agriseta sector · pdf fileagricultural and livestock research
TRANSCRIPT

SSEECCTTOORR AANNAALLYYSSIISS
AAGGRRIICCUULLTTUURREE
June 2010
Prepared for submission to the
Department of Higher Education and Training
by
AgriSETA June 2010
Table of contents SECTION 1 THE AGRICULTURAL LANDSCAPE 1 11 Size and shape of the Agricultural sector 1 Overview 1 Distribution of agricultural production 3 The structure of the agriculture sector in South Africa 6 Categories of farming enterprises 8 Employment trends 9 Employment categories and remuneration 11 Stakeholders in the Agricultural sector 13 National government departments 13 Sector representatives 14
12 Factors impacting development in the Agriculture sector 15 Future sector economic growth and development 16 South African sector growth plans (IPAP2) 16 International Trade 16 Global recession and rise in food prices 17
Land reform 17 Reliance on imports 19 Water 19 The labour market 20 Consumer trends 21 HIVAIDS 22 Farm safety and security 23 Broad‐based Black Economic Empowerment 23
Conclusions and scenarios 24 SECTION 2 DEMAND FOR SKILLS 27 AgriSETA registered employers and employee coverage 27 Employee coverage in the AgriSETA 28
21 Skills demand 31 The National Education and Training Strategy for Agriculture (AET Strategy) 31 AGRISETA sector skills planning demand data (2008‐2009) 31 AgriSETA WSP analyses 37 Skills demand in the commercial agricultural sector 37
Skills demand forecasting by AgriSETA 38 Research needs going forward 39
SECTION 3 Skills Gaps and scarce skills 40 Scarce skills at the DAFF 40 Scarce skills in the commercial sector 40 Supply of skills 42
APPENDIX 1 Skills demand in the Department of Agriculture Forestry amp Fisheries (200809) 45 Appendix 2 AgriSETA registered learnerships 46 REFERENCES 47
Agriculture Sector Analysis i
AgriSETA June 2010
Agriculture Sector Analysis 1
SECTION 1 THE AGRICULTURAL LANDSCAPE ldquoSouth Africarsquos agricultural sector is characterised by dualism a modern commercial farming sector using hired farm workers alongside small‐scale farmers mostly in the former homeland areas In addition land reform is creating thousands of new farming opportunities for emerging black farmers throughout the country and across the scale from large commercial to smallholder productionrdquo1
ldquoThe agro‐processing sector comprises a highly diverse group of sub‐sectors and industries The major sub‐sectors include Food processing Beverages Aquaculture Horticulture Medicinal aromatics and flavourants The agro‐processing sector has particularly strong linkages both up‐ and down‐stream Up‐stream the sector links to agriculture across a wide variety of farming models and products Down‐stream the sectorrsquos products are marketed across both wholesale and retail chains as well as through a diverse array of restaurants pubs shebeens and fastfood franchises Moreover the food processing sector is now the largest manufacturing sector in employment terms with some 160000 employees this increases to more than a million jobs once the upstream (primary agriculture) is includedrdquo2
11 Size and shape of the Agricultural sector
Overview
The South African agricultural sector is a diverse sector comprising several branches namely field crop husbandry horticulture animal production) dairy farming fish farming game farming and agro‐processing Within these broad branches are 39 sub‐sectors that are classified according to agricultural and economic focus as follows The sector encompasses both primary (resource production) and secondary (primary processing) activities
Table 1 Activities within the agricultural sector by international SIC code Sub‐sector Code DescriptionCoffeeTea 30493 Processing and marketing of coffee and tea including coconuts cocoa nuts olives dates etcFibre 30118 Grading ginning and packing of wool and cotton raw material
Fruit 30132 Fruit packed in cartons fruit juice concentrate drummed and fruit juice in container ready for consumption
Fruit 30133 Fruit exporters and importers
Grain
30300 Manufacture of grain mill products and starches30313 Handling and storage of grain61502 Wholesale amp retail trade in Agricultural machinery62111 Sale and distribution of Agricultural raw materials and other farming inputs
Milling 30311 Manufacture of flour and grain mill products including rice and vegetable milling grain mill
1 SETA re‐establishment and demarcation ndash A synthesis of the AgriSETA landscape AgriSETA June 2010 2 201112‐201213 Industrial Policy Action Plan DTI February 2010 Emphasis added
AgriSETA June 2010
Agriculture Sector Analysis 2
Sub‐sector Code Descriptionresidues
30330 Manufacture of prepared animal feeds30331 Manufacture of pet foods30332 Manufacture of starches and starch products
Pest control 99003 Pest Control Poultry 30114 Poultry and egg production including the slaughtering dressing and packing of poultry
Primary
11110 Growing of Cereals and other crops (not elsewhere classified)11120 Growing of Vegetables Horticultural specialties and nursery products
11121 Growing of Vegetables Horticultural specialties (Including Ornamental Horticulture) and nursery products
11122 Sugar plantation including sugar cane and sugar beet etc11130 Growing of fruit nuts beverage and spice crops11210 Farming of cattle sheep goats horses asses mules and hinnies Dairy farming 11220 Other animal farming production of animal products (not elsewhere classified) 11221 Ostrich farming 11222 Game farming 11300 Growing of crops combined with farming of animals (Mixed farming) 11301 Growing of coffee and tea including coconuts cocoa nuts olives dates etc 11400 Agricultural and animal husbandry services except veterinary activities 11402 Other animal farming (not elsewhere classified)12109 Growing of trees as second crop by farmers13000 Fishing operation of fish hatcheries and fish farm
Red Meat
11141 Production and animal products (not elsewhere classified)30111 Slaughtering dressing and packing of livestock including poultry and small game for meat30115 Production sale amp marketing of Agricultural by products (eg bones hides)
30117 Slaughtering dressing and packing of livestock including small game for meat and processing of ostrich products
61210 Wholesale trade in Agricultural raw materials and livestock74136 Transport of livestock as supporting activity87120 Agricultural and livestock research
Seed 11140 Seed production and marketing Sugar 30420 Manufacture of sugar including golden syrup and castor sugar Tobacco 62208 Processing and dispatching of tobacco Source AgriSETA
The contribution of primary agriculture to the gross domestic product (GDP) is about 25 and its contribution to formal employment is about 53 However agriculture has strong backward and forward linkages into the economy
The agro‐industrial sector has a higher contribution of about 12 to GDP4
Primary agriculture contributed 23 to the GDP in 20095
The figure below shows the relatively small proportion of GDP contribution from primary agriculture It needs to be noted however that processing is not included in the 23 as it is included in manufacturing and other farming activities For example farms linked to leisure facilities are located under Trade and Accommodation
3 National Treasury 2010 4 GCIS 2010 5 National Treasury 2010
AgriSETA June 2010
Figure 1 Contribution of agriculture to national GDP
Source National Treasury Budget Review 2010
South Africa is one of the top global exporters of some agricultural produce where it is ranked first in three products
Table 2 South Africas world ranking in selected products
Export Item South Africarsquos world ranking
Avocados 1st
Clementines 1st
Ostrich products 1st
Grapefruit 2nd
Table grapes 3rd
Plums 3rd
Pears 5th Source DTI February 2010
Distribution of agricultural production
South Africa has 276 million hectares of cultivated land of which nearly 1045 million hectares (82) is used for commercial purposes A total of 079 million hectares (only 619) is permanently under cultivation and more than 1083 million hectares (85) is rain‐fed More than 07 million hectares of land are degraded and left bare by sheet and gully erosion About 461 million hectares of natural vegetation are degraded mainly in indigenous forests woodlands and grasslands a further 019 million hectares are degraded by mine tailings waste rock dumps and surface‐based mining Land use in urban areas comprises mainly formal residential suburbs and townships (1 million ha) and informal settlements (023 million ha) Savannas (woodlands and bush lands) and grasslands cover 2570 and 1992 of South Africa respectively (Department of Environmental Affairs)
Although 80 of South African land is used for agriculture and subsistence farming only 12 is arable and the rest is used for grazing The main agricultural activities are crop production mixed farming cattle ranching and sheep farming dairy farming game ranching aquaculture beekeeping and winemaking (GCIS 2010) South Africa is the largest producer of maize the
Agriculture Sector Analysis 3
AgriSETA June 2010
staple food in the Southern African Development Community (SADC) as well as the main ingredient for animal feed The table below gives an indication of the geographic location of production of specific agricultural produce as well as the annual volume produced
Table 3 Volume of agricultural production by product and location Agricultural product Dominant production locations Average annual volume producedMaize North West Free State Mpumalanga 13 2 metric ton Wheat Western Cape Free State 21 metric ton Barley Western Cape 192 000 ton Groundnuts Free State North West Northern Cape 88 800 ton Sunflower seeds Free State North West Mpumalanga Limpopo 872 000 ton Soya beans Free State Mpumalanga KwaZulu Natal ‐ Sorghum Free State Mpumalanga Limpopo North West 255 000 ton Canola Western Cape North West Limpopo 30 800 ton
Dry beans Mpumalanga Free State Gauteng North West KZN Limpopo Western Cape Northern Cape
60 000 ton
Sugar Eastern Cape Mpumalanga KwaZulu Natal 20 metric ton
Deciduous fruit Western Cape Eastern Cape Free State Mpumalanga Gauteng
‐
Wine Western Cape 4033 million litres exported in 2009Citrus and subtropical fruit
Limpopo Mpumalanga Eastern Cape KwaZulu Natal Western Cape Northern Cape
46 896 ton subtropical fruit
Potatoes North West Northern Cape KwaZulu Natal Limpopo Free State Mpumalanga Eastern Cape Western Cape
1 853 000 ton
Tomatoes Limpopo Mpumalanga KwaZulu Natal Eastern Cape Western Cape
459 217 ton
Onions Mpumalanga Western Cape Free State 417 579 ton Cabbages Mpumalanga KwaZulu Natal 138 161 ton
Cotton Mpumalanga Limpopo Northern Cape KwaZulu Natal North West
‐
Tobacco Mpumalanga Limpopo North West 10 200 ton Tea Western Cape Eastern Cape ‐ Flowers Western Cape ‐ Livestock All provinces Largest agricultural sector
Dairy Free State North West KwaZulu Natal Eastern Cape Western Cape Mpumalanga
3 129 metric litres
Beef Cattle Eastern Cape Free State KwaZulu Natal Limpopo North West Mpumalanga Northern Cape
‐
Sheep and goats Eastern Cape Northern Cape Free State Western Cape Mpumalanga
‐
Poultry and pigs All provinces 930 000 ton broilers
26 million pigs slaughtered from August 2007 to August 2008
Fish Western Cape Eastern Cape ‐
Game Limpopo Northern Cape Eastern Cape Western Cape
‐
Beekeeping Western Cape KwaZulu Natal 2 000 ton Source GCIS SA Yearbook 200910
Agriculture plays an important part in provincial development and for most provinces provides a source of employment as well as being a potential focus for increased employment and sustainable livelihoods Agriculture therefore features as a key focus for economic development
Agriculture Sector Analysis 4
AgriSETA June 2010
Agriculture Sector Analysis 5
and growth in the all provinces Agricultural contribution to provincial GDP varies with the Free Statersquos agricultural sector contributing the most as reflected below
Table 4 Agriculture ‐ Contribution to Provincial GDP Province Percentage contribution to GDP
Free State 92 Limpopo 3 KwaZulu Natal 55 (2004) Western Cape 45 (2003) Mpumalanga 61
Source Provincial Growth Development Strategies
The provinces all have different focuses in their development strategies for agriculture although the underlying principle is the improvement of the lives of the people through employment creation in agriculture and provision of food security through investment in agricultural processes and technologies that enhance efficiency Free Statersquos focus on agriculture development is agriculture diversification and agribusiness Diversification involves identifying crops with a defined market in line with new and innovative agricultural practices Agribusiness extracts value from primary agriculture through processing of raw materials and provision of services to add value to produce6 The objectives of the Limpopo province with regards to agricultural development are tripling the size of agriculture by 2015 increasing the value of agriculture through enterprise diversification investing in water saving technologies and adding value within the agro‐value chain7 In the Eastern Cape two thirds of the population live in rural areas and the development of agriculture is a key factor in the development of the peoplersquos socio‐economic livelihood Development of agriculture will provide employment and an income to many families The focus of the growth and development strategy is to promote household food security through expanded smallholder production development of commercial agriculture through optimal use of agricultural land in the homelands focus on land redistribution and tenure and integration of homelands agriculture into mainstream provincial agricultural activity8 KwaZulu Natalrsquos focus on agriculture in the Growth Development Strategy is poverty alleviation as most areas of poverty in the province are rural The plan is to link up rural subsistence agricultural activity with commercial agriculture so as to develop subsistence agricultural projects into commercial ones The other focus is to link land reform projects to key provincial agrarian revolution programmes so as to make land transfer an economic growth opportunity The agrarian revolution strategy involves enabling access to markets farmer development through the set up of agri‐businesses improve road infrastructure to improve access to markets and expediting the land reform process9
6 Free State Growth Development Strategy 2004 ndash 2014 7 Limpopo Growth Development Strategy 2004 ndash 2014 8 Eastern Cape Growth Development Plan 2004 ‐ 2014 9 KZN Growth Development Strategy 2006
AgriSETA June 2010
Agriculture Sector Analysis 6
Northern Capersquos focus is the development of agro‐processing (Northern Cape Growth and Development Strategy) The North West is focusing on enabling access to markets and assisting financially in infrastructure development and machinery acquisition as well as investing in agro‐processing technology and skills as well as promoting efficient land use10 Agriculture holds employment growth potential in Mpumalanga province It accounts for 181 of provincial employment with forestry being the main agricultural activity in the province About 383 of the provincersquos land is used for forestry Agriculture is identified as a key focus area to achieve the strategic growth development strategy of providing a better life for all in the province through economic development Growth potential is through agricultural investment production and beneficiation so as to increase agriculture GDP contribution from 61 to 10 by the end of the 20082009 financial year Other strategic objectives are to increase sustainable employment in the agricultural sector from 18 to 20 by the end of 2015 improve food security by 50 by 2014 improve sustainability in agri‐business enterprises by 20 and increase participation of historically disadvantaged in agriculture to meet national Agri BEE targets (Mpumalanga Growth and Development Strategy 2004 ‐ 2014)
The structure of the agriculture sector in South Africa
The South African Agriculture Sector primarily based in rural and peri‐urban areas is characterised by a dual agricultural economy comprising well developed commercial farming with an established supply chain and small (subsistence) based production The General Household Survey of 2009 (Statistics South Africa) and the Census for commercial farms 2007 (Statistics South Africa) provide an insight into the size of the subsistence and commercial sectors Precise details in relation to non‐commercial and semi‐commercial farming are not available In 2009 207 of South African households were engaged in some form of agricultural production Table 1 reflects household agricultural production patterns in the provinces and shows that the largest proportions of households engaged in agriculture are in Limpopo Eastern Cape Free State and KwaZulu Natal
Table 5 South African households involved in agricultural activities by province (1000s)
Activity Province
Total WC EC NC FS KZN NW GP MP LP
Involved in agricultural production
39 643 35 274 697 108 248 205 580 2 832
27 373 114 319 268 114 71 211 434 207
Livestock production
312 22 26 230 34 27 21 99 778
175 485 621 96 330 310 107 104 171 275
Poultry production
349 11 35 256 23 22 11 146 853
18 543 310 129 367 211 90 51 251 301
Grains and food crops
389 21 316 34 31 128 465 1 390
27 605 122 78 454 315 125 625 801 491
Industrial crops 0 0 0 0
00 02 00 01 06 00 05 00 01 03
Fruit amp vegetable crops
30 220 232 330 40 175 141 173 1 350
759 342 252 847 473 368 705 688 298 477
10 North West Growth and Development Strategy
AgriSETA June 2010
Agriculture Sector Analysis 7
Activity Province
Total WC EC NC FS KZN NW GP MP LP
Fodder grazing pasture grass ndash animals
14 11 53
112 05 38 35 20 20 43 20 07 19
Forestry 0 10
12 01 05 21 01 00 04 04 02 04
Fish farming Aquaculture
0 0 0 0 0 0 0
15 01 00 00 00 00 00 00 00 00
Game farming 0 0 0 0
22 02 13 00 01 00 00 00 02 01
Other 0 0 0 0
00 02 00 03 04 03 03 00 00 02
Numbers smaller than 10 000 are too small for reliable estimates A particular household can be involved in more than one activity and percentages therefore do not add up to 100
Source Statistics South Africa ‐ General Household Survey 2009 (p318)
In 2007 there were 39 982 commercial farms11 in South Africa as opposed to the 45 818 registered in 2002 There has been a clear downward trend in the number of commercial farming enterprises which underscores the needs to grow the commercial agriculture sector to maintain South Africarsquos food sustainability potential and support interventions to develop skills across the agricultural sector especially for transformation and development of the small and emerging agricultural sector
Table 6 Commercial farming enterprises by province ‐ 2002 and 2007
Province 2002 2007 Growth Decline
Eastern Cape 4 376 3 896 ‐ 1097
Free State 8 531 7 515 ‐ 1191
Gauteng 2 206 2 378 780
KwaZulu‐Natal 4 038 3 560 ‐ 1184
Limpopo 2 915 2 657 ‐ 885
Mpumalanga 5 104 3 376 ‐ 3386
North West 5 349 4 692 ‐ 1228
Northern Cape 6 114 5 226 ‐ 1452
Western Cape 7 187 6 682 ‐ 703
Total 45 818 39 982 ‐ 1274
Source Statistics South Africa 2008
Whilst the largest proportions of households involved in agriculture are in Limpopo Free State Eastern Cape and KZN (Table 1) it is in the Free State Western Cape Northern Cape and North‐West provinces where the largest number of commercial farms are located (Table 2) No direct
11 Commercial farms are farming enterprises that are registered with SARS for Value Added Tax (VAT) and income tax
AgriSETA June 2010
relationship can thus be drawn between the numbers of households engaged in agriculture in a province and the numbers of commercial agricultural enterprises AgriSETA WSP data analysis reveals no direct relationship between the number of employers in a province and the number of formally employed persons
Categories of farming enterprises
ldquoDualismrdquo (Mhone 2000) is a useful way of describing the agricultural sector both in terms of understanding the economics of the sector and planning skills development interventions This term describes a formal sector that is well established and an informal or emergent sector with the two sectors reliant on each other and on interventions by the state for integration However these two broad categories have their limitations Within the commercial sector there are large established farming businesses and smaller ones that struggle to survive and within the less formal sector there are emergent farmers striving to achieve commercial success It is necessary therefore to understand the agricultural sector as comprising a number of different economic entities all operating within the same dualistic economic framework The following typology for the agricultural sector reflects the complexity of the agricultural sector
Table 7 Typology of the agricultural sector
Production Unit Turnover Ownership amp Management Number Binding constraint
Support required
Large commercial on private property
gtR2 million
Family owned but incorporated multiple farms Rent in land ndash professional management
plusmn5 400 Market size Equity capital
Export market access Financial market innovation
Medium commercial on private property
R300 000 to R2 million
Family owned could be incorporated Some renting in of land ndash family management
17000 Land capital management
Mortgage capital for land access Management training
Small commercial on private property
ltR300 000 Family owned generally part time Some lifestyle farming (game ranches weekend farms)
24 000 Management time
Commercial in communal areas
gtR300 000 Communal ownership Development projects Private ownership
‐ Capital management infrastructure
Grants for land access Property rights Comprehensive farmer support Credit Physical infrastructure
ldquoEmergingrdquo commercial in communal areas
ltR300 000
gt20 hectares Communal ownership Small farmers in development projects Private ownership
35 000
Land (property rights) Capital labour management Employment opportunities
Grants for land access Property rights Comprehensive farmer support Physical infrastructure Institutional infrastructure
Subsistence farmer in communal areas Allotments Market gardens
lt20 hectares Communal ownership Private ownership Little formal market participation
1256m Employment opportunities
Social welfare transfers
Source Vink and van Rooyen 2009
This confirms the dualism evident from Stats SA data It includes an estimate for emergent farms and provides insight into the different types of farming enterprises Being small and part time can mean subsistence farming but it can also mean running a game farm on a part‐time basis There is considerable scope for farming enterprise to move from being commercial to subsistence and vice versa There is some evidence that there is currently an increase in volatility with quite
Agriculture Sector Analysis 8
AgriSETA June 2010
significant changes occurring mainly due to the global economic down turn and the small margins that many agricultural enterprises operate within It is particularly important to have an understanding of the category of ldquoemergingrdquo farmers those who may be striving to move from subsistence farming to a more commercial model those who have benefited from land reform processes and want to establish an agricultural enterprise on the land that has been allocated to them those who have made use of BEE funding to acquire a stake in a farm and are trying to achieve profitability The emerging farmer sector is neither established commercial farming nor subsistence in nature and is the focus of many of the governmentrsquos efforts to achieve transformation within the sector as a whole
Employment trends
Employee numbers is a more important measure of ldquosizerdquo for the purpose of the SETA and skills planning even though turnover may be more important in terms of economic impact or contribution to GDP The cause of this discrepancy between turnover or GDP contribution on the one hand and formal employment numbers on the other is discussed extensively by Mhone (2000) and others such as Webster (2004) Labour absorption levels in an enclave (second) economy are not optimal One conclusion that can be drawn from this is that skills development will need to be linked to other changes within the sector if it is to contribute meaningfully to job creation Mechanisms need to be found that link growth to jobs and this is not strictly something that the SETA can address However it is important to link skills planning to other processes and opportunities for these will be examined as part of the environmental scan later in this section The past few years have seen huge depreciation in employment levels and a very high unemployment rate ndash currently estimated at 311 The agricultural sector has also witnessed a decline in sector employment largely linked to contraction of the sector The sector is characterised by the need for highly skilled and qualified farm managers and technical staff on the one hand and large numbers of unskilled and semi‐skilled workers on the other Many managers of emerging farms are mainly untrained and unqualified Agriculture relies more on semi skilled labour than other services as reflected in the table below The sector also relies on migrant casual and seasonal labour Table 8 Percentage unskilled to semi‐skilled labour by DTI industry (economic sector) classification
Sector 1995 2008 Growth decline in
skilled labour
Agriculture 990 941 49
Mining 920 879 45
Manufacturing 870 821 56
Utilities 800 688 140
Construction 900 883 19
Trade 840 842 ‐ 02
Transport and Communication 730 768 ‐ 52
Finance 620 595 40
Community and personal services 540 498 78
Total 782 738 56 Source National Treasury 2010
Agriculture Sector Analysis 9
AgriSETA June 2010
Agriculture Sector Analysis 10
Employment in the sector is based on those who work in administration in DAFF and those who work in production and processing at farms and in factories In March 2009 DAFF had 3 285 posts with 2 735 of these filled The table below shows the employment profile at DAFF by occupation race gender and disability as at 31 March 2009 The department employed 57 male employees and 43 female employees There were more African employees constituting 69 of the entire department workforce Very little progress has been made regarding the employment of people with disabilities who constitute only 04 of the workforce This is in line with other department across government where similarly little progress has been made
Table 9 Employee profile ‐ Department of Agriculture Forestry and Fisheries Occupational Category (SASCO)
African Coloured Indian White Totals
M F M F M F M F M F Total
Legislators senior officials managers
15 14 2 2 8 3 25 19 44 16
Professionals 239 241 11 12 4 14 70 64 324 331 655 240
Technicians associate prof
190 153 38 19 9 4 86 57 323 233 556 204
Clerks 93 204 22 42 0 7 13 171 128 424 552 30
Service and sales workers
38 19 4 2 1 17 1 60 22 82 30
Craft and related trades workers
42 3 13 58 0 58 21
Plant machine operators and assemblers
53 1 8 1 62 1 63 23
Elementary occupations
484 96 94 28 1 6 5 585 129 714 262
Totals 1 154 728 182 105 15 25 214 301 1 565 1 159 2 724
Percentage 424 267 67 39 06 09 79 110 575 425 100
People with disabilities
1 1 1 2 6 4 7 11 04
Race 1 882 287 40 515 Percentage 691 105 15 189 Source Dept of Agriculture Forestry and Fisheries (2010)
In respect of occupations and skills profiles the majority of the Departmentrsquos employees are Professionals and Technicians Associate Professionals (444) followed by people employed in elementary occupations (262) Employment across the agricultural sector is subject to growth and decline variations related to a wide range of conditions and circumstances ndash produce prices climate and environmental changes mechanisation technology and the like Since 2002 the trend has been downwards There are a number of reasons for this including mechanisation and casualisation of labour on larger farms the economic downturn impacting on some sub‐sectors and the global trade situation including changes in the foreign exchange rates and the failure of successive DOHA development talks to address inequalities in access to global agricultural markets12 12 The Doha Development Round is the trade‐negotiation of the World Trade Organization (WTO) Its objective is to lower trade barriers globally Talks have stalled over a divide on major issues such as agriculture industrial tariffs and non‐tariff barriers services and trade remedies The most significant differences are between developed nations led
AgriSETA June 2010
Agriculture Sector Analysis 11
It is anticipated that growth of the agricultural sector to meet local consumer demand government initiatives to expand agricultural niche export markets and the development of an aquaculture sub‐sector to counter depletion of natural resources is likely to lead to creation of employment in the sector
Table 10 Workforce changes in the Agricultural sector ‐ 2001 to 2010
Year Workers Year on year difference Variation 2001 969 0002002 1 153 000 + 184 000 1602003 808 000 ‐ 345 000 ‐ 4272004 828 000 + 20 000 242005 778 000 ‐ 50 000 ‐ 642006 886 000 + 108 000 1222007 703 000 ‐ 183 000 ‐ 2602008 764 000 + 61 000 802009 615 000 ‐ 149 000 ‐ 2422010 650 000 + 35 000 54
Quarter 1
Source Statistics South Africa Survey (pp 210‐211)
Employment categories and remuneration
It is difficult to get detailed and accurate yearly statistics on employment by type (full‐time casual and seasonal employees) or on remuneration in the agricultural sector The latest available statistics on commercial agriculture are found in the 2007 Stats SA Census of Commercial Agriculture The following tables reflect survey data on the number of permanent casual and seasonal agricultural sector employees by province as well as total remuneration per province
Table 11 Number of paid full‐time agricultural workers and total remuneration by province
Province 2002 2007 Growth Decline
Number Remuneration
R000s Number
Remuneration R000s
Number Remuneration
Eastern Cape 33 718 329 351 34 253 510 404 16 550Free State 57 607 580 888 53 944 737 796 ‐64 270Gauteng 20 815 344 629 22 979 534 083 104 550KwaZulu‐Natal 75 799 763 439 66 685 968 455 ‐120 269Limpopo 62 635 525 390 35 728 625 436 ‐430 190Mpumalanga 61 603 599 617 46 520 853 396 ‐245 423North West 39 914 409 526 53 741 574 596 346 403Northern Cape 31 077 320 598 26 871 339 948 ‐135 60Western Cape 98 207 1 378 816 90 943 2 029 275 ‐74 472Totals 481 375 5252251 431 664 7 173 389 ‐103 366
Source Statistics South Africa Report 120201 (p1101)
by EU USA and Japan and the major developing countries led and represented by India Brazil China and South Africa Considerable contestation exists over the maintenance of agricultural subsidies operating as trade barriers
AgriSETA June 2010
Agriculture Sector Analysis 12
Table 12 Number of paid casual amp seasonal agricultural workers amp total remuneration by province
Province 2002 2007 Variance
Number Remuneration
R000s Number
Remuneration R000s
Number Remuneration
Eastern Cape 30 936 59 680 30 565 106 497 ‐12 784Free State 57 871 69 595 45 150 98 996 ‐220 422Gauteng 8 722 20 975 11 957 93 461 371 3456KwaZulu‐Natal 37 602 103 946 34 383 154 286 ‐86 484Limpopo 38 614 107 223 31 833 124 159 ‐176 158Mpumalanga 46 480 86 242 32 826 176 363 ‐294 1045North West 46 078 62 653 32 008 75 250 ‐305 201Northern Cape 68 174 121 613 47 874 123 723 ‐298 17Western Cape 124 968 331 406 98 546 485 108 ‐211 464Totals 459 445 963 331 365 142 1 437 843 ‐205 493
Source Statistics South Africa Report 120201 (p1101)
The tables above reflect that the Western Cape was the biggest employer of labour on commercial farms in 2007 with a majority of the employees being casual and seasonal The Eastern Cape employed the least number of commercial farm employees The comparator figures for 2002 and 2007 would appear to show a continuous country wide reduction in employment both in permanent employees and casual and seasonal workers The exception is the North West that has experienced an increase in full time employees The current minimum wage for farm workers (February 2010) is R1 31669 per month13 Monthly salaries differ across sub‐sectors with highest paid workers in primary production in the fisheries and dairy sub‐sectors
Table 13 Approximate monthly wage rates in Agriculture for selected sub‐sectors
Subsector Primary Production ProcessingPack house
Meat R 2000
Dairy ‐ R 2650
Wines R 1100 R 1400
Flowers R 800 R 1200
Fisheries R 5000
(crewman)R 1892
Source DTI 201014
Vink amp van Rooyen (2009) indicate that before the introduction of minimum wage in 2003 the real cash remuneration for employees had been increasing However over time the unit cost of labour (the ratio of the total cost of labour to the total value of output) has been in decline including a steep drop during and after the introduction of minimum wages
13 Department of Labour 2010 14 Source DTI (Data sourced from SAMIC Dairy Industry JAG WOSA SAFEC SA Pelagic Fish Industry Association)
AgriSETA June 2010
Agriculture Sector Analysis 13
In 1970 for every R1 of output 16 cents was spent on labour By 1980 this has dropped to 13 cents for R1 of output By 1994 the figure had increased to 19 cents declining to 17 cents in 1998 and to 117 cents in 2001 By 2007 it had reduced to 108 cents Further research will be needed to establish the current situation but there is reason to believe that the decline has continued with wages being very low both in terms of unit costs and in relation to other groups of workers in the economy
Strictly speaking it is not the role of the SETA to engage in the complex regulatory framework for the agricultural labour market It is for the Department of Labour and NEDLAC with their employer and organised labour stakeholders to find ways of balancing the need for protection of vulnerable workers with the need to create a framework that encourages the creation of jobs and improved job security The reason that more research is needed in this area and in particular detailed discussions with industry and labour representatives is to establish
The extent to which skills development interventions can improve the prospects for job creation and improved job security and
The mechanisms that can be established to enable uninterrupted skills training in the context of casualisation and use of contract and seasonal labour
Stakeholders in the Agricultural sector
National government departments
There are a number of national government Departments and spheres involved in the challenges of the agricultural sector The following table sets out the broad contribution that each department is intended to make
Table 14 Government department roles in relation to Agriculture Department Role
Department of Agriculture Forestry and Fisheries Agricultural policy and support Department of Rural Development and Land Reform Land Reform and land claims settlements Department of Economic Development Economic planning National Treasury Macro economic policy Department of Trade and Industry Industrial strategy (IPAP 2) Department of Water Affairs The management of water supply Department of Labour Labour market policy Department of Higher Education and Training HRD and skills planning and SETAs In relation to public spending on agriculture the agricultural national budget constitutes about 05 of the national budget The figure below reflects trends in national budgeting for the agricultural sector between 19967 and 201112 Some analysts15 have argued that state expenditure on agriculture shows lack of prioritisation of the sector especially considering that the budget remains lower than it was in the late 1980s when it now caters for a greater number of farmers than it did during apartheid segregation
15 Greenberg 2010 p 2
AgriSETA June 2010
Figure 2 National budgets for Agriculture 1996‐2011 (adjusted for inflation)
Source Greenberg 2010
The Department of Agriculture Forestry and Fisheries (DAFF) is responsible for the agricultural sector The department works with various organisations to promote the interests of the sector
bull It registers all South African Pest Control Association (SAPCA) qualified inspectors bull It works with the Agricultural Research Council for research to optimise the control of
migratory pests bull The Directorate on Marketing works with the National Agricultural Marketing Council
(NAMC) on issues related to equitable access to markets including policy formulation issuing of permits and coordinating inter‐departmental relations to enhance marketing
bull Historically the Department has employed a large number of extension officers located in farming communities who have supported and advised farmers This service has been in decline in recent years but remains an important aspect of state support to the sector
The above roles will be subject to some review in the context of IPAP 2 and also the debates around the role of the state in the economy The issue is not only levels of spending but also clarifying the role of government in relation to the business of the sector
Sector representatives
There are three major umbrella organisations representing the interests of farmers AgriSA TLUSA and the National African Farmers Union of South Africa (NAFU) AgriSA and TLUSA represents both commercial farmers and cooperativesrsquo interests through its engagement at national and international level AgriSA is a member of the Southern African Confederation of Agricultural Unions (SACAU) a regional farmersrsquo union for farmers in Southern Africa AgriSA has structures in all the provinces except Limpopo
Agriculture Sector Analysis 14
AgriSETA June 2010
Agriculture Sector Analysis 15
NAFU is a union for predominantly previously historically disadvantaged smallholder farmers with a membership base including farmers agribusinesses farmersrsquo organisations corporations and individuals who support their goals NAFU is represented by different unions in all the provinces There are other employer organisations who are not affiliated to AgriSA and NAFU including
bull Agricultural Industrial and Medium Employers Organisation bull Agricultural Mining and Industrial Chemical Manufacturersrsquo Association bull Agrilabor Employersrsquo Organisation bull Algoa Meat Traders Association bull East Coast Poultry Producers Employersrsquo Association bull East London and District Meat Traders Association bull Fertiliser Industry Employersrsquo Organisation bull Landbou Werkgewersorganisasie (Workinfocom) bull Red Meat Producersrsquo Association
The Agricultural Research Council is an autonomous statutory body that provides research to DAFF and the provincial departments of agriculture Figures available for South Africarsquos investment in agriculture research and development show that South Africa was above international norms of investment in RampD which are 053 of agricultural GDP for developing countries and 236 for developed countries In South Africa in 2000 agricultural RampD investment in relation to agricultural GDP was 30416 There are six major sources of credit for farmers banks (50) agricultural cooperatives and agribusiness (12) the Land Bank (21) private creditors (8) other creditors and financial institutions (9) and government (1) (GCIS 2010)
12 Factors impacting development in the Agriculture sector Several international and local factors impact on the productivity of the agricultural sector and its growth Key amongst these are
Growth of the South African economy and rising consumer demand International trade and trade agreements The global recession and rise in food prices The land reform programme Reliance on imports Water availability Changing consumer patterns and demands (eg organic food stuffs) Technological changes and mechanisms Quality standards Farm safety and security Broad‐based black economic empowerment Legislation Skills demand and supply HIVAIDS
16 Vink amp van Rooyen 2009
AgriSETA June 2010
These key factors are clustered and discussed below
Future sector economic growth and development
South African sector growth plans (IPAP2)
The 20102011 ndash 20122013 Industrial Policy Action Plan (IPAP) identifies five structural challenges that existed in the South African economy before the global economic downturn and which have been exacerbated by the recent economic crisis These challenges were evident even during the time South Africa was experiencing relatively high growth rates between 2005 and 2007 and have continued during the recession These challenges are
1 Structural imbalances in the growth path including growth that is lagging behind other medium and low income countries
2 Uneven performance of the manufacturing sector with some divisions like the automotive sector experiencing exponential growth while other sectors have stagnated
3 Employment growth being sustained by credit extension and consumption rather than by productive sectors leading to a large current account deficit
4 Low profitability of manufacturing 5 Low savings and investment from financial sector growth Only 52 of private credit was
extended to fixed investment in 2008 Key sectors have been identified for IPAPrsquos focus including agro‐processing which has a diverse group of industries and sub‐sectors including food processing beverages aquaculture horticulture medicinal aromatic and flavourants Key action plans for the agro‐processing sector are identified in IPAP2 as
Development of a National Food Control Agency to consolidate the sector Development of aquaculture to supplement dwindling wild fish stocks Designating specific areas for utilisation of aquaculture Development of the organic food sector Development of the small milling industry Enhancing competitiveness in fruit and vegetable canning Improving beneficiation of Rooibos and Honeybush products (IPAP2 2010)
International Trade
South Africa is a major exporter of Agricultural produce In particular South African fruit and fruit‐derived products such as wine and fruit juice are competitive in the global market However in many sub‐sectors where export potential exists ndash grain and meat ndash serious problems face the industry A key challenge is the uneven playing field experienced by South African exporters Major global competitors include the United States and the countries of the European Union where government subsidies in various forms are in place No such subsidies are in place in South Africa making it difficult if not impossible for South African agricultural produces to enter developed country markets due to the prices that they have to ask for products I In addition the value of the Rand has fluctuated from levels of around R10 to the US dollar to as little as R7 to the dollar When the Rand is strong export becomes difficult because it costs more in the case of the move from R10 to R7 a 30 cost increase for the importer It is impossible to
Agriculture Sector Analysis 16
AgriSETA June 2010
Agriculture Sector Analysis 17
predict whether the World Trade Organisation negotiations known as the DOHA Round will achieve progress in the coming years Historical evidence is that during periods of global recession developed economies become more protective not less and so the current outlook is not good Nor is it possible to predict the value of the Rand though current thinking in government is to move toward a weaker Rand to encourage exports These are two key variables that will need to be factored into the different sector growth scenarios for the future
Global recession and rise in food prices
Economic growth slowed down significantly in sub Saharan Africa and in South Africa in 2009 but there appear to be signs of recovery GDP growth in the region declined from about 6 in 2004 ndash 2008 to about 18 in 200910 GDP growth in South Africa was 16 in 2009 17and rose to 46 in the first quarter of 201018 though much of this is related to the income derived from the 2010 FIFA World Cup and may not be sustained Projections are generally for a slow revival with a set back after the slight rise resulting from the World Cup A return to the 6 levels of the 20078 could take some years The global recession reduced the demand for African exports and reduced capital flows to the region but it is anticipated that the demand for mineral resources by Asian and Western powers will result in both the expansion of exports and expanded foreign direct investment The competition between India and China for African markets is also expected to boost trade to the benefit of African suppliers South Africa is expected to particularly benefit from direct foreign investment from China and India China has already become South Africarsquos largest market for exports and supplier of imports19 Rising food prices have forced governments around the world to control prices of maize bread rice and dairy products In South Africa ldquofood price inflation between December 2005 and December 2006 averaged 788 rdquo20 Although efforts are being made to reduce barriers to poorer families in relation to basic food there has been no move to subsidise food generally This may change though the space for significant levels of support is restricted because of reduced revenue from income taxes resulting from the recession The global credit crunch and recession have meant a reduction in public expenditure and funding which has affected the agricultural sector21
Land reform
In South Africa specifically land reform has a significant bearing on food security and agriculturersquos contribution to GDP The objective of the land reform programme is to transfer 30 of agricultural land to black ownership by 2014 (deferred to 2025) to ensure more equitable access to land by historically disadvantaged people and to increase their participation in agricultural activities22 Land reform has been informed by four processes23
17 Department of Agriculture Forestry and Fisheries 2010 18 Stats SA 2010 19 Department of Agriculture Forestry and Fisheries 2010 20 Department of Agriculture Forestry and Fisheries 2010 ‐2011 Strategic Plan 21 Economic Commission for Africa 2009 22 Xingwana 2008 23 CDE 2008
AgriSETA June 2010
Agriculture Sector Analysis 18
Land restitution involving returning land or providing financial compensation to those whose land was dispossessed during apartheid
Land redistribution transferring more land to the historically disadvantaged Tenure reform modernising land tenure rules and access to land ownership and Providing financial support for the development of emerging farmers
In relation to progress with land reform by September 2009 only 69 of agricultural land (about 567 million hectares) had been transferred and a majority of the beneficiaries have not yet occupied the land due to lack of infrastructure input or technical support The following table gives an indication of the progress of land reform since the inception of the first democratic government
Table 14 Land transfers and beneficiaries ‐ 1994 to 2009
Province Redistribution and tenure Restitution Total Hectares Beneficiaries Claims Hectares Beneficiaries Hectares Beneficiaries
Eastern Cape 675 353 357 25 633 16 201 94 834 215 201 448 191 240 834
Free State 799 350 291 7 721 2 662 47 615 40 893 397 906 48 614
Gauteng 286 34 513 7 328 13 159 9 476 70 179 43 989 77 507
KwaZulu Natal 690 547 414 67 761 14 752 642 447 433 168 1 189 861 500 929
Limpopo 291 91 235 7 403 3 382 513 024 220 227 604 259 227 630
Mpumalanga 444 322 839 13 950 2 694 399 876 225 877 722 715 239 827
Northern Cape 271 952 744 2 773 3 682 539 620 100 554 1 492 364 103 327
North West 300 268 566 40 539 3 709 373 642 172 963 642 208 213 502
Western Cape 223 122 304 12 750 15 546 3 769 118 165 126 073 130 915
Total 3 979 3 043 264 185 858 75 787 2 624 303 1 597 227 5 667 567 1 783 085
Source Greenberg 2010
Achievement of the 30 land reform target is being made difficult by land prices Under the willing buyer willing seller scheme the government will need R74 billion to be able to purchase enough land While resources may be available there are suggestions of lack of capacity The Department of Rural Development and Land Reform (DRDLR) was able to spend only 31 of its land reform 200910 budget in the first six months of the financial year Going forward this Department needs to identify what the real challenges are with the pace of land reform delivery so that they can be mitigated to meet the 2025 target A priority is the retention of skills skills transfer and skills development during the transfer of land as well as retention of national food production to avoid loss of production Support for new beneficiaries of land to ensure sustained productivity is derived from two main sources of funding ndash the Broadening Access to Agriculture Thrust (BADAT) and the Comprehensive Agricultural Support Programme (CASP) CASP is a conditional grant from the Department of Agriculture Forestry and Fisheries to provincial departments to support emerging farmer development Provincial farming budgets dedicated for farmer support in Mpumalanga the Free State Northern Cape and the Western Cape have risen significantly and those in KwaZulu Natal and Gauteng have witnessed a slight increase Eastern Cape and Limpopo agricultural budgets have been steady The North West is the only province where there has been a sharp decline in the share of the budget dedicated to farmer support24
24 Greenberg 2010
AgriSETA June 2010
Agriculture Sector Analysis 19
Reliance on imports
Overall the Agriculture sector contributes positively to the balance of payments ldquoSouth Africa remains food secure The value of our exports increased by 464 from R33 656 million in 200708 to R49 278 million in 200809 During the same period the estimated value of imports rose by 12 from R34 009 million to R38 401 million resulting in a positive trade balancerdquo25
South Africa depends largely on world markets for seed production and agrochemicals Regarding seed production there are only three community seed production schemes in Limpopo and Mpumalanga being piloted with state funding Ten top large companies including two South African companies and multinationals have rights to over two thirds of registered seed varieties in South Africa Despite the dominance of genetically modified and hybrid seed in some sub‐sectors like maize sunflower and sorghum open‐pollinated varieties have been resilient in South Africa enabling the possibility of alternative seed sources not dependent on technological processes26 In relation to agrochemicals deregulation and liberalisation in the fertiliser sector led to the shutdown of local production capacity and South Africa became an importer of fertiliser for the first time in 2000 There are three large players in the fertiliser sector Sasol Nitro Yara and Omnia South Africa imports an estimated 70 of fertilisers and pesticides Fertiliser prices rose by over 200 between 2006 and 2008 but dropped somewhat after that However this hike signified the volatility of the agrochemicals industry and South Africarsquos dependency on imports and the potential risk for emerging farmers and food production of this dependence on imports as the country cannot control the prices making inputs both difficult to budget for and in many cases unaffordable The price of agrochemicals is also particularly influenced by the prices of oil and the exchange rate The general understanding in relation to job creation is that a weaker Rand will improve exports and therefore enable job creation Of course the down side of this strategy is that imports become more expensive So what may be an advantage for those sub‐sectors who are expanding their export volumes those relying on imported agro chemicals will be under increased pressure
Water
Water is both an essential and scarce resource for the agriculture sector and is being threatened by climate changes Crop production relies heavily on water and yet access to water is not being addressed in a systematic way in the land reform processes Greenberg suggests that the relationship between land reform agricultural support and water resource provision is inadequate and a way to address this could be established by linking water provision to land transfer or investing in irrigation for both commercial and resource‐poor farmers However investing in irrigation in the context of water scarcity and climate change may not be the best option What could be needed is finding ways to maximise efficiency of the 60 of South African
25 Department of Agriculture Forestry and Fisheries Strategic Plan 201011 26 Greenberg 2010
AgriSETA June 2010
Agriculture Sector Analysis 20
water used for irrigation by for example using methods such as drip or micro‐irrigation which are expensive to set up but which reduce water wastage by 5‐1027 The Department of Water Affairs is responsible for managing water supply and has to give authorisation for agricultural projects and other developments The department needs to be seen as an important stakeholder in the agricultural sector
The labour market
South Africa recorded an unemployment rate of 243 in 2009 (narrow definition) If people who are no longer actively seeking work are considered the broad unemployment rate rose from 267 to 313 illustrated in the figure below As a direct consequence of the global economic downturn in 2008 870 000 formal jobs were lost in 200928 Others have quoted a figure of over 1 million
Figure 3 Official unemployment in South Africa 2003 ‐2009
Source National Treasury 2010
Annual employment loss followed sector growth patterns with agriculture mining manufacturing and trade facing the highest job losses as their sector growth contracted Unemployment is especially a major problem among lower skilled workers and younger people Youth employment in the 15 ‐24 year age group has fallen by 219 000 (136) and 483 of people in this age group are unemployed Employment of semi‐skilled and unskilled workers has contracted by 527 000 and male employment has gone down by 550 000 (71) while that of women has decreased by 320 000 (52) The number of discouraged workers ie those no longer actively seeking work has increased from 518 000 to 17 million29 Clearly the existence of a very large pool of largely unskilled unemployed workers has an impact on the farming sector It drives wages down and creates opportunities for casualisation and the expansion of labour contract agencies and brokers In addition there are significant numbers of foreign nationals mainly from Zimbabwe and Mozambique who are seeking work and often finding it on farms and in primary processing and packaging plants There are benefits to the
27 Greenberg 2010 28 National Treasury 2010 29 National Treasury 2010
AgriSETA June 2010
Agriculture Sector Analysis 21
sector with skilled and semi‐skilled workers coming into the labour market and being absorbed into the workforce and helping raise productivity levels However at the lower skilled end of the market the existence of this pool brings further casualisation and downward pressure on wages Tensions are likely to increase and further protests either in the form of xenophobic outbreaks or actions against farmers may well increase A view often expressed by farm employers is that current labour legislation makes dismissing workers difficult and so the availability of labour without entering into contracts of employment is an attractive way of avoiding the legislation and its obligations Organised Labour is seeking to restrict these opportunities through either regulating or eliminating labour brokers and efforts are being made to regulate the use of foreign labour However for the foreseeable future the trend is for formally employed people to be reduced in number In relation to the emergent sector there will also be a reluctance to enter employment contracts with workers The fact that many households are engaged in some form of largely unpaid agricultural work means that there is significant casual work dating back many years Helping change this situation into one where casual or unpaid jobs are transformed into formal jobs with regular wages will take time It is also likely that as some emergent farms become established they will act similarly to established farms and institute a form of casual labour rather than expanding a workforce for which they would have to take a level of responsibility From an AgriSETA perspective these labour market trends mean that whilst levy income can be directed at a relatively small labour pool one that is manageable in terms of planning and implementation the size of the informal casual and unemployed labour force in the sector ‐ for whom no levy is paid and who have no employer to plan for their skills needs ndash is very large and its needs almost unlimited Clearly the relationship with the National Skills Fund (NSF) becomes critical in respect of the entire non‐levy income sector Again the level of support available from non‐levy income sources will be an important variable in looking at future sector skills development scenarios
Consumer trends
South Africa currently produces enough food to meet the needs of its population However consumption of three main staples maize wheat and vegetables has been volatile since 1985 and remains below 1990 levels Consumption of maize and vegetables by South Africans is 17 and 32 less respectively than in 198530 The main reasons for this lie in the growing levels of poverty and the difficulties that families have in purchasing nutritious food Whilst government has increased the levels of social grants and increased the number of people receiving grants to around 13 million the incomes of poor families have been badly hit by a range of factors including job losses and rises in food prices The approximately 1 million people who lost their jobs in 20089 meant a loss of income for many millions of dependents Rises in food prices have also had a disproportionate impact on the poor Whilst food is available it is often not accessible to families on the income levels that they have to manage within The result is that less and less nutritious food is purchased which in turn impacts on the ability of farmers to sell their products locally 30 Greenberg 2010
AgriSETA June 2010
Agriculture Sector Analysis 22
Whilst there is no evidence that government will reduce its efforts in relation to poverty relief and social benefits including such programmes as school feeding schemes and food parcels during periods of drought the state of public finances may not enable to support the poverty that grips many rural areas If real income levels for the poor were to rise it could have a significant impact on the economy of the agricultural sector Equally an improvement in the rural economy with increased agricultural production and jobs would dramatically impact on the capacity of people to buy nutritious food Achieving a positive growth path in rural areas is a huge challenge for government and one that is key to governmentrsquos Medium Term Strategic Framework and Industrial Policy Action Plans
HIVAIDS
South Africa has a high prevalence of HIV and AIDS The HIV prevalence among people aged two and above was estimated at 109 in 2008
Table 15 Estimated HIV percentage prevalence by age group (2002 ndash 2008)
Age 2002 2005 2008 Change
Children (2‐14 years) 56 33 25 ‐31
Youth (15‐24 years) 93 103 87 ‐06
Adults (25 and older) 155 156 168 13
15‐49 year olds 156 1692 169 13
Total (ages 2 to 49) 114 108 109 ‐05 Source Avert 2009
The table above shows that HIV prevalence is highest amongst those aged 25 years and older Given youth labour market analyses which point to people from previously disadvantaged backgrounds mainly African males accessing formal employment for the first time at age 25 ‐27 this population can be held to represent people in employment Research31 has estimated that by 2020 the pandemic will have claimed at least 20 of employees in the agricultural sector Southern Africa
in
HIV and AIDS have significant ramifications in the agricultural sector for both commercial farming and subsistence farming The implications include
bull Decrease in cultivated land bull Focus on less labour intensive crop and animal production bull Decrease in womenrsquos agricultural productivity as they take on a more care giving role bull Loss of skills bull Increase in absenteeism from work bull Decrease in daily work outputproductivity because workers are weaker from infections
There are suggestions that the impact of the pandemic in South Africa demands sectoral intervention although this may be difficult in the agricultural commercial sector as
bull Seasonal workers who seem to be more vulnerable to infection because of their low socio‐economic status are not in one place long enough for care programs Further
31 Ingelozi Management Solutions 2008
AgriSETA June 2010
Agriculture Sector Analysis 23
farmers and employers may not feel responsible for seasonal workers in the same way they would invest in their permanent employees
bull There may be uncertainty around land reform which may put HIV intervention on farms on the back burner
bull There are no policies that enforce HIV education and care on farms in the same way that legislation like BEE does for ownership As a result HIV intervention may be left to goodwill and employers may feel it is more important to comply with issues that are monitored
Farm safety and security
South Africa has been plagued by unacceptably high levels of violent crime and murder for many years now Farms have experienced this and those living on farms feel and are extremely vulnerable The South African Chamber of Commerce and Industry (SACCI) has argued that
Using the nominal GDP figure for 2009 of R24 trillion a 322 percent contribution of agriculture to GDP and an estimate of 39982 farms (as at 2007) in South Africa the cost of a murderattack on a farm to the economy was R1932869 per annum
SACCI acknowledges that this estimate is flawed as it does not take into consideration the fact that farming units contribute differently to GDP and that not every attack or murder contributes to farm shut down or loss of productivity However if not addressed these attacks could lead to loss of farming sectors as farmers migrate to lsquosaferrsquo regions This will affect employment and GDP contribution of the sector The need for safety and security on farms may also shift farmersrsquo focus in skills development to include personnel who have skills in safety and security
Broad‐based Black Economic Empowerment
The aim of the AgriBEE Charter (gazetted in 2008) is to increase the involvement of black business in agriculture through ownership and control as executives and senior managers of new and existing agricultural businesses The extent to which AgriBEE is transforming the sector is not known as it is too early to tell but a recent survey conducted by ABC and the IDC showed that among the ABC respondents in 2007 46 of enterprises were busy constructing a BEE strategy and 46 claimed to be implementing a BEE strategy A survey of the dairy industry in the Western and Eastern Cape in 2008 showed that only 6 of firms had a BEE strategy in place It also seems from survey data that companies are focusing on the skills development and socio‐economic aspects of BEE rather than on ownership32 It would appear that although there have been some significant BEE purchases of viable farms and some employee empowerment projects including some quite high profile ones in the Cape Winelands the extent of ownership change had been limited One of the factors is the very high level of single person or family ownership in the agricultural sector BEE is more straight forward in the corporate world where shares can be exchanged For a family business it is a matter of selling off part or all of the land and the tendency is to sell off those areas of the farm that are expendable from a business sustainability perspective
32 Greenberg 2010
AgriSETA June 2010
Whilst there is discussion in government about the ending of the ldquowilling buyer willing sellerrdquo concept the Constitution itself provides for property rights and so although some pressure may be exerted through legislation and regulation the extent and speed of change may not be fast The mechanisms for encouraging the transfer of significant levels of ownership have not yet been created The focus of the SETA is therefore likely to be more the beneficiaries of land reform and emergent farmers though projects of a BEE nature can be targeted as they arise
Conclusions and scenarios It is useful when looking at possible scenarios to examine the key variables or uncertainties and to project how variations one way or the other will have an impact on the development and growth of the sector From the sector analysis and factors that are contributing to change in the sector there are some key factors that seem to emerge First appears to be the economy and related issues of the labour market and the challenges of labour absorption in an enclave economy These factors determine on the one hand whether there will be growth and development and on the other whether such improvements will result in improved employment opportunities and the creation of a virtuous cycle of development Second is the role of the state and the various government departments whose plans and work impact on the agricultural sector Related to this is land reform that is inevitably driven by the state and not the owners of land or the landless The view expressed by many engaged in agrarian reform is that the state must play a significant role It becomes clear that a successful agricultural enterprise requires a number of factors to be in place to be successful These include access to land (Department of Rural Development and Land Reform) agricultural support within a supportive agricultural framework (Department of Agriculture Forestry and Fisheries) access to consistent water supply (Department of Water Affairs) access to finance (Department of Trade and Industry various state agencies) conducive labour market regulation (Department of Labour) sound industrial policy (Department of Trade and Industry) economic planning and macro policy (Department of Economic Development National Treasury) and appropriate education training and skills development (Department of Higher Education and Training the Human Resources Development Council NSA and the SETA) There are other government departments as well as provincial and municipal structures that also play a role The following analyses show how the four variables
economic growth and development role of the government labour market changes and land reform)
impact positively or negatively on the growth of the sector and the demand for skills
Agriculture Sector Analysis 24
AgriSETA June 2010
Agriculture Sector Analysis 25
HHIIGGHH GGRROOWWTTHH SSCCEENNAARRIIOO
The economics of the sector Role of government
The economy in SA and globally continues to revive albeit slowly for the next few years
Roles and integration of national government departments are clarified Specific functions are agreed processes put in place and personnel appointed with the required skills
International trade agreements are still weighted infavour of US and EU but progress is being made and specific blockages are addressed in bilateral talks
The roles of Departments (DWA DAFF DRDLR DoL DTI DED DHET) are clarified with appropriate joint plans and coordinating structures
The rural economy gradually improves with the buying power of the poor increasing and more stable markets created for local produce
For each of the functions agreed in each of the related departments appropriate structures and systems are put in place and staff trained
Exports increase in key areas identified in IPAP 2 and the Rand exchange rate stabilises at a level not too much different than it is today
Specific capacity is put in place at local level to support implementation of land reform and rural development
There is a growing understanding of the concept of dualism and the need to intervene with labour absorption and development mechanisms
Land claims are all finally settled and ownership and tenure is resolved There is a serious drive to establish effective agricultural enterprises
An understanding is reached on the role of agencies and labour brokers and abuse is curbed
The willing buyer willing seller approach is resolved and enables viable land to become black owned
Some relaxation of labour market regulations are agreed that maintain some minimum standard of employment but assist absorption
Land transfer to black and emergent farmers is done in a manner that integrates then into the supply chains of the sector
Mechanisms are found to address skills needs in the context of casual and seasonal work patterns
Financing of land reform and transfer is done on the basis of agreed development plans including skills
Labour market reform Trajectory of land reform LLOOWW GGRROOWWTTHH SSCCEENNAARRIIOO
The economics of the sector Role of government departments The economy in SA and globally stagnates at current levels and the economy struggles to pick up after the temporary 2010 World Cup boost
A lack of purpose at government level means limited progress for another five years Land reform remains a commitment without a plan
International trade agreements are still weighted infavour of US and EU and protectionism increases as a result of the global recession
The roles of Departments (DWA DAFF DRDLR DoL DTI DED DHET) are unclear and there is no proper co‐ordination
SArsquos Gini coefficient continues to worsen with rural poverty increasing and local economies declining
There is a lack of effective structures systems and processes to implement policy across departments
Rand volatility causes problems for importers and exporters Well established markets are maintained but exports decrease
At local level the decline in the agricultural extension officer functions continues and limited practical support is available
Understanding of the rural economy is so diverse that stakeholders cannot agree the problem let alone the solution to low absorption levels
Land claims take too long and land reform processes leave potentially productive land poorly developed and managed
Casual labour and labour brokers remains an issue of dispute Confrontation results in bitterness and resentment
The impasse caused by a rigid interpretations of property clauses in the Constitution continues to stall achievement of the 30 black ownership target
Labour market regulation continues to be a contributing factor to reducing levels of employment
Black owned farms find it difficult to become part of supply chains and are unable to perform adequately
Unstable employment patterns in the sector make skills interventions difficult to manage and largely ineffective
Financing of land reform and land transfer continues to be wasted as it is not tied to the building of appropriate capacity
Labour market reform Trajectory of land reform
AgriSETA June 2010
These analyses can be translated into four potential growth and development scenarios for the agricultural sector which are based on the requirements for a strong development state Scenario 3 Weak government support
and sound economy
Econ
omic fa
ctors glob
ally n
ationa
lly and
locally
Scenario 1 Integrated government support and sound economy
The economic upturn triggered by the World Cup continues and globally things improve enabling an expansion of exports The government because of a lack of integrated policy planning and implementation provides limited support for sector development The gains go to the well established enterprise owners with few gains for emerging farmers and local communities
Government departments coordinate their efforts to achieve maximum impact There are favourable economic conditions that create opportunities for advance Within this positive environment the role of the AgriSETA becomes a central component of a comprehensive strategy for growth and skills interventions are targeted to achieve maximum effect Results in growth in sustainable enterprises and expanded employment opportunities
Government policy and support Government policy and support
Combination of disjointed government policy planning and a weak and increasingly marginalised rural economy Economic conditions result in unsustainable farming conditions and employment declines along with productivity Food shortages and the lack of development in rural areas leading to increasing social tensions A vicious cycle develops with the sector going into long term decline
Government departments coordinate their efforts to achieve maximum impact However economic conditions hamper progress Efforts by the AgriSETA are undermined by poor labour absorption and job insecurity Some significant successes are recorded including some NSF funded projects that result in sustainable enterprises A platform is laid for future improvements when the economic conditions improve
Scenario 4 Weak state and economy Scenario 2 Strong state but weak
economy
Agriculture Sector Analysis 26
AgriSETA June 2010
Agriculture Sector Analysis 27
SECTION 2 DEMAND FOR SKILLS
AgriSETA registered employers and employee coverage
In 2009 17 234 employers were registered with the AgriSETA comprising 15 394 small employers (less than 50 employees) 1 202 medium sized employers (50 ‐ 149 employees) and 638 large employers (more than 150 employees)
Considering that there are around 40000 commercial farms33 the 17 234 employers represent around 43 of commercial farms Notwithstanding changes in the sector as a result of land reform and sector shrinkage this is a sizable proportion and is held to be sufficiently representative for the purpose of skills development planning However this paints an incomplete picture It understates the representative nature of large enterprise registered with the SETA and overstates the representative nature of small registered enterprises 4 175 (242) of the enterprises are levy paying members Further only 1 673 (11) workplace skills plans (WSPs) were submitted
Table 16 Registered employers by size and sub‐sector Sub‐sector Description
Employers Small Medium Large
CoffeeTea Processing and marketing of coffee and tea including coconuts cocoa nuts olives dates etc
33 4 3
Fibre Grading ginning packing of wool and cotton raw material 1 676 16 18
Fruit Fruit packed in cartons fruit juice concentrate drummed and fruit juice in container ready for consumption
271 36 57
Fruit exporters and importers 6 0 1
Grain
Manufacture of grain mill products and starches 119 5 7Handling and storage of grain 67 7 23Wholesale amp retail trade in Agricultural machinery 213 9 4Sale and distribution of Agricultural raw materials and other farming inputs
182 9 3
Milling
Manufacture of flour and grain mill products including rice and vegetable milling grain mill residues
120 15 11
Manufacture of prepared animal feeds 110 19 0Manufacture of pet foods 42 9 0Manufacture of starches and starch products 7 1 1
Pest control
Pest Control 209 4 0
Poultry Poultry and egg production including the slaughtering dressing and packing of poultry
305 49 37
Primary
Growing of Cereals and other crops (not elsewhere classified) 902 160 34Growing of Vegetables Horticultural specialties nursery products
943 120 72
Growing of Vegetables Horticultural specialties (Including Ornamental Horticulture) and nursery products
11 5 0
Sugar plantation including sugar cane and sugar beet etc 9 4 2
33 SARS statistics 2007
AgriSETA June 2010
Agriculture Sector Analysis 28
Sub‐ Description Employers Growing of fruit nuts beverage and spice crops 1795 255 143Farming of cattle sheep goats horses asses mules and hinnies Dairy farming
2 252 59 18
Other animal farming production of animal products (NEC) 433 25 12Ostrich farming 5 0 0Game farming 16 0 0Growing of crops combined with farming of animals (Mixed farming)
2 920 256 109
Growing of coffee and tea including coconuts cocoa nuts olives dates etc
2 0 0
Agricultural and animal husbandry services except veterinary activities
438 22 9
Other animal farming (not elsewhere classified) 11 1 1Growing of trees as second crop by farmers 126 18 4Fishing operation of fish hatcheries and fish farm 913 10 6
Red meat
Production and animal products (not elsewhere classified) 6 0 0Slaughtering dressing and packing of livestock including poultry and small game for meat
317 40 17
Production sale amp marketing of Agricultural by products (eg bones hides)
61 2 0
Slaughtering dressing and packing of livestock including small game for meat and processing of ostrich products
2 1 0
Wholesale trade in Agricultural raw materials and livestock 193 7 10Transport of livestock as supporting activity 224 0 0Agricultural and livestock research 215 9 3
Seed Seed production and marketing 149 12 6
Sugar Manufacture of sugar including golden syrup and castor sugar
45 5 21
Tobacco Processing and dispatching of tobacco 46 8 6 TOTALS 15 394 1 202 638Source AgriSETA WSP data
The largest number of registered small and medium enterprises are found in the mixed farming sub‐sector while most large enterprises are in the growing of fruit nuts beverage and spice crops sub‐sector
Employee coverage in the AgriSETA
Collectively the 17 234 employers registered with AgriSETA employed a total of 239 076 employees This represents 39 of the agricultural labour force in 2009 The 1 673 employers who submitted WSPs in 2009 employed 97 898 employees representing 41 of the total number of people employed by registered employers While the number of registered employers submitting WSPs is small (11) they employ a sizeable number of employees and the percentage of employees provides a statistically significant sample The data for larger enterprises is statistically much more representative than that for small enterprises
AgriSETA June 2010
Table 17 Number of employees of registered employers by sub‐sector
Sub‐sector
Sub‐sector description Employees
CoffeeTea Processing and marketing of coffee and tea including coconuts cocoa nuts olives dates etc
483
Fibre Grading ginning and packing of wool and cotton raw material 6 539
Fruit Fruit packed in cartons fruit juice concentrate drummed and fruit juice in container ready for consumption
27 661
Fruit exporters and importers 212
Grain
Manufacture of grain mill products and starches 133Handling and storage of grain 18 303Wholesale amp retail trade in Agricultural machinery 795Sale and distribution of Agricultural raw materials and other farming inputs 2 898
Milling
Manufacture of flour and grain mill products including rice and vegetable milling grain mill residues
3 634
Manufacture of prepared animal feeds 731Manufacture of pet foods 160Manufacture of starches and starch products 105
Pest control
Pest Control 119
Poultry Poultry and egg production including the slaughtering dressing and packing of poultry
19 187
Primary
Growing of Cereals and other crops (not elsewhere classified) 10 104Growing of Vegetables Horticultural specialties and nursery products 37 799Growing of Vegetables Horticultural specialties (Including Ornamental Horticulture) and nursery products
195
Sugar plantation including sugar cane and sugar beet etc 220Growing of fruit nuts beverage and spice crops 47 043Farming of cattle sheep goats horses asses mules hinnies Dairy farming
3 382
Other animal farming production of animal products (NEC) 4 203Ostrich farming 0Game farming 0Growing of crops combined with farming of animals (Mixed farming) 28 722Growing of coffee amp tea including coconuts cocoa nuts olives dates etc 0Agricultural and animal husbandry services except veterinary activities 970Other animal farming (not elsewhere classified) 513Growing of trees as second crop by farmers 1 294Fishing operation of fish hatcheries and fish farm 1 589
Red meat
Production and animal products (not elsewhere classified) 0Slaughtering dressing and packing of livestock including poultry and small game for meat
5 128
Production sale amp marketing of Agricultural by products (eg bones hides) 116Slaughtering dressing and packing of livestock including small game for meat and processing of ostrich products
0
Wholesale trade in Agricultural raw materials and livestock 1 697Transport of livestock as supporting activity 0Agricultural and livestock research 534
Seed Seed production and marketing 2 127Sugar Manufacture of sugar including golden syrup and castor sugar 10 478Tobacco Processing and dispatching of tobacco 2 002 Total 239 076
Agriculture Sector Analysis 29
AgriSETA June 2010
Agriculture Sector Analysis 30
Source AgriSETA WSP data
According to the WSP analysis the sub‐sector for the growing of fruit nuts beverage and spice crops employed the largest number of people In six sub‐sectors there are employers who do not employ workers These are probably family based organisations where family members help in the business without drawing a salary These are in transport and livestock research slaughtering dressing and packing of livestock including poultry and small game for meat growing of coffee and tea including coconuts cocoa nuts olives dates etc ostrich farming and game farming
Table 18 Employee distribution by province Province Employees Percentage
Eastern Cape 18 844 192 Free State 1 946 20 Gauteng 2 788 28 KwaZulu‐Natal 5 416 55 Mpumalanga 8 062 82 North West 3 290 34 Northern Cape 5 436 56 Limpopo 1 730 18 Western Cape 50 386 515 Grand Total 97 898
Source AgriSETA WSP data
Of those submitting WSPs registered employers in the Western Cape employed the largest number of people while employers in Limpopo employed the least number of employees Free State has a small number of employees covered by WSPs submitted to the SETA whereas Eastern Cape with a relatively small number of registered farms has a very large number of employees on farms submitting WSPs Given this variance between provinces the use of WSP data for extrapolation purposes must be viewed cautiously
2009 WSP equity information was only provided for about a quarter of employees (25 637 or26)34 No information was available from the WSPs on non‐South Africans working on commercial farms
Table 19 Equity profile from 2009 WSP data African Coloured Indian White
Totals M F D M F D M F D M F D
8 040 5 785 38 5 097 5 228 24 22 25 0 811 556 11
580 417 03 493 505 02 468 532 00 589 403 08 13 863 10 349 47 1 378 25 637541 404 02 54 100
Total EquityTotal Male Total Female Total Disability
13 970 11 594 73 545 452 03
Source AgriSETA WSP data
Using currently available data it is not possible to provide disaggregated employment data by sub‐sector This will require a small change in the way that gender race and disability data is
34 Some employers did not complete race and gender information when giving their employment profiles
AgriSETA June 2010
codified during WSP data‐capturing including allocation by sub‐sector What can be stated is that employment of males is more dominant than that of women and more Africans are employed in the sector than other groups Employment of people with disabilities is below 1
21 Skills demand
The National Education and Training Strategy for Agriculture (AET Strategy)
The AET Strategy developed by the Department of Agriculture Fisheries and Forestry (in consultation with various key stakeholders in the agricultural sector) highlights priority skills needs and constraints within the sector and categorises needs within the following 5 broad areas
1 Agricultural production ndash requesting that the past focus on a narrow band of commodities (relevant mainly to the commercial sector) and related research be expanded to address the needs of small‐scale and subsistence farmers (eg more focus on mixed farming and rural livelihood sustainability skills)
2 Agricultural engineering ndash with specific focus to be placed on technologies suitable for small‐scale farmers (eg relevant and post‐harvesting techniques related to processing and storage of produce) ndash to address this need the scarcity of agricultural engineers requires attention
3 Agricultural economics ndash a critical need was identified for general agricultural economic skills (ranging spectrum of farm planning farm management enterprise management marketing finance etc) ndash with the need to training both farmers and extension officers in such fields
4 Agricultural development ndash a specific need was identified to develop agricultural extensionists in supporting especially emerging and small‐scale farmers over the full spectrum (a need exists for both new curriculum in the training of new extensionists and the re‐training and upgrading of existing officers)
5 Veterinarians ndash the need to develop state veterinarians in order for the state to perform its role and function (particularly in its preventative monitoring and regulatory role and function)
AGRISETA sector skills planning demand data (2008‐2009)
The following section reflects initial research on skills demand in the Agricultural sector arising from the sector analysis (section 1) previous AGRISETA skills demand research for Sector Skills Planning during 2005‐2009 and analysis of WSP data from 2009 With the introduction of the Organising Framework of Occupations and agreement on definitions for scarce and critical skills in 200506 the AGRISETA undertook an extensive research and consultation processes to determine skills development priorities for the sector The research methodology employed was based on the a four dimensional topology for establishing and evaluating skills needs illustrated in the figure below
Agriculture Sector Analysis 31
AgriSETA June 2010
Agriculture Sector Analysis 32
The identification and prioritisation of skills needs was also undertaken from a key stakeholder and beneficiary perspective Consideration was given to needs of the following groups
bull The unemployed ndash helping them gain andor regain entry to the labour market bull The economically inactive ndash helping them to become economically active bull School leavers ndash helping them gain access to further education and training opportunities
and thus facilitating their entry to the job market bull Entrants to the job market ndash facilitating employment and integration into the work culture
and work ethic (improving the employability of an individual) bull Those currently employed in the sector ndash increasing their competency and opportunities
for advancement creating a career path and offering continued job security enhancement of value adding to the sector improving their prospects for better employment opportunities
bull Organisations and enterprises within the sector ndash making sure that skills development and knowledge creation occurs in such a way as to improve the sectorrsquos viability and allowing companiesenterprises to become more sustainable and profitable along the way improving productivity competitiveness and innovation within organisations
In organising and reporting the identified priority skills development needs (200809) the following structuring approach was followed
Tier 1 The four categories of needs as per the Topology presented above were used for the identification evaluation and grouping of needs
Pay conditions
Image
RECRUITMENT DIFFICULTY
SKILLSGAP
SKILLSSHORTAGE
LABOURSHORTAGE
Firms experience difficulty recruiting This does not necessary imply a skills shortage ndash may indicate a poor image remuneration etc
Those currently in work do not have the requisite skills set to carry out their job to an optimum standard
Required skills are in short supply when compared with the demand across the whole labour market
Regardless of skills levels a situation exists where there is simply not enough supply of labour to meet demand
Figure 4 Topology for identifying skills development priorities
Source AGRISETA SSP Annual Update August 2009
AgriSETA June 2010
Tier 2 Within each of the first tier groupings needs were further broken down and organised per target group At this second level needs were grouped by
o General skills development needs (cross‐cutting over different target groups) o Needs experienced by small scale farmers (this group included subsistence
farmers new emerging land reform beneficiaries and small‐scale AgriBEE farmers) o Needs within the commercial agricultural sector (per sub‐sector groupings where
specific needs for such were identified ndash both on‐farm needs and within the secondary sub‐sector or related agri‐businesses)
o Needs of the Department of Agriculture Fisheries and Forestry (DAFF) To further guide and direct the identification and selection of scarce and critical skills the following factors or criteria that could reflect the importance (impact and effect) of a skills shortages were developed as an identification framework
1 Basic Skills Development Promoting basic literacy and numeracy and raising the base level of education for the sector improving the work and livelihood of existing workers
2 Employability Making the employee more employable by improving the fit between their skills and the sector needs
3 Enterprise Viability Improving the capability and feasibility of the enterprise by increasing its effectiveness of or possibilities for profit generation etc
4 Enterprise Sustainability Allow enterprises to survive and grow over an extended period of time without compromising the value of renewable resources thereby creating long‐term meaningful employment for larger numbers of people
5 Sector Growth Enabling the sector to develop or pursue new opportunities or improve the effectiveness of current operations
6 Sector Competitiveness Enabling the sector to compete more effectively in the international arena improving market intelligence and interpretation productivity cost efficiency etc
7 Human Resource Development Capacity Improving the access to quality provision of training to the agri sector
Based on this research and consultation framework the following skills development needs and priorities were identified
Agriculture Sector Analysis 33
AgriSETA June 2010
GENERAL NEEDS SMALL‐SCALE FARMER
NEEDS COMMERCIAL SECTOR
NEEDS DAFF NEEDS
RECRUITMENT RELATED SKILLS NEEDS Primary agriculture is the entry point into the world of work for large numbers of people in rural areas However the sector has negative connotations amongst sections of the youth and in parts of the country and is viewed as a last resort for some in the search for employment) The effect is that despite an unemployment rate of approximately 26 (now over 30) farmers find it difficult to recruit workers to meet seasonal demands This has resulted in the government approving the contracting of foreign labour to meet such temporary needs (workers are recruited mainly from Zimbabwe and Mozambique)
Labour in this farming sector is provided primarily by family members and no real recruitment constraints can be identified
The agricultural sector still manages to attract technical and management skills as it is perceived to include a better lifestyle and there is a strong tradition of agriculture in SA Increasing crime related security risks associated with farming may have a negative impact
The Department has identified a number of occupations in which they are experiencing long‐term vacancies Some of these result from a general shortage of such skills in SA while others arise from the inability of the public sector to compete with the private sector (less favourable employment image working conditions and equity considerations) Priority vacancies include Veterinarians Agricultural
Engineers Plant Health
Specialists Agricultural
Statisticians Plant Health Pest Risk
Analysts ICT Specialists Agricultural
Economists Agricultural Food and
Quarantine Technicians
Agro‐meteorologists Pasture Scientists Plant Production
Specialists Specialised Food
Analysts SKILLS GAPS RELATED NEEDS
bull Low literacy and numeracy levels ndash both amongst workers within the sector at large and at ownermanager level in many of the small‐scale farming
bull Farm management
Farm Management (Mainly owners managers) bull Farm management amp
entrepreneurship bull Resource
management and record keeping
bull Financial planning
A critical constraint is the poor educational levels of a large proportion of the labour force in the sector demanding a considerable effort and investment in ABET and other life skills
A particularly big need exists for skills upgrading amongst Extension Officers ndash particularly with regard to redress the historical neglect of small‐scale farmers and resource strapped farmers
Agriculture Sector Analysis 34
AgriSETA June 2010
Agriculture Sector Analysis 35
GENERAL NEEDS SMALL‐SCALE FARMER
NEEDS COMMERCIAL SECTOR
NEEDS DAFF NEEDS
skills (and general management skills in other agricultural businesses) coupled with a business orientation and entrepreneurship skills
bull A general need to increase compliance with environmental occupational health and safety animal welfare produce safety and hygiene standards regulations and requirements (local and international standards)
and management bull Project management bull Business plan
development Marketing and processing bull Processing and
packaging bull Transport
management bull Marketing produce
including branding bull Planning for
marketing bull Knowledge of
markets Technical knowledge and skills bull Production
management (related to specific enterprise)
bull Demonstration of production techniques
bull Natural resources management
Mechanical knowledge bull Farm maintenance bull Repairs of machinery
and equipment bull Electrical
maintenance and installation
programmes Need for improved management skills and relevant technological knowledge for increasing productivity levels and improved production methods Rising importance for environmentally responsible production and processing management systems Rising competitive and international markets increases need for business and marketing abilities among owners and managers Increasing requirements for compliance with environmental health and safety and international trade standards Information technology although not a priority is increasing in importance Business management ability is becoming increasingly important as more farmers are making decisions about restructuring their businesses diversification and developing supplementary sources of income
Critically improved farm management and business skills within an agricultural context to support the majority of BEE and emerging farmers Skills upgrading requirements for existing Extension Officers include bull Agricultural
economics bull Agricultural
management bull Business and
financial management
bull Technical and production related skills including o Animal husbandryo Poultry o Crop production o Horticulture
SKILLS SHORTAGES Generally SA has a shortage of entrepreneurs and people who have the business acumen drive motivation and
The profile of these farmers reflects a large contingent of older and less educated people who are generally less flexible tend to stick to
The commercial agri sector will increasingly have to compete in the global market and the ever increasing need to increase productivity to
DAFF us experiencing problems are especially sourcing people in specialised science related fields (learning fields experiencing few
AgriSETA June 2010
Agriculture Sector Analysis 36
GENERAL NEEDS SMALL‐SCALE FARMER
NEEDS COMMERCIAL SECTOR
NEEDS DAFF NEEDS
perseverance to become a successful farmer Given the high risks involved in the agricultural sector (natural elements outside onersquos control) the agri sector does not compete successfully for this ldquoscarce resourcerdquo Moreover as with other professional and skilled occupations there is a tendency for younger qualified people to move to urban areas
known practices and are less likely to experiment with new technology Within this target group candidates with good entrepreneurial ability are scarce There is a perceived shortage of Agricultural Extensionists and advisors to assist this target group However a large pool of young unemployed graduates exists who could assist such emerging farmers if they were mobilised and made accessible to farmers Similarly the potential pool of retired commercial farmers who could serve as mentors to this target group
remain profitable and viable it can be stated that many of the existing farmers and managers owners lack business management and entrepreneurial orientation Equity policy and the need to become BEE compliant requires that commercial enterprises appoint and develop black owners directors managers Changing local and global consumer preferences require farmers to change traditional farming methods and practices Skills and knowledge requirements include bull Global food and
international quality standards
bull Product traceability requirements
bull Organic produce and products
Specific occupations identified as being in short supply are
bull Production Managers (food processing)
bull Product specialisation to international specifications (research skills)
bull Forklift drivers heavy vehicletruck drivers and mobile plant operators
bull Experienced and competent artisans (millwrights electricians fitters
enrolments andor pass rates at HET institutions with the result that too few qualified persons come onto the labour market) Examples of such skills shortages identified by the Department include Agricultural Engineers bull Plant Health
Specialists (Nematology Entomology Plant Pathology)
bull Statisticians (specialised agricultural knowledge)
bull Plant Health Pest Risk Analysts
bull Agricultural Economists (production and resource economists)
bull Agricultural Food and Quarantine Technicians
bull Agro‐meteorologists Early warning Specialists
bull Pasture Scientists bull Plant Production
Specialists (eg ornamental crops hydroponics)
bull Specialised Food Analysts (pesticide residue analysts processed food and dairy analysts wine and spirit analysts)
AgriSETA June 2010
Agriculture Sector Analysis 37
GENERAL NEEDS SMALL‐SCALE FARMER
NEEDS COMMERCIAL SECTOR
NEEDS DAFF NEEDS
and turners bull Agricultural
Equipment Technicians
bull Pest and weed controllers
bull Horticultural specialists
LABOUR SHORTAGES AND RELATED SKILLS NEEDS Given an employment rate of some 26 (2009 currently estimated at over 30expanded definition) per definition there cannot be a labour shortage It is however difficult for people who have never worked before to integrate into the agricultural sector workforce Coupled with an aging workforce (30‐60 being over 40) means that most agri enterprises will within the next 5‐10 years be looking at replacing a large proportion of their workforce There could be an insufficient pool of people willing and able to participate The impact of HIVAIDS is also not always factored in to understanding the diminishing pool of resources available Labour shortages have been reported within selected geographical areas and in particular occupations Examples include cane cutters in the sugar industry chicken catchers in the poultry industry pickers in the fruit industry and animal handlers in feedlots as well as dairy parlour workers It is however believed that these shortages may reflect a recruitment problem as a result of the very harsh working conditions and the relatively poor remuneration (which makes these occupations unpopular) At present such ldquoshortagesrdquo are addressed through contracting labour from neighbouring countries
AgriSETA WSP analyses
Skills demand in the commercial agricultural sector
Information for demand for skills from WSP data is available for 1 673 employers who submitted their WSPs for the 200910 period The table below shows data on sub‐sector WSP submission relative to size of the sub‐sector as well as subsector data from all registered organisations and those who submitted WSPs Data for registered employers shows that there were 239 076 employees employed by the 17 234 registered organisations As previously stated 97 898 employees were employed by the organisations submitting WSPs This constitutes 41 of employees employed by registered organisations
Table 20 Employment and sub‐sector data drawn from WSP analyses
Sub‐sector
All Re
gistered
Employers
Small employers (0‐49)
Med
ium and
large
employers (50+)
Total W
SPs received
Total W
SPs received
as of
all registered em
ployers
WSP
received med
ium and
large orgs
WSPs received
as of
med
ium amp large em
ployers
WSPs received
small
employers
WSPs received
as of small
enterprises
EmployeesPer
Profile
CoffeeTea 40 33 7 9 23 5 71 4 12 483 Fibre 1 710 1 676 34 34 2 22 65 12 07 6 539
AgriSETA June 2010
Agriculture Sector Analysis 38
Sub‐sector
All Re
gistered
Employers
Small employers (0‐49)
Med
ium and
large
employers (50+)
Total W
SPs received
Total W
SPs received
as of
all registered em
ployers
WSP
received med
ium and
large orgs
WSPs received
as of
med
ium amp large em
ployers
WSPs received
small
employers
WSPs received
as of small
enterprises
EmployeesPer
Profile
Fruit 371 277 94 162 44 76 81 86 31 27 873 Grain 648 581 67 77 12 48 72 29 5 22 129 Milling 335 279 56 61 18 35 63 26 9 4 630 Pest Control 213 209 4 8 4 2 50 6 3 119 Poultry 391 305 86 66 17 46 53 20 7 19 187 Primary 12 121 10 776 1 345 1144 9 513 38 631 6 136 034 Red meat 1107 1 018 89 70 6 45 51 25 2 7 475 Seed 167 149 18 24 14 13 72 11 7 2 127 Sugar 71 45 26 13 18 10 38 3 7 10 478 Tobacco 60 46 14 5 8 3 21 2 4 2 002
Totals 17 234 15 394 1 840 1 673 10 818 44 855 16 239 076
Source 1 AgriSETA WSP 2009 data
Only 10 of all registered employers submitted WSPs for the 200910 period Of these 49 were medium and large sized employers and 51 small However only 16 small employers submitted their WSPs relative to the number of registered small employers and 44 medium and large employers submitted WSPs relative to the number of registered medium and large employers As such skills demand statistics provides more representative data on the requirements of medium and large employers Data for skills demand in the commercial agricultural sector is based on data for permanent employees as well as casual and seasonal employees
Skills demand forecasting by AgriSETA
Forecasting for skills demand the AgriSETA has estimated that the demand for skilled employees at different levels in the next few years is 510 686 This is based on WSP data analyses over the last 5 years and projected demand for the formal commercial agricultural sector and factoring in the demand that at maximum would result from completion of the land restitution programme in South Africa The table below reflects the skills that are on demand as well as the estimates for demand over the next five years by major occupational category35
35 AgriSETA 2010
AgriSETA June 2010
Table 21 Demand for skills by occupational category
Major Occupation (OFO)Estimated Demand
Group Title1 Managers (commercial and small emerging farmers) 264 3702 Professionals 4 1413 Technicians and Trade workers 8 9255 Clerical and administrative workers 8006 Sales workers 4007 Machinery operators and drivers 5 8008 Elementary workers 226 250
Total 510 686Source AgriSETA WSP data and SSP demand forecasts
Research needs going forward
As has been set out in the sector analysis and the scenarios derived from that analysis the sector is faced by both significant and profound change and also great uncertainty It therefore follows that the task of focussing limited resources (basically levy income in the formal sector and NSF funds for the emergent farming sector) is difficult Whilst the general thrust of training remains broadly as described in the 2006‐10 SSP Updates some considerable work is required to achieve targeted effective interventions during the 2011‐2016 period The following research questions will need to be addressed in preparing the next SSP
bull In relation to the managers and owner‐managers of commercial farms and enterprises what skills are needed to enable them to help bring about the more optimistic scenario and manage the risks associated with the less optimistic ones
bull In terms of professional and technical competencies do the current education and training institutions coupled with the learning programmes available through the AgriSETA (learnerships skills programmes and the like) meet the needs of the sector
bull In the emerging agricultural sector do the current programmes funded by sources external to the AgriSETA (eg NSF) meet all the identified needs What gaps are there and how should they be addressed
bull In relation to governmentrsquos growth strategy and industrial action plans what skills are required for developing the aquaculture sub‐sector What programmes are available How can the SETA support the skills needs for this sub‐sector
bull Given the increasing levels of casual and contract labour how can skills be developed to meet the needs of the formal commercial sector and the emerging enterprise sector
bull How can the demand in each of the priority areas be quantified and agreement be reached on numbers of people to be trained
Agriculture Sector Analysis 39
AgriSETA June 2010
SECTION 3 Skills Gaps and scarce skills
Scarce skills at the DAFF
The level of scarce skills at DAFF can be determined by the vacancy rate While the average vacancy rate in the department as at 31 March 2009 was 17 there were some posts that had very high vacancy rates as reflected in the table below Indicating the possibility that the Department is experiencing difficulties in finding suitable candidates in the South African labour market to fill these posts
Table 22 Scarce skill occupations and vacancy rates (DAFF March 2009) Critical occupations Number of posts Posts filled Vacancy rate ()
Agricultural animal oceanography forestry and other sciences
167 119 287
Engineering sciences related 2 1 50Engineers and related professions 13 6 538Farming forestry advisors and farm managers 11 4 636Finance and economics related 73 53 274Horticulturists foresters agricultural and forestry technicians
350 221 369
Legal related 6 4 333Mechanical engineering technicians 3 2 333Risk management and security services 6 4 333Social sciences related 1 0 100Veterinarians 34 24 294
Source DAFF Annual Report 20082009
Skills are also scarce at senior management level The department also reports on difficulties it has filling senior management services vacancies with some of them staying vacant for up to twelve months because no suitable candidates can be found The department would then resort to re‐advertisement and head hunting This was the case with 22 of 18 SMS posts in March 2009
Scarce skills in the commercial sector
The following occupations have previously been projected as scarce (extremely hard to fill vacancies) by AgriSETA in the commercial agricultural sector over the next five years
Table 23 Scarce and critical skills in the commercial agricultural sector
Occupation Code
Group Occupation Critical Skills Intervention Comments
139903 Managers Laboratory Manager
Technology AI nutrition
HET
221101 Professionals Accountant (General)
General HET
221102 Professionals Management Accountant
Farm financial management
HET Focus on support advice to farmers new enterprises
222101 Professionals Commodities Trader
Export administration supply chain
FET Learnership Skills
Agriculture Sector Analysis 40
AgriSETA June 2010
Agriculture Sector Analysis 41
Occupation Code
Group Occupation Critical Skills Intervention Comments
management Programme
224301 Professionals Economist Agricultural HET
Mainly for Department of Agriculture and para statals commodity organisations
233101 Professionals Chemical Engineer
Chemical processes in food production
HET Industries such as sugar processing
233301 Professionals Electrical Engineer
Installation and maintenance
HET Processing industry
233401 Professionals Electronics Engineer
Computerised production prosesses
HET Processing industry
233501 Professionals Industrial Engineer
Productivity and efficiency
HET Processing industry
233904 Professionals
Instrument Engineer (Defence Force)
Installation and maintenance
HET
Not for defence ‐ sugar industry
233502 Professionals Mechanical Engineer
FETHET Equity reasons
233902 Professionals Agricultural Engineer
Farm layout and infrastructure
HET Mainly in Government
311101 Technicians and trades workers
Agricultural Technician
Installation and maintenance
FETHET
234102 Professionals Agricultural Scientist
Agri research HETFET Especially in horticulture
234201 Professionals Chemist HET Processing industry
234202 Professionals Food Technologist
Food safety HACCP
FETHET Across sector
234701 Professionals Veterinarian HET Mainly in Government
311101 Technicians and trades workers
Agricultural Technician
Farm infrastructure
FET Mainly needed in government
311401 Technicians and trades workers
Chemistry Technician
FETHET EE reasons
312907 Technicians and trades workers
Chemical Engineering Technician
FET Learnership
Mainly EE reasons
312402 Technicians and trades workers
Electronic Engineering Technician
Weak stream production infra
FETHET Mainly tobacco industry
233904 Professionals
Instrument Engineer (Defence Force)
Instrument technician
FET
Occupation needed Instrument Technician (not defence force) Mainly sugar processing sector
321202 Technicians and trades workers
Diesel Motor Mechanic
FET Learnership
To include tractor mechanic
321204 Technicians and trades workers
Small Engine Mechanic
Agricultural equipment
FET Learnership
Throughout sector
AgriSETA June 2010
Agriculture Sector Analysis 42
Occupation Code
Group Occupation Critical Skills Intervention Comments
322301 Technicians and trades workers
Metal Fabricator
Artisan FET Learnership
322303 Technicians and trades workers
Welder Welder (First Class)
Artisan FET Learnership
323203 Technicians and trades workers
Fitter‐Welder Artisan FET Learnership
Mainly sugar ndash multi‐skilled
323202 Technicians and trades workers
Fitter And Turner
Artisan FET Learnership
Tobacco and sugar
323501 Technicians and trades workers
Millwright Artisan FET Learnership
Wide‐spread need
341101 Technicians and trades workers
Electrician (General)
Artisan FET Learnership
Wide‐spread need
342101 Technicians and trades workers
Air‐Conditioning And Refrigeration Mechanic
Artisan FET Learnership
Sugar pack houses cold chain
Source AgriSETA Sector Skills Plans
Supply of skills
South Africarsquos agriculture skills are produced in high schools agricultural colleges FET colleges and Higher Education institutions In high school a large cohort of learners take Agricultural Science as a subject In 2003 there were 42 Agricultural High Schools offering Agricultural Science as a subject These students and those in high schools taking the subject could progress to taking agriculture as a focus area for further education In 2004 there were 10 FET colleges offering vocationally directed agricultural programmes These FET colleges offered complete qualifications and short courses Eleven Colleges of Agriculture can offer qualifications up to degree level and 19 universities offer qualifications in Agriculture ranging from agricultural economics animal and plant sciences and horticulture among others at under and post graduate levels (Department of Agriculture 2006) While long term planning of skilling of new entrants in the sector can be done through close consultation between the sector agricultural schools and colleges FET colleges and HET institutions so that they teach relevant skills there are other avenues for training for those who are already employed in the sector for example skills programmes and learnerships There are 15 registered qualifications for the primary agriculture sub sectors Currently AgriSETA has 94 registered learnerships that can address the skills needs of the identified scarce skills These are captured in Appendix 2 AgriSETA has approved accredited a number of training providers across the country to deliver the theoretical and practical components of these learnerships These include agricultural colleges FET colleges and private providers Currently the AgriSETA has 246 registered and approved providers distributed nationally as follows
AgriSETA June 2010
Table 29 AgriSETA approved training providers (2010) Province Number of providers
Gauteng 72
(29)
KwaZulu Natal 20
(8)
Limpopo 35
(14)
North West 30
(12)
Northern Cape 3
(1)
Free State 15
(6)
Mpumalanga 14
(6)
Western Cape 26
(11)
Eastern Cape 31
(13) Total 246
The providers are small to large organisations In primary agriculture small providers appear to offer the most training in rural areas and community projects (AgriSETA 2010) Most of the operating providers will be in FET colleges and agricultural colleges The AgriSETA is unable to meet the total demands for skills across the duality of their sector There seems to be fairness in the approval of training for both permanent and casual and seasonal workers In 200809 the AgriSETA approved 559 learnerships as follows
Table 30 AgriSETA learnerships approved for grant purposes (2008‐2009)
Source AgriSETA learnership data analysis
Agriculture Sector Analysis 43
AgriSETA June 2010
Agriculture Sector Analysis 44
Provision of skills programmes in the same year attracted grants for 2 706 employees
Table 31 Participation by learners in skills programmes in the AgriSETA (200809)
Source AgriSETA Skills programmes data analysis
AgriSETA June 2010
APPENDIX 1 Skills demand in the Department of Agriculture Forestry amp Fisheries (200809)
Source DAFF Annual Report 2008‐20009
Agriculture Sector Analysis 45
AgriSETA June 2010
Agriculture Sector Analysis 46
Appendix 2 AgriSETA registered learnerships Registered Learnership NQF Level SAQA Registration NoLearnership in Agri Sales and Service 4 22 Q 220001 20 178 4Learnership Agricultural Machinery Technician 2 22 Q 220007 20 160 2Learnership in Specialist Agricultural Machinery Technician 5 22 Q 220009 21 258 5Agri Trade Processes 2 22 Q 220013 30 125 2FETC Meat Examination Applying Basic Business Principles 4 30 Q 3000 2823 164 4Further Education and Training Certificate Seed Marketing Execute Seed Trials 4 22 Q 220025 21 126 4Further Education and Training Certificate Seed Research and Development Certify as Seed Unit 4 22 Q 220027 21 121 4FETC Seed Research and Development Conduct a Field Inspection of a Seed Unit 4 22 Q 220028 20 120 4Seed Research and Development Operations Operate in a Team 3 22 Q 220020 22 121 3Seed Research and Development Operations Apply Basic Business Principles 3 22 Q 220021 22 121 3National Certificate Seed Processing and Packaging Operate in a Team 3 22 Q 220026 21 123 3Sugar Industry Technical Maintenance worker 2 22 Q 220011 39 128 2National Certificate Sugar Manufacturing and Refining Technical Maintenance 3 30 Q300003 23 146 3Further Education and Training Certificate Manufacturing Technical MaintenanceProduce Components by Performing Engineering Turning Operations
4 30 Q 3000 1321 173 4
FETC Manufacturing Technical Maintenance Produce Components by Performing Milling Operations 4 30 Q 3000 1521 173 4 FETC Manufacturing Technical Maintenance Develop and Fabricate from Complex Drawing 4 30 Q 3000 1420 173 4National Certificate in Sugar Technology 5 22 Q 220036 22 140 5Further Education and Training Certificate Sugar Processing 4 22 Q 220035 31 144 4National Certificate in Sugar Technology Processing Sugar Refining 2 22 Q 220037 28 124 2National Certificate in Sugar Technology Processing Juice Preparation 2 22 Q 220038 28 124 2National Certificate in Sugar Technology Processing Crystallisation 2 22 Q 220039 27 122 2National Certificate in Sugar Technology Processing Laboratory Practice 2 22 Q 220040 25 124 2National Certificate in Sugar Technology Processing Extraction 2 22 Q 220041 28 122 2NC Rooibos Production Applying Basic Business Principles 2 30 Q 3000 2427 130 2 NC Rooibos Processing Applying Basic Business Principles 2 30 Q 3000 2224 123 2 National Certificate Cigarette Production 3 22 Q 220046 23 121 3
AgriSETA June 2010
REFERENCES AgriSETA 2010 AgriSETA 20082009 Annual report Pretoria AgriSETA Agricultural Research Council httpwwwarcagriczahomeasppid=272 Avert South African HIV and AIDS statistics Available on httpwwwavertorgsafricastatshtm Centre for Development Enterprise 2008 Land reform in South Africa Getting back on track CDE Research No 16 DAFF 2010 Quarterly economic review of the agriculture sector Pretoria DAFF DAFF 2009 Annual report 20082009 Pretoria DAFF Department of Agriculture 2008 Strategic plan 2008 Pretoria Department of Agriculture DTI An introduction to the South African economy Available on httpwwwthedtigovzapublicationsagroprocessinghtm Eastern Cape Provincial Government Eastern Cape Provincial Growth and Development Strategy 2004 ndash 2014 Economic Commission for Africa 2009 Developing African agriculture through regional value chains Addis Ababa Economic Commission for Africa Economic Report Free State Province 2005 Provincial Growth and Development Strategy 2005 ndash 2014 GCIS 2010 SA Yearbook 200910rdquo Agriculture forestry and fisheries Pretoria GCIS Greenberg S 2010 Status report on land and agricultural policy in South Africa 2010 Institute for Poverty Land and Agrarian Studies School of Government University of the Western Cape Research report Ingelozi Management Solutions 2008 HIVAIDS in the South African agricultural sector Towards the development of a long term intervention Research report KwaZulu Natal Provincial Government 2006 KwaZulu Natal Provincial Growth and Development Strategy Limpopo Provincial Government Growth and Development Strategy 2004 ndash 2014 Mhone G (2000) Enclavity and Constrained Labour Absorbtive Capacity in Southern African Countries Geneva International Labour Office Moyo S The Agrarian question and the developmental state in South Africa In Edigheji O et al 2010 Constructing a democratic developmental state in South Africa HSRC PRESS
Agriculture Sector Analysis 47
AgriSETA
Agriculture Sector Analysis
National Treasury Republic of South Africa 2010 National Budget 2010 ndash National Budget Review 2010 Pretoria National Treasury Northern Cape Provincial Government Agriculture and agro‐processing sector strategy North West Provincial Government North West Provincial Growth and Development Strategy 2004 ndash 2014 Province of the Western Cape 2008 The Ikapa growth and development strategy White Paper SABCOHA SA Business Coalition on HIV and AIDS wwwsabcohaorg SACAU httpwwwsacauorghostingsacauSacauWebnsfHomehtmOpenForm South African Government 2010 20102011 ndash 20122013 Industrial Policy Action Plan Republic of South Africa Statistics South Africa 2005 Census of commercial agriculture 2002 Report No 110201 Pretoria Statistics South Africa Statistics South Africa 2009 Census of commercial agriculture 2007 Statistical release P1101 Pretoria Statistics South Africa Statistics South Africa 2010 General household survey 2009 Statistical release P0318 Pretoria Statistics South Africa Statistics South Africa 2010 Gross domestic product first quarter 2010 Statistical release P0441 Pretoria Statistics South Africa Statistics South Africa 2010 Quarterly labour force survey Quarter 1 2010 Statistical release P0211 Pretoria Statistics South Africa Vink N amp van Rooyen J 2009 The economic performance of agriculture in South Africa since 1994 The implications for food security Pretoria DBSA development planning division working paper series No 17 Webster E 2004 the Dual Economy from a book by Van Holdt K and Webster E Work restructuring and the Crisis of Social reproduction and 10 years of restructuring post apartheid workplaces University of Natal Press Workinfocom httpwwwworkinfocomfreesub_for_legresdatalraempassoc3htm Xingwana L 2008 Challenges and Opportunities for Land and Agrarian Reform towards 2025 Speech delivered at the Agri‐Consultation Protea Ranch Hotel Polokwane 30 July 2008
- Table of contents
- SECTION 1 THE AGRICULTURAL LANDSCAPE
- 11 Size and shape of the Agricultural sector
-
- Overview
- Distribution of agricultural production
- The structure of the agriculture sector in South Africa
- Categories of farming enterprises
- Employment trends
- Employment categories and remuneration
- Stakeholders in the Agricultural sector
-
- National government departments
- Sector representatives
-
- 12 Factors impacting development in the Agriculture sector
-
- Future sector economic growth and development
-
- South African sector growth plans (IPAP2)
- International Trade
- Global recession and rise in food prices
-
- Land reform
- Reliance on imports
- Water
- The labour market
- Consumer trends
- HIVAIDS
- Farm safety and security
- Broad-based Black Economic Empowerment
-
- Conclusions and scenarios
- SECTION 2 DEMAND FOR SKILLS
-
- AgriSETA registered employers and employee coverage
- Employee coverage in the AgriSETA
-
- 21 Skills demand
-
- The National Education and Training Strategy for Agriculture (AET Strategy)
- AGRISETA sector skills planning demand data (2008-2009)
- AgriSETA WSP analyses
-
- Skills demand in the commercial agricultural sector
-
- Skills demand forecasting by AgriSETA
- Research needs going forward
-
- SECTION 3 Skills Gaps and scarce skills
-
- Scarce skills at the DAFF
- Scarce skills in the commercial sector
- Supply of skills
-
- APPENDIX 1 Skills demand in the Department of Agriculture Forestry amp Fisheries (200809)
- Appendix 2 AgriSETA registered learnerships
-
AgriSETA June 2010
Agriculture Sector Analysis 1
SECTION 1 THE AGRICULTURAL LANDSCAPE ldquoSouth Africarsquos agricultural sector is characterised by dualism a modern commercial farming sector using hired farm workers alongside small‐scale farmers mostly in the former homeland areas In addition land reform is creating thousands of new farming opportunities for emerging black farmers throughout the country and across the scale from large commercial to smallholder productionrdquo1
ldquoThe agro‐processing sector comprises a highly diverse group of sub‐sectors and industries The major sub‐sectors include Food processing Beverages Aquaculture Horticulture Medicinal aromatics and flavourants The agro‐processing sector has particularly strong linkages both up‐ and down‐stream Up‐stream the sector links to agriculture across a wide variety of farming models and products Down‐stream the sectorrsquos products are marketed across both wholesale and retail chains as well as through a diverse array of restaurants pubs shebeens and fastfood franchises Moreover the food processing sector is now the largest manufacturing sector in employment terms with some 160000 employees this increases to more than a million jobs once the upstream (primary agriculture) is includedrdquo2
11 Size and shape of the Agricultural sector
Overview
The South African agricultural sector is a diverse sector comprising several branches namely field crop husbandry horticulture animal production) dairy farming fish farming game farming and agro‐processing Within these broad branches are 39 sub‐sectors that are classified according to agricultural and economic focus as follows The sector encompasses both primary (resource production) and secondary (primary processing) activities
Table 1 Activities within the agricultural sector by international SIC code Sub‐sector Code DescriptionCoffeeTea 30493 Processing and marketing of coffee and tea including coconuts cocoa nuts olives dates etcFibre 30118 Grading ginning and packing of wool and cotton raw material
Fruit 30132 Fruit packed in cartons fruit juice concentrate drummed and fruit juice in container ready for consumption
Fruit 30133 Fruit exporters and importers
Grain
30300 Manufacture of grain mill products and starches30313 Handling and storage of grain61502 Wholesale amp retail trade in Agricultural machinery62111 Sale and distribution of Agricultural raw materials and other farming inputs
Milling 30311 Manufacture of flour and grain mill products including rice and vegetable milling grain mill
1 SETA re‐establishment and demarcation ndash A synthesis of the AgriSETA landscape AgriSETA June 2010 2 201112‐201213 Industrial Policy Action Plan DTI February 2010 Emphasis added
AgriSETA June 2010
Agriculture Sector Analysis 2
Sub‐sector Code Descriptionresidues
30330 Manufacture of prepared animal feeds30331 Manufacture of pet foods30332 Manufacture of starches and starch products
Pest control 99003 Pest Control Poultry 30114 Poultry and egg production including the slaughtering dressing and packing of poultry
Primary
11110 Growing of Cereals and other crops (not elsewhere classified)11120 Growing of Vegetables Horticultural specialties and nursery products
11121 Growing of Vegetables Horticultural specialties (Including Ornamental Horticulture) and nursery products
11122 Sugar plantation including sugar cane and sugar beet etc11130 Growing of fruit nuts beverage and spice crops11210 Farming of cattle sheep goats horses asses mules and hinnies Dairy farming 11220 Other animal farming production of animal products (not elsewhere classified) 11221 Ostrich farming 11222 Game farming 11300 Growing of crops combined with farming of animals (Mixed farming) 11301 Growing of coffee and tea including coconuts cocoa nuts olives dates etc 11400 Agricultural and animal husbandry services except veterinary activities 11402 Other animal farming (not elsewhere classified)12109 Growing of trees as second crop by farmers13000 Fishing operation of fish hatcheries and fish farm
Red Meat
11141 Production and animal products (not elsewhere classified)30111 Slaughtering dressing and packing of livestock including poultry and small game for meat30115 Production sale amp marketing of Agricultural by products (eg bones hides)
30117 Slaughtering dressing and packing of livestock including small game for meat and processing of ostrich products
61210 Wholesale trade in Agricultural raw materials and livestock74136 Transport of livestock as supporting activity87120 Agricultural and livestock research
Seed 11140 Seed production and marketing Sugar 30420 Manufacture of sugar including golden syrup and castor sugar Tobacco 62208 Processing and dispatching of tobacco Source AgriSETA
The contribution of primary agriculture to the gross domestic product (GDP) is about 25 and its contribution to formal employment is about 53 However agriculture has strong backward and forward linkages into the economy
The agro‐industrial sector has a higher contribution of about 12 to GDP4
Primary agriculture contributed 23 to the GDP in 20095
The figure below shows the relatively small proportion of GDP contribution from primary agriculture It needs to be noted however that processing is not included in the 23 as it is included in manufacturing and other farming activities For example farms linked to leisure facilities are located under Trade and Accommodation
3 National Treasury 2010 4 GCIS 2010 5 National Treasury 2010
AgriSETA June 2010
Figure 1 Contribution of agriculture to national GDP
Source National Treasury Budget Review 2010
South Africa is one of the top global exporters of some agricultural produce where it is ranked first in three products
Table 2 South Africas world ranking in selected products
Export Item South Africarsquos world ranking
Avocados 1st
Clementines 1st
Ostrich products 1st
Grapefruit 2nd
Table grapes 3rd
Plums 3rd
Pears 5th Source DTI February 2010
Distribution of agricultural production
South Africa has 276 million hectares of cultivated land of which nearly 1045 million hectares (82) is used for commercial purposes A total of 079 million hectares (only 619) is permanently under cultivation and more than 1083 million hectares (85) is rain‐fed More than 07 million hectares of land are degraded and left bare by sheet and gully erosion About 461 million hectares of natural vegetation are degraded mainly in indigenous forests woodlands and grasslands a further 019 million hectares are degraded by mine tailings waste rock dumps and surface‐based mining Land use in urban areas comprises mainly formal residential suburbs and townships (1 million ha) and informal settlements (023 million ha) Savannas (woodlands and bush lands) and grasslands cover 2570 and 1992 of South Africa respectively (Department of Environmental Affairs)
Although 80 of South African land is used for agriculture and subsistence farming only 12 is arable and the rest is used for grazing The main agricultural activities are crop production mixed farming cattle ranching and sheep farming dairy farming game ranching aquaculture beekeeping and winemaking (GCIS 2010) South Africa is the largest producer of maize the
Agriculture Sector Analysis 3
AgriSETA June 2010
staple food in the Southern African Development Community (SADC) as well as the main ingredient for animal feed The table below gives an indication of the geographic location of production of specific agricultural produce as well as the annual volume produced
Table 3 Volume of agricultural production by product and location Agricultural product Dominant production locations Average annual volume producedMaize North West Free State Mpumalanga 13 2 metric ton Wheat Western Cape Free State 21 metric ton Barley Western Cape 192 000 ton Groundnuts Free State North West Northern Cape 88 800 ton Sunflower seeds Free State North West Mpumalanga Limpopo 872 000 ton Soya beans Free State Mpumalanga KwaZulu Natal ‐ Sorghum Free State Mpumalanga Limpopo North West 255 000 ton Canola Western Cape North West Limpopo 30 800 ton
Dry beans Mpumalanga Free State Gauteng North West KZN Limpopo Western Cape Northern Cape
60 000 ton
Sugar Eastern Cape Mpumalanga KwaZulu Natal 20 metric ton
Deciduous fruit Western Cape Eastern Cape Free State Mpumalanga Gauteng
‐
Wine Western Cape 4033 million litres exported in 2009Citrus and subtropical fruit
Limpopo Mpumalanga Eastern Cape KwaZulu Natal Western Cape Northern Cape
46 896 ton subtropical fruit
Potatoes North West Northern Cape KwaZulu Natal Limpopo Free State Mpumalanga Eastern Cape Western Cape
1 853 000 ton
Tomatoes Limpopo Mpumalanga KwaZulu Natal Eastern Cape Western Cape
459 217 ton
Onions Mpumalanga Western Cape Free State 417 579 ton Cabbages Mpumalanga KwaZulu Natal 138 161 ton
Cotton Mpumalanga Limpopo Northern Cape KwaZulu Natal North West
‐
Tobacco Mpumalanga Limpopo North West 10 200 ton Tea Western Cape Eastern Cape ‐ Flowers Western Cape ‐ Livestock All provinces Largest agricultural sector
Dairy Free State North West KwaZulu Natal Eastern Cape Western Cape Mpumalanga
3 129 metric litres
Beef Cattle Eastern Cape Free State KwaZulu Natal Limpopo North West Mpumalanga Northern Cape
‐
Sheep and goats Eastern Cape Northern Cape Free State Western Cape Mpumalanga
‐
Poultry and pigs All provinces 930 000 ton broilers
26 million pigs slaughtered from August 2007 to August 2008
Fish Western Cape Eastern Cape ‐
Game Limpopo Northern Cape Eastern Cape Western Cape
‐
Beekeeping Western Cape KwaZulu Natal 2 000 ton Source GCIS SA Yearbook 200910
Agriculture plays an important part in provincial development and for most provinces provides a source of employment as well as being a potential focus for increased employment and sustainable livelihoods Agriculture therefore features as a key focus for economic development
Agriculture Sector Analysis 4
AgriSETA June 2010
Agriculture Sector Analysis 5
and growth in the all provinces Agricultural contribution to provincial GDP varies with the Free Statersquos agricultural sector contributing the most as reflected below
Table 4 Agriculture ‐ Contribution to Provincial GDP Province Percentage contribution to GDP
Free State 92 Limpopo 3 KwaZulu Natal 55 (2004) Western Cape 45 (2003) Mpumalanga 61
Source Provincial Growth Development Strategies
The provinces all have different focuses in their development strategies for agriculture although the underlying principle is the improvement of the lives of the people through employment creation in agriculture and provision of food security through investment in agricultural processes and technologies that enhance efficiency Free Statersquos focus on agriculture development is agriculture diversification and agribusiness Diversification involves identifying crops with a defined market in line with new and innovative agricultural practices Agribusiness extracts value from primary agriculture through processing of raw materials and provision of services to add value to produce6 The objectives of the Limpopo province with regards to agricultural development are tripling the size of agriculture by 2015 increasing the value of agriculture through enterprise diversification investing in water saving technologies and adding value within the agro‐value chain7 In the Eastern Cape two thirds of the population live in rural areas and the development of agriculture is a key factor in the development of the peoplersquos socio‐economic livelihood Development of agriculture will provide employment and an income to many families The focus of the growth and development strategy is to promote household food security through expanded smallholder production development of commercial agriculture through optimal use of agricultural land in the homelands focus on land redistribution and tenure and integration of homelands agriculture into mainstream provincial agricultural activity8 KwaZulu Natalrsquos focus on agriculture in the Growth Development Strategy is poverty alleviation as most areas of poverty in the province are rural The plan is to link up rural subsistence agricultural activity with commercial agriculture so as to develop subsistence agricultural projects into commercial ones The other focus is to link land reform projects to key provincial agrarian revolution programmes so as to make land transfer an economic growth opportunity The agrarian revolution strategy involves enabling access to markets farmer development through the set up of agri‐businesses improve road infrastructure to improve access to markets and expediting the land reform process9
6 Free State Growth Development Strategy 2004 ndash 2014 7 Limpopo Growth Development Strategy 2004 ndash 2014 8 Eastern Cape Growth Development Plan 2004 ‐ 2014 9 KZN Growth Development Strategy 2006
AgriSETA June 2010
Agriculture Sector Analysis 6
Northern Capersquos focus is the development of agro‐processing (Northern Cape Growth and Development Strategy) The North West is focusing on enabling access to markets and assisting financially in infrastructure development and machinery acquisition as well as investing in agro‐processing technology and skills as well as promoting efficient land use10 Agriculture holds employment growth potential in Mpumalanga province It accounts for 181 of provincial employment with forestry being the main agricultural activity in the province About 383 of the provincersquos land is used for forestry Agriculture is identified as a key focus area to achieve the strategic growth development strategy of providing a better life for all in the province through economic development Growth potential is through agricultural investment production and beneficiation so as to increase agriculture GDP contribution from 61 to 10 by the end of the 20082009 financial year Other strategic objectives are to increase sustainable employment in the agricultural sector from 18 to 20 by the end of 2015 improve food security by 50 by 2014 improve sustainability in agri‐business enterprises by 20 and increase participation of historically disadvantaged in agriculture to meet national Agri BEE targets (Mpumalanga Growth and Development Strategy 2004 ‐ 2014)
The structure of the agriculture sector in South Africa
The South African Agriculture Sector primarily based in rural and peri‐urban areas is characterised by a dual agricultural economy comprising well developed commercial farming with an established supply chain and small (subsistence) based production The General Household Survey of 2009 (Statistics South Africa) and the Census for commercial farms 2007 (Statistics South Africa) provide an insight into the size of the subsistence and commercial sectors Precise details in relation to non‐commercial and semi‐commercial farming are not available In 2009 207 of South African households were engaged in some form of agricultural production Table 1 reflects household agricultural production patterns in the provinces and shows that the largest proportions of households engaged in agriculture are in Limpopo Eastern Cape Free State and KwaZulu Natal
Table 5 South African households involved in agricultural activities by province (1000s)
Activity Province
Total WC EC NC FS KZN NW GP MP LP
Involved in agricultural production
39 643 35 274 697 108 248 205 580 2 832
27 373 114 319 268 114 71 211 434 207
Livestock production
312 22 26 230 34 27 21 99 778
175 485 621 96 330 310 107 104 171 275
Poultry production
349 11 35 256 23 22 11 146 853
18 543 310 129 367 211 90 51 251 301
Grains and food crops
389 21 316 34 31 128 465 1 390
27 605 122 78 454 315 125 625 801 491
Industrial crops 0 0 0 0
00 02 00 01 06 00 05 00 01 03
Fruit amp vegetable crops
30 220 232 330 40 175 141 173 1 350
759 342 252 847 473 368 705 688 298 477
10 North West Growth and Development Strategy
AgriSETA June 2010
Agriculture Sector Analysis 7
Activity Province
Total WC EC NC FS KZN NW GP MP LP
Fodder grazing pasture grass ndash animals
14 11 53
112 05 38 35 20 20 43 20 07 19
Forestry 0 10
12 01 05 21 01 00 04 04 02 04
Fish farming Aquaculture
0 0 0 0 0 0 0
15 01 00 00 00 00 00 00 00 00
Game farming 0 0 0 0
22 02 13 00 01 00 00 00 02 01
Other 0 0 0 0
00 02 00 03 04 03 03 00 00 02
Numbers smaller than 10 000 are too small for reliable estimates A particular household can be involved in more than one activity and percentages therefore do not add up to 100
Source Statistics South Africa ‐ General Household Survey 2009 (p318)
In 2007 there were 39 982 commercial farms11 in South Africa as opposed to the 45 818 registered in 2002 There has been a clear downward trend in the number of commercial farming enterprises which underscores the needs to grow the commercial agriculture sector to maintain South Africarsquos food sustainability potential and support interventions to develop skills across the agricultural sector especially for transformation and development of the small and emerging agricultural sector
Table 6 Commercial farming enterprises by province ‐ 2002 and 2007
Province 2002 2007 Growth Decline
Eastern Cape 4 376 3 896 ‐ 1097
Free State 8 531 7 515 ‐ 1191
Gauteng 2 206 2 378 780
KwaZulu‐Natal 4 038 3 560 ‐ 1184
Limpopo 2 915 2 657 ‐ 885
Mpumalanga 5 104 3 376 ‐ 3386
North West 5 349 4 692 ‐ 1228
Northern Cape 6 114 5 226 ‐ 1452
Western Cape 7 187 6 682 ‐ 703
Total 45 818 39 982 ‐ 1274
Source Statistics South Africa 2008
Whilst the largest proportions of households involved in agriculture are in Limpopo Free State Eastern Cape and KZN (Table 1) it is in the Free State Western Cape Northern Cape and North‐West provinces where the largest number of commercial farms are located (Table 2) No direct
11 Commercial farms are farming enterprises that are registered with SARS for Value Added Tax (VAT) and income tax
AgriSETA June 2010
relationship can thus be drawn between the numbers of households engaged in agriculture in a province and the numbers of commercial agricultural enterprises AgriSETA WSP data analysis reveals no direct relationship between the number of employers in a province and the number of formally employed persons
Categories of farming enterprises
ldquoDualismrdquo (Mhone 2000) is a useful way of describing the agricultural sector both in terms of understanding the economics of the sector and planning skills development interventions This term describes a formal sector that is well established and an informal or emergent sector with the two sectors reliant on each other and on interventions by the state for integration However these two broad categories have their limitations Within the commercial sector there are large established farming businesses and smaller ones that struggle to survive and within the less formal sector there are emergent farmers striving to achieve commercial success It is necessary therefore to understand the agricultural sector as comprising a number of different economic entities all operating within the same dualistic economic framework The following typology for the agricultural sector reflects the complexity of the agricultural sector
Table 7 Typology of the agricultural sector
Production Unit Turnover Ownership amp Management Number Binding constraint
Support required
Large commercial on private property
gtR2 million
Family owned but incorporated multiple farms Rent in land ndash professional management
plusmn5 400 Market size Equity capital
Export market access Financial market innovation
Medium commercial on private property
R300 000 to R2 million
Family owned could be incorporated Some renting in of land ndash family management
17000 Land capital management
Mortgage capital for land access Management training
Small commercial on private property
ltR300 000 Family owned generally part time Some lifestyle farming (game ranches weekend farms)
24 000 Management time
Commercial in communal areas
gtR300 000 Communal ownership Development projects Private ownership
‐ Capital management infrastructure
Grants for land access Property rights Comprehensive farmer support Credit Physical infrastructure
ldquoEmergingrdquo commercial in communal areas
ltR300 000
gt20 hectares Communal ownership Small farmers in development projects Private ownership
35 000
Land (property rights) Capital labour management Employment opportunities
Grants for land access Property rights Comprehensive farmer support Physical infrastructure Institutional infrastructure
Subsistence farmer in communal areas Allotments Market gardens
lt20 hectares Communal ownership Private ownership Little formal market participation
1256m Employment opportunities
Social welfare transfers
Source Vink and van Rooyen 2009
This confirms the dualism evident from Stats SA data It includes an estimate for emergent farms and provides insight into the different types of farming enterprises Being small and part time can mean subsistence farming but it can also mean running a game farm on a part‐time basis There is considerable scope for farming enterprise to move from being commercial to subsistence and vice versa There is some evidence that there is currently an increase in volatility with quite
Agriculture Sector Analysis 8
AgriSETA June 2010
significant changes occurring mainly due to the global economic down turn and the small margins that many agricultural enterprises operate within It is particularly important to have an understanding of the category of ldquoemergingrdquo farmers those who may be striving to move from subsistence farming to a more commercial model those who have benefited from land reform processes and want to establish an agricultural enterprise on the land that has been allocated to them those who have made use of BEE funding to acquire a stake in a farm and are trying to achieve profitability The emerging farmer sector is neither established commercial farming nor subsistence in nature and is the focus of many of the governmentrsquos efforts to achieve transformation within the sector as a whole
Employment trends
Employee numbers is a more important measure of ldquosizerdquo for the purpose of the SETA and skills planning even though turnover may be more important in terms of economic impact or contribution to GDP The cause of this discrepancy between turnover or GDP contribution on the one hand and formal employment numbers on the other is discussed extensively by Mhone (2000) and others such as Webster (2004) Labour absorption levels in an enclave (second) economy are not optimal One conclusion that can be drawn from this is that skills development will need to be linked to other changes within the sector if it is to contribute meaningfully to job creation Mechanisms need to be found that link growth to jobs and this is not strictly something that the SETA can address However it is important to link skills planning to other processes and opportunities for these will be examined as part of the environmental scan later in this section The past few years have seen huge depreciation in employment levels and a very high unemployment rate ndash currently estimated at 311 The agricultural sector has also witnessed a decline in sector employment largely linked to contraction of the sector The sector is characterised by the need for highly skilled and qualified farm managers and technical staff on the one hand and large numbers of unskilled and semi‐skilled workers on the other Many managers of emerging farms are mainly untrained and unqualified Agriculture relies more on semi skilled labour than other services as reflected in the table below The sector also relies on migrant casual and seasonal labour Table 8 Percentage unskilled to semi‐skilled labour by DTI industry (economic sector) classification
Sector 1995 2008 Growth decline in
skilled labour
Agriculture 990 941 49
Mining 920 879 45
Manufacturing 870 821 56
Utilities 800 688 140
Construction 900 883 19
Trade 840 842 ‐ 02
Transport and Communication 730 768 ‐ 52
Finance 620 595 40
Community and personal services 540 498 78
Total 782 738 56 Source National Treasury 2010
Agriculture Sector Analysis 9
AgriSETA June 2010
Agriculture Sector Analysis 10
Employment in the sector is based on those who work in administration in DAFF and those who work in production and processing at farms and in factories In March 2009 DAFF had 3 285 posts with 2 735 of these filled The table below shows the employment profile at DAFF by occupation race gender and disability as at 31 March 2009 The department employed 57 male employees and 43 female employees There were more African employees constituting 69 of the entire department workforce Very little progress has been made regarding the employment of people with disabilities who constitute only 04 of the workforce This is in line with other department across government where similarly little progress has been made
Table 9 Employee profile ‐ Department of Agriculture Forestry and Fisheries Occupational Category (SASCO)
African Coloured Indian White Totals
M F M F M F M F M F Total
Legislators senior officials managers
15 14 2 2 8 3 25 19 44 16
Professionals 239 241 11 12 4 14 70 64 324 331 655 240
Technicians associate prof
190 153 38 19 9 4 86 57 323 233 556 204
Clerks 93 204 22 42 0 7 13 171 128 424 552 30
Service and sales workers
38 19 4 2 1 17 1 60 22 82 30
Craft and related trades workers
42 3 13 58 0 58 21
Plant machine operators and assemblers
53 1 8 1 62 1 63 23
Elementary occupations
484 96 94 28 1 6 5 585 129 714 262
Totals 1 154 728 182 105 15 25 214 301 1 565 1 159 2 724
Percentage 424 267 67 39 06 09 79 110 575 425 100
People with disabilities
1 1 1 2 6 4 7 11 04
Race 1 882 287 40 515 Percentage 691 105 15 189 Source Dept of Agriculture Forestry and Fisheries (2010)
In respect of occupations and skills profiles the majority of the Departmentrsquos employees are Professionals and Technicians Associate Professionals (444) followed by people employed in elementary occupations (262) Employment across the agricultural sector is subject to growth and decline variations related to a wide range of conditions and circumstances ndash produce prices climate and environmental changes mechanisation technology and the like Since 2002 the trend has been downwards There are a number of reasons for this including mechanisation and casualisation of labour on larger farms the economic downturn impacting on some sub‐sectors and the global trade situation including changes in the foreign exchange rates and the failure of successive DOHA development talks to address inequalities in access to global agricultural markets12 12 The Doha Development Round is the trade‐negotiation of the World Trade Organization (WTO) Its objective is to lower trade barriers globally Talks have stalled over a divide on major issues such as agriculture industrial tariffs and non‐tariff barriers services and trade remedies The most significant differences are between developed nations led
AgriSETA June 2010
Agriculture Sector Analysis 11
It is anticipated that growth of the agricultural sector to meet local consumer demand government initiatives to expand agricultural niche export markets and the development of an aquaculture sub‐sector to counter depletion of natural resources is likely to lead to creation of employment in the sector
Table 10 Workforce changes in the Agricultural sector ‐ 2001 to 2010
Year Workers Year on year difference Variation 2001 969 0002002 1 153 000 + 184 000 1602003 808 000 ‐ 345 000 ‐ 4272004 828 000 + 20 000 242005 778 000 ‐ 50 000 ‐ 642006 886 000 + 108 000 1222007 703 000 ‐ 183 000 ‐ 2602008 764 000 + 61 000 802009 615 000 ‐ 149 000 ‐ 2422010 650 000 + 35 000 54
Quarter 1
Source Statistics South Africa Survey (pp 210‐211)
Employment categories and remuneration
It is difficult to get detailed and accurate yearly statistics on employment by type (full‐time casual and seasonal employees) or on remuneration in the agricultural sector The latest available statistics on commercial agriculture are found in the 2007 Stats SA Census of Commercial Agriculture The following tables reflect survey data on the number of permanent casual and seasonal agricultural sector employees by province as well as total remuneration per province
Table 11 Number of paid full‐time agricultural workers and total remuneration by province
Province 2002 2007 Growth Decline
Number Remuneration
R000s Number
Remuneration R000s
Number Remuneration
Eastern Cape 33 718 329 351 34 253 510 404 16 550Free State 57 607 580 888 53 944 737 796 ‐64 270Gauteng 20 815 344 629 22 979 534 083 104 550KwaZulu‐Natal 75 799 763 439 66 685 968 455 ‐120 269Limpopo 62 635 525 390 35 728 625 436 ‐430 190Mpumalanga 61 603 599 617 46 520 853 396 ‐245 423North West 39 914 409 526 53 741 574 596 346 403Northern Cape 31 077 320 598 26 871 339 948 ‐135 60Western Cape 98 207 1 378 816 90 943 2 029 275 ‐74 472Totals 481 375 5252251 431 664 7 173 389 ‐103 366
Source Statistics South Africa Report 120201 (p1101)
by EU USA and Japan and the major developing countries led and represented by India Brazil China and South Africa Considerable contestation exists over the maintenance of agricultural subsidies operating as trade barriers
AgriSETA June 2010
Agriculture Sector Analysis 12
Table 12 Number of paid casual amp seasonal agricultural workers amp total remuneration by province
Province 2002 2007 Variance
Number Remuneration
R000s Number
Remuneration R000s
Number Remuneration
Eastern Cape 30 936 59 680 30 565 106 497 ‐12 784Free State 57 871 69 595 45 150 98 996 ‐220 422Gauteng 8 722 20 975 11 957 93 461 371 3456KwaZulu‐Natal 37 602 103 946 34 383 154 286 ‐86 484Limpopo 38 614 107 223 31 833 124 159 ‐176 158Mpumalanga 46 480 86 242 32 826 176 363 ‐294 1045North West 46 078 62 653 32 008 75 250 ‐305 201Northern Cape 68 174 121 613 47 874 123 723 ‐298 17Western Cape 124 968 331 406 98 546 485 108 ‐211 464Totals 459 445 963 331 365 142 1 437 843 ‐205 493
Source Statistics South Africa Report 120201 (p1101)
The tables above reflect that the Western Cape was the biggest employer of labour on commercial farms in 2007 with a majority of the employees being casual and seasonal The Eastern Cape employed the least number of commercial farm employees The comparator figures for 2002 and 2007 would appear to show a continuous country wide reduction in employment both in permanent employees and casual and seasonal workers The exception is the North West that has experienced an increase in full time employees The current minimum wage for farm workers (February 2010) is R1 31669 per month13 Monthly salaries differ across sub‐sectors with highest paid workers in primary production in the fisheries and dairy sub‐sectors
Table 13 Approximate monthly wage rates in Agriculture for selected sub‐sectors
Subsector Primary Production ProcessingPack house
Meat R 2000
Dairy ‐ R 2650
Wines R 1100 R 1400
Flowers R 800 R 1200
Fisheries R 5000
(crewman)R 1892
Source DTI 201014
Vink amp van Rooyen (2009) indicate that before the introduction of minimum wage in 2003 the real cash remuneration for employees had been increasing However over time the unit cost of labour (the ratio of the total cost of labour to the total value of output) has been in decline including a steep drop during and after the introduction of minimum wages
13 Department of Labour 2010 14 Source DTI (Data sourced from SAMIC Dairy Industry JAG WOSA SAFEC SA Pelagic Fish Industry Association)
AgriSETA June 2010
Agriculture Sector Analysis 13
In 1970 for every R1 of output 16 cents was spent on labour By 1980 this has dropped to 13 cents for R1 of output By 1994 the figure had increased to 19 cents declining to 17 cents in 1998 and to 117 cents in 2001 By 2007 it had reduced to 108 cents Further research will be needed to establish the current situation but there is reason to believe that the decline has continued with wages being very low both in terms of unit costs and in relation to other groups of workers in the economy
Strictly speaking it is not the role of the SETA to engage in the complex regulatory framework for the agricultural labour market It is for the Department of Labour and NEDLAC with their employer and organised labour stakeholders to find ways of balancing the need for protection of vulnerable workers with the need to create a framework that encourages the creation of jobs and improved job security The reason that more research is needed in this area and in particular detailed discussions with industry and labour representatives is to establish
The extent to which skills development interventions can improve the prospects for job creation and improved job security and
The mechanisms that can be established to enable uninterrupted skills training in the context of casualisation and use of contract and seasonal labour
Stakeholders in the Agricultural sector
National government departments
There are a number of national government Departments and spheres involved in the challenges of the agricultural sector The following table sets out the broad contribution that each department is intended to make
Table 14 Government department roles in relation to Agriculture Department Role
Department of Agriculture Forestry and Fisheries Agricultural policy and support Department of Rural Development and Land Reform Land Reform and land claims settlements Department of Economic Development Economic planning National Treasury Macro economic policy Department of Trade and Industry Industrial strategy (IPAP 2) Department of Water Affairs The management of water supply Department of Labour Labour market policy Department of Higher Education and Training HRD and skills planning and SETAs In relation to public spending on agriculture the agricultural national budget constitutes about 05 of the national budget The figure below reflects trends in national budgeting for the agricultural sector between 19967 and 201112 Some analysts15 have argued that state expenditure on agriculture shows lack of prioritisation of the sector especially considering that the budget remains lower than it was in the late 1980s when it now caters for a greater number of farmers than it did during apartheid segregation
15 Greenberg 2010 p 2
AgriSETA June 2010
Figure 2 National budgets for Agriculture 1996‐2011 (adjusted for inflation)
Source Greenberg 2010
The Department of Agriculture Forestry and Fisheries (DAFF) is responsible for the agricultural sector The department works with various organisations to promote the interests of the sector
bull It registers all South African Pest Control Association (SAPCA) qualified inspectors bull It works with the Agricultural Research Council for research to optimise the control of
migratory pests bull The Directorate on Marketing works with the National Agricultural Marketing Council
(NAMC) on issues related to equitable access to markets including policy formulation issuing of permits and coordinating inter‐departmental relations to enhance marketing
bull Historically the Department has employed a large number of extension officers located in farming communities who have supported and advised farmers This service has been in decline in recent years but remains an important aspect of state support to the sector
The above roles will be subject to some review in the context of IPAP 2 and also the debates around the role of the state in the economy The issue is not only levels of spending but also clarifying the role of government in relation to the business of the sector
Sector representatives
There are three major umbrella organisations representing the interests of farmers AgriSA TLUSA and the National African Farmers Union of South Africa (NAFU) AgriSA and TLUSA represents both commercial farmers and cooperativesrsquo interests through its engagement at national and international level AgriSA is a member of the Southern African Confederation of Agricultural Unions (SACAU) a regional farmersrsquo union for farmers in Southern Africa AgriSA has structures in all the provinces except Limpopo
Agriculture Sector Analysis 14
AgriSETA June 2010
Agriculture Sector Analysis 15
NAFU is a union for predominantly previously historically disadvantaged smallholder farmers with a membership base including farmers agribusinesses farmersrsquo organisations corporations and individuals who support their goals NAFU is represented by different unions in all the provinces There are other employer organisations who are not affiliated to AgriSA and NAFU including
bull Agricultural Industrial and Medium Employers Organisation bull Agricultural Mining and Industrial Chemical Manufacturersrsquo Association bull Agrilabor Employersrsquo Organisation bull Algoa Meat Traders Association bull East Coast Poultry Producers Employersrsquo Association bull East London and District Meat Traders Association bull Fertiliser Industry Employersrsquo Organisation bull Landbou Werkgewersorganisasie (Workinfocom) bull Red Meat Producersrsquo Association
The Agricultural Research Council is an autonomous statutory body that provides research to DAFF and the provincial departments of agriculture Figures available for South Africarsquos investment in agriculture research and development show that South Africa was above international norms of investment in RampD which are 053 of agricultural GDP for developing countries and 236 for developed countries In South Africa in 2000 agricultural RampD investment in relation to agricultural GDP was 30416 There are six major sources of credit for farmers banks (50) agricultural cooperatives and agribusiness (12) the Land Bank (21) private creditors (8) other creditors and financial institutions (9) and government (1) (GCIS 2010)
12 Factors impacting development in the Agriculture sector Several international and local factors impact on the productivity of the agricultural sector and its growth Key amongst these are
Growth of the South African economy and rising consumer demand International trade and trade agreements The global recession and rise in food prices The land reform programme Reliance on imports Water availability Changing consumer patterns and demands (eg organic food stuffs) Technological changes and mechanisms Quality standards Farm safety and security Broad‐based black economic empowerment Legislation Skills demand and supply HIVAIDS
16 Vink amp van Rooyen 2009
AgriSETA June 2010
These key factors are clustered and discussed below
Future sector economic growth and development
South African sector growth plans (IPAP2)
The 20102011 ndash 20122013 Industrial Policy Action Plan (IPAP) identifies five structural challenges that existed in the South African economy before the global economic downturn and which have been exacerbated by the recent economic crisis These challenges were evident even during the time South Africa was experiencing relatively high growth rates between 2005 and 2007 and have continued during the recession These challenges are
1 Structural imbalances in the growth path including growth that is lagging behind other medium and low income countries
2 Uneven performance of the manufacturing sector with some divisions like the automotive sector experiencing exponential growth while other sectors have stagnated
3 Employment growth being sustained by credit extension and consumption rather than by productive sectors leading to a large current account deficit
4 Low profitability of manufacturing 5 Low savings and investment from financial sector growth Only 52 of private credit was
extended to fixed investment in 2008 Key sectors have been identified for IPAPrsquos focus including agro‐processing which has a diverse group of industries and sub‐sectors including food processing beverages aquaculture horticulture medicinal aromatic and flavourants Key action plans for the agro‐processing sector are identified in IPAP2 as
Development of a National Food Control Agency to consolidate the sector Development of aquaculture to supplement dwindling wild fish stocks Designating specific areas for utilisation of aquaculture Development of the organic food sector Development of the small milling industry Enhancing competitiveness in fruit and vegetable canning Improving beneficiation of Rooibos and Honeybush products (IPAP2 2010)
International Trade
South Africa is a major exporter of Agricultural produce In particular South African fruit and fruit‐derived products such as wine and fruit juice are competitive in the global market However in many sub‐sectors where export potential exists ndash grain and meat ndash serious problems face the industry A key challenge is the uneven playing field experienced by South African exporters Major global competitors include the United States and the countries of the European Union where government subsidies in various forms are in place No such subsidies are in place in South Africa making it difficult if not impossible for South African agricultural produces to enter developed country markets due to the prices that they have to ask for products I In addition the value of the Rand has fluctuated from levels of around R10 to the US dollar to as little as R7 to the dollar When the Rand is strong export becomes difficult because it costs more in the case of the move from R10 to R7 a 30 cost increase for the importer It is impossible to
Agriculture Sector Analysis 16
AgriSETA June 2010
Agriculture Sector Analysis 17
predict whether the World Trade Organisation negotiations known as the DOHA Round will achieve progress in the coming years Historical evidence is that during periods of global recession developed economies become more protective not less and so the current outlook is not good Nor is it possible to predict the value of the Rand though current thinking in government is to move toward a weaker Rand to encourage exports These are two key variables that will need to be factored into the different sector growth scenarios for the future
Global recession and rise in food prices
Economic growth slowed down significantly in sub Saharan Africa and in South Africa in 2009 but there appear to be signs of recovery GDP growth in the region declined from about 6 in 2004 ndash 2008 to about 18 in 200910 GDP growth in South Africa was 16 in 2009 17and rose to 46 in the first quarter of 201018 though much of this is related to the income derived from the 2010 FIFA World Cup and may not be sustained Projections are generally for a slow revival with a set back after the slight rise resulting from the World Cup A return to the 6 levels of the 20078 could take some years The global recession reduced the demand for African exports and reduced capital flows to the region but it is anticipated that the demand for mineral resources by Asian and Western powers will result in both the expansion of exports and expanded foreign direct investment The competition between India and China for African markets is also expected to boost trade to the benefit of African suppliers South Africa is expected to particularly benefit from direct foreign investment from China and India China has already become South Africarsquos largest market for exports and supplier of imports19 Rising food prices have forced governments around the world to control prices of maize bread rice and dairy products In South Africa ldquofood price inflation between December 2005 and December 2006 averaged 788 rdquo20 Although efforts are being made to reduce barriers to poorer families in relation to basic food there has been no move to subsidise food generally This may change though the space for significant levels of support is restricted because of reduced revenue from income taxes resulting from the recession The global credit crunch and recession have meant a reduction in public expenditure and funding which has affected the agricultural sector21
Land reform
In South Africa specifically land reform has a significant bearing on food security and agriculturersquos contribution to GDP The objective of the land reform programme is to transfer 30 of agricultural land to black ownership by 2014 (deferred to 2025) to ensure more equitable access to land by historically disadvantaged people and to increase their participation in agricultural activities22 Land reform has been informed by four processes23
17 Department of Agriculture Forestry and Fisheries 2010 18 Stats SA 2010 19 Department of Agriculture Forestry and Fisheries 2010 20 Department of Agriculture Forestry and Fisheries 2010 ‐2011 Strategic Plan 21 Economic Commission for Africa 2009 22 Xingwana 2008 23 CDE 2008
AgriSETA June 2010
Agriculture Sector Analysis 18
Land restitution involving returning land or providing financial compensation to those whose land was dispossessed during apartheid
Land redistribution transferring more land to the historically disadvantaged Tenure reform modernising land tenure rules and access to land ownership and Providing financial support for the development of emerging farmers
In relation to progress with land reform by September 2009 only 69 of agricultural land (about 567 million hectares) had been transferred and a majority of the beneficiaries have not yet occupied the land due to lack of infrastructure input or technical support The following table gives an indication of the progress of land reform since the inception of the first democratic government
Table 14 Land transfers and beneficiaries ‐ 1994 to 2009
Province Redistribution and tenure Restitution Total Hectares Beneficiaries Claims Hectares Beneficiaries Hectares Beneficiaries
Eastern Cape 675 353 357 25 633 16 201 94 834 215 201 448 191 240 834
Free State 799 350 291 7 721 2 662 47 615 40 893 397 906 48 614
Gauteng 286 34 513 7 328 13 159 9 476 70 179 43 989 77 507
KwaZulu Natal 690 547 414 67 761 14 752 642 447 433 168 1 189 861 500 929
Limpopo 291 91 235 7 403 3 382 513 024 220 227 604 259 227 630
Mpumalanga 444 322 839 13 950 2 694 399 876 225 877 722 715 239 827
Northern Cape 271 952 744 2 773 3 682 539 620 100 554 1 492 364 103 327
North West 300 268 566 40 539 3 709 373 642 172 963 642 208 213 502
Western Cape 223 122 304 12 750 15 546 3 769 118 165 126 073 130 915
Total 3 979 3 043 264 185 858 75 787 2 624 303 1 597 227 5 667 567 1 783 085
Source Greenberg 2010
Achievement of the 30 land reform target is being made difficult by land prices Under the willing buyer willing seller scheme the government will need R74 billion to be able to purchase enough land While resources may be available there are suggestions of lack of capacity The Department of Rural Development and Land Reform (DRDLR) was able to spend only 31 of its land reform 200910 budget in the first six months of the financial year Going forward this Department needs to identify what the real challenges are with the pace of land reform delivery so that they can be mitigated to meet the 2025 target A priority is the retention of skills skills transfer and skills development during the transfer of land as well as retention of national food production to avoid loss of production Support for new beneficiaries of land to ensure sustained productivity is derived from two main sources of funding ndash the Broadening Access to Agriculture Thrust (BADAT) and the Comprehensive Agricultural Support Programme (CASP) CASP is a conditional grant from the Department of Agriculture Forestry and Fisheries to provincial departments to support emerging farmer development Provincial farming budgets dedicated for farmer support in Mpumalanga the Free State Northern Cape and the Western Cape have risen significantly and those in KwaZulu Natal and Gauteng have witnessed a slight increase Eastern Cape and Limpopo agricultural budgets have been steady The North West is the only province where there has been a sharp decline in the share of the budget dedicated to farmer support24
24 Greenberg 2010
AgriSETA June 2010
Agriculture Sector Analysis 19
Reliance on imports
Overall the Agriculture sector contributes positively to the balance of payments ldquoSouth Africa remains food secure The value of our exports increased by 464 from R33 656 million in 200708 to R49 278 million in 200809 During the same period the estimated value of imports rose by 12 from R34 009 million to R38 401 million resulting in a positive trade balancerdquo25
South Africa depends largely on world markets for seed production and agrochemicals Regarding seed production there are only three community seed production schemes in Limpopo and Mpumalanga being piloted with state funding Ten top large companies including two South African companies and multinationals have rights to over two thirds of registered seed varieties in South Africa Despite the dominance of genetically modified and hybrid seed in some sub‐sectors like maize sunflower and sorghum open‐pollinated varieties have been resilient in South Africa enabling the possibility of alternative seed sources not dependent on technological processes26 In relation to agrochemicals deregulation and liberalisation in the fertiliser sector led to the shutdown of local production capacity and South Africa became an importer of fertiliser for the first time in 2000 There are three large players in the fertiliser sector Sasol Nitro Yara and Omnia South Africa imports an estimated 70 of fertilisers and pesticides Fertiliser prices rose by over 200 between 2006 and 2008 but dropped somewhat after that However this hike signified the volatility of the agrochemicals industry and South Africarsquos dependency on imports and the potential risk for emerging farmers and food production of this dependence on imports as the country cannot control the prices making inputs both difficult to budget for and in many cases unaffordable The price of agrochemicals is also particularly influenced by the prices of oil and the exchange rate The general understanding in relation to job creation is that a weaker Rand will improve exports and therefore enable job creation Of course the down side of this strategy is that imports become more expensive So what may be an advantage for those sub‐sectors who are expanding their export volumes those relying on imported agro chemicals will be under increased pressure
Water
Water is both an essential and scarce resource for the agriculture sector and is being threatened by climate changes Crop production relies heavily on water and yet access to water is not being addressed in a systematic way in the land reform processes Greenberg suggests that the relationship between land reform agricultural support and water resource provision is inadequate and a way to address this could be established by linking water provision to land transfer or investing in irrigation for both commercial and resource‐poor farmers However investing in irrigation in the context of water scarcity and climate change may not be the best option What could be needed is finding ways to maximise efficiency of the 60 of South African
25 Department of Agriculture Forestry and Fisheries Strategic Plan 201011 26 Greenberg 2010
AgriSETA June 2010
Agriculture Sector Analysis 20
water used for irrigation by for example using methods such as drip or micro‐irrigation which are expensive to set up but which reduce water wastage by 5‐1027 The Department of Water Affairs is responsible for managing water supply and has to give authorisation for agricultural projects and other developments The department needs to be seen as an important stakeholder in the agricultural sector
The labour market
South Africa recorded an unemployment rate of 243 in 2009 (narrow definition) If people who are no longer actively seeking work are considered the broad unemployment rate rose from 267 to 313 illustrated in the figure below As a direct consequence of the global economic downturn in 2008 870 000 formal jobs were lost in 200928 Others have quoted a figure of over 1 million
Figure 3 Official unemployment in South Africa 2003 ‐2009
Source National Treasury 2010
Annual employment loss followed sector growth patterns with agriculture mining manufacturing and trade facing the highest job losses as their sector growth contracted Unemployment is especially a major problem among lower skilled workers and younger people Youth employment in the 15 ‐24 year age group has fallen by 219 000 (136) and 483 of people in this age group are unemployed Employment of semi‐skilled and unskilled workers has contracted by 527 000 and male employment has gone down by 550 000 (71) while that of women has decreased by 320 000 (52) The number of discouraged workers ie those no longer actively seeking work has increased from 518 000 to 17 million29 Clearly the existence of a very large pool of largely unskilled unemployed workers has an impact on the farming sector It drives wages down and creates opportunities for casualisation and the expansion of labour contract agencies and brokers In addition there are significant numbers of foreign nationals mainly from Zimbabwe and Mozambique who are seeking work and often finding it on farms and in primary processing and packaging plants There are benefits to the
27 Greenberg 2010 28 National Treasury 2010 29 National Treasury 2010
AgriSETA June 2010
Agriculture Sector Analysis 21
sector with skilled and semi‐skilled workers coming into the labour market and being absorbed into the workforce and helping raise productivity levels However at the lower skilled end of the market the existence of this pool brings further casualisation and downward pressure on wages Tensions are likely to increase and further protests either in the form of xenophobic outbreaks or actions against farmers may well increase A view often expressed by farm employers is that current labour legislation makes dismissing workers difficult and so the availability of labour without entering into contracts of employment is an attractive way of avoiding the legislation and its obligations Organised Labour is seeking to restrict these opportunities through either regulating or eliminating labour brokers and efforts are being made to regulate the use of foreign labour However for the foreseeable future the trend is for formally employed people to be reduced in number In relation to the emergent sector there will also be a reluctance to enter employment contracts with workers The fact that many households are engaged in some form of largely unpaid agricultural work means that there is significant casual work dating back many years Helping change this situation into one where casual or unpaid jobs are transformed into formal jobs with regular wages will take time It is also likely that as some emergent farms become established they will act similarly to established farms and institute a form of casual labour rather than expanding a workforce for which they would have to take a level of responsibility From an AgriSETA perspective these labour market trends mean that whilst levy income can be directed at a relatively small labour pool one that is manageable in terms of planning and implementation the size of the informal casual and unemployed labour force in the sector ‐ for whom no levy is paid and who have no employer to plan for their skills needs ndash is very large and its needs almost unlimited Clearly the relationship with the National Skills Fund (NSF) becomes critical in respect of the entire non‐levy income sector Again the level of support available from non‐levy income sources will be an important variable in looking at future sector skills development scenarios
Consumer trends
South Africa currently produces enough food to meet the needs of its population However consumption of three main staples maize wheat and vegetables has been volatile since 1985 and remains below 1990 levels Consumption of maize and vegetables by South Africans is 17 and 32 less respectively than in 198530 The main reasons for this lie in the growing levels of poverty and the difficulties that families have in purchasing nutritious food Whilst government has increased the levels of social grants and increased the number of people receiving grants to around 13 million the incomes of poor families have been badly hit by a range of factors including job losses and rises in food prices The approximately 1 million people who lost their jobs in 20089 meant a loss of income for many millions of dependents Rises in food prices have also had a disproportionate impact on the poor Whilst food is available it is often not accessible to families on the income levels that they have to manage within The result is that less and less nutritious food is purchased which in turn impacts on the ability of farmers to sell their products locally 30 Greenberg 2010
AgriSETA June 2010
Agriculture Sector Analysis 22
Whilst there is no evidence that government will reduce its efforts in relation to poverty relief and social benefits including such programmes as school feeding schemes and food parcels during periods of drought the state of public finances may not enable to support the poverty that grips many rural areas If real income levels for the poor were to rise it could have a significant impact on the economy of the agricultural sector Equally an improvement in the rural economy with increased agricultural production and jobs would dramatically impact on the capacity of people to buy nutritious food Achieving a positive growth path in rural areas is a huge challenge for government and one that is key to governmentrsquos Medium Term Strategic Framework and Industrial Policy Action Plans
HIVAIDS
South Africa has a high prevalence of HIV and AIDS The HIV prevalence among people aged two and above was estimated at 109 in 2008
Table 15 Estimated HIV percentage prevalence by age group (2002 ndash 2008)
Age 2002 2005 2008 Change
Children (2‐14 years) 56 33 25 ‐31
Youth (15‐24 years) 93 103 87 ‐06
Adults (25 and older) 155 156 168 13
15‐49 year olds 156 1692 169 13
Total (ages 2 to 49) 114 108 109 ‐05 Source Avert 2009
The table above shows that HIV prevalence is highest amongst those aged 25 years and older Given youth labour market analyses which point to people from previously disadvantaged backgrounds mainly African males accessing formal employment for the first time at age 25 ‐27 this population can be held to represent people in employment Research31 has estimated that by 2020 the pandemic will have claimed at least 20 of employees in the agricultural sector Southern Africa
in
HIV and AIDS have significant ramifications in the agricultural sector for both commercial farming and subsistence farming The implications include
bull Decrease in cultivated land bull Focus on less labour intensive crop and animal production bull Decrease in womenrsquos agricultural productivity as they take on a more care giving role bull Loss of skills bull Increase in absenteeism from work bull Decrease in daily work outputproductivity because workers are weaker from infections
There are suggestions that the impact of the pandemic in South Africa demands sectoral intervention although this may be difficult in the agricultural commercial sector as
bull Seasonal workers who seem to be more vulnerable to infection because of their low socio‐economic status are not in one place long enough for care programs Further
31 Ingelozi Management Solutions 2008
AgriSETA June 2010
Agriculture Sector Analysis 23
farmers and employers may not feel responsible for seasonal workers in the same way they would invest in their permanent employees
bull There may be uncertainty around land reform which may put HIV intervention on farms on the back burner
bull There are no policies that enforce HIV education and care on farms in the same way that legislation like BEE does for ownership As a result HIV intervention may be left to goodwill and employers may feel it is more important to comply with issues that are monitored
Farm safety and security
South Africa has been plagued by unacceptably high levels of violent crime and murder for many years now Farms have experienced this and those living on farms feel and are extremely vulnerable The South African Chamber of Commerce and Industry (SACCI) has argued that
Using the nominal GDP figure for 2009 of R24 trillion a 322 percent contribution of agriculture to GDP and an estimate of 39982 farms (as at 2007) in South Africa the cost of a murderattack on a farm to the economy was R1932869 per annum
SACCI acknowledges that this estimate is flawed as it does not take into consideration the fact that farming units contribute differently to GDP and that not every attack or murder contributes to farm shut down or loss of productivity However if not addressed these attacks could lead to loss of farming sectors as farmers migrate to lsquosaferrsquo regions This will affect employment and GDP contribution of the sector The need for safety and security on farms may also shift farmersrsquo focus in skills development to include personnel who have skills in safety and security
Broad‐based Black Economic Empowerment
The aim of the AgriBEE Charter (gazetted in 2008) is to increase the involvement of black business in agriculture through ownership and control as executives and senior managers of new and existing agricultural businesses The extent to which AgriBEE is transforming the sector is not known as it is too early to tell but a recent survey conducted by ABC and the IDC showed that among the ABC respondents in 2007 46 of enterprises were busy constructing a BEE strategy and 46 claimed to be implementing a BEE strategy A survey of the dairy industry in the Western and Eastern Cape in 2008 showed that only 6 of firms had a BEE strategy in place It also seems from survey data that companies are focusing on the skills development and socio‐economic aspects of BEE rather than on ownership32 It would appear that although there have been some significant BEE purchases of viable farms and some employee empowerment projects including some quite high profile ones in the Cape Winelands the extent of ownership change had been limited One of the factors is the very high level of single person or family ownership in the agricultural sector BEE is more straight forward in the corporate world where shares can be exchanged For a family business it is a matter of selling off part or all of the land and the tendency is to sell off those areas of the farm that are expendable from a business sustainability perspective
32 Greenberg 2010
AgriSETA June 2010
Whilst there is discussion in government about the ending of the ldquowilling buyer willing sellerrdquo concept the Constitution itself provides for property rights and so although some pressure may be exerted through legislation and regulation the extent and speed of change may not be fast The mechanisms for encouraging the transfer of significant levels of ownership have not yet been created The focus of the SETA is therefore likely to be more the beneficiaries of land reform and emergent farmers though projects of a BEE nature can be targeted as they arise
Conclusions and scenarios It is useful when looking at possible scenarios to examine the key variables or uncertainties and to project how variations one way or the other will have an impact on the development and growth of the sector From the sector analysis and factors that are contributing to change in the sector there are some key factors that seem to emerge First appears to be the economy and related issues of the labour market and the challenges of labour absorption in an enclave economy These factors determine on the one hand whether there will be growth and development and on the other whether such improvements will result in improved employment opportunities and the creation of a virtuous cycle of development Second is the role of the state and the various government departments whose plans and work impact on the agricultural sector Related to this is land reform that is inevitably driven by the state and not the owners of land or the landless The view expressed by many engaged in agrarian reform is that the state must play a significant role It becomes clear that a successful agricultural enterprise requires a number of factors to be in place to be successful These include access to land (Department of Rural Development and Land Reform) agricultural support within a supportive agricultural framework (Department of Agriculture Forestry and Fisheries) access to consistent water supply (Department of Water Affairs) access to finance (Department of Trade and Industry various state agencies) conducive labour market regulation (Department of Labour) sound industrial policy (Department of Trade and Industry) economic planning and macro policy (Department of Economic Development National Treasury) and appropriate education training and skills development (Department of Higher Education and Training the Human Resources Development Council NSA and the SETA) There are other government departments as well as provincial and municipal structures that also play a role The following analyses show how the four variables
economic growth and development role of the government labour market changes and land reform)
impact positively or negatively on the growth of the sector and the demand for skills
Agriculture Sector Analysis 24
AgriSETA June 2010
Agriculture Sector Analysis 25
HHIIGGHH GGRROOWWTTHH SSCCEENNAARRIIOO
The economics of the sector Role of government
The economy in SA and globally continues to revive albeit slowly for the next few years
Roles and integration of national government departments are clarified Specific functions are agreed processes put in place and personnel appointed with the required skills
International trade agreements are still weighted infavour of US and EU but progress is being made and specific blockages are addressed in bilateral talks
The roles of Departments (DWA DAFF DRDLR DoL DTI DED DHET) are clarified with appropriate joint plans and coordinating structures
The rural economy gradually improves with the buying power of the poor increasing and more stable markets created for local produce
For each of the functions agreed in each of the related departments appropriate structures and systems are put in place and staff trained
Exports increase in key areas identified in IPAP 2 and the Rand exchange rate stabilises at a level not too much different than it is today
Specific capacity is put in place at local level to support implementation of land reform and rural development
There is a growing understanding of the concept of dualism and the need to intervene with labour absorption and development mechanisms
Land claims are all finally settled and ownership and tenure is resolved There is a serious drive to establish effective agricultural enterprises
An understanding is reached on the role of agencies and labour brokers and abuse is curbed
The willing buyer willing seller approach is resolved and enables viable land to become black owned
Some relaxation of labour market regulations are agreed that maintain some minimum standard of employment but assist absorption
Land transfer to black and emergent farmers is done in a manner that integrates then into the supply chains of the sector
Mechanisms are found to address skills needs in the context of casual and seasonal work patterns
Financing of land reform and transfer is done on the basis of agreed development plans including skills
Labour market reform Trajectory of land reform LLOOWW GGRROOWWTTHH SSCCEENNAARRIIOO
The economics of the sector Role of government departments The economy in SA and globally stagnates at current levels and the economy struggles to pick up after the temporary 2010 World Cup boost
A lack of purpose at government level means limited progress for another five years Land reform remains a commitment without a plan
International trade agreements are still weighted infavour of US and EU and protectionism increases as a result of the global recession
The roles of Departments (DWA DAFF DRDLR DoL DTI DED DHET) are unclear and there is no proper co‐ordination
SArsquos Gini coefficient continues to worsen with rural poverty increasing and local economies declining
There is a lack of effective structures systems and processes to implement policy across departments
Rand volatility causes problems for importers and exporters Well established markets are maintained but exports decrease
At local level the decline in the agricultural extension officer functions continues and limited practical support is available
Understanding of the rural economy is so diverse that stakeholders cannot agree the problem let alone the solution to low absorption levels
Land claims take too long and land reform processes leave potentially productive land poorly developed and managed
Casual labour and labour brokers remains an issue of dispute Confrontation results in bitterness and resentment
The impasse caused by a rigid interpretations of property clauses in the Constitution continues to stall achievement of the 30 black ownership target
Labour market regulation continues to be a contributing factor to reducing levels of employment
Black owned farms find it difficult to become part of supply chains and are unable to perform adequately
Unstable employment patterns in the sector make skills interventions difficult to manage and largely ineffective
Financing of land reform and land transfer continues to be wasted as it is not tied to the building of appropriate capacity
Labour market reform Trajectory of land reform
AgriSETA June 2010
These analyses can be translated into four potential growth and development scenarios for the agricultural sector which are based on the requirements for a strong development state Scenario 3 Weak government support
and sound economy
Econ
omic fa
ctors glob
ally n
ationa
lly and
locally
Scenario 1 Integrated government support and sound economy
The economic upturn triggered by the World Cup continues and globally things improve enabling an expansion of exports The government because of a lack of integrated policy planning and implementation provides limited support for sector development The gains go to the well established enterprise owners with few gains for emerging farmers and local communities
Government departments coordinate their efforts to achieve maximum impact There are favourable economic conditions that create opportunities for advance Within this positive environment the role of the AgriSETA becomes a central component of a comprehensive strategy for growth and skills interventions are targeted to achieve maximum effect Results in growth in sustainable enterprises and expanded employment opportunities
Government policy and support Government policy and support
Combination of disjointed government policy planning and a weak and increasingly marginalised rural economy Economic conditions result in unsustainable farming conditions and employment declines along with productivity Food shortages and the lack of development in rural areas leading to increasing social tensions A vicious cycle develops with the sector going into long term decline
Government departments coordinate their efforts to achieve maximum impact However economic conditions hamper progress Efforts by the AgriSETA are undermined by poor labour absorption and job insecurity Some significant successes are recorded including some NSF funded projects that result in sustainable enterprises A platform is laid for future improvements when the economic conditions improve
Scenario 4 Weak state and economy Scenario 2 Strong state but weak
economy
Agriculture Sector Analysis 26
AgriSETA June 2010
Agriculture Sector Analysis 27
SECTION 2 DEMAND FOR SKILLS
AgriSETA registered employers and employee coverage
In 2009 17 234 employers were registered with the AgriSETA comprising 15 394 small employers (less than 50 employees) 1 202 medium sized employers (50 ‐ 149 employees) and 638 large employers (more than 150 employees)
Considering that there are around 40000 commercial farms33 the 17 234 employers represent around 43 of commercial farms Notwithstanding changes in the sector as a result of land reform and sector shrinkage this is a sizable proportion and is held to be sufficiently representative for the purpose of skills development planning However this paints an incomplete picture It understates the representative nature of large enterprise registered with the SETA and overstates the representative nature of small registered enterprises 4 175 (242) of the enterprises are levy paying members Further only 1 673 (11) workplace skills plans (WSPs) were submitted
Table 16 Registered employers by size and sub‐sector Sub‐sector Description
Employers Small Medium Large
CoffeeTea Processing and marketing of coffee and tea including coconuts cocoa nuts olives dates etc
33 4 3
Fibre Grading ginning packing of wool and cotton raw material 1 676 16 18
Fruit Fruit packed in cartons fruit juice concentrate drummed and fruit juice in container ready for consumption
271 36 57
Fruit exporters and importers 6 0 1
Grain
Manufacture of grain mill products and starches 119 5 7Handling and storage of grain 67 7 23Wholesale amp retail trade in Agricultural machinery 213 9 4Sale and distribution of Agricultural raw materials and other farming inputs
182 9 3
Milling
Manufacture of flour and grain mill products including rice and vegetable milling grain mill residues
120 15 11
Manufacture of prepared animal feeds 110 19 0Manufacture of pet foods 42 9 0Manufacture of starches and starch products 7 1 1
Pest control
Pest Control 209 4 0
Poultry Poultry and egg production including the slaughtering dressing and packing of poultry
305 49 37
Primary
Growing of Cereals and other crops (not elsewhere classified) 902 160 34Growing of Vegetables Horticultural specialties nursery products
943 120 72
Growing of Vegetables Horticultural specialties (Including Ornamental Horticulture) and nursery products
11 5 0
Sugar plantation including sugar cane and sugar beet etc 9 4 2
33 SARS statistics 2007
AgriSETA June 2010
Agriculture Sector Analysis 28
Sub‐ Description Employers Growing of fruit nuts beverage and spice crops 1795 255 143Farming of cattle sheep goats horses asses mules and hinnies Dairy farming
2 252 59 18
Other animal farming production of animal products (NEC) 433 25 12Ostrich farming 5 0 0Game farming 16 0 0Growing of crops combined with farming of animals (Mixed farming)
2 920 256 109
Growing of coffee and tea including coconuts cocoa nuts olives dates etc
2 0 0
Agricultural and animal husbandry services except veterinary activities
438 22 9
Other animal farming (not elsewhere classified) 11 1 1Growing of trees as second crop by farmers 126 18 4Fishing operation of fish hatcheries and fish farm 913 10 6
Red meat
Production and animal products (not elsewhere classified) 6 0 0Slaughtering dressing and packing of livestock including poultry and small game for meat
317 40 17
Production sale amp marketing of Agricultural by products (eg bones hides)
61 2 0
Slaughtering dressing and packing of livestock including small game for meat and processing of ostrich products
2 1 0
Wholesale trade in Agricultural raw materials and livestock 193 7 10Transport of livestock as supporting activity 224 0 0Agricultural and livestock research 215 9 3
Seed Seed production and marketing 149 12 6
Sugar Manufacture of sugar including golden syrup and castor sugar
45 5 21
Tobacco Processing and dispatching of tobacco 46 8 6 TOTALS 15 394 1 202 638Source AgriSETA WSP data
The largest number of registered small and medium enterprises are found in the mixed farming sub‐sector while most large enterprises are in the growing of fruit nuts beverage and spice crops sub‐sector
Employee coverage in the AgriSETA
Collectively the 17 234 employers registered with AgriSETA employed a total of 239 076 employees This represents 39 of the agricultural labour force in 2009 The 1 673 employers who submitted WSPs in 2009 employed 97 898 employees representing 41 of the total number of people employed by registered employers While the number of registered employers submitting WSPs is small (11) they employ a sizeable number of employees and the percentage of employees provides a statistically significant sample The data for larger enterprises is statistically much more representative than that for small enterprises
AgriSETA June 2010
Table 17 Number of employees of registered employers by sub‐sector
Sub‐sector
Sub‐sector description Employees
CoffeeTea Processing and marketing of coffee and tea including coconuts cocoa nuts olives dates etc
483
Fibre Grading ginning and packing of wool and cotton raw material 6 539
Fruit Fruit packed in cartons fruit juice concentrate drummed and fruit juice in container ready for consumption
27 661
Fruit exporters and importers 212
Grain
Manufacture of grain mill products and starches 133Handling and storage of grain 18 303Wholesale amp retail trade in Agricultural machinery 795Sale and distribution of Agricultural raw materials and other farming inputs 2 898
Milling
Manufacture of flour and grain mill products including rice and vegetable milling grain mill residues
3 634
Manufacture of prepared animal feeds 731Manufacture of pet foods 160Manufacture of starches and starch products 105
Pest control
Pest Control 119
Poultry Poultry and egg production including the slaughtering dressing and packing of poultry
19 187
Primary
Growing of Cereals and other crops (not elsewhere classified) 10 104Growing of Vegetables Horticultural specialties and nursery products 37 799Growing of Vegetables Horticultural specialties (Including Ornamental Horticulture) and nursery products
195
Sugar plantation including sugar cane and sugar beet etc 220Growing of fruit nuts beverage and spice crops 47 043Farming of cattle sheep goats horses asses mules hinnies Dairy farming
3 382
Other animal farming production of animal products (NEC) 4 203Ostrich farming 0Game farming 0Growing of crops combined with farming of animals (Mixed farming) 28 722Growing of coffee amp tea including coconuts cocoa nuts olives dates etc 0Agricultural and animal husbandry services except veterinary activities 970Other animal farming (not elsewhere classified) 513Growing of trees as second crop by farmers 1 294Fishing operation of fish hatcheries and fish farm 1 589
Red meat
Production and animal products (not elsewhere classified) 0Slaughtering dressing and packing of livestock including poultry and small game for meat
5 128
Production sale amp marketing of Agricultural by products (eg bones hides) 116Slaughtering dressing and packing of livestock including small game for meat and processing of ostrich products
0
Wholesale trade in Agricultural raw materials and livestock 1 697Transport of livestock as supporting activity 0Agricultural and livestock research 534
Seed Seed production and marketing 2 127Sugar Manufacture of sugar including golden syrup and castor sugar 10 478Tobacco Processing and dispatching of tobacco 2 002 Total 239 076
Agriculture Sector Analysis 29
AgriSETA June 2010
Agriculture Sector Analysis 30
Source AgriSETA WSP data
According to the WSP analysis the sub‐sector for the growing of fruit nuts beverage and spice crops employed the largest number of people In six sub‐sectors there are employers who do not employ workers These are probably family based organisations where family members help in the business without drawing a salary These are in transport and livestock research slaughtering dressing and packing of livestock including poultry and small game for meat growing of coffee and tea including coconuts cocoa nuts olives dates etc ostrich farming and game farming
Table 18 Employee distribution by province Province Employees Percentage
Eastern Cape 18 844 192 Free State 1 946 20 Gauteng 2 788 28 KwaZulu‐Natal 5 416 55 Mpumalanga 8 062 82 North West 3 290 34 Northern Cape 5 436 56 Limpopo 1 730 18 Western Cape 50 386 515 Grand Total 97 898
Source AgriSETA WSP data
Of those submitting WSPs registered employers in the Western Cape employed the largest number of people while employers in Limpopo employed the least number of employees Free State has a small number of employees covered by WSPs submitted to the SETA whereas Eastern Cape with a relatively small number of registered farms has a very large number of employees on farms submitting WSPs Given this variance between provinces the use of WSP data for extrapolation purposes must be viewed cautiously
2009 WSP equity information was only provided for about a quarter of employees (25 637 or26)34 No information was available from the WSPs on non‐South Africans working on commercial farms
Table 19 Equity profile from 2009 WSP data African Coloured Indian White
Totals M F D M F D M F D M F D
8 040 5 785 38 5 097 5 228 24 22 25 0 811 556 11
580 417 03 493 505 02 468 532 00 589 403 08 13 863 10 349 47 1 378 25 637541 404 02 54 100
Total EquityTotal Male Total Female Total Disability
13 970 11 594 73 545 452 03
Source AgriSETA WSP data
Using currently available data it is not possible to provide disaggregated employment data by sub‐sector This will require a small change in the way that gender race and disability data is
34 Some employers did not complete race and gender information when giving their employment profiles
AgriSETA June 2010
codified during WSP data‐capturing including allocation by sub‐sector What can be stated is that employment of males is more dominant than that of women and more Africans are employed in the sector than other groups Employment of people with disabilities is below 1
21 Skills demand
The National Education and Training Strategy for Agriculture (AET Strategy)
The AET Strategy developed by the Department of Agriculture Fisheries and Forestry (in consultation with various key stakeholders in the agricultural sector) highlights priority skills needs and constraints within the sector and categorises needs within the following 5 broad areas
1 Agricultural production ndash requesting that the past focus on a narrow band of commodities (relevant mainly to the commercial sector) and related research be expanded to address the needs of small‐scale and subsistence farmers (eg more focus on mixed farming and rural livelihood sustainability skills)
2 Agricultural engineering ndash with specific focus to be placed on technologies suitable for small‐scale farmers (eg relevant and post‐harvesting techniques related to processing and storage of produce) ndash to address this need the scarcity of agricultural engineers requires attention
3 Agricultural economics ndash a critical need was identified for general agricultural economic skills (ranging spectrum of farm planning farm management enterprise management marketing finance etc) ndash with the need to training both farmers and extension officers in such fields
4 Agricultural development ndash a specific need was identified to develop agricultural extensionists in supporting especially emerging and small‐scale farmers over the full spectrum (a need exists for both new curriculum in the training of new extensionists and the re‐training and upgrading of existing officers)
5 Veterinarians ndash the need to develop state veterinarians in order for the state to perform its role and function (particularly in its preventative monitoring and regulatory role and function)
AGRISETA sector skills planning demand data (2008‐2009)
The following section reflects initial research on skills demand in the Agricultural sector arising from the sector analysis (section 1) previous AGRISETA skills demand research for Sector Skills Planning during 2005‐2009 and analysis of WSP data from 2009 With the introduction of the Organising Framework of Occupations and agreement on definitions for scarce and critical skills in 200506 the AGRISETA undertook an extensive research and consultation processes to determine skills development priorities for the sector The research methodology employed was based on the a four dimensional topology for establishing and evaluating skills needs illustrated in the figure below
Agriculture Sector Analysis 31
AgriSETA June 2010
Agriculture Sector Analysis 32
The identification and prioritisation of skills needs was also undertaken from a key stakeholder and beneficiary perspective Consideration was given to needs of the following groups
bull The unemployed ndash helping them gain andor regain entry to the labour market bull The economically inactive ndash helping them to become economically active bull School leavers ndash helping them gain access to further education and training opportunities
and thus facilitating their entry to the job market bull Entrants to the job market ndash facilitating employment and integration into the work culture
and work ethic (improving the employability of an individual) bull Those currently employed in the sector ndash increasing their competency and opportunities
for advancement creating a career path and offering continued job security enhancement of value adding to the sector improving their prospects for better employment opportunities
bull Organisations and enterprises within the sector ndash making sure that skills development and knowledge creation occurs in such a way as to improve the sectorrsquos viability and allowing companiesenterprises to become more sustainable and profitable along the way improving productivity competitiveness and innovation within organisations
In organising and reporting the identified priority skills development needs (200809) the following structuring approach was followed
Tier 1 The four categories of needs as per the Topology presented above were used for the identification evaluation and grouping of needs
Pay conditions
Image
RECRUITMENT DIFFICULTY
SKILLSGAP
SKILLSSHORTAGE
LABOURSHORTAGE
Firms experience difficulty recruiting This does not necessary imply a skills shortage ndash may indicate a poor image remuneration etc
Those currently in work do not have the requisite skills set to carry out their job to an optimum standard
Required skills are in short supply when compared with the demand across the whole labour market
Regardless of skills levels a situation exists where there is simply not enough supply of labour to meet demand
Pay conditions
Image
RECRUITMENT DIFFICULTY
SKILLSGAP
SKILLSSHORTAGE
LABOURSHORTAGE
Firms experience difficulty recruiting This does not necessary imply a skills shortage ndash may indicate a poor image remuneration etc
Those currently in work do not have the requisite skills set to carry out their job to an optimum standard
Required skills are in short supply when compared with the demand across the whole labour market
Regardless of skills levels a situation exists where there is simply not enough supply of labour to meet demand
Figure 4 Topology for identifying skills development priorities
Source AGRISETA SSP Annual Update August 2009
AgriSETA June 2010
Tier 2 Within each of the first tier groupings needs were further broken down and organised per target group At this second level needs were grouped by
o General skills development needs (cross‐cutting over different target groups) o Needs experienced by small scale farmers (this group included subsistence
farmers new emerging land reform beneficiaries and small‐scale AgriBEE farmers) o Needs within the commercial agricultural sector (per sub‐sector groupings where
specific needs for such were identified ndash both on‐farm needs and within the secondary sub‐sector or related agri‐businesses)
o Needs of the Department of Agriculture Fisheries and Forestry (DAFF) To further guide and direct the identification and selection of scarce and critical skills the following factors or criteria that could reflect the importance (impact and effect) of a skills shortages were developed as an identification framework
1 Basic Skills Development Promoting basic literacy and numeracy and raising the base level of education for the sector improving the work and livelihood of existing workers
2 Employability Making the employee more employable by improving the fit between their skills and the sector needs
3 Enterprise Viability Improving the capability and feasibility of the enterprise by increasing its effectiveness of or possibilities for profit generation etc
4 Enterprise Sustainability Allow enterprises to survive and grow over an extended period of time without compromising the value of renewable resources thereby creating long‐term meaningful employment for larger numbers of people
5 Sector Growth Enabling the sector to develop or pursue new opportunities or improve the effectiveness of current operations
6 Sector Competitiveness Enabling the sector to compete more effectively in the international arena improving market intelligence and interpretation productivity cost efficiency etc
7 Human Resource Development Capacity Improving the access to quality provision of training to the agri sector
Based on this research and consultation framework the following skills development needs and priorities were identified
Agriculture Sector Analysis 33
AgriSETA June 2010
GENERAL NEEDS SMALL‐SCALE FARMER
NEEDS COMMERCIAL SECTOR
NEEDS DAFF NEEDS
RECRUITMENT RELATED SKILLS NEEDS Primary agriculture is the entry point into the world of work for large numbers of people in rural areas However the sector has negative connotations amongst sections of the youth and in parts of the country and is viewed as a last resort for some in the search for employment) The effect is that despite an unemployment rate of approximately 26 (now over 30) farmers find it difficult to recruit workers to meet seasonal demands This has resulted in the government approving the contracting of foreign labour to meet such temporary needs (workers are recruited mainly from Zimbabwe and Mozambique)
Labour in this farming sector is provided primarily by family members and no real recruitment constraints can be identified
The agricultural sector still manages to attract technical and management skills as it is perceived to include a better lifestyle and there is a strong tradition of agriculture in SA Increasing crime related security risks associated with farming may have a negative impact
The Department has identified a number of occupations in which they are experiencing long‐term vacancies Some of these result from a general shortage of such skills in SA while others arise from the inability of the public sector to compete with the private sector (less favourable employment image working conditions and equity considerations) Priority vacancies include Veterinarians Agricultural
Engineers Plant Health
Specialists Agricultural
Statisticians Plant Health Pest Risk
Analysts ICT Specialists Agricultural
Economists Agricultural Food and
Quarantine Technicians
Agro‐meteorologists Pasture Scientists Plant Production
Specialists Specialised Food
Analysts SKILLS GAPS RELATED NEEDS
bull Low literacy and numeracy levels ndash both amongst workers within the sector at large and at ownermanager level in many of the small‐scale farming
bull Farm management
Farm Management (Mainly owners managers) bull Farm management amp
entrepreneurship bull Resource
management and record keeping
bull Financial planning
A critical constraint is the poor educational levels of a large proportion of the labour force in the sector demanding a considerable effort and investment in ABET and other life skills
A particularly big need exists for skills upgrading amongst Extension Officers ndash particularly with regard to redress the historical neglect of small‐scale farmers and resource strapped farmers
Agriculture Sector Analysis 34
AgriSETA June 2010
Agriculture Sector Analysis 35
GENERAL NEEDS SMALL‐SCALE FARMER
NEEDS COMMERCIAL SECTOR
NEEDS DAFF NEEDS
skills (and general management skills in other agricultural businesses) coupled with a business orientation and entrepreneurship skills
bull A general need to increase compliance with environmental occupational health and safety animal welfare produce safety and hygiene standards regulations and requirements (local and international standards)
and management bull Project management bull Business plan
development Marketing and processing bull Processing and
packaging bull Transport
management bull Marketing produce
including branding bull Planning for
marketing bull Knowledge of
markets Technical knowledge and skills bull Production
management (related to specific enterprise)
bull Demonstration of production techniques
bull Natural resources management
Mechanical knowledge bull Farm maintenance bull Repairs of machinery
and equipment bull Electrical
maintenance and installation
programmes Need for improved management skills and relevant technological knowledge for increasing productivity levels and improved production methods Rising importance for environmentally responsible production and processing management systems Rising competitive and international markets increases need for business and marketing abilities among owners and managers Increasing requirements for compliance with environmental health and safety and international trade standards Information technology although not a priority is increasing in importance Business management ability is becoming increasingly important as more farmers are making decisions about restructuring their businesses diversification and developing supplementary sources of income
Critically improved farm management and business skills within an agricultural context to support the majority of BEE and emerging farmers Skills upgrading requirements for existing Extension Officers include bull Agricultural
economics bull Agricultural
management bull Business and
financial management
bull Technical and production related skills including o Animal husbandryo Poultry o Crop production o Horticulture
SKILLS SHORTAGES Generally SA has a shortage of entrepreneurs and people who have the business acumen drive motivation and
The profile of these farmers reflects a large contingent of older and less educated people who are generally less flexible tend to stick to
The commercial agri sector will increasingly have to compete in the global market and the ever increasing need to increase productivity to
DAFF us experiencing problems are especially sourcing people in specialised science related fields (learning fields experiencing few
AgriSETA June 2010
Agriculture Sector Analysis 36
GENERAL NEEDS SMALL‐SCALE FARMER
NEEDS COMMERCIAL SECTOR
NEEDS DAFF NEEDS
perseverance to become a successful farmer Given the high risks involved in the agricultural sector (natural elements outside onersquos control) the agri sector does not compete successfully for this ldquoscarce resourcerdquo Moreover as with other professional and skilled occupations there is a tendency for younger qualified people to move to urban areas
known practices and are less likely to experiment with new technology Within this target group candidates with good entrepreneurial ability are scarce There is a perceived shortage of Agricultural Extensionists and advisors to assist this target group However a large pool of young unemployed graduates exists who could assist such emerging farmers if they were mobilised and made accessible to farmers Similarly the potential pool of retired commercial farmers who could serve as mentors to this target group
remain profitable and viable it can be stated that many of the existing farmers and managers owners lack business management and entrepreneurial orientation Equity policy and the need to become BEE compliant requires that commercial enterprises appoint and develop black owners directors managers Changing local and global consumer preferences require farmers to change traditional farming methods and practices Skills and knowledge requirements include bull Global food and
international quality standards
bull Product traceability requirements
bull Organic produce and products
Specific occupations identified as being in short supply are
bull Production Managers (food processing)
bull Product specialisation to international specifications (research skills)
bull Forklift drivers heavy vehicletruck drivers and mobile plant operators
bull Experienced and competent artisans (millwrights electricians fitters
enrolments andor pass rates at HET institutions with the result that too few qualified persons come onto the labour market) Examples of such skills shortages identified by the Department include Agricultural Engineers bull Plant Health
Specialists (Nematology Entomology Plant Pathology)
bull Statisticians (specialised agricultural knowledge)
bull Plant Health Pest Risk Analysts
bull Agricultural Economists (production and resource economists)
bull Agricultural Food and Quarantine Technicians
bull Agro‐meteorologists Early warning Specialists
bull Pasture Scientists bull Plant Production
Specialists (eg ornamental crops hydroponics)
bull Specialised Food Analysts (pesticide residue analysts processed food and dairy analysts wine and spirit analysts)
AgriSETA June 2010
Agriculture Sector Analysis 37
GENERAL NEEDS SMALL‐SCALE FARMER
NEEDS COMMERCIAL SECTOR
NEEDS DAFF NEEDS
and turners bull Agricultural
Equipment Technicians
bull Pest and weed controllers
bull Horticultural specialists
LABOUR SHORTAGES AND RELATED SKILLS NEEDS Given an employment rate of some 26 (2009 currently estimated at over 30expanded definition) per definition there cannot be a labour shortage It is however difficult for people who have never worked before to integrate into the agricultural sector workforce Coupled with an aging workforce (30‐60 being over 40) means that most agri enterprises will within the next 5‐10 years be looking at replacing a large proportion of their workforce There could be an insufficient pool of people willing and able to participate The impact of HIVAIDS is also not always factored in to understanding the diminishing pool of resources available Labour shortages have been reported within selected geographical areas and in particular occupations Examples include cane cutters in the sugar industry chicken catchers in the poultry industry pickers in the fruit industry and animal handlers in feedlots as well as dairy parlour workers It is however believed that these shortages may reflect a recruitment problem as a result of the very harsh working conditions and the relatively poor remuneration (which makes these occupations unpopular) At present such ldquoshortagesrdquo are addressed through contracting labour from neighbouring countries
AgriSETA WSP analyses
Skills demand in the commercial agricultural sector
Information for demand for skills from WSP data is available for 1 673 employers who submitted their WSPs for the 200910 period The table below shows data on sub‐sector WSP submission relative to size of the sub‐sector as well as subsector data from all registered organisations and those who submitted WSPs Data for registered employers shows that there were 239 076 employees employed by the 17 234 registered organisations As previously stated 97 898 employees were employed by the organisations submitting WSPs This constitutes 41 of employees employed by registered organisations
Table 20 Employment and sub‐sector data drawn from WSP analyses
Sub‐sector
All Re
gistered
Employers
Small employers (0‐49)
Med
ium and
large
employers (50+)
Total W
SPs received
Total W
SPs received
as of
all registered em
ployers
WSP
received med
ium and
large orgs
WSPs received
as of
med
ium amp large em
ployers
WSPs received
small
employers
WSPs received
as of small
enterprises
EmployeesPer
Profile
CoffeeTea 40 33 7 9 23 5 71 4 12 483 Fibre 1 710 1 676 34 34 2 22 65 12 07 6 539
AgriSETA June 2010
Agriculture Sector Analysis 38
Sub‐sector
All Re
gistered
Employers
Small employers (0‐49)
Med
ium and
large
employers (50+)
Total W
SPs received
Total W
SPs received
as of
all registered em
ployers
WSP
received med
ium and
large orgs
WSPs received
as of
med
ium amp large em
ployers
WSPs received
small
employers
WSPs received
as of small
enterprises
EmployeesPer
Profile
Fruit 371 277 94 162 44 76 81 86 31 27 873 Grain 648 581 67 77 12 48 72 29 5 22 129 Milling 335 279 56 61 18 35 63 26 9 4 630 Pest Control 213 209 4 8 4 2 50 6 3 119 Poultry 391 305 86 66 17 46 53 20 7 19 187 Primary 12 121 10 776 1 345 1144 9 513 38 631 6 136 034 Red meat 1107 1 018 89 70 6 45 51 25 2 7 475 Seed 167 149 18 24 14 13 72 11 7 2 127 Sugar 71 45 26 13 18 10 38 3 7 10 478 Tobacco 60 46 14 5 8 3 21 2 4 2 002
Totals 17 234 15 394 1 840 1 673 10 818 44 855 16 239 076
Source 1 AgriSETA WSP 2009 data
Only 10 of all registered employers submitted WSPs for the 200910 period Of these 49 were medium and large sized employers and 51 small However only 16 small employers submitted their WSPs relative to the number of registered small employers and 44 medium and large employers submitted WSPs relative to the number of registered medium and large employers As such skills demand statistics provides more representative data on the requirements of medium and large employers Data for skills demand in the commercial agricultural sector is based on data for permanent employees as well as casual and seasonal employees
Skills demand forecasting by AgriSETA
Forecasting for skills demand the AgriSETA has estimated that the demand for skilled employees at different levels in the next few years is 510 686 This is based on WSP data analyses over the last 5 years and projected demand for the formal commercial agricultural sector and factoring in the demand that at maximum would result from completion of the land restitution programme in South Africa The table below reflects the skills that are on demand as well as the estimates for demand over the next five years by major occupational category35
35 AgriSETA 2010
AgriSETA June 2010
Table 21 Demand for skills by occupational category
Major Occupation (OFO)Estimated Demand
Group Title1 Managers (commercial and small emerging farmers) 264 3702 Professionals 4 1413 Technicians and Trade workers 8 9255 Clerical and administrative workers 8006 Sales workers 4007 Machinery operators and drivers 5 8008 Elementary workers 226 250
Total 510 686Source AgriSETA WSP data and SSP demand forecasts
Research needs going forward
As has been set out in the sector analysis and the scenarios derived from that analysis the sector is faced by both significant and profound change and also great uncertainty It therefore follows that the task of focussing limited resources (basically levy income in the formal sector and NSF funds for the emergent farming sector) is difficult Whilst the general thrust of training remains broadly as described in the 2006‐10 SSP Updates some considerable work is required to achieve targeted effective interventions during the 2011‐2016 period The following research questions will need to be addressed in preparing the next SSP
bull In relation to the managers and owner‐managers of commercial farms and enterprises what skills are needed to enable them to help bring about the more optimistic scenario and manage the risks associated with the less optimistic ones
bull In terms of professional and technical competencies do the current education and training institutions coupled with the learning programmes available through the AgriSETA (learnerships skills programmes and the like) meet the needs of the sector
bull In the emerging agricultural sector do the current programmes funded by sources external to the AgriSETA (eg NSF) meet all the identified needs What gaps are there and how should they be addressed
bull In relation to governmentrsquos growth strategy and industrial action plans what skills are required for developing the aquaculture sub‐sector What programmes are available How can the SETA support the skills needs for this sub‐sector
bull Given the increasing levels of casual and contract labour how can skills be developed to meet the needs of the formal commercial sector and the emerging enterprise sector
bull How can the demand in each of the priority areas be quantified and agreement be reached on numbers of people to be trained
Agriculture Sector Analysis 39
AgriSETA June 2010
SECTION 3 Skills Gaps and scarce skills
Scarce skills at the DAFF
The level of scarce skills at DAFF can be determined by the vacancy rate While the average vacancy rate in the department as at 31 March 2009 was 17 there were some posts that had very high vacancy rates as reflected in the table below Indicating the possibility that the Department is experiencing difficulties in finding suitable candidates in the South African labour market to fill these posts
Table 22 Scarce skill occupations and vacancy rates (DAFF March 2009) Critical occupations Number of posts Posts filled Vacancy rate ()
Agricultural animal oceanography forestry and other sciences
167 119 287
Engineering sciences related 2 1 50Engineers and related professions 13 6 538Farming forestry advisors and farm managers 11 4 636Finance and economics related 73 53 274Horticulturists foresters agricultural and forestry technicians
350 221 369
Legal related 6 4 333Mechanical engineering technicians 3 2 333Risk management and security services 6 4 333Social sciences related 1 0 100Veterinarians 34 24 294
Source DAFF Annual Report 20082009
Skills are also scarce at senior management level The department also reports on difficulties it has filling senior management services vacancies with some of them staying vacant for up to twelve months because no suitable candidates can be found The department would then resort to re‐advertisement and head hunting This was the case with 22 of 18 SMS posts in March 2009
Scarce skills in the commercial sector
The following occupations have previously been projected as scarce (extremely hard to fill vacancies) by AgriSETA in the commercial agricultural sector over the next five years
Table 23 Scarce and critical skills in the commercial agricultural sector
Occupation Code
Group Occupation Critical Skills Intervention Comments
139903 Managers Laboratory Manager
Technology AI nutrition
HET
221101 Professionals Accountant (General)
General HET
221102 Professionals Management Accountant
Farm financial management
HET Focus on support advice to farmers new enterprises
222101 Professionals Commodities Trader
Export administration supply chain
FET Learnership Skills
Agriculture Sector Analysis 40
AgriSETA June 2010
Agriculture Sector Analysis 41
Occupation Code
Group Occupation Critical Skills Intervention Comments
management Programme
224301 Professionals Economist Agricultural HET
Mainly for Department of Agriculture and para statals commodity organisations
233101 Professionals Chemical Engineer
Chemical processes in food production
HET Industries such as sugar processing
233301 Professionals Electrical Engineer
Installation and maintenance
HET Processing industry
233401 Professionals Electronics Engineer
Computerised production prosesses
HET Processing industry
233501 Professionals Industrial Engineer
Productivity and efficiency
HET Processing industry
233904 Professionals
Instrument Engineer (Defence Force)
Installation and maintenance
HET
Not for defence ‐ sugar industry
233502 Professionals Mechanical Engineer
FETHET Equity reasons
233902 Professionals Agricultural Engineer
Farm layout and infrastructure
HET Mainly in Government
311101 Technicians and trades workers
Agricultural Technician
Installation and maintenance
FETHET
234102 Professionals Agricultural Scientist
Agri research HETFET Especially in horticulture
234201 Professionals Chemist HET Processing industry
234202 Professionals Food Technologist
Food safety HACCP
FETHET Across sector
234701 Professionals Veterinarian HET Mainly in Government
311101 Technicians and trades workers
Agricultural Technician
Farm infrastructure
FET Mainly needed in government
311401 Technicians and trades workers
Chemistry Technician
FETHET EE reasons
312907 Technicians and trades workers
Chemical Engineering Technician
FET Learnership
Mainly EE reasons
312402 Technicians and trades workers
Electronic Engineering Technician
Weak stream production infra
FETHET Mainly tobacco industry
233904 Professionals
Instrument Engineer (Defence Force)
Instrument technician
FET
Occupation needed Instrument Technician (not defence force) Mainly sugar processing sector
321202 Technicians and trades workers
Diesel Motor Mechanic
FET Learnership
To include tractor mechanic
321204 Technicians and trades workers
Small Engine Mechanic
Agricultural equipment
FET Learnership
Throughout sector
AgriSETA June 2010
Agriculture Sector Analysis 42
Occupation Code
Group Occupation Critical Skills Intervention Comments
322301 Technicians and trades workers
Metal Fabricator
Artisan FET Learnership
322303 Technicians and trades workers
Welder Welder (First Class)
Artisan FET Learnership
323203 Technicians and trades workers
Fitter‐Welder Artisan FET Learnership
Mainly sugar ndash multi‐skilled
323202 Technicians and trades workers
Fitter And Turner
Artisan FET Learnership
Tobacco and sugar
323501 Technicians and trades workers
Millwright Artisan FET Learnership
Wide‐spread need
341101 Technicians and trades workers
Electrician (General)
Artisan FET Learnership
Wide‐spread need
342101 Technicians and trades workers
Air‐Conditioning And Refrigeration Mechanic
Artisan FET Learnership
Sugar pack houses cold chain
Source AgriSETA Sector Skills Plans
Supply of skills
South Africarsquos agriculture skills are produced in high schools agricultural colleges FET colleges and Higher Education institutions In high school a large cohort of learners take Agricultural Science as a subject In 2003 there were 42 Agricultural High Schools offering Agricultural Science as a subject These students and those in high schools taking the subject could progress to taking agriculture as a focus area for further education In 2004 there were 10 FET colleges offering vocationally directed agricultural programmes These FET colleges offered complete qualifications and short courses Eleven Colleges of Agriculture can offer qualifications up to degree level and 19 universities offer qualifications in Agriculture ranging from agricultural economics animal and plant sciences and horticulture among others at under and post graduate levels (Department of Agriculture 2006) While long term planning of skilling of new entrants in the sector can be done through close consultation between the sector agricultural schools and colleges FET colleges and HET institutions so that they teach relevant skills there are other avenues for training for those who are already employed in the sector for example skills programmes and learnerships There are 15 registered qualifications for the primary agriculture sub sectors Currently AgriSETA has 94 registered learnerships that can address the skills needs of the identified scarce skills These are captured in Appendix 2 AgriSETA has approved accredited a number of training providers across the country to deliver the theoretical and practical components of these learnerships These include agricultural colleges FET colleges and private providers Currently the AgriSETA has 246 registered and approved providers distributed nationally as follows
AgriSETA June 2010
Table 29 AgriSETA approved training providers (2010) Province Number of providers
Gauteng 72
(29)
KwaZulu Natal 20
(8)
Limpopo 35
(14)
North West 30
(12)
Northern Cape 3
(1)
Free State 15
(6)
Mpumalanga 14
(6)
Western Cape 26
(11)
Eastern Cape 31
(13) Total 246
The providers are small to large organisations In primary agriculture small providers appear to offer the most training in rural areas and community projects (AgriSETA 2010) Most of the operating providers will be in FET colleges and agricultural colleges The AgriSETA is unable to meet the total demands for skills across the duality of their sector There seems to be fairness in the approval of training for both permanent and casual and seasonal workers In 200809 the AgriSETA approved 559 learnerships as follows
Table 30 AgriSETA learnerships approved for grant purposes (2008‐2009)
Source AgriSETA learnership data analysis
Agriculture Sector Analysis 43
AgriSETA June 2010
Agriculture Sector Analysis 44
Provision of skills programmes in the same year attracted grants for 2 706 employees
Table 31 Participation by learners in skills programmes in the AgriSETA (200809)
Source AgriSETA Skills programmes data analysis
AgriSETA June 2010
APPENDIX 1 Skills demand in the Department of Agriculture Forestry amp Fisheries (200809)
Source DAFF Annual Report 2008‐20009
Agriculture Sector Analysis 45
AgriSETA June 2010
Agriculture Sector Analysis 46
Appendix 2 AgriSETA registered learnerships Registered Learnership NQF Level SAQA Registration NoLearnership in Agri Sales and Service 4 22 Q 220001 20 178 4Learnership Agricultural Machinery Technician 2 22 Q 220007 20 160 2Learnership in Specialist Agricultural Machinery Technician 5 22 Q 220009 21 258 5Agri Trade Processes 2 22 Q 220013 30 125 2FETC Meat Examination Applying Basic Business Principles 4 30 Q 3000 2823 164 4Further Education and Training Certificate Seed Marketing Execute Seed Trials 4 22 Q 220025 21 126 4Further Education and Training Certificate Seed Research and Development Certify as Seed Unit 4 22 Q 220027 21 121 4FETC Seed Research and Development Conduct a Field Inspection of a Seed Unit 4 22 Q 220028 20 120 4Seed Research and Development Operations Operate in a Team 3 22 Q 220020 22 121 3Seed Research and Development Operations Apply Basic Business Principles 3 22 Q 220021 22 121 3National Certificate Seed Processing and Packaging Operate in a Team 3 22 Q 220026 21 123 3Sugar Industry Technical Maintenance worker 2 22 Q 220011 39 128 2National Certificate Sugar Manufacturing and Refining Technical Maintenance 3 30 Q300003 23 146 3Further Education and Training Certificate Manufacturing Technical MaintenanceProduce Components by Performing Engineering Turning Operations
4 30 Q 3000 1321 173 4
FETC Manufacturing Technical Maintenance Produce Components by Performing Milling Operations 4 30 Q 3000 1521 173 4 FETC Manufacturing Technical Maintenance Develop and Fabricate from Complex Drawing 4 30 Q 3000 1420 173 4National Certificate in Sugar Technology 5 22 Q 220036 22 140 5Further Education and Training Certificate Sugar Processing 4 22 Q 220035 31 144 4National Certificate in Sugar Technology Processing Sugar Refining 2 22 Q 220037 28 124 2National Certificate in Sugar Technology Processing Juice Preparation 2 22 Q 220038 28 124 2National Certificate in Sugar Technology Processing Crystallisation 2 22 Q 220039 27 122 2National Certificate in Sugar Technology Processing Laboratory Practice 2 22 Q 220040 25 124 2National Certificate in Sugar Technology Processing Extraction 2 22 Q 220041 28 122 2NC Rooibos Production Applying Basic Business Principles 2 30 Q 3000 2427 130 2 NC Rooibos Processing Applying Basic Business Principles 2 30 Q 3000 2224 123 2 National Certificate Cigarette Production 3 22 Q 220046 23 121 3
AgriSETA June 2010
REFERENCES AgriSETA 2010 AgriSETA 20082009 Annual report Pretoria AgriSETA Agricultural Research Council httpwwwarcagriczahomeasppid=272 Avert South African HIV and AIDS statistics Available on httpwwwavertorgsafricastatshtm Centre for Development Enterprise 2008 Land reform in South Africa Getting back on track CDE Research No 16 DAFF 2010 Quarterly economic review of the agriculture sector Pretoria DAFF DAFF 2009 Annual report 20082009 Pretoria DAFF Department of Agriculture 2008 Strategic plan 2008 Pretoria Department of Agriculture DTI An introduction to the South African economy Available on httpwwwthedtigovzapublicationsagroprocessinghtm Eastern Cape Provincial Government Eastern Cape Provincial Growth and Development Strategy 2004 ndash 2014 Economic Commission for Africa 2009 Developing African agriculture through regional value chains Addis Ababa Economic Commission for Africa Economic Report Free State Province 2005 Provincial Growth and Development Strategy 2005 ndash 2014 GCIS 2010 SA Yearbook 200910rdquo Agriculture forestry and fisheries Pretoria GCIS Greenberg S 2010 Status report on land and agricultural policy in South Africa 2010 Institute for Poverty Land and Agrarian Studies School of Government University of the Western Cape Research report Ingelozi Management Solutions 2008 HIVAIDS in the South African agricultural sector Towards the development of a long term intervention Research report KwaZulu Natal Provincial Government 2006 KwaZulu Natal Provincial Growth and Development Strategy Limpopo Provincial Government Growth and Development Strategy 2004 ndash 2014 Mhone G (2000) Enclavity and Constrained Labour Absorbtive Capacity in Southern African Countries Geneva International Labour Office Moyo S The Agrarian question and the developmental state in South Africa In Edigheji O et al 2010 Constructing a democratic developmental state in South Africa HSRC PRESS
Agriculture Sector Analysis 47
AgriSETA
Agriculture Sector Analysis
National Treasury Republic of South Africa 2010 National Budget 2010 ndash National Budget Review 2010 Pretoria National Treasury Northern Cape Provincial Government Agriculture and agro‐processing sector strategy North West Provincial Government North West Provincial Growth and Development Strategy 2004 ndash 2014 Province of the Western Cape 2008 The Ikapa growth and development strategy White Paper SABCOHA SA Business Coalition on HIV and AIDS wwwsabcohaorg SACAU httpwwwsacauorghostingsacauSacauWebnsfHomehtmOpenForm South African Government 2010 20102011 ndash 20122013 Industrial Policy Action Plan Republic of South Africa Statistics South Africa 2005 Census of commercial agriculture 2002 Report No 110201 Pretoria Statistics South Africa Statistics South Africa 2009 Census of commercial agriculture 2007 Statistical release P1101 Pretoria Statistics South Africa Statistics South Africa 2010 General household survey 2009 Statistical release P0318 Pretoria Statistics South Africa Statistics South Africa 2010 Gross domestic product first quarter 2010 Statistical release P0441 Pretoria Statistics South Africa Statistics South Africa 2010 Quarterly labour force survey Quarter 1 2010 Statistical release P0211 Pretoria Statistics South Africa Vink N amp van Rooyen J 2009 The economic performance of agriculture in South Africa since 1994 The implications for food security Pretoria DBSA development planning division working paper series No 17 Webster E 2004 the Dual Economy from a book by Van Holdt K and Webster E Work restructuring and the Crisis of Social reproduction and 10 years of restructuring post apartheid workplaces University of Natal Press Workinfocom httpwwwworkinfocomfreesub_for_legresdatalraempassoc3htm Xingwana L 2008 Challenges and Opportunities for Land and Agrarian Reform towards 2025 Speech delivered at the Agri‐Consultation Protea Ranch Hotel Polokwane 30 July 2008
- Table of contents
- SECTION 1 THE AGRICULTURAL LANDSCAPE
- 11 Size and shape of the Agricultural sector
-
- Overview
- Distribution of agricultural production
- The structure of the agriculture sector in South Africa
- Categories of farming enterprises
- Employment trends
- Employment categories and remuneration
- Stakeholders in the Agricultural sector
-
- National government departments
- Sector representatives
-
- 12 Factors impacting development in the Agriculture sector
-
- Future sector economic growth and development
-
- South African sector growth plans (IPAP2)
- International Trade
- Global recession and rise in food prices
-
- Land reform
- Reliance on imports
- Water
- The labour market
- Consumer trends
- HIVAIDS
- Farm safety and security
- Broad-based Black Economic Empowerment
-
- Conclusions and scenarios
- SECTION 2 DEMAND FOR SKILLS
-
- AgriSETA registered employers and employee coverage
- Employee coverage in the AgriSETA
-
- 21 Skills demand
-
- The National Education and Training Strategy for Agriculture (AET Strategy)
- AGRISETA sector skills planning demand data (2008-2009)
- AgriSETA WSP analyses
-
- Skills demand in the commercial agricultural sector
-
- Skills demand forecasting by AgriSETA
- Research needs going forward
-
- SECTION 3 Skills Gaps and scarce skills
-
- Scarce skills at the DAFF
- Scarce skills in the commercial sector
- Supply of skills
-
- APPENDIX 1 Skills demand in the Department of Agriculture Forestry amp Fisheries (200809)
- Appendix 2 AgriSETA registered learnerships
-
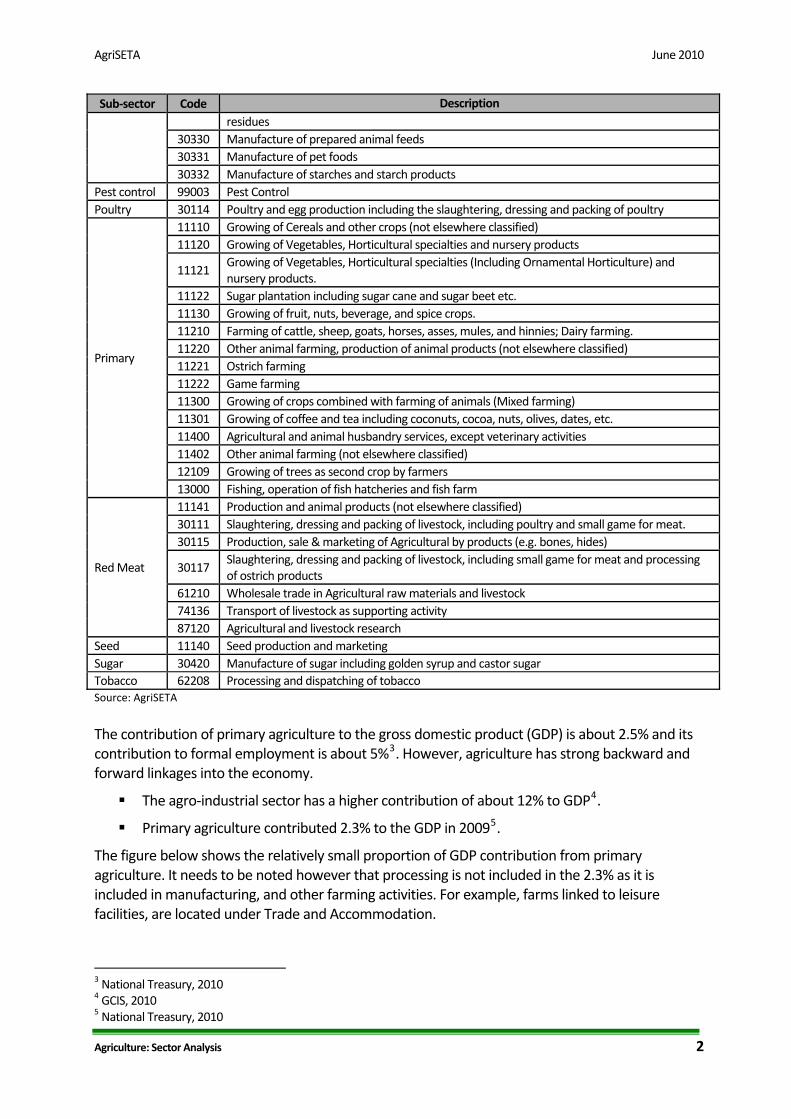
AgriSETA June 2010
Agriculture Sector Analysis 2
Sub‐sector Code Descriptionresidues
30330 Manufacture of prepared animal feeds30331 Manufacture of pet foods30332 Manufacture of starches and starch products
Pest control 99003 Pest Control Poultry 30114 Poultry and egg production including the slaughtering dressing and packing of poultry
Primary
11110 Growing of Cereals and other crops (not elsewhere classified)11120 Growing of Vegetables Horticultural specialties and nursery products
11121 Growing of Vegetables Horticultural specialties (Including Ornamental Horticulture) and nursery products
11122 Sugar plantation including sugar cane and sugar beet etc11130 Growing of fruit nuts beverage and spice crops11210 Farming of cattle sheep goats horses asses mules and hinnies Dairy farming 11220 Other animal farming production of animal products (not elsewhere classified) 11221 Ostrich farming 11222 Game farming 11300 Growing of crops combined with farming of animals (Mixed farming) 11301 Growing of coffee and tea including coconuts cocoa nuts olives dates etc 11400 Agricultural and animal husbandry services except veterinary activities 11402 Other animal farming (not elsewhere classified)12109 Growing of trees as second crop by farmers13000 Fishing operation of fish hatcheries and fish farm
Red Meat
11141 Production and animal products (not elsewhere classified)30111 Slaughtering dressing and packing of livestock including poultry and small game for meat30115 Production sale amp marketing of Agricultural by products (eg bones hides)
30117 Slaughtering dressing and packing of livestock including small game for meat and processing of ostrich products
61210 Wholesale trade in Agricultural raw materials and livestock74136 Transport of livestock as supporting activity87120 Agricultural and livestock research
Seed 11140 Seed production and marketing Sugar 30420 Manufacture of sugar including golden syrup and castor sugar Tobacco 62208 Processing and dispatching of tobacco Source AgriSETA
The contribution of primary agriculture to the gross domestic product (GDP) is about 25 and its contribution to formal employment is about 53 However agriculture has strong backward and forward linkages into the economy
The agro‐industrial sector has a higher contribution of about 12 to GDP4
Primary agriculture contributed 23 to the GDP in 20095
The figure below shows the relatively small proportion of GDP contribution from primary agriculture It needs to be noted however that processing is not included in the 23 as it is included in manufacturing and other farming activities For example farms linked to leisure facilities are located under Trade and Accommodation
3 National Treasury 2010 4 GCIS 2010 5 National Treasury 2010
AgriSETA June 2010
Figure 1 Contribution of agriculture to national GDP
Source National Treasury Budget Review 2010
South Africa is one of the top global exporters of some agricultural produce where it is ranked first in three products
Table 2 South Africas world ranking in selected products
Export Item South Africarsquos world ranking
Avocados 1st
Clementines 1st
Ostrich products 1st
Grapefruit 2nd
Table grapes 3rd
Plums 3rd
Pears 5th Source DTI February 2010
Distribution of agricultural production
South Africa has 276 million hectares of cultivated land of which nearly 1045 million hectares (82) is used for commercial purposes A total of 079 million hectares (only 619) is permanently under cultivation and more than 1083 million hectares (85) is rain‐fed More than 07 million hectares of land are degraded and left bare by sheet and gully erosion About 461 million hectares of natural vegetation are degraded mainly in indigenous forests woodlands and grasslands a further 019 million hectares are degraded by mine tailings waste rock dumps and surface‐based mining Land use in urban areas comprises mainly formal residential suburbs and townships (1 million ha) and informal settlements (023 million ha) Savannas (woodlands and bush lands) and grasslands cover 2570 and 1992 of South Africa respectively (Department of Environmental Affairs)
Although 80 of South African land is used for agriculture and subsistence farming only 12 is arable and the rest is used for grazing The main agricultural activities are crop production mixed farming cattle ranching and sheep farming dairy farming game ranching aquaculture beekeeping and winemaking (GCIS 2010) South Africa is the largest producer of maize the
Agriculture Sector Analysis 3
AgriSETA June 2010
staple food in the Southern African Development Community (SADC) as well as the main ingredient for animal feed The table below gives an indication of the geographic location of production of specific agricultural produce as well as the annual volume produced
Table 3 Volume of agricultural production by product and location Agricultural product Dominant production locations Average annual volume producedMaize North West Free State Mpumalanga 13 2 metric ton Wheat Western Cape Free State 21 metric ton Barley Western Cape 192 000 ton Groundnuts Free State North West Northern Cape 88 800 ton Sunflower seeds Free State North West Mpumalanga Limpopo 872 000 ton Soya beans Free State Mpumalanga KwaZulu Natal ‐ Sorghum Free State Mpumalanga Limpopo North West 255 000 ton Canola Western Cape North West Limpopo 30 800 ton
Dry beans Mpumalanga Free State Gauteng North West KZN Limpopo Western Cape Northern Cape
60 000 ton
Sugar Eastern Cape Mpumalanga KwaZulu Natal 20 metric ton
Deciduous fruit Western Cape Eastern Cape Free State Mpumalanga Gauteng
‐
Wine Western Cape 4033 million litres exported in 2009Citrus and subtropical fruit
Limpopo Mpumalanga Eastern Cape KwaZulu Natal Western Cape Northern Cape
46 896 ton subtropical fruit
Potatoes North West Northern Cape KwaZulu Natal Limpopo Free State Mpumalanga Eastern Cape Western Cape
1 853 000 ton
Tomatoes Limpopo Mpumalanga KwaZulu Natal Eastern Cape Western Cape
459 217 ton
Onions Mpumalanga Western Cape Free State 417 579 ton Cabbages Mpumalanga KwaZulu Natal 138 161 ton
Cotton Mpumalanga Limpopo Northern Cape KwaZulu Natal North West
‐
Tobacco Mpumalanga Limpopo North West 10 200 ton Tea Western Cape Eastern Cape ‐ Flowers Western Cape ‐ Livestock All provinces Largest agricultural sector
Dairy Free State North West KwaZulu Natal Eastern Cape Western Cape Mpumalanga
3 129 metric litres
Beef Cattle Eastern Cape Free State KwaZulu Natal Limpopo North West Mpumalanga Northern Cape
‐
Sheep and goats Eastern Cape Northern Cape Free State Western Cape Mpumalanga
‐
Poultry and pigs All provinces 930 000 ton broilers
26 million pigs slaughtered from August 2007 to August 2008
Fish Western Cape Eastern Cape ‐
Game Limpopo Northern Cape Eastern Cape Western Cape
‐
Beekeeping Western Cape KwaZulu Natal 2 000 ton Source GCIS SA Yearbook 200910
Agriculture plays an important part in provincial development and for most provinces provides a source of employment as well as being a potential focus for increased employment and sustainable livelihoods Agriculture therefore features as a key focus for economic development
Agriculture Sector Analysis 4
AgriSETA June 2010
Agriculture Sector Analysis 5
and growth in the all provinces Agricultural contribution to provincial GDP varies with the Free Statersquos agricultural sector contributing the most as reflected below
Table 4 Agriculture ‐ Contribution to Provincial GDP Province Percentage contribution to GDP
Free State 92 Limpopo 3 KwaZulu Natal 55 (2004) Western Cape 45 (2003) Mpumalanga 61
Source Provincial Growth Development Strategies
The provinces all have different focuses in their development strategies for agriculture although the underlying principle is the improvement of the lives of the people through employment creation in agriculture and provision of food security through investment in agricultural processes and technologies that enhance efficiency Free Statersquos focus on agriculture development is agriculture diversification and agribusiness Diversification involves identifying crops with a defined market in line with new and innovative agricultural practices Agribusiness extracts value from primary agriculture through processing of raw materials and provision of services to add value to produce6 The objectives of the Limpopo province with regards to agricultural development are tripling the size of agriculture by 2015 increasing the value of agriculture through enterprise diversification investing in water saving technologies and adding value within the agro‐value chain7 In the Eastern Cape two thirds of the population live in rural areas and the development of agriculture is a key factor in the development of the peoplersquos socio‐economic livelihood Development of agriculture will provide employment and an income to many families The focus of the growth and development strategy is to promote household food security through expanded smallholder production development of commercial agriculture through optimal use of agricultural land in the homelands focus on land redistribution and tenure and integration of homelands agriculture into mainstream provincial agricultural activity8 KwaZulu Natalrsquos focus on agriculture in the Growth Development Strategy is poverty alleviation as most areas of poverty in the province are rural The plan is to link up rural subsistence agricultural activity with commercial agriculture so as to develop subsistence agricultural projects into commercial ones The other focus is to link land reform projects to key provincial agrarian revolution programmes so as to make land transfer an economic growth opportunity The agrarian revolution strategy involves enabling access to markets farmer development through the set up of agri‐businesses improve road infrastructure to improve access to markets and expediting the land reform process9
6 Free State Growth Development Strategy 2004 ndash 2014 7 Limpopo Growth Development Strategy 2004 ndash 2014 8 Eastern Cape Growth Development Plan 2004 ‐ 2014 9 KZN Growth Development Strategy 2006
AgriSETA June 2010
Agriculture Sector Analysis 6
Northern Capersquos focus is the development of agro‐processing (Northern Cape Growth and Development Strategy) The North West is focusing on enabling access to markets and assisting financially in infrastructure development and machinery acquisition as well as investing in agro‐processing technology and skills as well as promoting efficient land use10 Agriculture holds employment growth potential in Mpumalanga province It accounts for 181 of provincial employment with forestry being the main agricultural activity in the province About 383 of the provincersquos land is used for forestry Agriculture is identified as a key focus area to achieve the strategic growth development strategy of providing a better life for all in the province through economic development Growth potential is through agricultural investment production and beneficiation so as to increase agriculture GDP contribution from 61 to 10 by the end of the 20082009 financial year Other strategic objectives are to increase sustainable employment in the agricultural sector from 18 to 20 by the end of 2015 improve food security by 50 by 2014 improve sustainability in agri‐business enterprises by 20 and increase participation of historically disadvantaged in agriculture to meet national Agri BEE targets (Mpumalanga Growth and Development Strategy 2004 ‐ 2014)
The structure of the agriculture sector in South Africa
The South African Agriculture Sector primarily based in rural and peri‐urban areas is characterised by a dual agricultural economy comprising well developed commercial farming with an established supply chain and small (subsistence) based production The General Household Survey of 2009 (Statistics South Africa) and the Census for commercial farms 2007 (Statistics South Africa) provide an insight into the size of the subsistence and commercial sectors Precise details in relation to non‐commercial and semi‐commercial farming are not available In 2009 207 of South African households were engaged in some form of agricultural production Table 1 reflects household agricultural production patterns in the provinces and shows that the largest proportions of households engaged in agriculture are in Limpopo Eastern Cape Free State and KwaZulu Natal
Table 5 South African households involved in agricultural activities by province (1000s)
Activity Province
Total WC EC NC FS KZN NW GP MP LP
Involved in agricultural production
39 643 35 274 697 108 248 205 580 2 832
27 373 114 319 268 114 71 211 434 207
Livestock production
312 22 26 230 34 27 21 99 778
175 485 621 96 330 310 107 104 171 275
Poultry production
349 11 35 256 23 22 11 146 853
18 543 310 129 367 211 90 51 251 301
Grains and food crops
389 21 316 34 31 128 465 1 390
27 605 122 78 454 315 125 625 801 491
Industrial crops 0 0 0 0
00 02 00 01 06 00 05 00 01 03
Fruit amp vegetable crops
30 220 232 330 40 175 141 173 1 350
759 342 252 847 473 368 705 688 298 477
10 North West Growth and Development Strategy
AgriSETA June 2010
Agriculture Sector Analysis 7
Activity Province
Total WC EC NC FS KZN NW GP MP LP
Fodder grazing pasture grass ndash animals
14 11 53
112 05 38 35 20 20 43 20 07 19
Forestry 0 10
12 01 05 21 01 00 04 04 02 04
Fish farming Aquaculture
0 0 0 0 0 0 0
15 01 00 00 00 00 00 00 00 00
Game farming 0 0 0 0
22 02 13 00 01 00 00 00 02 01
Other 0 0 0 0
00 02 00 03 04 03 03 00 00 02
Numbers smaller than 10 000 are too small for reliable estimates A particular household can be involved in more than one activity and percentages therefore do not add up to 100
Source Statistics South Africa ‐ General Household Survey 2009 (p318)
In 2007 there were 39 982 commercial farms11 in South Africa as opposed to the 45 818 registered in 2002 There has been a clear downward trend in the number of commercial farming enterprises which underscores the needs to grow the commercial agriculture sector to maintain South Africarsquos food sustainability potential and support interventions to develop skills across the agricultural sector especially for transformation and development of the small and emerging agricultural sector
Table 6 Commercial farming enterprises by province ‐ 2002 and 2007
Province 2002 2007 Growth Decline
Eastern Cape 4 376 3 896 ‐ 1097
Free State 8 531 7 515 ‐ 1191
Gauteng 2 206 2 378 780
KwaZulu‐Natal 4 038 3 560 ‐ 1184
Limpopo 2 915 2 657 ‐ 885
Mpumalanga 5 104 3 376 ‐ 3386
North West 5 349 4 692 ‐ 1228
Northern Cape 6 114 5 226 ‐ 1452
Western Cape 7 187 6 682 ‐ 703
Total 45 818 39 982 ‐ 1274
Source Statistics South Africa 2008
Whilst the largest proportions of households involved in agriculture are in Limpopo Free State Eastern Cape and KZN (Table 1) it is in the Free State Western Cape Northern Cape and North‐West provinces where the largest number of commercial farms are located (Table 2) No direct
11 Commercial farms are farming enterprises that are registered with SARS for Value Added Tax (VAT) and income tax
AgriSETA June 2010
relationship can thus be drawn between the numbers of households engaged in agriculture in a province and the numbers of commercial agricultural enterprises AgriSETA WSP data analysis reveals no direct relationship between the number of employers in a province and the number of formally employed persons
Categories of farming enterprises
ldquoDualismrdquo (Mhone 2000) is a useful way of describing the agricultural sector both in terms of understanding the economics of the sector and planning skills development interventions This term describes a formal sector that is well established and an informal or emergent sector with the two sectors reliant on each other and on interventions by the state for integration However these two broad categories have their limitations Within the commercial sector there are large established farming businesses and smaller ones that struggle to survive and within the less formal sector there are emergent farmers striving to achieve commercial success It is necessary therefore to understand the agricultural sector as comprising a number of different economic entities all operating within the same dualistic economic framework The following typology for the agricultural sector reflects the complexity of the agricultural sector
Table 7 Typology of the agricultural sector
Production Unit Turnover Ownership amp Management Number Binding constraint
Support required
Large commercial on private property
gtR2 million
Family owned but incorporated multiple farms Rent in land ndash professional management
plusmn5 400 Market size Equity capital
Export market access Financial market innovation
Medium commercial on private property
R300 000 to R2 million
Family owned could be incorporated Some renting in of land ndash family management
17000 Land capital management
Mortgage capital for land access Management training
Small commercial on private property
ltR300 000 Family owned generally part time Some lifestyle farming (game ranches weekend farms)
24 000 Management time
Commercial in communal areas
gtR300 000 Communal ownership Development projects Private ownership
‐ Capital management infrastructure
Grants for land access Property rights Comprehensive farmer support Credit Physical infrastructure
ldquoEmergingrdquo commercial in communal areas
ltR300 000
gt20 hectares Communal ownership Small farmers in development projects Private ownership
35 000
Land (property rights) Capital labour management Employment opportunities
Grants for land access Property rights Comprehensive farmer support Physical infrastructure Institutional infrastructure
Subsistence farmer in communal areas Allotments Market gardens
lt20 hectares Communal ownership Private ownership Little formal market participation
1256m Employment opportunities
Social welfare transfers
Source Vink and van Rooyen 2009
This confirms the dualism evident from Stats SA data It includes an estimate for emergent farms and provides insight into the different types of farming enterprises Being small and part time can mean subsistence farming but it can also mean running a game farm on a part‐time basis There is considerable scope for farming enterprise to move from being commercial to subsistence and vice versa There is some evidence that there is currently an increase in volatility with quite
Agriculture Sector Analysis 8
AgriSETA June 2010
significant changes occurring mainly due to the global economic down turn and the small margins that many agricultural enterprises operate within It is particularly important to have an understanding of the category of ldquoemergingrdquo farmers those who may be striving to move from subsistence farming to a more commercial model those who have benefited from land reform processes and want to establish an agricultural enterprise on the land that has been allocated to them those who have made use of BEE funding to acquire a stake in a farm and are trying to achieve profitability The emerging farmer sector is neither established commercial farming nor subsistence in nature and is the focus of many of the governmentrsquos efforts to achieve transformation within the sector as a whole
Employment trends
Employee numbers is a more important measure of ldquosizerdquo for the purpose of the SETA and skills planning even though turnover may be more important in terms of economic impact or contribution to GDP The cause of this discrepancy between turnover or GDP contribution on the one hand and formal employment numbers on the other is discussed extensively by Mhone (2000) and others such as Webster (2004) Labour absorption levels in an enclave (second) economy are not optimal One conclusion that can be drawn from this is that skills development will need to be linked to other changes within the sector if it is to contribute meaningfully to job creation Mechanisms need to be found that link growth to jobs and this is not strictly something that the SETA can address However it is important to link skills planning to other processes and opportunities for these will be examined as part of the environmental scan later in this section The past few years have seen huge depreciation in employment levels and a very high unemployment rate ndash currently estimated at 311 The agricultural sector has also witnessed a decline in sector employment largely linked to contraction of the sector The sector is characterised by the need for highly skilled and qualified farm managers and technical staff on the one hand and large numbers of unskilled and semi‐skilled workers on the other Many managers of emerging farms are mainly untrained and unqualified Agriculture relies more on semi skilled labour than other services as reflected in the table below The sector also relies on migrant casual and seasonal labour Table 8 Percentage unskilled to semi‐skilled labour by DTI industry (economic sector) classification
Sector 1995 2008 Growth decline in
skilled labour
Agriculture 990 941 49
Mining 920 879 45
Manufacturing 870 821 56
Utilities 800 688 140
Construction 900 883 19
Trade 840 842 ‐ 02
Transport and Communication 730 768 ‐ 52
Finance 620 595 40
Community and personal services 540 498 78
Total 782 738 56 Source National Treasury 2010
Agriculture Sector Analysis 9
AgriSETA June 2010
Agriculture Sector Analysis 10
Employment in the sector is based on those who work in administration in DAFF and those who work in production and processing at farms and in factories In March 2009 DAFF had 3 285 posts with 2 735 of these filled The table below shows the employment profile at DAFF by occupation race gender and disability as at 31 March 2009 The department employed 57 male employees and 43 female employees There were more African employees constituting 69 of the entire department workforce Very little progress has been made regarding the employment of people with disabilities who constitute only 04 of the workforce This is in line with other department across government where similarly little progress has been made
Table 9 Employee profile ‐ Department of Agriculture Forestry and Fisheries Occupational Category (SASCO)
African Coloured Indian White Totals
M F M F M F M F M F Total
Legislators senior officials managers
15 14 2 2 8 3 25 19 44 16
Professionals 239 241 11 12 4 14 70 64 324 331 655 240
Technicians associate prof
190 153 38 19 9 4 86 57 323 233 556 204
Clerks 93 204 22 42 0 7 13 171 128 424 552 30
Service and sales workers
38 19 4 2 1 17 1 60 22 82 30
Craft and related trades workers
42 3 13 58 0 58 21
Plant machine operators and assemblers
53 1 8 1 62 1 63 23
Elementary occupations
484 96 94 28 1 6 5 585 129 714 262
Totals 1 154 728 182 105 15 25 214 301 1 565 1 159 2 724
Percentage 424 267 67 39 06 09 79 110 575 425 100
People with disabilities
1 1 1 2 6 4 7 11 04
Race 1 882 287 40 515 Percentage 691 105 15 189 Source Dept of Agriculture Forestry and Fisheries (2010)
In respect of occupations and skills profiles the majority of the Departmentrsquos employees are Professionals and Technicians Associate Professionals (444) followed by people employed in elementary occupations (262) Employment across the agricultural sector is subject to growth and decline variations related to a wide range of conditions and circumstances ndash produce prices climate and environmental changes mechanisation technology and the like Since 2002 the trend has been downwards There are a number of reasons for this including mechanisation and casualisation of labour on larger farms the economic downturn impacting on some sub‐sectors and the global trade situation including changes in the foreign exchange rates and the failure of successive DOHA development talks to address inequalities in access to global agricultural markets12 12 The Doha Development Round is the trade‐negotiation of the World Trade Organization (WTO) Its objective is to lower trade barriers globally Talks have stalled over a divide on major issues such as agriculture industrial tariffs and non‐tariff barriers services and trade remedies The most significant differences are between developed nations led
AgriSETA June 2010
Agriculture Sector Analysis 11
It is anticipated that growth of the agricultural sector to meet local consumer demand government initiatives to expand agricultural niche export markets and the development of an aquaculture sub‐sector to counter depletion of natural resources is likely to lead to creation of employment in the sector
Table 10 Workforce changes in the Agricultural sector ‐ 2001 to 2010
Year Workers Year on year difference Variation 2001 969 0002002 1 153 000 + 184 000 1602003 808 000 ‐ 345 000 ‐ 4272004 828 000 + 20 000 242005 778 000 ‐ 50 000 ‐ 642006 886 000 + 108 000 1222007 703 000 ‐ 183 000 ‐ 2602008 764 000 + 61 000 802009 615 000 ‐ 149 000 ‐ 2422010 650 000 + 35 000 54
Quarter 1
Source Statistics South Africa Survey (pp 210‐211)
Employment categories and remuneration
It is difficult to get detailed and accurate yearly statistics on employment by type (full‐time casual and seasonal employees) or on remuneration in the agricultural sector The latest available statistics on commercial agriculture are found in the 2007 Stats SA Census of Commercial Agriculture The following tables reflect survey data on the number of permanent casual and seasonal agricultural sector employees by province as well as total remuneration per province
Table 11 Number of paid full‐time agricultural workers and total remuneration by province
Province 2002 2007 Growth Decline
Number Remuneration
R000s Number
Remuneration R000s
Number Remuneration
Eastern Cape 33 718 329 351 34 253 510 404 16 550Free State 57 607 580 888 53 944 737 796 ‐64 270Gauteng 20 815 344 629 22 979 534 083 104 550KwaZulu‐Natal 75 799 763 439 66 685 968 455 ‐120 269Limpopo 62 635 525 390 35 728 625 436 ‐430 190Mpumalanga 61 603 599 617 46 520 853 396 ‐245 423North West 39 914 409 526 53 741 574 596 346 403Northern Cape 31 077 320 598 26 871 339 948 ‐135 60Western Cape 98 207 1 378 816 90 943 2 029 275 ‐74 472Totals 481 375 5252251 431 664 7 173 389 ‐103 366
Source Statistics South Africa Report 120201 (p1101)
by EU USA and Japan and the major developing countries led and represented by India Brazil China and South Africa Considerable contestation exists over the maintenance of agricultural subsidies operating as trade barriers
AgriSETA June 2010
Agriculture Sector Analysis 12
Table 12 Number of paid casual amp seasonal agricultural workers amp total remuneration by province
Province 2002 2007 Variance
Number Remuneration
R000s Number
Remuneration R000s
Number Remuneration
Eastern Cape 30 936 59 680 30 565 106 497 ‐12 784Free State 57 871 69 595 45 150 98 996 ‐220 422Gauteng 8 722 20 975 11 957 93 461 371 3456KwaZulu‐Natal 37 602 103 946 34 383 154 286 ‐86 484Limpopo 38 614 107 223 31 833 124 159 ‐176 158Mpumalanga 46 480 86 242 32 826 176 363 ‐294 1045North West 46 078 62 653 32 008 75 250 ‐305 201Northern Cape 68 174 121 613 47 874 123 723 ‐298 17Western Cape 124 968 331 406 98 546 485 108 ‐211 464Totals 459 445 963 331 365 142 1 437 843 ‐205 493
Source Statistics South Africa Report 120201 (p1101)
The tables above reflect that the Western Cape was the biggest employer of labour on commercial farms in 2007 with a majority of the employees being casual and seasonal The Eastern Cape employed the least number of commercial farm employees The comparator figures for 2002 and 2007 would appear to show a continuous country wide reduction in employment both in permanent employees and casual and seasonal workers The exception is the North West that has experienced an increase in full time employees The current minimum wage for farm workers (February 2010) is R1 31669 per month13 Monthly salaries differ across sub‐sectors with highest paid workers in primary production in the fisheries and dairy sub‐sectors
Table 13 Approximate monthly wage rates in Agriculture for selected sub‐sectors
Subsector Primary Production ProcessingPack house
Meat R 2000
Dairy ‐ R 2650
Wines R 1100 R 1400
Flowers R 800 R 1200
Fisheries R 5000
(crewman)R 1892
Source DTI 201014
Vink amp van Rooyen (2009) indicate that before the introduction of minimum wage in 2003 the real cash remuneration for employees had been increasing However over time the unit cost of labour (the ratio of the total cost of labour to the total value of output) has been in decline including a steep drop during and after the introduction of minimum wages
13 Department of Labour 2010 14 Source DTI (Data sourced from SAMIC Dairy Industry JAG WOSA SAFEC SA Pelagic Fish Industry Association)
AgriSETA June 2010
Agriculture Sector Analysis 13
In 1970 for every R1 of output 16 cents was spent on labour By 1980 this has dropped to 13 cents for R1 of output By 1994 the figure had increased to 19 cents declining to 17 cents in 1998 and to 117 cents in 2001 By 2007 it had reduced to 108 cents Further research will be needed to establish the current situation but there is reason to believe that the decline has continued with wages being very low both in terms of unit costs and in relation to other groups of workers in the economy
Strictly speaking it is not the role of the SETA to engage in the complex regulatory framework for the agricultural labour market It is for the Department of Labour and NEDLAC with their employer and organised labour stakeholders to find ways of balancing the need for protection of vulnerable workers with the need to create a framework that encourages the creation of jobs and improved job security The reason that more research is needed in this area and in particular detailed discussions with industry and labour representatives is to establish
The extent to which skills development interventions can improve the prospects for job creation and improved job security and
The mechanisms that can be established to enable uninterrupted skills training in the context of casualisation and use of contract and seasonal labour
Stakeholders in the Agricultural sector
National government departments
There are a number of national government Departments and spheres involved in the challenges of the agricultural sector The following table sets out the broad contribution that each department is intended to make
Table 14 Government department roles in relation to Agriculture Department Role
Department of Agriculture Forestry and Fisheries Agricultural policy and support Department of Rural Development and Land Reform Land Reform and land claims settlements Department of Economic Development Economic planning National Treasury Macro economic policy Department of Trade and Industry Industrial strategy (IPAP 2) Department of Water Affairs The management of water supply Department of Labour Labour market policy Department of Higher Education and Training HRD and skills planning and SETAs In relation to public spending on agriculture the agricultural national budget constitutes about 05 of the national budget The figure below reflects trends in national budgeting for the agricultural sector between 19967 and 201112 Some analysts15 have argued that state expenditure on agriculture shows lack of prioritisation of the sector especially considering that the budget remains lower than it was in the late 1980s when it now caters for a greater number of farmers than it did during apartheid segregation
15 Greenberg 2010 p 2
AgriSETA June 2010
Figure 2 National budgets for Agriculture 1996‐2011 (adjusted for inflation)
Source Greenberg 2010
The Department of Agriculture Forestry and Fisheries (DAFF) is responsible for the agricultural sector The department works with various organisations to promote the interests of the sector
bull It registers all South African Pest Control Association (SAPCA) qualified inspectors bull It works with the Agricultural Research Council for research to optimise the control of
migratory pests bull The Directorate on Marketing works with the National Agricultural Marketing Council
(NAMC) on issues related to equitable access to markets including policy formulation issuing of permits and coordinating inter‐departmental relations to enhance marketing
bull Historically the Department has employed a large number of extension officers located in farming communities who have supported and advised farmers This service has been in decline in recent years but remains an important aspect of state support to the sector
The above roles will be subject to some review in the context of IPAP 2 and also the debates around the role of the state in the economy The issue is not only levels of spending but also clarifying the role of government in relation to the business of the sector
Sector representatives
There are three major umbrella organisations representing the interests of farmers AgriSA TLUSA and the National African Farmers Union of South Africa (NAFU) AgriSA and TLUSA represents both commercial farmers and cooperativesrsquo interests through its engagement at national and international level AgriSA is a member of the Southern African Confederation of Agricultural Unions (SACAU) a regional farmersrsquo union for farmers in Southern Africa AgriSA has structures in all the provinces except Limpopo
Agriculture Sector Analysis 14
AgriSETA June 2010
Agriculture Sector Analysis 15
NAFU is a union for predominantly previously historically disadvantaged smallholder farmers with a membership base including farmers agribusinesses farmersrsquo organisations corporations and individuals who support their goals NAFU is represented by different unions in all the provinces There are other employer organisations who are not affiliated to AgriSA and NAFU including
bull Agricultural Industrial and Medium Employers Organisation bull Agricultural Mining and Industrial Chemical Manufacturersrsquo Association bull Agrilabor Employersrsquo Organisation bull Algoa Meat Traders Association bull East Coast Poultry Producers Employersrsquo Association bull East London and District Meat Traders Association bull Fertiliser Industry Employersrsquo Organisation bull Landbou Werkgewersorganisasie (Workinfocom) bull Red Meat Producersrsquo Association
The Agricultural Research Council is an autonomous statutory body that provides research to DAFF and the provincial departments of agriculture Figures available for South Africarsquos investment in agriculture research and development show that South Africa was above international norms of investment in RampD which are 053 of agricultural GDP for developing countries and 236 for developed countries In South Africa in 2000 agricultural RampD investment in relation to agricultural GDP was 30416 There are six major sources of credit for farmers banks (50) agricultural cooperatives and agribusiness (12) the Land Bank (21) private creditors (8) other creditors and financial institutions (9) and government (1) (GCIS 2010)
12 Factors impacting development in the Agriculture sector Several international and local factors impact on the productivity of the agricultural sector and its growth Key amongst these are
Growth of the South African economy and rising consumer demand International trade and trade agreements The global recession and rise in food prices The land reform programme Reliance on imports Water availability Changing consumer patterns and demands (eg organic food stuffs) Technological changes and mechanisms Quality standards Farm safety and security Broad‐based black economic empowerment Legislation Skills demand and supply HIVAIDS
16 Vink amp van Rooyen 2009
AgriSETA June 2010
These key factors are clustered and discussed below
Future sector economic growth and development
South African sector growth plans (IPAP2)
The 20102011 ndash 20122013 Industrial Policy Action Plan (IPAP) identifies five structural challenges that existed in the South African economy before the global economic downturn and which have been exacerbated by the recent economic crisis These challenges were evident even during the time South Africa was experiencing relatively high growth rates between 2005 and 2007 and have continued during the recession These challenges are
1 Structural imbalances in the growth path including growth that is lagging behind other medium and low income countries
2 Uneven performance of the manufacturing sector with some divisions like the automotive sector experiencing exponential growth while other sectors have stagnated
3 Employment growth being sustained by credit extension and consumption rather than by productive sectors leading to a large current account deficit
4 Low profitability of manufacturing 5 Low savings and investment from financial sector growth Only 52 of private credit was
extended to fixed investment in 2008 Key sectors have been identified for IPAPrsquos focus including agro‐processing which has a diverse group of industries and sub‐sectors including food processing beverages aquaculture horticulture medicinal aromatic and flavourants Key action plans for the agro‐processing sector are identified in IPAP2 as
Development of a National Food Control Agency to consolidate the sector Development of aquaculture to supplement dwindling wild fish stocks Designating specific areas for utilisation of aquaculture Development of the organic food sector Development of the small milling industry Enhancing competitiveness in fruit and vegetable canning Improving beneficiation of Rooibos and Honeybush products (IPAP2 2010)
International Trade
South Africa is a major exporter of Agricultural produce In particular South African fruit and fruit‐derived products such as wine and fruit juice are competitive in the global market However in many sub‐sectors where export potential exists ndash grain and meat ndash serious problems face the industry A key challenge is the uneven playing field experienced by South African exporters Major global competitors include the United States and the countries of the European Union where government subsidies in various forms are in place No such subsidies are in place in South Africa making it difficult if not impossible for South African agricultural produces to enter developed country markets due to the prices that they have to ask for products I In addition the value of the Rand has fluctuated from levels of around R10 to the US dollar to as little as R7 to the dollar When the Rand is strong export becomes difficult because it costs more in the case of the move from R10 to R7 a 30 cost increase for the importer It is impossible to
Agriculture Sector Analysis 16
AgriSETA June 2010
Agriculture Sector Analysis 17
predict whether the World Trade Organisation negotiations known as the DOHA Round will achieve progress in the coming years Historical evidence is that during periods of global recession developed economies become more protective not less and so the current outlook is not good Nor is it possible to predict the value of the Rand though current thinking in government is to move toward a weaker Rand to encourage exports These are two key variables that will need to be factored into the different sector growth scenarios for the future
Global recession and rise in food prices
Economic growth slowed down significantly in sub Saharan Africa and in South Africa in 2009 but there appear to be signs of recovery GDP growth in the region declined from about 6 in 2004 ndash 2008 to about 18 in 200910 GDP growth in South Africa was 16 in 2009 17and rose to 46 in the first quarter of 201018 though much of this is related to the income derived from the 2010 FIFA World Cup and may not be sustained Projections are generally for a slow revival with a set back after the slight rise resulting from the World Cup A return to the 6 levels of the 20078 could take some years The global recession reduced the demand for African exports and reduced capital flows to the region but it is anticipated that the demand for mineral resources by Asian and Western powers will result in both the expansion of exports and expanded foreign direct investment The competition between India and China for African markets is also expected to boost trade to the benefit of African suppliers South Africa is expected to particularly benefit from direct foreign investment from China and India China has already become South Africarsquos largest market for exports and supplier of imports19 Rising food prices have forced governments around the world to control prices of maize bread rice and dairy products In South Africa ldquofood price inflation between December 2005 and December 2006 averaged 788 rdquo20 Although efforts are being made to reduce barriers to poorer families in relation to basic food there has been no move to subsidise food generally This may change though the space for significant levels of support is restricted because of reduced revenue from income taxes resulting from the recession The global credit crunch and recession have meant a reduction in public expenditure and funding which has affected the agricultural sector21
Land reform
In South Africa specifically land reform has a significant bearing on food security and agriculturersquos contribution to GDP The objective of the land reform programme is to transfer 30 of agricultural land to black ownership by 2014 (deferred to 2025) to ensure more equitable access to land by historically disadvantaged people and to increase their participation in agricultural activities22 Land reform has been informed by four processes23
17 Department of Agriculture Forestry and Fisheries 2010 18 Stats SA 2010 19 Department of Agriculture Forestry and Fisheries 2010 20 Department of Agriculture Forestry and Fisheries 2010 ‐2011 Strategic Plan 21 Economic Commission for Africa 2009 22 Xingwana 2008 23 CDE 2008
AgriSETA June 2010
Agriculture Sector Analysis 18
Land restitution involving returning land or providing financial compensation to those whose land was dispossessed during apartheid
Land redistribution transferring more land to the historically disadvantaged Tenure reform modernising land tenure rules and access to land ownership and Providing financial support for the development of emerging farmers
In relation to progress with land reform by September 2009 only 69 of agricultural land (about 567 million hectares) had been transferred and a majority of the beneficiaries have not yet occupied the land due to lack of infrastructure input or technical support The following table gives an indication of the progress of land reform since the inception of the first democratic government
Table 14 Land transfers and beneficiaries ‐ 1994 to 2009
Province Redistribution and tenure Restitution Total Hectares Beneficiaries Claims Hectares Beneficiaries Hectares Beneficiaries
Eastern Cape 675 353 357 25 633 16 201 94 834 215 201 448 191 240 834
Free State 799 350 291 7 721 2 662 47 615 40 893 397 906 48 614
Gauteng 286 34 513 7 328 13 159 9 476 70 179 43 989 77 507
KwaZulu Natal 690 547 414 67 761 14 752 642 447 433 168 1 189 861 500 929
Limpopo 291 91 235 7 403 3 382 513 024 220 227 604 259 227 630
Mpumalanga 444 322 839 13 950 2 694 399 876 225 877 722 715 239 827
Northern Cape 271 952 744 2 773 3 682 539 620 100 554 1 492 364 103 327
North West 300 268 566 40 539 3 709 373 642 172 963 642 208 213 502
Western Cape 223 122 304 12 750 15 546 3 769 118 165 126 073 130 915
Total 3 979 3 043 264 185 858 75 787 2 624 303 1 597 227 5 667 567 1 783 085
Source Greenberg 2010
Achievement of the 30 land reform target is being made difficult by land prices Under the willing buyer willing seller scheme the government will need R74 billion to be able to purchase enough land While resources may be available there are suggestions of lack of capacity The Department of Rural Development and Land Reform (DRDLR) was able to spend only 31 of its land reform 200910 budget in the first six months of the financial year Going forward this Department needs to identify what the real challenges are with the pace of land reform delivery so that they can be mitigated to meet the 2025 target A priority is the retention of skills skills transfer and skills development during the transfer of land as well as retention of national food production to avoid loss of production Support for new beneficiaries of land to ensure sustained productivity is derived from two main sources of funding ndash the Broadening Access to Agriculture Thrust (BADAT) and the Comprehensive Agricultural Support Programme (CASP) CASP is a conditional grant from the Department of Agriculture Forestry and Fisheries to provincial departments to support emerging farmer development Provincial farming budgets dedicated for farmer support in Mpumalanga the Free State Northern Cape and the Western Cape have risen significantly and those in KwaZulu Natal and Gauteng have witnessed a slight increase Eastern Cape and Limpopo agricultural budgets have been steady The North West is the only province where there has been a sharp decline in the share of the budget dedicated to farmer support24
24 Greenberg 2010
AgriSETA June 2010
Agriculture Sector Analysis 19
Reliance on imports
Overall the Agriculture sector contributes positively to the balance of payments ldquoSouth Africa remains food secure The value of our exports increased by 464 from R33 656 million in 200708 to R49 278 million in 200809 During the same period the estimated value of imports rose by 12 from R34 009 million to R38 401 million resulting in a positive trade balancerdquo25
South Africa depends largely on world markets for seed production and agrochemicals Regarding seed production there are only three community seed production schemes in Limpopo and Mpumalanga being piloted with state funding Ten top large companies including two South African companies and multinationals have rights to over two thirds of registered seed varieties in South Africa Despite the dominance of genetically modified and hybrid seed in some sub‐sectors like maize sunflower and sorghum open‐pollinated varieties have been resilient in South Africa enabling the possibility of alternative seed sources not dependent on technological processes26 In relation to agrochemicals deregulation and liberalisation in the fertiliser sector led to the shutdown of local production capacity and South Africa became an importer of fertiliser for the first time in 2000 There are three large players in the fertiliser sector Sasol Nitro Yara and Omnia South Africa imports an estimated 70 of fertilisers and pesticides Fertiliser prices rose by over 200 between 2006 and 2008 but dropped somewhat after that However this hike signified the volatility of the agrochemicals industry and South Africarsquos dependency on imports and the potential risk for emerging farmers and food production of this dependence on imports as the country cannot control the prices making inputs both difficult to budget for and in many cases unaffordable The price of agrochemicals is also particularly influenced by the prices of oil and the exchange rate The general understanding in relation to job creation is that a weaker Rand will improve exports and therefore enable job creation Of course the down side of this strategy is that imports become more expensive So what may be an advantage for those sub‐sectors who are expanding their export volumes those relying on imported agro chemicals will be under increased pressure
Water
Water is both an essential and scarce resource for the agriculture sector and is being threatened by climate changes Crop production relies heavily on water and yet access to water is not being addressed in a systematic way in the land reform processes Greenberg suggests that the relationship between land reform agricultural support and water resource provision is inadequate and a way to address this could be established by linking water provision to land transfer or investing in irrigation for both commercial and resource‐poor farmers However investing in irrigation in the context of water scarcity and climate change may not be the best option What could be needed is finding ways to maximise efficiency of the 60 of South African
25 Department of Agriculture Forestry and Fisheries Strategic Plan 201011 26 Greenberg 2010
AgriSETA June 2010
Agriculture Sector Analysis 20
water used for irrigation by for example using methods such as drip or micro‐irrigation which are expensive to set up but which reduce water wastage by 5‐1027 The Department of Water Affairs is responsible for managing water supply and has to give authorisation for agricultural projects and other developments The department needs to be seen as an important stakeholder in the agricultural sector
The labour market
South Africa recorded an unemployment rate of 243 in 2009 (narrow definition) If people who are no longer actively seeking work are considered the broad unemployment rate rose from 267 to 313 illustrated in the figure below As a direct consequence of the global economic downturn in 2008 870 000 formal jobs were lost in 200928 Others have quoted a figure of over 1 million
Figure 3 Official unemployment in South Africa 2003 ‐2009
Source National Treasury 2010
Annual employment loss followed sector growth patterns with agriculture mining manufacturing and trade facing the highest job losses as their sector growth contracted Unemployment is especially a major problem among lower skilled workers and younger people Youth employment in the 15 ‐24 year age group has fallen by 219 000 (136) and 483 of people in this age group are unemployed Employment of semi‐skilled and unskilled workers has contracted by 527 000 and male employment has gone down by 550 000 (71) while that of women has decreased by 320 000 (52) The number of discouraged workers ie those no longer actively seeking work has increased from 518 000 to 17 million29 Clearly the existence of a very large pool of largely unskilled unemployed workers has an impact on the farming sector It drives wages down and creates opportunities for casualisation and the expansion of labour contract agencies and brokers In addition there are significant numbers of foreign nationals mainly from Zimbabwe and Mozambique who are seeking work and often finding it on farms and in primary processing and packaging plants There are benefits to the
27 Greenberg 2010 28 National Treasury 2010 29 National Treasury 2010
AgriSETA June 2010
Agriculture Sector Analysis 21
sector with skilled and semi‐skilled workers coming into the labour market and being absorbed into the workforce and helping raise productivity levels However at the lower skilled end of the market the existence of this pool brings further casualisation and downward pressure on wages Tensions are likely to increase and further protests either in the form of xenophobic outbreaks or actions against farmers may well increase A view often expressed by farm employers is that current labour legislation makes dismissing workers difficult and so the availability of labour without entering into contracts of employment is an attractive way of avoiding the legislation and its obligations Organised Labour is seeking to restrict these opportunities through either regulating or eliminating labour brokers and efforts are being made to regulate the use of foreign labour However for the foreseeable future the trend is for formally employed people to be reduced in number In relation to the emergent sector there will also be a reluctance to enter employment contracts with workers The fact that many households are engaged in some form of largely unpaid agricultural work means that there is significant casual work dating back many years Helping change this situation into one where casual or unpaid jobs are transformed into formal jobs with regular wages will take time It is also likely that as some emergent farms become established they will act similarly to established farms and institute a form of casual labour rather than expanding a workforce for which they would have to take a level of responsibility From an AgriSETA perspective these labour market trends mean that whilst levy income can be directed at a relatively small labour pool one that is manageable in terms of planning and implementation the size of the informal casual and unemployed labour force in the sector ‐ for whom no levy is paid and who have no employer to plan for their skills needs ndash is very large and its needs almost unlimited Clearly the relationship with the National Skills Fund (NSF) becomes critical in respect of the entire non‐levy income sector Again the level of support available from non‐levy income sources will be an important variable in looking at future sector skills development scenarios
Consumer trends
South Africa currently produces enough food to meet the needs of its population However consumption of three main staples maize wheat and vegetables has been volatile since 1985 and remains below 1990 levels Consumption of maize and vegetables by South Africans is 17 and 32 less respectively than in 198530 The main reasons for this lie in the growing levels of poverty and the difficulties that families have in purchasing nutritious food Whilst government has increased the levels of social grants and increased the number of people receiving grants to around 13 million the incomes of poor families have been badly hit by a range of factors including job losses and rises in food prices The approximately 1 million people who lost their jobs in 20089 meant a loss of income for many millions of dependents Rises in food prices have also had a disproportionate impact on the poor Whilst food is available it is often not accessible to families on the income levels that they have to manage within The result is that less and less nutritious food is purchased which in turn impacts on the ability of farmers to sell their products locally 30 Greenberg 2010
AgriSETA June 2010
Agriculture Sector Analysis 22
Whilst there is no evidence that government will reduce its efforts in relation to poverty relief and social benefits including such programmes as school feeding schemes and food parcels during periods of drought the state of public finances may not enable to support the poverty that grips many rural areas If real income levels for the poor were to rise it could have a significant impact on the economy of the agricultural sector Equally an improvement in the rural economy with increased agricultural production and jobs would dramatically impact on the capacity of people to buy nutritious food Achieving a positive growth path in rural areas is a huge challenge for government and one that is key to governmentrsquos Medium Term Strategic Framework and Industrial Policy Action Plans
HIVAIDS
South Africa has a high prevalence of HIV and AIDS The HIV prevalence among people aged two and above was estimated at 109 in 2008
Table 15 Estimated HIV percentage prevalence by age group (2002 ndash 2008)
Age 2002 2005 2008 Change
Children (2‐14 years) 56 33 25 ‐31
Youth (15‐24 years) 93 103 87 ‐06
Adults (25 and older) 155 156 168 13
15‐49 year olds 156 1692 169 13
Total (ages 2 to 49) 114 108 109 ‐05 Source Avert 2009
The table above shows that HIV prevalence is highest amongst those aged 25 years and older Given youth labour market analyses which point to people from previously disadvantaged backgrounds mainly African males accessing formal employment for the first time at age 25 ‐27 this population can be held to represent people in employment Research31 has estimated that by 2020 the pandemic will have claimed at least 20 of employees in the agricultural sector Southern Africa
in
HIV and AIDS have significant ramifications in the agricultural sector for both commercial farming and subsistence farming The implications include
bull Decrease in cultivated land bull Focus on less labour intensive crop and animal production bull Decrease in womenrsquos agricultural productivity as they take on a more care giving role bull Loss of skills bull Increase in absenteeism from work bull Decrease in daily work outputproductivity because workers are weaker from infections
There are suggestions that the impact of the pandemic in South Africa demands sectoral intervention although this may be difficult in the agricultural commercial sector as
bull Seasonal workers who seem to be more vulnerable to infection because of their low socio‐economic status are not in one place long enough for care programs Further
31 Ingelozi Management Solutions 2008
AgriSETA June 2010
Agriculture Sector Analysis 23
farmers and employers may not feel responsible for seasonal workers in the same way they would invest in their permanent employees
bull There may be uncertainty around land reform which may put HIV intervention on farms on the back burner
bull There are no policies that enforce HIV education and care on farms in the same way that legislation like BEE does for ownership As a result HIV intervention may be left to goodwill and employers may feel it is more important to comply with issues that are monitored
Farm safety and security
South Africa has been plagued by unacceptably high levels of violent crime and murder for many years now Farms have experienced this and those living on farms feel and are extremely vulnerable The South African Chamber of Commerce and Industry (SACCI) has argued that
Using the nominal GDP figure for 2009 of R24 trillion a 322 percent contribution of agriculture to GDP and an estimate of 39982 farms (as at 2007) in South Africa the cost of a murderattack on a farm to the economy was R1932869 per annum
SACCI acknowledges that this estimate is flawed as it does not take into consideration the fact that farming units contribute differently to GDP and that not every attack or murder contributes to farm shut down or loss of productivity However if not addressed these attacks could lead to loss of farming sectors as farmers migrate to lsquosaferrsquo regions This will affect employment and GDP contribution of the sector The need for safety and security on farms may also shift farmersrsquo focus in skills development to include personnel who have skills in safety and security
Broad‐based Black Economic Empowerment
The aim of the AgriBEE Charter (gazetted in 2008) is to increase the involvement of black business in agriculture through ownership and control as executives and senior managers of new and existing agricultural businesses The extent to which AgriBEE is transforming the sector is not known as it is too early to tell but a recent survey conducted by ABC and the IDC showed that among the ABC respondents in 2007 46 of enterprises were busy constructing a BEE strategy and 46 claimed to be implementing a BEE strategy A survey of the dairy industry in the Western and Eastern Cape in 2008 showed that only 6 of firms had a BEE strategy in place It also seems from survey data that companies are focusing on the skills development and socio‐economic aspects of BEE rather than on ownership32 It would appear that although there have been some significant BEE purchases of viable farms and some employee empowerment projects including some quite high profile ones in the Cape Winelands the extent of ownership change had been limited One of the factors is the very high level of single person or family ownership in the agricultural sector BEE is more straight forward in the corporate world where shares can be exchanged For a family business it is a matter of selling off part or all of the land and the tendency is to sell off those areas of the farm that are expendable from a business sustainability perspective
32 Greenberg 2010
AgriSETA June 2010
Whilst there is discussion in government about the ending of the ldquowilling buyer willing sellerrdquo concept the Constitution itself provides for property rights and so although some pressure may be exerted through legislation and regulation the extent and speed of change may not be fast The mechanisms for encouraging the transfer of significant levels of ownership have not yet been created The focus of the SETA is therefore likely to be more the beneficiaries of land reform and emergent farmers though projects of a BEE nature can be targeted as they arise
Conclusions and scenarios It is useful when looking at possible scenarios to examine the key variables or uncertainties and to project how variations one way or the other will have an impact on the development and growth of the sector From the sector analysis and factors that are contributing to change in the sector there are some key factors that seem to emerge First appears to be the economy and related issues of the labour market and the challenges of labour absorption in an enclave economy These factors determine on the one hand whether there will be growth and development and on the other whether such improvements will result in improved employment opportunities and the creation of a virtuous cycle of development Second is the role of the state and the various government departments whose plans and work impact on the agricultural sector Related to this is land reform that is inevitably driven by the state and not the owners of land or the landless The view expressed by many engaged in agrarian reform is that the state must play a significant role It becomes clear that a successful agricultural enterprise requires a number of factors to be in place to be successful These include access to land (Department of Rural Development and Land Reform) agricultural support within a supportive agricultural framework (Department of Agriculture Forestry and Fisheries) access to consistent water supply (Department of Water Affairs) access to finance (Department of Trade and Industry various state agencies) conducive labour market regulation (Department of Labour) sound industrial policy (Department of Trade and Industry) economic planning and macro policy (Department of Economic Development National Treasury) and appropriate education training and skills development (Department of Higher Education and Training the Human Resources Development Council NSA and the SETA) There are other government departments as well as provincial and municipal structures that also play a role The following analyses show how the four variables
economic growth and development role of the government labour market changes and land reform)
impact positively or negatively on the growth of the sector and the demand for skills
Agriculture Sector Analysis 24
AgriSETA June 2010
Agriculture Sector Analysis 25
HHIIGGHH GGRROOWWTTHH SSCCEENNAARRIIOO
The economics of the sector Role of government
The economy in SA and globally continues to revive albeit slowly for the next few years
Roles and integration of national government departments are clarified Specific functions are agreed processes put in place and personnel appointed with the required skills
International trade agreements are still weighted infavour of US and EU but progress is being made and specific blockages are addressed in bilateral talks
The roles of Departments (DWA DAFF DRDLR DoL DTI DED DHET) are clarified with appropriate joint plans and coordinating structures
The rural economy gradually improves with the buying power of the poor increasing and more stable markets created for local produce
For each of the functions agreed in each of the related departments appropriate structures and systems are put in place and staff trained
Exports increase in key areas identified in IPAP 2 and the Rand exchange rate stabilises at a level not too much different than it is today
Specific capacity is put in place at local level to support implementation of land reform and rural development
There is a growing understanding of the concept of dualism and the need to intervene with labour absorption and development mechanisms
Land claims are all finally settled and ownership and tenure is resolved There is a serious drive to establish effective agricultural enterprises
An understanding is reached on the role of agencies and labour brokers and abuse is curbed
The willing buyer willing seller approach is resolved and enables viable land to become black owned
Some relaxation of labour market regulations are agreed that maintain some minimum standard of employment but assist absorption
Land transfer to black and emergent farmers is done in a manner that integrates then into the supply chains of the sector
Mechanisms are found to address skills needs in the context of casual and seasonal work patterns
Financing of land reform and transfer is done on the basis of agreed development plans including skills
Labour market reform Trajectory of land reform LLOOWW GGRROOWWTTHH SSCCEENNAARRIIOO
The economics of the sector Role of government departments The economy in SA and globally stagnates at current levels and the economy struggles to pick up after the temporary 2010 World Cup boost
A lack of purpose at government level means limited progress for another five years Land reform remains a commitment without a plan
International trade agreements are still weighted infavour of US and EU and protectionism increases as a result of the global recession
The roles of Departments (DWA DAFF DRDLR DoL DTI DED DHET) are unclear and there is no proper co‐ordination
SArsquos Gini coefficient continues to worsen with rural poverty increasing and local economies declining
There is a lack of effective structures systems and processes to implement policy across departments
Rand volatility causes problems for importers and exporters Well established markets are maintained but exports decrease
At local level the decline in the agricultural extension officer functions continues and limited practical support is available
Understanding of the rural economy is so diverse that stakeholders cannot agree the problem let alone the solution to low absorption levels
Land claims take too long and land reform processes leave potentially productive land poorly developed and managed
Casual labour and labour brokers remains an issue of dispute Confrontation results in bitterness and resentment
The impasse caused by a rigid interpretations of property clauses in the Constitution continues to stall achievement of the 30 black ownership target
Labour market regulation continues to be a contributing factor to reducing levels of employment
Black owned farms find it difficult to become part of supply chains and are unable to perform adequately
Unstable employment patterns in the sector make skills interventions difficult to manage and largely ineffective
Financing of land reform and land transfer continues to be wasted as it is not tied to the building of appropriate capacity
Labour market reform Trajectory of land reform
AgriSETA June 2010
These analyses can be translated into four potential growth and development scenarios for the agricultural sector which are based on the requirements for a strong development state Scenario 3 Weak government support
and sound economy
Econ
omic fa
ctors glob
ally n
ationa
lly and
locally
Scenario 1 Integrated government support and sound economy
The economic upturn triggered by the World Cup continues and globally things improve enabling an expansion of exports The government because of a lack of integrated policy planning and implementation provides limited support for sector development The gains go to the well established enterprise owners with few gains for emerging farmers and local communities
Government departments coordinate their efforts to achieve maximum impact There are favourable economic conditions that create opportunities for advance Within this positive environment the role of the AgriSETA becomes a central component of a comprehensive strategy for growth and skills interventions are targeted to achieve maximum effect Results in growth in sustainable enterprises and expanded employment opportunities
Government policy and support Government policy and support
Combination of disjointed government policy planning and a weak and increasingly marginalised rural economy Economic conditions result in unsustainable farming conditions and employment declines along with productivity Food shortages and the lack of development in rural areas leading to increasing social tensions A vicious cycle develops with the sector going into long term decline
Government departments coordinate their efforts to achieve maximum impact However economic conditions hamper progress Efforts by the AgriSETA are undermined by poor labour absorption and job insecurity Some significant successes are recorded including some NSF funded projects that result in sustainable enterprises A platform is laid for future improvements when the economic conditions improve
Scenario 4 Weak state and economy Scenario 2 Strong state but weak
economy
Agriculture Sector Analysis 26
AgriSETA June 2010
Agriculture Sector Analysis 27
SECTION 2 DEMAND FOR SKILLS
AgriSETA registered employers and employee coverage
In 2009 17 234 employers were registered with the AgriSETA comprising 15 394 small employers (less than 50 employees) 1 202 medium sized employers (50 ‐ 149 employees) and 638 large employers (more than 150 employees)
Considering that there are around 40000 commercial farms33 the 17 234 employers represent around 43 of commercial farms Notwithstanding changes in the sector as a result of land reform and sector shrinkage this is a sizable proportion and is held to be sufficiently representative for the purpose of skills development planning However this paints an incomplete picture It understates the representative nature of large enterprise registered with the SETA and overstates the representative nature of small registered enterprises 4 175 (242) of the enterprises are levy paying members Further only 1 673 (11) workplace skills plans (WSPs) were submitted
Table 16 Registered employers by size and sub‐sector Sub‐sector Description
Employers Small Medium Large
CoffeeTea Processing and marketing of coffee and tea including coconuts cocoa nuts olives dates etc
33 4 3
Fibre Grading ginning packing of wool and cotton raw material 1 676 16 18
Fruit Fruit packed in cartons fruit juice concentrate drummed and fruit juice in container ready for consumption
271 36 57
Fruit exporters and importers 6 0 1
Grain
Manufacture of grain mill products and starches 119 5 7Handling and storage of grain 67 7 23Wholesale amp retail trade in Agricultural machinery 213 9 4Sale and distribution of Agricultural raw materials and other farming inputs
182 9 3
Milling
Manufacture of flour and grain mill products including rice and vegetable milling grain mill residues
120 15 11
Manufacture of prepared animal feeds 110 19 0Manufacture of pet foods 42 9 0Manufacture of starches and starch products 7 1 1
Pest control
Pest Control 209 4 0
Poultry Poultry and egg production including the slaughtering dressing and packing of poultry
305 49 37
Primary
Growing of Cereals and other crops (not elsewhere classified) 902 160 34Growing of Vegetables Horticultural specialties nursery products
943 120 72
Growing of Vegetables Horticultural specialties (Including Ornamental Horticulture) and nursery products
11 5 0
Sugar plantation including sugar cane and sugar beet etc 9 4 2
33 SARS statistics 2007
AgriSETA June 2010
Agriculture Sector Analysis 28
Sub‐ Description Employers Growing of fruit nuts beverage and spice crops 1795 255 143Farming of cattle sheep goats horses asses mules and hinnies Dairy farming
2 252 59 18
Other animal farming production of animal products (NEC) 433 25 12Ostrich farming 5 0 0Game farming 16 0 0Growing of crops combined with farming of animals (Mixed farming)
2 920 256 109
Growing of coffee and tea including coconuts cocoa nuts olives dates etc
2 0 0
Agricultural and animal husbandry services except veterinary activities
438 22 9
Other animal farming (not elsewhere classified) 11 1 1Growing of trees as second crop by farmers 126 18 4Fishing operation of fish hatcheries and fish farm 913 10 6
Red meat
Production and animal products (not elsewhere classified) 6 0 0Slaughtering dressing and packing of livestock including poultry and small game for meat
317 40 17
Production sale amp marketing of Agricultural by products (eg bones hides)
61 2 0
Slaughtering dressing and packing of livestock including small game for meat and processing of ostrich products
2 1 0
Wholesale trade in Agricultural raw materials and livestock 193 7 10Transport of livestock as supporting activity 224 0 0Agricultural and livestock research 215 9 3
Seed Seed production and marketing 149 12 6
Sugar Manufacture of sugar including golden syrup and castor sugar
45 5 21
Tobacco Processing and dispatching of tobacco 46 8 6 TOTALS 15 394 1 202 638Source AgriSETA WSP data
The largest number of registered small and medium enterprises are found in the mixed farming sub‐sector while most large enterprises are in the growing of fruit nuts beverage and spice crops sub‐sector
Employee coverage in the AgriSETA
Collectively the 17 234 employers registered with AgriSETA employed a total of 239 076 employees This represents 39 of the agricultural labour force in 2009 The 1 673 employers who submitted WSPs in 2009 employed 97 898 employees representing 41 of the total number of people employed by registered employers While the number of registered employers submitting WSPs is small (11) they employ a sizeable number of employees and the percentage of employees provides a statistically significant sample The data for larger enterprises is statistically much more representative than that for small enterprises
AgriSETA June 2010
Table 17 Number of employees of registered employers by sub‐sector
Sub‐sector
Sub‐sector description Employees
CoffeeTea Processing and marketing of coffee and tea including coconuts cocoa nuts olives dates etc
483
Fibre Grading ginning and packing of wool and cotton raw material 6 539
Fruit Fruit packed in cartons fruit juice concentrate drummed and fruit juice in container ready for consumption
27 661
Fruit exporters and importers 212
Grain
Manufacture of grain mill products and starches 133Handling and storage of grain 18 303Wholesale amp retail trade in Agricultural machinery 795Sale and distribution of Agricultural raw materials and other farming inputs 2 898
Milling
Manufacture of flour and grain mill products including rice and vegetable milling grain mill residues
3 634
Manufacture of prepared animal feeds 731Manufacture of pet foods 160Manufacture of starches and starch products 105
Pest control
Pest Control 119
Poultry Poultry and egg production including the slaughtering dressing and packing of poultry
19 187
Primary
Growing of Cereals and other crops (not elsewhere classified) 10 104Growing of Vegetables Horticultural specialties and nursery products 37 799Growing of Vegetables Horticultural specialties (Including Ornamental Horticulture) and nursery products
195
Sugar plantation including sugar cane and sugar beet etc 220Growing of fruit nuts beverage and spice crops 47 043Farming of cattle sheep goats horses asses mules hinnies Dairy farming
3 382
Other animal farming production of animal products (NEC) 4 203Ostrich farming 0Game farming 0Growing of crops combined with farming of animals (Mixed farming) 28 722Growing of coffee amp tea including coconuts cocoa nuts olives dates etc 0Agricultural and animal husbandry services except veterinary activities 970Other animal farming (not elsewhere classified) 513Growing of trees as second crop by farmers 1 294Fishing operation of fish hatcheries and fish farm 1 589
Red meat
Production and animal products (not elsewhere classified) 0Slaughtering dressing and packing of livestock including poultry and small game for meat
5 128
Production sale amp marketing of Agricultural by products (eg bones hides) 116Slaughtering dressing and packing of livestock including small game for meat and processing of ostrich products
0
Wholesale trade in Agricultural raw materials and livestock 1 697Transport of livestock as supporting activity 0Agricultural and livestock research 534
Seed Seed production and marketing 2 127Sugar Manufacture of sugar including golden syrup and castor sugar 10 478Tobacco Processing and dispatching of tobacco 2 002 Total 239 076
Agriculture Sector Analysis 29
AgriSETA June 2010
Agriculture Sector Analysis 30
Source AgriSETA WSP data
According to the WSP analysis the sub‐sector for the growing of fruit nuts beverage and spice crops employed the largest number of people In six sub‐sectors there are employers who do not employ workers These are probably family based organisations where family members help in the business without drawing a salary These are in transport and livestock research slaughtering dressing and packing of livestock including poultry and small game for meat growing of coffee and tea including coconuts cocoa nuts olives dates etc ostrich farming and game farming
Table 18 Employee distribution by province Province Employees Percentage
Eastern Cape 18 844 192 Free State 1 946 20 Gauteng 2 788 28 KwaZulu‐Natal 5 416 55 Mpumalanga 8 062 82 North West 3 290 34 Northern Cape 5 436 56 Limpopo 1 730 18 Western Cape 50 386 515 Grand Total 97 898
Source AgriSETA WSP data
Of those submitting WSPs registered employers in the Western Cape employed the largest number of people while employers in Limpopo employed the least number of employees Free State has a small number of employees covered by WSPs submitted to the SETA whereas Eastern Cape with a relatively small number of registered farms has a very large number of employees on farms submitting WSPs Given this variance between provinces the use of WSP data for extrapolation purposes must be viewed cautiously
2009 WSP equity information was only provided for about a quarter of employees (25 637 or26)34 No information was available from the WSPs on non‐South Africans working on commercial farms
Table 19 Equity profile from 2009 WSP data African Coloured Indian White
Totals M F D M F D M F D M F D
8 040 5 785 38 5 097 5 228 24 22 25 0 811 556 11
580 417 03 493 505 02 468 532 00 589 403 08 13 863 10 349 47 1 378 25 637541 404 02 54 100
Total EquityTotal Male Total Female Total Disability
13 970 11 594 73 545 452 03
Source AgriSETA WSP data
Using currently available data it is not possible to provide disaggregated employment data by sub‐sector This will require a small change in the way that gender race and disability data is
34 Some employers did not complete race and gender information when giving their employment profiles
AgriSETA June 2010
codified during WSP data‐capturing including allocation by sub‐sector What can be stated is that employment of males is more dominant than that of women and more Africans are employed in the sector than other groups Employment of people with disabilities is below 1
21 Skills demand
The National Education and Training Strategy for Agriculture (AET Strategy)
The AET Strategy developed by the Department of Agriculture Fisheries and Forestry (in consultation with various key stakeholders in the agricultural sector) highlights priority skills needs and constraints within the sector and categorises needs within the following 5 broad areas
1 Agricultural production ndash requesting that the past focus on a narrow band of commodities (relevant mainly to the commercial sector) and related research be expanded to address the needs of small‐scale and subsistence farmers (eg more focus on mixed farming and rural livelihood sustainability skills)
2 Agricultural engineering ndash with specific focus to be placed on technologies suitable for small‐scale farmers (eg relevant and post‐harvesting techniques related to processing and storage of produce) ndash to address this need the scarcity of agricultural engineers requires attention
3 Agricultural economics ndash a critical need was identified for general agricultural economic skills (ranging spectrum of farm planning farm management enterprise management marketing finance etc) ndash with the need to training both farmers and extension officers in such fields
4 Agricultural development ndash a specific need was identified to develop agricultural extensionists in supporting especially emerging and small‐scale farmers over the full spectrum (a need exists for both new curriculum in the training of new extensionists and the re‐training and upgrading of existing officers)
5 Veterinarians ndash the need to develop state veterinarians in order for the state to perform its role and function (particularly in its preventative monitoring and regulatory role and function)
AGRISETA sector skills planning demand data (2008‐2009)
The following section reflects initial research on skills demand in the Agricultural sector arising from the sector analysis (section 1) previous AGRISETA skills demand research for Sector Skills Planning during 2005‐2009 and analysis of WSP data from 2009 With the introduction of the Organising Framework of Occupations and agreement on definitions for scarce and critical skills in 200506 the AGRISETA undertook an extensive research and consultation processes to determine skills development priorities for the sector The research methodology employed was based on the a four dimensional topology for establishing and evaluating skills needs illustrated in the figure below
Agriculture Sector Analysis 31
AgriSETA June 2010
Agriculture Sector Analysis 32
The identification and prioritisation of skills needs was also undertaken from a key stakeholder and beneficiary perspective Consideration was given to needs of the following groups
bull The unemployed ndash helping them gain andor regain entry to the labour market bull The economically inactive ndash helping them to become economically active bull School leavers ndash helping them gain access to further education and training opportunities
and thus facilitating their entry to the job market bull Entrants to the job market ndash facilitating employment and integration into the work culture
and work ethic (improving the employability of an individual) bull Those currently employed in the sector ndash increasing their competency and opportunities
for advancement creating a career path and offering continued job security enhancement of value adding to the sector improving their prospects for better employment opportunities
bull Organisations and enterprises within the sector ndash making sure that skills development and knowledge creation occurs in such a way as to improve the sectorrsquos viability and allowing companiesenterprises to become more sustainable and profitable along the way improving productivity competitiveness and innovation within organisations
In organising and reporting the identified priority skills development needs (200809) the following structuring approach was followed
Tier 1 The four categories of needs as per the Topology presented above were used for the identification evaluation and grouping of needs
Pay conditions
Image
RECRUITMENT DIFFICULTY
SKILLSGAP
SKILLSSHORTAGE
LABOURSHORTAGE
Firms experience difficulty recruiting This does not necessary imply a skills shortage ndash may indicate a poor image remuneration etc
Those currently in work do not have the requisite skills set to carry out their job to an optimum standard
Required skills are in short supply when compared with the demand across the whole labour market
Regardless of skills levels a situation exists where there is simply not enough supply of labour to meet demand
Pay conditions
Image
RECRUITMENT DIFFICULTY
SKILLSGAP
SKILLSSHORTAGE
LABOURSHORTAGE
Firms experience difficulty recruiting This does not necessary imply a skills shortage ndash may indicate a poor image remuneration etc
Those currently in work do not have the requisite skills set to carry out their job to an optimum standard
Required skills are in short supply when compared with the demand across the whole labour market
Regardless of skills levels a situation exists where there is simply not enough supply of labour to meet demand
Figure 4 Topology for identifying skills development priorities
Source AGRISETA SSP Annual Update August 2009
AgriSETA June 2010
Tier 2 Within each of the first tier groupings needs were further broken down and organised per target group At this second level needs were grouped by
o General skills development needs (cross‐cutting over different target groups) o Needs experienced by small scale farmers (this group included subsistence
farmers new emerging land reform beneficiaries and small‐scale AgriBEE farmers) o Needs within the commercial agricultural sector (per sub‐sector groupings where
specific needs for such were identified ndash both on‐farm needs and within the secondary sub‐sector or related agri‐businesses)
o Needs of the Department of Agriculture Fisheries and Forestry (DAFF) To further guide and direct the identification and selection of scarce and critical skills the following factors or criteria that could reflect the importance (impact and effect) of a skills shortages were developed as an identification framework
1 Basic Skills Development Promoting basic literacy and numeracy and raising the base level of education for the sector improving the work and livelihood of existing workers
2 Employability Making the employee more employable by improving the fit between their skills and the sector needs
3 Enterprise Viability Improving the capability and feasibility of the enterprise by increasing its effectiveness of or possibilities for profit generation etc
4 Enterprise Sustainability Allow enterprises to survive and grow over an extended period of time without compromising the value of renewable resources thereby creating long‐term meaningful employment for larger numbers of people
5 Sector Growth Enabling the sector to develop or pursue new opportunities or improve the effectiveness of current operations
6 Sector Competitiveness Enabling the sector to compete more effectively in the international arena improving market intelligence and interpretation productivity cost efficiency etc
7 Human Resource Development Capacity Improving the access to quality provision of training to the agri sector
Based on this research and consultation framework the following skills development needs and priorities were identified
Agriculture Sector Analysis 33
AgriSETA June 2010
GENERAL NEEDS SMALL‐SCALE FARMER
NEEDS COMMERCIAL SECTOR
NEEDS DAFF NEEDS
RECRUITMENT RELATED SKILLS NEEDS Primary agriculture is the entry point into the world of work for large numbers of people in rural areas However the sector has negative connotations amongst sections of the youth and in parts of the country and is viewed as a last resort for some in the search for employment) The effect is that despite an unemployment rate of approximately 26 (now over 30) farmers find it difficult to recruit workers to meet seasonal demands This has resulted in the government approving the contracting of foreign labour to meet such temporary needs (workers are recruited mainly from Zimbabwe and Mozambique)
Labour in this farming sector is provided primarily by family members and no real recruitment constraints can be identified
The agricultural sector still manages to attract technical and management skills as it is perceived to include a better lifestyle and there is a strong tradition of agriculture in SA Increasing crime related security risks associated with farming may have a negative impact
The Department has identified a number of occupations in which they are experiencing long‐term vacancies Some of these result from a general shortage of such skills in SA while others arise from the inability of the public sector to compete with the private sector (less favourable employment image working conditions and equity considerations) Priority vacancies include Veterinarians Agricultural
Engineers Plant Health
Specialists Agricultural
Statisticians Plant Health Pest Risk
Analysts ICT Specialists Agricultural
Economists Agricultural Food and
Quarantine Technicians
Agro‐meteorologists Pasture Scientists Plant Production
Specialists Specialised Food
Analysts SKILLS GAPS RELATED NEEDS
bull Low literacy and numeracy levels ndash both amongst workers within the sector at large and at ownermanager level in many of the small‐scale farming
bull Farm management
Farm Management (Mainly owners managers) bull Farm management amp
entrepreneurship bull Resource
management and record keeping
bull Financial planning
A critical constraint is the poor educational levels of a large proportion of the labour force in the sector demanding a considerable effort and investment in ABET and other life skills
A particularly big need exists for skills upgrading amongst Extension Officers ndash particularly with regard to redress the historical neglect of small‐scale farmers and resource strapped farmers
Agriculture Sector Analysis 34
AgriSETA June 2010
Agriculture Sector Analysis 35
GENERAL NEEDS SMALL‐SCALE FARMER
NEEDS COMMERCIAL SECTOR
NEEDS DAFF NEEDS
skills (and general management skills in other agricultural businesses) coupled with a business orientation and entrepreneurship skills
bull A general need to increase compliance with environmental occupational health and safety animal welfare produce safety and hygiene standards regulations and requirements (local and international standards)
and management bull Project management bull Business plan
development Marketing and processing bull Processing and
packaging bull Transport
management bull Marketing produce
including branding bull Planning for
marketing bull Knowledge of
markets Technical knowledge and skills bull Production
management (related to specific enterprise)
bull Demonstration of production techniques
bull Natural resources management
Mechanical knowledge bull Farm maintenance bull Repairs of machinery
and equipment bull Electrical
maintenance and installation
programmes Need for improved management skills and relevant technological knowledge for increasing productivity levels and improved production methods Rising importance for environmentally responsible production and processing management systems Rising competitive and international markets increases need for business and marketing abilities among owners and managers Increasing requirements for compliance with environmental health and safety and international trade standards Information technology although not a priority is increasing in importance Business management ability is becoming increasingly important as more farmers are making decisions about restructuring their businesses diversification and developing supplementary sources of income
Critically improved farm management and business skills within an agricultural context to support the majority of BEE and emerging farmers Skills upgrading requirements for existing Extension Officers include bull Agricultural
economics bull Agricultural
management bull Business and
financial management
bull Technical and production related skills including o Animal husbandryo Poultry o Crop production o Horticulture
SKILLS SHORTAGES Generally SA has a shortage of entrepreneurs and people who have the business acumen drive motivation and
The profile of these farmers reflects a large contingent of older and less educated people who are generally less flexible tend to stick to
The commercial agri sector will increasingly have to compete in the global market and the ever increasing need to increase productivity to
DAFF us experiencing problems are especially sourcing people in specialised science related fields (learning fields experiencing few
AgriSETA June 2010
Agriculture Sector Analysis 36
GENERAL NEEDS SMALL‐SCALE FARMER
NEEDS COMMERCIAL SECTOR
NEEDS DAFF NEEDS
perseverance to become a successful farmer Given the high risks involved in the agricultural sector (natural elements outside onersquos control) the agri sector does not compete successfully for this ldquoscarce resourcerdquo Moreover as with other professional and skilled occupations there is a tendency for younger qualified people to move to urban areas
known practices and are less likely to experiment with new technology Within this target group candidates with good entrepreneurial ability are scarce There is a perceived shortage of Agricultural Extensionists and advisors to assist this target group However a large pool of young unemployed graduates exists who could assist such emerging farmers if they were mobilised and made accessible to farmers Similarly the potential pool of retired commercial farmers who could serve as mentors to this target group
remain profitable and viable it can be stated that many of the existing farmers and managers owners lack business management and entrepreneurial orientation Equity policy and the need to become BEE compliant requires that commercial enterprises appoint and develop black owners directors managers Changing local and global consumer preferences require farmers to change traditional farming methods and practices Skills and knowledge requirements include bull Global food and
international quality standards
bull Product traceability requirements
bull Organic produce and products
Specific occupations identified as being in short supply are
bull Production Managers (food processing)
bull Product specialisation to international specifications (research skills)
bull Forklift drivers heavy vehicletruck drivers and mobile plant operators
bull Experienced and competent artisans (millwrights electricians fitters
enrolments andor pass rates at HET institutions with the result that too few qualified persons come onto the labour market) Examples of such skills shortages identified by the Department include Agricultural Engineers bull Plant Health
Specialists (Nematology Entomology Plant Pathology)
bull Statisticians (specialised agricultural knowledge)
bull Plant Health Pest Risk Analysts
bull Agricultural Economists (production and resource economists)
bull Agricultural Food and Quarantine Technicians
bull Agro‐meteorologists Early warning Specialists
bull Pasture Scientists bull Plant Production
Specialists (eg ornamental crops hydroponics)
bull Specialised Food Analysts (pesticide residue analysts processed food and dairy analysts wine and spirit analysts)
AgriSETA June 2010
Agriculture Sector Analysis 37
GENERAL NEEDS SMALL‐SCALE FARMER
NEEDS COMMERCIAL SECTOR
NEEDS DAFF NEEDS
and turners bull Agricultural
Equipment Technicians
bull Pest and weed controllers
bull Horticultural specialists
LABOUR SHORTAGES AND RELATED SKILLS NEEDS Given an employment rate of some 26 (2009 currently estimated at over 30expanded definition) per definition there cannot be a labour shortage It is however difficult for people who have never worked before to integrate into the agricultural sector workforce Coupled with an aging workforce (30‐60 being over 40) means that most agri enterprises will within the next 5‐10 years be looking at replacing a large proportion of their workforce There could be an insufficient pool of people willing and able to participate The impact of HIVAIDS is also not always factored in to understanding the diminishing pool of resources available Labour shortages have been reported within selected geographical areas and in particular occupations Examples include cane cutters in the sugar industry chicken catchers in the poultry industry pickers in the fruit industry and animal handlers in feedlots as well as dairy parlour workers It is however believed that these shortages may reflect a recruitment problem as a result of the very harsh working conditions and the relatively poor remuneration (which makes these occupations unpopular) At present such ldquoshortagesrdquo are addressed through contracting labour from neighbouring countries
AgriSETA WSP analyses
Skills demand in the commercial agricultural sector
Information for demand for skills from WSP data is available for 1 673 employers who submitted their WSPs for the 200910 period The table below shows data on sub‐sector WSP submission relative to size of the sub‐sector as well as subsector data from all registered organisations and those who submitted WSPs Data for registered employers shows that there were 239 076 employees employed by the 17 234 registered organisations As previously stated 97 898 employees were employed by the organisations submitting WSPs This constitutes 41 of employees employed by registered organisations
Table 20 Employment and sub‐sector data drawn from WSP analyses
Sub‐sector
All Re
gistered
Employers
Small employers (0‐49)
Med
ium and
large
employers (50+)
Total W
SPs received
Total W
SPs received
as of
all registered em
ployers
WSP
received med
ium and
large orgs
WSPs received
as of
med
ium amp large em
ployers
WSPs received
small
employers
WSPs received
as of small
enterprises
EmployeesPer
Profile
CoffeeTea 40 33 7 9 23 5 71 4 12 483 Fibre 1 710 1 676 34 34 2 22 65 12 07 6 539
AgriSETA June 2010
Agriculture Sector Analysis 38
Sub‐sector
All Re
gistered
Employers
Small employers (0‐49)
Med
ium and
large
employers (50+)
Total W
SPs received
Total W
SPs received
as of
all registered em
ployers
WSP
received med
ium and
large orgs
WSPs received
as of
med
ium amp large em
ployers
WSPs received
small
employers
WSPs received
as of small
enterprises
EmployeesPer
Profile
Fruit 371 277 94 162 44 76 81 86 31 27 873 Grain 648 581 67 77 12 48 72 29 5 22 129 Milling 335 279 56 61 18 35 63 26 9 4 630 Pest Control 213 209 4 8 4 2 50 6 3 119 Poultry 391 305 86 66 17 46 53 20 7 19 187 Primary 12 121 10 776 1 345 1144 9 513 38 631 6 136 034 Red meat 1107 1 018 89 70 6 45 51 25 2 7 475 Seed 167 149 18 24 14 13 72 11 7 2 127 Sugar 71 45 26 13 18 10 38 3 7 10 478 Tobacco 60 46 14 5 8 3 21 2 4 2 002
Totals 17 234 15 394 1 840 1 673 10 818 44 855 16 239 076
Source 1 AgriSETA WSP 2009 data
Only 10 of all registered employers submitted WSPs for the 200910 period Of these 49 were medium and large sized employers and 51 small However only 16 small employers submitted their WSPs relative to the number of registered small employers and 44 medium and large employers submitted WSPs relative to the number of registered medium and large employers As such skills demand statistics provides more representative data on the requirements of medium and large employers Data for skills demand in the commercial agricultural sector is based on data for permanent employees as well as casual and seasonal employees
Skills demand forecasting by AgriSETA
Forecasting for skills demand the AgriSETA has estimated that the demand for skilled employees at different levels in the next few years is 510 686 This is based on WSP data analyses over the last 5 years and projected demand for the formal commercial agricultural sector and factoring in the demand that at maximum would result from completion of the land restitution programme in South Africa The table below reflects the skills that are on demand as well as the estimates for demand over the next five years by major occupational category35
35 AgriSETA 2010
AgriSETA June 2010
Table 21 Demand for skills by occupational category
Major Occupation (OFO)Estimated Demand
Group Title1 Managers (commercial and small emerging farmers) 264 3702 Professionals 4 1413 Technicians and Trade workers 8 9255 Clerical and administrative workers 8006 Sales workers 4007 Machinery operators and drivers 5 8008 Elementary workers 226 250
Total 510 686Source AgriSETA WSP data and SSP demand forecasts
Research needs going forward
As has been set out in the sector analysis and the scenarios derived from that analysis the sector is faced by both significant and profound change and also great uncertainty It therefore follows that the task of focussing limited resources (basically levy income in the formal sector and NSF funds for the emergent farming sector) is difficult Whilst the general thrust of training remains broadly as described in the 2006‐10 SSP Updates some considerable work is required to achieve targeted effective interventions during the 2011‐2016 period The following research questions will need to be addressed in preparing the next SSP
bull In relation to the managers and owner‐managers of commercial farms and enterprises what skills are needed to enable them to help bring about the more optimistic scenario and manage the risks associated with the less optimistic ones
bull In terms of professional and technical competencies do the current education and training institutions coupled with the learning programmes available through the AgriSETA (learnerships skills programmes and the like) meet the needs of the sector
bull In the emerging agricultural sector do the current programmes funded by sources external to the AgriSETA (eg NSF) meet all the identified needs What gaps are there and how should they be addressed
bull In relation to governmentrsquos growth strategy and industrial action plans what skills are required for developing the aquaculture sub‐sector What programmes are available How can the SETA support the skills needs for this sub‐sector
bull Given the increasing levels of casual and contract labour how can skills be developed to meet the needs of the formal commercial sector and the emerging enterprise sector
bull How can the demand in each of the priority areas be quantified and agreement be reached on numbers of people to be trained
Agriculture Sector Analysis 39
AgriSETA June 2010
SECTION 3 Skills Gaps and scarce skills
Scarce skills at the DAFF
The level of scarce skills at DAFF can be determined by the vacancy rate While the average vacancy rate in the department as at 31 March 2009 was 17 there were some posts that had very high vacancy rates as reflected in the table below Indicating the possibility that the Department is experiencing difficulties in finding suitable candidates in the South African labour market to fill these posts
Table 22 Scarce skill occupations and vacancy rates (DAFF March 2009) Critical occupations Number of posts Posts filled Vacancy rate ()
Agricultural animal oceanography forestry and other sciences
167 119 287
Engineering sciences related 2 1 50Engineers and related professions 13 6 538Farming forestry advisors and farm managers 11 4 636Finance and economics related 73 53 274Horticulturists foresters agricultural and forestry technicians
350 221 369
Legal related 6 4 333Mechanical engineering technicians 3 2 333Risk management and security services 6 4 333Social sciences related 1 0 100Veterinarians 34 24 294
Source DAFF Annual Report 20082009
Skills are also scarce at senior management level The department also reports on difficulties it has filling senior management services vacancies with some of them staying vacant for up to twelve months because no suitable candidates can be found The department would then resort to re‐advertisement and head hunting This was the case with 22 of 18 SMS posts in March 2009
Scarce skills in the commercial sector
The following occupations have previously been projected as scarce (extremely hard to fill vacancies) by AgriSETA in the commercial agricultural sector over the next five years
Table 23 Scarce and critical skills in the commercial agricultural sector
Occupation Code
Group Occupation Critical Skills Intervention Comments
139903 Managers Laboratory Manager
Technology AI nutrition
HET
221101 Professionals Accountant (General)
General HET
221102 Professionals Management Accountant
Farm financial management
HET Focus on support advice to farmers new enterprises
222101 Professionals Commodities Trader
Export administration supply chain
FET Learnership Skills
Agriculture Sector Analysis 40
AgriSETA June 2010
Agriculture Sector Analysis 41
Occupation Code
Group Occupation Critical Skills Intervention Comments
management Programme
224301 Professionals Economist Agricultural HET
Mainly for Department of Agriculture and para statals commodity organisations
233101 Professionals Chemical Engineer
Chemical processes in food production
HET Industries such as sugar processing
233301 Professionals Electrical Engineer
Installation and maintenance
HET Processing industry
233401 Professionals Electronics Engineer
Computerised production prosesses
HET Processing industry
233501 Professionals Industrial Engineer
Productivity and efficiency
HET Processing industry
233904 Professionals
Instrument Engineer (Defence Force)
Installation and maintenance
HET
Not for defence ‐ sugar industry
233502 Professionals Mechanical Engineer
FETHET Equity reasons
233902 Professionals Agricultural Engineer
Farm layout and infrastructure
HET Mainly in Government
311101 Technicians and trades workers
Agricultural Technician
Installation and maintenance
FETHET
234102 Professionals Agricultural Scientist
Agri research HETFET Especially in horticulture
234201 Professionals Chemist HET Processing industry
234202 Professionals Food Technologist
Food safety HACCP
FETHET Across sector
234701 Professionals Veterinarian HET Mainly in Government
311101 Technicians and trades workers
Agricultural Technician
Farm infrastructure
FET Mainly needed in government
311401 Technicians and trades workers
Chemistry Technician
FETHET EE reasons
312907 Technicians and trades workers
Chemical Engineering Technician
FET Learnership
Mainly EE reasons
312402 Technicians and trades workers
Electronic Engineering Technician
Weak stream production infra
FETHET Mainly tobacco industry
233904 Professionals
Instrument Engineer (Defence Force)
Instrument technician
FET
Occupation needed Instrument Technician (not defence force) Mainly sugar processing sector
321202 Technicians and trades workers
Diesel Motor Mechanic
FET Learnership
To include tractor mechanic
321204 Technicians and trades workers
Small Engine Mechanic
Agricultural equipment
FET Learnership
Throughout sector
AgriSETA June 2010
Agriculture Sector Analysis 42
Occupation Code
Group Occupation Critical Skills Intervention Comments
322301 Technicians and trades workers
Metal Fabricator
Artisan FET Learnership
322303 Technicians and trades workers
Welder Welder (First Class)
Artisan FET Learnership
323203 Technicians and trades workers
Fitter‐Welder Artisan FET Learnership
Mainly sugar ndash multi‐skilled
323202 Technicians and trades workers
Fitter And Turner
Artisan FET Learnership
Tobacco and sugar
323501 Technicians and trades workers
Millwright Artisan FET Learnership
Wide‐spread need
341101 Technicians and trades workers
Electrician (General)
Artisan FET Learnership
Wide‐spread need
342101 Technicians and trades workers
Air‐Conditioning And Refrigeration Mechanic
Artisan FET Learnership
Sugar pack houses cold chain
Source AgriSETA Sector Skills Plans
Supply of skills
South Africarsquos agriculture skills are produced in high schools agricultural colleges FET colleges and Higher Education institutions In high school a large cohort of learners take Agricultural Science as a subject In 2003 there were 42 Agricultural High Schools offering Agricultural Science as a subject These students and those in high schools taking the subject could progress to taking agriculture as a focus area for further education In 2004 there were 10 FET colleges offering vocationally directed agricultural programmes These FET colleges offered complete qualifications and short courses Eleven Colleges of Agriculture can offer qualifications up to degree level and 19 universities offer qualifications in Agriculture ranging from agricultural economics animal and plant sciences and horticulture among others at under and post graduate levels (Department of Agriculture 2006) While long term planning of skilling of new entrants in the sector can be done through close consultation between the sector agricultural schools and colleges FET colleges and HET institutions so that they teach relevant skills there are other avenues for training for those who are already employed in the sector for example skills programmes and learnerships There are 15 registered qualifications for the primary agriculture sub sectors Currently AgriSETA has 94 registered learnerships that can address the skills needs of the identified scarce skills These are captured in Appendix 2 AgriSETA has approved accredited a number of training providers across the country to deliver the theoretical and practical components of these learnerships These include agricultural colleges FET colleges and private providers Currently the AgriSETA has 246 registered and approved providers distributed nationally as follows
AgriSETA June 2010
Table 29 AgriSETA approved training providers (2010) Province Number of providers
Gauteng 72
(29)
KwaZulu Natal 20
(8)
Limpopo 35
(14)
North West 30
(12)
Northern Cape 3
(1)
Free State 15
(6)
Mpumalanga 14
(6)
Western Cape 26
(11)
Eastern Cape 31
(13) Total 246
The providers are small to large organisations In primary agriculture small providers appear to offer the most training in rural areas and community projects (AgriSETA 2010) Most of the operating providers will be in FET colleges and agricultural colleges The AgriSETA is unable to meet the total demands for skills across the duality of their sector There seems to be fairness in the approval of training for both permanent and casual and seasonal workers In 200809 the AgriSETA approved 559 learnerships as follows
Table 30 AgriSETA learnerships approved for grant purposes (2008‐2009)
Source AgriSETA learnership data analysis
Agriculture Sector Analysis 43
AgriSETA June 2010
Agriculture Sector Analysis 44
Provision of skills programmes in the same year attracted grants for 2 706 employees
Table 31 Participation by learners in skills programmes in the AgriSETA (200809)
Source AgriSETA Skills programmes data analysis
AgriSETA June 2010
APPENDIX 1 Skills demand in the Department of Agriculture Forestry amp Fisheries (200809)
Source DAFF Annual Report 2008‐20009
Agriculture Sector Analysis 45
AgriSETA June 2010
Agriculture Sector Analysis 46
Appendix 2 AgriSETA registered learnerships Registered Learnership NQF Level SAQA Registration NoLearnership in Agri Sales and Service 4 22 Q 220001 20 178 4Learnership Agricultural Machinery Technician 2 22 Q 220007 20 160 2Learnership in Specialist Agricultural Machinery Technician 5 22 Q 220009 21 258 5Agri Trade Processes 2 22 Q 220013 30 125 2FETC Meat Examination Applying Basic Business Principles 4 30 Q 3000 2823 164 4Further Education and Training Certificate Seed Marketing Execute Seed Trials 4 22 Q 220025 21 126 4Further Education and Training Certificate Seed Research and Development Certify as Seed Unit 4 22 Q 220027 21 121 4FETC Seed Research and Development Conduct a Field Inspection of a Seed Unit 4 22 Q 220028 20 120 4Seed Research and Development Operations Operate in a Team 3 22 Q 220020 22 121 3Seed Research and Development Operations Apply Basic Business Principles 3 22 Q 220021 22 121 3National Certificate Seed Processing and Packaging Operate in a Team 3 22 Q 220026 21 123 3Sugar Industry Technical Maintenance worker 2 22 Q 220011 39 128 2National Certificate Sugar Manufacturing and Refining Technical Maintenance 3 30 Q300003 23 146 3Further Education and Training Certificate Manufacturing Technical MaintenanceProduce Components by Performing Engineering Turning Operations
4 30 Q 3000 1321 173 4
FETC Manufacturing Technical Maintenance Produce Components by Performing Milling Operations 4 30 Q 3000 1521 173 4 FETC Manufacturing Technical Maintenance Develop and Fabricate from Complex Drawing 4 30 Q 3000 1420 173 4National Certificate in Sugar Technology 5 22 Q 220036 22 140 5Further Education and Training Certificate Sugar Processing 4 22 Q 220035 31 144 4National Certificate in Sugar Technology Processing Sugar Refining 2 22 Q 220037 28 124 2National Certificate in Sugar Technology Processing Juice Preparation 2 22 Q 220038 28 124 2National Certificate in Sugar Technology Processing Crystallisation 2 22 Q 220039 27 122 2National Certificate in Sugar Technology Processing Laboratory Practice 2 22 Q 220040 25 124 2National Certificate in Sugar Technology Processing Extraction 2 22 Q 220041 28 122 2NC Rooibos Production Applying Basic Business Principles 2 30 Q 3000 2427 130 2 NC Rooibos Processing Applying Basic Business Principles 2 30 Q 3000 2224 123 2 National Certificate Cigarette Production 3 22 Q 220046 23 121 3
AgriSETA June 2010
REFERENCES AgriSETA 2010 AgriSETA 20082009 Annual report Pretoria AgriSETA Agricultural Research Council httpwwwarcagriczahomeasppid=272 Avert South African HIV and AIDS statistics Available on httpwwwavertorgsafricastatshtm Centre for Development Enterprise 2008 Land reform in South Africa Getting back on track CDE Research No 16 DAFF 2010 Quarterly economic review of the agriculture sector Pretoria DAFF DAFF 2009 Annual report 20082009 Pretoria DAFF Department of Agriculture 2008 Strategic plan 2008 Pretoria Department of Agriculture DTI An introduction to the South African economy Available on httpwwwthedtigovzapublicationsagroprocessinghtm Eastern Cape Provincial Government Eastern Cape Provincial Growth and Development Strategy 2004 ndash 2014 Economic Commission for Africa 2009 Developing African agriculture through regional value chains Addis Ababa Economic Commission for Africa Economic Report Free State Province 2005 Provincial Growth and Development Strategy 2005 ndash 2014 GCIS 2010 SA Yearbook 200910rdquo Agriculture forestry and fisheries Pretoria GCIS Greenberg S 2010 Status report on land and agricultural policy in South Africa 2010 Institute for Poverty Land and Agrarian Studies School of Government University of the Western Cape Research report Ingelozi Management Solutions 2008 HIVAIDS in the South African agricultural sector Towards the development of a long term intervention Research report KwaZulu Natal Provincial Government 2006 KwaZulu Natal Provincial Growth and Development Strategy Limpopo Provincial Government Growth and Development Strategy 2004 ndash 2014 Mhone G (2000) Enclavity and Constrained Labour Absorbtive Capacity in Southern African Countries Geneva International Labour Office Moyo S The Agrarian question and the developmental state in South Africa In Edigheji O et al 2010 Constructing a democratic developmental state in South Africa HSRC PRESS
Agriculture Sector Analysis 47
AgriSETA
Agriculture Sector Analysis
National Treasury Republic of South Africa 2010 National Budget 2010 ndash National Budget Review 2010 Pretoria National Treasury Northern Cape Provincial Government Agriculture and agro‐processing sector strategy North West Provincial Government North West Provincial Growth and Development Strategy 2004 ndash 2014 Province of the Western Cape 2008 The Ikapa growth and development strategy White Paper SABCOHA SA Business Coalition on HIV and AIDS wwwsabcohaorg SACAU httpwwwsacauorghostingsacauSacauWebnsfHomehtmOpenForm South African Government 2010 20102011 ndash 20122013 Industrial Policy Action Plan Republic of South Africa Statistics South Africa 2005 Census of commercial agriculture 2002 Report No 110201 Pretoria Statistics South Africa Statistics South Africa 2009 Census of commercial agriculture 2007 Statistical release P1101 Pretoria Statistics South Africa Statistics South Africa 2010 General household survey 2009 Statistical release P0318 Pretoria Statistics South Africa Statistics South Africa 2010 Gross domestic product first quarter 2010 Statistical release P0441 Pretoria Statistics South Africa Statistics South Africa 2010 Quarterly labour force survey Quarter 1 2010 Statistical release P0211 Pretoria Statistics South Africa Vink N amp van Rooyen J 2009 The economic performance of agriculture in South Africa since 1994 The implications for food security Pretoria DBSA development planning division working paper series No 17 Webster E 2004 the Dual Economy from a book by Van Holdt K and Webster E Work restructuring and the Crisis of Social reproduction and 10 years of restructuring post apartheid workplaces University of Natal Press Workinfocom httpwwwworkinfocomfreesub_for_legresdatalraempassoc3htm Xingwana L 2008 Challenges and Opportunities for Land and Agrarian Reform towards 2025 Speech delivered at the Agri‐Consultation Protea Ranch Hotel Polokwane 30 July 2008
- Table of contents
- SECTION 1 THE AGRICULTURAL LANDSCAPE
- 11 Size and shape of the Agricultural sector
-
- Overview
- Distribution of agricultural production
- The structure of the agriculture sector in South Africa
- Categories of farming enterprises
- Employment trends
- Employment categories and remuneration
- Stakeholders in the Agricultural sector
-
- National government departments
- Sector representatives
-
- 12 Factors impacting development in the Agriculture sector
-
- Future sector economic growth and development
-
- South African sector growth plans (IPAP2)
- International Trade
- Global recession and rise in food prices
-
- Land reform
- Reliance on imports
- Water
- The labour market
- Consumer trends
- HIVAIDS
- Farm safety and security
- Broad-based Black Economic Empowerment
-
- Conclusions and scenarios
- SECTION 2 DEMAND FOR SKILLS
-
- AgriSETA registered employers and employee coverage
- Employee coverage in the AgriSETA
-
- 21 Skills demand
-
- The National Education and Training Strategy for Agriculture (AET Strategy)
- AGRISETA sector skills planning demand data (2008-2009)
- AgriSETA WSP analyses
-
- Skills demand in the commercial agricultural sector
-
- Skills demand forecasting by AgriSETA
- Research needs going forward
-
- SECTION 3 Skills Gaps and scarce skills
-
- Scarce skills at the DAFF
- Scarce skills in the commercial sector
- Supply of skills
-
- APPENDIX 1 Skills demand in the Department of Agriculture Forestry amp Fisheries (200809)
- Appendix 2 AgriSETA registered learnerships
-
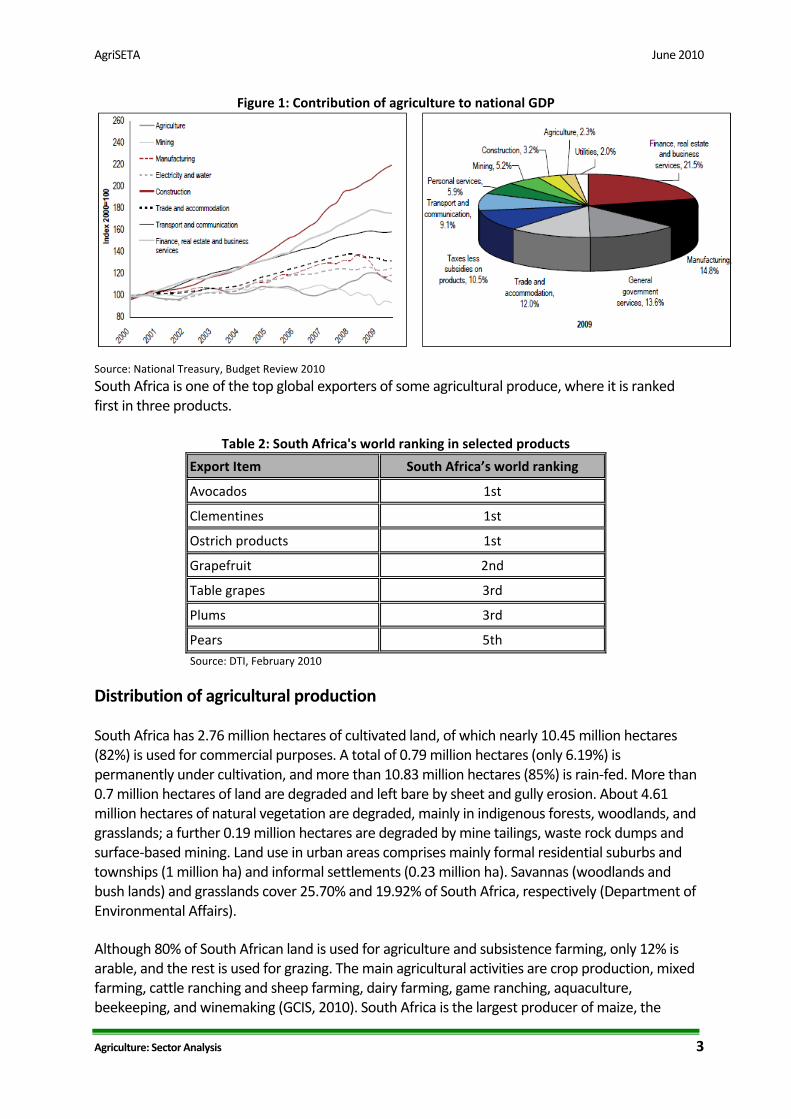
AgriSETA June 2010
staple food in the Southern African Development Community (SADC) as well as the main ingredient for animal feed The table below gives an indication of the geographic location of production of specific agricultural produce as well as the annual volume produced
Table 3 Volume of agricultural production by product and location Agricultural product Dominant production locations Average annual volume producedMaize North West Free State Mpumalanga 13 2 metric ton Wheat Western Cape Free State 21 metric ton Barley Western Cape 192 000 ton Groundnuts Free State North West Northern Cape 88 800 ton Sunflower seeds Free State North West Mpumalanga Limpopo 872 000 ton Soya beans Free State Mpumalanga KwaZulu Natal ‐ Sorghum Free State Mpumalanga Limpopo North West 255 000 ton Canola Western Cape North West Limpopo 30 800 ton
Dry beans Mpumalanga Free State Gauteng North West KZN Limpopo Western Cape Northern Cape
60 000 ton
Sugar Eastern Cape Mpumalanga KwaZulu Natal 20 metric ton
Deciduous fruit Western Cape Eastern Cape Free State Mpumalanga Gauteng
‐
Wine Western Cape 4033 million litres exported in 2009Citrus and subtropical fruit
Limpopo Mpumalanga Eastern Cape KwaZulu Natal Western Cape Northern Cape
46 896 ton subtropical fruit
Potatoes North West Northern Cape KwaZulu Natal Limpopo Free State Mpumalanga Eastern Cape Western Cape
1 853 000 ton
Tomatoes Limpopo Mpumalanga KwaZulu Natal Eastern Cape Western Cape
459 217 ton
Onions Mpumalanga Western Cape Free State 417 579 ton Cabbages Mpumalanga KwaZulu Natal 138 161 ton
Cotton Mpumalanga Limpopo Northern Cape KwaZulu Natal North West
‐
Tobacco Mpumalanga Limpopo North West 10 200 ton Tea Western Cape Eastern Cape ‐ Flowers Western Cape ‐ Livestock All provinces Largest agricultural sector
Dairy Free State North West KwaZulu Natal Eastern Cape Western Cape Mpumalanga
3 129 metric litres
Beef Cattle Eastern Cape Free State KwaZulu Natal Limpopo North West Mpumalanga Northern Cape
‐
Sheep and goats Eastern Cape Northern Cape Free State Western Cape Mpumalanga
‐
Poultry and pigs All provinces 930 000 ton broilers
26 million pigs slaughtered from August 2007 to August 2008
Fish Western Cape Eastern Cape ‐
Game Limpopo Northern Cape Eastern Cape Western Cape
‐
Beekeeping Western Cape KwaZulu Natal 2 000 ton Source GCIS SA Yearbook 200910
Agriculture plays an important part in provincial development and for most provinces provides a source of employment as well as being a potential focus for increased employment and sustainable livelihoods Agriculture therefore features as a key focus for economic development
Agriculture Sector Analysis 4
AgriSETA June 2010
Agriculture Sector Analysis 5
and growth in the all provinces Agricultural contribution to provincial GDP varies with the Free Statersquos agricultural sector contributing the most as reflected below
Table 4 Agriculture ‐ Contribution to Provincial GDP Province Percentage contribution to GDP
Free State 92 Limpopo 3 KwaZulu Natal 55 (2004) Western Cape 45 (2003) Mpumalanga 61
Source Provincial Growth Development Strategies
The provinces all have different focuses in their development strategies for agriculture although the underlying principle is the improvement of the lives of the people through employment creation in agriculture and provision of food security through investment in agricultural processes and technologies that enhance efficiency Free Statersquos focus on agriculture development is agriculture diversification and agribusiness Diversification involves identifying crops with a defined market in line with new and innovative agricultural practices Agribusiness extracts value from primary agriculture through processing of raw materials and provision of services to add value to produce6 The objectives of the Limpopo province with regards to agricultural development are tripling the size of agriculture by 2015 increasing the value of agriculture through enterprise diversification investing in water saving technologies and adding value within the agro‐value chain7 In the Eastern Cape two thirds of the population live in rural areas and the development of agriculture is a key factor in the development of the peoplersquos socio‐economic livelihood Development of agriculture will provide employment and an income to many families The focus of the growth and development strategy is to promote household food security through expanded smallholder production development of commercial agriculture through optimal use of agricultural land in the homelands focus on land redistribution and tenure and integration of homelands agriculture into mainstream provincial agricultural activity8 KwaZulu Natalrsquos focus on agriculture in the Growth Development Strategy is poverty alleviation as most areas of poverty in the province are rural The plan is to link up rural subsistence agricultural activity with commercial agriculture so as to develop subsistence agricultural projects into commercial ones The other focus is to link land reform projects to key provincial agrarian revolution programmes so as to make land transfer an economic growth opportunity The agrarian revolution strategy involves enabling access to markets farmer development through the set up of agri‐businesses improve road infrastructure to improve access to markets and expediting the land reform process9
6 Free State Growth Development Strategy 2004 ndash 2014 7 Limpopo Growth Development Strategy 2004 ndash 2014 8 Eastern Cape Growth Development Plan 2004 ‐ 2014 9 KZN Growth Development Strategy 2006
AgriSETA June 2010
Agriculture Sector Analysis 6
Northern Capersquos focus is the development of agro‐processing (Northern Cape Growth and Development Strategy) The North West is focusing on enabling access to markets and assisting financially in infrastructure development and machinery acquisition as well as investing in agro‐processing technology and skills as well as promoting efficient land use10 Agriculture holds employment growth potential in Mpumalanga province It accounts for 181 of provincial employment with forestry being the main agricultural activity in the province About 383 of the provincersquos land is used for forestry Agriculture is identified as a key focus area to achieve the strategic growth development strategy of providing a better life for all in the province through economic development Growth potential is through agricultural investment production and beneficiation so as to increase agriculture GDP contribution from 61 to 10 by the end of the 20082009 financial year Other strategic objectives are to increase sustainable employment in the agricultural sector from 18 to 20 by the end of 2015 improve food security by 50 by 2014 improve sustainability in agri‐business enterprises by 20 and increase participation of historically disadvantaged in agriculture to meet national Agri BEE targets (Mpumalanga Growth and Development Strategy 2004 ‐ 2014)
The structure of the agriculture sector in South Africa
The South African Agriculture Sector primarily based in rural and peri‐urban areas is characterised by a dual agricultural economy comprising well developed commercial farming with an established supply chain and small (subsistence) based production The General Household Survey of 2009 (Statistics South Africa) and the Census for commercial farms 2007 (Statistics South Africa) provide an insight into the size of the subsistence and commercial sectors Precise details in relation to non‐commercial and semi‐commercial farming are not available In 2009 207 of South African households were engaged in some form of agricultural production Table 1 reflects household agricultural production patterns in the provinces and shows that the largest proportions of households engaged in agriculture are in Limpopo Eastern Cape Free State and KwaZulu Natal
Table 5 South African households involved in agricultural activities by province (1000s)
Activity Province
Total WC EC NC FS KZN NW GP MP LP
Involved in agricultural production
39 643 35 274 697 108 248 205 580 2 832
27 373 114 319 268 114 71 211 434 207
Livestock production
312 22 26 230 34 27 21 99 778
175 485 621 96 330 310 107 104 171 275
Poultry production
349 11 35 256 23 22 11 146 853
18 543 310 129 367 211 90 51 251 301
Grains and food crops
389 21 316 34 31 128 465 1 390
27 605 122 78 454 315 125 625 801 491
Industrial crops 0 0 0 0
00 02 00 01 06 00 05 00 01 03
Fruit amp vegetable crops
30 220 232 330 40 175 141 173 1 350
759 342 252 847 473 368 705 688 298 477
10 North West Growth and Development Strategy
AgriSETA June 2010
Agriculture Sector Analysis 7
Activity Province
Total WC EC NC FS KZN NW GP MP LP
Fodder grazing pasture grass ndash animals
14 11 53
112 05 38 35 20 20 43 20 07 19
Forestry 0 10
12 01 05 21 01 00 04 04 02 04
Fish farming Aquaculture
0 0 0 0 0 0 0
15 01 00 00 00 00 00 00 00 00
Game farming 0 0 0 0
22 02 13 00 01 00 00 00 02 01
Other 0 0 0 0
00 02 00 03 04 03 03 00 00 02
Numbers smaller than 10 000 are too small for reliable estimates A particular household can be involved in more than one activity and percentages therefore do not add up to 100
Source Statistics South Africa ‐ General Household Survey 2009 (p318)
In 2007 there were 39 982 commercial farms11 in South Africa as opposed to the 45 818 registered in 2002 There has been a clear downward trend in the number of commercial farming enterprises which underscores the needs to grow the commercial agriculture sector to maintain South Africarsquos food sustainability potential and support interventions to develop skills across the agricultural sector especially for transformation and development of the small and emerging agricultural sector
Table 6 Commercial farming enterprises by province ‐ 2002 and 2007
Province 2002 2007 Growth Decline
Eastern Cape 4 376 3 896 ‐ 1097
Free State 8 531 7 515 ‐ 1191
Gauteng 2 206 2 378 780
KwaZulu‐Natal 4 038 3 560 ‐ 1184
Limpopo 2 915 2 657 ‐ 885
Mpumalanga 5 104 3 376 ‐ 3386
North West 5 349 4 692 ‐ 1228
Northern Cape 6 114 5 226 ‐ 1452
Western Cape 7 187 6 682 ‐ 703
Total 45 818 39 982 ‐ 1274
Source Statistics South Africa 2008
Whilst the largest proportions of households involved in agriculture are in Limpopo Free State Eastern Cape and KZN (Table 1) it is in the Free State Western Cape Northern Cape and North‐West provinces where the largest number of commercial farms are located (Table 2) No direct
11 Commercial farms are farming enterprises that are registered with SARS for Value Added Tax (VAT) and income tax
AgriSETA June 2010
relationship can thus be drawn between the numbers of households engaged in agriculture in a province and the numbers of commercial agricultural enterprises AgriSETA WSP data analysis reveals no direct relationship between the number of employers in a province and the number of formally employed persons
Categories of farming enterprises
ldquoDualismrdquo (Mhone 2000) is a useful way of describing the agricultural sector both in terms of understanding the economics of the sector and planning skills development interventions This term describes a formal sector that is well established and an informal or emergent sector with the two sectors reliant on each other and on interventions by the state for integration However these two broad categories have their limitations Within the commercial sector there are large established farming businesses and smaller ones that struggle to survive and within the less formal sector there are emergent farmers striving to achieve commercial success It is necessary therefore to understand the agricultural sector as comprising a number of different economic entities all operating within the same dualistic economic framework The following typology for the agricultural sector reflects the complexity of the agricultural sector
Table 7 Typology of the agricultural sector
Production Unit Turnover Ownership amp Management Number Binding constraint
Support required
Large commercial on private property
gtR2 million
Family owned but incorporated multiple farms Rent in land ndash professional management
plusmn5 400 Market size Equity capital
Export market access Financial market innovation
Medium commercial on private property
R300 000 to R2 million
Family owned could be incorporated Some renting in of land ndash family management
17000 Land capital management
Mortgage capital for land access Management training
Small commercial on private property
ltR300 000 Family owned generally part time Some lifestyle farming (game ranches weekend farms)
24 000 Management time
Commercial in communal areas
gtR300 000 Communal ownership Development projects Private ownership
‐ Capital management infrastructure
Grants for land access Property rights Comprehensive farmer support Credit Physical infrastructure
ldquoEmergingrdquo commercial in communal areas
ltR300 000
gt20 hectares Communal ownership Small farmers in development projects Private ownership
35 000
Land (property rights) Capital labour management Employment opportunities
Grants for land access Property rights Comprehensive farmer support Physical infrastructure Institutional infrastructure
Subsistence farmer in communal areas Allotments Market gardens
lt20 hectares Communal ownership Private ownership Little formal market participation
1256m Employment opportunities
Social welfare transfers
Source Vink and van Rooyen 2009
This confirms the dualism evident from Stats SA data It includes an estimate for emergent farms and provides insight into the different types of farming enterprises Being small and part time can mean subsistence farming but it can also mean running a game farm on a part‐time basis There is considerable scope for farming enterprise to move from being commercial to subsistence and vice versa There is some evidence that there is currently an increase in volatility with quite
Agriculture Sector Analysis 8
AgriSETA June 2010
significant changes occurring mainly due to the global economic down turn and the small margins that many agricultural enterprises operate within It is particularly important to have an understanding of the category of ldquoemergingrdquo farmers those who may be striving to move from subsistence farming to a more commercial model those who have benefited from land reform processes and want to establish an agricultural enterprise on the land that has been allocated to them those who have made use of BEE funding to acquire a stake in a farm and are trying to achieve profitability The emerging farmer sector is neither established commercial farming nor subsistence in nature and is the focus of many of the governmentrsquos efforts to achieve transformation within the sector as a whole
Employment trends
Employee numbers is a more important measure of ldquosizerdquo for the purpose of the SETA and skills planning even though turnover may be more important in terms of economic impact or contribution to GDP The cause of this discrepancy between turnover or GDP contribution on the one hand and formal employment numbers on the other is discussed extensively by Mhone (2000) and others such as Webster (2004) Labour absorption levels in an enclave (second) economy are not optimal One conclusion that can be drawn from this is that skills development will need to be linked to other changes within the sector if it is to contribute meaningfully to job creation Mechanisms need to be found that link growth to jobs and this is not strictly something that the SETA can address However it is important to link skills planning to other processes and opportunities for these will be examined as part of the environmental scan later in this section The past few years have seen huge depreciation in employment levels and a very high unemployment rate ndash currently estimated at 311 The agricultural sector has also witnessed a decline in sector employment largely linked to contraction of the sector The sector is characterised by the need for highly skilled and qualified farm managers and technical staff on the one hand and large numbers of unskilled and semi‐skilled workers on the other Many managers of emerging farms are mainly untrained and unqualified Agriculture relies more on semi skilled labour than other services as reflected in the table below The sector also relies on migrant casual and seasonal labour Table 8 Percentage unskilled to semi‐skilled labour by DTI industry (economic sector) classification
Sector 1995 2008 Growth decline in
skilled labour
Agriculture 990 941 49
Mining 920 879 45
Manufacturing 870 821 56
Utilities 800 688 140
Construction 900 883 19
Trade 840 842 ‐ 02
Transport and Communication 730 768 ‐ 52
Finance 620 595 40
Community and personal services 540 498 78
Total 782 738 56 Source National Treasury 2010
Agriculture Sector Analysis 9
AgriSETA June 2010
Agriculture Sector Analysis 10
Employment in the sector is based on those who work in administration in DAFF and those who work in production and processing at farms and in factories In March 2009 DAFF had 3 285 posts with 2 735 of these filled The table below shows the employment profile at DAFF by occupation race gender and disability as at 31 March 2009 The department employed 57 male employees and 43 female employees There were more African employees constituting 69 of the entire department workforce Very little progress has been made regarding the employment of people with disabilities who constitute only 04 of the workforce This is in line with other department across government where similarly little progress has been made
Table 9 Employee profile ‐ Department of Agriculture Forestry and Fisheries Occupational Category (SASCO)
African Coloured Indian White Totals
M F M F M F M F M F Total
Legislators senior officials managers
15 14 2 2 8 3 25 19 44 16
Professionals 239 241 11 12 4 14 70 64 324 331 655 240
Technicians associate prof
190 153 38 19 9 4 86 57 323 233 556 204
Clerks 93 204 22 42 0 7 13 171 128 424 552 30
Service and sales workers
38 19 4 2 1 17 1 60 22 82 30
Craft and related trades workers
42 3 13 58 0 58 21
Plant machine operators and assemblers
53 1 8 1 62 1 63 23
Elementary occupations
484 96 94 28 1 6 5 585 129 714 262
Totals 1 154 728 182 105 15 25 214 301 1 565 1 159 2 724
Percentage 424 267 67 39 06 09 79 110 575 425 100
People with disabilities
1 1 1 2 6 4 7 11 04
Race 1 882 287 40 515 Percentage 691 105 15 189 Source Dept of Agriculture Forestry and Fisheries (2010)
In respect of occupations and skills profiles the majority of the Departmentrsquos employees are Professionals and Technicians Associate Professionals (444) followed by people employed in elementary occupations (262) Employment across the agricultural sector is subject to growth and decline variations related to a wide range of conditions and circumstances ndash produce prices climate and environmental changes mechanisation technology and the like Since 2002 the trend has been downwards There are a number of reasons for this including mechanisation and casualisation of labour on larger farms the economic downturn impacting on some sub‐sectors and the global trade situation including changes in the foreign exchange rates and the failure of successive DOHA development talks to address inequalities in access to global agricultural markets12 12 The Doha Development Round is the trade‐negotiation of the World Trade Organization (WTO) Its objective is to lower trade barriers globally Talks have stalled over a divide on major issues such as agriculture industrial tariffs and non‐tariff barriers services and trade remedies The most significant differences are between developed nations led
AgriSETA June 2010
Agriculture Sector Analysis 11
It is anticipated that growth of the agricultural sector to meet local consumer demand government initiatives to expand agricultural niche export markets and the development of an aquaculture sub‐sector to counter depletion of natural resources is likely to lead to creation of employment in the sector
Table 10 Workforce changes in the Agricultural sector ‐ 2001 to 2010
Year Workers Year on year difference Variation 2001 969 0002002 1 153 000 + 184 000 1602003 808 000 ‐ 345 000 ‐ 4272004 828 000 + 20 000 242005 778 000 ‐ 50 000 ‐ 642006 886 000 + 108 000 1222007 703 000 ‐ 183 000 ‐ 2602008 764 000 + 61 000 802009 615 000 ‐ 149 000 ‐ 2422010 650 000 + 35 000 54
Quarter 1
Source Statistics South Africa Survey (pp 210‐211)
Employment categories and remuneration
It is difficult to get detailed and accurate yearly statistics on employment by type (full‐time casual and seasonal employees) or on remuneration in the agricultural sector The latest available statistics on commercial agriculture are found in the 2007 Stats SA Census of Commercial Agriculture The following tables reflect survey data on the number of permanent casual and seasonal agricultural sector employees by province as well as total remuneration per province
Table 11 Number of paid full‐time agricultural workers and total remuneration by province
Province 2002 2007 Growth Decline
Number Remuneration
R000s Number
Remuneration R000s
Number Remuneration
Eastern Cape 33 718 329 351 34 253 510 404 16 550Free State 57 607 580 888 53 944 737 796 ‐64 270Gauteng 20 815 344 629 22 979 534 083 104 550KwaZulu‐Natal 75 799 763 439 66 685 968 455 ‐120 269Limpopo 62 635 525 390 35 728 625 436 ‐430 190Mpumalanga 61 603 599 617 46 520 853 396 ‐245 423North West 39 914 409 526 53 741 574 596 346 403Northern Cape 31 077 320 598 26 871 339 948 ‐135 60Western Cape 98 207 1 378 816 90 943 2 029 275 ‐74 472Totals 481 375 5252251 431 664 7 173 389 ‐103 366
Source Statistics South Africa Report 120201 (p1101)
by EU USA and Japan and the major developing countries led and represented by India Brazil China and South Africa Considerable contestation exists over the maintenance of agricultural subsidies operating as trade barriers
AgriSETA June 2010
Agriculture Sector Analysis 12
Table 12 Number of paid casual amp seasonal agricultural workers amp total remuneration by province
Province 2002 2007 Variance
Number Remuneration
R000s Number
Remuneration R000s
Number Remuneration
Eastern Cape 30 936 59 680 30 565 106 497 ‐12 784Free State 57 871 69 595 45 150 98 996 ‐220 422Gauteng 8 722 20 975 11 957 93 461 371 3456KwaZulu‐Natal 37 602 103 946 34 383 154 286 ‐86 484Limpopo 38 614 107 223 31 833 124 159 ‐176 158Mpumalanga 46 480 86 242 32 826 176 363 ‐294 1045North West 46 078 62 653 32 008 75 250 ‐305 201Northern Cape 68 174 121 613 47 874 123 723 ‐298 17Western Cape 124 968 331 406 98 546 485 108 ‐211 464Totals 459 445 963 331 365 142 1 437 843 ‐205 493
Source Statistics South Africa Report 120201 (p1101)
The tables above reflect that the Western Cape was the biggest employer of labour on commercial farms in 2007 with a majority of the employees being casual and seasonal The Eastern Cape employed the least number of commercial farm employees The comparator figures for 2002 and 2007 would appear to show a continuous country wide reduction in employment both in permanent employees and casual and seasonal workers The exception is the North West that has experienced an increase in full time employees The current minimum wage for farm workers (February 2010) is R1 31669 per month13 Monthly salaries differ across sub‐sectors with highest paid workers in primary production in the fisheries and dairy sub‐sectors
Table 13 Approximate monthly wage rates in Agriculture for selected sub‐sectors
Subsector Primary Production ProcessingPack house
Meat R 2000
Dairy ‐ R 2650
Wines R 1100 R 1400
Flowers R 800 R 1200
Fisheries R 5000
(crewman)R 1892
Source DTI 201014
Vink amp van Rooyen (2009) indicate that before the introduction of minimum wage in 2003 the real cash remuneration for employees had been increasing However over time the unit cost of labour (the ratio of the total cost of labour to the total value of output) has been in decline including a steep drop during and after the introduction of minimum wages
13 Department of Labour 2010 14 Source DTI (Data sourced from SAMIC Dairy Industry JAG WOSA SAFEC SA Pelagic Fish Industry Association)
AgriSETA June 2010
Agriculture Sector Analysis 13
In 1970 for every R1 of output 16 cents was spent on labour By 1980 this has dropped to 13 cents for R1 of output By 1994 the figure had increased to 19 cents declining to 17 cents in 1998 and to 117 cents in 2001 By 2007 it had reduced to 108 cents Further research will be needed to establish the current situation but there is reason to believe that the decline has continued with wages being very low both in terms of unit costs and in relation to other groups of workers in the economy
Strictly speaking it is not the role of the SETA to engage in the complex regulatory framework for the agricultural labour market It is for the Department of Labour and NEDLAC with their employer and organised labour stakeholders to find ways of balancing the need for protection of vulnerable workers with the need to create a framework that encourages the creation of jobs and improved job security The reason that more research is needed in this area and in particular detailed discussions with industry and labour representatives is to establish
The extent to which skills development interventions can improve the prospects for job creation and improved job security and
The mechanisms that can be established to enable uninterrupted skills training in the context of casualisation and use of contract and seasonal labour
Stakeholders in the Agricultural sector
National government departments
There are a number of national government Departments and spheres involved in the challenges of the agricultural sector The following table sets out the broad contribution that each department is intended to make
Table 14 Government department roles in relation to Agriculture Department Role
Department of Agriculture Forestry and Fisheries Agricultural policy and support Department of Rural Development and Land Reform Land Reform and land claims settlements Department of Economic Development Economic planning National Treasury Macro economic policy Department of Trade and Industry Industrial strategy (IPAP 2) Department of Water Affairs The management of water supply Department of Labour Labour market policy Department of Higher Education and Training HRD and skills planning and SETAs In relation to public spending on agriculture the agricultural national budget constitutes about 05 of the national budget The figure below reflects trends in national budgeting for the agricultural sector between 19967 and 201112 Some analysts15 have argued that state expenditure on agriculture shows lack of prioritisation of the sector especially considering that the budget remains lower than it was in the late 1980s when it now caters for a greater number of farmers than it did during apartheid segregation
15 Greenberg 2010 p 2
AgriSETA June 2010
Figure 2 National budgets for Agriculture 1996‐2011 (adjusted for inflation)
Source Greenberg 2010
The Department of Agriculture Forestry and Fisheries (DAFF) is responsible for the agricultural sector The department works with various organisations to promote the interests of the sector
bull It registers all South African Pest Control Association (SAPCA) qualified inspectors bull It works with the Agricultural Research Council for research to optimise the control of
migratory pests bull The Directorate on Marketing works with the National Agricultural Marketing Council
(NAMC) on issues related to equitable access to markets including policy formulation issuing of permits and coordinating inter‐departmental relations to enhance marketing
bull Historically the Department has employed a large number of extension officers located in farming communities who have supported and advised farmers This service has been in decline in recent years but remains an important aspect of state support to the sector
The above roles will be subject to some review in the context of IPAP 2 and also the debates around the role of the state in the economy The issue is not only levels of spending but also clarifying the role of government in relation to the business of the sector
Sector representatives
There are three major umbrella organisations representing the interests of farmers AgriSA TLUSA and the National African Farmers Union of South Africa (NAFU) AgriSA and TLUSA represents both commercial farmers and cooperativesrsquo interests through its engagement at national and international level AgriSA is a member of the Southern African Confederation of Agricultural Unions (SACAU) a regional farmersrsquo union for farmers in Southern Africa AgriSA has structures in all the provinces except Limpopo
Agriculture Sector Analysis 14
AgriSETA June 2010
Agriculture Sector Analysis 15
NAFU is a union for predominantly previously historically disadvantaged smallholder farmers with a membership base including farmers agribusinesses farmersrsquo organisations corporations and individuals who support their goals NAFU is represented by different unions in all the provinces There are other employer organisations who are not affiliated to AgriSA and NAFU including
bull Agricultural Industrial and Medium Employers Organisation bull Agricultural Mining and Industrial Chemical Manufacturersrsquo Association bull Agrilabor Employersrsquo Organisation bull Algoa Meat Traders Association bull East Coast Poultry Producers Employersrsquo Association bull East London and District Meat Traders Association bull Fertiliser Industry Employersrsquo Organisation bull Landbou Werkgewersorganisasie (Workinfocom) bull Red Meat Producersrsquo Association
The Agricultural Research Council is an autonomous statutory body that provides research to DAFF and the provincial departments of agriculture Figures available for South Africarsquos investment in agriculture research and development show that South Africa was above international norms of investment in RampD which are 053 of agricultural GDP for developing countries and 236 for developed countries In South Africa in 2000 agricultural RampD investment in relation to agricultural GDP was 30416 There are six major sources of credit for farmers banks (50) agricultural cooperatives and agribusiness (12) the Land Bank (21) private creditors (8) other creditors and financial institutions (9) and government (1) (GCIS 2010)
12 Factors impacting development in the Agriculture sector Several international and local factors impact on the productivity of the agricultural sector and its growth Key amongst these are
Growth of the South African economy and rising consumer demand International trade and trade agreements The global recession and rise in food prices The land reform programme Reliance on imports Water availability Changing consumer patterns and demands (eg organic food stuffs) Technological changes and mechanisms Quality standards Farm safety and security Broad‐based black economic empowerment Legislation Skills demand and supply HIVAIDS
16 Vink amp van Rooyen 2009
AgriSETA June 2010
These key factors are clustered and discussed below
Future sector economic growth and development
South African sector growth plans (IPAP2)
The 20102011 ndash 20122013 Industrial Policy Action Plan (IPAP) identifies five structural challenges that existed in the South African economy before the global economic downturn and which have been exacerbated by the recent economic crisis These challenges were evident even during the time South Africa was experiencing relatively high growth rates between 2005 and 2007 and have continued during the recession These challenges are
1 Structural imbalances in the growth path including growth that is lagging behind other medium and low income countries
2 Uneven performance of the manufacturing sector with some divisions like the automotive sector experiencing exponential growth while other sectors have stagnated
3 Employment growth being sustained by credit extension and consumption rather than by productive sectors leading to a large current account deficit
4 Low profitability of manufacturing 5 Low savings and investment from financial sector growth Only 52 of private credit was
extended to fixed investment in 2008 Key sectors have been identified for IPAPrsquos focus including agro‐processing which has a diverse group of industries and sub‐sectors including food processing beverages aquaculture horticulture medicinal aromatic and flavourants Key action plans for the agro‐processing sector are identified in IPAP2 as
Development of a National Food Control Agency to consolidate the sector Development of aquaculture to supplement dwindling wild fish stocks Designating specific areas for utilisation of aquaculture Development of the organic food sector Development of the small milling industry Enhancing competitiveness in fruit and vegetable canning Improving beneficiation of Rooibos and Honeybush products (IPAP2 2010)
International Trade
South Africa is a major exporter of Agricultural produce In particular South African fruit and fruit‐derived products such as wine and fruit juice are competitive in the global market However in many sub‐sectors where export potential exists ndash grain and meat ndash serious problems face the industry A key challenge is the uneven playing field experienced by South African exporters Major global competitors include the United States and the countries of the European Union where government subsidies in various forms are in place No such subsidies are in place in South Africa making it difficult if not impossible for South African agricultural produces to enter developed country markets due to the prices that they have to ask for products I In addition the value of the Rand has fluctuated from levels of around R10 to the US dollar to as little as R7 to the dollar When the Rand is strong export becomes difficult because it costs more in the case of the move from R10 to R7 a 30 cost increase for the importer It is impossible to
Agriculture Sector Analysis 16
AgriSETA June 2010
Agriculture Sector Analysis 17
predict whether the World Trade Organisation negotiations known as the DOHA Round will achieve progress in the coming years Historical evidence is that during periods of global recession developed economies become more protective not less and so the current outlook is not good Nor is it possible to predict the value of the Rand though current thinking in government is to move toward a weaker Rand to encourage exports These are two key variables that will need to be factored into the different sector growth scenarios for the future
Global recession and rise in food prices
Economic growth slowed down significantly in sub Saharan Africa and in South Africa in 2009 but there appear to be signs of recovery GDP growth in the region declined from about 6 in 2004 ndash 2008 to about 18 in 200910 GDP growth in South Africa was 16 in 2009 17and rose to 46 in the first quarter of 201018 though much of this is related to the income derived from the 2010 FIFA World Cup and may not be sustained Projections are generally for a slow revival with a set back after the slight rise resulting from the World Cup A return to the 6 levels of the 20078 could take some years The global recession reduced the demand for African exports and reduced capital flows to the region but it is anticipated that the demand for mineral resources by Asian and Western powers will result in both the expansion of exports and expanded foreign direct investment The competition between India and China for African markets is also expected to boost trade to the benefit of African suppliers South Africa is expected to particularly benefit from direct foreign investment from China and India China has already become South Africarsquos largest market for exports and supplier of imports19 Rising food prices have forced governments around the world to control prices of maize bread rice and dairy products In South Africa ldquofood price inflation between December 2005 and December 2006 averaged 788 rdquo20 Although efforts are being made to reduce barriers to poorer families in relation to basic food there has been no move to subsidise food generally This may change though the space for significant levels of support is restricted because of reduced revenue from income taxes resulting from the recession The global credit crunch and recession have meant a reduction in public expenditure and funding which has affected the agricultural sector21
Land reform
In South Africa specifically land reform has a significant bearing on food security and agriculturersquos contribution to GDP The objective of the land reform programme is to transfer 30 of agricultural land to black ownership by 2014 (deferred to 2025) to ensure more equitable access to land by historically disadvantaged people and to increase their participation in agricultural activities22 Land reform has been informed by four processes23
17 Department of Agriculture Forestry and Fisheries 2010 18 Stats SA 2010 19 Department of Agriculture Forestry and Fisheries 2010 20 Department of Agriculture Forestry and Fisheries 2010 ‐2011 Strategic Plan 21 Economic Commission for Africa 2009 22 Xingwana 2008 23 CDE 2008
AgriSETA June 2010
Agriculture Sector Analysis 18
Land restitution involving returning land or providing financial compensation to those whose land was dispossessed during apartheid
Land redistribution transferring more land to the historically disadvantaged Tenure reform modernising land tenure rules and access to land ownership and Providing financial support for the development of emerging farmers
In relation to progress with land reform by September 2009 only 69 of agricultural land (about 567 million hectares) had been transferred and a majority of the beneficiaries have not yet occupied the land due to lack of infrastructure input or technical support The following table gives an indication of the progress of land reform since the inception of the first democratic government
Table 14 Land transfers and beneficiaries ‐ 1994 to 2009
Province Redistribution and tenure Restitution Total Hectares Beneficiaries Claims Hectares Beneficiaries Hectares Beneficiaries
Eastern Cape 675 353 357 25 633 16 201 94 834 215 201 448 191 240 834
Free State 799 350 291 7 721 2 662 47 615 40 893 397 906 48 614
Gauteng 286 34 513 7 328 13 159 9 476 70 179 43 989 77 507
KwaZulu Natal 690 547 414 67 761 14 752 642 447 433 168 1 189 861 500 929
Limpopo 291 91 235 7 403 3 382 513 024 220 227 604 259 227 630
Mpumalanga 444 322 839 13 950 2 694 399 876 225 877 722 715 239 827
Northern Cape 271 952 744 2 773 3 682 539 620 100 554 1 492 364 103 327
North West 300 268 566 40 539 3 709 373 642 172 963 642 208 213 502
Western Cape 223 122 304 12 750 15 546 3 769 118 165 126 073 130 915
Total 3 979 3 043 264 185 858 75 787 2 624 303 1 597 227 5 667 567 1 783 085
Source Greenberg 2010
Achievement of the 30 land reform target is being made difficult by land prices Under the willing buyer willing seller scheme the government will need R74 billion to be able to purchase enough land While resources may be available there are suggestions of lack of capacity The Department of Rural Development and Land Reform (DRDLR) was able to spend only 31 of its land reform 200910 budget in the first six months of the financial year Going forward this Department needs to identify what the real challenges are with the pace of land reform delivery so that they can be mitigated to meet the 2025 target A priority is the retention of skills skills transfer and skills development during the transfer of land as well as retention of national food production to avoid loss of production Support for new beneficiaries of land to ensure sustained productivity is derived from two main sources of funding ndash the Broadening Access to Agriculture Thrust (BADAT) and the Comprehensive Agricultural Support Programme (CASP) CASP is a conditional grant from the Department of Agriculture Forestry and Fisheries to provincial departments to support emerging farmer development Provincial farming budgets dedicated for farmer support in Mpumalanga the Free State Northern Cape and the Western Cape have risen significantly and those in KwaZulu Natal and Gauteng have witnessed a slight increase Eastern Cape and Limpopo agricultural budgets have been steady The North West is the only province where there has been a sharp decline in the share of the budget dedicated to farmer support24
24 Greenberg 2010
AgriSETA June 2010
Agriculture Sector Analysis 19
Reliance on imports
Overall the Agriculture sector contributes positively to the balance of payments ldquoSouth Africa remains food secure The value of our exports increased by 464 from R33 656 million in 200708 to R49 278 million in 200809 During the same period the estimated value of imports rose by 12 from R34 009 million to R38 401 million resulting in a positive trade balancerdquo25
South Africa depends largely on world markets for seed production and agrochemicals Regarding seed production there are only three community seed production schemes in Limpopo and Mpumalanga being piloted with state funding Ten top large companies including two South African companies and multinationals have rights to over two thirds of registered seed varieties in South Africa Despite the dominance of genetically modified and hybrid seed in some sub‐sectors like maize sunflower and sorghum open‐pollinated varieties have been resilient in South Africa enabling the possibility of alternative seed sources not dependent on technological processes26 In relation to agrochemicals deregulation and liberalisation in the fertiliser sector led to the shutdown of local production capacity and South Africa became an importer of fertiliser for the first time in 2000 There are three large players in the fertiliser sector Sasol Nitro Yara and Omnia South Africa imports an estimated 70 of fertilisers and pesticides Fertiliser prices rose by over 200 between 2006 and 2008 but dropped somewhat after that However this hike signified the volatility of the agrochemicals industry and South Africarsquos dependency on imports and the potential risk for emerging farmers and food production of this dependence on imports as the country cannot control the prices making inputs both difficult to budget for and in many cases unaffordable The price of agrochemicals is also particularly influenced by the prices of oil and the exchange rate The general understanding in relation to job creation is that a weaker Rand will improve exports and therefore enable job creation Of course the down side of this strategy is that imports become more expensive So what may be an advantage for those sub‐sectors who are expanding their export volumes those relying on imported agro chemicals will be under increased pressure
Water
Water is both an essential and scarce resource for the agriculture sector and is being threatened by climate changes Crop production relies heavily on water and yet access to water is not being addressed in a systematic way in the land reform processes Greenberg suggests that the relationship between land reform agricultural support and water resource provision is inadequate and a way to address this could be established by linking water provision to land transfer or investing in irrigation for both commercial and resource‐poor farmers However investing in irrigation in the context of water scarcity and climate change may not be the best option What could be needed is finding ways to maximise efficiency of the 60 of South African
25 Department of Agriculture Forestry and Fisheries Strategic Plan 201011 26 Greenberg 2010
AgriSETA June 2010
Agriculture Sector Analysis 20
water used for irrigation by for example using methods such as drip or micro‐irrigation which are expensive to set up but which reduce water wastage by 5‐1027 The Department of Water Affairs is responsible for managing water supply and has to give authorisation for agricultural projects and other developments The department needs to be seen as an important stakeholder in the agricultural sector
The labour market
South Africa recorded an unemployment rate of 243 in 2009 (narrow definition) If people who are no longer actively seeking work are considered the broad unemployment rate rose from 267 to 313 illustrated in the figure below As a direct consequence of the global economic downturn in 2008 870 000 formal jobs were lost in 200928 Others have quoted a figure of over 1 million
Figure 3 Official unemployment in South Africa 2003 ‐2009
Source National Treasury 2010
Annual employment loss followed sector growth patterns with agriculture mining manufacturing and trade facing the highest job losses as their sector growth contracted Unemployment is especially a major problem among lower skilled workers and younger people Youth employment in the 15 ‐24 year age group has fallen by 219 000 (136) and 483 of people in this age group are unemployed Employment of semi‐skilled and unskilled workers has contracted by 527 000 and male employment has gone down by 550 000 (71) while that of women has decreased by 320 000 (52) The number of discouraged workers ie those no longer actively seeking work has increased from 518 000 to 17 million29 Clearly the existence of a very large pool of largely unskilled unemployed workers has an impact on the farming sector It drives wages down and creates opportunities for casualisation and the expansion of labour contract agencies and brokers In addition there are significant numbers of foreign nationals mainly from Zimbabwe and Mozambique who are seeking work and often finding it on farms and in primary processing and packaging plants There are benefits to the
27 Greenberg 2010 28 National Treasury 2010 29 National Treasury 2010
AgriSETA June 2010
Agriculture Sector Analysis 21
sector with skilled and semi‐skilled workers coming into the labour market and being absorbed into the workforce and helping raise productivity levels However at the lower skilled end of the market the existence of this pool brings further casualisation and downward pressure on wages Tensions are likely to increase and further protests either in the form of xenophobic outbreaks or actions against farmers may well increase A view often expressed by farm employers is that current labour legislation makes dismissing workers difficult and so the availability of labour without entering into contracts of employment is an attractive way of avoiding the legislation and its obligations Organised Labour is seeking to restrict these opportunities through either regulating or eliminating labour brokers and efforts are being made to regulate the use of foreign labour However for the foreseeable future the trend is for formally employed people to be reduced in number In relation to the emergent sector there will also be a reluctance to enter employment contracts with workers The fact that many households are engaged in some form of largely unpaid agricultural work means that there is significant casual work dating back many years Helping change this situation into one where casual or unpaid jobs are transformed into formal jobs with regular wages will take time It is also likely that as some emergent farms become established they will act similarly to established farms and institute a form of casual labour rather than expanding a workforce for which they would have to take a level of responsibility From an AgriSETA perspective these labour market trends mean that whilst levy income can be directed at a relatively small labour pool one that is manageable in terms of planning and implementation the size of the informal casual and unemployed labour force in the sector ‐ for whom no levy is paid and who have no employer to plan for their skills needs ndash is very large and its needs almost unlimited Clearly the relationship with the National Skills Fund (NSF) becomes critical in respect of the entire non‐levy income sector Again the level of support available from non‐levy income sources will be an important variable in looking at future sector skills development scenarios
Consumer trends
South Africa currently produces enough food to meet the needs of its population However consumption of three main staples maize wheat and vegetables has been volatile since 1985 and remains below 1990 levels Consumption of maize and vegetables by South Africans is 17 and 32 less respectively than in 198530 The main reasons for this lie in the growing levels of poverty and the difficulties that families have in purchasing nutritious food Whilst government has increased the levels of social grants and increased the number of people receiving grants to around 13 million the incomes of poor families have been badly hit by a range of factors including job losses and rises in food prices The approximately 1 million people who lost their jobs in 20089 meant a loss of income for many millions of dependents Rises in food prices have also had a disproportionate impact on the poor Whilst food is available it is often not accessible to families on the income levels that they have to manage within The result is that less and less nutritious food is purchased which in turn impacts on the ability of farmers to sell their products locally 30 Greenberg 2010
AgriSETA June 2010
Agriculture Sector Analysis 22
Whilst there is no evidence that government will reduce its efforts in relation to poverty relief and social benefits including such programmes as school feeding schemes and food parcels during periods of drought the state of public finances may not enable to support the poverty that grips many rural areas If real income levels for the poor were to rise it could have a significant impact on the economy of the agricultural sector Equally an improvement in the rural economy with increased agricultural production and jobs would dramatically impact on the capacity of people to buy nutritious food Achieving a positive growth path in rural areas is a huge challenge for government and one that is key to governmentrsquos Medium Term Strategic Framework and Industrial Policy Action Plans
HIVAIDS
South Africa has a high prevalence of HIV and AIDS The HIV prevalence among people aged two and above was estimated at 109 in 2008
Table 15 Estimated HIV percentage prevalence by age group (2002 ndash 2008)
Age 2002 2005 2008 Change
Children (2‐14 years) 56 33 25 ‐31
Youth (15‐24 years) 93 103 87 ‐06
Adults (25 and older) 155 156 168 13
15‐49 year olds 156 1692 169 13
Total (ages 2 to 49) 114 108 109 ‐05 Source Avert 2009
The table above shows that HIV prevalence is highest amongst those aged 25 years and older Given youth labour market analyses which point to people from previously disadvantaged backgrounds mainly African males accessing formal employment for the first time at age 25 ‐27 this population can be held to represent people in employment Research31 has estimated that by 2020 the pandemic will have claimed at least 20 of employees in the agricultural sector Southern Africa
in
HIV and AIDS have significant ramifications in the agricultural sector for both commercial farming and subsistence farming The implications include
bull Decrease in cultivated land bull Focus on less labour intensive crop and animal production bull Decrease in womenrsquos agricultural productivity as they take on a more care giving role bull Loss of skills bull Increase in absenteeism from work bull Decrease in daily work outputproductivity because workers are weaker from infections
There are suggestions that the impact of the pandemic in South Africa demands sectoral intervention although this may be difficult in the agricultural commercial sector as
bull Seasonal workers who seem to be more vulnerable to infection because of their low socio‐economic status are not in one place long enough for care programs Further
31 Ingelozi Management Solutions 2008
AgriSETA June 2010
Agriculture Sector Analysis 23
farmers and employers may not feel responsible for seasonal workers in the same way they would invest in their permanent employees
bull There may be uncertainty around land reform which may put HIV intervention on farms on the back burner
bull There are no policies that enforce HIV education and care on farms in the same way that legislation like BEE does for ownership As a result HIV intervention may be left to goodwill and employers may feel it is more important to comply with issues that are monitored
Farm safety and security
South Africa has been plagued by unacceptably high levels of violent crime and murder for many years now Farms have experienced this and those living on farms feel and are extremely vulnerable The South African Chamber of Commerce and Industry (SACCI) has argued that
Using the nominal GDP figure for 2009 of R24 trillion a 322 percent contribution of agriculture to GDP and an estimate of 39982 farms (as at 2007) in South Africa the cost of a murderattack on a farm to the economy was R1932869 per annum
SACCI acknowledges that this estimate is flawed as it does not take into consideration the fact that farming units contribute differently to GDP and that not every attack or murder contributes to farm shut down or loss of productivity However if not addressed these attacks could lead to loss of farming sectors as farmers migrate to lsquosaferrsquo regions This will affect employment and GDP contribution of the sector The need for safety and security on farms may also shift farmersrsquo focus in skills development to include personnel who have skills in safety and security
Broad‐based Black Economic Empowerment
The aim of the AgriBEE Charter (gazetted in 2008) is to increase the involvement of black business in agriculture through ownership and control as executives and senior managers of new and existing agricultural businesses The extent to which AgriBEE is transforming the sector is not known as it is too early to tell but a recent survey conducted by ABC and the IDC showed that among the ABC respondents in 2007 46 of enterprises were busy constructing a BEE strategy and 46 claimed to be implementing a BEE strategy A survey of the dairy industry in the Western and Eastern Cape in 2008 showed that only 6 of firms had a BEE strategy in place It also seems from survey data that companies are focusing on the skills development and socio‐economic aspects of BEE rather than on ownership32 It would appear that although there have been some significant BEE purchases of viable farms and some employee empowerment projects including some quite high profile ones in the Cape Winelands the extent of ownership change had been limited One of the factors is the very high level of single person or family ownership in the agricultural sector BEE is more straight forward in the corporate world where shares can be exchanged For a family business it is a matter of selling off part or all of the land and the tendency is to sell off those areas of the farm that are expendable from a business sustainability perspective
32 Greenberg 2010
AgriSETA June 2010
Whilst there is discussion in government about the ending of the ldquowilling buyer willing sellerrdquo concept the Constitution itself provides for property rights and so although some pressure may be exerted through legislation and regulation the extent and speed of change may not be fast The mechanisms for encouraging the transfer of significant levels of ownership have not yet been created The focus of the SETA is therefore likely to be more the beneficiaries of land reform and emergent farmers though projects of a BEE nature can be targeted as they arise
Conclusions and scenarios It is useful when looking at possible scenarios to examine the key variables or uncertainties and to project how variations one way or the other will have an impact on the development and growth of the sector From the sector analysis and factors that are contributing to change in the sector there are some key factors that seem to emerge First appears to be the economy and related issues of the labour market and the challenges of labour absorption in an enclave economy These factors determine on the one hand whether there will be growth and development and on the other whether such improvements will result in improved employment opportunities and the creation of a virtuous cycle of development Second is the role of the state and the various government departments whose plans and work impact on the agricultural sector Related to this is land reform that is inevitably driven by the state and not the owners of land or the landless The view expressed by many engaged in agrarian reform is that the state must play a significant role It becomes clear that a successful agricultural enterprise requires a number of factors to be in place to be successful These include access to land (Department of Rural Development and Land Reform) agricultural support within a supportive agricultural framework (Department of Agriculture Forestry and Fisheries) access to consistent water supply (Department of Water Affairs) access to finance (Department of Trade and Industry various state agencies) conducive labour market regulation (Department of Labour) sound industrial policy (Department of Trade and Industry) economic planning and macro policy (Department of Economic Development National Treasury) and appropriate education training and skills development (Department of Higher Education and Training the Human Resources Development Council NSA and the SETA) There are other government departments as well as provincial and municipal structures that also play a role The following analyses show how the four variables
economic growth and development role of the government labour market changes and land reform)
impact positively or negatively on the growth of the sector and the demand for skills
Agriculture Sector Analysis 24
AgriSETA June 2010
Agriculture Sector Analysis 25
HHIIGGHH GGRROOWWTTHH SSCCEENNAARRIIOO
The economics of the sector Role of government
The economy in SA and globally continues to revive albeit slowly for the next few years
Roles and integration of national government departments are clarified Specific functions are agreed processes put in place and personnel appointed with the required skills
International trade agreements are still weighted infavour of US and EU but progress is being made and specific blockages are addressed in bilateral talks
The roles of Departments (DWA DAFF DRDLR DoL DTI DED DHET) are clarified with appropriate joint plans and coordinating structures
The rural economy gradually improves with the buying power of the poor increasing and more stable markets created for local produce
For each of the functions agreed in each of the related departments appropriate structures and systems are put in place and staff trained
Exports increase in key areas identified in IPAP 2 and the Rand exchange rate stabilises at a level not too much different than it is today
Specific capacity is put in place at local level to support implementation of land reform and rural development
There is a growing understanding of the concept of dualism and the need to intervene with labour absorption and development mechanisms
Land claims are all finally settled and ownership and tenure is resolved There is a serious drive to establish effective agricultural enterprises
An understanding is reached on the role of agencies and labour brokers and abuse is curbed
The willing buyer willing seller approach is resolved and enables viable land to become black owned
Some relaxation of labour market regulations are agreed that maintain some minimum standard of employment but assist absorption
Land transfer to black and emergent farmers is done in a manner that integrates then into the supply chains of the sector
Mechanisms are found to address skills needs in the context of casual and seasonal work patterns
Financing of land reform and transfer is done on the basis of agreed development plans including skills
Labour market reform Trajectory of land reform LLOOWW GGRROOWWTTHH SSCCEENNAARRIIOO
The economics of the sector Role of government departments The economy in SA and globally stagnates at current levels and the economy struggles to pick up after the temporary 2010 World Cup boost
A lack of purpose at government level means limited progress for another five years Land reform remains a commitment without a plan
International trade agreements are still weighted infavour of US and EU and protectionism increases as a result of the global recession
The roles of Departments (DWA DAFF DRDLR DoL DTI DED DHET) are unclear and there is no proper co‐ordination
SArsquos Gini coefficient continues to worsen with rural poverty increasing and local economies declining
There is a lack of effective structures systems and processes to implement policy across departments
Rand volatility causes problems for importers and exporters Well established markets are maintained but exports decrease
At local level the decline in the agricultural extension officer functions continues and limited practical support is available
Understanding of the rural economy is so diverse that stakeholders cannot agree the problem let alone the solution to low absorption levels
Land claims take too long and land reform processes leave potentially productive land poorly developed and managed
Casual labour and labour brokers remains an issue of dispute Confrontation results in bitterness and resentment
The impasse caused by a rigid interpretations of property clauses in the Constitution continues to stall achievement of the 30 black ownership target
Labour market regulation continues to be a contributing factor to reducing levels of employment
Black owned farms find it difficult to become part of supply chains and are unable to perform adequately
Unstable employment patterns in the sector make skills interventions difficult to manage and largely ineffective
Financing of land reform and land transfer continues to be wasted as it is not tied to the building of appropriate capacity
Labour market reform Trajectory of land reform
AgriSETA June 2010
These analyses can be translated into four potential growth and development scenarios for the agricultural sector which are based on the requirements for a strong development state Scenario 3 Weak government support
and sound economy
Econ
omic fa
ctors glob
ally n
ationa
lly and
locally
Scenario 1 Integrated government support and sound economy
The economic upturn triggered by the World Cup continues and globally things improve enabling an expansion of exports The government because of a lack of integrated policy planning and implementation provides limited support for sector development The gains go to the well established enterprise owners with few gains for emerging farmers and local communities
Government departments coordinate their efforts to achieve maximum impact There are favourable economic conditions that create opportunities for advance Within this positive environment the role of the AgriSETA becomes a central component of a comprehensive strategy for growth and skills interventions are targeted to achieve maximum effect Results in growth in sustainable enterprises and expanded employment opportunities
Government policy and support Government policy and support
Combination of disjointed government policy planning and a weak and increasingly marginalised rural economy Economic conditions result in unsustainable farming conditions and employment declines along with productivity Food shortages and the lack of development in rural areas leading to increasing social tensions A vicious cycle develops with the sector going into long term decline
Government departments coordinate their efforts to achieve maximum impact However economic conditions hamper progress Efforts by the AgriSETA are undermined by poor labour absorption and job insecurity Some significant successes are recorded including some NSF funded projects that result in sustainable enterprises A platform is laid for future improvements when the economic conditions improve
Scenario 4 Weak state and economy Scenario 2 Strong state but weak
economy
Agriculture Sector Analysis 26
AgriSETA June 2010
Agriculture Sector Analysis 27
SECTION 2 DEMAND FOR SKILLS
AgriSETA registered employers and employee coverage
In 2009 17 234 employers were registered with the AgriSETA comprising 15 394 small employers (less than 50 employees) 1 202 medium sized employers (50 ‐ 149 employees) and 638 large employers (more than 150 employees)
Considering that there are around 40000 commercial farms33 the 17 234 employers represent around 43 of commercial farms Notwithstanding changes in the sector as a result of land reform and sector shrinkage this is a sizable proportion and is held to be sufficiently representative for the purpose of skills development planning However this paints an incomplete picture It understates the representative nature of large enterprise registered with the SETA and overstates the representative nature of small registered enterprises 4 175 (242) of the enterprises are levy paying members Further only 1 673 (11) workplace skills plans (WSPs) were submitted
Table 16 Registered employers by size and sub‐sector Sub‐sector Description
Employers Small Medium Large
CoffeeTea Processing and marketing of coffee and tea including coconuts cocoa nuts olives dates etc
33 4 3
Fibre Grading ginning packing of wool and cotton raw material 1 676 16 18
Fruit Fruit packed in cartons fruit juice concentrate drummed and fruit juice in container ready for consumption
271 36 57
Fruit exporters and importers 6 0 1
Grain
Manufacture of grain mill products and starches 119 5 7Handling and storage of grain 67 7 23Wholesale amp retail trade in Agricultural machinery 213 9 4Sale and distribution of Agricultural raw materials and other farming inputs
182 9 3
Milling
Manufacture of flour and grain mill products including rice and vegetable milling grain mill residues
120 15 11
Manufacture of prepared animal feeds 110 19 0Manufacture of pet foods 42 9 0Manufacture of starches and starch products 7 1 1
Pest control
Pest Control 209 4 0
Poultry Poultry and egg production including the slaughtering dressing and packing of poultry
305 49 37
Primary
Growing of Cereals and other crops (not elsewhere classified) 902 160 34Growing of Vegetables Horticultural specialties nursery products
943 120 72
Growing of Vegetables Horticultural specialties (Including Ornamental Horticulture) and nursery products
11 5 0
Sugar plantation including sugar cane and sugar beet etc 9 4 2
33 SARS statistics 2007
AgriSETA June 2010
Agriculture Sector Analysis 28
Sub‐ Description Employers Growing of fruit nuts beverage and spice crops 1795 255 143Farming of cattle sheep goats horses asses mules and hinnies Dairy farming
2 252 59 18
Other animal farming production of animal products (NEC) 433 25 12Ostrich farming 5 0 0Game farming 16 0 0Growing of crops combined with farming of animals (Mixed farming)
2 920 256 109
Growing of coffee and tea including coconuts cocoa nuts olives dates etc
2 0 0
Agricultural and animal husbandry services except veterinary activities
438 22 9
Other animal farming (not elsewhere classified) 11 1 1Growing of trees as second crop by farmers 126 18 4Fishing operation of fish hatcheries and fish farm 913 10 6
Red meat
Production and animal products (not elsewhere classified) 6 0 0Slaughtering dressing and packing of livestock including poultry and small game for meat
317 40 17
Production sale amp marketing of Agricultural by products (eg bones hides)
61 2 0
Slaughtering dressing and packing of livestock including small game for meat and processing of ostrich products
2 1 0
Wholesale trade in Agricultural raw materials and livestock 193 7 10Transport of livestock as supporting activity 224 0 0Agricultural and livestock research 215 9 3
Seed Seed production and marketing 149 12 6
Sugar Manufacture of sugar including golden syrup and castor sugar
45 5 21
Tobacco Processing and dispatching of tobacco 46 8 6 TOTALS 15 394 1 202 638Source AgriSETA WSP data
The largest number of registered small and medium enterprises are found in the mixed farming sub‐sector while most large enterprises are in the growing of fruit nuts beverage and spice crops sub‐sector
Employee coverage in the AgriSETA
Collectively the 17 234 employers registered with AgriSETA employed a total of 239 076 employees This represents 39 of the agricultural labour force in 2009 The 1 673 employers who submitted WSPs in 2009 employed 97 898 employees representing 41 of the total number of people employed by registered employers While the number of registered employers submitting WSPs is small (11) they employ a sizeable number of employees and the percentage of employees provides a statistically significant sample The data for larger enterprises is statistically much more representative than that for small enterprises
AgriSETA June 2010
Table 17 Number of employees of registered employers by sub‐sector
Sub‐sector
Sub‐sector description Employees
CoffeeTea Processing and marketing of coffee and tea including coconuts cocoa nuts olives dates etc
483
Fibre Grading ginning and packing of wool and cotton raw material 6 539
Fruit Fruit packed in cartons fruit juice concentrate drummed and fruit juice in container ready for consumption
27 661
Fruit exporters and importers 212
Grain
Manufacture of grain mill products and starches 133Handling and storage of grain 18 303Wholesale amp retail trade in Agricultural machinery 795Sale and distribution of Agricultural raw materials and other farming inputs 2 898
Milling
Manufacture of flour and grain mill products including rice and vegetable milling grain mill residues
3 634
Manufacture of prepared animal feeds 731Manufacture of pet foods 160Manufacture of starches and starch products 105
Pest control
Pest Control 119
Poultry Poultry and egg production including the slaughtering dressing and packing of poultry
19 187
Primary
Growing of Cereals and other crops (not elsewhere classified) 10 104Growing of Vegetables Horticultural specialties and nursery products 37 799Growing of Vegetables Horticultural specialties (Including Ornamental Horticulture) and nursery products
195
Sugar plantation including sugar cane and sugar beet etc 220Growing of fruit nuts beverage and spice crops 47 043Farming of cattle sheep goats horses asses mules hinnies Dairy farming
3 382
Other animal farming production of animal products (NEC) 4 203Ostrich farming 0Game farming 0Growing of crops combined with farming of animals (Mixed farming) 28 722Growing of coffee amp tea including coconuts cocoa nuts olives dates etc 0Agricultural and animal husbandry services except veterinary activities 970Other animal farming (not elsewhere classified) 513Growing of trees as second crop by farmers 1 294Fishing operation of fish hatcheries and fish farm 1 589
Red meat
Production and animal products (not elsewhere classified) 0Slaughtering dressing and packing of livestock including poultry and small game for meat
5 128
Production sale amp marketing of Agricultural by products (eg bones hides) 116Slaughtering dressing and packing of livestock including small game for meat and processing of ostrich products
0
Wholesale trade in Agricultural raw materials and livestock 1 697Transport of livestock as supporting activity 0Agricultural and livestock research 534
Seed Seed production and marketing 2 127Sugar Manufacture of sugar including golden syrup and castor sugar 10 478Tobacco Processing and dispatching of tobacco 2 002 Total 239 076
Agriculture Sector Analysis 29
AgriSETA June 2010
Agriculture Sector Analysis 30
Source AgriSETA WSP data
According to the WSP analysis the sub‐sector for the growing of fruit nuts beverage and spice crops employed the largest number of people In six sub‐sectors there are employers who do not employ workers These are probably family based organisations where family members help in the business without drawing a salary These are in transport and livestock research slaughtering dressing and packing of livestock including poultry and small game for meat growing of coffee and tea including coconuts cocoa nuts olives dates etc ostrich farming and game farming
Table 18 Employee distribution by province Province Employees Percentage
Eastern Cape 18 844 192 Free State 1 946 20 Gauteng 2 788 28 KwaZulu‐Natal 5 416 55 Mpumalanga 8 062 82 North West 3 290 34 Northern Cape 5 436 56 Limpopo 1 730 18 Western Cape 50 386 515 Grand Total 97 898
Source AgriSETA WSP data
Of those submitting WSPs registered employers in the Western Cape employed the largest number of people while employers in Limpopo employed the least number of employees Free State has a small number of employees covered by WSPs submitted to the SETA whereas Eastern Cape with a relatively small number of registered farms has a very large number of employees on farms submitting WSPs Given this variance between provinces the use of WSP data for extrapolation purposes must be viewed cautiously
2009 WSP equity information was only provided for about a quarter of employees (25 637 or26)34 No information was available from the WSPs on non‐South Africans working on commercial farms
Table 19 Equity profile from 2009 WSP data African Coloured Indian White
Totals M F D M F D M F D M F D
8 040 5 785 38 5 097 5 228 24 22 25 0 811 556 11
580 417 03 493 505 02 468 532 00 589 403 08 13 863 10 349 47 1 378 25 637541 404 02 54 100
Total EquityTotal Male Total Female Total Disability
13 970 11 594 73 545 452 03
Source AgriSETA WSP data
Using currently available data it is not possible to provide disaggregated employment data by sub‐sector This will require a small change in the way that gender race and disability data is
34 Some employers did not complete race and gender information when giving their employment profiles
AgriSETA June 2010
codified during WSP data‐capturing including allocation by sub‐sector What can be stated is that employment of males is more dominant than that of women and more Africans are employed in the sector than other groups Employment of people with disabilities is below 1
21 Skills demand
The National Education and Training Strategy for Agriculture (AET Strategy)
The AET Strategy developed by the Department of Agriculture Fisheries and Forestry (in consultation with various key stakeholders in the agricultural sector) highlights priority skills needs and constraints within the sector and categorises needs within the following 5 broad areas
1 Agricultural production ndash requesting that the past focus on a narrow band of commodities (relevant mainly to the commercial sector) and related research be expanded to address the needs of small‐scale and subsistence farmers (eg more focus on mixed farming and rural livelihood sustainability skills)
2 Agricultural engineering ndash with specific focus to be placed on technologies suitable for small‐scale farmers (eg relevant and post‐harvesting techniques related to processing and storage of produce) ndash to address this need the scarcity of agricultural engineers requires attention
3 Agricultural economics ndash a critical need was identified for general agricultural economic skills (ranging spectrum of farm planning farm management enterprise management marketing finance etc) ndash with the need to training both farmers and extension officers in such fields
4 Agricultural development ndash a specific need was identified to develop agricultural extensionists in supporting especially emerging and small‐scale farmers over the full spectrum (a need exists for both new curriculum in the training of new extensionists and the re‐training and upgrading of existing officers)
5 Veterinarians ndash the need to develop state veterinarians in order for the state to perform its role and function (particularly in its preventative monitoring and regulatory role and function)
AGRISETA sector skills planning demand data (2008‐2009)
The following section reflects initial research on skills demand in the Agricultural sector arising from the sector analysis (section 1) previous AGRISETA skills demand research for Sector Skills Planning during 2005‐2009 and analysis of WSP data from 2009 With the introduction of the Organising Framework of Occupations and agreement on definitions for scarce and critical skills in 200506 the AGRISETA undertook an extensive research and consultation processes to determine skills development priorities for the sector The research methodology employed was based on the a four dimensional topology for establishing and evaluating skills needs illustrated in the figure below
Agriculture Sector Analysis 31
AgriSETA June 2010
Agriculture Sector Analysis 32
The identification and prioritisation of skills needs was also undertaken from a key stakeholder and beneficiary perspective Consideration was given to needs of the following groups
bull The unemployed ndash helping them gain andor regain entry to the labour market bull The economically inactive ndash helping them to become economically active bull School leavers ndash helping them gain access to further education and training opportunities
and thus facilitating their entry to the job market bull Entrants to the job market ndash facilitating employment and integration into the work culture
and work ethic (improving the employability of an individual) bull Those currently employed in the sector ndash increasing their competency and opportunities
for advancement creating a career path and offering continued job security enhancement of value adding to the sector improving their prospects for better employment opportunities
bull Organisations and enterprises within the sector ndash making sure that skills development and knowledge creation occurs in such a way as to improve the sectorrsquos viability and allowing companiesenterprises to become more sustainable and profitable along the way improving productivity competitiveness and innovation within organisations
In organising and reporting the identified priority skills development needs (200809) the following structuring approach was followed
Tier 1 The four categories of needs as per the Topology presented above were used for the identification evaluation and grouping of needs
Pay conditions
Image
RECRUITMENT DIFFICULTY
SKILLSGAP
SKILLSSHORTAGE
LABOURSHORTAGE
Firms experience difficulty recruiting This does not necessary imply a skills shortage ndash may indicate a poor image remuneration etc
Those currently in work do not have the requisite skills set to carry out their job to an optimum standard
Required skills are in short supply when compared with the demand across the whole labour market
Regardless of skills levels a situation exists where there is simply not enough supply of labour to meet demand
Pay conditions
Image
RECRUITMENT DIFFICULTY
SKILLSGAP
SKILLSSHORTAGE
LABOURSHORTAGE
Firms experience difficulty recruiting This does not necessary imply a skills shortage ndash may indicate a poor image remuneration etc
Those currently in work do not have the requisite skills set to carry out their job to an optimum standard
Required skills are in short supply when compared with the demand across the whole labour market
Regardless of skills levels a situation exists where there is simply not enough supply of labour to meet demand
Figure 4 Topology for identifying skills development priorities
Source AGRISETA SSP Annual Update August 2009
AgriSETA June 2010
Tier 2 Within each of the first tier groupings needs were further broken down and organised per target group At this second level needs were grouped by
o General skills development needs (cross‐cutting over different target groups) o Needs experienced by small scale farmers (this group included subsistence
farmers new emerging land reform beneficiaries and small‐scale AgriBEE farmers) o Needs within the commercial agricultural sector (per sub‐sector groupings where
specific needs for such were identified ndash both on‐farm needs and within the secondary sub‐sector or related agri‐businesses)
o Needs of the Department of Agriculture Fisheries and Forestry (DAFF) To further guide and direct the identification and selection of scarce and critical skills the following factors or criteria that could reflect the importance (impact and effect) of a skills shortages were developed as an identification framework
1 Basic Skills Development Promoting basic literacy and numeracy and raising the base level of education for the sector improving the work and livelihood of existing workers
2 Employability Making the employee more employable by improving the fit between their skills and the sector needs
3 Enterprise Viability Improving the capability and feasibility of the enterprise by increasing its effectiveness of or possibilities for profit generation etc
4 Enterprise Sustainability Allow enterprises to survive and grow over an extended period of time without compromising the value of renewable resources thereby creating long‐term meaningful employment for larger numbers of people
5 Sector Growth Enabling the sector to develop or pursue new opportunities or improve the effectiveness of current operations
6 Sector Competitiveness Enabling the sector to compete more effectively in the international arena improving market intelligence and interpretation productivity cost efficiency etc
7 Human Resource Development Capacity Improving the access to quality provision of training to the agri sector
Based on this research and consultation framework the following skills development needs and priorities were identified
Agriculture Sector Analysis 33
AgriSETA June 2010
GENERAL NEEDS SMALL‐SCALE FARMER
NEEDS COMMERCIAL SECTOR
NEEDS DAFF NEEDS
RECRUITMENT RELATED SKILLS NEEDS Primary agriculture is the entry point into the world of work for large numbers of people in rural areas However the sector has negative connotations amongst sections of the youth and in parts of the country and is viewed as a last resort for some in the search for employment) The effect is that despite an unemployment rate of approximately 26 (now over 30) farmers find it difficult to recruit workers to meet seasonal demands This has resulted in the government approving the contracting of foreign labour to meet such temporary needs (workers are recruited mainly from Zimbabwe and Mozambique)
Labour in this farming sector is provided primarily by family members and no real recruitment constraints can be identified
The agricultural sector still manages to attract technical and management skills as it is perceived to include a better lifestyle and there is a strong tradition of agriculture in SA Increasing crime related security risks associated with farming may have a negative impact
The Department has identified a number of occupations in which they are experiencing long‐term vacancies Some of these result from a general shortage of such skills in SA while others arise from the inability of the public sector to compete with the private sector (less favourable employment image working conditions and equity considerations) Priority vacancies include Veterinarians Agricultural
Engineers Plant Health
Specialists Agricultural
Statisticians Plant Health Pest Risk
Analysts ICT Specialists Agricultural
Economists Agricultural Food and
Quarantine Technicians
Agro‐meteorologists Pasture Scientists Plant Production
Specialists Specialised Food
Analysts SKILLS GAPS RELATED NEEDS
bull Low literacy and numeracy levels ndash both amongst workers within the sector at large and at ownermanager level in many of the small‐scale farming
bull Farm management
Farm Management (Mainly owners managers) bull Farm management amp
entrepreneurship bull Resource
management and record keeping
bull Financial planning
A critical constraint is the poor educational levels of a large proportion of the labour force in the sector demanding a considerable effort and investment in ABET and other life skills
A particularly big need exists for skills upgrading amongst Extension Officers ndash particularly with regard to redress the historical neglect of small‐scale farmers and resource strapped farmers
Agriculture Sector Analysis 34
AgriSETA June 2010
Agriculture Sector Analysis 35
GENERAL NEEDS SMALL‐SCALE FARMER
NEEDS COMMERCIAL SECTOR
NEEDS DAFF NEEDS
skills (and general management skills in other agricultural businesses) coupled with a business orientation and entrepreneurship skills
bull A general need to increase compliance with environmental occupational health and safety animal welfare produce safety and hygiene standards regulations and requirements (local and international standards)
and management bull Project management bull Business plan
development Marketing and processing bull Processing and
packaging bull Transport
management bull Marketing produce
including branding bull Planning for
marketing bull Knowledge of
markets Technical knowledge and skills bull Production
management (related to specific enterprise)
bull Demonstration of production techniques
bull Natural resources management
Mechanical knowledge bull Farm maintenance bull Repairs of machinery
and equipment bull Electrical
maintenance and installation
programmes Need for improved management skills and relevant technological knowledge for increasing productivity levels and improved production methods Rising importance for environmentally responsible production and processing management systems Rising competitive and international markets increases need for business and marketing abilities among owners and managers Increasing requirements for compliance with environmental health and safety and international trade standards Information technology although not a priority is increasing in importance Business management ability is becoming increasingly important as more farmers are making decisions about restructuring their businesses diversification and developing supplementary sources of income
Critically improved farm management and business skills within an agricultural context to support the majority of BEE and emerging farmers Skills upgrading requirements for existing Extension Officers include bull Agricultural
economics bull Agricultural
management bull Business and
financial management
bull Technical and production related skills including o Animal husbandryo Poultry o Crop production o Horticulture
SKILLS SHORTAGES Generally SA has a shortage of entrepreneurs and people who have the business acumen drive motivation and
The profile of these farmers reflects a large contingent of older and less educated people who are generally less flexible tend to stick to
The commercial agri sector will increasingly have to compete in the global market and the ever increasing need to increase productivity to
DAFF us experiencing problems are especially sourcing people in specialised science related fields (learning fields experiencing few
AgriSETA June 2010
Agriculture Sector Analysis 36
GENERAL NEEDS SMALL‐SCALE FARMER
NEEDS COMMERCIAL SECTOR
NEEDS DAFF NEEDS
perseverance to become a successful farmer Given the high risks involved in the agricultural sector (natural elements outside onersquos control) the agri sector does not compete successfully for this ldquoscarce resourcerdquo Moreover as with other professional and skilled occupations there is a tendency for younger qualified people to move to urban areas
known practices and are less likely to experiment with new technology Within this target group candidates with good entrepreneurial ability are scarce There is a perceived shortage of Agricultural Extensionists and advisors to assist this target group However a large pool of young unemployed graduates exists who could assist such emerging farmers if they were mobilised and made accessible to farmers Similarly the potential pool of retired commercial farmers who could serve as mentors to this target group
remain profitable and viable it can be stated that many of the existing farmers and managers owners lack business management and entrepreneurial orientation Equity policy and the need to become BEE compliant requires that commercial enterprises appoint and develop black owners directors managers Changing local and global consumer preferences require farmers to change traditional farming methods and practices Skills and knowledge requirements include bull Global food and
international quality standards
bull Product traceability requirements
bull Organic produce and products
Specific occupations identified as being in short supply are
bull Production Managers (food processing)
bull Product specialisation to international specifications (research skills)
bull Forklift drivers heavy vehicletruck drivers and mobile plant operators
bull Experienced and competent artisans (millwrights electricians fitters
enrolments andor pass rates at HET institutions with the result that too few qualified persons come onto the labour market) Examples of such skills shortages identified by the Department include Agricultural Engineers bull Plant Health
Specialists (Nematology Entomology Plant Pathology)
bull Statisticians (specialised agricultural knowledge)
bull Plant Health Pest Risk Analysts
bull Agricultural Economists (production and resource economists)
bull Agricultural Food and Quarantine Technicians
bull Agro‐meteorologists Early warning Specialists
bull Pasture Scientists bull Plant Production
Specialists (eg ornamental crops hydroponics)
bull Specialised Food Analysts (pesticide residue analysts processed food and dairy analysts wine and spirit analysts)
AgriSETA June 2010
Agriculture Sector Analysis 37
GENERAL NEEDS SMALL‐SCALE FARMER
NEEDS COMMERCIAL SECTOR
NEEDS DAFF NEEDS
and turners bull Agricultural
Equipment Technicians
bull Pest and weed controllers
bull Horticultural specialists
LABOUR SHORTAGES AND RELATED SKILLS NEEDS Given an employment rate of some 26 (2009 currently estimated at over 30expanded definition) per definition there cannot be a labour shortage It is however difficult for people who have never worked before to integrate into the agricultural sector workforce Coupled with an aging workforce (30‐60 being over 40) means that most agri enterprises will within the next 5‐10 years be looking at replacing a large proportion of their workforce There could be an insufficient pool of people willing and able to participate The impact of HIVAIDS is also not always factored in to understanding the diminishing pool of resources available Labour shortages have been reported within selected geographical areas and in particular occupations Examples include cane cutters in the sugar industry chicken catchers in the poultry industry pickers in the fruit industry and animal handlers in feedlots as well as dairy parlour workers It is however believed that these shortages may reflect a recruitment problem as a result of the very harsh working conditions and the relatively poor remuneration (which makes these occupations unpopular) At present such ldquoshortagesrdquo are addressed through contracting labour from neighbouring countries
AgriSETA WSP analyses
Skills demand in the commercial agricultural sector
Information for demand for skills from WSP data is available for 1 673 employers who submitted their WSPs for the 200910 period The table below shows data on sub‐sector WSP submission relative to size of the sub‐sector as well as subsector data from all registered organisations and those who submitted WSPs Data for registered employers shows that there were 239 076 employees employed by the 17 234 registered organisations As previously stated 97 898 employees were employed by the organisations submitting WSPs This constitutes 41 of employees employed by registered organisations
Table 20 Employment and sub‐sector data drawn from WSP analyses
Sub‐sector
All Re
gistered
Employers
Small employers (0‐49)
Med
ium and
large
employers (50+)
Total W
SPs received
Total W
SPs received
as of
all registered em
ployers
WSP
received med
ium and
large orgs
WSPs received
as of
med
ium amp large em
ployers
WSPs received
small
employers
WSPs received
as of small
enterprises
EmployeesPer
Profile
CoffeeTea 40 33 7 9 23 5 71 4 12 483 Fibre 1 710 1 676 34 34 2 22 65 12 07 6 539
AgriSETA June 2010
Agriculture Sector Analysis 38
Sub‐sector
All Re
gistered
Employers
Small employers (0‐49)
Med
ium and
large
employers (50+)
Total W
SPs received
Total W
SPs received
as of
all registered em
ployers
WSP
received med
ium and
large orgs
WSPs received
as of
med
ium amp large em
ployers
WSPs received
small
employers
WSPs received
as of small
enterprises
EmployeesPer
Profile
Fruit 371 277 94 162 44 76 81 86 31 27 873 Grain 648 581 67 77 12 48 72 29 5 22 129 Milling 335 279 56 61 18 35 63 26 9 4 630 Pest Control 213 209 4 8 4 2 50 6 3 119 Poultry 391 305 86 66 17 46 53 20 7 19 187 Primary 12 121 10 776 1 345 1144 9 513 38 631 6 136 034 Red meat 1107 1 018 89 70 6 45 51 25 2 7 475 Seed 167 149 18 24 14 13 72 11 7 2 127 Sugar 71 45 26 13 18 10 38 3 7 10 478 Tobacco 60 46 14 5 8 3 21 2 4 2 002
Totals 17 234 15 394 1 840 1 673 10 818 44 855 16 239 076
Source 1 AgriSETA WSP 2009 data
Only 10 of all registered employers submitted WSPs for the 200910 period Of these 49 were medium and large sized employers and 51 small However only 16 small employers submitted their WSPs relative to the number of registered small employers and 44 medium and large employers submitted WSPs relative to the number of registered medium and large employers As such skills demand statistics provides more representative data on the requirements of medium and large employers Data for skills demand in the commercial agricultural sector is based on data for permanent employees as well as casual and seasonal employees
Skills demand forecasting by AgriSETA
Forecasting for skills demand the AgriSETA has estimated that the demand for skilled employees at different levels in the next few years is 510 686 This is based on WSP data analyses over the last 5 years and projected demand for the formal commercial agricultural sector and factoring in the demand that at maximum would result from completion of the land restitution programme in South Africa The table below reflects the skills that are on demand as well as the estimates for demand over the next five years by major occupational category35
35 AgriSETA 2010
AgriSETA June 2010
Table 21 Demand for skills by occupational category
Major Occupation (OFO)Estimated Demand
Group Title1 Managers (commercial and small emerging farmers) 264 3702 Professionals 4 1413 Technicians and Trade workers 8 9255 Clerical and administrative workers 8006 Sales workers 4007 Machinery operators and drivers 5 8008 Elementary workers 226 250
Total 510 686Source AgriSETA WSP data and SSP demand forecasts
Research needs going forward
As has been set out in the sector analysis and the scenarios derived from that analysis the sector is faced by both significant and profound change and also great uncertainty It therefore follows that the task of focussing limited resources (basically levy income in the formal sector and NSF funds for the emergent farming sector) is difficult Whilst the general thrust of training remains broadly as described in the 2006‐10 SSP Updates some considerable work is required to achieve targeted effective interventions during the 2011‐2016 period The following research questions will need to be addressed in preparing the next SSP
bull In relation to the managers and owner‐managers of commercial farms and enterprises what skills are needed to enable them to help bring about the more optimistic scenario and manage the risks associated with the less optimistic ones
bull In terms of professional and technical competencies do the current education and training institutions coupled with the learning programmes available through the AgriSETA (learnerships skills programmes and the like) meet the needs of the sector
bull In the emerging agricultural sector do the current programmes funded by sources external to the AgriSETA (eg NSF) meet all the identified needs What gaps are there and how should they be addressed
bull In relation to governmentrsquos growth strategy and industrial action plans what skills are required for developing the aquaculture sub‐sector What programmes are available How can the SETA support the skills needs for this sub‐sector
bull Given the increasing levels of casual and contract labour how can skills be developed to meet the needs of the formal commercial sector and the emerging enterprise sector
bull How can the demand in each of the priority areas be quantified and agreement be reached on numbers of people to be trained
Agriculture Sector Analysis 39
AgriSETA June 2010
SECTION 3 Skills Gaps and scarce skills
Scarce skills at the DAFF
The level of scarce skills at DAFF can be determined by the vacancy rate While the average vacancy rate in the department as at 31 March 2009 was 17 there were some posts that had very high vacancy rates as reflected in the table below Indicating the possibility that the Department is experiencing difficulties in finding suitable candidates in the South African labour market to fill these posts
Table 22 Scarce skill occupations and vacancy rates (DAFF March 2009) Critical occupations Number of posts Posts filled Vacancy rate ()
Agricultural animal oceanography forestry and other sciences
167 119 287
Engineering sciences related 2 1 50Engineers and related professions 13 6 538Farming forestry advisors and farm managers 11 4 636Finance and economics related 73 53 274Horticulturists foresters agricultural and forestry technicians
350 221 369
Legal related 6 4 333Mechanical engineering technicians 3 2 333Risk management and security services 6 4 333Social sciences related 1 0 100Veterinarians 34 24 294
Source DAFF Annual Report 20082009
Skills are also scarce at senior management level The department also reports on difficulties it has filling senior management services vacancies with some of them staying vacant for up to twelve months because no suitable candidates can be found The department would then resort to re‐advertisement and head hunting This was the case with 22 of 18 SMS posts in March 2009
Scarce skills in the commercial sector
The following occupations have previously been projected as scarce (extremely hard to fill vacancies) by AgriSETA in the commercial agricultural sector over the next five years
Table 23 Scarce and critical skills in the commercial agricultural sector
Occupation Code
Group Occupation Critical Skills Intervention Comments
139903 Managers Laboratory Manager
Technology AI nutrition
HET
221101 Professionals Accountant (General)
General HET
221102 Professionals Management Accountant
Farm financial management
HET Focus on support advice to farmers new enterprises
222101 Professionals Commodities Trader
Export administration supply chain
FET Learnership Skills
Agriculture Sector Analysis 40
AgriSETA June 2010
Agriculture Sector Analysis 41
Occupation Code
Group Occupation Critical Skills Intervention Comments
management Programme
224301 Professionals Economist Agricultural HET
Mainly for Department of Agriculture and para statals commodity organisations
233101 Professionals Chemical Engineer
Chemical processes in food production
HET Industries such as sugar processing
233301 Professionals Electrical Engineer
Installation and maintenance
HET Processing industry
233401 Professionals Electronics Engineer
Computerised production prosesses
HET Processing industry
233501 Professionals Industrial Engineer
Productivity and efficiency
HET Processing industry
233904 Professionals
Instrument Engineer (Defence Force)
Installation and maintenance
HET
Not for defence ‐ sugar industry
233502 Professionals Mechanical Engineer
FETHET Equity reasons
233902 Professionals Agricultural Engineer
Farm layout and infrastructure
HET Mainly in Government
311101 Technicians and trades workers
Agricultural Technician
Installation and maintenance
FETHET
234102 Professionals Agricultural Scientist
Agri research HETFET Especially in horticulture
234201 Professionals Chemist HET Processing industry
234202 Professionals Food Technologist
Food safety HACCP
FETHET Across sector
234701 Professionals Veterinarian HET Mainly in Government
311101 Technicians and trades workers
Agricultural Technician
Farm infrastructure
FET Mainly needed in government
311401 Technicians and trades workers
Chemistry Technician
FETHET EE reasons
312907 Technicians and trades workers
Chemical Engineering Technician
FET Learnership
Mainly EE reasons
312402 Technicians and trades workers
Electronic Engineering Technician
Weak stream production infra
FETHET Mainly tobacco industry
233904 Professionals
Instrument Engineer (Defence Force)
Instrument technician
FET
Occupation needed Instrument Technician (not defence force) Mainly sugar processing sector
321202 Technicians and trades workers
Diesel Motor Mechanic
FET Learnership
To include tractor mechanic
321204 Technicians and trades workers
Small Engine Mechanic
Agricultural equipment
FET Learnership
Throughout sector
AgriSETA June 2010
Agriculture Sector Analysis 42
Occupation Code
Group Occupation Critical Skills Intervention Comments
322301 Technicians and trades workers
Metal Fabricator
Artisan FET Learnership
322303 Technicians and trades workers
Welder Welder (First Class)
Artisan FET Learnership
323203 Technicians and trades workers
Fitter‐Welder Artisan FET Learnership
Mainly sugar ndash multi‐skilled
323202 Technicians and trades workers
Fitter And Turner
Artisan FET Learnership
Tobacco and sugar
323501 Technicians and trades workers
Millwright Artisan FET Learnership
Wide‐spread need
341101 Technicians and trades workers
Electrician (General)
Artisan FET Learnership
Wide‐spread need
342101 Technicians and trades workers
Air‐Conditioning And Refrigeration Mechanic
Artisan FET Learnership
Sugar pack houses cold chain
Source AgriSETA Sector Skills Plans
Supply of skills
South Africarsquos agriculture skills are produced in high schools agricultural colleges FET colleges and Higher Education institutions In high school a large cohort of learners take Agricultural Science as a subject In 2003 there were 42 Agricultural High Schools offering Agricultural Science as a subject These students and those in high schools taking the subject could progress to taking agriculture as a focus area for further education In 2004 there were 10 FET colleges offering vocationally directed agricultural programmes These FET colleges offered complete qualifications and short courses Eleven Colleges of Agriculture can offer qualifications up to degree level and 19 universities offer qualifications in Agriculture ranging from agricultural economics animal and plant sciences and horticulture among others at under and post graduate levels (Department of Agriculture 2006) While long term planning of skilling of new entrants in the sector can be done through close consultation between the sector agricultural schools and colleges FET colleges and HET institutions so that they teach relevant skills there are other avenues for training for those who are already employed in the sector for example skills programmes and learnerships There are 15 registered qualifications for the primary agriculture sub sectors Currently AgriSETA has 94 registered learnerships that can address the skills needs of the identified scarce skills These are captured in Appendix 2 AgriSETA has approved accredited a number of training providers across the country to deliver the theoretical and practical components of these learnerships These include agricultural colleges FET colleges and private providers Currently the AgriSETA has 246 registered and approved providers distributed nationally as follows
AgriSETA June 2010
Table 29 AgriSETA approved training providers (2010) Province Number of providers
Gauteng 72
(29)
KwaZulu Natal 20
(8)
Limpopo 35
(14)
North West 30
(12)
Northern Cape 3
(1)
Free State 15
(6)
Mpumalanga 14
(6)
Western Cape 26
(11)
Eastern Cape 31
(13) Total 246
The providers are small to large organisations In primary agriculture small providers appear to offer the most training in rural areas and community projects (AgriSETA 2010) Most of the operating providers will be in FET colleges and agricultural colleges The AgriSETA is unable to meet the total demands for skills across the duality of their sector There seems to be fairness in the approval of training for both permanent and casual and seasonal workers In 200809 the AgriSETA approved 559 learnerships as follows
Table 30 AgriSETA learnerships approved for grant purposes (2008‐2009)
Source AgriSETA learnership data analysis
Agriculture Sector Analysis 43
AgriSETA June 2010
Agriculture Sector Analysis 44
Provision of skills programmes in the same year attracted grants for 2 706 employees
Table 31 Participation by learners in skills programmes in the AgriSETA (200809)
Source AgriSETA Skills programmes data analysis
AgriSETA June 2010
APPENDIX 1 Skills demand in the Department of Agriculture Forestry amp Fisheries (200809)
Source DAFF Annual Report 2008‐20009
Agriculture Sector Analysis 45
AgriSETA June 2010
Agriculture Sector Analysis 46
Appendix 2 AgriSETA registered learnerships Registered Learnership NQF Level SAQA Registration NoLearnership in Agri Sales and Service 4 22 Q 220001 20 178 4Learnership Agricultural Machinery Technician 2 22 Q 220007 20 160 2Learnership in Specialist Agricultural Machinery Technician 5 22 Q 220009 21 258 5Agri Trade Processes 2 22 Q 220013 30 125 2FETC Meat Examination Applying Basic Business Principles 4 30 Q 3000 2823 164 4Further Education and Training Certificate Seed Marketing Execute Seed Trials 4 22 Q 220025 21 126 4Further Education and Training Certificate Seed Research and Development Certify as Seed Unit 4 22 Q 220027 21 121 4FETC Seed Research and Development Conduct a Field Inspection of a Seed Unit 4 22 Q 220028 20 120 4Seed Research and Development Operations Operate in a Team 3 22 Q 220020 22 121 3Seed Research and Development Operations Apply Basic Business Principles 3 22 Q 220021 22 121 3National Certificate Seed Processing and Packaging Operate in a Team 3 22 Q 220026 21 123 3Sugar Industry Technical Maintenance worker 2 22 Q 220011 39 128 2National Certificate Sugar Manufacturing and Refining Technical Maintenance 3 30 Q300003 23 146 3Further Education and Training Certificate Manufacturing Technical MaintenanceProduce Components by Performing Engineering Turning Operations
4 30 Q 3000 1321 173 4
FETC Manufacturing Technical Maintenance Produce Components by Performing Milling Operations 4 30 Q 3000 1521 173 4 FETC Manufacturing Technical Maintenance Develop and Fabricate from Complex Drawing 4 30 Q 3000 1420 173 4National Certificate in Sugar Technology 5 22 Q 220036 22 140 5Further Education and Training Certificate Sugar Processing 4 22 Q 220035 31 144 4National Certificate in Sugar Technology Processing Sugar Refining 2 22 Q 220037 28 124 2National Certificate in Sugar Technology Processing Juice Preparation 2 22 Q 220038 28 124 2National Certificate in Sugar Technology Processing Crystallisation 2 22 Q 220039 27 122 2National Certificate in Sugar Technology Processing Laboratory Practice 2 22 Q 220040 25 124 2National Certificate in Sugar Technology Processing Extraction 2 22 Q 220041 28 122 2NC Rooibos Production Applying Basic Business Principles 2 30 Q 3000 2427 130 2 NC Rooibos Processing Applying Basic Business Principles 2 30 Q 3000 2224 123 2 National Certificate Cigarette Production 3 22 Q 220046 23 121 3
AgriSETA June 2010
REFERENCES AgriSETA 2010 AgriSETA 20082009 Annual report Pretoria AgriSETA Agricultural Research Council httpwwwarcagriczahomeasppid=272 Avert South African HIV and AIDS statistics Available on httpwwwavertorgsafricastatshtm Centre for Development Enterprise 2008 Land reform in South Africa Getting back on track CDE Research No 16 DAFF 2010 Quarterly economic review of the agriculture sector Pretoria DAFF DAFF 2009 Annual report 20082009 Pretoria DAFF Department of Agriculture 2008 Strategic plan 2008 Pretoria Department of Agriculture DTI An introduction to the South African economy Available on httpwwwthedtigovzapublicationsagroprocessinghtm Eastern Cape Provincial Government Eastern Cape Provincial Growth and Development Strategy 2004 ndash 2014 Economic Commission for Africa 2009 Developing African agriculture through regional value chains Addis Ababa Economic Commission for Africa Economic Report Free State Province 2005 Provincial Growth and Development Strategy 2005 ndash 2014 GCIS 2010 SA Yearbook 200910rdquo Agriculture forestry and fisheries Pretoria GCIS Greenberg S 2010 Status report on land and agricultural policy in South Africa 2010 Institute for Poverty Land and Agrarian Studies School of Government University of the Western Cape Research report Ingelozi Management Solutions 2008 HIVAIDS in the South African agricultural sector Towards the development of a long term intervention Research report KwaZulu Natal Provincial Government 2006 KwaZulu Natal Provincial Growth and Development Strategy Limpopo Provincial Government Growth and Development Strategy 2004 ndash 2014 Mhone G (2000) Enclavity and Constrained Labour Absorbtive Capacity in Southern African Countries Geneva International Labour Office Moyo S The Agrarian question and the developmental state in South Africa In Edigheji O et al 2010 Constructing a democratic developmental state in South Africa HSRC PRESS
Agriculture Sector Analysis 47
AgriSETA
Agriculture Sector Analysis
National Treasury Republic of South Africa 2010 National Budget 2010 ndash National Budget Review 2010 Pretoria National Treasury Northern Cape Provincial Government Agriculture and agro‐processing sector strategy North West Provincial Government North West Provincial Growth and Development Strategy 2004 ndash 2014 Province of the Western Cape 2008 The Ikapa growth and development strategy White Paper SABCOHA SA Business Coalition on HIV and AIDS wwwsabcohaorg SACAU httpwwwsacauorghostingsacauSacauWebnsfHomehtmOpenForm South African Government 2010 20102011 ndash 20122013 Industrial Policy Action Plan Republic of South Africa Statistics South Africa 2005 Census of commercial agriculture 2002 Report No 110201 Pretoria Statistics South Africa Statistics South Africa 2009 Census of commercial agriculture 2007 Statistical release P1101 Pretoria Statistics South Africa Statistics South Africa 2010 General household survey 2009 Statistical release P0318 Pretoria Statistics South Africa Statistics South Africa 2010 Gross domestic product first quarter 2010 Statistical release P0441 Pretoria Statistics South Africa Statistics South Africa 2010 Quarterly labour force survey Quarter 1 2010 Statistical release P0211 Pretoria Statistics South Africa Vink N amp van Rooyen J 2009 The economic performance of agriculture in South Africa since 1994 The implications for food security Pretoria DBSA development planning division working paper series No 17 Webster E 2004 the Dual Economy from a book by Van Holdt K and Webster E Work restructuring and the Crisis of Social reproduction and 10 years of restructuring post apartheid workplaces University of Natal Press Workinfocom httpwwwworkinfocomfreesub_for_legresdatalraempassoc3htm Xingwana L 2008 Challenges and Opportunities for Land and Agrarian Reform towards 2025 Speech delivered at the Agri‐Consultation Protea Ranch Hotel Polokwane 30 July 2008
- Table of contents
- SECTION 1 THE AGRICULTURAL LANDSCAPE
- 11 Size and shape of the Agricultural sector
-
- Overview
- Distribution of agricultural production
- The structure of the agriculture sector in South Africa
- Categories of farming enterprises
- Employment trends
- Employment categories and remuneration
- Stakeholders in the Agricultural sector
-
- National government departments
- Sector representatives
-
- 12 Factors impacting development in the Agriculture sector
-
- Future sector economic growth and development
-
- South African sector growth plans (IPAP2)
- International Trade
- Global recession and rise in food prices
-
- Land reform
- Reliance on imports
- Water
- The labour market
- Consumer trends
- HIVAIDS
- Farm safety and security
- Broad-based Black Economic Empowerment
-
- Conclusions and scenarios
- SECTION 2 DEMAND FOR SKILLS
-
- AgriSETA registered employers and employee coverage
- Employee coverage in the AgriSETA
-
- 21 Skills demand
-
- The National Education and Training Strategy for Agriculture (AET Strategy)
- AGRISETA sector skills planning demand data (2008-2009)
- AgriSETA WSP analyses
-
- Skills demand in the commercial agricultural sector
-
- Skills demand forecasting by AgriSETA
- Research needs going forward
-
- SECTION 3 Skills Gaps and scarce skills
-
- Scarce skills at the DAFF
- Scarce skills in the commercial sector
- Supply of skills
-
- APPENDIX 1 Skills demand in the Department of Agriculture Forestry amp Fisheries (200809)
- Appendix 2 AgriSETA registered learnerships
-
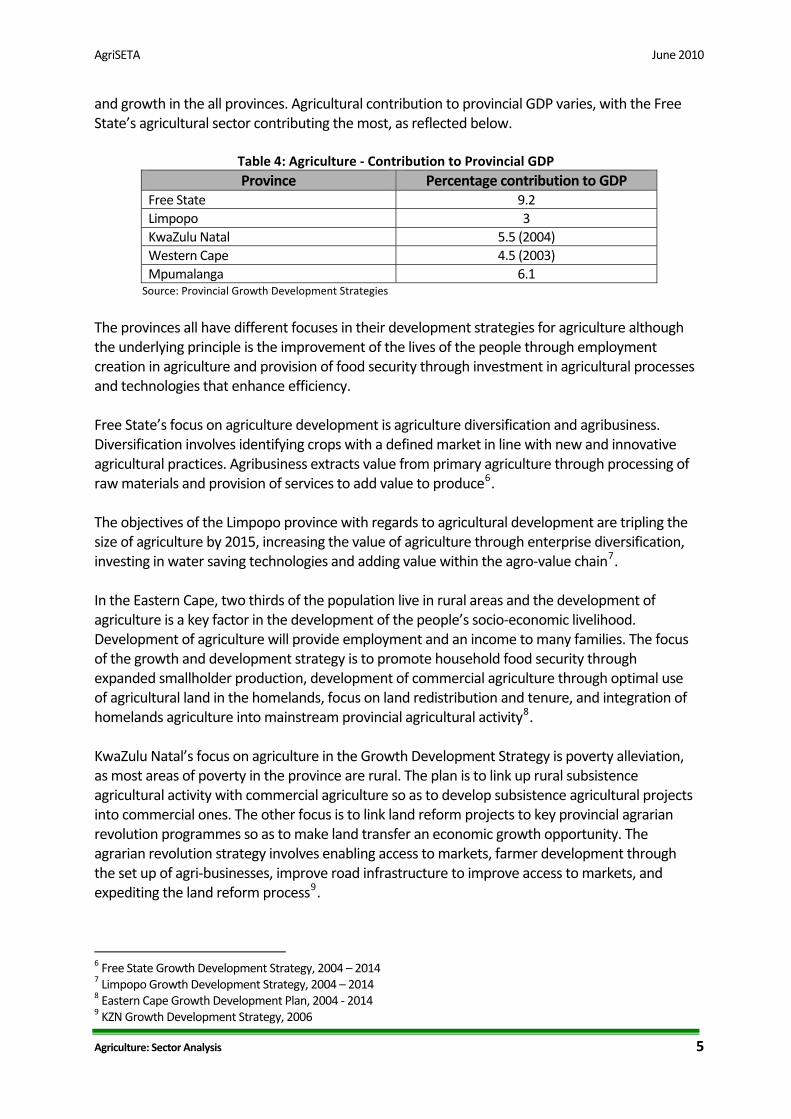
AgriSETA June 2010
Agriculture Sector Analysis 5
and growth in the all provinces Agricultural contribution to provincial GDP varies with the Free Statersquos agricultural sector contributing the most as reflected below
Table 4 Agriculture ‐ Contribution to Provincial GDP Province Percentage contribution to GDP
Free State 92 Limpopo 3 KwaZulu Natal 55 (2004) Western Cape 45 (2003) Mpumalanga 61
Source Provincial Growth Development Strategies
The provinces all have different focuses in their development strategies for agriculture although the underlying principle is the improvement of the lives of the people through employment creation in agriculture and provision of food security through investment in agricultural processes and technologies that enhance efficiency Free Statersquos focus on agriculture development is agriculture diversification and agribusiness Diversification involves identifying crops with a defined market in line with new and innovative agricultural practices Agribusiness extracts value from primary agriculture through processing of raw materials and provision of services to add value to produce6 The objectives of the Limpopo province with regards to agricultural development are tripling the size of agriculture by 2015 increasing the value of agriculture through enterprise diversification investing in water saving technologies and adding value within the agro‐value chain7 In the Eastern Cape two thirds of the population live in rural areas and the development of agriculture is a key factor in the development of the peoplersquos socio‐economic livelihood Development of agriculture will provide employment and an income to many families The focus of the growth and development strategy is to promote household food security through expanded smallholder production development of commercial agriculture through optimal use of agricultural land in the homelands focus on land redistribution and tenure and integration of homelands agriculture into mainstream provincial agricultural activity8 KwaZulu Natalrsquos focus on agriculture in the Growth Development Strategy is poverty alleviation as most areas of poverty in the province are rural The plan is to link up rural subsistence agricultural activity with commercial agriculture so as to develop subsistence agricultural projects into commercial ones The other focus is to link land reform projects to key provincial agrarian revolution programmes so as to make land transfer an economic growth opportunity The agrarian revolution strategy involves enabling access to markets farmer development through the set up of agri‐businesses improve road infrastructure to improve access to markets and expediting the land reform process9
6 Free State Growth Development Strategy 2004 ndash 2014 7 Limpopo Growth Development Strategy 2004 ndash 2014 8 Eastern Cape Growth Development Plan 2004 ‐ 2014 9 KZN Growth Development Strategy 2006
AgriSETA June 2010
Agriculture Sector Analysis 6
Northern Capersquos focus is the development of agro‐processing (Northern Cape Growth and Development Strategy) The North West is focusing on enabling access to markets and assisting financially in infrastructure development and machinery acquisition as well as investing in agro‐processing technology and skills as well as promoting efficient land use10 Agriculture holds employment growth potential in Mpumalanga province It accounts for 181 of provincial employment with forestry being the main agricultural activity in the province About 383 of the provincersquos land is used for forestry Agriculture is identified as a key focus area to achieve the strategic growth development strategy of providing a better life for all in the province through economic development Growth potential is through agricultural investment production and beneficiation so as to increase agriculture GDP contribution from 61 to 10 by the end of the 20082009 financial year Other strategic objectives are to increase sustainable employment in the agricultural sector from 18 to 20 by the end of 2015 improve food security by 50 by 2014 improve sustainability in agri‐business enterprises by 20 and increase participation of historically disadvantaged in agriculture to meet national Agri BEE targets (Mpumalanga Growth and Development Strategy 2004 ‐ 2014)
The structure of the agriculture sector in South Africa
The South African Agriculture Sector primarily based in rural and peri‐urban areas is characterised by a dual agricultural economy comprising well developed commercial farming with an established supply chain and small (subsistence) based production The General Household Survey of 2009 (Statistics South Africa) and the Census for commercial farms 2007 (Statistics South Africa) provide an insight into the size of the subsistence and commercial sectors Precise details in relation to non‐commercial and semi‐commercial farming are not available In 2009 207 of South African households were engaged in some form of agricultural production Table 1 reflects household agricultural production patterns in the provinces and shows that the largest proportions of households engaged in agriculture are in Limpopo Eastern Cape Free State and KwaZulu Natal
Table 5 South African households involved in agricultural activities by province (1000s)
Activity Province
Total WC EC NC FS KZN NW GP MP LP
Involved in agricultural production
39 643 35 274 697 108 248 205 580 2 832
27 373 114 319 268 114 71 211 434 207
Livestock production
312 22 26 230 34 27 21 99 778
175 485 621 96 330 310 107 104 171 275
Poultry production
349 11 35 256 23 22 11 146 853
18 543 310 129 367 211 90 51 251 301
Grains and food crops
389 21 316 34 31 128 465 1 390
27 605 122 78 454 315 125 625 801 491
Industrial crops 0 0 0 0
00 02 00 01 06 00 05 00 01 03
Fruit amp vegetable crops
30 220 232 330 40 175 141 173 1 350
759 342 252 847 473 368 705 688 298 477
10 North West Growth and Development Strategy
AgriSETA June 2010
Agriculture Sector Analysis 7
Activity Province
Total WC EC NC FS KZN NW GP MP LP
Fodder grazing pasture grass ndash animals
14 11 53
112 05 38 35 20 20 43 20 07 19
Forestry 0 10
12 01 05 21 01 00 04 04 02 04
Fish farming Aquaculture
0 0 0 0 0 0 0
15 01 00 00 00 00 00 00 00 00
Game farming 0 0 0 0
22 02 13 00 01 00 00 00 02 01
Other 0 0 0 0
00 02 00 03 04 03 03 00 00 02
Numbers smaller than 10 000 are too small for reliable estimates A particular household can be involved in more than one activity and percentages therefore do not add up to 100
Source Statistics South Africa ‐ General Household Survey 2009 (p318)
In 2007 there were 39 982 commercial farms11 in South Africa as opposed to the 45 818 registered in 2002 There has been a clear downward trend in the number of commercial farming enterprises which underscores the needs to grow the commercial agriculture sector to maintain South Africarsquos food sustainability potential and support interventions to develop skills across the agricultural sector especially for transformation and development of the small and emerging agricultural sector
Table 6 Commercial farming enterprises by province ‐ 2002 and 2007
Province 2002 2007 Growth Decline
Eastern Cape 4 376 3 896 ‐ 1097
Free State 8 531 7 515 ‐ 1191
Gauteng 2 206 2 378 780
KwaZulu‐Natal 4 038 3 560 ‐ 1184
Limpopo 2 915 2 657 ‐ 885
Mpumalanga 5 104 3 376 ‐ 3386
North West 5 349 4 692 ‐ 1228
Northern Cape 6 114 5 226 ‐ 1452
Western Cape 7 187 6 682 ‐ 703
Total 45 818 39 982 ‐ 1274
Source Statistics South Africa 2008
Whilst the largest proportions of households involved in agriculture are in Limpopo Free State Eastern Cape and KZN (Table 1) it is in the Free State Western Cape Northern Cape and North‐West provinces where the largest number of commercial farms are located (Table 2) No direct
11 Commercial farms are farming enterprises that are registered with SARS for Value Added Tax (VAT) and income tax
AgriSETA June 2010
relationship can thus be drawn between the numbers of households engaged in agriculture in a province and the numbers of commercial agricultural enterprises AgriSETA WSP data analysis reveals no direct relationship between the number of employers in a province and the number of formally employed persons
Categories of farming enterprises
ldquoDualismrdquo (Mhone 2000) is a useful way of describing the agricultural sector both in terms of understanding the economics of the sector and planning skills development interventions This term describes a formal sector that is well established and an informal or emergent sector with the two sectors reliant on each other and on interventions by the state for integration However these two broad categories have their limitations Within the commercial sector there are large established farming businesses and smaller ones that struggle to survive and within the less formal sector there are emergent farmers striving to achieve commercial success It is necessary therefore to understand the agricultural sector as comprising a number of different economic entities all operating within the same dualistic economic framework The following typology for the agricultural sector reflects the complexity of the agricultural sector
Table 7 Typology of the agricultural sector
Production Unit Turnover Ownership amp Management Number Binding constraint
Support required
Large commercial on private property
gtR2 million
Family owned but incorporated multiple farms Rent in land ndash professional management
plusmn5 400 Market size Equity capital
Export market access Financial market innovation
Medium commercial on private property
R300 000 to R2 million
Family owned could be incorporated Some renting in of land ndash family management
17000 Land capital management
Mortgage capital for land access Management training
Small commercial on private property
ltR300 000 Family owned generally part time Some lifestyle farming (game ranches weekend farms)
24 000 Management time
Commercial in communal areas
gtR300 000 Communal ownership Development projects Private ownership
‐ Capital management infrastructure
Grants for land access Property rights Comprehensive farmer support Credit Physical infrastructure
ldquoEmergingrdquo commercial in communal areas
ltR300 000
gt20 hectares Communal ownership Small farmers in development projects Private ownership
35 000
Land (property rights) Capital labour management Employment opportunities
Grants for land access Property rights Comprehensive farmer support Physical infrastructure Institutional infrastructure
Subsistence farmer in communal areas Allotments Market gardens
lt20 hectares Communal ownership Private ownership Little formal market participation
1256m Employment opportunities
Social welfare transfers
Source Vink and van Rooyen 2009
This confirms the dualism evident from Stats SA data It includes an estimate for emergent farms and provides insight into the different types of farming enterprises Being small and part time can mean subsistence farming but it can also mean running a game farm on a part‐time basis There is considerable scope for farming enterprise to move from being commercial to subsistence and vice versa There is some evidence that there is currently an increase in volatility with quite
Agriculture Sector Analysis 8
AgriSETA June 2010
significant changes occurring mainly due to the global economic down turn and the small margins that many agricultural enterprises operate within It is particularly important to have an understanding of the category of ldquoemergingrdquo farmers those who may be striving to move from subsistence farming to a more commercial model those who have benefited from land reform processes and want to establish an agricultural enterprise on the land that has been allocated to them those who have made use of BEE funding to acquire a stake in a farm and are trying to achieve profitability The emerging farmer sector is neither established commercial farming nor subsistence in nature and is the focus of many of the governmentrsquos efforts to achieve transformation within the sector as a whole
Employment trends
Employee numbers is a more important measure of ldquosizerdquo for the purpose of the SETA and skills planning even though turnover may be more important in terms of economic impact or contribution to GDP The cause of this discrepancy between turnover or GDP contribution on the one hand and formal employment numbers on the other is discussed extensively by Mhone (2000) and others such as Webster (2004) Labour absorption levels in an enclave (second) economy are not optimal One conclusion that can be drawn from this is that skills development will need to be linked to other changes within the sector if it is to contribute meaningfully to job creation Mechanisms need to be found that link growth to jobs and this is not strictly something that the SETA can address However it is important to link skills planning to other processes and opportunities for these will be examined as part of the environmental scan later in this section The past few years have seen huge depreciation in employment levels and a very high unemployment rate ndash currently estimated at 311 The agricultural sector has also witnessed a decline in sector employment largely linked to contraction of the sector The sector is characterised by the need for highly skilled and qualified farm managers and technical staff on the one hand and large numbers of unskilled and semi‐skilled workers on the other Many managers of emerging farms are mainly untrained and unqualified Agriculture relies more on semi skilled labour than other services as reflected in the table below The sector also relies on migrant casual and seasonal labour Table 8 Percentage unskilled to semi‐skilled labour by DTI industry (economic sector) classification
Sector 1995 2008 Growth decline in
skilled labour
Agriculture 990 941 49
Mining 920 879 45
Manufacturing 870 821 56
Utilities 800 688 140
Construction 900 883 19
Trade 840 842 ‐ 02
Transport and Communication 730 768 ‐ 52
Finance 620 595 40
Community and personal services 540 498 78
Total 782 738 56 Source National Treasury 2010
Agriculture Sector Analysis 9
AgriSETA June 2010
Agriculture Sector Analysis 10
Employment in the sector is based on those who work in administration in DAFF and those who work in production and processing at farms and in factories In March 2009 DAFF had 3 285 posts with 2 735 of these filled The table below shows the employment profile at DAFF by occupation race gender and disability as at 31 March 2009 The department employed 57 male employees and 43 female employees There were more African employees constituting 69 of the entire department workforce Very little progress has been made regarding the employment of people with disabilities who constitute only 04 of the workforce This is in line with other department across government where similarly little progress has been made
Table 9 Employee profile ‐ Department of Agriculture Forestry and Fisheries Occupational Category (SASCO)
African Coloured Indian White Totals
M F M F M F M F M F Total
Legislators senior officials managers
15 14 2 2 8 3 25 19 44 16
Professionals 239 241 11 12 4 14 70 64 324 331 655 240
Technicians associate prof
190 153 38 19 9 4 86 57 323 233 556 204
Clerks 93 204 22 42 0 7 13 171 128 424 552 30
Service and sales workers
38 19 4 2 1 17 1 60 22 82 30
Craft and related trades workers
42 3 13 58 0 58 21
Plant machine operators and assemblers
53 1 8 1 62 1 63 23
Elementary occupations
484 96 94 28 1 6 5 585 129 714 262
Totals 1 154 728 182 105 15 25 214 301 1 565 1 159 2 724
Percentage 424 267 67 39 06 09 79 110 575 425 100
People with disabilities
1 1 1 2 6 4 7 11 04
Race 1 882 287 40 515 Percentage 691 105 15 189 Source Dept of Agriculture Forestry and Fisheries (2010)
In respect of occupations and skills profiles the majority of the Departmentrsquos employees are Professionals and Technicians Associate Professionals (444) followed by people employed in elementary occupations (262) Employment across the agricultural sector is subject to growth and decline variations related to a wide range of conditions and circumstances ndash produce prices climate and environmental changes mechanisation technology and the like Since 2002 the trend has been downwards There are a number of reasons for this including mechanisation and casualisation of labour on larger farms the economic downturn impacting on some sub‐sectors and the global trade situation including changes in the foreign exchange rates and the failure of successive DOHA development talks to address inequalities in access to global agricultural markets12 12 The Doha Development Round is the trade‐negotiation of the World Trade Organization (WTO) Its objective is to lower trade barriers globally Talks have stalled over a divide on major issues such as agriculture industrial tariffs and non‐tariff barriers services and trade remedies The most significant differences are between developed nations led
AgriSETA June 2010
Agriculture Sector Analysis 11
It is anticipated that growth of the agricultural sector to meet local consumer demand government initiatives to expand agricultural niche export markets and the development of an aquaculture sub‐sector to counter depletion of natural resources is likely to lead to creation of employment in the sector
Table 10 Workforce changes in the Agricultural sector ‐ 2001 to 2010
Year Workers Year on year difference Variation 2001 969 0002002 1 153 000 + 184 000 1602003 808 000 ‐ 345 000 ‐ 4272004 828 000 + 20 000 242005 778 000 ‐ 50 000 ‐ 642006 886 000 + 108 000 1222007 703 000 ‐ 183 000 ‐ 2602008 764 000 + 61 000 802009 615 000 ‐ 149 000 ‐ 2422010 650 000 + 35 000 54
Quarter 1
Source Statistics South Africa Survey (pp 210‐211)
Employment categories and remuneration
It is difficult to get detailed and accurate yearly statistics on employment by type (full‐time casual and seasonal employees) or on remuneration in the agricultural sector The latest available statistics on commercial agriculture are found in the 2007 Stats SA Census of Commercial Agriculture The following tables reflect survey data on the number of permanent casual and seasonal agricultural sector employees by province as well as total remuneration per province
Table 11 Number of paid full‐time agricultural workers and total remuneration by province
Province 2002 2007 Growth Decline
Number Remuneration
R000s Number
Remuneration R000s
Number Remuneration
Eastern Cape 33 718 329 351 34 253 510 404 16 550Free State 57 607 580 888 53 944 737 796 ‐64 270Gauteng 20 815 344 629 22 979 534 083 104 550KwaZulu‐Natal 75 799 763 439 66 685 968 455 ‐120 269Limpopo 62 635 525 390 35 728 625 436 ‐430 190Mpumalanga 61 603 599 617 46 520 853 396 ‐245 423North West 39 914 409 526 53 741 574 596 346 403Northern Cape 31 077 320 598 26 871 339 948 ‐135 60Western Cape 98 207 1 378 816 90 943 2 029 275 ‐74 472Totals 481 375 5252251 431 664 7 173 389 ‐103 366
Source Statistics South Africa Report 120201 (p1101)
by EU USA and Japan and the major developing countries led and represented by India Brazil China and South Africa Considerable contestation exists over the maintenance of agricultural subsidies operating as trade barriers
AgriSETA June 2010
Agriculture Sector Analysis 12
Table 12 Number of paid casual amp seasonal agricultural workers amp total remuneration by province
Province 2002 2007 Variance
Number Remuneration
R000s Number
Remuneration R000s
Number Remuneration
Eastern Cape 30 936 59 680 30 565 106 497 ‐12 784Free State 57 871 69 595 45 150 98 996 ‐220 422Gauteng 8 722 20 975 11 957 93 461 371 3456KwaZulu‐Natal 37 602 103 946 34 383 154 286 ‐86 484Limpopo 38 614 107 223 31 833 124 159 ‐176 158Mpumalanga 46 480 86 242 32 826 176 363 ‐294 1045North West 46 078 62 653 32 008 75 250 ‐305 201Northern Cape 68 174 121 613 47 874 123 723 ‐298 17Western Cape 124 968 331 406 98 546 485 108 ‐211 464Totals 459 445 963 331 365 142 1 437 843 ‐205 493
Source Statistics South Africa Report 120201 (p1101)
The tables above reflect that the Western Cape was the biggest employer of labour on commercial farms in 2007 with a majority of the employees being casual and seasonal The Eastern Cape employed the least number of commercial farm employees The comparator figures for 2002 and 2007 would appear to show a continuous country wide reduction in employment both in permanent employees and casual and seasonal workers The exception is the North West that has experienced an increase in full time employees The current minimum wage for farm workers (February 2010) is R1 31669 per month13 Monthly salaries differ across sub‐sectors with highest paid workers in primary production in the fisheries and dairy sub‐sectors
Table 13 Approximate monthly wage rates in Agriculture for selected sub‐sectors
Subsector Primary Production ProcessingPack house
Meat R 2000
Dairy ‐ R 2650
Wines R 1100 R 1400
Flowers R 800 R 1200
Fisheries R 5000
(crewman)R 1892
Source DTI 201014
Vink amp van Rooyen (2009) indicate that before the introduction of minimum wage in 2003 the real cash remuneration for employees had been increasing However over time the unit cost of labour (the ratio of the total cost of labour to the total value of output) has been in decline including a steep drop during and after the introduction of minimum wages
13 Department of Labour 2010 14 Source DTI (Data sourced from SAMIC Dairy Industry JAG WOSA SAFEC SA Pelagic Fish Industry Association)
AgriSETA June 2010
Agriculture Sector Analysis 13
In 1970 for every R1 of output 16 cents was spent on labour By 1980 this has dropped to 13 cents for R1 of output By 1994 the figure had increased to 19 cents declining to 17 cents in 1998 and to 117 cents in 2001 By 2007 it had reduced to 108 cents Further research will be needed to establish the current situation but there is reason to believe that the decline has continued with wages being very low both in terms of unit costs and in relation to other groups of workers in the economy
Strictly speaking it is not the role of the SETA to engage in the complex regulatory framework for the agricultural labour market It is for the Department of Labour and NEDLAC with their employer and organised labour stakeholders to find ways of balancing the need for protection of vulnerable workers with the need to create a framework that encourages the creation of jobs and improved job security The reason that more research is needed in this area and in particular detailed discussions with industry and labour representatives is to establish
The extent to which skills development interventions can improve the prospects for job creation and improved job security and
The mechanisms that can be established to enable uninterrupted skills training in the context of casualisation and use of contract and seasonal labour
Stakeholders in the Agricultural sector
National government departments
There are a number of national government Departments and spheres involved in the challenges of the agricultural sector The following table sets out the broad contribution that each department is intended to make
Table 14 Government department roles in relation to Agriculture Department Role
Department of Agriculture Forestry and Fisheries Agricultural policy and support Department of Rural Development and Land Reform Land Reform and land claims settlements Department of Economic Development Economic planning National Treasury Macro economic policy Department of Trade and Industry Industrial strategy (IPAP 2) Department of Water Affairs The management of water supply Department of Labour Labour market policy Department of Higher Education and Training HRD and skills planning and SETAs In relation to public spending on agriculture the agricultural national budget constitutes about 05 of the national budget The figure below reflects trends in national budgeting for the agricultural sector between 19967 and 201112 Some analysts15 have argued that state expenditure on agriculture shows lack of prioritisation of the sector especially considering that the budget remains lower than it was in the late 1980s when it now caters for a greater number of farmers than it did during apartheid segregation
15 Greenberg 2010 p 2
AgriSETA June 2010
Figure 2 National budgets for Agriculture 1996‐2011 (adjusted for inflation)
Source Greenberg 2010
The Department of Agriculture Forestry and Fisheries (DAFF) is responsible for the agricultural sector The department works with various organisations to promote the interests of the sector
bull It registers all South African Pest Control Association (SAPCA) qualified inspectors bull It works with the Agricultural Research Council for research to optimise the control of
migratory pests bull The Directorate on Marketing works with the National Agricultural Marketing Council
(NAMC) on issues related to equitable access to markets including policy formulation issuing of permits and coordinating inter‐departmental relations to enhance marketing
bull Historically the Department has employed a large number of extension officers located in farming communities who have supported and advised farmers This service has been in decline in recent years but remains an important aspect of state support to the sector
The above roles will be subject to some review in the context of IPAP 2 and also the debates around the role of the state in the economy The issue is not only levels of spending but also clarifying the role of government in relation to the business of the sector
Sector representatives
There are three major umbrella organisations representing the interests of farmers AgriSA TLUSA and the National African Farmers Union of South Africa (NAFU) AgriSA and TLUSA represents both commercial farmers and cooperativesrsquo interests through its engagement at national and international level AgriSA is a member of the Southern African Confederation of Agricultural Unions (SACAU) a regional farmersrsquo union for farmers in Southern Africa AgriSA has structures in all the provinces except Limpopo
Agriculture Sector Analysis 14
AgriSETA June 2010
Agriculture Sector Analysis 15
NAFU is a union for predominantly previously historically disadvantaged smallholder farmers with a membership base including farmers agribusinesses farmersrsquo organisations corporations and individuals who support their goals NAFU is represented by different unions in all the provinces There are other employer organisations who are not affiliated to AgriSA and NAFU including
bull Agricultural Industrial and Medium Employers Organisation bull Agricultural Mining and Industrial Chemical Manufacturersrsquo Association bull Agrilabor Employersrsquo Organisation bull Algoa Meat Traders Association bull East Coast Poultry Producers Employersrsquo Association bull East London and District Meat Traders Association bull Fertiliser Industry Employersrsquo Organisation bull Landbou Werkgewersorganisasie (Workinfocom) bull Red Meat Producersrsquo Association
The Agricultural Research Council is an autonomous statutory body that provides research to DAFF and the provincial departments of agriculture Figures available for South Africarsquos investment in agriculture research and development show that South Africa was above international norms of investment in RampD which are 053 of agricultural GDP for developing countries and 236 for developed countries In South Africa in 2000 agricultural RampD investment in relation to agricultural GDP was 30416 There are six major sources of credit for farmers banks (50) agricultural cooperatives and agribusiness (12) the Land Bank (21) private creditors (8) other creditors and financial institutions (9) and government (1) (GCIS 2010)
12 Factors impacting development in the Agriculture sector Several international and local factors impact on the productivity of the agricultural sector and its growth Key amongst these are
Growth of the South African economy and rising consumer demand International trade and trade agreements The global recession and rise in food prices The land reform programme Reliance on imports Water availability Changing consumer patterns and demands (eg organic food stuffs) Technological changes and mechanisms Quality standards Farm safety and security Broad‐based black economic empowerment Legislation Skills demand and supply HIVAIDS
16 Vink amp van Rooyen 2009
AgriSETA June 2010
These key factors are clustered and discussed below
Future sector economic growth and development
South African sector growth plans (IPAP2)
The 20102011 ndash 20122013 Industrial Policy Action Plan (IPAP) identifies five structural challenges that existed in the South African economy before the global economic downturn and which have been exacerbated by the recent economic crisis These challenges were evident even during the time South Africa was experiencing relatively high growth rates between 2005 and 2007 and have continued during the recession These challenges are
1 Structural imbalances in the growth path including growth that is lagging behind other medium and low income countries
2 Uneven performance of the manufacturing sector with some divisions like the automotive sector experiencing exponential growth while other sectors have stagnated
3 Employment growth being sustained by credit extension and consumption rather than by productive sectors leading to a large current account deficit
4 Low profitability of manufacturing 5 Low savings and investment from financial sector growth Only 52 of private credit was
extended to fixed investment in 2008 Key sectors have been identified for IPAPrsquos focus including agro‐processing which has a diverse group of industries and sub‐sectors including food processing beverages aquaculture horticulture medicinal aromatic and flavourants Key action plans for the agro‐processing sector are identified in IPAP2 as
Development of a National Food Control Agency to consolidate the sector Development of aquaculture to supplement dwindling wild fish stocks Designating specific areas for utilisation of aquaculture Development of the organic food sector Development of the small milling industry Enhancing competitiveness in fruit and vegetable canning Improving beneficiation of Rooibos and Honeybush products (IPAP2 2010)
International Trade
South Africa is a major exporter of Agricultural produce In particular South African fruit and fruit‐derived products such as wine and fruit juice are competitive in the global market However in many sub‐sectors where export potential exists ndash grain and meat ndash serious problems face the industry A key challenge is the uneven playing field experienced by South African exporters Major global competitors include the United States and the countries of the European Union where government subsidies in various forms are in place No such subsidies are in place in South Africa making it difficult if not impossible for South African agricultural produces to enter developed country markets due to the prices that they have to ask for products I In addition the value of the Rand has fluctuated from levels of around R10 to the US dollar to as little as R7 to the dollar When the Rand is strong export becomes difficult because it costs more in the case of the move from R10 to R7 a 30 cost increase for the importer It is impossible to
Agriculture Sector Analysis 16
AgriSETA June 2010
Agriculture Sector Analysis 17
predict whether the World Trade Organisation negotiations known as the DOHA Round will achieve progress in the coming years Historical evidence is that during periods of global recession developed economies become more protective not less and so the current outlook is not good Nor is it possible to predict the value of the Rand though current thinking in government is to move toward a weaker Rand to encourage exports These are two key variables that will need to be factored into the different sector growth scenarios for the future
Global recession and rise in food prices
Economic growth slowed down significantly in sub Saharan Africa and in South Africa in 2009 but there appear to be signs of recovery GDP growth in the region declined from about 6 in 2004 ndash 2008 to about 18 in 200910 GDP growth in South Africa was 16 in 2009 17and rose to 46 in the first quarter of 201018 though much of this is related to the income derived from the 2010 FIFA World Cup and may not be sustained Projections are generally for a slow revival with a set back after the slight rise resulting from the World Cup A return to the 6 levels of the 20078 could take some years The global recession reduced the demand for African exports and reduced capital flows to the region but it is anticipated that the demand for mineral resources by Asian and Western powers will result in both the expansion of exports and expanded foreign direct investment The competition between India and China for African markets is also expected to boost trade to the benefit of African suppliers South Africa is expected to particularly benefit from direct foreign investment from China and India China has already become South Africarsquos largest market for exports and supplier of imports19 Rising food prices have forced governments around the world to control prices of maize bread rice and dairy products In South Africa ldquofood price inflation between December 2005 and December 2006 averaged 788 rdquo20 Although efforts are being made to reduce barriers to poorer families in relation to basic food there has been no move to subsidise food generally This may change though the space for significant levels of support is restricted because of reduced revenue from income taxes resulting from the recession The global credit crunch and recession have meant a reduction in public expenditure and funding which has affected the agricultural sector21
Land reform
In South Africa specifically land reform has a significant bearing on food security and agriculturersquos contribution to GDP The objective of the land reform programme is to transfer 30 of agricultural land to black ownership by 2014 (deferred to 2025) to ensure more equitable access to land by historically disadvantaged people and to increase their participation in agricultural activities22 Land reform has been informed by four processes23
17 Department of Agriculture Forestry and Fisheries 2010 18 Stats SA 2010 19 Department of Agriculture Forestry and Fisheries 2010 20 Department of Agriculture Forestry and Fisheries 2010 ‐2011 Strategic Plan 21 Economic Commission for Africa 2009 22 Xingwana 2008 23 CDE 2008
AgriSETA June 2010
Agriculture Sector Analysis 18
Land restitution involving returning land or providing financial compensation to those whose land was dispossessed during apartheid
Land redistribution transferring more land to the historically disadvantaged Tenure reform modernising land tenure rules and access to land ownership and Providing financial support for the development of emerging farmers
In relation to progress with land reform by September 2009 only 69 of agricultural land (about 567 million hectares) had been transferred and a majority of the beneficiaries have not yet occupied the land due to lack of infrastructure input or technical support The following table gives an indication of the progress of land reform since the inception of the first democratic government
Table 14 Land transfers and beneficiaries ‐ 1994 to 2009
Province Redistribution and tenure Restitution Total Hectares Beneficiaries Claims Hectares Beneficiaries Hectares Beneficiaries
Eastern Cape 675 353 357 25 633 16 201 94 834 215 201 448 191 240 834
Free State 799 350 291 7 721 2 662 47 615 40 893 397 906 48 614
Gauteng 286 34 513 7 328 13 159 9 476 70 179 43 989 77 507
KwaZulu Natal 690 547 414 67 761 14 752 642 447 433 168 1 189 861 500 929
Limpopo 291 91 235 7 403 3 382 513 024 220 227 604 259 227 630
Mpumalanga 444 322 839 13 950 2 694 399 876 225 877 722 715 239 827
Northern Cape 271 952 744 2 773 3 682 539 620 100 554 1 492 364 103 327
North West 300 268 566 40 539 3 709 373 642 172 963 642 208 213 502
Western Cape 223 122 304 12 750 15 546 3 769 118 165 126 073 130 915
Total 3 979 3 043 264 185 858 75 787 2 624 303 1 597 227 5 667 567 1 783 085
Source Greenberg 2010
Achievement of the 30 land reform target is being made difficult by land prices Under the willing buyer willing seller scheme the government will need R74 billion to be able to purchase enough land While resources may be available there are suggestions of lack of capacity The Department of Rural Development and Land Reform (DRDLR) was able to spend only 31 of its land reform 200910 budget in the first six months of the financial year Going forward this Department needs to identify what the real challenges are with the pace of land reform delivery so that they can be mitigated to meet the 2025 target A priority is the retention of skills skills transfer and skills development during the transfer of land as well as retention of national food production to avoid loss of production Support for new beneficiaries of land to ensure sustained productivity is derived from two main sources of funding ndash the Broadening Access to Agriculture Thrust (BADAT) and the Comprehensive Agricultural Support Programme (CASP) CASP is a conditional grant from the Department of Agriculture Forestry and Fisheries to provincial departments to support emerging farmer development Provincial farming budgets dedicated for farmer support in Mpumalanga the Free State Northern Cape and the Western Cape have risen significantly and those in KwaZulu Natal and Gauteng have witnessed a slight increase Eastern Cape and Limpopo agricultural budgets have been steady The North West is the only province where there has been a sharp decline in the share of the budget dedicated to farmer support24
24 Greenberg 2010
AgriSETA June 2010
Agriculture Sector Analysis 19
Reliance on imports
Overall the Agriculture sector contributes positively to the balance of payments ldquoSouth Africa remains food secure The value of our exports increased by 464 from R33 656 million in 200708 to R49 278 million in 200809 During the same period the estimated value of imports rose by 12 from R34 009 million to R38 401 million resulting in a positive trade balancerdquo25
South Africa depends largely on world markets for seed production and agrochemicals Regarding seed production there are only three community seed production schemes in Limpopo and Mpumalanga being piloted with state funding Ten top large companies including two South African companies and multinationals have rights to over two thirds of registered seed varieties in South Africa Despite the dominance of genetically modified and hybrid seed in some sub‐sectors like maize sunflower and sorghum open‐pollinated varieties have been resilient in South Africa enabling the possibility of alternative seed sources not dependent on technological processes26 In relation to agrochemicals deregulation and liberalisation in the fertiliser sector led to the shutdown of local production capacity and South Africa became an importer of fertiliser for the first time in 2000 There are three large players in the fertiliser sector Sasol Nitro Yara and Omnia South Africa imports an estimated 70 of fertilisers and pesticides Fertiliser prices rose by over 200 between 2006 and 2008 but dropped somewhat after that However this hike signified the volatility of the agrochemicals industry and South Africarsquos dependency on imports and the potential risk for emerging farmers and food production of this dependence on imports as the country cannot control the prices making inputs both difficult to budget for and in many cases unaffordable The price of agrochemicals is also particularly influenced by the prices of oil and the exchange rate The general understanding in relation to job creation is that a weaker Rand will improve exports and therefore enable job creation Of course the down side of this strategy is that imports become more expensive So what may be an advantage for those sub‐sectors who are expanding their export volumes those relying on imported agro chemicals will be under increased pressure
Water
Water is both an essential and scarce resource for the agriculture sector and is being threatened by climate changes Crop production relies heavily on water and yet access to water is not being addressed in a systematic way in the land reform processes Greenberg suggests that the relationship between land reform agricultural support and water resource provision is inadequate and a way to address this could be established by linking water provision to land transfer or investing in irrigation for both commercial and resource‐poor farmers However investing in irrigation in the context of water scarcity and climate change may not be the best option What could be needed is finding ways to maximise efficiency of the 60 of South African
25 Department of Agriculture Forestry and Fisheries Strategic Plan 201011 26 Greenberg 2010
AgriSETA June 2010
Agriculture Sector Analysis 20
water used for irrigation by for example using methods such as drip or micro‐irrigation which are expensive to set up but which reduce water wastage by 5‐1027 The Department of Water Affairs is responsible for managing water supply and has to give authorisation for agricultural projects and other developments The department needs to be seen as an important stakeholder in the agricultural sector
The labour market
South Africa recorded an unemployment rate of 243 in 2009 (narrow definition) If people who are no longer actively seeking work are considered the broad unemployment rate rose from 267 to 313 illustrated in the figure below As a direct consequence of the global economic downturn in 2008 870 000 formal jobs were lost in 200928 Others have quoted a figure of over 1 million
Figure 3 Official unemployment in South Africa 2003 ‐2009
Source National Treasury 2010
Annual employment loss followed sector growth patterns with agriculture mining manufacturing and trade facing the highest job losses as their sector growth contracted Unemployment is especially a major problem among lower skilled workers and younger people Youth employment in the 15 ‐24 year age group has fallen by 219 000 (136) and 483 of people in this age group are unemployed Employment of semi‐skilled and unskilled workers has contracted by 527 000 and male employment has gone down by 550 000 (71) while that of women has decreased by 320 000 (52) The number of discouraged workers ie those no longer actively seeking work has increased from 518 000 to 17 million29 Clearly the existence of a very large pool of largely unskilled unemployed workers has an impact on the farming sector It drives wages down and creates opportunities for casualisation and the expansion of labour contract agencies and brokers In addition there are significant numbers of foreign nationals mainly from Zimbabwe and Mozambique who are seeking work and often finding it on farms and in primary processing and packaging plants There are benefits to the
27 Greenberg 2010 28 National Treasury 2010 29 National Treasury 2010
AgriSETA June 2010
Agriculture Sector Analysis 21
sector with skilled and semi‐skilled workers coming into the labour market and being absorbed into the workforce and helping raise productivity levels However at the lower skilled end of the market the existence of this pool brings further casualisation and downward pressure on wages Tensions are likely to increase and further protests either in the form of xenophobic outbreaks or actions against farmers may well increase A view often expressed by farm employers is that current labour legislation makes dismissing workers difficult and so the availability of labour without entering into contracts of employment is an attractive way of avoiding the legislation and its obligations Organised Labour is seeking to restrict these opportunities through either regulating or eliminating labour brokers and efforts are being made to regulate the use of foreign labour However for the foreseeable future the trend is for formally employed people to be reduced in number In relation to the emergent sector there will also be a reluctance to enter employment contracts with workers The fact that many households are engaged in some form of largely unpaid agricultural work means that there is significant casual work dating back many years Helping change this situation into one where casual or unpaid jobs are transformed into formal jobs with regular wages will take time It is also likely that as some emergent farms become established they will act similarly to established farms and institute a form of casual labour rather than expanding a workforce for which they would have to take a level of responsibility From an AgriSETA perspective these labour market trends mean that whilst levy income can be directed at a relatively small labour pool one that is manageable in terms of planning and implementation the size of the informal casual and unemployed labour force in the sector ‐ for whom no levy is paid and who have no employer to plan for their skills needs ndash is very large and its needs almost unlimited Clearly the relationship with the National Skills Fund (NSF) becomes critical in respect of the entire non‐levy income sector Again the level of support available from non‐levy income sources will be an important variable in looking at future sector skills development scenarios
Consumer trends
South Africa currently produces enough food to meet the needs of its population However consumption of three main staples maize wheat and vegetables has been volatile since 1985 and remains below 1990 levels Consumption of maize and vegetables by South Africans is 17 and 32 less respectively than in 198530 The main reasons for this lie in the growing levels of poverty and the difficulties that families have in purchasing nutritious food Whilst government has increased the levels of social grants and increased the number of people receiving grants to around 13 million the incomes of poor families have been badly hit by a range of factors including job losses and rises in food prices The approximately 1 million people who lost their jobs in 20089 meant a loss of income for many millions of dependents Rises in food prices have also had a disproportionate impact on the poor Whilst food is available it is often not accessible to families on the income levels that they have to manage within The result is that less and less nutritious food is purchased which in turn impacts on the ability of farmers to sell their products locally 30 Greenberg 2010
AgriSETA June 2010
Agriculture Sector Analysis 22
Whilst there is no evidence that government will reduce its efforts in relation to poverty relief and social benefits including such programmes as school feeding schemes and food parcels during periods of drought the state of public finances may not enable to support the poverty that grips many rural areas If real income levels for the poor were to rise it could have a significant impact on the economy of the agricultural sector Equally an improvement in the rural economy with increased agricultural production and jobs would dramatically impact on the capacity of people to buy nutritious food Achieving a positive growth path in rural areas is a huge challenge for government and one that is key to governmentrsquos Medium Term Strategic Framework and Industrial Policy Action Plans
HIVAIDS
South Africa has a high prevalence of HIV and AIDS The HIV prevalence among people aged two and above was estimated at 109 in 2008
Table 15 Estimated HIV percentage prevalence by age group (2002 ndash 2008)
Age 2002 2005 2008 Change
Children (2‐14 years) 56 33 25 ‐31
Youth (15‐24 years) 93 103 87 ‐06
Adults (25 and older) 155 156 168 13
15‐49 year olds 156 1692 169 13
Total (ages 2 to 49) 114 108 109 ‐05 Source Avert 2009
The table above shows that HIV prevalence is highest amongst those aged 25 years and older Given youth labour market analyses which point to people from previously disadvantaged backgrounds mainly African males accessing formal employment for the first time at age 25 ‐27 this population can be held to represent people in employment Research31 has estimated that by 2020 the pandemic will have claimed at least 20 of employees in the agricultural sector Southern Africa
in
HIV and AIDS have significant ramifications in the agricultural sector for both commercial farming and subsistence farming The implications include
bull Decrease in cultivated land bull Focus on less labour intensive crop and animal production bull Decrease in womenrsquos agricultural productivity as they take on a more care giving role bull Loss of skills bull Increase in absenteeism from work bull Decrease in daily work outputproductivity because workers are weaker from infections
There are suggestions that the impact of the pandemic in South Africa demands sectoral intervention although this may be difficult in the agricultural commercial sector as
bull Seasonal workers who seem to be more vulnerable to infection because of their low socio‐economic status are not in one place long enough for care programs Further
31 Ingelozi Management Solutions 2008
AgriSETA June 2010
Agriculture Sector Analysis 23
farmers and employers may not feel responsible for seasonal workers in the same way they would invest in their permanent employees
bull There may be uncertainty around land reform which may put HIV intervention on farms on the back burner
bull There are no policies that enforce HIV education and care on farms in the same way that legislation like BEE does for ownership As a result HIV intervention may be left to goodwill and employers may feel it is more important to comply with issues that are monitored
Farm safety and security
South Africa has been plagued by unacceptably high levels of violent crime and murder for many years now Farms have experienced this and those living on farms feel and are extremely vulnerable The South African Chamber of Commerce and Industry (SACCI) has argued that
Using the nominal GDP figure for 2009 of R24 trillion a 322 percent contribution of agriculture to GDP and an estimate of 39982 farms (as at 2007) in South Africa the cost of a murderattack on a farm to the economy was R1932869 per annum
SACCI acknowledges that this estimate is flawed as it does not take into consideration the fact that farming units contribute differently to GDP and that not every attack or murder contributes to farm shut down or loss of productivity However if not addressed these attacks could lead to loss of farming sectors as farmers migrate to lsquosaferrsquo regions This will affect employment and GDP contribution of the sector The need for safety and security on farms may also shift farmersrsquo focus in skills development to include personnel who have skills in safety and security
Broad‐based Black Economic Empowerment
The aim of the AgriBEE Charter (gazetted in 2008) is to increase the involvement of black business in agriculture through ownership and control as executives and senior managers of new and existing agricultural businesses The extent to which AgriBEE is transforming the sector is not known as it is too early to tell but a recent survey conducted by ABC and the IDC showed that among the ABC respondents in 2007 46 of enterprises were busy constructing a BEE strategy and 46 claimed to be implementing a BEE strategy A survey of the dairy industry in the Western and Eastern Cape in 2008 showed that only 6 of firms had a BEE strategy in place It also seems from survey data that companies are focusing on the skills development and socio‐economic aspects of BEE rather than on ownership32 It would appear that although there have been some significant BEE purchases of viable farms and some employee empowerment projects including some quite high profile ones in the Cape Winelands the extent of ownership change had been limited One of the factors is the very high level of single person or family ownership in the agricultural sector BEE is more straight forward in the corporate world where shares can be exchanged For a family business it is a matter of selling off part or all of the land and the tendency is to sell off those areas of the farm that are expendable from a business sustainability perspective
32 Greenberg 2010
AgriSETA June 2010
Whilst there is discussion in government about the ending of the ldquowilling buyer willing sellerrdquo concept the Constitution itself provides for property rights and so although some pressure may be exerted through legislation and regulation the extent and speed of change may not be fast The mechanisms for encouraging the transfer of significant levels of ownership have not yet been created The focus of the SETA is therefore likely to be more the beneficiaries of land reform and emergent farmers though projects of a BEE nature can be targeted as they arise
Conclusions and scenarios It is useful when looking at possible scenarios to examine the key variables or uncertainties and to project how variations one way or the other will have an impact on the development and growth of the sector From the sector analysis and factors that are contributing to change in the sector there are some key factors that seem to emerge First appears to be the economy and related issues of the labour market and the challenges of labour absorption in an enclave economy These factors determine on the one hand whether there will be growth and development and on the other whether such improvements will result in improved employment opportunities and the creation of a virtuous cycle of development Second is the role of the state and the various government departments whose plans and work impact on the agricultural sector Related to this is land reform that is inevitably driven by the state and not the owners of land or the landless The view expressed by many engaged in agrarian reform is that the state must play a significant role It becomes clear that a successful agricultural enterprise requires a number of factors to be in place to be successful These include access to land (Department of Rural Development and Land Reform) agricultural support within a supportive agricultural framework (Department of Agriculture Forestry and Fisheries) access to consistent water supply (Department of Water Affairs) access to finance (Department of Trade and Industry various state agencies) conducive labour market regulation (Department of Labour) sound industrial policy (Department of Trade and Industry) economic planning and macro policy (Department of Economic Development National Treasury) and appropriate education training and skills development (Department of Higher Education and Training the Human Resources Development Council NSA and the SETA) There are other government departments as well as provincial and municipal structures that also play a role The following analyses show how the four variables
economic growth and development role of the government labour market changes and land reform)
impact positively or negatively on the growth of the sector and the demand for skills
Agriculture Sector Analysis 24
AgriSETA June 2010
Agriculture Sector Analysis 25
HHIIGGHH GGRROOWWTTHH SSCCEENNAARRIIOO
The economics of the sector Role of government
The economy in SA and globally continues to revive albeit slowly for the next few years
Roles and integration of national government departments are clarified Specific functions are agreed processes put in place and personnel appointed with the required skills
International trade agreements are still weighted infavour of US and EU but progress is being made and specific blockages are addressed in bilateral talks
The roles of Departments (DWA DAFF DRDLR DoL DTI DED DHET) are clarified with appropriate joint plans and coordinating structures
The rural economy gradually improves with the buying power of the poor increasing and more stable markets created for local produce
For each of the functions agreed in each of the related departments appropriate structures and systems are put in place and staff trained
Exports increase in key areas identified in IPAP 2 and the Rand exchange rate stabilises at a level not too much different than it is today
Specific capacity is put in place at local level to support implementation of land reform and rural development
There is a growing understanding of the concept of dualism and the need to intervene with labour absorption and development mechanisms
Land claims are all finally settled and ownership and tenure is resolved There is a serious drive to establish effective agricultural enterprises
An understanding is reached on the role of agencies and labour brokers and abuse is curbed
The willing buyer willing seller approach is resolved and enables viable land to become black owned
Some relaxation of labour market regulations are agreed that maintain some minimum standard of employment but assist absorption
Land transfer to black and emergent farmers is done in a manner that integrates then into the supply chains of the sector
Mechanisms are found to address skills needs in the context of casual and seasonal work patterns
Financing of land reform and transfer is done on the basis of agreed development plans including skills
Labour market reform Trajectory of land reform LLOOWW GGRROOWWTTHH SSCCEENNAARRIIOO
The economics of the sector Role of government departments The economy in SA and globally stagnates at current levels and the economy struggles to pick up after the temporary 2010 World Cup boost
A lack of purpose at government level means limited progress for another five years Land reform remains a commitment without a plan
International trade agreements are still weighted infavour of US and EU and protectionism increases as a result of the global recession
The roles of Departments (DWA DAFF DRDLR DoL DTI DED DHET) are unclear and there is no proper co‐ordination
SArsquos Gini coefficient continues to worsen with rural poverty increasing and local economies declining
There is a lack of effective structures systems and processes to implement policy across departments
Rand volatility causes problems for importers and exporters Well established markets are maintained but exports decrease
At local level the decline in the agricultural extension officer functions continues and limited practical support is available
Understanding of the rural economy is so diverse that stakeholders cannot agree the problem let alone the solution to low absorption levels
Land claims take too long and land reform processes leave potentially productive land poorly developed and managed
Casual labour and labour brokers remains an issue of dispute Confrontation results in bitterness and resentment
The impasse caused by a rigid interpretations of property clauses in the Constitution continues to stall achievement of the 30 black ownership target
Labour market regulation continues to be a contributing factor to reducing levels of employment
Black owned farms find it difficult to become part of supply chains and are unable to perform adequately
Unstable employment patterns in the sector make skills interventions difficult to manage and largely ineffective
Financing of land reform and land transfer continues to be wasted as it is not tied to the building of appropriate capacity
Labour market reform Trajectory of land reform
AgriSETA June 2010
These analyses can be translated into four potential growth and development scenarios for the agricultural sector which are based on the requirements for a strong development state Scenario 3 Weak government support
and sound economy
Econ
omic fa
ctors glob
ally n
ationa
lly and
locally
Scenario 1 Integrated government support and sound economy
The economic upturn triggered by the World Cup continues and globally things improve enabling an expansion of exports The government because of a lack of integrated policy planning and implementation provides limited support for sector development The gains go to the well established enterprise owners with few gains for emerging farmers and local communities
Government departments coordinate their efforts to achieve maximum impact There are favourable economic conditions that create opportunities for advance Within this positive environment the role of the AgriSETA becomes a central component of a comprehensive strategy for growth and skills interventions are targeted to achieve maximum effect Results in growth in sustainable enterprises and expanded employment opportunities
Government policy and support Government policy and support
Combination of disjointed government policy planning and a weak and increasingly marginalised rural economy Economic conditions result in unsustainable farming conditions and employment declines along with productivity Food shortages and the lack of development in rural areas leading to increasing social tensions A vicious cycle develops with the sector going into long term decline
Government departments coordinate their efforts to achieve maximum impact However economic conditions hamper progress Efforts by the AgriSETA are undermined by poor labour absorption and job insecurity Some significant successes are recorded including some NSF funded projects that result in sustainable enterprises A platform is laid for future improvements when the economic conditions improve
Scenario 4 Weak state and economy Scenario 2 Strong state but weak
economy
Agriculture Sector Analysis 26
AgriSETA June 2010
Agriculture Sector Analysis 27
SECTION 2 DEMAND FOR SKILLS
AgriSETA registered employers and employee coverage
In 2009 17 234 employers were registered with the AgriSETA comprising 15 394 small employers (less than 50 employees) 1 202 medium sized employers (50 ‐ 149 employees) and 638 large employers (more than 150 employees)
Considering that there are around 40000 commercial farms33 the 17 234 employers represent around 43 of commercial farms Notwithstanding changes in the sector as a result of land reform and sector shrinkage this is a sizable proportion and is held to be sufficiently representative for the purpose of skills development planning However this paints an incomplete picture It understates the representative nature of large enterprise registered with the SETA and overstates the representative nature of small registered enterprises 4 175 (242) of the enterprises are levy paying members Further only 1 673 (11) workplace skills plans (WSPs) were submitted
Table 16 Registered employers by size and sub‐sector Sub‐sector Description
Employers Small Medium Large
CoffeeTea Processing and marketing of coffee and tea including coconuts cocoa nuts olives dates etc
33 4 3
Fibre Grading ginning packing of wool and cotton raw material 1 676 16 18
Fruit Fruit packed in cartons fruit juice concentrate drummed and fruit juice in container ready for consumption
271 36 57
Fruit exporters and importers 6 0 1
Grain
Manufacture of grain mill products and starches 119 5 7Handling and storage of grain 67 7 23Wholesale amp retail trade in Agricultural machinery 213 9 4Sale and distribution of Agricultural raw materials and other farming inputs
182 9 3
Milling
Manufacture of flour and grain mill products including rice and vegetable milling grain mill residues
120 15 11
Manufacture of prepared animal feeds 110 19 0Manufacture of pet foods 42 9 0Manufacture of starches and starch products 7 1 1
Pest control
Pest Control 209 4 0
Poultry Poultry and egg production including the slaughtering dressing and packing of poultry
305 49 37
Primary
Growing of Cereals and other crops (not elsewhere classified) 902 160 34Growing of Vegetables Horticultural specialties nursery products
943 120 72
Growing of Vegetables Horticultural specialties (Including Ornamental Horticulture) and nursery products
11 5 0
Sugar plantation including sugar cane and sugar beet etc 9 4 2
33 SARS statistics 2007
AgriSETA June 2010
Agriculture Sector Analysis 28
Sub‐ Description Employers Growing of fruit nuts beverage and spice crops 1795 255 143Farming of cattle sheep goats horses asses mules and hinnies Dairy farming
2 252 59 18
Other animal farming production of animal products (NEC) 433 25 12Ostrich farming 5 0 0Game farming 16 0 0Growing of crops combined with farming of animals (Mixed farming)
2 920 256 109
Growing of coffee and tea including coconuts cocoa nuts olives dates etc
2 0 0
Agricultural and animal husbandry services except veterinary activities
438 22 9
Other animal farming (not elsewhere classified) 11 1 1Growing of trees as second crop by farmers 126 18 4Fishing operation of fish hatcheries and fish farm 913 10 6
Red meat
Production and animal products (not elsewhere classified) 6 0 0Slaughtering dressing and packing of livestock including poultry and small game for meat
317 40 17
Production sale amp marketing of Agricultural by products (eg bones hides)
61 2 0
Slaughtering dressing and packing of livestock including small game for meat and processing of ostrich products
2 1 0
Wholesale trade in Agricultural raw materials and livestock 193 7 10Transport of livestock as supporting activity 224 0 0Agricultural and livestock research 215 9 3
Seed Seed production and marketing 149 12 6
Sugar Manufacture of sugar including golden syrup and castor sugar
45 5 21
Tobacco Processing and dispatching of tobacco 46 8 6 TOTALS 15 394 1 202 638Source AgriSETA WSP data
The largest number of registered small and medium enterprises are found in the mixed farming sub‐sector while most large enterprises are in the growing of fruit nuts beverage and spice crops sub‐sector
Employee coverage in the AgriSETA
Collectively the 17 234 employers registered with AgriSETA employed a total of 239 076 employees This represents 39 of the agricultural labour force in 2009 The 1 673 employers who submitted WSPs in 2009 employed 97 898 employees representing 41 of the total number of people employed by registered employers While the number of registered employers submitting WSPs is small (11) they employ a sizeable number of employees and the percentage of employees provides a statistically significant sample The data for larger enterprises is statistically much more representative than that for small enterprises
AgriSETA June 2010
Table 17 Number of employees of registered employers by sub‐sector
Sub‐sector
Sub‐sector description Employees
CoffeeTea Processing and marketing of coffee and tea including coconuts cocoa nuts olives dates etc
483
Fibre Grading ginning and packing of wool and cotton raw material 6 539
Fruit Fruit packed in cartons fruit juice concentrate drummed and fruit juice in container ready for consumption
27 661
Fruit exporters and importers 212
Grain
Manufacture of grain mill products and starches 133Handling and storage of grain 18 303Wholesale amp retail trade in Agricultural machinery 795Sale and distribution of Agricultural raw materials and other farming inputs 2 898
Milling
Manufacture of flour and grain mill products including rice and vegetable milling grain mill residues
3 634
Manufacture of prepared animal feeds 731Manufacture of pet foods 160Manufacture of starches and starch products 105
Pest control
Pest Control 119
Poultry Poultry and egg production including the slaughtering dressing and packing of poultry
19 187
Primary
Growing of Cereals and other crops (not elsewhere classified) 10 104Growing of Vegetables Horticultural specialties and nursery products 37 799Growing of Vegetables Horticultural specialties (Including Ornamental Horticulture) and nursery products
195
Sugar plantation including sugar cane and sugar beet etc 220Growing of fruit nuts beverage and spice crops 47 043Farming of cattle sheep goats horses asses mules hinnies Dairy farming
3 382
Other animal farming production of animal products (NEC) 4 203Ostrich farming 0Game farming 0Growing of crops combined with farming of animals (Mixed farming) 28 722Growing of coffee amp tea including coconuts cocoa nuts olives dates etc 0Agricultural and animal husbandry services except veterinary activities 970Other animal farming (not elsewhere classified) 513Growing of trees as second crop by farmers 1 294Fishing operation of fish hatcheries and fish farm 1 589
Red meat
Production and animal products (not elsewhere classified) 0Slaughtering dressing and packing of livestock including poultry and small game for meat
5 128
Production sale amp marketing of Agricultural by products (eg bones hides) 116Slaughtering dressing and packing of livestock including small game for meat and processing of ostrich products
0
Wholesale trade in Agricultural raw materials and livestock 1 697Transport of livestock as supporting activity 0Agricultural and livestock research 534
Seed Seed production and marketing 2 127Sugar Manufacture of sugar including golden syrup and castor sugar 10 478Tobacco Processing and dispatching of tobacco 2 002 Total 239 076
Agriculture Sector Analysis 29
AgriSETA June 2010
Agriculture Sector Analysis 30
Source AgriSETA WSP data
According to the WSP analysis the sub‐sector for the growing of fruit nuts beverage and spice crops employed the largest number of people In six sub‐sectors there are employers who do not employ workers These are probably family based organisations where family members help in the business without drawing a salary These are in transport and livestock research slaughtering dressing and packing of livestock including poultry and small game for meat growing of coffee and tea including coconuts cocoa nuts olives dates etc ostrich farming and game farming
Table 18 Employee distribution by province Province Employees Percentage
Eastern Cape 18 844 192 Free State 1 946 20 Gauteng 2 788 28 KwaZulu‐Natal 5 416 55 Mpumalanga 8 062 82 North West 3 290 34 Northern Cape 5 436 56 Limpopo 1 730 18 Western Cape 50 386 515 Grand Total 97 898
Source AgriSETA WSP data
Of those submitting WSPs registered employers in the Western Cape employed the largest number of people while employers in Limpopo employed the least number of employees Free State has a small number of employees covered by WSPs submitted to the SETA whereas Eastern Cape with a relatively small number of registered farms has a very large number of employees on farms submitting WSPs Given this variance between provinces the use of WSP data for extrapolation purposes must be viewed cautiously
2009 WSP equity information was only provided for about a quarter of employees (25 637 or26)34 No information was available from the WSPs on non‐South Africans working on commercial farms
Table 19 Equity profile from 2009 WSP data African Coloured Indian White
Totals M F D M F D M F D M F D
8 040 5 785 38 5 097 5 228 24 22 25 0 811 556 11
580 417 03 493 505 02 468 532 00 589 403 08 13 863 10 349 47 1 378 25 637541 404 02 54 100
Total EquityTotal Male Total Female Total Disability
13 970 11 594 73 545 452 03
Source AgriSETA WSP data
Using currently available data it is not possible to provide disaggregated employment data by sub‐sector This will require a small change in the way that gender race and disability data is
34 Some employers did not complete race and gender information when giving their employment profiles
AgriSETA June 2010
codified during WSP data‐capturing including allocation by sub‐sector What can be stated is that employment of males is more dominant than that of women and more Africans are employed in the sector than other groups Employment of people with disabilities is below 1
21 Skills demand
The National Education and Training Strategy for Agriculture (AET Strategy)
The AET Strategy developed by the Department of Agriculture Fisheries and Forestry (in consultation with various key stakeholders in the agricultural sector) highlights priority skills needs and constraints within the sector and categorises needs within the following 5 broad areas
1 Agricultural production ndash requesting that the past focus on a narrow band of commodities (relevant mainly to the commercial sector) and related research be expanded to address the needs of small‐scale and subsistence farmers (eg more focus on mixed farming and rural livelihood sustainability skills)
2 Agricultural engineering ndash with specific focus to be placed on technologies suitable for small‐scale farmers (eg relevant and post‐harvesting techniques related to processing and storage of produce) ndash to address this need the scarcity of agricultural engineers requires attention
3 Agricultural economics ndash a critical need was identified for general agricultural economic skills (ranging spectrum of farm planning farm management enterprise management marketing finance etc) ndash with the need to training both farmers and extension officers in such fields
4 Agricultural development ndash a specific need was identified to develop agricultural extensionists in supporting especially emerging and small‐scale farmers over the full spectrum (a need exists for both new curriculum in the training of new extensionists and the re‐training and upgrading of existing officers)
5 Veterinarians ndash the need to develop state veterinarians in order for the state to perform its role and function (particularly in its preventative monitoring and regulatory role and function)
AGRISETA sector skills planning demand data (2008‐2009)
The following section reflects initial research on skills demand in the Agricultural sector arising from the sector analysis (section 1) previous AGRISETA skills demand research for Sector Skills Planning during 2005‐2009 and analysis of WSP data from 2009 With the introduction of the Organising Framework of Occupations and agreement on definitions for scarce and critical skills in 200506 the AGRISETA undertook an extensive research and consultation processes to determine skills development priorities for the sector The research methodology employed was based on the a four dimensional topology for establishing and evaluating skills needs illustrated in the figure below
Agriculture Sector Analysis 31
AgriSETA June 2010
Agriculture Sector Analysis 32
The identification and prioritisation of skills needs was also undertaken from a key stakeholder and beneficiary perspective Consideration was given to needs of the following groups
bull The unemployed ndash helping them gain andor regain entry to the labour market bull The economically inactive ndash helping them to become economically active bull School leavers ndash helping them gain access to further education and training opportunities
and thus facilitating their entry to the job market bull Entrants to the job market ndash facilitating employment and integration into the work culture
and work ethic (improving the employability of an individual) bull Those currently employed in the sector ndash increasing their competency and opportunities
for advancement creating a career path and offering continued job security enhancement of value adding to the sector improving their prospects for better employment opportunities
bull Organisations and enterprises within the sector ndash making sure that skills development and knowledge creation occurs in such a way as to improve the sectorrsquos viability and allowing companiesenterprises to become more sustainable and profitable along the way improving productivity competitiveness and innovation within organisations
In organising and reporting the identified priority skills development needs (200809) the following structuring approach was followed
Tier 1 The four categories of needs as per the Topology presented above were used for the identification evaluation and grouping of needs
Pay conditions
Image
RECRUITMENT DIFFICULTY
SKILLSGAP
SKILLSSHORTAGE
LABOURSHORTAGE
Firms experience difficulty recruiting This does not necessary imply a skills shortage ndash may indicate a poor image remuneration etc
Those currently in work do not have the requisite skills set to carry out their job to an optimum standard
Required skills are in short supply when compared with the demand across the whole labour market
Regardless of skills levels a situation exists where there is simply not enough supply of labour to meet demand
Pay conditions
Image
RECRUITMENT DIFFICULTY
SKILLSGAP
SKILLSSHORTAGE
LABOURSHORTAGE
Firms experience difficulty recruiting This does not necessary imply a skills shortage ndash may indicate a poor image remuneration etc
Those currently in work do not have the requisite skills set to carry out their job to an optimum standard
Required skills are in short supply when compared with the demand across the whole labour market
Regardless of skills levels a situation exists where there is simply not enough supply of labour to meet demand
Figure 4 Topology for identifying skills development priorities
Source AGRISETA SSP Annual Update August 2009
AgriSETA June 2010
Tier 2 Within each of the first tier groupings needs were further broken down and organised per target group At this second level needs were grouped by
o General skills development needs (cross‐cutting over different target groups) o Needs experienced by small scale farmers (this group included subsistence
farmers new emerging land reform beneficiaries and small‐scale AgriBEE farmers) o Needs within the commercial agricultural sector (per sub‐sector groupings where
specific needs for such were identified ndash both on‐farm needs and within the secondary sub‐sector or related agri‐businesses)
o Needs of the Department of Agriculture Fisheries and Forestry (DAFF) To further guide and direct the identification and selection of scarce and critical skills the following factors or criteria that could reflect the importance (impact and effect) of a skills shortages were developed as an identification framework
1 Basic Skills Development Promoting basic literacy and numeracy and raising the base level of education for the sector improving the work and livelihood of existing workers
2 Employability Making the employee more employable by improving the fit between their skills and the sector needs
3 Enterprise Viability Improving the capability and feasibility of the enterprise by increasing its effectiveness of or possibilities for profit generation etc
4 Enterprise Sustainability Allow enterprises to survive and grow over an extended period of time without compromising the value of renewable resources thereby creating long‐term meaningful employment for larger numbers of people
5 Sector Growth Enabling the sector to develop or pursue new opportunities or improve the effectiveness of current operations
6 Sector Competitiveness Enabling the sector to compete more effectively in the international arena improving market intelligence and interpretation productivity cost efficiency etc
7 Human Resource Development Capacity Improving the access to quality provision of training to the agri sector
Based on this research and consultation framework the following skills development needs and priorities were identified
Agriculture Sector Analysis 33
AgriSETA June 2010
GENERAL NEEDS SMALL‐SCALE FARMER
NEEDS COMMERCIAL SECTOR
NEEDS DAFF NEEDS
RECRUITMENT RELATED SKILLS NEEDS Primary agriculture is the entry point into the world of work for large numbers of people in rural areas However the sector has negative connotations amongst sections of the youth and in parts of the country and is viewed as a last resort for some in the search for employment) The effect is that despite an unemployment rate of approximately 26 (now over 30) farmers find it difficult to recruit workers to meet seasonal demands This has resulted in the government approving the contracting of foreign labour to meet such temporary needs (workers are recruited mainly from Zimbabwe and Mozambique)
Labour in this farming sector is provided primarily by family members and no real recruitment constraints can be identified
The agricultural sector still manages to attract technical and management skills as it is perceived to include a better lifestyle and there is a strong tradition of agriculture in SA Increasing crime related security risks associated with farming may have a negative impact
The Department has identified a number of occupations in which they are experiencing long‐term vacancies Some of these result from a general shortage of such skills in SA while others arise from the inability of the public sector to compete with the private sector (less favourable employment image working conditions and equity considerations) Priority vacancies include Veterinarians Agricultural
Engineers Plant Health
Specialists Agricultural
Statisticians Plant Health Pest Risk
Analysts ICT Specialists Agricultural
Economists Agricultural Food and
Quarantine Technicians
Agro‐meteorologists Pasture Scientists Plant Production
Specialists Specialised Food
Analysts SKILLS GAPS RELATED NEEDS
bull Low literacy and numeracy levels ndash both amongst workers within the sector at large and at ownermanager level in many of the small‐scale farming
bull Farm management
Farm Management (Mainly owners managers) bull Farm management amp
entrepreneurship bull Resource
management and record keeping
bull Financial planning
A critical constraint is the poor educational levels of a large proportion of the labour force in the sector demanding a considerable effort and investment in ABET and other life skills
A particularly big need exists for skills upgrading amongst Extension Officers ndash particularly with regard to redress the historical neglect of small‐scale farmers and resource strapped farmers
Agriculture Sector Analysis 34
AgriSETA June 2010
Agriculture Sector Analysis 35
GENERAL NEEDS SMALL‐SCALE FARMER
NEEDS COMMERCIAL SECTOR
NEEDS DAFF NEEDS
skills (and general management skills in other agricultural businesses) coupled with a business orientation and entrepreneurship skills
bull A general need to increase compliance with environmental occupational health and safety animal welfare produce safety and hygiene standards regulations and requirements (local and international standards)
and management bull Project management bull Business plan
development Marketing and processing bull Processing and
packaging bull Transport
management bull Marketing produce
including branding bull Planning for
marketing bull Knowledge of
markets Technical knowledge and skills bull Production
management (related to specific enterprise)
bull Demonstration of production techniques
bull Natural resources management
Mechanical knowledge bull Farm maintenance bull Repairs of machinery
and equipment bull Electrical
maintenance and installation
programmes Need for improved management skills and relevant technological knowledge for increasing productivity levels and improved production methods Rising importance for environmentally responsible production and processing management systems Rising competitive and international markets increases need for business and marketing abilities among owners and managers Increasing requirements for compliance with environmental health and safety and international trade standards Information technology although not a priority is increasing in importance Business management ability is becoming increasingly important as more farmers are making decisions about restructuring their businesses diversification and developing supplementary sources of income
Critically improved farm management and business skills within an agricultural context to support the majority of BEE and emerging farmers Skills upgrading requirements for existing Extension Officers include bull Agricultural
economics bull Agricultural
management bull Business and
financial management
bull Technical and production related skills including o Animal husbandryo Poultry o Crop production o Horticulture
SKILLS SHORTAGES Generally SA has a shortage of entrepreneurs and people who have the business acumen drive motivation and
The profile of these farmers reflects a large contingent of older and less educated people who are generally less flexible tend to stick to
The commercial agri sector will increasingly have to compete in the global market and the ever increasing need to increase productivity to
DAFF us experiencing problems are especially sourcing people in specialised science related fields (learning fields experiencing few
AgriSETA June 2010
Agriculture Sector Analysis 36
GENERAL NEEDS SMALL‐SCALE FARMER
NEEDS COMMERCIAL SECTOR
NEEDS DAFF NEEDS
perseverance to become a successful farmer Given the high risks involved in the agricultural sector (natural elements outside onersquos control) the agri sector does not compete successfully for this ldquoscarce resourcerdquo Moreover as with other professional and skilled occupations there is a tendency for younger qualified people to move to urban areas
known practices and are less likely to experiment with new technology Within this target group candidates with good entrepreneurial ability are scarce There is a perceived shortage of Agricultural Extensionists and advisors to assist this target group However a large pool of young unemployed graduates exists who could assist such emerging farmers if they were mobilised and made accessible to farmers Similarly the potential pool of retired commercial farmers who could serve as mentors to this target group
remain profitable and viable it can be stated that many of the existing farmers and managers owners lack business management and entrepreneurial orientation Equity policy and the need to become BEE compliant requires that commercial enterprises appoint and develop black owners directors managers Changing local and global consumer preferences require farmers to change traditional farming methods and practices Skills and knowledge requirements include bull Global food and
international quality standards
bull Product traceability requirements
bull Organic produce and products
Specific occupations identified as being in short supply are
bull Production Managers (food processing)
bull Product specialisation to international specifications (research skills)
bull Forklift drivers heavy vehicletruck drivers and mobile plant operators
bull Experienced and competent artisans (millwrights electricians fitters
enrolments andor pass rates at HET institutions with the result that too few qualified persons come onto the labour market) Examples of such skills shortages identified by the Department include Agricultural Engineers bull Plant Health
Specialists (Nematology Entomology Plant Pathology)
bull Statisticians (specialised agricultural knowledge)
bull Plant Health Pest Risk Analysts
bull Agricultural Economists (production and resource economists)
bull Agricultural Food and Quarantine Technicians
bull Agro‐meteorologists Early warning Specialists
bull Pasture Scientists bull Plant Production
Specialists (eg ornamental crops hydroponics)
bull Specialised Food Analysts (pesticide residue analysts processed food and dairy analysts wine and spirit analysts)
AgriSETA June 2010
Agriculture Sector Analysis 37
GENERAL NEEDS SMALL‐SCALE FARMER
NEEDS COMMERCIAL SECTOR
NEEDS DAFF NEEDS
and turners bull Agricultural
Equipment Technicians
bull Pest and weed controllers
bull Horticultural specialists
LABOUR SHORTAGES AND RELATED SKILLS NEEDS Given an employment rate of some 26 (2009 currently estimated at over 30expanded definition) per definition there cannot be a labour shortage It is however difficult for people who have never worked before to integrate into the agricultural sector workforce Coupled with an aging workforce (30‐60 being over 40) means that most agri enterprises will within the next 5‐10 years be looking at replacing a large proportion of their workforce There could be an insufficient pool of people willing and able to participate The impact of HIVAIDS is also not always factored in to understanding the diminishing pool of resources available Labour shortages have been reported within selected geographical areas and in particular occupations Examples include cane cutters in the sugar industry chicken catchers in the poultry industry pickers in the fruit industry and animal handlers in feedlots as well as dairy parlour workers It is however believed that these shortages may reflect a recruitment problem as a result of the very harsh working conditions and the relatively poor remuneration (which makes these occupations unpopular) At present such ldquoshortagesrdquo are addressed through contracting labour from neighbouring countries
AgriSETA WSP analyses
Skills demand in the commercial agricultural sector
Information for demand for skills from WSP data is available for 1 673 employers who submitted their WSPs for the 200910 period The table below shows data on sub‐sector WSP submission relative to size of the sub‐sector as well as subsector data from all registered organisations and those who submitted WSPs Data for registered employers shows that there were 239 076 employees employed by the 17 234 registered organisations As previously stated 97 898 employees were employed by the organisations submitting WSPs This constitutes 41 of employees employed by registered organisations
Table 20 Employment and sub‐sector data drawn from WSP analyses
Sub‐sector
All Re
gistered
Employers
Small employers (0‐49)
Med
ium and
large
employers (50+)
Total W
SPs received
Total W
SPs received
as of
all registered em
ployers
WSP
received med
ium and
large orgs
WSPs received
as of
med
ium amp large em
ployers
WSPs received
small
employers
WSPs received
as of small
enterprises
EmployeesPer
Profile
CoffeeTea 40 33 7 9 23 5 71 4 12 483 Fibre 1 710 1 676 34 34 2 22 65 12 07 6 539
AgriSETA June 2010
Agriculture Sector Analysis 38
Sub‐sector
All Re
gistered
Employers
Small employers (0‐49)
Med
ium and
large
employers (50+)
Total W
SPs received
Total W
SPs received
as of
all registered em
ployers
WSP
received med
ium and
large orgs
WSPs received
as of
med
ium amp large em
ployers
WSPs received
small
employers
WSPs received
as of small
enterprises
EmployeesPer
Profile
Fruit 371 277 94 162 44 76 81 86 31 27 873 Grain 648 581 67 77 12 48 72 29 5 22 129 Milling 335 279 56 61 18 35 63 26 9 4 630 Pest Control 213 209 4 8 4 2 50 6 3 119 Poultry 391 305 86 66 17 46 53 20 7 19 187 Primary 12 121 10 776 1 345 1144 9 513 38 631 6 136 034 Red meat 1107 1 018 89 70 6 45 51 25 2 7 475 Seed 167 149 18 24 14 13 72 11 7 2 127 Sugar 71 45 26 13 18 10 38 3 7 10 478 Tobacco 60 46 14 5 8 3 21 2 4 2 002
Totals 17 234 15 394 1 840 1 673 10 818 44 855 16 239 076
Source 1 AgriSETA WSP 2009 data
Only 10 of all registered employers submitted WSPs for the 200910 period Of these 49 were medium and large sized employers and 51 small However only 16 small employers submitted their WSPs relative to the number of registered small employers and 44 medium and large employers submitted WSPs relative to the number of registered medium and large employers As such skills demand statistics provides more representative data on the requirements of medium and large employers Data for skills demand in the commercial agricultural sector is based on data for permanent employees as well as casual and seasonal employees
Skills demand forecasting by AgriSETA
Forecasting for skills demand the AgriSETA has estimated that the demand for skilled employees at different levels in the next few years is 510 686 This is based on WSP data analyses over the last 5 years and projected demand for the formal commercial agricultural sector and factoring in the demand that at maximum would result from completion of the land restitution programme in South Africa The table below reflects the skills that are on demand as well as the estimates for demand over the next five years by major occupational category35
35 AgriSETA 2010
AgriSETA June 2010
Table 21 Demand for skills by occupational category
Major Occupation (OFO)Estimated Demand
Group Title1 Managers (commercial and small emerging farmers) 264 3702 Professionals 4 1413 Technicians and Trade workers 8 9255 Clerical and administrative workers 8006 Sales workers 4007 Machinery operators and drivers 5 8008 Elementary workers 226 250
Total 510 686Source AgriSETA WSP data and SSP demand forecasts
Research needs going forward
As has been set out in the sector analysis and the scenarios derived from that analysis the sector is faced by both significant and profound change and also great uncertainty It therefore follows that the task of focussing limited resources (basically levy income in the formal sector and NSF funds for the emergent farming sector) is difficult Whilst the general thrust of training remains broadly as described in the 2006‐10 SSP Updates some considerable work is required to achieve targeted effective interventions during the 2011‐2016 period The following research questions will need to be addressed in preparing the next SSP
bull In relation to the managers and owner‐managers of commercial farms and enterprises what skills are needed to enable them to help bring about the more optimistic scenario and manage the risks associated with the less optimistic ones
bull In terms of professional and technical competencies do the current education and training institutions coupled with the learning programmes available through the AgriSETA (learnerships skills programmes and the like) meet the needs of the sector
bull In the emerging agricultural sector do the current programmes funded by sources external to the AgriSETA (eg NSF) meet all the identified needs What gaps are there and how should they be addressed
bull In relation to governmentrsquos growth strategy and industrial action plans what skills are required for developing the aquaculture sub‐sector What programmes are available How can the SETA support the skills needs for this sub‐sector
bull Given the increasing levels of casual and contract labour how can skills be developed to meet the needs of the formal commercial sector and the emerging enterprise sector
bull How can the demand in each of the priority areas be quantified and agreement be reached on numbers of people to be trained
Agriculture Sector Analysis 39
AgriSETA June 2010
SECTION 3 Skills Gaps and scarce skills
Scarce skills at the DAFF
The level of scarce skills at DAFF can be determined by the vacancy rate While the average vacancy rate in the department as at 31 March 2009 was 17 there were some posts that had very high vacancy rates as reflected in the table below Indicating the possibility that the Department is experiencing difficulties in finding suitable candidates in the South African labour market to fill these posts
Table 22 Scarce skill occupations and vacancy rates (DAFF March 2009) Critical occupations Number of posts Posts filled Vacancy rate ()
Agricultural animal oceanography forestry and other sciences
167 119 287
Engineering sciences related 2 1 50Engineers and related professions 13 6 538Farming forestry advisors and farm managers 11 4 636Finance and economics related 73 53 274Horticulturists foresters agricultural and forestry technicians
350 221 369
Legal related 6 4 333Mechanical engineering technicians 3 2 333Risk management and security services 6 4 333Social sciences related 1 0 100Veterinarians 34 24 294
Source DAFF Annual Report 20082009
Skills are also scarce at senior management level The department also reports on difficulties it has filling senior management services vacancies with some of them staying vacant for up to twelve months because no suitable candidates can be found The department would then resort to re‐advertisement and head hunting This was the case with 22 of 18 SMS posts in March 2009
Scarce skills in the commercial sector
The following occupations have previously been projected as scarce (extremely hard to fill vacancies) by AgriSETA in the commercial agricultural sector over the next five years
Table 23 Scarce and critical skills in the commercial agricultural sector
Occupation Code
Group Occupation Critical Skills Intervention Comments
139903 Managers Laboratory Manager
Technology AI nutrition
HET
221101 Professionals Accountant (General)
General HET
221102 Professionals Management Accountant
Farm financial management
HET Focus on support advice to farmers new enterprises
222101 Professionals Commodities Trader
Export administration supply chain
FET Learnership Skills
Agriculture Sector Analysis 40
AgriSETA June 2010
Agriculture Sector Analysis 41
Occupation Code
Group Occupation Critical Skills Intervention Comments
management Programme
224301 Professionals Economist Agricultural HET
Mainly for Department of Agriculture and para statals commodity organisations
233101 Professionals Chemical Engineer
Chemical processes in food production
HET Industries such as sugar processing
233301 Professionals Electrical Engineer
Installation and maintenance
HET Processing industry
233401 Professionals Electronics Engineer
Computerised production prosesses
HET Processing industry
233501 Professionals Industrial Engineer
Productivity and efficiency
HET Processing industry
233904 Professionals
Instrument Engineer (Defence Force)
Installation and maintenance
HET
Not for defence ‐ sugar industry
233502 Professionals Mechanical Engineer
FETHET Equity reasons
233902 Professionals Agricultural Engineer
Farm layout and infrastructure
HET Mainly in Government
311101 Technicians and trades workers
Agricultural Technician
Installation and maintenance
FETHET
234102 Professionals Agricultural Scientist
Agri research HETFET Especially in horticulture
234201 Professionals Chemist HET Processing industry
234202 Professionals Food Technologist
Food safety HACCP
FETHET Across sector
234701 Professionals Veterinarian HET Mainly in Government
311101 Technicians and trades workers
Agricultural Technician
Farm infrastructure
FET Mainly needed in government
311401 Technicians and trades workers
Chemistry Technician
FETHET EE reasons
312907 Technicians and trades workers
Chemical Engineering Technician
FET Learnership
Mainly EE reasons
312402 Technicians and trades workers
Electronic Engineering Technician
Weak stream production infra
FETHET Mainly tobacco industry
233904 Professionals
Instrument Engineer (Defence Force)
Instrument technician
FET
Occupation needed Instrument Technician (not defence force) Mainly sugar processing sector
321202 Technicians and trades workers
Diesel Motor Mechanic
FET Learnership
To include tractor mechanic
321204 Technicians and trades workers
Small Engine Mechanic
Agricultural equipment
FET Learnership
Throughout sector
AgriSETA June 2010
Agriculture Sector Analysis 42
Occupation Code
Group Occupation Critical Skills Intervention Comments
322301 Technicians and trades workers
Metal Fabricator
Artisan FET Learnership
322303 Technicians and trades workers
Welder Welder (First Class)
Artisan FET Learnership
323203 Technicians and trades workers
Fitter‐Welder Artisan FET Learnership
Mainly sugar ndash multi‐skilled
323202 Technicians and trades workers
Fitter And Turner
Artisan FET Learnership
Tobacco and sugar
323501 Technicians and trades workers
Millwright Artisan FET Learnership
Wide‐spread need
341101 Technicians and trades workers
Electrician (General)
Artisan FET Learnership
Wide‐spread need
342101 Technicians and trades workers
Air‐Conditioning And Refrigeration Mechanic
Artisan FET Learnership
Sugar pack houses cold chain
Source AgriSETA Sector Skills Plans
Supply of skills
South Africarsquos agriculture skills are produced in high schools agricultural colleges FET colleges and Higher Education institutions In high school a large cohort of learners take Agricultural Science as a subject In 2003 there were 42 Agricultural High Schools offering Agricultural Science as a subject These students and those in high schools taking the subject could progress to taking agriculture as a focus area for further education In 2004 there were 10 FET colleges offering vocationally directed agricultural programmes These FET colleges offered complete qualifications and short courses Eleven Colleges of Agriculture can offer qualifications up to degree level and 19 universities offer qualifications in Agriculture ranging from agricultural economics animal and plant sciences and horticulture among others at under and post graduate levels (Department of Agriculture 2006) While long term planning of skilling of new entrants in the sector can be done through close consultation between the sector agricultural schools and colleges FET colleges and HET institutions so that they teach relevant skills there are other avenues for training for those who are already employed in the sector for example skills programmes and learnerships There are 15 registered qualifications for the primary agriculture sub sectors Currently AgriSETA has 94 registered learnerships that can address the skills needs of the identified scarce skills These are captured in Appendix 2 AgriSETA has approved accredited a number of training providers across the country to deliver the theoretical and practical components of these learnerships These include agricultural colleges FET colleges and private providers Currently the AgriSETA has 246 registered and approved providers distributed nationally as follows
AgriSETA June 2010
Table 29 AgriSETA approved training providers (2010) Province Number of providers
Gauteng 72
(29)
KwaZulu Natal 20
(8)
Limpopo 35
(14)
North West 30
(12)
Northern Cape 3
(1)
Free State 15
(6)
Mpumalanga 14
(6)
Western Cape 26
(11)
Eastern Cape 31
(13) Total 246
The providers are small to large organisations In primary agriculture small providers appear to offer the most training in rural areas and community projects (AgriSETA 2010) Most of the operating providers will be in FET colleges and agricultural colleges The AgriSETA is unable to meet the total demands for skills across the duality of their sector There seems to be fairness in the approval of training for both permanent and casual and seasonal workers In 200809 the AgriSETA approved 559 learnerships as follows
Table 30 AgriSETA learnerships approved for grant purposes (2008‐2009)
Source AgriSETA learnership data analysis
Agriculture Sector Analysis 43
AgriSETA June 2010
Agriculture Sector Analysis 44
Provision of skills programmes in the same year attracted grants for 2 706 employees
Table 31 Participation by learners in skills programmes in the AgriSETA (200809)
Source AgriSETA Skills programmes data analysis
AgriSETA June 2010
APPENDIX 1 Skills demand in the Department of Agriculture Forestry amp Fisheries (200809)
Source DAFF Annual Report 2008‐20009
Agriculture Sector Analysis 45
AgriSETA June 2010
Agriculture Sector Analysis 46
Appendix 2 AgriSETA registered learnerships Registered Learnership NQF Level SAQA Registration NoLearnership in Agri Sales and Service 4 22 Q 220001 20 178 4Learnership Agricultural Machinery Technician 2 22 Q 220007 20 160 2Learnership in Specialist Agricultural Machinery Technician 5 22 Q 220009 21 258 5Agri Trade Processes 2 22 Q 220013 30 125 2FETC Meat Examination Applying Basic Business Principles 4 30 Q 3000 2823 164 4Further Education and Training Certificate Seed Marketing Execute Seed Trials 4 22 Q 220025 21 126 4Further Education and Training Certificate Seed Research and Development Certify as Seed Unit 4 22 Q 220027 21 121 4FETC Seed Research and Development Conduct a Field Inspection of a Seed Unit 4 22 Q 220028 20 120 4Seed Research and Development Operations Operate in a Team 3 22 Q 220020 22 121 3Seed Research and Development Operations Apply Basic Business Principles 3 22 Q 220021 22 121 3National Certificate Seed Processing and Packaging Operate in a Team 3 22 Q 220026 21 123 3Sugar Industry Technical Maintenance worker 2 22 Q 220011 39 128 2National Certificate Sugar Manufacturing and Refining Technical Maintenance 3 30 Q300003 23 146 3Further Education and Training Certificate Manufacturing Technical MaintenanceProduce Components by Performing Engineering Turning Operations
4 30 Q 3000 1321 173 4
FETC Manufacturing Technical Maintenance Produce Components by Performing Milling Operations 4 30 Q 3000 1521 173 4 FETC Manufacturing Technical Maintenance Develop and Fabricate from Complex Drawing 4 30 Q 3000 1420 173 4National Certificate in Sugar Technology 5 22 Q 220036 22 140 5Further Education and Training Certificate Sugar Processing 4 22 Q 220035 31 144 4National Certificate in Sugar Technology Processing Sugar Refining 2 22 Q 220037 28 124 2National Certificate in Sugar Technology Processing Juice Preparation 2 22 Q 220038 28 124 2National Certificate in Sugar Technology Processing Crystallisation 2 22 Q 220039 27 122 2National Certificate in Sugar Technology Processing Laboratory Practice 2 22 Q 220040 25 124 2National Certificate in Sugar Technology Processing Extraction 2 22 Q 220041 28 122 2NC Rooibos Production Applying Basic Business Principles 2 30 Q 3000 2427 130 2 NC Rooibos Processing Applying Basic Business Principles 2 30 Q 3000 2224 123 2 National Certificate Cigarette Production 3 22 Q 220046 23 121 3
AgriSETA June 2010
REFERENCES AgriSETA 2010 AgriSETA 20082009 Annual report Pretoria AgriSETA Agricultural Research Council httpwwwarcagriczahomeasppid=272 Avert South African HIV and AIDS statistics Available on httpwwwavertorgsafricastatshtm Centre for Development Enterprise 2008 Land reform in South Africa Getting back on track CDE Research No 16 DAFF 2010 Quarterly economic review of the agriculture sector Pretoria DAFF DAFF 2009 Annual report 20082009 Pretoria DAFF Department of Agriculture 2008 Strategic plan 2008 Pretoria Department of Agriculture DTI An introduction to the South African economy Available on httpwwwthedtigovzapublicationsagroprocessinghtm Eastern Cape Provincial Government Eastern Cape Provincial Growth and Development Strategy 2004 ndash 2014 Economic Commission for Africa 2009 Developing African agriculture through regional value chains Addis Ababa Economic Commission for Africa Economic Report Free State Province 2005 Provincial Growth and Development Strategy 2005 ndash 2014 GCIS 2010 SA Yearbook 200910rdquo Agriculture forestry and fisheries Pretoria GCIS Greenberg S 2010 Status report on land and agricultural policy in South Africa 2010 Institute for Poverty Land and Agrarian Studies School of Government University of the Western Cape Research report Ingelozi Management Solutions 2008 HIVAIDS in the South African agricultural sector Towards the development of a long term intervention Research report KwaZulu Natal Provincial Government 2006 KwaZulu Natal Provincial Growth and Development Strategy Limpopo Provincial Government Growth and Development Strategy 2004 ndash 2014 Mhone G (2000) Enclavity and Constrained Labour Absorbtive Capacity in Southern African Countries Geneva International Labour Office Moyo S The Agrarian question and the developmental state in South Africa In Edigheji O et al 2010 Constructing a democratic developmental state in South Africa HSRC PRESS
Agriculture Sector Analysis 47
AgriSETA
Agriculture Sector Analysis
National Treasury Republic of South Africa 2010 National Budget 2010 ndash National Budget Review 2010 Pretoria National Treasury Northern Cape Provincial Government Agriculture and agro‐processing sector strategy North West Provincial Government North West Provincial Growth and Development Strategy 2004 ndash 2014 Province of the Western Cape 2008 The Ikapa growth and development strategy White Paper SABCOHA SA Business Coalition on HIV and AIDS wwwsabcohaorg SACAU httpwwwsacauorghostingsacauSacauWebnsfHomehtmOpenForm South African Government 2010 20102011 ndash 20122013 Industrial Policy Action Plan Republic of South Africa Statistics South Africa 2005 Census of commercial agriculture 2002 Report No 110201 Pretoria Statistics South Africa Statistics South Africa 2009 Census of commercial agriculture 2007 Statistical release P1101 Pretoria Statistics South Africa Statistics South Africa 2010 General household survey 2009 Statistical release P0318 Pretoria Statistics South Africa Statistics South Africa 2010 Gross domestic product first quarter 2010 Statistical release P0441 Pretoria Statistics South Africa Statistics South Africa 2010 Quarterly labour force survey Quarter 1 2010 Statistical release P0211 Pretoria Statistics South Africa Vink N amp van Rooyen J 2009 The economic performance of agriculture in South Africa since 1994 The implications for food security Pretoria DBSA development planning division working paper series No 17 Webster E 2004 the Dual Economy from a book by Van Holdt K and Webster E Work restructuring and the Crisis of Social reproduction and 10 years of restructuring post apartheid workplaces University of Natal Press Workinfocom httpwwwworkinfocomfreesub_for_legresdatalraempassoc3htm Xingwana L 2008 Challenges and Opportunities for Land and Agrarian Reform towards 2025 Speech delivered at the Agri‐Consultation Protea Ranch Hotel Polokwane 30 July 2008
- Table of contents
- SECTION 1 THE AGRICULTURAL LANDSCAPE
- 11 Size and shape of the Agricultural sector
-
- Overview
- Distribution of agricultural production
- The structure of the agriculture sector in South Africa
- Categories of farming enterprises
- Employment trends
- Employment categories and remuneration
- Stakeholders in the Agricultural sector
-
- National government departments
- Sector representatives
-
- 12 Factors impacting development in the Agriculture sector
-
- Future sector economic growth and development
-
- South African sector growth plans (IPAP2)
- International Trade
- Global recession and rise in food prices
-
- Land reform
- Reliance on imports
- Water
- The labour market
- Consumer trends
- HIVAIDS
- Farm safety and security
- Broad-based Black Economic Empowerment
-
- Conclusions and scenarios
- SECTION 2 DEMAND FOR SKILLS
-
- AgriSETA registered employers and employee coverage
- Employee coverage in the AgriSETA
-
- 21 Skills demand
-
- The National Education and Training Strategy for Agriculture (AET Strategy)
- AGRISETA sector skills planning demand data (2008-2009)
- AgriSETA WSP analyses
-
- Skills demand in the commercial agricultural sector
-
- Skills demand forecasting by AgriSETA
- Research needs going forward
-
- SECTION 3 Skills Gaps and scarce skills
-
- Scarce skills at the DAFF
- Scarce skills in the commercial sector
- Supply of skills
-
- APPENDIX 1 Skills demand in the Department of Agriculture Forestry amp Fisheries (200809)
- Appendix 2 AgriSETA registered learnerships
-
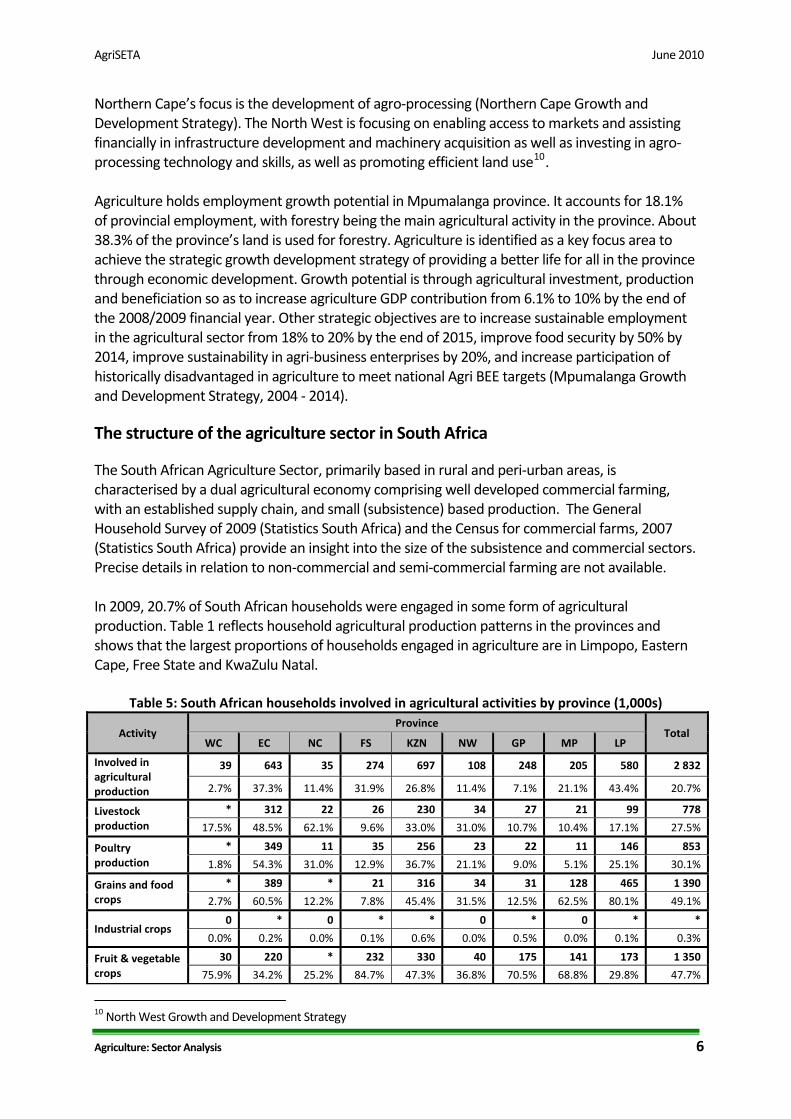
AgriSETA June 2010
Agriculture Sector Analysis 6
Northern Capersquos focus is the development of agro‐processing (Northern Cape Growth and Development Strategy) The North West is focusing on enabling access to markets and assisting financially in infrastructure development and machinery acquisition as well as investing in agro‐processing technology and skills as well as promoting efficient land use10 Agriculture holds employment growth potential in Mpumalanga province It accounts for 181 of provincial employment with forestry being the main agricultural activity in the province About 383 of the provincersquos land is used for forestry Agriculture is identified as a key focus area to achieve the strategic growth development strategy of providing a better life for all in the province through economic development Growth potential is through agricultural investment production and beneficiation so as to increase agriculture GDP contribution from 61 to 10 by the end of the 20082009 financial year Other strategic objectives are to increase sustainable employment in the agricultural sector from 18 to 20 by the end of 2015 improve food security by 50 by 2014 improve sustainability in agri‐business enterprises by 20 and increase participation of historically disadvantaged in agriculture to meet national Agri BEE targets (Mpumalanga Growth and Development Strategy 2004 ‐ 2014)
The structure of the agriculture sector in South Africa
The South African Agriculture Sector primarily based in rural and peri‐urban areas is characterised by a dual agricultural economy comprising well developed commercial farming with an established supply chain and small (subsistence) based production The General Household Survey of 2009 (Statistics South Africa) and the Census for commercial farms 2007 (Statistics South Africa) provide an insight into the size of the subsistence and commercial sectors Precise details in relation to non‐commercial and semi‐commercial farming are not available In 2009 207 of South African households were engaged in some form of agricultural production Table 1 reflects household agricultural production patterns in the provinces and shows that the largest proportions of households engaged in agriculture are in Limpopo Eastern Cape Free State and KwaZulu Natal
Table 5 South African households involved in agricultural activities by province (1000s)
Activity Province
Total WC EC NC FS KZN NW GP MP LP
Involved in agricultural production
39 643 35 274 697 108 248 205 580 2 832
27 373 114 319 268 114 71 211 434 207
Livestock production
312 22 26 230 34 27 21 99 778
175 485 621 96 330 310 107 104 171 275
Poultry production
349 11 35 256 23 22 11 146 853
18 543 310 129 367 211 90 51 251 301
Grains and food crops
389 21 316 34 31 128 465 1 390
27 605 122 78 454 315 125 625 801 491
Industrial crops 0 0 0 0
00 02 00 01 06 00 05 00 01 03
Fruit amp vegetable crops
30 220 232 330 40 175 141 173 1 350
759 342 252 847 473 368 705 688 298 477
10 North West Growth and Development Strategy
AgriSETA June 2010
Agriculture Sector Analysis 7
Activity Province
Total WC EC NC FS KZN NW GP MP LP
Fodder grazing pasture grass ndash animals
14 11 53
112 05 38 35 20 20 43 20 07 19
Forestry 0 10
12 01 05 21 01 00 04 04 02 04
Fish farming Aquaculture
0 0 0 0 0 0 0
15 01 00 00 00 00 00 00 00 00
Game farming 0 0 0 0
22 02 13 00 01 00 00 00 02 01
Other 0 0 0 0
00 02 00 03 04 03 03 00 00 02
Numbers smaller than 10 000 are too small for reliable estimates A particular household can be involved in more than one activity and percentages therefore do not add up to 100
Source Statistics South Africa ‐ General Household Survey 2009 (p318)
In 2007 there were 39 982 commercial farms11 in South Africa as opposed to the 45 818 registered in 2002 There has been a clear downward trend in the number of commercial farming enterprises which underscores the needs to grow the commercial agriculture sector to maintain South Africarsquos food sustainability potential and support interventions to develop skills across the agricultural sector especially for transformation and development of the small and emerging agricultural sector
Table 6 Commercial farming enterprises by province ‐ 2002 and 2007
Province 2002 2007 Growth Decline
Eastern Cape 4 376 3 896 ‐ 1097
Free State 8 531 7 515 ‐ 1191
Gauteng 2 206 2 378 780
KwaZulu‐Natal 4 038 3 560 ‐ 1184
Limpopo 2 915 2 657 ‐ 885
Mpumalanga 5 104 3 376 ‐ 3386
North West 5 349 4 692 ‐ 1228
Northern Cape 6 114 5 226 ‐ 1452
Western Cape 7 187 6 682 ‐ 703
Total 45 818 39 982 ‐ 1274
Source Statistics South Africa 2008
Whilst the largest proportions of households involved in agriculture are in Limpopo Free State Eastern Cape and KZN (Table 1) it is in the Free State Western Cape Northern Cape and North‐West provinces where the largest number of commercial farms are located (Table 2) No direct
11 Commercial farms are farming enterprises that are registered with SARS for Value Added Tax (VAT) and income tax
AgriSETA June 2010
relationship can thus be drawn between the numbers of households engaged in agriculture in a province and the numbers of commercial agricultural enterprises AgriSETA WSP data analysis reveals no direct relationship between the number of employers in a province and the number of formally employed persons
Categories of farming enterprises
ldquoDualismrdquo (Mhone 2000) is a useful way of describing the agricultural sector both in terms of understanding the economics of the sector and planning skills development interventions This term describes a formal sector that is well established and an informal or emergent sector with the two sectors reliant on each other and on interventions by the state for integration However these two broad categories have their limitations Within the commercial sector there are large established farming businesses and smaller ones that struggle to survive and within the less formal sector there are emergent farmers striving to achieve commercial success It is necessary therefore to understand the agricultural sector as comprising a number of different economic entities all operating within the same dualistic economic framework The following typology for the agricultural sector reflects the complexity of the agricultural sector
Table 7 Typology of the agricultural sector
Production Unit Turnover Ownership amp Management Number Binding constraint
Support required
Large commercial on private property
gtR2 million
Family owned but incorporated multiple farms Rent in land ndash professional management
plusmn5 400 Market size Equity capital
Export market access Financial market innovation
Medium commercial on private property
R300 000 to R2 million
Family owned could be incorporated Some renting in of land ndash family management
17000 Land capital management
Mortgage capital for land access Management training
Small commercial on private property
ltR300 000 Family owned generally part time Some lifestyle farming (game ranches weekend farms)
24 000 Management time
Commercial in communal areas
gtR300 000 Communal ownership Development projects Private ownership
‐ Capital management infrastructure
Grants for land access Property rights Comprehensive farmer support Credit Physical infrastructure
ldquoEmergingrdquo commercial in communal areas
ltR300 000
gt20 hectares Communal ownership Small farmers in development projects Private ownership
35 000
Land (property rights) Capital labour management Employment opportunities
Grants for land access Property rights Comprehensive farmer support Physical infrastructure Institutional infrastructure
Subsistence farmer in communal areas Allotments Market gardens
lt20 hectares Communal ownership Private ownership Little formal market participation
1256m Employment opportunities
Social welfare transfers
Source Vink and van Rooyen 2009
This confirms the dualism evident from Stats SA data It includes an estimate for emergent farms and provides insight into the different types of farming enterprises Being small and part time can mean subsistence farming but it can also mean running a game farm on a part‐time basis There is considerable scope for farming enterprise to move from being commercial to subsistence and vice versa There is some evidence that there is currently an increase in volatility with quite
Agriculture Sector Analysis 8
AgriSETA June 2010
significant changes occurring mainly due to the global economic down turn and the small margins that many agricultural enterprises operate within It is particularly important to have an understanding of the category of ldquoemergingrdquo farmers those who may be striving to move from subsistence farming to a more commercial model those who have benefited from land reform processes and want to establish an agricultural enterprise on the land that has been allocated to them those who have made use of BEE funding to acquire a stake in a farm and are trying to achieve profitability The emerging farmer sector is neither established commercial farming nor subsistence in nature and is the focus of many of the governmentrsquos efforts to achieve transformation within the sector as a whole
Employment trends
Employee numbers is a more important measure of ldquosizerdquo for the purpose of the SETA and skills planning even though turnover may be more important in terms of economic impact or contribution to GDP The cause of this discrepancy between turnover or GDP contribution on the one hand and formal employment numbers on the other is discussed extensively by Mhone (2000) and others such as Webster (2004) Labour absorption levels in an enclave (second) economy are not optimal One conclusion that can be drawn from this is that skills development will need to be linked to other changes within the sector if it is to contribute meaningfully to job creation Mechanisms need to be found that link growth to jobs and this is not strictly something that the SETA can address However it is important to link skills planning to other processes and opportunities for these will be examined as part of the environmental scan later in this section The past few years have seen huge depreciation in employment levels and a very high unemployment rate ndash currently estimated at 311 The agricultural sector has also witnessed a decline in sector employment largely linked to contraction of the sector The sector is characterised by the need for highly skilled and qualified farm managers and technical staff on the one hand and large numbers of unskilled and semi‐skilled workers on the other Many managers of emerging farms are mainly untrained and unqualified Agriculture relies more on semi skilled labour than other services as reflected in the table below The sector also relies on migrant casual and seasonal labour Table 8 Percentage unskilled to semi‐skilled labour by DTI industry (economic sector) classification
Sector 1995 2008 Growth decline in
skilled labour
Agriculture 990 941 49
Mining 920 879 45
Manufacturing 870 821 56
Utilities 800 688 140
Construction 900 883 19
Trade 840 842 ‐ 02
Transport and Communication 730 768 ‐ 52
Finance 620 595 40
Community and personal services 540 498 78
Total 782 738 56 Source National Treasury 2010
Agriculture Sector Analysis 9
AgriSETA June 2010
Agriculture Sector Analysis 10
Employment in the sector is based on those who work in administration in DAFF and those who work in production and processing at farms and in factories In March 2009 DAFF had 3 285 posts with 2 735 of these filled The table below shows the employment profile at DAFF by occupation race gender and disability as at 31 March 2009 The department employed 57 male employees and 43 female employees There were more African employees constituting 69 of the entire department workforce Very little progress has been made regarding the employment of people with disabilities who constitute only 04 of the workforce This is in line with other department across government where similarly little progress has been made
Table 9 Employee profile ‐ Department of Agriculture Forestry and Fisheries Occupational Category (SASCO)
African Coloured Indian White Totals
M F M F M F M F M F Total
Legislators senior officials managers
15 14 2 2 8 3 25 19 44 16
Professionals 239 241 11 12 4 14 70 64 324 331 655 240
Technicians associate prof
190 153 38 19 9 4 86 57 323 233 556 204
Clerks 93 204 22 42 0 7 13 171 128 424 552 30
Service and sales workers
38 19 4 2 1 17 1 60 22 82 30
Craft and related trades workers
42 3 13 58 0 58 21
Plant machine operators and assemblers
53 1 8 1 62 1 63 23
Elementary occupations
484 96 94 28 1 6 5 585 129 714 262
Totals 1 154 728 182 105 15 25 214 301 1 565 1 159 2 724
Percentage 424 267 67 39 06 09 79 110 575 425 100
People with disabilities
1 1 1 2 6 4 7 11 04
Race 1 882 287 40 515 Percentage 691 105 15 189 Source Dept of Agriculture Forestry and Fisheries (2010)
In respect of occupations and skills profiles the majority of the Departmentrsquos employees are Professionals and Technicians Associate Professionals (444) followed by people employed in elementary occupations (262) Employment across the agricultural sector is subject to growth and decline variations related to a wide range of conditions and circumstances ndash produce prices climate and environmental changes mechanisation technology and the like Since 2002 the trend has been downwards There are a number of reasons for this including mechanisation and casualisation of labour on larger farms the economic downturn impacting on some sub‐sectors and the global trade situation including changes in the foreign exchange rates and the failure of successive DOHA development talks to address inequalities in access to global agricultural markets12 12 The Doha Development Round is the trade‐negotiation of the World Trade Organization (WTO) Its objective is to lower trade barriers globally Talks have stalled over a divide on major issues such as agriculture industrial tariffs and non‐tariff barriers services and trade remedies The most significant differences are between developed nations led
AgriSETA June 2010
Agriculture Sector Analysis 11
It is anticipated that growth of the agricultural sector to meet local consumer demand government initiatives to expand agricultural niche export markets and the development of an aquaculture sub‐sector to counter depletion of natural resources is likely to lead to creation of employment in the sector
Table 10 Workforce changes in the Agricultural sector ‐ 2001 to 2010
Year Workers Year on year difference Variation 2001 969 0002002 1 153 000 + 184 000 1602003 808 000 ‐ 345 000 ‐ 4272004 828 000 + 20 000 242005 778 000 ‐ 50 000 ‐ 642006 886 000 + 108 000 1222007 703 000 ‐ 183 000 ‐ 2602008 764 000 + 61 000 802009 615 000 ‐ 149 000 ‐ 2422010 650 000 + 35 000 54
Quarter 1
Source Statistics South Africa Survey (pp 210‐211)
Employment categories and remuneration
It is difficult to get detailed and accurate yearly statistics on employment by type (full‐time casual and seasonal employees) or on remuneration in the agricultural sector The latest available statistics on commercial agriculture are found in the 2007 Stats SA Census of Commercial Agriculture The following tables reflect survey data on the number of permanent casual and seasonal agricultural sector employees by province as well as total remuneration per province
Table 11 Number of paid full‐time agricultural workers and total remuneration by province
Province 2002 2007 Growth Decline
Number Remuneration
R000s Number
Remuneration R000s
Number Remuneration
Eastern Cape 33 718 329 351 34 253 510 404 16 550Free State 57 607 580 888 53 944 737 796 ‐64 270Gauteng 20 815 344 629 22 979 534 083 104 550KwaZulu‐Natal 75 799 763 439 66 685 968 455 ‐120 269Limpopo 62 635 525 390 35 728 625 436 ‐430 190Mpumalanga 61 603 599 617 46 520 853 396 ‐245 423North West 39 914 409 526 53 741 574 596 346 403Northern Cape 31 077 320 598 26 871 339 948 ‐135 60Western Cape 98 207 1 378 816 90 943 2 029 275 ‐74 472Totals 481 375 5252251 431 664 7 173 389 ‐103 366
Source Statistics South Africa Report 120201 (p1101)
by EU USA and Japan and the major developing countries led and represented by India Brazil China and South Africa Considerable contestation exists over the maintenance of agricultural subsidies operating as trade barriers
AgriSETA June 2010
Agriculture Sector Analysis 12
Table 12 Number of paid casual amp seasonal agricultural workers amp total remuneration by province
Province 2002 2007 Variance
Number Remuneration
R000s Number
Remuneration R000s
Number Remuneration
Eastern Cape 30 936 59 680 30 565 106 497 ‐12 784Free State 57 871 69 595 45 150 98 996 ‐220 422Gauteng 8 722 20 975 11 957 93 461 371 3456KwaZulu‐Natal 37 602 103 946 34 383 154 286 ‐86 484Limpopo 38 614 107 223 31 833 124 159 ‐176 158Mpumalanga 46 480 86 242 32 826 176 363 ‐294 1045North West 46 078 62 653 32 008 75 250 ‐305 201Northern Cape 68 174 121 613 47 874 123 723 ‐298 17Western Cape 124 968 331 406 98 546 485 108 ‐211 464Totals 459 445 963 331 365 142 1 437 843 ‐205 493
Source Statistics South Africa Report 120201 (p1101)
The tables above reflect that the Western Cape was the biggest employer of labour on commercial farms in 2007 with a majority of the employees being casual and seasonal The Eastern Cape employed the least number of commercial farm employees The comparator figures for 2002 and 2007 would appear to show a continuous country wide reduction in employment both in permanent employees and casual and seasonal workers The exception is the North West that has experienced an increase in full time employees The current minimum wage for farm workers (February 2010) is R1 31669 per month13 Monthly salaries differ across sub‐sectors with highest paid workers in primary production in the fisheries and dairy sub‐sectors
Table 13 Approximate monthly wage rates in Agriculture for selected sub‐sectors
Subsector Primary Production ProcessingPack house
Meat R 2000
Dairy ‐ R 2650
Wines R 1100 R 1400
Flowers R 800 R 1200
Fisheries R 5000
(crewman)R 1892
Source DTI 201014
Vink amp van Rooyen (2009) indicate that before the introduction of minimum wage in 2003 the real cash remuneration for employees had been increasing However over time the unit cost of labour (the ratio of the total cost of labour to the total value of output) has been in decline including a steep drop during and after the introduction of minimum wages
13 Department of Labour 2010 14 Source DTI (Data sourced from SAMIC Dairy Industry JAG WOSA SAFEC SA Pelagic Fish Industry Association)
AgriSETA June 2010
Agriculture Sector Analysis 13
In 1970 for every R1 of output 16 cents was spent on labour By 1980 this has dropped to 13 cents for R1 of output By 1994 the figure had increased to 19 cents declining to 17 cents in 1998 and to 117 cents in 2001 By 2007 it had reduced to 108 cents Further research will be needed to establish the current situation but there is reason to believe that the decline has continued with wages being very low both in terms of unit costs and in relation to other groups of workers in the economy
Strictly speaking it is not the role of the SETA to engage in the complex regulatory framework for the agricultural labour market It is for the Department of Labour and NEDLAC with their employer and organised labour stakeholders to find ways of balancing the need for protection of vulnerable workers with the need to create a framework that encourages the creation of jobs and improved job security The reason that more research is needed in this area and in particular detailed discussions with industry and labour representatives is to establish
The extent to which skills development interventions can improve the prospects for job creation and improved job security and
The mechanisms that can be established to enable uninterrupted skills training in the context of casualisation and use of contract and seasonal labour
Stakeholders in the Agricultural sector
National government departments
There are a number of national government Departments and spheres involved in the challenges of the agricultural sector The following table sets out the broad contribution that each department is intended to make
Table 14 Government department roles in relation to Agriculture Department Role
Department of Agriculture Forestry and Fisheries Agricultural policy and support Department of Rural Development and Land Reform Land Reform and land claims settlements Department of Economic Development Economic planning National Treasury Macro economic policy Department of Trade and Industry Industrial strategy (IPAP 2) Department of Water Affairs The management of water supply Department of Labour Labour market policy Department of Higher Education and Training HRD and skills planning and SETAs In relation to public spending on agriculture the agricultural national budget constitutes about 05 of the national budget The figure below reflects trends in national budgeting for the agricultural sector between 19967 and 201112 Some analysts15 have argued that state expenditure on agriculture shows lack of prioritisation of the sector especially considering that the budget remains lower than it was in the late 1980s when it now caters for a greater number of farmers than it did during apartheid segregation
15 Greenberg 2010 p 2
AgriSETA June 2010
Figure 2 National budgets for Agriculture 1996‐2011 (adjusted for inflation)
Source Greenberg 2010
The Department of Agriculture Forestry and Fisheries (DAFF) is responsible for the agricultural sector The department works with various organisations to promote the interests of the sector
bull It registers all South African Pest Control Association (SAPCA) qualified inspectors bull It works with the Agricultural Research Council for research to optimise the control of
migratory pests bull The Directorate on Marketing works with the National Agricultural Marketing Council
(NAMC) on issues related to equitable access to markets including policy formulation issuing of permits and coordinating inter‐departmental relations to enhance marketing
bull Historically the Department has employed a large number of extension officers located in farming communities who have supported and advised farmers This service has been in decline in recent years but remains an important aspect of state support to the sector
The above roles will be subject to some review in the context of IPAP 2 and also the debates around the role of the state in the economy The issue is not only levels of spending but also clarifying the role of government in relation to the business of the sector
Sector representatives
There are three major umbrella organisations representing the interests of farmers AgriSA TLUSA and the National African Farmers Union of South Africa (NAFU) AgriSA and TLUSA represents both commercial farmers and cooperativesrsquo interests through its engagement at national and international level AgriSA is a member of the Southern African Confederation of Agricultural Unions (SACAU) a regional farmersrsquo union for farmers in Southern Africa AgriSA has structures in all the provinces except Limpopo
Agriculture Sector Analysis 14
AgriSETA June 2010
Agriculture Sector Analysis 15
NAFU is a union for predominantly previously historically disadvantaged smallholder farmers with a membership base including farmers agribusinesses farmersrsquo organisations corporations and individuals who support their goals NAFU is represented by different unions in all the provinces There are other employer organisations who are not affiliated to AgriSA and NAFU including
bull Agricultural Industrial and Medium Employers Organisation bull Agricultural Mining and Industrial Chemical Manufacturersrsquo Association bull Agrilabor Employersrsquo Organisation bull Algoa Meat Traders Association bull East Coast Poultry Producers Employersrsquo Association bull East London and District Meat Traders Association bull Fertiliser Industry Employersrsquo Organisation bull Landbou Werkgewersorganisasie (Workinfocom) bull Red Meat Producersrsquo Association
The Agricultural Research Council is an autonomous statutory body that provides research to DAFF and the provincial departments of agriculture Figures available for South Africarsquos investment in agriculture research and development show that South Africa was above international norms of investment in RampD which are 053 of agricultural GDP for developing countries and 236 for developed countries In South Africa in 2000 agricultural RampD investment in relation to agricultural GDP was 30416 There are six major sources of credit for farmers banks (50) agricultural cooperatives and agribusiness (12) the Land Bank (21) private creditors (8) other creditors and financial institutions (9) and government (1) (GCIS 2010)
12 Factors impacting development in the Agriculture sector Several international and local factors impact on the productivity of the agricultural sector and its growth Key amongst these are
Growth of the South African economy and rising consumer demand International trade and trade agreements The global recession and rise in food prices The land reform programme Reliance on imports Water availability Changing consumer patterns and demands (eg organic food stuffs) Technological changes and mechanisms Quality standards Farm safety and security Broad‐based black economic empowerment Legislation Skills demand and supply HIVAIDS
16 Vink amp van Rooyen 2009
AgriSETA June 2010
These key factors are clustered and discussed below
Future sector economic growth and development
South African sector growth plans (IPAP2)
The 20102011 ndash 20122013 Industrial Policy Action Plan (IPAP) identifies five structural challenges that existed in the South African economy before the global economic downturn and which have been exacerbated by the recent economic crisis These challenges were evident even during the time South Africa was experiencing relatively high growth rates between 2005 and 2007 and have continued during the recession These challenges are
1 Structural imbalances in the growth path including growth that is lagging behind other medium and low income countries
2 Uneven performance of the manufacturing sector with some divisions like the automotive sector experiencing exponential growth while other sectors have stagnated
3 Employment growth being sustained by credit extension and consumption rather than by productive sectors leading to a large current account deficit
4 Low profitability of manufacturing 5 Low savings and investment from financial sector growth Only 52 of private credit was
extended to fixed investment in 2008 Key sectors have been identified for IPAPrsquos focus including agro‐processing which has a diverse group of industries and sub‐sectors including food processing beverages aquaculture horticulture medicinal aromatic and flavourants Key action plans for the agro‐processing sector are identified in IPAP2 as
Development of a National Food Control Agency to consolidate the sector Development of aquaculture to supplement dwindling wild fish stocks Designating specific areas for utilisation of aquaculture Development of the organic food sector Development of the small milling industry Enhancing competitiveness in fruit and vegetable canning Improving beneficiation of Rooibos and Honeybush products (IPAP2 2010)
International Trade
South Africa is a major exporter of Agricultural produce In particular South African fruit and fruit‐derived products such as wine and fruit juice are competitive in the global market However in many sub‐sectors where export potential exists ndash grain and meat ndash serious problems face the industry A key challenge is the uneven playing field experienced by South African exporters Major global competitors include the United States and the countries of the European Union where government subsidies in various forms are in place No such subsidies are in place in South Africa making it difficult if not impossible for South African agricultural produces to enter developed country markets due to the prices that they have to ask for products I In addition the value of the Rand has fluctuated from levels of around R10 to the US dollar to as little as R7 to the dollar When the Rand is strong export becomes difficult because it costs more in the case of the move from R10 to R7 a 30 cost increase for the importer It is impossible to
Agriculture Sector Analysis 16
AgriSETA June 2010
Agriculture Sector Analysis 17
predict whether the World Trade Organisation negotiations known as the DOHA Round will achieve progress in the coming years Historical evidence is that during periods of global recession developed economies become more protective not less and so the current outlook is not good Nor is it possible to predict the value of the Rand though current thinking in government is to move toward a weaker Rand to encourage exports These are two key variables that will need to be factored into the different sector growth scenarios for the future
Global recession and rise in food prices
Economic growth slowed down significantly in sub Saharan Africa and in South Africa in 2009 but there appear to be signs of recovery GDP growth in the region declined from about 6 in 2004 ndash 2008 to about 18 in 200910 GDP growth in South Africa was 16 in 2009 17and rose to 46 in the first quarter of 201018 though much of this is related to the income derived from the 2010 FIFA World Cup and may not be sustained Projections are generally for a slow revival with a set back after the slight rise resulting from the World Cup A return to the 6 levels of the 20078 could take some years The global recession reduced the demand for African exports and reduced capital flows to the region but it is anticipated that the demand for mineral resources by Asian and Western powers will result in both the expansion of exports and expanded foreign direct investment The competition between India and China for African markets is also expected to boost trade to the benefit of African suppliers South Africa is expected to particularly benefit from direct foreign investment from China and India China has already become South Africarsquos largest market for exports and supplier of imports19 Rising food prices have forced governments around the world to control prices of maize bread rice and dairy products In South Africa ldquofood price inflation between December 2005 and December 2006 averaged 788 rdquo20 Although efforts are being made to reduce barriers to poorer families in relation to basic food there has been no move to subsidise food generally This may change though the space for significant levels of support is restricted because of reduced revenue from income taxes resulting from the recession The global credit crunch and recession have meant a reduction in public expenditure and funding which has affected the agricultural sector21
Land reform
In South Africa specifically land reform has a significant bearing on food security and agriculturersquos contribution to GDP The objective of the land reform programme is to transfer 30 of agricultural land to black ownership by 2014 (deferred to 2025) to ensure more equitable access to land by historically disadvantaged people and to increase their participation in agricultural activities22 Land reform has been informed by four processes23
17 Department of Agriculture Forestry and Fisheries 2010 18 Stats SA 2010 19 Department of Agriculture Forestry and Fisheries 2010 20 Department of Agriculture Forestry and Fisheries 2010 ‐2011 Strategic Plan 21 Economic Commission for Africa 2009 22 Xingwana 2008 23 CDE 2008
AgriSETA June 2010
Agriculture Sector Analysis 18
Land restitution involving returning land or providing financial compensation to those whose land was dispossessed during apartheid
Land redistribution transferring more land to the historically disadvantaged Tenure reform modernising land tenure rules and access to land ownership and Providing financial support for the development of emerging farmers
In relation to progress with land reform by September 2009 only 69 of agricultural land (about 567 million hectares) had been transferred and a majority of the beneficiaries have not yet occupied the land due to lack of infrastructure input or technical support The following table gives an indication of the progress of land reform since the inception of the first democratic government
Table 14 Land transfers and beneficiaries ‐ 1994 to 2009
Province Redistribution and tenure Restitution Total Hectares Beneficiaries Claims Hectares Beneficiaries Hectares Beneficiaries
Eastern Cape 675 353 357 25 633 16 201 94 834 215 201 448 191 240 834
Free State 799 350 291 7 721 2 662 47 615 40 893 397 906 48 614
Gauteng 286 34 513 7 328 13 159 9 476 70 179 43 989 77 507
KwaZulu Natal 690 547 414 67 761 14 752 642 447 433 168 1 189 861 500 929
Limpopo 291 91 235 7 403 3 382 513 024 220 227 604 259 227 630
Mpumalanga 444 322 839 13 950 2 694 399 876 225 877 722 715 239 827
Northern Cape 271 952 744 2 773 3 682 539 620 100 554 1 492 364 103 327
North West 300 268 566 40 539 3 709 373 642 172 963 642 208 213 502
Western Cape 223 122 304 12 750 15 546 3 769 118 165 126 073 130 915
Total 3 979 3 043 264 185 858 75 787 2 624 303 1 597 227 5 667 567 1 783 085
Source Greenberg 2010
Achievement of the 30 land reform target is being made difficult by land prices Under the willing buyer willing seller scheme the government will need R74 billion to be able to purchase enough land While resources may be available there are suggestions of lack of capacity The Department of Rural Development and Land Reform (DRDLR) was able to spend only 31 of its land reform 200910 budget in the first six months of the financial year Going forward this Department needs to identify what the real challenges are with the pace of land reform delivery so that they can be mitigated to meet the 2025 target A priority is the retention of skills skills transfer and skills development during the transfer of land as well as retention of national food production to avoid loss of production Support for new beneficiaries of land to ensure sustained productivity is derived from two main sources of funding ndash the Broadening Access to Agriculture Thrust (BADAT) and the Comprehensive Agricultural Support Programme (CASP) CASP is a conditional grant from the Department of Agriculture Forestry and Fisheries to provincial departments to support emerging farmer development Provincial farming budgets dedicated for farmer support in Mpumalanga the Free State Northern Cape and the Western Cape have risen significantly and those in KwaZulu Natal and Gauteng have witnessed a slight increase Eastern Cape and Limpopo agricultural budgets have been steady The North West is the only province where there has been a sharp decline in the share of the budget dedicated to farmer support24
24 Greenberg 2010
AgriSETA June 2010
Agriculture Sector Analysis 19
Reliance on imports
Overall the Agriculture sector contributes positively to the balance of payments ldquoSouth Africa remains food secure The value of our exports increased by 464 from R33 656 million in 200708 to R49 278 million in 200809 During the same period the estimated value of imports rose by 12 from R34 009 million to R38 401 million resulting in a positive trade balancerdquo25
South Africa depends largely on world markets for seed production and agrochemicals Regarding seed production there are only three community seed production schemes in Limpopo and Mpumalanga being piloted with state funding Ten top large companies including two South African companies and multinationals have rights to over two thirds of registered seed varieties in South Africa Despite the dominance of genetically modified and hybrid seed in some sub‐sectors like maize sunflower and sorghum open‐pollinated varieties have been resilient in South Africa enabling the possibility of alternative seed sources not dependent on technological processes26 In relation to agrochemicals deregulation and liberalisation in the fertiliser sector led to the shutdown of local production capacity and South Africa became an importer of fertiliser for the first time in 2000 There are three large players in the fertiliser sector Sasol Nitro Yara and Omnia South Africa imports an estimated 70 of fertilisers and pesticides Fertiliser prices rose by over 200 between 2006 and 2008 but dropped somewhat after that However this hike signified the volatility of the agrochemicals industry and South Africarsquos dependency on imports and the potential risk for emerging farmers and food production of this dependence on imports as the country cannot control the prices making inputs both difficult to budget for and in many cases unaffordable The price of agrochemicals is also particularly influenced by the prices of oil and the exchange rate The general understanding in relation to job creation is that a weaker Rand will improve exports and therefore enable job creation Of course the down side of this strategy is that imports become more expensive So what may be an advantage for those sub‐sectors who are expanding their export volumes those relying on imported agro chemicals will be under increased pressure
Water
Water is both an essential and scarce resource for the agriculture sector and is being threatened by climate changes Crop production relies heavily on water and yet access to water is not being addressed in a systematic way in the land reform processes Greenberg suggests that the relationship between land reform agricultural support and water resource provision is inadequate and a way to address this could be established by linking water provision to land transfer or investing in irrigation for both commercial and resource‐poor farmers However investing in irrigation in the context of water scarcity and climate change may not be the best option What could be needed is finding ways to maximise efficiency of the 60 of South African
25 Department of Agriculture Forestry and Fisheries Strategic Plan 201011 26 Greenberg 2010
AgriSETA June 2010
Agriculture Sector Analysis 20
water used for irrigation by for example using methods such as drip or micro‐irrigation which are expensive to set up but which reduce water wastage by 5‐1027 The Department of Water Affairs is responsible for managing water supply and has to give authorisation for agricultural projects and other developments The department needs to be seen as an important stakeholder in the agricultural sector
The labour market
South Africa recorded an unemployment rate of 243 in 2009 (narrow definition) If people who are no longer actively seeking work are considered the broad unemployment rate rose from 267 to 313 illustrated in the figure below As a direct consequence of the global economic downturn in 2008 870 000 formal jobs were lost in 200928 Others have quoted a figure of over 1 million
Figure 3 Official unemployment in South Africa 2003 ‐2009
Source National Treasury 2010
Annual employment loss followed sector growth patterns with agriculture mining manufacturing and trade facing the highest job losses as their sector growth contracted Unemployment is especially a major problem among lower skilled workers and younger people Youth employment in the 15 ‐24 year age group has fallen by 219 000 (136) and 483 of people in this age group are unemployed Employment of semi‐skilled and unskilled workers has contracted by 527 000 and male employment has gone down by 550 000 (71) while that of women has decreased by 320 000 (52) The number of discouraged workers ie those no longer actively seeking work has increased from 518 000 to 17 million29 Clearly the existence of a very large pool of largely unskilled unemployed workers has an impact on the farming sector It drives wages down and creates opportunities for casualisation and the expansion of labour contract agencies and brokers In addition there are significant numbers of foreign nationals mainly from Zimbabwe and Mozambique who are seeking work and often finding it on farms and in primary processing and packaging plants There are benefits to the
27 Greenberg 2010 28 National Treasury 2010 29 National Treasury 2010
AgriSETA June 2010
Agriculture Sector Analysis 21
sector with skilled and semi‐skilled workers coming into the labour market and being absorbed into the workforce and helping raise productivity levels However at the lower skilled end of the market the existence of this pool brings further casualisation and downward pressure on wages Tensions are likely to increase and further protests either in the form of xenophobic outbreaks or actions against farmers may well increase A view often expressed by farm employers is that current labour legislation makes dismissing workers difficult and so the availability of labour without entering into contracts of employment is an attractive way of avoiding the legislation and its obligations Organised Labour is seeking to restrict these opportunities through either regulating or eliminating labour brokers and efforts are being made to regulate the use of foreign labour However for the foreseeable future the trend is for formally employed people to be reduced in number In relation to the emergent sector there will also be a reluctance to enter employment contracts with workers The fact that many households are engaged in some form of largely unpaid agricultural work means that there is significant casual work dating back many years Helping change this situation into one where casual or unpaid jobs are transformed into formal jobs with regular wages will take time It is also likely that as some emergent farms become established they will act similarly to established farms and institute a form of casual labour rather than expanding a workforce for which they would have to take a level of responsibility From an AgriSETA perspective these labour market trends mean that whilst levy income can be directed at a relatively small labour pool one that is manageable in terms of planning and implementation the size of the informal casual and unemployed labour force in the sector ‐ for whom no levy is paid and who have no employer to plan for their skills needs ndash is very large and its needs almost unlimited Clearly the relationship with the National Skills Fund (NSF) becomes critical in respect of the entire non‐levy income sector Again the level of support available from non‐levy income sources will be an important variable in looking at future sector skills development scenarios
Consumer trends
South Africa currently produces enough food to meet the needs of its population However consumption of three main staples maize wheat and vegetables has been volatile since 1985 and remains below 1990 levels Consumption of maize and vegetables by South Africans is 17 and 32 less respectively than in 198530 The main reasons for this lie in the growing levels of poverty and the difficulties that families have in purchasing nutritious food Whilst government has increased the levels of social grants and increased the number of people receiving grants to around 13 million the incomes of poor families have been badly hit by a range of factors including job losses and rises in food prices The approximately 1 million people who lost their jobs in 20089 meant a loss of income for many millions of dependents Rises in food prices have also had a disproportionate impact on the poor Whilst food is available it is often not accessible to families on the income levels that they have to manage within The result is that less and less nutritious food is purchased which in turn impacts on the ability of farmers to sell their products locally 30 Greenberg 2010
AgriSETA June 2010
Agriculture Sector Analysis 22
Whilst there is no evidence that government will reduce its efforts in relation to poverty relief and social benefits including such programmes as school feeding schemes and food parcels during periods of drought the state of public finances may not enable to support the poverty that grips many rural areas If real income levels for the poor were to rise it could have a significant impact on the economy of the agricultural sector Equally an improvement in the rural economy with increased agricultural production and jobs would dramatically impact on the capacity of people to buy nutritious food Achieving a positive growth path in rural areas is a huge challenge for government and one that is key to governmentrsquos Medium Term Strategic Framework and Industrial Policy Action Plans
HIVAIDS
South Africa has a high prevalence of HIV and AIDS The HIV prevalence among people aged two and above was estimated at 109 in 2008
Table 15 Estimated HIV percentage prevalence by age group (2002 ndash 2008)
Age 2002 2005 2008 Change
Children (2‐14 years) 56 33 25 ‐31
Youth (15‐24 years) 93 103 87 ‐06
Adults (25 and older) 155 156 168 13
15‐49 year olds 156 1692 169 13
Total (ages 2 to 49) 114 108 109 ‐05 Source Avert 2009
The table above shows that HIV prevalence is highest amongst those aged 25 years and older Given youth labour market analyses which point to people from previously disadvantaged backgrounds mainly African males accessing formal employment for the first time at age 25 ‐27 this population can be held to represent people in employment Research31 has estimated that by 2020 the pandemic will have claimed at least 20 of employees in the agricultural sector Southern Africa
in
HIV and AIDS have significant ramifications in the agricultural sector for both commercial farming and subsistence farming The implications include
bull Decrease in cultivated land bull Focus on less labour intensive crop and animal production bull Decrease in womenrsquos agricultural productivity as they take on a more care giving role bull Loss of skills bull Increase in absenteeism from work bull Decrease in daily work outputproductivity because workers are weaker from infections
There are suggestions that the impact of the pandemic in South Africa demands sectoral intervention although this may be difficult in the agricultural commercial sector as
bull Seasonal workers who seem to be more vulnerable to infection because of their low socio‐economic status are not in one place long enough for care programs Further
31 Ingelozi Management Solutions 2008
AgriSETA June 2010
Agriculture Sector Analysis 23
farmers and employers may not feel responsible for seasonal workers in the same way they would invest in their permanent employees
bull There may be uncertainty around land reform which may put HIV intervention on farms on the back burner
bull There are no policies that enforce HIV education and care on farms in the same way that legislation like BEE does for ownership As a result HIV intervention may be left to goodwill and employers may feel it is more important to comply with issues that are monitored
Farm safety and security
South Africa has been plagued by unacceptably high levels of violent crime and murder for many years now Farms have experienced this and those living on farms feel and are extremely vulnerable The South African Chamber of Commerce and Industry (SACCI) has argued that
Using the nominal GDP figure for 2009 of R24 trillion a 322 percent contribution of agriculture to GDP and an estimate of 39982 farms (as at 2007) in South Africa the cost of a murderattack on a farm to the economy was R1932869 per annum
SACCI acknowledges that this estimate is flawed as it does not take into consideration the fact that farming units contribute differently to GDP and that not every attack or murder contributes to farm shut down or loss of productivity However if not addressed these attacks could lead to loss of farming sectors as farmers migrate to lsquosaferrsquo regions This will affect employment and GDP contribution of the sector The need for safety and security on farms may also shift farmersrsquo focus in skills development to include personnel who have skills in safety and security
Broad‐based Black Economic Empowerment
The aim of the AgriBEE Charter (gazetted in 2008) is to increase the involvement of black business in agriculture through ownership and control as executives and senior managers of new and existing agricultural businesses The extent to which AgriBEE is transforming the sector is not known as it is too early to tell but a recent survey conducted by ABC and the IDC showed that among the ABC respondents in 2007 46 of enterprises were busy constructing a BEE strategy and 46 claimed to be implementing a BEE strategy A survey of the dairy industry in the Western and Eastern Cape in 2008 showed that only 6 of firms had a BEE strategy in place It also seems from survey data that companies are focusing on the skills development and socio‐economic aspects of BEE rather than on ownership32 It would appear that although there have been some significant BEE purchases of viable farms and some employee empowerment projects including some quite high profile ones in the Cape Winelands the extent of ownership change had been limited One of the factors is the very high level of single person or family ownership in the agricultural sector BEE is more straight forward in the corporate world where shares can be exchanged For a family business it is a matter of selling off part or all of the land and the tendency is to sell off those areas of the farm that are expendable from a business sustainability perspective
32 Greenberg 2010
AgriSETA June 2010
Whilst there is discussion in government about the ending of the ldquowilling buyer willing sellerrdquo concept the Constitution itself provides for property rights and so although some pressure may be exerted through legislation and regulation the extent and speed of change may not be fast The mechanisms for encouraging the transfer of significant levels of ownership have not yet been created The focus of the SETA is therefore likely to be more the beneficiaries of land reform and emergent farmers though projects of a BEE nature can be targeted as they arise
Conclusions and scenarios It is useful when looking at possible scenarios to examine the key variables or uncertainties and to project how variations one way or the other will have an impact on the development and growth of the sector From the sector analysis and factors that are contributing to change in the sector there are some key factors that seem to emerge First appears to be the economy and related issues of the labour market and the challenges of labour absorption in an enclave economy These factors determine on the one hand whether there will be growth and development and on the other whether such improvements will result in improved employment opportunities and the creation of a virtuous cycle of development Second is the role of the state and the various government departments whose plans and work impact on the agricultural sector Related to this is land reform that is inevitably driven by the state and not the owners of land or the landless The view expressed by many engaged in agrarian reform is that the state must play a significant role It becomes clear that a successful agricultural enterprise requires a number of factors to be in place to be successful These include access to land (Department of Rural Development and Land Reform) agricultural support within a supportive agricultural framework (Department of Agriculture Forestry and Fisheries) access to consistent water supply (Department of Water Affairs) access to finance (Department of Trade and Industry various state agencies) conducive labour market regulation (Department of Labour) sound industrial policy (Department of Trade and Industry) economic planning and macro policy (Department of Economic Development National Treasury) and appropriate education training and skills development (Department of Higher Education and Training the Human Resources Development Council NSA and the SETA) There are other government departments as well as provincial and municipal structures that also play a role The following analyses show how the four variables
economic growth and development role of the government labour market changes and land reform)
impact positively or negatively on the growth of the sector and the demand for skills
Agriculture Sector Analysis 24
AgriSETA June 2010
Agriculture Sector Analysis 25
HHIIGGHH GGRROOWWTTHH SSCCEENNAARRIIOO
The economics of the sector Role of government
The economy in SA and globally continues to revive albeit slowly for the next few years
Roles and integration of national government departments are clarified Specific functions are agreed processes put in place and personnel appointed with the required skills
International trade agreements are still weighted infavour of US and EU but progress is being made and specific blockages are addressed in bilateral talks
The roles of Departments (DWA DAFF DRDLR DoL DTI DED DHET) are clarified with appropriate joint plans and coordinating structures
The rural economy gradually improves with the buying power of the poor increasing and more stable markets created for local produce
For each of the functions agreed in each of the related departments appropriate structures and systems are put in place and staff trained
Exports increase in key areas identified in IPAP 2 and the Rand exchange rate stabilises at a level not too much different than it is today
Specific capacity is put in place at local level to support implementation of land reform and rural development
There is a growing understanding of the concept of dualism and the need to intervene with labour absorption and development mechanisms
Land claims are all finally settled and ownership and tenure is resolved There is a serious drive to establish effective agricultural enterprises
An understanding is reached on the role of agencies and labour brokers and abuse is curbed
The willing buyer willing seller approach is resolved and enables viable land to become black owned
Some relaxation of labour market regulations are agreed that maintain some minimum standard of employment but assist absorption
Land transfer to black and emergent farmers is done in a manner that integrates then into the supply chains of the sector
Mechanisms are found to address skills needs in the context of casual and seasonal work patterns
Financing of land reform and transfer is done on the basis of agreed development plans including skills
Labour market reform Trajectory of land reform LLOOWW GGRROOWWTTHH SSCCEENNAARRIIOO
The economics of the sector Role of government departments The economy in SA and globally stagnates at current levels and the economy struggles to pick up after the temporary 2010 World Cup boost
A lack of purpose at government level means limited progress for another five years Land reform remains a commitment without a plan
International trade agreements are still weighted infavour of US and EU and protectionism increases as a result of the global recession
The roles of Departments (DWA DAFF DRDLR DoL DTI DED DHET) are unclear and there is no proper co‐ordination
SArsquos Gini coefficient continues to worsen with rural poverty increasing and local economies declining
There is a lack of effective structures systems and processes to implement policy across departments
Rand volatility causes problems for importers and exporters Well established markets are maintained but exports decrease
At local level the decline in the agricultural extension officer functions continues and limited practical support is available
Understanding of the rural economy is so diverse that stakeholders cannot agree the problem let alone the solution to low absorption levels
Land claims take too long and land reform processes leave potentially productive land poorly developed and managed
Casual labour and labour brokers remains an issue of dispute Confrontation results in bitterness and resentment
The impasse caused by a rigid interpretations of property clauses in the Constitution continues to stall achievement of the 30 black ownership target
Labour market regulation continues to be a contributing factor to reducing levels of employment
Black owned farms find it difficult to become part of supply chains and are unable to perform adequately
Unstable employment patterns in the sector make skills interventions difficult to manage and largely ineffective
Financing of land reform and land transfer continues to be wasted as it is not tied to the building of appropriate capacity
Labour market reform Trajectory of land reform
AgriSETA June 2010
These analyses can be translated into four potential growth and development scenarios for the agricultural sector which are based on the requirements for a strong development state Scenario 3 Weak government support
and sound economy
Econ
omic fa
ctors glob
ally n
ationa
lly and
locally
Scenario 1 Integrated government support and sound economy
The economic upturn triggered by the World Cup continues and globally things improve enabling an expansion of exports The government because of a lack of integrated policy planning and implementation provides limited support for sector development The gains go to the well established enterprise owners with few gains for emerging farmers and local communities
Government departments coordinate their efforts to achieve maximum impact There are favourable economic conditions that create opportunities for advance Within this positive environment the role of the AgriSETA becomes a central component of a comprehensive strategy for growth and skills interventions are targeted to achieve maximum effect Results in growth in sustainable enterprises and expanded employment opportunities
Government policy and support Government policy and support
Combination of disjointed government policy planning and a weak and increasingly marginalised rural economy Economic conditions result in unsustainable farming conditions and employment declines along with productivity Food shortages and the lack of development in rural areas leading to increasing social tensions A vicious cycle develops with the sector going into long term decline
Government departments coordinate their efforts to achieve maximum impact However economic conditions hamper progress Efforts by the AgriSETA are undermined by poor labour absorption and job insecurity Some significant successes are recorded including some NSF funded projects that result in sustainable enterprises A platform is laid for future improvements when the economic conditions improve
Scenario 4 Weak state and economy Scenario 2 Strong state but weak
economy
Agriculture Sector Analysis 26
AgriSETA June 2010
Agriculture Sector Analysis 27
SECTION 2 DEMAND FOR SKILLS
AgriSETA registered employers and employee coverage
In 2009 17 234 employers were registered with the AgriSETA comprising 15 394 small employers (less than 50 employees) 1 202 medium sized employers (50 ‐ 149 employees) and 638 large employers (more than 150 employees)
Considering that there are around 40000 commercial farms33 the 17 234 employers represent around 43 of commercial farms Notwithstanding changes in the sector as a result of land reform and sector shrinkage this is a sizable proportion and is held to be sufficiently representative for the purpose of skills development planning However this paints an incomplete picture It understates the representative nature of large enterprise registered with the SETA and overstates the representative nature of small registered enterprises 4 175 (242) of the enterprises are levy paying members Further only 1 673 (11) workplace skills plans (WSPs) were submitted
Table 16 Registered employers by size and sub‐sector Sub‐sector Description
Employers Small Medium Large
CoffeeTea Processing and marketing of coffee and tea including coconuts cocoa nuts olives dates etc
33 4 3
Fibre Grading ginning packing of wool and cotton raw material 1 676 16 18
Fruit Fruit packed in cartons fruit juice concentrate drummed and fruit juice in container ready for consumption
271 36 57
Fruit exporters and importers 6 0 1
Grain
Manufacture of grain mill products and starches 119 5 7Handling and storage of grain 67 7 23Wholesale amp retail trade in Agricultural machinery 213 9 4Sale and distribution of Agricultural raw materials and other farming inputs
182 9 3
Milling
Manufacture of flour and grain mill products including rice and vegetable milling grain mill residues
120 15 11
Manufacture of prepared animal feeds 110 19 0Manufacture of pet foods 42 9 0Manufacture of starches and starch products 7 1 1
Pest control
Pest Control 209 4 0
Poultry Poultry and egg production including the slaughtering dressing and packing of poultry
305 49 37
Primary
Growing of Cereals and other crops (not elsewhere classified) 902 160 34Growing of Vegetables Horticultural specialties nursery products
943 120 72
Growing of Vegetables Horticultural specialties (Including Ornamental Horticulture) and nursery products
11 5 0
Sugar plantation including sugar cane and sugar beet etc 9 4 2
33 SARS statistics 2007
AgriSETA June 2010
Agriculture Sector Analysis 28
Sub‐ Description Employers Growing of fruit nuts beverage and spice crops 1795 255 143Farming of cattle sheep goats horses asses mules and hinnies Dairy farming
2 252 59 18
Other animal farming production of animal products (NEC) 433 25 12Ostrich farming 5 0 0Game farming 16 0 0Growing of crops combined with farming of animals (Mixed farming)
2 920 256 109
Growing of coffee and tea including coconuts cocoa nuts olives dates etc
2 0 0
Agricultural and animal husbandry services except veterinary activities
438 22 9
Other animal farming (not elsewhere classified) 11 1 1Growing of trees as second crop by farmers 126 18 4Fishing operation of fish hatcheries and fish farm 913 10 6
Red meat
Production and animal products (not elsewhere classified) 6 0 0Slaughtering dressing and packing of livestock including poultry and small game for meat
317 40 17
Production sale amp marketing of Agricultural by products (eg bones hides)
61 2 0
Slaughtering dressing and packing of livestock including small game for meat and processing of ostrich products
2 1 0
Wholesale trade in Agricultural raw materials and livestock 193 7 10Transport of livestock as supporting activity 224 0 0Agricultural and livestock research 215 9 3
Seed Seed production and marketing 149 12 6
Sugar Manufacture of sugar including golden syrup and castor sugar
45 5 21
Tobacco Processing and dispatching of tobacco 46 8 6 TOTALS 15 394 1 202 638Source AgriSETA WSP data
The largest number of registered small and medium enterprises are found in the mixed farming sub‐sector while most large enterprises are in the growing of fruit nuts beverage and spice crops sub‐sector
Employee coverage in the AgriSETA
Collectively the 17 234 employers registered with AgriSETA employed a total of 239 076 employees This represents 39 of the agricultural labour force in 2009 The 1 673 employers who submitted WSPs in 2009 employed 97 898 employees representing 41 of the total number of people employed by registered employers While the number of registered employers submitting WSPs is small (11) they employ a sizeable number of employees and the percentage of employees provides a statistically significant sample The data for larger enterprises is statistically much more representative than that for small enterprises
AgriSETA June 2010
Table 17 Number of employees of registered employers by sub‐sector
Sub‐sector
Sub‐sector description Employees
CoffeeTea Processing and marketing of coffee and tea including coconuts cocoa nuts olives dates etc
483
Fibre Grading ginning and packing of wool and cotton raw material 6 539
Fruit Fruit packed in cartons fruit juice concentrate drummed and fruit juice in container ready for consumption
27 661
Fruit exporters and importers 212
Grain
Manufacture of grain mill products and starches 133Handling and storage of grain 18 303Wholesale amp retail trade in Agricultural machinery 795Sale and distribution of Agricultural raw materials and other farming inputs 2 898
Milling
Manufacture of flour and grain mill products including rice and vegetable milling grain mill residues
3 634
Manufacture of prepared animal feeds 731Manufacture of pet foods 160Manufacture of starches and starch products 105
Pest control
Pest Control 119
Poultry Poultry and egg production including the slaughtering dressing and packing of poultry
19 187
Primary
Growing of Cereals and other crops (not elsewhere classified) 10 104Growing of Vegetables Horticultural specialties and nursery products 37 799Growing of Vegetables Horticultural specialties (Including Ornamental Horticulture) and nursery products
195
Sugar plantation including sugar cane and sugar beet etc 220Growing of fruit nuts beverage and spice crops 47 043Farming of cattle sheep goats horses asses mules hinnies Dairy farming
3 382
Other animal farming production of animal products (NEC) 4 203Ostrich farming 0Game farming 0Growing of crops combined with farming of animals (Mixed farming) 28 722Growing of coffee amp tea including coconuts cocoa nuts olives dates etc 0Agricultural and animal husbandry services except veterinary activities 970Other animal farming (not elsewhere classified) 513Growing of trees as second crop by farmers 1 294Fishing operation of fish hatcheries and fish farm 1 589
Red meat
Production and animal products (not elsewhere classified) 0Slaughtering dressing and packing of livestock including poultry and small game for meat
5 128
Production sale amp marketing of Agricultural by products (eg bones hides) 116Slaughtering dressing and packing of livestock including small game for meat and processing of ostrich products
0
Wholesale trade in Agricultural raw materials and livestock 1 697Transport of livestock as supporting activity 0Agricultural and livestock research 534
Seed Seed production and marketing 2 127Sugar Manufacture of sugar including golden syrup and castor sugar 10 478Tobacco Processing and dispatching of tobacco 2 002 Total 239 076
Agriculture Sector Analysis 29
AgriSETA June 2010
Agriculture Sector Analysis 30
Source AgriSETA WSP data
According to the WSP analysis the sub‐sector for the growing of fruit nuts beverage and spice crops employed the largest number of people In six sub‐sectors there are employers who do not employ workers These are probably family based organisations where family members help in the business without drawing a salary These are in transport and livestock research slaughtering dressing and packing of livestock including poultry and small game for meat growing of coffee and tea including coconuts cocoa nuts olives dates etc ostrich farming and game farming
Table 18 Employee distribution by province Province Employees Percentage
Eastern Cape 18 844 192 Free State 1 946 20 Gauteng 2 788 28 KwaZulu‐Natal 5 416 55 Mpumalanga 8 062 82 North West 3 290 34 Northern Cape 5 436 56 Limpopo 1 730 18 Western Cape 50 386 515 Grand Total 97 898
Source AgriSETA WSP data
Of those submitting WSPs registered employers in the Western Cape employed the largest number of people while employers in Limpopo employed the least number of employees Free State has a small number of employees covered by WSPs submitted to the SETA whereas Eastern Cape with a relatively small number of registered farms has a very large number of employees on farms submitting WSPs Given this variance between provinces the use of WSP data for extrapolation purposes must be viewed cautiously
2009 WSP equity information was only provided for about a quarter of employees (25 637 or26)34 No information was available from the WSPs on non‐South Africans working on commercial farms
Table 19 Equity profile from 2009 WSP data African Coloured Indian White
Totals M F D M F D M F D M F D
8 040 5 785 38 5 097 5 228 24 22 25 0 811 556 11
580 417 03 493 505 02 468 532 00 589 403 08 13 863 10 349 47 1 378 25 637541 404 02 54 100
Total EquityTotal Male Total Female Total Disability
13 970 11 594 73 545 452 03
Source AgriSETA WSP data
Using currently available data it is not possible to provide disaggregated employment data by sub‐sector This will require a small change in the way that gender race and disability data is
34 Some employers did not complete race and gender information when giving their employment profiles
AgriSETA June 2010
codified during WSP data‐capturing including allocation by sub‐sector What can be stated is that employment of males is more dominant than that of women and more Africans are employed in the sector than other groups Employment of people with disabilities is below 1
21 Skills demand
The National Education and Training Strategy for Agriculture (AET Strategy)
The AET Strategy developed by the Department of Agriculture Fisheries and Forestry (in consultation with various key stakeholders in the agricultural sector) highlights priority skills needs and constraints within the sector and categorises needs within the following 5 broad areas
1 Agricultural production ndash requesting that the past focus on a narrow band of commodities (relevant mainly to the commercial sector) and related research be expanded to address the needs of small‐scale and subsistence farmers (eg more focus on mixed farming and rural livelihood sustainability skills)
2 Agricultural engineering ndash with specific focus to be placed on technologies suitable for small‐scale farmers (eg relevant and post‐harvesting techniques related to processing and storage of produce) ndash to address this need the scarcity of agricultural engineers requires attention
3 Agricultural economics ndash a critical need was identified for general agricultural economic skills (ranging spectrum of farm planning farm management enterprise management marketing finance etc) ndash with the need to training both farmers and extension officers in such fields
4 Agricultural development ndash a specific need was identified to develop agricultural extensionists in supporting especially emerging and small‐scale farmers over the full spectrum (a need exists for both new curriculum in the training of new extensionists and the re‐training and upgrading of existing officers)
5 Veterinarians ndash the need to develop state veterinarians in order for the state to perform its role and function (particularly in its preventative monitoring and regulatory role and function)
AGRISETA sector skills planning demand data (2008‐2009)
The following section reflects initial research on skills demand in the Agricultural sector arising from the sector analysis (section 1) previous AGRISETA skills demand research for Sector Skills Planning during 2005‐2009 and analysis of WSP data from 2009 With the introduction of the Organising Framework of Occupations and agreement on definitions for scarce and critical skills in 200506 the AGRISETA undertook an extensive research and consultation processes to determine skills development priorities for the sector The research methodology employed was based on the a four dimensional topology for establishing and evaluating skills needs illustrated in the figure below
Agriculture Sector Analysis 31
AgriSETA June 2010
Agriculture Sector Analysis 32
The identification and prioritisation of skills needs was also undertaken from a key stakeholder and beneficiary perspective Consideration was given to needs of the following groups
bull The unemployed ndash helping them gain andor regain entry to the labour market bull The economically inactive ndash helping them to become economically active bull School leavers ndash helping them gain access to further education and training opportunities
and thus facilitating their entry to the job market bull Entrants to the job market ndash facilitating employment and integration into the work culture
and work ethic (improving the employability of an individual) bull Those currently employed in the sector ndash increasing their competency and opportunities
for advancement creating a career path and offering continued job security enhancement of value adding to the sector improving their prospects for better employment opportunities
bull Organisations and enterprises within the sector ndash making sure that skills development and knowledge creation occurs in such a way as to improve the sectorrsquos viability and allowing companiesenterprises to become more sustainable and profitable along the way improving productivity competitiveness and innovation within organisations
In organising and reporting the identified priority skills development needs (200809) the following structuring approach was followed
Tier 1 The four categories of needs as per the Topology presented above were used for the identification evaluation and grouping of needs
Pay conditions
Image
RECRUITMENT DIFFICULTY
SKILLSGAP
SKILLSSHORTAGE
LABOURSHORTAGE
Firms experience difficulty recruiting This does not necessary imply a skills shortage ndash may indicate a poor image remuneration etc
Those currently in work do not have the requisite skills set to carry out their job to an optimum standard
Required skills are in short supply when compared with the demand across the whole labour market
Regardless of skills levels a situation exists where there is simply not enough supply of labour to meet demand
Pay conditions
Image
RECRUITMENT DIFFICULTY
SKILLSGAP
SKILLSSHORTAGE
LABOURSHORTAGE
Firms experience difficulty recruiting This does not necessary imply a skills shortage ndash may indicate a poor image remuneration etc
Those currently in work do not have the requisite skills set to carry out their job to an optimum standard
Required skills are in short supply when compared with the demand across the whole labour market
Regardless of skills levels a situation exists where there is simply not enough supply of labour to meet demand
Figure 4 Topology for identifying skills development priorities
Source AGRISETA SSP Annual Update August 2009
AgriSETA June 2010
Tier 2 Within each of the first tier groupings needs were further broken down and organised per target group At this second level needs were grouped by
o General skills development needs (cross‐cutting over different target groups) o Needs experienced by small scale farmers (this group included subsistence
farmers new emerging land reform beneficiaries and small‐scale AgriBEE farmers) o Needs within the commercial agricultural sector (per sub‐sector groupings where
specific needs for such were identified ndash both on‐farm needs and within the secondary sub‐sector or related agri‐businesses)
o Needs of the Department of Agriculture Fisheries and Forestry (DAFF) To further guide and direct the identification and selection of scarce and critical skills the following factors or criteria that could reflect the importance (impact and effect) of a skills shortages were developed as an identification framework
1 Basic Skills Development Promoting basic literacy and numeracy and raising the base level of education for the sector improving the work and livelihood of existing workers
2 Employability Making the employee more employable by improving the fit between their skills and the sector needs
3 Enterprise Viability Improving the capability and feasibility of the enterprise by increasing its effectiveness of or possibilities for profit generation etc
4 Enterprise Sustainability Allow enterprises to survive and grow over an extended period of time without compromising the value of renewable resources thereby creating long‐term meaningful employment for larger numbers of people
5 Sector Growth Enabling the sector to develop or pursue new opportunities or improve the effectiveness of current operations
6 Sector Competitiveness Enabling the sector to compete more effectively in the international arena improving market intelligence and interpretation productivity cost efficiency etc
7 Human Resource Development Capacity Improving the access to quality provision of training to the agri sector
Based on this research and consultation framework the following skills development needs and priorities were identified
Agriculture Sector Analysis 33
AgriSETA June 2010
GENERAL NEEDS SMALL‐SCALE FARMER
NEEDS COMMERCIAL SECTOR
NEEDS DAFF NEEDS
RECRUITMENT RELATED SKILLS NEEDS Primary agriculture is the entry point into the world of work for large numbers of people in rural areas However the sector has negative connotations amongst sections of the youth and in parts of the country and is viewed as a last resort for some in the search for employment) The effect is that despite an unemployment rate of approximately 26 (now over 30) farmers find it difficult to recruit workers to meet seasonal demands This has resulted in the government approving the contracting of foreign labour to meet such temporary needs (workers are recruited mainly from Zimbabwe and Mozambique)
Labour in this farming sector is provided primarily by family members and no real recruitment constraints can be identified
The agricultural sector still manages to attract technical and management skills as it is perceived to include a better lifestyle and there is a strong tradition of agriculture in SA Increasing crime related security risks associated with farming may have a negative impact
The Department has identified a number of occupations in which they are experiencing long‐term vacancies Some of these result from a general shortage of such skills in SA while others arise from the inability of the public sector to compete with the private sector (less favourable employment image working conditions and equity considerations) Priority vacancies include Veterinarians Agricultural
Engineers Plant Health
Specialists Agricultural
Statisticians Plant Health Pest Risk
Analysts ICT Specialists Agricultural
Economists Agricultural Food and
Quarantine Technicians
Agro‐meteorologists Pasture Scientists Plant Production
Specialists Specialised Food
Analysts SKILLS GAPS RELATED NEEDS
bull Low literacy and numeracy levels ndash both amongst workers within the sector at large and at ownermanager level in many of the small‐scale farming
bull Farm management
Farm Management (Mainly owners managers) bull Farm management amp
entrepreneurship bull Resource
management and record keeping
bull Financial planning
A critical constraint is the poor educational levels of a large proportion of the labour force in the sector demanding a considerable effort and investment in ABET and other life skills
A particularly big need exists for skills upgrading amongst Extension Officers ndash particularly with regard to redress the historical neglect of small‐scale farmers and resource strapped farmers
Agriculture Sector Analysis 34
AgriSETA June 2010
Agriculture Sector Analysis 35
GENERAL NEEDS SMALL‐SCALE FARMER
NEEDS COMMERCIAL SECTOR
NEEDS DAFF NEEDS
skills (and general management skills in other agricultural businesses) coupled with a business orientation and entrepreneurship skills
bull A general need to increase compliance with environmental occupational health and safety animal welfare produce safety and hygiene standards regulations and requirements (local and international standards)
and management bull Project management bull Business plan
development Marketing and processing bull Processing and
packaging bull Transport
management bull Marketing produce
including branding bull Planning for
marketing bull Knowledge of
markets Technical knowledge and skills bull Production
management (related to specific enterprise)
bull Demonstration of production techniques
bull Natural resources management
Mechanical knowledge bull Farm maintenance bull Repairs of machinery
and equipment bull Electrical
maintenance and installation
programmes Need for improved management skills and relevant technological knowledge for increasing productivity levels and improved production methods Rising importance for environmentally responsible production and processing management systems Rising competitive and international markets increases need for business and marketing abilities among owners and managers Increasing requirements for compliance with environmental health and safety and international trade standards Information technology although not a priority is increasing in importance Business management ability is becoming increasingly important as more farmers are making decisions about restructuring their businesses diversification and developing supplementary sources of income
Critically improved farm management and business skills within an agricultural context to support the majority of BEE and emerging farmers Skills upgrading requirements for existing Extension Officers include bull Agricultural
economics bull Agricultural
management bull Business and
financial management
bull Technical and production related skills including o Animal husbandryo Poultry o Crop production o Horticulture
SKILLS SHORTAGES Generally SA has a shortage of entrepreneurs and people who have the business acumen drive motivation and
The profile of these farmers reflects a large contingent of older and less educated people who are generally less flexible tend to stick to
The commercial agri sector will increasingly have to compete in the global market and the ever increasing need to increase productivity to
DAFF us experiencing problems are especially sourcing people in specialised science related fields (learning fields experiencing few
AgriSETA June 2010
Agriculture Sector Analysis 36
GENERAL NEEDS SMALL‐SCALE FARMER
NEEDS COMMERCIAL SECTOR
NEEDS DAFF NEEDS
perseverance to become a successful farmer Given the high risks involved in the agricultural sector (natural elements outside onersquos control) the agri sector does not compete successfully for this ldquoscarce resourcerdquo Moreover as with other professional and skilled occupations there is a tendency for younger qualified people to move to urban areas
known practices and are less likely to experiment with new technology Within this target group candidates with good entrepreneurial ability are scarce There is a perceived shortage of Agricultural Extensionists and advisors to assist this target group However a large pool of young unemployed graduates exists who could assist such emerging farmers if they were mobilised and made accessible to farmers Similarly the potential pool of retired commercial farmers who could serve as mentors to this target group
remain profitable and viable it can be stated that many of the existing farmers and managers owners lack business management and entrepreneurial orientation Equity policy and the need to become BEE compliant requires that commercial enterprises appoint and develop black owners directors managers Changing local and global consumer preferences require farmers to change traditional farming methods and practices Skills and knowledge requirements include bull Global food and
international quality standards
bull Product traceability requirements
bull Organic produce and products
Specific occupations identified as being in short supply are
bull Production Managers (food processing)
bull Product specialisation to international specifications (research skills)
bull Forklift drivers heavy vehicletruck drivers and mobile plant operators
bull Experienced and competent artisans (millwrights electricians fitters
enrolments andor pass rates at HET institutions with the result that too few qualified persons come onto the labour market) Examples of such skills shortages identified by the Department include Agricultural Engineers bull Plant Health
Specialists (Nematology Entomology Plant Pathology)
bull Statisticians (specialised agricultural knowledge)
bull Plant Health Pest Risk Analysts
bull Agricultural Economists (production and resource economists)
bull Agricultural Food and Quarantine Technicians
bull Agro‐meteorologists Early warning Specialists
bull Pasture Scientists bull Plant Production
Specialists (eg ornamental crops hydroponics)
bull Specialised Food Analysts (pesticide residue analysts processed food and dairy analysts wine and spirit analysts)
AgriSETA June 2010
Agriculture Sector Analysis 37
GENERAL NEEDS SMALL‐SCALE FARMER
NEEDS COMMERCIAL SECTOR
NEEDS DAFF NEEDS
and turners bull Agricultural
Equipment Technicians
bull Pest and weed controllers
bull Horticultural specialists
LABOUR SHORTAGES AND RELATED SKILLS NEEDS Given an employment rate of some 26 (2009 currently estimated at over 30expanded definition) per definition there cannot be a labour shortage It is however difficult for people who have never worked before to integrate into the agricultural sector workforce Coupled with an aging workforce (30‐60 being over 40) means that most agri enterprises will within the next 5‐10 years be looking at replacing a large proportion of their workforce There could be an insufficient pool of people willing and able to participate The impact of HIVAIDS is also not always factored in to understanding the diminishing pool of resources available Labour shortages have been reported within selected geographical areas and in particular occupations Examples include cane cutters in the sugar industry chicken catchers in the poultry industry pickers in the fruit industry and animal handlers in feedlots as well as dairy parlour workers It is however believed that these shortages may reflect a recruitment problem as a result of the very harsh working conditions and the relatively poor remuneration (which makes these occupations unpopular) At present such ldquoshortagesrdquo are addressed through contracting labour from neighbouring countries
AgriSETA WSP analyses
Skills demand in the commercial agricultural sector
Information for demand for skills from WSP data is available for 1 673 employers who submitted their WSPs for the 200910 period The table below shows data on sub‐sector WSP submission relative to size of the sub‐sector as well as subsector data from all registered organisations and those who submitted WSPs Data for registered employers shows that there were 239 076 employees employed by the 17 234 registered organisations As previously stated 97 898 employees were employed by the organisations submitting WSPs This constitutes 41 of employees employed by registered organisations
Table 20 Employment and sub‐sector data drawn from WSP analyses
Sub‐sector
All Re
gistered
Employers
Small employers (0‐49)
Med
ium and
large
employers (50+)
Total W
SPs received
Total W
SPs received
as of
all registered em
ployers
WSP
received med
ium and
large orgs
WSPs received
as of
med
ium amp large em
ployers
WSPs received
small
employers
WSPs received
as of small
enterprises
EmployeesPer
Profile
CoffeeTea 40 33 7 9 23 5 71 4 12 483 Fibre 1 710 1 676 34 34 2 22 65 12 07 6 539
AgriSETA June 2010
Agriculture Sector Analysis 38
Sub‐sector
All Re
gistered
Employers
Small employers (0‐49)
Med
ium and
large
employers (50+)
Total W
SPs received
Total W
SPs received
as of
all registered em
ployers
WSP
received med
ium and
large orgs
WSPs received
as of
med
ium amp large em
ployers
WSPs received
small
employers
WSPs received
as of small
enterprises
EmployeesPer
Profile
Fruit 371 277 94 162 44 76 81 86 31 27 873 Grain 648 581 67 77 12 48 72 29 5 22 129 Milling 335 279 56 61 18 35 63 26 9 4 630 Pest Control 213 209 4 8 4 2 50 6 3 119 Poultry 391 305 86 66 17 46 53 20 7 19 187 Primary 12 121 10 776 1 345 1144 9 513 38 631 6 136 034 Red meat 1107 1 018 89 70 6 45 51 25 2 7 475 Seed 167 149 18 24 14 13 72 11 7 2 127 Sugar 71 45 26 13 18 10 38 3 7 10 478 Tobacco 60 46 14 5 8 3 21 2 4 2 002
Totals 17 234 15 394 1 840 1 673 10 818 44 855 16 239 076
Source 1 AgriSETA WSP 2009 data
Only 10 of all registered employers submitted WSPs for the 200910 period Of these 49 were medium and large sized employers and 51 small However only 16 small employers submitted their WSPs relative to the number of registered small employers and 44 medium and large employers submitted WSPs relative to the number of registered medium and large employers As such skills demand statistics provides more representative data on the requirements of medium and large employers Data for skills demand in the commercial agricultural sector is based on data for permanent employees as well as casual and seasonal employees
Skills demand forecasting by AgriSETA
Forecasting for skills demand the AgriSETA has estimated that the demand for skilled employees at different levels in the next few years is 510 686 This is based on WSP data analyses over the last 5 years and projected demand for the formal commercial agricultural sector and factoring in the demand that at maximum would result from completion of the land restitution programme in South Africa The table below reflects the skills that are on demand as well as the estimates for demand over the next five years by major occupational category35
35 AgriSETA 2010
AgriSETA June 2010
Table 21 Demand for skills by occupational category
Major Occupation (OFO)Estimated Demand
Group Title1 Managers (commercial and small emerging farmers) 264 3702 Professionals 4 1413 Technicians and Trade workers 8 9255 Clerical and administrative workers 8006 Sales workers 4007 Machinery operators and drivers 5 8008 Elementary workers 226 250
Total 510 686Source AgriSETA WSP data and SSP demand forecasts
Research needs going forward
As has been set out in the sector analysis and the scenarios derived from that analysis the sector is faced by both significant and profound change and also great uncertainty It therefore follows that the task of focussing limited resources (basically levy income in the formal sector and NSF funds for the emergent farming sector) is difficult Whilst the general thrust of training remains broadly as described in the 2006‐10 SSP Updates some considerable work is required to achieve targeted effective interventions during the 2011‐2016 period The following research questions will need to be addressed in preparing the next SSP
bull In relation to the managers and owner‐managers of commercial farms and enterprises what skills are needed to enable them to help bring about the more optimistic scenario and manage the risks associated with the less optimistic ones
bull In terms of professional and technical competencies do the current education and training institutions coupled with the learning programmes available through the AgriSETA (learnerships skills programmes and the like) meet the needs of the sector
bull In the emerging agricultural sector do the current programmes funded by sources external to the AgriSETA (eg NSF) meet all the identified needs What gaps are there and how should they be addressed
bull In relation to governmentrsquos growth strategy and industrial action plans what skills are required for developing the aquaculture sub‐sector What programmes are available How can the SETA support the skills needs for this sub‐sector
bull Given the increasing levels of casual and contract labour how can skills be developed to meet the needs of the formal commercial sector and the emerging enterprise sector
bull How can the demand in each of the priority areas be quantified and agreement be reached on numbers of people to be trained
Agriculture Sector Analysis 39
AgriSETA June 2010
SECTION 3 Skills Gaps and scarce skills
Scarce skills at the DAFF
The level of scarce skills at DAFF can be determined by the vacancy rate While the average vacancy rate in the department as at 31 March 2009 was 17 there were some posts that had very high vacancy rates as reflected in the table below Indicating the possibility that the Department is experiencing difficulties in finding suitable candidates in the South African labour market to fill these posts
Table 22 Scarce skill occupations and vacancy rates (DAFF March 2009) Critical occupations Number of posts Posts filled Vacancy rate ()
Agricultural animal oceanography forestry and other sciences
167 119 287
Engineering sciences related 2 1 50Engineers and related professions 13 6 538Farming forestry advisors and farm managers 11 4 636Finance and economics related 73 53 274Horticulturists foresters agricultural and forestry technicians
350 221 369
Legal related 6 4 333Mechanical engineering technicians 3 2 333Risk management and security services 6 4 333Social sciences related 1 0 100Veterinarians 34 24 294
Source DAFF Annual Report 20082009
Skills are also scarce at senior management level The department also reports on difficulties it has filling senior management services vacancies with some of them staying vacant for up to twelve months because no suitable candidates can be found The department would then resort to re‐advertisement and head hunting This was the case with 22 of 18 SMS posts in March 2009
Scarce skills in the commercial sector
The following occupations have previously been projected as scarce (extremely hard to fill vacancies) by AgriSETA in the commercial agricultural sector over the next five years
Table 23 Scarce and critical skills in the commercial agricultural sector
Occupation Code
Group Occupation Critical Skills Intervention Comments
139903 Managers Laboratory Manager
Technology AI nutrition
HET
221101 Professionals Accountant (General)
General HET
221102 Professionals Management Accountant
Farm financial management
HET Focus on support advice to farmers new enterprises
222101 Professionals Commodities Trader
Export administration supply chain
FET Learnership Skills
Agriculture Sector Analysis 40
AgriSETA June 2010
Agriculture Sector Analysis 41
Occupation Code
Group Occupation Critical Skills Intervention Comments
management Programme
224301 Professionals Economist Agricultural HET
Mainly for Department of Agriculture and para statals commodity organisations
233101 Professionals Chemical Engineer
Chemical processes in food production
HET Industries such as sugar processing
233301 Professionals Electrical Engineer
Installation and maintenance
HET Processing industry
233401 Professionals Electronics Engineer
Computerised production prosesses
HET Processing industry
233501 Professionals Industrial Engineer
Productivity and efficiency
HET Processing industry
233904 Professionals
Instrument Engineer (Defence Force)
Installation and maintenance
HET
Not for defence ‐ sugar industry
233502 Professionals Mechanical Engineer
FETHET Equity reasons
233902 Professionals Agricultural Engineer
Farm layout and infrastructure
HET Mainly in Government
311101 Technicians and trades workers
Agricultural Technician
Installation and maintenance
FETHET
234102 Professionals Agricultural Scientist
Agri research HETFET Especially in horticulture
234201 Professionals Chemist HET Processing industry
234202 Professionals Food Technologist
Food safety HACCP
FETHET Across sector
234701 Professionals Veterinarian HET Mainly in Government
311101 Technicians and trades workers
Agricultural Technician
Farm infrastructure
FET Mainly needed in government
311401 Technicians and trades workers
Chemistry Technician
FETHET EE reasons
312907 Technicians and trades workers
Chemical Engineering Technician
FET Learnership
Mainly EE reasons
312402 Technicians and trades workers
Electronic Engineering Technician
Weak stream production infra
FETHET Mainly tobacco industry
233904 Professionals
Instrument Engineer (Defence Force)
Instrument technician
FET
Occupation needed Instrument Technician (not defence force) Mainly sugar processing sector
321202 Technicians and trades workers
Diesel Motor Mechanic
FET Learnership
To include tractor mechanic
321204 Technicians and trades workers
Small Engine Mechanic
Agricultural equipment
FET Learnership
Throughout sector
AgriSETA June 2010
Agriculture Sector Analysis 42
Occupation Code
Group Occupation Critical Skills Intervention Comments
322301 Technicians and trades workers
Metal Fabricator
Artisan FET Learnership
322303 Technicians and trades workers
Welder Welder (First Class)
Artisan FET Learnership
323203 Technicians and trades workers
Fitter‐Welder Artisan FET Learnership
Mainly sugar ndash multi‐skilled
323202 Technicians and trades workers
Fitter And Turner
Artisan FET Learnership
Tobacco and sugar
323501 Technicians and trades workers
Millwright Artisan FET Learnership
Wide‐spread need
341101 Technicians and trades workers
Electrician (General)
Artisan FET Learnership
Wide‐spread need
342101 Technicians and trades workers
Air‐Conditioning And Refrigeration Mechanic
Artisan FET Learnership
Sugar pack houses cold chain
Source AgriSETA Sector Skills Plans
Supply of skills
South Africarsquos agriculture skills are produced in high schools agricultural colleges FET colleges and Higher Education institutions In high school a large cohort of learners take Agricultural Science as a subject In 2003 there were 42 Agricultural High Schools offering Agricultural Science as a subject These students and those in high schools taking the subject could progress to taking agriculture as a focus area for further education In 2004 there were 10 FET colleges offering vocationally directed agricultural programmes These FET colleges offered complete qualifications and short courses Eleven Colleges of Agriculture can offer qualifications up to degree level and 19 universities offer qualifications in Agriculture ranging from agricultural economics animal and plant sciences and horticulture among others at under and post graduate levels (Department of Agriculture 2006) While long term planning of skilling of new entrants in the sector can be done through close consultation between the sector agricultural schools and colleges FET colleges and HET institutions so that they teach relevant skills there are other avenues for training for those who are already employed in the sector for example skills programmes and learnerships There are 15 registered qualifications for the primary agriculture sub sectors Currently AgriSETA has 94 registered learnerships that can address the skills needs of the identified scarce skills These are captured in Appendix 2 AgriSETA has approved accredited a number of training providers across the country to deliver the theoretical and practical components of these learnerships These include agricultural colleges FET colleges and private providers Currently the AgriSETA has 246 registered and approved providers distributed nationally as follows
AgriSETA June 2010
Table 29 AgriSETA approved training providers (2010) Province Number of providers
Gauteng 72
(29)
KwaZulu Natal 20
(8)
Limpopo 35
(14)
North West 30
(12)
Northern Cape 3
(1)
Free State 15
(6)
Mpumalanga 14
(6)
Western Cape 26
(11)
Eastern Cape 31
(13) Total 246
The providers are small to large organisations In primary agriculture small providers appear to offer the most training in rural areas and community projects (AgriSETA 2010) Most of the operating providers will be in FET colleges and agricultural colleges The AgriSETA is unable to meet the total demands for skills across the duality of their sector There seems to be fairness in the approval of training for both permanent and casual and seasonal workers In 200809 the AgriSETA approved 559 learnerships as follows
Table 30 AgriSETA learnerships approved for grant purposes (2008‐2009)
Source AgriSETA learnership data analysis
Agriculture Sector Analysis 43
AgriSETA June 2010
Agriculture Sector Analysis 44
Provision of skills programmes in the same year attracted grants for 2 706 employees
Table 31 Participation by learners in skills programmes in the AgriSETA (200809)
Source AgriSETA Skills programmes data analysis
AgriSETA June 2010
APPENDIX 1 Skills demand in the Department of Agriculture Forestry amp Fisheries (200809)
Source DAFF Annual Report 2008‐20009
Agriculture Sector Analysis 45
AgriSETA June 2010
Agriculture Sector Analysis 46
Appendix 2 AgriSETA registered learnerships Registered Learnership NQF Level SAQA Registration NoLearnership in Agri Sales and Service 4 22 Q 220001 20 178 4Learnership Agricultural Machinery Technician 2 22 Q 220007 20 160 2Learnership in Specialist Agricultural Machinery Technician 5 22 Q 220009 21 258 5Agri Trade Processes 2 22 Q 220013 30 125 2FETC Meat Examination Applying Basic Business Principles 4 30 Q 3000 2823 164 4Further Education and Training Certificate Seed Marketing Execute Seed Trials 4 22 Q 220025 21 126 4Further Education and Training Certificate Seed Research and Development Certify as Seed Unit 4 22 Q 220027 21 121 4FETC Seed Research and Development Conduct a Field Inspection of a Seed Unit 4 22 Q 220028 20 120 4Seed Research and Development Operations Operate in a Team 3 22 Q 220020 22 121 3Seed Research and Development Operations Apply Basic Business Principles 3 22 Q 220021 22 121 3National Certificate Seed Processing and Packaging Operate in a Team 3 22 Q 220026 21 123 3Sugar Industry Technical Maintenance worker 2 22 Q 220011 39 128 2National Certificate Sugar Manufacturing and Refining Technical Maintenance 3 30 Q300003 23 146 3Further Education and Training Certificate Manufacturing Technical MaintenanceProduce Components by Performing Engineering Turning Operations
4 30 Q 3000 1321 173 4
FETC Manufacturing Technical Maintenance Produce Components by Performing Milling Operations 4 30 Q 3000 1521 173 4 FETC Manufacturing Technical Maintenance Develop and Fabricate from Complex Drawing 4 30 Q 3000 1420 173 4National Certificate in Sugar Technology 5 22 Q 220036 22 140 5Further Education and Training Certificate Sugar Processing 4 22 Q 220035 31 144 4National Certificate in Sugar Technology Processing Sugar Refining 2 22 Q 220037 28 124 2National Certificate in Sugar Technology Processing Juice Preparation 2 22 Q 220038 28 124 2National Certificate in Sugar Technology Processing Crystallisation 2 22 Q 220039 27 122 2National Certificate in Sugar Technology Processing Laboratory Practice 2 22 Q 220040 25 124 2National Certificate in Sugar Technology Processing Extraction 2 22 Q 220041 28 122 2NC Rooibos Production Applying Basic Business Principles 2 30 Q 3000 2427 130 2 NC Rooibos Processing Applying Basic Business Principles 2 30 Q 3000 2224 123 2 National Certificate Cigarette Production 3 22 Q 220046 23 121 3
AgriSETA June 2010
REFERENCES AgriSETA 2010 AgriSETA 20082009 Annual report Pretoria AgriSETA Agricultural Research Council httpwwwarcagriczahomeasppid=272 Avert South African HIV and AIDS statistics Available on httpwwwavertorgsafricastatshtm Centre for Development Enterprise 2008 Land reform in South Africa Getting back on track CDE Research No 16 DAFF 2010 Quarterly economic review of the agriculture sector Pretoria DAFF DAFF 2009 Annual report 20082009 Pretoria DAFF Department of Agriculture 2008 Strategic plan 2008 Pretoria Department of Agriculture DTI An introduction to the South African economy Available on httpwwwthedtigovzapublicationsagroprocessinghtm Eastern Cape Provincial Government Eastern Cape Provincial Growth and Development Strategy 2004 ndash 2014 Economic Commission for Africa 2009 Developing African agriculture through regional value chains Addis Ababa Economic Commission for Africa Economic Report Free State Province 2005 Provincial Growth and Development Strategy 2005 ndash 2014 GCIS 2010 SA Yearbook 200910rdquo Agriculture forestry and fisheries Pretoria GCIS Greenberg S 2010 Status report on land and agricultural policy in South Africa 2010 Institute for Poverty Land and Agrarian Studies School of Government University of the Western Cape Research report Ingelozi Management Solutions 2008 HIVAIDS in the South African agricultural sector Towards the development of a long term intervention Research report KwaZulu Natal Provincial Government 2006 KwaZulu Natal Provincial Growth and Development Strategy Limpopo Provincial Government Growth and Development Strategy 2004 ndash 2014 Mhone G (2000) Enclavity and Constrained Labour Absorbtive Capacity in Southern African Countries Geneva International Labour Office Moyo S The Agrarian question and the developmental state in South Africa In Edigheji O et al 2010 Constructing a democratic developmental state in South Africa HSRC PRESS
Agriculture Sector Analysis 47
AgriSETA
Agriculture Sector Analysis
National Treasury Republic of South Africa 2010 National Budget 2010 ndash National Budget Review 2010 Pretoria National Treasury Northern Cape Provincial Government Agriculture and agro‐processing sector strategy North West Provincial Government North West Provincial Growth and Development Strategy 2004 ndash 2014 Province of the Western Cape 2008 The Ikapa growth and development strategy White Paper SABCOHA SA Business Coalition on HIV and AIDS wwwsabcohaorg SACAU httpwwwsacauorghostingsacauSacauWebnsfHomehtmOpenForm South African Government 2010 20102011 ndash 20122013 Industrial Policy Action Plan Republic of South Africa Statistics South Africa 2005 Census of commercial agriculture 2002 Report No 110201 Pretoria Statistics South Africa Statistics South Africa 2009 Census of commercial agriculture 2007 Statistical release P1101 Pretoria Statistics South Africa Statistics South Africa 2010 General household survey 2009 Statistical release P0318 Pretoria Statistics South Africa Statistics South Africa 2010 Gross domestic product first quarter 2010 Statistical release P0441 Pretoria Statistics South Africa Statistics South Africa 2010 Quarterly labour force survey Quarter 1 2010 Statistical release P0211 Pretoria Statistics South Africa Vink N amp van Rooyen J 2009 The economic performance of agriculture in South Africa since 1994 The implications for food security Pretoria DBSA development planning division working paper series No 17 Webster E 2004 the Dual Economy from a book by Van Holdt K and Webster E Work restructuring and the Crisis of Social reproduction and 10 years of restructuring post apartheid workplaces University of Natal Press Workinfocom httpwwwworkinfocomfreesub_for_legresdatalraempassoc3htm Xingwana L 2008 Challenges and Opportunities for Land and Agrarian Reform towards 2025 Speech delivered at the Agri‐Consultation Protea Ranch Hotel Polokwane 30 July 2008
- Table of contents
- SECTION 1 THE AGRICULTURAL LANDSCAPE
- 11 Size and shape of the Agricultural sector
-
- Overview
- Distribution of agricultural production
- The structure of the agriculture sector in South Africa
- Categories of farming enterprises
- Employment trends
- Employment categories and remuneration
- Stakeholders in the Agricultural sector
-
- National government departments
- Sector representatives
-
- 12 Factors impacting development in the Agriculture sector
-
- Future sector economic growth and development
-
- South African sector growth plans (IPAP2)
- International Trade
- Global recession and rise in food prices
-
- Land reform
- Reliance on imports
- Water
- The labour market
- Consumer trends
- HIVAIDS
- Farm safety and security
- Broad-based Black Economic Empowerment
-
- Conclusions and scenarios
- SECTION 2 DEMAND FOR SKILLS
-
- AgriSETA registered employers and employee coverage
- Employee coverage in the AgriSETA
-
- 21 Skills demand
-
- The National Education and Training Strategy for Agriculture (AET Strategy)
- AGRISETA sector skills planning demand data (2008-2009)
- AgriSETA WSP analyses
-
- Skills demand in the commercial agricultural sector
-
- Skills demand forecasting by AgriSETA
- Research needs going forward
-
- SECTION 3 Skills Gaps and scarce skills
-
- Scarce skills at the DAFF
- Scarce skills in the commercial sector
- Supply of skills
-
- APPENDIX 1 Skills demand in the Department of Agriculture Forestry amp Fisheries (200809)
- Appendix 2 AgriSETA registered learnerships
-
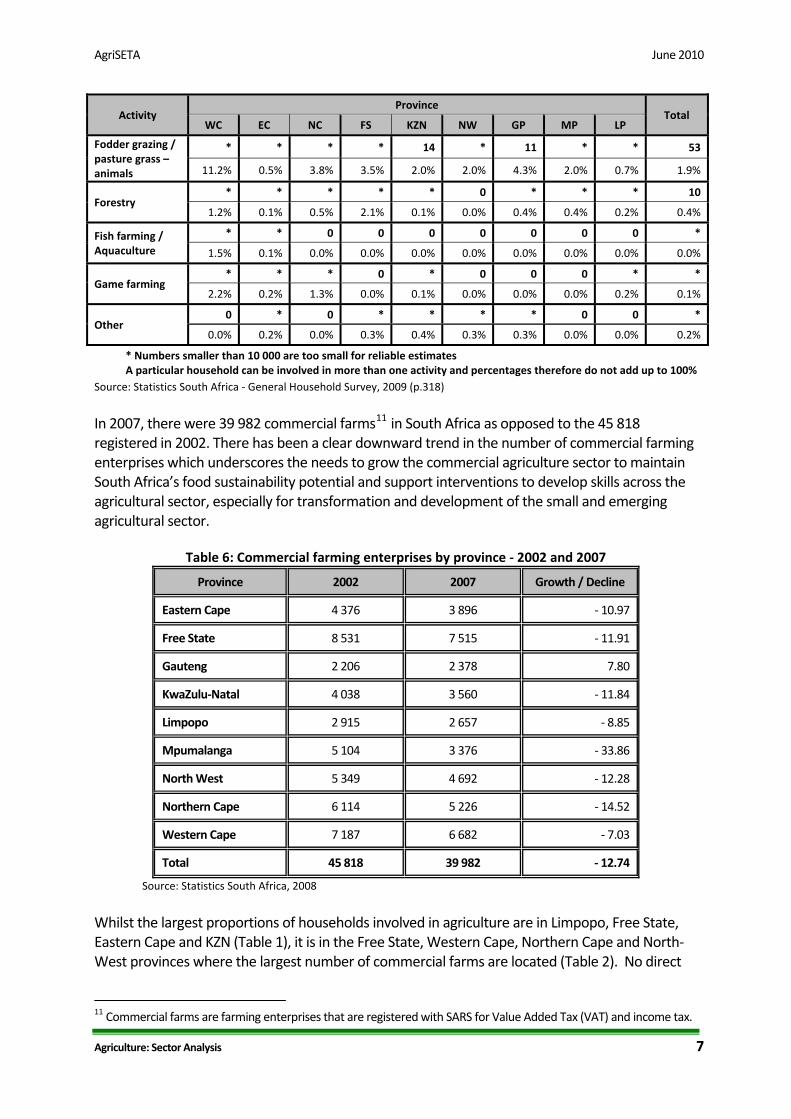
AgriSETA June 2010
Agriculture Sector Analysis 7
Activity Province
Total WC EC NC FS KZN NW GP MP LP
Fodder grazing pasture grass ndash animals
14 11 53
112 05 38 35 20 20 43 20 07 19
Forestry 0 10
12 01 05 21 01 00 04 04 02 04
Fish farming Aquaculture
0 0 0 0 0 0 0
15 01 00 00 00 00 00 00 00 00
Game farming 0 0 0 0
22 02 13 00 01 00 00 00 02 01
Other 0 0 0 0
00 02 00 03 04 03 03 00 00 02
Numbers smaller than 10 000 are too small for reliable estimates A particular household can be involved in more than one activity and percentages therefore do not add up to 100
Source Statistics South Africa ‐ General Household Survey 2009 (p318)
In 2007 there were 39 982 commercial farms11 in South Africa as opposed to the 45 818 registered in 2002 There has been a clear downward trend in the number of commercial farming enterprises which underscores the needs to grow the commercial agriculture sector to maintain South Africarsquos food sustainability potential and support interventions to develop skills across the agricultural sector especially for transformation and development of the small and emerging agricultural sector
Table 6 Commercial farming enterprises by province ‐ 2002 and 2007
Province 2002 2007 Growth Decline
Eastern Cape 4 376 3 896 ‐ 1097
Free State 8 531 7 515 ‐ 1191
Gauteng 2 206 2 378 780
KwaZulu‐Natal 4 038 3 560 ‐ 1184
Limpopo 2 915 2 657 ‐ 885
Mpumalanga 5 104 3 376 ‐ 3386
North West 5 349 4 692 ‐ 1228
Northern Cape 6 114 5 226 ‐ 1452
Western Cape 7 187 6 682 ‐ 703
Total 45 818 39 982 ‐ 1274
Source Statistics South Africa 2008
Whilst the largest proportions of households involved in agriculture are in Limpopo Free State Eastern Cape and KZN (Table 1) it is in the Free State Western Cape Northern Cape and North‐West provinces where the largest number of commercial farms are located (Table 2) No direct
11 Commercial farms are farming enterprises that are registered with SARS for Value Added Tax (VAT) and income tax
AgriSETA June 2010
relationship can thus be drawn between the numbers of households engaged in agriculture in a province and the numbers of commercial agricultural enterprises AgriSETA WSP data analysis reveals no direct relationship between the number of employers in a province and the number of formally employed persons
Categories of farming enterprises
ldquoDualismrdquo (Mhone 2000) is a useful way of describing the agricultural sector both in terms of understanding the economics of the sector and planning skills development interventions This term describes a formal sector that is well established and an informal or emergent sector with the two sectors reliant on each other and on interventions by the state for integration However these two broad categories have their limitations Within the commercial sector there are large established farming businesses and smaller ones that struggle to survive and within the less formal sector there are emergent farmers striving to achieve commercial success It is necessary therefore to understand the agricultural sector as comprising a number of different economic entities all operating within the same dualistic economic framework The following typology for the agricultural sector reflects the complexity of the agricultural sector
Table 7 Typology of the agricultural sector
Production Unit Turnover Ownership amp Management Number Binding constraint
Support required
Large commercial on private property
gtR2 million
Family owned but incorporated multiple farms Rent in land ndash professional management
plusmn5 400 Market size Equity capital
Export market access Financial market innovation
Medium commercial on private property
R300 000 to R2 million
Family owned could be incorporated Some renting in of land ndash family management
17000 Land capital management
Mortgage capital for land access Management training
Small commercial on private property
ltR300 000 Family owned generally part time Some lifestyle farming (game ranches weekend farms)
24 000 Management time
Commercial in communal areas
gtR300 000 Communal ownership Development projects Private ownership
‐ Capital management infrastructure
Grants for land access Property rights Comprehensive farmer support Credit Physical infrastructure
ldquoEmergingrdquo commercial in communal areas
ltR300 000
gt20 hectares Communal ownership Small farmers in development projects Private ownership
35 000
Land (property rights) Capital labour management Employment opportunities
Grants for land access Property rights Comprehensive farmer support Physical infrastructure Institutional infrastructure
Subsistence farmer in communal areas Allotments Market gardens
lt20 hectares Communal ownership Private ownership Little formal market participation
1256m Employment opportunities
Social welfare transfers
Source Vink and van Rooyen 2009
This confirms the dualism evident from Stats SA data It includes an estimate for emergent farms and provides insight into the different types of farming enterprises Being small and part time can mean subsistence farming but it can also mean running a game farm on a part‐time basis There is considerable scope for farming enterprise to move from being commercial to subsistence and vice versa There is some evidence that there is currently an increase in volatility with quite
Agriculture Sector Analysis 8
AgriSETA June 2010
significant changes occurring mainly due to the global economic down turn and the small margins that many agricultural enterprises operate within It is particularly important to have an understanding of the category of ldquoemergingrdquo farmers those who may be striving to move from subsistence farming to a more commercial model those who have benefited from land reform processes and want to establish an agricultural enterprise on the land that has been allocated to them those who have made use of BEE funding to acquire a stake in a farm and are trying to achieve profitability The emerging farmer sector is neither established commercial farming nor subsistence in nature and is the focus of many of the governmentrsquos efforts to achieve transformation within the sector as a whole
Employment trends
Employee numbers is a more important measure of ldquosizerdquo for the purpose of the SETA and skills planning even though turnover may be more important in terms of economic impact or contribution to GDP The cause of this discrepancy between turnover or GDP contribution on the one hand and formal employment numbers on the other is discussed extensively by Mhone (2000) and others such as Webster (2004) Labour absorption levels in an enclave (second) economy are not optimal One conclusion that can be drawn from this is that skills development will need to be linked to other changes within the sector if it is to contribute meaningfully to job creation Mechanisms need to be found that link growth to jobs and this is not strictly something that the SETA can address However it is important to link skills planning to other processes and opportunities for these will be examined as part of the environmental scan later in this section The past few years have seen huge depreciation in employment levels and a very high unemployment rate ndash currently estimated at 311 The agricultural sector has also witnessed a decline in sector employment largely linked to contraction of the sector The sector is characterised by the need for highly skilled and qualified farm managers and technical staff on the one hand and large numbers of unskilled and semi‐skilled workers on the other Many managers of emerging farms are mainly untrained and unqualified Agriculture relies more on semi skilled labour than other services as reflected in the table below The sector also relies on migrant casual and seasonal labour Table 8 Percentage unskilled to semi‐skilled labour by DTI industry (economic sector) classification
Sector 1995 2008 Growth decline in
skilled labour
Agriculture 990 941 49
Mining 920 879 45
Manufacturing 870 821 56
Utilities 800 688 140
Construction 900 883 19
Trade 840 842 ‐ 02
Transport and Communication 730 768 ‐ 52
Finance 620 595 40
Community and personal services 540 498 78
Total 782 738 56 Source National Treasury 2010
Agriculture Sector Analysis 9
AgriSETA June 2010
Agriculture Sector Analysis 10
Employment in the sector is based on those who work in administration in DAFF and those who work in production and processing at farms and in factories In March 2009 DAFF had 3 285 posts with 2 735 of these filled The table below shows the employment profile at DAFF by occupation race gender and disability as at 31 March 2009 The department employed 57 male employees and 43 female employees There were more African employees constituting 69 of the entire department workforce Very little progress has been made regarding the employment of people with disabilities who constitute only 04 of the workforce This is in line with other department across government where similarly little progress has been made
Table 9 Employee profile ‐ Department of Agriculture Forestry and Fisheries Occupational Category (SASCO)
African Coloured Indian White Totals
M F M F M F M F M F Total
Legislators senior officials managers
15 14 2 2 8 3 25 19 44 16
Professionals 239 241 11 12 4 14 70 64 324 331 655 240
Technicians associate prof
190 153 38 19 9 4 86 57 323 233 556 204
Clerks 93 204 22 42 0 7 13 171 128 424 552 30
Service and sales workers
38 19 4 2 1 17 1 60 22 82 30
Craft and related trades workers
42 3 13 58 0 58 21
Plant machine operators and assemblers
53 1 8 1 62 1 63 23
Elementary occupations
484 96 94 28 1 6 5 585 129 714 262
Totals 1 154 728 182 105 15 25 214 301 1 565 1 159 2 724
Percentage 424 267 67 39 06 09 79 110 575 425 100
People with disabilities
1 1 1 2 6 4 7 11 04
Race 1 882 287 40 515 Percentage 691 105 15 189 Source Dept of Agriculture Forestry and Fisheries (2010)
In respect of occupations and skills profiles the majority of the Departmentrsquos employees are Professionals and Technicians Associate Professionals (444) followed by people employed in elementary occupations (262) Employment across the agricultural sector is subject to growth and decline variations related to a wide range of conditions and circumstances ndash produce prices climate and environmental changes mechanisation technology and the like Since 2002 the trend has been downwards There are a number of reasons for this including mechanisation and casualisation of labour on larger farms the economic downturn impacting on some sub‐sectors and the global trade situation including changes in the foreign exchange rates and the failure of successive DOHA development talks to address inequalities in access to global agricultural markets12 12 The Doha Development Round is the trade‐negotiation of the World Trade Organization (WTO) Its objective is to lower trade barriers globally Talks have stalled over a divide on major issues such as agriculture industrial tariffs and non‐tariff barriers services and trade remedies The most significant differences are between developed nations led
AgriSETA June 2010
Agriculture Sector Analysis 11
It is anticipated that growth of the agricultural sector to meet local consumer demand government initiatives to expand agricultural niche export markets and the development of an aquaculture sub‐sector to counter depletion of natural resources is likely to lead to creation of employment in the sector
Table 10 Workforce changes in the Agricultural sector ‐ 2001 to 2010
Year Workers Year on year difference Variation 2001 969 0002002 1 153 000 + 184 000 1602003 808 000 ‐ 345 000 ‐ 4272004 828 000 + 20 000 242005 778 000 ‐ 50 000 ‐ 642006 886 000 + 108 000 1222007 703 000 ‐ 183 000 ‐ 2602008 764 000 + 61 000 802009 615 000 ‐ 149 000 ‐ 2422010 650 000 + 35 000 54
Quarter 1
Source Statistics South Africa Survey (pp 210‐211)
Employment categories and remuneration
It is difficult to get detailed and accurate yearly statistics on employment by type (full‐time casual and seasonal employees) or on remuneration in the agricultural sector The latest available statistics on commercial agriculture are found in the 2007 Stats SA Census of Commercial Agriculture The following tables reflect survey data on the number of permanent casual and seasonal agricultural sector employees by province as well as total remuneration per province
Table 11 Number of paid full‐time agricultural workers and total remuneration by province
Province 2002 2007 Growth Decline
Number Remuneration
R000s Number
Remuneration R000s
Number Remuneration
Eastern Cape 33 718 329 351 34 253 510 404 16 550Free State 57 607 580 888 53 944 737 796 ‐64 270Gauteng 20 815 344 629 22 979 534 083 104 550KwaZulu‐Natal 75 799 763 439 66 685 968 455 ‐120 269Limpopo 62 635 525 390 35 728 625 436 ‐430 190Mpumalanga 61 603 599 617 46 520 853 396 ‐245 423North West 39 914 409 526 53 741 574 596 346 403Northern Cape 31 077 320 598 26 871 339 948 ‐135 60Western Cape 98 207 1 378 816 90 943 2 029 275 ‐74 472Totals 481 375 5252251 431 664 7 173 389 ‐103 366
Source Statistics South Africa Report 120201 (p1101)
by EU USA and Japan and the major developing countries led and represented by India Brazil China and South Africa Considerable contestation exists over the maintenance of agricultural subsidies operating as trade barriers
AgriSETA June 2010
Agriculture Sector Analysis 12
Table 12 Number of paid casual amp seasonal agricultural workers amp total remuneration by province
Province 2002 2007 Variance
Number Remuneration
R000s Number
Remuneration R000s
Number Remuneration
Eastern Cape 30 936 59 680 30 565 106 497 ‐12 784Free State 57 871 69 595 45 150 98 996 ‐220 422Gauteng 8 722 20 975 11 957 93 461 371 3456KwaZulu‐Natal 37 602 103 946 34 383 154 286 ‐86 484Limpopo 38 614 107 223 31 833 124 159 ‐176 158Mpumalanga 46 480 86 242 32 826 176 363 ‐294 1045North West 46 078 62 653 32 008 75 250 ‐305 201Northern Cape 68 174 121 613 47 874 123 723 ‐298 17Western Cape 124 968 331 406 98 546 485 108 ‐211 464Totals 459 445 963 331 365 142 1 437 843 ‐205 493
Source Statistics South Africa Report 120201 (p1101)
The tables above reflect that the Western Cape was the biggest employer of labour on commercial farms in 2007 with a majority of the employees being casual and seasonal The Eastern Cape employed the least number of commercial farm employees The comparator figures for 2002 and 2007 would appear to show a continuous country wide reduction in employment both in permanent employees and casual and seasonal workers The exception is the North West that has experienced an increase in full time employees The current minimum wage for farm workers (February 2010) is R1 31669 per month13 Monthly salaries differ across sub‐sectors with highest paid workers in primary production in the fisheries and dairy sub‐sectors
Table 13 Approximate monthly wage rates in Agriculture for selected sub‐sectors
Subsector Primary Production ProcessingPack house
Meat R 2000
Dairy ‐ R 2650
Wines R 1100 R 1400
Flowers R 800 R 1200
Fisheries R 5000
(crewman)R 1892
Source DTI 201014
Vink amp van Rooyen (2009) indicate that before the introduction of minimum wage in 2003 the real cash remuneration for employees had been increasing However over time the unit cost of labour (the ratio of the total cost of labour to the total value of output) has been in decline including a steep drop during and after the introduction of minimum wages
13 Department of Labour 2010 14 Source DTI (Data sourced from SAMIC Dairy Industry JAG WOSA SAFEC SA Pelagic Fish Industry Association)
AgriSETA June 2010
Agriculture Sector Analysis 13
In 1970 for every R1 of output 16 cents was spent on labour By 1980 this has dropped to 13 cents for R1 of output By 1994 the figure had increased to 19 cents declining to 17 cents in 1998 and to 117 cents in 2001 By 2007 it had reduced to 108 cents Further research will be needed to establish the current situation but there is reason to believe that the decline has continued with wages being very low both in terms of unit costs and in relation to other groups of workers in the economy
Strictly speaking it is not the role of the SETA to engage in the complex regulatory framework for the agricultural labour market It is for the Department of Labour and NEDLAC with their employer and organised labour stakeholders to find ways of balancing the need for protection of vulnerable workers with the need to create a framework that encourages the creation of jobs and improved job security The reason that more research is needed in this area and in particular detailed discussions with industry and labour representatives is to establish
The extent to which skills development interventions can improve the prospects for job creation and improved job security and
The mechanisms that can be established to enable uninterrupted skills training in the context of casualisation and use of contract and seasonal labour
Stakeholders in the Agricultural sector
National government departments
There are a number of national government Departments and spheres involved in the challenges of the agricultural sector The following table sets out the broad contribution that each department is intended to make
Table 14 Government department roles in relation to Agriculture Department Role
Department of Agriculture Forestry and Fisheries Agricultural policy and support Department of Rural Development and Land Reform Land Reform and land claims settlements Department of Economic Development Economic planning National Treasury Macro economic policy Department of Trade and Industry Industrial strategy (IPAP 2) Department of Water Affairs The management of water supply Department of Labour Labour market policy Department of Higher Education and Training HRD and skills planning and SETAs In relation to public spending on agriculture the agricultural national budget constitutes about 05 of the national budget The figure below reflects trends in national budgeting for the agricultural sector between 19967 and 201112 Some analysts15 have argued that state expenditure on agriculture shows lack of prioritisation of the sector especially considering that the budget remains lower than it was in the late 1980s when it now caters for a greater number of farmers than it did during apartheid segregation
15 Greenberg 2010 p 2
AgriSETA June 2010
Figure 2 National budgets for Agriculture 1996‐2011 (adjusted for inflation)
Source Greenberg 2010
The Department of Agriculture Forestry and Fisheries (DAFF) is responsible for the agricultural sector The department works with various organisations to promote the interests of the sector
bull It registers all South African Pest Control Association (SAPCA) qualified inspectors bull It works with the Agricultural Research Council for research to optimise the control of
migratory pests bull The Directorate on Marketing works with the National Agricultural Marketing Council
(NAMC) on issues related to equitable access to markets including policy formulation issuing of permits and coordinating inter‐departmental relations to enhance marketing
bull Historically the Department has employed a large number of extension officers located in farming communities who have supported and advised farmers This service has been in decline in recent years but remains an important aspect of state support to the sector
The above roles will be subject to some review in the context of IPAP 2 and also the debates around the role of the state in the economy The issue is not only levels of spending but also clarifying the role of government in relation to the business of the sector
Sector representatives
There are three major umbrella organisations representing the interests of farmers AgriSA TLUSA and the National African Farmers Union of South Africa (NAFU) AgriSA and TLUSA represents both commercial farmers and cooperativesrsquo interests through its engagement at national and international level AgriSA is a member of the Southern African Confederation of Agricultural Unions (SACAU) a regional farmersrsquo union for farmers in Southern Africa AgriSA has structures in all the provinces except Limpopo
Agriculture Sector Analysis 14
AgriSETA June 2010
Agriculture Sector Analysis 15
NAFU is a union for predominantly previously historically disadvantaged smallholder farmers with a membership base including farmers agribusinesses farmersrsquo organisations corporations and individuals who support their goals NAFU is represented by different unions in all the provinces There are other employer organisations who are not affiliated to AgriSA and NAFU including
bull Agricultural Industrial and Medium Employers Organisation bull Agricultural Mining and Industrial Chemical Manufacturersrsquo Association bull Agrilabor Employersrsquo Organisation bull Algoa Meat Traders Association bull East Coast Poultry Producers Employersrsquo Association bull East London and District Meat Traders Association bull Fertiliser Industry Employersrsquo Organisation bull Landbou Werkgewersorganisasie (Workinfocom) bull Red Meat Producersrsquo Association
The Agricultural Research Council is an autonomous statutory body that provides research to DAFF and the provincial departments of agriculture Figures available for South Africarsquos investment in agriculture research and development show that South Africa was above international norms of investment in RampD which are 053 of agricultural GDP for developing countries and 236 for developed countries In South Africa in 2000 agricultural RampD investment in relation to agricultural GDP was 30416 There are six major sources of credit for farmers banks (50) agricultural cooperatives and agribusiness (12) the Land Bank (21) private creditors (8) other creditors and financial institutions (9) and government (1) (GCIS 2010)
12 Factors impacting development in the Agriculture sector Several international and local factors impact on the productivity of the agricultural sector and its growth Key amongst these are
Growth of the South African economy and rising consumer demand International trade and trade agreements The global recession and rise in food prices The land reform programme Reliance on imports Water availability Changing consumer patterns and demands (eg organic food stuffs) Technological changes and mechanisms Quality standards Farm safety and security Broad‐based black economic empowerment Legislation Skills demand and supply HIVAIDS
16 Vink amp van Rooyen 2009
AgriSETA June 2010
These key factors are clustered and discussed below
Future sector economic growth and development
South African sector growth plans (IPAP2)
The 20102011 ndash 20122013 Industrial Policy Action Plan (IPAP) identifies five structural challenges that existed in the South African economy before the global economic downturn and which have been exacerbated by the recent economic crisis These challenges were evident even during the time South Africa was experiencing relatively high growth rates between 2005 and 2007 and have continued during the recession These challenges are
1 Structural imbalances in the growth path including growth that is lagging behind other medium and low income countries
2 Uneven performance of the manufacturing sector with some divisions like the automotive sector experiencing exponential growth while other sectors have stagnated
3 Employment growth being sustained by credit extension and consumption rather than by productive sectors leading to a large current account deficit
4 Low profitability of manufacturing 5 Low savings and investment from financial sector growth Only 52 of private credit was
extended to fixed investment in 2008 Key sectors have been identified for IPAPrsquos focus including agro‐processing which has a diverse group of industries and sub‐sectors including food processing beverages aquaculture horticulture medicinal aromatic and flavourants Key action plans for the agro‐processing sector are identified in IPAP2 as
Development of a National Food Control Agency to consolidate the sector Development of aquaculture to supplement dwindling wild fish stocks Designating specific areas for utilisation of aquaculture Development of the organic food sector Development of the small milling industry Enhancing competitiveness in fruit and vegetable canning Improving beneficiation of Rooibos and Honeybush products (IPAP2 2010)
International Trade
South Africa is a major exporter of Agricultural produce In particular South African fruit and fruit‐derived products such as wine and fruit juice are competitive in the global market However in many sub‐sectors where export potential exists ndash grain and meat ndash serious problems face the industry A key challenge is the uneven playing field experienced by South African exporters Major global competitors include the United States and the countries of the European Union where government subsidies in various forms are in place No such subsidies are in place in South Africa making it difficult if not impossible for South African agricultural produces to enter developed country markets due to the prices that they have to ask for products I In addition the value of the Rand has fluctuated from levels of around R10 to the US dollar to as little as R7 to the dollar When the Rand is strong export becomes difficult because it costs more in the case of the move from R10 to R7 a 30 cost increase for the importer It is impossible to
Agriculture Sector Analysis 16
AgriSETA June 2010
Agriculture Sector Analysis 17
predict whether the World Trade Organisation negotiations known as the DOHA Round will achieve progress in the coming years Historical evidence is that during periods of global recession developed economies become more protective not less and so the current outlook is not good Nor is it possible to predict the value of the Rand though current thinking in government is to move toward a weaker Rand to encourage exports These are two key variables that will need to be factored into the different sector growth scenarios for the future
Global recession and rise in food prices
Economic growth slowed down significantly in sub Saharan Africa and in South Africa in 2009 but there appear to be signs of recovery GDP growth in the region declined from about 6 in 2004 ndash 2008 to about 18 in 200910 GDP growth in South Africa was 16 in 2009 17and rose to 46 in the first quarter of 201018 though much of this is related to the income derived from the 2010 FIFA World Cup and may not be sustained Projections are generally for a slow revival with a set back after the slight rise resulting from the World Cup A return to the 6 levels of the 20078 could take some years The global recession reduced the demand for African exports and reduced capital flows to the region but it is anticipated that the demand for mineral resources by Asian and Western powers will result in both the expansion of exports and expanded foreign direct investment The competition between India and China for African markets is also expected to boost trade to the benefit of African suppliers South Africa is expected to particularly benefit from direct foreign investment from China and India China has already become South Africarsquos largest market for exports and supplier of imports19 Rising food prices have forced governments around the world to control prices of maize bread rice and dairy products In South Africa ldquofood price inflation between December 2005 and December 2006 averaged 788 rdquo20 Although efforts are being made to reduce barriers to poorer families in relation to basic food there has been no move to subsidise food generally This may change though the space for significant levels of support is restricted because of reduced revenue from income taxes resulting from the recession The global credit crunch and recession have meant a reduction in public expenditure and funding which has affected the agricultural sector21
Land reform
In South Africa specifically land reform has a significant bearing on food security and agriculturersquos contribution to GDP The objective of the land reform programme is to transfer 30 of agricultural land to black ownership by 2014 (deferred to 2025) to ensure more equitable access to land by historically disadvantaged people and to increase their participation in agricultural activities22 Land reform has been informed by four processes23
17 Department of Agriculture Forestry and Fisheries 2010 18 Stats SA 2010 19 Department of Agriculture Forestry and Fisheries 2010 20 Department of Agriculture Forestry and Fisheries 2010 ‐2011 Strategic Plan 21 Economic Commission for Africa 2009 22 Xingwana 2008 23 CDE 2008
AgriSETA June 2010
Agriculture Sector Analysis 18
Land restitution involving returning land or providing financial compensation to those whose land was dispossessed during apartheid
Land redistribution transferring more land to the historically disadvantaged Tenure reform modernising land tenure rules and access to land ownership and Providing financial support for the development of emerging farmers
In relation to progress with land reform by September 2009 only 69 of agricultural land (about 567 million hectares) had been transferred and a majority of the beneficiaries have not yet occupied the land due to lack of infrastructure input or technical support The following table gives an indication of the progress of land reform since the inception of the first democratic government
Table 14 Land transfers and beneficiaries ‐ 1994 to 2009
Province Redistribution and tenure Restitution Total Hectares Beneficiaries Claims Hectares Beneficiaries Hectares Beneficiaries
Eastern Cape 675 353 357 25 633 16 201 94 834 215 201 448 191 240 834
Free State 799 350 291 7 721 2 662 47 615 40 893 397 906 48 614
Gauteng 286 34 513 7 328 13 159 9 476 70 179 43 989 77 507
KwaZulu Natal 690 547 414 67 761 14 752 642 447 433 168 1 189 861 500 929
Limpopo 291 91 235 7 403 3 382 513 024 220 227 604 259 227 630
Mpumalanga 444 322 839 13 950 2 694 399 876 225 877 722 715 239 827
Northern Cape 271 952 744 2 773 3 682 539 620 100 554 1 492 364 103 327
North West 300 268 566 40 539 3 709 373 642 172 963 642 208 213 502
Western Cape 223 122 304 12 750 15 546 3 769 118 165 126 073 130 915
Total 3 979 3 043 264 185 858 75 787 2 624 303 1 597 227 5 667 567 1 783 085
Source Greenberg 2010
Achievement of the 30 land reform target is being made difficult by land prices Under the willing buyer willing seller scheme the government will need R74 billion to be able to purchase enough land While resources may be available there are suggestions of lack of capacity The Department of Rural Development and Land Reform (DRDLR) was able to spend only 31 of its land reform 200910 budget in the first six months of the financial year Going forward this Department needs to identify what the real challenges are with the pace of land reform delivery so that they can be mitigated to meet the 2025 target A priority is the retention of skills skills transfer and skills development during the transfer of land as well as retention of national food production to avoid loss of production Support for new beneficiaries of land to ensure sustained productivity is derived from two main sources of funding ndash the Broadening Access to Agriculture Thrust (BADAT) and the Comprehensive Agricultural Support Programme (CASP) CASP is a conditional grant from the Department of Agriculture Forestry and Fisheries to provincial departments to support emerging farmer development Provincial farming budgets dedicated for farmer support in Mpumalanga the Free State Northern Cape and the Western Cape have risen significantly and those in KwaZulu Natal and Gauteng have witnessed a slight increase Eastern Cape and Limpopo agricultural budgets have been steady The North West is the only province where there has been a sharp decline in the share of the budget dedicated to farmer support24
24 Greenberg 2010
AgriSETA June 2010
Agriculture Sector Analysis 19
Reliance on imports
Overall the Agriculture sector contributes positively to the balance of payments ldquoSouth Africa remains food secure The value of our exports increased by 464 from R33 656 million in 200708 to R49 278 million in 200809 During the same period the estimated value of imports rose by 12 from R34 009 million to R38 401 million resulting in a positive trade balancerdquo25
South Africa depends largely on world markets for seed production and agrochemicals Regarding seed production there are only three community seed production schemes in Limpopo and Mpumalanga being piloted with state funding Ten top large companies including two South African companies and multinationals have rights to over two thirds of registered seed varieties in South Africa Despite the dominance of genetically modified and hybrid seed in some sub‐sectors like maize sunflower and sorghum open‐pollinated varieties have been resilient in South Africa enabling the possibility of alternative seed sources not dependent on technological processes26 In relation to agrochemicals deregulation and liberalisation in the fertiliser sector led to the shutdown of local production capacity and South Africa became an importer of fertiliser for the first time in 2000 There are three large players in the fertiliser sector Sasol Nitro Yara and Omnia South Africa imports an estimated 70 of fertilisers and pesticides Fertiliser prices rose by over 200 between 2006 and 2008 but dropped somewhat after that However this hike signified the volatility of the agrochemicals industry and South Africarsquos dependency on imports and the potential risk for emerging farmers and food production of this dependence on imports as the country cannot control the prices making inputs both difficult to budget for and in many cases unaffordable The price of agrochemicals is also particularly influenced by the prices of oil and the exchange rate The general understanding in relation to job creation is that a weaker Rand will improve exports and therefore enable job creation Of course the down side of this strategy is that imports become more expensive So what may be an advantage for those sub‐sectors who are expanding their export volumes those relying on imported agro chemicals will be under increased pressure
Water
Water is both an essential and scarce resource for the agriculture sector and is being threatened by climate changes Crop production relies heavily on water and yet access to water is not being addressed in a systematic way in the land reform processes Greenberg suggests that the relationship between land reform agricultural support and water resource provision is inadequate and a way to address this could be established by linking water provision to land transfer or investing in irrigation for both commercial and resource‐poor farmers However investing in irrigation in the context of water scarcity and climate change may not be the best option What could be needed is finding ways to maximise efficiency of the 60 of South African
25 Department of Agriculture Forestry and Fisheries Strategic Plan 201011 26 Greenberg 2010
AgriSETA June 2010
Agriculture Sector Analysis 20
water used for irrigation by for example using methods such as drip or micro‐irrigation which are expensive to set up but which reduce water wastage by 5‐1027 The Department of Water Affairs is responsible for managing water supply and has to give authorisation for agricultural projects and other developments The department needs to be seen as an important stakeholder in the agricultural sector
The labour market
South Africa recorded an unemployment rate of 243 in 2009 (narrow definition) If people who are no longer actively seeking work are considered the broad unemployment rate rose from 267 to 313 illustrated in the figure below As a direct consequence of the global economic downturn in 2008 870 000 formal jobs were lost in 200928 Others have quoted a figure of over 1 million
Figure 3 Official unemployment in South Africa 2003 ‐2009
Source National Treasury 2010
Annual employment loss followed sector growth patterns with agriculture mining manufacturing and trade facing the highest job losses as their sector growth contracted Unemployment is especially a major problem among lower skilled workers and younger people Youth employment in the 15 ‐24 year age group has fallen by 219 000 (136) and 483 of people in this age group are unemployed Employment of semi‐skilled and unskilled workers has contracted by 527 000 and male employment has gone down by 550 000 (71) while that of women has decreased by 320 000 (52) The number of discouraged workers ie those no longer actively seeking work has increased from 518 000 to 17 million29 Clearly the existence of a very large pool of largely unskilled unemployed workers has an impact on the farming sector It drives wages down and creates opportunities for casualisation and the expansion of labour contract agencies and brokers In addition there are significant numbers of foreign nationals mainly from Zimbabwe and Mozambique who are seeking work and often finding it on farms and in primary processing and packaging plants There are benefits to the
27 Greenberg 2010 28 National Treasury 2010 29 National Treasury 2010
AgriSETA June 2010
Agriculture Sector Analysis 21
sector with skilled and semi‐skilled workers coming into the labour market and being absorbed into the workforce and helping raise productivity levels However at the lower skilled end of the market the existence of this pool brings further casualisation and downward pressure on wages Tensions are likely to increase and further protests either in the form of xenophobic outbreaks or actions against farmers may well increase A view often expressed by farm employers is that current labour legislation makes dismissing workers difficult and so the availability of labour without entering into contracts of employment is an attractive way of avoiding the legislation and its obligations Organised Labour is seeking to restrict these opportunities through either regulating or eliminating labour brokers and efforts are being made to regulate the use of foreign labour However for the foreseeable future the trend is for formally employed people to be reduced in number In relation to the emergent sector there will also be a reluctance to enter employment contracts with workers The fact that many households are engaged in some form of largely unpaid agricultural work means that there is significant casual work dating back many years Helping change this situation into one where casual or unpaid jobs are transformed into formal jobs with regular wages will take time It is also likely that as some emergent farms become established they will act similarly to established farms and institute a form of casual labour rather than expanding a workforce for which they would have to take a level of responsibility From an AgriSETA perspective these labour market trends mean that whilst levy income can be directed at a relatively small labour pool one that is manageable in terms of planning and implementation the size of the informal casual and unemployed labour force in the sector ‐ for whom no levy is paid and who have no employer to plan for their skills needs ndash is very large and its needs almost unlimited Clearly the relationship with the National Skills Fund (NSF) becomes critical in respect of the entire non‐levy income sector Again the level of support available from non‐levy income sources will be an important variable in looking at future sector skills development scenarios
Consumer trends
South Africa currently produces enough food to meet the needs of its population However consumption of three main staples maize wheat and vegetables has been volatile since 1985 and remains below 1990 levels Consumption of maize and vegetables by South Africans is 17 and 32 less respectively than in 198530 The main reasons for this lie in the growing levels of poverty and the difficulties that families have in purchasing nutritious food Whilst government has increased the levels of social grants and increased the number of people receiving grants to around 13 million the incomes of poor families have been badly hit by a range of factors including job losses and rises in food prices The approximately 1 million people who lost their jobs in 20089 meant a loss of income for many millions of dependents Rises in food prices have also had a disproportionate impact on the poor Whilst food is available it is often not accessible to families on the income levels that they have to manage within The result is that less and less nutritious food is purchased which in turn impacts on the ability of farmers to sell their products locally 30 Greenberg 2010
AgriSETA June 2010
Agriculture Sector Analysis 22
Whilst there is no evidence that government will reduce its efforts in relation to poverty relief and social benefits including such programmes as school feeding schemes and food parcels during periods of drought the state of public finances may not enable to support the poverty that grips many rural areas If real income levels for the poor were to rise it could have a significant impact on the economy of the agricultural sector Equally an improvement in the rural economy with increased agricultural production and jobs would dramatically impact on the capacity of people to buy nutritious food Achieving a positive growth path in rural areas is a huge challenge for government and one that is key to governmentrsquos Medium Term Strategic Framework and Industrial Policy Action Plans
HIVAIDS
South Africa has a high prevalence of HIV and AIDS The HIV prevalence among people aged two and above was estimated at 109 in 2008
Table 15 Estimated HIV percentage prevalence by age group (2002 ndash 2008)
Age 2002 2005 2008 Change
Children (2‐14 years) 56 33 25 ‐31
Youth (15‐24 years) 93 103 87 ‐06
Adults (25 and older) 155 156 168 13
15‐49 year olds 156 1692 169 13
Total (ages 2 to 49) 114 108 109 ‐05 Source Avert 2009
The table above shows that HIV prevalence is highest amongst those aged 25 years and older Given youth labour market analyses which point to people from previously disadvantaged backgrounds mainly African males accessing formal employment for the first time at age 25 ‐27 this population can be held to represent people in employment Research31 has estimated that by 2020 the pandemic will have claimed at least 20 of employees in the agricultural sector Southern Africa
in
HIV and AIDS have significant ramifications in the agricultural sector for both commercial farming and subsistence farming The implications include
bull Decrease in cultivated land bull Focus on less labour intensive crop and animal production bull Decrease in womenrsquos agricultural productivity as they take on a more care giving role bull Loss of skills bull Increase in absenteeism from work bull Decrease in daily work outputproductivity because workers are weaker from infections
There are suggestions that the impact of the pandemic in South Africa demands sectoral intervention although this may be difficult in the agricultural commercial sector as
bull Seasonal workers who seem to be more vulnerable to infection because of their low socio‐economic status are not in one place long enough for care programs Further
31 Ingelozi Management Solutions 2008
AgriSETA June 2010
Agriculture Sector Analysis 23
farmers and employers may not feel responsible for seasonal workers in the same way they would invest in their permanent employees
bull There may be uncertainty around land reform which may put HIV intervention on farms on the back burner
bull There are no policies that enforce HIV education and care on farms in the same way that legislation like BEE does for ownership As a result HIV intervention may be left to goodwill and employers may feel it is more important to comply with issues that are monitored
Farm safety and security
South Africa has been plagued by unacceptably high levels of violent crime and murder for many years now Farms have experienced this and those living on farms feel and are extremely vulnerable The South African Chamber of Commerce and Industry (SACCI) has argued that
Using the nominal GDP figure for 2009 of R24 trillion a 322 percent contribution of agriculture to GDP and an estimate of 39982 farms (as at 2007) in South Africa the cost of a murderattack on a farm to the economy was R1932869 per annum
SACCI acknowledges that this estimate is flawed as it does not take into consideration the fact that farming units contribute differently to GDP and that not every attack or murder contributes to farm shut down or loss of productivity However if not addressed these attacks could lead to loss of farming sectors as farmers migrate to lsquosaferrsquo regions This will affect employment and GDP contribution of the sector The need for safety and security on farms may also shift farmersrsquo focus in skills development to include personnel who have skills in safety and security
Broad‐based Black Economic Empowerment
The aim of the AgriBEE Charter (gazetted in 2008) is to increase the involvement of black business in agriculture through ownership and control as executives and senior managers of new and existing agricultural businesses The extent to which AgriBEE is transforming the sector is not known as it is too early to tell but a recent survey conducted by ABC and the IDC showed that among the ABC respondents in 2007 46 of enterprises were busy constructing a BEE strategy and 46 claimed to be implementing a BEE strategy A survey of the dairy industry in the Western and Eastern Cape in 2008 showed that only 6 of firms had a BEE strategy in place It also seems from survey data that companies are focusing on the skills development and socio‐economic aspects of BEE rather than on ownership32 It would appear that although there have been some significant BEE purchases of viable farms and some employee empowerment projects including some quite high profile ones in the Cape Winelands the extent of ownership change had been limited One of the factors is the very high level of single person or family ownership in the agricultural sector BEE is more straight forward in the corporate world where shares can be exchanged For a family business it is a matter of selling off part or all of the land and the tendency is to sell off those areas of the farm that are expendable from a business sustainability perspective
32 Greenberg 2010
AgriSETA June 2010
Whilst there is discussion in government about the ending of the ldquowilling buyer willing sellerrdquo concept the Constitution itself provides for property rights and so although some pressure may be exerted through legislation and regulation the extent and speed of change may not be fast The mechanisms for encouraging the transfer of significant levels of ownership have not yet been created The focus of the SETA is therefore likely to be more the beneficiaries of land reform and emergent farmers though projects of a BEE nature can be targeted as they arise
Conclusions and scenarios It is useful when looking at possible scenarios to examine the key variables or uncertainties and to project how variations one way or the other will have an impact on the development and growth of the sector From the sector analysis and factors that are contributing to change in the sector there are some key factors that seem to emerge First appears to be the economy and related issues of the labour market and the challenges of labour absorption in an enclave economy These factors determine on the one hand whether there will be growth and development and on the other whether such improvements will result in improved employment opportunities and the creation of a virtuous cycle of development Second is the role of the state and the various government departments whose plans and work impact on the agricultural sector Related to this is land reform that is inevitably driven by the state and not the owners of land or the landless The view expressed by many engaged in agrarian reform is that the state must play a significant role It becomes clear that a successful agricultural enterprise requires a number of factors to be in place to be successful These include access to land (Department of Rural Development and Land Reform) agricultural support within a supportive agricultural framework (Department of Agriculture Forestry and Fisheries) access to consistent water supply (Department of Water Affairs) access to finance (Department of Trade and Industry various state agencies) conducive labour market regulation (Department of Labour) sound industrial policy (Department of Trade and Industry) economic planning and macro policy (Department of Economic Development National Treasury) and appropriate education training and skills development (Department of Higher Education and Training the Human Resources Development Council NSA and the SETA) There are other government departments as well as provincial and municipal structures that also play a role The following analyses show how the four variables
economic growth and development role of the government labour market changes and land reform)
impact positively or negatively on the growth of the sector and the demand for skills
Agriculture Sector Analysis 24
AgriSETA June 2010
Agriculture Sector Analysis 25
HHIIGGHH GGRROOWWTTHH SSCCEENNAARRIIOO
The economics of the sector Role of government
The economy in SA and globally continues to revive albeit slowly for the next few years
Roles and integration of national government departments are clarified Specific functions are agreed processes put in place and personnel appointed with the required skills
International trade agreements are still weighted infavour of US and EU but progress is being made and specific blockages are addressed in bilateral talks
The roles of Departments (DWA DAFF DRDLR DoL DTI DED DHET) are clarified with appropriate joint plans and coordinating structures
The rural economy gradually improves with the buying power of the poor increasing and more stable markets created for local produce
For each of the functions agreed in each of the related departments appropriate structures and systems are put in place and staff trained
Exports increase in key areas identified in IPAP 2 and the Rand exchange rate stabilises at a level not too much different than it is today
Specific capacity is put in place at local level to support implementation of land reform and rural development
There is a growing understanding of the concept of dualism and the need to intervene with labour absorption and development mechanisms
Land claims are all finally settled and ownership and tenure is resolved There is a serious drive to establish effective agricultural enterprises
An understanding is reached on the role of agencies and labour brokers and abuse is curbed
The willing buyer willing seller approach is resolved and enables viable land to become black owned
Some relaxation of labour market regulations are agreed that maintain some minimum standard of employment but assist absorption
Land transfer to black and emergent farmers is done in a manner that integrates then into the supply chains of the sector
Mechanisms are found to address skills needs in the context of casual and seasonal work patterns
Financing of land reform and transfer is done on the basis of agreed development plans including skills
Labour market reform Trajectory of land reform LLOOWW GGRROOWWTTHH SSCCEENNAARRIIOO
The economics of the sector Role of government departments The economy in SA and globally stagnates at current levels and the economy struggles to pick up after the temporary 2010 World Cup boost
A lack of purpose at government level means limited progress for another five years Land reform remains a commitment without a plan
International trade agreements are still weighted infavour of US and EU and protectionism increases as a result of the global recession
The roles of Departments (DWA DAFF DRDLR DoL DTI DED DHET) are unclear and there is no proper co‐ordination
SArsquos Gini coefficient continues to worsen with rural poverty increasing and local economies declining
There is a lack of effective structures systems and processes to implement policy across departments
Rand volatility causes problems for importers and exporters Well established markets are maintained but exports decrease
At local level the decline in the agricultural extension officer functions continues and limited practical support is available
Understanding of the rural economy is so diverse that stakeholders cannot agree the problem let alone the solution to low absorption levels
Land claims take too long and land reform processes leave potentially productive land poorly developed and managed
Casual labour and labour brokers remains an issue of dispute Confrontation results in bitterness and resentment
The impasse caused by a rigid interpretations of property clauses in the Constitution continues to stall achievement of the 30 black ownership target
Labour market regulation continues to be a contributing factor to reducing levels of employment
Black owned farms find it difficult to become part of supply chains and are unable to perform adequately
Unstable employment patterns in the sector make skills interventions difficult to manage and largely ineffective
Financing of land reform and land transfer continues to be wasted as it is not tied to the building of appropriate capacity
Labour market reform Trajectory of land reform
AgriSETA June 2010
These analyses can be translated into four potential growth and development scenarios for the agricultural sector which are based on the requirements for a strong development state Scenario 3 Weak government support
and sound economy
Econ
omic fa
ctors glob
ally n
ationa
lly and
locally
Scenario 1 Integrated government support and sound economy
The economic upturn triggered by the World Cup continues and globally things improve enabling an expansion of exports The government because of a lack of integrated policy planning and implementation provides limited support for sector development The gains go to the well established enterprise owners with few gains for emerging farmers and local communities
Government departments coordinate their efforts to achieve maximum impact There are favourable economic conditions that create opportunities for advance Within this positive environment the role of the AgriSETA becomes a central component of a comprehensive strategy for growth and skills interventions are targeted to achieve maximum effect Results in growth in sustainable enterprises and expanded employment opportunities
Government policy and support Government policy and support
Combination of disjointed government policy planning and a weak and increasingly marginalised rural economy Economic conditions result in unsustainable farming conditions and employment declines along with productivity Food shortages and the lack of development in rural areas leading to increasing social tensions A vicious cycle develops with the sector going into long term decline
Government departments coordinate their efforts to achieve maximum impact However economic conditions hamper progress Efforts by the AgriSETA are undermined by poor labour absorption and job insecurity Some significant successes are recorded including some NSF funded projects that result in sustainable enterprises A platform is laid for future improvements when the economic conditions improve
Scenario 4 Weak state and economy Scenario 2 Strong state but weak
economy
Agriculture Sector Analysis 26
AgriSETA June 2010
Agriculture Sector Analysis 27
SECTION 2 DEMAND FOR SKILLS
AgriSETA registered employers and employee coverage
In 2009 17 234 employers were registered with the AgriSETA comprising 15 394 small employers (less than 50 employees) 1 202 medium sized employers (50 ‐ 149 employees) and 638 large employers (more than 150 employees)
Considering that there are around 40000 commercial farms33 the 17 234 employers represent around 43 of commercial farms Notwithstanding changes in the sector as a result of land reform and sector shrinkage this is a sizable proportion and is held to be sufficiently representative for the purpose of skills development planning However this paints an incomplete picture It understates the representative nature of large enterprise registered with the SETA and overstates the representative nature of small registered enterprises 4 175 (242) of the enterprises are levy paying members Further only 1 673 (11) workplace skills plans (WSPs) were submitted
Table 16 Registered employers by size and sub‐sector Sub‐sector Description
Employers Small Medium Large
CoffeeTea Processing and marketing of coffee and tea including coconuts cocoa nuts olives dates etc
33 4 3
Fibre Grading ginning packing of wool and cotton raw material 1 676 16 18
Fruit Fruit packed in cartons fruit juice concentrate drummed and fruit juice in container ready for consumption
271 36 57
Fruit exporters and importers 6 0 1
Grain
Manufacture of grain mill products and starches 119 5 7Handling and storage of grain 67 7 23Wholesale amp retail trade in Agricultural machinery 213 9 4Sale and distribution of Agricultural raw materials and other farming inputs
182 9 3
Milling
Manufacture of flour and grain mill products including rice and vegetable milling grain mill residues
120 15 11
Manufacture of prepared animal feeds 110 19 0Manufacture of pet foods 42 9 0Manufacture of starches and starch products 7 1 1
Pest control
Pest Control 209 4 0
Poultry Poultry and egg production including the slaughtering dressing and packing of poultry
305 49 37
Primary
Growing of Cereals and other crops (not elsewhere classified) 902 160 34Growing of Vegetables Horticultural specialties nursery products
943 120 72
Growing of Vegetables Horticultural specialties (Including Ornamental Horticulture) and nursery products
11 5 0
Sugar plantation including sugar cane and sugar beet etc 9 4 2
33 SARS statistics 2007
AgriSETA June 2010
Agriculture Sector Analysis 28
Sub‐ Description Employers Growing of fruit nuts beverage and spice crops 1795 255 143Farming of cattle sheep goats horses asses mules and hinnies Dairy farming
2 252 59 18
Other animal farming production of animal products (NEC) 433 25 12Ostrich farming 5 0 0Game farming 16 0 0Growing of crops combined with farming of animals (Mixed farming)
2 920 256 109
Growing of coffee and tea including coconuts cocoa nuts olives dates etc
2 0 0
Agricultural and animal husbandry services except veterinary activities
438 22 9
Other animal farming (not elsewhere classified) 11 1 1Growing of trees as second crop by farmers 126 18 4Fishing operation of fish hatcheries and fish farm 913 10 6
Red meat
Production and animal products (not elsewhere classified) 6 0 0Slaughtering dressing and packing of livestock including poultry and small game for meat
317 40 17
Production sale amp marketing of Agricultural by products (eg bones hides)
61 2 0
Slaughtering dressing and packing of livestock including small game for meat and processing of ostrich products
2 1 0
Wholesale trade in Agricultural raw materials and livestock 193 7 10Transport of livestock as supporting activity 224 0 0Agricultural and livestock research 215 9 3
Seed Seed production and marketing 149 12 6
Sugar Manufacture of sugar including golden syrup and castor sugar
45 5 21
Tobacco Processing and dispatching of tobacco 46 8 6 TOTALS 15 394 1 202 638Source AgriSETA WSP data
The largest number of registered small and medium enterprises are found in the mixed farming sub‐sector while most large enterprises are in the growing of fruit nuts beverage and spice crops sub‐sector
Employee coverage in the AgriSETA
Collectively the 17 234 employers registered with AgriSETA employed a total of 239 076 employees This represents 39 of the agricultural labour force in 2009 The 1 673 employers who submitted WSPs in 2009 employed 97 898 employees representing 41 of the total number of people employed by registered employers While the number of registered employers submitting WSPs is small (11) they employ a sizeable number of employees and the percentage of employees provides a statistically significant sample The data for larger enterprises is statistically much more representative than that for small enterprises
AgriSETA June 2010
Table 17 Number of employees of registered employers by sub‐sector
Sub‐sector
Sub‐sector description Employees
CoffeeTea Processing and marketing of coffee and tea including coconuts cocoa nuts olives dates etc
483
Fibre Grading ginning and packing of wool and cotton raw material 6 539
Fruit Fruit packed in cartons fruit juice concentrate drummed and fruit juice in container ready for consumption
27 661
Fruit exporters and importers 212
Grain
Manufacture of grain mill products and starches 133Handling and storage of grain 18 303Wholesale amp retail trade in Agricultural machinery 795Sale and distribution of Agricultural raw materials and other farming inputs 2 898
Milling
Manufacture of flour and grain mill products including rice and vegetable milling grain mill residues
3 634
Manufacture of prepared animal feeds 731Manufacture of pet foods 160Manufacture of starches and starch products 105
Pest control
Pest Control 119
Poultry Poultry and egg production including the slaughtering dressing and packing of poultry
19 187
Primary
Growing of Cereals and other crops (not elsewhere classified) 10 104Growing of Vegetables Horticultural specialties and nursery products 37 799Growing of Vegetables Horticultural specialties (Including Ornamental Horticulture) and nursery products
195
Sugar plantation including sugar cane and sugar beet etc 220Growing of fruit nuts beverage and spice crops 47 043Farming of cattle sheep goats horses asses mules hinnies Dairy farming
3 382
Other animal farming production of animal products (NEC) 4 203Ostrich farming 0Game farming 0Growing of crops combined with farming of animals (Mixed farming) 28 722Growing of coffee amp tea including coconuts cocoa nuts olives dates etc 0Agricultural and animal husbandry services except veterinary activities 970Other animal farming (not elsewhere classified) 513Growing of trees as second crop by farmers 1 294Fishing operation of fish hatcheries and fish farm 1 589
Red meat
Production and animal products (not elsewhere classified) 0Slaughtering dressing and packing of livestock including poultry and small game for meat
5 128
Production sale amp marketing of Agricultural by products (eg bones hides) 116Slaughtering dressing and packing of livestock including small game for meat and processing of ostrich products
0
Wholesale trade in Agricultural raw materials and livestock 1 697Transport of livestock as supporting activity 0Agricultural and livestock research 534
Seed Seed production and marketing 2 127Sugar Manufacture of sugar including golden syrup and castor sugar 10 478Tobacco Processing and dispatching of tobacco 2 002 Total 239 076
Agriculture Sector Analysis 29
AgriSETA June 2010
Agriculture Sector Analysis 30
Source AgriSETA WSP data
According to the WSP analysis the sub‐sector for the growing of fruit nuts beverage and spice crops employed the largest number of people In six sub‐sectors there are employers who do not employ workers These are probably family based organisations where family members help in the business without drawing a salary These are in transport and livestock research slaughtering dressing and packing of livestock including poultry and small game for meat growing of coffee and tea including coconuts cocoa nuts olives dates etc ostrich farming and game farming
Table 18 Employee distribution by province Province Employees Percentage
Eastern Cape 18 844 192 Free State 1 946 20 Gauteng 2 788 28 KwaZulu‐Natal 5 416 55 Mpumalanga 8 062 82 North West 3 290 34 Northern Cape 5 436 56 Limpopo 1 730 18 Western Cape 50 386 515 Grand Total 97 898
Source AgriSETA WSP data
Of those submitting WSPs registered employers in the Western Cape employed the largest number of people while employers in Limpopo employed the least number of employees Free State has a small number of employees covered by WSPs submitted to the SETA whereas Eastern Cape with a relatively small number of registered farms has a very large number of employees on farms submitting WSPs Given this variance between provinces the use of WSP data for extrapolation purposes must be viewed cautiously
2009 WSP equity information was only provided for about a quarter of employees (25 637 or26)34 No information was available from the WSPs on non‐South Africans working on commercial farms
Table 19 Equity profile from 2009 WSP data African Coloured Indian White
Totals M F D M F D M F D M F D
8 040 5 785 38 5 097 5 228 24 22 25 0 811 556 11
580 417 03 493 505 02 468 532 00 589 403 08 13 863 10 349 47 1 378 25 637541 404 02 54 100
Total EquityTotal Male Total Female Total Disability
13 970 11 594 73 545 452 03
Source AgriSETA WSP data
Using currently available data it is not possible to provide disaggregated employment data by sub‐sector This will require a small change in the way that gender race and disability data is
34 Some employers did not complete race and gender information when giving their employment profiles
AgriSETA June 2010
codified during WSP data‐capturing including allocation by sub‐sector What can be stated is that employment of males is more dominant than that of women and more Africans are employed in the sector than other groups Employment of people with disabilities is below 1
21 Skills demand
The National Education and Training Strategy for Agriculture (AET Strategy)
The AET Strategy developed by the Department of Agriculture Fisheries and Forestry (in consultation with various key stakeholders in the agricultural sector) highlights priority skills needs and constraints within the sector and categorises needs within the following 5 broad areas
1 Agricultural production ndash requesting that the past focus on a narrow band of commodities (relevant mainly to the commercial sector) and related research be expanded to address the needs of small‐scale and subsistence farmers (eg more focus on mixed farming and rural livelihood sustainability skills)
2 Agricultural engineering ndash with specific focus to be placed on technologies suitable for small‐scale farmers (eg relevant and post‐harvesting techniques related to processing and storage of produce) ndash to address this need the scarcity of agricultural engineers requires attention
3 Agricultural economics ndash a critical need was identified for general agricultural economic skills (ranging spectrum of farm planning farm management enterprise management marketing finance etc) ndash with the need to training both farmers and extension officers in such fields
4 Agricultural development ndash a specific need was identified to develop agricultural extensionists in supporting especially emerging and small‐scale farmers over the full spectrum (a need exists for both new curriculum in the training of new extensionists and the re‐training and upgrading of existing officers)
5 Veterinarians ndash the need to develop state veterinarians in order for the state to perform its role and function (particularly in its preventative monitoring and regulatory role and function)
AGRISETA sector skills planning demand data (2008‐2009)
The following section reflects initial research on skills demand in the Agricultural sector arising from the sector analysis (section 1) previous AGRISETA skills demand research for Sector Skills Planning during 2005‐2009 and analysis of WSP data from 2009 With the introduction of the Organising Framework of Occupations and agreement on definitions for scarce and critical skills in 200506 the AGRISETA undertook an extensive research and consultation processes to determine skills development priorities for the sector The research methodology employed was based on the a four dimensional topology for establishing and evaluating skills needs illustrated in the figure below
Agriculture Sector Analysis 31
AgriSETA June 2010
Agriculture Sector Analysis 32
The identification and prioritisation of skills needs was also undertaken from a key stakeholder and beneficiary perspective Consideration was given to needs of the following groups
bull The unemployed ndash helping them gain andor regain entry to the labour market bull The economically inactive ndash helping them to become economically active bull School leavers ndash helping them gain access to further education and training opportunities
and thus facilitating their entry to the job market bull Entrants to the job market ndash facilitating employment and integration into the work culture
and work ethic (improving the employability of an individual) bull Those currently employed in the sector ndash increasing their competency and opportunities
for advancement creating a career path and offering continued job security enhancement of value adding to the sector improving their prospects for better employment opportunities
bull Organisations and enterprises within the sector ndash making sure that skills development and knowledge creation occurs in such a way as to improve the sectorrsquos viability and allowing companiesenterprises to become more sustainable and profitable along the way improving productivity competitiveness and innovation within organisations
In organising and reporting the identified priority skills development needs (200809) the following structuring approach was followed
Tier 1 The four categories of needs as per the Topology presented above were used for the identification evaluation and grouping of needs
Pay conditions
Image
RECRUITMENT DIFFICULTY
SKILLSGAP
SKILLSSHORTAGE
LABOURSHORTAGE
Firms experience difficulty recruiting This does not necessary imply a skills shortage ndash may indicate a poor image remuneration etc
Those currently in work do not have the requisite skills set to carry out their job to an optimum standard
Required skills are in short supply when compared with the demand across the whole labour market
Regardless of skills levels a situation exists where there is simply not enough supply of labour to meet demand
Pay conditions
Image
RECRUITMENT DIFFICULTY
SKILLSGAP
SKILLSSHORTAGE
LABOURSHORTAGE
Firms experience difficulty recruiting This does not necessary imply a skills shortage ndash may indicate a poor image remuneration etc
Those currently in work do not have the requisite skills set to carry out their job to an optimum standard
Required skills are in short supply when compared with the demand across the whole labour market
Regardless of skills levels a situation exists where there is simply not enough supply of labour to meet demand
Figure 4 Topology for identifying skills development priorities
Source AGRISETA SSP Annual Update August 2009
AgriSETA June 2010
Tier 2 Within each of the first tier groupings needs were further broken down and organised per target group At this second level needs were grouped by
o General skills development needs (cross‐cutting over different target groups) o Needs experienced by small scale farmers (this group included subsistence
farmers new emerging land reform beneficiaries and small‐scale AgriBEE farmers) o Needs within the commercial agricultural sector (per sub‐sector groupings where
specific needs for such were identified ndash both on‐farm needs and within the secondary sub‐sector or related agri‐businesses)
o Needs of the Department of Agriculture Fisheries and Forestry (DAFF) To further guide and direct the identification and selection of scarce and critical skills the following factors or criteria that could reflect the importance (impact and effect) of a skills shortages were developed as an identification framework
1 Basic Skills Development Promoting basic literacy and numeracy and raising the base level of education for the sector improving the work and livelihood of existing workers
2 Employability Making the employee more employable by improving the fit between their skills and the sector needs
3 Enterprise Viability Improving the capability and feasibility of the enterprise by increasing its effectiveness of or possibilities for profit generation etc
4 Enterprise Sustainability Allow enterprises to survive and grow over an extended period of time without compromising the value of renewable resources thereby creating long‐term meaningful employment for larger numbers of people
5 Sector Growth Enabling the sector to develop or pursue new opportunities or improve the effectiveness of current operations
6 Sector Competitiveness Enabling the sector to compete more effectively in the international arena improving market intelligence and interpretation productivity cost efficiency etc
7 Human Resource Development Capacity Improving the access to quality provision of training to the agri sector
Based on this research and consultation framework the following skills development needs and priorities were identified
Agriculture Sector Analysis 33
AgriSETA June 2010
GENERAL NEEDS SMALL‐SCALE FARMER
NEEDS COMMERCIAL SECTOR
NEEDS DAFF NEEDS
RECRUITMENT RELATED SKILLS NEEDS Primary agriculture is the entry point into the world of work for large numbers of people in rural areas However the sector has negative connotations amongst sections of the youth and in parts of the country and is viewed as a last resort for some in the search for employment) The effect is that despite an unemployment rate of approximately 26 (now over 30) farmers find it difficult to recruit workers to meet seasonal demands This has resulted in the government approving the contracting of foreign labour to meet such temporary needs (workers are recruited mainly from Zimbabwe and Mozambique)
Labour in this farming sector is provided primarily by family members and no real recruitment constraints can be identified
The agricultural sector still manages to attract technical and management skills as it is perceived to include a better lifestyle and there is a strong tradition of agriculture in SA Increasing crime related security risks associated with farming may have a negative impact
The Department has identified a number of occupations in which they are experiencing long‐term vacancies Some of these result from a general shortage of such skills in SA while others arise from the inability of the public sector to compete with the private sector (less favourable employment image working conditions and equity considerations) Priority vacancies include Veterinarians Agricultural
Engineers Plant Health
Specialists Agricultural
Statisticians Plant Health Pest Risk
Analysts ICT Specialists Agricultural
Economists Agricultural Food and
Quarantine Technicians
Agro‐meteorologists Pasture Scientists Plant Production
Specialists Specialised Food
Analysts SKILLS GAPS RELATED NEEDS
bull Low literacy and numeracy levels ndash both amongst workers within the sector at large and at ownermanager level in many of the small‐scale farming
bull Farm management
Farm Management (Mainly owners managers) bull Farm management amp
entrepreneurship bull Resource
management and record keeping
bull Financial planning
A critical constraint is the poor educational levels of a large proportion of the labour force in the sector demanding a considerable effort and investment in ABET and other life skills
A particularly big need exists for skills upgrading amongst Extension Officers ndash particularly with regard to redress the historical neglect of small‐scale farmers and resource strapped farmers
Agriculture Sector Analysis 34
AgriSETA June 2010
Agriculture Sector Analysis 35
GENERAL NEEDS SMALL‐SCALE FARMER
NEEDS COMMERCIAL SECTOR
NEEDS DAFF NEEDS
skills (and general management skills in other agricultural businesses) coupled with a business orientation and entrepreneurship skills
bull A general need to increase compliance with environmental occupational health and safety animal welfare produce safety and hygiene standards regulations and requirements (local and international standards)
and management bull Project management bull Business plan
development Marketing and processing bull Processing and
packaging bull Transport
management bull Marketing produce
including branding bull Planning for
marketing bull Knowledge of
markets Technical knowledge and skills bull Production
management (related to specific enterprise)
bull Demonstration of production techniques
bull Natural resources management
Mechanical knowledge bull Farm maintenance bull Repairs of machinery
and equipment bull Electrical
maintenance and installation
programmes Need for improved management skills and relevant technological knowledge for increasing productivity levels and improved production methods Rising importance for environmentally responsible production and processing management systems Rising competitive and international markets increases need for business and marketing abilities among owners and managers Increasing requirements for compliance with environmental health and safety and international trade standards Information technology although not a priority is increasing in importance Business management ability is becoming increasingly important as more farmers are making decisions about restructuring their businesses diversification and developing supplementary sources of income
Critically improved farm management and business skills within an agricultural context to support the majority of BEE and emerging farmers Skills upgrading requirements for existing Extension Officers include bull Agricultural
economics bull Agricultural
management bull Business and
financial management
bull Technical and production related skills including o Animal husbandryo Poultry o Crop production o Horticulture
SKILLS SHORTAGES Generally SA has a shortage of entrepreneurs and people who have the business acumen drive motivation and
The profile of these farmers reflects a large contingent of older and less educated people who are generally less flexible tend to stick to
The commercial agri sector will increasingly have to compete in the global market and the ever increasing need to increase productivity to
DAFF us experiencing problems are especially sourcing people in specialised science related fields (learning fields experiencing few
AgriSETA June 2010
Agriculture Sector Analysis 36
GENERAL NEEDS SMALL‐SCALE FARMER
NEEDS COMMERCIAL SECTOR
NEEDS DAFF NEEDS
perseverance to become a successful farmer Given the high risks involved in the agricultural sector (natural elements outside onersquos control) the agri sector does not compete successfully for this ldquoscarce resourcerdquo Moreover as with other professional and skilled occupations there is a tendency for younger qualified people to move to urban areas
known practices and are less likely to experiment with new technology Within this target group candidates with good entrepreneurial ability are scarce There is a perceived shortage of Agricultural Extensionists and advisors to assist this target group However a large pool of young unemployed graduates exists who could assist such emerging farmers if they were mobilised and made accessible to farmers Similarly the potential pool of retired commercial farmers who could serve as mentors to this target group
remain profitable and viable it can be stated that many of the existing farmers and managers owners lack business management and entrepreneurial orientation Equity policy and the need to become BEE compliant requires that commercial enterprises appoint and develop black owners directors managers Changing local and global consumer preferences require farmers to change traditional farming methods and practices Skills and knowledge requirements include bull Global food and
international quality standards
bull Product traceability requirements
bull Organic produce and products
Specific occupations identified as being in short supply are
bull Production Managers (food processing)
bull Product specialisation to international specifications (research skills)
bull Forklift drivers heavy vehicletruck drivers and mobile plant operators
bull Experienced and competent artisans (millwrights electricians fitters
enrolments andor pass rates at HET institutions with the result that too few qualified persons come onto the labour market) Examples of such skills shortages identified by the Department include Agricultural Engineers bull Plant Health
Specialists (Nematology Entomology Plant Pathology)
bull Statisticians (specialised agricultural knowledge)
bull Plant Health Pest Risk Analysts
bull Agricultural Economists (production and resource economists)
bull Agricultural Food and Quarantine Technicians
bull Agro‐meteorologists Early warning Specialists
bull Pasture Scientists bull Plant Production
Specialists (eg ornamental crops hydroponics)
bull Specialised Food Analysts (pesticide residue analysts processed food and dairy analysts wine and spirit analysts)
AgriSETA June 2010
Agriculture Sector Analysis 37
GENERAL NEEDS SMALL‐SCALE FARMER
NEEDS COMMERCIAL SECTOR
NEEDS DAFF NEEDS
and turners bull Agricultural
Equipment Technicians
bull Pest and weed controllers
bull Horticultural specialists
LABOUR SHORTAGES AND RELATED SKILLS NEEDS Given an employment rate of some 26 (2009 currently estimated at over 30expanded definition) per definition there cannot be a labour shortage It is however difficult for people who have never worked before to integrate into the agricultural sector workforce Coupled with an aging workforce (30‐60 being over 40) means that most agri enterprises will within the next 5‐10 years be looking at replacing a large proportion of their workforce There could be an insufficient pool of people willing and able to participate The impact of HIVAIDS is also not always factored in to understanding the diminishing pool of resources available Labour shortages have been reported within selected geographical areas and in particular occupations Examples include cane cutters in the sugar industry chicken catchers in the poultry industry pickers in the fruit industry and animal handlers in feedlots as well as dairy parlour workers It is however believed that these shortages may reflect a recruitment problem as a result of the very harsh working conditions and the relatively poor remuneration (which makes these occupations unpopular) At present such ldquoshortagesrdquo are addressed through contracting labour from neighbouring countries
AgriSETA WSP analyses
Skills demand in the commercial agricultural sector
Information for demand for skills from WSP data is available for 1 673 employers who submitted their WSPs for the 200910 period The table below shows data on sub‐sector WSP submission relative to size of the sub‐sector as well as subsector data from all registered organisations and those who submitted WSPs Data for registered employers shows that there were 239 076 employees employed by the 17 234 registered organisations As previously stated 97 898 employees were employed by the organisations submitting WSPs This constitutes 41 of employees employed by registered organisations
Table 20 Employment and sub‐sector data drawn from WSP analyses
Sub‐sector
All Re
gistered
Employers
Small employers (0‐49)
Med
ium and
large
employers (50+)
Total W
SPs received
Total W
SPs received
as of
all registered em
ployers
WSP
received med
ium and
large orgs
WSPs received
as of
med
ium amp large em
ployers
WSPs received
small
employers
WSPs received
as of small
enterprises
EmployeesPer
Profile
CoffeeTea 40 33 7 9 23 5 71 4 12 483 Fibre 1 710 1 676 34 34 2 22 65 12 07 6 539
AgriSETA June 2010
Agriculture Sector Analysis 38
Sub‐sector
All Re
gistered
Employers
Small employers (0‐49)
Med
ium and
large
employers (50+)
Total W
SPs received
Total W
SPs received
as of
all registered em
ployers
WSP
received med
ium and
large orgs
WSPs received
as of
med
ium amp large em
ployers
WSPs received
small
employers
WSPs received
as of small
enterprises
EmployeesPer
Profile
Fruit 371 277 94 162 44 76 81 86 31 27 873 Grain 648 581 67 77 12 48 72 29 5 22 129 Milling 335 279 56 61 18 35 63 26 9 4 630 Pest Control 213 209 4 8 4 2 50 6 3 119 Poultry 391 305 86 66 17 46 53 20 7 19 187 Primary 12 121 10 776 1 345 1144 9 513 38 631 6 136 034 Red meat 1107 1 018 89 70 6 45 51 25 2 7 475 Seed 167 149 18 24 14 13 72 11 7 2 127 Sugar 71 45 26 13 18 10 38 3 7 10 478 Tobacco 60 46 14 5 8 3 21 2 4 2 002
Totals 17 234 15 394 1 840 1 673 10 818 44 855 16 239 076
Source 1 AgriSETA WSP 2009 data
Only 10 of all registered employers submitted WSPs for the 200910 period Of these 49 were medium and large sized employers and 51 small However only 16 small employers submitted their WSPs relative to the number of registered small employers and 44 medium and large employers submitted WSPs relative to the number of registered medium and large employers As such skills demand statistics provides more representative data on the requirements of medium and large employers Data for skills demand in the commercial agricultural sector is based on data for permanent employees as well as casual and seasonal employees
Skills demand forecasting by AgriSETA
Forecasting for skills demand the AgriSETA has estimated that the demand for skilled employees at different levels in the next few years is 510 686 This is based on WSP data analyses over the last 5 years and projected demand for the formal commercial agricultural sector and factoring in the demand that at maximum would result from completion of the land restitution programme in South Africa The table below reflects the skills that are on demand as well as the estimates for demand over the next five years by major occupational category35
35 AgriSETA 2010
AgriSETA June 2010
Table 21 Demand for skills by occupational category
Major Occupation (OFO)Estimated Demand
Group Title1 Managers (commercial and small emerging farmers) 264 3702 Professionals 4 1413 Technicians and Trade workers 8 9255 Clerical and administrative workers 8006 Sales workers 4007 Machinery operators and drivers 5 8008 Elementary workers 226 250
Total 510 686Source AgriSETA WSP data and SSP demand forecasts
Research needs going forward
As has been set out in the sector analysis and the scenarios derived from that analysis the sector is faced by both significant and profound change and also great uncertainty It therefore follows that the task of focussing limited resources (basically levy income in the formal sector and NSF funds for the emergent farming sector) is difficult Whilst the general thrust of training remains broadly as described in the 2006‐10 SSP Updates some considerable work is required to achieve targeted effective interventions during the 2011‐2016 period The following research questions will need to be addressed in preparing the next SSP
bull In relation to the managers and owner‐managers of commercial farms and enterprises what skills are needed to enable them to help bring about the more optimistic scenario and manage the risks associated with the less optimistic ones
bull In terms of professional and technical competencies do the current education and training institutions coupled with the learning programmes available through the AgriSETA (learnerships skills programmes and the like) meet the needs of the sector
bull In the emerging agricultural sector do the current programmes funded by sources external to the AgriSETA (eg NSF) meet all the identified needs What gaps are there and how should they be addressed
bull In relation to governmentrsquos growth strategy and industrial action plans what skills are required for developing the aquaculture sub‐sector What programmes are available How can the SETA support the skills needs for this sub‐sector
bull Given the increasing levels of casual and contract labour how can skills be developed to meet the needs of the formal commercial sector and the emerging enterprise sector
bull How can the demand in each of the priority areas be quantified and agreement be reached on numbers of people to be trained
Agriculture Sector Analysis 39
AgriSETA June 2010
SECTION 3 Skills Gaps and scarce skills
Scarce skills at the DAFF
The level of scarce skills at DAFF can be determined by the vacancy rate While the average vacancy rate in the department as at 31 March 2009 was 17 there were some posts that had very high vacancy rates as reflected in the table below Indicating the possibility that the Department is experiencing difficulties in finding suitable candidates in the South African labour market to fill these posts
Table 22 Scarce skill occupations and vacancy rates (DAFF March 2009) Critical occupations Number of posts Posts filled Vacancy rate ()
Agricultural animal oceanography forestry and other sciences
167 119 287
Engineering sciences related 2 1 50Engineers and related professions 13 6 538Farming forestry advisors and farm managers 11 4 636Finance and economics related 73 53 274Horticulturists foresters agricultural and forestry technicians
350 221 369
Legal related 6 4 333Mechanical engineering technicians 3 2 333Risk management and security services 6 4 333Social sciences related 1 0 100Veterinarians 34 24 294
Source DAFF Annual Report 20082009
Skills are also scarce at senior management level The department also reports on difficulties it has filling senior management services vacancies with some of them staying vacant for up to twelve months because no suitable candidates can be found The department would then resort to re‐advertisement and head hunting This was the case with 22 of 18 SMS posts in March 2009
Scarce skills in the commercial sector
The following occupations have previously been projected as scarce (extremely hard to fill vacancies) by AgriSETA in the commercial agricultural sector over the next five years
Table 23 Scarce and critical skills in the commercial agricultural sector
Occupation Code
Group Occupation Critical Skills Intervention Comments
139903 Managers Laboratory Manager
Technology AI nutrition
HET
221101 Professionals Accountant (General)
General HET
221102 Professionals Management Accountant
Farm financial management
HET Focus on support advice to farmers new enterprises
222101 Professionals Commodities Trader
Export administration supply chain
FET Learnership Skills
Agriculture Sector Analysis 40
AgriSETA June 2010
Agriculture Sector Analysis 41
Occupation Code
Group Occupation Critical Skills Intervention Comments
management Programme
224301 Professionals Economist Agricultural HET
Mainly for Department of Agriculture and para statals commodity organisations
233101 Professionals Chemical Engineer
Chemical processes in food production
HET Industries such as sugar processing
233301 Professionals Electrical Engineer
Installation and maintenance
HET Processing industry
233401 Professionals Electronics Engineer
Computerised production prosesses
HET Processing industry
233501 Professionals Industrial Engineer
Productivity and efficiency
HET Processing industry
233904 Professionals
Instrument Engineer (Defence Force)
Installation and maintenance
HET
Not for defence ‐ sugar industry
233502 Professionals Mechanical Engineer
FETHET Equity reasons
233902 Professionals Agricultural Engineer
Farm layout and infrastructure
HET Mainly in Government
311101 Technicians and trades workers
Agricultural Technician
Installation and maintenance
FETHET
234102 Professionals Agricultural Scientist
Agri research HETFET Especially in horticulture
234201 Professionals Chemist HET Processing industry
234202 Professionals Food Technologist
Food safety HACCP
FETHET Across sector
234701 Professionals Veterinarian HET Mainly in Government
311101 Technicians and trades workers
Agricultural Technician
Farm infrastructure
FET Mainly needed in government
311401 Technicians and trades workers
Chemistry Technician
FETHET EE reasons
312907 Technicians and trades workers
Chemical Engineering Technician
FET Learnership
Mainly EE reasons
312402 Technicians and trades workers
Electronic Engineering Technician
Weak stream production infra
FETHET Mainly tobacco industry
233904 Professionals
Instrument Engineer (Defence Force)
Instrument technician
FET
Occupation needed Instrument Technician (not defence force) Mainly sugar processing sector
321202 Technicians and trades workers
Diesel Motor Mechanic
FET Learnership
To include tractor mechanic
321204 Technicians and trades workers
Small Engine Mechanic
Agricultural equipment
FET Learnership
Throughout sector
AgriSETA June 2010
Agriculture Sector Analysis 42
Occupation Code
Group Occupation Critical Skills Intervention Comments
322301 Technicians and trades workers
Metal Fabricator
Artisan FET Learnership
322303 Technicians and trades workers
Welder Welder (First Class)
Artisan FET Learnership
323203 Technicians and trades workers
Fitter‐Welder Artisan FET Learnership
Mainly sugar ndash multi‐skilled
323202 Technicians and trades workers
Fitter And Turner
Artisan FET Learnership
Tobacco and sugar
323501 Technicians and trades workers
Millwright Artisan FET Learnership
Wide‐spread need
341101 Technicians and trades workers
Electrician (General)
Artisan FET Learnership
Wide‐spread need
342101 Technicians and trades workers
Air‐Conditioning And Refrigeration Mechanic
Artisan FET Learnership
Sugar pack houses cold chain
Source AgriSETA Sector Skills Plans
Supply of skills
South Africarsquos agriculture skills are produced in high schools agricultural colleges FET colleges and Higher Education institutions In high school a large cohort of learners take Agricultural Science as a subject In 2003 there were 42 Agricultural High Schools offering Agricultural Science as a subject These students and those in high schools taking the subject could progress to taking agriculture as a focus area for further education In 2004 there were 10 FET colleges offering vocationally directed agricultural programmes These FET colleges offered complete qualifications and short courses Eleven Colleges of Agriculture can offer qualifications up to degree level and 19 universities offer qualifications in Agriculture ranging from agricultural economics animal and plant sciences and horticulture among others at under and post graduate levels (Department of Agriculture 2006) While long term planning of skilling of new entrants in the sector can be done through close consultation between the sector agricultural schools and colleges FET colleges and HET institutions so that they teach relevant skills there are other avenues for training for those who are already employed in the sector for example skills programmes and learnerships There are 15 registered qualifications for the primary agriculture sub sectors Currently AgriSETA has 94 registered learnerships that can address the skills needs of the identified scarce skills These are captured in Appendix 2 AgriSETA has approved accredited a number of training providers across the country to deliver the theoretical and practical components of these learnerships These include agricultural colleges FET colleges and private providers Currently the AgriSETA has 246 registered and approved providers distributed nationally as follows
AgriSETA June 2010
Table 29 AgriSETA approved training providers (2010) Province Number of providers
Gauteng 72
(29)
KwaZulu Natal 20
(8)
Limpopo 35
(14)
North West 30
(12)
Northern Cape 3
(1)
Free State 15
(6)
Mpumalanga 14
(6)
Western Cape 26
(11)
Eastern Cape 31
(13) Total 246
The providers are small to large organisations In primary agriculture small providers appear to offer the most training in rural areas and community projects (AgriSETA 2010) Most of the operating providers will be in FET colleges and agricultural colleges The AgriSETA is unable to meet the total demands for skills across the duality of their sector There seems to be fairness in the approval of training for both permanent and casual and seasonal workers In 200809 the AgriSETA approved 559 learnerships as follows
Table 30 AgriSETA learnerships approved for grant purposes (2008‐2009)
Source AgriSETA learnership data analysis
Agriculture Sector Analysis 43
AgriSETA June 2010
Agriculture Sector Analysis 44
Provision of skills programmes in the same year attracted grants for 2 706 employees
Table 31 Participation by learners in skills programmes in the AgriSETA (200809)
Source AgriSETA Skills programmes data analysis
AgriSETA June 2010
APPENDIX 1 Skills demand in the Department of Agriculture Forestry amp Fisheries (200809)
Source DAFF Annual Report 2008‐20009
Agriculture Sector Analysis 45
AgriSETA June 2010
Agriculture Sector Analysis 46
Appendix 2 AgriSETA registered learnerships Registered Learnership NQF Level SAQA Registration NoLearnership in Agri Sales and Service 4 22 Q 220001 20 178 4Learnership Agricultural Machinery Technician 2 22 Q 220007 20 160 2Learnership in Specialist Agricultural Machinery Technician 5 22 Q 220009 21 258 5Agri Trade Processes 2 22 Q 220013 30 125 2FETC Meat Examination Applying Basic Business Principles 4 30 Q 3000 2823 164 4Further Education and Training Certificate Seed Marketing Execute Seed Trials 4 22 Q 220025 21 126 4Further Education and Training Certificate Seed Research and Development Certify as Seed Unit 4 22 Q 220027 21 121 4FETC Seed Research and Development Conduct a Field Inspection of a Seed Unit 4 22 Q 220028 20 120 4Seed Research and Development Operations Operate in a Team 3 22 Q 220020 22 121 3Seed Research and Development Operations Apply Basic Business Principles 3 22 Q 220021 22 121 3National Certificate Seed Processing and Packaging Operate in a Team 3 22 Q 220026 21 123 3Sugar Industry Technical Maintenance worker 2 22 Q 220011 39 128 2National Certificate Sugar Manufacturing and Refining Technical Maintenance 3 30 Q300003 23 146 3Further Education and Training Certificate Manufacturing Technical MaintenanceProduce Components by Performing Engineering Turning Operations
4 30 Q 3000 1321 173 4
FETC Manufacturing Technical Maintenance Produce Components by Performing Milling Operations 4 30 Q 3000 1521 173 4 FETC Manufacturing Technical Maintenance Develop and Fabricate from Complex Drawing 4 30 Q 3000 1420 173 4National Certificate in Sugar Technology 5 22 Q 220036 22 140 5Further Education and Training Certificate Sugar Processing 4 22 Q 220035 31 144 4National Certificate in Sugar Technology Processing Sugar Refining 2 22 Q 220037 28 124 2National Certificate in Sugar Technology Processing Juice Preparation 2 22 Q 220038 28 124 2National Certificate in Sugar Technology Processing Crystallisation 2 22 Q 220039 27 122 2National Certificate in Sugar Technology Processing Laboratory Practice 2 22 Q 220040 25 124 2National Certificate in Sugar Technology Processing Extraction 2 22 Q 220041 28 122 2NC Rooibos Production Applying Basic Business Principles 2 30 Q 3000 2427 130 2 NC Rooibos Processing Applying Basic Business Principles 2 30 Q 3000 2224 123 2 National Certificate Cigarette Production 3 22 Q 220046 23 121 3
AgriSETA June 2010
REFERENCES AgriSETA 2010 AgriSETA 20082009 Annual report Pretoria AgriSETA Agricultural Research Council httpwwwarcagriczahomeasppid=272 Avert South African HIV and AIDS statistics Available on httpwwwavertorgsafricastatshtm Centre for Development Enterprise 2008 Land reform in South Africa Getting back on track CDE Research No 16 DAFF 2010 Quarterly economic review of the agriculture sector Pretoria DAFF DAFF 2009 Annual report 20082009 Pretoria DAFF Department of Agriculture 2008 Strategic plan 2008 Pretoria Department of Agriculture DTI An introduction to the South African economy Available on httpwwwthedtigovzapublicationsagroprocessinghtm Eastern Cape Provincial Government Eastern Cape Provincial Growth and Development Strategy 2004 ndash 2014 Economic Commission for Africa 2009 Developing African agriculture through regional value chains Addis Ababa Economic Commission for Africa Economic Report Free State Province 2005 Provincial Growth and Development Strategy 2005 ndash 2014 GCIS 2010 SA Yearbook 200910rdquo Agriculture forestry and fisheries Pretoria GCIS Greenberg S 2010 Status report on land and agricultural policy in South Africa 2010 Institute for Poverty Land and Agrarian Studies School of Government University of the Western Cape Research report Ingelozi Management Solutions 2008 HIVAIDS in the South African agricultural sector Towards the development of a long term intervention Research report KwaZulu Natal Provincial Government 2006 KwaZulu Natal Provincial Growth and Development Strategy Limpopo Provincial Government Growth and Development Strategy 2004 ndash 2014 Mhone G (2000) Enclavity and Constrained Labour Absorbtive Capacity in Southern African Countries Geneva International Labour Office Moyo S The Agrarian question and the developmental state in South Africa In Edigheji O et al 2010 Constructing a democratic developmental state in South Africa HSRC PRESS
Agriculture Sector Analysis 47
AgriSETA
Agriculture Sector Analysis
National Treasury Republic of South Africa 2010 National Budget 2010 ndash National Budget Review 2010 Pretoria National Treasury Northern Cape Provincial Government Agriculture and agro‐processing sector strategy North West Provincial Government North West Provincial Growth and Development Strategy 2004 ndash 2014 Province of the Western Cape 2008 The Ikapa growth and development strategy White Paper SABCOHA SA Business Coalition on HIV and AIDS wwwsabcohaorg SACAU httpwwwsacauorghostingsacauSacauWebnsfHomehtmOpenForm South African Government 2010 20102011 ndash 20122013 Industrial Policy Action Plan Republic of South Africa Statistics South Africa 2005 Census of commercial agriculture 2002 Report No 110201 Pretoria Statistics South Africa Statistics South Africa 2009 Census of commercial agriculture 2007 Statistical release P1101 Pretoria Statistics South Africa Statistics South Africa 2010 General household survey 2009 Statistical release P0318 Pretoria Statistics South Africa Statistics South Africa 2010 Gross domestic product first quarter 2010 Statistical release P0441 Pretoria Statistics South Africa Statistics South Africa 2010 Quarterly labour force survey Quarter 1 2010 Statistical release P0211 Pretoria Statistics South Africa Vink N amp van Rooyen J 2009 The economic performance of agriculture in South Africa since 1994 The implications for food security Pretoria DBSA development planning division working paper series No 17 Webster E 2004 the Dual Economy from a book by Van Holdt K and Webster E Work restructuring and the Crisis of Social reproduction and 10 years of restructuring post apartheid workplaces University of Natal Press Workinfocom httpwwwworkinfocomfreesub_for_legresdatalraempassoc3htm Xingwana L 2008 Challenges and Opportunities for Land and Agrarian Reform towards 2025 Speech delivered at the Agri‐Consultation Protea Ranch Hotel Polokwane 30 July 2008
- Table of contents
- SECTION 1 THE AGRICULTURAL LANDSCAPE
- 11 Size and shape of the Agricultural sector
-
- Overview
- Distribution of agricultural production
- The structure of the agriculture sector in South Africa
- Categories of farming enterprises
- Employment trends
- Employment categories and remuneration
- Stakeholders in the Agricultural sector
-
- National government departments
- Sector representatives
-
- 12 Factors impacting development in the Agriculture sector
-
- Future sector economic growth and development
-
- South African sector growth plans (IPAP2)
- International Trade
- Global recession and rise in food prices
-
- Land reform
- Reliance on imports
- Water
- The labour market
- Consumer trends
- HIVAIDS
- Farm safety and security
- Broad-based Black Economic Empowerment
-
- Conclusions and scenarios
- SECTION 2 DEMAND FOR SKILLS
-
- AgriSETA registered employers and employee coverage
- Employee coverage in the AgriSETA
-
- 21 Skills demand
-
- The National Education and Training Strategy for Agriculture (AET Strategy)
- AGRISETA sector skills planning demand data (2008-2009)
- AgriSETA WSP analyses
-
- Skills demand in the commercial agricultural sector
-
- Skills demand forecasting by AgriSETA
- Research needs going forward
-
- SECTION 3 Skills Gaps and scarce skills
-
- Scarce skills at the DAFF
- Scarce skills in the commercial sector
- Supply of skills
-
- APPENDIX 1 Skills demand in the Department of Agriculture Forestry amp Fisheries (200809)
- Appendix 2 AgriSETA registered learnerships
-
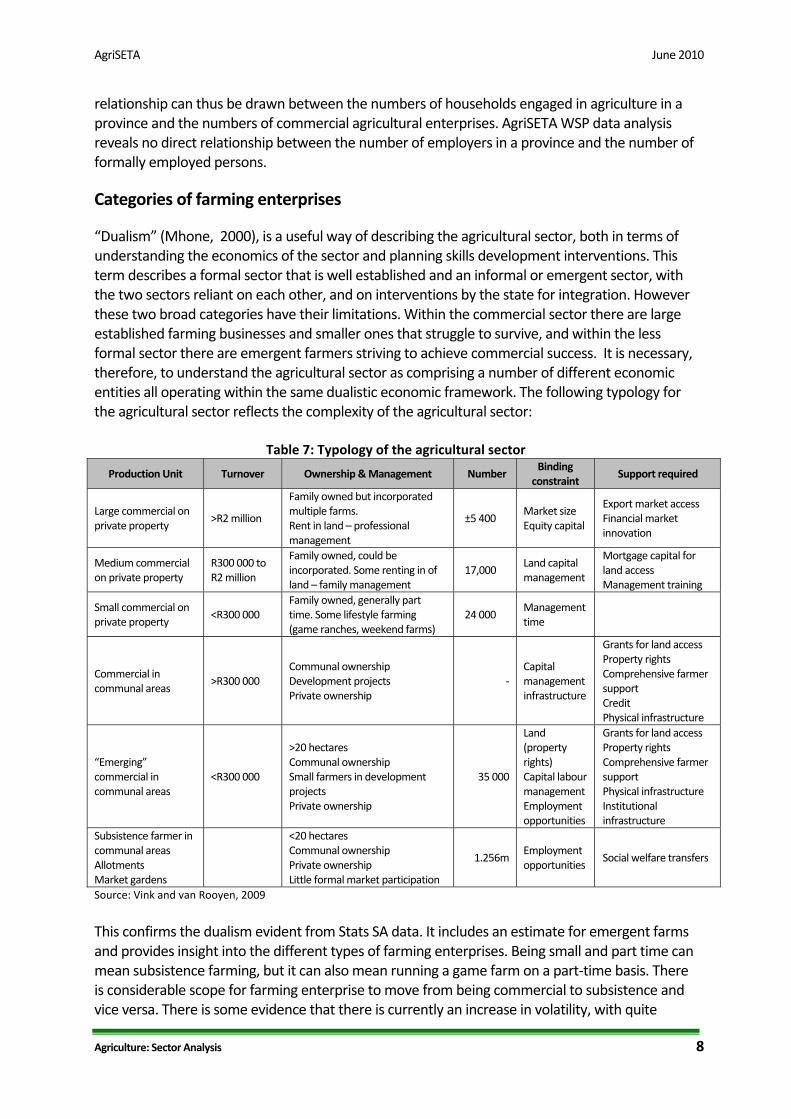
AgriSETA June 2010
Agriculture Sector Analysis 10
Employment in the sector is based on those who work in administration in DAFF and those who work in production and processing at farms and in factories In March 2009 DAFF had 3 285 posts with 2 735 of these filled The table below shows the employment profile at DAFF by occupation race gender and disability as at 31 March 2009 The department employed 57 male employees and 43 female employees There were more African employees constituting 69 of the entire department workforce Very little progress has been made regarding the employment of people with disabilities who constitute only 04 of the workforce This is in line with other department across government where similarly little progress has been made
Table 9 Employee profile ‐ Department of Agriculture Forestry and Fisheries Occupational Category (SASCO)
African Coloured Indian White Totals
M F M F M F M F M F Total
Legislators senior officials managers
15 14 2 2 8 3 25 19 44 16
Professionals 239 241 11 12 4 14 70 64 324 331 655 240
Technicians associate prof
190 153 38 19 9 4 86 57 323 233 556 204
Clerks 93 204 22 42 0 7 13 171 128 424 552 30
Service and sales workers
38 19 4 2 1 17 1 60 22 82 30
Craft and related trades workers
42 3 13 58 0 58 21
Plant machine operators and assemblers
53 1 8 1 62 1 63 23
Elementary occupations
484 96 94 28 1 6 5 585 129 714 262
Totals 1 154 728 182 105 15 25 214 301 1 565 1 159 2 724
Percentage 424 267 67 39 06 09 79 110 575 425 100
People with disabilities
1 1 1 2 6 4 7 11 04
Race 1 882 287 40 515 Percentage 691 105 15 189 Source Dept of Agriculture Forestry and Fisheries (2010)
In respect of occupations and skills profiles the majority of the Departmentrsquos employees are Professionals and Technicians Associate Professionals (444) followed by people employed in elementary occupations (262) Employment across the agricultural sector is subject to growth and decline variations related to a wide range of conditions and circumstances ndash produce prices climate and environmental changes mechanisation technology and the like Since 2002 the trend has been downwards There are a number of reasons for this including mechanisation and casualisation of labour on larger farms the economic downturn impacting on some sub‐sectors and the global trade situation including changes in the foreign exchange rates and the failure of successive DOHA development talks to address inequalities in access to global agricultural markets12 12 The Doha Development Round is the trade‐negotiation of the World Trade Organization (WTO) Its objective is to lower trade barriers globally Talks have stalled over a divide on major issues such as agriculture industrial tariffs and non‐tariff barriers services and trade remedies The most significant differences are between developed nations led
AgriSETA June 2010
Agriculture Sector Analysis 11
It is anticipated that growth of the agricultural sector to meet local consumer demand government initiatives to expand agricultural niche export markets and the development of an aquaculture sub‐sector to counter depletion of natural resources is likely to lead to creation of employment in the sector
Table 10 Workforce changes in the Agricultural sector ‐ 2001 to 2010
Year Workers Year on year difference Variation 2001 969 0002002 1 153 000 + 184 000 1602003 808 000 ‐ 345 000 ‐ 4272004 828 000 + 20 000 242005 778 000 ‐ 50 000 ‐ 642006 886 000 + 108 000 1222007 703 000 ‐ 183 000 ‐ 2602008 764 000 + 61 000 802009 615 000 ‐ 149 000 ‐ 2422010 650 000 + 35 000 54
Quarter 1
Source Statistics South Africa Survey (pp 210‐211)
Employment categories and remuneration
It is difficult to get detailed and accurate yearly statistics on employment by type (full‐time casual and seasonal employees) or on remuneration in the agricultural sector The latest available statistics on commercial agriculture are found in the 2007 Stats SA Census of Commercial Agriculture The following tables reflect survey data on the number of permanent casual and seasonal agricultural sector employees by province as well as total remuneration per province
Table 11 Number of paid full‐time agricultural workers and total remuneration by province
Province 2002 2007 Growth Decline
Number Remuneration
R000s Number
Remuneration R000s
Number Remuneration
Eastern Cape 33 718 329 351 34 253 510 404 16 550Free State 57 607 580 888 53 944 737 796 ‐64 270Gauteng 20 815 344 629 22 979 534 083 104 550KwaZulu‐Natal 75 799 763 439 66 685 968 455 ‐120 269Limpopo 62 635 525 390 35 728 625 436 ‐430 190Mpumalanga 61 603 599 617 46 520 853 396 ‐245 423North West 39 914 409 526 53 741 574 596 346 403Northern Cape 31 077 320 598 26 871 339 948 ‐135 60Western Cape 98 207 1 378 816 90 943 2 029 275 ‐74 472Totals 481 375 5252251 431 664 7 173 389 ‐103 366
Source Statistics South Africa Report 120201 (p1101)
by EU USA and Japan and the major developing countries led and represented by India Brazil China and South Africa Considerable contestation exists over the maintenance of agricultural subsidies operating as trade barriers
AgriSETA June 2010
Agriculture Sector Analysis 12
Table 12 Number of paid casual amp seasonal agricultural workers amp total remuneration by province
Province 2002 2007 Variance
Number Remuneration
R000s Number
Remuneration R000s
Number Remuneration
Eastern Cape 30 936 59 680 30 565 106 497 ‐12 784Free State 57 871 69 595 45 150 98 996 ‐220 422Gauteng 8 722 20 975 11 957 93 461 371 3456KwaZulu‐Natal 37 602 103 946 34 383 154 286 ‐86 484Limpopo 38 614 107 223 31 833 124 159 ‐176 158Mpumalanga 46 480 86 242 32 826 176 363 ‐294 1045North West 46 078 62 653 32 008 75 250 ‐305 201Northern Cape 68 174 121 613 47 874 123 723 ‐298 17Western Cape 124 968 331 406 98 546 485 108 ‐211 464Totals 459 445 963 331 365 142 1 437 843 ‐205 493
Source Statistics South Africa Report 120201 (p1101)
The tables above reflect that the Western Cape was the biggest employer of labour on commercial farms in 2007 with a majority of the employees being casual and seasonal The Eastern Cape employed the least number of commercial farm employees The comparator figures for 2002 and 2007 would appear to show a continuous country wide reduction in employment both in permanent employees and casual and seasonal workers The exception is the North West that has experienced an increase in full time employees The current minimum wage for farm workers (February 2010) is R1 31669 per month13 Monthly salaries differ across sub‐sectors with highest paid workers in primary production in the fisheries and dairy sub‐sectors
Table 13 Approximate monthly wage rates in Agriculture for selected sub‐sectors
Subsector Primary Production ProcessingPack house
Meat R 2000
Dairy ‐ R 2650
Wines R 1100 R 1400
Flowers R 800 R 1200
Fisheries R 5000
(crewman)R 1892
Source DTI 201014
Vink amp van Rooyen (2009) indicate that before the introduction of minimum wage in 2003 the real cash remuneration for employees had been increasing However over time the unit cost of labour (the ratio of the total cost of labour to the total value of output) has been in decline including a steep drop during and after the introduction of minimum wages
13 Department of Labour 2010 14 Source DTI (Data sourced from SAMIC Dairy Industry JAG WOSA SAFEC SA Pelagic Fish Industry Association)
AgriSETA June 2010
Agriculture Sector Analysis 13
In 1970 for every R1 of output 16 cents was spent on labour By 1980 this has dropped to 13 cents for R1 of output By 1994 the figure had increased to 19 cents declining to 17 cents in 1998 and to 117 cents in 2001 By 2007 it had reduced to 108 cents Further research will be needed to establish the current situation but there is reason to believe that the decline has continued with wages being very low both in terms of unit costs and in relation to other groups of workers in the economy
Strictly speaking it is not the role of the SETA to engage in the complex regulatory framework for the agricultural labour market It is for the Department of Labour and NEDLAC with their employer and organised labour stakeholders to find ways of balancing the need for protection of vulnerable workers with the need to create a framework that encourages the creation of jobs and improved job security The reason that more research is needed in this area and in particular detailed discussions with industry and labour representatives is to establish
The extent to which skills development interventions can improve the prospects for job creation and improved job security and
The mechanisms that can be established to enable uninterrupted skills training in the context of casualisation and use of contract and seasonal labour
Stakeholders in the Agricultural sector
National government departments
There are a number of national government Departments and spheres involved in the challenges of the agricultural sector The following table sets out the broad contribution that each department is intended to make
Table 14 Government department roles in relation to Agriculture Department Role
Department of Agriculture Forestry and Fisheries Agricultural policy and support Department of Rural Development and Land Reform Land Reform and land claims settlements Department of Economic Development Economic planning National Treasury Macro economic policy Department of Trade and Industry Industrial strategy (IPAP 2) Department of Water Affairs The management of water supply Department of Labour Labour market policy Department of Higher Education and Training HRD and skills planning and SETAs In relation to public spending on agriculture the agricultural national budget constitutes about 05 of the national budget The figure below reflects trends in national budgeting for the agricultural sector between 19967 and 201112 Some analysts15 have argued that state expenditure on agriculture shows lack of prioritisation of the sector especially considering that the budget remains lower than it was in the late 1980s when it now caters for a greater number of farmers than it did during apartheid segregation
15 Greenberg 2010 p 2
AgriSETA June 2010
Figure 2 National budgets for Agriculture 1996‐2011 (adjusted for inflation)
Source Greenberg 2010
The Department of Agriculture Forestry and Fisheries (DAFF) is responsible for the agricultural sector The department works with various organisations to promote the interests of the sector
bull It registers all South African Pest Control Association (SAPCA) qualified inspectors bull It works with the Agricultural Research Council for research to optimise the control of
migratory pests bull The Directorate on Marketing works with the National Agricultural Marketing Council
(NAMC) on issues related to equitable access to markets including policy formulation issuing of permits and coordinating inter‐departmental relations to enhance marketing
bull Historically the Department has employed a large number of extension officers located in farming communities who have supported and advised farmers This service has been in decline in recent years but remains an important aspect of state support to the sector
The above roles will be subject to some review in the context of IPAP 2 and also the debates around the role of the state in the economy The issue is not only levels of spending but also clarifying the role of government in relation to the business of the sector
Sector representatives
There are three major umbrella organisations representing the interests of farmers AgriSA TLUSA and the National African Farmers Union of South Africa (NAFU) AgriSA and TLUSA represents both commercial farmers and cooperativesrsquo interests through its engagement at national and international level AgriSA is a member of the Southern African Confederation of Agricultural Unions (SACAU) a regional farmersrsquo union for farmers in Southern Africa AgriSA has structures in all the provinces except Limpopo
Agriculture Sector Analysis 14
AgriSETA June 2010
Agriculture Sector Analysis 15
NAFU is a union for predominantly previously historically disadvantaged smallholder farmers with a membership base including farmers agribusinesses farmersrsquo organisations corporations and individuals who support their goals NAFU is represented by different unions in all the provinces There are other employer organisations who are not affiliated to AgriSA and NAFU including
bull Agricultural Industrial and Medium Employers Organisation bull Agricultural Mining and Industrial Chemical Manufacturersrsquo Association bull Agrilabor Employersrsquo Organisation bull Algoa Meat Traders Association bull East Coast Poultry Producers Employersrsquo Association bull East London and District Meat Traders Association bull Fertiliser Industry Employersrsquo Organisation bull Landbou Werkgewersorganisasie (Workinfocom) bull Red Meat Producersrsquo Association
The Agricultural Research Council is an autonomous statutory body that provides research to DAFF and the provincial departments of agriculture Figures available for South Africarsquos investment in agriculture research and development show that South Africa was above international norms of investment in RampD which are 053 of agricultural GDP for developing countries and 236 for developed countries In South Africa in 2000 agricultural RampD investment in relation to agricultural GDP was 30416 There are six major sources of credit for farmers banks (50) agricultural cooperatives and agribusiness (12) the Land Bank (21) private creditors (8) other creditors and financial institutions (9) and government (1) (GCIS 2010)
12 Factors impacting development in the Agriculture sector Several international and local factors impact on the productivity of the agricultural sector and its growth Key amongst these are
Growth of the South African economy and rising consumer demand International trade and trade agreements The global recession and rise in food prices The land reform programme Reliance on imports Water availability Changing consumer patterns and demands (eg organic food stuffs) Technological changes and mechanisms Quality standards Farm safety and security Broad‐based black economic empowerment Legislation Skills demand and supply HIVAIDS
16 Vink amp van Rooyen 2009
AgriSETA June 2010
These key factors are clustered and discussed below
Future sector economic growth and development
South African sector growth plans (IPAP2)
The 20102011 ndash 20122013 Industrial Policy Action Plan (IPAP) identifies five structural challenges that existed in the South African economy before the global economic downturn and which have been exacerbated by the recent economic crisis These challenges were evident even during the time South Africa was experiencing relatively high growth rates between 2005 and 2007 and have continued during the recession These challenges are
1 Structural imbalances in the growth path including growth that is lagging behind other medium and low income countries
2 Uneven performance of the manufacturing sector with some divisions like the automotive sector experiencing exponential growth while other sectors have stagnated
3 Employment growth being sustained by credit extension and consumption rather than by productive sectors leading to a large current account deficit
4 Low profitability of manufacturing 5 Low savings and investment from financial sector growth Only 52 of private credit was
extended to fixed investment in 2008 Key sectors have been identified for IPAPrsquos focus including agro‐processing which has a diverse group of industries and sub‐sectors including food processing beverages aquaculture horticulture medicinal aromatic and flavourants Key action plans for the agro‐processing sector are identified in IPAP2 as
Development of a National Food Control Agency to consolidate the sector Development of aquaculture to supplement dwindling wild fish stocks Designating specific areas for utilisation of aquaculture Development of the organic food sector Development of the small milling industry Enhancing competitiveness in fruit and vegetable canning Improving beneficiation of Rooibos and Honeybush products (IPAP2 2010)
International Trade
South Africa is a major exporter of Agricultural produce In particular South African fruit and fruit‐derived products such as wine and fruit juice are competitive in the global market However in many sub‐sectors where export potential exists ndash grain and meat ndash serious problems face the industry A key challenge is the uneven playing field experienced by South African exporters Major global competitors include the United States and the countries of the European Union where government subsidies in various forms are in place No such subsidies are in place in South Africa making it difficult if not impossible for South African agricultural produces to enter developed country markets due to the prices that they have to ask for products I In addition the value of the Rand has fluctuated from levels of around R10 to the US dollar to as little as R7 to the dollar When the Rand is strong export becomes difficult because it costs more in the case of the move from R10 to R7 a 30 cost increase for the importer It is impossible to
Agriculture Sector Analysis 16
AgriSETA June 2010
Agriculture Sector Analysis 17
predict whether the World Trade Organisation negotiations known as the DOHA Round will achieve progress in the coming years Historical evidence is that during periods of global recession developed economies become more protective not less and so the current outlook is not good Nor is it possible to predict the value of the Rand though current thinking in government is to move toward a weaker Rand to encourage exports These are two key variables that will need to be factored into the different sector growth scenarios for the future
Global recession and rise in food prices
Economic growth slowed down significantly in sub Saharan Africa and in South Africa in 2009 but there appear to be signs of recovery GDP growth in the region declined from about 6 in 2004 ndash 2008 to about 18 in 200910 GDP growth in South Africa was 16 in 2009 17and rose to 46 in the first quarter of 201018 though much of this is related to the income derived from the 2010 FIFA World Cup and may not be sustained Projections are generally for a slow revival with a set back after the slight rise resulting from the World Cup A return to the 6 levels of the 20078 could take some years The global recession reduced the demand for African exports and reduced capital flows to the region but it is anticipated that the demand for mineral resources by Asian and Western powers will result in both the expansion of exports and expanded foreign direct investment The competition between India and China for African markets is also expected to boost trade to the benefit of African suppliers South Africa is expected to particularly benefit from direct foreign investment from China and India China has already become South Africarsquos largest market for exports and supplier of imports19 Rising food prices have forced governments around the world to control prices of maize bread rice and dairy products In South Africa ldquofood price inflation between December 2005 and December 2006 averaged 788 rdquo20 Although efforts are being made to reduce barriers to poorer families in relation to basic food there has been no move to subsidise food generally This may change though the space for significant levels of support is restricted because of reduced revenue from income taxes resulting from the recession The global credit crunch and recession have meant a reduction in public expenditure and funding which has affected the agricultural sector21
Land reform
In South Africa specifically land reform has a significant bearing on food security and agriculturersquos contribution to GDP The objective of the land reform programme is to transfer 30 of agricultural land to black ownership by 2014 (deferred to 2025) to ensure more equitable access to land by historically disadvantaged people and to increase their participation in agricultural activities22 Land reform has been informed by four processes23
17 Department of Agriculture Forestry and Fisheries 2010 18 Stats SA 2010 19 Department of Agriculture Forestry and Fisheries 2010 20 Department of Agriculture Forestry and Fisheries 2010 ‐2011 Strategic Plan 21 Economic Commission for Africa 2009 22 Xingwana 2008 23 CDE 2008
AgriSETA June 2010
Agriculture Sector Analysis 18
Land restitution involving returning land or providing financial compensation to those whose land was dispossessed during apartheid
Land redistribution transferring more land to the historically disadvantaged Tenure reform modernising land tenure rules and access to land ownership and Providing financial support for the development of emerging farmers
In relation to progress with land reform by September 2009 only 69 of agricultural land (about 567 million hectares) had been transferred and a majority of the beneficiaries have not yet occupied the land due to lack of infrastructure input or technical support The following table gives an indication of the progress of land reform since the inception of the first democratic government
Table 14 Land transfers and beneficiaries ‐ 1994 to 2009
Province Redistribution and tenure Restitution Total Hectares Beneficiaries Claims Hectares Beneficiaries Hectares Beneficiaries
Eastern Cape 675 353 357 25 633 16 201 94 834 215 201 448 191 240 834
Free State 799 350 291 7 721 2 662 47 615 40 893 397 906 48 614
Gauteng 286 34 513 7 328 13 159 9 476 70 179 43 989 77 507
KwaZulu Natal 690 547 414 67 761 14 752 642 447 433 168 1 189 861 500 929
Limpopo 291 91 235 7 403 3 382 513 024 220 227 604 259 227 630
Mpumalanga 444 322 839 13 950 2 694 399 876 225 877 722 715 239 827
Northern Cape 271 952 744 2 773 3 682 539 620 100 554 1 492 364 103 327
North West 300 268 566 40 539 3 709 373 642 172 963 642 208 213 502
Western Cape 223 122 304 12 750 15 546 3 769 118 165 126 073 130 915
Total 3 979 3 043 264 185 858 75 787 2 624 303 1 597 227 5 667 567 1 783 085
Source Greenberg 2010
Achievement of the 30 land reform target is being made difficult by land prices Under the willing buyer willing seller scheme the government will need R74 billion to be able to purchase enough land While resources may be available there are suggestions of lack of capacity The Department of Rural Development and Land Reform (DRDLR) was able to spend only 31 of its land reform 200910 budget in the first six months of the financial year Going forward this Department needs to identify what the real challenges are with the pace of land reform delivery so that they can be mitigated to meet the 2025 target A priority is the retention of skills skills transfer and skills development during the transfer of land as well as retention of national food production to avoid loss of production Support for new beneficiaries of land to ensure sustained productivity is derived from two main sources of funding ndash the Broadening Access to Agriculture Thrust (BADAT) and the Comprehensive Agricultural Support Programme (CASP) CASP is a conditional grant from the Department of Agriculture Forestry and Fisheries to provincial departments to support emerging farmer development Provincial farming budgets dedicated for farmer support in Mpumalanga the Free State Northern Cape and the Western Cape have risen significantly and those in KwaZulu Natal and Gauteng have witnessed a slight increase Eastern Cape and Limpopo agricultural budgets have been steady The North West is the only province where there has been a sharp decline in the share of the budget dedicated to farmer support24
24 Greenberg 2010
AgriSETA June 2010
Agriculture Sector Analysis 19
Reliance on imports
Overall the Agriculture sector contributes positively to the balance of payments ldquoSouth Africa remains food secure The value of our exports increased by 464 from R33 656 million in 200708 to R49 278 million in 200809 During the same period the estimated value of imports rose by 12 from R34 009 million to R38 401 million resulting in a positive trade balancerdquo25
South Africa depends largely on world markets for seed production and agrochemicals Regarding seed production there are only three community seed production schemes in Limpopo and Mpumalanga being piloted with state funding Ten top large companies including two South African companies and multinationals have rights to over two thirds of registered seed varieties in South Africa Despite the dominance of genetically modified and hybrid seed in some sub‐sectors like maize sunflower and sorghum open‐pollinated varieties have been resilient in South Africa enabling the possibility of alternative seed sources not dependent on technological processes26 In relation to agrochemicals deregulation and liberalisation in the fertiliser sector led to the shutdown of local production capacity and South Africa became an importer of fertiliser for the first time in 2000 There are three large players in the fertiliser sector Sasol Nitro Yara and Omnia South Africa imports an estimated 70 of fertilisers and pesticides Fertiliser prices rose by over 200 between 2006 and 2008 but dropped somewhat after that However this hike signified the volatility of the agrochemicals industry and South Africarsquos dependency on imports and the potential risk for emerging farmers and food production of this dependence on imports as the country cannot control the prices making inputs both difficult to budget for and in many cases unaffordable The price of agrochemicals is also particularly influenced by the prices of oil and the exchange rate The general understanding in relation to job creation is that a weaker Rand will improve exports and therefore enable job creation Of course the down side of this strategy is that imports become more expensive So what may be an advantage for those sub‐sectors who are expanding their export volumes those relying on imported agro chemicals will be under increased pressure
Water
Water is both an essential and scarce resource for the agriculture sector and is being threatened by climate changes Crop production relies heavily on water and yet access to water is not being addressed in a systematic way in the land reform processes Greenberg suggests that the relationship between land reform agricultural support and water resource provision is inadequate and a way to address this could be established by linking water provision to land transfer or investing in irrigation for both commercial and resource‐poor farmers However investing in irrigation in the context of water scarcity and climate change may not be the best option What could be needed is finding ways to maximise efficiency of the 60 of South African
25 Department of Agriculture Forestry and Fisheries Strategic Plan 201011 26 Greenberg 2010
AgriSETA June 2010
Agriculture Sector Analysis 20
water used for irrigation by for example using methods such as drip or micro‐irrigation which are expensive to set up but which reduce water wastage by 5‐1027 The Department of Water Affairs is responsible for managing water supply and has to give authorisation for agricultural projects and other developments The department needs to be seen as an important stakeholder in the agricultural sector
The labour market
South Africa recorded an unemployment rate of 243 in 2009 (narrow definition) If people who are no longer actively seeking work are considered the broad unemployment rate rose from 267 to 313 illustrated in the figure below As a direct consequence of the global economic downturn in 2008 870 000 formal jobs were lost in 200928 Others have quoted a figure of over 1 million
Figure 3 Official unemployment in South Africa 2003 ‐2009
Source National Treasury 2010
Annual employment loss followed sector growth patterns with agriculture mining manufacturing and trade facing the highest job losses as their sector growth contracted Unemployment is especially a major problem among lower skilled workers and younger people Youth employment in the 15 ‐24 year age group has fallen by 219 000 (136) and 483 of people in this age group are unemployed Employment of semi‐skilled and unskilled workers has contracted by 527 000 and male employment has gone down by 550 000 (71) while that of women has decreased by 320 000 (52) The number of discouraged workers ie those no longer actively seeking work has increased from 518 000 to 17 million29 Clearly the existence of a very large pool of largely unskilled unemployed workers has an impact on the farming sector It drives wages down and creates opportunities for casualisation and the expansion of labour contract agencies and brokers In addition there are significant numbers of foreign nationals mainly from Zimbabwe and Mozambique who are seeking work and often finding it on farms and in primary processing and packaging plants There are benefits to the
27 Greenberg 2010 28 National Treasury 2010 29 National Treasury 2010
AgriSETA June 2010
Agriculture Sector Analysis 21
sector with skilled and semi‐skilled workers coming into the labour market and being absorbed into the workforce and helping raise productivity levels However at the lower skilled end of the market the existence of this pool brings further casualisation and downward pressure on wages Tensions are likely to increase and further protests either in the form of xenophobic outbreaks or actions against farmers may well increase A view often expressed by farm employers is that current labour legislation makes dismissing workers difficult and so the availability of labour without entering into contracts of employment is an attractive way of avoiding the legislation and its obligations Organised Labour is seeking to restrict these opportunities through either regulating or eliminating labour brokers and efforts are being made to regulate the use of foreign labour However for the foreseeable future the trend is for formally employed people to be reduced in number In relation to the emergent sector there will also be a reluctance to enter employment contracts with workers The fact that many households are engaged in some form of largely unpaid agricultural work means that there is significant casual work dating back many years Helping change this situation into one where casual or unpaid jobs are transformed into formal jobs with regular wages will take time It is also likely that as some emergent farms become established they will act similarly to established farms and institute a form of casual labour rather than expanding a workforce for which they would have to take a level of responsibility From an AgriSETA perspective these labour market trends mean that whilst levy income can be directed at a relatively small labour pool one that is manageable in terms of planning and implementation the size of the informal casual and unemployed labour force in the sector ‐ for whom no levy is paid and who have no employer to plan for their skills needs ndash is very large and its needs almost unlimited Clearly the relationship with the National Skills Fund (NSF) becomes critical in respect of the entire non‐levy income sector Again the level of support available from non‐levy income sources will be an important variable in looking at future sector skills development scenarios
Consumer trends
South Africa currently produces enough food to meet the needs of its population However consumption of three main staples maize wheat and vegetables has been volatile since 1985 and remains below 1990 levels Consumption of maize and vegetables by South Africans is 17 and 32 less respectively than in 198530 The main reasons for this lie in the growing levels of poverty and the difficulties that families have in purchasing nutritious food Whilst government has increased the levels of social grants and increased the number of people receiving grants to around 13 million the incomes of poor families have been badly hit by a range of factors including job losses and rises in food prices The approximately 1 million people who lost their jobs in 20089 meant a loss of income for many millions of dependents Rises in food prices have also had a disproportionate impact on the poor Whilst food is available it is often not accessible to families on the income levels that they have to manage within The result is that less and less nutritious food is purchased which in turn impacts on the ability of farmers to sell their products locally 30 Greenberg 2010
AgriSETA June 2010
Agriculture Sector Analysis 22
Whilst there is no evidence that government will reduce its efforts in relation to poverty relief and social benefits including such programmes as school feeding schemes and food parcels during periods of drought the state of public finances may not enable to support the poverty that grips many rural areas If real income levels for the poor were to rise it could have a significant impact on the economy of the agricultural sector Equally an improvement in the rural economy with increased agricultural production and jobs would dramatically impact on the capacity of people to buy nutritious food Achieving a positive growth path in rural areas is a huge challenge for government and one that is key to governmentrsquos Medium Term Strategic Framework and Industrial Policy Action Plans
HIVAIDS
South Africa has a high prevalence of HIV and AIDS The HIV prevalence among people aged two and above was estimated at 109 in 2008
Table 15 Estimated HIV percentage prevalence by age group (2002 ndash 2008)
Age 2002 2005 2008 Change
Children (2‐14 years) 56 33 25 ‐31
Youth (15‐24 years) 93 103 87 ‐06
Adults (25 and older) 155 156 168 13
15‐49 year olds 156 1692 169 13
Total (ages 2 to 49) 114 108 109 ‐05 Source Avert 2009
The table above shows that HIV prevalence is highest amongst those aged 25 years and older Given youth labour market analyses which point to people from previously disadvantaged backgrounds mainly African males accessing formal employment for the first time at age 25 ‐27 this population can be held to represent people in employment Research31 has estimated that by 2020 the pandemic will have claimed at least 20 of employees in the agricultural sector Southern Africa
in
HIV and AIDS have significant ramifications in the agricultural sector for both commercial farming and subsistence farming The implications include
bull Decrease in cultivated land bull Focus on less labour intensive crop and animal production bull Decrease in womenrsquos agricultural productivity as they take on a more care giving role bull Loss of skills bull Increase in absenteeism from work bull Decrease in daily work outputproductivity because workers are weaker from infections
There are suggestions that the impact of the pandemic in South Africa demands sectoral intervention although this may be difficult in the agricultural commercial sector as
bull Seasonal workers who seem to be more vulnerable to infection because of their low socio‐economic status are not in one place long enough for care programs Further
31 Ingelozi Management Solutions 2008
AgriSETA June 2010
Agriculture Sector Analysis 23
farmers and employers may not feel responsible for seasonal workers in the same way they would invest in their permanent employees
bull There may be uncertainty around land reform which may put HIV intervention on farms on the back burner
bull There are no policies that enforce HIV education and care on farms in the same way that legislation like BEE does for ownership As a result HIV intervention may be left to goodwill and employers may feel it is more important to comply with issues that are monitored
Farm safety and security
South Africa has been plagued by unacceptably high levels of violent crime and murder for many years now Farms have experienced this and those living on farms feel and are extremely vulnerable The South African Chamber of Commerce and Industry (SACCI) has argued that
Using the nominal GDP figure for 2009 of R24 trillion a 322 percent contribution of agriculture to GDP and an estimate of 39982 farms (as at 2007) in South Africa the cost of a murderattack on a farm to the economy was R1932869 per annum
SACCI acknowledges that this estimate is flawed as it does not take into consideration the fact that farming units contribute differently to GDP and that not every attack or murder contributes to farm shut down or loss of productivity However if not addressed these attacks could lead to loss of farming sectors as farmers migrate to lsquosaferrsquo regions This will affect employment and GDP contribution of the sector The need for safety and security on farms may also shift farmersrsquo focus in skills development to include personnel who have skills in safety and security
Broad‐based Black Economic Empowerment
The aim of the AgriBEE Charter (gazetted in 2008) is to increase the involvement of black business in agriculture through ownership and control as executives and senior managers of new and existing agricultural businesses The extent to which AgriBEE is transforming the sector is not known as it is too early to tell but a recent survey conducted by ABC and the IDC showed that among the ABC respondents in 2007 46 of enterprises were busy constructing a BEE strategy and 46 claimed to be implementing a BEE strategy A survey of the dairy industry in the Western and Eastern Cape in 2008 showed that only 6 of firms had a BEE strategy in place It also seems from survey data that companies are focusing on the skills development and socio‐economic aspects of BEE rather than on ownership32 It would appear that although there have been some significant BEE purchases of viable farms and some employee empowerment projects including some quite high profile ones in the Cape Winelands the extent of ownership change had been limited One of the factors is the very high level of single person or family ownership in the agricultural sector BEE is more straight forward in the corporate world where shares can be exchanged For a family business it is a matter of selling off part or all of the land and the tendency is to sell off those areas of the farm that are expendable from a business sustainability perspective
32 Greenberg 2010
AgriSETA June 2010
Whilst there is discussion in government about the ending of the ldquowilling buyer willing sellerrdquo concept the Constitution itself provides for property rights and so although some pressure may be exerted through legislation and regulation the extent and speed of change may not be fast The mechanisms for encouraging the transfer of significant levels of ownership have not yet been created The focus of the SETA is therefore likely to be more the beneficiaries of land reform and emergent farmers though projects of a BEE nature can be targeted as they arise
Conclusions and scenarios It is useful when looking at possible scenarios to examine the key variables or uncertainties and to project how variations one way or the other will have an impact on the development and growth of the sector From the sector analysis and factors that are contributing to change in the sector there are some key factors that seem to emerge First appears to be the economy and related issues of the labour market and the challenges of labour absorption in an enclave economy These factors determine on the one hand whether there will be growth and development and on the other whether such improvements will result in improved employment opportunities and the creation of a virtuous cycle of development Second is the role of the state and the various government departments whose plans and work impact on the agricultural sector Related to this is land reform that is inevitably driven by the state and not the owners of land or the landless The view expressed by many engaged in agrarian reform is that the state must play a significant role It becomes clear that a successful agricultural enterprise requires a number of factors to be in place to be successful These include access to land (Department of Rural Development and Land Reform) agricultural support within a supportive agricultural framework (Department of Agriculture Forestry and Fisheries) access to consistent water supply (Department of Water Affairs) access to finance (Department of Trade and Industry various state agencies) conducive labour market regulation (Department of Labour) sound industrial policy (Department of Trade and Industry) economic planning and macro policy (Department of Economic Development National Treasury) and appropriate education training and skills development (Department of Higher Education and Training the Human Resources Development Council NSA and the SETA) There are other government departments as well as provincial and municipal structures that also play a role The following analyses show how the four variables
economic growth and development role of the government labour market changes and land reform)
impact positively or negatively on the growth of the sector and the demand for skills
Agriculture Sector Analysis 24
AgriSETA June 2010
Agriculture Sector Analysis 25
HHIIGGHH GGRROOWWTTHH SSCCEENNAARRIIOO
The economics of the sector Role of government
The economy in SA and globally continues to revive albeit slowly for the next few years
Roles and integration of national government departments are clarified Specific functions are agreed processes put in place and personnel appointed with the required skills
International trade agreements are still weighted infavour of US and EU but progress is being made and specific blockages are addressed in bilateral talks
The roles of Departments (DWA DAFF DRDLR DoL DTI DED DHET) are clarified with appropriate joint plans and coordinating structures
The rural economy gradually improves with the buying power of the poor increasing and more stable markets created for local produce
For each of the functions agreed in each of the related departments appropriate structures and systems are put in place and staff trained
Exports increase in key areas identified in IPAP 2 and the Rand exchange rate stabilises at a level not too much different than it is today
Specific capacity is put in place at local level to support implementation of land reform and rural development
There is a growing understanding of the concept of dualism and the need to intervene with labour absorption and development mechanisms
Land claims are all finally settled and ownership and tenure is resolved There is a serious drive to establish effective agricultural enterprises
An understanding is reached on the role of agencies and labour brokers and abuse is curbed
The willing buyer willing seller approach is resolved and enables viable land to become black owned
Some relaxation of labour market regulations are agreed that maintain some minimum standard of employment but assist absorption
Land transfer to black and emergent farmers is done in a manner that integrates then into the supply chains of the sector
Mechanisms are found to address skills needs in the context of casual and seasonal work patterns
Financing of land reform and transfer is done on the basis of agreed development plans including skills
Labour market reform Trajectory of land reform LLOOWW GGRROOWWTTHH SSCCEENNAARRIIOO
The economics of the sector Role of government departments The economy in SA and globally stagnates at current levels and the economy struggles to pick up after the temporary 2010 World Cup boost
A lack of purpose at government level means limited progress for another five years Land reform remains a commitment without a plan
International trade agreements are still weighted infavour of US and EU and protectionism increases as a result of the global recession
The roles of Departments (DWA DAFF DRDLR DoL DTI DED DHET) are unclear and there is no proper co‐ordination
SArsquos Gini coefficient continues to worsen with rural poverty increasing and local economies declining
There is a lack of effective structures systems and processes to implement policy across departments
Rand volatility causes problems for importers and exporters Well established markets are maintained but exports decrease
At local level the decline in the agricultural extension officer functions continues and limited practical support is available
Understanding of the rural economy is so diverse that stakeholders cannot agree the problem let alone the solution to low absorption levels
Land claims take too long and land reform processes leave potentially productive land poorly developed and managed
Casual labour and labour brokers remains an issue of dispute Confrontation results in bitterness and resentment
The impasse caused by a rigid interpretations of property clauses in the Constitution continues to stall achievement of the 30 black ownership target
Labour market regulation continues to be a contributing factor to reducing levels of employment
Black owned farms find it difficult to become part of supply chains and are unable to perform adequately
Unstable employment patterns in the sector make skills interventions difficult to manage and largely ineffective
Financing of land reform and land transfer continues to be wasted as it is not tied to the building of appropriate capacity
Labour market reform Trajectory of land reform
AgriSETA June 2010
These analyses can be translated into four potential growth and development scenarios for the agricultural sector which are based on the requirements for a strong development state Scenario 3 Weak government support
and sound economy
Econ
omic fa
ctors glob
ally n
ationa
lly and
locally
Scenario 1 Integrated government support and sound economy
The economic upturn triggered by the World Cup continues and globally things improve enabling an expansion of exports The government because of a lack of integrated policy planning and implementation provides limited support for sector development The gains go to the well established enterprise owners with few gains for emerging farmers and local communities
Government departments coordinate their efforts to achieve maximum impact There are favourable economic conditions that create opportunities for advance Within this positive environment the role of the AgriSETA becomes a central component of a comprehensive strategy for growth and skills interventions are targeted to achieve maximum effect Results in growth in sustainable enterprises and expanded employment opportunities
Government policy and support Government policy and support
Combination of disjointed government policy planning and a weak and increasingly marginalised rural economy Economic conditions result in unsustainable farming conditions and employment declines along with productivity Food shortages and the lack of development in rural areas leading to increasing social tensions A vicious cycle develops with the sector going into long term decline
Government departments coordinate their efforts to achieve maximum impact However economic conditions hamper progress Efforts by the AgriSETA are undermined by poor labour absorption and job insecurity Some significant successes are recorded including some NSF funded projects that result in sustainable enterprises A platform is laid for future improvements when the economic conditions improve
Scenario 4 Weak state and economy Scenario 2 Strong state but weak
economy
Agriculture Sector Analysis 26
AgriSETA June 2010
Agriculture Sector Analysis 27
SECTION 2 DEMAND FOR SKILLS
AgriSETA registered employers and employee coverage
In 2009 17 234 employers were registered with the AgriSETA comprising 15 394 small employers (less than 50 employees) 1 202 medium sized employers (50 ‐ 149 employees) and 638 large employers (more than 150 employees)
Considering that there are around 40000 commercial farms33 the 17 234 employers represent around 43 of commercial farms Notwithstanding changes in the sector as a result of land reform and sector shrinkage this is a sizable proportion and is held to be sufficiently representative for the purpose of skills development planning However this paints an incomplete picture It understates the representative nature of large enterprise registered with the SETA and overstates the representative nature of small registered enterprises 4 175 (242) of the enterprises are levy paying members Further only 1 673 (11) workplace skills plans (WSPs) were submitted
Table 16 Registered employers by size and sub‐sector Sub‐sector Description
Employers Small Medium Large
CoffeeTea Processing and marketing of coffee and tea including coconuts cocoa nuts olives dates etc
33 4 3
Fibre Grading ginning packing of wool and cotton raw material 1 676 16 18
Fruit Fruit packed in cartons fruit juice concentrate drummed and fruit juice in container ready for consumption
271 36 57
Fruit exporters and importers 6 0 1
Grain
Manufacture of grain mill products and starches 119 5 7Handling and storage of grain 67 7 23Wholesale amp retail trade in Agricultural machinery 213 9 4Sale and distribution of Agricultural raw materials and other farming inputs
182 9 3
Milling
Manufacture of flour and grain mill products including rice and vegetable milling grain mill residues
120 15 11
Manufacture of prepared animal feeds 110 19 0Manufacture of pet foods 42 9 0Manufacture of starches and starch products 7 1 1
Pest control
Pest Control 209 4 0
Poultry Poultry and egg production including the slaughtering dressing and packing of poultry
305 49 37
Primary
Growing of Cereals and other crops (not elsewhere classified) 902 160 34Growing of Vegetables Horticultural specialties nursery products
943 120 72
Growing of Vegetables Horticultural specialties (Including Ornamental Horticulture) and nursery products
11 5 0
Sugar plantation including sugar cane and sugar beet etc 9 4 2
33 SARS statistics 2007
AgriSETA June 2010
Agriculture Sector Analysis 28
Sub‐ Description Employers Growing of fruit nuts beverage and spice crops 1795 255 143Farming of cattle sheep goats horses asses mules and hinnies Dairy farming
2 252 59 18
Other animal farming production of animal products (NEC) 433 25 12Ostrich farming 5 0 0Game farming 16 0 0Growing of crops combined with farming of animals (Mixed farming)
2 920 256 109
Growing of coffee and tea including coconuts cocoa nuts olives dates etc
2 0 0
Agricultural and animal husbandry services except veterinary activities
438 22 9
Other animal farming (not elsewhere classified) 11 1 1Growing of trees as second crop by farmers 126 18 4Fishing operation of fish hatcheries and fish farm 913 10 6
Red meat
Production and animal products (not elsewhere classified) 6 0 0Slaughtering dressing and packing of livestock including poultry and small game for meat
317 40 17
Production sale amp marketing of Agricultural by products (eg bones hides)
61 2 0
Slaughtering dressing and packing of livestock including small game for meat and processing of ostrich products
2 1 0
Wholesale trade in Agricultural raw materials and livestock 193 7 10Transport of livestock as supporting activity 224 0 0Agricultural and livestock research 215 9 3
Seed Seed production and marketing 149 12 6
Sugar Manufacture of sugar including golden syrup and castor sugar
45 5 21
Tobacco Processing and dispatching of tobacco 46 8 6 TOTALS 15 394 1 202 638Source AgriSETA WSP data
The largest number of registered small and medium enterprises are found in the mixed farming sub‐sector while most large enterprises are in the growing of fruit nuts beverage and spice crops sub‐sector
Employee coverage in the AgriSETA
Collectively the 17 234 employers registered with AgriSETA employed a total of 239 076 employees This represents 39 of the agricultural labour force in 2009 The 1 673 employers who submitted WSPs in 2009 employed 97 898 employees representing 41 of the total number of people employed by registered employers While the number of registered employers submitting WSPs is small (11) they employ a sizeable number of employees and the percentage of employees provides a statistically significant sample The data for larger enterprises is statistically much more representative than that for small enterprises
AgriSETA June 2010
Table 17 Number of employees of registered employers by sub‐sector
Sub‐sector
Sub‐sector description Employees
CoffeeTea Processing and marketing of coffee and tea including coconuts cocoa nuts olives dates etc
483
Fibre Grading ginning and packing of wool and cotton raw material 6 539
Fruit Fruit packed in cartons fruit juice concentrate drummed and fruit juice in container ready for consumption
27 661
Fruit exporters and importers 212
Grain
Manufacture of grain mill products and starches 133Handling and storage of grain 18 303Wholesale amp retail trade in Agricultural machinery 795Sale and distribution of Agricultural raw materials and other farming inputs 2 898
Milling
Manufacture of flour and grain mill products including rice and vegetable milling grain mill residues
3 634
Manufacture of prepared animal feeds 731Manufacture of pet foods 160Manufacture of starches and starch products 105
Pest control
Pest Control 119
Poultry Poultry and egg production including the slaughtering dressing and packing of poultry
19 187
Primary
Growing of Cereals and other crops (not elsewhere classified) 10 104Growing of Vegetables Horticultural specialties and nursery products 37 799Growing of Vegetables Horticultural specialties (Including Ornamental Horticulture) and nursery products
195
Sugar plantation including sugar cane and sugar beet etc 220Growing of fruit nuts beverage and spice crops 47 043Farming of cattle sheep goats horses asses mules hinnies Dairy farming
3 382
Other animal farming production of animal products (NEC) 4 203Ostrich farming 0Game farming 0Growing of crops combined with farming of animals (Mixed farming) 28 722Growing of coffee amp tea including coconuts cocoa nuts olives dates etc 0Agricultural and animal husbandry services except veterinary activities 970Other animal farming (not elsewhere classified) 513Growing of trees as second crop by farmers 1 294Fishing operation of fish hatcheries and fish farm 1 589
Red meat
Production and animal products (not elsewhere classified) 0Slaughtering dressing and packing of livestock including poultry and small game for meat
5 128
Production sale amp marketing of Agricultural by products (eg bones hides) 116Slaughtering dressing and packing of livestock including small game for meat and processing of ostrich products
0
Wholesale trade in Agricultural raw materials and livestock 1 697Transport of livestock as supporting activity 0Agricultural and livestock research 534
Seed Seed production and marketing 2 127Sugar Manufacture of sugar including golden syrup and castor sugar 10 478Tobacco Processing and dispatching of tobacco 2 002 Total 239 076
Agriculture Sector Analysis 29
AgriSETA June 2010
Agriculture Sector Analysis 30
Source AgriSETA WSP data
According to the WSP analysis the sub‐sector for the growing of fruit nuts beverage and spice crops employed the largest number of people In six sub‐sectors there are employers who do not employ workers These are probably family based organisations where family members help in the business without drawing a salary These are in transport and livestock research slaughtering dressing and packing of livestock including poultry and small game for meat growing of coffee and tea including coconuts cocoa nuts olives dates etc ostrich farming and game farming
Table 18 Employee distribution by province Province Employees Percentage
Eastern Cape 18 844 192 Free State 1 946 20 Gauteng 2 788 28 KwaZulu‐Natal 5 416 55 Mpumalanga 8 062 82 North West 3 290 34 Northern Cape 5 436 56 Limpopo 1 730 18 Western Cape 50 386 515 Grand Total 97 898
Source AgriSETA WSP data
Of those submitting WSPs registered employers in the Western Cape employed the largest number of people while employers in Limpopo employed the least number of employees Free State has a small number of employees covered by WSPs submitted to the SETA whereas Eastern Cape with a relatively small number of registered farms has a very large number of employees on farms submitting WSPs Given this variance between provinces the use of WSP data for extrapolation purposes must be viewed cautiously
2009 WSP equity information was only provided for about a quarter of employees (25 637 or26)34 No information was available from the WSPs on non‐South Africans working on commercial farms
Table 19 Equity profile from 2009 WSP data African Coloured Indian White
Totals M F D M F D M F D M F D
8 040 5 785 38 5 097 5 228 24 22 25 0 811 556 11
580 417 03 493 505 02 468 532 00 589 403 08 13 863 10 349 47 1 378 25 637541 404 02 54 100
Total EquityTotal Male Total Female Total Disability
13 970 11 594 73 545 452 03
Source AgriSETA WSP data
Using currently available data it is not possible to provide disaggregated employment data by sub‐sector This will require a small change in the way that gender race and disability data is
34 Some employers did not complete race and gender information when giving their employment profiles
AgriSETA June 2010
codified during WSP data‐capturing including allocation by sub‐sector What can be stated is that employment of males is more dominant than that of women and more Africans are employed in the sector than other groups Employment of people with disabilities is below 1
21 Skills demand
The National Education and Training Strategy for Agriculture (AET Strategy)
The AET Strategy developed by the Department of Agriculture Fisheries and Forestry (in consultation with various key stakeholders in the agricultural sector) highlights priority skills needs and constraints within the sector and categorises needs within the following 5 broad areas
1 Agricultural production ndash requesting that the past focus on a narrow band of commodities (relevant mainly to the commercial sector) and related research be expanded to address the needs of small‐scale and subsistence farmers (eg more focus on mixed farming and rural livelihood sustainability skills)
2 Agricultural engineering ndash with specific focus to be placed on technologies suitable for small‐scale farmers (eg relevant and post‐harvesting techniques related to processing and storage of produce) ndash to address this need the scarcity of agricultural engineers requires attention
3 Agricultural economics ndash a critical need was identified for general agricultural economic skills (ranging spectrum of farm planning farm management enterprise management marketing finance etc) ndash with the need to training both farmers and extension officers in such fields
4 Agricultural development ndash a specific need was identified to develop agricultural extensionists in supporting especially emerging and small‐scale farmers over the full spectrum (a need exists for both new curriculum in the training of new extensionists and the re‐training and upgrading of existing officers)
5 Veterinarians ndash the need to develop state veterinarians in order for the state to perform its role and function (particularly in its preventative monitoring and regulatory role and function)
AGRISETA sector skills planning demand data (2008‐2009)
The following section reflects initial research on skills demand in the Agricultural sector arising from the sector analysis (section 1) previous AGRISETA skills demand research for Sector Skills Planning during 2005‐2009 and analysis of WSP data from 2009 With the introduction of the Organising Framework of Occupations and agreement on definitions for scarce and critical skills in 200506 the AGRISETA undertook an extensive research and consultation processes to determine skills development priorities for the sector The research methodology employed was based on the a four dimensional topology for establishing and evaluating skills needs illustrated in the figure below
Agriculture Sector Analysis 31
AgriSETA June 2010
Agriculture Sector Analysis 32
The identification and prioritisation of skills needs was also undertaken from a key stakeholder and beneficiary perspective Consideration was given to needs of the following groups
bull The unemployed ndash helping them gain andor regain entry to the labour market bull The economically inactive ndash helping them to become economically active bull School leavers ndash helping them gain access to further education and training opportunities
and thus facilitating their entry to the job market bull Entrants to the job market ndash facilitating employment and integration into the work culture
and work ethic (improving the employability of an individual) bull Those currently employed in the sector ndash increasing their competency and opportunities
for advancement creating a career path and offering continued job security enhancement of value adding to the sector improving their prospects for better employment opportunities
bull Organisations and enterprises within the sector ndash making sure that skills development and knowledge creation occurs in such a way as to improve the sectorrsquos viability and allowing companiesenterprises to become more sustainable and profitable along the way improving productivity competitiveness and innovation within organisations
In organising and reporting the identified priority skills development needs (200809) the following structuring approach was followed
Tier 1 The four categories of needs as per the Topology presented above were used for the identification evaluation and grouping of needs
Pay conditions
Image
RECRUITMENT DIFFICULTY
SKILLSGAP
SKILLSSHORTAGE
LABOURSHORTAGE
Firms experience difficulty recruiting This does not necessary imply a skills shortage ndash may indicate a poor image remuneration etc
Those currently in work do not have the requisite skills set to carry out their job to an optimum standard
Required skills are in short supply when compared with the demand across the whole labour market
Regardless of skills levels a situation exists where there is simply not enough supply of labour to meet demand
Pay conditions
Image
RECRUITMENT DIFFICULTY
SKILLSGAP
SKILLSSHORTAGE
LABOURSHORTAGE
Firms experience difficulty recruiting This does not necessary imply a skills shortage ndash may indicate a poor image remuneration etc
Those currently in work do not have the requisite skills set to carry out their job to an optimum standard
Required skills are in short supply when compared with the demand across the whole labour market
Regardless of skills levels a situation exists where there is simply not enough supply of labour to meet demand
Figure 4 Topology for identifying skills development priorities
Source AGRISETA SSP Annual Update August 2009
AgriSETA June 2010
Tier 2 Within each of the first tier groupings needs were further broken down and organised per target group At this second level needs were grouped by
o General skills development needs (cross‐cutting over different target groups) o Needs experienced by small scale farmers (this group included subsistence
farmers new emerging land reform beneficiaries and small‐scale AgriBEE farmers) o Needs within the commercial agricultural sector (per sub‐sector groupings where
specific needs for such were identified ndash both on‐farm needs and within the secondary sub‐sector or related agri‐businesses)
o Needs of the Department of Agriculture Fisheries and Forestry (DAFF) To further guide and direct the identification and selection of scarce and critical skills the following factors or criteria that could reflect the importance (impact and effect) of a skills shortages were developed as an identification framework
1 Basic Skills Development Promoting basic literacy and numeracy and raising the base level of education for the sector improving the work and livelihood of existing workers
2 Employability Making the employee more employable by improving the fit between their skills and the sector needs
3 Enterprise Viability Improving the capability and feasibility of the enterprise by increasing its effectiveness of or possibilities for profit generation etc
4 Enterprise Sustainability Allow enterprises to survive and grow over an extended period of time without compromising the value of renewable resources thereby creating long‐term meaningful employment for larger numbers of people
5 Sector Growth Enabling the sector to develop or pursue new opportunities or improve the effectiveness of current operations
6 Sector Competitiveness Enabling the sector to compete more effectively in the international arena improving market intelligence and interpretation productivity cost efficiency etc
7 Human Resource Development Capacity Improving the access to quality provision of training to the agri sector
Based on this research and consultation framework the following skills development needs and priorities were identified
Agriculture Sector Analysis 33
AgriSETA June 2010
GENERAL NEEDS SMALL‐SCALE FARMER
NEEDS COMMERCIAL SECTOR
NEEDS DAFF NEEDS
RECRUITMENT RELATED SKILLS NEEDS Primary agriculture is the entry point into the world of work for large numbers of people in rural areas However the sector has negative connotations amongst sections of the youth and in parts of the country and is viewed as a last resort for some in the search for employment) The effect is that despite an unemployment rate of approximately 26 (now over 30) farmers find it difficult to recruit workers to meet seasonal demands This has resulted in the government approving the contracting of foreign labour to meet such temporary needs (workers are recruited mainly from Zimbabwe and Mozambique)
Labour in this farming sector is provided primarily by family members and no real recruitment constraints can be identified
The agricultural sector still manages to attract technical and management skills as it is perceived to include a better lifestyle and there is a strong tradition of agriculture in SA Increasing crime related security risks associated with farming may have a negative impact
The Department has identified a number of occupations in which they are experiencing long‐term vacancies Some of these result from a general shortage of such skills in SA while others arise from the inability of the public sector to compete with the private sector (less favourable employment image working conditions and equity considerations) Priority vacancies include Veterinarians Agricultural
Engineers Plant Health
Specialists Agricultural
Statisticians Plant Health Pest Risk
Analysts ICT Specialists Agricultural
Economists Agricultural Food and
Quarantine Technicians
Agro‐meteorologists Pasture Scientists Plant Production
Specialists Specialised Food
Analysts SKILLS GAPS RELATED NEEDS
bull Low literacy and numeracy levels ndash both amongst workers within the sector at large and at ownermanager level in many of the small‐scale farming
bull Farm management
Farm Management (Mainly owners managers) bull Farm management amp
entrepreneurship bull Resource
management and record keeping
bull Financial planning
A critical constraint is the poor educational levels of a large proportion of the labour force in the sector demanding a considerable effort and investment in ABET and other life skills
A particularly big need exists for skills upgrading amongst Extension Officers ndash particularly with regard to redress the historical neglect of small‐scale farmers and resource strapped farmers
Agriculture Sector Analysis 34
AgriSETA June 2010
Agriculture Sector Analysis 35
GENERAL NEEDS SMALL‐SCALE FARMER
NEEDS COMMERCIAL SECTOR
NEEDS DAFF NEEDS
skills (and general management skills in other agricultural businesses) coupled with a business orientation and entrepreneurship skills
bull A general need to increase compliance with environmental occupational health and safety animal welfare produce safety and hygiene standards regulations and requirements (local and international standards)
and management bull Project management bull Business plan
development Marketing and processing bull Processing and
packaging bull Transport
management bull Marketing produce
including branding bull Planning for
marketing bull Knowledge of
markets Technical knowledge and skills bull Production
management (related to specific enterprise)
bull Demonstration of production techniques
bull Natural resources management
Mechanical knowledge bull Farm maintenance bull Repairs of machinery
and equipment bull Electrical
maintenance and installation
programmes Need for improved management skills and relevant technological knowledge for increasing productivity levels and improved production methods Rising importance for environmentally responsible production and processing management systems Rising competitive and international markets increases need for business and marketing abilities among owners and managers Increasing requirements for compliance with environmental health and safety and international trade standards Information technology although not a priority is increasing in importance Business management ability is becoming increasingly important as more farmers are making decisions about restructuring their businesses diversification and developing supplementary sources of income
Critically improved farm management and business skills within an agricultural context to support the majority of BEE and emerging farmers Skills upgrading requirements for existing Extension Officers include bull Agricultural
economics bull Agricultural
management bull Business and
financial management
bull Technical and production related skills including o Animal husbandryo Poultry o Crop production o Horticulture
SKILLS SHORTAGES Generally SA has a shortage of entrepreneurs and people who have the business acumen drive motivation and
The profile of these farmers reflects a large contingent of older and less educated people who are generally less flexible tend to stick to
The commercial agri sector will increasingly have to compete in the global market and the ever increasing need to increase productivity to
DAFF us experiencing problems are especially sourcing people in specialised science related fields (learning fields experiencing few
AgriSETA June 2010
Agriculture Sector Analysis 36
GENERAL NEEDS SMALL‐SCALE FARMER
NEEDS COMMERCIAL SECTOR
NEEDS DAFF NEEDS
perseverance to become a successful farmer Given the high risks involved in the agricultural sector (natural elements outside onersquos control) the agri sector does not compete successfully for this ldquoscarce resourcerdquo Moreover as with other professional and skilled occupations there is a tendency for younger qualified people to move to urban areas
known practices and are less likely to experiment with new technology Within this target group candidates with good entrepreneurial ability are scarce There is a perceived shortage of Agricultural Extensionists and advisors to assist this target group However a large pool of young unemployed graduates exists who could assist such emerging farmers if they were mobilised and made accessible to farmers Similarly the potential pool of retired commercial farmers who could serve as mentors to this target group
remain profitable and viable it can be stated that many of the existing farmers and managers owners lack business management and entrepreneurial orientation Equity policy and the need to become BEE compliant requires that commercial enterprises appoint and develop black owners directors managers Changing local and global consumer preferences require farmers to change traditional farming methods and practices Skills and knowledge requirements include bull Global food and
international quality standards
bull Product traceability requirements
bull Organic produce and products
Specific occupations identified as being in short supply are
bull Production Managers (food processing)
bull Product specialisation to international specifications (research skills)
bull Forklift drivers heavy vehicletruck drivers and mobile plant operators
bull Experienced and competent artisans (millwrights electricians fitters
enrolments andor pass rates at HET institutions with the result that too few qualified persons come onto the labour market) Examples of such skills shortages identified by the Department include Agricultural Engineers bull Plant Health
Specialists (Nematology Entomology Plant Pathology)
bull Statisticians (specialised agricultural knowledge)
bull Plant Health Pest Risk Analysts
bull Agricultural Economists (production and resource economists)
bull Agricultural Food and Quarantine Technicians
bull Agro‐meteorologists Early warning Specialists
bull Pasture Scientists bull Plant Production
Specialists (eg ornamental crops hydroponics)
bull Specialised Food Analysts (pesticide residue analysts processed food and dairy analysts wine and spirit analysts)
AgriSETA June 2010
Agriculture Sector Analysis 37
GENERAL NEEDS SMALL‐SCALE FARMER
NEEDS COMMERCIAL SECTOR
NEEDS DAFF NEEDS
and turners bull Agricultural
Equipment Technicians
bull Pest and weed controllers
bull Horticultural specialists
LABOUR SHORTAGES AND RELATED SKILLS NEEDS Given an employment rate of some 26 (2009 currently estimated at over 30expanded definition) per definition there cannot be a labour shortage It is however difficult for people who have never worked before to integrate into the agricultural sector workforce Coupled with an aging workforce (30‐60 being over 40) means that most agri enterprises will within the next 5‐10 years be looking at replacing a large proportion of their workforce There could be an insufficient pool of people willing and able to participate The impact of HIVAIDS is also not always factored in to understanding the diminishing pool of resources available Labour shortages have been reported within selected geographical areas and in particular occupations Examples include cane cutters in the sugar industry chicken catchers in the poultry industry pickers in the fruit industry and animal handlers in feedlots as well as dairy parlour workers It is however believed that these shortages may reflect a recruitment problem as a result of the very harsh working conditions and the relatively poor remuneration (which makes these occupations unpopular) At present such ldquoshortagesrdquo are addressed through contracting labour from neighbouring countries
AgriSETA WSP analyses
Skills demand in the commercial agricultural sector
Information for demand for skills from WSP data is available for 1 673 employers who submitted their WSPs for the 200910 period The table below shows data on sub‐sector WSP submission relative to size of the sub‐sector as well as subsector data from all registered organisations and those who submitted WSPs Data for registered employers shows that there were 239 076 employees employed by the 17 234 registered organisations As previously stated 97 898 employees were employed by the organisations submitting WSPs This constitutes 41 of employees employed by registered organisations
Table 20 Employment and sub‐sector data drawn from WSP analyses
Sub‐sector
All Re
gistered
Employers
Small employers (0‐49)
Med
ium and
large
employers (50+)
Total W
SPs received
Total W
SPs received
as of
all registered em
ployers
WSP
received med
ium and
large orgs
WSPs received
as of
med
ium amp large em
ployers
WSPs received
small
employers
WSPs received
as of small
enterprises
EmployeesPer
Profile
CoffeeTea 40 33 7 9 23 5 71 4 12 483 Fibre 1 710 1 676 34 34 2 22 65 12 07 6 539
AgriSETA June 2010
Agriculture Sector Analysis 38
Sub‐sector
All Re
gistered
Employers
Small employers (0‐49)
Med
ium and
large
employers (50+)
Total W
SPs received
Total W
SPs received
as of
all registered em
ployers
WSP
received med
ium and
large orgs
WSPs received
as of
med
ium amp large em
ployers
WSPs received
small
employers
WSPs received
as of small
enterprises
EmployeesPer
Profile
Fruit 371 277 94 162 44 76 81 86 31 27 873 Grain 648 581 67 77 12 48 72 29 5 22 129 Milling 335 279 56 61 18 35 63 26 9 4 630 Pest Control 213 209 4 8 4 2 50 6 3 119 Poultry 391 305 86 66 17 46 53 20 7 19 187 Primary 12 121 10 776 1 345 1144 9 513 38 631 6 136 034 Red meat 1107 1 018 89 70 6 45 51 25 2 7 475 Seed 167 149 18 24 14 13 72 11 7 2 127 Sugar 71 45 26 13 18 10 38 3 7 10 478 Tobacco 60 46 14 5 8 3 21 2 4 2 002
Totals 17 234 15 394 1 840 1 673 10 818 44 855 16 239 076
Source 1 AgriSETA WSP 2009 data
Only 10 of all registered employers submitted WSPs for the 200910 period Of these 49 were medium and large sized employers and 51 small However only 16 small employers submitted their WSPs relative to the number of registered small employers and 44 medium and large employers submitted WSPs relative to the number of registered medium and large employers As such skills demand statistics provides more representative data on the requirements of medium and large employers Data for skills demand in the commercial agricultural sector is based on data for permanent employees as well as casual and seasonal employees
Skills demand forecasting by AgriSETA
Forecasting for skills demand the AgriSETA has estimated that the demand for skilled employees at different levels in the next few years is 510 686 This is based on WSP data analyses over the last 5 years and projected demand for the formal commercial agricultural sector and factoring in the demand that at maximum would result from completion of the land restitution programme in South Africa The table below reflects the skills that are on demand as well as the estimates for demand over the next five years by major occupational category35
35 AgriSETA 2010
AgriSETA June 2010
Table 21 Demand for skills by occupational category
Major Occupation (OFO)Estimated Demand
Group Title1 Managers (commercial and small emerging farmers) 264 3702 Professionals 4 1413 Technicians and Trade workers 8 9255 Clerical and administrative workers 8006 Sales workers 4007 Machinery operators and drivers 5 8008 Elementary workers 226 250
Total 510 686Source AgriSETA WSP data and SSP demand forecasts
Research needs going forward
As has been set out in the sector analysis and the scenarios derived from that analysis the sector is faced by both significant and profound change and also great uncertainty It therefore follows that the task of focussing limited resources (basically levy income in the formal sector and NSF funds for the emergent farming sector) is difficult Whilst the general thrust of training remains broadly as described in the 2006‐10 SSP Updates some considerable work is required to achieve targeted effective interventions during the 2011‐2016 period The following research questions will need to be addressed in preparing the next SSP
bull In relation to the managers and owner‐managers of commercial farms and enterprises what skills are needed to enable them to help bring about the more optimistic scenario and manage the risks associated with the less optimistic ones
bull In terms of professional and technical competencies do the current education and training institutions coupled with the learning programmes available through the AgriSETA (learnerships skills programmes and the like) meet the needs of the sector
bull In the emerging agricultural sector do the current programmes funded by sources external to the AgriSETA (eg NSF) meet all the identified needs What gaps are there and how should they be addressed
bull In relation to governmentrsquos growth strategy and industrial action plans what skills are required for developing the aquaculture sub‐sector What programmes are available How can the SETA support the skills needs for this sub‐sector
bull Given the increasing levels of casual and contract labour how can skills be developed to meet the needs of the formal commercial sector and the emerging enterprise sector
bull How can the demand in each of the priority areas be quantified and agreement be reached on numbers of people to be trained
Agriculture Sector Analysis 39
AgriSETA June 2010
SECTION 3 Skills Gaps and scarce skills
Scarce skills at the DAFF
The level of scarce skills at DAFF can be determined by the vacancy rate While the average vacancy rate in the department as at 31 March 2009 was 17 there were some posts that had very high vacancy rates as reflected in the table below Indicating the possibility that the Department is experiencing difficulties in finding suitable candidates in the South African labour market to fill these posts
Table 22 Scarce skill occupations and vacancy rates (DAFF March 2009) Critical occupations Number of posts Posts filled Vacancy rate ()
Agricultural animal oceanography forestry and other sciences
167 119 287
Engineering sciences related 2 1 50Engineers and related professions 13 6 538Farming forestry advisors and farm managers 11 4 636Finance and economics related 73 53 274Horticulturists foresters agricultural and forestry technicians
350 221 369
Legal related 6 4 333Mechanical engineering technicians 3 2 333Risk management and security services 6 4 333Social sciences related 1 0 100Veterinarians 34 24 294
Source DAFF Annual Report 20082009
Skills are also scarce at senior management level The department also reports on difficulties it has filling senior management services vacancies with some of them staying vacant for up to twelve months because no suitable candidates can be found The department would then resort to re‐advertisement and head hunting This was the case with 22 of 18 SMS posts in March 2009
Scarce skills in the commercial sector
The following occupations have previously been projected as scarce (extremely hard to fill vacancies) by AgriSETA in the commercial agricultural sector over the next five years
Table 23 Scarce and critical skills in the commercial agricultural sector
Occupation Code
Group Occupation Critical Skills Intervention Comments
139903 Managers Laboratory Manager
Technology AI nutrition
HET
221101 Professionals Accountant (General)
General HET
221102 Professionals Management Accountant
Farm financial management
HET Focus on support advice to farmers new enterprises
222101 Professionals Commodities Trader
Export administration supply chain
FET Learnership Skills
Agriculture Sector Analysis 40
AgriSETA June 2010
Agriculture Sector Analysis 41
Occupation Code
Group Occupation Critical Skills Intervention Comments
management Programme
224301 Professionals Economist Agricultural HET
Mainly for Department of Agriculture and para statals commodity organisations
233101 Professionals Chemical Engineer
Chemical processes in food production
HET Industries such as sugar processing
233301 Professionals Electrical Engineer
Installation and maintenance
HET Processing industry
233401 Professionals Electronics Engineer
Computerised production prosesses
HET Processing industry
233501 Professionals Industrial Engineer
Productivity and efficiency
HET Processing industry
233904 Professionals
Instrument Engineer (Defence Force)
Installation and maintenance
HET
Not for defence ‐ sugar industry
233502 Professionals Mechanical Engineer
FETHET Equity reasons
233902 Professionals Agricultural Engineer
Farm layout and infrastructure
HET Mainly in Government
311101 Technicians and trades workers
Agricultural Technician
Installation and maintenance
FETHET
234102 Professionals Agricultural Scientist
Agri research HETFET Especially in horticulture
234201 Professionals Chemist HET Processing industry
234202 Professionals Food Technologist
Food safety HACCP
FETHET Across sector
234701 Professionals Veterinarian HET Mainly in Government
311101 Technicians and trades workers
Agricultural Technician
Farm infrastructure
FET Mainly needed in government
311401 Technicians and trades workers
Chemistry Technician
FETHET EE reasons
312907 Technicians and trades workers
Chemical Engineering Technician
FET Learnership
Mainly EE reasons
312402 Technicians and trades workers
Electronic Engineering Technician
Weak stream production infra
FETHET Mainly tobacco industry
233904 Professionals
Instrument Engineer (Defence Force)
Instrument technician
FET
Occupation needed Instrument Technician (not defence force) Mainly sugar processing sector
321202 Technicians and trades workers
Diesel Motor Mechanic
FET Learnership
To include tractor mechanic
321204 Technicians and trades workers
Small Engine Mechanic
Agricultural equipment
FET Learnership
Throughout sector
AgriSETA June 2010
Agriculture Sector Analysis 42
Occupation Code
Group Occupation Critical Skills Intervention Comments
322301 Technicians and trades workers
Metal Fabricator
Artisan FET Learnership
322303 Technicians and trades workers
Welder Welder (First Class)
Artisan FET Learnership
323203 Technicians and trades workers
Fitter‐Welder Artisan FET Learnership
Mainly sugar ndash multi‐skilled
323202 Technicians and trades workers
Fitter And Turner
Artisan FET Learnership
Tobacco and sugar
323501 Technicians and trades workers
Millwright Artisan FET Learnership
Wide‐spread need
341101 Technicians and trades workers
Electrician (General)
Artisan FET Learnership
Wide‐spread need
342101 Technicians and trades workers
Air‐Conditioning And Refrigeration Mechanic
Artisan FET Learnership
Sugar pack houses cold chain
Source AgriSETA Sector Skills Plans
Supply of skills
South Africarsquos agriculture skills are produced in high schools agricultural colleges FET colleges and Higher Education institutions In high school a large cohort of learners take Agricultural Science as a subject In 2003 there were 42 Agricultural High Schools offering Agricultural Science as a subject These students and those in high schools taking the subject could progress to taking agriculture as a focus area for further education In 2004 there were 10 FET colleges offering vocationally directed agricultural programmes These FET colleges offered complete qualifications and short courses Eleven Colleges of Agriculture can offer qualifications up to degree level and 19 universities offer qualifications in Agriculture ranging from agricultural economics animal and plant sciences and horticulture among others at under and post graduate levels (Department of Agriculture 2006) While long term planning of skilling of new entrants in the sector can be done through close consultation between the sector agricultural schools and colleges FET colleges and HET institutions so that they teach relevant skills there are other avenues for training for those who are already employed in the sector for example skills programmes and learnerships There are 15 registered qualifications for the primary agriculture sub sectors Currently AgriSETA has 94 registered learnerships that can address the skills needs of the identified scarce skills These are captured in Appendix 2 AgriSETA has approved accredited a number of training providers across the country to deliver the theoretical and practical components of these learnerships These include agricultural colleges FET colleges and private providers Currently the AgriSETA has 246 registered and approved providers distributed nationally as follows
AgriSETA June 2010
Table 29 AgriSETA approved training providers (2010) Province Number of providers
Gauteng 72
(29)
KwaZulu Natal 20
(8)
Limpopo 35
(14)
North West 30
(12)
Northern Cape 3
(1)
Free State 15
(6)
Mpumalanga 14
(6)
Western Cape 26
(11)
Eastern Cape 31
(13) Total 246
The providers are small to large organisations In primary agriculture small providers appear to offer the most training in rural areas and community projects (AgriSETA 2010) Most of the operating providers will be in FET colleges and agricultural colleges The AgriSETA is unable to meet the total demands for skills across the duality of their sector There seems to be fairness in the approval of training for both permanent and casual and seasonal workers In 200809 the AgriSETA approved 559 learnerships as follows
Table 30 AgriSETA learnerships approved for grant purposes (2008‐2009)
Source AgriSETA learnership data analysis
Agriculture Sector Analysis 43
AgriSETA June 2010
Agriculture Sector Analysis 44
Provision of skills programmes in the same year attracted grants for 2 706 employees
Table 31 Participation by learners in skills programmes in the AgriSETA (200809)
Source AgriSETA Skills programmes data analysis
AgriSETA June 2010
APPENDIX 1 Skills demand in the Department of Agriculture Forestry amp Fisheries (200809)
Source DAFF Annual Report 2008‐20009
Agriculture Sector Analysis 45
AgriSETA June 2010
Agriculture Sector Analysis 46
Appendix 2 AgriSETA registered learnerships Registered Learnership NQF Level SAQA Registration NoLearnership in Agri Sales and Service 4 22 Q 220001 20 178 4Learnership Agricultural Machinery Technician 2 22 Q 220007 20 160 2Learnership in Specialist Agricultural Machinery Technician 5 22 Q 220009 21 258 5Agri Trade Processes 2 22 Q 220013 30 125 2FETC Meat Examination Applying Basic Business Principles 4 30 Q 3000 2823 164 4Further Education and Training Certificate Seed Marketing Execute Seed Trials 4 22 Q 220025 21 126 4Further Education and Training Certificate Seed Research and Development Certify as Seed Unit 4 22 Q 220027 21 121 4FETC Seed Research and Development Conduct a Field Inspection of a Seed Unit 4 22 Q 220028 20 120 4Seed Research and Development Operations Operate in a Team 3 22 Q 220020 22 121 3Seed Research and Development Operations Apply Basic Business Principles 3 22 Q 220021 22 121 3National Certificate Seed Processing and Packaging Operate in a Team 3 22 Q 220026 21 123 3Sugar Industry Technical Maintenance worker 2 22 Q 220011 39 128 2National Certificate Sugar Manufacturing and Refining Technical Maintenance 3 30 Q300003 23 146 3Further Education and Training Certificate Manufacturing Technical MaintenanceProduce Components by Performing Engineering Turning Operations
4 30 Q 3000 1321 173 4
FETC Manufacturing Technical Maintenance Produce Components by Performing Milling Operations 4 30 Q 3000 1521 173 4 FETC Manufacturing Technical Maintenance Develop and Fabricate from Complex Drawing 4 30 Q 3000 1420 173 4National Certificate in Sugar Technology 5 22 Q 220036 22 140 5Further Education and Training Certificate Sugar Processing 4 22 Q 220035 31 144 4National Certificate in Sugar Technology Processing Sugar Refining 2 22 Q 220037 28 124 2National Certificate in Sugar Technology Processing Juice Preparation 2 22 Q 220038 28 124 2National Certificate in Sugar Technology Processing Crystallisation 2 22 Q 220039 27 122 2National Certificate in Sugar Technology Processing Laboratory Practice 2 22 Q 220040 25 124 2National Certificate in Sugar Technology Processing Extraction 2 22 Q 220041 28 122 2NC Rooibos Production Applying Basic Business Principles 2 30 Q 3000 2427 130 2 NC Rooibos Processing Applying Basic Business Principles 2 30 Q 3000 2224 123 2 National Certificate Cigarette Production 3 22 Q 220046 23 121 3
AgriSETA June 2010
REFERENCES AgriSETA 2010 AgriSETA 20082009 Annual report Pretoria AgriSETA Agricultural Research Council httpwwwarcagriczahomeasppid=272 Avert South African HIV and AIDS statistics Available on httpwwwavertorgsafricastatshtm Centre for Development Enterprise 2008 Land reform in South Africa Getting back on track CDE Research No 16 DAFF 2010 Quarterly economic review of the agriculture sector Pretoria DAFF DAFF 2009 Annual report 20082009 Pretoria DAFF Department of Agriculture 2008 Strategic plan 2008 Pretoria Department of Agriculture DTI An introduction to the South African economy Available on httpwwwthedtigovzapublicationsagroprocessinghtm Eastern Cape Provincial Government Eastern Cape Provincial Growth and Development Strategy 2004 ndash 2014 Economic Commission for Africa 2009 Developing African agriculture through regional value chains Addis Ababa Economic Commission for Africa Economic Report Free State Province 2005 Provincial Growth and Development Strategy 2005 ndash 2014 GCIS 2010 SA Yearbook 200910rdquo Agriculture forestry and fisheries Pretoria GCIS Greenberg S 2010 Status report on land and agricultural policy in South Africa 2010 Institute for Poverty Land and Agrarian Studies School of Government University of the Western Cape Research report Ingelozi Management Solutions 2008 HIVAIDS in the South African agricultural sector Towards the development of a long term intervention Research report KwaZulu Natal Provincial Government 2006 KwaZulu Natal Provincial Growth and Development Strategy Limpopo Provincial Government Growth and Development Strategy 2004 ndash 2014 Mhone G (2000) Enclavity and Constrained Labour Absorbtive Capacity in Southern African Countries Geneva International Labour Office Moyo S The Agrarian question and the developmental state in South Africa In Edigheji O et al 2010 Constructing a democratic developmental state in South Africa HSRC PRESS
Agriculture Sector Analysis 47
AgriSETA
Agriculture Sector Analysis
National Treasury Republic of South Africa 2010 National Budget 2010 ndash National Budget Review 2010 Pretoria National Treasury Northern Cape Provincial Government Agriculture and agro‐processing sector strategy North West Provincial Government North West Provincial Growth and Development Strategy 2004 ndash 2014 Province of the Western Cape 2008 The Ikapa growth and development strategy White Paper SABCOHA SA Business Coalition on HIV and AIDS wwwsabcohaorg SACAU httpwwwsacauorghostingsacauSacauWebnsfHomehtmOpenForm South African Government 2010 20102011 ndash 20122013 Industrial Policy Action Plan Republic of South Africa Statistics South Africa 2005 Census of commercial agriculture 2002 Report No 110201 Pretoria Statistics South Africa Statistics South Africa 2009 Census of commercial agriculture 2007 Statistical release P1101 Pretoria Statistics South Africa Statistics South Africa 2010 General household survey 2009 Statistical release P0318 Pretoria Statistics South Africa Statistics South Africa 2010 Gross domestic product first quarter 2010 Statistical release P0441 Pretoria Statistics South Africa Statistics South Africa 2010 Quarterly labour force survey Quarter 1 2010 Statistical release P0211 Pretoria Statistics South Africa Vink N amp van Rooyen J 2009 The economic performance of agriculture in South Africa since 1994 The implications for food security Pretoria DBSA development planning division working paper series No 17 Webster E 2004 the Dual Economy from a book by Van Holdt K and Webster E Work restructuring and the Crisis of Social reproduction and 10 years of restructuring post apartheid workplaces University of Natal Press Workinfocom httpwwwworkinfocomfreesub_for_legresdatalraempassoc3htm Xingwana L 2008 Challenges and Opportunities for Land and Agrarian Reform towards 2025 Speech delivered at the Agri‐Consultation Protea Ranch Hotel Polokwane 30 July 2008
- Table of contents
- SECTION 1 THE AGRICULTURAL LANDSCAPE
- 11 Size and shape of the Agricultural sector
-
- Overview
- Distribution of agricultural production
- The structure of the agriculture sector in South Africa
- Categories of farming enterprises
- Employment trends
- Employment categories and remuneration
- Stakeholders in the Agricultural sector
-
- National government departments
- Sector representatives
-
- 12 Factors impacting development in the Agriculture sector
-
- Future sector economic growth and development
-
- South African sector growth plans (IPAP2)
- International Trade
- Global recession and rise in food prices
-
- Land reform
- Reliance on imports
- Water
- The labour market
- Consumer trends
- HIVAIDS
- Farm safety and security
- Broad-based Black Economic Empowerment
-
- Conclusions and scenarios
- SECTION 2 DEMAND FOR SKILLS
-
- AgriSETA registered employers and employee coverage
- Employee coverage in the AgriSETA
-
- 21 Skills demand
-
- The National Education and Training Strategy for Agriculture (AET Strategy)
- AGRISETA sector skills planning demand data (2008-2009)
- AgriSETA WSP analyses
-
- Skills demand in the commercial agricultural sector
-
- Skills demand forecasting by AgriSETA
- Research needs going forward
-
- SECTION 3 Skills Gaps and scarce skills
-
- Scarce skills at the DAFF
- Scarce skills in the commercial sector
- Supply of skills
-
- APPENDIX 1 Skills demand in the Department of Agriculture Forestry amp Fisheries (200809)
- Appendix 2 AgriSETA registered learnerships
-
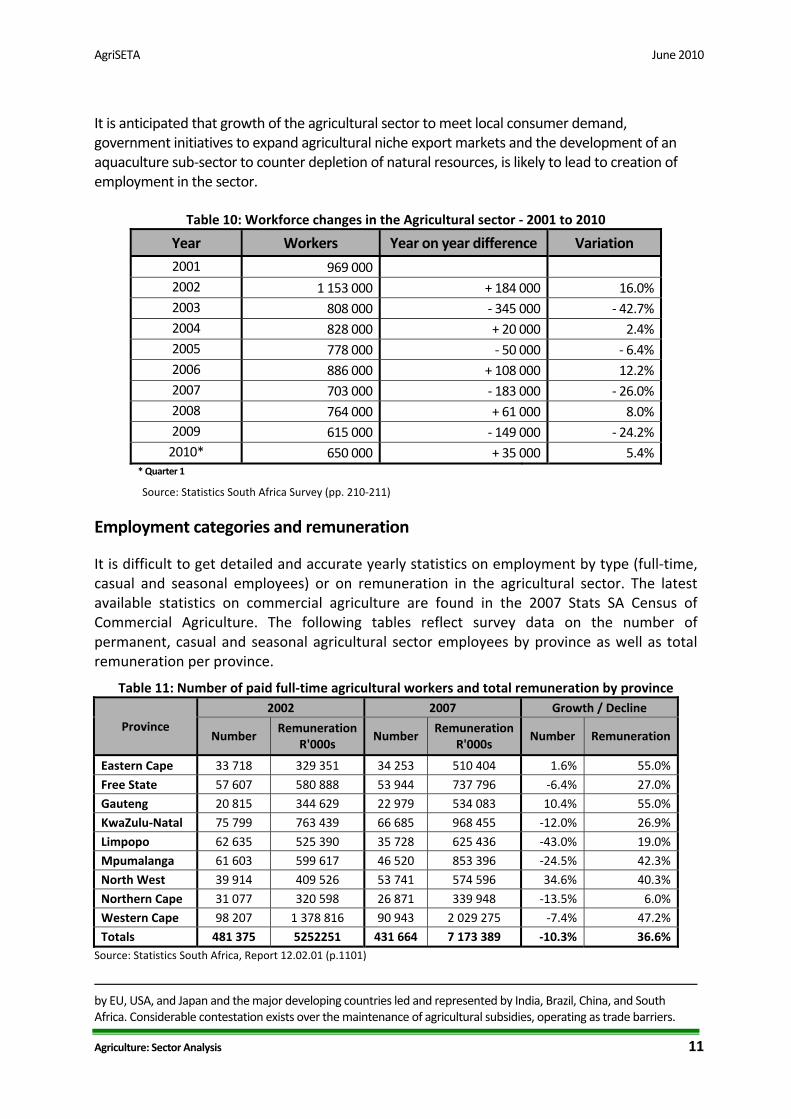
AgriSETA June 2010
Agriculture Sector Analysis 11
It is anticipated that growth of the agricultural sector to meet local consumer demand government initiatives to expand agricultural niche export markets and the development of an aquaculture sub‐sector to counter depletion of natural resources is likely to lead to creation of employment in the sector
Table 10 Workforce changes in the Agricultural sector ‐ 2001 to 2010
Year Workers Year on year difference Variation 2001 969 0002002 1 153 000 + 184 000 1602003 808 000 ‐ 345 000 ‐ 4272004 828 000 + 20 000 242005 778 000 ‐ 50 000 ‐ 642006 886 000 + 108 000 1222007 703 000 ‐ 183 000 ‐ 2602008 764 000 + 61 000 802009 615 000 ‐ 149 000 ‐ 2422010 650 000 + 35 000 54
Quarter 1
Source Statistics South Africa Survey (pp 210‐211)
Employment categories and remuneration
It is difficult to get detailed and accurate yearly statistics on employment by type (full‐time casual and seasonal employees) or on remuneration in the agricultural sector The latest available statistics on commercial agriculture are found in the 2007 Stats SA Census of Commercial Agriculture The following tables reflect survey data on the number of permanent casual and seasonal agricultural sector employees by province as well as total remuneration per province
Table 11 Number of paid full‐time agricultural workers and total remuneration by province
Province 2002 2007 Growth Decline
Number Remuneration
R000s Number
Remuneration R000s
Number Remuneration
Eastern Cape 33 718 329 351 34 253 510 404 16 550Free State 57 607 580 888 53 944 737 796 ‐64 270Gauteng 20 815 344 629 22 979 534 083 104 550KwaZulu‐Natal 75 799 763 439 66 685 968 455 ‐120 269Limpopo 62 635 525 390 35 728 625 436 ‐430 190Mpumalanga 61 603 599 617 46 520 853 396 ‐245 423North West 39 914 409 526 53 741 574 596 346 403Northern Cape 31 077 320 598 26 871 339 948 ‐135 60Western Cape 98 207 1 378 816 90 943 2 029 275 ‐74 472Totals 481 375 5252251 431 664 7 173 389 ‐103 366
Source Statistics South Africa Report 120201 (p1101)
by EU USA and Japan and the major developing countries led and represented by India Brazil China and South Africa Considerable contestation exists over the maintenance of agricultural subsidies operating as trade barriers
AgriSETA June 2010
Agriculture Sector Analysis 12
Table 12 Number of paid casual amp seasonal agricultural workers amp total remuneration by province
Province 2002 2007 Variance
Number Remuneration
R000s Number
Remuneration R000s
Number Remuneration
Eastern Cape 30 936 59 680 30 565 106 497 ‐12 784Free State 57 871 69 595 45 150 98 996 ‐220 422Gauteng 8 722 20 975 11 957 93 461 371 3456KwaZulu‐Natal 37 602 103 946 34 383 154 286 ‐86 484Limpopo 38 614 107 223 31 833 124 159 ‐176 158Mpumalanga 46 480 86 242 32 826 176 363 ‐294 1045North West 46 078 62 653 32 008 75 250 ‐305 201Northern Cape 68 174 121 613 47 874 123 723 ‐298 17Western Cape 124 968 331 406 98 546 485 108 ‐211 464Totals 459 445 963 331 365 142 1 437 843 ‐205 493
Source Statistics South Africa Report 120201 (p1101)
The tables above reflect that the Western Cape was the biggest employer of labour on commercial farms in 2007 with a majority of the employees being casual and seasonal The Eastern Cape employed the least number of commercial farm employees The comparator figures for 2002 and 2007 would appear to show a continuous country wide reduction in employment both in permanent employees and casual and seasonal workers The exception is the North West that has experienced an increase in full time employees The current minimum wage for farm workers (February 2010) is R1 31669 per month13 Monthly salaries differ across sub‐sectors with highest paid workers in primary production in the fisheries and dairy sub‐sectors
Table 13 Approximate monthly wage rates in Agriculture for selected sub‐sectors
Subsector Primary Production ProcessingPack house
Meat R 2000
Dairy ‐ R 2650
Wines R 1100 R 1400
Flowers R 800 R 1200
Fisheries R 5000
(crewman)R 1892
Source DTI 201014
Vink amp van Rooyen (2009) indicate that before the introduction of minimum wage in 2003 the real cash remuneration for employees had been increasing However over time the unit cost of labour (the ratio of the total cost of labour to the total value of output) has been in decline including a steep drop during and after the introduction of minimum wages
13 Department of Labour 2010 14 Source DTI (Data sourced from SAMIC Dairy Industry JAG WOSA SAFEC SA Pelagic Fish Industry Association)
AgriSETA June 2010
Agriculture Sector Analysis 13
In 1970 for every R1 of output 16 cents was spent on labour By 1980 this has dropped to 13 cents for R1 of output By 1994 the figure had increased to 19 cents declining to 17 cents in 1998 and to 117 cents in 2001 By 2007 it had reduced to 108 cents Further research will be needed to establish the current situation but there is reason to believe that the decline has continued with wages being very low both in terms of unit costs and in relation to other groups of workers in the economy
Strictly speaking it is not the role of the SETA to engage in the complex regulatory framework for the agricultural labour market It is for the Department of Labour and NEDLAC with their employer and organised labour stakeholders to find ways of balancing the need for protection of vulnerable workers with the need to create a framework that encourages the creation of jobs and improved job security The reason that more research is needed in this area and in particular detailed discussions with industry and labour representatives is to establish
The extent to which skills development interventions can improve the prospects for job creation and improved job security and
The mechanisms that can be established to enable uninterrupted skills training in the context of casualisation and use of contract and seasonal labour
Stakeholders in the Agricultural sector
National government departments
There are a number of national government Departments and spheres involved in the challenges of the agricultural sector The following table sets out the broad contribution that each department is intended to make
Table 14 Government department roles in relation to Agriculture Department Role
Department of Agriculture Forestry and Fisheries Agricultural policy and support Department of Rural Development and Land Reform Land Reform and land claims settlements Department of Economic Development Economic planning National Treasury Macro economic policy Department of Trade and Industry Industrial strategy (IPAP 2) Department of Water Affairs The management of water supply Department of Labour Labour market policy Department of Higher Education and Training HRD and skills planning and SETAs In relation to public spending on agriculture the agricultural national budget constitutes about 05 of the national budget The figure below reflects trends in national budgeting for the agricultural sector between 19967 and 201112 Some analysts15 have argued that state expenditure on agriculture shows lack of prioritisation of the sector especially considering that the budget remains lower than it was in the late 1980s when it now caters for a greater number of farmers than it did during apartheid segregation
15 Greenberg 2010 p 2
AgriSETA June 2010
Figure 2 National budgets for Agriculture 1996‐2011 (adjusted for inflation)
Source Greenberg 2010
The Department of Agriculture Forestry and Fisheries (DAFF) is responsible for the agricultural sector The department works with various organisations to promote the interests of the sector
bull It registers all South African Pest Control Association (SAPCA) qualified inspectors bull It works with the Agricultural Research Council for research to optimise the control of
migratory pests bull The Directorate on Marketing works with the National Agricultural Marketing Council
(NAMC) on issues related to equitable access to markets including policy formulation issuing of permits and coordinating inter‐departmental relations to enhance marketing
bull Historically the Department has employed a large number of extension officers located in farming communities who have supported and advised farmers This service has been in decline in recent years but remains an important aspect of state support to the sector
The above roles will be subject to some review in the context of IPAP 2 and also the debates around the role of the state in the economy The issue is not only levels of spending but also clarifying the role of government in relation to the business of the sector
Sector representatives
There are three major umbrella organisations representing the interests of farmers AgriSA TLUSA and the National African Farmers Union of South Africa (NAFU) AgriSA and TLUSA represents both commercial farmers and cooperativesrsquo interests through its engagement at national and international level AgriSA is a member of the Southern African Confederation of Agricultural Unions (SACAU) a regional farmersrsquo union for farmers in Southern Africa AgriSA has structures in all the provinces except Limpopo
Agriculture Sector Analysis 14
AgriSETA June 2010
Agriculture Sector Analysis 15
NAFU is a union for predominantly previously historically disadvantaged smallholder farmers with a membership base including farmers agribusinesses farmersrsquo organisations corporations and individuals who support their goals NAFU is represented by different unions in all the provinces There are other employer organisations who are not affiliated to AgriSA and NAFU including
bull Agricultural Industrial and Medium Employers Organisation bull Agricultural Mining and Industrial Chemical Manufacturersrsquo Association bull Agrilabor Employersrsquo Organisation bull Algoa Meat Traders Association bull East Coast Poultry Producers Employersrsquo Association bull East London and District Meat Traders Association bull Fertiliser Industry Employersrsquo Organisation bull Landbou Werkgewersorganisasie (Workinfocom) bull Red Meat Producersrsquo Association
The Agricultural Research Council is an autonomous statutory body that provides research to DAFF and the provincial departments of agriculture Figures available for South Africarsquos investment in agriculture research and development show that South Africa was above international norms of investment in RampD which are 053 of agricultural GDP for developing countries and 236 for developed countries In South Africa in 2000 agricultural RampD investment in relation to agricultural GDP was 30416 There are six major sources of credit for farmers banks (50) agricultural cooperatives and agribusiness (12) the Land Bank (21) private creditors (8) other creditors and financial institutions (9) and government (1) (GCIS 2010)
12 Factors impacting development in the Agriculture sector Several international and local factors impact on the productivity of the agricultural sector and its growth Key amongst these are
Growth of the South African economy and rising consumer demand International trade and trade agreements The global recession and rise in food prices The land reform programme Reliance on imports Water availability Changing consumer patterns and demands (eg organic food stuffs) Technological changes and mechanisms Quality standards Farm safety and security Broad‐based black economic empowerment Legislation Skills demand and supply HIVAIDS
16 Vink amp van Rooyen 2009
AgriSETA June 2010
These key factors are clustered and discussed below
Future sector economic growth and development
South African sector growth plans (IPAP2)
The 20102011 ndash 20122013 Industrial Policy Action Plan (IPAP) identifies five structural challenges that existed in the South African economy before the global economic downturn and which have been exacerbated by the recent economic crisis These challenges were evident even during the time South Africa was experiencing relatively high growth rates between 2005 and 2007 and have continued during the recession These challenges are
1 Structural imbalances in the growth path including growth that is lagging behind other medium and low income countries
2 Uneven performance of the manufacturing sector with some divisions like the automotive sector experiencing exponential growth while other sectors have stagnated
3 Employment growth being sustained by credit extension and consumption rather than by productive sectors leading to a large current account deficit
4 Low profitability of manufacturing 5 Low savings and investment from financial sector growth Only 52 of private credit was
extended to fixed investment in 2008 Key sectors have been identified for IPAPrsquos focus including agro‐processing which has a diverse group of industries and sub‐sectors including food processing beverages aquaculture horticulture medicinal aromatic and flavourants Key action plans for the agro‐processing sector are identified in IPAP2 as
Development of a National Food Control Agency to consolidate the sector Development of aquaculture to supplement dwindling wild fish stocks Designating specific areas for utilisation of aquaculture Development of the organic food sector Development of the small milling industry Enhancing competitiveness in fruit and vegetable canning Improving beneficiation of Rooibos and Honeybush products (IPAP2 2010)
International Trade
South Africa is a major exporter of Agricultural produce In particular South African fruit and fruit‐derived products such as wine and fruit juice are competitive in the global market However in many sub‐sectors where export potential exists ndash grain and meat ndash serious problems face the industry A key challenge is the uneven playing field experienced by South African exporters Major global competitors include the United States and the countries of the European Union where government subsidies in various forms are in place No such subsidies are in place in South Africa making it difficult if not impossible for South African agricultural produces to enter developed country markets due to the prices that they have to ask for products I In addition the value of the Rand has fluctuated from levels of around R10 to the US dollar to as little as R7 to the dollar When the Rand is strong export becomes difficult because it costs more in the case of the move from R10 to R7 a 30 cost increase for the importer It is impossible to
Agriculture Sector Analysis 16
AgriSETA June 2010
Agriculture Sector Analysis 17
predict whether the World Trade Organisation negotiations known as the DOHA Round will achieve progress in the coming years Historical evidence is that during periods of global recession developed economies become more protective not less and so the current outlook is not good Nor is it possible to predict the value of the Rand though current thinking in government is to move toward a weaker Rand to encourage exports These are two key variables that will need to be factored into the different sector growth scenarios for the future
Global recession and rise in food prices
Economic growth slowed down significantly in sub Saharan Africa and in South Africa in 2009 but there appear to be signs of recovery GDP growth in the region declined from about 6 in 2004 ndash 2008 to about 18 in 200910 GDP growth in South Africa was 16 in 2009 17and rose to 46 in the first quarter of 201018 though much of this is related to the income derived from the 2010 FIFA World Cup and may not be sustained Projections are generally for a slow revival with a set back after the slight rise resulting from the World Cup A return to the 6 levels of the 20078 could take some years The global recession reduced the demand for African exports and reduced capital flows to the region but it is anticipated that the demand for mineral resources by Asian and Western powers will result in both the expansion of exports and expanded foreign direct investment The competition between India and China for African markets is also expected to boost trade to the benefit of African suppliers South Africa is expected to particularly benefit from direct foreign investment from China and India China has already become South Africarsquos largest market for exports and supplier of imports19 Rising food prices have forced governments around the world to control prices of maize bread rice and dairy products In South Africa ldquofood price inflation between December 2005 and December 2006 averaged 788 rdquo20 Although efforts are being made to reduce barriers to poorer families in relation to basic food there has been no move to subsidise food generally This may change though the space for significant levels of support is restricted because of reduced revenue from income taxes resulting from the recession The global credit crunch and recession have meant a reduction in public expenditure and funding which has affected the agricultural sector21
Land reform
In South Africa specifically land reform has a significant bearing on food security and agriculturersquos contribution to GDP The objective of the land reform programme is to transfer 30 of agricultural land to black ownership by 2014 (deferred to 2025) to ensure more equitable access to land by historically disadvantaged people and to increase their participation in agricultural activities22 Land reform has been informed by four processes23
17 Department of Agriculture Forestry and Fisheries 2010 18 Stats SA 2010 19 Department of Agriculture Forestry and Fisheries 2010 20 Department of Agriculture Forestry and Fisheries 2010 ‐2011 Strategic Plan 21 Economic Commission for Africa 2009 22 Xingwana 2008 23 CDE 2008
AgriSETA June 2010
Agriculture Sector Analysis 18
Land restitution involving returning land or providing financial compensation to those whose land was dispossessed during apartheid
Land redistribution transferring more land to the historically disadvantaged Tenure reform modernising land tenure rules and access to land ownership and Providing financial support for the development of emerging farmers
In relation to progress with land reform by September 2009 only 69 of agricultural land (about 567 million hectares) had been transferred and a majority of the beneficiaries have not yet occupied the land due to lack of infrastructure input or technical support The following table gives an indication of the progress of land reform since the inception of the first democratic government
Table 14 Land transfers and beneficiaries ‐ 1994 to 2009
Province Redistribution and tenure Restitution Total Hectares Beneficiaries Claims Hectares Beneficiaries Hectares Beneficiaries
Eastern Cape 675 353 357 25 633 16 201 94 834 215 201 448 191 240 834
Free State 799 350 291 7 721 2 662 47 615 40 893 397 906 48 614
Gauteng 286 34 513 7 328 13 159 9 476 70 179 43 989 77 507
KwaZulu Natal 690 547 414 67 761 14 752 642 447 433 168 1 189 861 500 929
Limpopo 291 91 235 7 403 3 382 513 024 220 227 604 259 227 630
Mpumalanga 444 322 839 13 950 2 694 399 876 225 877 722 715 239 827
Northern Cape 271 952 744 2 773 3 682 539 620 100 554 1 492 364 103 327
North West 300 268 566 40 539 3 709 373 642 172 963 642 208 213 502
Western Cape 223 122 304 12 750 15 546 3 769 118 165 126 073 130 915
Total 3 979 3 043 264 185 858 75 787 2 624 303 1 597 227 5 667 567 1 783 085
Source Greenberg 2010
Achievement of the 30 land reform target is being made difficult by land prices Under the willing buyer willing seller scheme the government will need R74 billion to be able to purchase enough land While resources may be available there are suggestions of lack of capacity The Department of Rural Development and Land Reform (DRDLR) was able to spend only 31 of its land reform 200910 budget in the first six months of the financial year Going forward this Department needs to identify what the real challenges are with the pace of land reform delivery so that they can be mitigated to meet the 2025 target A priority is the retention of skills skills transfer and skills development during the transfer of land as well as retention of national food production to avoid loss of production Support for new beneficiaries of land to ensure sustained productivity is derived from two main sources of funding ndash the Broadening Access to Agriculture Thrust (BADAT) and the Comprehensive Agricultural Support Programme (CASP) CASP is a conditional grant from the Department of Agriculture Forestry and Fisheries to provincial departments to support emerging farmer development Provincial farming budgets dedicated for farmer support in Mpumalanga the Free State Northern Cape and the Western Cape have risen significantly and those in KwaZulu Natal and Gauteng have witnessed a slight increase Eastern Cape and Limpopo agricultural budgets have been steady The North West is the only province where there has been a sharp decline in the share of the budget dedicated to farmer support24
24 Greenberg 2010
AgriSETA June 2010
Agriculture Sector Analysis 19
Reliance on imports
Overall the Agriculture sector contributes positively to the balance of payments ldquoSouth Africa remains food secure The value of our exports increased by 464 from R33 656 million in 200708 to R49 278 million in 200809 During the same period the estimated value of imports rose by 12 from R34 009 million to R38 401 million resulting in a positive trade balancerdquo25
South Africa depends largely on world markets for seed production and agrochemicals Regarding seed production there are only three community seed production schemes in Limpopo and Mpumalanga being piloted with state funding Ten top large companies including two South African companies and multinationals have rights to over two thirds of registered seed varieties in South Africa Despite the dominance of genetically modified and hybrid seed in some sub‐sectors like maize sunflower and sorghum open‐pollinated varieties have been resilient in South Africa enabling the possibility of alternative seed sources not dependent on technological processes26 In relation to agrochemicals deregulation and liberalisation in the fertiliser sector led to the shutdown of local production capacity and South Africa became an importer of fertiliser for the first time in 2000 There are three large players in the fertiliser sector Sasol Nitro Yara and Omnia South Africa imports an estimated 70 of fertilisers and pesticides Fertiliser prices rose by over 200 between 2006 and 2008 but dropped somewhat after that However this hike signified the volatility of the agrochemicals industry and South Africarsquos dependency on imports and the potential risk for emerging farmers and food production of this dependence on imports as the country cannot control the prices making inputs both difficult to budget for and in many cases unaffordable The price of agrochemicals is also particularly influenced by the prices of oil and the exchange rate The general understanding in relation to job creation is that a weaker Rand will improve exports and therefore enable job creation Of course the down side of this strategy is that imports become more expensive So what may be an advantage for those sub‐sectors who are expanding their export volumes those relying on imported agro chemicals will be under increased pressure
Water
Water is both an essential and scarce resource for the agriculture sector and is being threatened by climate changes Crop production relies heavily on water and yet access to water is not being addressed in a systematic way in the land reform processes Greenberg suggests that the relationship between land reform agricultural support and water resource provision is inadequate and a way to address this could be established by linking water provision to land transfer or investing in irrigation for both commercial and resource‐poor farmers However investing in irrigation in the context of water scarcity and climate change may not be the best option What could be needed is finding ways to maximise efficiency of the 60 of South African
25 Department of Agriculture Forestry and Fisheries Strategic Plan 201011 26 Greenberg 2010
AgriSETA June 2010
Agriculture Sector Analysis 20
water used for irrigation by for example using methods such as drip or micro‐irrigation which are expensive to set up but which reduce water wastage by 5‐1027 The Department of Water Affairs is responsible for managing water supply and has to give authorisation for agricultural projects and other developments The department needs to be seen as an important stakeholder in the agricultural sector
The labour market
South Africa recorded an unemployment rate of 243 in 2009 (narrow definition) If people who are no longer actively seeking work are considered the broad unemployment rate rose from 267 to 313 illustrated in the figure below As a direct consequence of the global economic downturn in 2008 870 000 formal jobs were lost in 200928 Others have quoted a figure of over 1 million
Figure 3 Official unemployment in South Africa 2003 ‐2009
Source National Treasury 2010
Annual employment loss followed sector growth patterns with agriculture mining manufacturing and trade facing the highest job losses as their sector growth contracted Unemployment is especially a major problem among lower skilled workers and younger people Youth employment in the 15 ‐24 year age group has fallen by 219 000 (136) and 483 of people in this age group are unemployed Employment of semi‐skilled and unskilled workers has contracted by 527 000 and male employment has gone down by 550 000 (71) while that of women has decreased by 320 000 (52) The number of discouraged workers ie those no longer actively seeking work has increased from 518 000 to 17 million29 Clearly the existence of a very large pool of largely unskilled unemployed workers has an impact on the farming sector It drives wages down and creates opportunities for casualisation and the expansion of labour contract agencies and brokers In addition there are significant numbers of foreign nationals mainly from Zimbabwe and Mozambique who are seeking work and often finding it on farms and in primary processing and packaging plants There are benefits to the
27 Greenberg 2010 28 National Treasury 2010 29 National Treasury 2010
AgriSETA June 2010
Agriculture Sector Analysis 21
sector with skilled and semi‐skilled workers coming into the labour market and being absorbed into the workforce and helping raise productivity levels However at the lower skilled end of the market the existence of this pool brings further casualisation and downward pressure on wages Tensions are likely to increase and further protests either in the form of xenophobic outbreaks or actions against farmers may well increase A view often expressed by farm employers is that current labour legislation makes dismissing workers difficult and so the availability of labour without entering into contracts of employment is an attractive way of avoiding the legislation and its obligations Organised Labour is seeking to restrict these opportunities through either regulating or eliminating labour brokers and efforts are being made to regulate the use of foreign labour However for the foreseeable future the trend is for formally employed people to be reduced in number In relation to the emergent sector there will also be a reluctance to enter employment contracts with workers The fact that many households are engaged in some form of largely unpaid agricultural work means that there is significant casual work dating back many years Helping change this situation into one where casual or unpaid jobs are transformed into formal jobs with regular wages will take time It is also likely that as some emergent farms become established they will act similarly to established farms and institute a form of casual labour rather than expanding a workforce for which they would have to take a level of responsibility From an AgriSETA perspective these labour market trends mean that whilst levy income can be directed at a relatively small labour pool one that is manageable in terms of planning and implementation the size of the informal casual and unemployed labour force in the sector ‐ for whom no levy is paid and who have no employer to plan for their skills needs ndash is very large and its needs almost unlimited Clearly the relationship with the National Skills Fund (NSF) becomes critical in respect of the entire non‐levy income sector Again the level of support available from non‐levy income sources will be an important variable in looking at future sector skills development scenarios
Consumer trends
South Africa currently produces enough food to meet the needs of its population However consumption of three main staples maize wheat and vegetables has been volatile since 1985 and remains below 1990 levels Consumption of maize and vegetables by South Africans is 17 and 32 less respectively than in 198530 The main reasons for this lie in the growing levels of poverty and the difficulties that families have in purchasing nutritious food Whilst government has increased the levels of social grants and increased the number of people receiving grants to around 13 million the incomes of poor families have been badly hit by a range of factors including job losses and rises in food prices The approximately 1 million people who lost their jobs in 20089 meant a loss of income for many millions of dependents Rises in food prices have also had a disproportionate impact on the poor Whilst food is available it is often not accessible to families on the income levels that they have to manage within The result is that less and less nutritious food is purchased which in turn impacts on the ability of farmers to sell their products locally 30 Greenberg 2010
AgriSETA June 2010
Agriculture Sector Analysis 22
Whilst there is no evidence that government will reduce its efforts in relation to poverty relief and social benefits including such programmes as school feeding schemes and food parcels during periods of drought the state of public finances may not enable to support the poverty that grips many rural areas If real income levels for the poor were to rise it could have a significant impact on the economy of the agricultural sector Equally an improvement in the rural economy with increased agricultural production and jobs would dramatically impact on the capacity of people to buy nutritious food Achieving a positive growth path in rural areas is a huge challenge for government and one that is key to governmentrsquos Medium Term Strategic Framework and Industrial Policy Action Plans
HIVAIDS
South Africa has a high prevalence of HIV and AIDS The HIV prevalence among people aged two and above was estimated at 109 in 2008
Table 15 Estimated HIV percentage prevalence by age group (2002 ndash 2008)
Age 2002 2005 2008 Change
Children (2‐14 years) 56 33 25 ‐31
Youth (15‐24 years) 93 103 87 ‐06
Adults (25 and older) 155 156 168 13
15‐49 year olds 156 1692 169 13
Total (ages 2 to 49) 114 108 109 ‐05 Source Avert 2009
The table above shows that HIV prevalence is highest amongst those aged 25 years and older Given youth labour market analyses which point to people from previously disadvantaged backgrounds mainly African males accessing formal employment for the first time at age 25 ‐27 this population can be held to represent people in employment Research31 has estimated that by 2020 the pandemic will have claimed at least 20 of employees in the agricultural sector Southern Africa
in
HIV and AIDS have significant ramifications in the agricultural sector for both commercial farming and subsistence farming The implications include
bull Decrease in cultivated land bull Focus on less labour intensive crop and animal production bull Decrease in womenrsquos agricultural productivity as they take on a more care giving role bull Loss of skills bull Increase in absenteeism from work bull Decrease in daily work outputproductivity because workers are weaker from infections
There are suggestions that the impact of the pandemic in South Africa demands sectoral intervention although this may be difficult in the agricultural commercial sector as
bull Seasonal workers who seem to be more vulnerable to infection because of their low socio‐economic status are not in one place long enough for care programs Further
31 Ingelozi Management Solutions 2008
AgriSETA June 2010
Agriculture Sector Analysis 23
farmers and employers may not feel responsible for seasonal workers in the same way they would invest in their permanent employees
bull There may be uncertainty around land reform which may put HIV intervention on farms on the back burner
bull There are no policies that enforce HIV education and care on farms in the same way that legislation like BEE does for ownership As a result HIV intervention may be left to goodwill and employers may feel it is more important to comply with issues that are monitored
Farm safety and security
South Africa has been plagued by unacceptably high levels of violent crime and murder for many years now Farms have experienced this and those living on farms feel and are extremely vulnerable The South African Chamber of Commerce and Industry (SACCI) has argued that
Using the nominal GDP figure for 2009 of R24 trillion a 322 percent contribution of agriculture to GDP and an estimate of 39982 farms (as at 2007) in South Africa the cost of a murderattack on a farm to the economy was R1932869 per annum
SACCI acknowledges that this estimate is flawed as it does not take into consideration the fact that farming units contribute differently to GDP and that not every attack or murder contributes to farm shut down or loss of productivity However if not addressed these attacks could lead to loss of farming sectors as farmers migrate to lsquosaferrsquo regions This will affect employment and GDP contribution of the sector The need for safety and security on farms may also shift farmersrsquo focus in skills development to include personnel who have skills in safety and security
Broad‐based Black Economic Empowerment
The aim of the AgriBEE Charter (gazetted in 2008) is to increase the involvement of black business in agriculture through ownership and control as executives and senior managers of new and existing agricultural businesses The extent to which AgriBEE is transforming the sector is not known as it is too early to tell but a recent survey conducted by ABC and the IDC showed that among the ABC respondents in 2007 46 of enterprises were busy constructing a BEE strategy and 46 claimed to be implementing a BEE strategy A survey of the dairy industry in the Western and Eastern Cape in 2008 showed that only 6 of firms had a BEE strategy in place It also seems from survey data that companies are focusing on the skills development and socio‐economic aspects of BEE rather than on ownership32 It would appear that although there have been some significant BEE purchases of viable farms and some employee empowerment projects including some quite high profile ones in the Cape Winelands the extent of ownership change had been limited One of the factors is the very high level of single person or family ownership in the agricultural sector BEE is more straight forward in the corporate world where shares can be exchanged For a family business it is a matter of selling off part or all of the land and the tendency is to sell off those areas of the farm that are expendable from a business sustainability perspective
32 Greenberg 2010
AgriSETA June 2010
Whilst there is discussion in government about the ending of the ldquowilling buyer willing sellerrdquo concept the Constitution itself provides for property rights and so although some pressure may be exerted through legislation and regulation the extent and speed of change may not be fast The mechanisms for encouraging the transfer of significant levels of ownership have not yet been created The focus of the SETA is therefore likely to be more the beneficiaries of land reform and emergent farmers though projects of a BEE nature can be targeted as they arise
Conclusions and scenarios It is useful when looking at possible scenarios to examine the key variables or uncertainties and to project how variations one way or the other will have an impact on the development and growth of the sector From the sector analysis and factors that are contributing to change in the sector there are some key factors that seem to emerge First appears to be the economy and related issues of the labour market and the challenges of labour absorption in an enclave economy These factors determine on the one hand whether there will be growth and development and on the other whether such improvements will result in improved employment opportunities and the creation of a virtuous cycle of development Second is the role of the state and the various government departments whose plans and work impact on the agricultural sector Related to this is land reform that is inevitably driven by the state and not the owners of land or the landless The view expressed by many engaged in agrarian reform is that the state must play a significant role It becomes clear that a successful agricultural enterprise requires a number of factors to be in place to be successful These include access to land (Department of Rural Development and Land Reform) agricultural support within a supportive agricultural framework (Department of Agriculture Forestry and Fisheries) access to consistent water supply (Department of Water Affairs) access to finance (Department of Trade and Industry various state agencies) conducive labour market regulation (Department of Labour) sound industrial policy (Department of Trade and Industry) economic planning and macro policy (Department of Economic Development National Treasury) and appropriate education training and skills development (Department of Higher Education and Training the Human Resources Development Council NSA and the SETA) There are other government departments as well as provincial and municipal structures that also play a role The following analyses show how the four variables
economic growth and development role of the government labour market changes and land reform)
impact positively or negatively on the growth of the sector and the demand for skills
Agriculture Sector Analysis 24
AgriSETA June 2010
Agriculture Sector Analysis 25
HHIIGGHH GGRROOWWTTHH SSCCEENNAARRIIOO
The economics of the sector Role of government
The economy in SA and globally continues to revive albeit slowly for the next few years
Roles and integration of national government departments are clarified Specific functions are agreed processes put in place and personnel appointed with the required skills
International trade agreements are still weighted infavour of US and EU but progress is being made and specific blockages are addressed in bilateral talks
The roles of Departments (DWA DAFF DRDLR DoL DTI DED DHET) are clarified with appropriate joint plans and coordinating structures
The rural economy gradually improves with the buying power of the poor increasing and more stable markets created for local produce
For each of the functions agreed in each of the related departments appropriate structures and systems are put in place and staff trained
Exports increase in key areas identified in IPAP 2 and the Rand exchange rate stabilises at a level not too much different than it is today
Specific capacity is put in place at local level to support implementation of land reform and rural development
There is a growing understanding of the concept of dualism and the need to intervene with labour absorption and development mechanisms
Land claims are all finally settled and ownership and tenure is resolved There is a serious drive to establish effective agricultural enterprises
An understanding is reached on the role of agencies and labour brokers and abuse is curbed
The willing buyer willing seller approach is resolved and enables viable land to become black owned
Some relaxation of labour market regulations are agreed that maintain some minimum standard of employment but assist absorption
Land transfer to black and emergent farmers is done in a manner that integrates then into the supply chains of the sector
Mechanisms are found to address skills needs in the context of casual and seasonal work patterns
Financing of land reform and transfer is done on the basis of agreed development plans including skills
Labour market reform Trajectory of land reform LLOOWW GGRROOWWTTHH SSCCEENNAARRIIOO
The economics of the sector Role of government departments The economy in SA and globally stagnates at current levels and the economy struggles to pick up after the temporary 2010 World Cup boost
A lack of purpose at government level means limited progress for another five years Land reform remains a commitment without a plan
International trade agreements are still weighted infavour of US and EU and protectionism increases as a result of the global recession
The roles of Departments (DWA DAFF DRDLR DoL DTI DED DHET) are unclear and there is no proper co‐ordination
SArsquos Gini coefficient continues to worsen with rural poverty increasing and local economies declining
There is a lack of effective structures systems and processes to implement policy across departments
Rand volatility causes problems for importers and exporters Well established markets are maintained but exports decrease
At local level the decline in the agricultural extension officer functions continues and limited practical support is available
Understanding of the rural economy is so diverse that stakeholders cannot agree the problem let alone the solution to low absorption levels
Land claims take too long and land reform processes leave potentially productive land poorly developed and managed
Casual labour and labour brokers remains an issue of dispute Confrontation results in bitterness and resentment
The impasse caused by a rigid interpretations of property clauses in the Constitution continues to stall achievement of the 30 black ownership target
Labour market regulation continues to be a contributing factor to reducing levels of employment
Black owned farms find it difficult to become part of supply chains and are unable to perform adequately
Unstable employment patterns in the sector make skills interventions difficult to manage and largely ineffective
Financing of land reform and land transfer continues to be wasted as it is not tied to the building of appropriate capacity
Labour market reform Trajectory of land reform
AgriSETA June 2010
These analyses can be translated into four potential growth and development scenarios for the agricultural sector which are based on the requirements for a strong development state Scenario 3 Weak government support
and sound economy
Econ
omic fa
ctors glob
ally n
ationa
lly and
locally
Scenario 1 Integrated government support and sound economy
The economic upturn triggered by the World Cup continues and globally things improve enabling an expansion of exports The government because of a lack of integrated policy planning and implementation provides limited support for sector development The gains go to the well established enterprise owners with few gains for emerging farmers and local communities
Government departments coordinate their efforts to achieve maximum impact There are favourable economic conditions that create opportunities for advance Within this positive environment the role of the AgriSETA becomes a central component of a comprehensive strategy for growth and skills interventions are targeted to achieve maximum effect Results in growth in sustainable enterprises and expanded employment opportunities
Government policy and support Government policy and support
Combination of disjointed government policy planning and a weak and increasingly marginalised rural economy Economic conditions result in unsustainable farming conditions and employment declines along with productivity Food shortages and the lack of development in rural areas leading to increasing social tensions A vicious cycle develops with the sector going into long term decline
Government departments coordinate their efforts to achieve maximum impact However economic conditions hamper progress Efforts by the AgriSETA are undermined by poor labour absorption and job insecurity Some significant successes are recorded including some NSF funded projects that result in sustainable enterprises A platform is laid for future improvements when the economic conditions improve
Scenario 4 Weak state and economy Scenario 2 Strong state but weak
economy
Agriculture Sector Analysis 26
AgriSETA June 2010
Agriculture Sector Analysis 27
SECTION 2 DEMAND FOR SKILLS
AgriSETA registered employers and employee coverage
In 2009 17 234 employers were registered with the AgriSETA comprising 15 394 small employers (less than 50 employees) 1 202 medium sized employers (50 ‐ 149 employees) and 638 large employers (more than 150 employees)
Considering that there are around 40000 commercial farms33 the 17 234 employers represent around 43 of commercial farms Notwithstanding changes in the sector as a result of land reform and sector shrinkage this is a sizable proportion and is held to be sufficiently representative for the purpose of skills development planning However this paints an incomplete picture It understates the representative nature of large enterprise registered with the SETA and overstates the representative nature of small registered enterprises 4 175 (242) of the enterprises are levy paying members Further only 1 673 (11) workplace skills plans (WSPs) were submitted
Table 16 Registered employers by size and sub‐sector Sub‐sector Description
Employers Small Medium Large
CoffeeTea Processing and marketing of coffee and tea including coconuts cocoa nuts olives dates etc
33 4 3
Fibre Grading ginning packing of wool and cotton raw material 1 676 16 18
Fruit Fruit packed in cartons fruit juice concentrate drummed and fruit juice in container ready for consumption
271 36 57
Fruit exporters and importers 6 0 1
Grain
Manufacture of grain mill products and starches 119 5 7Handling and storage of grain 67 7 23Wholesale amp retail trade in Agricultural machinery 213 9 4Sale and distribution of Agricultural raw materials and other farming inputs
182 9 3
Milling
Manufacture of flour and grain mill products including rice and vegetable milling grain mill residues
120 15 11
Manufacture of prepared animal feeds 110 19 0Manufacture of pet foods 42 9 0Manufacture of starches and starch products 7 1 1
Pest control
Pest Control 209 4 0
Poultry Poultry and egg production including the slaughtering dressing and packing of poultry
305 49 37
Primary
Growing of Cereals and other crops (not elsewhere classified) 902 160 34Growing of Vegetables Horticultural specialties nursery products
943 120 72
Growing of Vegetables Horticultural specialties (Including Ornamental Horticulture) and nursery products
11 5 0
Sugar plantation including sugar cane and sugar beet etc 9 4 2
33 SARS statistics 2007
AgriSETA June 2010
Agriculture Sector Analysis 28
Sub‐ Description Employers Growing of fruit nuts beverage and spice crops 1795 255 143Farming of cattle sheep goats horses asses mules and hinnies Dairy farming
2 252 59 18
Other animal farming production of animal products (NEC) 433 25 12Ostrich farming 5 0 0Game farming 16 0 0Growing of crops combined with farming of animals (Mixed farming)
2 920 256 109
Growing of coffee and tea including coconuts cocoa nuts olives dates etc
2 0 0
Agricultural and animal husbandry services except veterinary activities
438 22 9
Other animal farming (not elsewhere classified) 11 1 1Growing of trees as second crop by farmers 126 18 4Fishing operation of fish hatcheries and fish farm 913 10 6
Red meat
Production and animal products (not elsewhere classified) 6 0 0Slaughtering dressing and packing of livestock including poultry and small game for meat
317 40 17
Production sale amp marketing of Agricultural by products (eg bones hides)
61 2 0
Slaughtering dressing and packing of livestock including small game for meat and processing of ostrich products
2 1 0
Wholesale trade in Agricultural raw materials and livestock 193 7 10Transport of livestock as supporting activity 224 0 0Agricultural and livestock research 215 9 3
Seed Seed production and marketing 149 12 6
Sugar Manufacture of sugar including golden syrup and castor sugar
45 5 21
Tobacco Processing and dispatching of tobacco 46 8 6 TOTALS 15 394 1 202 638Source AgriSETA WSP data
The largest number of registered small and medium enterprises are found in the mixed farming sub‐sector while most large enterprises are in the growing of fruit nuts beverage and spice crops sub‐sector
Employee coverage in the AgriSETA
Collectively the 17 234 employers registered with AgriSETA employed a total of 239 076 employees This represents 39 of the agricultural labour force in 2009 The 1 673 employers who submitted WSPs in 2009 employed 97 898 employees representing 41 of the total number of people employed by registered employers While the number of registered employers submitting WSPs is small (11) they employ a sizeable number of employees and the percentage of employees provides a statistically significant sample The data for larger enterprises is statistically much more representative than that for small enterprises
AgriSETA June 2010
Table 17 Number of employees of registered employers by sub‐sector
Sub‐sector
Sub‐sector description Employees
CoffeeTea Processing and marketing of coffee and tea including coconuts cocoa nuts olives dates etc
483
Fibre Grading ginning and packing of wool and cotton raw material 6 539
Fruit Fruit packed in cartons fruit juice concentrate drummed and fruit juice in container ready for consumption
27 661
Fruit exporters and importers 212
Grain
Manufacture of grain mill products and starches 133Handling and storage of grain 18 303Wholesale amp retail trade in Agricultural machinery 795Sale and distribution of Agricultural raw materials and other farming inputs 2 898
Milling
Manufacture of flour and grain mill products including rice and vegetable milling grain mill residues
3 634
Manufacture of prepared animal feeds 731Manufacture of pet foods 160Manufacture of starches and starch products 105
Pest control
Pest Control 119
Poultry Poultry and egg production including the slaughtering dressing and packing of poultry
19 187
Primary
Growing of Cereals and other crops (not elsewhere classified) 10 104Growing of Vegetables Horticultural specialties and nursery products 37 799Growing of Vegetables Horticultural specialties (Including Ornamental Horticulture) and nursery products
195
Sugar plantation including sugar cane and sugar beet etc 220Growing of fruit nuts beverage and spice crops 47 043Farming of cattle sheep goats horses asses mules hinnies Dairy farming
3 382
Other animal farming production of animal products (NEC) 4 203Ostrich farming 0Game farming 0Growing of crops combined with farming of animals (Mixed farming) 28 722Growing of coffee amp tea including coconuts cocoa nuts olives dates etc 0Agricultural and animal husbandry services except veterinary activities 970Other animal farming (not elsewhere classified) 513Growing of trees as second crop by farmers 1 294Fishing operation of fish hatcheries and fish farm 1 589
Red meat
Production and animal products (not elsewhere classified) 0Slaughtering dressing and packing of livestock including poultry and small game for meat
5 128
Production sale amp marketing of Agricultural by products (eg bones hides) 116Slaughtering dressing and packing of livestock including small game for meat and processing of ostrich products
0
Wholesale trade in Agricultural raw materials and livestock 1 697Transport of livestock as supporting activity 0Agricultural and livestock research 534
Seed Seed production and marketing 2 127Sugar Manufacture of sugar including golden syrup and castor sugar 10 478Tobacco Processing and dispatching of tobacco 2 002 Total 239 076
Agriculture Sector Analysis 29
AgriSETA June 2010
Agriculture Sector Analysis 30
Source AgriSETA WSP data
According to the WSP analysis the sub‐sector for the growing of fruit nuts beverage and spice crops employed the largest number of people In six sub‐sectors there are employers who do not employ workers These are probably family based organisations where family members help in the business without drawing a salary These are in transport and livestock research slaughtering dressing and packing of livestock including poultry and small game for meat growing of coffee and tea including coconuts cocoa nuts olives dates etc ostrich farming and game farming
Table 18 Employee distribution by province Province Employees Percentage
Eastern Cape 18 844 192 Free State 1 946 20 Gauteng 2 788 28 KwaZulu‐Natal 5 416 55 Mpumalanga 8 062 82 North West 3 290 34 Northern Cape 5 436 56 Limpopo 1 730 18 Western Cape 50 386 515 Grand Total 97 898
Source AgriSETA WSP data
Of those submitting WSPs registered employers in the Western Cape employed the largest number of people while employers in Limpopo employed the least number of employees Free State has a small number of employees covered by WSPs submitted to the SETA whereas Eastern Cape with a relatively small number of registered farms has a very large number of employees on farms submitting WSPs Given this variance between provinces the use of WSP data for extrapolation purposes must be viewed cautiously
2009 WSP equity information was only provided for about a quarter of employees (25 637 or26)34 No information was available from the WSPs on non‐South Africans working on commercial farms
Table 19 Equity profile from 2009 WSP data African Coloured Indian White
Totals M F D M F D M F D M F D
8 040 5 785 38 5 097 5 228 24 22 25 0 811 556 11
580 417 03 493 505 02 468 532 00 589 403 08 13 863 10 349 47 1 378 25 637541 404 02 54 100
Total EquityTotal Male Total Female Total Disability
13 970 11 594 73 545 452 03
Source AgriSETA WSP data
Using currently available data it is not possible to provide disaggregated employment data by sub‐sector This will require a small change in the way that gender race and disability data is
34 Some employers did not complete race and gender information when giving their employment profiles
AgriSETA June 2010
codified during WSP data‐capturing including allocation by sub‐sector What can be stated is that employment of males is more dominant than that of women and more Africans are employed in the sector than other groups Employment of people with disabilities is below 1
21 Skills demand
The National Education and Training Strategy for Agriculture (AET Strategy)
The AET Strategy developed by the Department of Agriculture Fisheries and Forestry (in consultation with various key stakeholders in the agricultural sector) highlights priority skills needs and constraints within the sector and categorises needs within the following 5 broad areas
1 Agricultural production ndash requesting that the past focus on a narrow band of commodities (relevant mainly to the commercial sector) and related research be expanded to address the needs of small‐scale and subsistence farmers (eg more focus on mixed farming and rural livelihood sustainability skills)
2 Agricultural engineering ndash with specific focus to be placed on technologies suitable for small‐scale farmers (eg relevant and post‐harvesting techniques related to processing and storage of produce) ndash to address this need the scarcity of agricultural engineers requires attention
3 Agricultural economics ndash a critical need was identified for general agricultural economic skills (ranging spectrum of farm planning farm management enterprise management marketing finance etc) ndash with the need to training both farmers and extension officers in such fields
4 Agricultural development ndash a specific need was identified to develop agricultural extensionists in supporting especially emerging and small‐scale farmers over the full spectrum (a need exists for both new curriculum in the training of new extensionists and the re‐training and upgrading of existing officers)
5 Veterinarians ndash the need to develop state veterinarians in order for the state to perform its role and function (particularly in its preventative monitoring and regulatory role and function)
AGRISETA sector skills planning demand data (2008‐2009)
The following section reflects initial research on skills demand in the Agricultural sector arising from the sector analysis (section 1) previous AGRISETA skills demand research for Sector Skills Planning during 2005‐2009 and analysis of WSP data from 2009 With the introduction of the Organising Framework of Occupations and agreement on definitions for scarce and critical skills in 200506 the AGRISETA undertook an extensive research and consultation processes to determine skills development priorities for the sector The research methodology employed was based on the a four dimensional topology for establishing and evaluating skills needs illustrated in the figure below
Agriculture Sector Analysis 31
AgriSETA June 2010
Agriculture Sector Analysis 32
The identification and prioritisation of skills needs was also undertaken from a key stakeholder and beneficiary perspective Consideration was given to needs of the following groups
bull The unemployed ndash helping them gain andor regain entry to the labour market bull The economically inactive ndash helping them to become economically active bull School leavers ndash helping them gain access to further education and training opportunities
and thus facilitating their entry to the job market bull Entrants to the job market ndash facilitating employment and integration into the work culture
and work ethic (improving the employability of an individual) bull Those currently employed in the sector ndash increasing their competency and opportunities
for advancement creating a career path and offering continued job security enhancement of value adding to the sector improving their prospects for better employment opportunities
bull Organisations and enterprises within the sector ndash making sure that skills development and knowledge creation occurs in such a way as to improve the sectorrsquos viability and allowing companiesenterprises to become more sustainable and profitable along the way improving productivity competitiveness and innovation within organisations
In organising and reporting the identified priority skills development needs (200809) the following structuring approach was followed
Tier 1 The four categories of needs as per the Topology presented above were used for the identification evaluation and grouping of needs
Pay conditions
Image
RECRUITMENT DIFFICULTY
SKILLSGAP
SKILLSSHORTAGE
LABOURSHORTAGE
Firms experience difficulty recruiting This does not necessary imply a skills shortage ndash may indicate a poor image remuneration etc
Those currently in work do not have the requisite skills set to carry out their job to an optimum standard
Required skills are in short supply when compared with the demand across the whole labour market
Regardless of skills levels a situation exists where there is simply not enough supply of labour to meet demand
Pay conditions
Image
RECRUITMENT DIFFICULTY
SKILLSGAP
SKILLSSHORTAGE
LABOURSHORTAGE
Firms experience difficulty recruiting This does not necessary imply a skills shortage ndash may indicate a poor image remuneration etc
Those currently in work do not have the requisite skills set to carry out their job to an optimum standard
Required skills are in short supply when compared with the demand across the whole labour market
Regardless of skills levels a situation exists where there is simply not enough supply of labour to meet demand
Figure 4 Topology for identifying skills development priorities
Source AGRISETA SSP Annual Update August 2009
AgriSETA June 2010
Tier 2 Within each of the first tier groupings needs were further broken down and organised per target group At this second level needs were grouped by
o General skills development needs (cross‐cutting over different target groups) o Needs experienced by small scale farmers (this group included subsistence
farmers new emerging land reform beneficiaries and small‐scale AgriBEE farmers) o Needs within the commercial agricultural sector (per sub‐sector groupings where
specific needs for such were identified ndash both on‐farm needs and within the secondary sub‐sector or related agri‐businesses)
o Needs of the Department of Agriculture Fisheries and Forestry (DAFF) To further guide and direct the identification and selection of scarce and critical skills the following factors or criteria that could reflect the importance (impact and effect) of a skills shortages were developed as an identification framework
1 Basic Skills Development Promoting basic literacy and numeracy and raising the base level of education for the sector improving the work and livelihood of existing workers
2 Employability Making the employee more employable by improving the fit between their skills and the sector needs
3 Enterprise Viability Improving the capability and feasibility of the enterprise by increasing its effectiveness of or possibilities for profit generation etc
4 Enterprise Sustainability Allow enterprises to survive and grow over an extended period of time without compromising the value of renewable resources thereby creating long‐term meaningful employment for larger numbers of people
5 Sector Growth Enabling the sector to develop or pursue new opportunities or improve the effectiveness of current operations
6 Sector Competitiveness Enabling the sector to compete more effectively in the international arena improving market intelligence and interpretation productivity cost efficiency etc
7 Human Resource Development Capacity Improving the access to quality provision of training to the agri sector
Based on this research and consultation framework the following skills development needs and priorities were identified
Agriculture Sector Analysis 33
AgriSETA June 2010
GENERAL NEEDS SMALL‐SCALE FARMER
NEEDS COMMERCIAL SECTOR
NEEDS DAFF NEEDS
RECRUITMENT RELATED SKILLS NEEDS Primary agriculture is the entry point into the world of work for large numbers of people in rural areas However the sector has negative connotations amongst sections of the youth and in parts of the country and is viewed as a last resort for some in the search for employment) The effect is that despite an unemployment rate of approximately 26 (now over 30) farmers find it difficult to recruit workers to meet seasonal demands This has resulted in the government approving the contracting of foreign labour to meet such temporary needs (workers are recruited mainly from Zimbabwe and Mozambique)
Labour in this farming sector is provided primarily by family members and no real recruitment constraints can be identified
The agricultural sector still manages to attract technical and management skills as it is perceived to include a better lifestyle and there is a strong tradition of agriculture in SA Increasing crime related security risks associated with farming may have a negative impact
The Department has identified a number of occupations in which they are experiencing long‐term vacancies Some of these result from a general shortage of such skills in SA while others arise from the inability of the public sector to compete with the private sector (less favourable employment image working conditions and equity considerations) Priority vacancies include Veterinarians Agricultural
Engineers Plant Health
Specialists Agricultural
Statisticians Plant Health Pest Risk
Analysts ICT Specialists Agricultural
Economists Agricultural Food and
Quarantine Technicians
Agro‐meteorologists Pasture Scientists Plant Production
Specialists Specialised Food
Analysts SKILLS GAPS RELATED NEEDS
bull Low literacy and numeracy levels ndash both amongst workers within the sector at large and at ownermanager level in many of the small‐scale farming
bull Farm management
Farm Management (Mainly owners managers) bull Farm management amp
entrepreneurship bull Resource
management and record keeping
bull Financial planning
A critical constraint is the poor educational levels of a large proportion of the labour force in the sector demanding a considerable effort and investment in ABET and other life skills
A particularly big need exists for skills upgrading amongst Extension Officers ndash particularly with regard to redress the historical neglect of small‐scale farmers and resource strapped farmers
Agriculture Sector Analysis 34
AgriSETA June 2010
Agriculture Sector Analysis 35
GENERAL NEEDS SMALL‐SCALE FARMER
NEEDS COMMERCIAL SECTOR
NEEDS DAFF NEEDS
skills (and general management skills in other agricultural businesses) coupled with a business orientation and entrepreneurship skills
bull A general need to increase compliance with environmental occupational health and safety animal welfare produce safety and hygiene standards regulations and requirements (local and international standards)
and management bull Project management bull Business plan
development Marketing and processing bull Processing and
packaging bull Transport
management bull Marketing produce
including branding bull Planning for
marketing bull Knowledge of
markets Technical knowledge and skills bull Production
management (related to specific enterprise)
bull Demonstration of production techniques
bull Natural resources management
Mechanical knowledge bull Farm maintenance bull Repairs of machinery
and equipment bull Electrical
maintenance and installation
programmes Need for improved management skills and relevant technological knowledge for increasing productivity levels and improved production methods Rising importance for environmentally responsible production and processing management systems Rising competitive and international markets increases need for business and marketing abilities among owners and managers Increasing requirements for compliance with environmental health and safety and international trade standards Information technology although not a priority is increasing in importance Business management ability is becoming increasingly important as more farmers are making decisions about restructuring their businesses diversification and developing supplementary sources of income
Critically improved farm management and business skills within an agricultural context to support the majority of BEE and emerging farmers Skills upgrading requirements for existing Extension Officers include bull Agricultural
economics bull Agricultural
management bull Business and
financial management
bull Technical and production related skills including o Animal husbandryo Poultry o Crop production o Horticulture
SKILLS SHORTAGES Generally SA has a shortage of entrepreneurs and people who have the business acumen drive motivation and
The profile of these farmers reflects a large contingent of older and less educated people who are generally less flexible tend to stick to
The commercial agri sector will increasingly have to compete in the global market and the ever increasing need to increase productivity to
DAFF us experiencing problems are especially sourcing people in specialised science related fields (learning fields experiencing few
AgriSETA June 2010
Agriculture Sector Analysis 36
GENERAL NEEDS SMALL‐SCALE FARMER
NEEDS COMMERCIAL SECTOR
NEEDS DAFF NEEDS
perseverance to become a successful farmer Given the high risks involved in the agricultural sector (natural elements outside onersquos control) the agri sector does not compete successfully for this ldquoscarce resourcerdquo Moreover as with other professional and skilled occupations there is a tendency for younger qualified people to move to urban areas
known practices and are less likely to experiment with new technology Within this target group candidates with good entrepreneurial ability are scarce There is a perceived shortage of Agricultural Extensionists and advisors to assist this target group However a large pool of young unemployed graduates exists who could assist such emerging farmers if they were mobilised and made accessible to farmers Similarly the potential pool of retired commercial farmers who could serve as mentors to this target group
remain profitable and viable it can be stated that many of the existing farmers and managers owners lack business management and entrepreneurial orientation Equity policy and the need to become BEE compliant requires that commercial enterprises appoint and develop black owners directors managers Changing local and global consumer preferences require farmers to change traditional farming methods and practices Skills and knowledge requirements include bull Global food and
international quality standards
bull Product traceability requirements
bull Organic produce and products
Specific occupations identified as being in short supply are
bull Production Managers (food processing)
bull Product specialisation to international specifications (research skills)
bull Forklift drivers heavy vehicletruck drivers and mobile plant operators
bull Experienced and competent artisans (millwrights electricians fitters
enrolments andor pass rates at HET institutions with the result that too few qualified persons come onto the labour market) Examples of such skills shortages identified by the Department include Agricultural Engineers bull Plant Health
Specialists (Nematology Entomology Plant Pathology)
bull Statisticians (specialised agricultural knowledge)
bull Plant Health Pest Risk Analysts
bull Agricultural Economists (production and resource economists)
bull Agricultural Food and Quarantine Technicians
bull Agro‐meteorologists Early warning Specialists
bull Pasture Scientists bull Plant Production
Specialists (eg ornamental crops hydroponics)
bull Specialised Food Analysts (pesticide residue analysts processed food and dairy analysts wine and spirit analysts)
AgriSETA June 2010
Agriculture Sector Analysis 37
GENERAL NEEDS SMALL‐SCALE FARMER
NEEDS COMMERCIAL SECTOR
NEEDS DAFF NEEDS
and turners bull Agricultural
Equipment Technicians
bull Pest and weed controllers
bull Horticultural specialists
LABOUR SHORTAGES AND RELATED SKILLS NEEDS Given an employment rate of some 26 (2009 currently estimated at over 30expanded definition) per definition there cannot be a labour shortage It is however difficult for people who have never worked before to integrate into the agricultural sector workforce Coupled with an aging workforce (30‐60 being over 40) means that most agri enterprises will within the next 5‐10 years be looking at replacing a large proportion of their workforce There could be an insufficient pool of people willing and able to participate The impact of HIVAIDS is also not always factored in to understanding the diminishing pool of resources available Labour shortages have been reported within selected geographical areas and in particular occupations Examples include cane cutters in the sugar industry chicken catchers in the poultry industry pickers in the fruit industry and animal handlers in feedlots as well as dairy parlour workers It is however believed that these shortages may reflect a recruitment problem as a result of the very harsh working conditions and the relatively poor remuneration (which makes these occupations unpopular) At present such ldquoshortagesrdquo are addressed through contracting labour from neighbouring countries
AgriSETA WSP analyses
Skills demand in the commercial agricultural sector
Information for demand for skills from WSP data is available for 1 673 employers who submitted their WSPs for the 200910 period The table below shows data on sub‐sector WSP submission relative to size of the sub‐sector as well as subsector data from all registered organisations and those who submitted WSPs Data for registered employers shows that there were 239 076 employees employed by the 17 234 registered organisations As previously stated 97 898 employees were employed by the organisations submitting WSPs This constitutes 41 of employees employed by registered organisations
Table 20 Employment and sub‐sector data drawn from WSP analyses
Sub‐sector
All Re
gistered
Employers
Small employers (0‐49)
Med
ium and
large
employers (50+)
Total W
SPs received
Total W
SPs received
as of
all registered em
ployers
WSP
received med
ium and
large orgs
WSPs received
as of
med
ium amp large em
ployers
WSPs received
small
employers
WSPs received
as of small
enterprises
EmployeesPer
Profile
CoffeeTea 40 33 7 9 23 5 71 4 12 483 Fibre 1 710 1 676 34 34 2 22 65 12 07 6 539
AgriSETA June 2010
Agriculture Sector Analysis 38
Sub‐sector
All Re
gistered
Employers
Small employers (0‐49)
Med
ium and
large
employers (50+)
Total W
SPs received
Total W
SPs received
as of
all registered em
ployers
WSP
received med
ium and
large orgs
WSPs received
as of
med
ium amp large em
ployers
WSPs received
small
employers
WSPs received
as of small
enterprises
EmployeesPer
Profile
Fruit 371 277 94 162 44 76 81 86 31 27 873 Grain 648 581 67 77 12 48 72 29 5 22 129 Milling 335 279 56 61 18 35 63 26 9 4 630 Pest Control 213 209 4 8 4 2 50 6 3 119 Poultry 391 305 86 66 17 46 53 20 7 19 187 Primary 12 121 10 776 1 345 1144 9 513 38 631 6 136 034 Red meat 1107 1 018 89 70 6 45 51 25 2 7 475 Seed 167 149 18 24 14 13 72 11 7 2 127 Sugar 71 45 26 13 18 10 38 3 7 10 478 Tobacco 60 46 14 5 8 3 21 2 4 2 002
Totals 17 234 15 394 1 840 1 673 10 818 44 855 16 239 076
Source 1 AgriSETA WSP 2009 data
Only 10 of all registered employers submitted WSPs for the 200910 period Of these 49 were medium and large sized employers and 51 small However only 16 small employers submitted their WSPs relative to the number of registered small employers and 44 medium and large employers submitted WSPs relative to the number of registered medium and large employers As such skills demand statistics provides more representative data on the requirements of medium and large employers Data for skills demand in the commercial agricultural sector is based on data for permanent employees as well as casual and seasonal employees
Skills demand forecasting by AgriSETA
Forecasting for skills demand the AgriSETA has estimated that the demand for skilled employees at different levels in the next few years is 510 686 This is based on WSP data analyses over the last 5 years and projected demand for the formal commercial agricultural sector and factoring in the demand that at maximum would result from completion of the land restitution programme in South Africa The table below reflects the skills that are on demand as well as the estimates for demand over the next five years by major occupational category35
35 AgriSETA 2010
AgriSETA June 2010
Table 21 Demand for skills by occupational category
Major Occupation (OFO)Estimated Demand
Group Title1 Managers (commercial and small emerging farmers) 264 3702 Professionals 4 1413 Technicians and Trade workers 8 9255 Clerical and administrative workers 8006 Sales workers 4007 Machinery operators and drivers 5 8008 Elementary workers 226 250
Total 510 686Source AgriSETA WSP data and SSP demand forecasts
Research needs going forward
As has been set out in the sector analysis and the scenarios derived from that analysis the sector is faced by both significant and profound change and also great uncertainty It therefore follows that the task of focussing limited resources (basically levy income in the formal sector and NSF funds for the emergent farming sector) is difficult Whilst the general thrust of training remains broadly as described in the 2006‐10 SSP Updates some considerable work is required to achieve targeted effective interventions during the 2011‐2016 period The following research questions will need to be addressed in preparing the next SSP
bull In relation to the managers and owner‐managers of commercial farms and enterprises what skills are needed to enable them to help bring about the more optimistic scenario and manage the risks associated with the less optimistic ones
bull In terms of professional and technical competencies do the current education and training institutions coupled with the learning programmes available through the AgriSETA (learnerships skills programmes and the like) meet the needs of the sector
bull In the emerging agricultural sector do the current programmes funded by sources external to the AgriSETA (eg NSF) meet all the identified needs What gaps are there and how should they be addressed
bull In relation to governmentrsquos growth strategy and industrial action plans what skills are required for developing the aquaculture sub‐sector What programmes are available How can the SETA support the skills needs for this sub‐sector
bull Given the increasing levels of casual and contract labour how can skills be developed to meet the needs of the formal commercial sector and the emerging enterprise sector
bull How can the demand in each of the priority areas be quantified and agreement be reached on numbers of people to be trained
Agriculture Sector Analysis 39
AgriSETA June 2010
SECTION 3 Skills Gaps and scarce skills
Scarce skills at the DAFF
The level of scarce skills at DAFF can be determined by the vacancy rate While the average vacancy rate in the department as at 31 March 2009 was 17 there were some posts that had very high vacancy rates as reflected in the table below Indicating the possibility that the Department is experiencing difficulties in finding suitable candidates in the South African labour market to fill these posts
Table 22 Scarce skill occupations and vacancy rates (DAFF March 2009) Critical occupations Number of posts Posts filled Vacancy rate ()
Agricultural animal oceanography forestry and other sciences
167 119 287
Engineering sciences related 2 1 50Engineers and related professions 13 6 538Farming forestry advisors and farm managers 11 4 636Finance and economics related 73 53 274Horticulturists foresters agricultural and forestry technicians
350 221 369
Legal related 6 4 333Mechanical engineering technicians 3 2 333Risk management and security services 6 4 333Social sciences related 1 0 100Veterinarians 34 24 294
Source DAFF Annual Report 20082009
Skills are also scarce at senior management level The department also reports on difficulties it has filling senior management services vacancies with some of them staying vacant for up to twelve months because no suitable candidates can be found The department would then resort to re‐advertisement and head hunting This was the case with 22 of 18 SMS posts in March 2009
Scarce skills in the commercial sector
The following occupations have previously been projected as scarce (extremely hard to fill vacancies) by AgriSETA in the commercial agricultural sector over the next five years
Table 23 Scarce and critical skills in the commercial agricultural sector
Occupation Code
Group Occupation Critical Skills Intervention Comments
139903 Managers Laboratory Manager
Technology AI nutrition
HET
221101 Professionals Accountant (General)
General HET
221102 Professionals Management Accountant
Farm financial management
HET Focus on support advice to farmers new enterprises
222101 Professionals Commodities Trader
Export administration supply chain
FET Learnership Skills
Agriculture Sector Analysis 40
AgriSETA June 2010
Agriculture Sector Analysis 41
Occupation Code
Group Occupation Critical Skills Intervention Comments
management Programme
224301 Professionals Economist Agricultural HET
Mainly for Department of Agriculture and para statals commodity organisations
233101 Professionals Chemical Engineer
Chemical processes in food production
HET Industries such as sugar processing
233301 Professionals Electrical Engineer
Installation and maintenance
HET Processing industry
233401 Professionals Electronics Engineer
Computerised production prosesses
HET Processing industry
233501 Professionals Industrial Engineer
Productivity and efficiency
HET Processing industry
233904 Professionals
Instrument Engineer (Defence Force)
Installation and maintenance
HET
Not for defence ‐ sugar industry
233502 Professionals Mechanical Engineer
FETHET Equity reasons
233902 Professionals Agricultural Engineer
Farm layout and infrastructure
HET Mainly in Government
311101 Technicians and trades workers
Agricultural Technician
Installation and maintenance
FETHET
234102 Professionals Agricultural Scientist
Agri research HETFET Especially in horticulture
234201 Professionals Chemist HET Processing industry
234202 Professionals Food Technologist
Food safety HACCP
FETHET Across sector
234701 Professionals Veterinarian HET Mainly in Government
311101 Technicians and trades workers
Agricultural Technician
Farm infrastructure
FET Mainly needed in government
311401 Technicians and trades workers
Chemistry Technician
FETHET EE reasons
312907 Technicians and trades workers
Chemical Engineering Technician
FET Learnership
Mainly EE reasons
312402 Technicians and trades workers
Electronic Engineering Technician
Weak stream production infra
FETHET Mainly tobacco industry
233904 Professionals
Instrument Engineer (Defence Force)
Instrument technician
FET
Occupation needed Instrument Technician (not defence force) Mainly sugar processing sector
321202 Technicians and trades workers
Diesel Motor Mechanic
FET Learnership
To include tractor mechanic
321204 Technicians and trades workers
Small Engine Mechanic
Agricultural equipment
FET Learnership
Throughout sector
AgriSETA June 2010
Agriculture Sector Analysis 42
Occupation Code
Group Occupation Critical Skills Intervention Comments
322301 Technicians and trades workers
Metal Fabricator
Artisan FET Learnership
322303 Technicians and trades workers
Welder Welder (First Class)
Artisan FET Learnership
323203 Technicians and trades workers
Fitter‐Welder Artisan FET Learnership
Mainly sugar ndash multi‐skilled
323202 Technicians and trades workers
Fitter And Turner
Artisan FET Learnership
Tobacco and sugar
323501 Technicians and trades workers
Millwright Artisan FET Learnership
Wide‐spread need
341101 Technicians and trades workers
Electrician (General)
Artisan FET Learnership
Wide‐spread need
342101 Technicians and trades workers
Air‐Conditioning And Refrigeration Mechanic
Artisan FET Learnership
Sugar pack houses cold chain
Source AgriSETA Sector Skills Plans
Supply of skills
South Africarsquos agriculture skills are produced in high schools agricultural colleges FET colleges and Higher Education institutions In high school a large cohort of learners take Agricultural Science as a subject In 2003 there were 42 Agricultural High Schools offering Agricultural Science as a subject These students and those in high schools taking the subject could progress to taking agriculture as a focus area for further education In 2004 there were 10 FET colleges offering vocationally directed agricultural programmes These FET colleges offered complete qualifications and short courses Eleven Colleges of Agriculture can offer qualifications up to degree level and 19 universities offer qualifications in Agriculture ranging from agricultural economics animal and plant sciences and horticulture among others at under and post graduate levels (Department of Agriculture 2006) While long term planning of skilling of new entrants in the sector can be done through close consultation between the sector agricultural schools and colleges FET colleges and HET institutions so that they teach relevant skills there are other avenues for training for those who are already employed in the sector for example skills programmes and learnerships There are 15 registered qualifications for the primary agriculture sub sectors Currently AgriSETA has 94 registered learnerships that can address the skills needs of the identified scarce skills These are captured in Appendix 2 AgriSETA has approved accredited a number of training providers across the country to deliver the theoretical and practical components of these learnerships These include agricultural colleges FET colleges and private providers Currently the AgriSETA has 246 registered and approved providers distributed nationally as follows
AgriSETA June 2010
Table 29 AgriSETA approved training providers (2010) Province Number of providers
Gauteng 72
(29)
KwaZulu Natal 20
(8)
Limpopo 35
(14)
North West 30
(12)
Northern Cape 3
(1)
Free State 15
(6)
Mpumalanga 14
(6)
Western Cape 26
(11)
Eastern Cape 31
(13) Total 246
The providers are small to large organisations In primary agriculture small providers appear to offer the most training in rural areas and community projects (AgriSETA 2010) Most of the operating providers will be in FET colleges and agricultural colleges The AgriSETA is unable to meet the total demands for skills across the duality of their sector There seems to be fairness in the approval of training for both permanent and casual and seasonal workers In 200809 the AgriSETA approved 559 learnerships as follows
Table 30 AgriSETA learnerships approved for grant purposes (2008‐2009)
Source AgriSETA learnership data analysis
Agriculture Sector Analysis 43
AgriSETA June 2010
Agriculture Sector Analysis 44
Provision of skills programmes in the same year attracted grants for 2 706 employees
Table 31 Participation by learners in skills programmes in the AgriSETA (200809)
Source AgriSETA Skills programmes data analysis
AgriSETA June 2010
APPENDIX 1 Skills demand in the Department of Agriculture Forestry amp Fisheries (200809)
Source DAFF Annual Report 2008‐20009
Agriculture Sector Analysis 45
AgriSETA June 2010
Agriculture Sector Analysis 46
Appendix 2 AgriSETA registered learnerships Registered Learnership NQF Level SAQA Registration NoLearnership in Agri Sales and Service 4 22 Q 220001 20 178 4Learnership Agricultural Machinery Technician 2 22 Q 220007 20 160 2Learnership in Specialist Agricultural Machinery Technician 5 22 Q 220009 21 258 5Agri Trade Processes 2 22 Q 220013 30 125 2FETC Meat Examination Applying Basic Business Principles 4 30 Q 3000 2823 164 4Further Education and Training Certificate Seed Marketing Execute Seed Trials 4 22 Q 220025 21 126 4Further Education and Training Certificate Seed Research and Development Certify as Seed Unit 4 22 Q 220027 21 121 4FETC Seed Research and Development Conduct a Field Inspection of a Seed Unit 4 22 Q 220028 20 120 4Seed Research and Development Operations Operate in a Team 3 22 Q 220020 22 121 3Seed Research and Development Operations Apply Basic Business Principles 3 22 Q 220021 22 121 3National Certificate Seed Processing and Packaging Operate in a Team 3 22 Q 220026 21 123 3Sugar Industry Technical Maintenance worker 2 22 Q 220011 39 128 2National Certificate Sugar Manufacturing and Refining Technical Maintenance 3 30 Q300003 23 146 3Further Education and Training Certificate Manufacturing Technical MaintenanceProduce Components by Performing Engineering Turning Operations
4 30 Q 3000 1321 173 4
FETC Manufacturing Technical Maintenance Produce Components by Performing Milling Operations 4 30 Q 3000 1521 173 4 FETC Manufacturing Technical Maintenance Develop and Fabricate from Complex Drawing 4 30 Q 3000 1420 173 4National Certificate in Sugar Technology 5 22 Q 220036 22 140 5Further Education and Training Certificate Sugar Processing 4 22 Q 220035 31 144 4National Certificate in Sugar Technology Processing Sugar Refining 2 22 Q 220037 28 124 2National Certificate in Sugar Technology Processing Juice Preparation 2 22 Q 220038 28 124 2National Certificate in Sugar Technology Processing Crystallisation 2 22 Q 220039 27 122 2National Certificate in Sugar Technology Processing Laboratory Practice 2 22 Q 220040 25 124 2National Certificate in Sugar Technology Processing Extraction 2 22 Q 220041 28 122 2NC Rooibos Production Applying Basic Business Principles 2 30 Q 3000 2427 130 2 NC Rooibos Processing Applying Basic Business Principles 2 30 Q 3000 2224 123 2 National Certificate Cigarette Production 3 22 Q 220046 23 121 3
AgriSETA June 2010
REFERENCES AgriSETA 2010 AgriSETA 20082009 Annual report Pretoria AgriSETA Agricultural Research Council httpwwwarcagriczahomeasppid=272 Avert South African HIV and AIDS statistics Available on httpwwwavertorgsafricastatshtm Centre for Development Enterprise 2008 Land reform in South Africa Getting back on track CDE Research No 16 DAFF 2010 Quarterly economic review of the agriculture sector Pretoria DAFF DAFF 2009 Annual report 20082009 Pretoria DAFF Department of Agriculture 2008 Strategic plan 2008 Pretoria Department of Agriculture DTI An introduction to the South African economy Available on httpwwwthedtigovzapublicationsagroprocessinghtm Eastern Cape Provincial Government Eastern Cape Provincial Growth and Development Strategy 2004 ndash 2014 Economic Commission for Africa 2009 Developing African agriculture through regional value chains Addis Ababa Economic Commission for Africa Economic Report Free State Province 2005 Provincial Growth and Development Strategy 2005 ndash 2014 GCIS 2010 SA Yearbook 200910rdquo Agriculture forestry and fisheries Pretoria GCIS Greenberg S 2010 Status report on land and agricultural policy in South Africa 2010 Institute for Poverty Land and Agrarian Studies School of Government University of the Western Cape Research report Ingelozi Management Solutions 2008 HIVAIDS in the South African agricultural sector Towards the development of a long term intervention Research report KwaZulu Natal Provincial Government 2006 KwaZulu Natal Provincial Growth and Development Strategy Limpopo Provincial Government Growth and Development Strategy 2004 ndash 2014 Mhone G (2000) Enclavity and Constrained Labour Absorbtive Capacity in Southern African Countries Geneva International Labour Office Moyo S The Agrarian question and the developmental state in South Africa In Edigheji O et al 2010 Constructing a democratic developmental state in South Africa HSRC PRESS
Agriculture Sector Analysis 47
AgriSETA
Agriculture Sector Analysis
National Treasury Republic of South Africa 2010 National Budget 2010 ndash National Budget Review 2010 Pretoria National Treasury Northern Cape Provincial Government Agriculture and agro‐processing sector strategy North West Provincial Government North West Provincial Growth and Development Strategy 2004 ndash 2014 Province of the Western Cape 2008 The Ikapa growth and development strategy White Paper SABCOHA SA Business Coalition on HIV and AIDS wwwsabcohaorg SACAU httpwwwsacauorghostingsacauSacauWebnsfHomehtmOpenForm South African Government 2010 20102011 ndash 20122013 Industrial Policy Action Plan Republic of South Africa Statistics South Africa 2005 Census of commercial agriculture 2002 Report No 110201 Pretoria Statistics South Africa Statistics South Africa 2009 Census of commercial agriculture 2007 Statistical release P1101 Pretoria Statistics South Africa Statistics South Africa 2010 General household survey 2009 Statistical release P0318 Pretoria Statistics South Africa Statistics South Africa 2010 Gross domestic product first quarter 2010 Statistical release P0441 Pretoria Statistics South Africa Statistics South Africa 2010 Quarterly labour force survey Quarter 1 2010 Statistical release P0211 Pretoria Statistics South Africa Vink N amp van Rooyen J 2009 The economic performance of agriculture in South Africa since 1994 The implications for food security Pretoria DBSA development planning division working paper series No 17 Webster E 2004 the Dual Economy from a book by Van Holdt K and Webster E Work restructuring and the Crisis of Social reproduction and 10 years of restructuring post apartheid workplaces University of Natal Press Workinfocom httpwwwworkinfocomfreesub_for_legresdatalraempassoc3htm Xingwana L 2008 Challenges and Opportunities for Land and Agrarian Reform towards 2025 Speech delivered at the Agri‐Consultation Protea Ranch Hotel Polokwane 30 July 2008
- Table of contents
- SECTION 1 THE AGRICULTURAL LANDSCAPE
- 11 Size and shape of the Agricultural sector
-
- Overview
- Distribution of agricultural production
- The structure of the agriculture sector in South Africa
- Categories of farming enterprises
- Employment trends
- Employment categories and remuneration
- Stakeholders in the Agricultural sector
-
- National government departments
- Sector representatives
-
- 12 Factors impacting development in the Agriculture sector
-
- Future sector economic growth and development
-
- South African sector growth plans (IPAP2)
- International Trade
- Global recession and rise in food prices
-
- Land reform
- Reliance on imports
- Water
- The labour market
- Consumer trends
- HIVAIDS
- Farm safety and security
- Broad-based Black Economic Empowerment
-
- Conclusions and scenarios
- SECTION 2 DEMAND FOR SKILLS
-
- AgriSETA registered employers and employee coverage
- Employee coverage in the AgriSETA
-
- 21 Skills demand
-
- The National Education and Training Strategy for Agriculture (AET Strategy)
- AGRISETA sector skills planning demand data (2008-2009)
- AgriSETA WSP analyses
-
- Skills demand in the commercial agricultural sector
-
- Skills demand forecasting by AgriSETA
- Research needs going forward
-
- SECTION 3 Skills Gaps and scarce skills
-
- Scarce skills at the DAFF
- Scarce skills in the commercial sector
- Supply of skills
-
- APPENDIX 1 Skills demand in the Department of Agriculture Forestry amp Fisheries (200809)
- Appendix 2 AgriSETA registered learnerships
-
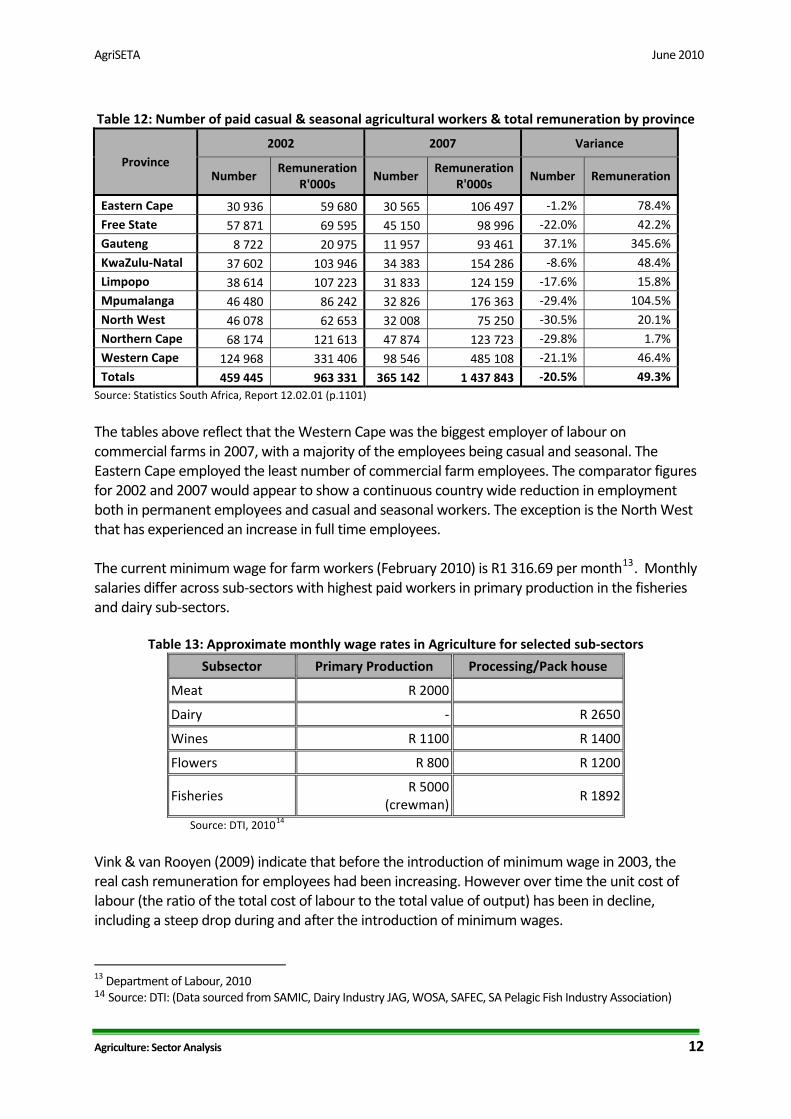
AgriSETA June 2010
Agriculture Sector Analysis 13
In 1970 for every R1 of output 16 cents was spent on labour By 1980 this has dropped to 13 cents for R1 of output By 1994 the figure had increased to 19 cents declining to 17 cents in 1998 and to 117 cents in 2001 By 2007 it had reduced to 108 cents Further research will be needed to establish the current situation but there is reason to believe that the decline has continued with wages being very low both in terms of unit costs and in relation to other groups of workers in the economy
Strictly speaking it is not the role of the SETA to engage in the complex regulatory framework for the agricultural labour market It is for the Department of Labour and NEDLAC with their employer and organised labour stakeholders to find ways of balancing the need for protection of vulnerable workers with the need to create a framework that encourages the creation of jobs and improved job security The reason that more research is needed in this area and in particular detailed discussions with industry and labour representatives is to establish
The extent to which skills development interventions can improve the prospects for job creation and improved job security and
The mechanisms that can be established to enable uninterrupted skills training in the context of casualisation and use of contract and seasonal labour
Stakeholders in the Agricultural sector
National government departments
There are a number of national government Departments and spheres involved in the challenges of the agricultural sector The following table sets out the broad contribution that each department is intended to make
Table 14 Government department roles in relation to Agriculture Department Role
Department of Agriculture Forestry and Fisheries Agricultural policy and support Department of Rural Development and Land Reform Land Reform and land claims settlements Department of Economic Development Economic planning National Treasury Macro economic policy Department of Trade and Industry Industrial strategy (IPAP 2) Department of Water Affairs The management of water supply Department of Labour Labour market policy Department of Higher Education and Training HRD and skills planning and SETAs In relation to public spending on agriculture the agricultural national budget constitutes about 05 of the national budget The figure below reflects trends in national budgeting for the agricultural sector between 19967 and 201112 Some analysts15 have argued that state expenditure on agriculture shows lack of prioritisation of the sector especially considering that the budget remains lower than it was in the late 1980s when it now caters for a greater number of farmers than it did during apartheid segregation
15 Greenberg 2010 p 2
AgriSETA June 2010
Figure 2 National budgets for Agriculture 1996‐2011 (adjusted for inflation)
Source Greenberg 2010
The Department of Agriculture Forestry and Fisheries (DAFF) is responsible for the agricultural sector The department works with various organisations to promote the interests of the sector
bull It registers all South African Pest Control Association (SAPCA) qualified inspectors bull It works with the Agricultural Research Council for research to optimise the control of
migratory pests bull The Directorate on Marketing works with the National Agricultural Marketing Council
(NAMC) on issues related to equitable access to markets including policy formulation issuing of permits and coordinating inter‐departmental relations to enhance marketing
bull Historically the Department has employed a large number of extension officers located in farming communities who have supported and advised farmers This service has been in decline in recent years but remains an important aspect of state support to the sector
The above roles will be subject to some review in the context of IPAP 2 and also the debates around the role of the state in the economy The issue is not only levels of spending but also clarifying the role of government in relation to the business of the sector
Sector representatives
There are three major umbrella organisations representing the interests of farmers AgriSA TLUSA and the National African Farmers Union of South Africa (NAFU) AgriSA and TLUSA represents both commercial farmers and cooperativesrsquo interests through its engagement at national and international level AgriSA is a member of the Southern African Confederation of Agricultural Unions (SACAU) a regional farmersrsquo union for farmers in Southern Africa AgriSA has structures in all the provinces except Limpopo
Agriculture Sector Analysis 14
AgriSETA June 2010
Agriculture Sector Analysis 15
NAFU is a union for predominantly previously historically disadvantaged smallholder farmers with a membership base including farmers agribusinesses farmersrsquo organisations corporations and individuals who support their goals NAFU is represented by different unions in all the provinces There are other employer organisations who are not affiliated to AgriSA and NAFU including
bull Agricultural Industrial and Medium Employers Organisation bull Agricultural Mining and Industrial Chemical Manufacturersrsquo Association bull Agrilabor Employersrsquo Organisation bull Algoa Meat Traders Association bull East Coast Poultry Producers Employersrsquo Association bull East London and District Meat Traders Association bull Fertiliser Industry Employersrsquo Organisation bull Landbou Werkgewersorganisasie (Workinfocom) bull Red Meat Producersrsquo Association
The Agricultural Research Council is an autonomous statutory body that provides research to DAFF and the provincial departments of agriculture Figures available for South Africarsquos investment in agriculture research and development show that South Africa was above international norms of investment in RampD which are 053 of agricultural GDP for developing countries and 236 for developed countries In South Africa in 2000 agricultural RampD investment in relation to agricultural GDP was 30416 There are six major sources of credit for farmers banks (50) agricultural cooperatives and agribusiness (12) the Land Bank (21) private creditors (8) other creditors and financial institutions (9) and government (1) (GCIS 2010)
12 Factors impacting development in the Agriculture sector Several international and local factors impact on the productivity of the agricultural sector and its growth Key amongst these are
Growth of the South African economy and rising consumer demand International trade and trade agreements The global recession and rise in food prices The land reform programme Reliance on imports Water availability Changing consumer patterns and demands (eg organic food stuffs) Technological changes and mechanisms Quality standards Farm safety and security Broad‐based black economic empowerment Legislation Skills demand and supply HIVAIDS
16 Vink amp van Rooyen 2009
AgriSETA June 2010
These key factors are clustered and discussed below
Future sector economic growth and development
South African sector growth plans (IPAP2)
The 20102011 ndash 20122013 Industrial Policy Action Plan (IPAP) identifies five structural challenges that existed in the South African economy before the global economic downturn and which have been exacerbated by the recent economic crisis These challenges were evident even during the time South Africa was experiencing relatively high growth rates between 2005 and 2007 and have continued during the recession These challenges are
1 Structural imbalances in the growth path including growth that is lagging behind other medium and low income countries
2 Uneven performance of the manufacturing sector with some divisions like the automotive sector experiencing exponential growth while other sectors have stagnated
3 Employment growth being sustained by credit extension and consumption rather than by productive sectors leading to a large current account deficit
4 Low profitability of manufacturing 5 Low savings and investment from financial sector growth Only 52 of private credit was
extended to fixed investment in 2008 Key sectors have been identified for IPAPrsquos focus including agro‐processing which has a diverse group of industries and sub‐sectors including food processing beverages aquaculture horticulture medicinal aromatic and flavourants Key action plans for the agro‐processing sector are identified in IPAP2 as
Development of a National Food Control Agency to consolidate the sector Development of aquaculture to supplement dwindling wild fish stocks Designating specific areas for utilisation of aquaculture Development of the organic food sector Development of the small milling industry Enhancing competitiveness in fruit and vegetable canning Improving beneficiation of Rooibos and Honeybush products (IPAP2 2010)
International Trade
South Africa is a major exporter of Agricultural produce In particular South African fruit and fruit‐derived products such as wine and fruit juice are competitive in the global market However in many sub‐sectors where export potential exists ndash grain and meat ndash serious problems face the industry A key challenge is the uneven playing field experienced by South African exporters Major global competitors include the United States and the countries of the European Union where government subsidies in various forms are in place No such subsidies are in place in South Africa making it difficult if not impossible for South African agricultural produces to enter developed country markets due to the prices that they have to ask for products I In addition the value of the Rand has fluctuated from levels of around R10 to the US dollar to as little as R7 to the dollar When the Rand is strong export becomes difficult because it costs more in the case of the move from R10 to R7 a 30 cost increase for the importer It is impossible to
Agriculture Sector Analysis 16
AgriSETA June 2010
Agriculture Sector Analysis 17
predict whether the World Trade Organisation negotiations known as the DOHA Round will achieve progress in the coming years Historical evidence is that during periods of global recession developed economies become more protective not less and so the current outlook is not good Nor is it possible to predict the value of the Rand though current thinking in government is to move toward a weaker Rand to encourage exports These are two key variables that will need to be factored into the different sector growth scenarios for the future
Global recession and rise in food prices
Economic growth slowed down significantly in sub Saharan Africa and in South Africa in 2009 but there appear to be signs of recovery GDP growth in the region declined from about 6 in 2004 ndash 2008 to about 18 in 200910 GDP growth in South Africa was 16 in 2009 17and rose to 46 in the first quarter of 201018 though much of this is related to the income derived from the 2010 FIFA World Cup and may not be sustained Projections are generally for a slow revival with a set back after the slight rise resulting from the World Cup A return to the 6 levels of the 20078 could take some years The global recession reduced the demand for African exports and reduced capital flows to the region but it is anticipated that the demand for mineral resources by Asian and Western powers will result in both the expansion of exports and expanded foreign direct investment The competition between India and China for African markets is also expected to boost trade to the benefit of African suppliers South Africa is expected to particularly benefit from direct foreign investment from China and India China has already become South Africarsquos largest market for exports and supplier of imports19 Rising food prices have forced governments around the world to control prices of maize bread rice and dairy products In South Africa ldquofood price inflation between December 2005 and December 2006 averaged 788 rdquo20 Although efforts are being made to reduce barriers to poorer families in relation to basic food there has been no move to subsidise food generally This may change though the space for significant levels of support is restricted because of reduced revenue from income taxes resulting from the recession The global credit crunch and recession have meant a reduction in public expenditure and funding which has affected the agricultural sector21
Land reform
In South Africa specifically land reform has a significant bearing on food security and agriculturersquos contribution to GDP The objective of the land reform programme is to transfer 30 of agricultural land to black ownership by 2014 (deferred to 2025) to ensure more equitable access to land by historically disadvantaged people and to increase their participation in agricultural activities22 Land reform has been informed by four processes23
17 Department of Agriculture Forestry and Fisheries 2010 18 Stats SA 2010 19 Department of Agriculture Forestry and Fisheries 2010 20 Department of Agriculture Forestry and Fisheries 2010 ‐2011 Strategic Plan 21 Economic Commission for Africa 2009 22 Xingwana 2008 23 CDE 2008
AgriSETA June 2010
Agriculture Sector Analysis 18
Land restitution involving returning land or providing financial compensation to those whose land was dispossessed during apartheid
Land redistribution transferring more land to the historically disadvantaged Tenure reform modernising land tenure rules and access to land ownership and Providing financial support for the development of emerging farmers
In relation to progress with land reform by September 2009 only 69 of agricultural land (about 567 million hectares) had been transferred and a majority of the beneficiaries have not yet occupied the land due to lack of infrastructure input or technical support The following table gives an indication of the progress of land reform since the inception of the first democratic government
Table 14 Land transfers and beneficiaries ‐ 1994 to 2009
Province Redistribution and tenure Restitution Total Hectares Beneficiaries Claims Hectares Beneficiaries Hectares Beneficiaries
Eastern Cape 675 353 357 25 633 16 201 94 834 215 201 448 191 240 834
Free State 799 350 291 7 721 2 662 47 615 40 893 397 906 48 614
Gauteng 286 34 513 7 328 13 159 9 476 70 179 43 989 77 507
KwaZulu Natal 690 547 414 67 761 14 752 642 447 433 168 1 189 861 500 929
Limpopo 291 91 235 7 403 3 382 513 024 220 227 604 259 227 630
Mpumalanga 444 322 839 13 950 2 694 399 876 225 877 722 715 239 827
Northern Cape 271 952 744 2 773 3 682 539 620 100 554 1 492 364 103 327
North West 300 268 566 40 539 3 709 373 642 172 963 642 208 213 502
Western Cape 223 122 304 12 750 15 546 3 769 118 165 126 073 130 915
Total 3 979 3 043 264 185 858 75 787 2 624 303 1 597 227 5 667 567 1 783 085
Source Greenberg 2010
Achievement of the 30 land reform target is being made difficult by land prices Under the willing buyer willing seller scheme the government will need R74 billion to be able to purchase enough land While resources may be available there are suggestions of lack of capacity The Department of Rural Development and Land Reform (DRDLR) was able to spend only 31 of its land reform 200910 budget in the first six months of the financial year Going forward this Department needs to identify what the real challenges are with the pace of land reform delivery so that they can be mitigated to meet the 2025 target A priority is the retention of skills skills transfer and skills development during the transfer of land as well as retention of national food production to avoid loss of production Support for new beneficiaries of land to ensure sustained productivity is derived from two main sources of funding ndash the Broadening Access to Agriculture Thrust (BADAT) and the Comprehensive Agricultural Support Programme (CASP) CASP is a conditional grant from the Department of Agriculture Forestry and Fisheries to provincial departments to support emerging farmer development Provincial farming budgets dedicated for farmer support in Mpumalanga the Free State Northern Cape and the Western Cape have risen significantly and those in KwaZulu Natal and Gauteng have witnessed a slight increase Eastern Cape and Limpopo agricultural budgets have been steady The North West is the only province where there has been a sharp decline in the share of the budget dedicated to farmer support24
24 Greenberg 2010
AgriSETA June 2010
Agriculture Sector Analysis 19
Reliance on imports
Overall the Agriculture sector contributes positively to the balance of payments ldquoSouth Africa remains food secure The value of our exports increased by 464 from R33 656 million in 200708 to R49 278 million in 200809 During the same period the estimated value of imports rose by 12 from R34 009 million to R38 401 million resulting in a positive trade balancerdquo25
South Africa depends largely on world markets for seed production and agrochemicals Regarding seed production there are only three community seed production schemes in Limpopo and Mpumalanga being piloted with state funding Ten top large companies including two South African companies and multinationals have rights to over two thirds of registered seed varieties in South Africa Despite the dominance of genetically modified and hybrid seed in some sub‐sectors like maize sunflower and sorghum open‐pollinated varieties have been resilient in South Africa enabling the possibility of alternative seed sources not dependent on technological processes26 In relation to agrochemicals deregulation and liberalisation in the fertiliser sector led to the shutdown of local production capacity and South Africa became an importer of fertiliser for the first time in 2000 There are three large players in the fertiliser sector Sasol Nitro Yara and Omnia South Africa imports an estimated 70 of fertilisers and pesticides Fertiliser prices rose by over 200 between 2006 and 2008 but dropped somewhat after that However this hike signified the volatility of the agrochemicals industry and South Africarsquos dependency on imports and the potential risk for emerging farmers and food production of this dependence on imports as the country cannot control the prices making inputs both difficult to budget for and in many cases unaffordable The price of agrochemicals is also particularly influenced by the prices of oil and the exchange rate The general understanding in relation to job creation is that a weaker Rand will improve exports and therefore enable job creation Of course the down side of this strategy is that imports become more expensive So what may be an advantage for those sub‐sectors who are expanding their export volumes those relying on imported agro chemicals will be under increased pressure
Water
Water is both an essential and scarce resource for the agriculture sector and is being threatened by climate changes Crop production relies heavily on water and yet access to water is not being addressed in a systematic way in the land reform processes Greenberg suggests that the relationship between land reform agricultural support and water resource provision is inadequate and a way to address this could be established by linking water provision to land transfer or investing in irrigation for both commercial and resource‐poor farmers However investing in irrigation in the context of water scarcity and climate change may not be the best option What could be needed is finding ways to maximise efficiency of the 60 of South African
25 Department of Agriculture Forestry and Fisheries Strategic Plan 201011 26 Greenberg 2010
AgriSETA June 2010
Agriculture Sector Analysis 20
water used for irrigation by for example using methods such as drip or micro‐irrigation which are expensive to set up but which reduce water wastage by 5‐1027 The Department of Water Affairs is responsible for managing water supply and has to give authorisation for agricultural projects and other developments The department needs to be seen as an important stakeholder in the agricultural sector
The labour market
South Africa recorded an unemployment rate of 243 in 2009 (narrow definition) If people who are no longer actively seeking work are considered the broad unemployment rate rose from 267 to 313 illustrated in the figure below As a direct consequence of the global economic downturn in 2008 870 000 formal jobs were lost in 200928 Others have quoted a figure of over 1 million
Figure 3 Official unemployment in South Africa 2003 ‐2009
Source National Treasury 2010
Annual employment loss followed sector growth patterns with agriculture mining manufacturing and trade facing the highest job losses as their sector growth contracted Unemployment is especially a major problem among lower skilled workers and younger people Youth employment in the 15 ‐24 year age group has fallen by 219 000 (136) and 483 of people in this age group are unemployed Employment of semi‐skilled and unskilled workers has contracted by 527 000 and male employment has gone down by 550 000 (71) while that of women has decreased by 320 000 (52) The number of discouraged workers ie those no longer actively seeking work has increased from 518 000 to 17 million29 Clearly the existence of a very large pool of largely unskilled unemployed workers has an impact on the farming sector It drives wages down and creates opportunities for casualisation and the expansion of labour contract agencies and brokers In addition there are significant numbers of foreign nationals mainly from Zimbabwe and Mozambique who are seeking work and often finding it on farms and in primary processing and packaging plants There are benefits to the
27 Greenberg 2010 28 National Treasury 2010 29 National Treasury 2010
AgriSETA June 2010
Agriculture Sector Analysis 21
sector with skilled and semi‐skilled workers coming into the labour market and being absorbed into the workforce and helping raise productivity levels However at the lower skilled end of the market the existence of this pool brings further casualisation and downward pressure on wages Tensions are likely to increase and further protests either in the form of xenophobic outbreaks or actions against farmers may well increase A view often expressed by farm employers is that current labour legislation makes dismissing workers difficult and so the availability of labour without entering into contracts of employment is an attractive way of avoiding the legislation and its obligations Organised Labour is seeking to restrict these opportunities through either regulating or eliminating labour brokers and efforts are being made to regulate the use of foreign labour However for the foreseeable future the trend is for formally employed people to be reduced in number In relation to the emergent sector there will also be a reluctance to enter employment contracts with workers The fact that many households are engaged in some form of largely unpaid agricultural work means that there is significant casual work dating back many years Helping change this situation into one where casual or unpaid jobs are transformed into formal jobs with regular wages will take time It is also likely that as some emergent farms become established they will act similarly to established farms and institute a form of casual labour rather than expanding a workforce for which they would have to take a level of responsibility From an AgriSETA perspective these labour market trends mean that whilst levy income can be directed at a relatively small labour pool one that is manageable in terms of planning and implementation the size of the informal casual and unemployed labour force in the sector ‐ for whom no levy is paid and who have no employer to plan for their skills needs ndash is very large and its needs almost unlimited Clearly the relationship with the National Skills Fund (NSF) becomes critical in respect of the entire non‐levy income sector Again the level of support available from non‐levy income sources will be an important variable in looking at future sector skills development scenarios
Consumer trends
South Africa currently produces enough food to meet the needs of its population However consumption of three main staples maize wheat and vegetables has been volatile since 1985 and remains below 1990 levels Consumption of maize and vegetables by South Africans is 17 and 32 less respectively than in 198530 The main reasons for this lie in the growing levels of poverty and the difficulties that families have in purchasing nutritious food Whilst government has increased the levels of social grants and increased the number of people receiving grants to around 13 million the incomes of poor families have been badly hit by a range of factors including job losses and rises in food prices The approximately 1 million people who lost their jobs in 20089 meant a loss of income for many millions of dependents Rises in food prices have also had a disproportionate impact on the poor Whilst food is available it is often not accessible to families on the income levels that they have to manage within The result is that less and less nutritious food is purchased which in turn impacts on the ability of farmers to sell their products locally 30 Greenberg 2010
AgriSETA June 2010
Agriculture Sector Analysis 22
Whilst there is no evidence that government will reduce its efforts in relation to poverty relief and social benefits including such programmes as school feeding schemes and food parcels during periods of drought the state of public finances may not enable to support the poverty that grips many rural areas If real income levels for the poor were to rise it could have a significant impact on the economy of the agricultural sector Equally an improvement in the rural economy with increased agricultural production and jobs would dramatically impact on the capacity of people to buy nutritious food Achieving a positive growth path in rural areas is a huge challenge for government and one that is key to governmentrsquos Medium Term Strategic Framework and Industrial Policy Action Plans
HIVAIDS
South Africa has a high prevalence of HIV and AIDS The HIV prevalence among people aged two and above was estimated at 109 in 2008
Table 15 Estimated HIV percentage prevalence by age group (2002 ndash 2008)
Age 2002 2005 2008 Change
Children (2‐14 years) 56 33 25 ‐31
Youth (15‐24 years) 93 103 87 ‐06
Adults (25 and older) 155 156 168 13
15‐49 year olds 156 1692 169 13
Total (ages 2 to 49) 114 108 109 ‐05 Source Avert 2009
The table above shows that HIV prevalence is highest amongst those aged 25 years and older Given youth labour market analyses which point to people from previously disadvantaged backgrounds mainly African males accessing formal employment for the first time at age 25 ‐27 this population can be held to represent people in employment Research31 has estimated that by 2020 the pandemic will have claimed at least 20 of employees in the agricultural sector Southern Africa
in
HIV and AIDS have significant ramifications in the agricultural sector for both commercial farming and subsistence farming The implications include
bull Decrease in cultivated land bull Focus on less labour intensive crop and animal production bull Decrease in womenrsquos agricultural productivity as they take on a more care giving role bull Loss of skills bull Increase in absenteeism from work bull Decrease in daily work outputproductivity because workers are weaker from infections
There are suggestions that the impact of the pandemic in South Africa demands sectoral intervention although this may be difficult in the agricultural commercial sector as
bull Seasonal workers who seem to be more vulnerable to infection because of their low socio‐economic status are not in one place long enough for care programs Further
31 Ingelozi Management Solutions 2008
AgriSETA June 2010
Agriculture Sector Analysis 23
farmers and employers may not feel responsible for seasonal workers in the same way they would invest in their permanent employees
bull There may be uncertainty around land reform which may put HIV intervention on farms on the back burner
bull There are no policies that enforce HIV education and care on farms in the same way that legislation like BEE does for ownership As a result HIV intervention may be left to goodwill and employers may feel it is more important to comply with issues that are monitored
Farm safety and security
South Africa has been plagued by unacceptably high levels of violent crime and murder for many years now Farms have experienced this and those living on farms feel and are extremely vulnerable The South African Chamber of Commerce and Industry (SACCI) has argued that
Using the nominal GDP figure for 2009 of R24 trillion a 322 percent contribution of agriculture to GDP and an estimate of 39982 farms (as at 2007) in South Africa the cost of a murderattack on a farm to the economy was R1932869 per annum
SACCI acknowledges that this estimate is flawed as it does not take into consideration the fact that farming units contribute differently to GDP and that not every attack or murder contributes to farm shut down or loss of productivity However if not addressed these attacks could lead to loss of farming sectors as farmers migrate to lsquosaferrsquo regions This will affect employment and GDP contribution of the sector The need for safety and security on farms may also shift farmersrsquo focus in skills development to include personnel who have skills in safety and security
Broad‐based Black Economic Empowerment
The aim of the AgriBEE Charter (gazetted in 2008) is to increase the involvement of black business in agriculture through ownership and control as executives and senior managers of new and existing agricultural businesses The extent to which AgriBEE is transforming the sector is not known as it is too early to tell but a recent survey conducted by ABC and the IDC showed that among the ABC respondents in 2007 46 of enterprises were busy constructing a BEE strategy and 46 claimed to be implementing a BEE strategy A survey of the dairy industry in the Western and Eastern Cape in 2008 showed that only 6 of firms had a BEE strategy in place It also seems from survey data that companies are focusing on the skills development and socio‐economic aspects of BEE rather than on ownership32 It would appear that although there have been some significant BEE purchases of viable farms and some employee empowerment projects including some quite high profile ones in the Cape Winelands the extent of ownership change had been limited One of the factors is the very high level of single person or family ownership in the agricultural sector BEE is more straight forward in the corporate world where shares can be exchanged For a family business it is a matter of selling off part or all of the land and the tendency is to sell off those areas of the farm that are expendable from a business sustainability perspective
32 Greenberg 2010
AgriSETA June 2010
Whilst there is discussion in government about the ending of the ldquowilling buyer willing sellerrdquo concept the Constitution itself provides for property rights and so although some pressure may be exerted through legislation and regulation the extent and speed of change may not be fast The mechanisms for encouraging the transfer of significant levels of ownership have not yet been created The focus of the SETA is therefore likely to be more the beneficiaries of land reform and emergent farmers though projects of a BEE nature can be targeted as they arise
Conclusions and scenarios It is useful when looking at possible scenarios to examine the key variables or uncertainties and to project how variations one way or the other will have an impact on the development and growth of the sector From the sector analysis and factors that are contributing to change in the sector there are some key factors that seem to emerge First appears to be the economy and related issues of the labour market and the challenges of labour absorption in an enclave economy These factors determine on the one hand whether there will be growth and development and on the other whether such improvements will result in improved employment opportunities and the creation of a virtuous cycle of development Second is the role of the state and the various government departments whose plans and work impact on the agricultural sector Related to this is land reform that is inevitably driven by the state and not the owners of land or the landless The view expressed by many engaged in agrarian reform is that the state must play a significant role It becomes clear that a successful agricultural enterprise requires a number of factors to be in place to be successful These include access to land (Department of Rural Development and Land Reform) agricultural support within a supportive agricultural framework (Department of Agriculture Forestry and Fisheries) access to consistent water supply (Department of Water Affairs) access to finance (Department of Trade and Industry various state agencies) conducive labour market regulation (Department of Labour) sound industrial policy (Department of Trade and Industry) economic planning and macro policy (Department of Economic Development National Treasury) and appropriate education training and skills development (Department of Higher Education and Training the Human Resources Development Council NSA and the SETA) There are other government departments as well as provincial and municipal structures that also play a role The following analyses show how the four variables
economic growth and development role of the government labour market changes and land reform)
impact positively or negatively on the growth of the sector and the demand for skills
Agriculture Sector Analysis 24
AgriSETA June 2010
Agriculture Sector Analysis 25
HHIIGGHH GGRROOWWTTHH SSCCEENNAARRIIOO
The economics of the sector Role of government
The economy in SA and globally continues to revive albeit slowly for the next few years
Roles and integration of national government departments are clarified Specific functions are agreed processes put in place and personnel appointed with the required skills
International trade agreements are still weighted infavour of US and EU but progress is being made and specific blockages are addressed in bilateral talks
The roles of Departments (DWA DAFF DRDLR DoL DTI DED DHET) are clarified with appropriate joint plans and coordinating structures
The rural economy gradually improves with the buying power of the poor increasing and more stable markets created for local produce
For each of the functions agreed in each of the related departments appropriate structures and systems are put in place and staff trained
Exports increase in key areas identified in IPAP 2 and the Rand exchange rate stabilises at a level not too much different than it is today
Specific capacity is put in place at local level to support implementation of land reform and rural development
There is a growing understanding of the concept of dualism and the need to intervene with labour absorption and development mechanisms
Land claims are all finally settled and ownership and tenure is resolved There is a serious drive to establish effective agricultural enterprises
An understanding is reached on the role of agencies and labour brokers and abuse is curbed
The willing buyer willing seller approach is resolved and enables viable land to become black owned
Some relaxation of labour market regulations are agreed that maintain some minimum standard of employment but assist absorption
Land transfer to black and emergent farmers is done in a manner that integrates then into the supply chains of the sector
Mechanisms are found to address skills needs in the context of casual and seasonal work patterns
Financing of land reform and transfer is done on the basis of agreed development plans including skills
Labour market reform Trajectory of land reform LLOOWW GGRROOWWTTHH SSCCEENNAARRIIOO
The economics of the sector Role of government departments The economy in SA and globally stagnates at current levels and the economy struggles to pick up after the temporary 2010 World Cup boost
A lack of purpose at government level means limited progress for another five years Land reform remains a commitment without a plan
International trade agreements are still weighted infavour of US and EU and protectionism increases as a result of the global recession
The roles of Departments (DWA DAFF DRDLR DoL DTI DED DHET) are unclear and there is no proper co‐ordination
SArsquos Gini coefficient continues to worsen with rural poverty increasing and local economies declining
There is a lack of effective structures systems and processes to implement policy across departments
Rand volatility causes problems for importers and exporters Well established markets are maintained but exports decrease
At local level the decline in the agricultural extension officer functions continues and limited practical support is available
Understanding of the rural economy is so diverse that stakeholders cannot agree the problem let alone the solution to low absorption levels
Land claims take too long and land reform processes leave potentially productive land poorly developed and managed
Casual labour and labour brokers remains an issue of dispute Confrontation results in bitterness and resentment
The impasse caused by a rigid interpretations of property clauses in the Constitution continues to stall achievement of the 30 black ownership target
Labour market regulation continues to be a contributing factor to reducing levels of employment
Black owned farms find it difficult to become part of supply chains and are unable to perform adequately
Unstable employment patterns in the sector make skills interventions difficult to manage and largely ineffective
Financing of land reform and land transfer continues to be wasted as it is not tied to the building of appropriate capacity
Labour market reform Trajectory of land reform
AgriSETA June 2010
These analyses can be translated into four potential growth and development scenarios for the agricultural sector which are based on the requirements for a strong development state Scenario 3 Weak government support
and sound economy
Econ
omic fa
ctors glob
ally n
ationa
lly and
locally
Scenario 1 Integrated government support and sound economy
The economic upturn triggered by the World Cup continues and globally things improve enabling an expansion of exports The government because of a lack of integrated policy planning and implementation provides limited support for sector development The gains go to the well established enterprise owners with few gains for emerging farmers and local communities
Government departments coordinate their efforts to achieve maximum impact There are favourable economic conditions that create opportunities for advance Within this positive environment the role of the AgriSETA becomes a central component of a comprehensive strategy for growth and skills interventions are targeted to achieve maximum effect Results in growth in sustainable enterprises and expanded employment opportunities
Government policy and support Government policy and support
Combination of disjointed government policy planning and a weak and increasingly marginalised rural economy Economic conditions result in unsustainable farming conditions and employment declines along with productivity Food shortages and the lack of development in rural areas leading to increasing social tensions A vicious cycle develops with the sector going into long term decline
Government departments coordinate their efforts to achieve maximum impact However economic conditions hamper progress Efforts by the AgriSETA are undermined by poor labour absorption and job insecurity Some significant successes are recorded including some NSF funded projects that result in sustainable enterprises A platform is laid for future improvements when the economic conditions improve
Scenario 4 Weak state and economy Scenario 2 Strong state but weak
economy
Agriculture Sector Analysis 26
AgriSETA June 2010
Agriculture Sector Analysis 27
SECTION 2 DEMAND FOR SKILLS
AgriSETA registered employers and employee coverage
In 2009 17 234 employers were registered with the AgriSETA comprising 15 394 small employers (less than 50 employees) 1 202 medium sized employers (50 ‐ 149 employees) and 638 large employers (more than 150 employees)
Considering that there are around 40000 commercial farms33 the 17 234 employers represent around 43 of commercial farms Notwithstanding changes in the sector as a result of land reform and sector shrinkage this is a sizable proportion and is held to be sufficiently representative for the purpose of skills development planning However this paints an incomplete picture It understates the representative nature of large enterprise registered with the SETA and overstates the representative nature of small registered enterprises 4 175 (242) of the enterprises are levy paying members Further only 1 673 (11) workplace skills plans (WSPs) were submitted
Table 16 Registered employers by size and sub‐sector Sub‐sector Description
Employers Small Medium Large
CoffeeTea Processing and marketing of coffee and tea including coconuts cocoa nuts olives dates etc
33 4 3
Fibre Grading ginning packing of wool and cotton raw material 1 676 16 18
Fruit Fruit packed in cartons fruit juice concentrate drummed and fruit juice in container ready for consumption
271 36 57
Fruit exporters and importers 6 0 1
Grain
Manufacture of grain mill products and starches 119 5 7Handling and storage of grain 67 7 23Wholesale amp retail trade in Agricultural machinery 213 9 4Sale and distribution of Agricultural raw materials and other farming inputs
182 9 3
Milling
Manufacture of flour and grain mill products including rice and vegetable milling grain mill residues
120 15 11
Manufacture of prepared animal feeds 110 19 0Manufacture of pet foods 42 9 0Manufacture of starches and starch products 7 1 1
Pest control
Pest Control 209 4 0
Poultry Poultry and egg production including the slaughtering dressing and packing of poultry
305 49 37
Primary
Growing of Cereals and other crops (not elsewhere classified) 902 160 34Growing of Vegetables Horticultural specialties nursery products
943 120 72
Growing of Vegetables Horticultural specialties (Including Ornamental Horticulture) and nursery products
11 5 0
Sugar plantation including sugar cane and sugar beet etc 9 4 2
33 SARS statistics 2007
AgriSETA June 2010
Agriculture Sector Analysis 28
Sub‐ Description Employers Growing of fruit nuts beverage and spice crops 1795 255 143Farming of cattle sheep goats horses asses mules and hinnies Dairy farming
2 252 59 18
Other animal farming production of animal products (NEC) 433 25 12Ostrich farming 5 0 0Game farming 16 0 0Growing of crops combined with farming of animals (Mixed farming)
2 920 256 109
Growing of coffee and tea including coconuts cocoa nuts olives dates etc
2 0 0
Agricultural and animal husbandry services except veterinary activities
438 22 9
Other animal farming (not elsewhere classified) 11 1 1Growing of trees as second crop by farmers 126 18 4Fishing operation of fish hatcheries and fish farm 913 10 6
Red meat
Production and animal products (not elsewhere classified) 6 0 0Slaughtering dressing and packing of livestock including poultry and small game for meat
317 40 17
Production sale amp marketing of Agricultural by products (eg bones hides)
61 2 0
Slaughtering dressing and packing of livestock including small game for meat and processing of ostrich products
2 1 0
Wholesale trade in Agricultural raw materials and livestock 193 7 10Transport of livestock as supporting activity 224 0 0Agricultural and livestock research 215 9 3
Seed Seed production and marketing 149 12 6
Sugar Manufacture of sugar including golden syrup and castor sugar
45 5 21
Tobacco Processing and dispatching of tobacco 46 8 6 TOTALS 15 394 1 202 638Source AgriSETA WSP data
The largest number of registered small and medium enterprises are found in the mixed farming sub‐sector while most large enterprises are in the growing of fruit nuts beverage and spice crops sub‐sector
Employee coverage in the AgriSETA
Collectively the 17 234 employers registered with AgriSETA employed a total of 239 076 employees This represents 39 of the agricultural labour force in 2009 The 1 673 employers who submitted WSPs in 2009 employed 97 898 employees representing 41 of the total number of people employed by registered employers While the number of registered employers submitting WSPs is small (11) they employ a sizeable number of employees and the percentage of employees provides a statistically significant sample The data for larger enterprises is statistically much more representative than that for small enterprises
AgriSETA June 2010
Table 17 Number of employees of registered employers by sub‐sector
Sub‐sector
Sub‐sector description Employees
CoffeeTea Processing and marketing of coffee and tea including coconuts cocoa nuts olives dates etc
483
Fibre Grading ginning and packing of wool and cotton raw material 6 539
Fruit Fruit packed in cartons fruit juice concentrate drummed and fruit juice in container ready for consumption
27 661
Fruit exporters and importers 212
Grain
Manufacture of grain mill products and starches 133Handling and storage of grain 18 303Wholesale amp retail trade in Agricultural machinery 795Sale and distribution of Agricultural raw materials and other farming inputs 2 898
Milling
Manufacture of flour and grain mill products including rice and vegetable milling grain mill residues
3 634
Manufacture of prepared animal feeds 731Manufacture of pet foods 160Manufacture of starches and starch products 105
Pest control
Pest Control 119
Poultry Poultry and egg production including the slaughtering dressing and packing of poultry
19 187
Primary
Growing of Cereals and other crops (not elsewhere classified) 10 104Growing of Vegetables Horticultural specialties and nursery products 37 799Growing of Vegetables Horticultural specialties (Including Ornamental Horticulture) and nursery products
195
Sugar plantation including sugar cane and sugar beet etc 220Growing of fruit nuts beverage and spice crops 47 043Farming of cattle sheep goats horses asses mules hinnies Dairy farming
3 382
Other animal farming production of animal products (NEC) 4 203Ostrich farming 0Game farming 0Growing of crops combined with farming of animals (Mixed farming) 28 722Growing of coffee amp tea including coconuts cocoa nuts olives dates etc 0Agricultural and animal husbandry services except veterinary activities 970Other animal farming (not elsewhere classified) 513Growing of trees as second crop by farmers 1 294Fishing operation of fish hatcheries and fish farm 1 589
Red meat
Production and animal products (not elsewhere classified) 0Slaughtering dressing and packing of livestock including poultry and small game for meat
5 128
Production sale amp marketing of Agricultural by products (eg bones hides) 116Slaughtering dressing and packing of livestock including small game for meat and processing of ostrich products
0
Wholesale trade in Agricultural raw materials and livestock 1 697Transport of livestock as supporting activity 0Agricultural and livestock research 534
Seed Seed production and marketing 2 127Sugar Manufacture of sugar including golden syrup and castor sugar 10 478Tobacco Processing and dispatching of tobacco 2 002 Total 239 076
Agriculture Sector Analysis 29
AgriSETA June 2010
Agriculture Sector Analysis 30
Source AgriSETA WSP data
According to the WSP analysis the sub‐sector for the growing of fruit nuts beverage and spice crops employed the largest number of people In six sub‐sectors there are employers who do not employ workers These are probably family based organisations where family members help in the business without drawing a salary These are in transport and livestock research slaughtering dressing and packing of livestock including poultry and small game for meat growing of coffee and tea including coconuts cocoa nuts olives dates etc ostrich farming and game farming
Table 18 Employee distribution by province Province Employees Percentage
Eastern Cape 18 844 192 Free State 1 946 20 Gauteng 2 788 28 KwaZulu‐Natal 5 416 55 Mpumalanga 8 062 82 North West 3 290 34 Northern Cape 5 436 56 Limpopo 1 730 18 Western Cape 50 386 515 Grand Total 97 898
Source AgriSETA WSP data
Of those submitting WSPs registered employers in the Western Cape employed the largest number of people while employers in Limpopo employed the least number of employees Free State has a small number of employees covered by WSPs submitted to the SETA whereas Eastern Cape with a relatively small number of registered farms has a very large number of employees on farms submitting WSPs Given this variance between provinces the use of WSP data for extrapolation purposes must be viewed cautiously
2009 WSP equity information was only provided for about a quarter of employees (25 637 or26)34 No information was available from the WSPs on non‐South Africans working on commercial farms
Table 19 Equity profile from 2009 WSP data African Coloured Indian White
Totals M F D M F D M F D M F D
8 040 5 785 38 5 097 5 228 24 22 25 0 811 556 11
580 417 03 493 505 02 468 532 00 589 403 08 13 863 10 349 47 1 378 25 637541 404 02 54 100
Total EquityTotal Male Total Female Total Disability
13 970 11 594 73 545 452 03
Source AgriSETA WSP data
Using currently available data it is not possible to provide disaggregated employment data by sub‐sector This will require a small change in the way that gender race and disability data is
34 Some employers did not complete race and gender information when giving their employment profiles
AgriSETA June 2010
codified during WSP data‐capturing including allocation by sub‐sector What can be stated is that employment of males is more dominant than that of women and more Africans are employed in the sector than other groups Employment of people with disabilities is below 1
21 Skills demand
The National Education and Training Strategy for Agriculture (AET Strategy)
The AET Strategy developed by the Department of Agriculture Fisheries and Forestry (in consultation with various key stakeholders in the agricultural sector) highlights priority skills needs and constraints within the sector and categorises needs within the following 5 broad areas
1 Agricultural production ndash requesting that the past focus on a narrow band of commodities (relevant mainly to the commercial sector) and related research be expanded to address the needs of small‐scale and subsistence farmers (eg more focus on mixed farming and rural livelihood sustainability skills)
2 Agricultural engineering ndash with specific focus to be placed on technologies suitable for small‐scale farmers (eg relevant and post‐harvesting techniques related to processing and storage of produce) ndash to address this need the scarcity of agricultural engineers requires attention
3 Agricultural economics ndash a critical need was identified for general agricultural economic skills (ranging spectrum of farm planning farm management enterprise management marketing finance etc) ndash with the need to training both farmers and extension officers in such fields
4 Agricultural development ndash a specific need was identified to develop agricultural extensionists in supporting especially emerging and small‐scale farmers over the full spectrum (a need exists for both new curriculum in the training of new extensionists and the re‐training and upgrading of existing officers)
5 Veterinarians ndash the need to develop state veterinarians in order for the state to perform its role and function (particularly in its preventative monitoring and regulatory role and function)
AGRISETA sector skills planning demand data (2008‐2009)
The following section reflects initial research on skills demand in the Agricultural sector arising from the sector analysis (section 1) previous AGRISETA skills demand research for Sector Skills Planning during 2005‐2009 and analysis of WSP data from 2009 With the introduction of the Organising Framework of Occupations and agreement on definitions for scarce and critical skills in 200506 the AGRISETA undertook an extensive research and consultation processes to determine skills development priorities for the sector The research methodology employed was based on the a four dimensional topology for establishing and evaluating skills needs illustrated in the figure below
Agriculture Sector Analysis 31
AgriSETA June 2010
Agriculture Sector Analysis 32
The identification and prioritisation of skills needs was also undertaken from a key stakeholder and beneficiary perspective Consideration was given to needs of the following groups
bull The unemployed ndash helping them gain andor regain entry to the labour market bull The economically inactive ndash helping them to become economically active bull School leavers ndash helping them gain access to further education and training opportunities
and thus facilitating their entry to the job market bull Entrants to the job market ndash facilitating employment and integration into the work culture
and work ethic (improving the employability of an individual) bull Those currently employed in the sector ndash increasing their competency and opportunities
for advancement creating a career path and offering continued job security enhancement of value adding to the sector improving their prospects for better employment opportunities
bull Organisations and enterprises within the sector ndash making sure that skills development and knowledge creation occurs in such a way as to improve the sectorrsquos viability and allowing companiesenterprises to become more sustainable and profitable along the way improving productivity competitiveness and innovation within organisations
In organising and reporting the identified priority skills development needs (200809) the following structuring approach was followed
Tier 1 The four categories of needs as per the Topology presented above were used for the identification evaluation and grouping of needs
Pay conditions
Image
RECRUITMENT DIFFICULTY
SKILLSGAP
SKILLSSHORTAGE
LABOURSHORTAGE
Firms experience difficulty recruiting This does not necessary imply a skills shortage ndash may indicate a poor image remuneration etc
Those currently in work do not have the requisite skills set to carry out their job to an optimum standard
Required skills are in short supply when compared with the demand across the whole labour market
Regardless of skills levels a situation exists where there is simply not enough supply of labour to meet demand
Pay conditions
Image
RECRUITMENT DIFFICULTY
SKILLSGAP
SKILLSSHORTAGE
LABOURSHORTAGE
Firms experience difficulty recruiting This does not necessary imply a skills shortage ndash may indicate a poor image remuneration etc
Those currently in work do not have the requisite skills set to carry out their job to an optimum standard
Required skills are in short supply when compared with the demand across the whole labour market
Regardless of skills levels a situation exists where there is simply not enough supply of labour to meet demand
Figure 4 Topology for identifying skills development priorities
Source AGRISETA SSP Annual Update August 2009
AgriSETA June 2010
Tier 2 Within each of the first tier groupings needs were further broken down and organised per target group At this second level needs were grouped by
o General skills development needs (cross‐cutting over different target groups) o Needs experienced by small scale farmers (this group included subsistence
farmers new emerging land reform beneficiaries and small‐scale AgriBEE farmers) o Needs within the commercial agricultural sector (per sub‐sector groupings where
specific needs for such were identified ndash both on‐farm needs and within the secondary sub‐sector or related agri‐businesses)
o Needs of the Department of Agriculture Fisheries and Forestry (DAFF) To further guide and direct the identification and selection of scarce and critical skills the following factors or criteria that could reflect the importance (impact and effect) of a skills shortages were developed as an identification framework
1 Basic Skills Development Promoting basic literacy and numeracy and raising the base level of education for the sector improving the work and livelihood of existing workers
2 Employability Making the employee more employable by improving the fit between their skills and the sector needs
3 Enterprise Viability Improving the capability and feasibility of the enterprise by increasing its effectiveness of or possibilities for profit generation etc
4 Enterprise Sustainability Allow enterprises to survive and grow over an extended period of time without compromising the value of renewable resources thereby creating long‐term meaningful employment for larger numbers of people
5 Sector Growth Enabling the sector to develop or pursue new opportunities or improve the effectiveness of current operations
6 Sector Competitiveness Enabling the sector to compete more effectively in the international arena improving market intelligence and interpretation productivity cost efficiency etc
7 Human Resource Development Capacity Improving the access to quality provision of training to the agri sector
Based on this research and consultation framework the following skills development needs and priorities were identified
Agriculture Sector Analysis 33
AgriSETA June 2010
GENERAL NEEDS SMALL‐SCALE FARMER
NEEDS COMMERCIAL SECTOR
NEEDS DAFF NEEDS
RECRUITMENT RELATED SKILLS NEEDS Primary agriculture is the entry point into the world of work for large numbers of people in rural areas However the sector has negative connotations amongst sections of the youth and in parts of the country and is viewed as a last resort for some in the search for employment) The effect is that despite an unemployment rate of approximately 26 (now over 30) farmers find it difficult to recruit workers to meet seasonal demands This has resulted in the government approving the contracting of foreign labour to meet such temporary needs (workers are recruited mainly from Zimbabwe and Mozambique)
Labour in this farming sector is provided primarily by family members and no real recruitment constraints can be identified
The agricultural sector still manages to attract technical and management skills as it is perceived to include a better lifestyle and there is a strong tradition of agriculture in SA Increasing crime related security risks associated with farming may have a negative impact
The Department has identified a number of occupations in which they are experiencing long‐term vacancies Some of these result from a general shortage of such skills in SA while others arise from the inability of the public sector to compete with the private sector (less favourable employment image working conditions and equity considerations) Priority vacancies include Veterinarians Agricultural
Engineers Plant Health
Specialists Agricultural
Statisticians Plant Health Pest Risk
Analysts ICT Specialists Agricultural
Economists Agricultural Food and
Quarantine Technicians
Agro‐meteorologists Pasture Scientists Plant Production
Specialists Specialised Food
Analysts SKILLS GAPS RELATED NEEDS
bull Low literacy and numeracy levels ndash both amongst workers within the sector at large and at ownermanager level in many of the small‐scale farming
bull Farm management
Farm Management (Mainly owners managers) bull Farm management amp
entrepreneurship bull Resource
management and record keeping
bull Financial planning
A critical constraint is the poor educational levels of a large proportion of the labour force in the sector demanding a considerable effort and investment in ABET and other life skills
A particularly big need exists for skills upgrading amongst Extension Officers ndash particularly with regard to redress the historical neglect of small‐scale farmers and resource strapped farmers
Agriculture Sector Analysis 34
AgriSETA June 2010
Agriculture Sector Analysis 35
GENERAL NEEDS SMALL‐SCALE FARMER
NEEDS COMMERCIAL SECTOR
NEEDS DAFF NEEDS
skills (and general management skills in other agricultural businesses) coupled with a business orientation and entrepreneurship skills
bull A general need to increase compliance with environmental occupational health and safety animal welfare produce safety and hygiene standards regulations and requirements (local and international standards)
and management bull Project management bull Business plan
development Marketing and processing bull Processing and
packaging bull Transport
management bull Marketing produce
including branding bull Planning for
marketing bull Knowledge of
markets Technical knowledge and skills bull Production
management (related to specific enterprise)
bull Demonstration of production techniques
bull Natural resources management
Mechanical knowledge bull Farm maintenance bull Repairs of machinery
and equipment bull Electrical
maintenance and installation
programmes Need for improved management skills and relevant technological knowledge for increasing productivity levels and improved production methods Rising importance for environmentally responsible production and processing management systems Rising competitive and international markets increases need for business and marketing abilities among owners and managers Increasing requirements for compliance with environmental health and safety and international trade standards Information technology although not a priority is increasing in importance Business management ability is becoming increasingly important as more farmers are making decisions about restructuring their businesses diversification and developing supplementary sources of income
Critically improved farm management and business skills within an agricultural context to support the majority of BEE and emerging farmers Skills upgrading requirements for existing Extension Officers include bull Agricultural
economics bull Agricultural
management bull Business and
financial management
bull Technical and production related skills including o Animal husbandryo Poultry o Crop production o Horticulture
SKILLS SHORTAGES Generally SA has a shortage of entrepreneurs and people who have the business acumen drive motivation and
The profile of these farmers reflects a large contingent of older and less educated people who are generally less flexible tend to stick to
The commercial agri sector will increasingly have to compete in the global market and the ever increasing need to increase productivity to
DAFF us experiencing problems are especially sourcing people in specialised science related fields (learning fields experiencing few
AgriSETA June 2010
Agriculture Sector Analysis 36
GENERAL NEEDS SMALL‐SCALE FARMER
NEEDS COMMERCIAL SECTOR
NEEDS DAFF NEEDS
perseverance to become a successful farmer Given the high risks involved in the agricultural sector (natural elements outside onersquos control) the agri sector does not compete successfully for this ldquoscarce resourcerdquo Moreover as with other professional and skilled occupations there is a tendency for younger qualified people to move to urban areas
known practices and are less likely to experiment with new technology Within this target group candidates with good entrepreneurial ability are scarce There is a perceived shortage of Agricultural Extensionists and advisors to assist this target group However a large pool of young unemployed graduates exists who could assist such emerging farmers if they were mobilised and made accessible to farmers Similarly the potential pool of retired commercial farmers who could serve as mentors to this target group
remain profitable and viable it can be stated that many of the existing farmers and managers owners lack business management and entrepreneurial orientation Equity policy and the need to become BEE compliant requires that commercial enterprises appoint and develop black owners directors managers Changing local and global consumer preferences require farmers to change traditional farming methods and practices Skills and knowledge requirements include bull Global food and
international quality standards
bull Product traceability requirements
bull Organic produce and products
Specific occupations identified as being in short supply are
bull Production Managers (food processing)
bull Product specialisation to international specifications (research skills)
bull Forklift drivers heavy vehicletruck drivers and mobile plant operators
bull Experienced and competent artisans (millwrights electricians fitters
enrolments andor pass rates at HET institutions with the result that too few qualified persons come onto the labour market) Examples of such skills shortages identified by the Department include Agricultural Engineers bull Plant Health
Specialists (Nematology Entomology Plant Pathology)
bull Statisticians (specialised agricultural knowledge)
bull Plant Health Pest Risk Analysts
bull Agricultural Economists (production and resource economists)
bull Agricultural Food and Quarantine Technicians
bull Agro‐meteorologists Early warning Specialists
bull Pasture Scientists bull Plant Production
Specialists (eg ornamental crops hydroponics)
bull Specialised Food Analysts (pesticide residue analysts processed food and dairy analysts wine and spirit analysts)
AgriSETA June 2010
Agriculture Sector Analysis 37
GENERAL NEEDS SMALL‐SCALE FARMER
NEEDS COMMERCIAL SECTOR
NEEDS DAFF NEEDS
and turners bull Agricultural
Equipment Technicians
bull Pest and weed controllers
bull Horticultural specialists
LABOUR SHORTAGES AND RELATED SKILLS NEEDS Given an employment rate of some 26 (2009 currently estimated at over 30expanded definition) per definition there cannot be a labour shortage It is however difficult for people who have never worked before to integrate into the agricultural sector workforce Coupled with an aging workforce (30‐60 being over 40) means that most agri enterprises will within the next 5‐10 years be looking at replacing a large proportion of their workforce There could be an insufficient pool of people willing and able to participate The impact of HIVAIDS is also not always factored in to understanding the diminishing pool of resources available Labour shortages have been reported within selected geographical areas and in particular occupations Examples include cane cutters in the sugar industry chicken catchers in the poultry industry pickers in the fruit industry and animal handlers in feedlots as well as dairy parlour workers It is however believed that these shortages may reflect a recruitment problem as a result of the very harsh working conditions and the relatively poor remuneration (which makes these occupations unpopular) At present such ldquoshortagesrdquo are addressed through contracting labour from neighbouring countries
AgriSETA WSP analyses
Skills demand in the commercial agricultural sector
Information for demand for skills from WSP data is available for 1 673 employers who submitted their WSPs for the 200910 period The table below shows data on sub‐sector WSP submission relative to size of the sub‐sector as well as subsector data from all registered organisations and those who submitted WSPs Data for registered employers shows that there were 239 076 employees employed by the 17 234 registered organisations As previously stated 97 898 employees were employed by the organisations submitting WSPs This constitutes 41 of employees employed by registered organisations
Table 20 Employment and sub‐sector data drawn from WSP analyses
Sub‐sector
All Re
gistered
Employers
Small employers (0‐49)
Med
ium and
large
employers (50+)
Total W
SPs received
Total W
SPs received
as of
all registered em
ployers
WSP
received med
ium and
large orgs
WSPs received
as of
med
ium amp large em
ployers
WSPs received
small
employers
WSPs received
as of small
enterprises
EmployeesPer
Profile
CoffeeTea 40 33 7 9 23 5 71 4 12 483 Fibre 1 710 1 676 34 34 2 22 65 12 07 6 539
AgriSETA June 2010
Agriculture Sector Analysis 38
Sub‐sector
All Re
gistered
Employers
Small employers (0‐49)
Med
ium and
large
employers (50+)
Total W
SPs received
Total W
SPs received
as of
all registered em
ployers
WSP
received med
ium and
large orgs
WSPs received
as of
med
ium amp large em
ployers
WSPs received
small
employers
WSPs received
as of small
enterprises
EmployeesPer
Profile
Fruit 371 277 94 162 44 76 81 86 31 27 873 Grain 648 581 67 77 12 48 72 29 5 22 129 Milling 335 279 56 61 18 35 63 26 9 4 630 Pest Control 213 209 4 8 4 2 50 6 3 119 Poultry 391 305 86 66 17 46 53 20 7 19 187 Primary 12 121 10 776 1 345 1144 9 513 38 631 6 136 034 Red meat 1107 1 018 89 70 6 45 51 25 2 7 475 Seed 167 149 18 24 14 13 72 11 7 2 127 Sugar 71 45 26 13 18 10 38 3 7 10 478 Tobacco 60 46 14 5 8 3 21 2 4 2 002
Totals 17 234 15 394 1 840 1 673 10 818 44 855 16 239 076
Source 1 AgriSETA WSP 2009 data
Only 10 of all registered employers submitted WSPs for the 200910 period Of these 49 were medium and large sized employers and 51 small However only 16 small employers submitted their WSPs relative to the number of registered small employers and 44 medium and large employers submitted WSPs relative to the number of registered medium and large employers As such skills demand statistics provides more representative data on the requirements of medium and large employers Data for skills demand in the commercial agricultural sector is based on data for permanent employees as well as casual and seasonal employees
Skills demand forecasting by AgriSETA
Forecasting for skills demand the AgriSETA has estimated that the demand for skilled employees at different levels in the next few years is 510 686 This is based on WSP data analyses over the last 5 years and projected demand for the formal commercial agricultural sector and factoring in the demand that at maximum would result from completion of the land restitution programme in South Africa The table below reflects the skills that are on demand as well as the estimates for demand over the next five years by major occupational category35
35 AgriSETA 2010
AgriSETA June 2010
Table 21 Demand for skills by occupational category
Major Occupation (OFO)Estimated Demand
Group Title1 Managers (commercial and small emerging farmers) 264 3702 Professionals 4 1413 Technicians and Trade workers 8 9255 Clerical and administrative workers 8006 Sales workers 4007 Machinery operators and drivers 5 8008 Elementary workers 226 250
Total 510 686Source AgriSETA WSP data and SSP demand forecasts
Research needs going forward
As has been set out in the sector analysis and the scenarios derived from that analysis the sector is faced by both significant and profound change and also great uncertainty It therefore follows that the task of focussing limited resources (basically levy income in the formal sector and NSF funds for the emergent farming sector) is difficult Whilst the general thrust of training remains broadly as described in the 2006‐10 SSP Updates some considerable work is required to achieve targeted effective interventions during the 2011‐2016 period The following research questions will need to be addressed in preparing the next SSP
bull In relation to the managers and owner‐managers of commercial farms and enterprises what skills are needed to enable them to help bring about the more optimistic scenario and manage the risks associated with the less optimistic ones
bull In terms of professional and technical competencies do the current education and training institutions coupled with the learning programmes available through the AgriSETA (learnerships skills programmes and the like) meet the needs of the sector
bull In the emerging agricultural sector do the current programmes funded by sources external to the AgriSETA (eg NSF) meet all the identified needs What gaps are there and how should they be addressed
bull In relation to governmentrsquos growth strategy and industrial action plans what skills are required for developing the aquaculture sub‐sector What programmes are available How can the SETA support the skills needs for this sub‐sector
bull Given the increasing levels of casual and contract labour how can skills be developed to meet the needs of the formal commercial sector and the emerging enterprise sector
bull How can the demand in each of the priority areas be quantified and agreement be reached on numbers of people to be trained
Agriculture Sector Analysis 39
AgriSETA June 2010
SECTION 3 Skills Gaps and scarce skills
Scarce skills at the DAFF
The level of scarce skills at DAFF can be determined by the vacancy rate While the average vacancy rate in the department as at 31 March 2009 was 17 there were some posts that had very high vacancy rates as reflected in the table below Indicating the possibility that the Department is experiencing difficulties in finding suitable candidates in the South African labour market to fill these posts
Table 22 Scarce skill occupations and vacancy rates (DAFF March 2009) Critical occupations Number of posts Posts filled Vacancy rate ()
Agricultural animal oceanography forestry and other sciences
167 119 287
Engineering sciences related 2 1 50Engineers and related professions 13 6 538Farming forestry advisors and farm managers 11 4 636Finance and economics related 73 53 274Horticulturists foresters agricultural and forestry technicians
350 221 369
Legal related 6 4 333Mechanical engineering technicians 3 2 333Risk management and security services 6 4 333Social sciences related 1 0 100Veterinarians 34 24 294
Source DAFF Annual Report 20082009
Skills are also scarce at senior management level The department also reports on difficulties it has filling senior management services vacancies with some of them staying vacant for up to twelve months because no suitable candidates can be found The department would then resort to re‐advertisement and head hunting This was the case with 22 of 18 SMS posts in March 2009
Scarce skills in the commercial sector
The following occupations have previously been projected as scarce (extremely hard to fill vacancies) by AgriSETA in the commercial agricultural sector over the next five years
Table 23 Scarce and critical skills in the commercial agricultural sector
Occupation Code
Group Occupation Critical Skills Intervention Comments
139903 Managers Laboratory Manager
Technology AI nutrition
HET
221101 Professionals Accountant (General)
General HET
221102 Professionals Management Accountant
Farm financial management
HET Focus on support advice to farmers new enterprises
222101 Professionals Commodities Trader
Export administration supply chain
FET Learnership Skills
Agriculture Sector Analysis 40
AgriSETA June 2010
Agriculture Sector Analysis 41
Occupation Code
Group Occupation Critical Skills Intervention Comments
management Programme
224301 Professionals Economist Agricultural HET
Mainly for Department of Agriculture and para statals commodity organisations
233101 Professionals Chemical Engineer
Chemical processes in food production
HET Industries such as sugar processing
233301 Professionals Electrical Engineer
Installation and maintenance
HET Processing industry
233401 Professionals Electronics Engineer
Computerised production prosesses
HET Processing industry
233501 Professionals Industrial Engineer
Productivity and efficiency
HET Processing industry
233904 Professionals
Instrument Engineer (Defence Force)
Installation and maintenance
HET
Not for defence ‐ sugar industry
233502 Professionals Mechanical Engineer
FETHET Equity reasons
233902 Professionals Agricultural Engineer
Farm layout and infrastructure
HET Mainly in Government
311101 Technicians and trades workers
Agricultural Technician
Installation and maintenance
FETHET
234102 Professionals Agricultural Scientist
Agri research HETFET Especially in horticulture
234201 Professionals Chemist HET Processing industry
234202 Professionals Food Technologist
Food safety HACCP
FETHET Across sector
234701 Professionals Veterinarian HET Mainly in Government
311101 Technicians and trades workers
Agricultural Technician
Farm infrastructure
FET Mainly needed in government
311401 Technicians and trades workers
Chemistry Technician
FETHET EE reasons
312907 Technicians and trades workers
Chemical Engineering Technician
FET Learnership
Mainly EE reasons
312402 Technicians and trades workers
Electronic Engineering Technician
Weak stream production infra
FETHET Mainly tobacco industry
233904 Professionals
Instrument Engineer (Defence Force)
Instrument technician
FET
Occupation needed Instrument Technician (not defence force) Mainly sugar processing sector
321202 Technicians and trades workers
Diesel Motor Mechanic
FET Learnership
To include tractor mechanic
321204 Technicians and trades workers
Small Engine Mechanic
Agricultural equipment
FET Learnership
Throughout sector
AgriSETA June 2010
Agriculture Sector Analysis 42
Occupation Code
Group Occupation Critical Skills Intervention Comments
322301 Technicians and trades workers
Metal Fabricator
Artisan FET Learnership
322303 Technicians and trades workers
Welder Welder (First Class)
Artisan FET Learnership
323203 Technicians and trades workers
Fitter‐Welder Artisan FET Learnership
Mainly sugar ndash multi‐skilled
323202 Technicians and trades workers
Fitter And Turner
Artisan FET Learnership
Tobacco and sugar
323501 Technicians and trades workers
Millwright Artisan FET Learnership
Wide‐spread need
341101 Technicians and trades workers
Electrician (General)
Artisan FET Learnership
Wide‐spread need
342101 Technicians and trades workers
Air‐Conditioning And Refrigeration Mechanic
Artisan FET Learnership
Sugar pack houses cold chain
Source AgriSETA Sector Skills Plans
Supply of skills
South Africarsquos agriculture skills are produced in high schools agricultural colleges FET colleges and Higher Education institutions In high school a large cohort of learners take Agricultural Science as a subject In 2003 there were 42 Agricultural High Schools offering Agricultural Science as a subject These students and those in high schools taking the subject could progress to taking agriculture as a focus area for further education In 2004 there were 10 FET colleges offering vocationally directed agricultural programmes These FET colleges offered complete qualifications and short courses Eleven Colleges of Agriculture can offer qualifications up to degree level and 19 universities offer qualifications in Agriculture ranging from agricultural economics animal and plant sciences and horticulture among others at under and post graduate levels (Department of Agriculture 2006) While long term planning of skilling of new entrants in the sector can be done through close consultation between the sector agricultural schools and colleges FET colleges and HET institutions so that they teach relevant skills there are other avenues for training for those who are already employed in the sector for example skills programmes and learnerships There are 15 registered qualifications for the primary agriculture sub sectors Currently AgriSETA has 94 registered learnerships that can address the skills needs of the identified scarce skills These are captured in Appendix 2 AgriSETA has approved accredited a number of training providers across the country to deliver the theoretical and practical components of these learnerships These include agricultural colleges FET colleges and private providers Currently the AgriSETA has 246 registered and approved providers distributed nationally as follows
AgriSETA June 2010
Table 29 AgriSETA approved training providers (2010) Province Number of providers
Gauteng 72
(29)
KwaZulu Natal 20
(8)
Limpopo 35
(14)
North West 30
(12)
Northern Cape 3
(1)
Free State 15
(6)
Mpumalanga 14
(6)
Western Cape 26
(11)
Eastern Cape 31
(13) Total 246
The providers are small to large organisations In primary agriculture small providers appear to offer the most training in rural areas and community projects (AgriSETA 2010) Most of the operating providers will be in FET colleges and agricultural colleges The AgriSETA is unable to meet the total demands for skills across the duality of their sector There seems to be fairness in the approval of training for both permanent and casual and seasonal workers In 200809 the AgriSETA approved 559 learnerships as follows
Table 30 AgriSETA learnerships approved for grant purposes (2008‐2009)
Source AgriSETA learnership data analysis
Agriculture Sector Analysis 43
AgriSETA June 2010
Agriculture Sector Analysis 44
Provision of skills programmes in the same year attracted grants for 2 706 employees
Table 31 Participation by learners in skills programmes in the AgriSETA (200809)
Source AgriSETA Skills programmes data analysis
AgriSETA June 2010
APPENDIX 1 Skills demand in the Department of Agriculture Forestry amp Fisheries (200809)
Source DAFF Annual Report 2008‐20009
Agriculture Sector Analysis 45
AgriSETA June 2010
Agriculture Sector Analysis 46
Appendix 2 AgriSETA registered learnerships Registered Learnership NQF Level SAQA Registration NoLearnership in Agri Sales and Service 4 22 Q 220001 20 178 4Learnership Agricultural Machinery Technician 2 22 Q 220007 20 160 2Learnership in Specialist Agricultural Machinery Technician 5 22 Q 220009 21 258 5Agri Trade Processes 2 22 Q 220013 30 125 2FETC Meat Examination Applying Basic Business Principles 4 30 Q 3000 2823 164 4Further Education and Training Certificate Seed Marketing Execute Seed Trials 4 22 Q 220025 21 126 4Further Education and Training Certificate Seed Research and Development Certify as Seed Unit 4 22 Q 220027 21 121 4FETC Seed Research and Development Conduct a Field Inspection of a Seed Unit 4 22 Q 220028 20 120 4Seed Research and Development Operations Operate in a Team 3 22 Q 220020 22 121 3Seed Research and Development Operations Apply Basic Business Principles 3 22 Q 220021 22 121 3National Certificate Seed Processing and Packaging Operate in a Team 3 22 Q 220026 21 123 3Sugar Industry Technical Maintenance worker 2 22 Q 220011 39 128 2National Certificate Sugar Manufacturing and Refining Technical Maintenance 3 30 Q300003 23 146 3Further Education and Training Certificate Manufacturing Technical MaintenanceProduce Components by Performing Engineering Turning Operations
4 30 Q 3000 1321 173 4
FETC Manufacturing Technical Maintenance Produce Components by Performing Milling Operations 4 30 Q 3000 1521 173 4 FETC Manufacturing Technical Maintenance Develop and Fabricate from Complex Drawing 4 30 Q 3000 1420 173 4National Certificate in Sugar Technology 5 22 Q 220036 22 140 5Further Education and Training Certificate Sugar Processing 4 22 Q 220035 31 144 4National Certificate in Sugar Technology Processing Sugar Refining 2 22 Q 220037 28 124 2National Certificate in Sugar Technology Processing Juice Preparation 2 22 Q 220038 28 124 2National Certificate in Sugar Technology Processing Crystallisation 2 22 Q 220039 27 122 2National Certificate in Sugar Technology Processing Laboratory Practice 2 22 Q 220040 25 124 2National Certificate in Sugar Technology Processing Extraction 2 22 Q 220041 28 122 2NC Rooibos Production Applying Basic Business Principles 2 30 Q 3000 2427 130 2 NC Rooibos Processing Applying Basic Business Principles 2 30 Q 3000 2224 123 2 National Certificate Cigarette Production 3 22 Q 220046 23 121 3
AgriSETA June 2010
REFERENCES AgriSETA 2010 AgriSETA 20082009 Annual report Pretoria AgriSETA Agricultural Research Council httpwwwarcagriczahomeasppid=272 Avert South African HIV and AIDS statistics Available on httpwwwavertorgsafricastatshtm Centre for Development Enterprise 2008 Land reform in South Africa Getting back on track CDE Research No 16 DAFF 2010 Quarterly economic review of the agriculture sector Pretoria DAFF DAFF 2009 Annual report 20082009 Pretoria DAFF Department of Agriculture 2008 Strategic plan 2008 Pretoria Department of Agriculture DTI An introduction to the South African economy Available on httpwwwthedtigovzapublicationsagroprocessinghtm Eastern Cape Provincial Government Eastern Cape Provincial Growth and Development Strategy 2004 ndash 2014 Economic Commission for Africa 2009 Developing African agriculture through regional value chains Addis Ababa Economic Commission for Africa Economic Report Free State Province 2005 Provincial Growth and Development Strategy 2005 ndash 2014 GCIS 2010 SA Yearbook 200910rdquo Agriculture forestry and fisheries Pretoria GCIS Greenberg S 2010 Status report on land and agricultural policy in South Africa 2010 Institute for Poverty Land and Agrarian Studies School of Government University of the Western Cape Research report Ingelozi Management Solutions 2008 HIVAIDS in the South African agricultural sector Towards the development of a long term intervention Research report KwaZulu Natal Provincial Government 2006 KwaZulu Natal Provincial Growth and Development Strategy Limpopo Provincial Government Growth and Development Strategy 2004 ndash 2014 Mhone G (2000) Enclavity and Constrained Labour Absorbtive Capacity in Southern African Countries Geneva International Labour Office Moyo S The Agrarian question and the developmental state in South Africa In Edigheji O et al 2010 Constructing a democratic developmental state in South Africa HSRC PRESS
Agriculture Sector Analysis 47
AgriSETA
Agriculture Sector Analysis
National Treasury Republic of South Africa 2010 National Budget 2010 ndash National Budget Review 2010 Pretoria National Treasury Northern Cape Provincial Government Agriculture and agro‐processing sector strategy North West Provincial Government North West Provincial Growth and Development Strategy 2004 ndash 2014 Province of the Western Cape 2008 The Ikapa growth and development strategy White Paper SABCOHA SA Business Coalition on HIV and AIDS wwwsabcohaorg SACAU httpwwwsacauorghostingsacauSacauWebnsfHomehtmOpenForm South African Government 2010 20102011 ndash 20122013 Industrial Policy Action Plan Republic of South Africa Statistics South Africa 2005 Census of commercial agriculture 2002 Report No 110201 Pretoria Statistics South Africa Statistics South Africa 2009 Census of commercial agriculture 2007 Statistical release P1101 Pretoria Statistics South Africa Statistics South Africa 2010 General household survey 2009 Statistical release P0318 Pretoria Statistics South Africa Statistics South Africa 2010 Gross domestic product first quarter 2010 Statistical release P0441 Pretoria Statistics South Africa Statistics South Africa 2010 Quarterly labour force survey Quarter 1 2010 Statistical release P0211 Pretoria Statistics South Africa Vink N amp van Rooyen J 2009 The economic performance of agriculture in South Africa since 1994 The implications for food security Pretoria DBSA development planning division working paper series No 17 Webster E 2004 the Dual Economy from a book by Van Holdt K and Webster E Work restructuring and the Crisis of Social reproduction and 10 years of restructuring post apartheid workplaces University of Natal Press Workinfocom httpwwwworkinfocomfreesub_for_legresdatalraempassoc3htm Xingwana L 2008 Challenges and Opportunities for Land and Agrarian Reform towards 2025 Speech delivered at the Agri‐Consultation Protea Ranch Hotel Polokwane 30 July 2008
- Table of contents
- SECTION 1 THE AGRICULTURAL LANDSCAPE
- 11 Size and shape of the Agricultural sector
-
- Overview
- Distribution of agricultural production
- The structure of the agriculture sector in South Africa
- Categories of farming enterprises
- Employment trends
- Employment categories and remuneration
- Stakeholders in the Agricultural sector
-
- National government departments
- Sector representatives
-
- 12 Factors impacting development in the Agriculture sector
-
- Future sector economic growth and development
-
- South African sector growth plans (IPAP2)
- International Trade
- Global recession and rise in food prices
-
- Land reform
- Reliance on imports
- Water
- The labour market
- Consumer trends
- HIVAIDS
- Farm safety and security
- Broad-based Black Economic Empowerment
-
- Conclusions and scenarios
- SECTION 2 DEMAND FOR SKILLS
-
- AgriSETA registered employers and employee coverage
- Employee coverage in the AgriSETA
-
- 21 Skills demand
-
- The National Education and Training Strategy for Agriculture (AET Strategy)
- AGRISETA sector skills planning demand data (2008-2009)
- AgriSETA WSP analyses
-
- Skills demand in the commercial agricultural sector
-
- Skills demand forecasting by AgriSETA
- Research needs going forward
-
- SECTION 3 Skills Gaps and scarce skills
-
- Scarce skills at the DAFF
- Scarce skills in the commercial sector
- Supply of skills
-
- APPENDIX 1 Skills demand in the Department of Agriculture Forestry amp Fisheries (200809)
- Appendix 2 AgriSETA registered learnerships
-
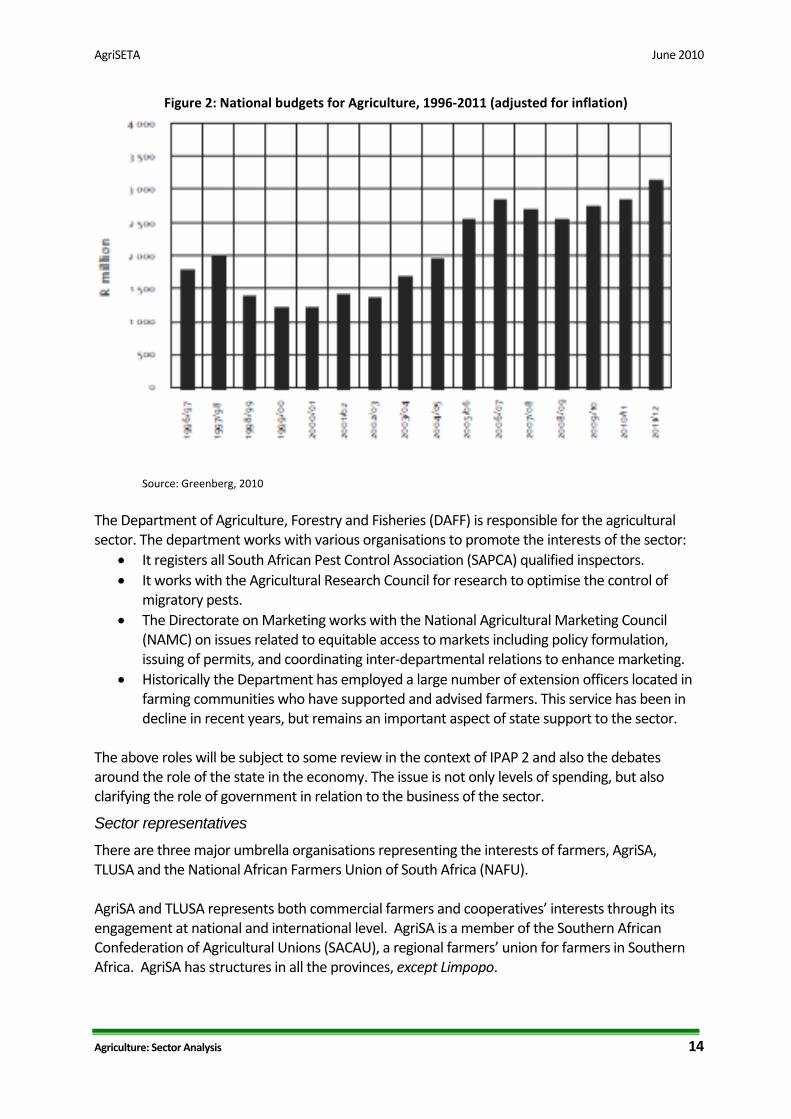
AgriSETA June 2010
Figure 2 National budgets for Agriculture 1996‐2011 (adjusted for inflation)
Source Greenberg 2010
The Department of Agriculture Forestry and Fisheries (DAFF) is responsible for the agricultural sector The department works with various organisations to promote the interests of the sector
bull It registers all South African Pest Control Association (SAPCA) qualified inspectors bull It works with the Agricultural Research Council for research to optimise the control of
migratory pests bull The Directorate on Marketing works with the National Agricultural Marketing Council
(NAMC) on issues related to equitable access to markets including policy formulation issuing of permits and coordinating inter‐departmental relations to enhance marketing
bull Historically the Department has employed a large number of extension officers located in farming communities who have supported and advised farmers This service has been in decline in recent years but remains an important aspect of state support to the sector
The above roles will be subject to some review in the context of IPAP 2 and also the debates around the role of the state in the economy The issue is not only levels of spending but also clarifying the role of government in relation to the business of the sector
Sector representatives
There are three major umbrella organisations representing the interests of farmers AgriSA TLUSA and the National African Farmers Union of South Africa (NAFU) AgriSA and TLUSA represents both commercial farmers and cooperativesrsquo interests through its engagement at national and international level AgriSA is a member of the Southern African Confederation of Agricultural Unions (SACAU) a regional farmersrsquo union for farmers in Southern Africa AgriSA has structures in all the provinces except Limpopo
Agriculture Sector Analysis 14
AgriSETA June 2010
Agriculture Sector Analysis 15
NAFU is a union for predominantly previously historically disadvantaged smallholder farmers with a membership base including farmers agribusinesses farmersrsquo organisations corporations and individuals who support their goals NAFU is represented by different unions in all the provinces There are other employer organisations who are not affiliated to AgriSA and NAFU including
bull Agricultural Industrial and Medium Employers Organisation bull Agricultural Mining and Industrial Chemical Manufacturersrsquo Association bull Agrilabor Employersrsquo Organisation bull Algoa Meat Traders Association bull East Coast Poultry Producers Employersrsquo Association bull East London and District Meat Traders Association bull Fertiliser Industry Employersrsquo Organisation bull Landbou Werkgewersorganisasie (Workinfocom) bull Red Meat Producersrsquo Association
The Agricultural Research Council is an autonomous statutory body that provides research to DAFF and the provincial departments of agriculture Figures available for South Africarsquos investment in agriculture research and development show that South Africa was above international norms of investment in RampD which are 053 of agricultural GDP for developing countries and 236 for developed countries In South Africa in 2000 agricultural RampD investment in relation to agricultural GDP was 30416 There are six major sources of credit for farmers banks (50) agricultural cooperatives and agribusiness (12) the Land Bank (21) private creditors (8) other creditors and financial institutions (9) and government (1) (GCIS 2010)
12 Factors impacting development in the Agriculture sector Several international and local factors impact on the productivity of the agricultural sector and its growth Key amongst these are
Growth of the South African economy and rising consumer demand International trade and trade agreements The global recession and rise in food prices The land reform programme Reliance on imports Water availability Changing consumer patterns and demands (eg organic food stuffs) Technological changes and mechanisms Quality standards Farm safety and security Broad‐based black economic empowerment Legislation Skills demand and supply HIVAIDS
16 Vink amp van Rooyen 2009
AgriSETA June 2010
These key factors are clustered and discussed below
Future sector economic growth and development
South African sector growth plans (IPAP2)
The 20102011 ndash 20122013 Industrial Policy Action Plan (IPAP) identifies five structural challenges that existed in the South African economy before the global economic downturn and which have been exacerbated by the recent economic crisis These challenges were evident even during the time South Africa was experiencing relatively high growth rates between 2005 and 2007 and have continued during the recession These challenges are
1 Structural imbalances in the growth path including growth that is lagging behind other medium and low income countries
2 Uneven performance of the manufacturing sector with some divisions like the automotive sector experiencing exponential growth while other sectors have stagnated
3 Employment growth being sustained by credit extension and consumption rather than by productive sectors leading to a large current account deficit
4 Low profitability of manufacturing 5 Low savings and investment from financial sector growth Only 52 of private credit was
extended to fixed investment in 2008 Key sectors have been identified for IPAPrsquos focus including agro‐processing which has a diverse group of industries and sub‐sectors including food processing beverages aquaculture horticulture medicinal aromatic and flavourants Key action plans for the agro‐processing sector are identified in IPAP2 as
Development of a National Food Control Agency to consolidate the sector Development of aquaculture to supplement dwindling wild fish stocks Designating specific areas for utilisation of aquaculture Development of the organic food sector Development of the small milling industry Enhancing competitiveness in fruit and vegetable canning Improving beneficiation of Rooibos and Honeybush products (IPAP2 2010)
International Trade
South Africa is a major exporter of Agricultural produce In particular South African fruit and fruit‐derived products such as wine and fruit juice are competitive in the global market However in many sub‐sectors where export potential exists ndash grain and meat ndash serious problems face the industry A key challenge is the uneven playing field experienced by South African exporters Major global competitors include the United States and the countries of the European Union where government subsidies in various forms are in place No such subsidies are in place in South Africa making it difficult if not impossible for South African agricultural produces to enter developed country markets due to the prices that they have to ask for products I In addition the value of the Rand has fluctuated from levels of around R10 to the US dollar to as little as R7 to the dollar When the Rand is strong export becomes difficult because it costs more in the case of the move from R10 to R7 a 30 cost increase for the importer It is impossible to
Agriculture Sector Analysis 16
AgriSETA June 2010
Agriculture Sector Analysis 17
predict whether the World Trade Organisation negotiations known as the DOHA Round will achieve progress in the coming years Historical evidence is that during periods of global recession developed economies become more protective not less and so the current outlook is not good Nor is it possible to predict the value of the Rand though current thinking in government is to move toward a weaker Rand to encourage exports These are two key variables that will need to be factored into the different sector growth scenarios for the future
Global recession and rise in food prices
Economic growth slowed down significantly in sub Saharan Africa and in South Africa in 2009 but there appear to be signs of recovery GDP growth in the region declined from about 6 in 2004 ndash 2008 to about 18 in 200910 GDP growth in South Africa was 16 in 2009 17and rose to 46 in the first quarter of 201018 though much of this is related to the income derived from the 2010 FIFA World Cup and may not be sustained Projections are generally for a slow revival with a set back after the slight rise resulting from the World Cup A return to the 6 levels of the 20078 could take some years The global recession reduced the demand for African exports and reduced capital flows to the region but it is anticipated that the demand for mineral resources by Asian and Western powers will result in both the expansion of exports and expanded foreign direct investment The competition between India and China for African markets is also expected to boost trade to the benefit of African suppliers South Africa is expected to particularly benefit from direct foreign investment from China and India China has already become South Africarsquos largest market for exports and supplier of imports19 Rising food prices have forced governments around the world to control prices of maize bread rice and dairy products In South Africa ldquofood price inflation between December 2005 and December 2006 averaged 788 rdquo20 Although efforts are being made to reduce barriers to poorer families in relation to basic food there has been no move to subsidise food generally This may change though the space for significant levels of support is restricted because of reduced revenue from income taxes resulting from the recession The global credit crunch and recession have meant a reduction in public expenditure and funding which has affected the agricultural sector21
Land reform
In South Africa specifically land reform has a significant bearing on food security and agriculturersquos contribution to GDP The objective of the land reform programme is to transfer 30 of agricultural land to black ownership by 2014 (deferred to 2025) to ensure more equitable access to land by historically disadvantaged people and to increase their participation in agricultural activities22 Land reform has been informed by four processes23
17 Department of Agriculture Forestry and Fisheries 2010 18 Stats SA 2010 19 Department of Agriculture Forestry and Fisheries 2010 20 Department of Agriculture Forestry and Fisheries 2010 ‐2011 Strategic Plan 21 Economic Commission for Africa 2009 22 Xingwana 2008 23 CDE 2008
AgriSETA June 2010
Agriculture Sector Analysis 18
Land restitution involving returning land or providing financial compensation to those whose land was dispossessed during apartheid
Land redistribution transferring more land to the historically disadvantaged Tenure reform modernising land tenure rules and access to land ownership and Providing financial support for the development of emerging farmers
In relation to progress with land reform by September 2009 only 69 of agricultural land (about 567 million hectares) had been transferred and a majority of the beneficiaries have not yet occupied the land due to lack of infrastructure input or technical support The following table gives an indication of the progress of land reform since the inception of the first democratic government
Table 14 Land transfers and beneficiaries ‐ 1994 to 2009
Province Redistribution and tenure Restitution Total Hectares Beneficiaries Claims Hectares Beneficiaries Hectares Beneficiaries
Eastern Cape 675 353 357 25 633 16 201 94 834 215 201 448 191 240 834
Free State 799 350 291 7 721 2 662 47 615 40 893 397 906 48 614
Gauteng 286 34 513 7 328 13 159 9 476 70 179 43 989 77 507
KwaZulu Natal 690 547 414 67 761 14 752 642 447 433 168 1 189 861 500 929
Limpopo 291 91 235 7 403 3 382 513 024 220 227 604 259 227 630
Mpumalanga 444 322 839 13 950 2 694 399 876 225 877 722 715 239 827
Northern Cape 271 952 744 2 773 3 682 539 620 100 554 1 492 364 103 327
North West 300 268 566 40 539 3 709 373 642 172 963 642 208 213 502
Western Cape 223 122 304 12 750 15 546 3 769 118 165 126 073 130 915
Total 3 979 3 043 264 185 858 75 787 2 624 303 1 597 227 5 667 567 1 783 085
Source Greenberg 2010
Achievement of the 30 land reform target is being made difficult by land prices Under the willing buyer willing seller scheme the government will need R74 billion to be able to purchase enough land While resources may be available there are suggestions of lack of capacity The Department of Rural Development and Land Reform (DRDLR) was able to spend only 31 of its land reform 200910 budget in the first six months of the financial year Going forward this Department needs to identify what the real challenges are with the pace of land reform delivery so that they can be mitigated to meet the 2025 target A priority is the retention of skills skills transfer and skills development during the transfer of land as well as retention of national food production to avoid loss of production Support for new beneficiaries of land to ensure sustained productivity is derived from two main sources of funding ndash the Broadening Access to Agriculture Thrust (BADAT) and the Comprehensive Agricultural Support Programme (CASP) CASP is a conditional grant from the Department of Agriculture Forestry and Fisheries to provincial departments to support emerging farmer development Provincial farming budgets dedicated for farmer support in Mpumalanga the Free State Northern Cape and the Western Cape have risen significantly and those in KwaZulu Natal and Gauteng have witnessed a slight increase Eastern Cape and Limpopo agricultural budgets have been steady The North West is the only province where there has been a sharp decline in the share of the budget dedicated to farmer support24
24 Greenberg 2010
AgriSETA June 2010
Agriculture Sector Analysis 19
Reliance on imports
Overall the Agriculture sector contributes positively to the balance of payments ldquoSouth Africa remains food secure The value of our exports increased by 464 from R33 656 million in 200708 to R49 278 million in 200809 During the same period the estimated value of imports rose by 12 from R34 009 million to R38 401 million resulting in a positive trade balancerdquo25
South Africa depends largely on world markets for seed production and agrochemicals Regarding seed production there are only three community seed production schemes in Limpopo and Mpumalanga being piloted with state funding Ten top large companies including two South African companies and multinationals have rights to over two thirds of registered seed varieties in South Africa Despite the dominance of genetically modified and hybrid seed in some sub‐sectors like maize sunflower and sorghum open‐pollinated varieties have been resilient in South Africa enabling the possibility of alternative seed sources not dependent on technological processes26 In relation to agrochemicals deregulation and liberalisation in the fertiliser sector led to the shutdown of local production capacity and South Africa became an importer of fertiliser for the first time in 2000 There are three large players in the fertiliser sector Sasol Nitro Yara and Omnia South Africa imports an estimated 70 of fertilisers and pesticides Fertiliser prices rose by over 200 between 2006 and 2008 but dropped somewhat after that However this hike signified the volatility of the agrochemicals industry and South Africarsquos dependency on imports and the potential risk for emerging farmers and food production of this dependence on imports as the country cannot control the prices making inputs both difficult to budget for and in many cases unaffordable The price of agrochemicals is also particularly influenced by the prices of oil and the exchange rate The general understanding in relation to job creation is that a weaker Rand will improve exports and therefore enable job creation Of course the down side of this strategy is that imports become more expensive So what may be an advantage for those sub‐sectors who are expanding their export volumes those relying on imported agro chemicals will be under increased pressure
Water
Water is both an essential and scarce resource for the agriculture sector and is being threatened by climate changes Crop production relies heavily on water and yet access to water is not being addressed in a systematic way in the land reform processes Greenberg suggests that the relationship between land reform agricultural support and water resource provision is inadequate and a way to address this could be established by linking water provision to land transfer or investing in irrigation for both commercial and resource‐poor farmers However investing in irrigation in the context of water scarcity and climate change may not be the best option What could be needed is finding ways to maximise efficiency of the 60 of South African
25 Department of Agriculture Forestry and Fisheries Strategic Plan 201011 26 Greenberg 2010
AgriSETA June 2010
Agriculture Sector Analysis 20
water used for irrigation by for example using methods such as drip or micro‐irrigation which are expensive to set up but which reduce water wastage by 5‐1027 The Department of Water Affairs is responsible for managing water supply and has to give authorisation for agricultural projects and other developments The department needs to be seen as an important stakeholder in the agricultural sector
The labour market
South Africa recorded an unemployment rate of 243 in 2009 (narrow definition) If people who are no longer actively seeking work are considered the broad unemployment rate rose from 267 to 313 illustrated in the figure below As a direct consequence of the global economic downturn in 2008 870 000 formal jobs were lost in 200928 Others have quoted a figure of over 1 million
Figure 3 Official unemployment in South Africa 2003 ‐2009
Source National Treasury 2010
Annual employment loss followed sector growth patterns with agriculture mining manufacturing and trade facing the highest job losses as their sector growth contracted Unemployment is especially a major problem among lower skilled workers and younger people Youth employment in the 15 ‐24 year age group has fallen by 219 000 (136) and 483 of people in this age group are unemployed Employment of semi‐skilled and unskilled workers has contracted by 527 000 and male employment has gone down by 550 000 (71) while that of women has decreased by 320 000 (52) The number of discouraged workers ie those no longer actively seeking work has increased from 518 000 to 17 million29 Clearly the existence of a very large pool of largely unskilled unemployed workers has an impact on the farming sector It drives wages down and creates opportunities for casualisation and the expansion of labour contract agencies and brokers In addition there are significant numbers of foreign nationals mainly from Zimbabwe and Mozambique who are seeking work and often finding it on farms and in primary processing and packaging plants There are benefits to the
27 Greenberg 2010 28 National Treasury 2010 29 National Treasury 2010
AgriSETA June 2010
Agriculture Sector Analysis 21
sector with skilled and semi‐skilled workers coming into the labour market and being absorbed into the workforce and helping raise productivity levels However at the lower skilled end of the market the existence of this pool brings further casualisation and downward pressure on wages Tensions are likely to increase and further protests either in the form of xenophobic outbreaks or actions against farmers may well increase A view often expressed by farm employers is that current labour legislation makes dismissing workers difficult and so the availability of labour without entering into contracts of employment is an attractive way of avoiding the legislation and its obligations Organised Labour is seeking to restrict these opportunities through either regulating or eliminating labour brokers and efforts are being made to regulate the use of foreign labour However for the foreseeable future the trend is for formally employed people to be reduced in number In relation to the emergent sector there will also be a reluctance to enter employment contracts with workers The fact that many households are engaged in some form of largely unpaid agricultural work means that there is significant casual work dating back many years Helping change this situation into one where casual or unpaid jobs are transformed into formal jobs with regular wages will take time It is also likely that as some emergent farms become established they will act similarly to established farms and institute a form of casual labour rather than expanding a workforce for which they would have to take a level of responsibility From an AgriSETA perspective these labour market trends mean that whilst levy income can be directed at a relatively small labour pool one that is manageable in terms of planning and implementation the size of the informal casual and unemployed labour force in the sector ‐ for whom no levy is paid and who have no employer to plan for their skills needs ndash is very large and its needs almost unlimited Clearly the relationship with the National Skills Fund (NSF) becomes critical in respect of the entire non‐levy income sector Again the level of support available from non‐levy income sources will be an important variable in looking at future sector skills development scenarios
Consumer trends
South Africa currently produces enough food to meet the needs of its population However consumption of three main staples maize wheat and vegetables has been volatile since 1985 and remains below 1990 levels Consumption of maize and vegetables by South Africans is 17 and 32 less respectively than in 198530 The main reasons for this lie in the growing levels of poverty and the difficulties that families have in purchasing nutritious food Whilst government has increased the levels of social grants and increased the number of people receiving grants to around 13 million the incomes of poor families have been badly hit by a range of factors including job losses and rises in food prices The approximately 1 million people who lost their jobs in 20089 meant a loss of income for many millions of dependents Rises in food prices have also had a disproportionate impact on the poor Whilst food is available it is often not accessible to families on the income levels that they have to manage within The result is that less and less nutritious food is purchased which in turn impacts on the ability of farmers to sell their products locally 30 Greenberg 2010
AgriSETA June 2010
Agriculture Sector Analysis 22
Whilst there is no evidence that government will reduce its efforts in relation to poverty relief and social benefits including such programmes as school feeding schemes and food parcels during periods of drought the state of public finances may not enable to support the poverty that grips many rural areas If real income levels for the poor were to rise it could have a significant impact on the economy of the agricultural sector Equally an improvement in the rural economy with increased agricultural production and jobs would dramatically impact on the capacity of people to buy nutritious food Achieving a positive growth path in rural areas is a huge challenge for government and one that is key to governmentrsquos Medium Term Strategic Framework and Industrial Policy Action Plans
HIVAIDS
South Africa has a high prevalence of HIV and AIDS The HIV prevalence among people aged two and above was estimated at 109 in 2008
Table 15 Estimated HIV percentage prevalence by age group (2002 ndash 2008)
Age 2002 2005 2008 Change
Children (2‐14 years) 56 33 25 ‐31
Youth (15‐24 years) 93 103 87 ‐06
Adults (25 and older) 155 156 168 13
15‐49 year olds 156 1692 169 13
Total (ages 2 to 49) 114 108 109 ‐05 Source Avert 2009
The table above shows that HIV prevalence is highest amongst those aged 25 years and older Given youth labour market analyses which point to people from previously disadvantaged backgrounds mainly African males accessing formal employment for the first time at age 25 ‐27 this population can be held to represent people in employment Research31 has estimated that by 2020 the pandemic will have claimed at least 20 of employees in the agricultural sector Southern Africa
in
HIV and AIDS have significant ramifications in the agricultural sector for both commercial farming and subsistence farming The implications include
bull Decrease in cultivated land bull Focus on less labour intensive crop and animal production bull Decrease in womenrsquos agricultural productivity as they take on a more care giving role bull Loss of skills bull Increase in absenteeism from work bull Decrease in daily work outputproductivity because workers are weaker from infections
There are suggestions that the impact of the pandemic in South Africa demands sectoral intervention although this may be difficult in the agricultural commercial sector as
bull Seasonal workers who seem to be more vulnerable to infection because of their low socio‐economic status are not in one place long enough for care programs Further
31 Ingelozi Management Solutions 2008
AgriSETA June 2010
Agriculture Sector Analysis 23
farmers and employers may not feel responsible for seasonal workers in the same way they would invest in their permanent employees
bull There may be uncertainty around land reform which may put HIV intervention on farms on the back burner
bull There are no policies that enforce HIV education and care on farms in the same way that legislation like BEE does for ownership As a result HIV intervention may be left to goodwill and employers may feel it is more important to comply with issues that are monitored
Farm safety and security
South Africa has been plagued by unacceptably high levels of violent crime and murder for many years now Farms have experienced this and those living on farms feel and are extremely vulnerable The South African Chamber of Commerce and Industry (SACCI) has argued that
Using the nominal GDP figure for 2009 of R24 trillion a 322 percent contribution of agriculture to GDP and an estimate of 39982 farms (as at 2007) in South Africa the cost of a murderattack on a farm to the economy was R1932869 per annum
SACCI acknowledges that this estimate is flawed as it does not take into consideration the fact that farming units contribute differently to GDP and that not every attack or murder contributes to farm shut down or loss of productivity However if not addressed these attacks could lead to loss of farming sectors as farmers migrate to lsquosaferrsquo regions This will affect employment and GDP contribution of the sector The need for safety and security on farms may also shift farmersrsquo focus in skills development to include personnel who have skills in safety and security
Broad‐based Black Economic Empowerment
The aim of the AgriBEE Charter (gazetted in 2008) is to increase the involvement of black business in agriculture through ownership and control as executives and senior managers of new and existing agricultural businesses The extent to which AgriBEE is transforming the sector is not known as it is too early to tell but a recent survey conducted by ABC and the IDC showed that among the ABC respondents in 2007 46 of enterprises were busy constructing a BEE strategy and 46 claimed to be implementing a BEE strategy A survey of the dairy industry in the Western and Eastern Cape in 2008 showed that only 6 of firms had a BEE strategy in place It also seems from survey data that companies are focusing on the skills development and socio‐economic aspects of BEE rather than on ownership32 It would appear that although there have been some significant BEE purchases of viable farms and some employee empowerment projects including some quite high profile ones in the Cape Winelands the extent of ownership change had been limited One of the factors is the very high level of single person or family ownership in the agricultural sector BEE is more straight forward in the corporate world where shares can be exchanged For a family business it is a matter of selling off part or all of the land and the tendency is to sell off those areas of the farm that are expendable from a business sustainability perspective
32 Greenberg 2010
AgriSETA June 2010
Whilst there is discussion in government about the ending of the ldquowilling buyer willing sellerrdquo concept the Constitution itself provides for property rights and so although some pressure may be exerted through legislation and regulation the extent and speed of change may not be fast The mechanisms for encouraging the transfer of significant levels of ownership have not yet been created The focus of the SETA is therefore likely to be more the beneficiaries of land reform and emergent farmers though projects of a BEE nature can be targeted as they arise
Conclusions and scenarios It is useful when looking at possible scenarios to examine the key variables or uncertainties and to project how variations one way or the other will have an impact on the development and growth of the sector From the sector analysis and factors that are contributing to change in the sector there are some key factors that seem to emerge First appears to be the economy and related issues of the labour market and the challenges of labour absorption in an enclave economy These factors determine on the one hand whether there will be growth and development and on the other whether such improvements will result in improved employment opportunities and the creation of a virtuous cycle of development Second is the role of the state and the various government departments whose plans and work impact on the agricultural sector Related to this is land reform that is inevitably driven by the state and not the owners of land or the landless The view expressed by many engaged in agrarian reform is that the state must play a significant role It becomes clear that a successful agricultural enterprise requires a number of factors to be in place to be successful These include access to land (Department of Rural Development and Land Reform) agricultural support within a supportive agricultural framework (Department of Agriculture Forestry and Fisheries) access to consistent water supply (Department of Water Affairs) access to finance (Department of Trade and Industry various state agencies) conducive labour market regulation (Department of Labour) sound industrial policy (Department of Trade and Industry) economic planning and macro policy (Department of Economic Development National Treasury) and appropriate education training and skills development (Department of Higher Education and Training the Human Resources Development Council NSA and the SETA) There are other government departments as well as provincial and municipal structures that also play a role The following analyses show how the four variables
economic growth and development role of the government labour market changes and land reform)
impact positively or negatively on the growth of the sector and the demand for skills
Agriculture Sector Analysis 24
AgriSETA June 2010
Agriculture Sector Analysis 25
HHIIGGHH GGRROOWWTTHH SSCCEENNAARRIIOO
The economics of the sector Role of government
The economy in SA and globally continues to revive albeit slowly for the next few years
Roles and integration of national government departments are clarified Specific functions are agreed processes put in place and personnel appointed with the required skills
International trade agreements are still weighted infavour of US and EU but progress is being made and specific blockages are addressed in bilateral talks
The roles of Departments (DWA DAFF DRDLR DoL DTI DED DHET) are clarified with appropriate joint plans and coordinating structures
The rural economy gradually improves with the buying power of the poor increasing and more stable markets created for local produce
For each of the functions agreed in each of the related departments appropriate structures and systems are put in place and staff trained
Exports increase in key areas identified in IPAP 2 and the Rand exchange rate stabilises at a level not too much different than it is today
Specific capacity is put in place at local level to support implementation of land reform and rural development
There is a growing understanding of the concept of dualism and the need to intervene with labour absorption and development mechanisms
Land claims are all finally settled and ownership and tenure is resolved There is a serious drive to establish effective agricultural enterprises
An understanding is reached on the role of agencies and labour brokers and abuse is curbed
The willing buyer willing seller approach is resolved and enables viable land to become black owned
Some relaxation of labour market regulations are agreed that maintain some minimum standard of employment but assist absorption
Land transfer to black and emergent farmers is done in a manner that integrates then into the supply chains of the sector
Mechanisms are found to address skills needs in the context of casual and seasonal work patterns
Financing of land reform and transfer is done on the basis of agreed development plans including skills
Labour market reform Trajectory of land reform LLOOWW GGRROOWWTTHH SSCCEENNAARRIIOO
The economics of the sector Role of government departments The economy in SA and globally stagnates at current levels and the economy struggles to pick up after the temporary 2010 World Cup boost
A lack of purpose at government level means limited progress for another five years Land reform remains a commitment without a plan
International trade agreements are still weighted infavour of US and EU and protectionism increases as a result of the global recession
The roles of Departments (DWA DAFF DRDLR DoL DTI DED DHET) are unclear and there is no proper co‐ordination
SArsquos Gini coefficient continues to worsen with rural poverty increasing and local economies declining
There is a lack of effective structures systems and processes to implement policy across departments
Rand volatility causes problems for importers and exporters Well established markets are maintained but exports decrease
At local level the decline in the agricultural extension officer functions continues and limited practical support is available
Understanding of the rural economy is so diverse that stakeholders cannot agree the problem let alone the solution to low absorption levels
Land claims take too long and land reform processes leave potentially productive land poorly developed and managed
Casual labour and labour brokers remains an issue of dispute Confrontation results in bitterness and resentment
The impasse caused by a rigid interpretations of property clauses in the Constitution continues to stall achievement of the 30 black ownership target
Labour market regulation continues to be a contributing factor to reducing levels of employment
Black owned farms find it difficult to become part of supply chains and are unable to perform adequately
Unstable employment patterns in the sector make skills interventions difficult to manage and largely ineffective
Financing of land reform and land transfer continues to be wasted as it is not tied to the building of appropriate capacity
Labour market reform Trajectory of land reform
AgriSETA June 2010
These analyses can be translated into four potential growth and development scenarios for the agricultural sector which are based on the requirements for a strong development state Scenario 3 Weak government support
and sound economy
Econ
omic fa
ctors glob
ally n
ationa
lly and
locally
Scenario 1 Integrated government support and sound economy
The economic upturn triggered by the World Cup continues and globally things improve enabling an expansion of exports The government because of a lack of integrated policy planning and implementation provides limited support for sector development The gains go to the well established enterprise owners with few gains for emerging farmers and local communities
Government departments coordinate their efforts to achieve maximum impact There are favourable economic conditions that create opportunities for advance Within this positive environment the role of the AgriSETA becomes a central component of a comprehensive strategy for growth and skills interventions are targeted to achieve maximum effect Results in growth in sustainable enterprises and expanded employment opportunities
Government policy and support Government policy and support
Combination of disjointed government policy planning and a weak and increasingly marginalised rural economy Economic conditions result in unsustainable farming conditions and employment declines along with productivity Food shortages and the lack of development in rural areas leading to increasing social tensions A vicious cycle develops with the sector going into long term decline
Government departments coordinate their efforts to achieve maximum impact However economic conditions hamper progress Efforts by the AgriSETA are undermined by poor labour absorption and job insecurity Some significant successes are recorded including some NSF funded projects that result in sustainable enterprises A platform is laid for future improvements when the economic conditions improve
Scenario 4 Weak state and economy Scenario 2 Strong state but weak
economy
Agriculture Sector Analysis 26
AgriSETA June 2010
Agriculture Sector Analysis 27
SECTION 2 DEMAND FOR SKILLS
AgriSETA registered employers and employee coverage
In 2009 17 234 employers were registered with the AgriSETA comprising 15 394 small employers (less than 50 employees) 1 202 medium sized employers (50 ‐ 149 employees) and 638 large employers (more than 150 employees)
Considering that there are around 40000 commercial farms33 the 17 234 employers represent around 43 of commercial farms Notwithstanding changes in the sector as a result of land reform and sector shrinkage this is a sizable proportion and is held to be sufficiently representative for the purpose of skills development planning However this paints an incomplete picture It understates the representative nature of large enterprise registered with the SETA and overstates the representative nature of small registered enterprises 4 175 (242) of the enterprises are levy paying members Further only 1 673 (11) workplace skills plans (WSPs) were submitted
Table 16 Registered employers by size and sub‐sector Sub‐sector Description
Employers Small Medium Large
CoffeeTea Processing and marketing of coffee and tea including coconuts cocoa nuts olives dates etc
33 4 3
Fibre Grading ginning packing of wool and cotton raw material 1 676 16 18
Fruit Fruit packed in cartons fruit juice concentrate drummed and fruit juice in container ready for consumption
271 36 57
Fruit exporters and importers 6 0 1
Grain
Manufacture of grain mill products and starches 119 5 7Handling and storage of grain 67 7 23Wholesale amp retail trade in Agricultural machinery 213 9 4Sale and distribution of Agricultural raw materials and other farming inputs
182 9 3
Milling
Manufacture of flour and grain mill products including rice and vegetable milling grain mill residues
120 15 11
Manufacture of prepared animal feeds 110 19 0Manufacture of pet foods 42 9 0Manufacture of starches and starch products 7 1 1
Pest control
Pest Control 209 4 0
Poultry Poultry and egg production including the slaughtering dressing and packing of poultry
305 49 37
Primary
Growing of Cereals and other crops (not elsewhere classified) 902 160 34Growing of Vegetables Horticultural specialties nursery products
943 120 72
Growing of Vegetables Horticultural specialties (Including Ornamental Horticulture) and nursery products
11 5 0
Sugar plantation including sugar cane and sugar beet etc 9 4 2
33 SARS statistics 2007
AgriSETA June 2010
Agriculture Sector Analysis 28
Sub‐ Description Employers Growing of fruit nuts beverage and spice crops 1795 255 143Farming of cattle sheep goats horses asses mules and hinnies Dairy farming
2 252 59 18
Other animal farming production of animal products (NEC) 433 25 12Ostrich farming 5 0 0Game farming 16 0 0Growing of crops combined with farming of animals (Mixed farming)
2 920 256 109
Growing of coffee and tea including coconuts cocoa nuts olives dates etc
2 0 0
Agricultural and animal husbandry services except veterinary activities
438 22 9
Other animal farming (not elsewhere classified) 11 1 1Growing of trees as second crop by farmers 126 18 4Fishing operation of fish hatcheries and fish farm 913 10 6
Red meat
Production and animal products (not elsewhere classified) 6 0 0Slaughtering dressing and packing of livestock including poultry and small game for meat
317 40 17
Production sale amp marketing of Agricultural by products (eg bones hides)
61 2 0
Slaughtering dressing and packing of livestock including small game for meat and processing of ostrich products
2 1 0
Wholesale trade in Agricultural raw materials and livestock 193 7 10Transport of livestock as supporting activity 224 0 0Agricultural and livestock research 215 9 3
Seed Seed production and marketing 149 12 6
Sugar Manufacture of sugar including golden syrup and castor sugar
45 5 21
Tobacco Processing and dispatching of tobacco 46 8 6 TOTALS 15 394 1 202 638Source AgriSETA WSP data
The largest number of registered small and medium enterprises are found in the mixed farming sub‐sector while most large enterprises are in the growing of fruit nuts beverage and spice crops sub‐sector
Employee coverage in the AgriSETA
Collectively the 17 234 employers registered with AgriSETA employed a total of 239 076 employees This represents 39 of the agricultural labour force in 2009 The 1 673 employers who submitted WSPs in 2009 employed 97 898 employees representing 41 of the total number of people employed by registered employers While the number of registered employers submitting WSPs is small (11) they employ a sizeable number of employees and the percentage of employees provides a statistically significant sample The data for larger enterprises is statistically much more representative than that for small enterprises
AgriSETA June 2010
Table 17 Number of employees of registered employers by sub‐sector
Sub‐sector
Sub‐sector description Employees
CoffeeTea Processing and marketing of coffee and tea including coconuts cocoa nuts olives dates etc
483
Fibre Grading ginning and packing of wool and cotton raw material 6 539
Fruit Fruit packed in cartons fruit juice concentrate drummed and fruit juice in container ready for consumption
27 661
Fruit exporters and importers 212
Grain
Manufacture of grain mill products and starches 133Handling and storage of grain 18 303Wholesale amp retail trade in Agricultural machinery 795Sale and distribution of Agricultural raw materials and other farming inputs 2 898
Milling
Manufacture of flour and grain mill products including rice and vegetable milling grain mill residues
3 634
Manufacture of prepared animal feeds 731Manufacture of pet foods 160Manufacture of starches and starch products 105
Pest control
Pest Control 119
Poultry Poultry and egg production including the slaughtering dressing and packing of poultry
19 187
Primary
Growing of Cereals and other crops (not elsewhere classified) 10 104Growing of Vegetables Horticultural specialties and nursery products 37 799Growing of Vegetables Horticultural specialties (Including Ornamental Horticulture) and nursery products
195
Sugar plantation including sugar cane and sugar beet etc 220Growing of fruit nuts beverage and spice crops 47 043Farming of cattle sheep goats horses asses mules hinnies Dairy farming
3 382
Other animal farming production of animal products (NEC) 4 203Ostrich farming 0Game farming 0Growing of crops combined with farming of animals (Mixed farming) 28 722Growing of coffee amp tea including coconuts cocoa nuts olives dates etc 0Agricultural and animal husbandry services except veterinary activities 970Other animal farming (not elsewhere classified) 513Growing of trees as second crop by farmers 1 294Fishing operation of fish hatcheries and fish farm 1 589
Red meat
Production and animal products (not elsewhere classified) 0Slaughtering dressing and packing of livestock including poultry and small game for meat
5 128
Production sale amp marketing of Agricultural by products (eg bones hides) 116Slaughtering dressing and packing of livestock including small game for meat and processing of ostrich products
0
Wholesale trade in Agricultural raw materials and livestock 1 697Transport of livestock as supporting activity 0Agricultural and livestock research 534
Seed Seed production and marketing 2 127Sugar Manufacture of sugar including golden syrup and castor sugar 10 478Tobacco Processing and dispatching of tobacco 2 002 Total 239 076
Agriculture Sector Analysis 29
AgriSETA June 2010
Agriculture Sector Analysis 30
Source AgriSETA WSP data
According to the WSP analysis the sub‐sector for the growing of fruit nuts beverage and spice crops employed the largest number of people In six sub‐sectors there are employers who do not employ workers These are probably family based organisations where family members help in the business without drawing a salary These are in transport and livestock research slaughtering dressing and packing of livestock including poultry and small game for meat growing of coffee and tea including coconuts cocoa nuts olives dates etc ostrich farming and game farming
Table 18 Employee distribution by province Province Employees Percentage
Eastern Cape 18 844 192 Free State 1 946 20 Gauteng 2 788 28 KwaZulu‐Natal 5 416 55 Mpumalanga 8 062 82 North West 3 290 34 Northern Cape 5 436 56 Limpopo 1 730 18 Western Cape 50 386 515 Grand Total 97 898
Source AgriSETA WSP data
Of those submitting WSPs registered employers in the Western Cape employed the largest number of people while employers in Limpopo employed the least number of employees Free State has a small number of employees covered by WSPs submitted to the SETA whereas Eastern Cape with a relatively small number of registered farms has a very large number of employees on farms submitting WSPs Given this variance between provinces the use of WSP data for extrapolation purposes must be viewed cautiously
2009 WSP equity information was only provided for about a quarter of employees (25 637 or26)34 No information was available from the WSPs on non‐South Africans working on commercial farms
Table 19 Equity profile from 2009 WSP data African Coloured Indian White
Totals M F D M F D M F D M F D
8 040 5 785 38 5 097 5 228 24 22 25 0 811 556 11
580 417 03 493 505 02 468 532 00 589 403 08 13 863 10 349 47 1 378 25 637541 404 02 54 100
Total EquityTotal Male Total Female Total Disability
13 970 11 594 73 545 452 03
Source AgriSETA WSP data
Using currently available data it is not possible to provide disaggregated employment data by sub‐sector This will require a small change in the way that gender race and disability data is
34 Some employers did not complete race and gender information when giving their employment profiles
AgriSETA June 2010
codified during WSP data‐capturing including allocation by sub‐sector What can be stated is that employment of males is more dominant than that of women and more Africans are employed in the sector than other groups Employment of people with disabilities is below 1
21 Skills demand
The National Education and Training Strategy for Agriculture (AET Strategy)
The AET Strategy developed by the Department of Agriculture Fisheries and Forestry (in consultation with various key stakeholders in the agricultural sector) highlights priority skills needs and constraints within the sector and categorises needs within the following 5 broad areas
1 Agricultural production ndash requesting that the past focus on a narrow band of commodities (relevant mainly to the commercial sector) and related research be expanded to address the needs of small‐scale and subsistence farmers (eg more focus on mixed farming and rural livelihood sustainability skills)
2 Agricultural engineering ndash with specific focus to be placed on technologies suitable for small‐scale farmers (eg relevant and post‐harvesting techniques related to processing and storage of produce) ndash to address this need the scarcity of agricultural engineers requires attention
3 Agricultural economics ndash a critical need was identified for general agricultural economic skills (ranging spectrum of farm planning farm management enterprise management marketing finance etc) ndash with the need to training both farmers and extension officers in such fields
4 Agricultural development ndash a specific need was identified to develop agricultural extensionists in supporting especially emerging and small‐scale farmers over the full spectrum (a need exists for both new curriculum in the training of new extensionists and the re‐training and upgrading of existing officers)
5 Veterinarians ndash the need to develop state veterinarians in order for the state to perform its role and function (particularly in its preventative monitoring and regulatory role and function)
AGRISETA sector skills planning demand data (2008‐2009)
The following section reflects initial research on skills demand in the Agricultural sector arising from the sector analysis (section 1) previous AGRISETA skills demand research for Sector Skills Planning during 2005‐2009 and analysis of WSP data from 2009 With the introduction of the Organising Framework of Occupations and agreement on definitions for scarce and critical skills in 200506 the AGRISETA undertook an extensive research and consultation processes to determine skills development priorities for the sector The research methodology employed was based on the a four dimensional topology for establishing and evaluating skills needs illustrated in the figure below
Agriculture Sector Analysis 31
AgriSETA June 2010
Agriculture Sector Analysis 32
The identification and prioritisation of skills needs was also undertaken from a key stakeholder and beneficiary perspective Consideration was given to needs of the following groups
bull The unemployed ndash helping them gain andor regain entry to the labour market bull The economically inactive ndash helping them to become economically active bull School leavers ndash helping them gain access to further education and training opportunities
and thus facilitating their entry to the job market bull Entrants to the job market ndash facilitating employment and integration into the work culture
and work ethic (improving the employability of an individual) bull Those currently employed in the sector ndash increasing their competency and opportunities
for advancement creating a career path and offering continued job security enhancement of value adding to the sector improving their prospects for better employment opportunities
bull Organisations and enterprises within the sector ndash making sure that skills development and knowledge creation occurs in such a way as to improve the sectorrsquos viability and allowing companiesenterprises to become more sustainable and profitable along the way improving productivity competitiveness and innovation within organisations
In organising and reporting the identified priority skills development needs (200809) the following structuring approach was followed
Tier 1 The four categories of needs as per the Topology presented above were used for the identification evaluation and grouping of needs
Pay conditions
Image
RECRUITMENT DIFFICULTY
SKILLSGAP
SKILLSSHORTAGE
LABOURSHORTAGE
Firms experience difficulty recruiting This does not necessary imply a skills shortage ndash may indicate a poor image remuneration etc
Those currently in work do not have the requisite skills set to carry out their job to an optimum standard
Required skills are in short supply when compared with the demand across the whole labour market
Regardless of skills levels a situation exists where there is simply not enough supply of labour to meet demand
Pay conditions
Image
RECRUITMENT DIFFICULTY
SKILLSGAP
SKILLSSHORTAGE
LABOURSHORTAGE
Firms experience difficulty recruiting This does not necessary imply a skills shortage ndash may indicate a poor image remuneration etc
Those currently in work do not have the requisite skills set to carry out their job to an optimum standard
Required skills are in short supply when compared with the demand across the whole labour market
Regardless of skills levels a situation exists where there is simply not enough supply of labour to meet demand
Figure 4 Topology for identifying skills development priorities
Source AGRISETA SSP Annual Update August 2009
AgriSETA June 2010
Tier 2 Within each of the first tier groupings needs were further broken down and organised per target group At this second level needs were grouped by
o General skills development needs (cross‐cutting over different target groups) o Needs experienced by small scale farmers (this group included subsistence
farmers new emerging land reform beneficiaries and small‐scale AgriBEE farmers) o Needs within the commercial agricultural sector (per sub‐sector groupings where
specific needs for such were identified ndash both on‐farm needs and within the secondary sub‐sector or related agri‐businesses)
o Needs of the Department of Agriculture Fisheries and Forestry (DAFF) To further guide and direct the identification and selection of scarce and critical skills the following factors or criteria that could reflect the importance (impact and effect) of a skills shortages were developed as an identification framework
1 Basic Skills Development Promoting basic literacy and numeracy and raising the base level of education for the sector improving the work and livelihood of existing workers
2 Employability Making the employee more employable by improving the fit between their skills and the sector needs
3 Enterprise Viability Improving the capability and feasibility of the enterprise by increasing its effectiveness of or possibilities for profit generation etc
4 Enterprise Sustainability Allow enterprises to survive and grow over an extended period of time without compromising the value of renewable resources thereby creating long‐term meaningful employment for larger numbers of people
5 Sector Growth Enabling the sector to develop or pursue new opportunities or improve the effectiveness of current operations
6 Sector Competitiveness Enabling the sector to compete more effectively in the international arena improving market intelligence and interpretation productivity cost efficiency etc
7 Human Resource Development Capacity Improving the access to quality provision of training to the agri sector
Based on this research and consultation framework the following skills development needs and priorities were identified
Agriculture Sector Analysis 33
AgriSETA June 2010
GENERAL NEEDS SMALL‐SCALE FARMER
NEEDS COMMERCIAL SECTOR
NEEDS DAFF NEEDS
RECRUITMENT RELATED SKILLS NEEDS Primary agriculture is the entry point into the world of work for large numbers of people in rural areas However the sector has negative connotations amongst sections of the youth and in parts of the country and is viewed as a last resort for some in the search for employment) The effect is that despite an unemployment rate of approximately 26 (now over 30) farmers find it difficult to recruit workers to meet seasonal demands This has resulted in the government approving the contracting of foreign labour to meet such temporary needs (workers are recruited mainly from Zimbabwe and Mozambique)
Labour in this farming sector is provided primarily by family members and no real recruitment constraints can be identified
The agricultural sector still manages to attract technical and management skills as it is perceived to include a better lifestyle and there is a strong tradition of agriculture in SA Increasing crime related security risks associated with farming may have a negative impact
The Department has identified a number of occupations in which they are experiencing long‐term vacancies Some of these result from a general shortage of such skills in SA while others arise from the inability of the public sector to compete with the private sector (less favourable employment image working conditions and equity considerations) Priority vacancies include Veterinarians Agricultural
Engineers Plant Health
Specialists Agricultural
Statisticians Plant Health Pest Risk
Analysts ICT Specialists Agricultural
Economists Agricultural Food and
Quarantine Technicians
Agro‐meteorologists Pasture Scientists Plant Production
Specialists Specialised Food
Analysts SKILLS GAPS RELATED NEEDS
bull Low literacy and numeracy levels ndash both amongst workers within the sector at large and at ownermanager level in many of the small‐scale farming
bull Farm management
Farm Management (Mainly owners managers) bull Farm management amp
entrepreneurship bull Resource
management and record keeping
bull Financial planning
A critical constraint is the poor educational levels of a large proportion of the labour force in the sector demanding a considerable effort and investment in ABET and other life skills
A particularly big need exists for skills upgrading amongst Extension Officers ndash particularly with regard to redress the historical neglect of small‐scale farmers and resource strapped farmers
Agriculture Sector Analysis 34
AgriSETA June 2010
Agriculture Sector Analysis 35
GENERAL NEEDS SMALL‐SCALE FARMER
NEEDS COMMERCIAL SECTOR
NEEDS DAFF NEEDS
skills (and general management skills in other agricultural businesses) coupled with a business orientation and entrepreneurship skills
bull A general need to increase compliance with environmental occupational health and safety animal welfare produce safety and hygiene standards regulations and requirements (local and international standards)
and management bull Project management bull Business plan
development Marketing and processing bull Processing and
packaging bull Transport
management bull Marketing produce
including branding bull Planning for
marketing bull Knowledge of
markets Technical knowledge and skills bull Production
management (related to specific enterprise)
bull Demonstration of production techniques
bull Natural resources management
Mechanical knowledge bull Farm maintenance bull Repairs of machinery
and equipment bull Electrical
maintenance and installation
programmes Need for improved management skills and relevant technological knowledge for increasing productivity levels and improved production methods Rising importance for environmentally responsible production and processing management systems Rising competitive and international markets increases need for business and marketing abilities among owners and managers Increasing requirements for compliance with environmental health and safety and international trade standards Information technology although not a priority is increasing in importance Business management ability is becoming increasingly important as more farmers are making decisions about restructuring their businesses diversification and developing supplementary sources of income
Critically improved farm management and business skills within an agricultural context to support the majority of BEE and emerging farmers Skills upgrading requirements for existing Extension Officers include bull Agricultural
economics bull Agricultural
management bull Business and
financial management
bull Technical and production related skills including o Animal husbandryo Poultry o Crop production o Horticulture
SKILLS SHORTAGES Generally SA has a shortage of entrepreneurs and people who have the business acumen drive motivation and
The profile of these farmers reflects a large contingent of older and less educated people who are generally less flexible tend to stick to
The commercial agri sector will increasingly have to compete in the global market and the ever increasing need to increase productivity to
DAFF us experiencing problems are especially sourcing people in specialised science related fields (learning fields experiencing few
AgriSETA June 2010
Agriculture Sector Analysis 36
GENERAL NEEDS SMALL‐SCALE FARMER
NEEDS COMMERCIAL SECTOR
NEEDS DAFF NEEDS
perseverance to become a successful farmer Given the high risks involved in the agricultural sector (natural elements outside onersquos control) the agri sector does not compete successfully for this ldquoscarce resourcerdquo Moreover as with other professional and skilled occupations there is a tendency for younger qualified people to move to urban areas
known practices and are less likely to experiment with new technology Within this target group candidates with good entrepreneurial ability are scarce There is a perceived shortage of Agricultural Extensionists and advisors to assist this target group However a large pool of young unemployed graduates exists who could assist such emerging farmers if they were mobilised and made accessible to farmers Similarly the potential pool of retired commercial farmers who could serve as mentors to this target group
remain profitable and viable it can be stated that many of the existing farmers and managers owners lack business management and entrepreneurial orientation Equity policy and the need to become BEE compliant requires that commercial enterprises appoint and develop black owners directors managers Changing local and global consumer preferences require farmers to change traditional farming methods and practices Skills and knowledge requirements include bull Global food and
international quality standards
bull Product traceability requirements
bull Organic produce and products
Specific occupations identified as being in short supply are
bull Production Managers (food processing)
bull Product specialisation to international specifications (research skills)
bull Forklift drivers heavy vehicletruck drivers and mobile plant operators
bull Experienced and competent artisans (millwrights electricians fitters
enrolments andor pass rates at HET institutions with the result that too few qualified persons come onto the labour market) Examples of such skills shortages identified by the Department include Agricultural Engineers bull Plant Health
Specialists (Nematology Entomology Plant Pathology)
bull Statisticians (specialised agricultural knowledge)
bull Plant Health Pest Risk Analysts
bull Agricultural Economists (production and resource economists)
bull Agricultural Food and Quarantine Technicians
bull Agro‐meteorologists Early warning Specialists
bull Pasture Scientists bull Plant Production
Specialists (eg ornamental crops hydroponics)
bull Specialised Food Analysts (pesticide residue analysts processed food and dairy analysts wine and spirit analysts)
AgriSETA June 2010
Agriculture Sector Analysis 37
GENERAL NEEDS SMALL‐SCALE FARMER
NEEDS COMMERCIAL SECTOR
NEEDS DAFF NEEDS
and turners bull Agricultural
Equipment Technicians
bull Pest and weed controllers
bull Horticultural specialists
LABOUR SHORTAGES AND RELATED SKILLS NEEDS Given an employment rate of some 26 (2009 currently estimated at over 30expanded definition) per definition there cannot be a labour shortage It is however difficult for people who have never worked before to integrate into the agricultural sector workforce Coupled with an aging workforce (30‐60 being over 40) means that most agri enterprises will within the next 5‐10 years be looking at replacing a large proportion of their workforce There could be an insufficient pool of people willing and able to participate The impact of HIVAIDS is also not always factored in to understanding the diminishing pool of resources available Labour shortages have been reported within selected geographical areas and in particular occupations Examples include cane cutters in the sugar industry chicken catchers in the poultry industry pickers in the fruit industry and animal handlers in feedlots as well as dairy parlour workers It is however believed that these shortages may reflect a recruitment problem as a result of the very harsh working conditions and the relatively poor remuneration (which makes these occupations unpopular) At present such ldquoshortagesrdquo are addressed through contracting labour from neighbouring countries
AgriSETA WSP analyses
Skills demand in the commercial agricultural sector
Information for demand for skills from WSP data is available for 1 673 employers who submitted their WSPs for the 200910 period The table below shows data on sub‐sector WSP submission relative to size of the sub‐sector as well as subsector data from all registered organisations and those who submitted WSPs Data for registered employers shows that there were 239 076 employees employed by the 17 234 registered organisations As previously stated 97 898 employees were employed by the organisations submitting WSPs This constitutes 41 of employees employed by registered organisations
Table 20 Employment and sub‐sector data drawn from WSP analyses
Sub‐sector
All Re
gistered
Employers
Small employers (0‐49)
Med
ium and
large
employers (50+)
Total W
SPs received
Total W
SPs received
as of
all registered em
ployers
WSP
received med
ium and
large orgs
WSPs received
as of
med
ium amp large em
ployers
WSPs received
small
employers
WSPs received
as of small
enterprises
EmployeesPer
Profile
CoffeeTea 40 33 7 9 23 5 71 4 12 483 Fibre 1 710 1 676 34 34 2 22 65 12 07 6 539
AgriSETA June 2010
Agriculture Sector Analysis 38
Sub‐sector
All Re
gistered
Employers
Small employers (0‐49)
Med
ium and
large
employers (50+)
Total W
SPs received
Total W
SPs received
as of
all registered em
ployers
WSP
received med
ium and
large orgs
WSPs received
as of
med
ium amp large em
ployers
WSPs received
small
employers
WSPs received
as of small
enterprises
EmployeesPer
Profile
Fruit 371 277 94 162 44 76 81 86 31 27 873 Grain 648 581 67 77 12 48 72 29 5 22 129 Milling 335 279 56 61 18 35 63 26 9 4 630 Pest Control 213 209 4 8 4 2 50 6 3 119 Poultry 391 305 86 66 17 46 53 20 7 19 187 Primary 12 121 10 776 1 345 1144 9 513 38 631 6 136 034 Red meat 1107 1 018 89 70 6 45 51 25 2 7 475 Seed 167 149 18 24 14 13 72 11 7 2 127 Sugar 71 45 26 13 18 10 38 3 7 10 478 Tobacco 60 46 14 5 8 3 21 2 4 2 002
Totals 17 234 15 394 1 840 1 673 10 818 44 855 16 239 076
Source 1 AgriSETA WSP 2009 data
Only 10 of all registered employers submitted WSPs for the 200910 period Of these 49 were medium and large sized employers and 51 small However only 16 small employers submitted their WSPs relative to the number of registered small employers and 44 medium and large employers submitted WSPs relative to the number of registered medium and large employers As such skills demand statistics provides more representative data on the requirements of medium and large employers Data for skills demand in the commercial agricultural sector is based on data for permanent employees as well as casual and seasonal employees
Skills demand forecasting by AgriSETA
Forecasting for skills demand the AgriSETA has estimated that the demand for skilled employees at different levels in the next few years is 510 686 This is based on WSP data analyses over the last 5 years and projected demand for the formal commercial agricultural sector and factoring in the demand that at maximum would result from completion of the land restitution programme in South Africa The table below reflects the skills that are on demand as well as the estimates for demand over the next five years by major occupational category35
35 AgriSETA 2010
AgriSETA June 2010
Table 21 Demand for skills by occupational category
Major Occupation (OFO)Estimated Demand
Group Title1 Managers (commercial and small emerging farmers) 264 3702 Professionals 4 1413 Technicians and Trade workers 8 9255 Clerical and administrative workers 8006 Sales workers 4007 Machinery operators and drivers 5 8008 Elementary workers 226 250
Total 510 686Source AgriSETA WSP data and SSP demand forecasts
Research needs going forward
As has been set out in the sector analysis and the scenarios derived from that analysis the sector is faced by both significant and profound change and also great uncertainty It therefore follows that the task of focussing limited resources (basically levy income in the formal sector and NSF funds for the emergent farming sector) is difficult Whilst the general thrust of training remains broadly as described in the 2006‐10 SSP Updates some considerable work is required to achieve targeted effective interventions during the 2011‐2016 period The following research questions will need to be addressed in preparing the next SSP
bull In relation to the managers and owner‐managers of commercial farms and enterprises what skills are needed to enable them to help bring about the more optimistic scenario and manage the risks associated with the less optimistic ones
bull In terms of professional and technical competencies do the current education and training institutions coupled with the learning programmes available through the AgriSETA (learnerships skills programmes and the like) meet the needs of the sector
bull In the emerging agricultural sector do the current programmes funded by sources external to the AgriSETA (eg NSF) meet all the identified needs What gaps are there and how should they be addressed
bull In relation to governmentrsquos growth strategy and industrial action plans what skills are required for developing the aquaculture sub‐sector What programmes are available How can the SETA support the skills needs for this sub‐sector
bull Given the increasing levels of casual and contract labour how can skills be developed to meet the needs of the formal commercial sector and the emerging enterprise sector
bull How can the demand in each of the priority areas be quantified and agreement be reached on numbers of people to be trained
Agriculture Sector Analysis 39
AgriSETA June 2010
SECTION 3 Skills Gaps and scarce skills
Scarce skills at the DAFF
The level of scarce skills at DAFF can be determined by the vacancy rate While the average vacancy rate in the department as at 31 March 2009 was 17 there were some posts that had very high vacancy rates as reflected in the table below Indicating the possibility that the Department is experiencing difficulties in finding suitable candidates in the South African labour market to fill these posts
Table 22 Scarce skill occupations and vacancy rates (DAFF March 2009) Critical occupations Number of posts Posts filled Vacancy rate ()
Agricultural animal oceanography forestry and other sciences
167 119 287
Engineering sciences related 2 1 50Engineers and related professions 13 6 538Farming forestry advisors and farm managers 11 4 636Finance and economics related 73 53 274Horticulturists foresters agricultural and forestry technicians
350 221 369
Legal related 6 4 333Mechanical engineering technicians 3 2 333Risk management and security services 6 4 333Social sciences related 1 0 100Veterinarians 34 24 294
Source DAFF Annual Report 20082009
Skills are also scarce at senior management level The department also reports on difficulties it has filling senior management services vacancies with some of them staying vacant for up to twelve months because no suitable candidates can be found The department would then resort to re‐advertisement and head hunting This was the case with 22 of 18 SMS posts in March 2009
Scarce skills in the commercial sector
The following occupations have previously been projected as scarce (extremely hard to fill vacancies) by AgriSETA in the commercial agricultural sector over the next five years
Table 23 Scarce and critical skills in the commercial agricultural sector
Occupation Code
Group Occupation Critical Skills Intervention Comments
139903 Managers Laboratory Manager
Technology AI nutrition
HET
221101 Professionals Accountant (General)
General HET
221102 Professionals Management Accountant
Farm financial management
HET Focus on support advice to farmers new enterprises
222101 Professionals Commodities Trader
Export administration supply chain
FET Learnership Skills
Agriculture Sector Analysis 40
AgriSETA June 2010
Agriculture Sector Analysis 41
Occupation Code
Group Occupation Critical Skills Intervention Comments
management Programme
224301 Professionals Economist Agricultural HET
Mainly for Department of Agriculture and para statals commodity organisations
233101 Professionals Chemical Engineer
Chemical processes in food production
HET Industries such as sugar processing
233301 Professionals Electrical Engineer
Installation and maintenance
HET Processing industry
233401 Professionals Electronics Engineer
Computerised production prosesses
HET Processing industry
233501 Professionals Industrial Engineer
Productivity and efficiency
HET Processing industry
233904 Professionals
Instrument Engineer (Defence Force)
Installation and maintenance
HET
Not for defence ‐ sugar industry
233502 Professionals Mechanical Engineer
FETHET Equity reasons
233902 Professionals Agricultural Engineer
Farm layout and infrastructure
HET Mainly in Government
311101 Technicians and trades workers
Agricultural Technician
Installation and maintenance
FETHET
234102 Professionals Agricultural Scientist
Agri research HETFET Especially in horticulture
234201 Professionals Chemist HET Processing industry
234202 Professionals Food Technologist
Food safety HACCP
FETHET Across sector
234701 Professionals Veterinarian HET Mainly in Government
311101 Technicians and trades workers
Agricultural Technician
Farm infrastructure
FET Mainly needed in government
311401 Technicians and trades workers
Chemistry Technician
FETHET EE reasons
312907 Technicians and trades workers
Chemical Engineering Technician
FET Learnership
Mainly EE reasons
312402 Technicians and trades workers
Electronic Engineering Technician
Weak stream production infra
FETHET Mainly tobacco industry
233904 Professionals
Instrument Engineer (Defence Force)
Instrument technician
FET
Occupation needed Instrument Technician (not defence force) Mainly sugar processing sector
321202 Technicians and trades workers
Diesel Motor Mechanic
FET Learnership
To include tractor mechanic
321204 Technicians and trades workers
Small Engine Mechanic
Agricultural equipment
FET Learnership
Throughout sector
AgriSETA June 2010
Agriculture Sector Analysis 42
Occupation Code
Group Occupation Critical Skills Intervention Comments
322301 Technicians and trades workers
Metal Fabricator
Artisan FET Learnership
322303 Technicians and trades workers
Welder Welder (First Class)
Artisan FET Learnership
323203 Technicians and trades workers
Fitter‐Welder Artisan FET Learnership
Mainly sugar ndash multi‐skilled
323202 Technicians and trades workers
Fitter And Turner
Artisan FET Learnership
Tobacco and sugar
323501 Technicians and trades workers
Millwright Artisan FET Learnership
Wide‐spread need
341101 Technicians and trades workers
Electrician (General)
Artisan FET Learnership
Wide‐spread need
342101 Technicians and trades workers
Air‐Conditioning And Refrigeration Mechanic
Artisan FET Learnership
Sugar pack houses cold chain
Source AgriSETA Sector Skills Plans
Supply of skills
South Africarsquos agriculture skills are produced in high schools agricultural colleges FET colleges and Higher Education institutions In high school a large cohort of learners take Agricultural Science as a subject In 2003 there were 42 Agricultural High Schools offering Agricultural Science as a subject These students and those in high schools taking the subject could progress to taking agriculture as a focus area for further education In 2004 there were 10 FET colleges offering vocationally directed agricultural programmes These FET colleges offered complete qualifications and short courses Eleven Colleges of Agriculture can offer qualifications up to degree level and 19 universities offer qualifications in Agriculture ranging from agricultural economics animal and plant sciences and horticulture among others at under and post graduate levels (Department of Agriculture 2006) While long term planning of skilling of new entrants in the sector can be done through close consultation between the sector agricultural schools and colleges FET colleges and HET institutions so that they teach relevant skills there are other avenues for training for those who are already employed in the sector for example skills programmes and learnerships There are 15 registered qualifications for the primary agriculture sub sectors Currently AgriSETA has 94 registered learnerships that can address the skills needs of the identified scarce skills These are captured in Appendix 2 AgriSETA has approved accredited a number of training providers across the country to deliver the theoretical and practical components of these learnerships These include agricultural colleges FET colleges and private providers Currently the AgriSETA has 246 registered and approved providers distributed nationally as follows
AgriSETA June 2010
Table 29 AgriSETA approved training providers (2010) Province Number of providers
Gauteng 72
(29)
KwaZulu Natal 20
(8)
Limpopo 35
(14)
North West 30
(12)
Northern Cape 3
(1)
Free State 15
(6)
Mpumalanga 14
(6)
Western Cape 26
(11)
Eastern Cape 31
(13) Total 246
The providers are small to large organisations In primary agriculture small providers appear to offer the most training in rural areas and community projects (AgriSETA 2010) Most of the operating providers will be in FET colleges and agricultural colleges The AgriSETA is unable to meet the total demands for skills across the duality of their sector There seems to be fairness in the approval of training for both permanent and casual and seasonal workers In 200809 the AgriSETA approved 559 learnerships as follows
Table 30 AgriSETA learnerships approved for grant purposes (2008‐2009)
Source AgriSETA learnership data analysis
Agriculture Sector Analysis 43
AgriSETA June 2010
Agriculture Sector Analysis 44
Provision of skills programmes in the same year attracted grants for 2 706 employees
Table 31 Participation by learners in skills programmes in the AgriSETA (200809)
Source AgriSETA Skills programmes data analysis
AgriSETA June 2010
APPENDIX 1 Skills demand in the Department of Agriculture Forestry amp Fisheries (200809)
Source DAFF Annual Report 2008‐20009
Agriculture Sector Analysis 45
AgriSETA June 2010
Agriculture Sector Analysis 46
Appendix 2 AgriSETA registered learnerships Registered Learnership NQF Level SAQA Registration NoLearnership in Agri Sales and Service 4 22 Q 220001 20 178 4Learnership Agricultural Machinery Technician 2 22 Q 220007 20 160 2Learnership in Specialist Agricultural Machinery Technician 5 22 Q 220009 21 258 5Agri Trade Processes 2 22 Q 220013 30 125 2FETC Meat Examination Applying Basic Business Principles 4 30 Q 3000 2823 164 4Further Education and Training Certificate Seed Marketing Execute Seed Trials 4 22 Q 220025 21 126 4Further Education and Training Certificate Seed Research and Development Certify as Seed Unit 4 22 Q 220027 21 121 4FETC Seed Research and Development Conduct a Field Inspection of a Seed Unit 4 22 Q 220028 20 120 4Seed Research and Development Operations Operate in a Team 3 22 Q 220020 22 121 3Seed Research and Development Operations Apply Basic Business Principles 3 22 Q 220021 22 121 3National Certificate Seed Processing and Packaging Operate in a Team 3 22 Q 220026 21 123 3Sugar Industry Technical Maintenance worker 2 22 Q 220011 39 128 2National Certificate Sugar Manufacturing and Refining Technical Maintenance 3 30 Q300003 23 146 3Further Education and Training Certificate Manufacturing Technical MaintenanceProduce Components by Performing Engineering Turning Operations
4 30 Q 3000 1321 173 4
FETC Manufacturing Technical Maintenance Produce Components by Performing Milling Operations 4 30 Q 3000 1521 173 4 FETC Manufacturing Technical Maintenance Develop and Fabricate from Complex Drawing 4 30 Q 3000 1420 173 4National Certificate in Sugar Technology 5 22 Q 220036 22 140 5Further Education and Training Certificate Sugar Processing 4 22 Q 220035 31 144 4National Certificate in Sugar Technology Processing Sugar Refining 2 22 Q 220037 28 124 2National Certificate in Sugar Technology Processing Juice Preparation 2 22 Q 220038 28 124 2National Certificate in Sugar Technology Processing Crystallisation 2 22 Q 220039 27 122 2National Certificate in Sugar Technology Processing Laboratory Practice 2 22 Q 220040 25 124 2National Certificate in Sugar Technology Processing Extraction 2 22 Q 220041 28 122 2NC Rooibos Production Applying Basic Business Principles 2 30 Q 3000 2427 130 2 NC Rooibos Processing Applying Basic Business Principles 2 30 Q 3000 2224 123 2 National Certificate Cigarette Production 3 22 Q 220046 23 121 3
AgriSETA June 2010
REFERENCES AgriSETA 2010 AgriSETA 20082009 Annual report Pretoria AgriSETA Agricultural Research Council httpwwwarcagriczahomeasppid=272 Avert South African HIV and AIDS statistics Available on httpwwwavertorgsafricastatshtm Centre for Development Enterprise 2008 Land reform in South Africa Getting back on track CDE Research No 16 DAFF 2010 Quarterly economic review of the agriculture sector Pretoria DAFF DAFF 2009 Annual report 20082009 Pretoria DAFF Department of Agriculture 2008 Strategic plan 2008 Pretoria Department of Agriculture DTI An introduction to the South African economy Available on httpwwwthedtigovzapublicationsagroprocessinghtm Eastern Cape Provincial Government Eastern Cape Provincial Growth and Development Strategy 2004 ndash 2014 Economic Commission for Africa 2009 Developing African agriculture through regional value chains Addis Ababa Economic Commission for Africa Economic Report Free State Province 2005 Provincial Growth and Development Strategy 2005 ndash 2014 GCIS 2010 SA Yearbook 200910rdquo Agriculture forestry and fisheries Pretoria GCIS Greenberg S 2010 Status report on land and agricultural policy in South Africa 2010 Institute for Poverty Land and Agrarian Studies School of Government University of the Western Cape Research report Ingelozi Management Solutions 2008 HIVAIDS in the South African agricultural sector Towards the development of a long term intervention Research report KwaZulu Natal Provincial Government 2006 KwaZulu Natal Provincial Growth and Development Strategy Limpopo Provincial Government Growth and Development Strategy 2004 ndash 2014 Mhone G (2000) Enclavity and Constrained Labour Absorbtive Capacity in Southern African Countries Geneva International Labour Office Moyo S The Agrarian question and the developmental state in South Africa In Edigheji O et al 2010 Constructing a democratic developmental state in South Africa HSRC PRESS
Agriculture Sector Analysis 47
AgriSETA
Agriculture Sector Analysis
National Treasury Republic of South Africa 2010 National Budget 2010 ndash National Budget Review 2010 Pretoria National Treasury Northern Cape Provincial Government Agriculture and agro‐processing sector strategy North West Provincial Government North West Provincial Growth and Development Strategy 2004 ndash 2014 Province of the Western Cape 2008 The Ikapa growth and development strategy White Paper SABCOHA SA Business Coalition on HIV and AIDS wwwsabcohaorg SACAU httpwwwsacauorghostingsacauSacauWebnsfHomehtmOpenForm South African Government 2010 20102011 ndash 20122013 Industrial Policy Action Plan Republic of South Africa Statistics South Africa 2005 Census of commercial agriculture 2002 Report No 110201 Pretoria Statistics South Africa Statistics South Africa 2009 Census of commercial agriculture 2007 Statistical release P1101 Pretoria Statistics South Africa Statistics South Africa 2010 General household survey 2009 Statistical release P0318 Pretoria Statistics South Africa Statistics South Africa 2010 Gross domestic product first quarter 2010 Statistical release P0441 Pretoria Statistics South Africa Statistics South Africa 2010 Quarterly labour force survey Quarter 1 2010 Statistical release P0211 Pretoria Statistics South Africa Vink N amp van Rooyen J 2009 The economic performance of agriculture in South Africa since 1994 The implications for food security Pretoria DBSA development planning division working paper series No 17 Webster E 2004 the Dual Economy from a book by Van Holdt K and Webster E Work restructuring and the Crisis of Social reproduction and 10 years of restructuring post apartheid workplaces University of Natal Press Workinfocom httpwwwworkinfocomfreesub_for_legresdatalraempassoc3htm Xingwana L 2008 Challenges and Opportunities for Land and Agrarian Reform towards 2025 Speech delivered at the Agri‐Consultation Protea Ranch Hotel Polokwane 30 July 2008
- Table of contents
- SECTION 1 THE AGRICULTURAL LANDSCAPE
- 11 Size and shape of the Agricultural sector
-
- Overview
- Distribution of agricultural production
- The structure of the agriculture sector in South Africa
- Categories of farming enterprises
- Employment trends
- Employment categories and remuneration
- Stakeholders in the Agricultural sector
-
- National government departments
- Sector representatives
-
- 12 Factors impacting development in the Agriculture sector
-
- Future sector economic growth and development
-
- South African sector growth plans (IPAP2)
- International Trade
- Global recession and rise in food prices
-
- Land reform
- Reliance on imports
- Water
- The labour market
- Consumer trends
- HIVAIDS
- Farm safety and security
- Broad-based Black Economic Empowerment
-
- Conclusions and scenarios
- SECTION 2 DEMAND FOR SKILLS
-
- AgriSETA registered employers and employee coverage
- Employee coverage in the AgriSETA
-
- 21 Skills demand
-
- The National Education and Training Strategy for Agriculture (AET Strategy)
- AGRISETA sector skills planning demand data (2008-2009)
- AgriSETA WSP analyses
-
- Skills demand in the commercial agricultural sector
-
- Skills demand forecasting by AgriSETA
- Research needs going forward
-
- SECTION 3 Skills Gaps and scarce skills
-
- Scarce skills at the DAFF
- Scarce skills in the commercial sector
- Supply of skills
-
- APPENDIX 1 Skills demand in the Department of Agriculture Forestry amp Fisheries (200809)
- Appendix 2 AgriSETA registered learnerships
-
AgriSETA June 2010
Agriculture Sector Analysis 15
NAFU is a union for predominantly previously historically disadvantaged smallholder farmers with a membership base including farmers agribusinesses farmersrsquo organisations corporations and individuals who support their goals NAFU is represented by different unions in all the provinces There are other employer organisations who are not affiliated to AgriSA and NAFU including
bull Agricultural Industrial and Medium Employers Organisation bull Agricultural Mining and Industrial Chemical Manufacturersrsquo Association bull Agrilabor Employersrsquo Organisation bull Algoa Meat Traders Association bull East Coast Poultry Producers Employersrsquo Association bull East London and District Meat Traders Association bull Fertiliser Industry Employersrsquo Organisation bull Landbou Werkgewersorganisasie (Workinfocom) bull Red Meat Producersrsquo Association
The Agricultural Research Council is an autonomous statutory body that provides research to DAFF and the provincial departments of agriculture Figures available for South Africarsquos investment in agriculture research and development show that South Africa was above international norms of investment in RampD which are 053 of agricultural GDP for developing countries and 236 for developed countries In South Africa in 2000 agricultural RampD investment in relation to agricultural GDP was 30416 There are six major sources of credit for farmers banks (50) agricultural cooperatives and agribusiness (12) the Land Bank (21) private creditors (8) other creditors and financial institutions (9) and government (1) (GCIS 2010)
12 Factors impacting development in the Agriculture sector Several international and local factors impact on the productivity of the agricultural sector and its growth Key amongst these are
Growth of the South African economy and rising consumer demand International trade and trade agreements The global recession and rise in food prices The land reform programme Reliance on imports Water availability Changing consumer patterns and demands (eg organic food stuffs) Technological changes and mechanisms Quality standards Farm safety and security Broad‐based black economic empowerment Legislation Skills demand and supply HIVAIDS
16 Vink amp van Rooyen 2009
AgriSETA June 2010
These key factors are clustered and discussed below
Future sector economic growth and development
South African sector growth plans (IPAP2)
The 20102011 ndash 20122013 Industrial Policy Action Plan (IPAP) identifies five structural challenges that existed in the South African economy before the global economic downturn and which have been exacerbated by the recent economic crisis These challenges were evident even during the time South Africa was experiencing relatively high growth rates between 2005 and 2007 and have continued during the recession These challenges are
1 Structural imbalances in the growth path including growth that is lagging behind other medium and low income countries
2 Uneven performance of the manufacturing sector with some divisions like the automotive sector experiencing exponential growth while other sectors have stagnated
3 Employment growth being sustained by credit extension and consumption rather than by productive sectors leading to a large current account deficit
4 Low profitability of manufacturing 5 Low savings and investment from financial sector growth Only 52 of private credit was
extended to fixed investment in 2008 Key sectors have been identified for IPAPrsquos focus including agro‐processing which has a diverse group of industries and sub‐sectors including food processing beverages aquaculture horticulture medicinal aromatic and flavourants Key action plans for the agro‐processing sector are identified in IPAP2 as
Development of a National Food Control Agency to consolidate the sector Development of aquaculture to supplement dwindling wild fish stocks Designating specific areas for utilisation of aquaculture Development of the organic food sector Development of the small milling industry Enhancing competitiveness in fruit and vegetable canning Improving beneficiation of Rooibos and Honeybush products (IPAP2 2010)
International Trade
South Africa is a major exporter of Agricultural produce In particular South African fruit and fruit‐derived products such as wine and fruit juice are competitive in the global market However in many sub‐sectors where export potential exists ndash grain and meat ndash serious problems face the industry A key challenge is the uneven playing field experienced by South African exporters Major global competitors include the United States and the countries of the European Union where government subsidies in various forms are in place No such subsidies are in place in South Africa making it difficult if not impossible for South African agricultural produces to enter developed country markets due to the prices that they have to ask for products I In addition the value of the Rand has fluctuated from levels of around R10 to the US dollar to as little as R7 to the dollar When the Rand is strong export becomes difficult because it costs more in the case of the move from R10 to R7 a 30 cost increase for the importer It is impossible to
Agriculture Sector Analysis 16
AgriSETA June 2010
Agriculture Sector Analysis 17
predict whether the World Trade Organisation negotiations known as the DOHA Round will achieve progress in the coming years Historical evidence is that during periods of global recession developed economies become more protective not less and so the current outlook is not good Nor is it possible to predict the value of the Rand though current thinking in government is to move toward a weaker Rand to encourage exports These are two key variables that will need to be factored into the different sector growth scenarios for the future
Global recession and rise in food prices
Economic growth slowed down significantly in sub Saharan Africa and in South Africa in 2009 but there appear to be signs of recovery GDP growth in the region declined from about 6 in 2004 ndash 2008 to about 18 in 200910 GDP growth in South Africa was 16 in 2009 17and rose to 46 in the first quarter of 201018 though much of this is related to the income derived from the 2010 FIFA World Cup and may not be sustained Projections are generally for a slow revival with a set back after the slight rise resulting from the World Cup A return to the 6 levels of the 20078 could take some years The global recession reduced the demand for African exports and reduced capital flows to the region but it is anticipated that the demand for mineral resources by Asian and Western powers will result in both the expansion of exports and expanded foreign direct investment The competition between India and China for African markets is also expected to boost trade to the benefit of African suppliers South Africa is expected to particularly benefit from direct foreign investment from China and India China has already become South Africarsquos largest market for exports and supplier of imports19 Rising food prices have forced governments around the world to control prices of maize bread rice and dairy products In South Africa ldquofood price inflation between December 2005 and December 2006 averaged 788 rdquo20 Although efforts are being made to reduce barriers to poorer families in relation to basic food there has been no move to subsidise food generally This may change though the space for significant levels of support is restricted because of reduced revenue from income taxes resulting from the recession The global credit crunch and recession have meant a reduction in public expenditure and funding which has affected the agricultural sector21
Land reform
In South Africa specifically land reform has a significant bearing on food security and agriculturersquos contribution to GDP The objective of the land reform programme is to transfer 30 of agricultural land to black ownership by 2014 (deferred to 2025) to ensure more equitable access to land by historically disadvantaged people and to increase their participation in agricultural activities22 Land reform has been informed by four processes23
17 Department of Agriculture Forestry and Fisheries 2010 18 Stats SA 2010 19 Department of Agriculture Forestry and Fisheries 2010 20 Department of Agriculture Forestry and Fisheries 2010 ‐2011 Strategic Plan 21 Economic Commission for Africa 2009 22 Xingwana 2008 23 CDE 2008
AgriSETA June 2010
Agriculture Sector Analysis 18
Land restitution involving returning land or providing financial compensation to those whose land was dispossessed during apartheid
Land redistribution transferring more land to the historically disadvantaged Tenure reform modernising land tenure rules and access to land ownership and Providing financial support for the development of emerging farmers
In relation to progress with land reform by September 2009 only 69 of agricultural land (about 567 million hectares) had been transferred and a majority of the beneficiaries have not yet occupied the land due to lack of infrastructure input or technical support The following table gives an indication of the progress of land reform since the inception of the first democratic government
Table 14 Land transfers and beneficiaries ‐ 1994 to 2009
Province Redistribution and tenure Restitution Total Hectares Beneficiaries Claims Hectares Beneficiaries Hectares Beneficiaries
Eastern Cape 675 353 357 25 633 16 201 94 834 215 201 448 191 240 834
Free State 799 350 291 7 721 2 662 47 615 40 893 397 906 48 614
Gauteng 286 34 513 7 328 13 159 9 476 70 179 43 989 77 507
KwaZulu Natal 690 547 414 67 761 14 752 642 447 433 168 1 189 861 500 929
Limpopo 291 91 235 7 403 3 382 513 024 220 227 604 259 227 630
Mpumalanga 444 322 839 13 950 2 694 399 876 225 877 722 715 239 827
Northern Cape 271 952 744 2 773 3 682 539 620 100 554 1 492 364 103 327
North West 300 268 566 40 539 3 709 373 642 172 963 642 208 213 502
Western Cape 223 122 304 12 750 15 546 3 769 118 165 126 073 130 915
Total 3 979 3 043 264 185 858 75 787 2 624 303 1 597 227 5 667 567 1 783 085
Source Greenberg 2010
Achievement of the 30 land reform target is being made difficult by land prices Under the willing buyer willing seller scheme the government will need R74 billion to be able to purchase enough land While resources may be available there are suggestions of lack of capacity The Department of Rural Development and Land Reform (DRDLR) was able to spend only 31 of its land reform 200910 budget in the first six months of the financial year Going forward this Department needs to identify what the real challenges are with the pace of land reform delivery so that they can be mitigated to meet the 2025 target A priority is the retention of skills skills transfer and skills development during the transfer of land as well as retention of national food production to avoid loss of production Support for new beneficiaries of land to ensure sustained productivity is derived from two main sources of funding ndash the Broadening Access to Agriculture Thrust (BADAT) and the Comprehensive Agricultural Support Programme (CASP) CASP is a conditional grant from the Department of Agriculture Forestry and Fisheries to provincial departments to support emerging farmer development Provincial farming budgets dedicated for farmer support in Mpumalanga the Free State Northern Cape and the Western Cape have risen significantly and those in KwaZulu Natal and Gauteng have witnessed a slight increase Eastern Cape and Limpopo agricultural budgets have been steady The North West is the only province where there has been a sharp decline in the share of the budget dedicated to farmer support24
24 Greenberg 2010
AgriSETA June 2010
Agriculture Sector Analysis 19
Reliance on imports
Overall the Agriculture sector contributes positively to the balance of payments ldquoSouth Africa remains food secure The value of our exports increased by 464 from R33 656 million in 200708 to R49 278 million in 200809 During the same period the estimated value of imports rose by 12 from R34 009 million to R38 401 million resulting in a positive trade balancerdquo25
South Africa depends largely on world markets for seed production and agrochemicals Regarding seed production there are only three community seed production schemes in Limpopo and Mpumalanga being piloted with state funding Ten top large companies including two South African companies and multinationals have rights to over two thirds of registered seed varieties in South Africa Despite the dominance of genetically modified and hybrid seed in some sub‐sectors like maize sunflower and sorghum open‐pollinated varieties have been resilient in South Africa enabling the possibility of alternative seed sources not dependent on technological processes26 In relation to agrochemicals deregulation and liberalisation in the fertiliser sector led to the shutdown of local production capacity and South Africa became an importer of fertiliser for the first time in 2000 There are three large players in the fertiliser sector Sasol Nitro Yara and Omnia South Africa imports an estimated 70 of fertilisers and pesticides Fertiliser prices rose by over 200 between 2006 and 2008 but dropped somewhat after that However this hike signified the volatility of the agrochemicals industry and South Africarsquos dependency on imports and the potential risk for emerging farmers and food production of this dependence on imports as the country cannot control the prices making inputs both difficult to budget for and in many cases unaffordable The price of agrochemicals is also particularly influenced by the prices of oil and the exchange rate The general understanding in relation to job creation is that a weaker Rand will improve exports and therefore enable job creation Of course the down side of this strategy is that imports become more expensive So what may be an advantage for those sub‐sectors who are expanding their export volumes those relying on imported agro chemicals will be under increased pressure
Water
Water is both an essential and scarce resource for the agriculture sector and is being threatened by climate changes Crop production relies heavily on water and yet access to water is not being addressed in a systematic way in the land reform processes Greenberg suggests that the relationship between land reform agricultural support and water resource provision is inadequate and a way to address this could be established by linking water provision to land transfer or investing in irrigation for both commercial and resource‐poor farmers However investing in irrigation in the context of water scarcity and climate change may not be the best option What could be needed is finding ways to maximise efficiency of the 60 of South African
25 Department of Agriculture Forestry and Fisheries Strategic Plan 201011 26 Greenberg 2010
AgriSETA June 2010
Agriculture Sector Analysis 20
water used for irrigation by for example using methods such as drip or micro‐irrigation which are expensive to set up but which reduce water wastage by 5‐1027 The Department of Water Affairs is responsible for managing water supply and has to give authorisation for agricultural projects and other developments The department needs to be seen as an important stakeholder in the agricultural sector
The labour market
South Africa recorded an unemployment rate of 243 in 2009 (narrow definition) If people who are no longer actively seeking work are considered the broad unemployment rate rose from 267 to 313 illustrated in the figure below As a direct consequence of the global economic downturn in 2008 870 000 formal jobs were lost in 200928 Others have quoted a figure of over 1 million
Figure 3 Official unemployment in South Africa 2003 ‐2009
Source National Treasury 2010
Annual employment loss followed sector growth patterns with agriculture mining manufacturing and trade facing the highest job losses as their sector growth contracted Unemployment is especially a major problem among lower skilled workers and younger people Youth employment in the 15 ‐24 year age group has fallen by 219 000 (136) and 483 of people in this age group are unemployed Employment of semi‐skilled and unskilled workers has contracted by 527 000 and male employment has gone down by 550 000 (71) while that of women has decreased by 320 000 (52) The number of discouraged workers ie those no longer actively seeking work has increased from 518 000 to 17 million29 Clearly the existence of a very large pool of largely unskilled unemployed workers has an impact on the farming sector It drives wages down and creates opportunities for casualisation and the expansion of labour contract agencies and brokers In addition there are significant numbers of foreign nationals mainly from Zimbabwe and Mozambique who are seeking work and often finding it on farms and in primary processing and packaging plants There are benefits to the
27 Greenberg 2010 28 National Treasury 2010 29 National Treasury 2010
AgriSETA June 2010
Agriculture Sector Analysis 21
sector with skilled and semi‐skilled workers coming into the labour market and being absorbed into the workforce and helping raise productivity levels However at the lower skilled end of the market the existence of this pool brings further casualisation and downward pressure on wages Tensions are likely to increase and further protests either in the form of xenophobic outbreaks or actions against farmers may well increase A view often expressed by farm employers is that current labour legislation makes dismissing workers difficult and so the availability of labour without entering into contracts of employment is an attractive way of avoiding the legislation and its obligations Organised Labour is seeking to restrict these opportunities through either regulating or eliminating labour brokers and efforts are being made to regulate the use of foreign labour However for the foreseeable future the trend is for formally employed people to be reduced in number In relation to the emergent sector there will also be a reluctance to enter employment contracts with workers The fact that many households are engaged in some form of largely unpaid agricultural work means that there is significant casual work dating back many years Helping change this situation into one where casual or unpaid jobs are transformed into formal jobs with regular wages will take time It is also likely that as some emergent farms become established they will act similarly to established farms and institute a form of casual labour rather than expanding a workforce for which they would have to take a level of responsibility From an AgriSETA perspective these labour market trends mean that whilst levy income can be directed at a relatively small labour pool one that is manageable in terms of planning and implementation the size of the informal casual and unemployed labour force in the sector ‐ for whom no levy is paid and who have no employer to plan for their skills needs ndash is very large and its needs almost unlimited Clearly the relationship with the National Skills Fund (NSF) becomes critical in respect of the entire non‐levy income sector Again the level of support available from non‐levy income sources will be an important variable in looking at future sector skills development scenarios
Consumer trends
South Africa currently produces enough food to meet the needs of its population However consumption of three main staples maize wheat and vegetables has been volatile since 1985 and remains below 1990 levels Consumption of maize and vegetables by South Africans is 17 and 32 less respectively than in 198530 The main reasons for this lie in the growing levels of poverty and the difficulties that families have in purchasing nutritious food Whilst government has increased the levels of social grants and increased the number of people receiving grants to around 13 million the incomes of poor families have been badly hit by a range of factors including job losses and rises in food prices The approximately 1 million people who lost their jobs in 20089 meant a loss of income for many millions of dependents Rises in food prices have also had a disproportionate impact on the poor Whilst food is available it is often not accessible to families on the income levels that they have to manage within The result is that less and less nutritious food is purchased which in turn impacts on the ability of farmers to sell their products locally 30 Greenberg 2010
AgriSETA June 2010
Agriculture Sector Analysis 22
Whilst there is no evidence that government will reduce its efforts in relation to poverty relief and social benefits including such programmes as school feeding schemes and food parcels during periods of drought the state of public finances may not enable to support the poverty that grips many rural areas If real income levels for the poor were to rise it could have a significant impact on the economy of the agricultural sector Equally an improvement in the rural economy with increased agricultural production and jobs would dramatically impact on the capacity of people to buy nutritious food Achieving a positive growth path in rural areas is a huge challenge for government and one that is key to governmentrsquos Medium Term Strategic Framework and Industrial Policy Action Plans
HIVAIDS
South Africa has a high prevalence of HIV and AIDS The HIV prevalence among people aged two and above was estimated at 109 in 2008
Table 15 Estimated HIV percentage prevalence by age group (2002 ndash 2008)
Age 2002 2005 2008 Change
Children (2‐14 years) 56 33 25 ‐31
Youth (15‐24 years) 93 103 87 ‐06
Adults (25 and older) 155 156 168 13
15‐49 year olds 156 1692 169 13
Total (ages 2 to 49) 114 108 109 ‐05 Source Avert 2009
The table above shows that HIV prevalence is highest amongst those aged 25 years and older Given youth labour market analyses which point to people from previously disadvantaged backgrounds mainly African males accessing formal employment for the first time at age 25 ‐27 this population can be held to represent people in employment Research31 has estimated that by 2020 the pandemic will have claimed at least 20 of employees in the agricultural sector Southern Africa
in
HIV and AIDS have significant ramifications in the agricultural sector for both commercial farming and subsistence farming The implications include
bull Decrease in cultivated land bull Focus on less labour intensive crop and animal production bull Decrease in womenrsquos agricultural productivity as they take on a more care giving role bull Loss of skills bull Increase in absenteeism from work bull Decrease in daily work outputproductivity because workers are weaker from infections
There are suggestions that the impact of the pandemic in South Africa demands sectoral intervention although this may be difficult in the agricultural commercial sector as
bull Seasonal workers who seem to be more vulnerable to infection because of their low socio‐economic status are not in one place long enough for care programs Further
31 Ingelozi Management Solutions 2008
AgriSETA June 2010
Agriculture Sector Analysis 23
farmers and employers may not feel responsible for seasonal workers in the same way they would invest in their permanent employees
bull There may be uncertainty around land reform which may put HIV intervention on farms on the back burner
bull There are no policies that enforce HIV education and care on farms in the same way that legislation like BEE does for ownership As a result HIV intervention may be left to goodwill and employers may feel it is more important to comply with issues that are monitored
Farm safety and security
South Africa has been plagued by unacceptably high levels of violent crime and murder for many years now Farms have experienced this and those living on farms feel and are extremely vulnerable The South African Chamber of Commerce and Industry (SACCI) has argued that
Using the nominal GDP figure for 2009 of R24 trillion a 322 percent contribution of agriculture to GDP and an estimate of 39982 farms (as at 2007) in South Africa the cost of a murderattack on a farm to the economy was R1932869 per annum
SACCI acknowledges that this estimate is flawed as it does not take into consideration the fact that farming units contribute differently to GDP and that not every attack or murder contributes to farm shut down or loss of productivity However if not addressed these attacks could lead to loss of farming sectors as farmers migrate to lsquosaferrsquo regions This will affect employment and GDP contribution of the sector The need for safety and security on farms may also shift farmersrsquo focus in skills development to include personnel who have skills in safety and security
Broad‐based Black Economic Empowerment
The aim of the AgriBEE Charter (gazetted in 2008) is to increase the involvement of black business in agriculture through ownership and control as executives and senior managers of new and existing agricultural businesses The extent to which AgriBEE is transforming the sector is not known as it is too early to tell but a recent survey conducted by ABC and the IDC showed that among the ABC respondents in 2007 46 of enterprises were busy constructing a BEE strategy and 46 claimed to be implementing a BEE strategy A survey of the dairy industry in the Western and Eastern Cape in 2008 showed that only 6 of firms had a BEE strategy in place It also seems from survey data that companies are focusing on the skills development and socio‐economic aspects of BEE rather than on ownership32 It would appear that although there have been some significant BEE purchases of viable farms and some employee empowerment projects including some quite high profile ones in the Cape Winelands the extent of ownership change had been limited One of the factors is the very high level of single person or family ownership in the agricultural sector BEE is more straight forward in the corporate world where shares can be exchanged For a family business it is a matter of selling off part or all of the land and the tendency is to sell off those areas of the farm that are expendable from a business sustainability perspective
32 Greenberg 2010
AgriSETA June 2010
Whilst there is discussion in government about the ending of the ldquowilling buyer willing sellerrdquo concept the Constitution itself provides for property rights and so although some pressure may be exerted through legislation and regulation the extent and speed of change may not be fast The mechanisms for encouraging the transfer of significant levels of ownership have not yet been created The focus of the SETA is therefore likely to be more the beneficiaries of land reform and emergent farmers though projects of a BEE nature can be targeted as they arise
Conclusions and scenarios It is useful when looking at possible scenarios to examine the key variables or uncertainties and to project how variations one way or the other will have an impact on the development and growth of the sector From the sector analysis and factors that are contributing to change in the sector there are some key factors that seem to emerge First appears to be the economy and related issues of the labour market and the challenges of labour absorption in an enclave economy These factors determine on the one hand whether there will be growth and development and on the other whether such improvements will result in improved employment opportunities and the creation of a virtuous cycle of development Second is the role of the state and the various government departments whose plans and work impact on the agricultural sector Related to this is land reform that is inevitably driven by the state and not the owners of land or the landless The view expressed by many engaged in agrarian reform is that the state must play a significant role It becomes clear that a successful agricultural enterprise requires a number of factors to be in place to be successful These include access to land (Department of Rural Development and Land Reform) agricultural support within a supportive agricultural framework (Department of Agriculture Forestry and Fisheries) access to consistent water supply (Department of Water Affairs) access to finance (Department of Trade and Industry various state agencies) conducive labour market regulation (Department of Labour) sound industrial policy (Department of Trade and Industry) economic planning and macro policy (Department of Economic Development National Treasury) and appropriate education training and skills development (Department of Higher Education and Training the Human Resources Development Council NSA and the SETA) There are other government departments as well as provincial and municipal structures that also play a role The following analyses show how the four variables
economic growth and development role of the government labour market changes and land reform)
impact positively or negatively on the growth of the sector and the demand for skills
Agriculture Sector Analysis 24
AgriSETA June 2010
Agriculture Sector Analysis 25
HHIIGGHH GGRROOWWTTHH SSCCEENNAARRIIOO
The economics of the sector Role of government
The economy in SA and globally continues to revive albeit slowly for the next few years
Roles and integration of national government departments are clarified Specific functions are agreed processes put in place and personnel appointed with the required skills
International trade agreements are still weighted infavour of US and EU but progress is being made and specific blockages are addressed in bilateral talks
The roles of Departments (DWA DAFF DRDLR DoL DTI DED DHET) are clarified with appropriate joint plans and coordinating structures
The rural economy gradually improves with the buying power of the poor increasing and more stable markets created for local produce
For each of the functions agreed in each of the related departments appropriate structures and systems are put in place and staff trained
Exports increase in key areas identified in IPAP 2 and the Rand exchange rate stabilises at a level not too much different than it is today
Specific capacity is put in place at local level to support implementation of land reform and rural development
There is a growing understanding of the concept of dualism and the need to intervene with labour absorption and development mechanisms
Land claims are all finally settled and ownership and tenure is resolved There is a serious drive to establish effective agricultural enterprises
An understanding is reached on the role of agencies and labour brokers and abuse is curbed
The willing buyer willing seller approach is resolved and enables viable land to become black owned
Some relaxation of labour market regulations are agreed that maintain some minimum standard of employment but assist absorption
Land transfer to black and emergent farmers is done in a manner that integrates then into the supply chains of the sector
Mechanisms are found to address skills needs in the context of casual and seasonal work patterns
Financing of land reform and transfer is done on the basis of agreed development plans including skills
Labour market reform Trajectory of land reform LLOOWW GGRROOWWTTHH SSCCEENNAARRIIOO
The economics of the sector Role of government departments The economy in SA and globally stagnates at current levels and the economy struggles to pick up after the temporary 2010 World Cup boost
A lack of purpose at government level means limited progress for another five years Land reform remains a commitment without a plan
International trade agreements are still weighted infavour of US and EU and protectionism increases as a result of the global recession
The roles of Departments (DWA DAFF DRDLR DoL DTI DED DHET) are unclear and there is no proper co‐ordination
SArsquos Gini coefficient continues to worsen with rural poverty increasing and local economies declining
There is a lack of effective structures systems and processes to implement policy across departments
Rand volatility causes problems for importers and exporters Well established markets are maintained but exports decrease
At local level the decline in the agricultural extension officer functions continues and limited practical support is available
Understanding of the rural economy is so diverse that stakeholders cannot agree the problem let alone the solution to low absorption levels
Land claims take too long and land reform processes leave potentially productive land poorly developed and managed
Casual labour and labour brokers remains an issue of dispute Confrontation results in bitterness and resentment
The impasse caused by a rigid interpretations of property clauses in the Constitution continues to stall achievement of the 30 black ownership target
Labour market regulation continues to be a contributing factor to reducing levels of employment
Black owned farms find it difficult to become part of supply chains and are unable to perform adequately
Unstable employment patterns in the sector make skills interventions difficult to manage and largely ineffective
Financing of land reform and land transfer continues to be wasted as it is not tied to the building of appropriate capacity
Labour market reform Trajectory of land reform
AgriSETA June 2010
These analyses can be translated into four potential growth and development scenarios for the agricultural sector which are based on the requirements for a strong development state Scenario 3 Weak government support
and sound economy
Econ
omic fa
ctors glob
ally n
ationa
lly and
locally
Scenario 1 Integrated government support and sound economy
The economic upturn triggered by the World Cup continues and globally things improve enabling an expansion of exports The government because of a lack of integrated policy planning and implementation provides limited support for sector development The gains go to the well established enterprise owners with few gains for emerging farmers and local communities
Government departments coordinate their efforts to achieve maximum impact There are favourable economic conditions that create opportunities for advance Within this positive environment the role of the AgriSETA becomes a central component of a comprehensive strategy for growth and skills interventions are targeted to achieve maximum effect Results in growth in sustainable enterprises and expanded employment opportunities
Government policy and support Government policy and support
Combination of disjointed government policy planning and a weak and increasingly marginalised rural economy Economic conditions result in unsustainable farming conditions and employment declines along with productivity Food shortages and the lack of development in rural areas leading to increasing social tensions A vicious cycle develops with the sector going into long term decline
Government departments coordinate their efforts to achieve maximum impact However economic conditions hamper progress Efforts by the AgriSETA are undermined by poor labour absorption and job insecurity Some significant successes are recorded including some NSF funded projects that result in sustainable enterprises A platform is laid for future improvements when the economic conditions improve
Scenario 4 Weak state and economy Scenario 2 Strong state but weak
economy
Agriculture Sector Analysis 26
AgriSETA June 2010
Agriculture Sector Analysis 27
SECTION 2 DEMAND FOR SKILLS
AgriSETA registered employers and employee coverage
In 2009 17 234 employers were registered with the AgriSETA comprising 15 394 small employers (less than 50 employees) 1 202 medium sized employers (50 ‐ 149 employees) and 638 large employers (more than 150 employees)
Considering that there are around 40000 commercial farms33 the 17 234 employers represent around 43 of commercial farms Notwithstanding changes in the sector as a result of land reform and sector shrinkage this is a sizable proportion and is held to be sufficiently representative for the purpose of skills development planning However this paints an incomplete picture It understates the representative nature of large enterprise registered with the SETA and overstates the representative nature of small registered enterprises 4 175 (242) of the enterprises are levy paying members Further only 1 673 (11) workplace skills plans (WSPs) were submitted
Table 16 Registered employers by size and sub‐sector Sub‐sector Description
Employers Small Medium Large
CoffeeTea Processing and marketing of coffee and tea including coconuts cocoa nuts olives dates etc
33 4 3
Fibre Grading ginning packing of wool and cotton raw material 1 676 16 18
Fruit Fruit packed in cartons fruit juice concentrate drummed and fruit juice in container ready for consumption
271 36 57
Fruit exporters and importers 6 0 1
Grain
Manufacture of grain mill products and starches 119 5 7Handling and storage of grain 67 7 23Wholesale amp retail trade in Agricultural machinery 213 9 4Sale and distribution of Agricultural raw materials and other farming inputs
182 9 3
Milling
Manufacture of flour and grain mill products including rice and vegetable milling grain mill residues
120 15 11
Manufacture of prepared animal feeds 110 19 0Manufacture of pet foods 42 9 0Manufacture of starches and starch products 7 1 1
Pest control
Pest Control 209 4 0
Poultry Poultry and egg production including the slaughtering dressing and packing of poultry
305 49 37
Primary
Growing of Cereals and other crops (not elsewhere classified) 902 160 34Growing of Vegetables Horticultural specialties nursery products
943 120 72
Growing of Vegetables Horticultural specialties (Including Ornamental Horticulture) and nursery products
11 5 0
Sugar plantation including sugar cane and sugar beet etc 9 4 2
33 SARS statistics 2007
AgriSETA June 2010
Agriculture Sector Analysis 28
Sub‐ Description Employers Growing of fruit nuts beverage and spice crops 1795 255 143Farming of cattle sheep goats horses asses mules and hinnies Dairy farming
2 252 59 18
Other animal farming production of animal products (NEC) 433 25 12Ostrich farming 5 0 0Game farming 16 0 0Growing of crops combined with farming of animals (Mixed farming)
2 920 256 109
Growing of coffee and tea including coconuts cocoa nuts olives dates etc
2 0 0
Agricultural and animal husbandry services except veterinary activities
438 22 9
Other animal farming (not elsewhere classified) 11 1 1Growing of trees as second crop by farmers 126 18 4Fishing operation of fish hatcheries and fish farm 913 10 6
Red meat
Production and animal products (not elsewhere classified) 6 0 0Slaughtering dressing and packing of livestock including poultry and small game for meat
317 40 17
Production sale amp marketing of Agricultural by products (eg bones hides)
61 2 0
Slaughtering dressing and packing of livestock including small game for meat and processing of ostrich products
2 1 0
Wholesale trade in Agricultural raw materials and livestock 193 7 10Transport of livestock as supporting activity 224 0 0Agricultural and livestock research 215 9 3
Seed Seed production and marketing 149 12 6
Sugar Manufacture of sugar including golden syrup and castor sugar
45 5 21
Tobacco Processing and dispatching of tobacco 46 8 6 TOTALS 15 394 1 202 638Source AgriSETA WSP data
The largest number of registered small and medium enterprises are found in the mixed farming sub‐sector while most large enterprises are in the growing of fruit nuts beverage and spice crops sub‐sector
Employee coverage in the AgriSETA
Collectively the 17 234 employers registered with AgriSETA employed a total of 239 076 employees This represents 39 of the agricultural labour force in 2009 The 1 673 employers who submitted WSPs in 2009 employed 97 898 employees representing 41 of the total number of people employed by registered employers While the number of registered employers submitting WSPs is small (11) they employ a sizeable number of employees and the percentage of employees provides a statistically significant sample The data for larger enterprises is statistically much more representative than that for small enterprises
AgriSETA June 2010
Table 17 Number of employees of registered employers by sub‐sector
Sub‐sector
Sub‐sector description Employees
CoffeeTea Processing and marketing of coffee and tea including coconuts cocoa nuts olives dates etc
483
Fibre Grading ginning and packing of wool and cotton raw material 6 539
Fruit Fruit packed in cartons fruit juice concentrate drummed and fruit juice in container ready for consumption
27 661
Fruit exporters and importers 212
Grain
Manufacture of grain mill products and starches 133Handling and storage of grain 18 303Wholesale amp retail trade in Agricultural machinery 795Sale and distribution of Agricultural raw materials and other farming inputs 2 898
Milling
Manufacture of flour and grain mill products including rice and vegetable milling grain mill residues
3 634
Manufacture of prepared animal feeds 731Manufacture of pet foods 160Manufacture of starches and starch products 105
Pest control
Pest Control 119
Poultry Poultry and egg production including the slaughtering dressing and packing of poultry
19 187
Primary
Growing of Cereals and other crops (not elsewhere classified) 10 104Growing of Vegetables Horticultural specialties and nursery products 37 799Growing of Vegetables Horticultural specialties (Including Ornamental Horticulture) and nursery products
195
Sugar plantation including sugar cane and sugar beet etc 220Growing of fruit nuts beverage and spice crops 47 043Farming of cattle sheep goats horses asses mules hinnies Dairy farming
3 382
Other animal farming production of animal products (NEC) 4 203Ostrich farming 0Game farming 0Growing of crops combined with farming of animals (Mixed farming) 28 722Growing of coffee amp tea including coconuts cocoa nuts olives dates etc 0Agricultural and animal husbandry services except veterinary activities 970Other animal farming (not elsewhere classified) 513Growing of trees as second crop by farmers 1 294Fishing operation of fish hatcheries and fish farm 1 589
Red meat
Production and animal products (not elsewhere classified) 0Slaughtering dressing and packing of livestock including poultry and small game for meat
5 128
Production sale amp marketing of Agricultural by products (eg bones hides) 116Slaughtering dressing and packing of livestock including small game for meat and processing of ostrich products
0
Wholesale trade in Agricultural raw materials and livestock 1 697Transport of livestock as supporting activity 0Agricultural and livestock research 534
Seed Seed production and marketing 2 127Sugar Manufacture of sugar including golden syrup and castor sugar 10 478Tobacco Processing and dispatching of tobacco 2 002 Total 239 076
Agriculture Sector Analysis 29
AgriSETA June 2010
Agriculture Sector Analysis 30
Source AgriSETA WSP data
According to the WSP analysis the sub‐sector for the growing of fruit nuts beverage and spice crops employed the largest number of people In six sub‐sectors there are employers who do not employ workers These are probably family based organisations where family members help in the business without drawing a salary These are in transport and livestock research slaughtering dressing and packing of livestock including poultry and small game for meat growing of coffee and tea including coconuts cocoa nuts olives dates etc ostrich farming and game farming
Table 18 Employee distribution by province Province Employees Percentage
Eastern Cape 18 844 192 Free State 1 946 20 Gauteng 2 788 28 KwaZulu‐Natal 5 416 55 Mpumalanga 8 062 82 North West 3 290 34 Northern Cape 5 436 56 Limpopo 1 730 18 Western Cape 50 386 515 Grand Total 97 898
Source AgriSETA WSP data
Of those submitting WSPs registered employers in the Western Cape employed the largest number of people while employers in Limpopo employed the least number of employees Free State has a small number of employees covered by WSPs submitted to the SETA whereas Eastern Cape with a relatively small number of registered farms has a very large number of employees on farms submitting WSPs Given this variance between provinces the use of WSP data for extrapolation purposes must be viewed cautiously
2009 WSP equity information was only provided for about a quarter of employees (25 637 or26)34 No information was available from the WSPs on non‐South Africans working on commercial farms
Table 19 Equity profile from 2009 WSP data African Coloured Indian White
Totals M F D M F D M F D M F D
8 040 5 785 38 5 097 5 228 24 22 25 0 811 556 11
580 417 03 493 505 02 468 532 00 589 403 08 13 863 10 349 47 1 378 25 637541 404 02 54 100
Total EquityTotal Male Total Female Total Disability
13 970 11 594 73 545 452 03
Source AgriSETA WSP data
Using currently available data it is not possible to provide disaggregated employment data by sub‐sector This will require a small change in the way that gender race and disability data is
34 Some employers did not complete race and gender information when giving their employment profiles
AgriSETA June 2010
codified during WSP data‐capturing including allocation by sub‐sector What can be stated is that employment of males is more dominant than that of women and more Africans are employed in the sector than other groups Employment of people with disabilities is below 1
21 Skills demand
The National Education and Training Strategy for Agriculture (AET Strategy)
The AET Strategy developed by the Department of Agriculture Fisheries and Forestry (in consultation with various key stakeholders in the agricultural sector) highlights priority skills needs and constraints within the sector and categorises needs within the following 5 broad areas
1 Agricultural production ndash requesting that the past focus on a narrow band of commodities (relevant mainly to the commercial sector) and related research be expanded to address the needs of small‐scale and subsistence farmers (eg more focus on mixed farming and rural livelihood sustainability skills)
2 Agricultural engineering ndash with specific focus to be placed on technologies suitable for small‐scale farmers (eg relevant and post‐harvesting techniques related to processing and storage of produce) ndash to address this need the scarcity of agricultural engineers requires attention
3 Agricultural economics ndash a critical need was identified for general agricultural economic skills (ranging spectrum of farm planning farm management enterprise management marketing finance etc) ndash with the need to training both farmers and extension officers in such fields
4 Agricultural development ndash a specific need was identified to develop agricultural extensionists in supporting especially emerging and small‐scale farmers over the full spectrum (a need exists for both new curriculum in the training of new extensionists and the re‐training and upgrading of existing officers)
5 Veterinarians ndash the need to develop state veterinarians in order for the state to perform its role and function (particularly in its preventative monitoring and regulatory role and function)
AGRISETA sector skills planning demand data (2008‐2009)
The following section reflects initial research on skills demand in the Agricultural sector arising from the sector analysis (section 1) previous AGRISETA skills demand research for Sector Skills Planning during 2005‐2009 and analysis of WSP data from 2009 With the introduction of the Organising Framework of Occupations and agreement on definitions for scarce and critical skills in 200506 the AGRISETA undertook an extensive research and consultation processes to determine skills development priorities for the sector The research methodology employed was based on the a four dimensional topology for establishing and evaluating skills needs illustrated in the figure below
Agriculture Sector Analysis 31
AgriSETA June 2010
Agriculture Sector Analysis 32
The identification and prioritisation of skills needs was also undertaken from a key stakeholder and beneficiary perspective Consideration was given to needs of the following groups
bull The unemployed ndash helping them gain andor regain entry to the labour market bull The economically inactive ndash helping them to become economically active bull School leavers ndash helping them gain access to further education and training opportunities
and thus facilitating their entry to the job market bull Entrants to the job market ndash facilitating employment and integration into the work culture
and work ethic (improving the employability of an individual) bull Those currently employed in the sector ndash increasing their competency and opportunities
for advancement creating a career path and offering continued job security enhancement of value adding to the sector improving their prospects for better employment opportunities
bull Organisations and enterprises within the sector ndash making sure that skills development and knowledge creation occurs in such a way as to improve the sectorrsquos viability and allowing companiesenterprises to become more sustainable and profitable along the way improving productivity competitiveness and innovation within organisations
In organising and reporting the identified priority skills development needs (200809) the following structuring approach was followed
Tier 1 The four categories of needs as per the Topology presented above were used for the identification evaluation and grouping of needs
Pay conditions
Image
RECRUITMENT DIFFICULTY
SKILLSGAP
SKILLSSHORTAGE
LABOURSHORTAGE
Firms experience difficulty recruiting This does not necessary imply a skills shortage ndash may indicate a poor image remuneration etc
Those currently in work do not have the requisite skills set to carry out their job to an optimum standard
Required skills are in short supply when compared with the demand across the whole labour market
Regardless of skills levels a situation exists where there is simply not enough supply of labour to meet demand
Pay conditions
Image
RECRUITMENT DIFFICULTY
SKILLSGAP
SKILLSSHORTAGE
LABOURSHORTAGE
Firms experience difficulty recruiting This does not necessary imply a skills shortage ndash may indicate a poor image remuneration etc
Those currently in work do not have the requisite skills set to carry out their job to an optimum standard
Required skills are in short supply when compared with the demand across the whole labour market
Regardless of skills levels a situation exists where there is simply not enough supply of labour to meet demand
Figure 4 Topology for identifying skills development priorities
Source AGRISETA SSP Annual Update August 2009
AgriSETA June 2010
Tier 2 Within each of the first tier groupings needs were further broken down and organised per target group At this second level needs were grouped by
o General skills development needs (cross‐cutting over different target groups) o Needs experienced by small scale farmers (this group included subsistence
farmers new emerging land reform beneficiaries and small‐scale AgriBEE farmers) o Needs within the commercial agricultural sector (per sub‐sector groupings where
specific needs for such were identified ndash both on‐farm needs and within the secondary sub‐sector or related agri‐businesses)
o Needs of the Department of Agriculture Fisheries and Forestry (DAFF) To further guide and direct the identification and selection of scarce and critical skills the following factors or criteria that could reflect the importance (impact and effect) of a skills shortages were developed as an identification framework
1 Basic Skills Development Promoting basic literacy and numeracy and raising the base level of education for the sector improving the work and livelihood of existing workers
2 Employability Making the employee more employable by improving the fit between their skills and the sector needs
3 Enterprise Viability Improving the capability and feasibility of the enterprise by increasing its effectiveness of or possibilities for profit generation etc
4 Enterprise Sustainability Allow enterprises to survive and grow over an extended period of time without compromising the value of renewable resources thereby creating long‐term meaningful employment for larger numbers of people
5 Sector Growth Enabling the sector to develop or pursue new opportunities or improve the effectiveness of current operations
6 Sector Competitiveness Enabling the sector to compete more effectively in the international arena improving market intelligence and interpretation productivity cost efficiency etc
7 Human Resource Development Capacity Improving the access to quality provision of training to the agri sector
Based on this research and consultation framework the following skills development needs and priorities were identified
Agriculture Sector Analysis 33
AgriSETA June 2010
GENERAL NEEDS SMALL‐SCALE FARMER
NEEDS COMMERCIAL SECTOR
NEEDS DAFF NEEDS
RECRUITMENT RELATED SKILLS NEEDS Primary agriculture is the entry point into the world of work for large numbers of people in rural areas However the sector has negative connotations amongst sections of the youth and in parts of the country and is viewed as a last resort for some in the search for employment) The effect is that despite an unemployment rate of approximately 26 (now over 30) farmers find it difficult to recruit workers to meet seasonal demands This has resulted in the government approving the contracting of foreign labour to meet such temporary needs (workers are recruited mainly from Zimbabwe and Mozambique)
Labour in this farming sector is provided primarily by family members and no real recruitment constraints can be identified
The agricultural sector still manages to attract technical and management skills as it is perceived to include a better lifestyle and there is a strong tradition of agriculture in SA Increasing crime related security risks associated with farming may have a negative impact
The Department has identified a number of occupations in which they are experiencing long‐term vacancies Some of these result from a general shortage of such skills in SA while others arise from the inability of the public sector to compete with the private sector (less favourable employment image working conditions and equity considerations) Priority vacancies include Veterinarians Agricultural
Engineers Plant Health
Specialists Agricultural
Statisticians Plant Health Pest Risk
Analysts ICT Specialists Agricultural
Economists Agricultural Food and
Quarantine Technicians
Agro‐meteorologists Pasture Scientists Plant Production
Specialists Specialised Food
Analysts SKILLS GAPS RELATED NEEDS
bull Low literacy and numeracy levels ndash both amongst workers within the sector at large and at ownermanager level in many of the small‐scale farming
bull Farm management
Farm Management (Mainly owners managers) bull Farm management amp
entrepreneurship bull Resource
management and record keeping
bull Financial planning
A critical constraint is the poor educational levels of a large proportion of the labour force in the sector demanding a considerable effort and investment in ABET and other life skills
A particularly big need exists for skills upgrading amongst Extension Officers ndash particularly with regard to redress the historical neglect of small‐scale farmers and resource strapped farmers
Agriculture Sector Analysis 34
AgriSETA June 2010
Agriculture Sector Analysis 35
GENERAL NEEDS SMALL‐SCALE FARMER
NEEDS COMMERCIAL SECTOR
NEEDS DAFF NEEDS
skills (and general management skills in other agricultural businesses) coupled with a business orientation and entrepreneurship skills
bull A general need to increase compliance with environmental occupational health and safety animal welfare produce safety and hygiene standards regulations and requirements (local and international standards)
and management bull Project management bull Business plan
development Marketing and processing bull Processing and
packaging bull Transport
management bull Marketing produce
including branding bull Planning for
marketing bull Knowledge of
markets Technical knowledge and skills bull Production
management (related to specific enterprise)
bull Demonstration of production techniques
bull Natural resources management
Mechanical knowledge bull Farm maintenance bull Repairs of machinery
and equipment bull Electrical
maintenance and installation
programmes Need for improved management skills and relevant technological knowledge for increasing productivity levels and improved production methods Rising importance for environmentally responsible production and processing management systems Rising competitive and international markets increases need for business and marketing abilities among owners and managers Increasing requirements for compliance with environmental health and safety and international trade standards Information technology although not a priority is increasing in importance Business management ability is becoming increasingly important as more farmers are making decisions about restructuring their businesses diversification and developing supplementary sources of income
Critically improved farm management and business skills within an agricultural context to support the majority of BEE and emerging farmers Skills upgrading requirements for existing Extension Officers include bull Agricultural
economics bull Agricultural
management bull Business and
financial management
bull Technical and production related skills including o Animal husbandryo Poultry o Crop production o Horticulture
SKILLS SHORTAGES Generally SA has a shortage of entrepreneurs and people who have the business acumen drive motivation and
The profile of these farmers reflects a large contingent of older and less educated people who are generally less flexible tend to stick to
The commercial agri sector will increasingly have to compete in the global market and the ever increasing need to increase productivity to
DAFF us experiencing problems are especially sourcing people in specialised science related fields (learning fields experiencing few
AgriSETA June 2010
Agriculture Sector Analysis 36
GENERAL NEEDS SMALL‐SCALE FARMER
NEEDS COMMERCIAL SECTOR
NEEDS DAFF NEEDS
perseverance to become a successful farmer Given the high risks involved in the agricultural sector (natural elements outside onersquos control) the agri sector does not compete successfully for this ldquoscarce resourcerdquo Moreover as with other professional and skilled occupations there is a tendency for younger qualified people to move to urban areas
known practices and are less likely to experiment with new technology Within this target group candidates with good entrepreneurial ability are scarce There is a perceived shortage of Agricultural Extensionists and advisors to assist this target group However a large pool of young unemployed graduates exists who could assist such emerging farmers if they were mobilised and made accessible to farmers Similarly the potential pool of retired commercial farmers who could serve as mentors to this target group
remain profitable and viable it can be stated that many of the existing farmers and managers owners lack business management and entrepreneurial orientation Equity policy and the need to become BEE compliant requires that commercial enterprises appoint and develop black owners directors managers Changing local and global consumer preferences require farmers to change traditional farming methods and practices Skills and knowledge requirements include bull Global food and
international quality standards
bull Product traceability requirements
bull Organic produce and products
Specific occupations identified as being in short supply are
bull Production Managers (food processing)
bull Product specialisation to international specifications (research skills)
bull Forklift drivers heavy vehicletruck drivers and mobile plant operators
bull Experienced and competent artisans (millwrights electricians fitters
enrolments andor pass rates at HET institutions with the result that too few qualified persons come onto the labour market) Examples of such skills shortages identified by the Department include Agricultural Engineers bull Plant Health
Specialists (Nematology Entomology Plant Pathology)
bull Statisticians (specialised agricultural knowledge)
bull Plant Health Pest Risk Analysts
bull Agricultural Economists (production and resource economists)
bull Agricultural Food and Quarantine Technicians
bull Agro‐meteorologists Early warning Specialists
bull Pasture Scientists bull Plant Production
Specialists (eg ornamental crops hydroponics)
bull Specialised Food Analysts (pesticide residue analysts processed food and dairy analysts wine and spirit analysts)
AgriSETA June 2010
Agriculture Sector Analysis 37
GENERAL NEEDS SMALL‐SCALE FARMER
NEEDS COMMERCIAL SECTOR
NEEDS DAFF NEEDS
and turners bull Agricultural
Equipment Technicians
bull Pest and weed controllers
bull Horticultural specialists
LABOUR SHORTAGES AND RELATED SKILLS NEEDS Given an employment rate of some 26 (2009 currently estimated at over 30expanded definition) per definition there cannot be a labour shortage It is however difficult for people who have never worked before to integrate into the agricultural sector workforce Coupled with an aging workforce (30‐60 being over 40) means that most agri enterprises will within the next 5‐10 years be looking at replacing a large proportion of their workforce There could be an insufficient pool of people willing and able to participate The impact of HIVAIDS is also not always factored in to understanding the diminishing pool of resources available Labour shortages have been reported within selected geographical areas and in particular occupations Examples include cane cutters in the sugar industry chicken catchers in the poultry industry pickers in the fruit industry and animal handlers in feedlots as well as dairy parlour workers It is however believed that these shortages may reflect a recruitment problem as a result of the very harsh working conditions and the relatively poor remuneration (which makes these occupations unpopular) At present such ldquoshortagesrdquo are addressed through contracting labour from neighbouring countries
AgriSETA WSP analyses
Skills demand in the commercial agricultural sector
Information for demand for skills from WSP data is available for 1 673 employers who submitted their WSPs for the 200910 period The table below shows data on sub‐sector WSP submission relative to size of the sub‐sector as well as subsector data from all registered organisations and those who submitted WSPs Data for registered employers shows that there were 239 076 employees employed by the 17 234 registered organisations As previously stated 97 898 employees were employed by the organisations submitting WSPs This constitutes 41 of employees employed by registered organisations
Table 20 Employment and sub‐sector data drawn from WSP analyses
Sub‐sector
All Re
gistered
Employers
Small employers (0‐49)
Med
ium and
large
employers (50+)
Total W
SPs received
Total W
SPs received
as of
all registered em
ployers
WSP
received med
ium and
large orgs
WSPs received
as of
med
ium amp large em
ployers
WSPs received
small
employers
WSPs received
as of small
enterprises
EmployeesPer
Profile
CoffeeTea 40 33 7 9 23 5 71 4 12 483 Fibre 1 710 1 676 34 34 2 22 65 12 07 6 539
AgriSETA June 2010
Agriculture Sector Analysis 38
Sub‐sector
All Re
gistered
Employers
Small employers (0‐49)
Med
ium and
large
employers (50+)
Total W
SPs received
Total W
SPs received
as of
all registered em
ployers
WSP
received med
ium and
large orgs
WSPs received
as of
med
ium amp large em
ployers
WSPs received
small
employers
WSPs received
as of small
enterprises
EmployeesPer
Profile
Fruit 371 277 94 162 44 76 81 86 31 27 873 Grain 648 581 67 77 12 48 72 29 5 22 129 Milling 335 279 56 61 18 35 63 26 9 4 630 Pest Control 213 209 4 8 4 2 50 6 3 119 Poultry 391 305 86 66 17 46 53 20 7 19 187 Primary 12 121 10 776 1 345 1144 9 513 38 631 6 136 034 Red meat 1107 1 018 89 70 6 45 51 25 2 7 475 Seed 167 149 18 24 14 13 72 11 7 2 127 Sugar 71 45 26 13 18 10 38 3 7 10 478 Tobacco 60 46 14 5 8 3 21 2 4 2 002
Totals 17 234 15 394 1 840 1 673 10 818 44 855 16 239 076
Source 1 AgriSETA WSP 2009 data
Only 10 of all registered employers submitted WSPs for the 200910 period Of these 49 were medium and large sized employers and 51 small However only 16 small employers submitted their WSPs relative to the number of registered small employers and 44 medium and large employers submitted WSPs relative to the number of registered medium and large employers As such skills demand statistics provides more representative data on the requirements of medium and large employers Data for skills demand in the commercial agricultural sector is based on data for permanent employees as well as casual and seasonal employees
Skills demand forecasting by AgriSETA
Forecasting for skills demand the AgriSETA has estimated that the demand for skilled employees at different levels in the next few years is 510 686 This is based on WSP data analyses over the last 5 years and projected demand for the formal commercial agricultural sector and factoring in the demand that at maximum would result from completion of the land restitution programme in South Africa The table below reflects the skills that are on demand as well as the estimates for demand over the next five years by major occupational category35
35 AgriSETA 2010
AgriSETA June 2010
Table 21 Demand for skills by occupational category
Major Occupation (OFO)Estimated Demand
Group Title1 Managers (commercial and small emerging farmers) 264 3702 Professionals 4 1413 Technicians and Trade workers 8 9255 Clerical and administrative workers 8006 Sales workers 4007 Machinery operators and drivers 5 8008 Elementary workers 226 250
Total 510 686Source AgriSETA WSP data and SSP demand forecasts
Research needs going forward
As has been set out in the sector analysis and the scenarios derived from that analysis the sector is faced by both significant and profound change and also great uncertainty It therefore follows that the task of focussing limited resources (basically levy income in the formal sector and NSF funds for the emergent farming sector) is difficult Whilst the general thrust of training remains broadly as described in the 2006‐10 SSP Updates some considerable work is required to achieve targeted effective interventions during the 2011‐2016 period The following research questions will need to be addressed in preparing the next SSP
bull In relation to the managers and owner‐managers of commercial farms and enterprises what skills are needed to enable them to help bring about the more optimistic scenario and manage the risks associated with the less optimistic ones
bull In terms of professional and technical competencies do the current education and training institutions coupled with the learning programmes available through the AgriSETA (learnerships skills programmes and the like) meet the needs of the sector
bull In the emerging agricultural sector do the current programmes funded by sources external to the AgriSETA (eg NSF) meet all the identified needs What gaps are there and how should they be addressed
bull In relation to governmentrsquos growth strategy and industrial action plans what skills are required for developing the aquaculture sub‐sector What programmes are available How can the SETA support the skills needs for this sub‐sector
bull Given the increasing levels of casual and contract labour how can skills be developed to meet the needs of the formal commercial sector and the emerging enterprise sector
bull How can the demand in each of the priority areas be quantified and agreement be reached on numbers of people to be trained
Agriculture Sector Analysis 39
AgriSETA June 2010
SECTION 3 Skills Gaps and scarce skills
Scarce skills at the DAFF
The level of scarce skills at DAFF can be determined by the vacancy rate While the average vacancy rate in the department as at 31 March 2009 was 17 there were some posts that had very high vacancy rates as reflected in the table below Indicating the possibility that the Department is experiencing difficulties in finding suitable candidates in the South African labour market to fill these posts
Table 22 Scarce skill occupations and vacancy rates (DAFF March 2009) Critical occupations Number of posts Posts filled Vacancy rate ()
Agricultural animal oceanography forestry and other sciences
167 119 287
Engineering sciences related 2 1 50Engineers and related professions 13 6 538Farming forestry advisors and farm managers 11 4 636Finance and economics related 73 53 274Horticulturists foresters agricultural and forestry technicians
350 221 369
Legal related 6 4 333Mechanical engineering technicians 3 2 333Risk management and security services 6 4 333Social sciences related 1 0 100Veterinarians 34 24 294
Source DAFF Annual Report 20082009
Skills are also scarce at senior management level The department also reports on difficulties it has filling senior management services vacancies with some of them staying vacant for up to twelve months because no suitable candidates can be found The department would then resort to re‐advertisement and head hunting This was the case with 22 of 18 SMS posts in March 2009
Scarce skills in the commercial sector
The following occupations have previously been projected as scarce (extremely hard to fill vacancies) by AgriSETA in the commercial agricultural sector over the next five years
Table 23 Scarce and critical skills in the commercial agricultural sector
Occupation Code
Group Occupation Critical Skills Intervention Comments
139903 Managers Laboratory Manager
Technology AI nutrition
HET
221101 Professionals Accountant (General)
General HET
221102 Professionals Management Accountant
Farm financial management
HET Focus on support advice to farmers new enterprises
222101 Professionals Commodities Trader
Export administration supply chain
FET Learnership Skills
Agriculture Sector Analysis 40
AgriSETA June 2010
Agriculture Sector Analysis 41
Occupation Code
Group Occupation Critical Skills Intervention Comments
management Programme
224301 Professionals Economist Agricultural HET
Mainly for Department of Agriculture and para statals commodity organisations
233101 Professionals Chemical Engineer
Chemical processes in food production
HET Industries such as sugar processing
233301 Professionals Electrical Engineer
Installation and maintenance
HET Processing industry
233401 Professionals Electronics Engineer
Computerised production prosesses
HET Processing industry
233501 Professionals Industrial Engineer
Productivity and efficiency
HET Processing industry
233904 Professionals
Instrument Engineer (Defence Force)
Installation and maintenance
HET
Not for defence ‐ sugar industry
233502 Professionals Mechanical Engineer
FETHET Equity reasons
233902 Professionals Agricultural Engineer
Farm layout and infrastructure
HET Mainly in Government
311101 Technicians and trades workers
Agricultural Technician
Installation and maintenance
FETHET
234102 Professionals Agricultural Scientist
Agri research HETFET Especially in horticulture
234201 Professionals Chemist HET Processing industry
234202 Professionals Food Technologist
Food safety HACCP
FETHET Across sector
234701 Professionals Veterinarian HET Mainly in Government
311101 Technicians and trades workers
Agricultural Technician
Farm infrastructure
FET Mainly needed in government
311401 Technicians and trades workers
Chemistry Technician
FETHET EE reasons
312907 Technicians and trades workers
Chemical Engineering Technician
FET Learnership
Mainly EE reasons
312402 Technicians and trades workers
Electronic Engineering Technician
Weak stream production infra
FETHET Mainly tobacco industry
233904 Professionals
Instrument Engineer (Defence Force)
Instrument technician
FET
Occupation needed Instrument Technician (not defence force) Mainly sugar processing sector
321202 Technicians and trades workers
Diesel Motor Mechanic
FET Learnership
To include tractor mechanic
321204 Technicians and trades workers
Small Engine Mechanic
Agricultural equipment
FET Learnership
Throughout sector
AgriSETA June 2010
Agriculture Sector Analysis 42
Occupation Code
Group Occupation Critical Skills Intervention Comments
322301 Technicians and trades workers
Metal Fabricator
Artisan FET Learnership
322303 Technicians and trades workers
Welder Welder (First Class)
Artisan FET Learnership
323203 Technicians and trades workers
Fitter‐Welder Artisan FET Learnership
Mainly sugar ndash multi‐skilled
323202 Technicians and trades workers
Fitter And Turner
Artisan FET Learnership
Tobacco and sugar
323501 Technicians and trades workers
Millwright Artisan FET Learnership
Wide‐spread need
341101 Technicians and trades workers
Electrician (General)
Artisan FET Learnership
Wide‐spread need
342101 Technicians and trades workers
Air‐Conditioning And Refrigeration Mechanic
Artisan FET Learnership
Sugar pack houses cold chain
Source AgriSETA Sector Skills Plans
Supply of skills
South Africarsquos agriculture skills are produced in high schools agricultural colleges FET colleges and Higher Education institutions In high school a large cohort of learners take Agricultural Science as a subject In 2003 there were 42 Agricultural High Schools offering Agricultural Science as a subject These students and those in high schools taking the subject could progress to taking agriculture as a focus area for further education In 2004 there were 10 FET colleges offering vocationally directed agricultural programmes These FET colleges offered complete qualifications and short courses Eleven Colleges of Agriculture can offer qualifications up to degree level and 19 universities offer qualifications in Agriculture ranging from agricultural economics animal and plant sciences and horticulture among others at under and post graduate levels (Department of Agriculture 2006) While long term planning of skilling of new entrants in the sector can be done through close consultation between the sector agricultural schools and colleges FET colleges and HET institutions so that they teach relevant skills there are other avenues for training for those who are already employed in the sector for example skills programmes and learnerships There are 15 registered qualifications for the primary agriculture sub sectors Currently AgriSETA has 94 registered learnerships that can address the skills needs of the identified scarce skills These are captured in Appendix 2 AgriSETA has approved accredited a number of training providers across the country to deliver the theoretical and practical components of these learnerships These include agricultural colleges FET colleges and private providers Currently the AgriSETA has 246 registered and approved providers distributed nationally as follows
AgriSETA June 2010
Table 29 AgriSETA approved training providers (2010) Province Number of providers
Gauteng 72
(29)
KwaZulu Natal 20
(8)
Limpopo 35
(14)
North West 30
(12)
Northern Cape 3
(1)
Free State 15
(6)
Mpumalanga 14
(6)
Western Cape 26
(11)
Eastern Cape 31
(13) Total 246
The providers are small to large organisations In primary agriculture small providers appear to offer the most training in rural areas and community projects (AgriSETA 2010) Most of the operating providers will be in FET colleges and agricultural colleges The AgriSETA is unable to meet the total demands for skills across the duality of their sector There seems to be fairness in the approval of training for both permanent and casual and seasonal workers In 200809 the AgriSETA approved 559 learnerships as follows
Table 30 AgriSETA learnerships approved for grant purposes (2008‐2009)
Source AgriSETA learnership data analysis
Agriculture Sector Analysis 43
AgriSETA June 2010
Agriculture Sector Analysis 44
Provision of skills programmes in the same year attracted grants for 2 706 employees
Table 31 Participation by learners in skills programmes in the AgriSETA (200809)
Source AgriSETA Skills programmes data analysis
AgriSETA June 2010
APPENDIX 1 Skills demand in the Department of Agriculture Forestry amp Fisheries (200809)
Source DAFF Annual Report 2008‐20009
Agriculture Sector Analysis 45
AgriSETA June 2010
Agriculture Sector Analysis 46
Appendix 2 AgriSETA registered learnerships Registered Learnership NQF Level SAQA Registration NoLearnership in Agri Sales and Service 4 22 Q 220001 20 178 4Learnership Agricultural Machinery Technician 2 22 Q 220007 20 160 2Learnership in Specialist Agricultural Machinery Technician 5 22 Q 220009 21 258 5Agri Trade Processes 2 22 Q 220013 30 125 2FETC Meat Examination Applying Basic Business Principles 4 30 Q 3000 2823 164 4Further Education and Training Certificate Seed Marketing Execute Seed Trials 4 22 Q 220025 21 126 4Further Education and Training Certificate Seed Research and Development Certify as Seed Unit 4 22 Q 220027 21 121 4FETC Seed Research and Development Conduct a Field Inspection of a Seed Unit 4 22 Q 220028 20 120 4Seed Research and Development Operations Operate in a Team 3 22 Q 220020 22 121 3Seed Research and Development Operations Apply Basic Business Principles 3 22 Q 220021 22 121 3National Certificate Seed Processing and Packaging Operate in a Team 3 22 Q 220026 21 123 3Sugar Industry Technical Maintenance worker 2 22 Q 220011 39 128 2National Certificate Sugar Manufacturing and Refining Technical Maintenance 3 30 Q300003 23 146 3Further Education and Training Certificate Manufacturing Technical MaintenanceProduce Components by Performing Engineering Turning Operations
4 30 Q 3000 1321 173 4
FETC Manufacturing Technical Maintenance Produce Components by Performing Milling Operations 4 30 Q 3000 1521 173 4 FETC Manufacturing Technical Maintenance Develop and Fabricate from Complex Drawing 4 30 Q 3000 1420 173 4National Certificate in Sugar Technology 5 22 Q 220036 22 140 5Further Education and Training Certificate Sugar Processing 4 22 Q 220035 31 144 4National Certificate in Sugar Technology Processing Sugar Refining 2 22 Q 220037 28 124 2National Certificate in Sugar Technology Processing Juice Preparation 2 22 Q 220038 28 124 2National Certificate in Sugar Technology Processing Crystallisation 2 22 Q 220039 27 122 2National Certificate in Sugar Technology Processing Laboratory Practice 2 22 Q 220040 25 124 2National Certificate in Sugar Technology Processing Extraction 2 22 Q 220041 28 122 2NC Rooibos Production Applying Basic Business Principles 2 30 Q 3000 2427 130 2 NC Rooibos Processing Applying Basic Business Principles 2 30 Q 3000 2224 123 2 National Certificate Cigarette Production 3 22 Q 220046 23 121 3
AgriSETA June 2010
REFERENCES AgriSETA 2010 AgriSETA 20082009 Annual report Pretoria AgriSETA Agricultural Research Council httpwwwarcagriczahomeasppid=272 Avert South African HIV and AIDS statistics Available on httpwwwavertorgsafricastatshtm Centre for Development Enterprise 2008 Land reform in South Africa Getting back on track CDE Research No 16 DAFF 2010 Quarterly economic review of the agriculture sector Pretoria DAFF DAFF 2009 Annual report 20082009 Pretoria DAFF Department of Agriculture 2008 Strategic plan 2008 Pretoria Department of Agriculture DTI An introduction to the South African economy Available on httpwwwthedtigovzapublicationsagroprocessinghtm Eastern Cape Provincial Government Eastern Cape Provincial Growth and Development Strategy 2004 ndash 2014 Economic Commission for Africa 2009 Developing African agriculture through regional value chains Addis Ababa Economic Commission for Africa Economic Report Free State Province 2005 Provincial Growth and Development Strategy 2005 ndash 2014 GCIS 2010 SA Yearbook 200910rdquo Agriculture forestry and fisheries Pretoria GCIS Greenberg S 2010 Status report on land and agricultural policy in South Africa 2010 Institute for Poverty Land and Agrarian Studies School of Government University of the Western Cape Research report Ingelozi Management Solutions 2008 HIVAIDS in the South African agricultural sector Towards the development of a long term intervention Research report KwaZulu Natal Provincial Government 2006 KwaZulu Natal Provincial Growth and Development Strategy Limpopo Provincial Government Growth and Development Strategy 2004 ndash 2014 Mhone G (2000) Enclavity and Constrained Labour Absorbtive Capacity in Southern African Countries Geneva International Labour Office Moyo S The Agrarian question and the developmental state in South Africa In Edigheji O et al 2010 Constructing a democratic developmental state in South Africa HSRC PRESS
Agriculture Sector Analysis 47
AgriSETA
Agriculture Sector Analysis
National Treasury Republic of South Africa 2010 National Budget 2010 ndash National Budget Review 2010 Pretoria National Treasury Northern Cape Provincial Government Agriculture and agro‐processing sector strategy North West Provincial Government North West Provincial Growth and Development Strategy 2004 ndash 2014 Province of the Western Cape 2008 The Ikapa growth and development strategy White Paper SABCOHA SA Business Coalition on HIV and AIDS wwwsabcohaorg SACAU httpwwwsacauorghostingsacauSacauWebnsfHomehtmOpenForm South African Government 2010 20102011 ndash 20122013 Industrial Policy Action Plan Republic of South Africa Statistics South Africa 2005 Census of commercial agriculture 2002 Report No 110201 Pretoria Statistics South Africa Statistics South Africa 2009 Census of commercial agriculture 2007 Statistical release P1101 Pretoria Statistics South Africa Statistics South Africa 2010 General household survey 2009 Statistical release P0318 Pretoria Statistics South Africa Statistics South Africa 2010 Gross domestic product first quarter 2010 Statistical release P0441 Pretoria Statistics South Africa Statistics South Africa 2010 Quarterly labour force survey Quarter 1 2010 Statistical release P0211 Pretoria Statistics South Africa Vink N amp van Rooyen J 2009 The economic performance of agriculture in South Africa since 1994 The implications for food security Pretoria DBSA development planning division working paper series No 17 Webster E 2004 the Dual Economy from a book by Van Holdt K and Webster E Work restructuring and the Crisis of Social reproduction and 10 years of restructuring post apartheid workplaces University of Natal Press Workinfocom httpwwwworkinfocomfreesub_for_legresdatalraempassoc3htm Xingwana L 2008 Challenges and Opportunities for Land and Agrarian Reform towards 2025 Speech delivered at the Agri‐Consultation Protea Ranch Hotel Polokwane 30 July 2008
- Table of contents
- SECTION 1 THE AGRICULTURAL LANDSCAPE
- 11 Size and shape of the Agricultural sector
-
- Overview
- Distribution of agricultural production
- The structure of the agriculture sector in South Africa
- Categories of farming enterprises
- Employment trends
- Employment categories and remuneration
- Stakeholders in the Agricultural sector
-
- National government departments
- Sector representatives
-
- 12 Factors impacting development in the Agriculture sector
-
- Future sector economic growth and development
-
- South African sector growth plans (IPAP2)
- International Trade
- Global recession and rise in food prices
-
- Land reform
- Reliance on imports
- Water
- The labour market
- Consumer trends
- HIVAIDS
- Farm safety and security
- Broad-based Black Economic Empowerment
-
- Conclusions and scenarios
- SECTION 2 DEMAND FOR SKILLS
-
- AgriSETA registered employers and employee coverage
- Employee coverage in the AgriSETA
-
- 21 Skills demand
-
- The National Education and Training Strategy for Agriculture (AET Strategy)
- AGRISETA sector skills planning demand data (2008-2009)
- AgriSETA WSP analyses
-
- Skills demand in the commercial agricultural sector
-
- Skills demand forecasting by AgriSETA
- Research needs going forward
-
- SECTION 3 Skills Gaps and scarce skills
-
- Scarce skills at the DAFF
- Scarce skills in the commercial sector
- Supply of skills
-
- APPENDIX 1 Skills demand in the Department of Agriculture Forestry amp Fisheries (200809)
- Appendix 2 AgriSETA registered learnerships
-

AgriSETA June 2010
These key factors are clustered and discussed below
Future sector economic growth and development
South African sector growth plans (IPAP2)
The 20102011 ndash 20122013 Industrial Policy Action Plan (IPAP) identifies five structural challenges that existed in the South African economy before the global economic downturn and which have been exacerbated by the recent economic crisis These challenges were evident even during the time South Africa was experiencing relatively high growth rates between 2005 and 2007 and have continued during the recession These challenges are
1 Structural imbalances in the growth path including growth that is lagging behind other medium and low income countries
2 Uneven performance of the manufacturing sector with some divisions like the automotive sector experiencing exponential growth while other sectors have stagnated
3 Employment growth being sustained by credit extension and consumption rather than by productive sectors leading to a large current account deficit
4 Low profitability of manufacturing 5 Low savings and investment from financial sector growth Only 52 of private credit was
extended to fixed investment in 2008 Key sectors have been identified for IPAPrsquos focus including agro‐processing which has a diverse group of industries and sub‐sectors including food processing beverages aquaculture horticulture medicinal aromatic and flavourants Key action plans for the agro‐processing sector are identified in IPAP2 as
Development of a National Food Control Agency to consolidate the sector Development of aquaculture to supplement dwindling wild fish stocks Designating specific areas for utilisation of aquaculture Development of the organic food sector Development of the small milling industry Enhancing competitiveness in fruit and vegetable canning Improving beneficiation of Rooibos and Honeybush products (IPAP2 2010)
International Trade
South Africa is a major exporter of Agricultural produce In particular South African fruit and fruit‐derived products such as wine and fruit juice are competitive in the global market However in many sub‐sectors where export potential exists ndash grain and meat ndash serious problems face the industry A key challenge is the uneven playing field experienced by South African exporters Major global competitors include the United States and the countries of the European Union where government subsidies in various forms are in place No such subsidies are in place in South Africa making it difficult if not impossible for South African agricultural produces to enter developed country markets due to the prices that they have to ask for products I In addition the value of the Rand has fluctuated from levels of around R10 to the US dollar to as little as R7 to the dollar When the Rand is strong export becomes difficult because it costs more in the case of the move from R10 to R7 a 30 cost increase for the importer It is impossible to
Agriculture Sector Analysis 16
AgriSETA June 2010
Agriculture Sector Analysis 17
predict whether the World Trade Organisation negotiations known as the DOHA Round will achieve progress in the coming years Historical evidence is that during periods of global recession developed economies become more protective not less and so the current outlook is not good Nor is it possible to predict the value of the Rand though current thinking in government is to move toward a weaker Rand to encourage exports These are two key variables that will need to be factored into the different sector growth scenarios for the future
Global recession and rise in food prices
Economic growth slowed down significantly in sub Saharan Africa and in South Africa in 2009 but there appear to be signs of recovery GDP growth in the region declined from about 6 in 2004 ndash 2008 to about 18 in 200910 GDP growth in South Africa was 16 in 2009 17and rose to 46 in the first quarter of 201018 though much of this is related to the income derived from the 2010 FIFA World Cup and may not be sustained Projections are generally for a slow revival with a set back after the slight rise resulting from the World Cup A return to the 6 levels of the 20078 could take some years The global recession reduced the demand for African exports and reduced capital flows to the region but it is anticipated that the demand for mineral resources by Asian and Western powers will result in both the expansion of exports and expanded foreign direct investment The competition between India and China for African markets is also expected to boost trade to the benefit of African suppliers South Africa is expected to particularly benefit from direct foreign investment from China and India China has already become South Africarsquos largest market for exports and supplier of imports19 Rising food prices have forced governments around the world to control prices of maize bread rice and dairy products In South Africa ldquofood price inflation between December 2005 and December 2006 averaged 788 rdquo20 Although efforts are being made to reduce barriers to poorer families in relation to basic food there has been no move to subsidise food generally This may change though the space for significant levels of support is restricted because of reduced revenue from income taxes resulting from the recession The global credit crunch and recession have meant a reduction in public expenditure and funding which has affected the agricultural sector21
Land reform
In South Africa specifically land reform has a significant bearing on food security and agriculturersquos contribution to GDP The objective of the land reform programme is to transfer 30 of agricultural land to black ownership by 2014 (deferred to 2025) to ensure more equitable access to land by historically disadvantaged people and to increase their participation in agricultural activities22 Land reform has been informed by four processes23
17 Department of Agriculture Forestry and Fisheries 2010 18 Stats SA 2010 19 Department of Agriculture Forestry and Fisheries 2010 20 Department of Agriculture Forestry and Fisheries 2010 ‐2011 Strategic Plan 21 Economic Commission for Africa 2009 22 Xingwana 2008 23 CDE 2008
AgriSETA June 2010
Agriculture Sector Analysis 18
Land restitution involving returning land or providing financial compensation to those whose land was dispossessed during apartheid
Land redistribution transferring more land to the historically disadvantaged Tenure reform modernising land tenure rules and access to land ownership and Providing financial support for the development of emerging farmers
In relation to progress with land reform by September 2009 only 69 of agricultural land (about 567 million hectares) had been transferred and a majority of the beneficiaries have not yet occupied the land due to lack of infrastructure input or technical support The following table gives an indication of the progress of land reform since the inception of the first democratic government
Table 14 Land transfers and beneficiaries ‐ 1994 to 2009
Province Redistribution and tenure Restitution Total Hectares Beneficiaries Claims Hectares Beneficiaries Hectares Beneficiaries
Eastern Cape 675 353 357 25 633 16 201 94 834 215 201 448 191 240 834
Free State 799 350 291 7 721 2 662 47 615 40 893 397 906 48 614
Gauteng 286 34 513 7 328 13 159 9 476 70 179 43 989 77 507
KwaZulu Natal 690 547 414 67 761 14 752 642 447 433 168 1 189 861 500 929
Limpopo 291 91 235 7 403 3 382 513 024 220 227 604 259 227 630
Mpumalanga 444 322 839 13 950 2 694 399 876 225 877 722 715 239 827
Northern Cape 271 952 744 2 773 3 682 539 620 100 554 1 492 364 103 327
North West 300 268 566 40 539 3 709 373 642 172 963 642 208 213 502
Western Cape 223 122 304 12 750 15 546 3 769 118 165 126 073 130 915
Total 3 979 3 043 264 185 858 75 787 2 624 303 1 597 227 5 667 567 1 783 085
Source Greenberg 2010
Achievement of the 30 land reform target is being made difficult by land prices Under the willing buyer willing seller scheme the government will need R74 billion to be able to purchase enough land While resources may be available there are suggestions of lack of capacity The Department of Rural Development and Land Reform (DRDLR) was able to spend only 31 of its land reform 200910 budget in the first six months of the financial year Going forward this Department needs to identify what the real challenges are with the pace of land reform delivery so that they can be mitigated to meet the 2025 target A priority is the retention of skills skills transfer and skills development during the transfer of land as well as retention of national food production to avoid loss of production Support for new beneficiaries of land to ensure sustained productivity is derived from two main sources of funding ndash the Broadening Access to Agriculture Thrust (BADAT) and the Comprehensive Agricultural Support Programme (CASP) CASP is a conditional grant from the Department of Agriculture Forestry and Fisheries to provincial departments to support emerging farmer development Provincial farming budgets dedicated for farmer support in Mpumalanga the Free State Northern Cape and the Western Cape have risen significantly and those in KwaZulu Natal and Gauteng have witnessed a slight increase Eastern Cape and Limpopo agricultural budgets have been steady The North West is the only province where there has been a sharp decline in the share of the budget dedicated to farmer support24
24 Greenberg 2010
AgriSETA June 2010
Agriculture Sector Analysis 19
Reliance on imports
Overall the Agriculture sector contributes positively to the balance of payments ldquoSouth Africa remains food secure The value of our exports increased by 464 from R33 656 million in 200708 to R49 278 million in 200809 During the same period the estimated value of imports rose by 12 from R34 009 million to R38 401 million resulting in a positive trade balancerdquo25
South Africa depends largely on world markets for seed production and agrochemicals Regarding seed production there are only three community seed production schemes in Limpopo and Mpumalanga being piloted with state funding Ten top large companies including two South African companies and multinationals have rights to over two thirds of registered seed varieties in South Africa Despite the dominance of genetically modified and hybrid seed in some sub‐sectors like maize sunflower and sorghum open‐pollinated varieties have been resilient in South Africa enabling the possibility of alternative seed sources not dependent on technological processes26 In relation to agrochemicals deregulation and liberalisation in the fertiliser sector led to the shutdown of local production capacity and South Africa became an importer of fertiliser for the first time in 2000 There are three large players in the fertiliser sector Sasol Nitro Yara and Omnia South Africa imports an estimated 70 of fertilisers and pesticides Fertiliser prices rose by over 200 between 2006 and 2008 but dropped somewhat after that However this hike signified the volatility of the agrochemicals industry and South Africarsquos dependency on imports and the potential risk for emerging farmers and food production of this dependence on imports as the country cannot control the prices making inputs both difficult to budget for and in many cases unaffordable The price of agrochemicals is also particularly influenced by the prices of oil and the exchange rate The general understanding in relation to job creation is that a weaker Rand will improve exports and therefore enable job creation Of course the down side of this strategy is that imports become more expensive So what may be an advantage for those sub‐sectors who are expanding their export volumes those relying on imported agro chemicals will be under increased pressure
Water
Water is both an essential and scarce resource for the agriculture sector and is being threatened by climate changes Crop production relies heavily on water and yet access to water is not being addressed in a systematic way in the land reform processes Greenberg suggests that the relationship between land reform agricultural support and water resource provision is inadequate and a way to address this could be established by linking water provision to land transfer or investing in irrigation for both commercial and resource‐poor farmers However investing in irrigation in the context of water scarcity and climate change may not be the best option What could be needed is finding ways to maximise efficiency of the 60 of South African
25 Department of Agriculture Forestry and Fisheries Strategic Plan 201011 26 Greenberg 2010
AgriSETA June 2010
Agriculture Sector Analysis 20
water used for irrigation by for example using methods such as drip or micro‐irrigation which are expensive to set up but which reduce water wastage by 5‐1027 The Department of Water Affairs is responsible for managing water supply and has to give authorisation for agricultural projects and other developments The department needs to be seen as an important stakeholder in the agricultural sector
The labour market
South Africa recorded an unemployment rate of 243 in 2009 (narrow definition) If people who are no longer actively seeking work are considered the broad unemployment rate rose from 267 to 313 illustrated in the figure below As a direct consequence of the global economic downturn in 2008 870 000 formal jobs were lost in 200928 Others have quoted a figure of over 1 million
Figure 3 Official unemployment in South Africa 2003 ‐2009
Source National Treasury 2010
Annual employment loss followed sector growth patterns with agriculture mining manufacturing and trade facing the highest job losses as their sector growth contracted Unemployment is especially a major problem among lower skilled workers and younger people Youth employment in the 15 ‐24 year age group has fallen by 219 000 (136) and 483 of people in this age group are unemployed Employment of semi‐skilled and unskilled workers has contracted by 527 000 and male employment has gone down by 550 000 (71) while that of women has decreased by 320 000 (52) The number of discouraged workers ie those no longer actively seeking work has increased from 518 000 to 17 million29 Clearly the existence of a very large pool of largely unskilled unemployed workers has an impact on the farming sector It drives wages down and creates opportunities for casualisation and the expansion of labour contract agencies and brokers In addition there are significant numbers of foreign nationals mainly from Zimbabwe and Mozambique who are seeking work and often finding it on farms and in primary processing and packaging plants There are benefits to the
27 Greenberg 2010 28 National Treasury 2010 29 National Treasury 2010
AgriSETA June 2010
Agriculture Sector Analysis 21
sector with skilled and semi‐skilled workers coming into the labour market and being absorbed into the workforce and helping raise productivity levels However at the lower skilled end of the market the existence of this pool brings further casualisation and downward pressure on wages Tensions are likely to increase and further protests either in the form of xenophobic outbreaks or actions against farmers may well increase A view often expressed by farm employers is that current labour legislation makes dismissing workers difficult and so the availability of labour without entering into contracts of employment is an attractive way of avoiding the legislation and its obligations Organised Labour is seeking to restrict these opportunities through either regulating or eliminating labour brokers and efforts are being made to regulate the use of foreign labour However for the foreseeable future the trend is for formally employed people to be reduced in number In relation to the emergent sector there will also be a reluctance to enter employment contracts with workers The fact that many households are engaged in some form of largely unpaid agricultural work means that there is significant casual work dating back many years Helping change this situation into one where casual or unpaid jobs are transformed into formal jobs with regular wages will take time It is also likely that as some emergent farms become established they will act similarly to established farms and institute a form of casual labour rather than expanding a workforce for which they would have to take a level of responsibility From an AgriSETA perspective these labour market trends mean that whilst levy income can be directed at a relatively small labour pool one that is manageable in terms of planning and implementation the size of the informal casual and unemployed labour force in the sector ‐ for whom no levy is paid and who have no employer to plan for their skills needs ndash is very large and its needs almost unlimited Clearly the relationship with the National Skills Fund (NSF) becomes critical in respect of the entire non‐levy income sector Again the level of support available from non‐levy income sources will be an important variable in looking at future sector skills development scenarios
Consumer trends
South Africa currently produces enough food to meet the needs of its population However consumption of three main staples maize wheat and vegetables has been volatile since 1985 and remains below 1990 levels Consumption of maize and vegetables by South Africans is 17 and 32 less respectively than in 198530 The main reasons for this lie in the growing levels of poverty and the difficulties that families have in purchasing nutritious food Whilst government has increased the levels of social grants and increased the number of people receiving grants to around 13 million the incomes of poor families have been badly hit by a range of factors including job losses and rises in food prices The approximately 1 million people who lost their jobs in 20089 meant a loss of income for many millions of dependents Rises in food prices have also had a disproportionate impact on the poor Whilst food is available it is often not accessible to families on the income levels that they have to manage within The result is that less and less nutritious food is purchased which in turn impacts on the ability of farmers to sell their products locally 30 Greenberg 2010
AgriSETA June 2010
Agriculture Sector Analysis 22
Whilst there is no evidence that government will reduce its efforts in relation to poverty relief and social benefits including such programmes as school feeding schemes and food parcels during periods of drought the state of public finances may not enable to support the poverty that grips many rural areas If real income levels for the poor were to rise it could have a significant impact on the economy of the agricultural sector Equally an improvement in the rural economy with increased agricultural production and jobs would dramatically impact on the capacity of people to buy nutritious food Achieving a positive growth path in rural areas is a huge challenge for government and one that is key to governmentrsquos Medium Term Strategic Framework and Industrial Policy Action Plans
HIVAIDS
South Africa has a high prevalence of HIV and AIDS The HIV prevalence among people aged two and above was estimated at 109 in 2008
Table 15 Estimated HIV percentage prevalence by age group (2002 ndash 2008)
Age 2002 2005 2008 Change
Children (2‐14 years) 56 33 25 ‐31
Youth (15‐24 years) 93 103 87 ‐06
Adults (25 and older) 155 156 168 13
15‐49 year olds 156 1692 169 13
Total (ages 2 to 49) 114 108 109 ‐05 Source Avert 2009
The table above shows that HIV prevalence is highest amongst those aged 25 years and older Given youth labour market analyses which point to people from previously disadvantaged backgrounds mainly African males accessing formal employment for the first time at age 25 ‐27 this population can be held to represent people in employment Research31 has estimated that by 2020 the pandemic will have claimed at least 20 of employees in the agricultural sector Southern Africa
in
HIV and AIDS have significant ramifications in the agricultural sector for both commercial farming and subsistence farming The implications include
bull Decrease in cultivated land bull Focus on less labour intensive crop and animal production bull Decrease in womenrsquos agricultural productivity as they take on a more care giving role bull Loss of skills bull Increase in absenteeism from work bull Decrease in daily work outputproductivity because workers are weaker from infections
There are suggestions that the impact of the pandemic in South Africa demands sectoral intervention although this may be difficult in the agricultural commercial sector as
bull Seasonal workers who seem to be more vulnerable to infection because of their low socio‐economic status are not in one place long enough for care programs Further
31 Ingelozi Management Solutions 2008
AgriSETA June 2010
Agriculture Sector Analysis 23
farmers and employers may not feel responsible for seasonal workers in the same way they would invest in their permanent employees
bull There may be uncertainty around land reform which may put HIV intervention on farms on the back burner
bull There are no policies that enforce HIV education and care on farms in the same way that legislation like BEE does for ownership As a result HIV intervention may be left to goodwill and employers may feel it is more important to comply with issues that are monitored
Farm safety and security
South Africa has been plagued by unacceptably high levels of violent crime and murder for many years now Farms have experienced this and those living on farms feel and are extremely vulnerable The South African Chamber of Commerce and Industry (SACCI) has argued that
Using the nominal GDP figure for 2009 of R24 trillion a 322 percent contribution of agriculture to GDP and an estimate of 39982 farms (as at 2007) in South Africa the cost of a murderattack on a farm to the economy was R1932869 per annum
SACCI acknowledges that this estimate is flawed as it does not take into consideration the fact that farming units contribute differently to GDP and that not every attack or murder contributes to farm shut down or loss of productivity However if not addressed these attacks could lead to loss of farming sectors as farmers migrate to lsquosaferrsquo regions This will affect employment and GDP contribution of the sector The need for safety and security on farms may also shift farmersrsquo focus in skills development to include personnel who have skills in safety and security
Broad‐based Black Economic Empowerment
The aim of the AgriBEE Charter (gazetted in 2008) is to increase the involvement of black business in agriculture through ownership and control as executives and senior managers of new and existing agricultural businesses The extent to which AgriBEE is transforming the sector is not known as it is too early to tell but a recent survey conducted by ABC and the IDC showed that among the ABC respondents in 2007 46 of enterprises were busy constructing a BEE strategy and 46 claimed to be implementing a BEE strategy A survey of the dairy industry in the Western and Eastern Cape in 2008 showed that only 6 of firms had a BEE strategy in place It also seems from survey data that companies are focusing on the skills development and socio‐economic aspects of BEE rather than on ownership32 It would appear that although there have been some significant BEE purchases of viable farms and some employee empowerment projects including some quite high profile ones in the Cape Winelands the extent of ownership change had been limited One of the factors is the very high level of single person or family ownership in the agricultural sector BEE is more straight forward in the corporate world where shares can be exchanged For a family business it is a matter of selling off part or all of the land and the tendency is to sell off those areas of the farm that are expendable from a business sustainability perspective
32 Greenberg 2010
AgriSETA June 2010
Whilst there is discussion in government about the ending of the ldquowilling buyer willing sellerrdquo concept the Constitution itself provides for property rights and so although some pressure may be exerted through legislation and regulation the extent and speed of change may not be fast The mechanisms for encouraging the transfer of significant levels of ownership have not yet been created The focus of the SETA is therefore likely to be more the beneficiaries of land reform and emergent farmers though projects of a BEE nature can be targeted as they arise
Conclusions and scenarios It is useful when looking at possible scenarios to examine the key variables or uncertainties and to project how variations one way or the other will have an impact on the development and growth of the sector From the sector analysis and factors that are contributing to change in the sector there are some key factors that seem to emerge First appears to be the economy and related issues of the labour market and the challenges of labour absorption in an enclave economy These factors determine on the one hand whether there will be growth and development and on the other whether such improvements will result in improved employment opportunities and the creation of a virtuous cycle of development Second is the role of the state and the various government departments whose plans and work impact on the agricultural sector Related to this is land reform that is inevitably driven by the state and not the owners of land or the landless The view expressed by many engaged in agrarian reform is that the state must play a significant role It becomes clear that a successful agricultural enterprise requires a number of factors to be in place to be successful These include access to land (Department of Rural Development and Land Reform) agricultural support within a supportive agricultural framework (Department of Agriculture Forestry and Fisheries) access to consistent water supply (Department of Water Affairs) access to finance (Department of Trade and Industry various state agencies) conducive labour market regulation (Department of Labour) sound industrial policy (Department of Trade and Industry) economic planning and macro policy (Department of Economic Development National Treasury) and appropriate education training and skills development (Department of Higher Education and Training the Human Resources Development Council NSA and the SETA) There are other government departments as well as provincial and municipal structures that also play a role The following analyses show how the four variables
economic growth and development role of the government labour market changes and land reform)
impact positively or negatively on the growth of the sector and the demand for skills
Agriculture Sector Analysis 24
AgriSETA June 2010
Agriculture Sector Analysis 25
HHIIGGHH GGRROOWWTTHH SSCCEENNAARRIIOO
The economics of the sector Role of government
The economy in SA and globally continues to revive albeit slowly for the next few years
Roles and integration of national government departments are clarified Specific functions are agreed processes put in place and personnel appointed with the required skills
International trade agreements are still weighted infavour of US and EU but progress is being made and specific blockages are addressed in bilateral talks
The roles of Departments (DWA DAFF DRDLR DoL DTI DED DHET) are clarified with appropriate joint plans and coordinating structures
The rural economy gradually improves with the buying power of the poor increasing and more stable markets created for local produce
For each of the functions agreed in each of the related departments appropriate structures and systems are put in place and staff trained
Exports increase in key areas identified in IPAP 2 and the Rand exchange rate stabilises at a level not too much different than it is today
Specific capacity is put in place at local level to support implementation of land reform and rural development
There is a growing understanding of the concept of dualism and the need to intervene with labour absorption and development mechanisms
Land claims are all finally settled and ownership and tenure is resolved There is a serious drive to establish effective agricultural enterprises
An understanding is reached on the role of agencies and labour brokers and abuse is curbed
The willing buyer willing seller approach is resolved and enables viable land to become black owned
Some relaxation of labour market regulations are agreed that maintain some minimum standard of employment but assist absorption
Land transfer to black and emergent farmers is done in a manner that integrates then into the supply chains of the sector
Mechanisms are found to address skills needs in the context of casual and seasonal work patterns
Financing of land reform and transfer is done on the basis of agreed development plans including skills
Labour market reform Trajectory of land reform LLOOWW GGRROOWWTTHH SSCCEENNAARRIIOO
The economics of the sector Role of government departments The economy in SA and globally stagnates at current levels and the economy struggles to pick up after the temporary 2010 World Cup boost
A lack of purpose at government level means limited progress for another five years Land reform remains a commitment without a plan
International trade agreements are still weighted infavour of US and EU and protectionism increases as a result of the global recession
The roles of Departments (DWA DAFF DRDLR DoL DTI DED DHET) are unclear and there is no proper co‐ordination
SArsquos Gini coefficient continues to worsen with rural poverty increasing and local economies declining
There is a lack of effective structures systems and processes to implement policy across departments
Rand volatility causes problems for importers and exporters Well established markets are maintained but exports decrease
At local level the decline in the agricultural extension officer functions continues and limited practical support is available
Understanding of the rural economy is so diverse that stakeholders cannot agree the problem let alone the solution to low absorption levels
Land claims take too long and land reform processes leave potentially productive land poorly developed and managed
Casual labour and labour brokers remains an issue of dispute Confrontation results in bitterness and resentment
The impasse caused by a rigid interpretations of property clauses in the Constitution continues to stall achievement of the 30 black ownership target
Labour market regulation continues to be a contributing factor to reducing levels of employment
Black owned farms find it difficult to become part of supply chains and are unable to perform adequately
Unstable employment patterns in the sector make skills interventions difficult to manage and largely ineffective
Financing of land reform and land transfer continues to be wasted as it is not tied to the building of appropriate capacity
Labour market reform Trajectory of land reform
AgriSETA June 2010
These analyses can be translated into four potential growth and development scenarios for the agricultural sector which are based on the requirements for a strong development state Scenario 3 Weak government support
and sound economy
Econ
omic fa
ctors glob
ally n
ationa
lly and
locally
Scenario 1 Integrated government support and sound economy
The economic upturn triggered by the World Cup continues and globally things improve enabling an expansion of exports The government because of a lack of integrated policy planning and implementation provides limited support for sector development The gains go to the well established enterprise owners with few gains for emerging farmers and local communities
Government departments coordinate their efforts to achieve maximum impact There are favourable economic conditions that create opportunities for advance Within this positive environment the role of the AgriSETA becomes a central component of a comprehensive strategy for growth and skills interventions are targeted to achieve maximum effect Results in growth in sustainable enterprises and expanded employment opportunities
Government policy and support Government policy and support
Combination of disjointed government policy planning and a weak and increasingly marginalised rural economy Economic conditions result in unsustainable farming conditions and employment declines along with productivity Food shortages and the lack of development in rural areas leading to increasing social tensions A vicious cycle develops with the sector going into long term decline
Government departments coordinate their efforts to achieve maximum impact However economic conditions hamper progress Efforts by the AgriSETA are undermined by poor labour absorption and job insecurity Some significant successes are recorded including some NSF funded projects that result in sustainable enterprises A platform is laid for future improvements when the economic conditions improve
Scenario 4 Weak state and economy Scenario 2 Strong state but weak
economy
Agriculture Sector Analysis 26
AgriSETA June 2010
Agriculture Sector Analysis 27
SECTION 2 DEMAND FOR SKILLS
AgriSETA registered employers and employee coverage
In 2009 17 234 employers were registered with the AgriSETA comprising 15 394 small employers (less than 50 employees) 1 202 medium sized employers (50 ‐ 149 employees) and 638 large employers (more than 150 employees)
Considering that there are around 40000 commercial farms33 the 17 234 employers represent around 43 of commercial farms Notwithstanding changes in the sector as a result of land reform and sector shrinkage this is a sizable proportion and is held to be sufficiently representative for the purpose of skills development planning However this paints an incomplete picture It understates the representative nature of large enterprise registered with the SETA and overstates the representative nature of small registered enterprises 4 175 (242) of the enterprises are levy paying members Further only 1 673 (11) workplace skills plans (WSPs) were submitted
Table 16 Registered employers by size and sub‐sector Sub‐sector Description
Employers Small Medium Large
CoffeeTea Processing and marketing of coffee and tea including coconuts cocoa nuts olives dates etc
33 4 3
Fibre Grading ginning packing of wool and cotton raw material 1 676 16 18
Fruit Fruit packed in cartons fruit juice concentrate drummed and fruit juice in container ready for consumption
271 36 57
Fruit exporters and importers 6 0 1
Grain
Manufacture of grain mill products and starches 119 5 7Handling and storage of grain 67 7 23Wholesale amp retail trade in Agricultural machinery 213 9 4Sale and distribution of Agricultural raw materials and other farming inputs
182 9 3
Milling
Manufacture of flour and grain mill products including rice and vegetable milling grain mill residues
120 15 11
Manufacture of prepared animal feeds 110 19 0Manufacture of pet foods 42 9 0Manufacture of starches and starch products 7 1 1
Pest control
Pest Control 209 4 0
Poultry Poultry and egg production including the slaughtering dressing and packing of poultry
305 49 37
Primary
Growing of Cereals and other crops (not elsewhere classified) 902 160 34Growing of Vegetables Horticultural specialties nursery products
943 120 72
Growing of Vegetables Horticultural specialties (Including Ornamental Horticulture) and nursery products
11 5 0
Sugar plantation including sugar cane and sugar beet etc 9 4 2
33 SARS statistics 2007
AgriSETA June 2010
Agriculture Sector Analysis 28
Sub‐ Description Employers Growing of fruit nuts beverage and spice crops 1795 255 143Farming of cattle sheep goats horses asses mules and hinnies Dairy farming
2 252 59 18
Other animal farming production of animal products (NEC) 433 25 12Ostrich farming 5 0 0Game farming 16 0 0Growing of crops combined with farming of animals (Mixed farming)
2 920 256 109
Growing of coffee and tea including coconuts cocoa nuts olives dates etc
2 0 0
Agricultural and animal husbandry services except veterinary activities
438 22 9
Other animal farming (not elsewhere classified) 11 1 1Growing of trees as second crop by farmers 126 18 4Fishing operation of fish hatcheries and fish farm 913 10 6
Red meat
Production and animal products (not elsewhere classified) 6 0 0Slaughtering dressing and packing of livestock including poultry and small game for meat
317 40 17
Production sale amp marketing of Agricultural by products (eg bones hides)
61 2 0
Slaughtering dressing and packing of livestock including small game for meat and processing of ostrich products
2 1 0
Wholesale trade in Agricultural raw materials and livestock 193 7 10Transport of livestock as supporting activity 224 0 0Agricultural and livestock research 215 9 3
Seed Seed production and marketing 149 12 6
Sugar Manufacture of sugar including golden syrup and castor sugar
45 5 21
Tobacco Processing and dispatching of tobacco 46 8 6 TOTALS 15 394 1 202 638Source AgriSETA WSP data
The largest number of registered small and medium enterprises are found in the mixed farming sub‐sector while most large enterprises are in the growing of fruit nuts beverage and spice crops sub‐sector
Employee coverage in the AgriSETA
Collectively the 17 234 employers registered with AgriSETA employed a total of 239 076 employees This represents 39 of the agricultural labour force in 2009 The 1 673 employers who submitted WSPs in 2009 employed 97 898 employees representing 41 of the total number of people employed by registered employers While the number of registered employers submitting WSPs is small (11) they employ a sizeable number of employees and the percentage of employees provides a statistically significant sample The data for larger enterprises is statistically much more representative than that for small enterprises
AgriSETA June 2010
Table 17 Number of employees of registered employers by sub‐sector
Sub‐sector
Sub‐sector description Employees
CoffeeTea Processing and marketing of coffee and tea including coconuts cocoa nuts olives dates etc
483
Fibre Grading ginning and packing of wool and cotton raw material 6 539
Fruit Fruit packed in cartons fruit juice concentrate drummed and fruit juice in container ready for consumption
27 661
Fruit exporters and importers 212
Grain
Manufacture of grain mill products and starches 133Handling and storage of grain 18 303Wholesale amp retail trade in Agricultural machinery 795Sale and distribution of Agricultural raw materials and other farming inputs 2 898
Milling
Manufacture of flour and grain mill products including rice and vegetable milling grain mill residues
3 634
Manufacture of prepared animal feeds 731Manufacture of pet foods 160Manufacture of starches and starch products 105
Pest control
Pest Control 119
Poultry Poultry and egg production including the slaughtering dressing and packing of poultry
19 187
Primary
Growing of Cereals and other crops (not elsewhere classified) 10 104Growing of Vegetables Horticultural specialties and nursery products 37 799Growing of Vegetables Horticultural specialties (Including Ornamental Horticulture) and nursery products
195
Sugar plantation including sugar cane and sugar beet etc 220Growing of fruit nuts beverage and spice crops 47 043Farming of cattle sheep goats horses asses mules hinnies Dairy farming
3 382
Other animal farming production of animal products (NEC) 4 203Ostrich farming 0Game farming 0Growing of crops combined with farming of animals (Mixed farming) 28 722Growing of coffee amp tea including coconuts cocoa nuts olives dates etc 0Agricultural and animal husbandry services except veterinary activities 970Other animal farming (not elsewhere classified) 513Growing of trees as second crop by farmers 1 294Fishing operation of fish hatcheries and fish farm 1 589
Red meat
Production and animal products (not elsewhere classified) 0Slaughtering dressing and packing of livestock including poultry and small game for meat
5 128
Production sale amp marketing of Agricultural by products (eg bones hides) 116Slaughtering dressing and packing of livestock including small game for meat and processing of ostrich products
0
Wholesale trade in Agricultural raw materials and livestock 1 697Transport of livestock as supporting activity 0Agricultural and livestock research 534
Seed Seed production and marketing 2 127Sugar Manufacture of sugar including golden syrup and castor sugar 10 478Tobacco Processing and dispatching of tobacco 2 002 Total 239 076
Agriculture Sector Analysis 29
AgriSETA June 2010
Agriculture Sector Analysis 30
Source AgriSETA WSP data
According to the WSP analysis the sub‐sector for the growing of fruit nuts beverage and spice crops employed the largest number of people In six sub‐sectors there are employers who do not employ workers These are probably family based organisations where family members help in the business without drawing a salary These are in transport and livestock research slaughtering dressing and packing of livestock including poultry and small game for meat growing of coffee and tea including coconuts cocoa nuts olives dates etc ostrich farming and game farming
Table 18 Employee distribution by province Province Employees Percentage
Eastern Cape 18 844 192 Free State 1 946 20 Gauteng 2 788 28 KwaZulu‐Natal 5 416 55 Mpumalanga 8 062 82 North West 3 290 34 Northern Cape 5 436 56 Limpopo 1 730 18 Western Cape 50 386 515 Grand Total 97 898
Source AgriSETA WSP data
Of those submitting WSPs registered employers in the Western Cape employed the largest number of people while employers in Limpopo employed the least number of employees Free State has a small number of employees covered by WSPs submitted to the SETA whereas Eastern Cape with a relatively small number of registered farms has a very large number of employees on farms submitting WSPs Given this variance between provinces the use of WSP data for extrapolation purposes must be viewed cautiously
2009 WSP equity information was only provided for about a quarter of employees (25 637 or26)34 No information was available from the WSPs on non‐South Africans working on commercial farms
Table 19 Equity profile from 2009 WSP data African Coloured Indian White
Totals M F D M F D M F D M F D
8 040 5 785 38 5 097 5 228 24 22 25 0 811 556 11
580 417 03 493 505 02 468 532 00 589 403 08 13 863 10 349 47 1 378 25 637541 404 02 54 100
Total EquityTotal Male Total Female Total Disability
13 970 11 594 73 545 452 03
Source AgriSETA WSP data
Using currently available data it is not possible to provide disaggregated employment data by sub‐sector This will require a small change in the way that gender race and disability data is
34 Some employers did not complete race and gender information when giving their employment profiles
AgriSETA June 2010
codified during WSP data‐capturing including allocation by sub‐sector What can be stated is that employment of males is more dominant than that of women and more Africans are employed in the sector than other groups Employment of people with disabilities is below 1
21 Skills demand
The National Education and Training Strategy for Agriculture (AET Strategy)
The AET Strategy developed by the Department of Agriculture Fisheries and Forestry (in consultation with various key stakeholders in the agricultural sector) highlights priority skills needs and constraints within the sector and categorises needs within the following 5 broad areas
1 Agricultural production ndash requesting that the past focus on a narrow band of commodities (relevant mainly to the commercial sector) and related research be expanded to address the needs of small‐scale and subsistence farmers (eg more focus on mixed farming and rural livelihood sustainability skills)
2 Agricultural engineering ndash with specific focus to be placed on technologies suitable for small‐scale farmers (eg relevant and post‐harvesting techniques related to processing and storage of produce) ndash to address this need the scarcity of agricultural engineers requires attention
3 Agricultural economics ndash a critical need was identified for general agricultural economic skills (ranging spectrum of farm planning farm management enterprise management marketing finance etc) ndash with the need to training both farmers and extension officers in such fields
4 Agricultural development ndash a specific need was identified to develop agricultural extensionists in supporting especially emerging and small‐scale farmers over the full spectrum (a need exists for both new curriculum in the training of new extensionists and the re‐training and upgrading of existing officers)
5 Veterinarians ndash the need to develop state veterinarians in order for the state to perform its role and function (particularly in its preventative monitoring and regulatory role and function)
AGRISETA sector skills planning demand data (2008‐2009)
The following section reflects initial research on skills demand in the Agricultural sector arising from the sector analysis (section 1) previous AGRISETA skills demand research for Sector Skills Planning during 2005‐2009 and analysis of WSP data from 2009 With the introduction of the Organising Framework of Occupations and agreement on definitions for scarce and critical skills in 200506 the AGRISETA undertook an extensive research and consultation processes to determine skills development priorities for the sector The research methodology employed was based on the a four dimensional topology for establishing and evaluating skills needs illustrated in the figure below
Agriculture Sector Analysis 31
AgriSETA June 2010
Agriculture Sector Analysis 32
The identification and prioritisation of skills needs was also undertaken from a key stakeholder and beneficiary perspective Consideration was given to needs of the following groups
bull The unemployed ndash helping them gain andor regain entry to the labour market bull The economically inactive ndash helping them to become economically active bull School leavers ndash helping them gain access to further education and training opportunities
and thus facilitating their entry to the job market bull Entrants to the job market ndash facilitating employment and integration into the work culture
and work ethic (improving the employability of an individual) bull Those currently employed in the sector ndash increasing their competency and opportunities
for advancement creating a career path and offering continued job security enhancement of value adding to the sector improving their prospects for better employment opportunities
bull Organisations and enterprises within the sector ndash making sure that skills development and knowledge creation occurs in such a way as to improve the sectorrsquos viability and allowing companiesenterprises to become more sustainable and profitable along the way improving productivity competitiveness and innovation within organisations
In organising and reporting the identified priority skills development needs (200809) the following structuring approach was followed
Tier 1 The four categories of needs as per the Topology presented above were used for the identification evaluation and grouping of needs
Pay conditions
Image
RECRUITMENT DIFFICULTY
SKILLSGAP
SKILLSSHORTAGE
LABOURSHORTAGE
Firms experience difficulty recruiting This does not necessary imply a skills shortage ndash may indicate a poor image remuneration etc
Those currently in work do not have the requisite skills set to carry out their job to an optimum standard
Required skills are in short supply when compared with the demand across the whole labour market
Regardless of skills levels a situation exists where there is simply not enough supply of labour to meet demand
Pay conditions
Image
RECRUITMENT DIFFICULTY
SKILLSGAP
SKILLSSHORTAGE
LABOURSHORTAGE
Firms experience difficulty recruiting This does not necessary imply a skills shortage ndash may indicate a poor image remuneration etc
Those currently in work do not have the requisite skills set to carry out their job to an optimum standard
Required skills are in short supply when compared with the demand across the whole labour market
Regardless of skills levels a situation exists where there is simply not enough supply of labour to meet demand
Figure 4 Topology for identifying skills development priorities
Source AGRISETA SSP Annual Update August 2009
AgriSETA June 2010
Tier 2 Within each of the first tier groupings needs were further broken down and organised per target group At this second level needs were grouped by
o General skills development needs (cross‐cutting over different target groups) o Needs experienced by small scale farmers (this group included subsistence
farmers new emerging land reform beneficiaries and small‐scale AgriBEE farmers) o Needs within the commercial agricultural sector (per sub‐sector groupings where
specific needs for such were identified ndash both on‐farm needs and within the secondary sub‐sector or related agri‐businesses)
o Needs of the Department of Agriculture Fisheries and Forestry (DAFF) To further guide and direct the identification and selection of scarce and critical skills the following factors or criteria that could reflect the importance (impact and effect) of a skills shortages were developed as an identification framework
1 Basic Skills Development Promoting basic literacy and numeracy and raising the base level of education for the sector improving the work and livelihood of existing workers
2 Employability Making the employee more employable by improving the fit between their skills and the sector needs
3 Enterprise Viability Improving the capability and feasibility of the enterprise by increasing its effectiveness of or possibilities for profit generation etc
4 Enterprise Sustainability Allow enterprises to survive and grow over an extended period of time without compromising the value of renewable resources thereby creating long‐term meaningful employment for larger numbers of people
5 Sector Growth Enabling the sector to develop or pursue new opportunities or improve the effectiveness of current operations
6 Sector Competitiveness Enabling the sector to compete more effectively in the international arena improving market intelligence and interpretation productivity cost efficiency etc
7 Human Resource Development Capacity Improving the access to quality provision of training to the agri sector
Based on this research and consultation framework the following skills development needs and priorities were identified
Agriculture Sector Analysis 33
AgriSETA June 2010
GENERAL NEEDS SMALL‐SCALE FARMER
NEEDS COMMERCIAL SECTOR
NEEDS DAFF NEEDS
RECRUITMENT RELATED SKILLS NEEDS Primary agriculture is the entry point into the world of work for large numbers of people in rural areas However the sector has negative connotations amongst sections of the youth and in parts of the country and is viewed as a last resort for some in the search for employment) The effect is that despite an unemployment rate of approximately 26 (now over 30) farmers find it difficult to recruit workers to meet seasonal demands This has resulted in the government approving the contracting of foreign labour to meet such temporary needs (workers are recruited mainly from Zimbabwe and Mozambique)
Labour in this farming sector is provided primarily by family members and no real recruitment constraints can be identified
The agricultural sector still manages to attract technical and management skills as it is perceived to include a better lifestyle and there is a strong tradition of agriculture in SA Increasing crime related security risks associated with farming may have a negative impact
The Department has identified a number of occupations in which they are experiencing long‐term vacancies Some of these result from a general shortage of such skills in SA while others arise from the inability of the public sector to compete with the private sector (less favourable employment image working conditions and equity considerations) Priority vacancies include Veterinarians Agricultural
Engineers Plant Health
Specialists Agricultural
Statisticians Plant Health Pest Risk
Analysts ICT Specialists Agricultural
Economists Agricultural Food and
Quarantine Technicians
Agro‐meteorologists Pasture Scientists Plant Production
Specialists Specialised Food
Analysts SKILLS GAPS RELATED NEEDS
bull Low literacy and numeracy levels ndash both amongst workers within the sector at large and at ownermanager level in many of the small‐scale farming
bull Farm management
Farm Management (Mainly owners managers) bull Farm management amp
entrepreneurship bull Resource
management and record keeping
bull Financial planning
A critical constraint is the poor educational levels of a large proportion of the labour force in the sector demanding a considerable effort and investment in ABET and other life skills
A particularly big need exists for skills upgrading amongst Extension Officers ndash particularly with regard to redress the historical neglect of small‐scale farmers and resource strapped farmers
Agriculture Sector Analysis 34
AgriSETA June 2010
Agriculture Sector Analysis 35
GENERAL NEEDS SMALL‐SCALE FARMER
NEEDS COMMERCIAL SECTOR
NEEDS DAFF NEEDS
skills (and general management skills in other agricultural businesses) coupled with a business orientation and entrepreneurship skills
bull A general need to increase compliance with environmental occupational health and safety animal welfare produce safety and hygiene standards regulations and requirements (local and international standards)
and management bull Project management bull Business plan
development Marketing and processing bull Processing and
packaging bull Transport
management bull Marketing produce
including branding bull Planning for
marketing bull Knowledge of
markets Technical knowledge and skills bull Production
management (related to specific enterprise)
bull Demonstration of production techniques
bull Natural resources management
Mechanical knowledge bull Farm maintenance bull Repairs of machinery
and equipment bull Electrical
maintenance and installation
programmes Need for improved management skills and relevant technological knowledge for increasing productivity levels and improved production methods Rising importance for environmentally responsible production and processing management systems Rising competitive and international markets increases need for business and marketing abilities among owners and managers Increasing requirements for compliance with environmental health and safety and international trade standards Information technology although not a priority is increasing in importance Business management ability is becoming increasingly important as more farmers are making decisions about restructuring their businesses diversification and developing supplementary sources of income
Critically improved farm management and business skills within an agricultural context to support the majority of BEE and emerging farmers Skills upgrading requirements for existing Extension Officers include bull Agricultural
economics bull Agricultural
management bull Business and
financial management
bull Technical and production related skills including o Animal husbandryo Poultry o Crop production o Horticulture
SKILLS SHORTAGES Generally SA has a shortage of entrepreneurs and people who have the business acumen drive motivation and
The profile of these farmers reflects a large contingent of older and less educated people who are generally less flexible tend to stick to
The commercial agri sector will increasingly have to compete in the global market and the ever increasing need to increase productivity to
DAFF us experiencing problems are especially sourcing people in specialised science related fields (learning fields experiencing few
AgriSETA June 2010
Agriculture Sector Analysis 36
GENERAL NEEDS SMALL‐SCALE FARMER
NEEDS COMMERCIAL SECTOR
NEEDS DAFF NEEDS
perseverance to become a successful farmer Given the high risks involved in the agricultural sector (natural elements outside onersquos control) the agri sector does not compete successfully for this ldquoscarce resourcerdquo Moreover as with other professional and skilled occupations there is a tendency for younger qualified people to move to urban areas
known practices and are less likely to experiment with new technology Within this target group candidates with good entrepreneurial ability are scarce There is a perceived shortage of Agricultural Extensionists and advisors to assist this target group However a large pool of young unemployed graduates exists who could assist such emerging farmers if they were mobilised and made accessible to farmers Similarly the potential pool of retired commercial farmers who could serve as mentors to this target group
remain profitable and viable it can be stated that many of the existing farmers and managers owners lack business management and entrepreneurial orientation Equity policy and the need to become BEE compliant requires that commercial enterprises appoint and develop black owners directors managers Changing local and global consumer preferences require farmers to change traditional farming methods and practices Skills and knowledge requirements include bull Global food and
international quality standards
bull Product traceability requirements
bull Organic produce and products
Specific occupations identified as being in short supply are
bull Production Managers (food processing)
bull Product specialisation to international specifications (research skills)
bull Forklift drivers heavy vehicletruck drivers and mobile plant operators
bull Experienced and competent artisans (millwrights electricians fitters
enrolments andor pass rates at HET institutions with the result that too few qualified persons come onto the labour market) Examples of such skills shortages identified by the Department include Agricultural Engineers bull Plant Health
Specialists (Nematology Entomology Plant Pathology)
bull Statisticians (specialised agricultural knowledge)
bull Plant Health Pest Risk Analysts
bull Agricultural Economists (production and resource economists)
bull Agricultural Food and Quarantine Technicians
bull Agro‐meteorologists Early warning Specialists
bull Pasture Scientists bull Plant Production
Specialists (eg ornamental crops hydroponics)
bull Specialised Food Analysts (pesticide residue analysts processed food and dairy analysts wine and spirit analysts)
AgriSETA June 2010
Agriculture Sector Analysis 37
GENERAL NEEDS SMALL‐SCALE FARMER
NEEDS COMMERCIAL SECTOR
NEEDS DAFF NEEDS
and turners bull Agricultural
Equipment Technicians
bull Pest and weed controllers
bull Horticultural specialists
LABOUR SHORTAGES AND RELATED SKILLS NEEDS Given an employment rate of some 26 (2009 currently estimated at over 30expanded definition) per definition there cannot be a labour shortage It is however difficult for people who have never worked before to integrate into the agricultural sector workforce Coupled with an aging workforce (30‐60 being over 40) means that most agri enterprises will within the next 5‐10 years be looking at replacing a large proportion of their workforce There could be an insufficient pool of people willing and able to participate The impact of HIVAIDS is also not always factored in to understanding the diminishing pool of resources available Labour shortages have been reported within selected geographical areas and in particular occupations Examples include cane cutters in the sugar industry chicken catchers in the poultry industry pickers in the fruit industry and animal handlers in feedlots as well as dairy parlour workers It is however believed that these shortages may reflect a recruitment problem as a result of the very harsh working conditions and the relatively poor remuneration (which makes these occupations unpopular) At present such ldquoshortagesrdquo are addressed through contracting labour from neighbouring countries
AgriSETA WSP analyses
Skills demand in the commercial agricultural sector
Information for demand for skills from WSP data is available for 1 673 employers who submitted their WSPs for the 200910 period The table below shows data on sub‐sector WSP submission relative to size of the sub‐sector as well as subsector data from all registered organisations and those who submitted WSPs Data for registered employers shows that there were 239 076 employees employed by the 17 234 registered organisations As previously stated 97 898 employees were employed by the organisations submitting WSPs This constitutes 41 of employees employed by registered organisations
Table 20 Employment and sub‐sector data drawn from WSP analyses
Sub‐sector
All Re
gistered
Employers
Small employers (0‐49)
Med
ium and
large
employers (50+)
Total W
SPs received
Total W
SPs received
as of
all registered em
ployers
WSP
received med
ium and
large orgs
WSPs received
as of
med
ium amp large em
ployers
WSPs received
small
employers
WSPs received
as of small
enterprises
EmployeesPer
Profile
CoffeeTea 40 33 7 9 23 5 71 4 12 483 Fibre 1 710 1 676 34 34 2 22 65 12 07 6 539
AgriSETA June 2010
Agriculture Sector Analysis 38
Sub‐sector
All Re
gistered
Employers
Small employers (0‐49)
Med
ium and
large
employers (50+)
Total W
SPs received
Total W
SPs received
as of
all registered em
ployers
WSP
received med
ium and
large orgs
WSPs received
as of
med
ium amp large em
ployers
WSPs received
small
employers
WSPs received
as of small
enterprises
EmployeesPer
Profile
Fruit 371 277 94 162 44 76 81 86 31 27 873 Grain 648 581 67 77 12 48 72 29 5 22 129 Milling 335 279 56 61 18 35 63 26 9 4 630 Pest Control 213 209 4 8 4 2 50 6 3 119 Poultry 391 305 86 66 17 46 53 20 7 19 187 Primary 12 121 10 776 1 345 1144 9 513 38 631 6 136 034 Red meat 1107 1 018 89 70 6 45 51 25 2 7 475 Seed 167 149 18 24 14 13 72 11 7 2 127 Sugar 71 45 26 13 18 10 38 3 7 10 478 Tobacco 60 46 14 5 8 3 21 2 4 2 002
Totals 17 234 15 394 1 840 1 673 10 818 44 855 16 239 076
Source 1 AgriSETA WSP 2009 data
Only 10 of all registered employers submitted WSPs for the 200910 period Of these 49 were medium and large sized employers and 51 small However only 16 small employers submitted their WSPs relative to the number of registered small employers and 44 medium and large employers submitted WSPs relative to the number of registered medium and large employers As such skills demand statistics provides more representative data on the requirements of medium and large employers Data for skills demand in the commercial agricultural sector is based on data for permanent employees as well as casual and seasonal employees
Skills demand forecasting by AgriSETA
Forecasting for skills demand the AgriSETA has estimated that the demand for skilled employees at different levels in the next few years is 510 686 This is based on WSP data analyses over the last 5 years and projected demand for the formal commercial agricultural sector and factoring in the demand that at maximum would result from completion of the land restitution programme in South Africa The table below reflects the skills that are on demand as well as the estimates for demand over the next five years by major occupational category35
35 AgriSETA 2010
AgriSETA June 2010
Table 21 Demand for skills by occupational category
Major Occupation (OFO)Estimated Demand
Group Title1 Managers (commercial and small emerging farmers) 264 3702 Professionals 4 1413 Technicians and Trade workers 8 9255 Clerical and administrative workers 8006 Sales workers 4007 Machinery operators and drivers 5 8008 Elementary workers 226 250
Total 510 686Source AgriSETA WSP data and SSP demand forecasts
Research needs going forward
As has been set out in the sector analysis and the scenarios derived from that analysis the sector is faced by both significant and profound change and also great uncertainty It therefore follows that the task of focussing limited resources (basically levy income in the formal sector and NSF funds for the emergent farming sector) is difficult Whilst the general thrust of training remains broadly as described in the 2006‐10 SSP Updates some considerable work is required to achieve targeted effective interventions during the 2011‐2016 period The following research questions will need to be addressed in preparing the next SSP
bull In relation to the managers and owner‐managers of commercial farms and enterprises what skills are needed to enable them to help bring about the more optimistic scenario and manage the risks associated with the less optimistic ones
bull In terms of professional and technical competencies do the current education and training institutions coupled with the learning programmes available through the AgriSETA (learnerships skills programmes and the like) meet the needs of the sector
bull In the emerging agricultural sector do the current programmes funded by sources external to the AgriSETA (eg NSF) meet all the identified needs What gaps are there and how should they be addressed
bull In relation to governmentrsquos growth strategy and industrial action plans what skills are required for developing the aquaculture sub‐sector What programmes are available How can the SETA support the skills needs for this sub‐sector
bull Given the increasing levels of casual and contract labour how can skills be developed to meet the needs of the formal commercial sector and the emerging enterprise sector
bull How can the demand in each of the priority areas be quantified and agreement be reached on numbers of people to be trained
Agriculture Sector Analysis 39
AgriSETA June 2010
SECTION 3 Skills Gaps and scarce skills
Scarce skills at the DAFF
The level of scarce skills at DAFF can be determined by the vacancy rate While the average vacancy rate in the department as at 31 March 2009 was 17 there were some posts that had very high vacancy rates as reflected in the table below Indicating the possibility that the Department is experiencing difficulties in finding suitable candidates in the South African labour market to fill these posts
Table 22 Scarce skill occupations and vacancy rates (DAFF March 2009) Critical occupations Number of posts Posts filled Vacancy rate ()
Agricultural animal oceanography forestry and other sciences
167 119 287
Engineering sciences related 2 1 50Engineers and related professions 13 6 538Farming forestry advisors and farm managers 11 4 636Finance and economics related 73 53 274Horticulturists foresters agricultural and forestry technicians
350 221 369
Legal related 6 4 333Mechanical engineering technicians 3 2 333Risk management and security services 6 4 333Social sciences related 1 0 100Veterinarians 34 24 294
Source DAFF Annual Report 20082009
Skills are also scarce at senior management level The department also reports on difficulties it has filling senior management services vacancies with some of them staying vacant for up to twelve months because no suitable candidates can be found The department would then resort to re‐advertisement and head hunting This was the case with 22 of 18 SMS posts in March 2009
Scarce skills in the commercial sector
The following occupations have previously been projected as scarce (extremely hard to fill vacancies) by AgriSETA in the commercial agricultural sector over the next five years
Table 23 Scarce and critical skills in the commercial agricultural sector
Occupation Code
Group Occupation Critical Skills Intervention Comments
139903 Managers Laboratory Manager
Technology AI nutrition
HET
221101 Professionals Accountant (General)
General HET
221102 Professionals Management Accountant
Farm financial management
HET Focus on support advice to farmers new enterprises
222101 Professionals Commodities Trader
Export administration supply chain
FET Learnership Skills
Agriculture Sector Analysis 40
AgriSETA June 2010
Agriculture Sector Analysis 41
Occupation Code
Group Occupation Critical Skills Intervention Comments
management Programme
224301 Professionals Economist Agricultural HET
Mainly for Department of Agriculture and para statals commodity organisations
233101 Professionals Chemical Engineer
Chemical processes in food production
HET Industries such as sugar processing
233301 Professionals Electrical Engineer
Installation and maintenance
HET Processing industry
233401 Professionals Electronics Engineer
Computerised production prosesses
HET Processing industry
233501 Professionals Industrial Engineer
Productivity and efficiency
HET Processing industry
233904 Professionals
Instrument Engineer (Defence Force)
Installation and maintenance
HET
Not for defence ‐ sugar industry
233502 Professionals Mechanical Engineer
FETHET Equity reasons
233902 Professionals Agricultural Engineer
Farm layout and infrastructure
HET Mainly in Government
311101 Technicians and trades workers
Agricultural Technician
Installation and maintenance
FETHET
234102 Professionals Agricultural Scientist
Agri research HETFET Especially in horticulture
234201 Professionals Chemist HET Processing industry
234202 Professionals Food Technologist
Food safety HACCP
FETHET Across sector
234701 Professionals Veterinarian HET Mainly in Government
311101 Technicians and trades workers
Agricultural Technician
Farm infrastructure
FET Mainly needed in government
311401 Technicians and trades workers
Chemistry Technician
FETHET EE reasons
312907 Technicians and trades workers
Chemical Engineering Technician
FET Learnership
Mainly EE reasons
312402 Technicians and trades workers
Electronic Engineering Technician
Weak stream production infra
FETHET Mainly tobacco industry
233904 Professionals
Instrument Engineer (Defence Force)
Instrument technician
FET
Occupation needed Instrument Technician (not defence force) Mainly sugar processing sector
321202 Technicians and trades workers
Diesel Motor Mechanic
FET Learnership
To include tractor mechanic
321204 Technicians and trades workers
Small Engine Mechanic
Agricultural equipment
FET Learnership
Throughout sector
AgriSETA June 2010
Agriculture Sector Analysis 42
Occupation Code
Group Occupation Critical Skills Intervention Comments
322301 Technicians and trades workers
Metal Fabricator
Artisan FET Learnership
322303 Technicians and trades workers
Welder Welder (First Class)
Artisan FET Learnership
323203 Technicians and trades workers
Fitter‐Welder Artisan FET Learnership
Mainly sugar ndash multi‐skilled
323202 Technicians and trades workers
Fitter And Turner
Artisan FET Learnership
Tobacco and sugar
323501 Technicians and trades workers
Millwright Artisan FET Learnership
Wide‐spread need
341101 Technicians and trades workers
Electrician (General)
Artisan FET Learnership
Wide‐spread need
342101 Technicians and trades workers
Air‐Conditioning And Refrigeration Mechanic
Artisan FET Learnership
Sugar pack houses cold chain
Source AgriSETA Sector Skills Plans
Supply of skills
South Africarsquos agriculture skills are produced in high schools agricultural colleges FET colleges and Higher Education institutions In high school a large cohort of learners take Agricultural Science as a subject In 2003 there were 42 Agricultural High Schools offering Agricultural Science as a subject These students and those in high schools taking the subject could progress to taking agriculture as a focus area for further education In 2004 there were 10 FET colleges offering vocationally directed agricultural programmes These FET colleges offered complete qualifications and short courses Eleven Colleges of Agriculture can offer qualifications up to degree level and 19 universities offer qualifications in Agriculture ranging from agricultural economics animal and plant sciences and horticulture among others at under and post graduate levels (Department of Agriculture 2006) While long term planning of skilling of new entrants in the sector can be done through close consultation between the sector agricultural schools and colleges FET colleges and HET institutions so that they teach relevant skills there are other avenues for training for those who are already employed in the sector for example skills programmes and learnerships There are 15 registered qualifications for the primary agriculture sub sectors Currently AgriSETA has 94 registered learnerships that can address the skills needs of the identified scarce skills These are captured in Appendix 2 AgriSETA has approved accredited a number of training providers across the country to deliver the theoretical and practical components of these learnerships These include agricultural colleges FET colleges and private providers Currently the AgriSETA has 246 registered and approved providers distributed nationally as follows
AgriSETA June 2010
Table 29 AgriSETA approved training providers (2010) Province Number of providers
Gauteng 72
(29)
KwaZulu Natal 20
(8)
Limpopo 35
(14)
North West 30
(12)
Northern Cape 3
(1)
Free State 15
(6)
Mpumalanga 14
(6)
Western Cape 26
(11)
Eastern Cape 31
(13) Total 246
The providers are small to large organisations In primary agriculture small providers appear to offer the most training in rural areas and community projects (AgriSETA 2010) Most of the operating providers will be in FET colleges and agricultural colleges The AgriSETA is unable to meet the total demands for skills across the duality of their sector There seems to be fairness in the approval of training for both permanent and casual and seasonal workers In 200809 the AgriSETA approved 559 learnerships as follows
Table 30 AgriSETA learnerships approved for grant purposes (2008‐2009)
Source AgriSETA learnership data analysis
Agriculture Sector Analysis 43
AgriSETA June 2010
Agriculture Sector Analysis 44
Provision of skills programmes in the same year attracted grants for 2 706 employees
Table 31 Participation by learners in skills programmes in the AgriSETA (200809)
Source AgriSETA Skills programmes data analysis
AgriSETA June 2010
APPENDIX 1 Skills demand in the Department of Agriculture Forestry amp Fisheries (200809)
Source DAFF Annual Report 2008‐20009
Agriculture Sector Analysis 45
AgriSETA June 2010
Agriculture Sector Analysis 46
Appendix 2 AgriSETA registered learnerships Registered Learnership NQF Level SAQA Registration NoLearnership in Agri Sales and Service 4 22 Q 220001 20 178 4Learnership Agricultural Machinery Technician 2 22 Q 220007 20 160 2Learnership in Specialist Agricultural Machinery Technician 5 22 Q 220009 21 258 5Agri Trade Processes 2 22 Q 220013 30 125 2FETC Meat Examination Applying Basic Business Principles 4 30 Q 3000 2823 164 4Further Education and Training Certificate Seed Marketing Execute Seed Trials 4 22 Q 220025 21 126 4Further Education and Training Certificate Seed Research and Development Certify as Seed Unit 4 22 Q 220027 21 121 4FETC Seed Research and Development Conduct a Field Inspection of a Seed Unit 4 22 Q 220028 20 120 4Seed Research and Development Operations Operate in a Team 3 22 Q 220020 22 121 3Seed Research and Development Operations Apply Basic Business Principles 3 22 Q 220021 22 121 3National Certificate Seed Processing and Packaging Operate in a Team 3 22 Q 220026 21 123 3Sugar Industry Technical Maintenance worker 2 22 Q 220011 39 128 2National Certificate Sugar Manufacturing and Refining Technical Maintenance 3 30 Q300003 23 146 3Further Education and Training Certificate Manufacturing Technical MaintenanceProduce Components by Performing Engineering Turning Operations
4 30 Q 3000 1321 173 4
FETC Manufacturing Technical Maintenance Produce Components by Performing Milling Operations 4 30 Q 3000 1521 173 4 FETC Manufacturing Technical Maintenance Develop and Fabricate from Complex Drawing 4 30 Q 3000 1420 173 4National Certificate in Sugar Technology 5 22 Q 220036 22 140 5Further Education and Training Certificate Sugar Processing 4 22 Q 220035 31 144 4National Certificate in Sugar Technology Processing Sugar Refining 2 22 Q 220037 28 124 2National Certificate in Sugar Technology Processing Juice Preparation 2 22 Q 220038 28 124 2National Certificate in Sugar Technology Processing Crystallisation 2 22 Q 220039 27 122 2National Certificate in Sugar Technology Processing Laboratory Practice 2 22 Q 220040 25 124 2National Certificate in Sugar Technology Processing Extraction 2 22 Q 220041 28 122 2NC Rooibos Production Applying Basic Business Principles 2 30 Q 3000 2427 130 2 NC Rooibos Processing Applying Basic Business Principles 2 30 Q 3000 2224 123 2 National Certificate Cigarette Production 3 22 Q 220046 23 121 3
AgriSETA June 2010
REFERENCES AgriSETA 2010 AgriSETA 20082009 Annual report Pretoria AgriSETA Agricultural Research Council httpwwwarcagriczahomeasppid=272 Avert South African HIV and AIDS statistics Available on httpwwwavertorgsafricastatshtm Centre for Development Enterprise 2008 Land reform in South Africa Getting back on track CDE Research No 16 DAFF 2010 Quarterly economic review of the agriculture sector Pretoria DAFF DAFF 2009 Annual report 20082009 Pretoria DAFF Department of Agriculture 2008 Strategic plan 2008 Pretoria Department of Agriculture DTI An introduction to the South African economy Available on httpwwwthedtigovzapublicationsagroprocessinghtm Eastern Cape Provincial Government Eastern Cape Provincial Growth and Development Strategy 2004 ndash 2014 Economic Commission for Africa 2009 Developing African agriculture through regional value chains Addis Ababa Economic Commission for Africa Economic Report Free State Province 2005 Provincial Growth and Development Strategy 2005 ndash 2014 GCIS 2010 SA Yearbook 200910rdquo Agriculture forestry and fisheries Pretoria GCIS Greenberg S 2010 Status report on land and agricultural policy in South Africa 2010 Institute for Poverty Land and Agrarian Studies School of Government University of the Western Cape Research report Ingelozi Management Solutions 2008 HIVAIDS in the South African agricultural sector Towards the development of a long term intervention Research report KwaZulu Natal Provincial Government 2006 KwaZulu Natal Provincial Growth and Development Strategy Limpopo Provincial Government Growth and Development Strategy 2004 ndash 2014 Mhone G (2000) Enclavity and Constrained Labour Absorbtive Capacity in Southern African Countries Geneva International Labour Office Moyo S The Agrarian question and the developmental state in South Africa In Edigheji O et al 2010 Constructing a democratic developmental state in South Africa HSRC PRESS
Agriculture Sector Analysis 47
AgriSETA
Agriculture Sector Analysis
National Treasury Republic of South Africa 2010 National Budget 2010 ndash National Budget Review 2010 Pretoria National Treasury Northern Cape Provincial Government Agriculture and agro‐processing sector strategy North West Provincial Government North West Provincial Growth and Development Strategy 2004 ndash 2014 Province of the Western Cape 2008 The Ikapa growth and development strategy White Paper SABCOHA SA Business Coalition on HIV and AIDS wwwsabcohaorg SACAU httpwwwsacauorghostingsacauSacauWebnsfHomehtmOpenForm South African Government 2010 20102011 ndash 20122013 Industrial Policy Action Plan Republic of South Africa Statistics South Africa 2005 Census of commercial agriculture 2002 Report No 110201 Pretoria Statistics South Africa Statistics South Africa 2009 Census of commercial agriculture 2007 Statistical release P1101 Pretoria Statistics South Africa Statistics South Africa 2010 General household survey 2009 Statistical release P0318 Pretoria Statistics South Africa Statistics South Africa 2010 Gross domestic product first quarter 2010 Statistical release P0441 Pretoria Statistics South Africa Statistics South Africa 2010 Quarterly labour force survey Quarter 1 2010 Statistical release P0211 Pretoria Statistics South Africa Vink N amp van Rooyen J 2009 The economic performance of agriculture in South Africa since 1994 The implications for food security Pretoria DBSA development planning division working paper series No 17 Webster E 2004 the Dual Economy from a book by Van Holdt K and Webster E Work restructuring and the Crisis of Social reproduction and 10 years of restructuring post apartheid workplaces University of Natal Press Workinfocom httpwwwworkinfocomfreesub_for_legresdatalraempassoc3htm Xingwana L 2008 Challenges and Opportunities for Land and Agrarian Reform towards 2025 Speech delivered at the Agri‐Consultation Protea Ranch Hotel Polokwane 30 July 2008
- Table of contents
- SECTION 1 THE AGRICULTURAL LANDSCAPE
- 11 Size and shape of the Agricultural sector
-
- Overview
- Distribution of agricultural production
- The structure of the agriculture sector in South Africa
- Categories of farming enterprises
- Employment trends
- Employment categories and remuneration
- Stakeholders in the Agricultural sector
-
- National government departments
- Sector representatives
-
- 12 Factors impacting development in the Agriculture sector
-
- Future sector economic growth and development
-
- South African sector growth plans (IPAP2)
- International Trade
- Global recession and rise in food prices
-
- Land reform
- Reliance on imports
- Water
- The labour market
- Consumer trends
- HIVAIDS
- Farm safety and security
- Broad-based Black Economic Empowerment
-
- Conclusions and scenarios
- SECTION 2 DEMAND FOR SKILLS
-
- AgriSETA registered employers and employee coverage
- Employee coverage in the AgriSETA
-
- 21 Skills demand
-
- The National Education and Training Strategy for Agriculture (AET Strategy)
- AGRISETA sector skills planning demand data (2008-2009)
- AgriSETA WSP analyses
-
- Skills demand in the commercial agricultural sector
-
- Skills demand forecasting by AgriSETA
- Research needs going forward
-
- SECTION 3 Skills Gaps and scarce skills
-
- Scarce skills at the DAFF
- Scarce skills in the commercial sector
- Supply of skills
-
- APPENDIX 1 Skills demand in the Department of Agriculture Forestry amp Fisheries (200809)
- Appendix 2 AgriSETA registered learnerships
-
AgriSETA June 2010
Agriculture Sector Analysis 17
predict whether the World Trade Organisation negotiations known as the DOHA Round will achieve progress in the coming years Historical evidence is that during periods of global recession developed economies become more protective not less and so the current outlook is not good Nor is it possible to predict the value of the Rand though current thinking in government is to move toward a weaker Rand to encourage exports These are two key variables that will need to be factored into the different sector growth scenarios for the future
Global recession and rise in food prices
Economic growth slowed down significantly in sub Saharan Africa and in South Africa in 2009 but there appear to be signs of recovery GDP growth in the region declined from about 6 in 2004 ndash 2008 to about 18 in 200910 GDP growth in South Africa was 16 in 2009 17and rose to 46 in the first quarter of 201018 though much of this is related to the income derived from the 2010 FIFA World Cup and may not be sustained Projections are generally for a slow revival with a set back after the slight rise resulting from the World Cup A return to the 6 levels of the 20078 could take some years The global recession reduced the demand for African exports and reduced capital flows to the region but it is anticipated that the demand for mineral resources by Asian and Western powers will result in both the expansion of exports and expanded foreign direct investment The competition between India and China for African markets is also expected to boost trade to the benefit of African suppliers South Africa is expected to particularly benefit from direct foreign investment from China and India China has already become South Africarsquos largest market for exports and supplier of imports19 Rising food prices have forced governments around the world to control prices of maize bread rice and dairy products In South Africa ldquofood price inflation between December 2005 and December 2006 averaged 788 rdquo20 Although efforts are being made to reduce barriers to poorer families in relation to basic food there has been no move to subsidise food generally This may change though the space for significant levels of support is restricted because of reduced revenue from income taxes resulting from the recession The global credit crunch and recession have meant a reduction in public expenditure and funding which has affected the agricultural sector21
Land reform
In South Africa specifically land reform has a significant bearing on food security and agriculturersquos contribution to GDP The objective of the land reform programme is to transfer 30 of agricultural land to black ownership by 2014 (deferred to 2025) to ensure more equitable access to land by historically disadvantaged people and to increase their participation in agricultural activities22 Land reform has been informed by four processes23
17 Department of Agriculture Forestry and Fisheries 2010 18 Stats SA 2010 19 Department of Agriculture Forestry and Fisheries 2010 20 Department of Agriculture Forestry and Fisheries 2010 ‐2011 Strategic Plan 21 Economic Commission for Africa 2009 22 Xingwana 2008 23 CDE 2008
AgriSETA June 2010
Agriculture Sector Analysis 18
Land restitution involving returning land or providing financial compensation to those whose land was dispossessed during apartheid
Land redistribution transferring more land to the historically disadvantaged Tenure reform modernising land tenure rules and access to land ownership and Providing financial support for the development of emerging farmers
In relation to progress with land reform by September 2009 only 69 of agricultural land (about 567 million hectares) had been transferred and a majority of the beneficiaries have not yet occupied the land due to lack of infrastructure input or technical support The following table gives an indication of the progress of land reform since the inception of the first democratic government
Table 14 Land transfers and beneficiaries ‐ 1994 to 2009
Province Redistribution and tenure Restitution Total Hectares Beneficiaries Claims Hectares Beneficiaries Hectares Beneficiaries
Eastern Cape 675 353 357 25 633 16 201 94 834 215 201 448 191 240 834
Free State 799 350 291 7 721 2 662 47 615 40 893 397 906 48 614
Gauteng 286 34 513 7 328 13 159 9 476 70 179 43 989 77 507
KwaZulu Natal 690 547 414 67 761 14 752 642 447 433 168 1 189 861 500 929
Limpopo 291 91 235 7 403 3 382 513 024 220 227 604 259 227 630
Mpumalanga 444 322 839 13 950 2 694 399 876 225 877 722 715 239 827
Northern Cape 271 952 744 2 773 3 682 539 620 100 554 1 492 364 103 327
North West 300 268 566 40 539 3 709 373 642 172 963 642 208 213 502
Western Cape 223 122 304 12 750 15 546 3 769 118 165 126 073 130 915
Total 3 979 3 043 264 185 858 75 787 2 624 303 1 597 227 5 667 567 1 783 085
Source Greenberg 2010
Achievement of the 30 land reform target is being made difficult by land prices Under the willing buyer willing seller scheme the government will need R74 billion to be able to purchase enough land While resources may be available there are suggestions of lack of capacity The Department of Rural Development and Land Reform (DRDLR) was able to spend only 31 of its land reform 200910 budget in the first six months of the financial year Going forward this Department needs to identify what the real challenges are with the pace of land reform delivery so that they can be mitigated to meet the 2025 target A priority is the retention of skills skills transfer and skills development during the transfer of land as well as retention of national food production to avoid loss of production Support for new beneficiaries of land to ensure sustained productivity is derived from two main sources of funding ndash the Broadening Access to Agriculture Thrust (BADAT) and the Comprehensive Agricultural Support Programme (CASP) CASP is a conditional grant from the Department of Agriculture Forestry and Fisheries to provincial departments to support emerging farmer development Provincial farming budgets dedicated for farmer support in Mpumalanga the Free State Northern Cape and the Western Cape have risen significantly and those in KwaZulu Natal and Gauteng have witnessed a slight increase Eastern Cape and Limpopo agricultural budgets have been steady The North West is the only province where there has been a sharp decline in the share of the budget dedicated to farmer support24
24 Greenberg 2010
AgriSETA June 2010
Agriculture Sector Analysis 19
Reliance on imports
Overall the Agriculture sector contributes positively to the balance of payments ldquoSouth Africa remains food secure The value of our exports increased by 464 from R33 656 million in 200708 to R49 278 million in 200809 During the same period the estimated value of imports rose by 12 from R34 009 million to R38 401 million resulting in a positive trade balancerdquo25
South Africa depends largely on world markets for seed production and agrochemicals Regarding seed production there are only three community seed production schemes in Limpopo and Mpumalanga being piloted with state funding Ten top large companies including two South African companies and multinationals have rights to over two thirds of registered seed varieties in South Africa Despite the dominance of genetically modified and hybrid seed in some sub‐sectors like maize sunflower and sorghum open‐pollinated varieties have been resilient in South Africa enabling the possibility of alternative seed sources not dependent on technological processes26 In relation to agrochemicals deregulation and liberalisation in the fertiliser sector led to the shutdown of local production capacity and South Africa became an importer of fertiliser for the first time in 2000 There are three large players in the fertiliser sector Sasol Nitro Yara and Omnia South Africa imports an estimated 70 of fertilisers and pesticides Fertiliser prices rose by over 200 between 2006 and 2008 but dropped somewhat after that However this hike signified the volatility of the agrochemicals industry and South Africarsquos dependency on imports and the potential risk for emerging farmers and food production of this dependence on imports as the country cannot control the prices making inputs both difficult to budget for and in many cases unaffordable The price of agrochemicals is also particularly influenced by the prices of oil and the exchange rate The general understanding in relation to job creation is that a weaker Rand will improve exports and therefore enable job creation Of course the down side of this strategy is that imports become more expensive So what may be an advantage for those sub‐sectors who are expanding their export volumes those relying on imported agro chemicals will be under increased pressure
Water
Water is both an essential and scarce resource for the agriculture sector and is being threatened by climate changes Crop production relies heavily on water and yet access to water is not being addressed in a systematic way in the land reform processes Greenberg suggests that the relationship between land reform agricultural support and water resource provision is inadequate and a way to address this could be established by linking water provision to land transfer or investing in irrigation for both commercial and resource‐poor farmers However investing in irrigation in the context of water scarcity and climate change may not be the best option What could be needed is finding ways to maximise efficiency of the 60 of South African
25 Department of Agriculture Forestry and Fisheries Strategic Plan 201011 26 Greenberg 2010
AgriSETA June 2010
Agriculture Sector Analysis 20
water used for irrigation by for example using methods such as drip or micro‐irrigation which are expensive to set up but which reduce water wastage by 5‐1027 The Department of Water Affairs is responsible for managing water supply and has to give authorisation for agricultural projects and other developments The department needs to be seen as an important stakeholder in the agricultural sector
The labour market
South Africa recorded an unemployment rate of 243 in 2009 (narrow definition) If people who are no longer actively seeking work are considered the broad unemployment rate rose from 267 to 313 illustrated in the figure below As a direct consequence of the global economic downturn in 2008 870 000 formal jobs were lost in 200928 Others have quoted a figure of over 1 million
Figure 3 Official unemployment in South Africa 2003 ‐2009
Source National Treasury 2010
Annual employment loss followed sector growth patterns with agriculture mining manufacturing and trade facing the highest job losses as their sector growth contracted Unemployment is especially a major problem among lower skilled workers and younger people Youth employment in the 15 ‐24 year age group has fallen by 219 000 (136) and 483 of people in this age group are unemployed Employment of semi‐skilled and unskilled workers has contracted by 527 000 and male employment has gone down by 550 000 (71) while that of women has decreased by 320 000 (52) The number of discouraged workers ie those no longer actively seeking work has increased from 518 000 to 17 million29 Clearly the existence of a very large pool of largely unskilled unemployed workers has an impact on the farming sector It drives wages down and creates opportunities for casualisation and the expansion of labour contract agencies and brokers In addition there are significant numbers of foreign nationals mainly from Zimbabwe and Mozambique who are seeking work and often finding it on farms and in primary processing and packaging plants There are benefits to the
27 Greenberg 2010 28 National Treasury 2010 29 National Treasury 2010
AgriSETA June 2010
Agriculture Sector Analysis 21
sector with skilled and semi‐skilled workers coming into the labour market and being absorbed into the workforce and helping raise productivity levels However at the lower skilled end of the market the existence of this pool brings further casualisation and downward pressure on wages Tensions are likely to increase and further protests either in the form of xenophobic outbreaks or actions against farmers may well increase A view often expressed by farm employers is that current labour legislation makes dismissing workers difficult and so the availability of labour without entering into contracts of employment is an attractive way of avoiding the legislation and its obligations Organised Labour is seeking to restrict these opportunities through either regulating or eliminating labour brokers and efforts are being made to regulate the use of foreign labour However for the foreseeable future the trend is for formally employed people to be reduced in number In relation to the emergent sector there will also be a reluctance to enter employment contracts with workers The fact that many households are engaged in some form of largely unpaid agricultural work means that there is significant casual work dating back many years Helping change this situation into one where casual or unpaid jobs are transformed into formal jobs with regular wages will take time It is also likely that as some emergent farms become established they will act similarly to established farms and institute a form of casual labour rather than expanding a workforce for which they would have to take a level of responsibility From an AgriSETA perspective these labour market trends mean that whilst levy income can be directed at a relatively small labour pool one that is manageable in terms of planning and implementation the size of the informal casual and unemployed labour force in the sector ‐ for whom no levy is paid and who have no employer to plan for their skills needs ndash is very large and its needs almost unlimited Clearly the relationship with the National Skills Fund (NSF) becomes critical in respect of the entire non‐levy income sector Again the level of support available from non‐levy income sources will be an important variable in looking at future sector skills development scenarios
Consumer trends
South Africa currently produces enough food to meet the needs of its population However consumption of three main staples maize wheat and vegetables has been volatile since 1985 and remains below 1990 levels Consumption of maize and vegetables by South Africans is 17 and 32 less respectively than in 198530 The main reasons for this lie in the growing levels of poverty and the difficulties that families have in purchasing nutritious food Whilst government has increased the levels of social grants and increased the number of people receiving grants to around 13 million the incomes of poor families have been badly hit by a range of factors including job losses and rises in food prices The approximately 1 million people who lost their jobs in 20089 meant a loss of income for many millions of dependents Rises in food prices have also had a disproportionate impact on the poor Whilst food is available it is often not accessible to families on the income levels that they have to manage within The result is that less and less nutritious food is purchased which in turn impacts on the ability of farmers to sell their products locally 30 Greenberg 2010
AgriSETA June 2010
Agriculture Sector Analysis 22
Whilst there is no evidence that government will reduce its efforts in relation to poverty relief and social benefits including such programmes as school feeding schemes and food parcels during periods of drought the state of public finances may not enable to support the poverty that grips many rural areas If real income levels for the poor were to rise it could have a significant impact on the economy of the agricultural sector Equally an improvement in the rural economy with increased agricultural production and jobs would dramatically impact on the capacity of people to buy nutritious food Achieving a positive growth path in rural areas is a huge challenge for government and one that is key to governmentrsquos Medium Term Strategic Framework and Industrial Policy Action Plans
HIVAIDS
South Africa has a high prevalence of HIV and AIDS The HIV prevalence among people aged two and above was estimated at 109 in 2008
Table 15 Estimated HIV percentage prevalence by age group (2002 ndash 2008)
Age 2002 2005 2008 Change
Children (2‐14 years) 56 33 25 ‐31
Youth (15‐24 years) 93 103 87 ‐06
Adults (25 and older) 155 156 168 13
15‐49 year olds 156 1692 169 13
Total (ages 2 to 49) 114 108 109 ‐05 Source Avert 2009
The table above shows that HIV prevalence is highest amongst those aged 25 years and older Given youth labour market analyses which point to people from previously disadvantaged backgrounds mainly African males accessing formal employment for the first time at age 25 ‐27 this population can be held to represent people in employment Research31 has estimated that by 2020 the pandemic will have claimed at least 20 of employees in the agricultural sector Southern Africa
in
HIV and AIDS have significant ramifications in the agricultural sector for both commercial farming and subsistence farming The implications include
bull Decrease in cultivated land bull Focus on less labour intensive crop and animal production bull Decrease in womenrsquos agricultural productivity as they take on a more care giving role bull Loss of skills bull Increase in absenteeism from work bull Decrease in daily work outputproductivity because workers are weaker from infections
There are suggestions that the impact of the pandemic in South Africa demands sectoral intervention although this may be difficult in the agricultural commercial sector as
bull Seasonal workers who seem to be more vulnerable to infection because of their low socio‐economic status are not in one place long enough for care programs Further
31 Ingelozi Management Solutions 2008
AgriSETA June 2010
Agriculture Sector Analysis 23
farmers and employers may not feel responsible for seasonal workers in the same way they would invest in their permanent employees
bull There may be uncertainty around land reform which may put HIV intervention on farms on the back burner
bull There are no policies that enforce HIV education and care on farms in the same way that legislation like BEE does for ownership As a result HIV intervention may be left to goodwill and employers may feel it is more important to comply with issues that are monitored
Farm safety and security
South Africa has been plagued by unacceptably high levels of violent crime and murder for many years now Farms have experienced this and those living on farms feel and are extremely vulnerable The South African Chamber of Commerce and Industry (SACCI) has argued that
Using the nominal GDP figure for 2009 of R24 trillion a 322 percent contribution of agriculture to GDP and an estimate of 39982 farms (as at 2007) in South Africa the cost of a murderattack on a farm to the economy was R1932869 per annum
SACCI acknowledges that this estimate is flawed as it does not take into consideration the fact that farming units contribute differently to GDP and that not every attack or murder contributes to farm shut down or loss of productivity However if not addressed these attacks could lead to loss of farming sectors as farmers migrate to lsquosaferrsquo regions This will affect employment and GDP contribution of the sector The need for safety and security on farms may also shift farmersrsquo focus in skills development to include personnel who have skills in safety and security
Broad‐based Black Economic Empowerment
The aim of the AgriBEE Charter (gazetted in 2008) is to increase the involvement of black business in agriculture through ownership and control as executives and senior managers of new and existing agricultural businesses The extent to which AgriBEE is transforming the sector is not known as it is too early to tell but a recent survey conducted by ABC and the IDC showed that among the ABC respondents in 2007 46 of enterprises were busy constructing a BEE strategy and 46 claimed to be implementing a BEE strategy A survey of the dairy industry in the Western and Eastern Cape in 2008 showed that only 6 of firms had a BEE strategy in place It also seems from survey data that companies are focusing on the skills development and socio‐economic aspects of BEE rather than on ownership32 It would appear that although there have been some significant BEE purchases of viable farms and some employee empowerment projects including some quite high profile ones in the Cape Winelands the extent of ownership change had been limited One of the factors is the very high level of single person or family ownership in the agricultural sector BEE is more straight forward in the corporate world where shares can be exchanged For a family business it is a matter of selling off part or all of the land and the tendency is to sell off those areas of the farm that are expendable from a business sustainability perspective
32 Greenberg 2010
AgriSETA June 2010
Whilst there is discussion in government about the ending of the ldquowilling buyer willing sellerrdquo concept the Constitution itself provides for property rights and so although some pressure may be exerted through legislation and regulation the extent and speed of change may not be fast The mechanisms for encouraging the transfer of significant levels of ownership have not yet been created The focus of the SETA is therefore likely to be more the beneficiaries of land reform and emergent farmers though projects of a BEE nature can be targeted as they arise
Conclusions and scenarios It is useful when looking at possible scenarios to examine the key variables or uncertainties and to project how variations one way or the other will have an impact on the development and growth of the sector From the sector analysis and factors that are contributing to change in the sector there are some key factors that seem to emerge First appears to be the economy and related issues of the labour market and the challenges of labour absorption in an enclave economy These factors determine on the one hand whether there will be growth and development and on the other whether such improvements will result in improved employment opportunities and the creation of a virtuous cycle of development Second is the role of the state and the various government departments whose plans and work impact on the agricultural sector Related to this is land reform that is inevitably driven by the state and not the owners of land or the landless The view expressed by many engaged in agrarian reform is that the state must play a significant role It becomes clear that a successful agricultural enterprise requires a number of factors to be in place to be successful These include access to land (Department of Rural Development and Land Reform) agricultural support within a supportive agricultural framework (Department of Agriculture Forestry and Fisheries) access to consistent water supply (Department of Water Affairs) access to finance (Department of Trade and Industry various state agencies) conducive labour market regulation (Department of Labour) sound industrial policy (Department of Trade and Industry) economic planning and macro policy (Department of Economic Development National Treasury) and appropriate education training and skills development (Department of Higher Education and Training the Human Resources Development Council NSA and the SETA) There are other government departments as well as provincial and municipal structures that also play a role The following analyses show how the four variables
economic growth and development role of the government labour market changes and land reform)
impact positively or negatively on the growth of the sector and the demand for skills
Agriculture Sector Analysis 24
AgriSETA June 2010
Agriculture Sector Analysis 25
HHIIGGHH GGRROOWWTTHH SSCCEENNAARRIIOO
The economics of the sector Role of government
The economy in SA and globally continues to revive albeit slowly for the next few years
Roles and integration of national government departments are clarified Specific functions are agreed processes put in place and personnel appointed with the required skills
International trade agreements are still weighted infavour of US and EU but progress is being made and specific blockages are addressed in bilateral talks
The roles of Departments (DWA DAFF DRDLR DoL DTI DED DHET) are clarified with appropriate joint plans and coordinating structures
The rural economy gradually improves with the buying power of the poor increasing and more stable markets created for local produce
For each of the functions agreed in each of the related departments appropriate structures and systems are put in place and staff trained
Exports increase in key areas identified in IPAP 2 and the Rand exchange rate stabilises at a level not too much different than it is today
Specific capacity is put in place at local level to support implementation of land reform and rural development
There is a growing understanding of the concept of dualism and the need to intervene with labour absorption and development mechanisms
Land claims are all finally settled and ownership and tenure is resolved There is a serious drive to establish effective agricultural enterprises
An understanding is reached on the role of agencies and labour brokers and abuse is curbed
The willing buyer willing seller approach is resolved and enables viable land to become black owned
Some relaxation of labour market regulations are agreed that maintain some minimum standard of employment but assist absorption
Land transfer to black and emergent farmers is done in a manner that integrates then into the supply chains of the sector
Mechanisms are found to address skills needs in the context of casual and seasonal work patterns
Financing of land reform and transfer is done on the basis of agreed development plans including skills
Labour market reform Trajectory of land reform LLOOWW GGRROOWWTTHH SSCCEENNAARRIIOO
The economics of the sector Role of government departments The economy in SA and globally stagnates at current levels and the economy struggles to pick up after the temporary 2010 World Cup boost
A lack of purpose at government level means limited progress for another five years Land reform remains a commitment without a plan
International trade agreements are still weighted infavour of US and EU and protectionism increases as a result of the global recession
The roles of Departments (DWA DAFF DRDLR DoL DTI DED DHET) are unclear and there is no proper co‐ordination
SArsquos Gini coefficient continues to worsen with rural poverty increasing and local economies declining
There is a lack of effective structures systems and processes to implement policy across departments
Rand volatility causes problems for importers and exporters Well established markets are maintained but exports decrease
At local level the decline in the agricultural extension officer functions continues and limited practical support is available
Understanding of the rural economy is so diverse that stakeholders cannot agree the problem let alone the solution to low absorption levels
Land claims take too long and land reform processes leave potentially productive land poorly developed and managed
Casual labour and labour brokers remains an issue of dispute Confrontation results in bitterness and resentment
The impasse caused by a rigid interpretations of property clauses in the Constitution continues to stall achievement of the 30 black ownership target
Labour market regulation continues to be a contributing factor to reducing levels of employment
Black owned farms find it difficult to become part of supply chains and are unable to perform adequately
Unstable employment patterns in the sector make skills interventions difficult to manage and largely ineffective
Financing of land reform and land transfer continues to be wasted as it is not tied to the building of appropriate capacity
Labour market reform Trajectory of land reform
AgriSETA June 2010
These analyses can be translated into four potential growth and development scenarios for the agricultural sector which are based on the requirements for a strong development state Scenario 3 Weak government support
and sound economy
Econ
omic fa
ctors glob
ally n
ationa
lly and
locally
Scenario 1 Integrated government support and sound economy
The economic upturn triggered by the World Cup continues and globally things improve enabling an expansion of exports The government because of a lack of integrated policy planning and implementation provides limited support for sector development The gains go to the well established enterprise owners with few gains for emerging farmers and local communities
Government departments coordinate their efforts to achieve maximum impact There are favourable economic conditions that create opportunities for advance Within this positive environment the role of the AgriSETA becomes a central component of a comprehensive strategy for growth and skills interventions are targeted to achieve maximum effect Results in growth in sustainable enterprises and expanded employment opportunities
Government policy and support Government policy and support
Combination of disjointed government policy planning and a weak and increasingly marginalised rural economy Economic conditions result in unsustainable farming conditions and employment declines along with productivity Food shortages and the lack of development in rural areas leading to increasing social tensions A vicious cycle develops with the sector going into long term decline
Government departments coordinate their efforts to achieve maximum impact However economic conditions hamper progress Efforts by the AgriSETA are undermined by poor labour absorption and job insecurity Some significant successes are recorded including some NSF funded projects that result in sustainable enterprises A platform is laid for future improvements when the economic conditions improve
Scenario 4 Weak state and economy Scenario 2 Strong state but weak
economy
Agriculture Sector Analysis 26
AgriSETA June 2010
Agriculture Sector Analysis 27
SECTION 2 DEMAND FOR SKILLS
AgriSETA registered employers and employee coverage
In 2009 17 234 employers were registered with the AgriSETA comprising 15 394 small employers (less than 50 employees) 1 202 medium sized employers (50 ‐ 149 employees) and 638 large employers (more than 150 employees)
Considering that there are around 40000 commercial farms33 the 17 234 employers represent around 43 of commercial farms Notwithstanding changes in the sector as a result of land reform and sector shrinkage this is a sizable proportion and is held to be sufficiently representative for the purpose of skills development planning However this paints an incomplete picture It understates the representative nature of large enterprise registered with the SETA and overstates the representative nature of small registered enterprises 4 175 (242) of the enterprises are levy paying members Further only 1 673 (11) workplace skills plans (WSPs) were submitted
Table 16 Registered employers by size and sub‐sector Sub‐sector Description
Employers Small Medium Large
CoffeeTea Processing and marketing of coffee and tea including coconuts cocoa nuts olives dates etc
33 4 3
Fibre Grading ginning packing of wool and cotton raw material 1 676 16 18
Fruit Fruit packed in cartons fruit juice concentrate drummed and fruit juice in container ready for consumption
271 36 57
Fruit exporters and importers 6 0 1
Grain
Manufacture of grain mill products and starches 119 5 7Handling and storage of grain 67 7 23Wholesale amp retail trade in Agricultural machinery 213 9 4Sale and distribution of Agricultural raw materials and other farming inputs
182 9 3
Milling
Manufacture of flour and grain mill products including rice and vegetable milling grain mill residues
120 15 11
Manufacture of prepared animal feeds 110 19 0Manufacture of pet foods 42 9 0Manufacture of starches and starch products 7 1 1
Pest control
Pest Control 209 4 0
Poultry Poultry and egg production including the slaughtering dressing and packing of poultry
305 49 37
Primary
Growing of Cereals and other crops (not elsewhere classified) 902 160 34Growing of Vegetables Horticultural specialties nursery products
943 120 72
Growing of Vegetables Horticultural specialties (Including Ornamental Horticulture) and nursery products
11 5 0
Sugar plantation including sugar cane and sugar beet etc 9 4 2
33 SARS statistics 2007
AgriSETA June 2010
Agriculture Sector Analysis 28
Sub‐ Description Employers Growing of fruit nuts beverage and spice crops 1795 255 143Farming of cattle sheep goats horses asses mules and hinnies Dairy farming
2 252 59 18
Other animal farming production of animal products (NEC) 433 25 12Ostrich farming 5 0 0Game farming 16 0 0Growing of crops combined with farming of animals (Mixed farming)
2 920 256 109
Growing of coffee and tea including coconuts cocoa nuts olives dates etc
2 0 0
Agricultural and animal husbandry services except veterinary activities
438 22 9
Other animal farming (not elsewhere classified) 11 1 1Growing of trees as second crop by farmers 126 18 4Fishing operation of fish hatcheries and fish farm 913 10 6
Red meat
Production and animal products (not elsewhere classified) 6 0 0Slaughtering dressing and packing of livestock including poultry and small game for meat
317 40 17
Production sale amp marketing of Agricultural by products (eg bones hides)
61 2 0
Slaughtering dressing and packing of livestock including small game for meat and processing of ostrich products
2 1 0
Wholesale trade in Agricultural raw materials and livestock 193 7 10Transport of livestock as supporting activity 224 0 0Agricultural and livestock research 215 9 3
Seed Seed production and marketing 149 12 6
Sugar Manufacture of sugar including golden syrup and castor sugar
45 5 21
Tobacco Processing and dispatching of tobacco 46 8 6 TOTALS 15 394 1 202 638Source AgriSETA WSP data
The largest number of registered small and medium enterprises are found in the mixed farming sub‐sector while most large enterprises are in the growing of fruit nuts beverage and spice crops sub‐sector
Employee coverage in the AgriSETA
Collectively the 17 234 employers registered with AgriSETA employed a total of 239 076 employees This represents 39 of the agricultural labour force in 2009 The 1 673 employers who submitted WSPs in 2009 employed 97 898 employees representing 41 of the total number of people employed by registered employers While the number of registered employers submitting WSPs is small (11) they employ a sizeable number of employees and the percentage of employees provides a statistically significant sample The data for larger enterprises is statistically much more representative than that for small enterprises
AgriSETA June 2010
Table 17 Number of employees of registered employers by sub‐sector
Sub‐sector
Sub‐sector description Employees
CoffeeTea Processing and marketing of coffee and tea including coconuts cocoa nuts olives dates etc
483
Fibre Grading ginning and packing of wool and cotton raw material 6 539
Fruit Fruit packed in cartons fruit juice concentrate drummed and fruit juice in container ready for consumption
27 661
Fruit exporters and importers 212
Grain
Manufacture of grain mill products and starches 133Handling and storage of grain 18 303Wholesale amp retail trade in Agricultural machinery 795Sale and distribution of Agricultural raw materials and other farming inputs 2 898
Milling
Manufacture of flour and grain mill products including rice and vegetable milling grain mill residues
3 634
Manufacture of prepared animal feeds 731Manufacture of pet foods 160Manufacture of starches and starch products 105
Pest control
Pest Control 119
Poultry Poultry and egg production including the slaughtering dressing and packing of poultry
19 187
Primary
Growing of Cereals and other crops (not elsewhere classified) 10 104Growing of Vegetables Horticultural specialties and nursery products 37 799Growing of Vegetables Horticultural specialties (Including Ornamental Horticulture) and nursery products
195
Sugar plantation including sugar cane and sugar beet etc 220Growing of fruit nuts beverage and spice crops 47 043Farming of cattle sheep goats horses asses mules hinnies Dairy farming
3 382
Other animal farming production of animal products (NEC) 4 203Ostrich farming 0Game farming 0Growing of crops combined with farming of animals (Mixed farming) 28 722Growing of coffee amp tea including coconuts cocoa nuts olives dates etc 0Agricultural and animal husbandry services except veterinary activities 970Other animal farming (not elsewhere classified) 513Growing of trees as second crop by farmers 1 294Fishing operation of fish hatcheries and fish farm 1 589
Red meat
Production and animal products (not elsewhere classified) 0Slaughtering dressing and packing of livestock including poultry and small game for meat
5 128
Production sale amp marketing of Agricultural by products (eg bones hides) 116Slaughtering dressing and packing of livestock including small game for meat and processing of ostrich products
0
Wholesale trade in Agricultural raw materials and livestock 1 697Transport of livestock as supporting activity 0Agricultural and livestock research 534
Seed Seed production and marketing 2 127Sugar Manufacture of sugar including golden syrup and castor sugar 10 478Tobacco Processing and dispatching of tobacco 2 002 Total 239 076
Agriculture Sector Analysis 29
AgriSETA June 2010
Agriculture Sector Analysis 30
Source AgriSETA WSP data
According to the WSP analysis the sub‐sector for the growing of fruit nuts beverage and spice crops employed the largest number of people In six sub‐sectors there are employers who do not employ workers These are probably family based organisations where family members help in the business without drawing a salary These are in transport and livestock research slaughtering dressing and packing of livestock including poultry and small game for meat growing of coffee and tea including coconuts cocoa nuts olives dates etc ostrich farming and game farming
Table 18 Employee distribution by province Province Employees Percentage
Eastern Cape 18 844 192 Free State 1 946 20 Gauteng 2 788 28 KwaZulu‐Natal 5 416 55 Mpumalanga 8 062 82 North West 3 290 34 Northern Cape 5 436 56 Limpopo 1 730 18 Western Cape 50 386 515 Grand Total 97 898
Source AgriSETA WSP data
Of those submitting WSPs registered employers in the Western Cape employed the largest number of people while employers in Limpopo employed the least number of employees Free State has a small number of employees covered by WSPs submitted to the SETA whereas Eastern Cape with a relatively small number of registered farms has a very large number of employees on farms submitting WSPs Given this variance between provinces the use of WSP data for extrapolation purposes must be viewed cautiously
2009 WSP equity information was only provided for about a quarter of employees (25 637 or26)34 No information was available from the WSPs on non‐South Africans working on commercial farms
Table 19 Equity profile from 2009 WSP data African Coloured Indian White
Totals M F D M F D M F D M F D
8 040 5 785 38 5 097 5 228 24 22 25 0 811 556 11
580 417 03 493 505 02 468 532 00 589 403 08 13 863 10 349 47 1 378 25 637541 404 02 54 100
Total EquityTotal Male Total Female Total Disability
13 970 11 594 73 545 452 03
Source AgriSETA WSP data
Using currently available data it is not possible to provide disaggregated employment data by sub‐sector This will require a small change in the way that gender race and disability data is
34 Some employers did not complete race and gender information when giving their employment profiles
AgriSETA June 2010
codified during WSP data‐capturing including allocation by sub‐sector What can be stated is that employment of males is more dominant than that of women and more Africans are employed in the sector than other groups Employment of people with disabilities is below 1
21 Skills demand
The National Education and Training Strategy for Agriculture (AET Strategy)
The AET Strategy developed by the Department of Agriculture Fisheries and Forestry (in consultation with various key stakeholders in the agricultural sector) highlights priority skills needs and constraints within the sector and categorises needs within the following 5 broad areas
1 Agricultural production ndash requesting that the past focus on a narrow band of commodities (relevant mainly to the commercial sector) and related research be expanded to address the needs of small‐scale and subsistence farmers (eg more focus on mixed farming and rural livelihood sustainability skills)
2 Agricultural engineering ndash with specific focus to be placed on technologies suitable for small‐scale farmers (eg relevant and post‐harvesting techniques related to processing and storage of produce) ndash to address this need the scarcity of agricultural engineers requires attention
3 Agricultural economics ndash a critical need was identified for general agricultural economic skills (ranging spectrum of farm planning farm management enterprise management marketing finance etc) ndash with the need to training both farmers and extension officers in such fields
4 Agricultural development ndash a specific need was identified to develop agricultural extensionists in supporting especially emerging and small‐scale farmers over the full spectrum (a need exists for both new curriculum in the training of new extensionists and the re‐training and upgrading of existing officers)
5 Veterinarians ndash the need to develop state veterinarians in order for the state to perform its role and function (particularly in its preventative monitoring and regulatory role and function)
AGRISETA sector skills planning demand data (2008‐2009)
The following section reflects initial research on skills demand in the Agricultural sector arising from the sector analysis (section 1) previous AGRISETA skills demand research for Sector Skills Planning during 2005‐2009 and analysis of WSP data from 2009 With the introduction of the Organising Framework of Occupations and agreement on definitions for scarce and critical skills in 200506 the AGRISETA undertook an extensive research and consultation processes to determine skills development priorities for the sector The research methodology employed was based on the a four dimensional topology for establishing and evaluating skills needs illustrated in the figure below
Agriculture Sector Analysis 31
AgriSETA June 2010
Agriculture Sector Analysis 32
The identification and prioritisation of skills needs was also undertaken from a key stakeholder and beneficiary perspective Consideration was given to needs of the following groups
bull The unemployed ndash helping them gain andor regain entry to the labour market bull The economically inactive ndash helping them to become economically active bull School leavers ndash helping them gain access to further education and training opportunities
and thus facilitating their entry to the job market bull Entrants to the job market ndash facilitating employment and integration into the work culture
and work ethic (improving the employability of an individual) bull Those currently employed in the sector ndash increasing their competency and opportunities
for advancement creating a career path and offering continued job security enhancement of value adding to the sector improving their prospects for better employment opportunities
bull Organisations and enterprises within the sector ndash making sure that skills development and knowledge creation occurs in such a way as to improve the sectorrsquos viability and allowing companiesenterprises to become more sustainable and profitable along the way improving productivity competitiveness and innovation within organisations
In organising and reporting the identified priority skills development needs (200809) the following structuring approach was followed
Tier 1 The four categories of needs as per the Topology presented above were used for the identification evaluation and grouping of needs
Pay conditions
Image
RECRUITMENT DIFFICULTY
SKILLSGAP
SKILLSSHORTAGE
LABOURSHORTAGE
Firms experience difficulty recruiting This does not necessary imply a skills shortage ndash may indicate a poor image remuneration etc
Those currently in work do not have the requisite skills set to carry out their job to an optimum standard
Required skills are in short supply when compared with the demand across the whole labour market
Regardless of skills levels a situation exists where there is simply not enough supply of labour to meet demand
Pay conditions
Image
RECRUITMENT DIFFICULTY
SKILLSGAP
SKILLSSHORTAGE
LABOURSHORTAGE
Firms experience difficulty recruiting This does not necessary imply a skills shortage ndash may indicate a poor image remuneration etc
Those currently in work do not have the requisite skills set to carry out their job to an optimum standard
Required skills are in short supply when compared with the demand across the whole labour market
Regardless of skills levels a situation exists where there is simply not enough supply of labour to meet demand
Figure 4 Topology for identifying skills development priorities
Source AGRISETA SSP Annual Update August 2009
AgriSETA June 2010
Tier 2 Within each of the first tier groupings needs were further broken down and organised per target group At this second level needs were grouped by
o General skills development needs (cross‐cutting over different target groups) o Needs experienced by small scale farmers (this group included subsistence
farmers new emerging land reform beneficiaries and small‐scale AgriBEE farmers) o Needs within the commercial agricultural sector (per sub‐sector groupings where
specific needs for such were identified ndash both on‐farm needs and within the secondary sub‐sector or related agri‐businesses)
o Needs of the Department of Agriculture Fisheries and Forestry (DAFF) To further guide and direct the identification and selection of scarce and critical skills the following factors or criteria that could reflect the importance (impact and effect) of a skills shortages were developed as an identification framework
1 Basic Skills Development Promoting basic literacy and numeracy and raising the base level of education for the sector improving the work and livelihood of existing workers
2 Employability Making the employee more employable by improving the fit between their skills and the sector needs
3 Enterprise Viability Improving the capability and feasibility of the enterprise by increasing its effectiveness of or possibilities for profit generation etc
4 Enterprise Sustainability Allow enterprises to survive and grow over an extended period of time without compromising the value of renewable resources thereby creating long‐term meaningful employment for larger numbers of people
5 Sector Growth Enabling the sector to develop or pursue new opportunities or improve the effectiveness of current operations
6 Sector Competitiveness Enabling the sector to compete more effectively in the international arena improving market intelligence and interpretation productivity cost efficiency etc
7 Human Resource Development Capacity Improving the access to quality provision of training to the agri sector
Based on this research and consultation framework the following skills development needs and priorities were identified
Agriculture Sector Analysis 33
AgriSETA June 2010
GENERAL NEEDS SMALL‐SCALE FARMER
NEEDS COMMERCIAL SECTOR
NEEDS DAFF NEEDS
RECRUITMENT RELATED SKILLS NEEDS Primary agriculture is the entry point into the world of work for large numbers of people in rural areas However the sector has negative connotations amongst sections of the youth and in parts of the country and is viewed as a last resort for some in the search for employment) The effect is that despite an unemployment rate of approximately 26 (now over 30) farmers find it difficult to recruit workers to meet seasonal demands This has resulted in the government approving the contracting of foreign labour to meet such temporary needs (workers are recruited mainly from Zimbabwe and Mozambique)
Labour in this farming sector is provided primarily by family members and no real recruitment constraints can be identified
The agricultural sector still manages to attract technical and management skills as it is perceived to include a better lifestyle and there is a strong tradition of agriculture in SA Increasing crime related security risks associated with farming may have a negative impact
The Department has identified a number of occupations in which they are experiencing long‐term vacancies Some of these result from a general shortage of such skills in SA while others arise from the inability of the public sector to compete with the private sector (less favourable employment image working conditions and equity considerations) Priority vacancies include Veterinarians Agricultural
Engineers Plant Health
Specialists Agricultural
Statisticians Plant Health Pest Risk
Analysts ICT Specialists Agricultural
Economists Agricultural Food and
Quarantine Technicians
Agro‐meteorologists Pasture Scientists Plant Production
Specialists Specialised Food
Analysts SKILLS GAPS RELATED NEEDS
bull Low literacy and numeracy levels ndash both amongst workers within the sector at large and at ownermanager level in many of the small‐scale farming
bull Farm management
Farm Management (Mainly owners managers) bull Farm management amp
entrepreneurship bull Resource
management and record keeping
bull Financial planning
A critical constraint is the poor educational levels of a large proportion of the labour force in the sector demanding a considerable effort and investment in ABET and other life skills
A particularly big need exists for skills upgrading amongst Extension Officers ndash particularly with regard to redress the historical neglect of small‐scale farmers and resource strapped farmers
Agriculture Sector Analysis 34
AgriSETA June 2010
Agriculture Sector Analysis 35
GENERAL NEEDS SMALL‐SCALE FARMER
NEEDS COMMERCIAL SECTOR
NEEDS DAFF NEEDS
skills (and general management skills in other agricultural businesses) coupled with a business orientation and entrepreneurship skills
bull A general need to increase compliance with environmental occupational health and safety animal welfare produce safety and hygiene standards regulations and requirements (local and international standards)
and management bull Project management bull Business plan
development Marketing and processing bull Processing and
packaging bull Transport
management bull Marketing produce
including branding bull Planning for
marketing bull Knowledge of
markets Technical knowledge and skills bull Production
management (related to specific enterprise)
bull Demonstration of production techniques
bull Natural resources management
Mechanical knowledge bull Farm maintenance bull Repairs of machinery
and equipment bull Electrical
maintenance and installation
programmes Need for improved management skills and relevant technological knowledge for increasing productivity levels and improved production methods Rising importance for environmentally responsible production and processing management systems Rising competitive and international markets increases need for business and marketing abilities among owners and managers Increasing requirements for compliance with environmental health and safety and international trade standards Information technology although not a priority is increasing in importance Business management ability is becoming increasingly important as more farmers are making decisions about restructuring their businesses diversification and developing supplementary sources of income
Critically improved farm management and business skills within an agricultural context to support the majority of BEE and emerging farmers Skills upgrading requirements for existing Extension Officers include bull Agricultural
economics bull Agricultural
management bull Business and
financial management
bull Technical and production related skills including o Animal husbandryo Poultry o Crop production o Horticulture
SKILLS SHORTAGES Generally SA has a shortage of entrepreneurs and people who have the business acumen drive motivation and
The profile of these farmers reflects a large contingent of older and less educated people who are generally less flexible tend to stick to
The commercial agri sector will increasingly have to compete in the global market and the ever increasing need to increase productivity to
DAFF us experiencing problems are especially sourcing people in specialised science related fields (learning fields experiencing few
AgriSETA June 2010
Agriculture Sector Analysis 36
GENERAL NEEDS SMALL‐SCALE FARMER
NEEDS COMMERCIAL SECTOR
NEEDS DAFF NEEDS
perseverance to become a successful farmer Given the high risks involved in the agricultural sector (natural elements outside onersquos control) the agri sector does not compete successfully for this ldquoscarce resourcerdquo Moreover as with other professional and skilled occupations there is a tendency for younger qualified people to move to urban areas
known practices and are less likely to experiment with new technology Within this target group candidates with good entrepreneurial ability are scarce There is a perceived shortage of Agricultural Extensionists and advisors to assist this target group However a large pool of young unemployed graduates exists who could assist such emerging farmers if they were mobilised and made accessible to farmers Similarly the potential pool of retired commercial farmers who could serve as mentors to this target group
remain profitable and viable it can be stated that many of the existing farmers and managers owners lack business management and entrepreneurial orientation Equity policy and the need to become BEE compliant requires that commercial enterprises appoint and develop black owners directors managers Changing local and global consumer preferences require farmers to change traditional farming methods and practices Skills and knowledge requirements include bull Global food and
international quality standards
bull Product traceability requirements
bull Organic produce and products
Specific occupations identified as being in short supply are
bull Production Managers (food processing)
bull Product specialisation to international specifications (research skills)
bull Forklift drivers heavy vehicletruck drivers and mobile plant operators
bull Experienced and competent artisans (millwrights electricians fitters
enrolments andor pass rates at HET institutions with the result that too few qualified persons come onto the labour market) Examples of such skills shortages identified by the Department include Agricultural Engineers bull Plant Health
Specialists (Nematology Entomology Plant Pathology)
bull Statisticians (specialised agricultural knowledge)
bull Plant Health Pest Risk Analysts
bull Agricultural Economists (production and resource economists)
bull Agricultural Food and Quarantine Technicians
bull Agro‐meteorologists Early warning Specialists
bull Pasture Scientists bull Plant Production
Specialists (eg ornamental crops hydroponics)
bull Specialised Food Analysts (pesticide residue analysts processed food and dairy analysts wine and spirit analysts)
AgriSETA June 2010
Agriculture Sector Analysis 37
GENERAL NEEDS SMALL‐SCALE FARMER
NEEDS COMMERCIAL SECTOR
NEEDS DAFF NEEDS
and turners bull Agricultural
Equipment Technicians
bull Pest and weed controllers
bull Horticultural specialists
LABOUR SHORTAGES AND RELATED SKILLS NEEDS Given an employment rate of some 26 (2009 currently estimated at over 30expanded definition) per definition there cannot be a labour shortage It is however difficult for people who have never worked before to integrate into the agricultural sector workforce Coupled with an aging workforce (30‐60 being over 40) means that most agri enterprises will within the next 5‐10 years be looking at replacing a large proportion of their workforce There could be an insufficient pool of people willing and able to participate The impact of HIVAIDS is also not always factored in to understanding the diminishing pool of resources available Labour shortages have been reported within selected geographical areas and in particular occupations Examples include cane cutters in the sugar industry chicken catchers in the poultry industry pickers in the fruit industry and animal handlers in feedlots as well as dairy parlour workers It is however believed that these shortages may reflect a recruitment problem as a result of the very harsh working conditions and the relatively poor remuneration (which makes these occupations unpopular) At present such ldquoshortagesrdquo are addressed through contracting labour from neighbouring countries
AgriSETA WSP analyses
Skills demand in the commercial agricultural sector
Information for demand for skills from WSP data is available for 1 673 employers who submitted their WSPs for the 200910 period The table below shows data on sub‐sector WSP submission relative to size of the sub‐sector as well as subsector data from all registered organisations and those who submitted WSPs Data for registered employers shows that there were 239 076 employees employed by the 17 234 registered organisations As previously stated 97 898 employees were employed by the organisations submitting WSPs This constitutes 41 of employees employed by registered organisations
Table 20 Employment and sub‐sector data drawn from WSP analyses
Sub‐sector
All Re
gistered
Employers
Small employers (0‐49)
Med
ium and
large
employers (50+)
Total W
SPs received
Total W
SPs received
as of
all registered em
ployers
WSP
received med
ium and
large orgs
WSPs received
as of
med
ium amp large em
ployers
WSPs received
small
employers
WSPs received
as of small
enterprises
EmployeesPer
Profile
CoffeeTea 40 33 7 9 23 5 71 4 12 483 Fibre 1 710 1 676 34 34 2 22 65 12 07 6 539
AgriSETA June 2010
Agriculture Sector Analysis 38
Sub‐sector
All Re
gistered
Employers
Small employers (0‐49)
Med
ium and
large
employers (50+)
Total W
SPs received
Total W
SPs received
as of
all registered em
ployers
WSP
received med
ium and
large orgs
WSPs received
as of
med
ium amp large em
ployers
WSPs received
small
employers
WSPs received
as of small
enterprises
EmployeesPer
Profile
Fruit 371 277 94 162 44 76 81 86 31 27 873 Grain 648 581 67 77 12 48 72 29 5 22 129 Milling 335 279 56 61 18 35 63 26 9 4 630 Pest Control 213 209 4 8 4 2 50 6 3 119 Poultry 391 305 86 66 17 46 53 20 7 19 187 Primary 12 121 10 776 1 345 1144 9 513 38 631 6 136 034 Red meat 1107 1 018 89 70 6 45 51 25 2 7 475 Seed 167 149 18 24 14 13 72 11 7 2 127 Sugar 71 45 26 13 18 10 38 3 7 10 478 Tobacco 60 46 14 5 8 3 21 2 4 2 002
Totals 17 234 15 394 1 840 1 673 10 818 44 855 16 239 076
Source 1 AgriSETA WSP 2009 data
Only 10 of all registered employers submitted WSPs for the 200910 period Of these 49 were medium and large sized employers and 51 small However only 16 small employers submitted their WSPs relative to the number of registered small employers and 44 medium and large employers submitted WSPs relative to the number of registered medium and large employers As such skills demand statistics provides more representative data on the requirements of medium and large employers Data for skills demand in the commercial agricultural sector is based on data for permanent employees as well as casual and seasonal employees
Skills demand forecasting by AgriSETA
Forecasting for skills demand the AgriSETA has estimated that the demand for skilled employees at different levels in the next few years is 510 686 This is based on WSP data analyses over the last 5 years and projected demand for the formal commercial agricultural sector and factoring in the demand that at maximum would result from completion of the land restitution programme in South Africa The table below reflects the skills that are on demand as well as the estimates for demand over the next five years by major occupational category35
35 AgriSETA 2010
AgriSETA June 2010
Table 21 Demand for skills by occupational category
Major Occupation (OFO)Estimated Demand
Group Title1 Managers (commercial and small emerging farmers) 264 3702 Professionals 4 1413 Technicians and Trade workers 8 9255 Clerical and administrative workers 8006 Sales workers 4007 Machinery operators and drivers 5 8008 Elementary workers 226 250
Total 510 686Source AgriSETA WSP data and SSP demand forecasts
Research needs going forward
As has been set out in the sector analysis and the scenarios derived from that analysis the sector is faced by both significant and profound change and also great uncertainty It therefore follows that the task of focussing limited resources (basically levy income in the formal sector and NSF funds for the emergent farming sector) is difficult Whilst the general thrust of training remains broadly as described in the 2006‐10 SSP Updates some considerable work is required to achieve targeted effective interventions during the 2011‐2016 period The following research questions will need to be addressed in preparing the next SSP
bull In relation to the managers and owner‐managers of commercial farms and enterprises what skills are needed to enable them to help bring about the more optimistic scenario and manage the risks associated with the less optimistic ones
bull In terms of professional and technical competencies do the current education and training institutions coupled with the learning programmes available through the AgriSETA (learnerships skills programmes and the like) meet the needs of the sector
bull In the emerging agricultural sector do the current programmes funded by sources external to the AgriSETA (eg NSF) meet all the identified needs What gaps are there and how should they be addressed
bull In relation to governmentrsquos growth strategy and industrial action plans what skills are required for developing the aquaculture sub‐sector What programmes are available How can the SETA support the skills needs for this sub‐sector
bull Given the increasing levels of casual and contract labour how can skills be developed to meet the needs of the formal commercial sector and the emerging enterprise sector
bull How can the demand in each of the priority areas be quantified and agreement be reached on numbers of people to be trained
Agriculture Sector Analysis 39
AgriSETA June 2010
SECTION 3 Skills Gaps and scarce skills
Scarce skills at the DAFF
The level of scarce skills at DAFF can be determined by the vacancy rate While the average vacancy rate in the department as at 31 March 2009 was 17 there were some posts that had very high vacancy rates as reflected in the table below Indicating the possibility that the Department is experiencing difficulties in finding suitable candidates in the South African labour market to fill these posts
Table 22 Scarce skill occupations and vacancy rates (DAFF March 2009) Critical occupations Number of posts Posts filled Vacancy rate ()
Agricultural animal oceanography forestry and other sciences
167 119 287
Engineering sciences related 2 1 50Engineers and related professions 13 6 538Farming forestry advisors and farm managers 11 4 636Finance and economics related 73 53 274Horticulturists foresters agricultural and forestry technicians
350 221 369
Legal related 6 4 333Mechanical engineering technicians 3 2 333Risk management and security services 6 4 333Social sciences related 1 0 100Veterinarians 34 24 294
Source DAFF Annual Report 20082009
Skills are also scarce at senior management level The department also reports on difficulties it has filling senior management services vacancies with some of them staying vacant for up to twelve months because no suitable candidates can be found The department would then resort to re‐advertisement and head hunting This was the case with 22 of 18 SMS posts in March 2009
Scarce skills in the commercial sector
The following occupations have previously been projected as scarce (extremely hard to fill vacancies) by AgriSETA in the commercial agricultural sector over the next five years
Table 23 Scarce and critical skills in the commercial agricultural sector
Occupation Code
Group Occupation Critical Skills Intervention Comments
139903 Managers Laboratory Manager
Technology AI nutrition
HET
221101 Professionals Accountant (General)
General HET
221102 Professionals Management Accountant
Farm financial management
HET Focus on support advice to farmers new enterprises
222101 Professionals Commodities Trader
Export administration supply chain
FET Learnership Skills
Agriculture Sector Analysis 40
AgriSETA June 2010
Agriculture Sector Analysis 41
Occupation Code
Group Occupation Critical Skills Intervention Comments
management Programme
224301 Professionals Economist Agricultural HET
Mainly for Department of Agriculture and para statals commodity organisations
233101 Professionals Chemical Engineer
Chemical processes in food production
HET Industries such as sugar processing
233301 Professionals Electrical Engineer
Installation and maintenance
HET Processing industry
233401 Professionals Electronics Engineer
Computerised production prosesses
HET Processing industry
233501 Professionals Industrial Engineer
Productivity and efficiency
HET Processing industry
233904 Professionals
Instrument Engineer (Defence Force)
Installation and maintenance
HET
Not for defence ‐ sugar industry
233502 Professionals Mechanical Engineer
FETHET Equity reasons
233902 Professionals Agricultural Engineer
Farm layout and infrastructure
HET Mainly in Government
311101 Technicians and trades workers
Agricultural Technician
Installation and maintenance
FETHET
234102 Professionals Agricultural Scientist
Agri research HETFET Especially in horticulture
234201 Professionals Chemist HET Processing industry
234202 Professionals Food Technologist
Food safety HACCP
FETHET Across sector
234701 Professionals Veterinarian HET Mainly in Government
311101 Technicians and trades workers
Agricultural Technician
Farm infrastructure
FET Mainly needed in government
311401 Technicians and trades workers
Chemistry Technician
FETHET EE reasons
312907 Technicians and trades workers
Chemical Engineering Technician
FET Learnership
Mainly EE reasons
312402 Technicians and trades workers
Electronic Engineering Technician
Weak stream production infra
FETHET Mainly tobacco industry
233904 Professionals
Instrument Engineer (Defence Force)
Instrument technician
FET
Occupation needed Instrument Technician (not defence force) Mainly sugar processing sector
321202 Technicians and trades workers
Diesel Motor Mechanic
FET Learnership
To include tractor mechanic
321204 Technicians and trades workers
Small Engine Mechanic
Agricultural equipment
FET Learnership
Throughout sector
AgriSETA June 2010
Agriculture Sector Analysis 42
Occupation Code
Group Occupation Critical Skills Intervention Comments
322301 Technicians and trades workers
Metal Fabricator
Artisan FET Learnership
322303 Technicians and trades workers
Welder Welder (First Class)
Artisan FET Learnership
323203 Technicians and trades workers
Fitter‐Welder Artisan FET Learnership
Mainly sugar ndash multi‐skilled
323202 Technicians and trades workers
Fitter And Turner
Artisan FET Learnership
Tobacco and sugar
323501 Technicians and trades workers
Millwright Artisan FET Learnership
Wide‐spread need
341101 Technicians and trades workers
Electrician (General)
Artisan FET Learnership
Wide‐spread need
342101 Technicians and trades workers
Air‐Conditioning And Refrigeration Mechanic
Artisan FET Learnership
Sugar pack houses cold chain
Source AgriSETA Sector Skills Plans
Supply of skills
South Africarsquos agriculture skills are produced in high schools agricultural colleges FET colleges and Higher Education institutions In high school a large cohort of learners take Agricultural Science as a subject In 2003 there were 42 Agricultural High Schools offering Agricultural Science as a subject These students and those in high schools taking the subject could progress to taking agriculture as a focus area for further education In 2004 there were 10 FET colleges offering vocationally directed agricultural programmes These FET colleges offered complete qualifications and short courses Eleven Colleges of Agriculture can offer qualifications up to degree level and 19 universities offer qualifications in Agriculture ranging from agricultural economics animal and plant sciences and horticulture among others at under and post graduate levels (Department of Agriculture 2006) While long term planning of skilling of new entrants in the sector can be done through close consultation between the sector agricultural schools and colleges FET colleges and HET institutions so that they teach relevant skills there are other avenues for training for those who are already employed in the sector for example skills programmes and learnerships There are 15 registered qualifications for the primary agriculture sub sectors Currently AgriSETA has 94 registered learnerships that can address the skills needs of the identified scarce skills These are captured in Appendix 2 AgriSETA has approved accredited a number of training providers across the country to deliver the theoretical and practical components of these learnerships These include agricultural colleges FET colleges and private providers Currently the AgriSETA has 246 registered and approved providers distributed nationally as follows
AgriSETA June 2010
Table 29 AgriSETA approved training providers (2010) Province Number of providers
Gauteng 72
(29)
KwaZulu Natal 20
(8)
Limpopo 35
(14)
North West 30
(12)
Northern Cape 3
(1)
Free State 15
(6)
Mpumalanga 14
(6)
Western Cape 26
(11)
Eastern Cape 31
(13) Total 246
The providers are small to large organisations In primary agriculture small providers appear to offer the most training in rural areas and community projects (AgriSETA 2010) Most of the operating providers will be in FET colleges and agricultural colleges The AgriSETA is unable to meet the total demands for skills across the duality of their sector There seems to be fairness in the approval of training for both permanent and casual and seasonal workers In 200809 the AgriSETA approved 559 learnerships as follows
Table 30 AgriSETA learnerships approved for grant purposes (2008‐2009)
Source AgriSETA learnership data analysis
Agriculture Sector Analysis 43
AgriSETA June 2010
Agriculture Sector Analysis 44
Provision of skills programmes in the same year attracted grants for 2 706 employees
Table 31 Participation by learners in skills programmes in the AgriSETA (200809)
Source AgriSETA Skills programmes data analysis
AgriSETA June 2010
APPENDIX 1 Skills demand in the Department of Agriculture Forestry amp Fisheries (200809)
Source DAFF Annual Report 2008‐20009
Agriculture Sector Analysis 45
AgriSETA June 2010
Agriculture Sector Analysis 46
Appendix 2 AgriSETA registered learnerships Registered Learnership NQF Level SAQA Registration NoLearnership in Agri Sales and Service 4 22 Q 220001 20 178 4Learnership Agricultural Machinery Technician 2 22 Q 220007 20 160 2Learnership in Specialist Agricultural Machinery Technician 5 22 Q 220009 21 258 5Agri Trade Processes 2 22 Q 220013 30 125 2FETC Meat Examination Applying Basic Business Principles 4 30 Q 3000 2823 164 4Further Education and Training Certificate Seed Marketing Execute Seed Trials 4 22 Q 220025 21 126 4Further Education and Training Certificate Seed Research and Development Certify as Seed Unit 4 22 Q 220027 21 121 4FETC Seed Research and Development Conduct a Field Inspection of a Seed Unit 4 22 Q 220028 20 120 4Seed Research and Development Operations Operate in a Team 3 22 Q 220020 22 121 3Seed Research and Development Operations Apply Basic Business Principles 3 22 Q 220021 22 121 3National Certificate Seed Processing and Packaging Operate in a Team 3 22 Q 220026 21 123 3Sugar Industry Technical Maintenance worker 2 22 Q 220011 39 128 2National Certificate Sugar Manufacturing and Refining Technical Maintenance 3 30 Q300003 23 146 3Further Education and Training Certificate Manufacturing Technical MaintenanceProduce Components by Performing Engineering Turning Operations
4 30 Q 3000 1321 173 4
FETC Manufacturing Technical Maintenance Produce Components by Performing Milling Operations 4 30 Q 3000 1521 173 4 FETC Manufacturing Technical Maintenance Develop and Fabricate from Complex Drawing 4 30 Q 3000 1420 173 4National Certificate in Sugar Technology 5 22 Q 220036 22 140 5Further Education and Training Certificate Sugar Processing 4 22 Q 220035 31 144 4National Certificate in Sugar Technology Processing Sugar Refining 2 22 Q 220037 28 124 2National Certificate in Sugar Technology Processing Juice Preparation 2 22 Q 220038 28 124 2National Certificate in Sugar Technology Processing Crystallisation 2 22 Q 220039 27 122 2National Certificate in Sugar Technology Processing Laboratory Practice 2 22 Q 220040 25 124 2National Certificate in Sugar Technology Processing Extraction 2 22 Q 220041 28 122 2NC Rooibos Production Applying Basic Business Principles 2 30 Q 3000 2427 130 2 NC Rooibos Processing Applying Basic Business Principles 2 30 Q 3000 2224 123 2 National Certificate Cigarette Production 3 22 Q 220046 23 121 3
AgriSETA June 2010
REFERENCES AgriSETA 2010 AgriSETA 20082009 Annual report Pretoria AgriSETA Agricultural Research Council httpwwwarcagriczahomeasppid=272 Avert South African HIV and AIDS statistics Available on httpwwwavertorgsafricastatshtm Centre for Development Enterprise 2008 Land reform in South Africa Getting back on track CDE Research No 16 DAFF 2010 Quarterly economic review of the agriculture sector Pretoria DAFF DAFF 2009 Annual report 20082009 Pretoria DAFF Department of Agriculture 2008 Strategic plan 2008 Pretoria Department of Agriculture DTI An introduction to the South African economy Available on httpwwwthedtigovzapublicationsagroprocessinghtm Eastern Cape Provincial Government Eastern Cape Provincial Growth and Development Strategy 2004 ndash 2014 Economic Commission for Africa 2009 Developing African agriculture through regional value chains Addis Ababa Economic Commission for Africa Economic Report Free State Province 2005 Provincial Growth and Development Strategy 2005 ndash 2014 GCIS 2010 SA Yearbook 200910rdquo Agriculture forestry and fisheries Pretoria GCIS Greenberg S 2010 Status report on land and agricultural policy in South Africa 2010 Institute for Poverty Land and Agrarian Studies School of Government University of the Western Cape Research report Ingelozi Management Solutions 2008 HIVAIDS in the South African agricultural sector Towards the development of a long term intervention Research report KwaZulu Natal Provincial Government 2006 KwaZulu Natal Provincial Growth and Development Strategy Limpopo Provincial Government Growth and Development Strategy 2004 ndash 2014 Mhone G (2000) Enclavity and Constrained Labour Absorbtive Capacity in Southern African Countries Geneva International Labour Office Moyo S The Agrarian question and the developmental state in South Africa In Edigheji O et al 2010 Constructing a democratic developmental state in South Africa HSRC PRESS
Agriculture Sector Analysis 47
AgriSETA
Agriculture Sector Analysis
National Treasury Republic of South Africa 2010 National Budget 2010 ndash National Budget Review 2010 Pretoria National Treasury Northern Cape Provincial Government Agriculture and agro‐processing sector strategy North West Provincial Government North West Provincial Growth and Development Strategy 2004 ndash 2014 Province of the Western Cape 2008 The Ikapa growth and development strategy White Paper SABCOHA SA Business Coalition on HIV and AIDS wwwsabcohaorg SACAU httpwwwsacauorghostingsacauSacauWebnsfHomehtmOpenForm South African Government 2010 20102011 ndash 20122013 Industrial Policy Action Plan Republic of South Africa Statistics South Africa 2005 Census of commercial agriculture 2002 Report No 110201 Pretoria Statistics South Africa Statistics South Africa 2009 Census of commercial agriculture 2007 Statistical release P1101 Pretoria Statistics South Africa Statistics South Africa 2010 General household survey 2009 Statistical release P0318 Pretoria Statistics South Africa Statistics South Africa 2010 Gross domestic product first quarter 2010 Statistical release P0441 Pretoria Statistics South Africa Statistics South Africa 2010 Quarterly labour force survey Quarter 1 2010 Statistical release P0211 Pretoria Statistics South Africa Vink N amp van Rooyen J 2009 The economic performance of agriculture in South Africa since 1994 The implications for food security Pretoria DBSA development planning division working paper series No 17 Webster E 2004 the Dual Economy from a book by Van Holdt K and Webster E Work restructuring and the Crisis of Social reproduction and 10 years of restructuring post apartheid workplaces University of Natal Press Workinfocom httpwwwworkinfocomfreesub_for_legresdatalraempassoc3htm Xingwana L 2008 Challenges and Opportunities for Land and Agrarian Reform towards 2025 Speech delivered at the Agri‐Consultation Protea Ranch Hotel Polokwane 30 July 2008
- Table of contents
- SECTION 1 THE AGRICULTURAL LANDSCAPE
- 11 Size and shape of the Agricultural sector
-
- Overview
- Distribution of agricultural production
- The structure of the agriculture sector in South Africa
- Categories of farming enterprises
- Employment trends
- Employment categories and remuneration
- Stakeholders in the Agricultural sector
-
- National government departments
- Sector representatives
-
- 12 Factors impacting development in the Agriculture sector
-
- Future sector economic growth and development
-
- South African sector growth plans (IPAP2)
- International Trade
- Global recession and rise in food prices
-
- Land reform
- Reliance on imports
- Water
- The labour market
- Consumer trends
- HIVAIDS
- Farm safety and security
- Broad-based Black Economic Empowerment
-
- Conclusions and scenarios
- SECTION 2 DEMAND FOR SKILLS
-
- AgriSETA registered employers and employee coverage
- Employee coverage in the AgriSETA
-
- 21 Skills demand
-
- The National Education and Training Strategy for Agriculture (AET Strategy)
- AGRISETA sector skills planning demand data (2008-2009)
- AgriSETA WSP analyses
-
- Skills demand in the commercial agricultural sector
-
- Skills demand forecasting by AgriSETA
- Research needs going forward
-
- SECTION 3 Skills Gaps and scarce skills
-
- Scarce skills at the DAFF
- Scarce skills in the commercial sector
- Supply of skills
-
- APPENDIX 1 Skills demand in the Department of Agriculture Forestry amp Fisheries (200809)
- Appendix 2 AgriSETA registered learnerships
-
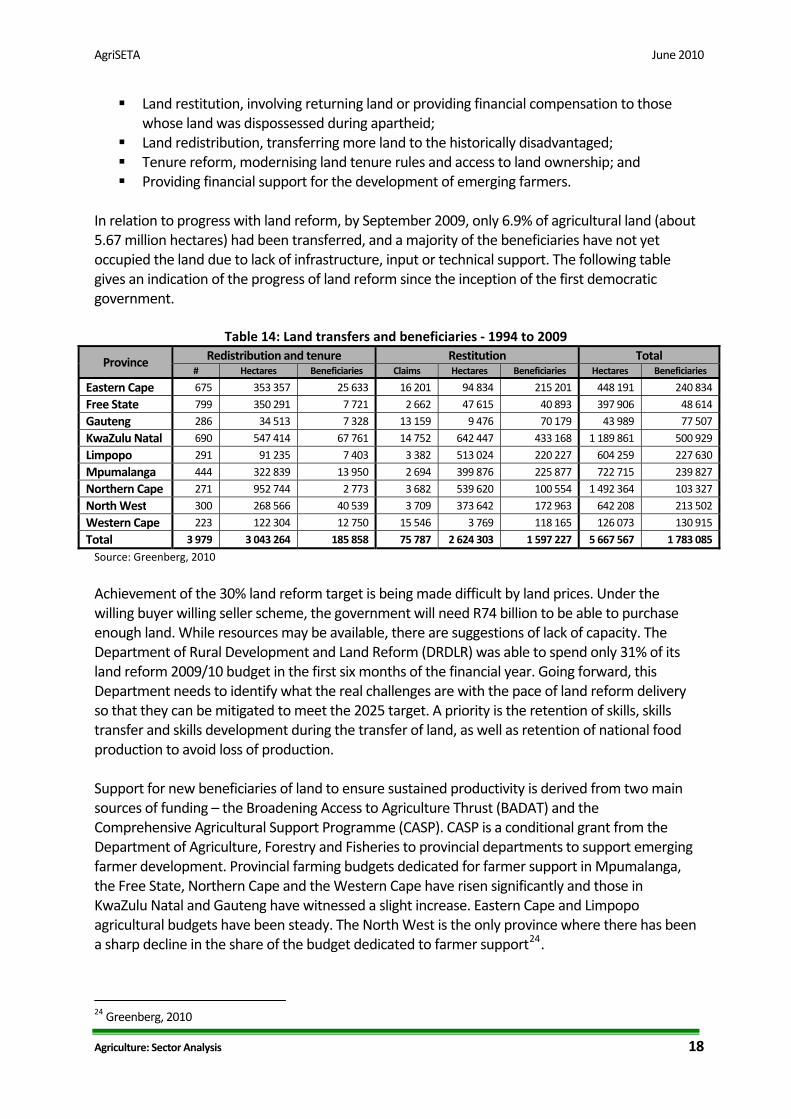
AgriSETA June 2010
Agriculture Sector Analysis 18
Land restitution involving returning land or providing financial compensation to those whose land was dispossessed during apartheid
Land redistribution transferring more land to the historically disadvantaged Tenure reform modernising land tenure rules and access to land ownership and Providing financial support for the development of emerging farmers
In relation to progress with land reform by September 2009 only 69 of agricultural land (about 567 million hectares) had been transferred and a majority of the beneficiaries have not yet occupied the land due to lack of infrastructure input or technical support The following table gives an indication of the progress of land reform since the inception of the first democratic government
Table 14 Land transfers and beneficiaries ‐ 1994 to 2009
Province Redistribution and tenure Restitution Total Hectares Beneficiaries Claims Hectares Beneficiaries Hectares Beneficiaries
Eastern Cape 675 353 357 25 633 16 201 94 834 215 201 448 191 240 834
Free State 799 350 291 7 721 2 662 47 615 40 893 397 906 48 614
Gauteng 286 34 513 7 328 13 159 9 476 70 179 43 989 77 507
KwaZulu Natal 690 547 414 67 761 14 752 642 447 433 168 1 189 861 500 929
Limpopo 291 91 235 7 403 3 382 513 024 220 227 604 259 227 630
Mpumalanga 444 322 839 13 950 2 694 399 876 225 877 722 715 239 827
Northern Cape 271 952 744 2 773 3 682 539 620 100 554 1 492 364 103 327
North West 300 268 566 40 539 3 709 373 642 172 963 642 208 213 502
Western Cape 223 122 304 12 750 15 546 3 769 118 165 126 073 130 915
Total 3 979 3 043 264 185 858 75 787 2 624 303 1 597 227 5 667 567 1 783 085
Source Greenberg 2010
Achievement of the 30 land reform target is being made difficult by land prices Under the willing buyer willing seller scheme the government will need R74 billion to be able to purchase enough land While resources may be available there are suggestions of lack of capacity The Department of Rural Development and Land Reform (DRDLR) was able to spend only 31 of its land reform 200910 budget in the first six months of the financial year Going forward this Department needs to identify what the real challenges are with the pace of land reform delivery so that they can be mitigated to meet the 2025 target A priority is the retention of skills skills transfer and skills development during the transfer of land as well as retention of national food production to avoid loss of production Support for new beneficiaries of land to ensure sustained productivity is derived from two main sources of funding ndash the Broadening Access to Agriculture Thrust (BADAT) and the Comprehensive Agricultural Support Programme (CASP) CASP is a conditional grant from the Department of Agriculture Forestry and Fisheries to provincial departments to support emerging farmer development Provincial farming budgets dedicated for farmer support in Mpumalanga the Free State Northern Cape and the Western Cape have risen significantly and those in KwaZulu Natal and Gauteng have witnessed a slight increase Eastern Cape and Limpopo agricultural budgets have been steady The North West is the only province where there has been a sharp decline in the share of the budget dedicated to farmer support24
24 Greenberg 2010
AgriSETA June 2010
Agriculture Sector Analysis 19
Reliance on imports
Overall the Agriculture sector contributes positively to the balance of payments ldquoSouth Africa remains food secure The value of our exports increased by 464 from R33 656 million in 200708 to R49 278 million in 200809 During the same period the estimated value of imports rose by 12 from R34 009 million to R38 401 million resulting in a positive trade balancerdquo25
South Africa depends largely on world markets for seed production and agrochemicals Regarding seed production there are only three community seed production schemes in Limpopo and Mpumalanga being piloted with state funding Ten top large companies including two South African companies and multinationals have rights to over two thirds of registered seed varieties in South Africa Despite the dominance of genetically modified and hybrid seed in some sub‐sectors like maize sunflower and sorghum open‐pollinated varieties have been resilient in South Africa enabling the possibility of alternative seed sources not dependent on technological processes26 In relation to agrochemicals deregulation and liberalisation in the fertiliser sector led to the shutdown of local production capacity and South Africa became an importer of fertiliser for the first time in 2000 There are three large players in the fertiliser sector Sasol Nitro Yara and Omnia South Africa imports an estimated 70 of fertilisers and pesticides Fertiliser prices rose by over 200 between 2006 and 2008 but dropped somewhat after that However this hike signified the volatility of the agrochemicals industry and South Africarsquos dependency on imports and the potential risk for emerging farmers and food production of this dependence on imports as the country cannot control the prices making inputs both difficult to budget for and in many cases unaffordable The price of agrochemicals is also particularly influenced by the prices of oil and the exchange rate The general understanding in relation to job creation is that a weaker Rand will improve exports and therefore enable job creation Of course the down side of this strategy is that imports become more expensive So what may be an advantage for those sub‐sectors who are expanding their export volumes those relying on imported agro chemicals will be under increased pressure
Water
Water is both an essential and scarce resource for the agriculture sector and is being threatened by climate changes Crop production relies heavily on water and yet access to water is not being addressed in a systematic way in the land reform processes Greenberg suggests that the relationship between land reform agricultural support and water resource provision is inadequate and a way to address this could be established by linking water provision to land transfer or investing in irrigation for both commercial and resource‐poor farmers However investing in irrigation in the context of water scarcity and climate change may not be the best option What could be needed is finding ways to maximise efficiency of the 60 of South African
25 Department of Agriculture Forestry and Fisheries Strategic Plan 201011 26 Greenberg 2010
AgriSETA June 2010
Agriculture Sector Analysis 20
water used for irrigation by for example using methods such as drip or micro‐irrigation which are expensive to set up but which reduce water wastage by 5‐1027 The Department of Water Affairs is responsible for managing water supply and has to give authorisation for agricultural projects and other developments The department needs to be seen as an important stakeholder in the agricultural sector
The labour market
South Africa recorded an unemployment rate of 243 in 2009 (narrow definition) If people who are no longer actively seeking work are considered the broad unemployment rate rose from 267 to 313 illustrated in the figure below As a direct consequence of the global economic downturn in 2008 870 000 formal jobs were lost in 200928 Others have quoted a figure of over 1 million
Figure 3 Official unemployment in South Africa 2003 ‐2009
Source National Treasury 2010
Annual employment loss followed sector growth patterns with agriculture mining manufacturing and trade facing the highest job losses as their sector growth contracted Unemployment is especially a major problem among lower skilled workers and younger people Youth employment in the 15 ‐24 year age group has fallen by 219 000 (136) and 483 of people in this age group are unemployed Employment of semi‐skilled and unskilled workers has contracted by 527 000 and male employment has gone down by 550 000 (71) while that of women has decreased by 320 000 (52) The number of discouraged workers ie those no longer actively seeking work has increased from 518 000 to 17 million29 Clearly the existence of a very large pool of largely unskilled unemployed workers has an impact on the farming sector It drives wages down and creates opportunities for casualisation and the expansion of labour contract agencies and brokers In addition there are significant numbers of foreign nationals mainly from Zimbabwe and Mozambique who are seeking work and often finding it on farms and in primary processing and packaging plants There are benefits to the
27 Greenberg 2010 28 National Treasury 2010 29 National Treasury 2010
AgriSETA June 2010
Agriculture Sector Analysis 21
sector with skilled and semi‐skilled workers coming into the labour market and being absorbed into the workforce and helping raise productivity levels However at the lower skilled end of the market the existence of this pool brings further casualisation and downward pressure on wages Tensions are likely to increase and further protests either in the form of xenophobic outbreaks or actions against farmers may well increase A view often expressed by farm employers is that current labour legislation makes dismissing workers difficult and so the availability of labour without entering into contracts of employment is an attractive way of avoiding the legislation and its obligations Organised Labour is seeking to restrict these opportunities through either regulating or eliminating labour brokers and efforts are being made to regulate the use of foreign labour However for the foreseeable future the trend is for formally employed people to be reduced in number In relation to the emergent sector there will also be a reluctance to enter employment contracts with workers The fact that many households are engaged in some form of largely unpaid agricultural work means that there is significant casual work dating back many years Helping change this situation into one where casual or unpaid jobs are transformed into formal jobs with regular wages will take time It is also likely that as some emergent farms become established they will act similarly to established farms and institute a form of casual labour rather than expanding a workforce for which they would have to take a level of responsibility From an AgriSETA perspective these labour market trends mean that whilst levy income can be directed at a relatively small labour pool one that is manageable in terms of planning and implementation the size of the informal casual and unemployed labour force in the sector ‐ for whom no levy is paid and who have no employer to plan for their skills needs ndash is very large and its needs almost unlimited Clearly the relationship with the National Skills Fund (NSF) becomes critical in respect of the entire non‐levy income sector Again the level of support available from non‐levy income sources will be an important variable in looking at future sector skills development scenarios
Consumer trends
South Africa currently produces enough food to meet the needs of its population However consumption of three main staples maize wheat and vegetables has been volatile since 1985 and remains below 1990 levels Consumption of maize and vegetables by South Africans is 17 and 32 less respectively than in 198530 The main reasons for this lie in the growing levels of poverty and the difficulties that families have in purchasing nutritious food Whilst government has increased the levels of social grants and increased the number of people receiving grants to around 13 million the incomes of poor families have been badly hit by a range of factors including job losses and rises in food prices The approximately 1 million people who lost their jobs in 20089 meant a loss of income for many millions of dependents Rises in food prices have also had a disproportionate impact on the poor Whilst food is available it is often not accessible to families on the income levels that they have to manage within The result is that less and less nutritious food is purchased which in turn impacts on the ability of farmers to sell their products locally 30 Greenberg 2010
AgriSETA June 2010
Agriculture Sector Analysis 22
Whilst there is no evidence that government will reduce its efforts in relation to poverty relief and social benefits including such programmes as school feeding schemes and food parcels during periods of drought the state of public finances may not enable to support the poverty that grips many rural areas If real income levels for the poor were to rise it could have a significant impact on the economy of the agricultural sector Equally an improvement in the rural economy with increased agricultural production and jobs would dramatically impact on the capacity of people to buy nutritious food Achieving a positive growth path in rural areas is a huge challenge for government and one that is key to governmentrsquos Medium Term Strategic Framework and Industrial Policy Action Plans
HIVAIDS
South Africa has a high prevalence of HIV and AIDS The HIV prevalence among people aged two and above was estimated at 109 in 2008
Table 15 Estimated HIV percentage prevalence by age group (2002 ndash 2008)
Age 2002 2005 2008 Change
Children (2‐14 years) 56 33 25 ‐31
Youth (15‐24 years) 93 103 87 ‐06
Adults (25 and older) 155 156 168 13
15‐49 year olds 156 1692 169 13
Total (ages 2 to 49) 114 108 109 ‐05 Source Avert 2009
The table above shows that HIV prevalence is highest amongst those aged 25 years and older Given youth labour market analyses which point to people from previously disadvantaged backgrounds mainly African males accessing formal employment for the first time at age 25 ‐27 this population can be held to represent people in employment Research31 has estimated that by 2020 the pandemic will have claimed at least 20 of employees in the agricultural sector Southern Africa
in
HIV and AIDS have significant ramifications in the agricultural sector for both commercial farming and subsistence farming The implications include
bull Decrease in cultivated land bull Focus on less labour intensive crop and animal production bull Decrease in womenrsquos agricultural productivity as they take on a more care giving role bull Loss of skills bull Increase in absenteeism from work bull Decrease in daily work outputproductivity because workers are weaker from infections
There are suggestions that the impact of the pandemic in South Africa demands sectoral intervention although this may be difficult in the agricultural commercial sector as
bull Seasonal workers who seem to be more vulnerable to infection because of their low socio‐economic status are not in one place long enough for care programs Further
31 Ingelozi Management Solutions 2008
AgriSETA June 2010
Agriculture Sector Analysis 23
farmers and employers may not feel responsible for seasonal workers in the same way they would invest in their permanent employees
bull There may be uncertainty around land reform which may put HIV intervention on farms on the back burner
bull There are no policies that enforce HIV education and care on farms in the same way that legislation like BEE does for ownership As a result HIV intervention may be left to goodwill and employers may feel it is more important to comply with issues that are monitored
Farm safety and security
South Africa has been plagued by unacceptably high levels of violent crime and murder for many years now Farms have experienced this and those living on farms feel and are extremely vulnerable The South African Chamber of Commerce and Industry (SACCI) has argued that
Using the nominal GDP figure for 2009 of R24 trillion a 322 percent contribution of agriculture to GDP and an estimate of 39982 farms (as at 2007) in South Africa the cost of a murderattack on a farm to the economy was R1932869 per annum
SACCI acknowledges that this estimate is flawed as it does not take into consideration the fact that farming units contribute differently to GDP and that not every attack or murder contributes to farm shut down or loss of productivity However if not addressed these attacks could lead to loss of farming sectors as farmers migrate to lsquosaferrsquo regions This will affect employment and GDP contribution of the sector The need for safety and security on farms may also shift farmersrsquo focus in skills development to include personnel who have skills in safety and security
Broad‐based Black Economic Empowerment
The aim of the AgriBEE Charter (gazetted in 2008) is to increase the involvement of black business in agriculture through ownership and control as executives and senior managers of new and existing agricultural businesses The extent to which AgriBEE is transforming the sector is not known as it is too early to tell but a recent survey conducted by ABC and the IDC showed that among the ABC respondents in 2007 46 of enterprises were busy constructing a BEE strategy and 46 claimed to be implementing a BEE strategy A survey of the dairy industry in the Western and Eastern Cape in 2008 showed that only 6 of firms had a BEE strategy in place It also seems from survey data that companies are focusing on the skills development and socio‐economic aspects of BEE rather than on ownership32 It would appear that although there have been some significant BEE purchases of viable farms and some employee empowerment projects including some quite high profile ones in the Cape Winelands the extent of ownership change had been limited One of the factors is the very high level of single person or family ownership in the agricultural sector BEE is more straight forward in the corporate world where shares can be exchanged For a family business it is a matter of selling off part or all of the land and the tendency is to sell off those areas of the farm that are expendable from a business sustainability perspective
32 Greenberg 2010
AgriSETA June 2010
Whilst there is discussion in government about the ending of the ldquowilling buyer willing sellerrdquo concept the Constitution itself provides for property rights and so although some pressure may be exerted through legislation and regulation the extent and speed of change may not be fast The mechanisms for encouraging the transfer of significant levels of ownership have not yet been created The focus of the SETA is therefore likely to be more the beneficiaries of land reform and emergent farmers though projects of a BEE nature can be targeted as they arise
Conclusions and scenarios It is useful when looking at possible scenarios to examine the key variables or uncertainties and to project how variations one way or the other will have an impact on the development and growth of the sector From the sector analysis and factors that are contributing to change in the sector there are some key factors that seem to emerge First appears to be the economy and related issues of the labour market and the challenges of labour absorption in an enclave economy These factors determine on the one hand whether there will be growth and development and on the other whether such improvements will result in improved employment opportunities and the creation of a virtuous cycle of development Second is the role of the state and the various government departments whose plans and work impact on the agricultural sector Related to this is land reform that is inevitably driven by the state and not the owners of land or the landless The view expressed by many engaged in agrarian reform is that the state must play a significant role It becomes clear that a successful agricultural enterprise requires a number of factors to be in place to be successful These include access to land (Department of Rural Development and Land Reform) agricultural support within a supportive agricultural framework (Department of Agriculture Forestry and Fisheries) access to consistent water supply (Department of Water Affairs) access to finance (Department of Trade and Industry various state agencies) conducive labour market regulation (Department of Labour) sound industrial policy (Department of Trade and Industry) economic planning and macro policy (Department of Economic Development National Treasury) and appropriate education training and skills development (Department of Higher Education and Training the Human Resources Development Council NSA and the SETA) There are other government departments as well as provincial and municipal structures that also play a role The following analyses show how the four variables
economic growth and development role of the government labour market changes and land reform)
impact positively or negatively on the growth of the sector and the demand for skills
Agriculture Sector Analysis 24
AgriSETA June 2010
Agriculture Sector Analysis 25
HHIIGGHH GGRROOWWTTHH SSCCEENNAARRIIOO
The economics of the sector Role of government
The economy in SA and globally continues to revive albeit slowly for the next few years
Roles and integration of national government departments are clarified Specific functions are agreed processes put in place and personnel appointed with the required skills
International trade agreements are still weighted infavour of US and EU but progress is being made and specific blockages are addressed in bilateral talks
The roles of Departments (DWA DAFF DRDLR DoL DTI DED DHET) are clarified with appropriate joint plans and coordinating structures
The rural economy gradually improves with the buying power of the poor increasing and more stable markets created for local produce
For each of the functions agreed in each of the related departments appropriate structures and systems are put in place and staff trained
Exports increase in key areas identified in IPAP 2 and the Rand exchange rate stabilises at a level not too much different than it is today
Specific capacity is put in place at local level to support implementation of land reform and rural development
There is a growing understanding of the concept of dualism and the need to intervene with labour absorption and development mechanisms
Land claims are all finally settled and ownership and tenure is resolved There is a serious drive to establish effective agricultural enterprises
An understanding is reached on the role of agencies and labour brokers and abuse is curbed
The willing buyer willing seller approach is resolved and enables viable land to become black owned
Some relaxation of labour market regulations are agreed that maintain some minimum standard of employment but assist absorption
Land transfer to black and emergent farmers is done in a manner that integrates then into the supply chains of the sector
Mechanisms are found to address skills needs in the context of casual and seasonal work patterns
Financing of land reform and transfer is done on the basis of agreed development plans including skills
Labour market reform Trajectory of land reform LLOOWW GGRROOWWTTHH SSCCEENNAARRIIOO
The economics of the sector Role of government departments The economy in SA and globally stagnates at current levels and the economy struggles to pick up after the temporary 2010 World Cup boost
A lack of purpose at government level means limited progress for another five years Land reform remains a commitment without a plan
International trade agreements are still weighted infavour of US and EU and protectionism increases as a result of the global recession
The roles of Departments (DWA DAFF DRDLR DoL DTI DED DHET) are unclear and there is no proper co‐ordination
SArsquos Gini coefficient continues to worsen with rural poverty increasing and local economies declining
There is a lack of effective structures systems and processes to implement policy across departments
Rand volatility causes problems for importers and exporters Well established markets are maintained but exports decrease
At local level the decline in the agricultural extension officer functions continues and limited practical support is available
Understanding of the rural economy is so diverse that stakeholders cannot agree the problem let alone the solution to low absorption levels
Land claims take too long and land reform processes leave potentially productive land poorly developed and managed
Casual labour and labour brokers remains an issue of dispute Confrontation results in bitterness and resentment
The impasse caused by a rigid interpretations of property clauses in the Constitution continues to stall achievement of the 30 black ownership target
Labour market regulation continues to be a contributing factor to reducing levels of employment
Black owned farms find it difficult to become part of supply chains and are unable to perform adequately
Unstable employment patterns in the sector make skills interventions difficult to manage and largely ineffective
Financing of land reform and land transfer continues to be wasted as it is not tied to the building of appropriate capacity
Labour market reform Trajectory of land reform
AgriSETA June 2010
These analyses can be translated into four potential growth and development scenarios for the agricultural sector which are based on the requirements for a strong development state Scenario 3 Weak government support
and sound economy
Econ
omic fa
ctors glob
ally n
ationa
lly and
locally
Scenario 1 Integrated government support and sound economy
The economic upturn triggered by the World Cup continues and globally things improve enabling an expansion of exports The government because of a lack of integrated policy planning and implementation provides limited support for sector development The gains go to the well established enterprise owners with few gains for emerging farmers and local communities
Government departments coordinate their efforts to achieve maximum impact There are favourable economic conditions that create opportunities for advance Within this positive environment the role of the AgriSETA becomes a central component of a comprehensive strategy for growth and skills interventions are targeted to achieve maximum effect Results in growth in sustainable enterprises and expanded employment opportunities
Government policy and support Government policy and support
Combination of disjointed government policy planning and a weak and increasingly marginalised rural economy Economic conditions result in unsustainable farming conditions and employment declines along with productivity Food shortages and the lack of development in rural areas leading to increasing social tensions A vicious cycle develops with the sector going into long term decline
Government departments coordinate their efforts to achieve maximum impact However economic conditions hamper progress Efforts by the AgriSETA are undermined by poor labour absorption and job insecurity Some significant successes are recorded including some NSF funded projects that result in sustainable enterprises A platform is laid for future improvements when the economic conditions improve
Scenario 4 Weak state and economy Scenario 2 Strong state but weak
economy
Agriculture Sector Analysis 26
AgriSETA June 2010
Agriculture Sector Analysis 27
SECTION 2 DEMAND FOR SKILLS
AgriSETA registered employers and employee coverage
In 2009 17 234 employers were registered with the AgriSETA comprising 15 394 small employers (less than 50 employees) 1 202 medium sized employers (50 ‐ 149 employees) and 638 large employers (more than 150 employees)
Considering that there are around 40000 commercial farms33 the 17 234 employers represent around 43 of commercial farms Notwithstanding changes in the sector as a result of land reform and sector shrinkage this is a sizable proportion and is held to be sufficiently representative for the purpose of skills development planning However this paints an incomplete picture It understates the representative nature of large enterprise registered with the SETA and overstates the representative nature of small registered enterprises 4 175 (242) of the enterprises are levy paying members Further only 1 673 (11) workplace skills plans (WSPs) were submitted
Table 16 Registered employers by size and sub‐sector Sub‐sector Description
Employers Small Medium Large
CoffeeTea Processing and marketing of coffee and tea including coconuts cocoa nuts olives dates etc
33 4 3
Fibre Grading ginning packing of wool and cotton raw material 1 676 16 18
Fruit Fruit packed in cartons fruit juice concentrate drummed and fruit juice in container ready for consumption
271 36 57
Fruit exporters and importers 6 0 1
Grain
Manufacture of grain mill products and starches 119 5 7Handling and storage of grain 67 7 23Wholesale amp retail trade in Agricultural machinery 213 9 4Sale and distribution of Agricultural raw materials and other farming inputs
182 9 3
Milling
Manufacture of flour and grain mill products including rice and vegetable milling grain mill residues
120 15 11
Manufacture of prepared animal feeds 110 19 0Manufacture of pet foods 42 9 0Manufacture of starches and starch products 7 1 1
Pest control
Pest Control 209 4 0
Poultry Poultry and egg production including the slaughtering dressing and packing of poultry
305 49 37
Primary
Growing of Cereals and other crops (not elsewhere classified) 902 160 34Growing of Vegetables Horticultural specialties nursery products
943 120 72
Growing of Vegetables Horticultural specialties (Including Ornamental Horticulture) and nursery products
11 5 0
Sugar plantation including sugar cane and sugar beet etc 9 4 2
33 SARS statistics 2007
AgriSETA June 2010
Agriculture Sector Analysis 28
Sub‐ Description Employers Growing of fruit nuts beverage and spice crops 1795 255 143Farming of cattle sheep goats horses asses mules and hinnies Dairy farming
2 252 59 18
Other animal farming production of animal products (NEC) 433 25 12Ostrich farming 5 0 0Game farming 16 0 0Growing of crops combined with farming of animals (Mixed farming)
2 920 256 109
Growing of coffee and tea including coconuts cocoa nuts olives dates etc
2 0 0
Agricultural and animal husbandry services except veterinary activities
438 22 9
Other animal farming (not elsewhere classified) 11 1 1Growing of trees as second crop by farmers 126 18 4Fishing operation of fish hatcheries and fish farm 913 10 6
Red meat
Production and animal products (not elsewhere classified) 6 0 0Slaughtering dressing and packing of livestock including poultry and small game for meat
317 40 17
Production sale amp marketing of Agricultural by products (eg bones hides)
61 2 0
Slaughtering dressing and packing of livestock including small game for meat and processing of ostrich products
2 1 0
Wholesale trade in Agricultural raw materials and livestock 193 7 10Transport of livestock as supporting activity 224 0 0Agricultural and livestock research 215 9 3
Seed Seed production and marketing 149 12 6
Sugar Manufacture of sugar including golden syrup and castor sugar
45 5 21
Tobacco Processing and dispatching of tobacco 46 8 6 TOTALS 15 394 1 202 638Source AgriSETA WSP data
The largest number of registered small and medium enterprises are found in the mixed farming sub‐sector while most large enterprises are in the growing of fruit nuts beverage and spice crops sub‐sector
Employee coverage in the AgriSETA
Collectively the 17 234 employers registered with AgriSETA employed a total of 239 076 employees This represents 39 of the agricultural labour force in 2009 The 1 673 employers who submitted WSPs in 2009 employed 97 898 employees representing 41 of the total number of people employed by registered employers While the number of registered employers submitting WSPs is small (11) they employ a sizeable number of employees and the percentage of employees provides a statistically significant sample The data for larger enterprises is statistically much more representative than that for small enterprises
AgriSETA June 2010
Table 17 Number of employees of registered employers by sub‐sector
Sub‐sector
Sub‐sector description Employees
CoffeeTea Processing and marketing of coffee and tea including coconuts cocoa nuts olives dates etc
483
Fibre Grading ginning and packing of wool and cotton raw material 6 539
Fruit Fruit packed in cartons fruit juice concentrate drummed and fruit juice in container ready for consumption
27 661
Fruit exporters and importers 212
Grain
Manufacture of grain mill products and starches 133Handling and storage of grain 18 303Wholesale amp retail trade in Agricultural machinery 795Sale and distribution of Agricultural raw materials and other farming inputs 2 898
Milling
Manufacture of flour and grain mill products including rice and vegetable milling grain mill residues
3 634
Manufacture of prepared animal feeds 731Manufacture of pet foods 160Manufacture of starches and starch products 105
Pest control
Pest Control 119
Poultry Poultry and egg production including the slaughtering dressing and packing of poultry
19 187
Primary
Growing of Cereals and other crops (not elsewhere classified) 10 104Growing of Vegetables Horticultural specialties and nursery products 37 799Growing of Vegetables Horticultural specialties (Including Ornamental Horticulture) and nursery products
195
Sugar plantation including sugar cane and sugar beet etc 220Growing of fruit nuts beverage and spice crops 47 043Farming of cattle sheep goats horses asses mules hinnies Dairy farming
3 382
Other animal farming production of animal products (NEC) 4 203Ostrich farming 0Game farming 0Growing of crops combined with farming of animals (Mixed farming) 28 722Growing of coffee amp tea including coconuts cocoa nuts olives dates etc 0Agricultural and animal husbandry services except veterinary activities 970Other animal farming (not elsewhere classified) 513Growing of trees as second crop by farmers 1 294Fishing operation of fish hatcheries and fish farm 1 589
Red meat
Production and animal products (not elsewhere classified) 0Slaughtering dressing and packing of livestock including poultry and small game for meat
5 128
Production sale amp marketing of Agricultural by products (eg bones hides) 116Slaughtering dressing and packing of livestock including small game for meat and processing of ostrich products
0
Wholesale trade in Agricultural raw materials and livestock 1 697Transport of livestock as supporting activity 0Agricultural and livestock research 534
Seed Seed production and marketing 2 127Sugar Manufacture of sugar including golden syrup and castor sugar 10 478Tobacco Processing and dispatching of tobacco 2 002 Total 239 076
Agriculture Sector Analysis 29
AgriSETA June 2010
Agriculture Sector Analysis 30
Source AgriSETA WSP data
According to the WSP analysis the sub‐sector for the growing of fruit nuts beverage and spice crops employed the largest number of people In six sub‐sectors there are employers who do not employ workers These are probably family based organisations where family members help in the business without drawing a salary These are in transport and livestock research slaughtering dressing and packing of livestock including poultry and small game for meat growing of coffee and tea including coconuts cocoa nuts olives dates etc ostrich farming and game farming
Table 18 Employee distribution by province Province Employees Percentage
Eastern Cape 18 844 192 Free State 1 946 20 Gauteng 2 788 28 KwaZulu‐Natal 5 416 55 Mpumalanga 8 062 82 North West 3 290 34 Northern Cape 5 436 56 Limpopo 1 730 18 Western Cape 50 386 515 Grand Total 97 898
Source AgriSETA WSP data
Of those submitting WSPs registered employers in the Western Cape employed the largest number of people while employers in Limpopo employed the least number of employees Free State has a small number of employees covered by WSPs submitted to the SETA whereas Eastern Cape with a relatively small number of registered farms has a very large number of employees on farms submitting WSPs Given this variance between provinces the use of WSP data for extrapolation purposes must be viewed cautiously
2009 WSP equity information was only provided for about a quarter of employees (25 637 or26)34 No information was available from the WSPs on non‐South Africans working on commercial farms
Table 19 Equity profile from 2009 WSP data African Coloured Indian White
Totals M F D M F D M F D M F D
8 040 5 785 38 5 097 5 228 24 22 25 0 811 556 11
580 417 03 493 505 02 468 532 00 589 403 08 13 863 10 349 47 1 378 25 637541 404 02 54 100
Total EquityTotal Male Total Female Total Disability
13 970 11 594 73 545 452 03
Source AgriSETA WSP data
Using currently available data it is not possible to provide disaggregated employment data by sub‐sector This will require a small change in the way that gender race and disability data is
34 Some employers did not complete race and gender information when giving their employment profiles
AgriSETA June 2010
codified during WSP data‐capturing including allocation by sub‐sector What can be stated is that employment of males is more dominant than that of women and more Africans are employed in the sector than other groups Employment of people with disabilities is below 1
21 Skills demand
The National Education and Training Strategy for Agriculture (AET Strategy)
The AET Strategy developed by the Department of Agriculture Fisheries and Forestry (in consultation with various key stakeholders in the agricultural sector) highlights priority skills needs and constraints within the sector and categorises needs within the following 5 broad areas
1 Agricultural production ndash requesting that the past focus on a narrow band of commodities (relevant mainly to the commercial sector) and related research be expanded to address the needs of small‐scale and subsistence farmers (eg more focus on mixed farming and rural livelihood sustainability skills)
2 Agricultural engineering ndash with specific focus to be placed on technologies suitable for small‐scale farmers (eg relevant and post‐harvesting techniques related to processing and storage of produce) ndash to address this need the scarcity of agricultural engineers requires attention
3 Agricultural economics ndash a critical need was identified for general agricultural economic skills (ranging spectrum of farm planning farm management enterprise management marketing finance etc) ndash with the need to training both farmers and extension officers in such fields
4 Agricultural development ndash a specific need was identified to develop agricultural extensionists in supporting especially emerging and small‐scale farmers over the full spectrum (a need exists for both new curriculum in the training of new extensionists and the re‐training and upgrading of existing officers)
5 Veterinarians ndash the need to develop state veterinarians in order for the state to perform its role and function (particularly in its preventative monitoring and regulatory role and function)
AGRISETA sector skills planning demand data (2008‐2009)
The following section reflects initial research on skills demand in the Agricultural sector arising from the sector analysis (section 1) previous AGRISETA skills demand research for Sector Skills Planning during 2005‐2009 and analysis of WSP data from 2009 With the introduction of the Organising Framework of Occupations and agreement on definitions for scarce and critical skills in 200506 the AGRISETA undertook an extensive research and consultation processes to determine skills development priorities for the sector The research methodology employed was based on the a four dimensional topology for establishing and evaluating skills needs illustrated in the figure below
Agriculture Sector Analysis 31
AgriSETA June 2010
Agriculture Sector Analysis 32
The identification and prioritisation of skills needs was also undertaken from a key stakeholder and beneficiary perspective Consideration was given to needs of the following groups
bull The unemployed ndash helping them gain andor regain entry to the labour market bull The economically inactive ndash helping them to become economically active bull School leavers ndash helping them gain access to further education and training opportunities
and thus facilitating their entry to the job market bull Entrants to the job market ndash facilitating employment and integration into the work culture
and work ethic (improving the employability of an individual) bull Those currently employed in the sector ndash increasing their competency and opportunities
for advancement creating a career path and offering continued job security enhancement of value adding to the sector improving their prospects for better employment opportunities
bull Organisations and enterprises within the sector ndash making sure that skills development and knowledge creation occurs in such a way as to improve the sectorrsquos viability and allowing companiesenterprises to become more sustainable and profitable along the way improving productivity competitiveness and innovation within organisations
In organising and reporting the identified priority skills development needs (200809) the following structuring approach was followed
Tier 1 The four categories of needs as per the Topology presented above were used for the identification evaluation and grouping of needs
Pay conditions
Image
RECRUITMENT DIFFICULTY
SKILLSGAP
SKILLSSHORTAGE
LABOURSHORTAGE
Firms experience difficulty recruiting This does not necessary imply a skills shortage ndash may indicate a poor image remuneration etc
Those currently in work do not have the requisite skills set to carry out their job to an optimum standard
Required skills are in short supply when compared with the demand across the whole labour market
Regardless of skills levels a situation exists where there is simply not enough supply of labour to meet demand
Pay conditions
Image
RECRUITMENT DIFFICULTY
SKILLSGAP
SKILLSSHORTAGE
LABOURSHORTAGE
Firms experience difficulty recruiting This does not necessary imply a skills shortage ndash may indicate a poor image remuneration etc
Those currently in work do not have the requisite skills set to carry out their job to an optimum standard
Required skills are in short supply when compared with the demand across the whole labour market
Regardless of skills levels a situation exists where there is simply not enough supply of labour to meet demand
Figure 4 Topology for identifying skills development priorities
Source AGRISETA SSP Annual Update August 2009
AgriSETA June 2010
Tier 2 Within each of the first tier groupings needs were further broken down and organised per target group At this second level needs were grouped by
o General skills development needs (cross‐cutting over different target groups) o Needs experienced by small scale farmers (this group included subsistence
farmers new emerging land reform beneficiaries and small‐scale AgriBEE farmers) o Needs within the commercial agricultural sector (per sub‐sector groupings where
specific needs for such were identified ndash both on‐farm needs and within the secondary sub‐sector or related agri‐businesses)
o Needs of the Department of Agriculture Fisheries and Forestry (DAFF) To further guide and direct the identification and selection of scarce and critical skills the following factors or criteria that could reflect the importance (impact and effect) of a skills shortages were developed as an identification framework
1 Basic Skills Development Promoting basic literacy and numeracy and raising the base level of education for the sector improving the work and livelihood of existing workers
2 Employability Making the employee more employable by improving the fit between their skills and the sector needs
3 Enterprise Viability Improving the capability and feasibility of the enterprise by increasing its effectiveness of or possibilities for profit generation etc
4 Enterprise Sustainability Allow enterprises to survive and grow over an extended period of time without compromising the value of renewable resources thereby creating long‐term meaningful employment for larger numbers of people
5 Sector Growth Enabling the sector to develop or pursue new opportunities or improve the effectiveness of current operations
6 Sector Competitiveness Enabling the sector to compete more effectively in the international arena improving market intelligence and interpretation productivity cost efficiency etc
7 Human Resource Development Capacity Improving the access to quality provision of training to the agri sector
Based on this research and consultation framework the following skills development needs and priorities were identified
Agriculture Sector Analysis 33
AgriSETA June 2010
GENERAL NEEDS SMALL‐SCALE FARMER
NEEDS COMMERCIAL SECTOR
NEEDS DAFF NEEDS
RECRUITMENT RELATED SKILLS NEEDS Primary agriculture is the entry point into the world of work for large numbers of people in rural areas However the sector has negative connotations amongst sections of the youth and in parts of the country and is viewed as a last resort for some in the search for employment) The effect is that despite an unemployment rate of approximately 26 (now over 30) farmers find it difficult to recruit workers to meet seasonal demands This has resulted in the government approving the contracting of foreign labour to meet such temporary needs (workers are recruited mainly from Zimbabwe and Mozambique)
Labour in this farming sector is provided primarily by family members and no real recruitment constraints can be identified
The agricultural sector still manages to attract technical and management skills as it is perceived to include a better lifestyle and there is a strong tradition of agriculture in SA Increasing crime related security risks associated with farming may have a negative impact
The Department has identified a number of occupations in which they are experiencing long‐term vacancies Some of these result from a general shortage of such skills in SA while others arise from the inability of the public sector to compete with the private sector (less favourable employment image working conditions and equity considerations) Priority vacancies include Veterinarians Agricultural
Engineers Plant Health
Specialists Agricultural
Statisticians Plant Health Pest Risk
Analysts ICT Specialists Agricultural
Economists Agricultural Food and
Quarantine Technicians
Agro‐meteorologists Pasture Scientists Plant Production
Specialists Specialised Food
Analysts SKILLS GAPS RELATED NEEDS
bull Low literacy and numeracy levels ndash both amongst workers within the sector at large and at ownermanager level in many of the small‐scale farming
bull Farm management
Farm Management (Mainly owners managers) bull Farm management amp
entrepreneurship bull Resource
management and record keeping
bull Financial planning
A critical constraint is the poor educational levels of a large proportion of the labour force in the sector demanding a considerable effort and investment in ABET and other life skills
A particularly big need exists for skills upgrading amongst Extension Officers ndash particularly with regard to redress the historical neglect of small‐scale farmers and resource strapped farmers
Agriculture Sector Analysis 34
AgriSETA June 2010
Agriculture Sector Analysis 35
GENERAL NEEDS SMALL‐SCALE FARMER
NEEDS COMMERCIAL SECTOR
NEEDS DAFF NEEDS
skills (and general management skills in other agricultural businesses) coupled with a business orientation and entrepreneurship skills
bull A general need to increase compliance with environmental occupational health and safety animal welfare produce safety and hygiene standards regulations and requirements (local and international standards)
and management bull Project management bull Business plan
development Marketing and processing bull Processing and
packaging bull Transport
management bull Marketing produce
including branding bull Planning for
marketing bull Knowledge of
markets Technical knowledge and skills bull Production
management (related to specific enterprise)
bull Demonstration of production techniques
bull Natural resources management
Mechanical knowledge bull Farm maintenance bull Repairs of machinery
and equipment bull Electrical
maintenance and installation
programmes Need for improved management skills and relevant technological knowledge for increasing productivity levels and improved production methods Rising importance for environmentally responsible production and processing management systems Rising competitive and international markets increases need for business and marketing abilities among owners and managers Increasing requirements for compliance with environmental health and safety and international trade standards Information technology although not a priority is increasing in importance Business management ability is becoming increasingly important as more farmers are making decisions about restructuring their businesses diversification and developing supplementary sources of income
Critically improved farm management and business skills within an agricultural context to support the majority of BEE and emerging farmers Skills upgrading requirements for existing Extension Officers include bull Agricultural
economics bull Agricultural
management bull Business and
financial management
bull Technical and production related skills including o Animal husbandryo Poultry o Crop production o Horticulture
SKILLS SHORTAGES Generally SA has a shortage of entrepreneurs and people who have the business acumen drive motivation and
The profile of these farmers reflects a large contingent of older and less educated people who are generally less flexible tend to stick to
The commercial agri sector will increasingly have to compete in the global market and the ever increasing need to increase productivity to
DAFF us experiencing problems are especially sourcing people in specialised science related fields (learning fields experiencing few
AgriSETA June 2010
Agriculture Sector Analysis 36
GENERAL NEEDS SMALL‐SCALE FARMER
NEEDS COMMERCIAL SECTOR
NEEDS DAFF NEEDS
perseverance to become a successful farmer Given the high risks involved in the agricultural sector (natural elements outside onersquos control) the agri sector does not compete successfully for this ldquoscarce resourcerdquo Moreover as with other professional and skilled occupations there is a tendency for younger qualified people to move to urban areas
known practices and are less likely to experiment with new technology Within this target group candidates with good entrepreneurial ability are scarce There is a perceived shortage of Agricultural Extensionists and advisors to assist this target group However a large pool of young unemployed graduates exists who could assist such emerging farmers if they were mobilised and made accessible to farmers Similarly the potential pool of retired commercial farmers who could serve as mentors to this target group
remain profitable and viable it can be stated that many of the existing farmers and managers owners lack business management and entrepreneurial orientation Equity policy and the need to become BEE compliant requires that commercial enterprises appoint and develop black owners directors managers Changing local and global consumer preferences require farmers to change traditional farming methods and practices Skills and knowledge requirements include bull Global food and
international quality standards
bull Product traceability requirements
bull Organic produce and products
Specific occupations identified as being in short supply are
bull Production Managers (food processing)
bull Product specialisation to international specifications (research skills)
bull Forklift drivers heavy vehicletruck drivers and mobile plant operators
bull Experienced and competent artisans (millwrights electricians fitters
enrolments andor pass rates at HET institutions with the result that too few qualified persons come onto the labour market) Examples of such skills shortages identified by the Department include Agricultural Engineers bull Plant Health
Specialists (Nematology Entomology Plant Pathology)
bull Statisticians (specialised agricultural knowledge)
bull Plant Health Pest Risk Analysts
bull Agricultural Economists (production and resource economists)
bull Agricultural Food and Quarantine Technicians
bull Agro‐meteorologists Early warning Specialists
bull Pasture Scientists bull Plant Production
Specialists (eg ornamental crops hydroponics)
bull Specialised Food Analysts (pesticide residue analysts processed food and dairy analysts wine and spirit analysts)
AgriSETA June 2010
Agriculture Sector Analysis 37
GENERAL NEEDS SMALL‐SCALE FARMER
NEEDS COMMERCIAL SECTOR
NEEDS DAFF NEEDS
and turners bull Agricultural
Equipment Technicians
bull Pest and weed controllers
bull Horticultural specialists
LABOUR SHORTAGES AND RELATED SKILLS NEEDS Given an employment rate of some 26 (2009 currently estimated at over 30expanded definition) per definition there cannot be a labour shortage It is however difficult for people who have never worked before to integrate into the agricultural sector workforce Coupled with an aging workforce (30‐60 being over 40) means that most agri enterprises will within the next 5‐10 years be looking at replacing a large proportion of their workforce There could be an insufficient pool of people willing and able to participate The impact of HIVAIDS is also not always factored in to understanding the diminishing pool of resources available Labour shortages have been reported within selected geographical areas and in particular occupations Examples include cane cutters in the sugar industry chicken catchers in the poultry industry pickers in the fruit industry and animal handlers in feedlots as well as dairy parlour workers It is however believed that these shortages may reflect a recruitment problem as a result of the very harsh working conditions and the relatively poor remuneration (which makes these occupations unpopular) At present such ldquoshortagesrdquo are addressed through contracting labour from neighbouring countries
AgriSETA WSP analyses
Skills demand in the commercial agricultural sector
Information for demand for skills from WSP data is available for 1 673 employers who submitted their WSPs for the 200910 period The table below shows data on sub‐sector WSP submission relative to size of the sub‐sector as well as subsector data from all registered organisations and those who submitted WSPs Data for registered employers shows that there were 239 076 employees employed by the 17 234 registered organisations As previously stated 97 898 employees were employed by the organisations submitting WSPs This constitutes 41 of employees employed by registered organisations
Table 20 Employment and sub‐sector data drawn from WSP analyses
Sub‐sector
All Re
gistered
Employers
Small employers (0‐49)
Med
ium and
large
employers (50+)
Total W
SPs received
Total W
SPs received
as of
all registered em
ployers
WSP
received med
ium and
large orgs
WSPs received
as of
med
ium amp large em
ployers
WSPs received
small
employers
WSPs received
as of small
enterprises
EmployeesPer
Profile
CoffeeTea 40 33 7 9 23 5 71 4 12 483 Fibre 1 710 1 676 34 34 2 22 65 12 07 6 539
AgriSETA June 2010
Agriculture Sector Analysis 38
Sub‐sector
All Re
gistered
Employers
Small employers (0‐49)
Med
ium and
large
employers (50+)
Total W
SPs received
Total W
SPs received
as of
all registered em
ployers
WSP
received med
ium and
large orgs
WSPs received
as of
med
ium amp large em
ployers
WSPs received
small
employers
WSPs received
as of small
enterprises
EmployeesPer
Profile
Fruit 371 277 94 162 44 76 81 86 31 27 873 Grain 648 581 67 77 12 48 72 29 5 22 129 Milling 335 279 56 61 18 35 63 26 9 4 630 Pest Control 213 209 4 8 4 2 50 6 3 119 Poultry 391 305 86 66 17 46 53 20 7 19 187 Primary 12 121 10 776 1 345 1144 9 513 38 631 6 136 034 Red meat 1107 1 018 89 70 6 45 51 25 2 7 475 Seed 167 149 18 24 14 13 72 11 7 2 127 Sugar 71 45 26 13 18 10 38 3 7 10 478 Tobacco 60 46 14 5 8 3 21 2 4 2 002
Totals 17 234 15 394 1 840 1 673 10 818 44 855 16 239 076
Source 1 AgriSETA WSP 2009 data
Only 10 of all registered employers submitted WSPs for the 200910 period Of these 49 were medium and large sized employers and 51 small However only 16 small employers submitted their WSPs relative to the number of registered small employers and 44 medium and large employers submitted WSPs relative to the number of registered medium and large employers As such skills demand statistics provides more representative data on the requirements of medium and large employers Data for skills demand in the commercial agricultural sector is based on data for permanent employees as well as casual and seasonal employees
Skills demand forecasting by AgriSETA
Forecasting for skills demand the AgriSETA has estimated that the demand for skilled employees at different levels in the next few years is 510 686 This is based on WSP data analyses over the last 5 years and projected demand for the formal commercial agricultural sector and factoring in the demand that at maximum would result from completion of the land restitution programme in South Africa The table below reflects the skills that are on demand as well as the estimates for demand over the next five years by major occupational category35
35 AgriSETA 2010
AgriSETA June 2010
Table 21 Demand for skills by occupational category
Major Occupation (OFO)Estimated Demand
Group Title1 Managers (commercial and small emerging farmers) 264 3702 Professionals 4 1413 Technicians and Trade workers 8 9255 Clerical and administrative workers 8006 Sales workers 4007 Machinery operators and drivers 5 8008 Elementary workers 226 250
Total 510 686Source AgriSETA WSP data and SSP demand forecasts
Research needs going forward
As has been set out in the sector analysis and the scenarios derived from that analysis the sector is faced by both significant and profound change and also great uncertainty It therefore follows that the task of focussing limited resources (basically levy income in the formal sector and NSF funds for the emergent farming sector) is difficult Whilst the general thrust of training remains broadly as described in the 2006‐10 SSP Updates some considerable work is required to achieve targeted effective interventions during the 2011‐2016 period The following research questions will need to be addressed in preparing the next SSP
bull In relation to the managers and owner‐managers of commercial farms and enterprises what skills are needed to enable them to help bring about the more optimistic scenario and manage the risks associated with the less optimistic ones
bull In terms of professional and technical competencies do the current education and training institutions coupled with the learning programmes available through the AgriSETA (learnerships skills programmes and the like) meet the needs of the sector
bull In the emerging agricultural sector do the current programmes funded by sources external to the AgriSETA (eg NSF) meet all the identified needs What gaps are there and how should they be addressed
bull In relation to governmentrsquos growth strategy and industrial action plans what skills are required for developing the aquaculture sub‐sector What programmes are available How can the SETA support the skills needs for this sub‐sector
bull Given the increasing levels of casual and contract labour how can skills be developed to meet the needs of the formal commercial sector and the emerging enterprise sector
bull How can the demand in each of the priority areas be quantified and agreement be reached on numbers of people to be trained
Agriculture Sector Analysis 39
AgriSETA June 2010
SECTION 3 Skills Gaps and scarce skills
Scarce skills at the DAFF
The level of scarce skills at DAFF can be determined by the vacancy rate While the average vacancy rate in the department as at 31 March 2009 was 17 there were some posts that had very high vacancy rates as reflected in the table below Indicating the possibility that the Department is experiencing difficulties in finding suitable candidates in the South African labour market to fill these posts
Table 22 Scarce skill occupations and vacancy rates (DAFF March 2009) Critical occupations Number of posts Posts filled Vacancy rate ()
Agricultural animal oceanography forestry and other sciences
167 119 287
Engineering sciences related 2 1 50Engineers and related professions 13 6 538Farming forestry advisors and farm managers 11 4 636Finance and economics related 73 53 274Horticulturists foresters agricultural and forestry technicians
350 221 369
Legal related 6 4 333Mechanical engineering technicians 3 2 333Risk management and security services 6 4 333Social sciences related 1 0 100Veterinarians 34 24 294
Source DAFF Annual Report 20082009
Skills are also scarce at senior management level The department also reports on difficulties it has filling senior management services vacancies with some of them staying vacant for up to twelve months because no suitable candidates can be found The department would then resort to re‐advertisement and head hunting This was the case with 22 of 18 SMS posts in March 2009
Scarce skills in the commercial sector
The following occupations have previously been projected as scarce (extremely hard to fill vacancies) by AgriSETA in the commercial agricultural sector over the next five years
Table 23 Scarce and critical skills in the commercial agricultural sector
Occupation Code
Group Occupation Critical Skills Intervention Comments
139903 Managers Laboratory Manager
Technology AI nutrition
HET
221101 Professionals Accountant (General)
General HET
221102 Professionals Management Accountant
Farm financial management
HET Focus on support advice to farmers new enterprises
222101 Professionals Commodities Trader
Export administration supply chain
FET Learnership Skills
Agriculture Sector Analysis 40
AgriSETA June 2010
Agriculture Sector Analysis 41
Occupation Code
Group Occupation Critical Skills Intervention Comments
management Programme
224301 Professionals Economist Agricultural HET
Mainly for Department of Agriculture and para statals commodity organisations
233101 Professionals Chemical Engineer
Chemical processes in food production
HET Industries such as sugar processing
233301 Professionals Electrical Engineer
Installation and maintenance
HET Processing industry
233401 Professionals Electronics Engineer
Computerised production prosesses
HET Processing industry
233501 Professionals Industrial Engineer
Productivity and efficiency
HET Processing industry
233904 Professionals
Instrument Engineer (Defence Force)
Installation and maintenance
HET
Not for defence ‐ sugar industry
233502 Professionals Mechanical Engineer
FETHET Equity reasons
233902 Professionals Agricultural Engineer
Farm layout and infrastructure
HET Mainly in Government
311101 Technicians and trades workers
Agricultural Technician
Installation and maintenance
FETHET
234102 Professionals Agricultural Scientist
Agri research HETFET Especially in horticulture
234201 Professionals Chemist HET Processing industry
234202 Professionals Food Technologist
Food safety HACCP
FETHET Across sector
234701 Professionals Veterinarian HET Mainly in Government
311101 Technicians and trades workers
Agricultural Technician
Farm infrastructure
FET Mainly needed in government
311401 Technicians and trades workers
Chemistry Technician
FETHET EE reasons
312907 Technicians and trades workers
Chemical Engineering Technician
FET Learnership
Mainly EE reasons
312402 Technicians and trades workers
Electronic Engineering Technician
Weak stream production infra
FETHET Mainly tobacco industry
233904 Professionals
Instrument Engineer (Defence Force)
Instrument technician
FET
Occupation needed Instrument Technician (not defence force) Mainly sugar processing sector
321202 Technicians and trades workers
Diesel Motor Mechanic
FET Learnership
To include tractor mechanic
321204 Technicians and trades workers
Small Engine Mechanic
Agricultural equipment
FET Learnership
Throughout sector
AgriSETA June 2010
Agriculture Sector Analysis 42
Occupation Code
Group Occupation Critical Skills Intervention Comments
322301 Technicians and trades workers
Metal Fabricator
Artisan FET Learnership
322303 Technicians and trades workers
Welder Welder (First Class)
Artisan FET Learnership
323203 Technicians and trades workers
Fitter‐Welder Artisan FET Learnership
Mainly sugar ndash multi‐skilled
323202 Technicians and trades workers
Fitter And Turner
Artisan FET Learnership
Tobacco and sugar
323501 Technicians and trades workers
Millwright Artisan FET Learnership
Wide‐spread need
341101 Technicians and trades workers
Electrician (General)
Artisan FET Learnership
Wide‐spread need
342101 Technicians and trades workers
Air‐Conditioning And Refrigeration Mechanic
Artisan FET Learnership
Sugar pack houses cold chain
Source AgriSETA Sector Skills Plans
Supply of skills
South Africarsquos agriculture skills are produced in high schools agricultural colleges FET colleges and Higher Education institutions In high school a large cohort of learners take Agricultural Science as a subject In 2003 there were 42 Agricultural High Schools offering Agricultural Science as a subject These students and those in high schools taking the subject could progress to taking agriculture as a focus area for further education In 2004 there were 10 FET colleges offering vocationally directed agricultural programmes These FET colleges offered complete qualifications and short courses Eleven Colleges of Agriculture can offer qualifications up to degree level and 19 universities offer qualifications in Agriculture ranging from agricultural economics animal and plant sciences and horticulture among others at under and post graduate levels (Department of Agriculture 2006) While long term planning of skilling of new entrants in the sector can be done through close consultation between the sector agricultural schools and colleges FET colleges and HET institutions so that they teach relevant skills there are other avenues for training for those who are already employed in the sector for example skills programmes and learnerships There are 15 registered qualifications for the primary agriculture sub sectors Currently AgriSETA has 94 registered learnerships that can address the skills needs of the identified scarce skills These are captured in Appendix 2 AgriSETA has approved accredited a number of training providers across the country to deliver the theoretical and practical components of these learnerships These include agricultural colleges FET colleges and private providers Currently the AgriSETA has 246 registered and approved providers distributed nationally as follows
AgriSETA June 2010
Table 29 AgriSETA approved training providers (2010) Province Number of providers
Gauteng 72
(29)
KwaZulu Natal 20
(8)
Limpopo 35
(14)
North West 30
(12)
Northern Cape 3
(1)
Free State 15
(6)
Mpumalanga 14
(6)
Western Cape 26
(11)
Eastern Cape 31
(13) Total 246
The providers are small to large organisations In primary agriculture small providers appear to offer the most training in rural areas and community projects (AgriSETA 2010) Most of the operating providers will be in FET colleges and agricultural colleges The AgriSETA is unable to meet the total demands for skills across the duality of their sector There seems to be fairness in the approval of training for both permanent and casual and seasonal workers In 200809 the AgriSETA approved 559 learnerships as follows
Table 30 AgriSETA learnerships approved for grant purposes (2008‐2009)
Source AgriSETA learnership data analysis
Agriculture Sector Analysis 43
AgriSETA June 2010
Agriculture Sector Analysis 44
Provision of skills programmes in the same year attracted grants for 2 706 employees
Table 31 Participation by learners in skills programmes in the AgriSETA (200809)
Source AgriSETA Skills programmes data analysis
AgriSETA June 2010
APPENDIX 1 Skills demand in the Department of Agriculture Forestry amp Fisheries (200809)
Source DAFF Annual Report 2008‐20009
Agriculture Sector Analysis 45
AgriSETA June 2010
Agriculture Sector Analysis 46
Appendix 2 AgriSETA registered learnerships Registered Learnership NQF Level SAQA Registration NoLearnership in Agri Sales and Service 4 22 Q 220001 20 178 4Learnership Agricultural Machinery Technician 2 22 Q 220007 20 160 2Learnership in Specialist Agricultural Machinery Technician 5 22 Q 220009 21 258 5Agri Trade Processes 2 22 Q 220013 30 125 2FETC Meat Examination Applying Basic Business Principles 4 30 Q 3000 2823 164 4Further Education and Training Certificate Seed Marketing Execute Seed Trials 4 22 Q 220025 21 126 4Further Education and Training Certificate Seed Research and Development Certify as Seed Unit 4 22 Q 220027 21 121 4FETC Seed Research and Development Conduct a Field Inspection of a Seed Unit 4 22 Q 220028 20 120 4Seed Research and Development Operations Operate in a Team 3 22 Q 220020 22 121 3Seed Research and Development Operations Apply Basic Business Principles 3 22 Q 220021 22 121 3National Certificate Seed Processing and Packaging Operate in a Team 3 22 Q 220026 21 123 3Sugar Industry Technical Maintenance worker 2 22 Q 220011 39 128 2National Certificate Sugar Manufacturing and Refining Technical Maintenance 3 30 Q300003 23 146 3Further Education and Training Certificate Manufacturing Technical MaintenanceProduce Components by Performing Engineering Turning Operations
4 30 Q 3000 1321 173 4
FETC Manufacturing Technical Maintenance Produce Components by Performing Milling Operations 4 30 Q 3000 1521 173 4 FETC Manufacturing Technical Maintenance Develop and Fabricate from Complex Drawing 4 30 Q 3000 1420 173 4National Certificate in Sugar Technology 5 22 Q 220036 22 140 5Further Education and Training Certificate Sugar Processing 4 22 Q 220035 31 144 4National Certificate in Sugar Technology Processing Sugar Refining 2 22 Q 220037 28 124 2National Certificate in Sugar Technology Processing Juice Preparation 2 22 Q 220038 28 124 2National Certificate in Sugar Technology Processing Crystallisation 2 22 Q 220039 27 122 2National Certificate in Sugar Technology Processing Laboratory Practice 2 22 Q 220040 25 124 2National Certificate in Sugar Technology Processing Extraction 2 22 Q 220041 28 122 2NC Rooibos Production Applying Basic Business Principles 2 30 Q 3000 2427 130 2 NC Rooibos Processing Applying Basic Business Principles 2 30 Q 3000 2224 123 2 National Certificate Cigarette Production 3 22 Q 220046 23 121 3
AgriSETA June 2010
REFERENCES AgriSETA 2010 AgriSETA 20082009 Annual report Pretoria AgriSETA Agricultural Research Council httpwwwarcagriczahomeasppid=272 Avert South African HIV and AIDS statistics Available on httpwwwavertorgsafricastatshtm Centre for Development Enterprise 2008 Land reform in South Africa Getting back on track CDE Research No 16 DAFF 2010 Quarterly economic review of the agriculture sector Pretoria DAFF DAFF 2009 Annual report 20082009 Pretoria DAFF Department of Agriculture 2008 Strategic plan 2008 Pretoria Department of Agriculture DTI An introduction to the South African economy Available on httpwwwthedtigovzapublicationsagroprocessinghtm Eastern Cape Provincial Government Eastern Cape Provincial Growth and Development Strategy 2004 ndash 2014 Economic Commission for Africa 2009 Developing African agriculture through regional value chains Addis Ababa Economic Commission for Africa Economic Report Free State Province 2005 Provincial Growth and Development Strategy 2005 ndash 2014 GCIS 2010 SA Yearbook 200910rdquo Agriculture forestry and fisheries Pretoria GCIS Greenberg S 2010 Status report on land and agricultural policy in South Africa 2010 Institute for Poverty Land and Agrarian Studies School of Government University of the Western Cape Research report Ingelozi Management Solutions 2008 HIVAIDS in the South African agricultural sector Towards the development of a long term intervention Research report KwaZulu Natal Provincial Government 2006 KwaZulu Natal Provincial Growth and Development Strategy Limpopo Provincial Government Growth and Development Strategy 2004 ndash 2014 Mhone G (2000) Enclavity and Constrained Labour Absorbtive Capacity in Southern African Countries Geneva International Labour Office Moyo S The Agrarian question and the developmental state in South Africa In Edigheji O et al 2010 Constructing a democratic developmental state in South Africa HSRC PRESS
Agriculture Sector Analysis 47
AgriSETA
Agriculture Sector Analysis
National Treasury Republic of South Africa 2010 National Budget 2010 ndash National Budget Review 2010 Pretoria National Treasury Northern Cape Provincial Government Agriculture and agro‐processing sector strategy North West Provincial Government North West Provincial Growth and Development Strategy 2004 ndash 2014 Province of the Western Cape 2008 The Ikapa growth and development strategy White Paper SABCOHA SA Business Coalition on HIV and AIDS wwwsabcohaorg SACAU httpwwwsacauorghostingsacauSacauWebnsfHomehtmOpenForm South African Government 2010 20102011 ndash 20122013 Industrial Policy Action Plan Republic of South Africa Statistics South Africa 2005 Census of commercial agriculture 2002 Report No 110201 Pretoria Statistics South Africa Statistics South Africa 2009 Census of commercial agriculture 2007 Statistical release P1101 Pretoria Statistics South Africa Statistics South Africa 2010 General household survey 2009 Statistical release P0318 Pretoria Statistics South Africa Statistics South Africa 2010 Gross domestic product first quarter 2010 Statistical release P0441 Pretoria Statistics South Africa Statistics South Africa 2010 Quarterly labour force survey Quarter 1 2010 Statistical release P0211 Pretoria Statistics South Africa Vink N amp van Rooyen J 2009 The economic performance of agriculture in South Africa since 1994 The implications for food security Pretoria DBSA development planning division working paper series No 17 Webster E 2004 the Dual Economy from a book by Van Holdt K and Webster E Work restructuring and the Crisis of Social reproduction and 10 years of restructuring post apartheid workplaces University of Natal Press Workinfocom httpwwwworkinfocomfreesub_for_legresdatalraempassoc3htm Xingwana L 2008 Challenges and Opportunities for Land and Agrarian Reform towards 2025 Speech delivered at the Agri‐Consultation Protea Ranch Hotel Polokwane 30 July 2008
- Table of contents
- SECTION 1 THE AGRICULTURAL LANDSCAPE
- 11 Size and shape of the Agricultural sector
-
- Overview
- Distribution of agricultural production
- The structure of the agriculture sector in South Africa
- Categories of farming enterprises
- Employment trends
- Employment categories and remuneration
- Stakeholders in the Agricultural sector
-
- National government departments
- Sector representatives
-
- 12 Factors impacting development in the Agriculture sector
-
- Future sector economic growth and development
-
- South African sector growth plans (IPAP2)
- International Trade
- Global recession and rise in food prices
-
- Land reform
- Reliance on imports
- Water
- The labour market
- Consumer trends
- HIVAIDS
- Farm safety and security
- Broad-based Black Economic Empowerment
-
- Conclusions and scenarios
- SECTION 2 DEMAND FOR SKILLS
-
- AgriSETA registered employers and employee coverage
- Employee coverage in the AgriSETA
-
- 21 Skills demand
-
- The National Education and Training Strategy for Agriculture (AET Strategy)
- AGRISETA sector skills planning demand data (2008-2009)
- AgriSETA WSP analyses
-
- Skills demand in the commercial agricultural sector
-
- Skills demand forecasting by AgriSETA
- Research needs going forward
-
- SECTION 3 Skills Gaps and scarce skills
-
- Scarce skills at the DAFF
- Scarce skills in the commercial sector
- Supply of skills
-
- APPENDIX 1 Skills demand in the Department of Agriculture Forestry amp Fisheries (200809)
- Appendix 2 AgriSETA registered learnerships
-
AgriSETA June 2010
Agriculture Sector Analysis 19
Reliance on imports
Overall the Agriculture sector contributes positively to the balance of payments ldquoSouth Africa remains food secure The value of our exports increased by 464 from R33 656 million in 200708 to R49 278 million in 200809 During the same period the estimated value of imports rose by 12 from R34 009 million to R38 401 million resulting in a positive trade balancerdquo25
South Africa depends largely on world markets for seed production and agrochemicals Regarding seed production there are only three community seed production schemes in Limpopo and Mpumalanga being piloted with state funding Ten top large companies including two South African companies and multinationals have rights to over two thirds of registered seed varieties in South Africa Despite the dominance of genetically modified and hybrid seed in some sub‐sectors like maize sunflower and sorghum open‐pollinated varieties have been resilient in South Africa enabling the possibility of alternative seed sources not dependent on technological processes26 In relation to agrochemicals deregulation and liberalisation in the fertiliser sector led to the shutdown of local production capacity and South Africa became an importer of fertiliser for the first time in 2000 There are three large players in the fertiliser sector Sasol Nitro Yara and Omnia South Africa imports an estimated 70 of fertilisers and pesticides Fertiliser prices rose by over 200 between 2006 and 2008 but dropped somewhat after that However this hike signified the volatility of the agrochemicals industry and South Africarsquos dependency on imports and the potential risk for emerging farmers and food production of this dependence on imports as the country cannot control the prices making inputs both difficult to budget for and in many cases unaffordable The price of agrochemicals is also particularly influenced by the prices of oil and the exchange rate The general understanding in relation to job creation is that a weaker Rand will improve exports and therefore enable job creation Of course the down side of this strategy is that imports become more expensive So what may be an advantage for those sub‐sectors who are expanding their export volumes those relying on imported agro chemicals will be under increased pressure
Water
Water is both an essential and scarce resource for the agriculture sector and is being threatened by climate changes Crop production relies heavily on water and yet access to water is not being addressed in a systematic way in the land reform processes Greenberg suggests that the relationship between land reform agricultural support and water resource provision is inadequate and a way to address this could be established by linking water provision to land transfer or investing in irrigation for both commercial and resource‐poor farmers However investing in irrigation in the context of water scarcity and climate change may not be the best option What could be needed is finding ways to maximise efficiency of the 60 of South African
25 Department of Agriculture Forestry and Fisheries Strategic Plan 201011 26 Greenberg 2010
AgriSETA June 2010
Agriculture Sector Analysis 20
water used for irrigation by for example using methods such as drip or micro‐irrigation which are expensive to set up but which reduce water wastage by 5‐1027 The Department of Water Affairs is responsible for managing water supply and has to give authorisation for agricultural projects and other developments The department needs to be seen as an important stakeholder in the agricultural sector
The labour market
South Africa recorded an unemployment rate of 243 in 2009 (narrow definition) If people who are no longer actively seeking work are considered the broad unemployment rate rose from 267 to 313 illustrated in the figure below As a direct consequence of the global economic downturn in 2008 870 000 formal jobs were lost in 200928 Others have quoted a figure of over 1 million
Figure 3 Official unemployment in South Africa 2003 ‐2009
Source National Treasury 2010
Annual employment loss followed sector growth patterns with agriculture mining manufacturing and trade facing the highest job losses as their sector growth contracted Unemployment is especially a major problem among lower skilled workers and younger people Youth employment in the 15 ‐24 year age group has fallen by 219 000 (136) and 483 of people in this age group are unemployed Employment of semi‐skilled and unskilled workers has contracted by 527 000 and male employment has gone down by 550 000 (71) while that of women has decreased by 320 000 (52) The number of discouraged workers ie those no longer actively seeking work has increased from 518 000 to 17 million29 Clearly the existence of a very large pool of largely unskilled unemployed workers has an impact on the farming sector It drives wages down and creates opportunities for casualisation and the expansion of labour contract agencies and brokers In addition there are significant numbers of foreign nationals mainly from Zimbabwe and Mozambique who are seeking work and often finding it on farms and in primary processing and packaging plants There are benefits to the
27 Greenberg 2010 28 National Treasury 2010 29 National Treasury 2010
AgriSETA June 2010
Agriculture Sector Analysis 21
sector with skilled and semi‐skilled workers coming into the labour market and being absorbed into the workforce and helping raise productivity levels However at the lower skilled end of the market the existence of this pool brings further casualisation and downward pressure on wages Tensions are likely to increase and further protests either in the form of xenophobic outbreaks or actions against farmers may well increase A view often expressed by farm employers is that current labour legislation makes dismissing workers difficult and so the availability of labour without entering into contracts of employment is an attractive way of avoiding the legislation and its obligations Organised Labour is seeking to restrict these opportunities through either regulating or eliminating labour brokers and efforts are being made to regulate the use of foreign labour However for the foreseeable future the trend is for formally employed people to be reduced in number In relation to the emergent sector there will also be a reluctance to enter employment contracts with workers The fact that many households are engaged in some form of largely unpaid agricultural work means that there is significant casual work dating back many years Helping change this situation into one where casual or unpaid jobs are transformed into formal jobs with regular wages will take time It is also likely that as some emergent farms become established they will act similarly to established farms and institute a form of casual labour rather than expanding a workforce for which they would have to take a level of responsibility From an AgriSETA perspective these labour market trends mean that whilst levy income can be directed at a relatively small labour pool one that is manageable in terms of planning and implementation the size of the informal casual and unemployed labour force in the sector ‐ for whom no levy is paid and who have no employer to plan for their skills needs ndash is very large and its needs almost unlimited Clearly the relationship with the National Skills Fund (NSF) becomes critical in respect of the entire non‐levy income sector Again the level of support available from non‐levy income sources will be an important variable in looking at future sector skills development scenarios
Consumer trends
South Africa currently produces enough food to meet the needs of its population However consumption of three main staples maize wheat and vegetables has been volatile since 1985 and remains below 1990 levels Consumption of maize and vegetables by South Africans is 17 and 32 less respectively than in 198530 The main reasons for this lie in the growing levels of poverty and the difficulties that families have in purchasing nutritious food Whilst government has increased the levels of social grants and increased the number of people receiving grants to around 13 million the incomes of poor families have been badly hit by a range of factors including job losses and rises in food prices The approximately 1 million people who lost their jobs in 20089 meant a loss of income for many millions of dependents Rises in food prices have also had a disproportionate impact on the poor Whilst food is available it is often not accessible to families on the income levels that they have to manage within The result is that less and less nutritious food is purchased which in turn impacts on the ability of farmers to sell their products locally 30 Greenberg 2010
AgriSETA June 2010
Agriculture Sector Analysis 22
Whilst there is no evidence that government will reduce its efforts in relation to poverty relief and social benefits including such programmes as school feeding schemes and food parcels during periods of drought the state of public finances may not enable to support the poverty that grips many rural areas If real income levels for the poor were to rise it could have a significant impact on the economy of the agricultural sector Equally an improvement in the rural economy with increased agricultural production and jobs would dramatically impact on the capacity of people to buy nutritious food Achieving a positive growth path in rural areas is a huge challenge for government and one that is key to governmentrsquos Medium Term Strategic Framework and Industrial Policy Action Plans
HIVAIDS
South Africa has a high prevalence of HIV and AIDS The HIV prevalence among people aged two and above was estimated at 109 in 2008
Table 15 Estimated HIV percentage prevalence by age group (2002 ndash 2008)
Age 2002 2005 2008 Change
Children (2‐14 years) 56 33 25 ‐31
Youth (15‐24 years) 93 103 87 ‐06
Adults (25 and older) 155 156 168 13
15‐49 year olds 156 1692 169 13
Total (ages 2 to 49) 114 108 109 ‐05 Source Avert 2009
The table above shows that HIV prevalence is highest amongst those aged 25 years and older Given youth labour market analyses which point to people from previously disadvantaged backgrounds mainly African males accessing formal employment for the first time at age 25 ‐27 this population can be held to represent people in employment Research31 has estimated that by 2020 the pandemic will have claimed at least 20 of employees in the agricultural sector Southern Africa
in
HIV and AIDS have significant ramifications in the agricultural sector for both commercial farming and subsistence farming The implications include
bull Decrease in cultivated land bull Focus on less labour intensive crop and animal production bull Decrease in womenrsquos agricultural productivity as they take on a more care giving role bull Loss of skills bull Increase in absenteeism from work bull Decrease in daily work outputproductivity because workers are weaker from infections
There are suggestions that the impact of the pandemic in South Africa demands sectoral intervention although this may be difficult in the agricultural commercial sector as
bull Seasonal workers who seem to be more vulnerable to infection because of their low socio‐economic status are not in one place long enough for care programs Further
31 Ingelozi Management Solutions 2008
AgriSETA June 2010
Agriculture Sector Analysis 23
farmers and employers may not feel responsible for seasonal workers in the same way they would invest in their permanent employees
bull There may be uncertainty around land reform which may put HIV intervention on farms on the back burner
bull There are no policies that enforce HIV education and care on farms in the same way that legislation like BEE does for ownership As a result HIV intervention may be left to goodwill and employers may feel it is more important to comply with issues that are monitored
Farm safety and security
South Africa has been plagued by unacceptably high levels of violent crime and murder for many years now Farms have experienced this and those living on farms feel and are extremely vulnerable The South African Chamber of Commerce and Industry (SACCI) has argued that
Using the nominal GDP figure for 2009 of R24 trillion a 322 percent contribution of agriculture to GDP and an estimate of 39982 farms (as at 2007) in South Africa the cost of a murderattack on a farm to the economy was R1932869 per annum
SACCI acknowledges that this estimate is flawed as it does not take into consideration the fact that farming units contribute differently to GDP and that not every attack or murder contributes to farm shut down or loss of productivity However if not addressed these attacks could lead to loss of farming sectors as farmers migrate to lsquosaferrsquo regions This will affect employment and GDP contribution of the sector The need for safety and security on farms may also shift farmersrsquo focus in skills development to include personnel who have skills in safety and security
Broad‐based Black Economic Empowerment
The aim of the AgriBEE Charter (gazetted in 2008) is to increase the involvement of black business in agriculture through ownership and control as executives and senior managers of new and existing agricultural businesses The extent to which AgriBEE is transforming the sector is not known as it is too early to tell but a recent survey conducted by ABC and the IDC showed that among the ABC respondents in 2007 46 of enterprises were busy constructing a BEE strategy and 46 claimed to be implementing a BEE strategy A survey of the dairy industry in the Western and Eastern Cape in 2008 showed that only 6 of firms had a BEE strategy in place It also seems from survey data that companies are focusing on the skills development and socio‐economic aspects of BEE rather than on ownership32 It would appear that although there have been some significant BEE purchases of viable farms and some employee empowerment projects including some quite high profile ones in the Cape Winelands the extent of ownership change had been limited One of the factors is the very high level of single person or family ownership in the agricultural sector BEE is more straight forward in the corporate world where shares can be exchanged For a family business it is a matter of selling off part or all of the land and the tendency is to sell off those areas of the farm that are expendable from a business sustainability perspective
32 Greenberg 2010
AgriSETA June 2010
Whilst there is discussion in government about the ending of the ldquowilling buyer willing sellerrdquo concept the Constitution itself provides for property rights and so although some pressure may be exerted through legislation and regulation the extent and speed of change may not be fast The mechanisms for encouraging the transfer of significant levels of ownership have not yet been created The focus of the SETA is therefore likely to be more the beneficiaries of land reform and emergent farmers though projects of a BEE nature can be targeted as they arise
Conclusions and scenarios It is useful when looking at possible scenarios to examine the key variables or uncertainties and to project how variations one way or the other will have an impact on the development and growth of the sector From the sector analysis and factors that are contributing to change in the sector there are some key factors that seem to emerge First appears to be the economy and related issues of the labour market and the challenges of labour absorption in an enclave economy These factors determine on the one hand whether there will be growth and development and on the other whether such improvements will result in improved employment opportunities and the creation of a virtuous cycle of development Second is the role of the state and the various government departments whose plans and work impact on the agricultural sector Related to this is land reform that is inevitably driven by the state and not the owners of land or the landless The view expressed by many engaged in agrarian reform is that the state must play a significant role It becomes clear that a successful agricultural enterprise requires a number of factors to be in place to be successful These include access to land (Department of Rural Development and Land Reform) agricultural support within a supportive agricultural framework (Department of Agriculture Forestry and Fisheries) access to consistent water supply (Department of Water Affairs) access to finance (Department of Trade and Industry various state agencies) conducive labour market regulation (Department of Labour) sound industrial policy (Department of Trade and Industry) economic planning and macro policy (Department of Economic Development National Treasury) and appropriate education training and skills development (Department of Higher Education and Training the Human Resources Development Council NSA and the SETA) There are other government departments as well as provincial and municipal structures that also play a role The following analyses show how the four variables
economic growth and development role of the government labour market changes and land reform)
impact positively or negatively on the growth of the sector and the demand for skills
Agriculture Sector Analysis 24
AgriSETA June 2010
Agriculture Sector Analysis 25
HHIIGGHH GGRROOWWTTHH SSCCEENNAARRIIOO
The economics of the sector Role of government
The economy in SA and globally continues to revive albeit slowly for the next few years
Roles and integration of national government departments are clarified Specific functions are agreed processes put in place and personnel appointed with the required skills
International trade agreements are still weighted infavour of US and EU but progress is being made and specific blockages are addressed in bilateral talks
The roles of Departments (DWA DAFF DRDLR DoL DTI DED DHET) are clarified with appropriate joint plans and coordinating structures
The rural economy gradually improves with the buying power of the poor increasing and more stable markets created for local produce
For each of the functions agreed in each of the related departments appropriate structures and systems are put in place and staff trained
Exports increase in key areas identified in IPAP 2 and the Rand exchange rate stabilises at a level not too much different than it is today
Specific capacity is put in place at local level to support implementation of land reform and rural development
There is a growing understanding of the concept of dualism and the need to intervene with labour absorption and development mechanisms
Land claims are all finally settled and ownership and tenure is resolved There is a serious drive to establish effective agricultural enterprises
An understanding is reached on the role of agencies and labour brokers and abuse is curbed
The willing buyer willing seller approach is resolved and enables viable land to become black owned
Some relaxation of labour market regulations are agreed that maintain some minimum standard of employment but assist absorption
Land transfer to black and emergent farmers is done in a manner that integrates then into the supply chains of the sector
Mechanisms are found to address skills needs in the context of casual and seasonal work patterns
Financing of land reform and transfer is done on the basis of agreed development plans including skills
Labour market reform Trajectory of land reform LLOOWW GGRROOWWTTHH SSCCEENNAARRIIOO
The economics of the sector Role of government departments The economy in SA and globally stagnates at current levels and the economy struggles to pick up after the temporary 2010 World Cup boost
A lack of purpose at government level means limited progress for another five years Land reform remains a commitment without a plan
International trade agreements are still weighted infavour of US and EU and protectionism increases as a result of the global recession
The roles of Departments (DWA DAFF DRDLR DoL DTI DED DHET) are unclear and there is no proper co‐ordination
SArsquos Gini coefficient continues to worsen with rural poverty increasing and local economies declining
There is a lack of effective structures systems and processes to implement policy across departments
Rand volatility causes problems for importers and exporters Well established markets are maintained but exports decrease
At local level the decline in the agricultural extension officer functions continues and limited practical support is available
Understanding of the rural economy is so diverse that stakeholders cannot agree the problem let alone the solution to low absorption levels
Land claims take too long and land reform processes leave potentially productive land poorly developed and managed
Casual labour and labour brokers remains an issue of dispute Confrontation results in bitterness and resentment
The impasse caused by a rigid interpretations of property clauses in the Constitution continues to stall achievement of the 30 black ownership target
Labour market regulation continues to be a contributing factor to reducing levels of employment
Black owned farms find it difficult to become part of supply chains and are unable to perform adequately
Unstable employment patterns in the sector make skills interventions difficult to manage and largely ineffective
Financing of land reform and land transfer continues to be wasted as it is not tied to the building of appropriate capacity
Labour market reform Trajectory of land reform
AgriSETA June 2010
These analyses can be translated into four potential growth and development scenarios for the agricultural sector which are based on the requirements for a strong development state Scenario 3 Weak government support
and sound economy
Econ
omic fa
ctors glob
ally n
ationa
lly and
locally
Scenario 1 Integrated government support and sound economy
The economic upturn triggered by the World Cup continues and globally things improve enabling an expansion of exports The government because of a lack of integrated policy planning and implementation provides limited support for sector development The gains go to the well established enterprise owners with few gains for emerging farmers and local communities
Government departments coordinate their efforts to achieve maximum impact There are favourable economic conditions that create opportunities for advance Within this positive environment the role of the AgriSETA becomes a central component of a comprehensive strategy for growth and skills interventions are targeted to achieve maximum effect Results in growth in sustainable enterprises and expanded employment opportunities
Government policy and support Government policy and support
Combination of disjointed government policy planning and a weak and increasingly marginalised rural economy Economic conditions result in unsustainable farming conditions and employment declines along with productivity Food shortages and the lack of development in rural areas leading to increasing social tensions A vicious cycle develops with the sector going into long term decline
Government departments coordinate their efforts to achieve maximum impact However economic conditions hamper progress Efforts by the AgriSETA are undermined by poor labour absorption and job insecurity Some significant successes are recorded including some NSF funded projects that result in sustainable enterprises A platform is laid for future improvements when the economic conditions improve
Scenario 4 Weak state and economy Scenario 2 Strong state but weak
economy
Agriculture Sector Analysis 26
AgriSETA June 2010
Agriculture Sector Analysis 27
SECTION 2 DEMAND FOR SKILLS
AgriSETA registered employers and employee coverage
In 2009 17 234 employers were registered with the AgriSETA comprising 15 394 small employers (less than 50 employees) 1 202 medium sized employers (50 ‐ 149 employees) and 638 large employers (more than 150 employees)
Considering that there are around 40000 commercial farms33 the 17 234 employers represent around 43 of commercial farms Notwithstanding changes in the sector as a result of land reform and sector shrinkage this is a sizable proportion and is held to be sufficiently representative for the purpose of skills development planning However this paints an incomplete picture It understates the representative nature of large enterprise registered with the SETA and overstates the representative nature of small registered enterprises 4 175 (242) of the enterprises are levy paying members Further only 1 673 (11) workplace skills plans (WSPs) were submitted
Table 16 Registered employers by size and sub‐sector Sub‐sector Description
Employers Small Medium Large
CoffeeTea Processing and marketing of coffee and tea including coconuts cocoa nuts olives dates etc
33 4 3
Fibre Grading ginning packing of wool and cotton raw material 1 676 16 18
Fruit Fruit packed in cartons fruit juice concentrate drummed and fruit juice in container ready for consumption
271 36 57
Fruit exporters and importers 6 0 1
Grain
Manufacture of grain mill products and starches 119 5 7Handling and storage of grain 67 7 23Wholesale amp retail trade in Agricultural machinery 213 9 4Sale and distribution of Agricultural raw materials and other farming inputs
182 9 3
Milling
Manufacture of flour and grain mill products including rice and vegetable milling grain mill residues
120 15 11
Manufacture of prepared animal feeds 110 19 0Manufacture of pet foods 42 9 0Manufacture of starches and starch products 7 1 1
Pest control
Pest Control 209 4 0
Poultry Poultry and egg production including the slaughtering dressing and packing of poultry
305 49 37
Primary
Growing of Cereals and other crops (not elsewhere classified) 902 160 34Growing of Vegetables Horticultural specialties nursery products
943 120 72
Growing of Vegetables Horticultural specialties (Including Ornamental Horticulture) and nursery products
11 5 0
Sugar plantation including sugar cane and sugar beet etc 9 4 2
33 SARS statistics 2007
AgriSETA June 2010
Agriculture Sector Analysis 28
Sub‐ Description Employers Growing of fruit nuts beverage and spice crops 1795 255 143Farming of cattle sheep goats horses asses mules and hinnies Dairy farming
2 252 59 18
Other animal farming production of animal products (NEC) 433 25 12Ostrich farming 5 0 0Game farming 16 0 0Growing of crops combined with farming of animals (Mixed farming)
2 920 256 109
Growing of coffee and tea including coconuts cocoa nuts olives dates etc
2 0 0
Agricultural and animal husbandry services except veterinary activities
438 22 9
Other animal farming (not elsewhere classified) 11 1 1Growing of trees as second crop by farmers 126 18 4Fishing operation of fish hatcheries and fish farm 913 10 6
Red meat
Production and animal products (not elsewhere classified) 6 0 0Slaughtering dressing and packing of livestock including poultry and small game for meat
317 40 17
Production sale amp marketing of Agricultural by products (eg bones hides)
61 2 0
Slaughtering dressing and packing of livestock including small game for meat and processing of ostrich products
2 1 0
Wholesale trade in Agricultural raw materials and livestock 193 7 10Transport of livestock as supporting activity 224 0 0Agricultural and livestock research 215 9 3
Seed Seed production and marketing 149 12 6
Sugar Manufacture of sugar including golden syrup and castor sugar
45 5 21
Tobacco Processing and dispatching of tobacco 46 8 6 TOTALS 15 394 1 202 638Source AgriSETA WSP data
The largest number of registered small and medium enterprises are found in the mixed farming sub‐sector while most large enterprises are in the growing of fruit nuts beverage and spice crops sub‐sector
Employee coverage in the AgriSETA
Collectively the 17 234 employers registered with AgriSETA employed a total of 239 076 employees This represents 39 of the agricultural labour force in 2009 The 1 673 employers who submitted WSPs in 2009 employed 97 898 employees representing 41 of the total number of people employed by registered employers While the number of registered employers submitting WSPs is small (11) they employ a sizeable number of employees and the percentage of employees provides a statistically significant sample The data for larger enterprises is statistically much more representative than that for small enterprises
AgriSETA June 2010
Table 17 Number of employees of registered employers by sub‐sector
Sub‐sector
Sub‐sector description Employees
CoffeeTea Processing and marketing of coffee and tea including coconuts cocoa nuts olives dates etc
483
Fibre Grading ginning and packing of wool and cotton raw material 6 539
Fruit Fruit packed in cartons fruit juice concentrate drummed and fruit juice in container ready for consumption
27 661
Fruit exporters and importers 212
Grain
Manufacture of grain mill products and starches 133Handling and storage of grain 18 303Wholesale amp retail trade in Agricultural machinery 795Sale and distribution of Agricultural raw materials and other farming inputs 2 898
Milling
Manufacture of flour and grain mill products including rice and vegetable milling grain mill residues
3 634
Manufacture of prepared animal feeds 731Manufacture of pet foods 160Manufacture of starches and starch products 105
Pest control
Pest Control 119
Poultry Poultry and egg production including the slaughtering dressing and packing of poultry
19 187
Primary
Growing of Cereals and other crops (not elsewhere classified) 10 104Growing of Vegetables Horticultural specialties and nursery products 37 799Growing of Vegetables Horticultural specialties (Including Ornamental Horticulture) and nursery products
195
Sugar plantation including sugar cane and sugar beet etc 220Growing of fruit nuts beverage and spice crops 47 043Farming of cattle sheep goats horses asses mules hinnies Dairy farming
3 382
Other animal farming production of animal products (NEC) 4 203Ostrich farming 0Game farming 0Growing of crops combined with farming of animals (Mixed farming) 28 722Growing of coffee amp tea including coconuts cocoa nuts olives dates etc 0Agricultural and animal husbandry services except veterinary activities 970Other animal farming (not elsewhere classified) 513Growing of trees as second crop by farmers 1 294Fishing operation of fish hatcheries and fish farm 1 589
Red meat
Production and animal products (not elsewhere classified) 0Slaughtering dressing and packing of livestock including poultry and small game for meat
5 128
Production sale amp marketing of Agricultural by products (eg bones hides) 116Slaughtering dressing and packing of livestock including small game for meat and processing of ostrich products
0
Wholesale trade in Agricultural raw materials and livestock 1 697Transport of livestock as supporting activity 0Agricultural and livestock research 534
Seed Seed production and marketing 2 127Sugar Manufacture of sugar including golden syrup and castor sugar 10 478Tobacco Processing and dispatching of tobacco 2 002 Total 239 076
Agriculture Sector Analysis 29
AgriSETA June 2010
Agriculture Sector Analysis 30
Source AgriSETA WSP data
According to the WSP analysis the sub‐sector for the growing of fruit nuts beverage and spice crops employed the largest number of people In six sub‐sectors there are employers who do not employ workers These are probably family based organisations where family members help in the business without drawing a salary These are in transport and livestock research slaughtering dressing and packing of livestock including poultry and small game for meat growing of coffee and tea including coconuts cocoa nuts olives dates etc ostrich farming and game farming
Table 18 Employee distribution by province Province Employees Percentage
Eastern Cape 18 844 192 Free State 1 946 20 Gauteng 2 788 28 KwaZulu‐Natal 5 416 55 Mpumalanga 8 062 82 North West 3 290 34 Northern Cape 5 436 56 Limpopo 1 730 18 Western Cape 50 386 515 Grand Total 97 898
Source AgriSETA WSP data
Of those submitting WSPs registered employers in the Western Cape employed the largest number of people while employers in Limpopo employed the least number of employees Free State has a small number of employees covered by WSPs submitted to the SETA whereas Eastern Cape with a relatively small number of registered farms has a very large number of employees on farms submitting WSPs Given this variance between provinces the use of WSP data for extrapolation purposes must be viewed cautiously
2009 WSP equity information was only provided for about a quarter of employees (25 637 or26)34 No information was available from the WSPs on non‐South Africans working on commercial farms
Table 19 Equity profile from 2009 WSP data African Coloured Indian White
Totals M F D M F D M F D M F D
8 040 5 785 38 5 097 5 228 24 22 25 0 811 556 11
580 417 03 493 505 02 468 532 00 589 403 08 13 863 10 349 47 1 378 25 637541 404 02 54 100
Total EquityTotal Male Total Female Total Disability
13 970 11 594 73 545 452 03
Source AgriSETA WSP data
Using currently available data it is not possible to provide disaggregated employment data by sub‐sector This will require a small change in the way that gender race and disability data is
34 Some employers did not complete race and gender information when giving their employment profiles
AgriSETA June 2010
codified during WSP data‐capturing including allocation by sub‐sector What can be stated is that employment of males is more dominant than that of women and more Africans are employed in the sector than other groups Employment of people with disabilities is below 1
21 Skills demand
The National Education and Training Strategy for Agriculture (AET Strategy)
The AET Strategy developed by the Department of Agriculture Fisheries and Forestry (in consultation with various key stakeholders in the agricultural sector) highlights priority skills needs and constraints within the sector and categorises needs within the following 5 broad areas
1 Agricultural production ndash requesting that the past focus on a narrow band of commodities (relevant mainly to the commercial sector) and related research be expanded to address the needs of small‐scale and subsistence farmers (eg more focus on mixed farming and rural livelihood sustainability skills)
2 Agricultural engineering ndash with specific focus to be placed on technologies suitable for small‐scale farmers (eg relevant and post‐harvesting techniques related to processing and storage of produce) ndash to address this need the scarcity of agricultural engineers requires attention
3 Agricultural economics ndash a critical need was identified for general agricultural economic skills (ranging spectrum of farm planning farm management enterprise management marketing finance etc) ndash with the need to training both farmers and extension officers in such fields
4 Agricultural development ndash a specific need was identified to develop agricultural extensionists in supporting especially emerging and small‐scale farmers over the full spectrum (a need exists for both new curriculum in the training of new extensionists and the re‐training and upgrading of existing officers)
5 Veterinarians ndash the need to develop state veterinarians in order for the state to perform its role and function (particularly in its preventative monitoring and regulatory role and function)
AGRISETA sector skills planning demand data (2008‐2009)
The following section reflects initial research on skills demand in the Agricultural sector arising from the sector analysis (section 1) previous AGRISETA skills demand research for Sector Skills Planning during 2005‐2009 and analysis of WSP data from 2009 With the introduction of the Organising Framework of Occupations and agreement on definitions for scarce and critical skills in 200506 the AGRISETA undertook an extensive research and consultation processes to determine skills development priorities for the sector The research methodology employed was based on the a four dimensional topology for establishing and evaluating skills needs illustrated in the figure below
Agriculture Sector Analysis 31
AgriSETA June 2010
Agriculture Sector Analysis 32
The identification and prioritisation of skills needs was also undertaken from a key stakeholder and beneficiary perspective Consideration was given to needs of the following groups
bull The unemployed ndash helping them gain andor regain entry to the labour market bull The economically inactive ndash helping them to become economically active bull School leavers ndash helping them gain access to further education and training opportunities
and thus facilitating their entry to the job market bull Entrants to the job market ndash facilitating employment and integration into the work culture
and work ethic (improving the employability of an individual) bull Those currently employed in the sector ndash increasing their competency and opportunities
for advancement creating a career path and offering continued job security enhancement of value adding to the sector improving their prospects for better employment opportunities
bull Organisations and enterprises within the sector ndash making sure that skills development and knowledge creation occurs in such a way as to improve the sectorrsquos viability and allowing companiesenterprises to become more sustainable and profitable along the way improving productivity competitiveness and innovation within organisations
In organising and reporting the identified priority skills development needs (200809) the following structuring approach was followed
Tier 1 The four categories of needs as per the Topology presented above were used for the identification evaluation and grouping of needs
Pay conditions
Image
RECRUITMENT DIFFICULTY
SKILLSGAP
SKILLSSHORTAGE
LABOURSHORTAGE
Firms experience difficulty recruiting This does not necessary imply a skills shortage ndash may indicate a poor image remuneration etc
Those currently in work do not have the requisite skills set to carry out their job to an optimum standard
Required skills are in short supply when compared with the demand across the whole labour market
Regardless of skills levels a situation exists where there is simply not enough supply of labour to meet demand
Pay conditions
Image
RECRUITMENT DIFFICULTY
SKILLSGAP
SKILLSSHORTAGE
LABOURSHORTAGE
Firms experience difficulty recruiting This does not necessary imply a skills shortage ndash may indicate a poor image remuneration etc
Those currently in work do not have the requisite skills set to carry out their job to an optimum standard
Required skills are in short supply when compared with the demand across the whole labour market
Regardless of skills levels a situation exists where there is simply not enough supply of labour to meet demand
Figure 4 Topology for identifying skills development priorities
Source AGRISETA SSP Annual Update August 2009
AgriSETA June 2010
Tier 2 Within each of the first tier groupings needs were further broken down and organised per target group At this second level needs were grouped by
o General skills development needs (cross‐cutting over different target groups) o Needs experienced by small scale farmers (this group included subsistence
farmers new emerging land reform beneficiaries and small‐scale AgriBEE farmers) o Needs within the commercial agricultural sector (per sub‐sector groupings where
specific needs for such were identified ndash both on‐farm needs and within the secondary sub‐sector or related agri‐businesses)
o Needs of the Department of Agriculture Fisheries and Forestry (DAFF) To further guide and direct the identification and selection of scarce and critical skills the following factors or criteria that could reflect the importance (impact and effect) of a skills shortages were developed as an identification framework
1 Basic Skills Development Promoting basic literacy and numeracy and raising the base level of education for the sector improving the work and livelihood of existing workers
2 Employability Making the employee more employable by improving the fit between their skills and the sector needs
3 Enterprise Viability Improving the capability and feasibility of the enterprise by increasing its effectiveness of or possibilities for profit generation etc
4 Enterprise Sustainability Allow enterprises to survive and grow over an extended period of time without compromising the value of renewable resources thereby creating long‐term meaningful employment for larger numbers of people
5 Sector Growth Enabling the sector to develop or pursue new opportunities or improve the effectiveness of current operations
6 Sector Competitiveness Enabling the sector to compete more effectively in the international arena improving market intelligence and interpretation productivity cost efficiency etc
7 Human Resource Development Capacity Improving the access to quality provision of training to the agri sector
Based on this research and consultation framework the following skills development needs and priorities were identified
Agriculture Sector Analysis 33
AgriSETA June 2010
GENERAL NEEDS SMALL‐SCALE FARMER
NEEDS COMMERCIAL SECTOR
NEEDS DAFF NEEDS
RECRUITMENT RELATED SKILLS NEEDS Primary agriculture is the entry point into the world of work for large numbers of people in rural areas However the sector has negative connotations amongst sections of the youth and in parts of the country and is viewed as a last resort for some in the search for employment) The effect is that despite an unemployment rate of approximately 26 (now over 30) farmers find it difficult to recruit workers to meet seasonal demands This has resulted in the government approving the contracting of foreign labour to meet such temporary needs (workers are recruited mainly from Zimbabwe and Mozambique)
Labour in this farming sector is provided primarily by family members and no real recruitment constraints can be identified
The agricultural sector still manages to attract technical and management skills as it is perceived to include a better lifestyle and there is a strong tradition of agriculture in SA Increasing crime related security risks associated with farming may have a negative impact
The Department has identified a number of occupations in which they are experiencing long‐term vacancies Some of these result from a general shortage of such skills in SA while others arise from the inability of the public sector to compete with the private sector (less favourable employment image working conditions and equity considerations) Priority vacancies include Veterinarians Agricultural
Engineers Plant Health
Specialists Agricultural
Statisticians Plant Health Pest Risk
Analysts ICT Specialists Agricultural
Economists Agricultural Food and
Quarantine Technicians
Agro‐meteorologists Pasture Scientists Plant Production
Specialists Specialised Food
Analysts SKILLS GAPS RELATED NEEDS
bull Low literacy and numeracy levels ndash both amongst workers within the sector at large and at ownermanager level in many of the small‐scale farming
bull Farm management
Farm Management (Mainly owners managers) bull Farm management amp
entrepreneurship bull Resource
management and record keeping
bull Financial planning
A critical constraint is the poor educational levels of a large proportion of the labour force in the sector demanding a considerable effort and investment in ABET and other life skills
A particularly big need exists for skills upgrading amongst Extension Officers ndash particularly with regard to redress the historical neglect of small‐scale farmers and resource strapped farmers
Agriculture Sector Analysis 34
AgriSETA June 2010
Agriculture Sector Analysis 35
GENERAL NEEDS SMALL‐SCALE FARMER
NEEDS COMMERCIAL SECTOR
NEEDS DAFF NEEDS
skills (and general management skills in other agricultural businesses) coupled with a business orientation and entrepreneurship skills
bull A general need to increase compliance with environmental occupational health and safety animal welfare produce safety and hygiene standards regulations and requirements (local and international standards)
and management bull Project management bull Business plan
development Marketing and processing bull Processing and
packaging bull Transport
management bull Marketing produce
including branding bull Planning for
marketing bull Knowledge of
markets Technical knowledge and skills bull Production
management (related to specific enterprise)
bull Demonstration of production techniques
bull Natural resources management
Mechanical knowledge bull Farm maintenance bull Repairs of machinery
and equipment bull Electrical
maintenance and installation
programmes Need for improved management skills and relevant technological knowledge for increasing productivity levels and improved production methods Rising importance for environmentally responsible production and processing management systems Rising competitive and international markets increases need for business and marketing abilities among owners and managers Increasing requirements for compliance with environmental health and safety and international trade standards Information technology although not a priority is increasing in importance Business management ability is becoming increasingly important as more farmers are making decisions about restructuring their businesses diversification and developing supplementary sources of income
Critically improved farm management and business skills within an agricultural context to support the majority of BEE and emerging farmers Skills upgrading requirements for existing Extension Officers include bull Agricultural
economics bull Agricultural
management bull Business and
financial management
bull Technical and production related skills including o Animal husbandryo Poultry o Crop production o Horticulture
SKILLS SHORTAGES Generally SA has a shortage of entrepreneurs and people who have the business acumen drive motivation and
The profile of these farmers reflects a large contingent of older and less educated people who are generally less flexible tend to stick to
The commercial agri sector will increasingly have to compete in the global market and the ever increasing need to increase productivity to
DAFF us experiencing problems are especially sourcing people in specialised science related fields (learning fields experiencing few
AgriSETA June 2010
Agriculture Sector Analysis 36
GENERAL NEEDS SMALL‐SCALE FARMER
NEEDS COMMERCIAL SECTOR
NEEDS DAFF NEEDS
perseverance to become a successful farmer Given the high risks involved in the agricultural sector (natural elements outside onersquos control) the agri sector does not compete successfully for this ldquoscarce resourcerdquo Moreover as with other professional and skilled occupations there is a tendency for younger qualified people to move to urban areas
known practices and are less likely to experiment with new technology Within this target group candidates with good entrepreneurial ability are scarce There is a perceived shortage of Agricultural Extensionists and advisors to assist this target group However a large pool of young unemployed graduates exists who could assist such emerging farmers if they were mobilised and made accessible to farmers Similarly the potential pool of retired commercial farmers who could serve as mentors to this target group
remain profitable and viable it can be stated that many of the existing farmers and managers owners lack business management and entrepreneurial orientation Equity policy and the need to become BEE compliant requires that commercial enterprises appoint and develop black owners directors managers Changing local and global consumer preferences require farmers to change traditional farming methods and practices Skills and knowledge requirements include bull Global food and
international quality standards
bull Product traceability requirements
bull Organic produce and products
Specific occupations identified as being in short supply are
bull Production Managers (food processing)
bull Product specialisation to international specifications (research skills)
bull Forklift drivers heavy vehicletruck drivers and mobile plant operators
bull Experienced and competent artisans (millwrights electricians fitters
enrolments andor pass rates at HET institutions with the result that too few qualified persons come onto the labour market) Examples of such skills shortages identified by the Department include Agricultural Engineers bull Plant Health
Specialists (Nematology Entomology Plant Pathology)
bull Statisticians (specialised agricultural knowledge)
bull Plant Health Pest Risk Analysts
bull Agricultural Economists (production and resource economists)
bull Agricultural Food and Quarantine Technicians
bull Agro‐meteorologists Early warning Specialists
bull Pasture Scientists bull Plant Production
Specialists (eg ornamental crops hydroponics)
bull Specialised Food Analysts (pesticide residue analysts processed food and dairy analysts wine and spirit analysts)
AgriSETA June 2010
Agriculture Sector Analysis 37
GENERAL NEEDS SMALL‐SCALE FARMER
NEEDS COMMERCIAL SECTOR
NEEDS DAFF NEEDS
and turners bull Agricultural
Equipment Technicians
bull Pest and weed controllers
bull Horticultural specialists
LABOUR SHORTAGES AND RELATED SKILLS NEEDS Given an employment rate of some 26 (2009 currently estimated at over 30expanded definition) per definition there cannot be a labour shortage It is however difficult for people who have never worked before to integrate into the agricultural sector workforce Coupled with an aging workforce (30‐60 being over 40) means that most agri enterprises will within the next 5‐10 years be looking at replacing a large proportion of their workforce There could be an insufficient pool of people willing and able to participate The impact of HIVAIDS is also not always factored in to understanding the diminishing pool of resources available Labour shortages have been reported within selected geographical areas and in particular occupations Examples include cane cutters in the sugar industry chicken catchers in the poultry industry pickers in the fruit industry and animal handlers in feedlots as well as dairy parlour workers It is however believed that these shortages may reflect a recruitment problem as a result of the very harsh working conditions and the relatively poor remuneration (which makes these occupations unpopular) At present such ldquoshortagesrdquo are addressed through contracting labour from neighbouring countries
AgriSETA WSP analyses
Skills demand in the commercial agricultural sector
Information for demand for skills from WSP data is available for 1 673 employers who submitted their WSPs for the 200910 period The table below shows data on sub‐sector WSP submission relative to size of the sub‐sector as well as subsector data from all registered organisations and those who submitted WSPs Data for registered employers shows that there were 239 076 employees employed by the 17 234 registered organisations As previously stated 97 898 employees were employed by the organisations submitting WSPs This constitutes 41 of employees employed by registered organisations
Table 20 Employment and sub‐sector data drawn from WSP analyses
Sub‐sector
All Re
gistered
Employers
Small employers (0‐49)
Med
ium and
large
employers (50+)
Total W
SPs received
Total W
SPs received
as of
all registered em
ployers
WSP
received med
ium and
large orgs
WSPs received
as of
med
ium amp large em
ployers
WSPs received
small
employers
WSPs received
as of small
enterprises
EmployeesPer
Profile
CoffeeTea 40 33 7 9 23 5 71 4 12 483 Fibre 1 710 1 676 34 34 2 22 65 12 07 6 539
AgriSETA June 2010
Agriculture Sector Analysis 38
Sub‐sector
All Re
gistered
Employers
Small employers (0‐49)
Med
ium and
large
employers (50+)
Total W
SPs received
Total W
SPs received
as of
all registered em
ployers
WSP
received med
ium and
large orgs
WSPs received
as of
med
ium amp large em
ployers
WSPs received
small
employers
WSPs received
as of small
enterprises
EmployeesPer
Profile
Fruit 371 277 94 162 44 76 81 86 31 27 873 Grain 648 581 67 77 12 48 72 29 5 22 129 Milling 335 279 56 61 18 35 63 26 9 4 630 Pest Control 213 209 4 8 4 2 50 6 3 119 Poultry 391 305 86 66 17 46 53 20 7 19 187 Primary 12 121 10 776 1 345 1144 9 513 38 631 6 136 034 Red meat 1107 1 018 89 70 6 45 51 25 2 7 475 Seed 167 149 18 24 14 13 72 11 7 2 127 Sugar 71 45 26 13 18 10 38 3 7 10 478 Tobacco 60 46 14 5 8 3 21 2 4 2 002
Totals 17 234 15 394 1 840 1 673 10 818 44 855 16 239 076
Source 1 AgriSETA WSP 2009 data
Only 10 of all registered employers submitted WSPs for the 200910 period Of these 49 were medium and large sized employers and 51 small However only 16 small employers submitted their WSPs relative to the number of registered small employers and 44 medium and large employers submitted WSPs relative to the number of registered medium and large employers As such skills demand statistics provides more representative data on the requirements of medium and large employers Data for skills demand in the commercial agricultural sector is based on data for permanent employees as well as casual and seasonal employees
Skills demand forecasting by AgriSETA
Forecasting for skills demand the AgriSETA has estimated that the demand for skilled employees at different levels in the next few years is 510 686 This is based on WSP data analyses over the last 5 years and projected demand for the formal commercial agricultural sector and factoring in the demand that at maximum would result from completion of the land restitution programme in South Africa The table below reflects the skills that are on demand as well as the estimates for demand over the next five years by major occupational category35
35 AgriSETA 2010
AgriSETA June 2010
Table 21 Demand for skills by occupational category
Major Occupation (OFO)Estimated Demand
Group Title1 Managers (commercial and small emerging farmers) 264 3702 Professionals 4 1413 Technicians and Trade workers 8 9255 Clerical and administrative workers 8006 Sales workers 4007 Machinery operators and drivers 5 8008 Elementary workers 226 250
Total 510 686Source AgriSETA WSP data and SSP demand forecasts
Research needs going forward
As has been set out in the sector analysis and the scenarios derived from that analysis the sector is faced by both significant and profound change and also great uncertainty It therefore follows that the task of focussing limited resources (basically levy income in the formal sector and NSF funds for the emergent farming sector) is difficult Whilst the general thrust of training remains broadly as described in the 2006‐10 SSP Updates some considerable work is required to achieve targeted effective interventions during the 2011‐2016 period The following research questions will need to be addressed in preparing the next SSP
bull In relation to the managers and owner‐managers of commercial farms and enterprises what skills are needed to enable them to help bring about the more optimistic scenario and manage the risks associated with the less optimistic ones
bull In terms of professional and technical competencies do the current education and training institutions coupled with the learning programmes available through the AgriSETA (learnerships skills programmes and the like) meet the needs of the sector
bull In the emerging agricultural sector do the current programmes funded by sources external to the AgriSETA (eg NSF) meet all the identified needs What gaps are there and how should they be addressed
bull In relation to governmentrsquos growth strategy and industrial action plans what skills are required for developing the aquaculture sub‐sector What programmes are available How can the SETA support the skills needs for this sub‐sector
bull Given the increasing levels of casual and contract labour how can skills be developed to meet the needs of the formal commercial sector and the emerging enterprise sector
bull How can the demand in each of the priority areas be quantified and agreement be reached on numbers of people to be trained
Agriculture Sector Analysis 39
AgriSETA June 2010
SECTION 3 Skills Gaps and scarce skills
Scarce skills at the DAFF
The level of scarce skills at DAFF can be determined by the vacancy rate While the average vacancy rate in the department as at 31 March 2009 was 17 there were some posts that had very high vacancy rates as reflected in the table below Indicating the possibility that the Department is experiencing difficulties in finding suitable candidates in the South African labour market to fill these posts
Table 22 Scarce skill occupations and vacancy rates (DAFF March 2009) Critical occupations Number of posts Posts filled Vacancy rate ()
Agricultural animal oceanography forestry and other sciences
167 119 287
Engineering sciences related 2 1 50Engineers and related professions 13 6 538Farming forestry advisors and farm managers 11 4 636Finance and economics related 73 53 274Horticulturists foresters agricultural and forestry technicians
350 221 369
Legal related 6 4 333Mechanical engineering technicians 3 2 333Risk management and security services 6 4 333Social sciences related 1 0 100Veterinarians 34 24 294
Source DAFF Annual Report 20082009
Skills are also scarce at senior management level The department also reports on difficulties it has filling senior management services vacancies with some of them staying vacant for up to twelve months because no suitable candidates can be found The department would then resort to re‐advertisement and head hunting This was the case with 22 of 18 SMS posts in March 2009
Scarce skills in the commercial sector
The following occupations have previously been projected as scarce (extremely hard to fill vacancies) by AgriSETA in the commercial agricultural sector over the next five years
Table 23 Scarce and critical skills in the commercial agricultural sector
Occupation Code
Group Occupation Critical Skills Intervention Comments
139903 Managers Laboratory Manager
Technology AI nutrition
HET
221101 Professionals Accountant (General)
General HET
221102 Professionals Management Accountant
Farm financial management
HET Focus on support advice to farmers new enterprises
222101 Professionals Commodities Trader
Export administration supply chain
FET Learnership Skills
Agriculture Sector Analysis 40
AgriSETA June 2010
Agriculture Sector Analysis 41
Occupation Code
Group Occupation Critical Skills Intervention Comments
management Programme
224301 Professionals Economist Agricultural HET
Mainly for Department of Agriculture and para statals commodity organisations
233101 Professionals Chemical Engineer
Chemical processes in food production
HET Industries such as sugar processing
233301 Professionals Electrical Engineer
Installation and maintenance
HET Processing industry
233401 Professionals Electronics Engineer
Computerised production prosesses
HET Processing industry
233501 Professionals Industrial Engineer
Productivity and efficiency
HET Processing industry
233904 Professionals
Instrument Engineer (Defence Force)
Installation and maintenance
HET
Not for defence ‐ sugar industry
233502 Professionals Mechanical Engineer
FETHET Equity reasons
233902 Professionals Agricultural Engineer
Farm layout and infrastructure
HET Mainly in Government
311101 Technicians and trades workers
Agricultural Technician
Installation and maintenance
FETHET
234102 Professionals Agricultural Scientist
Agri research HETFET Especially in horticulture
234201 Professionals Chemist HET Processing industry
234202 Professionals Food Technologist
Food safety HACCP
FETHET Across sector
234701 Professionals Veterinarian HET Mainly in Government
311101 Technicians and trades workers
Agricultural Technician
Farm infrastructure
FET Mainly needed in government
311401 Technicians and trades workers
Chemistry Technician
FETHET EE reasons
312907 Technicians and trades workers
Chemical Engineering Technician
FET Learnership
Mainly EE reasons
312402 Technicians and trades workers
Electronic Engineering Technician
Weak stream production infra
FETHET Mainly tobacco industry
233904 Professionals
Instrument Engineer (Defence Force)
Instrument technician
FET
Occupation needed Instrument Technician (not defence force) Mainly sugar processing sector
321202 Technicians and trades workers
Diesel Motor Mechanic
FET Learnership
To include tractor mechanic
321204 Technicians and trades workers
Small Engine Mechanic
Agricultural equipment
FET Learnership
Throughout sector
AgriSETA June 2010
Agriculture Sector Analysis 42
Occupation Code
Group Occupation Critical Skills Intervention Comments
322301 Technicians and trades workers
Metal Fabricator
Artisan FET Learnership
322303 Technicians and trades workers
Welder Welder (First Class)
Artisan FET Learnership
323203 Technicians and trades workers
Fitter‐Welder Artisan FET Learnership
Mainly sugar ndash multi‐skilled
323202 Technicians and trades workers
Fitter And Turner
Artisan FET Learnership
Tobacco and sugar
323501 Technicians and trades workers
Millwright Artisan FET Learnership
Wide‐spread need
341101 Technicians and trades workers
Electrician (General)
Artisan FET Learnership
Wide‐spread need
342101 Technicians and trades workers
Air‐Conditioning And Refrigeration Mechanic
Artisan FET Learnership
Sugar pack houses cold chain
Source AgriSETA Sector Skills Plans
Supply of skills
South Africarsquos agriculture skills are produced in high schools agricultural colleges FET colleges and Higher Education institutions In high school a large cohort of learners take Agricultural Science as a subject In 2003 there were 42 Agricultural High Schools offering Agricultural Science as a subject These students and those in high schools taking the subject could progress to taking agriculture as a focus area for further education In 2004 there were 10 FET colleges offering vocationally directed agricultural programmes These FET colleges offered complete qualifications and short courses Eleven Colleges of Agriculture can offer qualifications up to degree level and 19 universities offer qualifications in Agriculture ranging from agricultural economics animal and plant sciences and horticulture among others at under and post graduate levels (Department of Agriculture 2006) While long term planning of skilling of new entrants in the sector can be done through close consultation between the sector agricultural schools and colleges FET colleges and HET institutions so that they teach relevant skills there are other avenues for training for those who are already employed in the sector for example skills programmes and learnerships There are 15 registered qualifications for the primary agriculture sub sectors Currently AgriSETA has 94 registered learnerships that can address the skills needs of the identified scarce skills These are captured in Appendix 2 AgriSETA has approved accredited a number of training providers across the country to deliver the theoretical and practical components of these learnerships These include agricultural colleges FET colleges and private providers Currently the AgriSETA has 246 registered and approved providers distributed nationally as follows
AgriSETA June 2010
Table 29 AgriSETA approved training providers (2010) Province Number of providers
Gauteng 72
(29)
KwaZulu Natal 20
(8)
Limpopo 35
(14)
North West 30
(12)
Northern Cape 3
(1)
Free State 15
(6)
Mpumalanga 14
(6)
Western Cape 26
(11)
Eastern Cape 31
(13) Total 246
The providers are small to large organisations In primary agriculture small providers appear to offer the most training in rural areas and community projects (AgriSETA 2010) Most of the operating providers will be in FET colleges and agricultural colleges The AgriSETA is unable to meet the total demands for skills across the duality of their sector There seems to be fairness in the approval of training for both permanent and casual and seasonal workers In 200809 the AgriSETA approved 559 learnerships as follows
Table 30 AgriSETA learnerships approved for grant purposes (2008‐2009)
Source AgriSETA learnership data analysis
Agriculture Sector Analysis 43
AgriSETA June 2010
Agriculture Sector Analysis 44
Provision of skills programmes in the same year attracted grants for 2 706 employees
Table 31 Participation by learners in skills programmes in the AgriSETA (200809)
Source AgriSETA Skills programmes data analysis
AgriSETA June 2010
APPENDIX 1 Skills demand in the Department of Agriculture Forestry amp Fisheries (200809)
Source DAFF Annual Report 2008‐20009
Agriculture Sector Analysis 45
AgriSETA June 2010
Agriculture Sector Analysis 46
Appendix 2 AgriSETA registered learnerships Registered Learnership NQF Level SAQA Registration NoLearnership in Agri Sales and Service 4 22 Q 220001 20 178 4Learnership Agricultural Machinery Technician 2 22 Q 220007 20 160 2Learnership in Specialist Agricultural Machinery Technician 5 22 Q 220009 21 258 5Agri Trade Processes 2 22 Q 220013 30 125 2FETC Meat Examination Applying Basic Business Principles 4 30 Q 3000 2823 164 4Further Education and Training Certificate Seed Marketing Execute Seed Trials 4 22 Q 220025 21 126 4Further Education and Training Certificate Seed Research and Development Certify as Seed Unit 4 22 Q 220027 21 121 4FETC Seed Research and Development Conduct a Field Inspection of a Seed Unit 4 22 Q 220028 20 120 4Seed Research and Development Operations Operate in a Team 3 22 Q 220020 22 121 3Seed Research and Development Operations Apply Basic Business Principles 3 22 Q 220021 22 121 3National Certificate Seed Processing and Packaging Operate in a Team 3 22 Q 220026 21 123 3Sugar Industry Technical Maintenance worker 2 22 Q 220011 39 128 2National Certificate Sugar Manufacturing and Refining Technical Maintenance 3 30 Q300003 23 146 3Further Education and Training Certificate Manufacturing Technical MaintenanceProduce Components by Performing Engineering Turning Operations
4 30 Q 3000 1321 173 4
FETC Manufacturing Technical Maintenance Produce Components by Performing Milling Operations 4 30 Q 3000 1521 173 4 FETC Manufacturing Technical Maintenance Develop and Fabricate from Complex Drawing 4 30 Q 3000 1420 173 4National Certificate in Sugar Technology 5 22 Q 220036 22 140 5Further Education and Training Certificate Sugar Processing 4 22 Q 220035 31 144 4National Certificate in Sugar Technology Processing Sugar Refining 2 22 Q 220037 28 124 2National Certificate in Sugar Technology Processing Juice Preparation 2 22 Q 220038 28 124 2National Certificate in Sugar Technology Processing Crystallisation 2 22 Q 220039 27 122 2National Certificate in Sugar Technology Processing Laboratory Practice 2 22 Q 220040 25 124 2National Certificate in Sugar Technology Processing Extraction 2 22 Q 220041 28 122 2NC Rooibos Production Applying Basic Business Principles 2 30 Q 3000 2427 130 2 NC Rooibos Processing Applying Basic Business Principles 2 30 Q 3000 2224 123 2 National Certificate Cigarette Production 3 22 Q 220046 23 121 3
AgriSETA June 2010
REFERENCES AgriSETA 2010 AgriSETA 20082009 Annual report Pretoria AgriSETA Agricultural Research Council httpwwwarcagriczahomeasppid=272 Avert South African HIV and AIDS statistics Available on httpwwwavertorgsafricastatshtm Centre for Development Enterprise 2008 Land reform in South Africa Getting back on track CDE Research No 16 DAFF 2010 Quarterly economic review of the agriculture sector Pretoria DAFF DAFF 2009 Annual report 20082009 Pretoria DAFF Department of Agriculture 2008 Strategic plan 2008 Pretoria Department of Agriculture DTI An introduction to the South African economy Available on httpwwwthedtigovzapublicationsagroprocessinghtm Eastern Cape Provincial Government Eastern Cape Provincial Growth and Development Strategy 2004 ndash 2014 Economic Commission for Africa 2009 Developing African agriculture through regional value chains Addis Ababa Economic Commission for Africa Economic Report Free State Province 2005 Provincial Growth and Development Strategy 2005 ndash 2014 GCIS 2010 SA Yearbook 200910rdquo Agriculture forestry and fisheries Pretoria GCIS Greenberg S 2010 Status report on land and agricultural policy in South Africa 2010 Institute for Poverty Land and Agrarian Studies School of Government University of the Western Cape Research report Ingelozi Management Solutions 2008 HIVAIDS in the South African agricultural sector Towards the development of a long term intervention Research report KwaZulu Natal Provincial Government 2006 KwaZulu Natal Provincial Growth and Development Strategy Limpopo Provincial Government Growth and Development Strategy 2004 ndash 2014 Mhone G (2000) Enclavity and Constrained Labour Absorbtive Capacity in Southern African Countries Geneva International Labour Office Moyo S The Agrarian question and the developmental state in South Africa In Edigheji O et al 2010 Constructing a democratic developmental state in South Africa HSRC PRESS
Agriculture Sector Analysis 47
AgriSETA
Agriculture Sector Analysis
National Treasury Republic of South Africa 2010 National Budget 2010 ndash National Budget Review 2010 Pretoria National Treasury Northern Cape Provincial Government Agriculture and agro‐processing sector strategy North West Provincial Government North West Provincial Growth and Development Strategy 2004 ndash 2014 Province of the Western Cape 2008 The Ikapa growth and development strategy White Paper SABCOHA SA Business Coalition on HIV and AIDS wwwsabcohaorg SACAU httpwwwsacauorghostingsacauSacauWebnsfHomehtmOpenForm South African Government 2010 20102011 ndash 20122013 Industrial Policy Action Plan Republic of South Africa Statistics South Africa 2005 Census of commercial agriculture 2002 Report No 110201 Pretoria Statistics South Africa Statistics South Africa 2009 Census of commercial agriculture 2007 Statistical release P1101 Pretoria Statistics South Africa Statistics South Africa 2010 General household survey 2009 Statistical release P0318 Pretoria Statistics South Africa Statistics South Africa 2010 Gross domestic product first quarter 2010 Statistical release P0441 Pretoria Statistics South Africa Statistics South Africa 2010 Quarterly labour force survey Quarter 1 2010 Statistical release P0211 Pretoria Statistics South Africa Vink N amp van Rooyen J 2009 The economic performance of agriculture in South Africa since 1994 The implications for food security Pretoria DBSA development planning division working paper series No 17 Webster E 2004 the Dual Economy from a book by Van Holdt K and Webster E Work restructuring and the Crisis of Social reproduction and 10 years of restructuring post apartheid workplaces University of Natal Press Workinfocom httpwwwworkinfocomfreesub_for_legresdatalraempassoc3htm Xingwana L 2008 Challenges and Opportunities for Land and Agrarian Reform towards 2025 Speech delivered at the Agri‐Consultation Protea Ranch Hotel Polokwane 30 July 2008
- Table of contents
- SECTION 1 THE AGRICULTURAL LANDSCAPE
- 11 Size and shape of the Agricultural sector
-
- Overview
- Distribution of agricultural production
- The structure of the agriculture sector in South Africa
- Categories of farming enterprises
- Employment trends
- Employment categories and remuneration
- Stakeholders in the Agricultural sector
-
- National government departments
- Sector representatives
-
- 12 Factors impacting development in the Agriculture sector
-
- Future sector economic growth and development
-
- South African sector growth plans (IPAP2)
- International Trade
- Global recession and rise in food prices
-
- Land reform
- Reliance on imports
- Water
- The labour market
- Consumer trends
- HIVAIDS
- Farm safety and security
- Broad-based Black Economic Empowerment
-
- Conclusions and scenarios
- SECTION 2 DEMAND FOR SKILLS
-
- AgriSETA registered employers and employee coverage
- Employee coverage in the AgriSETA
-
- 21 Skills demand
-
- The National Education and Training Strategy for Agriculture (AET Strategy)
- AGRISETA sector skills planning demand data (2008-2009)
- AgriSETA WSP analyses
-
- Skills demand in the commercial agricultural sector
-
- Skills demand forecasting by AgriSETA
- Research needs going forward
-
- SECTION 3 Skills Gaps and scarce skills
-
- Scarce skills at the DAFF
- Scarce skills in the commercial sector
- Supply of skills
-
- APPENDIX 1 Skills demand in the Department of Agriculture Forestry amp Fisheries (200809)
- Appendix 2 AgriSETA registered learnerships
-

AgriSETA June 2010
Agriculture Sector Analysis 20
water used for irrigation by for example using methods such as drip or micro‐irrigation which are expensive to set up but which reduce water wastage by 5‐1027 The Department of Water Affairs is responsible for managing water supply and has to give authorisation for agricultural projects and other developments The department needs to be seen as an important stakeholder in the agricultural sector
The labour market
South Africa recorded an unemployment rate of 243 in 2009 (narrow definition) If people who are no longer actively seeking work are considered the broad unemployment rate rose from 267 to 313 illustrated in the figure below As a direct consequence of the global economic downturn in 2008 870 000 formal jobs were lost in 200928 Others have quoted a figure of over 1 million
Figure 3 Official unemployment in South Africa 2003 ‐2009
Source National Treasury 2010
Annual employment loss followed sector growth patterns with agriculture mining manufacturing and trade facing the highest job losses as their sector growth contracted Unemployment is especially a major problem among lower skilled workers and younger people Youth employment in the 15 ‐24 year age group has fallen by 219 000 (136) and 483 of people in this age group are unemployed Employment of semi‐skilled and unskilled workers has contracted by 527 000 and male employment has gone down by 550 000 (71) while that of women has decreased by 320 000 (52) The number of discouraged workers ie those no longer actively seeking work has increased from 518 000 to 17 million29 Clearly the existence of a very large pool of largely unskilled unemployed workers has an impact on the farming sector It drives wages down and creates opportunities for casualisation and the expansion of labour contract agencies and brokers In addition there are significant numbers of foreign nationals mainly from Zimbabwe and Mozambique who are seeking work and often finding it on farms and in primary processing and packaging plants There are benefits to the
27 Greenberg 2010 28 National Treasury 2010 29 National Treasury 2010
AgriSETA June 2010
Agriculture Sector Analysis 21
sector with skilled and semi‐skilled workers coming into the labour market and being absorbed into the workforce and helping raise productivity levels However at the lower skilled end of the market the existence of this pool brings further casualisation and downward pressure on wages Tensions are likely to increase and further protests either in the form of xenophobic outbreaks or actions against farmers may well increase A view often expressed by farm employers is that current labour legislation makes dismissing workers difficult and so the availability of labour without entering into contracts of employment is an attractive way of avoiding the legislation and its obligations Organised Labour is seeking to restrict these opportunities through either regulating or eliminating labour brokers and efforts are being made to regulate the use of foreign labour However for the foreseeable future the trend is for formally employed people to be reduced in number In relation to the emergent sector there will also be a reluctance to enter employment contracts with workers The fact that many households are engaged in some form of largely unpaid agricultural work means that there is significant casual work dating back many years Helping change this situation into one where casual or unpaid jobs are transformed into formal jobs with regular wages will take time It is also likely that as some emergent farms become established they will act similarly to established farms and institute a form of casual labour rather than expanding a workforce for which they would have to take a level of responsibility From an AgriSETA perspective these labour market trends mean that whilst levy income can be directed at a relatively small labour pool one that is manageable in terms of planning and implementation the size of the informal casual and unemployed labour force in the sector ‐ for whom no levy is paid and who have no employer to plan for their skills needs ndash is very large and its needs almost unlimited Clearly the relationship with the National Skills Fund (NSF) becomes critical in respect of the entire non‐levy income sector Again the level of support available from non‐levy income sources will be an important variable in looking at future sector skills development scenarios
Consumer trends
South Africa currently produces enough food to meet the needs of its population However consumption of three main staples maize wheat and vegetables has been volatile since 1985 and remains below 1990 levels Consumption of maize and vegetables by South Africans is 17 and 32 less respectively than in 198530 The main reasons for this lie in the growing levels of poverty and the difficulties that families have in purchasing nutritious food Whilst government has increased the levels of social grants and increased the number of people receiving grants to around 13 million the incomes of poor families have been badly hit by a range of factors including job losses and rises in food prices The approximately 1 million people who lost their jobs in 20089 meant a loss of income for many millions of dependents Rises in food prices have also had a disproportionate impact on the poor Whilst food is available it is often not accessible to families on the income levels that they have to manage within The result is that less and less nutritious food is purchased which in turn impacts on the ability of farmers to sell their products locally 30 Greenberg 2010
AgriSETA June 2010
Agriculture Sector Analysis 22
Whilst there is no evidence that government will reduce its efforts in relation to poverty relief and social benefits including such programmes as school feeding schemes and food parcels during periods of drought the state of public finances may not enable to support the poverty that grips many rural areas If real income levels for the poor were to rise it could have a significant impact on the economy of the agricultural sector Equally an improvement in the rural economy with increased agricultural production and jobs would dramatically impact on the capacity of people to buy nutritious food Achieving a positive growth path in rural areas is a huge challenge for government and one that is key to governmentrsquos Medium Term Strategic Framework and Industrial Policy Action Plans
HIVAIDS
South Africa has a high prevalence of HIV and AIDS The HIV prevalence among people aged two and above was estimated at 109 in 2008
Table 15 Estimated HIV percentage prevalence by age group (2002 ndash 2008)
Age 2002 2005 2008 Change
Children (2‐14 years) 56 33 25 ‐31
Youth (15‐24 years) 93 103 87 ‐06
Adults (25 and older) 155 156 168 13
15‐49 year olds 156 1692 169 13
Total (ages 2 to 49) 114 108 109 ‐05 Source Avert 2009
The table above shows that HIV prevalence is highest amongst those aged 25 years and older Given youth labour market analyses which point to people from previously disadvantaged backgrounds mainly African males accessing formal employment for the first time at age 25 ‐27 this population can be held to represent people in employment Research31 has estimated that by 2020 the pandemic will have claimed at least 20 of employees in the agricultural sector Southern Africa
in
HIV and AIDS have significant ramifications in the agricultural sector for both commercial farming and subsistence farming The implications include
bull Decrease in cultivated land bull Focus on less labour intensive crop and animal production bull Decrease in womenrsquos agricultural productivity as they take on a more care giving role bull Loss of skills bull Increase in absenteeism from work bull Decrease in daily work outputproductivity because workers are weaker from infections
There are suggestions that the impact of the pandemic in South Africa demands sectoral intervention although this may be difficult in the agricultural commercial sector as
bull Seasonal workers who seem to be more vulnerable to infection because of their low socio‐economic status are not in one place long enough for care programs Further
31 Ingelozi Management Solutions 2008
AgriSETA June 2010
Agriculture Sector Analysis 23
farmers and employers may not feel responsible for seasonal workers in the same way they would invest in their permanent employees
bull There may be uncertainty around land reform which may put HIV intervention on farms on the back burner
bull There are no policies that enforce HIV education and care on farms in the same way that legislation like BEE does for ownership As a result HIV intervention may be left to goodwill and employers may feel it is more important to comply with issues that are monitored
Farm safety and security
South Africa has been plagued by unacceptably high levels of violent crime and murder for many years now Farms have experienced this and those living on farms feel and are extremely vulnerable The South African Chamber of Commerce and Industry (SACCI) has argued that
Using the nominal GDP figure for 2009 of R24 trillion a 322 percent contribution of agriculture to GDP and an estimate of 39982 farms (as at 2007) in South Africa the cost of a murderattack on a farm to the economy was R1932869 per annum
SACCI acknowledges that this estimate is flawed as it does not take into consideration the fact that farming units contribute differently to GDP and that not every attack or murder contributes to farm shut down or loss of productivity However if not addressed these attacks could lead to loss of farming sectors as farmers migrate to lsquosaferrsquo regions This will affect employment and GDP contribution of the sector The need for safety and security on farms may also shift farmersrsquo focus in skills development to include personnel who have skills in safety and security
Broad‐based Black Economic Empowerment
The aim of the AgriBEE Charter (gazetted in 2008) is to increase the involvement of black business in agriculture through ownership and control as executives and senior managers of new and existing agricultural businesses The extent to which AgriBEE is transforming the sector is not known as it is too early to tell but a recent survey conducted by ABC and the IDC showed that among the ABC respondents in 2007 46 of enterprises were busy constructing a BEE strategy and 46 claimed to be implementing a BEE strategy A survey of the dairy industry in the Western and Eastern Cape in 2008 showed that only 6 of firms had a BEE strategy in place It also seems from survey data that companies are focusing on the skills development and socio‐economic aspects of BEE rather than on ownership32 It would appear that although there have been some significant BEE purchases of viable farms and some employee empowerment projects including some quite high profile ones in the Cape Winelands the extent of ownership change had been limited One of the factors is the very high level of single person or family ownership in the agricultural sector BEE is more straight forward in the corporate world where shares can be exchanged For a family business it is a matter of selling off part or all of the land and the tendency is to sell off those areas of the farm that are expendable from a business sustainability perspective
32 Greenberg 2010
AgriSETA June 2010
Whilst there is discussion in government about the ending of the ldquowilling buyer willing sellerrdquo concept the Constitution itself provides for property rights and so although some pressure may be exerted through legislation and regulation the extent and speed of change may not be fast The mechanisms for encouraging the transfer of significant levels of ownership have not yet been created The focus of the SETA is therefore likely to be more the beneficiaries of land reform and emergent farmers though projects of a BEE nature can be targeted as they arise
Conclusions and scenarios It is useful when looking at possible scenarios to examine the key variables or uncertainties and to project how variations one way or the other will have an impact on the development and growth of the sector From the sector analysis and factors that are contributing to change in the sector there are some key factors that seem to emerge First appears to be the economy and related issues of the labour market and the challenges of labour absorption in an enclave economy These factors determine on the one hand whether there will be growth and development and on the other whether such improvements will result in improved employment opportunities and the creation of a virtuous cycle of development Second is the role of the state and the various government departments whose plans and work impact on the agricultural sector Related to this is land reform that is inevitably driven by the state and not the owners of land or the landless The view expressed by many engaged in agrarian reform is that the state must play a significant role It becomes clear that a successful agricultural enterprise requires a number of factors to be in place to be successful These include access to land (Department of Rural Development and Land Reform) agricultural support within a supportive agricultural framework (Department of Agriculture Forestry and Fisheries) access to consistent water supply (Department of Water Affairs) access to finance (Department of Trade and Industry various state agencies) conducive labour market regulation (Department of Labour) sound industrial policy (Department of Trade and Industry) economic planning and macro policy (Department of Economic Development National Treasury) and appropriate education training and skills development (Department of Higher Education and Training the Human Resources Development Council NSA and the SETA) There are other government departments as well as provincial and municipal structures that also play a role The following analyses show how the four variables
economic growth and development role of the government labour market changes and land reform)
impact positively or negatively on the growth of the sector and the demand for skills
Agriculture Sector Analysis 24
AgriSETA June 2010
Agriculture Sector Analysis 25
HHIIGGHH GGRROOWWTTHH SSCCEENNAARRIIOO
The economics of the sector Role of government
The economy in SA and globally continues to revive albeit slowly for the next few years
Roles and integration of national government departments are clarified Specific functions are agreed processes put in place and personnel appointed with the required skills
International trade agreements are still weighted infavour of US and EU but progress is being made and specific blockages are addressed in bilateral talks
The roles of Departments (DWA DAFF DRDLR DoL DTI DED DHET) are clarified with appropriate joint plans and coordinating structures
The rural economy gradually improves with the buying power of the poor increasing and more stable markets created for local produce
For each of the functions agreed in each of the related departments appropriate structures and systems are put in place and staff trained
Exports increase in key areas identified in IPAP 2 and the Rand exchange rate stabilises at a level not too much different than it is today
Specific capacity is put in place at local level to support implementation of land reform and rural development
There is a growing understanding of the concept of dualism and the need to intervene with labour absorption and development mechanisms
Land claims are all finally settled and ownership and tenure is resolved There is a serious drive to establish effective agricultural enterprises
An understanding is reached on the role of agencies and labour brokers and abuse is curbed
The willing buyer willing seller approach is resolved and enables viable land to become black owned
Some relaxation of labour market regulations are agreed that maintain some minimum standard of employment but assist absorption
Land transfer to black and emergent farmers is done in a manner that integrates then into the supply chains of the sector
Mechanisms are found to address skills needs in the context of casual and seasonal work patterns
Financing of land reform and transfer is done on the basis of agreed development plans including skills
Labour market reform Trajectory of land reform LLOOWW GGRROOWWTTHH SSCCEENNAARRIIOO
The economics of the sector Role of government departments The economy in SA and globally stagnates at current levels and the economy struggles to pick up after the temporary 2010 World Cup boost
A lack of purpose at government level means limited progress for another five years Land reform remains a commitment without a plan
International trade agreements are still weighted infavour of US and EU and protectionism increases as a result of the global recession
The roles of Departments (DWA DAFF DRDLR DoL DTI DED DHET) are unclear and there is no proper co‐ordination
SArsquos Gini coefficient continues to worsen with rural poverty increasing and local economies declining
There is a lack of effective structures systems and processes to implement policy across departments
Rand volatility causes problems for importers and exporters Well established markets are maintained but exports decrease
At local level the decline in the agricultural extension officer functions continues and limited practical support is available
Understanding of the rural economy is so diverse that stakeholders cannot agree the problem let alone the solution to low absorption levels
Land claims take too long and land reform processes leave potentially productive land poorly developed and managed
Casual labour and labour brokers remains an issue of dispute Confrontation results in bitterness and resentment
The impasse caused by a rigid interpretations of property clauses in the Constitution continues to stall achievement of the 30 black ownership target
Labour market regulation continues to be a contributing factor to reducing levels of employment
Black owned farms find it difficult to become part of supply chains and are unable to perform adequately
Unstable employment patterns in the sector make skills interventions difficult to manage and largely ineffective
Financing of land reform and land transfer continues to be wasted as it is not tied to the building of appropriate capacity
Labour market reform Trajectory of land reform
AgriSETA June 2010
These analyses can be translated into four potential growth and development scenarios for the agricultural sector which are based on the requirements for a strong development state Scenario 3 Weak government support
and sound economy
Econ
omic fa
ctors glob
ally n
ationa
lly and
locally
Scenario 1 Integrated government support and sound economy
The economic upturn triggered by the World Cup continues and globally things improve enabling an expansion of exports The government because of a lack of integrated policy planning and implementation provides limited support for sector development The gains go to the well established enterprise owners with few gains for emerging farmers and local communities
Government departments coordinate their efforts to achieve maximum impact There are favourable economic conditions that create opportunities for advance Within this positive environment the role of the AgriSETA becomes a central component of a comprehensive strategy for growth and skills interventions are targeted to achieve maximum effect Results in growth in sustainable enterprises and expanded employment opportunities
Government policy and support Government policy and support
Combination of disjointed government policy planning and a weak and increasingly marginalised rural economy Economic conditions result in unsustainable farming conditions and employment declines along with productivity Food shortages and the lack of development in rural areas leading to increasing social tensions A vicious cycle develops with the sector going into long term decline
Government departments coordinate their efforts to achieve maximum impact However economic conditions hamper progress Efforts by the AgriSETA are undermined by poor labour absorption and job insecurity Some significant successes are recorded including some NSF funded projects that result in sustainable enterprises A platform is laid for future improvements when the economic conditions improve
Scenario 4 Weak state and economy Scenario 2 Strong state but weak
economy
Agriculture Sector Analysis 26
AgriSETA June 2010
Agriculture Sector Analysis 27
SECTION 2 DEMAND FOR SKILLS
AgriSETA registered employers and employee coverage
In 2009 17 234 employers were registered with the AgriSETA comprising 15 394 small employers (less than 50 employees) 1 202 medium sized employers (50 ‐ 149 employees) and 638 large employers (more than 150 employees)
Considering that there are around 40000 commercial farms33 the 17 234 employers represent around 43 of commercial farms Notwithstanding changes in the sector as a result of land reform and sector shrinkage this is a sizable proportion and is held to be sufficiently representative for the purpose of skills development planning However this paints an incomplete picture It understates the representative nature of large enterprise registered with the SETA and overstates the representative nature of small registered enterprises 4 175 (242) of the enterprises are levy paying members Further only 1 673 (11) workplace skills plans (WSPs) were submitted
Table 16 Registered employers by size and sub‐sector Sub‐sector Description
Employers Small Medium Large
CoffeeTea Processing and marketing of coffee and tea including coconuts cocoa nuts olives dates etc
33 4 3
Fibre Grading ginning packing of wool and cotton raw material 1 676 16 18
Fruit Fruit packed in cartons fruit juice concentrate drummed and fruit juice in container ready for consumption
271 36 57
Fruit exporters and importers 6 0 1
Grain
Manufacture of grain mill products and starches 119 5 7Handling and storage of grain 67 7 23Wholesale amp retail trade in Agricultural machinery 213 9 4Sale and distribution of Agricultural raw materials and other farming inputs
182 9 3
Milling
Manufacture of flour and grain mill products including rice and vegetable milling grain mill residues
120 15 11
Manufacture of prepared animal feeds 110 19 0Manufacture of pet foods 42 9 0Manufacture of starches and starch products 7 1 1
Pest control
Pest Control 209 4 0
Poultry Poultry and egg production including the slaughtering dressing and packing of poultry
305 49 37
Primary
Growing of Cereals and other crops (not elsewhere classified) 902 160 34Growing of Vegetables Horticultural specialties nursery products
943 120 72
Growing of Vegetables Horticultural specialties (Including Ornamental Horticulture) and nursery products
11 5 0
Sugar plantation including sugar cane and sugar beet etc 9 4 2
33 SARS statistics 2007
AgriSETA June 2010
Agriculture Sector Analysis 28
Sub‐ Description Employers Growing of fruit nuts beverage and spice crops 1795 255 143Farming of cattle sheep goats horses asses mules and hinnies Dairy farming
2 252 59 18
Other animal farming production of animal products (NEC) 433 25 12Ostrich farming 5 0 0Game farming 16 0 0Growing of crops combined with farming of animals (Mixed farming)
2 920 256 109
Growing of coffee and tea including coconuts cocoa nuts olives dates etc
2 0 0
Agricultural and animal husbandry services except veterinary activities
438 22 9
Other animal farming (not elsewhere classified) 11 1 1Growing of trees as second crop by farmers 126 18 4Fishing operation of fish hatcheries and fish farm 913 10 6
Red meat
Production and animal products (not elsewhere classified) 6 0 0Slaughtering dressing and packing of livestock including poultry and small game for meat
317 40 17
Production sale amp marketing of Agricultural by products (eg bones hides)
61 2 0
Slaughtering dressing and packing of livestock including small game for meat and processing of ostrich products
2 1 0
Wholesale trade in Agricultural raw materials and livestock 193 7 10Transport of livestock as supporting activity 224 0 0Agricultural and livestock research 215 9 3
Seed Seed production and marketing 149 12 6
Sugar Manufacture of sugar including golden syrup and castor sugar
45 5 21
Tobacco Processing and dispatching of tobacco 46 8 6 TOTALS 15 394 1 202 638Source AgriSETA WSP data
The largest number of registered small and medium enterprises are found in the mixed farming sub‐sector while most large enterprises are in the growing of fruit nuts beverage and spice crops sub‐sector
Employee coverage in the AgriSETA
Collectively the 17 234 employers registered with AgriSETA employed a total of 239 076 employees This represents 39 of the agricultural labour force in 2009 The 1 673 employers who submitted WSPs in 2009 employed 97 898 employees representing 41 of the total number of people employed by registered employers While the number of registered employers submitting WSPs is small (11) they employ a sizeable number of employees and the percentage of employees provides a statistically significant sample The data for larger enterprises is statistically much more representative than that for small enterprises
AgriSETA June 2010
Table 17 Number of employees of registered employers by sub‐sector
Sub‐sector
Sub‐sector description Employees
CoffeeTea Processing and marketing of coffee and tea including coconuts cocoa nuts olives dates etc
483
Fibre Grading ginning and packing of wool and cotton raw material 6 539
Fruit Fruit packed in cartons fruit juice concentrate drummed and fruit juice in container ready for consumption
27 661
Fruit exporters and importers 212
Grain
Manufacture of grain mill products and starches 133Handling and storage of grain 18 303Wholesale amp retail trade in Agricultural machinery 795Sale and distribution of Agricultural raw materials and other farming inputs 2 898
Milling
Manufacture of flour and grain mill products including rice and vegetable milling grain mill residues
3 634
Manufacture of prepared animal feeds 731Manufacture of pet foods 160Manufacture of starches and starch products 105
Pest control
Pest Control 119
Poultry Poultry and egg production including the slaughtering dressing and packing of poultry
19 187
Primary
Growing of Cereals and other crops (not elsewhere classified) 10 104Growing of Vegetables Horticultural specialties and nursery products 37 799Growing of Vegetables Horticultural specialties (Including Ornamental Horticulture) and nursery products
195
Sugar plantation including sugar cane and sugar beet etc 220Growing of fruit nuts beverage and spice crops 47 043Farming of cattle sheep goats horses asses mules hinnies Dairy farming
3 382
Other animal farming production of animal products (NEC) 4 203Ostrich farming 0Game farming 0Growing of crops combined with farming of animals (Mixed farming) 28 722Growing of coffee amp tea including coconuts cocoa nuts olives dates etc 0Agricultural and animal husbandry services except veterinary activities 970Other animal farming (not elsewhere classified) 513Growing of trees as second crop by farmers 1 294Fishing operation of fish hatcheries and fish farm 1 589
Red meat
Production and animal products (not elsewhere classified) 0Slaughtering dressing and packing of livestock including poultry and small game for meat
5 128
Production sale amp marketing of Agricultural by products (eg bones hides) 116Slaughtering dressing and packing of livestock including small game for meat and processing of ostrich products
0
Wholesale trade in Agricultural raw materials and livestock 1 697Transport of livestock as supporting activity 0Agricultural and livestock research 534
Seed Seed production and marketing 2 127Sugar Manufacture of sugar including golden syrup and castor sugar 10 478Tobacco Processing and dispatching of tobacco 2 002 Total 239 076
Agriculture Sector Analysis 29
AgriSETA June 2010
Agriculture Sector Analysis 30
Source AgriSETA WSP data
According to the WSP analysis the sub‐sector for the growing of fruit nuts beverage and spice crops employed the largest number of people In six sub‐sectors there are employers who do not employ workers These are probably family based organisations where family members help in the business without drawing a salary These are in transport and livestock research slaughtering dressing and packing of livestock including poultry and small game for meat growing of coffee and tea including coconuts cocoa nuts olives dates etc ostrich farming and game farming
Table 18 Employee distribution by province Province Employees Percentage
Eastern Cape 18 844 192 Free State 1 946 20 Gauteng 2 788 28 KwaZulu‐Natal 5 416 55 Mpumalanga 8 062 82 North West 3 290 34 Northern Cape 5 436 56 Limpopo 1 730 18 Western Cape 50 386 515 Grand Total 97 898
Source AgriSETA WSP data
Of those submitting WSPs registered employers in the Western Cape employed the largest number of people while employers in Limpopo employed the least number of employees Free State has a small number of employees covered by WSPs submitted to the SETA whereas Eastern Cape with a relatively small number of registered farms has a very large number of employees on farms submitting WSPs Given this variance between provinces the use of WSP data for extrapolation purposes must be viewed cautiously
2009 WSP equity information was only provided for about a quarter of employees (25 637 or26)34 No information was available from the WSPs on non‐South Africans working on commercial farms
Table 19 Equity profile from 2009 WSP data African Coloured Indian White
Totals M F D M F D M F D M F D
8 040 5 785 38 5 097 5 228 24 22 25 0 811 556 11
580 417 03 493 505 02 468 532 00 589 403 08 13 863 10 349 47 1 378 25 637541 404 02 54 100
Total EquityTotal Male Total Female Total Disability
13 970 11 594 73 545 452 03
Source AgriSETA WSP data
Using currently available data it is not possible to provide disaggregated employment data by sub‐sector This will require a small change in the way that gender race and disability data is
34 Some employers did not complete race and gender information when giving their employment profiles
AgriSETA June 2010
codified during WSP data‐capturing including allocation by sub‐sector What can be stated is that employment of males is more dominant than that of women and more Africans are employed in the sector than other groups Employment of people with disabilities is below 1
21 Skills demand
The National Education and Training Strategy for Agriculture (AET Strategy)
The AET Strategy developed by the Department of Agriculture Fisheries and Forestry (in consultation with various key stakeholders in the agricultural sector) highlights priority skills needs and constraints within the sector and categorises needs within the following 5 broad areas
1 Agricultural production ndash requesting that the past focus on a narrow band of commodities (relevant mainly to the commercial sector) and related research be expanded to address the needs of small‐scale and subsistence farmers (eg more focus on mixed farming and rural livelihood sustainability skills)
2 Agricultural engineering ndash with specific focus to be placed on technologies suitable for small‐scale farmers (eg relevant and post‐harvesting techniques related to processing and storage of produce) ndash to address this need the scarcity of agricultural engineers requires attention
3 Agricultural economics ndash a critical need was identified for general agricultural economic skills (ranging spectrum of farm planning farm management enterprise management marketing finance etc) ndash with the need to training both farmers and extension officers in such fields
4 Agricultural development ndash a specific need was identified to develop agricultural extensionists in supporting especially emerging and small‐scale farmers over the full spectrum (a need exists for both new curriculum in the training of new extensionists and the re‐training and upgrading of existing officers)
5 Veterinarians ndash the need to develop state veterinarians in order for the state to perform its role and function (particularly in its preventative monitoring and regulatory role and function)
AGRISETA sector skills planning demand data (2008‐2009)
The following section reflects initial research on skills demand in the Agricultural sector arising from the sector analysis (section 1) previous AGRISETA skills demand research for Sector Skills Planning during 2005‐2009 and analysis of WSP data from 2009 With the introduction of the Organising Framework of Occupations and agreement on definitions for scarce and critical skills in 200506 the AGRISETA undertook an extensive research and consultation processes to determine skills development priorities for the sector The research methodology employed was based on the a four dimensional topology for establishing and evaluating skills needs illustrated in the figure below
Agriculture Sector Analysis 31
AgriSETA June 2010
Agriculture Sector Analysis 32
The identification and prioritisation of skills needs was also undertaken from a key stakeholder and beneficiary perspective Consideration was given to needs of the following groups
bull The unemployed ndash helping them gain andor regain entry to the labour market bull The economically inactive ndash helping them to become economically active bull School leavers ndash helping them gain access to further education and training opportunities
and thus facilitating their entry to the job market bull Entrants to the job market ndash facilitating employment and integration into the work culture
and work ethic (improving the employability of an individual) bull Those currently employed in the sector ndash increasing their competency and opportunities
for advancement creating a career path and offering continued job security enhancement of value adding to the sector improving their prospects for better employment opportunities
bull Organisations and enterprises within the sector ndash making sure that skills development and knowledge creation occurs in such a way as to improve the sectorrsquos viability and allowing companiesenterprises to become more sustainable and profitable along the way improving productivity competitiveness and innovation within organisations
In organising and reporting the identified priority skills development needs (200809) the following structuring approach was followed
Tier 1 The four categories of needs as per the Topology presented above were used for the identification evaluation and grouping of needs
Pay conditions
Image
RECRUITMENT DIFFICULTY
SKILLSGAP
SKILLSSHORTAGE
LABOURSHORTAGE
Firms experience difficulty recruiting This does not necessary imply a skills shortage ndash may indicate a poor image remuneration etc
Those currently in work do not have the requisite skills set to carry out their job to an optimum standard
Required skills are in short supply when compared with the demand across the whole labour market
Regardless of skills levels a situation exists where there is simply not enough supply of labour to meet demand
Pay conditions
Image
RECRUITMENT DIFFICULTY
SKILLSGAP
SKILLSSHORTAGE
LABOURSHORTAGE
Firms experience difficulty recruiting This does not necessary imply a skills shortage ndash may indicate a poor image remuneration etc
Those currently in work do not have the requisite skills set to carry out their job to an optimum standard
Required skills are in short supply when compared with the demand across the whole labour market
Regardless of skills levels a situation exists where there is simply not enough supply of labour to meet demand
Figure 4 Topology for identifying skills development priorities
Source AGRISETA SSP Annual Update August 2009
AgriSETA June 2010
Tier 2 Within each of the first tier groupings needs were further broken down and organised per target group At this second level needs were grouped by
o General skills development needs (cross‐cutting over different target groups) o Needs experienced by small scale farmers (this group included subsistence
farmers new emerging land reform beneficiaries and small‐scale AgriBEE farmers) o Needs within the commercial agricultural sector (per sub‐sector groupings where
specific needs for such were identified ndash both on‐farm needs and within the secondary sub‐sector or related agri‐businesses)
o Needs of the Department of Agriculture Fisheries and Forestry (DAFF) To further guide and direct the identification and selection of scarce and critical skills the following factors or criteria that could reflect the importance (impact and effect) of a skills shortages were developed as an identification framework
1 Basic Skills Development Promoting basic literacy and numeracy and raising the base level of education for the sector improving the work and livelihood of existing workers
2 Employability Making the employee more employable by improving the fit between their skills and the sector needs
3 Enterprise Viability Improving the capability and feasibility of the enterprise by increasing its effectiveness of or possibilities for profit generation etc
4 Enterprise Sustainability Allow enterprises to survive and grow over an extended period of time without compromising the value of renewable resources thereby creating long‐term meaningful employment for larger numbers of people
5 Sector Growth Enabling the sector to develop or pursue new opportunities or improve the effectiveness of current operations
6 Sector Competitiveness Enabling the sector to compete more effectively in the international arena improving market intelligence and interpretation productivity cost efficiency etc
7 Human Resource Development Capacity Improving the access to quality provision of training to the agri sector
Based on this research and consultation framework the following skills development needs and priorities were identified
Agriculture Sector Analysis 33
AgriSETA June 2010
GENERAL NEEDS SMALL‐SCALE FARMER
NEEDS COMMERCIAL SECTOR
NEEDS DAFF NEEDS
RECRUITMENT RELATED SKILLS NEEDS Primary agriculture is the entry point into the world of work for large numbers of people in rural areas However the sector has negative connotations amongst sections of the youth and in parts of the country and is viewed as a last resort for some in the search for employment) The effect is that despite an unemployment rate of approximately 26 (now over 30) farmers find it difficult to recruit workers to meet seasonal demands This has resulted in the government approving the contracting of foreign labour to meet such temporary needs (workers are recruited mainly from Zimbabwe and Mozambique)
Labour in this farming sector is provided primarily by family members and no real recruitment constraints can be identified
The agricultural sector still manages to attract technical and management skills as it is perceived to include a better lifestyle and there is a strong tradition of agriculture in SA Increasing crime related security risks associated with farming may have a negative impact
The Department has identified a number of occupations in which they are experiencing long‐term vacancies Some of these result from a general shortage of such skills in SA while others arise from the inability of the public sector to compete with the private sector (less favourable employment image working conditions and equity considerations) Priority vacancies include Veterinarians Agricultural
Engineers Plant Health
Specialists Agricultural
Statisticians Plant Health Pest Risk
Analysts ICT Specialists Agricultural
Economists Agricultural Food and
Quarantine Technicians
Agro‐meteorologists Pasture Scientists Plant Production
Specialists Specialised Food
Analysts SKILLS GAPS RELATED NEEDS
bull Low literacy and numeracy levels ndash both amongst workers within the sector at large and at ownermanager level in many of the small‐scale farming
bull Farm management
Farm Management (Mainly owners managers) bull Farm management amp
entrepreneurship bull Resource
management and record keeping
bull Financial planning
A critical constraint is the poor educational levels of a large proportion of the labour force in the sector demanding a considerable effort and investment in ABET and other life skills
A particularly big need exists for skills upgrading amongst Extension Officers ndash particularly with regard to redress the historical neglect of small‐scale farmers and resource strapped farmers
Agriculture Sector Analysis 34
AgriSETA June 2010
Agriculture Sector Analysis 35
GENERAL NEEDS SMALL‐SCALE FARMER
NEEDS COMMERCIAL SECTOR
NEEDS DAFF NEEDS
skills (and general management skills in other agricultural businesses) coupled with a business orientation and entrepreneurship skills
bull A general need to increase compliance with environmental occupational health and safety animal welfare produce safety and hygiene standards regulations and requirements (local and international standards)
and management bull Project management bull Business plan
development Marketing and processing bull Processing and
packaging bull Transport
management bull Marketing produce
including branding bull Planning for
marketing bull Knowledge of
markets Technical knowledge and skills bull Production
management (related to specific enterprise)
bull Demonstration of production techniques
bull Natural resources management
Mechanical knowledge bull Farm maintenance bull Repairs of machinery
and equipment bull Electrical
maintenance and installation
programmes Need for improved management skills and relevant technological knowledge for increasing productivity levels and improved production methods Rising importance for environmentally responsible production and processing management systems Rising competitive and international markets increases need for business and marketing abilities among owners and managers Increasing requirements for compliance with environmental health and safety and international trade standards Information technology although not a priority is increasing in importance Business management ability is becoming increasingly important as more farmers are making decisions about restructuring their businesses diversification and developing supplementary sources of income
Critically improved farm management and business skills within an agricultural context to support the majority of BEE and emerging farmers Skills upgrading requirements for existing Extension Officers include bull Agricultural
economics bull Agricultural
management bull Business and
financial management
bull Technical and production related skills including o Animal husbandryo Poultry o Crop production o Horticulture
SKILLS SHORTAGES Generally SA has a shortage of entrepreneurs and people who have the business acumen drive motivation and
The profile of these farmers reflects a large contingent of older and less educated people who are generally less flexible tend to stick to
The commercial agri sector will increasingly have to compete in the global market and the ever increasing need to increase productivity to
DAFF us experiencing problems are especially sourcing people in specialised science related fields (learning fields experiencing few
AgriSETA June 2010
Agriculture Sector Analysis 36
GENERAL NEEDS SMALL‐SCALE FARMER
NEEDS COMMERCIAL SECTOR
NEEDS DAFF NEEDS
perseverance to become a successful farmer Given the high risks involved in the agricultural sector (natural elements outside onersquos control) the agri sector does not compete successfully for this ldquoscarce resourcerdquo Moreover as with other professional and skilled occupations there is a tendency for younger qualified people to move to urban areas
known practices and are less likely to experiment with new technology Within this target group candidates with good entrepreneurial ability are scarce There is a perceived shortage of Agricultural Extensionists and advisors to assist this target group However a large pool of young unemployed graduates exists who could assist such emerging farmers if they were mobilised and made accessible to farmers Similarly the potential pool of retired commercial farmers who could serve as mentors to this target group
remain profitable and viable it can be stated that many of the existing farmers and managers owners lack business management and entrepreneurial orientation Equity policy and the need to become BEE compliant requires that commercial enterprises appoint and develop black owners directors managers Changing local and global consumer preferences require farmers to change traditional farming methods and practices Skills and knowledge requirements include bull Global food and
international quality standards
bull Product traceability requirements
bull Organic produce and products
Specific occupations identified as being in short supply are
bull Production Managers (food processing)
bull Product specialisation to international specifications (research skills)
bull Forklift drivers heavy vehicletruck drivers and mobile plant operators
bull Experienced and competent artisans (millwrights electricians fitters
enrolments andor pass rates at HET institutions with the result that too few qualified persons come onto the labour market) Examples of such skills shortages identified by the Department include Agricultural Engineers bull Plant Health
Specialists (Nematology Entomology Plant Pathology)
bull Statisticians (specialised agricultural knowledge)
bull Plant Health Pest Risk Analysts
bull Agricultural Economists (production and resource economists)
bull Agricultural Food and Quarantine Technicians
bull Agro‐meteorologists Early warning Specialists
bull Pasture Scientists bull Plant Production
Specialists (eg ornamental crops hydroponics)
bull Specialised Food Analysts (pesticide residue analysts processed food and dairy analysts wine and spirit analysts)
AgriSETA June 2010
Agriculture Sector Analysis 37
GENERAL NEEDS SMALL‐SCALE FARMER
NEEDS COMMERCIAL SECTOR
NEEDS DAFF NEEDS
and turners bull Agricultural
Equipment Technicians
bull Pest and weed controllers
bull Horticultural specialists
LABOUR SHORTAGES AND RELATED SKILLS NEEDS Given an employment rate of some 26 (2009 currently estimated at over 30expanded definition) per definition there cannot be a labour shortage It is however difficult for people who have never worked before to integrate into the agricultural sector workforce Coupled with an aging workforce (30‐60 being over 40) means that most agri enterprises will within the next 5‐10 years be looking at replacing a large proportion of their workforce There could be an insufficient pool of people willing and able to participate The impact of HIVAIDS is also not always factored in to understanding the diminishing pool of resources available Labour shortages have been reported within selected geographical areas and in particular occupations Examples include cane cutters in the sugar industry chicken catchers in the poultry industry pickers in the fruit industry and animal handlers in feedlots as well as dairy parlour workers It is however believed that these shortages may reflect a recruitment problem as a result of the very harsh working conditions and the relatively poor remuneration (which makes these occupations unpopular) At present such ldquoshortagesrdquo are addressed through contracting labour from neighbouring countries
AgriSETA WSP analyses
Skills demand in the commercial agricultural sector
Information for demand for skills from WSP data is available for 1 673 employers who submitted their WSPs for the 200910 period The table below shows data on sub‐sector WSP submission relative to size of the sub‐sector as well as subsector data from all registered organisations and those who submitted WSPs Data for registered employers shows that there were 239 076 employees employed by the 17 234 registered organisations As previously stated 97 898 employees were employed by the organisations submitting WSPs This constitutes 41 of employees employed by registered organisations
Table 20 Employment and sub‐sector data drawn from WSP analyses
Sub‐sector
All Re
gistered
Employers
Small employers (0‐49)
Med
ium and
large
employers (50+)
Total W
SPs received
Total W
SPs received
as of
all registered em
ployers
WSP
received med
ium and
large orgs
WSPs received
as of
med
ium amp large em
ployers
WSPs received
small
employers
WSPs received
as of small
enterprises
EmployeesPer
Profile
CoffeeTea 40 33 7 9 23 5 71 4 12 483 Fibre 1 710 1 676 34 34 2 22 65 12 07 6 539
AgriSETA June 2010
Agriculture Sector Analysis 38
Sub‐sector
All Re
gistered
Employers
Small employers (0‐49)
Med
ium and
large
employers (50+)
Total W
SPs received
Total W
SPs received
as of
all registered em
ployers
WSP
received med
ium and
large orgs
WSPs received
as of
med
ium amp large em
ployers
WSPs received
small
employers
WSPs received
as of small
enterprises
EmployeesPer
Profile
Fruit 371 277 94 162 44 76 81 86 31 27 873 Grain 648 581 67 77 12 48 72 29 5 22 129 Milling 335 279 56 61 18 35 63 26 9 4 630 Pest Control 213 209 4 8 4 2 50 6 3 119 Poultry 391 305 86 66 17 46 53 20 7 19 187 Primary 12 121 10 776 1 345 1144 9 513 38 631 6 136 034 Red meat 1107 1 018 89 70 6 45 51 25 2 7 475 Seed 167 149 18 24 14 13 72 11 7 2 127 Sugar 71 45 26 13 18 10 38 3 7 10 478 Tobacco 60 46 14 5 8 3 21 2 4 2 002
Totals 17 234 15 394 1 840 1 673 10 818 44 855 16 239 076
Source 1 AgriSETA WSP 2009 data
Only 10 of all registered employers submitted WSPs for the 200910 period Of these 49 were medium and large sized employers and 51 small However only 16 small employers submitted their WSPs relative to the number of registered small employers and 44 medium and large employers submitted WSPs relative to the number of registered medium and large employers As such skills demand statistics provides more representative data on the requirements of medium and large employers Data for skills demand in the commercial agricultural sector is based on data for permanent employees as well as casual and seasonal employees
Skills demand forecasting by AgriSETA
Forecasting for skills demand the AgriSETA has estimated that the demand for skilled employees at different levels in the next few years is 510 686 This is based on WSP data analyses over the last 5 years and projected demand for the formal commercial agricultural sector and factoring in the demand that at maximum would result from completion of the land restitution programme in South Africa The table below reflects the skills that are on demand as well as the estimates for demand over the next five years by major occupational category35
35 AgriSETA 2010
AgriSETA June 2010
Table 21 Demand for skills by occupational category
Major Occupation (OFO)Estimated Demand
Group Title1 Managers (commercial and small emerging farmers) 264 3702 Professionals 4 1413 Technicians and Trade workers 8 9255 Clerical and administrative workers 8006 Sales workers 4007 Machinery operators and drivers 5 8008 Elementary workers 226 250
Total 510 686Source AgriSETA WSP data and SSP demand forecasts
Research needs going forward
As has been set out in the sector analysis and the scenarios derived from that analysis the sector is faced by both significant and profound change and also great uncertainty It therefore follows that the task of focussing limited resources (basically levy income in the formal sector and NSF funds for the emergent farming sector) is difficult Whilst the general thrust of training remains broadly as described in the 2006‐10 SSP Updates some considerable work is required to achieve targeted effective interventions during the 2011‐2016 period The following research questions will need to be addressed in preparing the next SSP
bull In relation to the managers and owner‐managers of commercial farms and enterprises what skills are needed to enable them to help bring about the more optimistic scenario and manage the risks associated with the less optimistic ones
bull In terms of professional and technical competencies do the current education and training institutions coupled with the learning programmes available through the AgriSETA (learnerships skills programmes and the like) meet the needs of the sector
bull In the emerging agricultural sector do the current programmes funded by sources external to the AgriSETA (eg NSF) meet all the identified needs What gaps are there and how should they be addressed
bull In relation to governmentrsquos growth strategy and industrial action plans what skills are required for developing the aquaculture sub‐sector What programmes are available How can the SETA support the skills needs for this sub‐sector
bull Given the increasing levels of casual and contract labour how can skills be developed to meet the needs of the formal commercial sector and the emerging enterprise sector
bull How can the demand in each of the priority areas be quantified and agreement be reached on numbers of people to be trained
Agriculture Sector Analysis 39
AgriSETA June 2010
SECTION 3 Skills Gaps and scarce skills
Scarce skills at the DAFF
The level of scarce skills at DAFF can be determined by the vacancy rate While the average vacancy rate in the department as at 31 March 2009 was 17 there were some posts that had very high vacancy rates as reflected in the table below Indicating the possibility that the Department is experiencing difficulties in finding suitable candidates in the South African labour market to fill these posts
Table 22 Scarce skill occupations and vacancy rates (DAFF March 2009) Critical occupations Number of posts Posts filled Vacancy rate ()
Agricultural animal oceanography forestry and other sciences
167 119 287
Engineering sciences related 2 1 50Engineers and related professions 13 6 538Farming forestry advisors and farm managers 11 4 636Finance and economics related 73 53 274Horticulturists foresters agricultural and forestry technicians
350 221 369
Legal related 6 4 333Mechanical engineering technicians 3 2 333Risk management and security services 6 4 333Social sciences related 1 0 100Veterinarians 34 24 294
Source DAFF Annual Report 20082009
Skills are also scarce at senior management level The department also reports on difficulties it has filling senior management services vacancies with some of them staying vacant for up to twelve months because no suitable candidates can be found The department would then resort to re‐advertisement and head hunting This was the case with 22 of 18 SMS posts in March 2009
Scarce skills in the commercial sector
The following occupations have previously been projected as scarce (extremely hard to fill vacancies) by AgriSETA in the commercial agricultural sector over the next five years
Table 23 Scarce and critical skills in the commercial agricultural sector
Occupation Code
Group Occupation Critical Skills Intervention Comments
139903 Managers Laboratory Manager
Technology AI nutrition
HET
221101 Professionals Accountant (General)
General HET
221102 Professionals Management Accountant
Farm financial management
HET Focus on support advice to farmers new enterprises
222101 Professionals Commodities Trader
Export administration supply chain
FET Learnership Skills
Agriculture Sector Analysis 40
AgriSETA June 2010
Agriculture Sector Analysis 41
Occupation Code
Group Occupation Critical Skills Intervention Comments
management Programme
224301 Professionals Economist Agricultural HET
Mainly for Department of Agriculture and para statals commodity organisations
233101 Professionals Chemical Engineer
Chemical processes in food production
HET Industries such as sugar processing
233301 Professionals Electrical Engineer
Installation and maintenance
HET Processing industry
233401 Professionals Electronics Engineer
Computerised production prosesses
HET Processing industry
233501 Professionals Industrial Engineer
Productivity and efficiency
HET Processing industry
233904 Professionals
Instrument Engineer (Defence Force)
Installation and maintenance
HET
Not for defence ‐ sugar industry
233502 Professionals Mechanical Engineer
FETHET Equity reasons
233902 Professionals Agricultural Engineer
Farm layout and infrastructure
HET Mainly in Government
311101 Technicians and trades workers
Agricultural Technician
Installation and maintenance
FETHET
234102 Professionals Agricultural Scientist
Agri research HETFET Especially in horticulture
234201 Professionals Chemist HET Processing industry
234202 Professionals Food Technologist
Food safety HACCP
FETHET Across sector
234701 Professionals Veterinarian HET Mainly in Government
311101 Technicians and trades workers
Agricultural Technician
Farm infrastructure
FET Mainly needed in government
311401 Technicians and trades workers
Chemistry Technician
FETHET EE reasons
312907 Technicians and trades workers
Chemical Engineering Technician
FET Learnership
Mainly EE reasons
312402 Technicians and trades workers
Electronic Engineering Technician
Weak stream production infra
FETHET Mainly tobacco industry
233904 Professionals
Instrument Engineer (Defence Force)
Instrument technician
FET
Occupation needed Instrument Technician (not defence force) Mainly sugar processing sector
321202 Technicians and trades workers
Diesel Motor Mechanic
FET Learnership
To include tractor mechanic
321204 Technicians and trades workers
Small Engine Mechanic
Agricultural equipment
FET Learnership
Throughout sector
AgriSETA June 2010
Agriculture Sector Analysis 42
Occupation Code
Group Occupation Critical Skills Intervention Comments
322301 Technicians and trades workers
Metal Fabricator
Artisan FET Learnership
322303 Technicians and trades workers
Welder Welder (First Class)
Artisan FET Learnership
323203 Technicians and trades workers
Fitter‐Welder Artisan FET Learnership
Mainly sugar ndash multi‐skilled
323202 Technicians and trades workers
Fitter And Turner
Artisan FET Learnership
Tobacco and sugar
323501 Technicians and trades workers
Millwright Artisan FET Learnership
Wide‐spread need
341101 Technicians and trades workers
Electrician (General)
Artisan FET Learnership
Wide‐spread need
342101 Technicians and trades workers
Air‐Conditioning And Refrigeration Mechanic
Artisan FET Learnership
Sugar pack houses cold chain
Source AgriSETA Sector Skills Plans
Supply of skills
South Africarsquos agriculture skills are produced in high schools agricultural colleges FET colleges and Higher Education institutions In high school a large cohort of learners take Agricultural Science as a subject In 2003 there were 42 Agricultural High Schools offering Agricultural Science as a subject These students and those in high schools taking the subject could progress to taking agriculture as a focus area for further education In 2004 there were 10 FET colleges offering vocationally directed agricultural programmes These FET colleges offered complete qualifications and short courses Eleven Colleges of Agriculture can offer qualifications up to degree level and 19 universities offer qualifications in Agriculture ranging from agricultural economics animal and plant sciences and horticulture among others at under and post graduate levels (Department of Agriculture 2006) While long term planning of skilling of new entrants in the sector can be done through close consultation between the sector agricultural schools and colleges FET colleges and HET institutions so that they teach relevant skills there are other avenues for training for those who are already employed in the sector for example skills programmes and learnerships There are 15 registered qualifications for the primary agriculture sub sectors Currently AgriSETA has 94 registered learnerships that can address the skills needs of the identified scarce skills These are captured in Appendix 2 AgriSETA has approved accredited a number of training providers across the country to deliver the theoretical and practical components of these learnerships These include agricultural colleges FET colleges and private providers Currently the AgriSETA has 246 registered and approved providers distributed nationally as follows
AgriSETA June 2010
Table 29 AgriSETA approved training providers (2010) Province Number of providers
Gauteng 72
(29)
KwaZulu Natal 20
(8)
Limpopo 35
(14)
North West 30
(12)
Northern Cape 3
(1)
Free State 15
(6)
Mpumalanga 14
(6)
Western Cape 26
(11)
Eastern Cape 31
(13) Total 246
The providers are small to large organisations In primary agriculture small providers appear to offer the most training in rural areas and community projects (AgriSETA 2010) Most of the operating providers will be in FET colleges and agricultural colleges The AgriSETA is unable to meet the total demands for skills across the duality of their sector There seems to be fairness in the approval of training for both permanent and casual and seasonal workers In 200809 the AgriSETA approved 559 learnerships as follows
Table 30 AgriSETA learnerships approved for grant purposes (2008‐2009)
Source AgriSETA learnership data analysis
Agriculture Sector Analysis 43
AgriSETA June 2010
Agriculture Sector Analysis 44
Provision of skills programmes in the same year attracted grants for 2 706 employees
Table 31 Participation by learners in skills programmes in the AgriSETA (200809)
Source AgriSETA Skills programmes data analysis
AgriSETA June 2010
APPENDIX 1 Skills demand in the Department of Agriculture Forestry amp Fisheries (200809)
Source DAFF Annual Report 2008‐20009
Agriculture Sector Analysis 45
AgriSETA June 2010
Agriculture Sector Analysis 46
Appendix 2 AgriSETA registered learnerships Registered Learnership NQF Level SAQA Registration NoLearnership in Agri Sales and Service 4 22 Q 220001 20 178 4Learnership Agricultural Machinery Technician 2 22 Q 220007 20 160 2Learnership in Specialist Agricultural Machinery Technician 5 22 Q 220009 21 258 5Agri Trade Processes 2 22 Q 220013 30 125 2FETC Meat Examination Applying Basic Business Principles 4 30 Q 3000 2823 164 4Further Education and Training Certificate Seed Marketing Execute Seed Trials 4 22 Q 220025 21 126 4Further Education and Training Certificate Seed Research and Development Certify as Seed Unit 4 22 Q 220027 21 121 4FETC Seed Research and Development Conduct a Field Inspection of a Seed Unit 4 22 Q 220028 20 120 4Seed Research and Development Operations Operate in a Team 3 22 Q 220020 22 121 3Seed Research and Development Operations Apply Basic Business Principles 3 22 Q 220021 22 121 3National Certificate Seed Processing and Packaging Operate in a Team 3 22 Q 220026 21 123 3Sugar Industry Technical Maintenance worker 2 22 Q 220011 39 128 2National Certificate Sugar Manufacturing and Refining Technical Maintenance 3 30 Q300003 23 146 3Further Education and Training Certificate Manufacturing Technical MaintenanceProduce Components by Performing Engineering Turning Operations
4 30 Q 3000 1321 173 4
FETC Manufacturing Technical Maintenance Produce Components by Performing Milling Operations 4 30 Q 3000 1521 173 4 FETC Manufacturing Technical Maintenance Develop and Fabricate from Complex Drawing 4 30 Q 3000 1420 173 4National Certificate in Sugar Technology 5 22 Q 220036 22 140 5Further Education and Training Certificate Sugar Processing 4 22 Q 220035 31 144 4National Certificate in Sugar Technology Processing Sugar Refining 2 22 Q 220037 28 124 2National Certificate in Sugar Technology Processing Juice Preparation 2 22 Q 220038 28 124 2National Certificate in Sugar Technology Processing Crystallisation 2 22 Q 220039 27 122 2National Certificate in Sugar Technology Processing Laboratory Practice 2 22 Q 220040 25 124 2National Certificate in Sugar Technology Processing Extraction 2 22 Q 220041 28 122 2NC Rooibos Production Applying Basic Business Principles 2 30 Q 3000 2427 130 2 NC Rooibos Processing Applying Basic Business Principles 2 30 Q 3000 2224 123 2 National Certificate Cigarette Production 3 22 Q 220046 23 121 3
AgriSETA June 2010
REFERENCES AgriSETA 2010 AgriSETA 20082009 Annual report Pretoria AgriSETA Agricultural Research Council httpwwwarcagriczahomeasppid=272 Avert South African HIV and AIDS statistics Available on httpwwwavertorgsafricastatshtm Centre for Development Enterprise 2008 Land reform in South Africa Getting back on track CDE Research No 16 DAFF 2010 Quarterly economic review of the agriculture sector Pretoria DAFF DAFF 2009 Annual report 20082009 Pretoria DAFF Department of Agriculture 2008 Strategic plan 2008 Pretoria Department of Agriculture DTI An introduction to the South African economy Available on httpwwwthedtigovzapublicationsagroprocessinghtm Eastern Cape Provincial Government Eastern Cape Provincial Growth and Development Strategy 2004 ndash 2014 Economic Commission for Africa 2009 Developing African agriculture through regional value chains Addis Ababa Economic Commission for Africa Economic Report Free State Province 2005 Provincial Growth and Development Strategy 2005 ndash 2014 GCIS 2010 SA Yearbook 200910rdquo Agriculture forestry and fisheries Pretoria GCIS Greenberg S 2010 Status report on land and agricultural policy in South Africa 2010 Institute for Poverty Land and Agrarian Studies School of Government University of the Western Cape Research report Ingelozi Management Solutions 2008 HIVAIDS in the South African agricultural sector Towards the development of a long term intervention Research report KwaZulu Natal Provincial Government 2006 KwaZulu Natal Provincial Growth and Development Strategy Limpopo Provincial Government Growth and Development Strategy 2004 ndash 2014 Mhone G (2000) Enclavity and Constrained Labour Absorbtive Capacity in Southern African Countries Geneva International Labour Office Moyo S The Agrarian question and the developmental state in South Africa In Edigheji O et al 2010 Constructing a democratic developmental state in South Africa HSRC PRESS
Agriculture Sector Analysis 47
AgriSETA
Agriculture Sector Analysis
National Treasury Republic of South Africa 2010 National Budget 2010 ndash National Budget Review 2010 Pretoria National Treasury Northern Cape Provincial Government Agriculture and agro‐processing sector strategy North West Provincial Government North West Provincial Growth and Development Strategy 2004 ndash 2014 Province of the Western Cape 2008 The Ikapa growth and development strategy White Paper SABCOHA SA Business Coalition on HIV and AIDS wwwsabcohaorg SACAU httpwwwsacauorghostingsacauSacauWebnsfHomehtmOpenForm South African Government 2010 20102011 ndash 20122013 Industrial Policy Action Plan Republic of South Africa Statistics South Africa 2005 Census of commercial agriculture 2002 Report No 110201 Pretoria Statistics South Africa Statistics South Africa 2009 Census of commercial agriculture 2007 Statistical release P1101 Pretoria Statistics South Africa Statistics South Africa 2010 General household survey 2009 Statistical release P0318 Pretoria Statistics South Africa Statistics South Africa 2010 Gross domestic product first quarter 2010 Statistical release P0441 Pretoria Statistics South Africa Statistics South Africa 2010 Quarterly labour force survey Quarter 1 2010 Statistical release P0211 Pretoria Statistics South Africa Vink N amp van Rooyen J 2009 The economic performance of agriculture in South Africa since 1994 The implications for food security Pretoria DBSA development planning division working paper series No 17 Webster E 2004 the Dual Economy from a book by Van Holdt K and Webster E Work restructuring and the Crisis of Social reproduction and 10 years of restructuring post apartheid workplaces University of Natal Press Workinfocom httpwwwworkinfocomfreesub_for_legresdatalraempassoc3htm Xingwana L 2008 Challenges and Opportunities for Land and Agrarian Reform towards 2025 Speech delivered at the Agri‐Consultation Protea Ranch Hotel Polokwane 30 July 2008
- Table of contents
- SECTION 1 THE AGRICULTURAL LANDSCAPE
- 11 Size and shape of the Agricultural sector
-
- Overview
- Distribution of agricultural production
- The structure of the agriculture sector in South Africa
- Categories of farming enterprises
- Employment trends
- Employment categories and remuneration
- Stakeholders in the Agricultural sector
-
- National government departments
- Sector representatives
-
- 12 Factors impacting development in the Agriculture sector
-
- Future sector economic growth and development
-
- South African sector growth plans (IPAP2)
- International Trade
- Global recession and rise in food prices
-
- Land reform
- Reliance on imports
- Water
- The labour market
- Consumer trends
- HIVAIDS
- Farm safety and security
- Broad-based Black Economic Empowerment
-
- Conclusions and scenarios
- SECTION 2 DEMAND FOR SKILLS
-
- AgriSETA registered employers and employee coverage
- Employee coverage in the AgriSETA
-
- 21 Skills demand
-
- The National Education and Training Strategy for Agriculture (AET Strategy)
- AGRISETA sector skills planning demand data (2008-2009)
- AgriSETA WSP analyses
-
- Skills demand in the commercial agricultural sector
-
- Skills demand forecasting by AgriSETA
- Research needs going forward
-
- SECTION 3 Skills Gaps and scarce skills
-
- Scarce skills at the DAFF
- Scarce skills in the commercial sector
- Supply of skills
-
- APPENDIX 1 Skills demand in the Department of Agriculture Forestry amp Fisheries (200809)
- Appendix 2 AgriSETA registered learnerships
-
AgriSETA June 2010
Agriculture Sector Analysis 21
sector with skilled and semi‐skilled workers coming into the labour market and being absorbed into the workforce and helping raise productivity levels However at the lower skilled end of the market the existence of this pool brings further casualisation and downward pressure on wages Tensions are likely to increase and further protests either in the form of xenophobic outbreaks or actions against farmers may well increase A view often expressed by farm employers is that current labour legislation makes dismissing workers difficult and so the availability of labour without entering into contracts of employment is an attractive way of avoiding the legislation and its obligations Organised Labour is seeking to restrict these opportunities through either regulating or eliminating labour brokers and efforts are being made to regulate the use of foreign labour However for the foreseeable future the trend is for formally employed people to be reduced in number In relation to the emergent sector there will also be a reluctance to enter employment contracts with workers The fact that many households are engaged in some form of largely unpaid agricultural work means that there is significant casual work dating back many years Helping change this situation into one where casual or unpaid jobs are transformed into formal jobs with regular wages will take time It is also likely that as some emergent farms become established they will act similarly to established farms and institute a form of casual labour rather than expanding a workforce for which they would have to take a level of responsibility From an AgriSETA perspective these labour market trends mean that whilst levy income can be directed at a relatively small labour pool one that is manageable in terms of planning and implementation the size of the informal casual and unemployed labour force in the sector ‐ for whom no levy is paid and who have no employer to plan for their skills needs ndash is very large and its needs almost unlimited Clearly the relationship with the National Skills Fund (NSF) becomes critical in respect of the entire non‐levy income sector Again the level of support available from non‐levy income sources will be an important variable in looking at future sector skills development scenarios
Consumer trends
South Africa currently produces enough food to meet the needs of its population However consumption of three main staples maize wheat and vegetables has been volatile since 1985 and remains below 1990 levels Consumption of maize and vegetables by South Africans is 17 and 32 less respectively than in 198530 The main reasons for this lie in the growing levels of poverty and the difficulties that families have in purchasing nutritious food Whilst government has increased the levels of social grants and increased the number of people receiving grants to around 13 million the incomes of poor families have been badly hit by a range of factors including job losses and rises in food prices The approximately 1 million people who lost their jobs in 20089 meant a loss of income for many millions of dependents Rises in food prices have also had a disproportionate impact on the poor Whilst food is available it is often not accessible to families on the income levels that they have to manage within The result is that less and less nutritious food is purchased which in turn impacts on the ability of farmers to sell their products locally 30 Greenberg 2010
AgriSETA June 2010
Agriculture Sector Analysis 22
Whilst there is no evidence that government will reduce its efforts in relation to poverty relief and social benefits including such programmes as school feeding schemes and food parcels during periods of drought the state of public finances may not enable to support the poverty that grips many rural areas If real income levels for the poor were to rise it could have a significant impact on the economy of the agricultural sector Equally an improvement in the rural economy with increased agricultural production and jobs would dramatically impact on the capacity of people to buy nutritious food Achieving a positive growth path in rural areas is a huge challenge for government and one that is key to governmentrsquos Medium Term Strategic Framework and Industrial Policy Action Plans
HIVAIDS
South Africa has a high prevalence of HIV and AIDS The HIV prevalence among people aged two and above was estimated at 109 in 2008
Table 15 Estimated HIV percentage prevalence by age group (2002 ndash 2008)
Age 2002 2005 2008 Change
Children (2‐14 years) 56 33 25 ‐31
Youth (15‐24 years) 93 103 87 ‐06
Adults (25 and older) 155 156 168 13
15‐49 year olds 156 1692 169 13
Total (ages 2 to 49) 114 108 109 ‐05 Source Avert 2009
The table above shows that HIV prevalence is highest amongst those aged 25 years and older Given youth labour market analyses which point to people from previously disadvantaged backgrounds mainly African males accessing formal employment for the first time at age 25 ‐27 this population can be held to represent people in employment Research31 has estimated that by 2020 the pandemic will have claimed at least 20 of employees in the agricultural sector Southern Africa
in
HIV and AIDS have significant ramifications in the agricultural sector for both commercial farming and subsistence farming The implications include
bull Decrease in cultivated land bull Focus on less labour intensive crop and animal production bull Decrease in womenrsquos agricultural productivity as they take on a more care giving role bull Loss of skills bull Increase in absenteeism from work bull Decrease in daily work outputproductivity because workers are weaker from infections
There are suggestions that the impact of the pandemic in South Africa demands sectoral intervention although this may be difficult in the agricultural commercial sector as
bull Seasonal workers who seem to be more vulnerable to infection because of their low socio‐economic status are not in one place long enough for care programs Further
31 Ingelozi Management Solutions 2008
AgriSETA June 2010
Agriculture Sector Analysis 23
farmers and employers may not feel responsible for seasonal workers in the same way they would invest in their permanent employees
bull There may be uncertainty around land reform which may put HIV intervention on farms on the back burner
bull There are no policies that enforce HIV education and care on farms in the same way that legislation like BEE does for ownership As a result HIV intervention may be left to goodwill and employers may feel it is more important to comply with issues that are monitored
Farm safety and security
South Africa has been plagued by unacceptably high levels of violent crime and murder for many years now Farms have experienced this and those living on farms feel and are extremely vulnerable The South African Chamber of Commerce and Industry (SACCI) has argued that
Using the nominal GDP figure for 2009 of R24 trillion a 322 percent contribution of agriculture to GDP and an estimate of 39982 farms (as at 2007) in South Africa the cost of a murderattack on a farm to the economy was R1932869 per annum
SACCI acknowledges that this estimate is flawed as it does not take into consideration the fact that farming units contribute differently to GDP and that not every attack or murder contributes to farm shut down or loss of productivity However if not addressed these attacks could lead to loss of farming sectors as farmers migrate to lsquosaferrsquo regions This will affect employment and GDP contribution of the sector The need for safety and security on farms may also shift farmersrsquo focus in skills development to include personnel who have skills in safety and security
Broad‐based Black Economic Empowerment
The aim of the AgriBEE Charter (gazetted in 2008) is to increase the involvement of black business in agriculture through ownership and control as executives and senior managers of new and existing agricultural businesses The extent to which AgriBEE is transforming the sector is not known as it is too early to tell but a recent survey conducted by ABC and the IDC showed that among the ABC respondents in 2007 46 of enterprises were busy constructing a BEE strategy and 46 claimed to be implementing a BEE strategy A survey of the dairy industry in the Western and Eastern Cape in 2008 showed that only 6 of firms had a BEE strategy in place It also seems from survey data that companies are focusing on the skills development and socio‐economic aspects of BEE rather than on ownership32 It would appear that although there have been some significant BEE purchases of viable farms and some employee empowerment projects including some quite high profile ones in the Cape Winelands the extent of ownership change had been limited One of the factors is the very high level of single person or family ownership in the agricultural sector BEE is more straight forward in the corporate world where shares can be exchanged For a family business it is a matter of selling off part or all of the land and the tendency is to sell off those areas of the farm that are expendable from a business sustainability perspective
32 Greenberg 2010
AgriSETA June 2010
Whilst there is discussion in government about the ending of the ldquowilling buyer willing sellerrdquo concept the Constitution itself provides for property rights and so although some pressure may be exerted through legislation and regulation the extent and speed of change may not be fast The mechanisms for encouraging the transfer of significant levels of ownership have not yet been created The focus of the SETA is therefore likely to be more the beneficiaries of land reform and emergent farmers though projects of a BEE nature can be targeted as they arise
Conclusions and scenarios It is useful when looking at possible scenarios to examine the key variables or uncertainties and to project how variations one way or the other will have an impact on the development and growth of the sector From the sector analysis and factors that are contributing to change in the sector there are some key factors that seem to emerge First appears to be the economy and related issues of the labour market and the challenges of labour absorption in an enclave economy These factors determine on the one hand whether there will be growth and development and on the other whether such improvements will result in improved employment opportunities and the creation of a virtuous cycle of development Second is the role of the state and the various government departments whose plans and work impact on the agricultural sector Related to this is land reform that is inevitably driven by the state and not the owners of land or the landless The view expressed by many engaged in agrarian reform is that the state must play a significant role It becomes clear that a successful agricultural enterprise requires a number of factors to be in place to be successful These include access to land (Department of Rural Development and Land Reform) agricultural support within a supportive agricultural framework (Department of Agriculture Forestry and Fisheries) access to consistent water supply (Department of Water Affairs) access to finance (Department of Trade and Industry various state agencies) conducive labour market regulation (Department of Labour) sound industrial policy (Department of Trade and Industry) economic planning and macro policy (Department of Economic Development National Treasury) and appropriate education training and skills development (Department of Higher Education and Training the Human Resources Development Council NSA and the SETA) There are other government departments as well as provincial and municipal structures that also play a role The following analyses show how the four variables
economic growth and development role of the government labour market changes and land reform)
impact positively or negatively on the growth of the sector and the demand for skills
Agriculture Sector Analysis 24
AgriSETA June 2010
Agriculture Sector Analysis 25
HHIIGGHH GGRROOWWTTHH SSCCEENNAARRIIOO
The economics of the sector Role of government
The economy in SA and globally continues to revive albeit slowly for the next few years
Roles and integration of national government departments are clarified Specific functions are agreed processes put in place and personnel appointed with the required skills
International trade agreements are still weighted infavour of US and EU but progress is being made and specific blockages are addressed in bilateral talks
The roles of Departments (DWA DAFF DRDLR DoL DTI DED DHET) are clarified with appropriate joint plans and coordinating structures
The rural economy gradually improves with the buying power of the poor increasing and more stable markets created for local produce
For each of the functions agreed in each of the related departments appropriate structures and systems are put in place and staff trained
Exports increase in key areas identified in IPAP 2 and the Rand exchange rate stabilises at a level not too much different than it is today
Specific capacity is put in place at local level to support implementation of land reform and rural development
There is a growing understanding of the concept of dualism and the need to intervene with labour absorption and development mechanisms
Land claims are all finally settled and ownership and tenure is resolved There is a serious drive to establish effective agricultural enterprises
An understanding is reached on the role of agencies and labour brokers and abuse is curbed
The willing buyer willing seller approach is resolved and enables viable land to become black owned
Some relaxation of labour market regulations are agreed that maintain some minimum standard of employment but assist absorption
Land transfer to black and emergent farmers is done in a manner that integrates then into the supply chains of the sector
Mechanisms are found to address skills needs in the context of casual and seasonal work patterns
Financing of land reform and transfer is done on the basis of agreed development plans including skills
Labour market reform Trajectory of land reform LLOOWW GGRROOWWTTHH SSCCEENNAARRIIOO
The economics of the sector Role of government departments The economy in SA and globally stagnates at current levels and the economy struggles to pick up after the temporary 2010 World Cup boost
A lack of purpose at government level means limited progress for another five years Land reform remains a commitment without a plan
International trade agreements are still weighted infavour of US and EU and protectionism increases as a result of the global recession
The roles of Departments (DWA DAFF DRDLR DoL DTI DED DHET) are unclear and there is no proper co‐ordination
SArsquos Gini coefficient continues to worsen with rural poverty increasing and local economies declining
There is a lack of effective structures systems and processes to implement policy across departments
Rand volatility causes problems for importers and exporters Well established markets are maintained but exports decrease
At local level the decline in the agricultural extension officer functions continues and limited practical support is available
Understanding of the rural economy is so diverse that stakeholders cannot agree the problem let alone the solution to low absorption levels
Land claims take too long and land reform processes leave potentially productive land poorly developed and managed
Casual labour and labour brokers remains an issue of dispute Confrontation results in bitterness and resentment
The impasse caused by a rigid interpretations of property clauses in the Constitution continues to stall achievement of the 30 black ownership target
Labour market regulation continues to be a contributing factor to reducing levels of employment
Black owned farms find it difficult to become part of supply chains and are unable to perform adequately
Unstable employment patterns in the sector make skills interventions difficult to manage and largely ineffective
Financing of land reform and land transfer continues to be wasted as it is not tied to the building of appropriate capacity
Labour market reform Trajectory of land reform
AgriSETA June 2010
These analyses can be translated into four potential growth and development scenarios for the agricultural sector which are based on the requirements for a strong development state Scenario 3 Weak government support
and sound economy
Econ
omic fa
ctors glob
ally n
ationa
lly and
locally
Scenario 1 Integrated government support and sound economy
The economic upturn triggered by the World Cup continues and globally things improve enabling an expansion of exports The government because of a lack of integrated policy planning and implementation provides limited support for sector development The gains go to the well established enterprise owners with few gains for emerging farmers and local communities
Government departments coordinate their efforts to achieve maximum impact There are favourable economic conditions that create opportunities for advance Within this positive environment the role of the AgriSETA becomes a central component of a comprehensive strategy for growth and skills interventions are targeted to achieve maximum effect Results in growth in sustainable enterprises and expanded employment opportunities
Government policy and support Government policy and support
Combination of disjointed government policy planning and a weak and increasingly marginalised rural economy Economic conditions result in unsustainable farming conditions and employment declines along with productivity Food shortages and the lack of development in rural areas leading to increasing social tensions A vicious cycle develops with the sector going into long term decline
Government departments coordinate their efforts to achieve maximum impact However economic conditions hamper progress Efforts by the AgriSETA are undermined by poor labour absorption and job insecurity Some significant successes are recorded including some NSF funded projects that result in sustainable enterprises A platform is laid for future improvements when the economic conditions improve
Scenario 4 Weak state and economy Scenario 2 Strong state but weak
economy
Agriculture Sector Analysis 26
AgriSETA June 2010
Agriculture Sector Analysis 27
SECTION 2 DEMAND FOR SKILLS
AgriSETA registered employers and employee coverage
In 2009 17 234 employers were registered with the AgriSETA comprising 15 394 small employers (less than 50 employees) 1 202 medium sized employers (50 ‐ 149 employees) and 638 large employers (more than 150 employees)
Considering that there are around 40000 commercial farms33 the 17 234 employers represent around 43 of commercial farms Notwithstanding changes in the sector as a result of land reform and sector shrinkage this is a sizable proportion and is held to be sufficiently representative for the purpose of skills development planning However this paints an incomplete picture It understates the representative nature of large enterprise registered with the SETA and overstates the representative nature of small registered enterprises 4 175 (242) of the enterprises are levy paying members Further only 1 673 (11) workplace skills plans (WSPs) were submitted
Table 16 Registered employers by size and sub‐sector Sub‐sector Description
Employers Small Medium Large
CoffeeTea Processing and marketing of coffee and tea including coconuts cocoa nuts olives dates etc
33 4 3
Fibre Grading ginning packing of wool and cotton raw material 1 676 16 18
Fruit Fruit packed in cartons fruit juice concentrate drummed and fruit juice in container ready for consumption
271 36 57
Fruit exporters and importers 6 0 1
Grain
Manufacture of grain mill products and starches 119 5 7Handling and storage of grain 67 7 23Wholesale amp retail trade in Agricultural machinery 213 9 4Sale and distribution of Agricultural raw materials and other farming inputs
182 9 3
Milling
Manufacture of flour and grain mill products including rice and vegetable milling grain mill residues
120 15 11
Manufacture of prepared animal feeds 110 19 0Manufacture of pet foods 42 9 0Manufacture of starches and starch products 7 1 1
Pest control
Pest Control 209 4 0
Poultry Poultry and egg production including the slaughtering dressing and packing of poultry
305 49 37
Primary
Growing of Cereals and other crops (not elsewhere classified) 902 160 34Growing of Vegetables Horticultural specialties nursery products
943 120 72
Growing of Vegetables Horticultural specialties (Including Ornamental Horticulture) and nursery products
11 5 0
Sugar plantation including sugar cane and sugar beet etc 9 4 2
33 SARS statistics 2007
AgriSETA June 2010
Agriculture Sector Analysis 28
Sub‐ Description Employers Growing of fruit nuts beverage and spice crops 1795 255 143Farming of cattle sheep goats horses asses mules and hinnies Dairy farming
2 252 59 18
Other animal farming production of animal products (NEC) 433 25 12Ostrich farming 5 0 0Game farming 16 0 0Growing of crops combined with farming of animals (Mixed farming)
2 920 256 109
Growing of coffee and tea including coconuts cocoa nuts olives dates etc
2 0 0
Agricultural and animal husbandry services except veterinary activities
438 22 9
Other animal farming (not elsewhere classified) 11 1 1Growing of trees as second crop by farmers 126 18 4Fishing operation of fish hatcheries and fish farm 913 10 6
Red meat
Production and animal products (not elsewhere classified) 6 0 0Slaughtering dressing and packing of livestock including poultry and small game for meat
317 40 17
Production sale amp marketing of Agricultural by products (eg bones hides)
61 2 0
Slaughtering dressing and packing of livestock including small game for meat and processing of ostrich products
2 1 0
Wholesale trade in Agricultural raw materials and livestock 193 7 10Transport of livestock as supporting activity 224 0 0Agricultural and livestock research 215 9 3
Seed Seed production and marketing 149 12 6
Sugar Manufacture of sugar including golden syrup and castor sugar
45 5 21
Tobacco Processing and dispatching of tobacco 46 8 6 TOTALS 15 394 1 202 638Source AgriSETA WSP data
The largest number of registered small and medium enterprises are found in the mixed farming sub‐sector while most large enterprises are in the growing of fruit nuts beverage and spice crops sub‐sector
Employee coverage in the AgriSETA
Collectively the 17 234 employers registered with AgriSETA employed a total of 239 076 employees This represents 39 of the agricultural labour force in 2009 The 1 673 employers who submitted WSPs in 2009 employed 97 898 employees representing 41 of the total number of people employed by registered employers While the number of registered employers submitting WSPs is small (11) they employ a sizeable number of employees and the percentage of employees provides a statistically significant sample The data for larger enterprises is statistically much more representative than that for small enterprises
AgriSETA June 2010
Table 17 Number of employees of registered employers by sub‐sector
Sub‐sector
Sub‐sector description Employees
CoffeeTea Processing and marketing of coffee and tea including coconuts cocoa nuts olives dates etc
483
Fibre Grading ginning and packing of wool and cotton raw material 6 539
Fruit Fruit packed in cartons fruit juice concentrate drummed and fruit juice in container ready for consumption
27 661
Fruit exporters and importers 212
Grain
Manufacture of grain mill products and starches 133Handling and storage of grain 18 303Wholesale amp retail trade in Agricultural machinery 795Sale and distribution of Agricultural raw materials and other farming inputs 2 898
Milling
Manufacture of flour and grain mill products including rice and vegetable milling grain mill residues
3 634
Manufacture of prepared animal feeds 731Manufacture of pet foods 160Manufacture of starches and starch products 105
Pest control
Pest Control 119
Poultry Poultry and egg production including the slaughtering dressing and packing of poultry
19 187
Primary
Growing of Cereals and other crops (not elsewhere classified) 10 104Growing of Vegetables Horticultural specialties and nursery products 37 799Growing of Vegetables Horticultural specialties (Including Ornamental Horticulture) and nursery products
195
Sugar plantation including sugar cane and sugar beet etc 220Growing of fruit nuts beverage and spice crops 47 043Farming of cattle sheep goats horses asses mules hinnies Dairy farming
3 382
Other animal farming production of animal products (NEC) 4 203Ostrich farming 0Game farming 0Growing of crops combined with farming of animals (Mixed farming) 28 722Growing of coffee amp tea including coconuts cocoa nuts olives dates etc 0Agricultural and animal husbandry services except veterinary activities 970Other animal farming (not elsewhere classified) 513Growing of trees as second crop by farmers 1 294Fishing operation of fish hatcheries and fish farm 1 589
Red meat
Production and animal products (not elsewhere classified) 0Slaughtering dressing and packing of livestock including poultry and small game for meat
5 128
Production sale amp marketing of Agricultural by products (eg bones hides) 116Slaughtering dressing and packing of livestock including small game for meat and processing of ostrich products
0
Wholesale trade in Agricultural raw materials and livestock 1 697Transport of livestock as supporting activity 0Agricultural and livestock research 534
Seed Seed production and marketing 2 127Sugar Manufacture of sugar including golden syrup and castor sugar 10 478Tobacco Processing and dispatching of tobacco 2 002 Total 239 076
Agriculture Sector Analysis 29
AgriSETA June 2010
Agriculture Sector Analysis 30
Source AgriSETA WSP data
According to the WSP analysis the sub‐sector for the growing of fruit nuts beverage and spice crops employed the largest number of people In six sub‐sectors there are employers who do not employ workers These are probably family based organisations where family members help in the business without drawing a salary These are in transport and livestock research slaughtering dressing and packing of livestock including poultry and small game for meat growing of coffee and tea including coconuts cocoa nuts olives dates etc ostrich farming and game farming
Table 18 Employee distribution by province Province Employees Percentage
Eastern Cape 18 844 192 Free State 1 946 20 Gauteng 2 788 28 KwaZulu‐Natal 5 416 55 Mpumalanga 8 062 82 North West 3 290 34 Northern Cape 5 436 56 Limpopo 1 730 18 Western Cape 50 386 515 Grand Total 97 898
Source AgriSETA WSP data
Of those submitting WSPs registered employers in the Western Cape employed the largest number of people while employers in Limpopo employed the least number of employees Free State has a small number of employees covered by WSPs submitted to the SETA whereas Eastern Cape with a relatively small number of registered farms has a very large number of employees on farms submitting WSPs Given this variance between provinces the use of WSP data for extrapolation purposes must be viewed cautiously
2009 WSP equity information was only provided for about a quarter of employees (25 637 or26)34 No information was available from the WSPs on non‐South Africans working on commercial farms
Table 19 Equity profile from 2009 WSP data African Coloured Indian White
Totals M F D M F D M F D M F D
8 040 5 785 38 5 097 5 228 24 22 25 0 811 556 11
580 417 03 493 505 02 468 532 00 589 403 08 13 863 10 349 47 1 378 25 637541 404 02 54 100
Total EquityTotal Male Total Female Total Disability
13 970 11 594 73 545 452 03
Source AgriSETA WSP data
Using currently available data it is not possible to provide disaggregated employment data by sub‐sector This will require a small change in the way that gender race and disability data is
34 Some employers did not complete race and gender information when giving their employment profiles
AgriSETA June 2010
codified during WSP data‐capturing including allocation by sub‐sector What can be stated is that employment of males is more dominant than that of women and more Africans are employed in the sector than other groups Employment of people with disabilities is below 1
21 Skills demand
The National Education and Training Strategy for Agriculture (AET Strategy)
The AET Strategy developed by the Department of Agriculture Fisheries and Forestry (in consultation with various key stakeholders in the agricultural sector) highlights priority skills needs and constraints within the sector and categorises needs within the following 5 broad areas
1 Agricultural production ndash requesting that the past focus on a narrow band of commodities (relevant mainly to the commercial sector) and related research be expanded to address the needs of small‐scale and subsistence farmers (eg more focus on mixed farming and rural livelihood sustainability skills)
2 Agricultural engineering ndash with specific focus to be placed on technologies suitable for small‐scale farmers (eg relevant and post‐harvesting techniques related to processing and storage of produce) ndash to address this need the scarcity of agricultural engineers requires attention
3 Agricultural economics ndash a critical need was identified for general agricultural economic skills (ranging spectrum of farm planning farm management enterprise management marketing finance etc) ndash with the need to training both farmers and extension officers in such fields
4 Agricultural development ndash a specific need was identified to develop agricultural extensionists in supporting especially emerging and small‐scale farmers over the full spectrum (a need exists for both new curriculum in the training of new extensionists and the re‐training and upgrading of existing officers)
5 Veterinarians ndash the need to develop state veterinarians in order for the state to perform its role and function (particularly in its preventative monitoring and regulatory role and function)
AGRISETA sector skills planning demand data (2008‐2009)
The following section reflects initial research on skills demand in the Agricultural sector arising from the sector analysis (section 1) previous AGRISETA skills demand research for Sector Skills Planning during 2005‐2009 and analysis of WSP data from 2009 With the introduction of the Organising Framework of Occupations and agreement on definitions for scarce and critical skills in 200506 the AGRISETA undertook an extensive research and consultation processes to determine skills development priorities for the sector The research methodology employed was based on the a four dimensional topology for establishing and evaluating skills needs illustrated in the figure below
Agriculture Sector Analysis 31
AgriSETA June 2010
Agriculture Sector Analysis 32
The identification and prioritisation of skills needs was also undertaken from a key stakeholder and beneficiary perspective Consideration was given to needs of the following groups
bull The unemployed ndash helping them gain andor regain entry to the labour market bull The economically inactive ndash helping them to become economically active bull School leavers ndash helping them gain access to further education and training opportunities
and thus facilitating their entry to the job market bull Entrants to the job market ndash facilitating employment and integration into the work culture
and work ethic (improving the employability of an individual) bull Those currently employed in the sector ndash increasing their competency and opportunities
for advancement creating a career path and offering continued job security enhancement of value adding to the sector improving their prospects for better employment opportunities
bull Organisations and enterprises within the sector ndash making sure that skills development and knowledge creation occurs in such a way as to improve the sectorrsquos viability and allowing companiesenterprises to become more sustainable and profitable along the way improving productivity competitiveness and innovation within organisations
In organising and reporting the identified priority skills development needs (200809) the following structuring approach was followed
Tier 1 The four categories of needs as per the Topology presented above were used for the identification evaluation and grouping of needs
Pay conditions
Image
RECRUITMENT DIFFICULTY
SKILLSGAP
SKILLSSHORTAGE
LABOURSHORTAGE
Firms experience difficulty recruiting This does not necessary imply a skills shortage ndash may indicate a poor image remuneration etc
Those currently in work do not have the requisite skills set to carry out their job to an optimum standard
Required skills are in short supply when compared with the demand across the whole labour market
Regardless of skills levels a situation exists where there is simply not enough supply of labour to meet demand
Pay conditions
Image
RECRUITMENT DIFFICULTY
SKILLSGAP
SKILLSSHORTAGE
LABOURSHORTAGE
Firms experience difficulty recruiting This does not necessary imply a skills shortage ndash may indicate a poor image remuneration etc
Those currently in work do not have the requisite skills set to carry out their job to an optimum standard
Required skills are in short supply when compared with the demand across the whole labour market
Regardless of skills levels a situation exists where there is simply not enough supply of labour to meet demand
Figure 4 Topology for identifying skills development priorities
Source AGRISETA SSP Annual Update August 2009
AgriSETA June 2010
Tier 2 Within each of the first tier groupings needs were further broken down and organised per target group At this second level needs were grouped by
o General skills development needs (cross‐cutting over different target groups) o Needs experienced by small scale farmers (this group included subsistence
farmers new emerging land reform beneficiaries and small‐scale AgriBEE farmers) o Needs within the commercial agricultural sector (per sub‐sector groupings where
specific needs for such were identified ndash both on‐farm needs and within the secondary sub‐sector or related agri‐businesses)
o Needs of the Department of Agriculture Fisheries and Forestry (DAFF) To further guide and direct the identification and selection of scarce and critical skills the following factors or criteria that could reflect the importance (impact and effect) of a skills shortages were developed as an identification framework
1 Basic Skills Development Promoting basic literacy and numeracy and raising the base level of education for the sector improving the work and livelihood of existing workers
2 Employability Making the employee more employable by improving the fit between their skills and the sector needs
3 Enterprise Viability Improving the capability and feasibility of the enterprise by increasing its effectiveness of or possibilities for profit generation etc
4 Enterprise Sustainability Allow enterprises to survive and grow over an extended period of time without compromising the value of renewable resources thereby creating long‐term meaningful employment for larger numbers of people
5 Sector Growth Enabling the sector to develop or pursue new opportunities or improve the effectiveness of current operations
6 Sector Competitiveness Enabling the sector to compete more effectively in the international arena improving market intelligence and interpretation productivity cost efficiency etc
7 Human Resource Development Capacity Improving the access to quality provision of training to the agri sector
Based on this research and consultation framework the following skills development needs and priorities were identified
Agriculture Sector Analysis 33
AgriSETA June 2010
GENERAL NEEDS SMALL‐SCALE FARMER
NEEDS COMMERCIAL SECTOR
NEEDS DAFF NEEDS
RECRUITMENT RELATED SKILLS NEEDS Primary agriculture is the entry point into the world of work for large numbers of people in rural areas However the sector has negative connotations amongst sections of the youth and in parts of the country and is viewed as a last resort for some in the search for employment) The effect is that despite an unemployment rate of approximately 26 (now over 30) farmers find it difficult to recruit workers to meet seasonal demands This has resulted in the government approving the contracting of foreign labour to meet such temporary needs (workers are recruited mainly from Zimbabwe and Mozambique)
Labour in this farming sector is provided primarily by family members and no real recruitment constraints can be identified
The agricultural sector still manages to attract technical and management skills as it is perceived to include a better lifestyle and there is a strong tradition of agriculture in SA Increasing crime related security risks associated with farming may have a negative impact
The Department has identified a number of occupations in which they are experiencing long‐term vacancies Some of these result from a general shortage of such skills in SA while others arise from the inability of the public sector to compete with the private sector (less favourable employment image working conditions and equity considerations) Priority vacancies include Veterinarians Agricultural
Engineers Plant Health
Specialists Agricultural
Statisticians Plant Health Pest Risk
Analysts ICT Specialists Agricultural
Economists Agricultural Food and
Quarantine Technicians
Agro‐meteorologists Pasture Scientists Plant Production
Specialists Specialised Food
Analysts SKILLS GAPS RELATED NEEDS
bull Low literacy and numeracy levels ndash both amongst workers within the sector at large and at ownermanager level in many of the small‐scale farming
bull Farm management
Farm Management (Mainly owners managers) bull Farm management amp
entrepreneurship bull Resource
management and record keeping
bull Financial planning
A critical constraint is the poor educational levels of a large proportion of the labour force in the sector demanding a considerable effort and investment in ABET and other life skills
A particularly big need exists for skills upgrading amongst Extension Officers ndash particularly with regard to redress the historical neglect of small‐scale farmers and resource strapped farmers
Agriculture Sector Analysis 34
AgriSETA June 2010
Agriculture Sector Analysis 35
GENERAL NEEDS SMALL‐SCALE FARMER
NEEDS COMMERCIAL SECTOR
NEEDS DAFF NEEDS
skills (and general management skills in other agricultural businesses) coupled with a business orientation and entrepreneurship skills
bull A general need to increase compliance with environmental occupational health and safety animal welfare produce safety and hygiene standards regulations and requirements (local and international standards)
and management bull Project management bull Business plan
development Marketing and processing bull Processing and
packaging bull Transport
management bull Marketing produce
including branding bull Planning for
marketing bull Knowledge of
markets Technical knowledge and skills bull Production
management (related to specific enterprise)
bull Demonstration of production techniques
bull Natural resources management
Mechanical knowledge bull Farm maintenance bull Repairs of machinery
and equipment bull Electrical
maintenance and installation
programmes Need for improved management skills and relevant technological knowledge for increasing productivity levels and improved production methods Rising importance for environmentally responsible production and processing management systems Rising competitive and international markets increases need for business and marketing abilities among owners and managers Increasing requirements for compliance with environmental health and safety and international trade standards Information technology although not a priority is increasing in importance Business management ability is becoming increasingly important as more farmers are making decisions about restructuring their businesses diversification and developing supplementary sources of income
Critically improved farm management and business skills within an agricultural context to support the majority of BEE and emerging farmers Skills upgrading requirements for existing Extension Officers include bull Agricultural
economics bull Agricultural
management bull Business and
financial management
bull Technical and production related skills including o Animal husbandryo Poultry o Crop production o Horticulture
SKILLS SHORTAGES Generally SA has a shortage of entrepreneurs and people who have the business acumen drive motivation and
The profile of these farmers reflects a large contingent of older and less educated people who are generally less flexible tend to stick to
The commercial agri sector will increasingly have to compete in the global market and the ever increasing need to increase productivity to
DAFF us experiencing problems are especially sourcing people in specialised science related fields (learning fields experiencing few
AgriSETA June 2010
Agriculture Sector Analysis 36
GENERAL NEEDS SMALL‐SCALE FARMER
NEEDS COMMERCIAL SECTOR
NEEDS DAFF NEEDS
perseverance to become a successful farmer Given the high risks involved in the agricultural sector (natural elements outside onersquos control) the agri sector does not compete successfully for this ldquoscarce resourcerdquo Moreover as with other professional and skilled occupations there is a tendency for younger qualified people to move to urban areas
known practices and are less likely to experiment with new technology Within this target group candidates with good entrepreneurial ability are scarce There is a perceived shortage of Agricultural Extensionists and advisors to assist this target group However a large pool of young unemployed graduates exists who could assist such emerging farmers if they were mobilised and made accessible to farmers Similarly the potential pool of retired commercial farmers who could serve as mentors to this target group
remain profitable and viable it can be stated that many of the existing farmers and managers owners lack business management and entrepreneurial orientation Equity policy and the need to become BEE compliant requires that commercial enterprises appoint and develop black owners directors managers Changing local and global consumer preferences require farmers to change traditional farming methods and practices Skills and knowledge requirements include bull Global food and
international quality standards
bull Product traceability requirements
bull Organic produce and products
Specific occupations identified as being in short supply are
bull Production Managers (food processing)
bull Product specialisation to international specifications (research skills)
bull Forklift drivers heavy vehicletruck drivers and mobile plant operators
bull Experienced and competent artisans (millwrights electricians fitters
enrolments andor pass rates at HET institutions with the result that too few qualified persons come onto the labour market) Examples of such skills shortages identified by the Department include Agricultural Engineers bull Plant Health
Specialists (Nematology Entomology Plant Pathology)
bull Statisticians (specialised agricultural knowledge)
bull Plant Health Pest Risk Analysts
bull Agricultural Economists (production and resource economists)
bull Agricultural Food and Quarantine Technicians
bull Agro‐meteorologists Early warning Specialists
bull Pasture Scientists bull Plant Production
Specialists (eg ornamental crops hydroponics)
bull Specialised Food Analysts (pesticide residue analysts processed food and dairy analysts wine and spirit analysts)
AgriSETA June 2010
Agriculture Sector Analysis 37
GENERAL NEEDS SMALL‐SCALE FARMER
NEEDS COMMERCIAL SECTOR
NEEDS DAFF NEEDS
and turners bull Agricultural
Equipment Technicians
bull Pest and weed controllers
bull Horticultural specialists
LABOUR SHORTAGES AND RELATED SKILLS NEEDS Given an employment rate of some 26 (2009 currently estimated at over 30expanded definition) per definition there cannot be a labour shortage It is however difficult for people who have never worked before to integrate into the agricultural sector workforce Coupled with an aging workforce (30‐60 being over 40) means that most agri enterprises will within the next 5‐10 years be looking at replacing a large proportion of their workforce There could be an insufficient pool of people willing and able to participate The impact of HIVAIDS is also not always factored in to understanding the diminishing pool of resources available Labour shortages have been reported within selected geographical areas and in particular occupations Examples include cane cutters in the sugar industry chicken catchers in the poultry industry pickers in the fruit industry and animal handlers in feedlots as well as dairy parlour workers It is however believed that these shortages may reflect a recruitment problem as a result of the very harsh working conditions and the relatively poor remuneration (which makes these occupations unpopular) At present such ldquoshortagesrdquo are addressed through contracting labour from neighbouring countries
AgriSETA WSP analyses
Skills demand in the commercial agricultural sector
Information for demand for skills from WSP data is available for 1 673 employers who submitted their WSPs for the 200910 period The table below shows data on sub‐sector WSP submission relative to size of the sub‐sector as well as subsector data from all registered organisations and those who submitted WSPs Data for registered employers shows that there were 239 076 employees employed by the 17 234 registered organisations As previously stated 97 898 employees were employed by the organisations submitting WSPs This constitutes 41 of employees employed by registered organisations
Table 20 Employment and sub‐sector data drawn from WSP analyses
Sub‐sector
All Re
gistered
Employers
Small employers (0‐49)
Med
ium and
large
employers (50+)
Total W
SPs received
Total W
SPs received
as of
all registered em
ployers
WSP
received med
ium and
large orgs
WSPs received
as of
med
ium amp large em
ployers
WSPs received
small
employers
WSPs received
as of small
enterprises
EmployeesPer
Profile
CoffeeTea 40 33 7 9 23 5 71 4 12 483 Fibre 1 710 1 676 34 34 2 22 65 12 07 6 539
AgriSETA June 2010
Agriculture Sector Analysis 38
Sub‐sector
All Re
gistered
Employers
Small employers (0‐49)
Med
ium and
large
employers (50+)
Total W
SPs received
Total W
SPs received
as of
all registered em
ployers
WSP
received med
ium and
large orgs
WSPs received
as of
med
ium amp large em
ployers
WSPs received
small
employers
WSPs received
as of small
enterprises
EmployeesPer
Profile
Fruit 371 277 94 162 44 76 81 86 31 27 873 Grain 648 581 67 77 12 48 72 29 5 22 129 Milling 335 279 56 61 18 35 63 26 9 4 630 Pest Control 213 209 4 8 4 2 50 6 3 119 Poultry 391 305 86 66 17 46 53 20 7 19 187 Primary 12 121 10 776 1 345 1144 9 513 38 631 6 136 034 Red meat 1107 1 018 89 70 6 45 51 25 2 7 475 Seed 167 149 18 24 14 13 72 11 7 2 127 Sugar 71 45 26 13 18 10 38 3 7 10 478 Tobacco 60 46 14 5 8 3 21 2 4 2 002
Totals 17 234 15 394 1 840 1 673 10 818 44 855 16 239 076
Source 1 AgriSETA WSP 2009 data
Only 10 of all registered employers submitted WSPs for the 200910 period Of these 49 were medium and large sized employers and 51 small However only 16 small employers submitted their WSPs relative to the number of registered small employers and 44 medium and large employers submitted WSPs relative to the number of registered medium and large employers As such skills demand statistics provides more representative data on the requirements of medium and large employers Data for skills demand in the commercial agricultural sector is based on data for permanent employees as well as casual and seasonal employees
Skills demand forecasting by AgriSETA
Forecasting for skills demand the AgriSETA has estimated that the demand for skilled employees at different levels in the next few years is 510 686 This is based on WSP data analyses over the last 5 years and projected demand for the formal commercial agricultural sector and factoring in the demand that at maximum would result from completion of the land restitution programme in South Africa The table below reflects the skills that are on demand as well as the estimates for demand over the next five years by major occupational category35
35 AgriSETA 2010
AgriSETA June 2010
Table 21 Demand for skills by occupational category
Major Occupation (OFO)Estimated Demand
Group Title1 Managers (commercial and small emerging farmers) 264 3702 Professionals 4 1413 Technicians and Trade workers 8 9255 Clerical and administrative workers 8006 Sales workers 4007 Machinery operators and drivers 5 8008 Elementary workers 226 250
Total 510 686Source AgriSETA WSP data and SSP demand forecasts
Research needs going forward
As has been set out in the sector analysis and the scenarios derived from that analysis the sector is faced by both significant and profound change and also great uncertainty It therefore follows that the task of focussing limited resources (basically levy income in the formal sector and NSF funds for the emergent farming sector) is difficult Whilst the general thrust of training remains broadly as described in the 2006‐10 SSP Updates some considerable work is required to achieve targeted effective interventions during the 2011‐2016 period The following research questions will need to be addressed in preparing the next SSP
bull In relation to the managers and owner‐managers of commercial farms and enterprises what skills are needed to enable them to help bring about the more optimistic scenario and manage the risks associated with the less optimistic ones
bull In terms of professional and technical competencies do the current education and training institutions coupled with the learning programmes available through the AgriSETA (learnerships skills programmes and the like) meet the needs of the sector
bull In the emerging agricultural sector do the current programmes funded by sources external to the AgriSETA (eg NSF) meet all the identified needs What gaps are there and how should they be addressed
bull In relation to governmentrsquos growth strategy and industrial action plans what skills are required for developing the aquaculture sub‐sector What programmes are available How can the SETA support the skills needs for this sub‐sector
bull Given the increasing levels of casual and contract labour how can skills be developed to meet the needs of the formal commercial sector and the emerging enterprise sector
bull How can the demand in each of the priority areas be quantified and agreement be reached on numbers of people to be trained
Agriculture Sector Analysis 39
AgriSETA June 2010
SECTION 3 Skills Gaps and scarce skills
Scarce skills at the DAFF
The level of scarce skills at DAFF can be determined by the vacancy rate While the average vacancy rate in the department as at 31 March 2009 was 17 there were some posts that had very high vacancy rates as reflected in the table below Indicating the possibility that the Department is experiencing difficulties in finding suitable candidates in the South African labour market to fill these posts
Table 22 Scarce skill occupations and vacancy rates (DAFF March 2009) Critical occupations Number of posts Posts filled Vacancy rate ()
Agricultural animal oceanography forestry and other sciences
167 119 287
Engineering sciences related 2 1 50Engineers and related professions 13 6 538Farming forestry advisors and farm managers 11 4 636Finance and economics related 73 53 274Horticulturists foresters agricultural and forestry technicians
350 221 369
Legal related 6 4 333Mechanical engineering technicians 3 2 333Risk management and security services 6 4 333Social sciences related 1 0 100Veterinarians 34 24 294
Source DAFF Annual Report 20082009
Skills are also scarce at senior management level The department also reports on difficulties it has filling senior management services vacancies with some of them staying vacant for up to twelve months because no suitable candidates can be found The department would then resort to re‐advertisement and head hunting This was the case with 22 of 18 SMS posts in March 2009
Scarce skills in the commercial sector
The following occupations have previously been projected as scarce (extremely hard to fill vacancies) by AgriSETA in the commercial agricultural sector over the next five years
Table 23 Scarce and critical skills in the commercial agricultural sector
Occupation Code
Group Occupation Critical Skills Intervention Comments
139903 Managers Laboratory Manager
Technology AI nutrition
HET
221101 Professionals Accountant (General)
General HET
221102 Professionals Management Accountant
Farm financial management
HET Focus on support advice to farmers new enterprises
222101 Professionals Commodities Trader
Export administration supply chain
FET Learnership Skills
Agriculture Sector Analysis 40
AgriSETA June 2010
Agriculture Sector Analysis 41
Occupation Code
Group Occupation Critical Skills Intervention Comments
management Programme
224301 Professionals Economist Agricultural HET
Mainly for Department of Agriculture and para statals commodity organisations
233101 Professionals Chemical Engineer
Chemical processes in food production
HET Industries such as sugar processing
233301 Professionals Electrical Engineer
Installation and maintenance
HET Processing industry
233401 Professionals Electronics Engineer
Computerised production prosesses
HET Processing industry
233501 Professionals Industrial Engineer
Productivity and efficiency
HET Processing industry
233904 Professionals
Instrument Engineer (Defence Force)
Installation and maintenance
HET
Not for defence ‐ sugar industry
233502 Professionals Mechanical Engineer
FETHET Equity reasons
233902 Professionals Agricultural Engineer
Farm layout and infrastructure
HET Mainly in Government
311101 Technicians and trades workers
Agricultural Technician
Installation and maintenance
FETHET
234102 Professionals Agricultural Scientist
Agri research HETFET Especially in horticulture
234201 Professionals Chemist HET Processing industry
234202 Professionals Food Technologist
Food safety HACCP
FETHET Across sector
234701 Professionals Veterinarian HET Mainly in Government
311101 Technicians and trades workers
Agricultural Technician
Farm infrastructure
FET Mainly needed in government
311401 Technicians and trades workers
Chemistry Technician
FETHET EE reasons
312907 Technicians and trades workers
Chemical Engineering Technician
FET Learnership
Mainly EE reasons
312402 Technicians and trades workers
Electronic Engineering Technician
Weak stream production infra
FETHET Mainly tobacco industry
233904 Professionals
Instrument Engineer (Defence Force)
Instrument technician
FET
Occupation needed Instrument Technician (not defence force) Mainly sugar processing sector
321202 Technicians and trades workers
Diesel Motor Mechanic
FET Learnership
To include tractor mechanic
321204 Technicians and trades workers
Small Engine Mechanic
Agricultural equipment
FET Learnership
Throughout sector
AgriSETA June 2010
Agriculture Sector Analysis 42
Occupation Code
Group Occupation Critical Skills Intervention Comments
322301 Technicians and trades workers
Metal Fabricator
Artisan FET Learnership
322303 Technicians and trades workers
Welder Welder (First Class)
Artisan FET Learnership
323203 Technicians and trades workers
Fitter‐Welder Artisan FET Learnership
Mainly sugar ndash multi‐skilled
323202 Technicians and trades workers
Fitter And Turner
Artisan FET Learnership
Tobacco and sugar
323501 Technicians and trades workers
Millwright Artisan FET Learnership
Wide‐spread need
341101 Technicians and trades workers
Electrician (General)
Artisan FET Learnership
Wide‐spread need
342101 Technicians and trades workers
Air‐Conditioning And Refrigeration Mechanic
Artisan FET Learnership
Sugar pack houses cold chain
Source AgriSETA Sector Skills Plans
Supply of skills
South Africarsquos agriculture skills are produced in high schools agricultural colleges FET colleges and Higher Education institutions In high school a large cohort of learners take Agricultural Science as a subject In 2003 there were 42 Agricultural High Schools offering Agricultural Science as a subject These students and those in high schools taking the subject could progress to taking agriculture as a focus area for further education In 2004 there were 10 FET colleges offering vocationally directed agricultural programmes These FET colleges offered complete qualifications and short courses Eleven Colleges of Agriculture can offer qualifications up to degree level and 19 universities offer qualifications in Agriculture ranging from agricultural economics animal and plant sciences and horticulture among others at under and post graduate levels (Department of Agriculture 2006) While long term planning of skilling of new entrants in the sector can be done through close consultation between the sector agricultural schools and colleges FET colleges and HET institutions so that they teach relevant skills there are other avenues for training for those who are already employed in the sector for example skills programmes and learnerships There are 15 registered qualifications for the primary agriculture sub sectors Currently AgriSETA has 94 registered learnerships that can address the skills needs of the identified scarce skills These are captured in Appendix 2 AgriSETA has approved accredited a number of training providers across the country to deliver the theoretical and practical components of these learnerships These include agricultural colleges FET colleges and private providers Currently the AgriSETA has 246 registered and approved providers distributed nationally as follows
AgriSETA June 2010
Table 29 AgriSETA approved training providers (2010) Province Number of providers
Gauteng 72
(29)
KwaZulu Natal 20
(8)
Limpopo 35
(14)
North West 30
(12)
Northern Cape 3
(1)
Free State 15
(6)
Mpumalanga 14
(6)
Western Cape 26
(11)
Eastern Cape 31
(13) Total 246
The providers are small to large organisations In primary agriculture small providers appear to offer the most training in rural areas and community projects (AgriSETA 2010) Most of the operating providers will be in FET colleges and agricultural colleges The AgriSETA is unable to meet the total demands for skills across the duality of their sector There seems to be fairness in the approval of training for both permanent and casual and seasonal workers In 200809 the AgriSETA approved 559 learnerships as follows
Table 30 AgriSETA learnerships approved for grant purposes (2008‐2009)
Source AgriSETA learnership data analysis
Agriculture Sector Analysis 43
AgriSETA June 2010
Agriculture Sector Analysis 44
Provision of skills programmes in the same year attracted grants for 2 706 employees
Table 31 Participation by learners in skills programmes in the AgriSETA (200809)
Source AgriSETA Skills programmes data analysis
AgriSETA June 2010
APPENDIX 1 Skills demand in the Department of Agriculture Forestry amp Fisheries (200809)
Source DAFF Annual Report 2008‐20009
Agriculture Sector Analysis 45
AgriSETA June 2010
Agriculture Sector Analysis 46
Appendix 2 AgriSETA registered learnerships Registered Learnership NQF Level SAQA Registration NoLearnership in Agri Sales and Service 4 22 Q 220001 20 178 4Learnership Agricultural Machinery Technician 2 22 Q 220007 20 160 2Learnership in Specialist Agricultural Machinery Technician 5 22 Q 220009 21 258 5Agri Trade Processes 2 22 Q 220013 30 125 2FETC Meat Examination Applying Basic Business Principles 4 30 Q 3000 2823 164 4Further Education and Training Certificate Seed Marketing Execute Seed Trials 4 22 Q 220025 21 126 4Further Education and Training Certificate Seed Research and Development Certify as Seed Unit 4 22 Q 220027 21 121 4FETC Seed Research and Development Conduct a Field Inspection of a Seed Unit 4 22 Q 220028 20 120 4Seed Research and Development Operations Operate in a Team 3 22 Q 220020 22 121 3Seed Research and Development Operations Apply Basic Business Principles 3 22 Q 220021 22 121 3National Certificate Seed Processing and Packaging Operate in a Team 3 22 Q 220026 21 123 3Sugar Industry Technical Maintenance worker 2 22 Q 220011 39 128 2National Certificate Sugar Manufacturing and Refining Technical Maintenance 3 30 Q300003 23 146 3Further Education and Training Certificate Manufacturing Technical MaintenanceProduce Components by Performing Engineering Turning Operations
4 30 Q 3000 1321 173 4
FETC Manufacturing Technical Maintenance Produce Components by Performing Milling Operations 4 30 Q 3000 1521 173 4 FETC Manufacturing Technical Maintenance Develop and Fabricate from Complex Drawing 4 30 Q 3000 1420 173 4National Certificate in Sugar Technology 5 22 Q 220036 22 140 5Further Education and Training Certificate Sugar Processing 4 22 Q 220035 31 144 4National Certificate in Sugar Technology Processing Sugar Refining 2 22 Q 220037 28 124 2National Certificate in Sugar Technology Processing Juice Preparation 2 22 Q 220038 28 124 2National Certificate in Sugar Technology Processing Crystallisation 2 22 Q 220039 27 122 2National Certificate in Sugar Technology Processing Laboratory Practice 2 22 Q 220040 25 124 2National Certificate in Sugar Technology Processing Extraction 2 22 Q 220041 28 122 2NC Rooibos Production Applying Basic Business Principles 2 30 Q 3000 2427 130 2 NC Rooibos Processing Applying Basic Business Principles 2 30 Q 3000 2224 123 2 National Certificate Cigarette Production 3 22 Q 220046 23 121 3
AgriSETA June 2010
REFERENCES AgriSETA 2010 AgriSETA 20082009 Annual report Pretoria AgriSETA Agricultural Research Council httpwwwarcagriczahomeasppid=272 Avert South African HIV and AIDS statistics Available on httpwwwavertorgsafricastatshtm Centre for Development Enterprise 2008 Land reform in South Africa Getting back on track CDE Research No 16 DAFF 2010 Quarterly economic review of the agriculture sector Pretoria DAFF DAFF 2009 Annual report 20082009 Pretoria DAFF Department of Agriculture 2008 Strategic plan 2008 Pretoria Department of Agriculture DTI An introduction to the South African economy Available on httpwwwthedtigovzapublicationsagroprocessinghtm Eastern Cape Provincial Government Eastern Cape Provincial Growth and Development Strategy 2004 ndash 2014 Economic Commission for Africa 2009 Developing African agriculture through regional value chains Addis Ababa Economic Commission for Africa Economic Report Free State Province 2005 Provincial Growth and Development Strategy 2005 ndash 2014 GCIS 2010 SA Yearbook 200910rdquo Agriculture forestry and fisheries Pretoria GCIS Greenberg S 2010 Status report on land and agricultural policy in South Africa 2010 Institute for Poverty Land and Agrarian Studies School of Government University of the Western Cape Research report Ingelozi Management Solutions 2008 HIVAIDS in the South African agricultural sector Towards the development of a long term intervention Research report KwaZulu Natal Provincial Government 2006 KwaZulu Natal Provincial Growth and Development Strategy Limpopo Provincial Government Growth and Development Strategy 2004 ndash 2014 Mhone G (2000) Enclavity and Constrained Labour Absorbtive Capacity in Southern African Countries Geneva International Labour Office Moyo S The Agrarian question and the developmental state in South Africa In Edigheji O et al 2010 Constructing a democratic developmental state in South Africa HSRC PRESS
Agriculture Sector Analysis 47
AgriSETA
Agriculture Sector Analysis
National Treasury Republic of South Africa 2010 National Budget 2010 ndash National Budget Review 2010 Pretoria National Treasury Northern Cape Provincial Government Agriculture and agro‐processing sector strategy North West Provincial Government North West Provincial Growth and Development Strategy 2004 ndash 2014 Province of the Western Cape 2008 The Ikapa growth and development strategy White Paper SABCOHA SA Business Coalition on HIV and AIDS wwwsabcohaorg SACAU httpwwwsacauorghostingsacauSacauWebnsfHomehtmOpenForm South African Government 2010 20102011 ndash 20122013 Industrial Policy Action Plan Republic of South Africa Statistics South Africa 2005 Census of commercial agriculture 2002 Report No 110201 Pretoria Statistics South Africa Statistics South Africa 2009 Census of commercial agriculture 2007 Statistical release P1101 Pretoria Statistics South Africa Statistics South Africa 2010 General household survey 2009 Statistical release P0318 Pretoria Statistics South Africa Statistics South Africa 2010 Gross domestic product first quarter 2010 Statistical release P0441 Pretoria Statistics South Africa Statistics South Africa 2010 Quarterly labour force survey Quarter 1 2010 Statistical release P0211 Pretoria Statistics South Africa Vink N amp van Rooyen J 2009 The economic performance of agriculture in South Africa since 1994 The implications for food security Pretoria DBSA development planning division working paper series No 17 Webster E 2004 the Dual Economy from a book by Van Holdt K and Webster E Work restructuring and the Crisis of Social reproduction and 10 years of restructuring post apartheid workplaces University of Natal Press Workinfocom httpwwwworkinfocomfreesub_for_legresdatalraempassoc3htm Xingwana L 2008 Challenges and Opportunities for Land and Agrarian Reform towards 2025 Speech delivered at the Agri‐Consultation Protea Ranch Hotel Polokwane 30 July 2008
- Table of contents
- SECTION 1 THE AGRICULTURAL LANDSCAPE
- 11 Size and shape of the Agricultural sector
-
- Overview
- Distribution of agricultural production
- The structure of the agriculture sector in South Africa
- Categories of farming enterprises
- Employment trends
- Employment categories and remuneration
- Stakeholders in the Agricultural sector
-
- National government departments
- Sector representatives
-
- 12 Factors impacting development in the Agriculture sector
-
- Future sector economic growth and development
-
- South African sector growth plans (IPAP2)
- International Trade
- Global recession and rise in food prices
-
- Land reform
- Reliance on imports
- Water
- The labour market
- Consumer trends
- HIVAIDS
- Farm safety and security
- Broad-based Black Economic Empowerment
-
- Conclusions and scenarios
- SECTION 2 DEMAND FOR SKILLS
-
- AgriSETA registered employers and employee coverage
- Employee coverage in the AgriSETA
-
- 21 Skills demand
-
- The National Education and Training Strategy for Agriculture (AET Strategy)
- AGRISETA sector skills planning demand data (2008-2009)
- AgriSETA WSP analyses
-
- Skills demand in the commercial agricultural sector
-
- Skills demand forecasting by AgriSETA
- Research needs going forward
-
- SECTION 3 Skills Gaps and scarce skills
-
- Scarce skills at the DAFF
- Scarce skills in the commercial sector
- Supply of skills
-
- APPENDIX 1 Skills demand in the Department of Agriculture Forestry amp Fisheries (200809)
- Appendix 2 AgriSETA registered learnerships
-
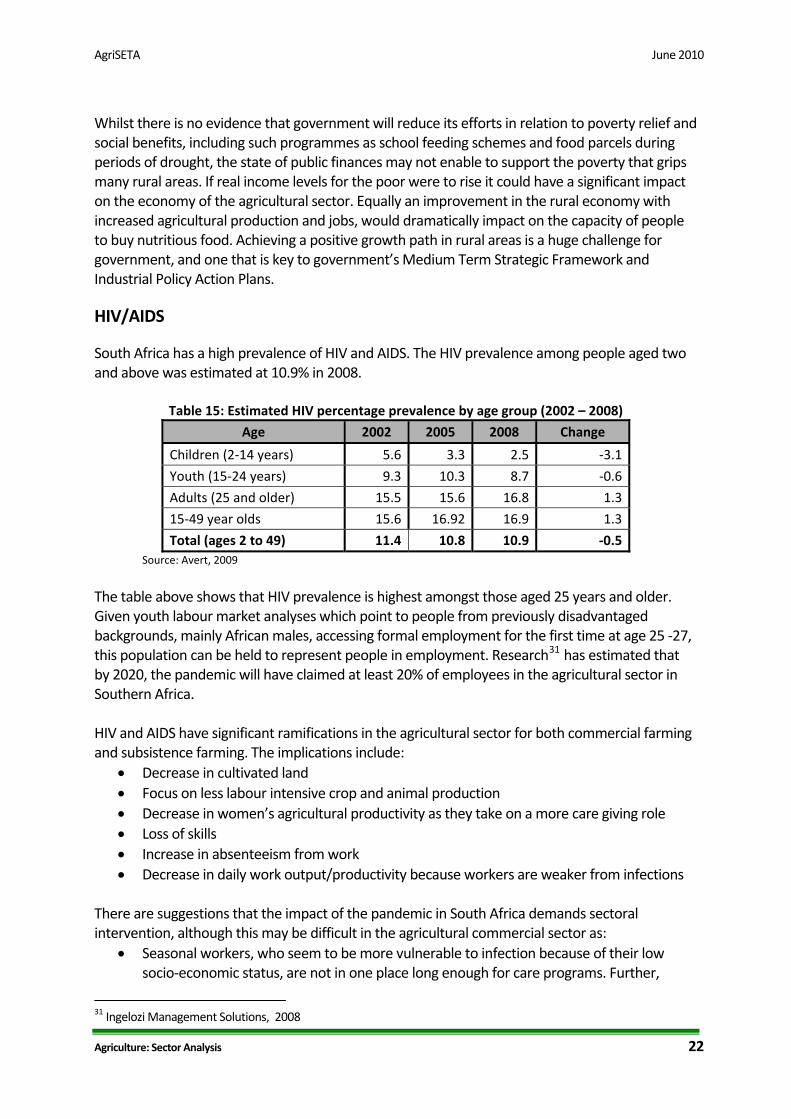
AgriSETA June 2010
Agriculture Sector Analysis 22
Whilst there is no evidence that government will reduce its efforts in relation to poverty relief and social benefits including such programmes as school feeding schemes and food parcels during periods of drought the state of public finances may not enable to support the poverty that grips many rural areas If real income levels for the poor were to rise it could have a significant impact on the economy of the agricultural sector Equally an improvement in the rural economy with increased agricultural production and jobs would dramatically impact on the capacity of people to buy nutritious food Achieving a positive growth path in rural areas is a huge challenge for government and one that is key to governmentrsquos Medium Term Strategic Framework and Industrial Policy Action Plans
HIVAIDS
South Africa has a high prevalence of HIV and AIDS The HIV prevalence among people aged two and above was estimated at 109 in 2008
Table 15 Estimated HIV percentage prevalence by age group (2002 ndash 2008)
Age 2002 2005 2008 Change
Children (2‐14 years) 56 33 25 ‐31
Youth (15‐24 years) 93 103 87 ‐06
Adults (25 and older) 155 156 168 13
15‐49 year olds 156 1692 169 13
Total (ages 2 to 49) 114 108 109 ‐05 Source Avert 2009
The table above shows that HIV prevalence is highest amongst those aged 25 years and older Given youth labour market analyses which point to people from previously disadvantaged backgrounds mainly African males accessing formal employment for the first time at age 25 ‐27 this population can be held to represent people in employment Research31 has estimated that by 2020 the pandemic will have claimed at least 20 of employees in the agricultural sector Southern Africa
in
HIV and AIDS have significant ramifications in the agricultural sector for both commercial farming and subsistence farming The implications include
bull Decrease in cultivated land bull Focus on less labour intensive crop and animal production bull Decrease in womenrsquos agricultural productivity as they take on a more care giving role bull Loss of skills bull Increase in absenteeism from work bull Decrease in daily work outputproductivity because workers are weaker from infections
There are suggestions that the impact of the pandemic in South Africa demands sectoral intervention although this may be difficult in the agricultural commercial sector as
bull Seasonal workers who seem to be more vulnerable to infection because of their low socio‐economic status are not in one place long enough for care programs Further
31 Ingelozi Management Solutions 2008
AgriSETA June 2010
Agriculture Sector Analysis 23
farmers and employers may not feel responsible for seasonal workers in the same way they would invest in their permanent employees
bull There may be uncertainty around land reform which may put HIV intervention on farms on the back burner
bull There are no policies that enforce HIV education and care on farms in the same way that legislation like BEE does for ownership As a result HIV intervention may be left to goodwill and employers may feel it is more important to comply with issues that are monitored
Farm safety and security
South Africa has been plagued by unacceptably high levels of violent crime and murder for many years now Farms have experienced this and those living on farms feel and are extremely vulnerable The South African Chamber of Commerce and Industry (SACCI) has argued that
Using the nominal GDP figure for 2009 of R24 trillion a 322 percent contribution of agriculture to GDP and an estimate of 39982 farms (as at 2007) in South Africa the cost of a murderattack on a farm to the economy was R1932869 per annum
SACCI acknowledges that this estimate is flawed as it does not take into consideration the fact that farming units contribute differently to GDP and that not every attack or murder contributes to farm shut down or loss of productivity However if not addressed these attacks could lead to loss of farming sectors as farmers migrate to lsquosaferrsquo regions This will affect employment and GDP contribution of the sector The need for safety and security on farms may also shift farmersrsquo focus in skills development to include personnel who have skills in safety and security
Broad‐based Black Economic Empowerment
The aim of the AgriBEE Charter (gazetted in 2008) is to increase the involvement of black business in agriculture through ownership and control as executives and senior managers of new and existing agricultural businesses The extent to which AgriBEE is transforming the sector is not known as it is too early to tell but a recent survey conducted by ABC and the IDC showed that among the ABC respondents in 2007 46 of enterprises were busy constructing a BEE strategy and 46 claimed to be implementing a BEE strategy A survey of the dairy industry in the Western and Eastern Cape in 2008 showed that only 6 of firms had a BEE strategy in place It also seems from survey data that companies are focusing on the skills development and socio‐economic aspects of BEE rather than on ownership32 It would appear that although there have been some significant BEE purchases of viable farms and some employee empowerment projects including some quite high profile ones in the Cape Winelands the extent of ownership change had been limited One of the factors is the very high level of single person or family ownership in the agricultural sector BEE is more straight forward in the corporate world where shares can be exchanged For a family business it is a matter of selling off part or all of the land and the tendency is to sell off those areas of the farm that are expendable from a business sustainability perspective
32 Greenberg 2010
AgriSETA June 2010
Whilst there is discussion in government about the ending of the ldquowilling buyer willing sellerrdquo concept the Constitution itself provides for property rights and so although some pressure may be exerted through legislation and regulation the extent and speed of change may not be fast The mechanisms for encouraging the transfer of significant levels of ownership have not yet been created The focus of the SETA is therefore likely to be more the beneficiaries of land reform and emergent farmers though projects of a BEE nature can be targeted as they arise
Conclusions and scenarios It is useful when looking at possible scenarios to examine the key variables or uncertainties and to project how variations one way or the other will have an impact on the development and growth of the sector From the sector analysis and factors that are contributing to change in the sector there are some key factors that seem to emerge First appears to be the economy and related issues of the labour market and the challenges of labour absorption in an enclave economy These factors determine on the one hand whether there will be growth and development and on the other whether such improvements will result in improved employment opportunities and the creation of a virtuous cycle of development Second is the role of the state and the various government departments whose plans and work impact on the agricultural sector Related to this is land reform that is inevitably driven by the state and not the owners of land or the landless The view expressed by many engaged in agrarian reform is that the state must play a significant role It becomes clear that a successful agricultural enterprise requires a number of factors to be in place to be successful These include access to land (Department of Rural Development and Land Reform) agricultural support within a supportive agricultural framework (Department of Agriculture Forestry and Fisheries) access to consistent water supply (Department of Water Affairs) access to finance (Department of Trade and Industry various state agencies) conducive labour market regulation (Department of Labour) sound industrial policy (Department of Trade and Industry) economic planning and macro policy (Department of Economic Development National Treasury) and appropriate education training and skills development (Department of Higher Education and Training the Human Resources Development Council NSA and the SETA) There are other government departments as well as provincial and municipal structures that also play a role The following analyses show how the four variables
economic growth and development role of the government labour market changes and land reform)
impact positively or negatively on the growth of the sector and the demand for skills
Agriculture Sector Analysis 24
AgriSETA June 2010
Agriculture Sector Analysis 25
HHIIGGHH GGRROOWWTTHH SSCCEENNAARRIIOO
The economics of the sector Role of government
The economy in SA and globally continues to revive albeit slowly for the next few years
Roles and integration of national government departments are clarified Specific functions are agreed processes put in place and personnel appointed with the required skills
International trade agreements are still weighted infavour of US and EU but progress is being made and specific blockages are addressed in bilateral talks
The roles of Departments (DWA DAFF DRDLR DoL DTI DED DHET) are clarified with appropriate joint plans and coordinating structures
The rural economy gradually improves with the buying power of the poor increasing and more stable markets created for local produce
For each of the functions agreed in each of the related departments appropriate structures and systems are put in place and staff trained
Exports increase in key areas identified in IPAP 2 and the Rand exchange rate stabilises at a level not too much different than it is today
Specific capacity is put in place at local level to support implementation of land reform and rural development
There is a growing understanding of the concept of dualism and the need to intervene with labour absorption and development mechanisms
Land claims are all finally settled and ownership and tenure is resolved There is a serious drive to establish effective agricultural enterprises
An understanding is reached on the role of agencies and labour brokers and abuse is curbed
The willing buyer willing seller approach is resolved and enables viable land to become black owned
Some relaxation of labour market regulations are agreed that maintain some minimum standard of employment but assist absorption
Land transfer to black and emergent farmers is done in a manner that integrates then into the supply chains of the sector
Mechanisms are found to address skills needs in the context of casual and seasonal work patterns
Financing of land reform and transfer is done on the basis of agreed development plans including skills
Labour market reform Trajectory of land reform LLOOWW GGRROOWWTTHH SSCCEENNAARRIIOO
The economics of the sector Role of government departments The economy in SA and globally stagnates at current levels and the economy struggles to pick up after the temporary 2010 World Cup boost
A lack of purpose at government level means limited progress for another five years Land reform remains a commitment without a plan
International trade agreements are still weighted infavour of US and EU and protectionism increases as a result of the global recession
The roles of Departments (DWA DAFF DRDLR DoL DTI DED DHET) are unclear and there is no proper co‐ordination
SArsquos Gini coefficient continues to worsen with rural poverty increasing and local economies declining
There is a lack of effective structures systems and processes to implement policy across departments
Rand volatility causes problems for importers and exporters Well established markets are maintained but exports decrease
At local level the decline in the agricultural extension officer functions continues and limited practical support is available
Understanding of the rural economy is so diverse that stakeholders cannot agree the problem let alone the solution to low absorption levels
Land claims take too long and land reform processes leave potentially productive land poorly developed and managed
Casual labour and labour brokers remains an issue of dispute Confrontation results in bitterness and resentment
The impasse caused by a rigid interpretations of property clauses in the Constitution continues to stall achievement of the 30 black ownership target
Labour market regulation continues to be a contributing factor to reducing levels of employment
Black owned farms find it difficult to become part of supply chains and are unable to perform adequately
Unstable employment patterns in the sector make skills interventions difficult to manage and largely ineffective
Financing of land reform and land transfer continues to be wasted as it is not tied to the building of appropriate capacity
Labour market reform Trajectory of land reform
AgriSETA June 2010
These analyses can be translated into four potential growth and development scenarios for the agricultural sector which are based on the requirements for a strong development state Scenario 3 Weak government support
and sound economy
Econ
omic fa
ctors glob
ally n
ationa
lly and
locally
Scenario 1 Integrated government support and sound economy
The economic upturn triggered by the World Cup continues and globally things improve enabling an expansion of exports The government because of a lack of integrated policy planning and implementation provides limited support for sector development The gains go to the well established enterprise owners with few gains for emerging farmers and local communities
Government departments coordinate their efforts to achieve maximum impact There are favourable economic conditions that create opportunities for advance Within this positive environment the role of the AgriSETA becomes a central component of a comprehensive strategy for growth and skills interventions are targeted to achieve maximum effect Results in growth in sustainable enterprises and expanded employment opportunities
Government policy and support Government policy and support
Combination of disjointed government policy planning and a weak and increasingly marginalised rural economy Economic conditions result in unsustainable farming conditions and employment declines along with productivity Food shortages and the lack of development in rural areas leading to increasing social tensions A vicious cycle develops with the sector going into long term decline
Government departments coordinate their efforts to achieve maximum impact However economic conditions hamper progress Efforts by the AgriSETA are undermined by poor labour absorption and job insecurity Some significant successes are recorded including some NSF funded projects that result in sustainable enterprises A platform is laid for future improvements when the economic conditions improve
Scenario 4 Weak state and economy Scenario 2 Strong state but weak
economy
Agriculture Sector Analysis 26
AgriSETA June 2010
Agriculture Sector Analysis 27
SECTION 2 DEMAND FOR SKILLS
AgriSETA registered employers and employee coverage
In 2009 17 234 employers were registered with the AgriSETA comprising 15 394 small employers (less than 50 employees) 1 202 medium sized employers (50 ‐ 149 employees) and 638 large employers (more than 150 employees)
Considering that there are around 40000 commercial farms33 the 17 234 employers represent around 43 of commercial farms Notwithstanding changes in the sector as a result of land reform and sector shrinkage this is a sizable proportion and is held to be sufficiently representative for the purpose of skills development planning However this paints an incomplete picture It understates the representative nature of large enterprise registered with the SETA and overstates the representative nature of small registered enterprises 4 175 (242) of the enterprises are levy paying members Further only 1 673 (11) workplace skills plans (WSPs) were submitted
Table 16 Registered employers by size and sub‐sector Sub‐sector Description
Employers Small Medium Large
CoffeeTea Processing and marketing of coffee and tea including coconuts cocoa nuts olives dates etc
33 4 3
Fibre Grading ginning packing of wool and cotton raw material 1 676 16 18
Fruit Fruit packed in cartons fruit juice concentrate drummed and fruit juice in container ready for consumption
271 36 57
Fruit exporters and importers 6 0 1
Grain
Manufacture of grain mill products and starches 119 5 7Handling and storage of grain 67 7 23Wholesale amp retail trade in Agricultural machinery 213 9 4Sale and distribution of Agricultural raw materials and other farming inputs
182 9 3
Milling
Manufacture of flour and grain mill products including rice and vegetable milling grain mill residues
120 15 11
Manufacture of prepared animal feeds 110 19 0Manufacture of pet foods 42 9 0Manufacture of starches and starch products 7 1 1
Pest control
Pest Control 209 4 0
Poultry Poultry and egg production including the slaughtering dressing and packing of poultry
305 49 37
Primary
Growing of Cereals and other crops (not elsewhere classified) 902 160 34Growing of Vegetables Horticultural specialties nursery products
943 120 72
Growing of Vegetables Horticultural specialties (Including Ornamental Horticulture) and nursery products
11 5 0
Sugar plantation including sugar cane and sugar beet etc 9 4 2
33 SARS statistics 2007
AgriSETA June 2010
Agriculture Sector Analysis 28
Sub‐ Description Employers Growing of fruit nuts beverage and spice crops 1795 255 143Farming of cattle sheep goats horses asses mules and hinnies Dairy farming
2 252 59 18
Other animal farming production of animal products (NEC) 433 25 12Ostrich farming 5 0 0Game farming 16 0 0Growing of crops combined with farming of animals (Mixed farming)
2 920 256 109
Growing of coffee and tea including coconuts cocoa nuts olives dates etc
2 0 0
Agricultural and animal husbandry services except veterinary activities
438 22 9
Other animal farming (not elsewhere classified) 11 1 1Growing of trees as second crop by farmers 126 18 4Fishing operation of fish hatcheries and fish farm 913 10 6
Red meat
Production and animal products (not elsewhere classified) 6 0 0Slaughtering dressing and packing of livestock including poultry and small game for meat
317 40 17
Production sale amp marketing of Agricultural by products (eg bones hides)
61 2 0
Slaughtering dressing and packing of livestock including small game for meat and processing of ostrich products
2 1 0
Wholesale trade in Agricultural raw materials and livestock 193 7 10Transport of livestock as supporting activity 224 0 0Agricultural and livestock research 215 9 3
Seed Seed production and marketing 149 12 6
Sugar Manufacture of sugar including golden syrup and castor sugar
45 5 21
Tobacco Processing and dispatching of tobacco 46 8 6 TOTALS 15 394 1 202 638Source AgriSETA WSP data
The largest number of registered small and medium enterprises are found in the mixed farming sub‐sector while most large enterprises are in the growing of fruit nuts beverage and spice crops sub‐sector
Employee coverage in the AgriSETA
Collectively the 17 234 employers registered with AgriSETA employed a total of 239 076 employees This represents 39 of the agricultural labour force in 2009 The 1 673 employers who submitted WSPs in 2009 employed 97 898 employees representing 41 of the total number of people employed by registered employers While the number of registered employers submitting WSPs is small (11) they employ a sizeable number of employees and the percentage of employees provides a statistically significant sample The data for larger enterprises is statistically much more representative than that for small enterprises
AgriSETA June 2010
Table 17 Number of employees of registered employers by sub‐sector
Sub‐sector
Sub‐sector description Employees
CoffeeTea Processing and marketing of coffee and tea including coconuts cocoa nuts olives dates etc
483
Fibre Grading ginning and packing of wool and cotton raw material 6 539
Fruit Fruit packed in cartons fruit juice concentrate drummed and fruit juice in container ready for consumption
27 661
Fruit exporters and importers 212
Grain
Manufacture of grain mill products and starches 133Handling and storage of grain 18 303Wholesale amp retail trade in Agricultural machinery 795Sale and distribution of Agricultural raw materials and other farming inputs 2 898
Milling
Manufacture of flour and grain mill products including rice and vegetable milling grain mill residues
3 634
Manufacture of prepared animal feeds 731Manufacture of pet foods 160Manufacture of starches and starch products 105
Pest control
Pest Control 119
Poultry Poultry and egg production including the slaughtering dressing and packing of poultry
19 187
Primary
Growing of Cereals and other crops (not elsewhere classified) 10 104Growing of Vegetables Horticultural specialties and nursery products 37 799Growing of Vegetables Horticultural specialties (Including Ornamental Horticulture) and nursery products
195
Sugar plantation including sugar cane and sugar beet etc 220Growing of fruit nuts beverage and spice crops 47 043Farming of cattle sheep goats horses asses mules hinnies Dairy farming
3 382
Other animal farming production of animal products (NEC) 4 203Ostrich farming 0Game farming 0Growing of crops combined with farming of animals (Mixed farming) 28 722Growing of coffee amp tea including coconuts cocoa nuts olives dates etc 0Agricultural and animal husbandry services except veterinary activities 970Other animal farming (not elsewhere classified) 513Growing of trees as second crop by farmers 1 294Fishing operation of fish hatcheries and fish farm 1 589
Red meat
Production and animal products (not elsewhere classified) 0Slaughtering dressing and packing of livestock including poultry and small game for meat
5 128
Production sale amp marketing of Agricultural by products (eg bones hides) 116Slaughtering dressing and packing of livestock including small game for meat and processing of ostrich products
0
Wholesale trade in Agricultural raw materials and livestock 1 697Transport of livestock as supporting activity 0Agricultural and livestock research 534
Seed Seed production and marketing 2 127Sugar Manufacture of sugar including golden syrup and castor sugar 10 478Tobacco Processing and dispatching of tobacco 2 002 Total 239 076
Agriculture Sector Analysis 29
AgriSETA June 2010
Agriculture Sector Analysis 30
Source AgriSETA WSP data
According to the WSP analysis the sub‐sector for the growing of fruit nuts beverage and spice crops employed the largest number of people In six sub‐sectors there are employers who do not employ workers These are probably family based organisations where family members help in the business without drawing a salary These are in transport and livestock research slaughtering dressing and packing of livestock including poultry and small game for meat growing of coffee and tea including coconuts cocoa nuts olives dates etc ostrich farming and game farming
Table 18 Employee distribution by province Province Employees Percentage
Eastern Cape 18 844 192 Free State 1 946 20 Gauteng 2 788 28 KwaZulu‐Natal 5 416 55 Mpumalanga 8 062 82 North West 3 290 34 Northern Cape 5 436 56 Limpopo 1 730 18 Western Cape 50 386 515 Grand Total 97 898
Source AgriSETA WSP data
Of those submitting WSPs registered employers in the Western Cape employed the largest number of people while employers in Limpopo employed the least number of employees Free State has a small number of employees covered by WSPs submitted to the SETA whereas Eastern Cape with a relatively small number of registered farms has a very large number of employees on farms submitting WSPs Given this variance between provinces the use of WSP data for extrapolation purposes must be viewed cautiously
2009 WSP equity information was only provided for about a quarter of employees (25 637 or26)34 No information was available from the WSPs on non‐South Africans working on commercial farms
Table 19 Equity profile from 2009 WSP data African Coloured Indian White
Totals M F D M F D M F D M F D
8 040 5 785 38 5 097 5 228 24 22 25 0 811 556 11
580 417 03 493 505 02 468 532 00 589 403 08 13 863 10 349 47 1 378 25 637541 404 02 54 100
Total EquityTotal Male Total Female Total Disability
13 970 11 594 73 545 452 03
Source AgriSETA WSP data
Using currently available data it is not possible to provide disaggregated employment data by sub‐sector This will require a small change in the way that gender race and disability data is
34 Some employers did not complete race and gender information when giving their employment profiles
AgriSETA June 2010
codified during WSP data‐capturing including allocation by sub‐sector What can be stated is that employment of males is more dominant than that of women and more Africans are employed in the sector than other groups Employment of people with disabilities is below 1
21 Skills demand
The National Education and Training Strategy for Agriculture (AET Strategy)
The AET Strategy developed by the Department of Agriculture Fisheries and Forestry (in consultation with various key stakeholders in the agricultural sector) highlights priority skills needs and constraints within the sector and categorises needs within the following 5 broad areas
1 Agricultural production ndash requesting that the past focus on a narrow band of commodities (relevant mainly to the commercial sector) and related research be expanded to address the needs of small‐scale and subsistence farmers (eg more focus on mixed farming and rural livelihood sustainability skills)
2 Agricultural engineering ndash with specific focus to be placed on technologies suitable for small‐scale farmers (eg relevant and post‐harvesting techniques related to processing and storage of produce) ndash to address this need the scarcity of agricultural engineers requires attention
3 Agricultural economics ndash a critical need was identified for general agricultural economic skills (ranging spectrum of farm planning farm management enterprise management marketing finance etc) ndash with the need to training both farmers and extension officers in such fields
4 Agricultural development ndash a specific need was identified to develop agricultural extensionists in supporting especially emerging and small‐scale farmers over the full spectrum (a need exists for both new curriculum in the training of new extensionists and the re‐training and upgrading of existing officers)
5 Veterinarians ndash the need to develop state veterinarians in order for the state to perform its role and function (particularly in its preventative monitoring and regulatory role and function)
AGRISETA sector skills planning demand data (2008‐2009)
The following section reflects initial research on skills demand in the Agricultural sector arising from the sector analysis (section 1) previous AGRISETA skills demand research for Sector Skills Planning during 2005‐2009 and analysis of WSP data from 2009 With the introduction of the Organising Framework of Occupations and agreement on definitions for scarce and critical skills in 200506 the AGRISETA undertook an extensive research and consultation processes to determine skills development priorities for the sector The research methodology employed was based on the a four dimensional topology for establishing and evaluating skills needs illustrated in the figure below
Agriculture Sector Analysis 31
AgriSETA June 2010
Agriculture Sector Analysis 32
The identification and prioritisation of skills needs was also undertaken from a key stakeholder and beneficiary perspective Consideration was given to needs of the following groups
bull The unemployed ndash helping them gain andor regain entry to the labour market bull The economically inactive ndash helping them to become economically active bull School leavers ndash helping them gain access to further education and training opportunities
and thus facilitating their entry to the job market bull Entrants to the job market ndash facilitating employment and integration into the work culture
and work ethic (improving the employability of an individual) bull Those currently employed in the sector ndash increasing their competency and opportunities
for advancement creating a career path and offering continued job security enhancement of value adding to the sector improving their prospects for better employment opportunities
bull Organisations and enterprises within the sector ndash making sure that skills development and knowledge creation occurs in such a way as to improve the sectorrsquos viability and allowing companiesenterprises to become more sustainable and profitable along the way improving productivity competitiveness and innovation within organisations
In organising and reporting the identified priority skills development needs (200809) the following structuring approach was followed
Tier 1 The four categories of needs as per the Topology presented above were used for the identification evaluation and grouping of needs
Pay conditions
Image
RECRUITMENT DIFFICULTY
SKILLSGAP
SKILLSSHORTAGE
LABOURSHORTAGE
Firms experience difficulty recruiting This does not necessary imply a skills shortage ndash may indicate a poor image remuneration etc
Those currently in work do not have the requisite skills set to carry out their job to an optimum standard
Required skills are in short supply when compared with the demand across the whole labour market
Regardless of skills levels a situation exists where there is simply not enough supply of labour to meet demand
Pay conditions
Image
RECRUITMENT DIFFICULTY
SKILLSGAP
SKILLSSHORTAGE
LABOURSHORTAGE
Firms experience difficulty recruiting This does not necessary imply a skills shortage ndash may indicate a poor image remuneration etc
Those currently in work do not have the requisite skills set to carry out their job to an optimum standard
Required skills are in short supply when compared with the demand across the whole labour market
Regardless of skills levels a situation exists where there is simply not enough supply of labour to meet demand
Figure 4 Topology for identifying skills development priorities
Source AGRISETA SSP Annual Update August 2009
AgriSETA June 2010
Tier 2 Within each of the first tier groupings needs were further broken down and organised per target group At this second level needs were grouped by
o General skills development needs (cross‐cutting over different target groups) o Needs experienced by small scale farmers (this group included subsistence
farmers new emerging land reform beneficiaries and small‐scale AgriBEE farmers) o Needs within the commercial agricultural sector (per sub‐sector groupings where
specific needs for such were identified ndash both on‐farm needs and within the secondary sub‐sector or related agri‐businesses)
o Needs of the Department of Agriculture Fisheries and Forestry (DAFF) To further guide and direct the identification and selection of scarce and critical skills the following factors or criteria that could reflect the importance (impact and effect) of a skills shortages were developed as an identification framework
1 Basic Skills Development Promoting basic literacy and numeracy and raising the base level of education for the sector improving the work and livelihood of existing workers
2 Employability Making the employee more employable by improving the fit between their skills and the sector needs
3 Enterprise Viability Improving the capability and feasibility of the enterprise by increasing its effectiveness of or possibilities for profit generation etc
4 Enterprise Sustainability Allow enterprises to survive and grow over an extended period of time without compromising the value of renewable resources thereby creating long‐term meaningful employment for larger numbers of people
5 Sector Growth Enabling the sector to develop or pursue new opportunities or improve the effectiveness of current operations
6 Sector Competitiveness Enabling the sector to compete more effectively in the international arena improving market intelligence and interpretation productivity cost efficiency etc
7 Human Resource Development Capacity Improving the access to quality provision of training to the agri sector
Based on this research and consultation framework the following skills development needs and priorities were identified
Agriculture Sector Analysis 33
AgriSETA June 2010
GENERAL NEEDS SMALL‐SCALE FARMER
NEEDS COMMERCIAL SECTOR
NEEDS DAFF NEEDS
RECRUITMENT RELATED SKILLS NEEDS Primary agriculture is the entry point into the world of work for large numbers of people in rural areas However the sector has negative connotations amongst sections of the youth and in parts of the country and is viewed as a last resort for some in the search for employment) The effect is that despite an unemployment rate of approximately 26 (now over 30) farmers find it difficult to recruit workers to meet seasonal demands This has resulted in the government approving the contracting of foreign labour to meet such temporary needs (workers are recruited mainly from Zimbabwe and Mozambique)
Labour in this farming sector is provided primarily by family members and no real recruitment constraints can be identified
The agricultural sector still manages to attract technical and management skills as it is perceived to include a better lifestyle and there is a strong tradition of agriculture in SA Increasing crime related security risks associated with farming may have a negative impact
The Department has identified a number of occupations in which they are experiencing long‐term vacancies Some of these result from a general shortage of such skills in SA while others arise from the inability of the public sector to compete with the private sector (less favourable employment image working conditions and equity considerations) Priority vacancies include Veterinarians Agricultural
Engineers Plant Health
Specialists Agricultural
Statisticians Plant Health Pest Risk
Analysts ICT Specialists Agricultural
Economists Agricultural Food and
Quarantine Technicians
Agro‐meteorologists Pasture Scientists Plant Production
Specialists Specialised Food
Analysts SKILLS GAPS RELATED NEEDS
bull Low literacy and numeracy levels ndash both amongst workers within the sector at large and at ownermanager level in many of the small‐scale farming
bull Farm management
Farm Management (Mainly owners managers) bull Farm management amp
entrepreneurship bull Resource
management and record keeping
bull Financial planning
A critical constraint is the poor educational levels of a large proportion of the labour force in the sector demanding a considerable effort and investment in ABET and other life skills
A particularly big need exists for skills upgrading amongst Extension Officers ndash particularly with regard to redress the historical neglect of small‐scale farmers and resource strapped farmers
Agriculture Sector Analysis 34
AgriSETA June 2010
Agriculture Sector Analysis 35
GENERAL NEEDS SMALL‐SCALE FARMER
NEEDS COMMERCIAL SECTOR
NEEDS DAFF NEEDS
skills (and general management skills in other agricultural businesses) coupled with a business orientation and entrepreneurship skills
bull A general need to increase compliance with environmental occupational health and safety animal welfare produce safety and hygiene standards regulations and requirements (local and international standards)
and management bull Project management bull Business plan
development Marketing and processing bull Processing and
packaging bull Transport
management bull Marketing produce
including branding bull Planning for
marketing bull Knowledge of
markets Technical knowledge and skills bull Production
management (related to specific enterprise)
bull Demonstration of production techniques
bull Natural resources management
Mechanical knowledge bull Farm maintenance bull Repairs of machinery
and equipment bull Electrical
maintenance and installation
programmes Need for improved management skills and relevant technological knowledge for increasing productivity levels and improved production methods Rising importance for environmentally responsible production and processing management systems Rising competitive and international markets increases need for business and marketing abilities among owners and managers Increasing requirements for compliance with environmental health and safety and international trade standards Information technology although not a priority is increasing in importance Business management ability is becoming increasingly important as more farmers are making decisions about restructuring their businesses diversification and developing supplementary sources of income
Critically improved farm management and business skills within an agricultural context to support the majority of BEE and emerging farmers Skills upgrading requirements for existing Extension Officers include bull Agricultural
economics bull Agricultural
management bull Business and
financial management
bull Technical and production related skills including o Animal husbandryo Poultry o Crop production o Horticulture
SKILLS SHORTAGES Generally SA has a shortage of entrepreneurs and people who have the business acumen drive motivation and
The profile of these farmers reflects a large contingent of older and less educated people who are generally less flexible tend to stick to
The commercial agri sector will increasingly have to compete in the global market and the ever increasing need to increase productivity to
DAFF us experiencing problems are especially sourcing people in specialised science related fields (learning fields experiencing few
AgriSETA June 2010
Agriculture Sector Analysis 36
GENERAL NEEDS SMALL‐SCALE FARMER
NEEDS COMMERCIAL SECTOR
NEEDS DAFF NEEDS
perseverance to become a successful farmer Given the high risks involved in the agricultural sector (natural elements outside onersquos control) the agri sector does not compete successfully for this ldquoscarce resourcerdquo Moreover as with other professional and skilled occupations there is a tendency for younger qualified people to move to urban areas
known practices and are less likely to experiment with new technology Within this target group candidates with good entrepreneurial ability are scarce There is a perceived shortage of Agricultural Extensionists and advisors to assist this target group However a large pool of young unemployed graduates exists who could assist such emerging farmers if they were mobilised and made accessible to farmers Similarly the potential pool of retired commercial farmers who could serve as mentors to this target group
remain profitable and viable it can be stated that many of the existing farmers and managers owners lack business management and entrepreneurial orientation Equity policy and the need to become BEE compliant requires that commercial enterprises appoint and develop black owners directors managers Changing local and global consumer preferences require farmers to change traditional farming methods and practices Skills and knowledge requirements include bull Global food and
international quality standards
bull Product traceability requirements
bull Organic produce and products
Specific occupations identified as being in short supply are
bull Production Managers (food processing)
bull Product specialisation to international specifications (research skills)
bull Forklift drivers heavy vehicletruck drivers and mobile plant operators
bull Experienced and competent artisans (millwrights electricians fitters
enrolments andor pass rates at HET institutions with the result that too few qualified persons come onto the labour market) Examples of such skills shortages identified by the Department include Agricultural Engineers bull Plant Health
Specialists (Nematology Entomology Plant Pathology)
bull Statisticians (specialised agricultural knowledge)
bull Plant Health Pest Risk Analysts
bull Agricultural Economists (production and resource economists)
bull Agricultural Food and Quarantine Technicians
bull Agro‐meteorologists Early warning Specialists
bull Pasture Scientists bull Plant Production
Specialists (eg ornamental crops hydroponics)
bull Specialised Food Analysts (pesticide residue analysts processed food and dairy analysts wine and spirit analysts)
AgriSETA June 2010
Agriculture Sector Analysis 37
GENERAL NEEDS SMALL‐SCALE FARMER
NEEDS COMMERCIAL SECTOR
NEEDS DAFF NEEDS
and turners bull Agricultural
Equipment Technicians
bull Pest and weed controllers
bull Horticultural specialists
LABOUR SHORTAGES AND RELATED SKILLS NEEDS Given an employment rate of some 26 (2009 currently estimated at over 30expanded definition) per definition there cannot be a labour shortage It is however difficult for people who have never worked before to integrate into the agricultural sector workforce Coupled with an aging workforce (30‐60 being over 40) means that most agri enterprises will within the next 5‐10 years be looking at replacing a large proportion of their workforce There could be an insufficient pool of people willing and able to participate The impact of HIVAIDS is also not always factored in to understanding the diminishing pool of resources available Labour shortages have been reported within selected geographical areas and in particular occupations Examples include cane cutters in the sugar industry chicken catchers in the poultry industry pickers in the fruit industry and animal handlers in feedlots as well as dairy parlour workers It is however believed that these shortages may reflect a recruitment problem as a result of the very harsh working conditions and the relatively poor remuneration (which makes these occupations unpopular) At present such ldquoshortagesrdquo are addressed through contracting labour from neighbouring countries
AgriSETA WSP analyses
Skills demand in the commercial agricultural sector
Information for demand for skills from WSP data is available for 1 673 employers who submitted their WSPs for the 200910 period The table below shows data on sub‐sector WSP submission relative to size of the sub‐sector as well as subsector data from all registered organisations and those who submitted WSPs Data for registered employers shows that there were 239 076 employees employed by the 17 234 registered organisations As previously stated 97 898 employees were employed by the organisations submitting WSPs This constitutes 41 of employees employed by registered organisations
Table 20 Employment and sub‐sector data drawn from WSP analyses
Sub‐sector
All Re
gistered
Employers
Small employers (0‐49)
Med
ium and
large
employers (50+)
Total W
SPs received
Total W
SPs received
as of
all registered em
ployers
WSP
received med
ium and
large orgs
WSPs received
as of
med
ium amp large em
ployers
WSPs received
small
employers
WSPs received
as of small
enterprises
EmployeesPer
Profile
CoffeeTea 40 33 7 9 23 5 71 4 12 483 Fibre 1 710 1 676 34 34 2 22 65 12 07 6 539
AgriSETA June 2010
Agriculture Sector Analysis 38
Sub‐sector
All Re
gistered
Employers
Small employers (0‐49)
Med
ium and
large
employers (50+)
Total W
SPs received
Total W
SPs received
as of
all registered em
ployers
WSP
received med
ium and
large orgs
WSPs received
as of
med
ium amp large em
ployers
WSPs received
small
employers
WSPs received
as of small
enterprises
EmployeesPer
Profile
Fruit 371 277 94 162 44 76 81 86 31 27 873 Grain 648 581 67 77 12 48 72 29 5 22 129 Milling 335 279 56 61 18 35 63 26 9 4 630 Pest Control 213 209 4 8 4 2 50 6 3 119 Poultry 391 305 86 66 17 46 53 20 7 19 187 Primary 12 121 10 776 1 345 1144 9 513 38 631 6 136 034 Red meat 1107 1 018 89 70 6 45 51 25 2 7 475 Seed 167 149 18 24 14 13 72 11 7 2 127 Sugar 71 45 26 13 18 10 38 3 7 10 478 Tobacco 60 46 14 5 8 3 21 2 4 2 002
Totals 17 234 15 394 1 840 1 673 10 818 44 855 16 239 076
Source 1 AgriSETA WSP 2009 data
Only 10 of all registered employers submitted WSPs for the 200910 period Of these 49 were medium and large sized employers and 51 small However only 16 small employers submitted their WSPs relative to the number of registered small employers and 44 medium and large employers submitted WSPs relative to the number of registered medium and large employers As such skills demand statistics provides more representative data on the requirements of medium and large employers Data for skills demand in the commercial agricultural sector is based on data for permanent employees as well as casual and seasonal employees
Skills demand forecasting by AgriSETA
Forecasting for skills demand the AgriSETA has estimated that the demand for skilled employees at different levels in the next few years is 510 686 This is based on WSP data analyses over the last 5 years and projected demand for the formal commercial agricultural sector and factoring in the demand that at maximum would result from completion of the land restitution programme in South Africa The table below reflects the skills that are on demand as well as the estimates for demand over the next five years by major occupational category35
35 AgriSETA 2010
AgriSETA June 2010
Table 21 Demand for skills by occupational category
Major Occupation (OFO)Estimated Demand
Group Title1 Managers (commercial and small emerging farmers) 264 3702 Professionals 4 1413 Technicians and Trade workers 8 9255 Clerical and administrative workers 8006 Sales workers 4007 Machinery operators and drivers 5 8008 Elementary workers 226 250
Total 510 686Source AgriSETA WSP data and SSP demand forecasts
Research needs going forward
As has been set out in the sector analysis and the scenarios derived from that analysis the sector is faced by both significant and profound change and also great uncertainty It therefore follows that the task of focussing limited resources (basically levy income in the formal sector and NSF funds for the emergent farming sector) is difficult Whilst the general thrust of training remains broadly as described in the 2006‐10 SSP Updates some considerable work is required to achieve targeted effective interventions during the 2011‐2016 period The following research questions will need to be addressed in preparing the next SSP
bull In relation to the managers and owner‐managers of commercial farms and enterprises what skills are needed to enable them to help bring about the more optimistic scenario and manage the risks associated with the less optimistic ones
bull In terms of professional and technical competencies do the current education and training institutions coupled with the learning programmes available through the AgriSETA (learnerships skills programmes and the like) meet the needs of the sector
bull In the emerging agricultural sector do the current programmes funded by sources external to the AgriSETA (eg NSF) meet all the identified needs What gaps are there and how should they be addressed
bull In relation to governmentrsquos growth strategy and industrial action plans what skills are required for developing the aquaculture sub‐sector What programmes are available How can the SETA support the skills needs for this sub‐sector
bull Given the increasing levels of casual and contract labour how can skills be developed to meet the needs of the formal commercial sector and the emerging enterprise sector
bull How can the demand in each of the priority areas be quantified and agreement be reached on numbers of people to be trained
Agriculture Sector Analysis 39
AgriSETA June 2010
SECTION 3 Skills Gaps and scarce skills
Scarce skills at the DAFF
The level of scarce skills at DAFF can be determined by the vacancy rate While the average vacancy rate in the department as at 31 March 2009 was 17 there were some posts that had very high vacancy rates as reflected in the table below Indicating the possibility that the Department is experiencing difficulties in finding suitable candidates in the South African labour market to fill these posts
Table 22 Scarce skill occupations and vacancy rates (DAFF March 2009) Critical occupations Number of posts Posts filled Vacancy rate ()
Agricultural animal oceanography forestry and other sciences
167 119 287
Engineering sciences related 2 1 50Engineers and related professions 13 6 538Farming forestry advisors and farm managers 11 4 636Finance and economics related 73 53 274Horticulturists foresters agricultural and forestry technicians
350 221 369
Legal related 6 4 333Mechanical engineering technicians 3 2 333Risk management and security services 6 4 333Social sciences related 1 0 100Veterinarians 34 24 294
Source DAFF Annual Report 20082009
Skills are also scarce at senior management level The department also reports on difficulties it has filling senior management services vacancies with some of them staying vacant for up to twelve months because no suitable candidates can be found The department would then resort to re‐advertisement and head hunting This was the case with 22 of 18 SMS posts in March 2009
Scarce skills in the commercial sector
The following occupations have previously been projected as scarce (extremely hard to fill vacancies) by AgriSETA in the commercial agricultural sector over the next five years
Table 23 Scarce and critical skills in the commercial agricultural sector
Occupation Code
Group Occupation Critical Skills Intervention Comments
139903 Managers Laboratory Manager
Technology AI nutrition
HET
221101 Professionals Accountant (General)
General HET
221102 Professionals Management Accountant
Farm financial management
HET Focus on support advice to farmers new enterprises
222101 Professionals Commodities Trader
Export administration supply chain
FET Learnership Skills
Agriculture Sector Analysis 40
AgriSETA June 2010
Agriculture Sector Analysis 41
Occupation Code
Group Occupation Critical Skills Intervention Comments
management Programme
224301 Professionals Economist Agricultural HET
Mainly for Department of Agriculture and para statals commodity organisations
233101 Professionals Chemical Engineer
Chemical processes in food production
HET Industries such as sugar processing
233301 Professionals Electrical Engineer
Installation and maintenance
HET Processing industry
233401 Professionals Electronics Engineer
Computerised production prosesses
HET Processing industry
233501 Professionals Industrial Engineer
Productivity and efficiency
HET Processing industry
233904 Professionals
Instrument Engineer (Defence Force)
Installation and maintenance
HET
Not for defence ‐ sugar industry
233502 Professionals Mechanical Engineer
FETHET Equity reasons
233902 Professionals Agricultural Engineer
Farm layout and infrastructure
HET Mainly in Government
311101 Technicians and trades workers
Agricultural Technician
Installation and maintenance
FETHET
234102 Professionals Agricultural Scientist
Agri research HETFET Especially in horticulture
234201 Professionals Chemist HET Processing industry
234202 Professionals Food Technologist
Food safety HACCP
FETHET Across sector
234701 Professionals Veterinarian HET Mainly in Government
311101 Technicians and trades workers
Agricultural Technician
Farm infrastructure
FET Mainly needed in government
311401 Technicians and trades workers
Chemistry Technician
FETHET EE reasons
312907 Technicians and trades workers
Chemical Engineering Technician
FET Learnership
Mainly EE reasons
312402 Technicians and trades workers
Electronic Engineering Technician
Weak stream production infra
FETHET Mainly tobacco industry
233904 Professionals
Instrument Engineer (Defence Force)
Instrument technician
FET
Occupation needed Instrument Technician (not defence force) Mainly sugar processing sector
321202 Technicians and trades workers
Diesel Motor Mechanic
FET Learnership
To include tractor mechanic
321204 Technicians and trades workers
Small Engine Mechanic
Agricultural equipment
FET Learnership
Throughout sector
AgriSETA June 2010
Agriculture Sector Analysis 42
Occupation Code
Group Occupation Critical Skills Intervention Comments
322301 Technicians and trades workers
Metal Fabricator
Artisan FET Learnership
322303 Technicians and trades workers
Welder Welder (First Class)
Artisan FET Learnership
323203 Technicians and trades workers
Fitter‐Welder Artisan FET Learnership
Mainly sugar ndash multi‐skilled
323202 Technicians and trades workers
Fitter And Turner
Artisan FET Learnership
Tobacco and sugar
323501 Technicians and trades workers
Millwright Artisan FET Learnership
Wide‐spread need
341101 Technicians and trades workers
Electrician (General)
Artisan FET Learnership
Wide‐spread need
342101 Technicians and trades workers
Air‐Conditioning And Refrigeration Mechanic
Artisan FET Learnership
Sugar pack houses cold chain
Source AgriSETA Sector Skills Plans
Supply of skills
South Africarsquos agriculture skills are produced in high schools agricultural colleges FET colleges and Higher Education institutions In high school a large cohort of learners take Agricultural Science as a subject In 2003 there were 42 Agricultural High Schools offering Agricultural Science as a subject These students and those in high schools taking the subject could progress to taking agriculture as a focus area for further education In 2004 there were 10 FET colleges offering vocationally directed agricultural programmes These FET colleges offered complete qualifications and short courses Eleven Colleges of Agriculture can offer qualifications up to degree level and 19 universities offer qualifications in Agriculture ranging from agricultural economics animal and plant sciences and horticulture among others at under and post graduate levels (Department of Agriculture 2006) While long term planning of skilling of new entrants in the sector can be done through close consultation between the sector agricultural schools and colleges FET colleges and HET institutions so that they teach relevant skills there are other avenues for training for those who are already employed in the sector for example skills programmes and learnerships There are 15 registered qualifications for the primary agriculture sub sectors Currently AgriSETA has 94 registered learnerships that can address the skills needs of the identified scarce skills These are captured in Appendix 2 AgriSETA has approved accredited a number of training providers across the country to deliver the theoretical and practical components of these learnerships These include agricultural colleges FET colleges and private providers Currently the AgriSETA has 246 registered and approved providers distributed nationally as follows
AgriSETA June 2010
Table 29 AgriSETA approved training providers (2010) Province Number of providers
Gauteng 72
(29)
KwaZulu Natal 20
(8)
Limpopo 35
(14)
North West 30
(12)
Northern Cape 3
(1)
Free State 15
(6)
Mpumalanga 14
(6)
Western Cape 26
(11)
Eastern Cape 31
(13) Total 246
The providers are small to large organisations In primary agriculture small providers appear to offer the most training in rural areas and community projects (AgriSETA 2010) Most of the operating providers will be in FET colleges and agricultural colleges The AgriSETA is unable to meet the total demands for skills across the duality of their sector There seems to be fairness in the approval of training for both permanent and casual and seasonal workers In 200809 the AgriSETA approved 559 learnerships as follows
Table 30 AgriSETA learnerships approved for grant purposes (2008‐2009)
Source AgriSETA learnership data analysis
Agriculture Sector Analysis 43
AgriSETA June 2010
Agriculture Sector Analysis 44
Provision of skills programmes in the same year attracted grants for 2 706 employees
Table 31 Participation by learners in skills programmes in the AgriSETA (200809)
Source AgriSETA Skills programmes data analysis
AgriSETA June 2010
APPENDIX 1 Skills demand in the Department of Agriculture Forestry amp Fisheries (200809)
Source DAFF Annual Report 2008‐20009
Agriculture Sector Analysis 45
AgriSETA June 2010
Agriculture Sector Analysis 46
Appendix 2 AgriSETA registered learnerships Registered Learnership NQF Level SAQA Registration NoLearnership in Agri Sales and Service 4 22 Q 220001 20 178 4Learnership Agricultural Machinery Technician 2 22 Q 220007 20 160 2Learnership in Specialist Agricultural Machinery Technician 5 22 Q 220009 21 258 5Agri Trade Processes 2 22 Q 220013 30 125 2FETC Meat Examination Applying Basic Business Principles 4 30 Q 3000 2823 164 4Further Education and Training Certificate Seed Marketing Execute Seed Trials 4 22 Q 220025 21 126 4Further Education and Training Certificate Seed Research and Development Certify as Seed Unit 4 22 Q 220027 21 121 4FETC Seed Research and Development Conduct a Field Inspection of a Seed Unit 4 22 Q 220028 20 120 4Seed Research and Development Operations Operate in a Team 3 22 Q 220020 22 121 3Seed Research and Development Operations Apply Basic Business Principles 3 22 Q 220021 22 121 3National Certificate Seed Processing and Packaging Operate in a Team 3 22 Q 220026 21 123 3Sugar Industry Technical Maintenance worker 2 22 Q 220011 39 128 2National Certificate Sugar Manufacturing and Refining Technical Maintenance 3 30 Q300003 23 146 3Further Education and Training Certificate Manufacturing Technical MaintenanceProduce Components by Performing Engineering Turning Operations
4 30 Q 3000 1321 173 4
FETC Manufacturing Technical Maintenance Produce Components by Performing Milling Operations 4 30 Q 3000 1521 173 4 FETC Manufacturing Technical Maintenance Develop and Fabricate from Complex Drawing 4 30 Q 3000 1420 173 4National Certificate in Sugar Technology 5 22 Q 220036 22 140 5Further Education and Training Certificate Sugar Processing 4 22 Q 220035 31 144 4National Certificate in Sugar Technology Processing Sugar Refining 2 22 Q 220037 28 124 2National Certificate in Sugar Technology Processing Juice Preparation 2 22 Q 220038 28 124 2National Certificate in Sugar Technology Processing Crystallisation 2 22 Q 220039 27 122 2National Certificate in Sugar Technology Processing Laboratory Practice 2 22 Q 220040 25 124 2National Certificate in Sugar Technology Processing Extraction 2 22 Q 220041 28 122 2NC Rooibos Production Applying Basic Business Principles 2 30 Q 3000 2427 130 2 NC Rooibos Processing Applying Basic Business Principles 2 30 Q 3000 2224 123 2 National Certificate Cigarette Production 3 22 Q 220046 23 121 3
AgriSETA June 2010
REFERENCES AgriSETA 2010 AgriSETA 20082009 Annual report Pretoria AgriSETA Agricultural Research Council httpwwwarcagriczahomeasppid=272 Avert South African HIV and AIDS statistics Available on httpwwwavertorgsafricastatshtm Centre for Development Enterprise 2008 Land reform in South Africa Getting back on track CDE Research No 16 DAFF 2010 Quarterly economic review of the agriculture sector Pretoria DAFF DAFF 2009 Annual report 20082009 Pretoria DAFF Department of Agriculture 2008 Strategic plan 2008 Pretoria Department of Agriculture DTI An introduction to the South African economy Available on httpwwwthedtigovzapublicationsagroprocessinghtm Eastern Cape Provincial Government Eastern Cape Provincial Growth and Development Strategy 2004 ndash 2014 Economic Commission for Africa 2009 Developing African agriculture through regional value chains Addis Ababa Economic Commission for Africa Economic Report Free State Province 2005 Provincial Growth and Development Strategy 2005 ndash 2014 GCIS 2010 SA Yearbook 200910rdquo Agriculture forestry and fisheries Pretoria GCIS Greenberg S 2010 Status report on land and agricultural policy in South Africa 2010 Institute for Poverty Land and Agrarian Studies School of Government University of the Western Cape Research report Ingelozi Management Solutions 2008 HIVAIDS in the South African agricultural sector Towards the development of a long term intervention Research report KwaZulu Natal Provincial Government 2006 KwaZulu Natal Provincial Growth and Development Strategy Limpopo Provincial Government Growth and Development Strategy 2004 ndash 2014 Mhone G (2000) Enclavity and Constrained Labour Absorbtive Capacity in Southern African Countries Geneva International Labour Office Moyo S The Agrarian question and the developmental state in South Africa In Edigheji O et al 2010 Constructing a democratic developmental state in South Africa HSRC PRESS
Agriculture Sector Analysis 47
AgriSETA
Agriculture Sector Analysis
National Treasury Republic of South Africa 2010 National Budget 2010 ndash National Budget Review 2010 Pretoria National Treasury Northern Cape Provincial Government Agriculture and agro‐processing sector strategy North West Provincial Government North West Provincial Growth and Development Strategy 2004 ndash 2014 Province of the Western Cape 2008 The Ikapa growth and development strategy White Paper SABCOHA SA Business Coalition on HIV and AIDS wwwsabcohaorg SACAU httpwwwsacauorghostingsacauSacauWebnsfHomehtmOpenForm South African Government 2010 20102011 ndash 20122013 Industrial Policy Action Plan Republic of South Africa Statistics South Africa 2005 Census of commercial agriculture 2002 Report No 110201 Pretoria Statistics South Africa Statistics South Africa 2009 Census of commercial agriculture 2007 Statistical release P1101 Pretoria Statistics South Africa Statistics South Africa 2010 General household survey 2009 Statistical release P0318 Pretoria Statistics South Africa Statistics South Africa 2010 Gross domestic product first quarter 2010 Statistical release P0441 Pretoria Statistics South Africa Statistics South Africa 2010 Quarterly labour force survey Quarter 1 2010 Statistical release P0211 Pretoria Statistics South Africa Vink N amp van Rooyen J 2009 The economic performance of agriculture in South Africa since 1994 The implications for food security Pretoria DBSA development planning division working paper series No 17 Webster E 2004 the Dual Economy from a book by Van Holdt K and Webster E Work restructuring and the Crisis of Social reproduction and 10 years of restructuring post apartheid workplaces University of Natal Press Workinfocom httpwwwworkinfocomfreesub_for_legresdatalraempassoc3htm Xingwana L 2008 Challenges and Opportunities for Land and Agrarian Reform towards 2025 Speech delivered at the Agri‐Consultation Protea Ranch Hotel Polokwane 30 July 2008
- Table of contents
- SECTION 1 THE AGRICULTURAL LANDSCAPE
- 11 Size and shape of the Agricultural sector
-
- Overview
- Distribution of agricultural production
- The structure of the agriculture sector in South Africa
- Categories of farming enterprises
- Employment trends
- Employment categories and remuneration
- Stakeholders in the Agricultural sector
-
- National government departments
- Sector representatives
-
- 12 Factors impacting development in the Agriculture sector
-
- Future sector economic growth and development
-
- South African sector growth plans (IPAP2)
- International Trade
- Global recession and rise in food prices
-
- Land reform
- Reliance on imports
- Water
- The labour market
- Consumer trends
- HIVAIDS
- Farm safety and security
- Broad-based Black Economic Empowerment
-
- Conclusions and scenarios
- SECTION 2 DEMAND FOR SKILLS
-
- AgriSETA registered employers and employee coverage
- Employee coverage in the AgriSETA
-
- 21 Skills demand
-
- The National Education and Training Strategy for Agriculture (AET Strategy)
- AGRISETA sector skills planning demand data (2008-2009)
- AgriSETA WSP analyses
-
- Skills demand in the commercial agricultural sector
-
- Skills demand forecasting by AgriSETA
- Research needs going forward
-
- SECTION 3 Skills Gaps and scarce skills
-
- Scarce skills at the DAFF
- Scarce skills in the commercial sector
- Supply of skills
-
- APPENDIX 1 Skills demand in the Department of Agriculture Forestry amp Fisheries (200809)
- Appendix 2 AgriSETA registered learnerships
-
AgriSETA June 2010
Whilst there is discussion in government about the ending of the ldquowilling buyer willing sellerrdquo concept the Constitution itself provides for property rights and so although some pressure may be exerted through legislation and regulation the extent and speed of change may not be fast The mechanisms for encouraging the transfer of significant levels of ownership have not yet been created The focus of the SETA is therefore likely to be more the beneficiaries of land reform and emergent farmers though projects of a BEE nature can be targeted as they arise
Conclusions and scenarios It is useful when looking at possible scenarios to examine the key variables or uncertainties and to project how variations one way or the other will have an impact on the development and growth of the sector From the sector analysis and factors that are contributing to change in the sector there are some key factors that seem to emerge First appears to be the economy and related issues of the labour market and the challenges of labour absorption in an enclave economy These factors determine on the one hand whether there will be growth and development and on the other whether such improvements will result in improved employment opportunities and the creation of a virtuous cycle of development Second is the role of the state and the various government departments whose plans and work impact on the agricultural sector Related to this is land reform that is inevitably driven by the state and not the owners of land or the landless The view expressed by many engaged in agrarian reform is that the state must play a significant role It becomes clear that a successful agricultural enterprise requires a number of factors to be in place to be successful These include access to land (Department of Rural Development and Land Reform) agricultural support within a supportive agricultural framework (Department of Agriculture Forestry and Fisheries) access to consistent water supply (Department of Water Affairs) access to finance (Department of Trade and Industry various state agencies) conducive labour market regulation (Department of Labour) sound industrial policy (Department of Trade and Industry) economic planning and macro policy (Department of Economic Development National Treasury) and appropriate education training and skills development (Department of Higher Education and Training the Human Resources Development Council NSA and the SETA) There are other government departments as well as provincial and municipal structures that also play a role The following analyses show how the four variables
economic growth and development role of the government labour market changes and land reform)
impact positively or negatively on the growth of the sector and the demand for skills
Agriculture Sector Analysis 24
AgriSETA June 2010
Agriculture Sector Analysis 25
HHIIGGHH GGRROOWWTTHH SSCCEENNAARRIIOO
The economics of the sector Role of government
The economy in SA and globally continues to revive albeit slowly for the next few years
Roles and integration of national government departments are clarified Specific functions are agreed processes put in place and personnel appointed with the required skills
International trade agreements are still weighted infavour of US and EU but progress is being made and specific blockages are addressed in bilateral talks
The roles of Departments (DWA DAFF DRDLR DoL DTI DED DHET) are clarified with appropriate joint plans and coordinating structures
The rural economy gradually improves with the buying power of the poor increasing and more stable markets created for local produce
For each of the functions agreed in each of the related departments appropriate structures and systems are put in place and staff trained
Exports increase in key areas identified in IPAP 2 and the Rand exchange rate stabilises at a level not too much different than it is today
Specific capacity is put in place at local level to support implementation of land reform and rural development
There is a growing understanding of the concept of dualism and the need to intervene with labour absorption and development mechanisms
Land claims are all finally settled and ownership and tenure is resolved There is a serious drive to establish effective agricultural enterprises
An understanding is reached on the role of agencies and labour brokers and abuse is curbed
The willing buyer willing seller approach is resolved and enables viable land to become black owned
Some relaxation of labour market regulations are agreed that maintain some minimum standard of employment but assist absorption
Land transfer to black and emergent farmers is done in a manner that integrates then into the supply chains of the sector
Mechanisms are found to address skills needs in the context of casual and seasonal work patterns
Financing of land reform and transfer is done on the basis of agreed development plans including skills
Labour market reform Trajectory of land reform LLOOWW GGRROOWWTTHH SSCCEENNAARRIIOO
The economics of the sector Role of government departments The economy in SA and globally stagnates at current levels and the economy struggles to pick up after the temporary 2010 World Cup boost
A lack of purpose at government level means limited progress for another five years Land reform remains a commitment without a plan
International trade agreements are still weighted infavour of US and EU and protectionism increases as a result of the global recession
The roles of Departments (DWA DAFF DRDLR DoL DTI DED DHET) are unclear and there is no proper co‐ordination
SArsquos Gini coefficient continues to worsen with rural poverty increasing and local economies declining
There is a lack of effective structures systems and processes to implement policy across departments
Rand volatility causes problems for importers and exporters Well established markets are maintained but exports decrease
At local level the decline in the agricultural extension officer functions continues and limited practical support is available
Understanding of the rural economy is so diverse that stakeholders cannot agree the problem let alone the solution to low absorption levels
Land claims take too long and land reform processes leave potentially productive land poorly developed and managed
Casual labour and labour brokers remains an issue of dispute Confrontation results in bitterness and resentment
The impasse caused by a rigid interpretations of property clauses in the Constitution continues to stall achievement of the 30 black ownership target
Labour market regulation continues to be a contributing factor to reducing levels of employment
Black owned farms find it difficult to become part of supply chains and are unable to perform adequately
Unstable employment patterns in the sector make skills interventions difficult to manage and largely ineffective
Financing of land reform and land transfer continues to be wasted as it is not tied to the building of appropriate capacity
Labour market reform Trajectory of land reform
AgriSETA June 2010
These analyses can be translated into four potential growth and development scenarios for the agricultural sector which are based on the requirements for a strong development state Scenario 3 Weak government support
and sound economy
Econ
omic fa
ctors glob
ally n
ationa
lly and
locally
Scenario 1 Integrated government support and sound economy
The economic upturn triggered by the World Cup continues and globally things improve enabling an expansion of exports The government because of a lack of integrated policy planning and implementation provides limited support for sector development The gains go to the well established enterprise owners with few gains for emerging farmers and local communities
Government departments coordinate their efforts to achieve maximum impact There are favourable economic conditions that create opportunities for advance Within this positive environment the role of the AgriSETA becomes a central component of a comprehensive strategy for growth and skills interventions are targeted to achieve maximum effect Results in growth in sustainable enterprises and expanded employment opportunities
Government policy and support Government policy and support
Combination of disjointed government policy planning and a weak and increasingly marginalised rural economy Economic conditions result in unsustainable farming conditions and employment declines along with productivity Food shortages and the lack of development in rural areas leading to increasing social tensions A vicious cycle develops with the sector going into long term decline
Government departments coordinate their efforts to achieve maximum impact However economic conditions hamper progress Efforts by the AgriSETA are undermined by poor labour absorption and job insecurity Some significant successes are recorded including some NSF funded projects that result in sustainable enterprises A platform is laid for future improvements when the economic conditions improve
Scenario 4 Weak state and economy Scenario 2 Strong state but weak
economy
Agriculture Sector Analysis 26
AgriSETA June 2010
Agriculture Sector Analysis 27
SECTION 2 DEMAND FOR SKILLS
AgriSETA registered employers and employee coverage
In 2009 17 234 employers were registered with the AgriSETA comprising 15 394 small employers (less than 50 employees) 1 202 medium sized employers (50 ‐ 149 employees) and 638 large employers (more than 150 employees)
Considering that there are around 40000 commercial farms33 the 17 234 employers represent around 43 of commercial farms Notwithstanding changes in the sector as a result of land reform and sector shrinkage this is a sizable proportion and is held to be sufficiently representative for the purpose of skills development planning However this paints an incomplete picture It understates the representative nature of large enterprise registered with the SETA and overstates the representative nature of small registered enterprises 4 175 (242) of the enterprises are levy paying members Further only 1 673 (11) workplace skills plans (WSPs) were submitted
Table 16 Registered employers by size and sub‐sector Sub‐sector Description
Employers Small Medium Large
CoffeeTea Processing and marketing of coffee and tea including coconuts cocoa nuts olives dates etc
33 4 3
Fibre Grading ginning packing of wool and cotton raw material 1 676 16 18
Fruit Fruit packed in cartons fruit juice concentrate drummed and fruit juice in container ready for consumption
271 36 57
Fruit exporters and importers 6 0 1
Grain
Manufacture of grain mill products and starches 119 5 7Handling and storage of grain 67 7 23Wholesale amp retail trade in Agricultural machinery 213 9 4Sale and distribution of Agricultural raw materials and other farming inputs
182 9 3
Milling
Manufacture of flour and grain mill products including rice and vegetable milling grain mill residues
120 15 11
Manufacture of prepared animal feeds 110 19 0Manufacture of pet foods 42 9 0Manufacture of starches and starch products 7 1 1
Pest control
Pest Control 209 4 0
Poultry Poultry and egg production including the slaughtering dressing and packing of poultry
305 49 37
Primary
Growing of Cereals and other crops (not elsewhere classified) 902 160 34Growing of Vegetables Horticultural specialties nursery products
943 120 72
Growing of Vegetables Horticultural specialties (Including Ornamental Horticulture) and nursery products
11 5 0
Sugar plantation including sugar cane and sugar beet etc 9 4 2
33 SARS statistics 2007
AgriSETA June 2010
Agriculture Sector Analysis 28
Sub‐ Description Employers Growing of fruit nuts beverage and spice crops 1795 255 143Farming of cattle sheep goats horses asses mules and hinnies Dairy farming
2 252 59 18
Other animal farming production of animal products (NEC) 433 25 12Ostrich farming 5 0 0Game farming 16 0 0Growing of crops combined with farming of animals (Mixed farming)
2 920 256 109
Growing of coffee and tea including coconuts cocoa nuts olives dates etc
2 0 0
Agricultural and animal husbandry services except veterinary activities
438 22 9
Other animal farming (not elsewhere classified) 11 1 1Growing of trees as second crop by farmers 126 18 4Fishing operation of fish hatcheries and fish farm 913 10 6
Red meat
Production and animal products (not elsewhere classified) 6 0 0Slaughtering dressing and packing of livestock including poultry and small game for meat
317 40 17
Production sale amp marketing of Agricultural by products (eg bones hides)
61 2 0
Slaughtering dressing and packing of livestock including small game for meat and processing of ostrich products
2 1 0
Wholesale trade in Agricultural raw materials and livestock 193 7 10Transport of livestock as supporting activity 224 0 0Agricultural and livestock research 215 9 3
Seed Seed production and marketing 149 12 6
Sugar Manufacture of sugar including golden syrup and castor sugar
45 5 21
Tobacco Processing and dispatching of tobacco 46 8 6 TOTALS 15 394 1 202 638Source AgriSETA WSP data
The largest number of registered small and medium enterprises are found in the mixed farming sub‐sector while most large enterprises are in the growing of fruit nuts beverage and spice crops sub‐sector
Employee coverage in the AgriSETA
Collectively the 17 234 employers registered with AgriSETA employed a total of 239 076 employees This represents 39 of the agricultural labour force in 2009 The 1 673 employers who submitted WSPs in 2009 employed 97 898 employees representing 41 of the total number of people employed by registered employers While the number of registered employers submitting WSPs is small (11) they employ a sizeable number of employees and the percentage of employees provides a statistically significant sample The data for larger enterprises is statistically much more representative than that for small enterprises
AgriSETA June 2010
Table 17 Number of employees of registered employers by sub‐sector
Sub‐sector
Sub‐sector description Employees
CoffeeTea Processing and marketing of coffee and tea including coconuts cocoa nuts olives dates etc
483
Fibre Grading ginning and packing of wool and cotton raw material 6 539
Fruit Fruit packed in cartons fruit juice concentrate drummed and fruit juice in container ready for consumption
27 661
Fruit exporters and importers 212
Grain
Manufacture of grain mill products and starches 133Handling and storage of grain 18 303Wholesale amp retail trade in Agricultural machinery 795Sale and distribution of Agricultural raw materials and other farming inputs 2 898
Milling
Manufacture of flour and grain mill products including rice and vegetable milling grain mill residues
3 634
Manufacture of prepared animal feeds 731Manufacture of pet foods 160Manufacture of starches and starch products 105
Pest control
Pest Control 119
Poultry Poultry and egg production including the slaughtering dressing and packing of poultry
19 187
Primary
Growing of Cereals and other crops (not elsewhere classified) 10 104Growing of Vegetables Horticultural specialties and nursery products 37 799Growing of Vegetables Horticultural specialties (Including Ornamental Horticulture) and nursery products
195
Sugar plantation including sugar cane and sugar beet etc 220Growing of fruit nuts beverage and spice crops 47 043Farming of cattle sheep goats horses asses mules hinnies Dairy farming
3 382
Other animal farming production of animal products (NEC) 4 203Ostrich farming 0Game farming 0Growing of crops combined with farming of animals (Mixed farming) 28 722Growing of coffee amp tea including coconuts cocoa nuts olives dates etc 0Agricultural and animal husbandry services except veterinary activities 970Other animal farming (not elsewhere classified) 513Growing of trees as second crop by farmers 1 294Fishing operation of fish hatcheries and fish farm 1 589
Red meat
Production and animal products (not elsewhere classified) 0Slaughtering dressing and packing of livestock including poultry and small game for meat
5 128
Production sale amp marketing of Agricultural by products (eg bones hides) 116Slaughtering dressing and packing of livestock including small game for meat and processing of ostrich products
0
Wholesale trade in Agricultural raw materials and livestock 1 697Transport of livestock as supporting activity 0Agricultural and livestock research 534
Seed Seed production and marketing 2 127Sugar Manufacture of sugar including golden syrup and castor sugar 10 478Tobacco Processing and dispatching of tobacco 2 002 Total 239 076
Agriculture Sector Analysis 29
AgriSETA June 2010
Agriculture Sector Analysis 30
Source AgriSETA WSP data
According to the WSP analysis the sub‐sector for the growing of fruit nuts beverage and spice crops employed the largest number of people In six sub‐sectors there are employers who do not employ workers These are probably family based organisations where family members help in the business without drawing a salary These are in transport and livestock research slaughtering dressing and packing of livestock including poultry and small game for meat growing of coffee and tea including coconuts cocoa nuts olives dates etc ostrich farming and game farming
Table 18 Employee distribution by province Province Employees Percentage
Eastern Cape 18 844 192 Free State 1 946 20 Gauteng 2 788 28 KwaZulu‐Natal 5 416 55 Mpumalanga 8 062 82 North West 3 290 34 Northern Cape 5 436 56 Limpopo 1 730 18 Western Cape 50 386 515 Grand Total 97 898
Source AgriSETA WSP data
Of those submitting WSPs registered employers in the Western Cape employed the largest number of people while employers in Limpopo employed the least number of employees Free State has a small number of employees covered by WSPs submitted to the SETA whereas Eastern Cape with a relatively small number of registered farms has a very large number of employees on farms submitting WSPs Given this variance between provinces the use of WSP data for extrapolation purposes must be viewed cautiously
2009 WSP equity information was only provided for about a quarter of employees (25 637 or26)34 No information was available from the WSPs on non‐South Africans working on commercial farms
Table 19 Equity profile from 2009 WSP data African Coloured Indian White
Totals M F D M F D M F D M F D
8 040 5 785 38 5 097 5 228 24 22 25 0 811 556 11
580 417 03 493 505 02 468 532 00 589 403 08 13 863 10 349 47 1 378 25 637541 404 02 54 100
Total EquityTotal Male Total Female Total Disability
13 970 11 594 73 545 452 03
Source AgriSETA WSP data
Using currently available data it is not possible to provide disaggregated employment data by sub‐sector This will require a small change in the way that gender race and disability data is
34 Some employers did not complete race and gender information when giving their employment profiles
AgriSETA June 2010
codified during WSP data‐capturing including allocation by sub‐sector What can be stated is that employment of males is more dominant than that of women and more Africans are employed in the sector than other groups Employment of people with disabilities is below 1
21 Skills demand
The National Education and Training Strategy for Agriculture (AET Strategy)
The AET Strategy developed by the Department of Agriculture Fisheries and Forestry (in consultation with various key stakeholders in the agricultural sector) highlights priority skills needs and constraints within the sector and categorises needs within the following 5 broad areas
1 Agricultural production ndash requesting that the past focus on a narrow band of commodities (relevant mainly to the commercial sector) and related research be expanded to address the needs of small‐scale and subsistence farmers (eg more focus on mixed farming and rural livelihood sustainability skills)
2 Agricultural engineering ndash with specific focus to be placed on technologies suitable for small‐scale farmers (eg relevant and post‐harvesting techniques related to processing and storage of produce) ndash to address this need the scarcity of agricultural engineers requires attention
3 Agricultural economics ndash a critical need was identified for general agricultural economic skills (ranging spectrum of farm planning farm management enterprise management marketing finance etc) ndash with the need to training both farmers and extension officers in such fields
4 Agricultural development ndash a specific need was identified to develop agricultural extensionists in supporting especially emerging and small‐scale farmers over the full spectrum (a need exists for both new curriculum in the training of new extensionists and the re‐training and upgrading of existing officers)
5 Veterinarians ndash the need to develop state veterinarians in order for the state to perform its role and function (particularly in its preventative monitoring and regulatory role and function)
AGRISETA sector skills planning demand data (2008‐2009)
The following section reflects initial research on skills demand in the Agricultural sector arising from the sector analysis (section 1) previous AGRISETA skills demand research for Sector Skills Planning during 2005‐2009 and analysis of WSP data from 2009 With the introduction of the Organising Framework of Occupations and agreement on definitions for scarce and critical skills in 200506 the AGRISETA undertook an extensive research and consultation processes to determine skills development priorities for the sector The research methodology employed was based on the a four dimensional topology for establishing and evaluating skills needs illustrated in the figure below
Agriculture Sector Analysis 31
AgriSETA June 2010
Agriculture Sector Analysis 32
The identification and prioritisation of skills needs was also undertaken from a key stakeholder and beneficiary perspective Consideration was given to needs of the following groups
bull The unemployed ndash helping them gain andor regain entry to the labour market bull The economically inactive ndash helping them to become economically active bull School leavers ndash helping them gain access to further education and training opportunities
and thus facilitating their entry to the job market bull Entrants to the job market ndash facilitating employment and integration into the work culture
and work ethic (improving the employability of an individual) bull Those currently employed in the sector ndash increasing their competency and opportunities
for advancement creating a career path and offering continued job security enhancement of value adding to the sector improving their prospects for better employment opportunities
bull Organisations and enterprises within the sector ndash making sure that skills development and knowledge creation occurs in such a way as to improve the sectorrsquos viability and allowing companiesenterprises to become more sustainable and profitable along the way improving productivity competitiveness and innovation within organisations
In organising and reporting the identified priority skills development needs (200809) the following structuring approach was followed
Tier 1 The four categories of needs as per the Topology presented above were used for the identification evaluation and grouping of needs
Pay conditions
Image
RECRUITMENT DIFFICULTY
SKILLSGAP
SKILLSSHORTAGE
LABOURSHORTAGE
Firms experience difficulty recruiting This does not necessary imply a skills shortage ndash may indicate a poor image remuneration etc
Those currently in work do not have the requisite skills set to carry out their job to an optimum standard
Required skills are in short supply when compared with the demand across the whole labour market
Regardless of skills levels a situation exists where there is simply not enough supply of labour to meet demand
Pay conditions
Image
RECRUITMENT DIFFICULTY
SKILLSGAP
SKILLSSHORTAGE
LABOURSHORTAGE
Firms experience difficulty recruiting This does not necessary imply a skills shortage ndash may indicate a poor image remuneration etc
Those currently in work do not have the requisite skills set to carry out their job to an optimum standard
Required skills are in short supply when compared with the demand across the whole labour market
Regardless of skills levels a situation exists where there is simply not enough supply of labour to meet demand
Figure 4 Topology for identifying skills development priorities
Source AGRISETA SSP Annual Update August 2009
AgriSETA June 2010
Tier 2 Within each of the first tier groupings needs were further broken down and organised per target group At this second level needs were grouped by
o General skills development needs (cross‐cutting over different target groups) o Needs experienced by small scale farmers (this group included subsistence
farmers new emerging land reform beneficiaries and small‐scale AgriBEE farmers) o Needs within the commercial agricultural sector (per sub‐sector groupings where
specific needs for such were identified ndash both on‐farm needs and within the secondary sub‐sector or related agri‐businesses)
o Needs of the Department of Agriculture Fisheries and Forestry (DAFF) To further guide and direct the identification and selection of scarce and critical skills the following factors or criteria that could reflect the importance (impact and effect) of a skills shortages were developed as an identification framework
1 Basic Skills Development Promoting basic literacy and numeracy and raising the base level of education for the sector improving the work and livelihood of existing workers
2 Employability Making the employee more employable by improving the fit between their skills and the sector needs
3 Enterprise Viability Improving the capability and feasibility of the enterprise by increasing its effectiveness of or possibilities for profit generation etc
4 Enterprise Sustainability Allow enterprises to survive and grow over an extended period of time without compromising the value of renewable resources thereby creating long‐term meaningful employment for larger numbers of people
5 Sector Growth Enabling the sector to develop or pursue new opportunities or improve the effectiveness of current operations
6 Sector Competitiveness Enabling the sector to compete more effectively in the international arena improving market intelligence and interpretation productivity cost efficiency etc
7 Human Resource Development Capacity Improving the access to quality provision of training to the agri sector
Based on this research and consultation framework the following skills development needs and priorities were identified
Agriculture Sector Analysis 33
AgriSETA June 2010
GENERAL NEEDS SMALL‐SCALE FARMER
NEEDS COMMERCIAL SECTOR
NEEDS DAFF NEEDS
RECRUITMENT RELATED SKILLS NEEDS Primary agriculture is the entry point into the world of work for large numbers of people in rural areas However the sector has negative connotations amongst sections of the youth and in parts of the country and is viewed as a last resort for some in the search for employment) The effect is that despite an unemployment rate of approximately 26 (now over 30) farmers find it difficult to recruit workers to meet seasonal demands This has resulted in the government approving the contracting of foreign labour to meet such temporary needs (workers are recruited mainly from Zimbabwe and Mozambique)
Labour in this farming sector is provided primarily by family members and no real recruitment constraints can be identified
The agricultural sector still manages to attract technical and management skills as it is perceived to include a better lifestyle and there is a strong tradition of agriculture in SA Increasing crime related security risks associated with farming may have a negative impact
The Department has identified a number of occupations in which they are experiencing long‐term vacancies Some of these result from a general shortage of such skills in SA while others arise from the inability of the public sector to compete with the private sector (less favourable employment image working conditions and equity considerations) Priority vacancies include Veterinarians Agricultural
Engineers Plant Health
Specialists Agricultural
Statisticians Plant Health Pest Risk
Analysts ICT Specialists Agricultural
Economists Agricultural Food and
Quarantine Technicians
Agro‐meteorologists Pasture Scientists Plant Production
Specialists Specialised Food
Analysts SKILLS GAPS RELATED NEEDS
bull Low literacy and numeracy levels ndash both amongst workers within the sector at large and at ownermanager level in many of the small‐scale farming
bull Farm management
Farm Management (Mainly owners managers) bull Farm management amp
entrepreneurship bull Resource
management and record keeping
bull Financial planning
A critical constraint is the poor educational levels of a large proportion of the labour force in the sector demanding a considerable effort and investment in ABET and other life skills
A particularly big need exists for skills upgrading amongst Extension Officers ndash particularly with regard to redress the historical neglect of small‐scale farmers and resource strapped farmers
Agriculture Sector Analysis 34
AgriSETA June 2010
Agriculture Sector Analysis 35
GENERAL NEEDS SMALL‐SCALE FARMER
NEEDS COMMERCIAL SECTOR
NEEDS DAFF NEEDS
skills (and general management skills in other agricultural businesses) coupled with a business orientation and entrepreneurship skills
bull A general need to increase compliance with environmental occupational health and safety animal welfare produce safety and hygiene standards regulations and requirements (local and international standards)
and management bull Project management bull Business plan
development Marketing and processing bull Processing and
packaging bull Transport
management bull Marketing produce
including branding bull Planning for
marketing bull Knowledge of
markets Technical knowledge and skills bull Production
management (related to specific enterprise)
bull Demonstration of production techniques
bull Natural resources management
Mechanical knowledge bull Farm maintenance bull Repairs of machinery
and equipment bull Electrical
maintenance and installation
programmes Need for improved management skills and relevant technological knowledge for increasing productivity levels and improved production methods Rising importance for environmentally responsible production and processing management systems Rising competitive and international markets increases need for business and marketing abilities among owners and managers Increasing requirements for compliance with environmental health and safety and international trade standards Information technology although not a priority is increasing in importance Business management ability is becoming increasingly important as more farmers are making decisions about restructuring their businesses diversification and developing supplementary sources of income
Critically improved farm management and business skills within an agricultural context to support the majority of BEE and emerging farmers Skills upgrading requirements for existing Extension Officers include bull Agricultural
economics bull Agricultural
management bull Business and
financial management
bull Technical and production related skills including o Animal husbandryo Poultry o Crop production o Horticulture
SKILLS SHORTAGES Generally SA has a shortage of entrepreneurs and people who have the business acumen drive motivation and
The profile of these farmers reflects a large contingent of older and less educated people who are generally less flexible tend to stick to
The commercial agri sector will increasingly have to compete in the global market and the ever increasing need to increase productivity to
DAFF us experiencing problems are especially sourcing people in specialised science related fields (learning fields experiencing few
AgriSETA June 2010
Agriculture Sector Analysis 36
GENERAL NEEDS SMALL‐SCALE FARMER
NEEDS COMMERCIAL SECTOR
NEEDS DAFF NEEDS
perseverance to become a successful farmer Given the high risks involved in the agricultural sector (natural elements outside onersquos control) the agri sector does not compete successfully for this ldquoscarce resourcerdquo Moreover as with other professional and skilled occupations there is a tendency for younger qualified people to move to urban areas
known practices and are less likely to experiment with new technology Within this target group candidates with good entrepreneurial ability are scarce There is a perceived shortage of Agricultural Extensionists and advisors to assist this target group However a large pool of young unemployed graduates exists who could assist such emerging farmers if they were mobilised and made accessible to farmers Similarly the potential pool of retired commercial farmers who could serve as mentors to this target group
remain profitable and viable it can be stated that many of the existing farmers and managers owners lack business management and entrepreneurial orientation Equity policy and the need to become BEE compliant requires that commercial enterprises appoint and develop black owners directors managers Changing local and global consumer preferences require farmers to change traditional farming methods and practices Skills and knowledge requirements include bull Global food and
international quality standards
bull Product traceability requirements
bull Organic produce and products
Specific occupations identified as being in short supply are
bull Production Managers (food processing)
bull Product specialisation to international specifications (research skills)
bull Forklift drivers heavy vehicletruck drivers and mobile plant operators
bull Experienced and competent artisans (millwrights electricians fitters
enrolments andor pass rates at HET institutions with the result that too few qualified persons come onto the labour market) Examples of such skills shortages identified by the Department include Agricultural Engineers bull Plant Health
Specialists (Nematology Entomology Plant Pathology)
bull Statisticians (specialised agricultural knowledge)
bull Plant Health Pest Risk Analysts
bull Agricultural Economists (production and resource economists)
bull Agricultural Food and Quarantine Technicians
bull Agro‐meteorologists Early warning Specialists
bull Pasture Scientists bull Plant Production
Specialists (eg ornamental crops hydroponics)
bull Specialised Food Analysts (pesticide residue analysts processed food and dairy analysts wine and spirit analysts)
AgriSETA June 2010
Agriculture Sector Analysis 37
GENERAL NEEDS SMALL‐SCALE FARMER
NEEDS COMMERCIAL SECTOR
NEEDS DAFF NEEDS
and turners bull Agricultural
Equipment Technicians
bull Pest and weed controllers
bull Horticultural specialists
LABOUR SHORTAGES AND RELATED SKILLS NEEDS Given an employment rate of some 26 (2009 currently estimated at over 30expanded definition) per definition there cannot be a labour shortage It is however difficult for people who have never worked before to integrate into the agricultural sector workforce Coupled with an aging workforce (30‐60 being over 40) means that most agri enterprises will within the next 5‐10 years be looking at replacing a large proportion of their workforce There could be an insufficient pool of people willing and able to participate The impact of HIVAIDS is also not always factored in to understanding the diminishing pool of resources available Labour shortages have been reported within selected geographical areas and in particular occupations Examples include cane cutters in the sugar industry chicken catchers in the poultry industry pickers in the fruit industry and animal handlers in feedlots as well as dairy parlour workers It is however believed that these shortages may reflect a recruitment problem as a result of the very harsh working conditions and the relatively poor remuneration (which makes these occupations unpopular) At present such ldquoshortagesrdquo are addressed through contracting labour from neighbouring countries
AgriSETA WSP analyses
Skills demand in the commercial agricultural sector
Information for demand for skills from WSP data is available for 1 673 employers who submitted their WSPs for the 200910 period The table below shows data on sub‐sector WSP submission relative to size of the sub‐sector as well as subsector data from all registered organisations and those who submitted WSPs Data for registered employers shows that there were 239 076 employees employed by the 17 234 registered organisations As previously stated 97 898 employees were employed by the organisations submitting WSPs This constitutes 41 of employees employed by registered organisations
Table 20 Employment and sub‐sector data drawn from WSP analyses
Sub‐sector
All Re
gistered
Employers
Small employers (0‐49)
Med
ium and
large
employers (50+)
Total W
SPs received
Total W
SPs received
as of
all registered em
ployers
WSP
received med
ium and
large orgs
WSPs received
as of
med
ium amp large em
ployers
WSPs received
small
employers
WSPs received
as of small
enterprises
EmployeesPer
Profile
CoffeeTea 40 33 7 9 23 5 71 4 12 483 Fibre 1 710 1 676 34 34 2 22 65 12 07 6 539
AgriSETA June 2010
Agriculture Sector Analysis 38
Sub‐sector
All Re
gistered
Employers
Small employers (0‐49)
Med
ium and
large
employers (50+)
Total W
SPs received
Total W
SPs received
as of
all registered em
ployers
WSP
received med
ium and
large orgs
WSPs received
as of
med
ium amp large em
ployers
WSPs received
small
employers
WSPs received
as of small
enterprises
EmployeesPer
Profile
Fruit 371 277 94 162 44 76 81 86 31 27 873 Grain 648 581 67 77 12 48 72 29 5 22 129 Milling 335 279 56 61 18 35 63 26 9 4 630 Pest Control 213 209 4 8 4 2 50 6 3 119 Poultry 391 305 86 66 17 46 53 20 7 19 187 Primary 12 121 10 776 1 345 1144 9 513 38 631 6 136 034 Red meat 1107 1 018 89 70 6 45 51 25 2 7 475 Seed 167 149 18 24 14 13 72 11 7 2 127 Sugar 71 45 26 13 18 10 38 3 7 10 478 Tobacco 60 46 14 5 8 3 21 2 4 2 002
Totals 17 234 15 394 1 840 1 673 10 818 44 855 16 239 076
Source 1 AgriSETA WSP 2009 data
Only 10 of all registered employers submitted WSPs for the 200910 period Of these 49 were medium and large sized employers and 51 small However only 16 small employers submitted their WSPs relative to the number of registered small employers and 44 medium and large employers submitted WSPs relative to the number of registered medium and large employers As such skills demand statistics provides more representative data on the requirements of medium and large employers Data for skills demand in the commercial agricultural sector is based on data for permanent employees as well as casual and seasonal employees
Skills demand forecasting by AgriSETA
Forecasting for skills demand the AgriSETA has estimated that the demand for skilled employees at different levels in the next few years is 510 686 This is based on WSP data analyses over the last 5 years and projected demand for the formal commercial agricultural sector and factoring in the demand that at maximum would result from completion of the land restitution programme in South Africa The table below reflects the skills that are on demand as well as the estimates for demand over the next five years by major occupational category35
35 AgriSETA 2010
AgriSETA June 2010
Table 21 Demand for skills by occupational category
Major Occupation (OFO)Estimated Demand
Group Title1 Managers (commercial and small emerging farmers) 264 3702 Professionals 4 1413 Technicians and Trade workers 8 9255 Clerical and administrative workers 8006 Sales workers 4007 Machinery operators and drivers 5 8008 Elementary workers 226 250
Total 510 686Source AgriSETA WSP data and SSP demand forecasts
Research needs going forward
As has been set out in the sector analysis and the scenarios derived from that analysis the sector is faced by both significant and profound change and also great uncertainty It therefore follows that the task of focussing limited resources (basically levy income in the formal sector and NSF funds for the emergent farming sector) is difficult Whilst the general thrust of training remains broadly as described in the 2006‐10 SSP Updates some considerable work is required to achieve targeted effective interventions during the 2011‐2016 period The following research questions will need to be addressed in preparing the next SSP
bull In relation to the managers and owner‐managers of commercial farms and enterprises what skills are needed to enable them to help bring about the more optimistic scenario and manage the risks associated with the less optimistic ones
bull In terms of professional and technical competencies do the current education and training institutions coupled with the learning programmes available through the AgriSETA (learnerships skills programmes and the like) meet the needs of the sector
bull In the emerging agricultural sector do the current programmes funded by sources external to the AgriSETA (eg NSF) meet all the identified needs What gaps are there and how should they be addressed
bull In relation to governmentrsquos growth strategy and industrial action plans what skills are required for developing the aquaculture sub‐sector What programmes are available How can the SETA support the skills needs for this sub‐sector
bull Given the increasing levels of casual and contract labour how can skills be developed to meet the needs of the formal commercial sector and the emerging enterprise sector
bull How can the demand in each of the priority areas be quantified and agreement be reached on numbers of people to be trained
Agriculture Sector Analysis 39
AgriSETA June 2010
SECTION 3 Skills Gaps and scarce skills
Scarce skills at the DAFF
The level of scarce skills at DAFF can be determined by the vacancy rate While the average vacancy rate in the department as at 31 March 2009 was 17 there were some posts that had very high vacancy rates as reflected in the table below Indicating the possibility that the Department is experiencing difficulties in finding suitable candidates in the South African labour market to fill these posts
Table 22 Scarce skill occupations and vacancy rates (DAFF March 2009) Critical occupations Number of posts Posts filled Vacancy rate ()
Agricultural animal oceanography forestry and other sciences
167 119 287
Engineering sciences related 2 1 50Engineers and related professions 13 6 538Farming forestry advisors and farm managers 11 4 636Finance and economics related 73 53 274Horticulturists foresters agricultural and forestry technicians
350 221 369
Legal related 6 4 333Mechanical engineering technicians 3 2 333Risk management and security services 6 4 333Social sciences related 1 0 100Veterinarians 34 24 294
Source DAFF Annual Report 20082009
Skills are also scarce at senior management level The department also reports on difficulties it has filling senior management services vacancies with some of them staying vacant for up to twelve months because no suitable candidates can be found The department would then resort to re‐advertisement and head hunting This was the case with 22 of 18 SMS posts in March 2009
Scarce skills in the commercial sector
The following occupations have previously been projected as scarce (extremely hard to fill vacancies) by AgriSETA in the commercial agricultural sector over the next five years
Table 23 Scarce and critical skills in the commercial agricultural sector
Occupation Code
Group Occupation Critical Skills Intervention Comments
139903 Managers Laboratory Manager
Technology AI nutrition
HET
221101 Professionals Accountant (General)
General HET
221102 Professionals Management Accountant
Farm financial management
HET Focus on support advice to farmers new enterprises
222101 Professionals Commodities Trader
Export administration supply chain
FET Learnership Skills
Agriculture Sector Analysis 40
AgriSETA June 2010
Agriculture Sector Analysis 41
Occupation Code
Group Occupation Critical Skills Intervention Comments
management Programme
224301 Professionals Economist Agricultural HET
Mainly for Department of Agriculture and para statals commodity organisations
233101 Professionals Chemical Engineer
Chemical processes in food production
HET Industries such as sugar processing
233301 Professionals Electrical Engineer
Installation and maintenance
HET Processing industry
233401 Professionals Electronics Engineer
Computerised production prosesses
HET Processing industry
233501 Professionals Industrial Engineer
Productivity and efficiency
HET Processing industry
233904 Professionals
Instrument Engineer (Defence Force)
Installation and maintenance
HET
Not for defence ‐ sugar industry
233502 Professionals Mechanical Engineer
FETHET Equity reasons
233902 Professionals Agricultural Engineer
Farm layout and infrastructure
HET Mainly in Government
311101 Technicians and trades workers
Agricultural Technician
Installation and maintenance
FETHET
234102 Professionals Agricultural Scientist
Agri research HETFET Especially in horticulture
234201 Professionals Chemist HET Processing industry
234202 Professionals Food Technologist
Food safety HACCP
FETHET Across sector
234701 Professionals Veterinarian HET Mainly in Government
311101 Technicians and trades workers
Agricultural Technician
Farm infrastructure
FET Mainly needed in government
311401 Technicians and trades workers
Chemistry Technician
FETHET EE reasons
312907 Technicians and trades workers
Chemical Engineering Technician
FET Learnership
Mainly EE reasons
312402 Technicians and trades workers
Electronic Engineering Technician
Weak stream production infra
FETHET Mainly tobacco industry
233904 Professionals
Instrument Engineer (Defence Force)
Instrument technician
FET
Occupation needed Instrument Technician (not defence force) Mainly sugar processing sector
321202 Technicians and trades workers
Diesel Motor Mechanic
FET Learnership
To include tractor mechanic
321204 Technicians and trades workers
Small Engine Mechanic
Agricultural equipment
FET Learnership
Throughout sector
AgriSETA June 2010
Agriculture Sector Analysis 42
Occupation Code
Group Occupation Critical Skills Intervention Comments
322301 Technicians and trades workers
Metal Fabricator
Artisan FET Learnership
322303 Technicians and trades workers
Welder Welder (First Class)
Artisan FET Learnership
323203 Technicians and trades workers
Fitter‐Welder Artisan FET Learnership
Mainly sugar ndash multi‐skilled
323202 Technicians and trades workers
Fitter And Turner
Artisan FET Learnership
Tobacco and sugar
323501 Technicians and trades workers
Millwright Artisan FET Learnership
Wide‐spread need
341101 Technicians and trades workers
Electrician (General)
Artisan FET Learnership
Wide‐spread need
342101 Technicians and trades workers
Air‐Conditioning And Refrigeration Mechanic
Artisan FET Learnership
Sugar pack houses cold chain
Source AgriSETA Sector Skills Plans
Supply of skills
South Africarsquos agriculture skills are produced in high schools agricultural colleges FET colleges and Higher Education institutions In high school a large cohort of learners take Agricultural Science as a subject In 2003 there were 42 Agricultural High Schools offering Agricultural Science as a subject These students and those in high schools taking the subject could progress to taking agriculture as a focus area for further education In 2004 there were 10 FET colleges offering vocationally directed agricultural programmes These FET colleges offered complete qualifications and short courses Eleven Colleges of Agriculture can offer qualifications up to degree level and 19 universities offer qualifications in Agriculture ranging from agricultural economics animal and plant sciences and horticulture among others at under and post graduate levels (Department of Agriculture 2006) While long term planning of skilling of new entrants in the sector can be done through close consultation between the sector agricultural schools and colleges FET colleges and HET institutions so that they teach relevant skills there are other avenues for training for those who are already employed in the sector for example skills programmes and learnerships There are 15 registered qualifications for the primary agriculture sub sectors Currently AgriSETA has 94 registered learnerships that can address the skills needs of the identified scarce skills These are captured in Appendix 2 AgriSETA has approved accredited a number of training providers across the country to deliver the theoretical and practical components of these learnerships These include agricultural colleges FET colleges and private providers Currently the AgriSETA has 246 registered and approved providers distributed nationally as follows
AgriSETA June 2010
Table 29 AgriSETA approved training providers (2010) Province Number of providers
Gauteng 72
(29)
KwaZulu Natal 20
(8)
Limpopo 35
(14)
North West 30
(12)
Northern Cape 3
(1)
Free State 15
(6)
Mpumalanga 14
(6)
Western Cape 26
(11)
Eastern Cape 31
(13) Total 246
The providers are small to large organisations In primary agriculture small providers appear to offer the most training in rural areas and community projects (AgriSETA 2010) Most of the operating providers will be in FET colleges and agricultural colleges The AgriSETA is unable to meet the total demands for skills across the duality of their sector There seems to be fairness in the approval of training for both permanent and casual and seasonal workers In 200809 the AgriSETA approved 559 learnerships as follows
Table 30 AgriSETA learnerships approved for grant purposes (2008‐2009)
Source AgriSETA learnership data analysis
Agriculture Sector Analysis 43
AgriSETA June 2010
Agriculture Sector Analysis 44
Provision of skills programmes in the same year attracted grants for 2 706 employees
Table 31 Participation by learners in skills programmes in the AgriSETA (200809)
Source AgriSETA Skills programmes data analysis
AgriSETA June 2010
APPENDIX 1 Skills demand in the Department of Agriculture Forestry amp Fisheries (200809)
Source DAFF Annual Report 2008‐20009
Agriculture Sector Analysis 45
AgriSETA June 2010
Agriculture Sector Analysis 46
Appendix 2 AgriSETA registered learnerships Registered Learnership NQF Level SAQA Registration NoLearnership in Agri Sales and Service 4 22 Q 220001 20 178 4Learnership Agricultural Machinery Technician 2 22 Q 220007 20 160 2Learnership in Specialist Agricultural Machinery Technician 5 22 Q 220009 21 258 5Agri Trade Processes 2 22 Q 220013 30 125 2FETC Meat Examination Applying Basic Business Principles 4 30 Q 3000 2823 164 4Further Education and Training Certificate Seed Marketing Execute Seed Trials 4 22 Q 220025 21 126 4Further Education and Training Certificate Seed Research and Development Certify as Seed Unit 4 22 Q 220027 21 121 4FETC Seed Research and Development Conduct a Field Inspection of a Seed Unit 4 22 Q 220028 20 120 4Seed Research and Development Operations Operate in a Team 3 22 Q 220020 22 121 3Seed Research and Development Operations Apply Basic Business Principles 3 22 Q 220021 22 121 3National Certificate Seed Processing and Packaging Operate in a Team 3 22 Q 220026 21 123 3Sugar Industry Technical Maintenance worker 2 22 Q 220011 39 128 2National Certificate Sugar Manufacturing and Refining Technical Maintenance 3 30 Q300003 23 146 3Further Education and Training Certificate Manufacturing Technical MaintenanceProduce Components by Performing Engineering Turning Operations
4 30 Q 3000 1321 173 4
FETC Manufacturing Technical Maintenance Produce Components by Performing Milling Operations 4 30 Q 3000 1521 173 4 FETC Manufacturing Technical Maintenance Develop and Fabricate from Complex Drawing 4 30 Q 3000 1420 173 4National Certificate in Sugar Technology 5 22 Q 220036 22 140 5Further Education and Training Certificate Sugar Processing 4 22 Q 220035 31 144 4National Certificate in Sugar Technology Processing Sugar Refining 2 22 Q 220037 28 124 2National Certificate in Sugar Technology Processing Juice Preparation 2 22 Q 220038 28 124 2National Certificate in Sugar Technology Processing Crystallisation 2 22 Q 220039 27 122 2National Certificate in Sugar Technology Processing Laboratory Practice 2 22 Q 220040 25 124 2National Certificate in Sugar Technology Processing Extraction 2 22 Q 220041 28 122 2NC Rooibos Production Applying Basic Business Principles 2 30 Q 3000 2427 130 2 NC Rooibos Processing Applying Basic Business Principles 2 30 Q 3000 2224 123 2 National Certificate Cigarette Production 3 22 Q 220046 23 121 3
AgriSETA June 2010
REFERENCES AgriSETA 2010 AgriSETA 20082009 Annual report Pretoria AgriSETA Agricultural Research Council httpwwwarcagriczahomeasppid=272 Avert South African HIV and AIDS statistics Available on httpwwwavertorgsafricastatshtm Centre for Development Enterprise 2008 Land reform in South Africa Getting back on track CDE Research No 16 DAFF 2010 Quarterly economic review of the agriculture sector Pretoria DAFF DAFF 2009 Annual report 20082009 Pretoria DAFF Department of Agriculture 2008 Strategic plan 2008 Pretoria Department of Agriculture DTI An introduction to the South African economy Available on httpwwwthedtigovzapublicationsagroprocessinghtm Eastern Cape Provincial Government Eastern Cape Provincial Growth and Development Strategy 2004 ndash 2014 Economic Commission for Africa 2009 Developing African agriculture through regional value chains Addis Ababa Economic Commission for Africa Economic Report Free State Province 2005 Provincial Growth and Development Strategy 2005 ndash 2014 GCIS 2010 SA Yearbook 200910rdquo Agriculture forestry and fisheries Pretoria GCIS Greenberg S 2010 Status report on land and agricultural policy in South Africa 2010 Institute for Poverty Land and Agrarian Studies School of Government University of the Western Cape Research report Ingelozi Management Solutions 2008 HIVAIDS in the South African agricultural sector Towards the development of a long term intervention Research report KwaZulu Natal Provincial Government 2006 KwaZulu Natal Provincial Growth and Development Strategy Limpopo Provincial Government Growth and Development Strategy 2004 ndash 2014 Mhone G (2000) Enclavity and Constrained Labour Absorbtive Capacity in Southern African Countries Geneva International Labour Office Moyo S The Agrarian question and the developmental state in South Africa In Edigheji O et al 2010 Constructing a democratic developmental state in South Africa HSRC PRESS
Agriculture Sector Analysis 47
AgriSETA
Agriculture Sector Analysis
National Treasury Republic of South Africa 2010 National Budget 2010 ndash National Budget Review 2010 Pretoria National Treasury Northern Cape Provincial Government Agriculture and agro‐processing sector strategy North West Provincial Government North West Provincial Growth and Development Strategy 2004 ndash 2014 Province of the Western Cape 2008 The Ikapa growth and development strategy White Paper SABCOHA SA Business Coalition on HIV and AIDS wwwsabcohaorg SACAU httpwwwsacauorghostingsacauSacauWebnsfHomehtmOpenForm South African Government 2010 20102011 ndash 20122013 Industrial Policy Action Plan Republic of South Africa Statistics South Africa 2005 Census of commercial agriculture 2002 Report No 110201 Pretoria Statistics South Africa Statistics South Africa 2009 Census of commercial agriculture 2007 Statistical release P1101 Pretoria Statistics South Africa Statistics South Africa 2010 General household survey 2009 Statistical release P0318 Pretoria Statistics South Africa Statistics South Africa 2010 Gross domestic product first quarter 2010 Statistical release P0441 Pretoria Statistics South Africa Statistics South Africa 2010 Quarterly labour force survey Quarter 1 2010 Statistical release P0211 Pretoria Statistics South Africa Vink N amp van Rooyen J 2009 The economic performance of agriculture in South Africa since 1994 The implications for food security Pretoria DBSA development planning division working paper series No 17 Webster E 2004 the Dual Economy from a book by Van Holdt K and Webster E Work restructuring and the Crisis of Social reproduction and 10 years of restructuring post apartheid workplaces University of Natal Press Workinfocom httpwwwworkinfocomfreesub_for_legresdatalraempassoc3htm Xingwana L 2008 Challenges and Opportunities for Land and Agrarian Reform towards 2025 Speech delivered at the Agri‐Consultation Protea Ranch Hotel Polokwane 30 July 2008
- Table of contents
- SECTION 1 THE AGRICULTURAL LANDSCAPE
- 11 Size and shape of the Agricultural sector
-
- Overview
- Distribution of agricultural production
- The structure of the agriculture sector in South Africa
- Categories of farming enterprises
- Employment trends
- Employment categories and remuneration
- Stakeholders in the Agricultural sector
-
- National government departments
- Sector representatives
-
- 12 Factors impacting development in the Agriculture sector
-
- Future sector economic growth and development
-
- South African sector growth plans (IPAP2)
- International Trade
- Global recession and rise in food prices
-
- Land reform
- Reliance on imports
- Water
- The labour market
- Consumer trends
- HIVAIDS
- Farm safety and security
- Broad-based Black Economic Empowerment
-
- Conclusions and scenarios
- SECTION 2 DEMAND FOR SKILLS
-
- AgriSETA registered employers and employee coverage
- Employee coverage in the AgriSETA
-
- 21 Skills demand
-
- The National Education and Training Strategy for Agriculture (AET Strategy)
- AGRISETA sector skills planning demand data (2008-2009)
- AgriSETA WSP analyses
-
- Skills demand in the commercial agricultural sector
-
- Skills demand forecasting by AgriSETA
- Research needs going forward
-
- SECTION 3 Skills Gaps and scarce skills
-
- Scarce skills at the DAFF
- Scarce skills in the commercial sector
- Supply of skills
-
- APPENDIX 1 Skills demand in the Department of Agriculture Forestry amp Fisheries (200809)
- Appendix 2 AgriSETA registered learnerships
-
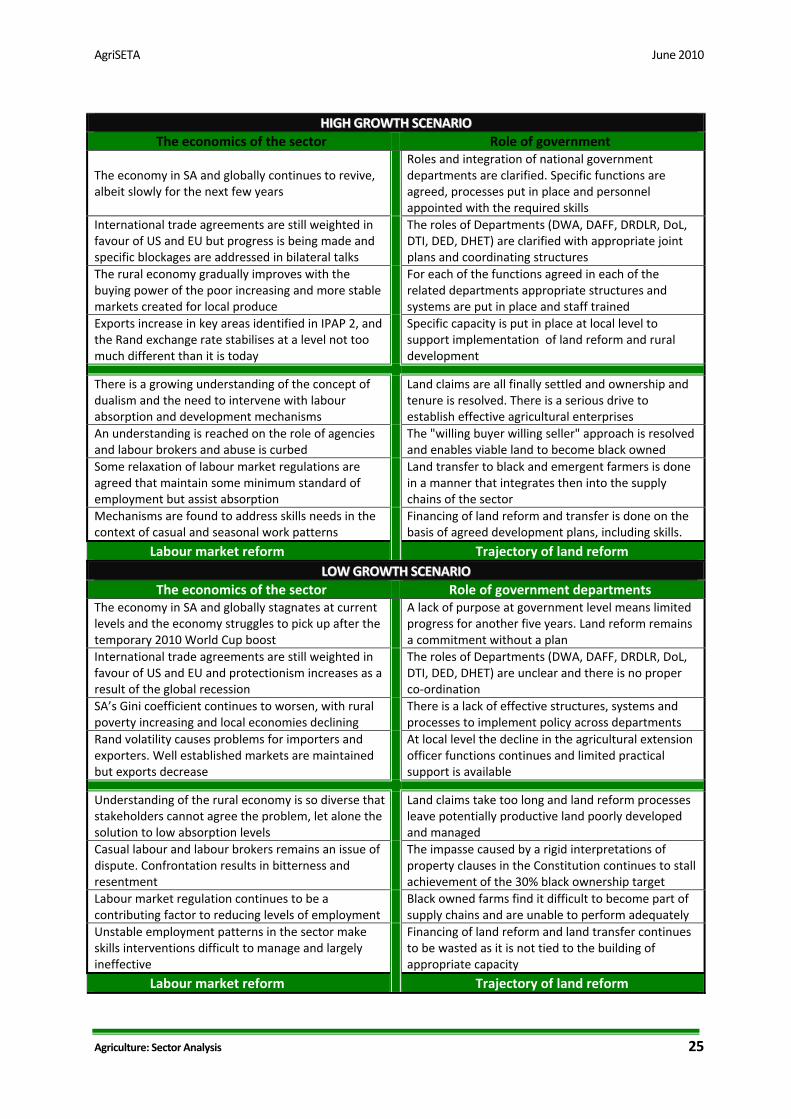
AgriSETA June 2010
Agriculture Sector Analysis 25
HHIIGGHH GGRROOWWTTHH SSCCEENNAARRIIOO
The economics of the sector Role of government
The economy in SA and globally continues to revive albeit slowly for the next few years
Roles and integration of national government departments are clarified Specific functions are agreed processes put in place and personnel appointed with the required skills
International trade agreements are still weighted infavour of US and EU but progress is being made and specific blockages are addressed in bilateral talks
The roles of Departments (DWA DAFF DRDLR DoL DTI DED DHET) are clarified with appropriate joint plans and coordinating structures
The rural economy gradually improves with the buying power of the poor increasing and more stable markets created for local produce
For each of the functions agreed in each of the related departments appropriate structures and systems are put in place and staff trained
Exports increase in key areas identified in IPAP 2 and the Rand exchange rate stabilises at a level not too much different than it is today
Specific capacity is put in place at local level to support implementation of land reform and rural development
There is a growing understanding of the concept of dualism and the need to intervene with labour absorption and development mechanisms
Land claims are all finally settled and ownership and tenure is resolved There is a serious drive to establish effective agricultural enterprises
An understanding is reached on the role of agencies and labour brokers and abuse is curbed
The willing buyer willing seller approach is resolved and enables viable land to become black owned
Some relaxation of labour market regulations are agreed that maintain some minimum standard of employment but assist absorption
Land transfer to black and emergent farmers is done in a manner that integrates then into the supply chains of the sector
Mechanisms are found to address skills needs in the context of casual and seasonal work patterns
Financing of land reform and transfer is done on the basis of agreed development plans including skills
Labour market reform Trajectory of land reform LLOOWW GGRROOWWTTHH SSCCEENNAARRIIOO
The economics of the sector Role of government departments The economy in SA and globally stagnates at current levels and the economy struggles to pick up after the temporary 2010 World Cup boost
A lack of purpose at government level means limited progress for another five years Land reform remains a commitment without a plan
International trade agreements are still weighted infavour of US and EU and protectionism increases as a result of the global recession
The roles of Departments (DWA DAFF DRDLR DoL DTI DED DHET) are unclear and there is no proper co‐ordination
SArsquos Gini coefficient continues to worsen with rural poverty increasing and local economies declining
There is a lack of effective structures systems and processes to implement policy across departments
Rand volatility causes problems for importers and exporters Well established markets are maintained but exports decrease
At local level the decline in the agricultural extension officer functions continues and limited practical support is available
Understanding of the rural economy is so diverse that stakeholders cannot agree the problem let alone the solution to low absorption levels
Land claims take too long and land reform processes leave potentially productive land poorly developed and managed
Casual labour and labour brokers remains an issue of dispute Confrontation results in bitterness and resentment
The impasse caused by a rigid interpretations of property clauses in the Constitution continues to stall achievement of the 30 black ownership target
Labour market regulation continues to be a contributing factor to reducing levels of employment
Black owned farms find it difficult to become part of supply chains and are unable to perform adequately
Unstable employment patterns in the sector make skills interventions difficult to manage and largely ineffective
Financing of land reform and land transfer continues to be wasted as it is not tied to the building of appropriate capacity
Labour market reform Trajectory of land reform
AgriSETA June 2010
These analyses can be translated into four potential growth and development scenarios for the agricultural sector which are based on the requirements for a strong development state Scenario 3 Weak government support
and sound economy
Econ
omic fa
ctors glob
ally n
ationa
lly and
locally
Scenario 1 Integrated government support and sound economy
The economic upturn triggered by the World Cup continues and globally things improve enabling an expansion of exports The government because of a lack of integrated policy planning and implementation provides limited support for sector development The gains go to the well established enterprise owners with few gains for emerging farmers and local communities
Government departments coordinate their efforts to achieve maximum impact There are favourable economic conditions that create opportunities for advance Within this positive environment the role of the AgriSETA becomes a central component of a comprehensive strategy for growth and skills interventions are targeted to achieve maximum effect Results in growth in sustainable enterprises and expanded employment opportunities
Government policy and support Government policy and support
Combination of disjointed government policy planning and a weak and increasingly marginalised rural economy Economic conditions result in unsustainable farming conditions and employment declines along with productivity Food shortages and the lack of development in rural areas leading to increasing social tensions A vicious cycle develops with the sector going into long term decline
Government departments coordinate their efforts to achieve maximum impact However economic conditions hamper progress Efforts by the AgriSETA are undermined by poor labour absorption and job insecurity Some significant successes are recorded including some NSF funded projects that result in sustainable enterprises A platform is laid for future improvements when the economic conditions improve
Scenario 4 Weak state and economy Scenario 2 Strong state but weak
economy
Agriculture Sector Analysis 26
AgriSETA June 2010
Agriculture Sector Analysis 27
SECTION 2 DEMAND FOR SKILLS
AgriSETA registered employers and employee coverage
In 2009 17 234 employers were registered with the AgriSETA comprising 15 394 small employers (less than 50 employees) 1 202 medium sized employers (50 ‐ 149 employees) and 638 large employers (more than 150 employees)
Considering that there are around 40000 commercial farms33 the 17 234 employers represent around 43 of commercial farms Notwithstanding changes in the sector as a result of land reform and sector shrinkage this is a sizable proportion and is held to be sufficiently representative for the purpose of skills development planning However this paints an incomplete picture It understates the representative nature of large enterprise registered with the SETA and overstates the representative nature of small registered enterprises 4 175 (242) of the enterprises are levy paying members Further only 1 673 (11) workplace skills plans (WSPs) were submitted
Table 16 Registered employers by size and sub‐sector Sub‐sector Description
Employers Small Medium Large
CoffeeTea Processing and marketing of coffee and tea including coconuts cocoa nuts olives dates etc
33 4 3
Fibre Grading ginning packing of wool and cotton raw material 1 676 16 18
Fruit Fruit packed in cartons fruit juice concentrate drummed and fruit juice in container ready for consumption
271 36 57
Fruit exporters and importers 6 0 1
Grain
Manufacture of grain mill products and starches 119 5 7Handling and storage of grain 67 7 23Wholesale amp retail trade in Agricultural machinery 213 9 4Sale and distribution of Agricultural raw materials and other farming inputs
182 9 3
Milling
Manufacture of flour and grain mill products including rice and vegetable milling grain mill residues
120 15 11
Manufacture of prepared animal feeds 110 19 0Manufacture of pet foods 42 9 0Manufacture of starches and starch products 7 1 1
Pest control
Pest Control 209 4 0
Poultry Poultry and egg production including the slaughtering dressing and packing of poultry
305 49 37
Primary
Growing of Cereals and other crops (not elsewhere classified) 902 160 34Growing of Vegetables Horticultural specialties nursery products
943 120 72
Growing of Vegetables Horticultural specialties (Including Ornamental Horticulture) and nursery products
11 5 0
Sugar plantation including sugar cane and sugar beet etc 9 4 2
33 SARS statistics 2007
AgriSETA June 2010
Agriculture Sector Analysis 28
Sub‐ Description Employers Growing of fruit nuts beverage and spice crops 1795 255 143Farming of cattle sheep goats horses asses mules and hinnies Dairy farming
2 252 59 18
Other animal farming production of animal products (NEC) 433 25 12Ostrich farming 5 0 0Game farming 16 0 0Growing of crops combined with farming of animals (Mixed farming)
2 920 256 109
Growing of coffee and tea including coconuts cocoa nuts olives dates etc
2 0 0
Agricultural and animal husbandry services except veterinary activities
438 22 9
Other animal farming (not elsewhere classified) 11 1 1Growing of trees as second crop by farmers 126 18 4Fishing operation of fish hatcheries and fish farm 913 10 6
Red meat
Production and animal products (not elsewhere classified) 6 0 0Slaughtering dressing and packing of livestock including poultry and small game for meat
317 40 17
Production sale amp marketing of Agricultural by products (eg bones hides)
61 2 0
Slaughtering dressing and packing of livestock including small game for meat and processing of ostrich products
2 1 0
Wholesale trade in Agricultural raw materials and livestock 193 7 10Transport of livestock as supporting activity 224 0 0Agricultural and livestock research 215 9 3
Seed Seed production and marketing 149 12 6
Sugar Manufacture of sugar including golden syrup and castor sugar
45 5 21
Tobacco Processing and dispatching of tobacco 46 8 6 TOTALS 15 394 1 202 638Source AgriSETA WSP data
The largest number of registered small and medium enterprises are found in the mixed farming sub‐sector while most large enterprises are in the growing of fruit nuts beverage and spice crops sub‐sector
Employee coverage in the AgriSETA
Collectively the 17 234 employers registered with AgriSETA employed a total of 239 076 employees This represents 39 of the agricultural labour force in 2009 The 1 673 employers who submitted WSPs in 2009 employed 97 898 employees representing 41 of the total number of people employed by registered employers While the number of registered employers submitting WSPs is small (11) they employ a sizeable number of employees and the percentage of employees provides a statistically significant sample The data for larger enterprises is statistically much more representative than that for small enterprises
AgriSETA June 2010
Table 17 Number of employees of registered employers by sub‐sector
Sub‐sector
Sub‐sector description Employees
CoffeeTea Processing and marketing of coffee and tea including coconuts cocoa nuts olives dates etc
483
Fibre Grading ginning and packing of wool and cotton raw material 6 539
Fruit Fruit packed in cartons fruit juice concentrate drummed and fruit juice in container ready for consumption
27 661
Fruit exporters and importers 212
Grain
Manufacture of grain mill products and starches 133Handling and storage of grain 18 303Wholesale amp retail trade in Agricultural machinery 795Sale and distribution of Agricultural raw materials and other farming inputs 2 898
Milling
Manufacture of flour and grain mill products including rice and vegetable milling grain mill residues
3 634
Manufacture of prepared animal feeds 731Manufacture of pet foods 160Manufacture of starches and starch products 105
Pest control
Pest Control 119
Poultry Poultry and egg production including the slaughtering dressing and packing of poultry
19 187
Primary
Growing of Cereals and other crops (not elsewhere classified) 10 104Growing of Vegetables Horticultural specialties and nursery products 37 799Growing of Vegetables Horticultural specialties (Including Ornamental Horticulture) and nursery products
195
Sugar plantation including sugar cane and sugar beet etc 220Growing of fruit nuts beverage and spice crops 47 043Farming of cattle sheep goats horses asses mules hinnies Dairy farming
3 382
Other animal farming production of animal products (NEC) 4 203Ostrich farming 0Game farming 0Growing of crops combined with farming of animals (Mixed farming) 28 722Growing of coffee amp tea including coconuts cocoa nuts olives dates etc 0Agricultural and animal husbandry services except veterinary activities 970Other animal farming (not elsewhere classified) 513Growing of trees as second crop by farmers 1 294Fishing operation of fish hatcheries and fish farm 1 589
Red meat
Production and animal products (not elsewhere classified) 0Slaughtering dressing and packing of livestock including poultry and small game for meat
5 128
Production sale amp marketing of Agricultural by products (eg bones hides) 116Slaughtering dressing and packing of livestock including small game for meat and processing of ostrich products
0
Wholesale trade in Agricultural raw materials and livestock 1 697Transport of livestock as supporting activity 0Agricultural and livestock research 534
Seed Seed production and marketing 2 127Sugar Manufacture of sugar including golden syrup and castor sugar 10 478Tobacco Processing and dispatching of tobacco 2 002 Total 239 076
Agriculture Sector Analysis 29
AgriSETA June 2010
Agriculture Sector Analysis 30
Source AgriSETA WSP data
According to the WSP analysis the sub‐sector for the growing of fruit nuts beverage and spice crops employed the largest number of people In six sub‐sectors there are employers who do not employ workers These are probably family based organisations where family members help in the business without drawing a salary These are in transport and livestock research slaughtering dressing and packing of livestock including poultry and small game for meat growing of coffee and tea including coconuts cocoa nuts olives dates etc ostrich farming and game farming
Table 18 Employee distribution by province Province Employees Percentage
Eastern Cape 18 844 192 Free State 1 946 20 Gauteng 2 788 28 KwaZulu‐Natal 5 416 55 Mpumalanga 8 062 82 North West 3 290 34 Northern Cape 5 436 56 Limpopo 1 730 18 Western Cape 50 386 515 Grand Total 97 898
Source AgriSETA WSP data
Of those submitting WSPs registered employers in the Western Cape employed the largest number of people while employers in Limpopo employed the least number of employees Free State has a small number of employees covered by WSPs submitted to the SETA whereas Eastern Cape with a relatively small number of registered farms has a very large number of employees on farms submitting WSPs Given this variance between provinces the use of WSP data for extrapolation purposes must be viewed cautiously
2009 WSP equity information was only provided for about a quarter of employees (25 637 or26)34 No information was available from the WSPs on non‐South Africans working on commercial farms
Table 19 Equity profile from 2009 WSP data African Coloured Indian White
Totals M F D M F D M F D M F D
8 040 5 785 38 5 097 5 228 24 22 25 0 811 556 11
580 417 03 493 505 02 468 532 00 589 403 08 13 863 10 349 47 1 378 25 637541 404 02 54 100
Total EquityTotal Male Total Female Total Disability
13 970 11 594 73 545 452 03
Source AgriSETA WSP data
Using currently available data it is not possible to provide disaggregated employment data by sub‐sector This will require a small change in the way that gender race and disability data is
34 Some employers did not complete race and gender information when giving their employment profiles
AgriSETA June 2010
codified during WSP data‐capturing including allocation by sub‐sector What can be stated is that employment of males is more dominant than that of women and more Africans are employed in the sector than other groups Employment of people with disabilities is below 1
21 Skills demand
The National Education and Training Strategy for Agriculture (AET Strategy)
The AET Strategy developed by the Department of Agriculture Fisheries and Forestry (in consultation with various key stakeholders in the agricultural sector) highlights priority skills needs and constraints within the sector and categorises needs within the following 5 broad areas
1 Agricultural production ndash requesting that the past focus on a narrow band of commodities (relevant mainly to the commercial sector) and related research be expanded to address the needs of small‐scale and subsistence farmers (eg more focus on mixed farming and rural livelihood sustainability skills)
2 Agricultural engineering ndash with specific focus to be placed on technologies suitable for small‐scale farmers (eg relevant and post‐harvesting techniques related to processing and storage of produce) ndash to address this need the scarcity of agricultural engineers requires attention
3 Agricultural economics ndash a critical need was identified for general agricultural economic skills (ranging spectrum of farm planning farm management enterprise management marketing finance etc) ndash with the need to training both farmers and extension officers in such fields
4 Agricultural development ndash a specific need was identified to develop agricultural extensionists in supporting especially emerging and small‐scale farmers over the full spectrum (a need exists for both new curriculum in the training of new extensionists and the re‐training and upgrading of existing officers)
5 Veterinarians ndash the need to develop state veterinarians in order for the state to perform its role and function (particularly in its preventative monitoring and regulatory role and function)
AGRISETA sector skills planning demand data (2008‐2009)
The following section reflects initial research on skills demand in the Agricultural sector arising from the sector analysis (section 1) previous AGRISETA skills demand research for Sector Skills Planning during 2005‐2009 and analysis of WSP data from 2009 With the introduction of the Organising Framework of Occupations and agreement on definitions for scarce and critical skills in 200506 the AGRISETA undertook an extensive research and consultation processes to determine skills development priorities for the sector The research methodology employed was based on the a four dimensional topology for establishing and evaluating skills needs illustrated in the figure below
Agriculture Sector Analysis 31
AgriSETA June 2010
Agriculture Sector Analysis 32
The identification and prioritisation of skills needs was also undertaken from a key stakeholder and beneficiary perspective Consideration was given to needs of the following groups
bull The unemployed ndash helping them gain andor regain entry to the labour market bull The economically inactive ndash helping them to become economically active bull School leavers ndash helping them gain access to further education and training opportunities
and thus facilitating their entry to the job market bull Entrants to the job market ndash facilitating employment and integration into the work culture
and work ethic (improving the employability of an individual) bull Those currently employed in the sector ndash increasing their competency and opportunities
for advancement creating a career path and offering continued job security enhancement of value adding to the sector improving their prospects for better employment opportunities
bull Organisations and enterprises within the sector ndash making sure that skills development and knowledge creation occurs in such a way as to improve the sectorrsquos viability and allowing companiesenterprises to become more sustainable and profitable along the way improving productivity competitiveness and innovation within organisations
In organising and reporting the identified priority skills development needs (200809) the following structuring approach was followed
Tier 1 The four categories of needs as per the Topology presented above were used for the identification evaluation and grouping of needs
Pay conditions
Image
RECRUITMENT DIFFICULTY
SKILLSGAP
SKILLSSHORTAGE
LABOURSHORTAGE
Firms experience difficulty recruiting This does not necessary imply a skills shortage ndash may indicate a poor image remuneration etc
Those currently in work do not have the requisite skills set to carry out their job to an optimum standard
Required skills are in short supply when compared with the demand across the whole labour market
Regardless of skills levels a situation exists where there is simply not enough supply of labour to meet demand
Pay conditions
Image
RECRUITMENT DIFFICULTY
SKILLSGAP
SKILLSSHORTAGE
LABOURSHORTAGE
Firms experience difficulty recruiting This does not necessary imply a skills shortage ndash may indicate a poor image remuneration etc
Those currently in work do not have the requisite skills set to carry out their job to an optimum standard
Required skills are in short supply when compared with the demand across the whole labour market
Regardless of skills levels a situation exists where there is simply not enough supply of labour to meet demand
Figure 4 Topology for identifying skills development priorities
Source AGRISETA SSP Annual Update August 2009
AgriSETA June 2010
Tier 2 Within each of the first tier groupings needs were further broken down and organised per target group At this second level needs were grouped by
o General skills development needs (cross‐cutting over different target groups) o Needs experienced by small scale farmers (this group included subsistence
farmers new emerging land reform beneficiaries and small‐scale AgriBEE farmers) o Needs within the commercial agricultural sector (per sub‐sector groupings where
specific needs for such were identified ndash both on‐farm needs and within the secondary sub‐sector or related agri‐businesses)
o Needs of the Department of Agriculture Fisheries and Forestry (DAFF) To further guide and direct the identification and selection of scarce and critical skills the following factors or criteria that could reflect the importance (impact and effect) of a skills shortages were developed as an identification framework
1 Basic Skills Development Promoting basic literacy and numeracy and raising the base level of education for the sector improving the work and livelihood of existing workers
2 Employability Making the employee more employable by improving the fit between their skills and the sector needs
3 Enterprise Viability Improving the capability and feasibility of the enterprise by increasing its effectiveness of or possibilities for profit generation etc
4 Enterprise Sustainability Allow enterprises to survive and grow over an extended period of time without compromising the value of renewable resources thereby creating long‐term meaningful employment for larger numbers of people
5 Sector Growth Enabling the sector to develop or pursue new opportunities or improve the effectiveness of current operations
6 Sector Competitiveness Enabling the sector to compete more effectively in the international arena improving market intelligence and interpretation productivity cost efficiency etc
7 Human Resource Development Capacity Improving the access to quality provision of training to the agri sector
Based on this research and consultation framework the following skills development needs and priorities were identified
Agriculture Sector Analysis 33
AgriSETA June 2010
GENERAL NEEDS SMALL‐SCALE FARMER
NEEDS COMMERCIAL SECTOR
NEEDS DAFF NEEDS
RECRUITMENT RELATED SKILLS NEEDS Primary agriculture is the entry point into the world of work for large numbers of people in rural areas However the sector has negative connotations amongst sections of the youth and in parts of the country and is viewed as a last resort for some in the search for employment) The effect is that despite an unemployment rate of approximately 26 (now over 30) farmers find it difficult to recruit workers to meet seasonal demands This has resulted in the government approving the contracting of foreign labour to meet such temporary needs (workers are recruited mainly from Zimbabwe and Mozambique)
Labour in this farming sector is provided primarily by family members and no real recruitment constraints can be identified
The agricultural sector still manages to attract technical and management skills as it is perceived to include a better lifestyle and there is a strong tradition of agriculture in SA Increasing crime related security risks associated with farming may have a negative impact
The Department has identified a number of occupations in which they are experiencing long‐term vacancies Some of these result from a general shortage of such skills in SA while others arise from the inability of the public sector to compete with the private sector (less favourable employment image working conditions and equity considerations) Priority vacancies include Veterinarians Agricultural
Engineers Plant Health
Specialists Agricultural
Statisticians Plant Health Pest Risk
Analysts ICT Specialists Agricultural
Economists Agricultural Food and
Quarantine Technicians
Agro‐meteorologists Pasture Scientists Plant Production
Specialists Specialised Food
Analysts SKILLS GAPS RELATED NEEDS
bull Low literacy and numeracy levels ndash both amongst workers within the sector at large and at ownermanager level in many of the small‐scale farming
bull Farm management
Farm Management (Mainly owners managers) bull Farm management amp
entrepreneurship bull Resource
management and record keeping
bull Financial planning
A critical constraint is the poor educational levels of a large proportion of the labour force in the sector demanding a considerable effort and investment in ABET and other life skills
A particularly big need exists for skills upgrading amongst Extension Officers ndash particularly with regard to redress the historical neglect of small‐scale farmers and resource strapped farmers
Agriculture Sector Analysis 34
AgriSETA June 2010
Agriculture Sector Analysis 35
GENERAL NEEDS SMALL‐SCALE FARMER
NEEDS COMMERCIAL SECTOR
NEEDS DAFF NEEDS
skills (and general management skills in other agricultural businesses) coupled with a business orientation and entrepreneurship skills
bull A general need to increase compliance with environmental occupational health and safety animal welfare produce safety and hygiene standards regulations and requirements (local and international standards)
and management bull Project management bull Business plan
development Marketing and processing bull Processing and
packaging bull Transport
management bull Marketing produce
including branding bull Planning for
marketing bull Knowledge of
markets Technical knowledge and skills bull Production
management (related to specific enterprise)
bull Demonstration of production techniques
bull Natural resources management
Mechanical knowledge bull Farm maintenance bull Repairs of machinery
and equipment bull Electrical
maintenance and installation
programmes Need for improved management skills and relevant technological knowledge for increasing productivity levels and improved production methods Rising importance for environmentally responsible production and processing management systems Rising competitive and international markets increases need for business and marketing abilities among owners and managers Increasing requirements for compliance with environmental health and safety and international trade standards Information technology although not a priority is increasing in importance Business management ability is becoming increasingly important as more farmers are making decisions about restructuring their businesses diversification and developing supplementary sources of income
Critically improved farm management and business skills within an agricultural context to support the majority of BEE and emerging farmers Skills upgrading requirements for existing Extension Officers include bull Agricultural
economics bull Agricultural
management bull Business and
financial management
bull Technical and production related skills including o Animal husbandryo Poultry o Crop production o Horticulture
SKILLS SHORTAGES Generally SA has a shortage of entrepreneurs and people who have the business acumen drive motivation and
The profile of these farmers reflects a large contingent of older and less educated people who are generally less flexible tend to stick to
The commercial agri sector will increasingly have to compete in the global market and the ever increasing need to increase productivity to
DAFF us experiencing problems are especially sourcing people in specialised science related fields (learning fields experiencing few
AgriSETA June 2010
Agriculture Sector Analysis 36
GENERAL NEEDS SMALL‐SCALE FARMER
NEEDS COMMERCIAL SECTOR
NEEDS DAFF NEEDS
perseverance to become a successful farmer Given the high risks involved in the agricultural sector (natural elements outside onersquos control) the agri sector does not compete successfully for this ldquoscarce resourcerdquo Moreover as with other professional and skilled occupations there is a tendency for younger qualified people to move to urban areas
known practices and are less likely to experiment with new technology Within this target group candidates with good entrepreneurial ability are scarce There is a perceived shortage of Agricultural Extensionists and advisors to assist this target group However a large pool of young unemployed graduates exists who could assist such emerging farmers if they were mobilised and made accessible to farmers Similarly the potential pool of retired commercial farmers who could serve as mentors to this target group
remain profitable and viable it can be stated that many of the existing farmers and managers owners lack business management and entrepreneurial orientation Equity policy and the need to become BEE compliant requires that commercial enterprises appoint and develop black owners directors managers Changing local and global consumer preferences require farmers to change traditional farming methods and practices Skills and knowledge requirements include bull Global food and
international quality standards
bull Product traceability requirements
bull Organic produce and products
Specific occupations identified as being in short supply are
bull Production Managers (food processing)
bull Product specialisation to international specifications (research skills)
bull Forklift drivers heavy vehicletruck drivers and mobile plant operators
bull Experienced and competent artisans (millwrights electricians fitters
enrolments andor pass rates at HET institutions with the result that too few qualified persons come onto the labour market) Examples of such skills shortages identified by the Department include Agricultural Engineers bull Plant Health
Specialists (Nematology Entomology Plant Pathology)
bull Statisticians (specialised agricultural knowledge)
bull Plant Health Pest Risk Analysts
bull Agricultural Economists (production and resource economists)
bull Agricultural Food and Quarantine Technicians
bull Agro‐meteorologists Early warning Specialists
bull Pasture Scientists bull Plant Production
Specialists (eg ornamental crops hydroponics)
bull Specialised Food Analysts (pesticide residue analysts processed food and dairy analysts wine and spirit analysts)
AgriSETA June 2010
Agriculture Sector Analysis 37
GENERAL NEEDS SMALL‐SCALE FARMER
NEEDS COMMERCIAL SECTOR
NEEDS DAFF NEEDS
and turners bull Agricultural
Equipment Technicians
bull Pest and weed controllers
bull Horticultural specialists
LABOUR SHORTAGES AND RELATED SKILLS NEEDS Given an employment rate of some 26 (2009 currently estimated at over 30expanded definition) per definition there cannot be a labour shortage It is however difficult for people who have never worked before to integrate into the agricultural sector workforce Coupled with an aging workforce (30‐60 being over 40) means that most agri enterprises will within the next 5‐10 years be looking at replacing a large proportion of their workforce There could be an insufficient pool of people willing and able to participate The impact of HIVAIDS is also not always factored in to understanding the diminishing pool of resources available Labour shortages have been reported within selected geographical areas and in particular occupations Examples include cane cutters in the sugar industry chicken catchers in the poultry industry pickers in the fruit industry and animal handlers in feedlots as well as dairy parlour workers It is however believed that these shortages may reflect a recruitment problem as a result of the very harsh working conditions and the relatively poor remuneration (which makes these occupations unpopular) At present such ldquoshortagesrdquo are addressed through contracting labour from neighbouring countries
AgriSETA WSP analyses
Skills demand in the commercial agricultural sector
Information for demand for skills from WSP data is available for 1 673 employers who submitted their WSPs for the 200910 period The table below shows data on sub‐sector WSP submission relative to size of the sub‐sector as well as subsector data from all registered organisations and those who submitted WSPs Data for registered employers shows that there were 239 076 employees employed by the 17 234 registered organisations As previously stated 97 898 employees were employed by the organisations submitting WSPs This constitutes 41 of employees employed by registered organisations
Table 20 Employment and sub‐sector data drawn from WSP analyses
Sub‐sector
All Re
gistered
Employers
Small employers (0‐49)
Med
ium and
large
employers (50+)
Total W
SPs received
Total W
SPs received
as of
all registered em
ployers
WSP
received med
ium and
large orgs
WSPs received
as of
med
ium amp large em
ployers
WSPs received
small
employers
WSPs received
as of small
enterprises
EmployeesPer
Profile
CoffeeTea 40 33 7 9 23 5 71 4 12 483 Fibre 1 710 1 676 34 34 2 22 65 12 07 6 539
AgriSETA June 2010
Agriculture Sector Analysis 38
Sub‐sector
All Re
gistered
Employers
Small employers (0‐49)
Med
ium and
large
employers (50+)
Total W
SPs received
Total W
SPs received
as of
all registered em
ployers
WSP
received med
ium and
large orgs
WSPs received
as of
med
ium amp large em
ployers
WSPs received
small
employers
WSPs received
as of small
enterprises
EmployeesPer
Profile
Fruit 371 277 94 162 44 76 81 86 31 27 873 Grain 648 581 67 77 12 48 72 29 5 22 129 Milling 335 279 56 61 18 35 63 26 9 4 630 Pest Control 213 209 4 8 4 2 50 6 3 119 Poultry 391 305 86 66 17 46 53 20 7 19 187 Primary 12 121 10 776 1 345 1144 9 513 38 631 6 136 034 Red meat 1107 1 018 89 70 6 45 51 25 2 7 475 Seed 167 149 18 24 14 13 72 11 7 2 127 Sugar 71 45 26 13 18 10 38 3 7 10 478 Tobacco 60 46 14 5 8 3 21 2 4 2 002
Totals 17 234 15 394 1 840 1 673 10 818 44 855 16 239 076
Source 1 AgriSETA WSP 2009 data
Only 10 of all registered employers submitted WSPs for the 200910 period Of these 49 were medium and large sized employers and 51 small However only 16 small employers submitted their WSPs relative to the number of registered small employers and 44 medium and large employers submitted WSPs relative to the number of registered medium and large employers As such skills demand statistics provides more representative data on the requirements of medium and large employers Data for skills demand in the commercial agricultural sector is based on data for permanent employees as well as casual and seasonal employees
Skills demand forecasting by AgriSETA
Forecasting for skills demand the AgriSETA has estimated that the demand for skilled employees at different levels in the next few years is 510 686 This is based on WSP data analyses over the last 5 years and projected demand for the formal commercial agricultural sector and factoring in the demand that at maximum would result from completion of the land restitution programme in South Africa The table below reflects the skills that are on demand as well as the estimates for demand over the next five years by major occupational category35
35 AgriSETA 2010
AgriSETA June 2010
Table 21 Demand for skills by occupational category
Major Occupation (OFO)Estimated Demand
Group Title1 Managers (commercial and small emerging farmers) 264 3702 Professionals 4 1413 Technicians and Trade workers 8 9255 Clerical and administrative workers 8006 Sales workers 4007 Machinery operators and drivers 5 8008 Elementary workers 226 250
Total 510 686Source AgriSETA WSP data and SSP demand forecasts
Research needs going forward
As has been set out in the sector analysis and the scenarios derived from that analysis the sector is faced by both significant and profound change and also great uncertainty It therefore follows that the task of focussing limited resources (basically levy income in the formal sector and NSF funds for the emergent farming sector) is difficult Whilst the general thrust of training remains broadly as described in the 2006‐10 SSP Updates some considerable work is required to achieve targeted effective interventions during the 2011‐2016 period The following research questions will need to be addressed in preparing the next SSP
bull In relation to the managers and owner‐managers of commercial farms and enterprises what skills are needed to enable them to help bring about the more optimistic scenario and manage the risks associated with the less optimistic ones
bull In terms of professional and technical competencies do the current education and training institutions coupled with the learning programmes available through the AgriSETA (learnerships skills programmes and the like) meet the needs of the sector
bull In the emerging agricultural sector do the current programmes funded by sources external to the AgriSETA (eg NSF) meet all the identified needs What gaps are there and how should they be addressed
bull In relation to governmentrsquos growth strategy and industrial action plans what skills are required for developing the aquaculture sub‐sector What programmes are available How can the SETA support the skills needs for this sub‐sector
bull Given the increasing levels of casual and contract labour how can skills be developed to meet the needs of the formal commercial sector and the emerging enterprise sector
bull How can the demand in each of the priority areas be quantified and agreement be reached on numbers of people to be trained
Agriculture Sector Analysis 39
AgriSETA June 2010
SECTION 3 Skills Gaps and scarce skills
Scarce skills at the DAFF
The level of scarce skills at DAFF can be determined by the vacancy rate While the average vacancy rate in the department as at 31 March 2009 was 17 there were some posts that had very high vacancy rates as reflected in the table below Indicating the possibility that the Department is experiencing difficulties in finding suitable candidates in the South African labour market to fill these posts
Table 22 Scarce skill occupations and vacancy rates (DAFF March 2009) Critical occupations Number of posts Posts filled Vacancy rate ()
Agricultural animal oceanography forestry and other sciences
167 119 287
Engineering sciences related 2 1 50Engineers and related professions 13 6 538Farming forestry advisors and farm managers 11 4 636Finance and economics related 73 53 274Horticulturists foresters agricultural and forestry technicians
350 221 369
Legal related 6 4 333Mechanical engineering technicians 3 2 333Risk management and security services 6 4 333Social sciences related 1 0 100Veterinarians 34 24 294
Source DAFF Annual Report 20082009
Skills are also scarce at senior management level The department also reports on difficulties it has filling senior management services vacancies with some of them staying vacant for up to twelve months because no suitable candidates can be found The department would then resort to re‐advertisement and head hunting This was the case with 22 of 18 SMS posts in March 2009
Scarce skills in the commercial sector
The following occupations have previously been projected as scarce (extremely hard to fill vacancies) by AgriSETA in the commercial agricultural sector over the next five years
Table 23 Scarce and critical skills in the commercial agricultural sector
Occupation Code
Group Occupation Critical Skills Intervention Comments
139903 Managers Laboratory Manager
Technology AI nutrition
HET
221101 Professionals Accountant (General)
General HET
221102 Professionals Management Accountant
Farm financial management
HET Focus on support advice to farmers new enterprises
222101 Professionals Commodities Trader
Export administration supply chain
FET Learnership Skills
Agriculture Sector Analysis 40
AgriSETA June 2010
Agriculture Sector Analysis 41
Occupation Code
Group Occupation Critical Skills Intervention Comments
management Programme
224301 Professionals Economist Agricultural HET
Mainly for Department of Agriculture and para statals commodity organisations
233101 Professionals Chemical Engineer
Chemical processes in food production
HET Industries such as sugar processing
233301 Professionals Electrical Engineer
Installation and maintenance
HET Processing industry
233401 Professionals Electronics Engineer
Computerised production prosesses
HET Processing industry
233501 Professionals Industrial Engineer
Productivity and efficiency
HET Processing industry
233904 Professionals
Instrument Engineer (Defence Force)
Installation and maintenance
HET
Not for defence ‐ sugar industry
233502 Professionals Mechanical Engineer
FETHET Equity reasons
233902 Professionals Agricultural Engineer
Farm layout and infrastructure
HET Mainly in Government
311101 Technicians and trades workers
Agricultural Technician
Installation and maintenance
FETHET
234102 Professionals Agricultural Scientist
Agri research HETFET Especially in horticulture
234201 Professionals Chemist HET Processing industry
234202 Professionals Food Technologist
Food safety HACCP
FETHET Across sector
234701 Professionals Veterinarian HET Mainly in Government
311101 Technicians and trades workers
Agricultural Technician
Farm infrastructure
FET Mainly needed in government
311401 Technicians and trades workers
Chemistry Technician
FETHET EE reasons
312907 Technicians and trades workers
Chemical Engineering Technician
FET Learnership
Mainly EE reasons
312402 Technicians and trades workers
Electronic Engineering Technician
Weak stream production infra
FETHET Mainly tobacco industry
233904 Professionals
Instrument Engineer (Defence Force)
Instrument technician
FET
Occupation needed Instrument Technician (not defence force) Mainly sugar processing sector
321202 Technicians and trades workers
Diesel Motor Mechanic
FET Learnership
To include tractor mechanic
321204 Technicians and trades workers
Small Engine Mechanic
Agricultural equipment
FET Learnership
Throughout sector
AgriSETA June 2010
Agriculture Sector Analysis 42
Occupation Code
Group Occupation Critical Skills Intervention Comments
322301 Technicians and trades workers
Metal Fabricator
Artisan FET Learnership
322303 Technicians and trades workers
Welder Welder (First Class)
Artisan FET Learnership
323203 Technicians and trades workers
Fitter‐Welder Artisan FET Learnership
Mainly sugar ndash multi‐skilled
323202 Technicians and trades workers
Fitter And Turner
Artisan FET Learnership
Tobacco and sugar
323501 Technicians and trades workers
Millwright Artisan FET Learnership
Wide‐spread need
341101 Technicians and trades workers
Electrician (General)
Artisan FET Learnership
Wide‐spread need
342101 Technicians and trades workers
Air‐Conditioning And Refrigeration Mechanic
Artisan FET Learnership
Sugar pack houses cold chain
Source AgriSETA Sector Skills Plans
Supply of skills
South Africarsquos agriculture skills are produced in high schools agricultural colleges FET colleges and Higher Education institutions In high school a large cohort of learners take Agricultural Science as a subject In 2003 there were 42 Agricultural High Schools offering Agricultural Science as a subject These students and those in high schools taking the subject could progress to taking agriculture as a focus area for further education In 2004 there were 10 FET colleges offering vocationally directed agricultural programmes These FET colleges offered complete qualifications and short courses Eleven Colleges of Agriculture can offer qualifications up to degree level and 19 universities offer qualifications in Agriculture ranging from agricultural economics animal and plant sciences and horticulture among others at under and post graduate levels (Department of Agriculture 2006) While long term planning of skilling of new entrants in the sector can be done through close consultation between the sector agricultural schools and colleges FET colleges and HET institutions so that they teach relevant skills there are other avenues for training for those who are already employed in the sector for example skills programmes and learnerships There are 15 registered qualifications for the primary agriculture sub sectors Currently AgriSETA has 94 registered learnerships that can address the skills needs of the identified scarce skills These are captured in Appendix 2 AgriSETA has approved accredited a number of training providers across the country to deliver the theoretical and practical components of these learnerships These include agricultural colleges FET colleges and private providers Currently the AgriSETA has 246 registered and approved providers distributed nationally as follows
AgriSETA June 2010
Table 29 AgriSETA approved training providers (2010) Province Number of providers
Gauteng 72
(29)
KwaZulu Natal 20
(8)
Limpopo 35
(14)
North West 30
(12)
Northern Cape 3
(1)
Free State 15
(6)
Mpumalanga 14
(6)
Western Cape 26
(11)
Eastern Cape 31
(13) Total 246
The providers are small to large organisations In primary agriculture small providers appear to offer the most training in rural areas and community projects (AgriSETA 2010) Most of the operating providers will be in FET colleges and agricultural colleges The AgriSETA is unable to meet the total demands for skills across the duality of their sector There seems to be fairness in the approval of training for both permanent and casual and seasonal workers In 200809 the AgriSETA approved 559 learnerships as follows
Table 30 AgriSETA learnerships approved for grant purposes (2008‐2009)
Source AgriSETA learnership data analysis
Agriculture Sector Analysis 43
AgriSETA June 2010
Agriculture Sector Analysis 44
Provision of skills programmes in the same year attracted grants for 2 706 employees
Table 31 Participation by learners in skills programmes in the AgriSETA (200809)
Source AgriSETA Skills programmes data analysis
AgriSETA June 2010
APPENDIX 1 Skills demand in the Department of Agriculture Forestry amp Fisheries (200809)
Source DAFF Annual Report 2008‐20009
Agriculture Sector Analysis 45
AgriSETA June 2010
Agriculture Sector Analysis 46
Appendix 2 AgriSETA registered learnerships Registered Learnership NQF Level SAQA Registration NoLearnership in Agri Sales and Service 4 22 Q 220001 20 178 4Learnership Agricultural Machinery Technician 2 22 Q 220007 20 160 2Learnership in Specialist Agricultural Machinery Technician 5 22 Q 220009 21 258 5Agri Trade Processes 2 22 Q 220013 30 125 2FETC Meat Examination Applying Basic Business Principles 4 30 Q 3000 2823 164 4Further Education and Training Certificate Seed Marketing Execute Seed Trials 4 22 Q 220025 21 126 4Further Education and Training Certificate Seed Research and Development Certify as Seed Unit 4 22 Q 220027 21 121 4FETC Seed Research and Development Conduct a Field Inspection of a Seed Unit 4 22 Q 220028 20 120 4Seed Research and Development Operations Operate in a Team 3 22 Q 220020 22 121 3Seed Research and Development Operations Apply Basic Business Principles 3 22 Q 220021 22 121 3National Certificate Seed Processing and Packaging Operate in a Team 3 22 Q 220026 21 123 3Sugar Industry Technical Maintenance worker 2 22 Q 220011 39 128 2National Certificate Sugar Manufacturing and Refining Technical Maintenance 3 30 Q300003 23 146 3Further Education and Training Certificate Manufacturing Technical MaintenanceProduce Components by Performing Engineering Turning Operations
4 30 Q 3000 1321 173 4
FETC Manufacturing Technical Maintenance Produce Components by Performing Milling Operations 4 30 Q 3000 1521 173 4 FETC Manufacturing Technical Maintenance Develop and Fabricate from Complex Drawing 4 30 Q 3000 1420 173 4National Certificate in Sugar Technology 5 22 Q 220036 22 140 5Further Education and Training Certificate Sugar Processing 4 22 Q 220035 31 144 4National Certificate in Sugar Technology Processing Sugar Refining 2 22 Q 220037 28 124 2National Certificate in Sugar Technology Processing Juice Preparation 2 22 Q 220038 28 124 2National Certificate in Sugar Technology Processing Crystallisation 2 22 Q 220039 27 122 2National Certificate in Sugar Technology Processing Laboratory Practice 2 22 Q 220040 25 124 2National Certificate in Sugar Technology Processing Extraction 2 22 Q 220041 28 122 2NC Rooibos Production Applying Basic Business Principles 2 30 Q 3000 2427 130 2 NC Rooibos Processing Applying Basic Business Principles 2 30 Q 3000 2224 123 2 National Certificate Cigarette Production 3 22 Q 220046 23 121 3
AgriSETA June 2010
REFERENCES AgriSETA 2010 AgriSETA 20082009 Annual report Pretoria AgriSETA Agricultural Research Council httpwwwarcagriczahomeasppid=272 Avert South African HIV and AIDS statistics Available on httpwwwavertorgsafricastatshtm Centre for Development Enterprise 2008 Land reform in South Africa Getting back on track CDE Research No 16 DAFF 2010 Quarterly economic review of the agriculture sector Pretoria DAFF DAFF 2009 Annual report 20082009 Pretoria DAFF Department of Agriculture 2008 Strategic plan 2008 Pretoria Department of Agriculture DTI An introduction to the South African economy Available on httpwwwthedtigovzapublicationsagroprocessinghtm Eastern Cape Provincial Government Eastern Cape Provincial Growth and Development Strategy 2004 ndash 2014 Economic Commission for Africa 2009 Developing African agriculture through regional value chains Addis Ababa Economic Commission for Africa Economic Report Free State Province 2005 Provincial Growth and Development Strategy 2005 ndash 2014 GCIS 2010 SA Yearbook 200910rdquo Agriculture forestry and fisheries Pretoria GCIS Greenberg S 2010 Status report on land and agricultural policy in South Africa 2010 Institute for Poverty Land and Agrarian Studies School of Government University of the Western Cape Research report Ingelozi Management Solutions 2008 HIVAIDS in the South African agricultural sector Towards the development of a long term intervention Research report KwaZulu Natal Provincial Government 2006 KwaZulu Natal Provincial Growth and Development Strategy Limpopo Provincial Government Growth and Development Strategy 2004 ndash 2014 Mhone G (2000) Enclavity and Constrained Labour Absorbtive Capacity in Southern African Countries Geneva International Labour Office Moyo S The Agrarian question and the developmental state in South Africa In Edigheji O et al 2010 Constructing a democratic developmental state in South Africa HSRC PRESS
Agriculture Sector Analysis 47
AgriSETA
Agriculture Sector Analysis
National Treasury Republic of South Africa 2010 National Budget 2010 ndash National Budget Review 2010 Pretoria National Treasury Northern Cape Provincial Government Agriculture and agro‐processing sector strategy North West Provincial Government North West Provincial Growth and Development Strategy 2004 ndash 2014 Province of the Western Cape 2008 The Ikapa growth and development strategy White Paper SABCOHA SA Business Coalition on HIV and AIDS wwwsabcohaorg SACAU httpwwwsacauorghostingsacauSacauWebnsfHomehtmOpenForm South African Government 2010 20102011 ndash 20122013 Industrial Policy Action Plan Republic of South Africa Statistics South Africa 2005 Census of commercial agriculture 2002 Report No 110201 Pretoria Statistics South Africa Statistics South Africa 2009 Census of commercial agriculture 2007 Statistical release P1101 Pretoria Statistics South Africa Statistics South Africa 2010 General household survey 2009 Statistical release P0318 Pretoria Statistics South Africa Statistics South Africa 2010 Gross domestic product first quarter 2010 Statistical release P0441 Pretoria Statistics South Africa Statistics South Africa 2010 Quarterly labour force survey Quarter 1 2010 Statistical release P0211 Pretoria Statistics South Africa Vink N amp van Rooyen J 2009 The economic performance of agriculture in South Africa since 1994 The implications for food security Pretoria DBSA development planning division working paper series No 17 Webster E 2004 the Dual Economy from a book by Van Holdt K and Webster E Work restructuring and the Crisis of Social reproduction and 10 years of restructuring post apartheid workplaces University of Natal Press Workinfocom httpwwwworkinfocomfreesub_for_legresdatalraempassoc3htm Xingwana L 2008 Challenges and Opportunities for Land and Agrarian Reform towards 2025 Speech delivered at the Agri‐Consultation Protea Ranch Hotel Polokwane 30 July 2008
- Table of contents
- SECTION 1 THE AGRICULTURAL LANDSCAPE
- 11 Size and shape of the Agricultural sector
-
- Overview
- Distribution of agricultural production
- The structure of the agriculture sector in South Africa
- Categories of farming enterprises
- Employment trends
- Employment categories and remuneration
- Stakeholders in the Agricultural sector
-
- National government departments
- Sector representatives
-
- 12 Factors impacting development in the Agriculture sector
-
- Future sector economic growth and development
-
- South African sector growth plans (IPAP2)
- International Trade
- Global recession and rise in food prices
-
- Land reform
- Reliance on imports
- Water
- The labour market
- Consumer trends
- HIVAIDS
- Farm safety and security
- Broad-based Black Economic Empowerment
-
- Conclusions and scenarios
- SECTION 2 DEMAND FOR SKILLS
-
- AgriSETA registered employers and employee coverage
- Employee coverage in the AgriSETA
-
- 21 Skills demand
-
- The National Education and Training Strategy for Agriculture (AET Strategy)
- AGRISETA sector skills planning demand data (2008-2009)
- AgriSETA WSP analyses
-
- Skills demand in the commercial agricultural sector
-
- Skills demand forecasting by AgriSETA
- Research needs going forward
-
- SECTION 3 Skills Gaps and scarce skills
-
- Scarce skills at the DAFF
- Scarce skills in the commercial sector
- Supply of skills
-
- APPENDIX 1 Skills demand in the Department of Agriculture Forestry amp Fisheries (200809)
- Appendix 2 AgriSETA registered learnerships
-
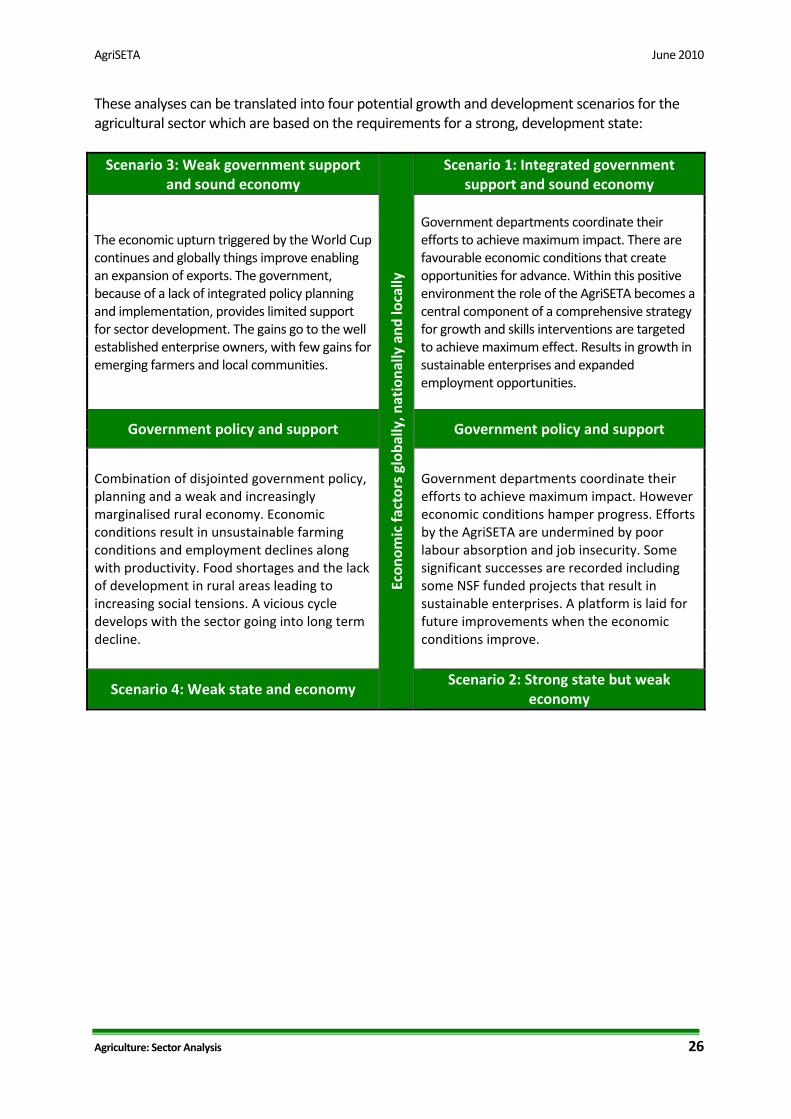
AgriSETA June 2010
Agriculture Sector Analysis 28
Sub‐ Description Employers Growing of fruit nuts beverage and spice crops 1795 255 143Farming of cattle sheep goats horses asses mules and hinnies Dairy farming
2 252 59 18
Other animal farming production of animal products (NEC) 433 25 12Ostrich farming 5 0 0Game farming 16 0 0Growing of crops combined with farming of animals (Mixed farming)
2 920 256 109
Growing of coffee and tea including coconuts cocoa nuts olives dates etc
2 0 0
Agricultural and animal husbandry services except veterinary activities
438 22 9
Other animal farming (not elsewhere classified) 11 1 1Growing of trees as second crop by farmers 126 18 4Fishing operation of fish hatcheries and fish farm 913 10 6
Red meat
Production and animal products (not elsewhere classified) 6 0 0Slaughtering dressing and packing of livestock including poultry and small game for meat
317 40 17
Production sale amp marketing of Agricultural by products (eg bones hides)
61 2 0
Slaughtering dressing and packing of livestock including small game for meat and processing of ostrich products
2 1 0
Wholesale trade in Agricultural raw materials and livestock 193 7 10Transport of livestock as supporting activity 224 0 0Agricultural and livestock research 215 9 3
Seed Seed production and marketing 149 12 6
Sugar Manufacture of sugar including golden syrup and castor sugar
45 5 21
Tobacco Processing and dispatching of tobacco 46 8 6 TOTALS 15 394 1 202 638Source AgriSETA WSP data
The largest number of registered small and medium enterprises are found in the mixed farming sub‐sector while most large enterprises are in the growing of fruit nuts beverage and spice crops sub‐sector
Employee coverage in the AgriSETA
Collectively the 17 234 employers registered with AgriSETA employed a total of 239 076 employees This represents 39 of the agricultural labour force in 2009 The 1 673 employers who submitted WSPs in 2009 employed 97 898 employees representing 41 of the total number of people employed by registered employers While the number of registered employers submitting WSPs is small (11) they employ a sizeable number of employees and the percentage of employees provides a statistically significant sample The data for larger enterprises is statistically much more representative than that for small enterprises
AgriSETA June 2010
Table 17 Number of employees of registered employers by sub‐sector
Sub‐sector
Sub‐sector description Employees
CoffeeTea Processing and marketing of coffee and tea including coconuts cocoa nuts olives dates etc
483
Fibre Grading ginning and packing of wool and cotton raw material 6 539
Fruit Fruit packed in cartons fruit juice concentrate drummed and fruit juice in container ready for consumption
27 661
Fruit exporters and importers 212
Grain
Manufacture of grain mill products and starches 133Handling and storage of grain 18 303Wholesale amp retail trade in Agricultural machinery 795Sale and distribution of Agricultural raw materials and other farming inputs 2 898
Milling
Manufacture of flour and grain mill products including rice and vegetable milling grain mill residues
3 634
Manufacture of prepared animal feeds 731Manufacture of pet foods 160Manufacture of starches and starch products 105
Pest control
Pest Control 119
Poultry Poultry and egg production including the slaughtering dressing and packing of poultry
19 187
Primary
Growing of Cereals and other crops (not elsewhere classified) 10 104Growing of Vegetables Horticultural specialties and nursery products 37 799Growing of Vegetables Horticultural specialties (Including Ornamental Horticulture) and nursery products
195
Sugar plantation including sugar cane and sugar beet etc 220Growing of fruit nuts beverage and spice crops 47 043Farming of cattle sheep goats horses asses mules hinnies Dairy farming
3 382
Other animal farming production of animal products (NEC) 4 203Ostrich farming 0Game farming 0Growing of crops combined with farming of animals (Mixed farming) 28 722Growing of coffee amp tea including coconuts cocoa nuts olives dates etc 0Agricultural and animal husbandry services except veterinary activities 970Other animal farming (not elsewhere classified) 513Growing of trees as second crop by farmers 1 294Fishing operation of fish hatcheries and fish farm 1 589
Red meat
Production and animal products (not elsewhere classified) 0Slaughtering dressing and packing of livestock including poultry and small game for meat
5 128
Production sale amp marketing of Agricultural by products (eg bones hides) 116Slaughtering dressing and packing of livestock including small game for meat and processing of ostrich products
0
Wholesale trade in Agricultural raw materials and livestock 1 697Transport of livestock as supporting activity 0Agricultural and livestock research 534
Seed Seed production and marketing 2 127Sugar Manufacture of sugar including golden syrup and castor sugar 10 478Tobacco Processing and dispatching of tobacco 2 002 Total 239 076
Agriculture Sector Analysis 29
AgriSETA June 2010
Agriculture Sector Analysis 30
Source AgriSETA WSP data
According to the WSP analysis the sub‐sector for the growing of fruit nuts beverage and spice crops employed the largest number of people In six sub‐sectors there are employers who do not employ workers These are probably family based organisations where family members help in the business without drawing a salary These are in transport and livestock research slaughtering dressing and packing of livestock including poultry and small game for meat growing of coffee and tea including coconuts cocoa nuts olives dates etc ostrich farming and game farming
Table 18 Employee distribution by province Province Employees Percentage
Eastern Cape 18 844 192 Free State 1 946 20 Gauteng 2 788 28 KwaZulu‐Natal 5 416 55 Mpumalanga 8 062 82 North West 3 290 34 Northern Cape 5 436 56 Limpopo 1 730 18 Western Cape 50 386 515 Grand Total 97 898
Source AgriSETA WSP data
Of those submitting WSPs registered employers in the Western Cape employed the largest number of people while employers in Limpopo employed the least number of employees Free State has a small number of employees covered by WSPs submitted to the SETA whereas Eastern Cape with a relatively small number of registered farms has a very large number of employees on farms submitting WSPs Given this variance between provinces the use of WSP data for extrapolation purposes must be viewed cautiously
2009 WSP equity information was only provided for about a quarter of employees (25 637 or26)34 No information was available from the WSPs on non‐South Africans working on commercial farms
Table 19 Equity profile from 2009 WSP data African Coloured Indian White
Totals M F D M F D M F D M F D
8 040 5 785 38 5 097 5 228 24 22 25 0 811 556 11
580 417 03 493 505 02 468 532 00 589 403 08 13 863 10 349 47 1 378 25 637541 404 02 54 100
Total EquityTotal Male Total Female Total Disability
13 970 11 594 73 545 452 03
Source AgriSETA WSP data
Using currently available data it is not possible to provide disaggregated employment data by sub‐sector This will require a small change in the way that gender race and disability data is
34 Some employers did not complete race and gender information when giving their employment profiles
AgriSETA June 2010
codified during WSP data‐capturing including allocation by sub‐sector What can be stated is that employment of males is more dominant than that of women and more Africans are employed in the sector than other groups Employment of people with disabilities is below 1
21 Skills demand
The National Education and Training Strategy for Agriculture (AET Strategy)
The AET Strategy developed by the Department of Agriculture Fisheries and Forestry (in consultation with various key stakeholders in the agricultural sector) highlights priority skills needs and constraints within the sector and categorises needs within the following 5 broad areas
1 Agricultural production ndash requesting that the past focus on a narrow band of commodities (relevant mainly to the commercial sector) and related research be expanded to address the needs of small‐scale and subsistence farmers (eg more focus on mixed farming and rural livelihood sustainability skills)
2 Agricultural engineering ndash with specific focus to be placed on technologies suitable for small‐scale farmers (eg relevant and post‐harvesting techniques related to processing and storage of produce) ndash to address this need the scarcity of agricultural engineers requires attention
3 Agricultural economics ndash a critical need was identified for general agricultural economic skills (ranging spectrum of farm planning farm management enterprise management marketing finance etc) ndash with the need to training both farmers and extension officers in such fields
4 Agricultural development ndash a specific need was identified to develop agricultural extensionists in supporting especially emerging and small‐scale farmers over the full spectrum (a need exists for both new curriculum in the training of new extensionists and the re‐training and upgrading of existing officers)
5 Veterinarians ndash the need to develop state veterinarians in order for the state to perform its role and function (particularly in its preventative monitoring and regulatory role and function)
AGRISETA sector skills planning demand data (2008‐2009)
The following section reflects initial research on skills demand in the Agricultural sector arising from the sector analysis (section 1) previous AGRISETA skills demand research for Sector Skills Planning during 2005‐2009 and analysis of WSP data from 2009 With the introduction of the Organising Framework of Occupations and agreement on definitions for scarce and critical skills in 200506 the AGRISETA undertook an extensive research and consultation processes to determine skills development priorities for the sector The research methodology employed was based on the a four dimensional topology for establishing and evaluating skills needs illustrated in the figure below
Agriculture Sector Analysis 31
AgriSETA June 2010
Agriculture Sector Analysis 32
The identification and prioritisation of skills needs was also undertaken from a key stakeholder and beneficiary perspective Consideration was given to needs of the following groups
bull The unemployed ndash helping them gain andor regain entry to the labour market bull The economically inactive ndash helping them to become economically active bull School leavers ndash helping them gain access to further education and training opportunities
and thus facilitating their entry to the job market bull Entrants to the job market ndash facilitating employment and integration into the work culture
and work ethic (improving the employability of an individual) bull Those currently employed in the sector ndash increasing their competency and opportunities
for advancement creating a career path and offering continued job security enhancement of value adding to the sector improving their prospects for better employment opportunities
bull Organisations and enterprises within the sector ndash making sure that skills development and knowledge creation occurs in such a way as to improve the sectorrsquos viability and allowing companiesenterprises to become more sustainable and profitable along the way improving productivity competitiveness and innovation within organisations
In organising and reporting the identified priority skills development needs (200809) the following structuring approach was followed
Tier 1 The four categories of needs as per the Topology presented above were used for the identification evaluation and grouping of needs
Pay conditions
Image
RECRUITMENT DIFFICULTY
SKILLSGAP
SKILLSSHORTAGE
LABOURSHORTAGE
Firms experience difficulty recruiting This does not necessary imply a skills shortage ndash may indicate a poor image remuneration etc
Those currently in work do not have the requisite skills set to carry out their job to an optimum standard
Required skills are in short supply when compared with the demand across the whole labour market
Regardless of skills levels a situation exists where there is simply not enough supply of labour to meet demand
Pay conditions
Image
RECRUITMENT DIFFICULTY
SKILLSGAP
SKILLSSHORTAGE
LABOURSHORTAGE
Firms experience difficulty recruiting This does not necessary imply a skills shortage ndash may indicate a poor image remuneration etc
Those currently in work do not have the requisite skills set to carry out their job to an optimum standard
Required skills are in short supply when compared with the demand across the whole labour market
Regardless of skills levels a situation exists where there is simply not enough supply of labour to meet demand
Figure 4 Topology for identifying skills development priorities
Source AGRISETA SSP Annual Update August 2009
AgriSETA June 2010
Tier 2 Within each of the first tier groupings needs were further broken down and organised per target group At this second level needs were grouped by
o General skills development needs (cross‐cutting over different target groups) o Needs experienced by small scale farmers (this group included subsistence
farmers new emerging land reform beneficiaries and small‐scale AgriBEE farmers) o Needs within the commercial agricultural sector (per sub‐sector groupings where
specific needs for such were identified ndash both on‐farm needs and within the secondary sub‐sector or related agri‐businesses)
o Needs of the Department of Agriculture Fisheries and Forestry (DAFF) To further guide and direct the identification and selection of scarce and critical skills the following factors or criteria that could reflect the importance (impact and effect) of a skills shortages were developed as an identification framework
1 Basic Skills Development Promoting basic literacy and numeracy and raising the base level of education for the sector improving the work and livelihood of existing workers
2 Employability Making the employee more employable by improving the fit between their skills and the sector needs
3 Enterprise Viability Improving the capability and feasibility of the enterprise by increasing its effectiveness of or possibilities for profit generation etc
4 Enterprise Sustainability Allow enterprises to survive and grow over an extended period of time without compromising the value of renewable resources thereby creating long‐term meaningful employment for larger numbers of people
5 Sector Growth Enabling the sector to develop or pursue new opportunities or improve the effectiveness of current operations
6 Sector Competitiveness Enabling the sector to compete more effectively in the international arena improving market intelligence and interpretation productivity cost efficiency etc
7 Human Resource Development Capacity Improving the access to quality provision of training to the agri sector
Based on this research and consultation framework the following skills development needs and priorities were identified
Agriculture Sector Analysis 33
AgriSETA June 2010
GENERAL NEEDS SMALL‐SCALE FARMER
NEEDS COMMERCIAL SECTOR
NEEDS DAFF NEEDS
RECRUITMENT RELATED SKILLS NEEDS Primary agriculture is the entry point into the world of work for large numbers of people in rural areas However the sector has negative connotations amongst sections of the youth and in parts of the country and is viewed as a last resort for some in the search for employment) The effect is that despite an unemployment rate of approximately 26 (now over 30) farmers find it difficult to recruit workers to meet seasonal demands This has resulted in the government approving the contracting of foreign labour to meet such temporary needs (workers are recruited mainly from Zimbabwe and Mozambique)
Labour in this farming sector is provided primarily by family members and no real recruitment constraints can be identified
The agricultural sector still manages to attract technical and management skills as it is perceived to include a better lifestyle and there is a strong tradition of agriculture in SA Increasing crime related security risks associated with farming may have a negative impact
The Department has identified a number of occupations in which they are experiencing long‐term vacancies Some of these result from a general shortage of such skills in SA while others arise from the inability of the public sector to compete with the private sector (less favourable employment image working conditions and equity considerations) Priority vacancies include Veterinarians Agricultural
Engineers Plant Health
Specialists Agricultural
Statisticians Plant Health Pest Risk
Analysts ICT Specialists Agricultural
Economists Agricultural Food and
Quarantine Technicians
Agro‐meteorologists Pasture Scientists Plant Production
Specialists Specialised Food
Analysts SKILLS GAPS RELATED NEEDS
bull Low literacy and numeracy levels ndash both amongst workers within the sector at large and at ownermanager level in many of the small‐scale farming
bull Farm management
Farm Management (Mainly owners managers) bull Farm management amp
entrepreneurship bull Resource
management and record keeping
bull Financial planning
A critical constraint is the poor educational levels of a large proportion of the labour force in the sector demanding a considerable effort and investment in ABET and other life skills
A particularly big need exists for skills upgrading amongst Extension Officers ndash particularly with regard to redress the historical neglect of small‐scale farmers and resource strapped farmers
Agriculture Sector Analysis 34
AgriSETA June 2010
Agriculture Sector Analysis 35
GENERAL NEEDS SMALL‐SCALE FARMER
NEEDS COMMERCIAL SECTOR
NEEDS DAFF NEEDS
skills (and general management skills in other agricultural businesses) coupled with a business orientation and entrepreneurship skills
bull A general need to increase compliance with environmental occupational health and safety animal welfare produce safety and hygiene standards regulations and requirements (local and international standards)
and management bull Project management bull Business plan
development Marketing and processing bull Processing and
packaging bull Transport
management bull Marketing produce
including branding bull Planning for
marketing bull Knowledge of
markets Technical knowledge and skills bull Production
management (related to specific enterprise)
bull Demonstration of production techniques
bull Natural resources management
Mechanical knowledge bull Farm maintenance bull Repairs of machinery
and equipment bull Electrical
maintenance and installation
programmes Need for improved management skills and relevant technological knowledge for increasing productivity levels and improved production methods Rising importance for environmentally responsible production and processing management systems Rising competitive and international markets increases need for business and marketing abilities among owners and managers Increasing requirements for compliance with environmental health and safety and international trade standards Information technology although not a priority is increasing in importance Business management ability is becoming increasingly important as more farmers are making decisions about restructuring their businesses diversification and developing supplementary sources of income
Critically improved farm management and business skills within an agricultural context to support the majority of BEE and emerging farmers Skills upgrading requirements for existing Extension Officers include bull Agricultural
economics bull Agricultural
management bull Business and
financial management
bull Technical and production related skills including o Animal husbandryo Poultry o Crop production o Horticulture
SKILLS SHORTAGES Generally SA has a shortage of entrepreneurs and people who have the business acumen drive motivation and
The profile of these farmers reflects a large contingent of older and less educated people who are generally less flexible tend to stick to
The commercial agri sector will increasingly have to compete in the global market and the ever increasing need to increase productivity to
DAFF us experiencing problems are especially sourcing people in specialised science related fields (learning fields experiencing few
AgriSETA June 2010
Agriculture Sector Analysis 36
GENERAL NEEDS SMALL‐SCALE FARMER
NEEDS COMMERCIAL SECTOR
NEEDS DAFF NEEDS
perseverance to become a successful farmer Given the high risks involved in the agricultural sector (natural elements outside onersquos control) the agri sector does not compete successfully for this ldquoscarce resourcerdquo Moreover as with other professional and skilled occupations there is a tendency for younger qualified people to move to urban areas
known practices and are less likely to experiment with new technology Within this target group candidates with good entrepreneurial ability are scarce There is a perceived shortage of Agricultural Extensionists and advisors to assist this target group However a large pool of young unemployed graduates exists who could assist such emerging farmers if they were mobilised and made accessible to farmers Similarly the potential pool of retired commercial farmers who could serve as mentors to this target group
remain profitable and viable it can be stated that many of the existing farmers and managers owners lack business management and entrepreneurial orientation Equity policy and the need to become BEE compliant requires that commercial enterprises appoint and develop black owners directors managers Changing local and global consumer preferences require farmers to change traditional farming methods and practices Skills and knowledge requirements include bull Global food and
international quality standards
bull Product traceability requirements
bull Organic produce and products
Specific occupations identified as being in short supply are
bull Production Managers (food processing)
bull Product specialisation to international specifications (research skills)
bull Forklift drivers heavy vehicletruck drivers and mobile plant operators
bull Experienced and competent artisans (millwrights electricians fitters
enrolments andor pass rates at HET institutions with the result that too few qualified persons come onto the labour market) Examples of such skills shortages identified by the Department include Agricultural Engineers bull Plant Health
Specialists (Nematology Entomology Plant Pathology)
bull Statisticians (specialised agricultural knowledge)
bull Plant Health Pest Risk Analysts
bull Agricultural Economists (production and resource economists)
bull Agricultural Food and Quarantine Technicians
bull Agro‐meteorologists Early warning Specialists
bull Pasture Scientists bull Plant Production
Specialists (eg ornamental crops hydroponics)
bull Specialised Food Analysts (pesticide residue analysts processed food and dairy analysts wine and spirit analysts)
AgriSETA June 2010
Agriculture Sector Analysis 37
GENERAL NEEDS SMALL‐SCALE FARMER
NEEDS COMMERCIAL SECTOR
NEEDS DAFF NEEDS
and turners bull Agricultural
Equipment Technicians
bull Pest and weed controllers
bull Horticultural specialists
LABOUR SHORTAGES AND RELATED SKILLS NEEDS Given an employment rate of some 26 (2009 currently estimated at over 30expanded definition) per definition there cannot be a labour shortage It is however difficult for people who have never worked before to integrate into the agricultural sector workforce Coupled with an aging workforce (30‐60 being over 40) means that most agri enterprises will within the next 5‐10 years be looking at replacing a large proportion of their workforce There could be an insufficient pool of people willing and able to participate The impact of HIVAIDS is also not always factored in to understanding the diminishing pool of resources available Labour shortages have been reported within selected geographical areas and in particular occupations Examples include cane cutters in the sugar industry chicken catchers in the poultry industry pickers in the fruit industry and animal handlers in feedlots as well as dairy parlour workers It is however believed that these shortages may reflect a recruitment problem as a result of the very harsh working conditions and the relatively poor remuneration (which makes these occupations unpopular) At present such ldquoshortagesrdquo are addressed through contracting labour from neighbouring countries
AgriSETA WSP analyses
Skills demand in the commercial agricultural sector
Information for demand for skills from WSP data is available for 1 673 employers who submitted their WSPs for the 200910 period The table below shows data on sub‐sector WSP submission relative to size of the sub‐sector as well as subsector data from all registered organisations and those who submitted WSPs Data for registered employers shows that there were 239 076 employees employed by the 17 234 registered organisations As previously stated 97 898 employees were employed by the organisations submitting WSPs This constitutes 41 of employees employed by registered organisations
Table 20 Employment and sub‐sector data drawn from WSP analyses
Sub‐sector
All Re
gistered
Employers
Small employers (0‐49)
Med
ium and
large
employers (50+)
Total W
SPs received
Total W
SPs received
as of
all registered em
ployers
WSP
received med
ium and
large orgs
WSPs received
as of
med
ium amp large em
ployers
WSPs received
small
employers
WSPs received
as of small
enterprises
EmployeesPer
Profile
CoffeeTea 40 33 7 9 23 5 71 4 12 483 Fibre 1 710 1 676 34 34 2 22 65 12 07 6 539
AgriSETA June 2010
Agriculture Sector Analysis 38
Sub‐sector
All Re
gistered
Employers
Small employers (0‐49)
Med
ium and
large
employers (50+)
Total W
SPs received
Total W
SPs received
as of
all registered em
ployers
WSP
received med
ium and
large orgs
WSPs received
as of
med
ium amp large em
ployers
WSPs received
small
employers
WSPs received
as of small
enterprises
EmployeesPer
Profile
Fruit 371 277 94 162 44 76 81 86 31 27 873 Grain 648 581 67 77 12 48 72 29 5 22 129 Milling 335 279 56 61 18 35 63 26 9 4 630 Pest Control 213 209 4 8 4 2 50 6 3 119 Poultry 391 305 86 66 17 46 53 20 7 19 187 Primary 12 121 10 776 1 345 1144 9 513 38 631 6 136 034 Red meat 1107 1 018 89 70 6 45 51 25 2 7 475 Seed 167 149 18 24 14 13 72 11 7 2 127 Sugar 71 45 26 13 18 10 38 3 7 10 478 Tobacco 60 46 14 5 8 3 21 2 4 2 002
Totals 17 234 15 394 1 840 1 673 10 818 44 855 16 239 076
Source 1 AgriSETA WSP 2009 data
Only 10 of all registered employers submitted WSPs for the 200910 period Of these 49 were medium and large sized employers and 51 small However only 16 small employers submitted their WSPs relative to the number of registered small employers and 44 medium and large employers submitted WSPs relative to the number of registered medium and large employers As such skills demand statistics provides more representative data on the requirements of medium and large employers Data for skills demand in the commercial agricultural sector is based on data for permanent employees as well as casual and seasonal employees
Skills demand forecasting by AgriSETA
Forecasting for skills demand the AgriSETA has estimated that the demand for skilled employees at different levels in the next few years is 510 686 This is based on WSP data analyses over the last 5 years and projected demand for the formal commercial agricultural sector and factoring in the demand that at maximum would result from completion of the land restitution programme in South Africa The table below reflects the skills that are on demand as well as the estimates for demand over the next five years by major occupational category35
35 AgriSETA 2010
AgriSETA June 2010
Table 21 Demand for skills by occupational category
Major Occupation (OFO)Estimated Demand
Group Title1 Managers (commercial and small emerging farmers) 264 3702 Professionals 4 1413 Technicians and Trade workers 8 9255 Clerical and administrative workers 8006 Sales workers 4007 Machinery operators and drivers 5 8008 Elementary workers 226 250
Total 510 686Source AgriSETA WSP data and SSP demand forecasts
Research needs going forward
As has been set out in the sector analysis and the scenarios derived from that analysis the sector is faced by both significant and profound change and also great uncertainty It therefore follows that the task of focussing limited resources (basically levy income in the formal sector and NSF funds for the emergent farming sector) is difficult Whilst the general thrust of training remains broadly as described in the 2006‐10 SSP Updates some considerable work is required to achieve targeted effective interventions during the 2011‐2016 period The following research questions will need to be addressed in preparing the next SSP
bull In relation to the managers and owner‐managers of commercial farms and enterprises what skills are needed to enable them to help bring about the more optimistic scenario and manage the risks associated with the less optimistic ones
bull In terms of professional and technical competencies do the current education and training institutions coupled with the learning programmes available through the AgriSETA (learnerships skills programmes and the like) meet the needs of the sector
bull In the emerging agricultural sector do the current programmes funded by sources external to the AgriSETA (eg NSF) meet all the identified needs What gaps are there and how should they be addressed
bull In relation to governmentrsquos growth strategy and industrial action plans what skills are required for developing the aquaculture sub‐sector What programmes are available How can the SETA support the skills needs for this sub‐sector
bull Given the increasing levels of casual and contract labour how can skills be developed to meet the needs of the formal commercial sector and the emerging enterprise sector
bull How can the demand in each of the priority areas be quantified and agreement be reached on numbers of people to be trained
Agriculture Sector Analysis 39
AgriSETA June 2010
SECTION 3 Skills Gaps and scarce skills
Scarce skills at the DAFF
The level of scarce skills at DAFF can be determined by the vacancy rate While the average vacancy rate in the department as at 31 March 2009 was 17 there were some posts that had very high vacancy rates as reflected in the table below Indicating the possibility that the Department is experiencing difficulties in finding suitable candidates in the South African labour market to fill these posts
Table 22 Scarce skill occupations and vacancy rates (DAFF March 2009) Critical occupations Number of posts Posts filled Vacancy rate ()
Agricultural animal oceanography forestry and other sciences
167 119 287
Engineering sciences related 2 1 50Engineers and related professions 13 6 538Farming forestry advisors and farm managers 11 4 636Finance and economics related 73 53 274Horticulturists foresters agricultural and forestry technicians
350 221 369
Legal related 6 4 333Mechanical engineering technicians 3 2 333Risk management and security services 6 4 333Social sciences related 1 0 100Veterinarians 34 24 294
Source DAFF Annual Report 20082009
Skills are also scarce at senior management level The department also reports on difficulties it has filling senior management services vacancies with some of them staying vacant for up to twelve months because no suitable candidates can be found The department would then resort to re‐advertisement and head hunting This was the case with 22 of 18 SMS posts in March 2009
Scarce skills in the commercial sector
The following occupations have previously been projected as scarce (extremely hard to fill vacancies) by AgriSETA in the commercial agricultural sector over the next five years
Table 23 Scarce and critical skills in the commercial agricultural sector
Occupation Code
Group Occupation Critical Skills Intervention Comments
139903 Managers Laboratory Manager
Technology AI nutrition
HET
221101 Professionals Accountant (General)
General HET
221102 Professionals Management Accountant
Farm financial management
HET Focus on support advice to farmers new enterprises
222101 Professionals Commodities Trader
Export administration supply chain
FET Learnership Skills
Agriculture Sector Analysis 40
AgriSETA June 2010
Agriculture Sector Analysis 41
Occupation Code
Group Occupation Critical Skills Intervention Comments
management Programme
224301 Professionals Economist Agricultural HET
Mainly for Department of Agriculture and para statals commodity organisations
233101 Professionals Chemical Engineer
Chemical processes in food production
HET Industries such as sugar processing
233301 Professionals Electrical Engineer
Installation and maintenance
HET Processing industry
233401 Professionals Electronics Engineer
Computerised production prosesses
HET Processing industry
233501 Professionals Industrial Engineer
Productivity and efficiency
HET Processing industry
233904 Professionals
Instrument Engineer (Defence Force)
Installation and maintenance
HET
Not for defence ‐ sugar industry
233502 Professionals Mechanical Engineer
FETHET Equity reasons
233902 Professionals Agricultural Engineer
Farm layout and infrastructure
HET Mainly in Government
311101 Technicians and trades workers
Agricultural Technician
Installation and maintenance
FETHET
234102 Professionals Agricultural Scientist
Agri research HETFET Especially in horticulture
234201 Professionals Chemist HET Processing industry
234202 Professionals Food Technologist
Food safety HACCP
FETHET Across sector
234701 Professionals Veterinarian HET Mainly in Government
311101 Technicians and trades workers
Agricultural Technician
Farm infrastructure
FET Mainly needed in government
311401 Technicians and trades workers
Chemistry Technician
FETHET EE reasons
312907 Technicians and trades workers
Chemical Engineering Technician
FET Learnership
Mainly EE reasons
312402 Technicians and trades workers
Electronic Engineering Technician
Weak stream production infra
FETHET Mainly tobacco industry
233904 Professionals
Instrument Engineer (Defence Force)
Instrument technician
FET
Occupation needed Instrument Technician (not defence force) Mainly sugar processing sector
321202 Technicians and trades workers
Diesel Motor Mechanic
FET Learnership
To include tractor mechanic
321204 Technicians and trades workers
Small Engine Mechanic
Agricultural equipment
FET Learnership
Throughout sector
AgriSETA June 2010
Agriculture Sector Analysis 42
Occupation Code
Group Occupation Critical Skills Intervention Comments
322301 Technicians and trades workers
Metal Fabricator
Artisan FET Learnership
322303 Technicians and trades workers
Welder Welder (First Class)
Artisan FET Learnership
323203 Technicians and trades workers
Fitter‐Welder Artisan FET Learnership
Mainly sugar ndash multi‐skilled
323202 Technicians and trades workers
Fitter And Turner
Artisan FET Learnership
Tobacco and sugar
323501 Technicians and trades workers
Millwright Artisan FET Learnership
Wide‐spread need
341101 Technicians and trades workers
Electrician (General)
Artisan FET Learnership
Wide‐spread need
342101 Technicians and trades workers
Air‐Conditioning And Refrigeration Mechanic
Artisan FET Learnership
Sugar pack houses cold chain
Source AgriSETA Sector Skills Plans
Supply of skills
South Africarsquos agriculture skills are produced in high schools agricultural colleges FET colleges and Higher Education institutions In high school a large cohort of learners take Agricultural Science as a subject In 2003 there were 42 Agricultural High Schools offering Agricultural Science as a subject These students and those in high schools taking the subject could progress to taking agriculture as a focus area for further education In 2004 there were 10 FET colleges offering vocationally directed agricultural programmes These FET colleges offered complete qualifications and short courses Eleven Colleges of Agriculture can offer qualifications up to degree level and 19 universities offer qualifications in Agriculture ranging from agricultural economics animal and plant sciences and horticulture among others at under and post graduate levels (Department of Agriculture 2006) While long term planning of skilling of new entrants in the sector can be done through close consultation between the sector agricultural schools and colleges FET colleges and HET institutions so that they teach relevant skills there are other avenues for training for those who are already employed in the sector for example skills programmes and learnerships There are 15 registered qualifications for the primary agriculture sub sectors Currently AgriSETA has 94 registered learnerships that can address the skills needs of the identified scarce skills These are captured in Appendix 2 AgriSETA has approved accredited a number of training providers across the country to deliver the theoretical and practical components of these learnerships These include agricultural colleges FET colleges and private providers Currently the AgriSETA has 246 registered and approved providers distributed nationally as follows
AgriSETA June 2010
Table 29 AgriSETA approved training providers (2010) Province Number of providers
Gauteng 72
(29)
KwaZulu Natal 20
(8)
Limpopo 35
(14)
North West 30
(12)
Northern Cape 3
(1)
Free State 15
(6)
Mpumalanga 14
(6)
Western Cape 26
(11)
Eastern Cape 31
(13) Total 246
The providers are small to large organisations In primary agriculture small providers appear to offer the most training in rural areas and community projects (AgriSETA 2010) Most of the operating providers will be in FET colleges and agricultural colleges The AgriSETA is unable to meet the total demands for skills across the duality of their sector There seems to be fairness in the approval of training for both permanent and casual and seasonal workers In 200809 the AgriSETA approved 559 learnerships as follows
Table 30 AgriSETA learnerships approved for grant purposes (2008‐2009)
Source AgriSETA learnership data analysis
Agriculture Sector Analysis 43
AgriSETA June 2010
Agriculture Sector Analysis 44
Provision of skills programmes in the same year attracted grants for 2 706 employees
Table 31 Participation by learners in skills programmes in the AgriSETA (200809)
Source AgriSETA Skills programmes data analysis
AgriSETA June 2010
APPENDIX 1 Skills demand in the Department of Agriculture Forestry amp Fisheries (200809)
Source DAFF Annual Report 2008‐20009
Agriculture Sector Analysis 45
AgriSETA June 2010
Agriculture Sector Analysis 46
Appendix 2 AgriSETA registered learnerships Registered Learnership NQF Level SAQA Registration NoLearnership in Agri Sales and Service 4 22 Q 220001 20 178 4Learnership Agricultural Machinery Technician 2 22 Q 220007 20 160 2Learnership in Specialist Agricultural Machinery Technician 5 22 Q 220009 21 258 5Agri Trade Processes 2 22 Q 220013 30 125 2FETC Meat Examination Applying Basic Business Principles 4 30 Q 3000 2823 164 4Further Education and Training Certificate Seed Marketing Execute Seed Trials 4 22 Q 220025 21 126 4Further Education and Training Certificate Seed Research and Development Certify as Seed Unit 4 22 Q 220027 21 121 4FETC Seed Research and Development Conduct a Field Inspection of a Seed Unit 4 22 Q 220028 20 120 4Seed Research and Development Operations Operate in a Team 3 22 Q 220020 22 121 3Seed Research and Development Operations Apply Basic Business Principles 3 22 Q 220021 22 121 3National Certificate Seed Processing and Packaging Operate in a Team 3 22 Q 220026 21 123 3Sugar Industry Technical Maintenance worker 2 22 Q 220011 39 128 2National Certificate Sugar Manufacturing and Refining Technical Maintenance 3 30 Q300003 23 146 3Further Education and Training Certificate Manufacturing Technical MaintenanceProduce Components by Performing Engineering Turning Operations
4 30 Q 3000 1321 173 4
FETC Manufacturing Technical Maintenance Produce Components by Performing Milling Operations 4 30 Q 3000 1521 173 4 FETC Manufacturing Technical Maintenance Develop and Fabricate from Complex Drawing 4 30 Q 3000 1420 173 4National Certificate in Sugar Technology 5 22 Q 220036 22 140 5Further Education and Training Certificate Sugar Processing 4 22 Q 220035 31 144 4National Certificate in Sugar Technology Processing Sugar Refining 2 22 Q 220037 28 124 2National Certificate in Sugar Technology Processing Juice Preparation 2 22 Q 220038 28 124 2National Certificate in Sugar Technology Processing Crystallisation 2 22 Q 220039 27 122 2National Certificate in Sugar Technology Processing Laboratory Practice 2 22 Q 220040 25 124 2National Certificate in Sugar Technology Processing Extraction 2 22 Q 220041 28 122 2NC Rooibos Production Applying Basic Business Principles 2 30 Q 3000 2427 130 2 NC Rooibos Processing Applying Basic Business Principles 2 30 Q 3000 2224 123 2 National Certificate Cigarette Production 3 22 Q 220046 23 121 3
AgriSETA June 2010
REFERENCES AgriSETA 2010 AgriSETA 20082009 Annual report Pretoria AgriSETA Agricultural Research Council httpwwwarcagriczahomeasppid=272 Avert South African HIV and AIDS statistics Available on httpwwwavertorgsafricastatshtm Centre for Development Enterprise 2008 Land reform in South Africa Getting back on track CDE Research No 16 DAFF 2010 Quarterly economic review of the agriculture sector Pretoria DAFF DAFF 2009 Annual report 20082009 Pretoria DAFF Department of Agriculture 2008 Strategic plan 2008 Pretoria Department of Agriculture DTI An introduction to the South African economy Available on httpwwwthedtigovzapublicationsagroprocessinghtm Eastern Cape Provincial Government Eastern Cape Provincial Growth and Development Strategy 2004 ndash 2014 Economic Commission for Africa 2009 Developing African agriculture through regional value chains Addis Ababa Economic Commission for Africa Economic Report Free State Province 2005 Provincial Growth and Development Strategy 2005 ndash 2014 GCIS 2010 SA Yearbook 200910rdquo Agriculture forestry and fisheries Pretoria GCIS Greenberg S 2010 Status report on land and agricultural policy in South Africa 2010 Institute for Poverty Land and Agrarian Studies School of Government University of the Western Cape Research report Ingelozi Management Solutions 2008 HIVAIDS in the South African agricultural sector Towards the development of a long term intervention Research report KwaZulu Natal Provincial Government 2006 KwaZulu Natal Provincial Growth and Development Strategy Limpopo Provincial Government Growth and Development Strategy 2004 ndash 2014 Mhone G (2000) Enclavity and Constrained Labour Absorbtive Capacity in Southern African Countries Geneva International Labour Office Moyo S The Agrarian question and the developmental state in South Africa In Edigheji O et al 2010 Constructing a democratic developmental state in South Africa HSRC PRESS
Agriculture Sector Analysis 47
AgriSETA
Agriculture Sector Analysis
National Treasury Republic of South Africa 2010 National Budget 2010 ndash National Budget Review 2010 Pretoria National Treasury Northern Cape Provincial Government Agriculture and agro‐processing sector strategy North West Provincial Government North West Provincial Growth and Development Strategy 2004 ndash 2014 Province of the Western Cape 2008 The Ikapa growth and development strategy White Paper SABCOHA SA Business Coalition on HIV and AIDS wwwsabcohaorg SACAU httpwwwsacauorghostingsacauSacauWebnsfHomehtmOpenForm South African Government 2010 20102011 ndash 20122013 Industrial Policy Action Plan Republic of South Africa Statistics South Africa 2005 Census of commercial agriculture 2002 Report No 110201 Pretoria Statistics South Africa Statistics South Africa 2009 Census of commercial agriculture 2007 Statistical release P1101 Pretoria Statistics South Africa Statistics South Africa 2010 General household survey 2009 Statistical release P0318 Pretoria Statistics South Africa Statistics South Africa 2010 Gross domestic product first quarter 2010 Statistical release P0441 Pretoria Statistics South Africa Statistics South Africa 2010 Quarterly labour force survey Quarter 1 2010 Statistical release P0211 Pretoria Statistics South Africa Vink N amp van Rooyen J 2009 The economic performance of agriculture in South Africa since 1994 The implications for food security Pretoria DBSA development planning division working paper series No 17 Webster E 2004 the Dual Economy from a book by Van Holdt K and Webster E Work restructuring and the Crisis of Social reproduction and 10 years of restructuring post apartheid workplaces University of Natal Press Workinfocom httpwwwworkinfocomfreesub_for_legresdatalraempassoc3htm Xingwana L 2008 Challenges and Opportunities for Land and Agrarian Reform towards 2025 Speech delivered at the Agri‐Consultation Protea Ranch Hotel Polokwane 30 July 2008
- Table of contents
- SECTION 1 THE AGRICULTURAL LANDSCAPE
- 11 Size and shape of the Agricultural sector
-
- Overview
- Distribution of agricultural production
- The structure of the agriculture sector in South Africa
- Categories of farming enterprises
- Employment trends
- Employment categories and remuneration
- Stakeholders in the Agricultural sector
-
- National government departments
- Sector representatives
-
- 12 Factors impacting development in the Agriculture sector
-
- Future sector economic growth and development
-
- South African sector growth plans (IPAP2)
- International Trade
- Global recession and rise in food prices
-
- Land reform
- Reliance on imports
- Water
- The labour market
- Consumer trends
- HIVAIDS
- Farm safety and security
- Broad-based Black Economic Empowerment
-
- Conclusions and scenarios
- SECTION 2 DEMAND FOR SKILLS
-
- AgriSETA registered employers and employee coverage
- Employee coverage in the AgriSETA
-
- 21 Skills demand
-
- The National Education and Training Strategy for Agriculture (AET Strategy)
- AGRISETA sector skills planning demand data (2008-2009)
- AgriSETA WSP analyses
-
- Skills demand in the commercial agricultural sector
-
- Skills demand forecasting by AgriSETA
- Research needs going forward
-
- SECTION 3 Skills Gaps and scarce skills
-
- Scarce skills at the DAFF
- Scarce skills in the commercial sector
- Supply of skills
-
- APPENDIX 1 Skills demand in the Department of Agriculture Forestry amp Fisheries (200809)
- Appendix 2 AgriSETA registered learnerships
-
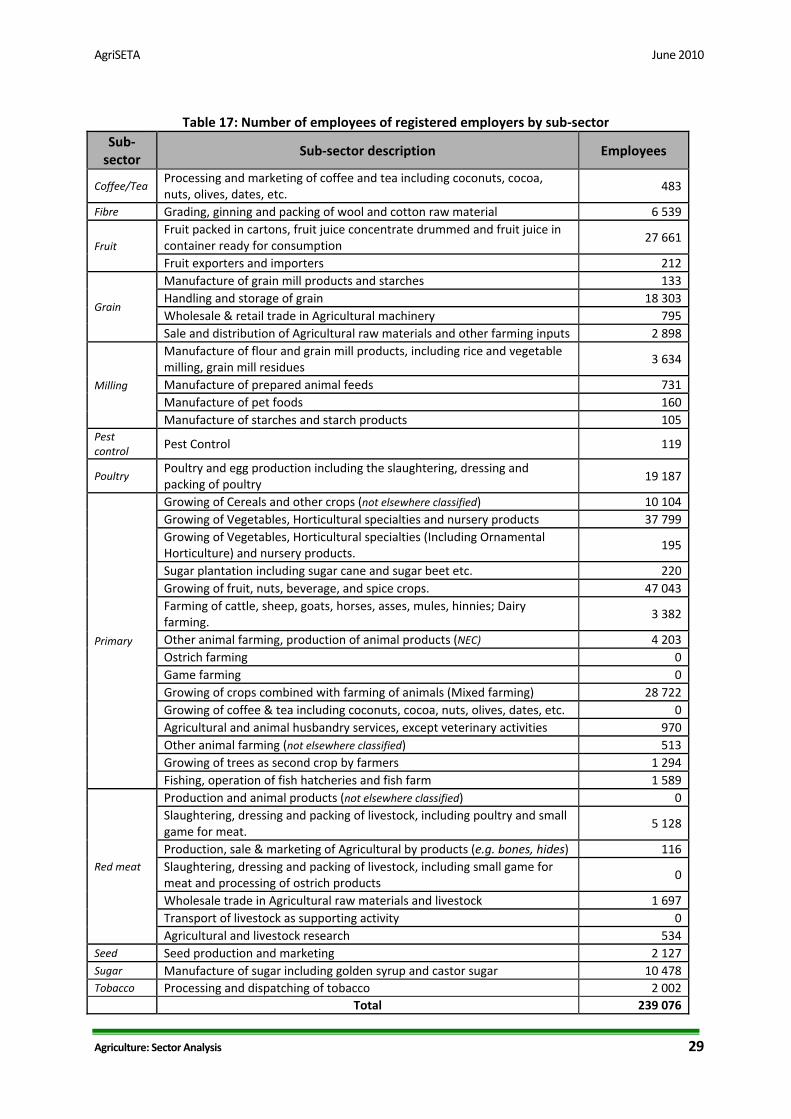
AgriSETA June 2010
Agriculture Sector Analysis 30
Source AgriSETA WSP data
According to the WSP analysis the sub‐sector for the growing of fruit nuts beverage and spice crops employed the largest number of people In six sub‐sectors there are employers who do not employ workers These are probably family based organisations where family members help in the business without drawing a salary These are in transport and livestock research slaughtering dressing and packing of livestock including poultry and small game for meat growing of coffee and tea including coconuts cocoa nuts olives dates etc ostrich farming and game farming
Table 18 Employee distribution by province Province Employees Percentage
Eastern Cape 18 844 192 Free State 1 946 20 Gauteng 2 788 28 KwaZulu‐Natal 5 416 55 Mpumalanga 8 062 82 North West 3 290 34 Northern Cape 5 436 56 Limpopo 1 730 18 Western Cape 50 386 515 Grand Total 97 898
Source AgriSETA WSP data
Of those submitting WSPs registered employers in the Western Cape employed the largest number of people while employers in Limpopo employed the least number of employees Free State has a small number of employees covered by WSPs submitted to the SETA whereas Eastern Cape with a relatively small number of registered farms has a very large number of employees on farms submitting WSPs Given this variance between provinces the use of WSP data for extrapolation purposes must be viewed cautiously
2009 WSP equity information was only provided for about a quarter of employees (25 637 or26)34 No information was available from the WSPs on non‐South Africans working on commercial farms
Table 19 Equity profile from 2009 WSP data African Coloured Indian White
Totals M F D M F D M F D M F D
8 040 5 785 38 5 097 5 228 24 22 25 0 811 556 11
580 417 03 493 505 02 468 532 00 589 403 08 13 863 10 349 47 1 378 25 637541 404 02 54 100
Total EquityTotal Male Total Female Total Disability
13 970 11 594 73 545 452 03
Source AgriSETA WSP data
Using currently available data it is not possible to provide disaggregated employment data by sub‐sector This will require a small change in the way that gender race and disability data is
34 Some employers did not complete race and gender information when giving their employment profiles
AgriSETA June 2010
codified during WSP data‐capturing including allocation by sub‐sector What can be stated is that employment of males is more dominant than that of women and more Africans are employed in the sector than other groups Employment of people with disabilities is below 1
21 Skills demand
The National Education and Training Strategy for Agriculture (AET Strategy)
The AET Strategy developed by the Department of Agriculture Fisheries and Forestry (in consultation with various key stakeholders in the agricultural sector) highlights priority skills needs and constraints within the sector and categorises needs within the following 5 broad areas
1 Agricultural production ndash requesting that the past focus on a narrow band of commodities (relevant mainly to the commercial sector) and related research be expanded to address the needs of small‐scale and subsistence farmers (eg more focus on mixed farming and rural livelihood sustainability skills)
2 Agricultural engineering ndash with specific focus to be placed on technologies suitable for small‐scale farmers (eg relevant and post‐harvesting techniques related to processing and storage of produce) ndash to address this need the scarcity of agricultural engineers requires attention
3 Agricultural economics ndash a critical need was identified for general agricultural economic skills (ranging spectrum of farm planning farm management enterprise management marketing finance etc) ndash with the need to training both farmers and extension officers in such fields
4 Agricultural development ndash a specific need was identified to develop agricultural extensionists in supporting especially emerging and small‐scale farmers over the full spectrum (a need exists for both new curriculum in the training of new extensionists and the re‐training and upgrading of existing officers)
5 Veterinarians ndash the need to develop state veterinarians in order for the state to perform its role and function (particularly in its preventative monitoring and regulatory role and function)
AGRISETA sector skills planning demand data (2008‐2009)
The following section reflects initial research on skills demand in the Agricultural sector arising from the sector analysis (section 1) previous AGRISETA skills demand research for Sector Skills Planning during 2005‐2009 and analysis of WSP data from 2009 With the introduction of the Organising Framework of Occupations and agreement on definitions for scarce and critical skills in 200506 the AGRISETA undertook an extensive research and consultation processes to determine skills development priorities for the sector The research methodology employed was based on the a four dimensional topology for establishing and evaluating skills needs illustrated in the figure below
Agriculture Sector Analysis 31
AgriSETA June 2010
Agriculture Sector Analysis 32
The identification and prioritisation of skills needs was also undertaken from a key stakeholder and beneficiary perspective Consideration was given to needs of the following groups
bull The unemployed ndash helping them gain andor regain entry to the labour market bull The economically inactive ndash helping them to become economically active bull School leavers ndash helping them gain access to further education and training opportunities
and thus facilitating their entry to the job market bull Entrants to the job market ndash facilitating employment and integration into the work culture
and work ethic (improving the employability of an individual) bull Those currently employed in the sector ndash increasing their competency and opportunities
for advancement creating a career path and offering continued job security enhancement of value adding to the sector improving their prospects for better employment opportunities
bull Organisations and enterprises within the sector ndash making sure that skills development and knowledge creation occurs in such a way as to improve the sectorrsquos viability and allowing companiesenterprises to become more sustainable and profitable along the way improving productivity competitiveness and innovation within organisations
In organising and reporting the identified priority skills development needs (200809) the following structuring approach was followed
Tier 1 The four categories of needs as per the Topology presented above were used for the identification evaluation and grouping of needs
Pay conditions
Image
RECRUITMENT DIFFICULTY
SKILLSGAP
SKILLSSHORTAGE
LABOURSHORTAGE
Firms experience difficulty recruiting This does not necessary imply a skills shortage ndash may indicate a poor image remuneration etc
Those currently in work do not have the requisite skills set to carry out their job to an optimum standard
Required skills are in short supply when compared with the demand across the whole labour market
Regardless of skills levels a situation exists where there is simply not enough supply of labour to meet demand
Pay conditions
Image
RECRUITMENT DIFFICULTY
SKILLSGAP
SKILLSSHORTAGE
LABOURSHORTAGE
Firms experience difficulty recruiting This does not necessary imply a skills shortage ndash may indicate a poor image remuneration etc
Those currently in work do not have the requisite skills set to carry out their job to an optimum standard
Required skills are in short supply when compared with the demand across the whole labour market
Regardless of skills levels a situation exists where there is simply not enough supply of labour to meet demand
Figure 4 Topology for identifying skills development priorities
Source AGRISETA SSP Annual Update August 2009
AgriSETA June 2010
Tier 2 Within each of the first tier groupings needs were further broken down and organised per target group At this second level needs were grouped by
o General skills development needs (cross‐cutting over different target groups) o Needs experienced by small scale farmers (this group included subsistence
farmers new emerging land reform beneficiaries and small‐scale AgriBEE farmers) o Needs within the commercial agricultural sector (per sub‐sector groupings where
specific needs for such were identified ndash both on‐farm needs and within the secondary sub‐sector or related agri‐businesses)
o Needs of the Department of Agriculture Fisheries and Forestry (DAFF) To further guide and direct the identification and selection of scarce and critical skills the following factors or criteria that could reflect the importance (impact and effect) of a skills shortages were developed as an identification framework
1 Basic Skills Development Promoting basic literacy and numeracy and raising the base level of education for the sector improving the work and livelihood of existing workers
2 Employability Making the employee more employable by improving the fit between their skills and the sector needs
3 Enterprise Viability Improving the capability and feasibility of the enterprise by increasing its effectiveness of or possibilities for profit generation etc
4 Enterprise Sustainability Allow enterprises to survive and grow over an extended period of time without compromising the value of renewable resources thereby creating long‐term meaningful employment for larger numbers of people
5 Sector Growth Enabling the sector to develop or pursue new opportunities or improve the effectiveness of current operations
6 Sector Competitiveness Enabling the sector to compete more effectively in the international arena improving market intelligence and interpretation productivity cost efficiency etc
7 Human Resource Development Capacity Improving the access to quality provision of training to the agri sector
Based on this research and consultation framework the following skills development needs and priorities were identified
Agriculture Sector Analysis 33
AgriSETA June 2010
GENERAL NEEDS SMALL‐SCALE FARMER
NEEDS COMMERCIAL SECTOR
NEEDS DAFF NEEDS
RECRUITMENT RELATED SKILLS NEEDS Primary agriculture is the entry point into the world of work for large numbers of people in rural areas However the sector has negative connotations amongst sections of the youth and in parts of the country and is viewed as a last resort for some in the search for employment) The effect is that despite an unemployment rate of approximately 26 (now over 30) farmers find it difficult to recruit workers to meet seasonal demands This has resulted in the government approving the contracting of foreign labour to meet such temporary needs (workers are recruited mainly from Zimbabwe and Mozambique)
Labour in this farming sector is provided primarily by family members and no real recruitment constraints can be identified
The agricultural sector still manages to attract technical and management skills as it is perceived to include a better lifestyle and there is a strong tradition of agriculture in SA Increasing crime related security risks associated with farming may have a negative impact
The Department has identified a number of occupations in which they are experiencing long‐term vacancies Some of these result from a general shortage of such skills in SA while others arise from the inability of the public sector to compete with the private sector (less favourable employment image working conditions and equity considerations) Priority vacancies include Veterinarians Agricultural
Engineers Plant Health
Specialists Agricultural
Statisticians Plant Health Pest Risk
Analysts ICT Specialists Agricultural
Economists Agricultural Food and
Quarantine Technicians
Agro‐meteorologists Pasture Scientists Plant Production
Specialists Specialised Food
Analysts SKILLS GAPS RELATED NEEDS
bull Low literacy and numeracy levels ndash both amongst workers within the sector at large and at ownermanager level in many of the small‐scale farming
bull Farm management
Farm Management (Mainly owners managers) bull Farm management amp
entrepreneurship bull Resource
management and record keeping
bull Financial planning
A critical constraint is the poor educational levels of a large proportion of the labour force in the sector demanding a considerable effort and investment in ABET and other life skills
A particularly big need exists for skills upgrading amongst Extension Officers ndash particularly with regard to redress the historical neglect of small‐scale farmers and resource strapped farmers
Agriculture Sector Analysis 34
AgriSETA June 2010
Agriculture Sector Analysis 35
GENERAL NEEDS SMALL‐SCALE FARMER
NEEDS COMMERCIAL SECTOR
NEEDS DAFF NEEDS
skills (and general management skills in other agricultural businesses) coupled with a business orientation and entrepreneurship skills
bull A general need to increase compliance with environmental occupational health and safety animal welfare produce safety and hygiene standards regulations and requirements (local and international standards)
and management bull Project management bull Business plan
development Marketing and processing bull Processing and
packaging bull Transport
management bull Marketing produce
including branding bull Planning for
marketing bull Knowledge of
markets Technical knowledge and skills bull Production
management (related to specific enterprise)
bull Demonstration of production techniques
bull Natural resources management
Mechanical knowledge bull Farm maintenance bull Repairs of machinery
and equipment bull Electrical
maintenance and installation
programmes Need for improved management skills and relevant technological knowledge for increasing productivity levels and improved production methods Rising importance for environmentally responsible production and processing management systems Rising competitive and international markets increases need for business and marketing abilities among owners and managers Increasing requirements for compliance with environmental health and safety and international trade standards Information technology although not a priority is increasing in importance Business management ability is becoming increasingly important as more farmers are making decisions about restructuring their businesses diversification and developing supplementary sources of income
Critically improved farm management and business skills within an agricultural context to support the majority of BEE and emerging farmers Skills upgrading requirements for existing Extension Officers include bull Agricultural
economics bull Agricultural
management bull Business and
financial management
bull Technical and production related skills including o Animal husbandryo Poultry o Crop production o Horticulture
SKILLS SHORTAGES Generally SA has a shortage of entrepreneurs and people who have the business acumen drive motivation and
The profile of these farmers reflects a large contingent of older and less educated people who are generally less flexible tend to stick to
The commercial agri sector will increasingly have to compete in the global market and the ever increasing need to increase productivity to
DAFF us experiencing problems are especially sourcing people in specialised science related fields (learning fields experiencing few
AgriSETA June 2010
Agriculture Sector Analysis 36
GENERAL NEEDS SMALL‐SCALE FARMER
NEEDS COMMERCIAL SECTOR
NEEDS DAFF NEEDS
perseverance to become a successful farmer Given the high risks involved in the agricultural sector (natural elements outside onersquos control) the agri sector does not compete successfully for this ldquoscarce resourcerdquo Moreover as with other professional and skilled occupations there is a tendency for younger qualified people to move to urban areas
known practices and are less likely to experiment with new technology Within this target group candidates with good entrepreneurial ability are scarce There is a perceived shortage of Agricultural Extensionists and advisors to assist this target group However a large pool of young unemployed graduates exists who could assist such emerging farmers if they were mobilised and made accessible to farmers Similarly the potential pool of retired commercial farmers who could serve as mentors to this target group
remain profitable and viable it can be stated that many of the existing farmers and managers owners lack business management and entrepreneurial orientation Equity policy and the need to become BEE compliant requires that commercial enterprises appoint and develop black owners directors managers Changing local and global consumer preferences require farmers to change traditional farming methods and practices Skills and knowledge requirements include bull Global food and
international quality standards
bull Product traceability requirements
bull Organic produce and products
Specific occupations identified as being in short supply are
bull Production Managers (food processing)
bull Product specialisation to international specifications (research skills)
bull Forklift drivers heavy vehicletruck drivers and mobile plant operators
bull Experienced and competent artisans (millwrights electricians fitters
enrolments andor pass rates at HET institutions with the result that too few qualified persons come onto the labour market) Examples of such skills shortages identified by the Department include Agricultural Engineers bull Plant Health
Specialists (Nematology Entomology Plant Pathology)
bull Statisticians (specialised agricultural knowledge)
bull Plant Health Pest Risk Analysts
bull Agricultural Economists (production and resource economists)
bull Agricultural Food and Quarantine Technicians
bull Agro‐meteorologists Early warning Specialists
bull Pasture Scientists bull Plant Production
Specialists (eg ornamental crops hydroponics)
bull Specialised Food Analysts (pesticide residue analysts processed food and dairy analysts wine and spirit analysts)
AgriSETA June 2010
Agriculture Sector Analysis 37
GENERAL NEEDS SMALL‐SCALE FARMER
NEEDS COMMERCIAL SECTOR
NEEDS DAFF NEEDS
and turners bull Agricultural
Equipment Technicians
bull Pest and weed controllers
bull Horticultural specialists
LABOUR SHORTAGES AND RELATED SKILLS NEEDS Given an employment rate of some 26 (2009 currently estimated at over 30expanded definition) per definition there cannot be a labour shortage It is however difficult for people who have never worked before to integrate into the agricultural sector workforce Coupled with an aging workforce (30‐60 being over 40) means that most agri enterprises will within the next 5‐10 years be looking at replacing a large proportion of their workforce There could be an insufficient pool of people willing and able to participate The impact of HIVAIDS is also not always factored in to understanding the diminishing pool of resources available Labour shortages have been reported within selected geographical areas and in particular occupations Examples include cane cutters in the sugar industry chicken catchers in the poultry industry pickers in the fruit industry and animal handlers in feedlots as well as dairy parlour workers It is however believed that these shortages may reflect a recruitment problem as a result of the very harsh working conditions and the relatively poor remuneration (which makes these occupations unpopular) At present such ldquoshortagesrdquo are addressed through contracting labour from neighbouring countries
AgriSETA WSP analyses
Skills demand in the commercial agricultural sector
Information for demand for skills from WSP data is available for 1 673 employers who submitted their WSPs for the 200910 period The table below shows data on sub‐sector WSP submission relative to size of the sub‐sector as well as subsector data from all registered organisations and those who submitted WSPs Data for registered employers shows that there were 239 076 employees employed by the 17 234 registered organisations As previously stated 97 898 employees were employed by the organisations submitting WSPs This constitutes 41 of employees employed by registered organisations
Table 20 Employment and sub‐sector data drawn from WSP analyses
Sub‐sector
All Re
gistered
Employers
Small employers (0‐49)
Med
ium and
large
employers (50+)
Total W
SPs received
Total W
SPs received
as of
all registered em
ployers
WSP
received med
ium and
large orgs
WSPs received
as of
med
ium amp large em
ployers
WSPs received
small
employers
WSPs received
as of small
enterprises
EmployeesPer
Profile
CoffeeTea 40 33 7 9 23 5 71 4 12 483 Fibre 1 710 1 676 34 34 2 22 65 12 07 6 539
AgriSETA June 2010
Agriculture Sector Analysis 38
Sub‐sector
All Re
gistered
Employers
Small employers (0‐49)
Med
ium and
large
employers (50+)
Total W
SPs received
Total W
SPs received
as of
all registered em
ployers
WSP
received med
ium and
large orgs
WSPs received
as of
med
ium amp large em
ployers
WSPs received
small
employers
WSPs received
as of small
enterprises
EmployeesPer
Profile
Fruit 371 277 94 162 44 76 81 86 31 27 873 Grain 648 581 67 77 12 48 72 29 5 22 129 Milling 335 279 56 61 18 35 63 26 9 4 630 Pest Control 213 209 4 8 4 2 50 6 3 119 Poultry 391 305 86 66 17 46 53 20 7 19 187 Primary 12 121 10 776 1 345 1144 9 513 38 631 6 136 034 Red meat 1107 1 018 89 70 6 45 51 25 2 7 475 Seed 167 149 18 24 14 13 72 11 7 2 127 Sugar 71 45 26 13 18 10 38 3 7 10 478 Tobacco 60 46 14 5 8 3 21 2 4 2 002
Totals 17 234 15 394 1 840 1 673 10 818 44 855 16 239 076
Source 1 AgriSETA WSP 2009 data
Only 10 of all registered employers submitted WSPs for the 200910 period Of these 49 were medium and large sized employers and 51 small However only 16 small employers submitted their WSPs relative to the number of registered small employers and 44 medium and large employers submitted WSPs relative to the number of registered medium and large employers As such skills demand statistics provides more representative data on the requirements of medium and large employers Data for skills demand in the commercial agricultural sector is based on data for permanent employees as well as casual and seasonal employees
Skills demand forecasting by AgriSETA
Forecasting for skills demand the AgriSETA has estimated that the demand for skilled employees at different levels in the next few years is 510 686 This is based on WSP data analyses over the last 5 years and projected demand for the formal commercial agricultural sector and factoring in the demand that at maximum would result from completion of the land restitution programme in South Africa The table below reflects the skills that are on demand as well as the estimates for demand over the next five years by major occupational category35
35 AgriSETA 2010
AgriSETA June 2010
Table 21 Demand for skills by occupational category
Major Occupation (OFO)Estimated Demand
Group Title1 Managers (commercial and small emerging farmers) 264 3702 Professionals 4 1413 Technicians and Trade workers 8 9255 Clerical and administrative workers 8006 Sales workers 4007 Machinery operators and drivers 5 8008 Elementary workers 226 250
Total 510 686Source AgriSETA WSP data and SSP demand forecasts
Research needs going forward
As has been set out in the sector analysis and the scenarios derived from that analysis the sector is faced by both significant and profound change and also great uncertainty It therefore follows that the task of focussing limited resources (basically levy income in the formal sector and NSF funds for the emergent farming sector) is difficult Whilst the general thrust of training remains broadly as described in the 2006‐10 SSP Updates some considerable work is required to achieve targeted effective interventions during the 2011‐2016 period The following research questions will need to be addressed in preparing the next SSP
bull In relation to the managers and owner‐managers of commercial farms and enterprises what skills are needed to enable them to help bring about the more optimistic scenario and manage the risks associated with the less optimistic ones
bull In terms of professional and technical competencies do the current education and training institutions coupled with the learning programmes available through the AgriSETA (learnerships skills programmes and the like) meet the needs of the sector
bull In the emerging agricultural sector do the current programmes funded by sources external to the AgriSETA (eg NSF) meet all the identified needs What gaps are there and how should they be addressed
bull In relation to governmentrsquos growth strategy and industrial action plans what skills are required for developing the aquaculture sub‐sector What programmes are available How can the SETA support the skills needs for this sub‐sector
bull Given the increasing levels of casual and contract labour how can skills be developed to meet the needs of the formal commercial sector and the emerging enterprise sector
bull How can the demand in each of the priority areas be quantified and agreement be reached on numbers of people to be trained
Agriculture Sector Analysis 39
AgriSETA June 2010
SECTION 3 Skills Gaps and scarce skills
Scarce skills at the DAFF
The level of scarce skills at DAFF can be determined by the vacancy rate While the average vacancy rate in the department as at 31 March 2009 was 17 there were some posts that had very high vacancy rates as reflected in the table below Indicating the possibility that the Department is experiencing difficulties in finding suitable candidates in the South African labour market to fill these posts
Table 22 Scarce skill occupations and vacancy rates (DAFF March 2009) Critical occupations Number of posts Posts filled Vacancy rate ()
Agricultural animal oceanography forestry and other sciences
167 119 287
Engineering sciences related 2 1 50Engineers and related professions 13 6 538Farming forestry advisors and farm managers 11 4 636Finance and economics related 73 53 274Horticulturists foresters agricultural and forestry technicians
350 221 369
Legal related 6 4 333Mechanical engineering technicians 3 2 333Risk management and security services 6 4 333Social sciences related 1 0 100Veterinarians 34 24 294
Source DAFF Annual Report 20082009
Skills are also scarce at senior management level The department also reports on difficulties it has filling senior management services vacancies with some of them staying vacant for up to twelve months because no suitable candidates can be found The department would then resort to re‐advertisement and head hunting This was the case with 22 of 18 SMS posts in March 2009
Scarce skills in the commercial sector
The following occupations have previously been projected as scarce (extremely hard to fill vacancies) by AgriSETA in the commercial agricultural sector over the next five years
Table 23 Scarce and critical skills in the commercial agricultural sector
Occupation Code
Group Occupation Critical Skills Intervention Comments
139903 Managers Laboratory Manager
Technology AI nutrition
HET
221101 Professionals Accountant (General)
General HET
221102 Professionals Management Accountant
Farm financial management
HET Focus on support advice to farmers new enterprises
222101 Professionals Commodities Trader
Export administration supply chain
FET Learnership Skills
Agriculture Sector Analysis 40
AgriSETA June 2010
Agriculture Sector Analysis 41
Occupation Code
Group Occupation Critical Skills Intervention Comments
management Programme
224301 Professionals Economist Agricultural HET
Mainly for Department of Agriculture and para statals commodity organisations
233101 Professionals Chemical Engineer
Chemical processes in food production
HET Industries such as sugar processing
233301 Professionals Electrical Engineer
Installation and maintenance
HET Processing industry
233401 Professionals Electronics Engineer
Computerised production prosesses
HET Processing industry
233501 Professionals Industrial Engineer
Productivity and efficiency
HET Processing industry
233904 Professionals
Instrument Engineer (Defence Force)
Installation and maintenance
HET
Not for defence ‐ sugar industry
233502 Professionals Mechanical Engineer
FETHET Equity reasons
233902 Professionals Agricultural Engineer
Farm layout and infrastructure
HET Mainly in Government
311101 Technicians and trades workers
Agricultural Technician
Installation and maintenance
FETHET
234102 Professionals Agricultural Scientist
Agri research HETFET Especially in horticulture
234201 Professionals Chemist HET Processing industry
234202 Professionals Food Technologist
Food safety HACCP
FETHET Across sector
234701 Professionals Veterinarian HET Mainly in Government
311101 Technicians and trades workers
Agricultural Technician
Farm infrastructure
FET Mainly needed in government
311401 Technicians and trades workers
Chemistry Technician
FETHET EE reasons
312907 Technicians and trades workers
Chemical Engineering Technician
FET Learnership
Mainly EE reasons
312402 Technicians and trades workers
Electronic Engineering Technician
Weak stream production infra
FETHET Mainly tobacco industry
233904 Professionals
Instrument Engineer (Defence Force)
Instrument technician
FET
Occupation needed Instrument Technician (not defence force) Mainly sugar processing sector
321202 Technicians and trades workers
Diesel Motor Mechanic
FET Learnership
To include tractor mechanic
321204 Technicians and trades workers
Small Engine Mechanic
Agricultural equipment
FET Learnership
Throughout sector
AgriSETA June 2010
Agriculture Sector Analysis 42
Occupation Code
Group Occupation Critical Skills Intervention Comments
322301 Technicians and trades workers
Metal Fabricator
Artisan FET Learnership
322303 Technicians and trades workers
Welder Welder (First Class)
Artisan FET Learnership
323203 Technicians and trades workers
Fitter‐Welder Artisan FET Learnership
Mainly sugar ndash multi‐skilled
323202 Technicians and trades workers
Fitter And Turner
Artisan FET Learnership
Tobacco and sugar
323501 Technicians and trades workers
Millwright Artisan FET Learnership
Wide‐spread need
341101 Technicians and trades workers
Electrician (General)
Artisan FET Learnership
Wide‐spread need
342101 Technicians and trades workers
Air‐Conditioning And Refrigeration Mechanic
Artisan FET Learnership
Sugar pack houses cold chain
Source AgriSETA Sector Skills Plans
Supply of skills
South Africarsquos agriculture skills are produced in high schools agricultural colleges FET colleges and Higher Education institutions In high school a large cohort of learners take Agricultural Science as a subject In 2003 there were 42 Agricultural High Schools offering Agricultural Science as a subject These students and those in high schools taking the subject could progress to taking agriculture as a focus area for further education In 2004 there were 10 FET colleges offering vocationally directed agricultural programmes These FET colleges offered complete qualifications and short courses Eleven Colleges of Agriculture can offer qualifications up to degree level and 19 universities offer qualifications in Agriculture ranging from agricultural economics animal and plant sciences and horticulture among others at under and post graduate levels (Department of Agriculture 2006) While long term planning of skilling of new entrants in the sector can be done through close consultation between the sector agricultural schools and colleges FET colleges and HET institutions so that they teach relevant skills there are other avenues for training for those who are already employed in the sector for example skills programmes and learnerships There are 15 registered qualifications for the primary agriculture sub sectors Currently AgriSETA has 94 registered learnerships that can address the skills needs of the identified scarce skills These are captured in Appendix 2 AgriSETA has approved accredited a number of training providers across the country to deliver the theoretical and practical components of these learnerships These include agricultural colleges FET colleges and private providers Currently the AgriSETA has 246 registered and approved providers distributed nationally as follows
AgriSETA June 2010
Table 29 AgriSETA approved training providers (2010) Province Number of providers
Gauteng 72
(29)
KwaZulu Natal 20
(8)
Limpopo 35
(14)
North West 30
(12)
Northern Cape 3
(1)
Free State 15
(6)
Mpumalanga 14
(6)
Western Cape 26
(11)
Eastern Cape 31
(13) Total 246
The providers are small to large organisations In primary agriculture small providers appear to offer the most training in rural areas and community projects (AgriSETA 2010) Most of the operating providers will be in FET colleges and agricultural colleges The AgriSETA is unable to meet the total demands for skills across the duality of their sector There seems to be fairness in the approval of training for both permanent and casual and seasonal workers In 200809 the AgriSETA approved 559 learnerships as follows
Table 30 AgriSETA learnerships approved for grant purposes (2008‐2009)
Source AgriSETA learnership data analysis
Agriculture Sector Analysis 43
AgriSETA June 2010
Agriculture Sector Analysis 44
Provision of skills programmes in the same year attracted grants for 2 706 employees
Table 31 Participation by learners in skills programmes in the AgriSETA (200809)
Source AgriSETA Skills programmes data analysis
AgriSETA June 2010
APPENDIX 1 Skills demand in the Department of Agriculture Forestry amp Fisheries (200809)
Source DAFF Annual Report 2008‐20009
Agriculture Sector Analysis 45
AgriSETA June 2010
Agriculture Sector Analysis 46
Appendix 2 AgriSETA registered learnerships Registered Learnership NQF Level SAQA Registration NoLearnership in Agri Sales and Service 4 22 Q 220001 20 178 4Learnership Agricultural Machinery Technician 2 22 Q 220007 20 160 2Learnership in Specialist Agricultural Machinery Technician 5 22 Q 220009 21 258 5Agri Trade Processes 2 22 Q 220013 30 125 2FETC Meat Examination Applying Basic Business Principles 4 30 Q 3000 2823 164 4Further Education and Training Certificate Seed Marketing Execute Seed Trials 4 22 Q 220025 21 126 4Further Education and Training Certificate Seed Research and Development Certify as Seed Unit 4 22 Q 220027 21 121 4FETC Seed Research and Development Conduct a Field Inspection of a Seed Unit 4 22 Q 220028 20 120 4Seed Research and Development Operations Operate in a Team 3 22 Q 220020 22 121 3Seed Research and Development Operations Apply Basic Business Principles 3 22 Q 220021 22 121 3National Certificate Seed Processing and Packaging Operate in a Team 3 22 Q 220026 21 123 3Sugar Industry Technical Maintenance worker 2 22 Q 220011 39 128 2National Certificate Sugar Manufacturing and Refining Technical Maintenance 3 30 Q300003 23 146 3Further Education and Training Certificate Manufacturing Technical MaintenanceProduce Components by Performing Engineering Turning Operations
4 30 Q 3000 1321 173 4
FETC Manufacturing Technical Maintenance Produce Components by Performing Milling Operations 4 30 Q 3000 1521 173 4 FETC Manufacturing Technical Maintenance Develop and Fabricate from Complex Drawing 4 30 Q 3000 1420 173 4National Certificate in Sugar Technology 5 22 Q 220036 22 140 5Further Education and Training Certificate Sugar Processing 4 22 Q 220035 31 144 4National Certificate in Sugar Technology Processing Sugar Refining 2 22 Q 220037 28 124 2National Certificate in Sugar Technology Processing Juice Preparation 2 22 Q 220038 28 124 2National Certificate in Sugar Technology Processing Crystallisation 2 22 Q 220039 27 122 2National Certificate in Sugar Technology Processing Laboratory Practice 2 22 Q 220040 25 124 2National Certificate in Sugar Technology Processing Extraction 2 22 Q 220041 28 122 2NC Rooibos Production Applying Basic Business Principles 2 30 Q 3000 2427 130 2 NC Rooibos Processing Applying Basic Business Principles 2 30 Q 3000 2224 123 2 National Certificate Cigarette Production 3 22 Q 220046 23 121 3
AgriSETA June 2010
REFERENCES AgriSETA 2010 AgriSETA 20082009 Annual report Pretoria AgriSETA Agricultural Research Council httpwwwarcagriczahomeasppid=272 Avert South African HIV and AIDS statistics Available on httpwwwavertorgsafricastatshtm Centre for Development Enterprise 2008 Land reform in South Africa Getting back on track CDE Research No 16 DAFF 2010 Quarterly economic review of the agriculture sector Pretoria DAFF DAFF 2009 Annual report 20082009 Pretoria DAFF Department of Agriculture 2008 Strategic plan 2008 Pretoria Department of Agriculture DTI An introduction to the South African economy Available on httpwwwthedtigovzapublicationsagroprocessinghtm Eastern Cape Provincial Government Eastern Cape Provincial Growth and Development Strategy 2004 ndash 2014 Economic Commission for Africa 2009 Developing African agriculture through regional value chains Addis Ababa Economic Commission for Africa Economic Report Free State Province 2005 Provincial Growth and Development Strategy 2005 ndash 2014 GCIS 2010 SA Yearbook 200910rdquo Agriculture forestry and fisheries Pretoria GCIS Greenberg S 2010 Status report on land and agricultural policy in South Africa 2010 Institute for Poverty Land and Agrarian Studies School of Government University of the Western Cape Research report Ingelozi Management Solutions 2008 HIVAIDS in the South African agricultural sector Towards the development of a long term intervention Research report KwaZulu Natal Provincial Government 2006 KwaZulu Natal Provincial Growth and Development Strategy Limpopo Provincial Government Growth and Development Strategy 2004 ndash 2014 Mhone G (2000) Enclavity and Constrained Labour Absorbtive Capacity in Southern African Countries Geneva International Labour Office Moyo S The Agrarian question and the developmental state in South Africa In Edigheji O et al 2010 Constructing a democratic developmental state in South Africa HSRC PRESS
Agriculture Sector Analysis 47
AgriSETA
Agriculture Sector Analysis
National Treasury Republic of South Africa 2010 National Budget 2010 ndash National Budget Review 2010 Pretoria National Treasury Northern Cape Provincial Government Agriculture and agro‐processing sector strategy North West Provincial Government North West Provincial Growth and Development Strategy 2004 ndash 2014 Province of the Western Cape 2008 The Ikapa growth and development strategy White Paper SABCOHA SA Business Coalition on HIV and AIDS wwwsabcohaorg SACAU httpwwwsacauorghostingsacauSacauWebnsfHomehtmOpenForm South African Government 2010 20102011 ndash 20122013 Industrial Policy Action Plan Republic of South Africa Statistics South Africa 2005 Census of commercial agriculture 2002 Report No 110201 Pretoria Statistics South Africa Statistics South Africa 2009 Census of commercial agriculture 2007 Statistical release P1101 Pretoria Statistics South Africa Statistics South Africa 2010 General household survey 2009 Statistical release P0318 Pretoria Statistics South Africa Statistics South Africa 2010 Gross domestic product first quarter 2010 Statistical release P0441 Pretoria Statistics South Africa Statistics South Africa 2010 Quarterly labour force survey Quarter 1 2010 Statistical release P0211 Pretoria Statistics South Africa Vink N amp van Rooyen J 2009 The economic performance of agriculture in South Africa since 1994 The implications for food security Pretoria DBSA development planning division working paper series No 17 Webster E 2004 the Dual Economy from a book by Van Holdt K and Webster E Work restructuring and the Crisis of Social reproduction and 10 years of restructuring post apartheid workplaces University of Natal Press Workinfocom httpwwwworkinfocomfreesub_for_legresdatalraempassoc3htm Xingwana L 2008 Challenges and Opportunities for Land and Agrarian Reform towards 2025 Speech delivered at the Agri‐Consultation Protea Ranch Hotel Polokwane 30 July 2008
- Table of contents
- SECTION 1 THE AGRICULTURAL LANDSCAPE
- 11 Size and shape of the Agricultural sector
-
- Overview
- Distribution of agricultural production
- The structure of the agriculture sector in South Africa
- Categories of farming enterprises
- Employment trends
- Employment categories and remuneration
- Stakeholders in the Agricultural sector
-
- National government departments
- Sector representatives
-
- 12 Factors impacting development in the Agriculture sector
-
- Future sector economic growth and development
-
- South African sector growth plans (IPAP2)
- International Trade
- Global recession and rise in food prices
-
- Land reform
- Reliance on imports
- Water
- The labour market
- Consumer trends
- HIVAIDS
- Farm safety and security
- Broad-based Black Economic Empowerment
-
- Conclusions and scenarios
- SECTION 2 DEMAND FOR SKILLS
-
- AgriSETA registered employers and employee coverage
- Employee coverage in the AgriSETA
-
- 21 Skills demand
-
- The National Education and Training Strategy for Agriculture (AET Strategy)
- AGRISETA sector skills planning demand data (2008-2009)
- AgriSETA WSP analyses
-
- Skills demand in the commercial agricultural sector
-
- Skills demand forecasting by AgriSETA
- Research needs going forward
-
- SECTION 3 Skills Gaps and scarce skills
-
- Scarce skills at the DAFF
- Scarce skills in the commercial sector
- Supply of skills
-
- APPENDIX 1 Skills demand in the Department of Agriculture Forestry amp Fisheries (200809)
- Appendix 2 AgriSETA registered learnerships
-
AgriSETA June 2010
codified during WSP data‐capturing including allocation by sub‐sector What can be stated is that employment of males is more dominant than that of women and more Africans are employed in the sector than other groups Employment of people with disabilities is below 1
21 Skills demand
The National Education and Training Strategy for Agriculture (AET Strategy)
The AET Strategy developed by the Department of Agriculture Fisheries and Forestry (in consultation with various key stakeholders in the agricultural sector) highlights priority skills needs and constraints within the sector and categorises needs within the following 5 broad areas
1 Agricultural production ndash requesting that the past focus on a narrow band of commodities (relevant mainly to the commercial sector) and related research be expanded to address the needs of small‐scale and subsistence farmers (eg more focus on mixed farming and rural livelihood sustainability skills)
2 Agricultural engineering ndash with specific focus to be placed on technologies suitable for small‐scale farmers (eg relevant and post‐harvesting techniques related to processing and storage of produce) ndash to address this need the scarcity of agricultural engineers requires attention
3 Agricultural economics ndash a critical need was identified for general agricultural economic skills (ranging spectrum of farm planning farm management enterprise management marketing finance etc) ndash with the need to training both farmers and extension officers in such fields
4 Agricultural development ndash a specific need was identified to develop agricultural extensionists in supporting especially emerging and small‐scale farmers over the full spectrum (a need exists for both new curriculum in the training of new extensionists and the re‐training and upgrading of existing officers)
5 Veterinarians ndash the need to develop state veterinarians in order for the state to perform its role and function (particularly in its preventative monitoring and regulatory role and function)
AGRISETA sector skills planning demand data (2008‐2009)
The following section reflects initial research on skills demand in the Agricultural sector arising from the sector analysis (section 1) previous AGRISETA skills demand research for Sector Skills Planning during 2005‐2009 and analysis of WSP data from 2009 With the introduction of the Organising Framework of Occupations and agreement on definitions for scarce and critical skills in 200506 the AGRISETA undertook an extensive research and consultation processes to determine skills development priorities for the sector The research methodology employed was based on the a four dimensional topology for establishing and evaluating skills needs illustrated in the figure below
Agriculture Sector Analysis 31
AgriSETA June 2010
Agriculture Sector Analysis 32
The identification and prioritisation of skills needs was also undertaken from a key stakeholder and beneficiary perspective Consideration was given to needs of the following groups
bull The unemployed ndash helping them gain andor regain entry to the labour market bull The economically inactive ndash helping them to become economically active bull School leavers ndash helping them gain access to further education and training opportunities
and thus facilitating their entry to the job market bull Entrants to the job market ndash facilitating employment and integration into the work culture
and work ethic (improving the employability of an individual) bull Those currently employed in the sector ndash increasing their competency and opportunities
for advancement creating a career path and offering continued job security enhancement of value adding to the sector improving their prospects for better employment opportunities
bull Organisations and enterprises within the sector ndash making sure that skills development and knowledge creation occurs in such a way as to improve the sectorrsquos viability and allowing companiesenterprises to become more sustainable and profitable along the way improving productivity competitiveness and innovation within organisations
In organising and reporting the identified priority skills development needs (200809) the following structuring approach was followed
Tier 1 The four categories of needs as per the Topology presented above were used for the identification evaluation and grouping of needs
Pay conditions
Image
RECRUITMENT DIFFICULTY
SKILLSGAP
SKILLSSHORTAGE
LABOURSHORTAGE
Firms experience difficulty recruiting This does not necessary imply a skills shortage ndash may indicate a poor image remuneration etc
Those currently in work do not have the requisite skills set to carry out their job to an optimum standard
Required skills are in short supply when compared with the demand across the whole labour market
Regardless of skills levels a situation exists where there is simply not enough supply of labour to meet demand
Pay conditions
Image
RECRUITMENT DIFFICULTY
SKILLSGAP
SKILLSSHORTAGE
LABOURSHORTAGE
Firms experience difficulty recruiting This does not necessary imply a skills shortage ndash may indicate a poor image remuneration etc
Those currently in work do not have the requisite skills set to carry out their job to an optimum standard
Required skills are in short supply when compared with the demand across the whole labour market
Regardless of skills levels a situation exists where there is simply not enough supply of labour to meet demand
Figure 4 Topology for identifying skills development priorities
Source AGRISETA SSP Annual Update August 2009
AgriSETA June 2010
Tier 2 Within each of the first tier groupings needs were further broken down and organised per target group At this second level needs were grouped by
o General skills development needs (cross‐cutting over different target groups) o Needs experienced by small scale farmers (this group included subsistence
farmers new emerging land reform beneficiaries and small‐scale AgriBEE farmers) o Needs within the commercial agricultural sector (per sub‐sector groupings where
specific needs for such were identified ndash both on‐farm needs and within the secondary sub‐sector or related agri‐businesses)
o Needs of the Department of Agriculture Fisheries and Forestry (DAFF) To further guide and direct the identification and selection of scarce and critical skills the following factors or criteria that could reflect the importance (impact and effect) of a skills shortages were developed as an identification framework
1 Basic Skills Development Promoting basic literacy and numeracy and raising the base level of education for the sector improving the work and livelihood of existing workers
2 Employability Making the employee more employable by improving the fit between their skills and the sector needs
3 Enterprise Viability Improving the capability and feasibility of the enterprise by increasing its effectiveness of or possibilities for profit generation etc
4 Enterprise Sustainability Allow enterprises to survive and grow over an extended period of time without compromising the value of renewable resources thereby creating long‐term meaningful employment for larger numbers of people
5 Sector Growth Enabling the sector to develop or pursue new opportunities or improve the effectiveness of current operations
6 Sector Competitiveness Enabling the sector to compete more effectively in the international arena improving market intelligence and interpretation productivity cost efficiency etc
7 Human Resource Development Capacity Improving the access to quality provision of training to the agri sector
Based on this research and consultation framework the following skills development needs and priorities were identified
Agriculture Sector Analysis 33
AgriSETA June 2010
GENERAL NEEDS SMALL‐SCALE FARMER
NEEDS COMMERCIAL SECTOR
NEEDS DAFF NEEDS
RECRUITMENT RELATED SKILLS NEEDS Primary agriculture is the entry point into the world of work for large numbers of people in rural areas However the sector has negative connotations amongst sections of the youth and in parts of the country and is viewed as a last resort for some in the search for employment) The effect is that despite an unemployment rate of approximately 26 (now over 30) farmers find it difficult to recruit workers to meet seasonal demands This has resulted in the government approving the contracting of foreign labour to meet such temporary needs (workers are recruited mainly from Zimbabwe and Mozambique)
Labour in this farming sector is provided primarily by family members and no real recruitment constraints can be identified
The agricultural sector still manages to attract technical and management skills as it is perceived to include a better lifestyle and there is a strong tradition of agriculture in SA Increasing crime related security risks associated with farming may have a negative impact
The Department has identified a number of occupations in which they are experiencing long‐term vacancies Some of these result from a general shortage of such skills in SA while others arise from the inability of the public sector to compete with the private sector (less favourable employment image working conditions and equity considerations) Priority vacancies include Veterinarians Agricultural
Engineers Plant Health
Specialists Agricultural
Statisticians Plant Health Pest Risk
Analysts ICT Specialists Agricultural
Economists Agricultural Food and
Quarantine Technicians
Agro‐meteorologists Pasture Scientists Plant Production
Specialists Specialised Food
Analysts SKILLS GAPS RELATED NEEDS
bull Low literacy and numeracy levels ndash both amongst workers within the sector at large and at ownermanager level in many of the small‐scale farming
bull Farm management
Farm Management (Mainly owners managers) bull Farm management amp
entrepreneurship bull Resource
management and record keeping
bull Financial planning
A critical constraint is the poor educational levels of a large proportion of the labour force in the sector demanding a considerable effort and investment in ABET and other life skills
A particularly big need exists for skills upgrading amongst Extension Officers ndash particularly with regard to redress the historical neglect of small‐scale farmers and resource strapped farmers
Agriculture Sector Analysis 34
AgriSETA June 2010
Agriculture Sector Analysis 35
GENERAL NEEDS SMALL‐SCALE FARMER
NEEDS COMMERCIAL SECTOR
NEEDS DAFF NEEDS
skills (and general management skills in other agricultural businesses) coupled with a business orientation and entrepreneurship skills
bull A general need to increase compliance with environmental occupational health and safety animal welfare produce safety and hygiene standards regulations and requirements (local and international standards)
and management bull Project management bull Business plan
development Marketing and processing bull Processing and
packaging bull Transport
management bull Marketing produce
including branding bull Planning for
marketing bull Knowledge of
markets Technical knowledge and skills bull Production
management (related to specific enterprise)
bull Demonstration of production techniques
bull Natural resources management
Mechanical knowledge bull Farm maintenance bull Repairs of machinery
and equipment bull Electrical
maintenance and installation
programmes Need for improved management skills and relevant technological knowledge for increasing productivity levels and improved production methods Rising importance for environmentally responsible production and processing management systems Rising competitive and international markets increases need for business and marketing abilities among owners and managers Increasing requirements for compliance with environmental health and safety and international trade standards Information technology although not a priority is increasing in importance Business management ability is becoming increasingly important as more farmers are making decisions about restructuring their businesses diversification and developing supplementary sources of income
Critically improved farm management and business skills within an agricultural context to support the majority of BEE and emerging farmers Skills upgrading requirements for existing Extension Officers include bull Agricultural
economics bull Agricultural
management bull Business and
financial management
bull Technical and production related skills including o Animal husbandryo Poultry o Crop production o Horticulture
SKILLS SHORTAGES Generally SA has a shortage of entrepreneurs and people who have the business acumen drive motivation and
The profile of these farmers reflects a large contingent of older and less educated people who are generally less flexible tend to stick to
The commercial agri sector will increasingly have to compete in the global market and the ever increasing need to increase productivity to
DAFF us experiencing problems are especially sourcing people in specialised science related fields (learning fields experiencing few
AgriSETA June 2010
Agriculture Sector Analysis 36
GENERAL NEEDS SMALL‐SCALE FARMER
NEEDS COMMERCIAL SECTOR
NEEDS DAFF NEEDS
perseverance to become a successful farmer Given the high risks involved in the agricultural sector (natural elements outside onersquos control) the agri sector does not compete successfully for this ldquoscarce resourcerdquo Moreover as with other professional and skilled occupations there is a tendency for younger qualified people to move to urban areas
known practices and are less likely to experiment with new technology Within this target group candidates with good entrepreneurial ability are scarce There is a perceived shortage of Agricultural Extensionists and advisors to assist this target group However a large pool of young unemployed graduates exists who could assist such emerging farmers if they were mobilised and made accessible to farmers Similarly the potential pool of retired commercial farmers who could serve as mentors to this target group
remain profitable and viable it can be stated that many of the existing farmers and managers owners lack business management and entrepreneurial orientation Equity policy and the need to become BEE compliant requires that commercial enterprises appoint and develop black owners directors managers Changing local and global consumer preferences require farmers to change traditional farming methods and practices Skills and knowledge requirements include bull Global food and
international quality standards
bull Product traceability requirements
bull Organic produce and products
Specific occupations identified as being in short supply are
bull Production Managers (food processing)
bull Product specialisation to international specifications (research skills)
bull Forklift drivers heavy vehicletruck drivers and mobile plant operators
bull Experienced and competent artisans (millwrights electricians fitters
enrolments andor pass rates at HET institutions with the result that too few qualified persons come onto the labour market) Examples of such skills shortages identified by the Department include Agricultural Engineers bull Plant Health
Specialists (Nematology Entomology Plant Pathology)
bull Statisticians (specialised agricultural knowledge)
bull Plant Health Pest Risk Analysts
bull Agricultural Economists (production and resource economists)
bull Agricultural Food and Quarantine Technicians
bull Agro‐meteorologists Early warning Specialists
bull Pasture Scientists bull Plant Production
Specialists (eg ornamental crops hydroponics)
bull Specialised Food Analysts (pesticide residue analysts processed food and dairy analysts wine and spirit analysts)
AgriSETA June 2010
Agriculture Sector Analysis 37
GENERAL NEEDS SMALL‐SCALE FARMER
NEEDS COMMERCIAL SECTOR
NEEDS DAFF NEEDS
and turners bull Agricultural
Equipment Technicians
bull Pest and weed controllers
bull Horticultural specialists
LABOUR SHORTAGES AND RELATED SKILLS NEEDS Given an employment rate of some 26 (2009 currently estimated at over 30expanded definition) per definition there cannot be a labour shortage It is however difficult for people who have never worked before to integrate into the agricultural sector workforce Coupled with an aging workforce (30‐60 being over 40) means that most agri enterprises will within the next 5‐10 years be looking at replacing a large proportion of their workforce There could be an insufficient pool of people willing and able to participate The impact of HIVAIDS is also not always factored in to understanding the diminishing pool of resources available Labour shortages have been reported within selected geographical areas and in particular occupations Examples include cane cutters in the sugar industry chicken catchers in the poultry industry pickers in the fruit industry and animal handlers in feedlots as well as dairy parlour workers It is however believed that these shortages may reflect a recruitment problem as a result of the very harsh working conditions and the relatively poor remuneration (which makes these occupations unpopular) At present such ldquoshortagesrdquo are addressed through contracting labour from neighbouring countries
AgriSETA WSP analyses
Skills demand in the commercial agricultural sector
Information for demand for skills from WSP data is available for 1 673 employers who submitted their WSPs for the 200910 period The table below shows data on sub‐sector WSP submission relative to size of the sub‐sector as well as subsector data from all registered organisations and those who submitted WSPs Data for registered employers shows that there were 239 076 employees employed by the 17 234 registered organisations As previously stated 97 898 employees were employed by the organisations submitting WSPs This constitutes 41 of employees employed by registered organisations
Table 20 Employment and sub‐sector data drawn from WSP analyses
Sub‐sector
All Re
gistered
Employers
Small employers (0‐49)
Med
ium and
large
employers (50+)
Total W
SPs received
Total W
SPs received
as of
all registered em
ployers
WSP
received med
ium and
large orgs
WSPs received
as of
med
ium amp large em
ployers
WSPs received
small
employers
WSPs received
as of small
enterprises
EmployeesPer
Profile
CoffeeTea 40 33 7 9 23 5 71 4 12 483 Fibre 1 710 1 676 34 34 2 22 65 12 07 6 539
AgriSETA June 2010
Agriculture Sector Analysis 38
Sub‐sector
All Re
gistered
Employers
Small employers (0‐49)
Med
ium and
large
employers (50+)
Total W
SPs received
Total W
SPs received
as of
all registered em
ployers
WSP
received med
ium and
large orgs
WSPs received
as of
med
ium amp large em
ployers
WSPs received
small
employers
WSPs received
as of small
enterprises
EmployeesPer
Profile
Fruit 371 277 94 162 44 76 81 86 31 27 873 Grain 648 581 67 77 12 48 72 29 5 22 129 Milling 335 279 56 61 18 35 63 26 9 4 630 Pest Control 213 209 4 8 4 2 50 6 3 119 Poultry 391 305 86 66 17 46 53 20 7 19 187 Primary 12 121 10 776 1 345 1144 9 513 38 631 6 136 034 Red meat 1107 1 018 89 70 6 45 51 25 2 7 475 Seed 167 149 18 24 14 13 72 11 7 2 127 Sugar 71 45 26 13 18 10 38 3 7 10 478 Tobacco 60 46 14 5 8 3 21 2 4 2 002
Totals 17 234 15 394 1 840 1 673 10 818 44 855 16 239 076
Source 1 AgriSETA WSP 2009 data
Only 10 of all registered employers submitted WSPs for the 200910 period Of these 49 were medium and large sized employers and 51 small However only 16 small employers submitted their WSPs relative to the number of registered small employers and 44 medium and large employers submitted WSPs relative to the number of registered medium and large employers As such skills demand statistics provides more representative data on the requirements of medium and large employers Data for skills demand in the commercial agricultural sector is based on data for permanent employees as well as casual and seasonal employees
Skills demand forecasting by AgriSETA
Forecasting for skills demand the AgriSETA has estimated that the demand for skilled employees at different levels in the next few years is 510 686 This is based on WSP data analyses over the last 5 years and projected demand for the formal commercial agricultural sector and factoring in the demand that at maximum would result from completion of the land restitution programme in South Africa The table below reflects the skills that are on demand as well as the estimates for demand over the next five years by major occupational category35
35 AgriSETA 2010
AgriSETA June 2010
Table 21 Demand for skills by occupational category
Major Occupation (OFO)Estimated Demand
Group Title1 Managers (commercial and small emerging farmers) 264 3702 Professionals 4 1413 Technicians and Trade workers 8 9255 Clerical and administrative workers 8006 Sales workers 4007 Machinery operators and drivers 5 8008 Elementary workers 226 250
Total 510 686Source AgriSETA WSP data and SSP demand forecasts
Research needs going forward
As has been set out in the sector analysis and the scenarios derived from that analysis the sector is faced by both significant and profound change and also great uncertainty It therefore follows that the task of focussing limited resources (basically levy income in the formal sector and NSF funds for the emergent farming sector) is difficult Whilst the general thrust of training remains broadly as described in the 2006‐10 SSP Updates some considerable work is required to achieve targeted effective interventions during the 2011‐2016 period The following research questions will need to be addressed in preparing the next SSP
bull In relation to the managers and owner‐managers of commercial farms and enterprises what skills are needed to enable them to help bring about the more optimistic scenario and manage the risks associated with the less optimistic ones
bull In terms of professional and technical competencies do the current education and training institutions coupled with the learning programmes available through the AgriSETA (learnerships skills programmes and the like) meet the needs of the sector
bull In the emerging agricultural sector do the current programmes funded by sources external to the AgriSETA (eg NSF) meet all the identified needs What gaps are there and how should they be addressed
bull In relation to governmentrsquos growth strategy and industrial action plans what skills are required for developing the aquaculture sub‐sector What programmes are available How can the SETA support the skills needs for this sub‐sector
bull Given the increasing levels of casual and contract labour how can skills be developed to meet the needs of the formal commercial sector and the emerging enterprise sector
bull How can the demand in each of the priority areas be quantified and agreement be reached on numbers of people to be trained
Agriculture Sector Analysis 39
AgriSETA June 2010
SECTION 3 Skills Gaps and scarce skills
Scarce skills at the DAFF
The level of scarce skills at DAFF can be determined by the vacancy rate While the average vacancy rate in the department as at 31 March 2009 was 17 there were some posts that had very high vacancy rates as reflected in the table below Indicating the possibility that the Department is experiencing difficulties in finding suitable candidates in the South African labour market to fill these posts
Table 22 Scarce skill occupations and vacancy rates (DAFF March 2009) Critical occupations Number of posts Posts filled Vacancy rate ()
Agricultural animal oceanography forestry and other sciences
167 119 287
Engineering sciences related 2 1 50Engineers and related professions 13 6 538Farming forestry advisors and farm managers 11 4 636Finance and economics related 73 53 274Horticulturists foresters agricultural and forestry technicians
350 221 369
Legal related 6 4 333Mechanical engineering technicians 3 2 333Risk management and security services 6 4 333Social sciences related 1 0 100Veterinarians 34 24 294
Source DAFF Annual Report 20082009
Skills are also scarce at senior management level The department also reports on difficulties it has filling senior management services vacancies with some of them staying vacant for up to twelve months because no suitable candidates can be found The department would then resort to re‐advertisement and head hunting This was the case with 22 of 18 SMS posts in March 2009
Scarce skills in the commercial sector
The following occupations have previously been projected as scarce (extremely hard to fill vacancies) by AgriSETA in the commercial agricultural sector over the next five years
Table 23 Scarce and critical skills in the commercial agricultural sector
Occupation Code
Group Occupation Critical Skills Intervention Comments
139903 Managers Laboratory Manager
Technology AI nutrition
HET
221101 Professionals Accountant (General)
General HET
221102 Professionals Management Accountant
Farm financial management
HET Focus on support advice to farmers new enterprises
222101 Professionals Commodities Trader
Export administration supply chain
FET Learnership Skills
Agriculture Sector Analysis 40
AgriSETA June 2010
Agriculture Sector Analysis 41
Occupation Code
Group Occupation Critical Skills Intervention Comments
management Programme
224301 Professionals Economist Agricultural HET
Mainly for Department of Agriculture and para statals commodity organisations
233101 Professionals Chemical Engineer
Chemical processes in food production
HET Industries such as sugar processing
233301 Professionals Electrical Engineer
Installation and maintenance
HET Processing industry
233401 Professionals Electronics Engineer
Computerised production prosesses
HET Processing industry
233501 Professionals Industrial Engineer
Productivity and efficiency
HET Processing industry
233904 Professionals
Instrument Engineer (Defence Force)
Installation and maintenance
HET
Not for defence ‐ sugar industry
233502 Professionals Mechanical Engineer
FETHET Equity reasons
233902 Professionals Agricultural Engineer
Farm layout and infrastructure
HET Mainly in Government
311101 Technicians and trades workers
Agricultural Technician
Installation and maintenance
FETHET
234102 Professionals Agricultural Scientist
Agri research HETFET Especially in horticulture
234201 Professionals Chemist HET Processing industry
234202 Professionals Food Technologist
Food safety HACCP
FETHET Across sector
234701 Professionals Veterinarian HET Mainly in Government
311101 Technicians and trades workers
Agricultural Technician
Farm infrastructure
FET Mainly needed in government
311401 Technicians and trades workers
Chemistry Technician
FETHET EE reasons
312907 Technicians and trades workers
Chemical Engineering Technician
FET Learnership
Mainly EE reasons
312402 Technicians and trades workers
Electronic Engineering Technician
Weak stream production infra
FETHET Mainly tobacco industry
233904 Professionals
Instrument Engineer (Defence Force)
Instrument technician
FET
Occupation needed Instrument Technician (not defence force) Mainly sugar processing sector
321202 Technicians and trades workers
Diesel Motor Mechanic
FET Learnership
To include tractor mechanic
321204 Technicians and trades workers
Small Engine Mechanic
Agricultural equipment
FET Learnership
Throughout sector
AgriSETA June 2010
Agriculture Sector Analysis 42
Occupation Code
Group Occupation Critical Skills Intervention Comments
322301 Technicians and trades workers
Metal Fabricator
Artisan FET Learnership
322303 Technicians and trades workers
Welder Welder (First Class)
Artisan FET Learnership
323203 Technicians and trades workers
Fitter‐Welder Artisan FET Learnership
Mainly sugar ndash multi‐skilled
323202 Technicians and trades workers
Fitter And Turner
Artisan FET Learnership
Tobacco and sugar
323501 Technicians and trades workers
Millwright Artisan FET Learnership
Wide‐spread need
341101 Technicians and trades workers
Electrician (General)
Artisan FET Learnership
Wide‐spread need
342101 Technicians and trades workers
Air‐Conditioning And Refrigeration Mechanic
Artisan FET Learnership
Sugar pack houses cold chain
Source AgriSETA Sector Skills Plans
Supply of skills
South Africarsquos agriculture skills are produced in high schools agricultural colleges FET colleges and Higher Education institutions In high school a large cohort of learners take Agricultural Science as a subject In 2003 there were 42 Agricultural High Schools offering Agricultural Science as a subject These students and those in high schools taking the subject could progress to taking agriculture as a focus area for further education In 2004 there were 10 FET colleges offering vocationally directed agricultural programmes These FET colleges offered complete qualifications and short courses Eleven Colleges of Agriculture can offer qualifications up to degree level and 19 universities offer qualifications in Agriculture ranging from agricultural economics animal and plant sciences and horticulture among others at under and post graduate levels (Department of Agriculture 2006) While long term planning of skilling of new entrants in the sector can be done through close consultation between the sector agricultural schools and colleges FET colleges and HET institutions so that they teach relevant skills there are other avenues for training for those who are already employed in the sector for example skills programmes and learnerships There are 15 registered qualifications for the primary agriculture sub sectors Currently AgriSETA has 94 registered learnerships that can address the skills needs of the identified scarce skills These are captured in Appendix 2 AgriSETA has approved accredited a number of training providers across the country to deliver the theoretical and practical components of these learnerships These include agricultural colleges FET colleges and private providers Currently the AgriSETA has 246 registered and approved providers distributed nationally as follows
AgriSETA June 2010
Table 29 AgriSETA approved training providers (2010) Province Number of providers
Gauteng 72
(29)
KwaZulu Natal 20
(8)
Limpopo 35
(14)
North West 30
(12)
Northern Cape 3
(1)
Free State 15
(6)
Mpumalanga 14
(6)
Western Cape 26
(11)
Eastern Cape 31
(13) Total 246
The providers are small to large organisations In primary agriculture small providers appear to offer the most training in rural areas and community projects (AgriSETA 2010) Most of the operating providers will be in FET colleges and agricultural colleges The AgriSETA is unable to meet the total demands for skills across the duality of their sector There seems to be fairness in the approval of training for both permanent and casual and seasonal workers In 200809 the AgriSETA approved 559 learnerships as follows
Table 30 AgriSETA learnerships approved for grant purposes (2008‐2009)
Source AgriSETA learnership data analysis
Agriculture Sector Analysis 43
AgriSETA June 2010
Agriculture Sector Analysis 44
Provision of skills programmes in the same year attracted grants for 2 706 employees
Table 31 Participation by learners in skills programmes in the AgriSETA (200809)
Source AgriSETA Skills programmes data analysis
AgriSETA June 2010
APPENDIX 1 Skills demand in the Department of Agriculture Forestry amp Fisheries (200809)
Source DAFF Annual Report 2008‐20009
Agriculture Sector Analysis 45
AgriSETA June 2010
Agriculture Sector Analysis 46
Appendix 2 AgriSETA registered learnerships Registered Learnership NQF Level SAQA Registration NoLearnership in Agri Sales and Service 4 22 Q 220001 20 178 4Learnership Agricultural Machinery Technician 2 22 Q 220007 20 160 2Learnership in Specialist Agricultural Machinery Technician 5 22 Q 220009 21 258 5Agri Trade Processes 2 22 Q 220013 30 125 2FETC Meat Examination Applying Basic Business Principles 4 30 Q 3000 2823 164 4Further Education and Training Certificate Seed Marketing Execute Seed Trials 4 22 Q 220025 21 126 4Further Education and Training Certificate Seed Research and Development Certify as Seed Unit 4 22 Q 220027 21 121 4FETC Seed Research and Development Conduct a Field Inspection of a Seed Unit 4 22 Q 220028 20 120 4Seed Research and Development Operations Operate in a Team 3 22 Q 220020 22 121 3Seed Research and Development Operations Apply Basic Business Principles 3 22 Q 220021 22 121 3National Certificate Seed Processing and Packaging Operate in a Team 3 22 Q 220026 21 123 3Sugar Industry Technical Maintenance worker 2 22 Q 220011 39 128 2National Certificate Sugar Manufacturing and Refining Technical Maintenance 3 30 Q300003 23 146 3Further Education and Training Certificate Manufacturing Technical MaintenanceProduce Components by Performing Engineering Turning Operations
4 30 Q 3000 1321 173 4
FETC Manufacturing Technical Maintenance Produce Components by Performing Milling Operations 4 30 Q 3000 1521 173 4 FETC Manufacturing Technical Maintenance Develop and Fabricate from Complex Drawing 4 30 Q 3000 1420 173 4National Certificate in Sugar Technology 5 22 Q 220036 22 140 5Further Education and Training Certificate Sugar Processing 4 22 Q 220035 31 144 4National Certificate in Sugar Technology Processing Sugar Refining 2 22 Q 220037 28 124 2National Certificate in Sugar Technology Processing Juice Preparation 2 22 Q 220038 28 124 2National Certificate in Sugar Technology Processing Crystallisation 2 22 Q 220039 27 122 2National Certificate in Sugar Technology Processing Laboratory Practice 2 22 Q 220040 25 124 2National Certificate in Sugar Technology Processing Extraction 2 22 Q 220041 28 122 2NC Rooibos Production Applying Basic Business Principles 2 30 Q 3000 2427 130 2 NC Rooibos Processing Applying Basic Business Principles 2 30 Q 3000 2224 123 2 National Certificate Cigarette Production 3 22 Q 220046 23 121 3
AgriSETA June 2010
REFERENCES AgriSETA 2010 AgriSETA 20082009 Annual report Pretoria AgriSETA Agricultural Research Council httpwwwarcagriczahomeasppid=272 Avert South African HIV and AIDS statistics Available on httpwwwavertorgsafricastatshtm Centre for Development Enterprise 2008 Land reform in South Africa Getting back on track CDE Research No 16 DAFF 2010 Quarterly economic review of the agriculture sector Pretoria DAFF DAFF 2009 Annual report 20082009 Pretoria DAFF Department of Agriculture 2008 Strategic plan 2008 Pretoria Department of Agriculture DTI An introduction to the South African economy Available on httpwwwthedtigovzapublicationsagroprocessinghtm Eastern Cape Provincial Government Eastern Cape Provincial Growth and Development Strategy 2004 ndash 2014 Economic Commission for Africa 2009 Developing African agriculture through regional value chains Addis Ababa Economic Commission for Africa Economic Report Free State Province 2005 Provincial Growth and Development Strategy 2005 ndash 2014 GCIS 2010 SA Yearbook 200910rdquo Agriculture forestry and fisheries Pretoria GCIS Greenberg S 2010 Status report on land and agricultural policy in South Africa 2010 Institute for Poverty Land and Agrarian Studies School of Government University of the Western Cape Research report Ingelozi Management Solutions 2008 HIVAIDS in the South African agricultural sector Towards the development of a long term intervention Research report KwaZulu Natal Provincial Government 2006 KwaZulu Natal Provincial Growth and Development Strategy Limpopo Provincial Government Growth and Development Strategy 2004 ndash 2014 Mhone G (2000) Enclavity and Constrained Labour Absorbtive Capacity in Southern African Countries Geneva International Labour Office Moyo S The Agrarian question and the developmental state in South Africa In Edigheji O et al 2010 Constructing a democratic developmental state in South Africa HSRC PRESS
Agriculture Sector Analysis 47
AgriSETA
Agriculture Sector Analysis
National Treasury Republic of South Africa 2010 National Budget 2010 ndash National Budget Review 2010 Pretoria National Treasury Northern Cape Provincial Government Agriculture and agro‐processing sector strategy North West Provincial Government North West Provincial Growth and Development Strategy 2004 ndash 2014 Province of the Western Cape 2008 The Ikapa growth and development strategy White Paper SABCOHA SA Business Coalition on HIV and AIDS wwwsabcohaorg SACAU httpwwwsacauorghostingsacauSacauWebnsfHomehtmOpenForm South African Government 2010 20102011 ndash 20122013 Industrial Policy Action Plan Republic of South Africa Statistics South Africa 2005 Census of commercial agriculture 2002 Report No 110201 Pretoria Statistics South Africa Statistics South Africa 2009 Census of commercial agriculture 2007 Statistical release P1101 Pretoria Statistics South Africa Statistics South Africa 2010 General household survey 2009 Statistical release P0318 Pretoria Statistics South Africa Statistics South Africa 2010 Gross domestic product first quarter 2010 Statistical release P0441 Pretoria Statistics South Africa Statistics South Africa 2010 Quarterly labour force survey Quarter 1 2010 Statistical release P0211 Pretoria Statistics South Africa Vink N amp van Rooyen J 2009 The economic performance of agriculture in South Africa since 1994 The implications for food security Pretoria DBSA development planning division working paper series No 17 Webster E 2004 the Dual Economy from a book by Van Holdt K and Webster E Work restructuring and the Crisis of Social reproduction and 10 years of restructuring post apartheid workplaces University of Natal Press Workinfocom httpwwwworkinfocomfreesub_for_legresdatalraempassoc3htm Xingwana L 2008 Challenges and Opportunities for Land and Agrarian Reform towards 2025 Speech delivered at the Agri‐Consultation Protea Ranch Hotel Polokwane 30 July 2008
- Table of contents
- SECTION 1 THE AGRICULTURAL LANDSCAPE
- 11 Size and shape of the Agricultural sector
-
- Overview
- Distribution of agricultural production
- The structure of the agriculture sector in South Africa
- Categories of farming enterprises
- Employment trends
- Employment categories and remuneration
- Stakeholders in the Agricultural sector
-
- National government departments
- Sector representatives
-
- 12 Factors impacting development in the Agriculture sector
-
- Future sector economic growth and development
-
- South African sector growth plans (IPAP2)
- International Trade
- Global recession and rise in food prices
-
- Land reform
- Reliance on imports
- Water
- The labour market
- Consumer trends
- HIVAIDS
- Farm safety and security
- Broad-based Black Economic Empowerment
-
- Conclusions and scenarios
- SECTION 2 DEMAND FOR SKILLS
-
- AgriSETA registered employers and employee coverage
- Employee coverage in the AgriSETA
-
- 21 Skills demand
-
- The National Education and Training Strategy for Agriculture (AET Strategy)
- AGRISETA sector skills planning demand data (2008-2009)
- AgriSETA WSP analyses
-
- Skills demand in the commercial agricultural sector
-
- Skills demand forecasting by AgriSETA
- Research needs going forward
-
- SECTION 3 Skills Gaps and scarce skills
-
- Scarce skills at the DAFF
- Scarce skills in the commercial sector
- Supply of skills
-
- APPENDIX 1 Skills demand in the Department of Agriculture Forestry amp Fisheries (200809)
- Appendix 2 AgriSETA registered learnerships
-
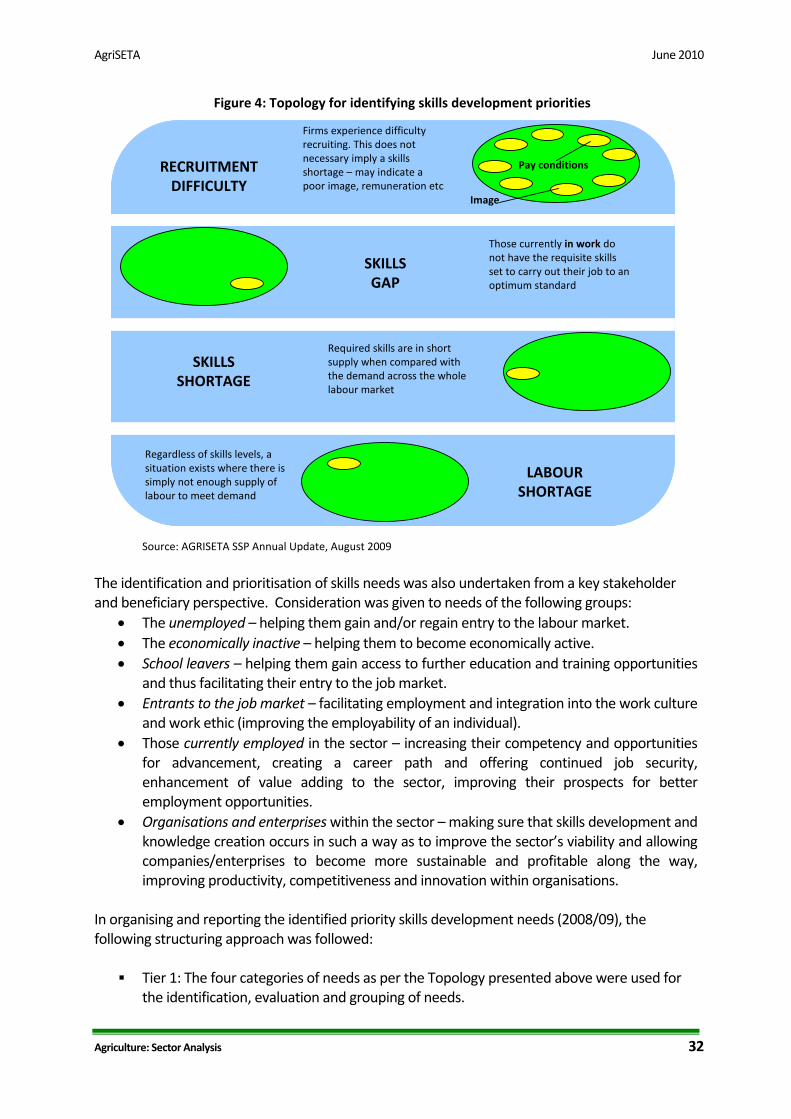
AgriSETA June 2010
Agriculture Sector Analysis 32
The identification and prioritisation of skills needs was also undertaken from a key stakeholder and beneficiary perspective Consideration was given to needs of the following groups
bull The unemployed ndash helping them gain andor regain entry to the labour market bull The economically inactive ndash helping them to become economically active bull School leavers ndash helping them gain access to further education and training opportunities
and thus facilitating their entry to the job market bull Entrants to the job market ndash facilitating employment and integration into the work culture
and work ethic (improving the employability of an individual) bull Those currently employed in the sector ndash increasing their competency and opportunities
for advancement creating a career path and offering continued job security enhancement of value adding to the sector improving their prospects for better employment opportunities
bull Organisations and enterprises within the sector ndash making sure that skills development and knowledge creation occurs in such a way as to improve the sectorrsquos viability and allowing companiesenterprises to become more sustainable and profitable along the way improving productivity competitiveness and innovation within organisations
In organising and reporting the identified priority skills development needs (200809) the following structuring approach was followed
Tier 1 The four categories of needs as per the Topology presented above were used for the identification evaluation and grouping of needs
Pay conditions
Image
RECRUITMENT DIFFICULTY
SKILLSGAP
SKILLSSHORTAGE
LABOURSHORTAGE
Firms experience difficulty recruiting This does not necessary imply a skills shortage ndash may indicate a poor image remuneration etc
Those currently in work do not have the requisite skills set to carry out their job to an optimum standard
Required skills are in short supply when compared with the demand across the whole labour market
Regardless of skills levels a situation exists where there is simply not enough supply of labour to meet demand
Pay conditions
Image
RECRUITMENT DIFFICULTY
SKILLSGAP
SKILLSSHORTAGE
LABOURSHORTAGE
Firms experience difficulty recruiting This does not necessary imply a skills shortage ndash may indicate a poor image remuneration etc
Those currently in work do not have the requisite skills set to carry out their job to an optimum standard
Required skills are in short supply when compared with the demand across the whole labour market
Regardless of skills levels a situation exists where there is simply not enough supply of labour to meet demand
Figure 4 Topology for identifying skills development priorities
Source AGRISETA SSP Annual Update August 2009
AgriSETA June 2010
Tier 2 Within each of the first tier groupings needs were further broken down and organised per target group At this second level needs were grouped by
o General skills development needs (cross‐cutting over different target groups) o Needs experienced by small scale farmers (this group included subsistence
farmers new emerging land reform beneficiaries and small‐scale AgriBEE farmers) o Needs within the commercial agricultural sector (per sub‐sector groupings where
specific needs for such were identified ndash both on‐farm needs and within the secondary sub‐sector or related agri‐businesses)
o Needs of the Department of Agriculture Fisheries and Forestry (DAFF) To further guide and direct the identification and selection of scarce and critical skills the following factors or criteria that could reflect the importance (impact and effect) of a skills shortages were developed as an identification framework
1 Basic Skills Development Promoting basic literacy and numeracy and raising the base level of education for the sector improving the work and livelihood of existing workers
2 Employability Making the employee more employable by improving the fit between their skills and the sector needs
3 Enterprise Viability Improving the capability and feasibility of the enterprise by increasing its effectiveness of or possibilities for profit generation etc
4 Enterprise Sustainability Allow enterprises to survive and grow over an extended period of time without compromising the value of renewable resources thereby creating long‐term meaningful employment for larger numbers of people
5 Sector Growth Enabling the sector to develop or pursue new opportunities or improve the effectiveness of current operations
6 Sector Competitiveness Enabling the sector to compete more effectively in the international arena improving market intelligence and interpretation productivity cost efficiency etc
7 Human Resource Development Capacity Improving the access to quality provision of training to the agri sector
Based on this research and consultation framework the following skills development needs and priorities were identified
Agriculture Sector Analysis 33
AgriSETA June 2010
GENERAL NEEDS SMALL‐SCALE FARMER
NEEDS COMMERCIAL SECTOR
NEEDS DAFF NEEDS
RECRUITMENT RELATED SKILLS NEEDS Primary agriculture is the entry point into the world of work for large numbers of people in rural areas However the sector has negative connotations amongst sections of the youth and in parts of the country and is viewed as a last resort for some in the search for employment) The effect is that despite an unemployment rate of approximately 26 (now over 30) farmers find it difficult to recruit workers to meet seasonal demands This has resulted in the government approving the contracting of foreign labour to meet such temporary needs (workers are recruited mainly from Zimbabwe and Mozambique)
Labour in this farming sector is provided primarily by family members and no real recruitment constraints can be identified
The agricultural sector still manages to attract technical and management skills as it is perceived to include a better lifestyle and there is a strong tradition of agriculture in SA Increasing crime related security risks associated with farming may have a negative impact
The Department has identified a number of occupations in which they are experiencing long‐term vacancies Some of these result from a general shortage of such skills in SA while others arise from the inability of the public sector to compete with the private sector (less favourable employment image working conditions and equity considerations) Priority vacancies include Veterinarians Agricultural
Engineers Plant Health
Specialists Agricultural
Statisticians Plant Health Pest Risk
Analysts ICT Specialists Agricultural
Economists Agricultural Food and
Quarantine Technicians
Agro‐meteorologists Pasture Scientists Plant Production
Specialists Specialised Food
Analysts SKILLS GAPS RELATED NEEDS
bull Low literacy and numeracy levels ndash both amongst workers within the sector at large and at ownermanager level in many of the small‐scale farming
bull Farm management
Farm Management (Mainly owners managers) bull Farm management amp
entrepreneurship bull Resource
management and record keeping
bull Financial planning
A critical constraint is the poor educational levels of a large proportion of the labour force in the sector demanding a considerable effort and investment in ABET and other life skills
A particularly big need exists for skills upgrading amongst Extension Officers ndash particularly with regard to redress the historical neglect of small‐scale farmers and resource strapped farmers
Agriculture Sector Analysis 34
AgriSETA June 2010
Agriculture Sector Analysis 35
GENERAL NEEDS SMALL‐SCALE FARMER
NEEDS COMMERCIAL SECTOR
NEEDS DAFF NEEDS
skills (and general management skills in other agricultural businesses) coupled with a business orientation and entrepreneurship skills
bull A general need to increase compliance with environmental occupational health and safety animal welfare produce safety and hygiene standards regulations and requirements (local and international standards)
and management bull Project management bull Business plan
development Marketing and processing bull Processing and
packaging bull Transport
management bull Marketing produce
including branding bull Planning for
marketing bull Knowledge of
markets Technical knowledge and skills bull Production
management (related to specific enterprise)
bull Demonstration of production techniques
bull Natural resources management
Mechanical knowledge bull Farm maintenance bull Repairs of machinery
and equipment bull Electrical
maintenance and installation
programmes Need for improved management skills and relevant technological knowledge for increasing productivity levels and improved production methods Rising importance for environmentally responsible production and processing management systems Rising competitive and international markets increases need for business and marketing abilities among owners and managers Increasing requirements for compliance with environmental health and safety and international trade standards Information technology although not a priority is increasing in importance Business management ability is becoming increasingly important as more farmers are making decisions about restructuring their businesses diversification and developing supplementary sources of income
Critically improved farm management and business skills within an agricultural context to support the majority of BEE and emerging farmers Skills upgrading requirements for existing Extension Officers include bull Agricultural
economics bull Agricultural
management bull Business and
financial management
bull Technical and production related skills including o Animal husbandryo Poultry o Crop production o Horticulture
SKILLS SHORTAGES Generally SA has a shortage of entrepreneurs and people who have the business acumen drive motivation and
The profile of these farmers reflects a large contingent of older and less educated people who are generally less flexible tend to stick to
The commercial agri sector will increasingly have to compete in the global market and the ever increasing need to increase productivity to
DAFF us experiencing problems are especially sourcing people in specialised science related fields (learning fields experiencing few
AgriSETA June 2010
Agriculture Sector Analysis 36
GENERAL NEEDS SMALL‐SCALE FARMER
NEEDS COMMERCIAL SECTOR
NEEDS DAFF NEEDS
perseverance to become a successful farmer Given the high risks involved in the agricultural sector (natural elements outside onersquos control) the agri sector does not compete successfully for this ldquoscarce resourcerdquo Moreover as with other professional and skilled occupations there is a tendency for younger qualified people to move to urban areas
known practices and are less likely to experiment with new technology Within this target group candidates with good entrepreneurial ability are scarce There is a perceived shortage of Agricultural Extensionists and advisors to assist this target group However a large pool of young unemployed graduates exists who could assist such emerging farmers if they were mobilised and made accessible to farmers Similarly the potential pool of retired commercial farmers who could serve as mentors to this target group
remain profitable and viable it can be stated that many of the existing farmers and managers owners lack business management and entrepreneurial orientation Equity policy and the need to become BEE compliant requires that commercial enterprises appoint and develop black owners directors managers Changing local and global consumer preferences require farmers to change traditional farming methods and practices Skills and knowledge requirements include bull Global food and
international quality standards
bull Product traceability requirements
bull Organic produce and products
Specific occupations identified as being in short supply are
bull Production Managers (food processing)
bull Product specialisation to international specifications (research skills)
bull Forklift drivers heavy vehicletruck drivers and mobile plant operators
bull Experienced and competent artisans (millwrights electricians fitters
enrolments andor pass rates at HET institutions with the result that too few qualified persons come onto the labour market) Examples of such skills shortages identified by the Department include Agricultural Engineers bull Plant Health
Specialists (Nematology Entomology Plant Pathology)
bull Statisticians (specialised agricultural knowledge)
bull Plant Health Pest Risk Analysts
bull Agricultural Economists (production and resource economists)
bull Agricultural Food and Quarantine Technicians
bull Agro‐meteorologists Early warning Specialists
bull Pasture Scientists bull Plant Production
Specialists (eg ornamental crops hydroponics)
bull Specialised Food Analysts (pesticide residue analysts processed food and dairy analysts wine and spirit analysts)
AgriSETA June 2010
Agriculture Sector Analysis 37
GENERAL NEEDS SMALL‐SCALE FARMER
NEEDS COMMERCIAL SECTOR
NEEDS DAFF NEEDS
and turners bull Agricultural
Equipment Technicians
bull Pest and weed controllers
bull Horticultural specialists
LABOUR SHORTAGES AND RELATED SKILLS NEEDS Given an employment rate of some 26 (2009 currently estimated at over 30expanded definition) per definition there cannot be a labour shortage It is however difficult for people who have never worked before to integrate into the agricultural sector workforce Coupled with an aging workforce (30‐60 being over 40) means that most agri enterprises will within the next 5‐10 years be looking at replacing a large proportion of their workforce There could be an insufficient pool of people willing and able to participate The impact of HIVAIDS is also not always factored in to understanding the diminishing pool of resources available Labour shortages have been reported within selected geographical areas and in particular occupations Examples include cane cutters in the sugar industry chicken catchers in the poultry industry pickers in the fruit industry and animal handlers in feedlots as well as dairy parlour workers It is however believed that these shortages may reflect a recruitment problem as a result of the very harsh working conditions and the relatively poor remuneration (which makes these occupations unpopular) At present such ldquoshortagesrdquo are addressed through contracting labour from neighbouring countries
AgriSETA WSP analyses
Skills demand in the commercial agricultural sector
Information for demand for skills from WSP data is available for 1 673 employers who submitted their WSPs for the 200910 period The table below shows data on sub‐sector WSP submission relative to size of the sub‐sector as well as subsector data from all registered organisations and those who submitted WSPs Data for registered employers shows that there were 239 076 employees employed by the 17 234 registered organisations As previously stated 97 898 employees were employed by the organisations submitting WSPs This constitutes 41 of employees employed by registered organisations
Table 20 Employment and sub‐sector data drawn from WSP analyses
Sub‐sector
All Re
gistered
Employers
Small employers (0‐49)
Med
ium and
large
employers (50+)
Total W
SPs received
Total W
SPs received
as of
all registered em
ployers
WSP
received med
ium and
large orgs
WSPs received
as of
med
ium amp large em
ployers
WSPs received
small
employers
WSPs received
as of small
enterprises
EmployeesPer
Profile
CoffeeTea 40 33 7 9 23 5 71 4 12 483 Fibre 1 710 1 676 34 34 2 22 65 12 07 6 539
AgriSETA June 2010
Agriculture Sector Analysis 38
Sub‐sector
All Re
gistered
Employers
Small employers (0‐49)
Med
ium and
large
employers (50+)
Total W
SPs received
Total W
SPs received
as of
all registered em
ployers
WSP
received med
ium and
large orgs
WSPs received
as of
med
ium amp large em
ployers
WSPs received
small
employers
WSPs received
as of small
enterprises
EmployeesPer
Profile
Fruit 371 277 94 162 44 76 81 86 31 27 873 Grain 648 581 67 77 12 48 72 29 5 22 129 Milling 335 279 56 61 18 35 63 26 9 4 630 Pest Control 213 209 4 8 4 2 50 6 3 119 Poultry 391 305 86 66 17 46 53 20 7 19 187 Primary 12 121 10 776 1 345 1144 9 513 38 631 6 136 034 Red meat 1107 1 018 89 70 6 45 51 25 2 7 475 Seed 167 149 18 24 14 13 72 11 7 2 127 Sugar 71 45 26 13 18 10 38 3 7 10 478 Tobacco 60 46 14 5 8 3 21 2 4 2 002
Totals 17 234 15 394 1 840 1 673 10 818 44 855 16 239 076
Source 1 AgriSETA WSP 2009 data
Only 10 of all registered employers submitted WSPs for the 200910 period Of these 49 were medium and large sized employers and 51 small However only 16 small employers submitted their WSPs relative to the number of registered small employers and 44 medium and large employers submitted WSPs relative to the number of registered medium and large employers As such skills demand statistics provides more representative data on the requirements of medium and large employers Data for skills demand in the commercial agricultural sector is based on data for permanent employees as well as casual and seasonal employees
Skills demand forecasting by AgriSETA
Forecasting for skills demand the AgriSETA has estimated that the demand for skilled employees at different levels in the next few years is 510 686 This is based on WSP data analyses over the last 5 years and projected demand for the formal commercial agricultural sector and factoring in the demand that at maximum would result from completion of the land restitution programme in South Africa The table below reflects the skills that are on demand as well as the estimates for demand over the next five years by major occupational category35
35 AgriSETA 2010
AgriSETA June 2010
Table 21 Demand for skills by occupational category
Major Occupation (OFO)Estimated Demand
Group Title1 Managers (commercial and small emerging farmers) 264 3702 Professionals 4 1413 Technicians and Trade workers 8 9255 Clerical and administrative workers 8006 Sales workers 4007 Machinery operators and drivers 5 8008 Elementary workers 226 250
Total 510 686Source AgriSETA WSP data and SSP demand forecasts
Research needs going forward
As has been set out in the sector analysis and the scenarios derived from that analysis the sector is faced by both significant and profound change and also great uncertainty It therefore follows that the task of focussing limited resources (basically levy income in the formal sector and NSF funds for the emergent farming sector) is difficult Whilst the general thrust of training remains broadly as described in the 2006‐10 SSP Updates some considerable work is required to achieve targeted effective interventions during the 2011‐2016 period The following research questions will need to be addressed in preparing the next SSP
bull In relation to the managers and owner‐managers of commercial farms and enterprises what skills are needed to enable them to help bring about the more optimistic scenario and manage the risks associated with the less optimistic ones
bull In terms of professional and technical competencies do the current education and training institutions coupled with the learning programmes available through the AgriSETA (learnerships skills programmes and the like) meet the needs of the sector
bull In the emerging agricultural sector do the current programmes funded by sources external to the AgriSETA (eg NSF) meet all the identified needs What gaps are there and how should they be addressed
bull In relation to governmentrsquos growth strategy and industrial action plans what skills are required for developing the aquaculture sub‐sector What programmes are available How can the SETA support the skills needs for this sub‐sector
bull Given the increasing levels of casual and contract labour how can skills be developed to meet the needs of the formal commercial sector and the emerging enterprise sector
bull How can the demand in each of the priority areas be quantified and agreement be reached on numbers of people to be trained
Agriculture Sector Analysis 39
AgriSETA June 2010
SECTION 3 Skills Gaps and scarce skills
Scarce skills at the DAFF
The level of scarce skills at DAFF can be determined by the vacancy rate While the average vacancy rate in the department as at 31 March 2009 was 17 there were some posts that had very high vacancy rates as reflected in the table below Indicating the possibility that the Department is experiencing difficulties in finding suitable candidates in the South African labour market to fill these posts
Table 22 Scarce skill occupations and vacancy rates (DAFF March 2009) Critical occupations Number of posts Posts filled Vacancy rate ()
Agricultural animal oceanography forestry and other sciences
167 119 287
Engineering sciences related 2 1 50Engineers and related professions 13 6 538Farming forestry advisors and farm managers 11 4 636Finance and economics related 73 53 274Horticulturists foresters agricultural and forestry technicians
350 221 369
Legal related 6 4 333Mechanical engineering technicians 3 2 333Risk management and security services 6 4 333Social sciences related 1 0 100Veterinarians 34 24 294
Source DAFF Annual Report 20082009
Skills are also scarce at senior management level The department also reports on difficulties it has filling senior management services vacancies with some of them staying vacant for up to twelve months because no suitable candidates can be found The department would then resort to re‐advertisement and head hunting This was the case with 22 of 18 SMS posts in March 2009
Scarce skills in the commercial sector
The following occupations have previously been projected as scarce (extremely hard to fill vacancies) by AgriSETA in the commercial agricultural sector over the next five years
Table 23 Scarce and critical skills in the commercial agricultural sector
Occupation Code
Group Occupation Critical Skills Intervention Comments
139903 Managers Laboratory Manager
Technology AI nutrition
HET
221101 Professionals Accountant (General)
General HET
221102 Professionals Management Accountant
Farm financial management
HET Focus on support advice to farmers new enterprises
222101 Professionals Commodities Trader
Export administration supply chain
FET Learnership Skills
Agriculture Sector Analysis 40
AgriSETA June 2010
Agriculture Sector Analysis 41
Occupation Code
Group Occupation Critical Skills Intervention Comments
management Programme
224301 Professionals Economist Agricultural HET
Mainly for Department of Agriculture and para statals commodity organisations
233101 Professionals Chemical Engineer
Chemical processes in food production
HET Industries such as sugar processing
233301 Professionals Electrical Engineer
Installation and maintenance
HET Processing industry
233401 Professionals Electronics Engineer
Computerised production prosesses
HET Processing industry
233501 Professionals Industrial Engineer
Productivity and efficiency
HET Processing industry
233904 Professionals
Instrument Engineer (Defence Force)
Installation and maintenance
HET
Not for defence ‐ sugar industry
233502 Professionals Mechanical Engineer
FETHET Equity reasons
233902 Professionals Agricultural Engineer
Farm layout and infrastructure
HET Mainly in Government
311101 Technicians and trades workers
Agricultural Technician
Installation and maintenance
FETHET
234102 Professionals Agricultural Scientist
Agri research HETFET Especially in horticulture
234201 Professionals Chemist HET Processing industry
234202 Professionals Food Technologist
Food safety HACCP
FETHET Across sector
234701 Professionals Veterinarian HET Mainly in Government
311101 Technicians and trades workers
Agricultural Technician
Farm infrastructure
FET Mainly needed in government
311401 Technicians and trades workers
Chemistry Technician
FETHET EE reasons
312907 Technicians and trades workers
Chemical Engineering Technician
FET Learnership
Mainly EE reasons
312402 Technicians and trades workers
Electronic Engineering Technician
Weak stream production infra
FETHET Mainly tobacco industry
233904 Professionals
Instrument Engineer (Defence Force)
Instrument technician
FET
Occupation needed Instrument Technician (not defence force) Mainly sugar processing sector
321202 Technicians and trades workers
Diesel Motor Mechanic
FET Learnership
To include tractor mechanic
321204 Technicians and trades workers
Small Engine Mechanic
Agricultural equipment
FET Learnership
Throughout sector
AgriSETA June 2010
Agriculture Sector Analysis 42
Occupation Code
Group Occupation Critical Skills Intervention Comments
322301 Technicians and trades workers
Metal Fabricator
Artisan FET Learnership
322303 Technicians and trades workers
Welder Welder (First Class)
Artisan FET Learnership
323203 Technicians and trades workers
Fitter‐Welder Artisan FET Learnership
Mainly sugar ndash multi‐skilled
323202 Technicians and trades workers
Fitter And Turner
Artisan FET Learnership
Tobacco and sugar
323501 Technicians and trades workers
Millwright Artisan FET Learnership
Wide‐spread need
341101 Technicians and trades workers
Electrician (General)
Artisan FET Learnership
Wide‐spread need
342101 Technicians and trades workers
Air‐Conditioning And Refrigeration Mechanic
Artisan FET Learnership
Sugar pack houses cold chain
Source AgriSETA Sector Skills Plans
Supply of skills
South Africarsquos agriculture skills are produced in high schools agricultural colleges FET colleges and Higher Education institutions In high school a large cohort of learners take Agricultural Science as a subject In 2003 there were 42 Agricultural High Schools offering Agricultural Science as a subject These students and those in high schools taking the subject could progress to taking agriculture as a focus area for further education In 2004 there were 10 FET colleges offering vocationally directed agricultural programmes These FET colleges offered complete qualifications and short courses Eleven Colleges of Agriculture can offer qualifications up to degree level and 19 universities offer qualifications in Agriculture ranging from agricultural economics animal and plant sciences and horticulture among others at under and post graduate levels (Department of Agriculture 2006) While long term planning of skilling of new entrants in the sector can be done through close consultation between the sector agricultural schools and colleges FET colleges and HET institutions so that they teach relevant skills there are other avenues for training for those who are already employed in the sector for example skills programmes and learnerships There are 15 registered qualifications for the primary agriculture sub sectors Currently AgriSETA has 94 registered learnerships that can address the skills needs of the identified scarce skills These are captured in Appendix 2 AgriSETA has approved accredited a number of training providers across the country to deliver the theoretical and practical components of these learnerships These include agricultural colleges FET colleges and private providers Currently the AgriSETA has 246 registered and approved providers distributed nationally as follows
AgriSETA June 2010
Table 29 AgriSETA approved training providers (2010) Province Number of providers
Gauteng 72
(29)
KwaZulu Natal 20
(8)
Limpopo 35
(14)
North West 30
(12)
Northern Cape 3
(1)
Free State 15
(6)
Mpumalanga 14
(6)
Western Cape 26
(11)
Eastern Cape 31
(13) Total 246
The providers are small to large organisations In primary agriculture small providers appear to offer the most training in rural areas and community projects (AgriSETA 2010) Most of the operating providers will be in FET colleges and agricultural colleges The AgriSETA is unable to meet the total demands for skills across the duality of their sector There seems to be fairness in the approval of training for both permanent and casual and seasonal workers In 200809 the AgriSETA approved 559 learnerships as follows
Table 30 AgriSETA learnerships approved for grant purposes (2008‐2009)
Source AgriSETA learnership data analysis
Agriculture Sector Analysis 43
AgriSETA June 2010
Agriculture Sector Analysis 44
Provision of skills programmes in the same year attracted grants for 2 706 employees
Table 31 Participation by learners in skills programmes in the AgriSETA (200809)
Source AgriSETA Skills programmes data analysis
AgriSETA June 2010
APPENDIX 1 Skills demand in the Department of Agriculture Forestry amp Fisheries (200809)
Source DAFF Annual Report 2008‐20009
Agriculture Sector Analysis 45
AgriSETA June 2010
Agriculture Sector Analysis 46
Appendix 2 AgriSETA registered learnerships Registered Learnership NQF Level SAQA Registration NoLearnership in Agri Sales and Service 4 22 Q 220001 20 178 4Learnership Agricultural Machinery Technician 2 22 Q 220007 20 160 2Learnership in Specialist Agricultural Machinery Technician 5 22 Q 220009 21 258 5Agri Trade Processes 2 22 Q 220013 30 125 2FETC Meat Examination Applying Basic Business Principles 4 30 Q 3000 2823 164 4Further Education and Training Certificate Seed Marketing Execute Seed Trials 4 22 Q 220025 21 126 4Further Education and Training Certificate Seed Research and Development Certify as Seed Unit 4 22 Q 220027 21 121 4FETC Seed Research and Development Conduct a Field Inspection of a Seed Unit 4 22 Q 220028 20 120 4Seed Research and Development Operations Operate in a Team 3 22 Q 220020 22 121 3Seed Research and Development Operations Apply Basic Business Principles 3 22 Q 220021 22 121 3National Certificate Seed Processing and Packaging Operate in a Team 3 22 Q 220026 21 123 3Sugar Industry Technical Maintenance worker 2 22 Q 220011 39 128 2National Certificate Sugar Manufacturing and Refining Technical Maintenance 3 30 Q300003 23 146 3Further Education and Training Certificate Manufacturing Technical MaintenanceProduce Components by Performing Engineering Turning Operations
4 30 Q 3000 1321 173 4
FETC Manufacturing Technical Maintenance Produce Components by Performing Milling Operations 4 30 Q 3000 1521 173 4 FETC Manufacturing Technical Maintenance Develop and Fabricate from Complex Drawing 4 30 Q 3000 1420 173 4National Certificate in Sugar Technology 5 22 Q 220036 22 140 5Further Education and Training Certificate Sugar Processing 4 22 Q 220035 31 144 4National Certificate in Sugar Technology Processing Sugar Refining 2 22 Q 220037 28 124 2National Certificate in Sugar Technology Processing Juice Preparation 2 22 Q 220038 28 124 2National Certificate in Sugar Technology Processing Crystallisation 2 22 Q 220039 27 122 2National Certificate in Sugar Technology Processing Laboratory Practice 2 22 Q 220040 25 124 2National Certificate in Sugar Technology Processing Extraction 2 22 Q 220041 28 122 2NC Rooibos Production Applying Basic Business Principles 2 30 Q 3000 2427 130 2 NC Rooibos Processing Applying Basic Business Principles 2 30 Q 3000 2224 123 2 National Certificate Cigarette Production 3 22 Q 220046 23 121 3
AgriSETA June 2010
REFERENCES AgriSETA 2010 AgriSETA 20082009 Annual report Pretoria AgriSETA Agricultural Research Council httpwwwarcagriczahomeasppid=272 Avert South African HIV and AIDS statistics Available on httpwwwavertorgsafricastatshtm Centre for Development Enterprise 2008 Land reform in South Africa Getting back on track CDE Research No 16 DAFF 2010 Quarterly economic review of the agriculture sector Pretoria DAFF DAFF 2009 Annual report 20082009 Pretoria DAFF Department of Agriculture 2008 Strategic plan 2008 Pretoria Department of Agriculture DTI An introduction to the South African economy Available on httpwwwthedtigovzapublicationsagroprocessinghtm Eastern Cape Provincial Government Eastern Cape Provincial Growth and Development Strategy 2004 ndash 2014 Economic Commission for Africa 2009 Developing African agriculture through regional value chains Addis Ababa Economic Commission for Africa Economic Report Free State Province 2005 Provincial Growth and Development Strategy 2005 ndash 2014 GCIS 2010 SA Yearbook 200910rdquo Agriculture forestry and fisheries Pretoria GCIS Greenberg S 2010 Status report on land and agricultural policy in South Africa 2010 Institute for Poverty Land and Agrarian Studies School of Government University of the Western Cape Research report Ingelozi Management Solutions 2008 HIVAIDS in the South African agricultural sector Towards the development of a long term intervention Research report KwaZulu Natal Provincial Government 2006 KwaZulu Natal Provincial Growth and Development Strategy Limpopo Provincial Government Growth and Development Strategy 2004 ndash 2014 Mhone G (2000) Enclavity and Constrained Labour Absorbtive Capacity in Southern African Countries Geneva International Labour Office Moyo S The Agrarian question and the developmental state in South Africa In Edigheji O et al 2010 Constructing a democratic developmental state in South Africa HSRC PRESS
Agriculture Sector Analysis 47
AgriSETA
Agriculture Sector Analysis
National Treasury Republic of South Africa 2010 National Budget 2010 ndash National Budget Review 2010 Pretoria National Treasury Northern Cape Provincial Government Agriculture and agro‐processing sector strategy North West Provincial Government North West Provincial Growth and Development Strategy 2004 ndash 2014 Province of the Western Cape 2008 The Ikapa growth and development strategy White Paper SABCOHA SA Business Coalition on HIV and AIDS wwwsabcohaorg SACAU httpwwwsacauorghostingsacauSacauWebnsfHomehtmOpenForm South African Government 2010 20102011 ndash 20122013 Industrial Policy Action Plan Republic of South Africa Statistics South Africa 2005 Census of commercial agriculture 2002 Report No 110201 Pretoria Statistics South Africa Statistics South Africa 2009 Census of commercial agriculture 2007 Statistical release P1101 Pretoria Statistics South Africa Statistics South Africa 2010 General household survey 2009 Statistical release P0318 Pretoria Statistics South Africa Statistics South Africa 2010 Gross domestic product first quarter 2010 Statistical release P0441 Pretoria Statistics South Africa Statistics South Africa 2010 Quarterly labour force survey Quarter 1 2010 Statistical release P0211 Pretoria Statistics South Africa Vink N amp van Rooyen J 2009 The economic performance of agriculture in South Africa since 1994 The implications for food security Pretoria DBSA development planning division working paper series No 17 Webster E 2004 the Dual Economy from a book by Van Holdt K and Webster E Work restructuring and the Crisis of Social reproduction and 10 years of restructuring post apartheid workplaces University of Natal Press Workinfocom httpwwwworkinfocomfreesub_for_legresdatalraempassoc3htm Xingwana L 2008 Challenges and Opportunities for Land and Agrarian Reform towards 2025 Speech delivered at the Agri‐Consultation Protea Ranch Hotel Polokwane 30 July 2008
- Table of contents
- SECTION 1 THE AGRICULTURAL LANDSCAPE
- 11 Size and shape of the Agricultural sector
-
- Overview
- Distribution of agricultural production
- The structure of the agriculture sector in South Africa
- Categories of farming enterprises
- Employment trends
- Employment categories and remuneration
- Stakeholders in the Agricultural sector
-
- National government departments
- Sector representatives
-
- 12 Factors impacting development in the Agriculture sector
-
- Future sector economic growth and development
-
- South African sector growth plans (IPAP2)
- International Trade
- Global recession and rise in food prices
-
- Land reform
- Reliance on imports
- Water
- The labour market
- Consumer trends
- HIVAIDS
- Farm safety and security
- Broad-based Black Economic Empowerment
-
- Conclusions and scenarios
- SECTION 2 DEMAND FOR SKILLS
-
- AgriSETA registered employers and employee coverage
- Employee coverage in the AgriSETA
-
- 21 Skills demand
-
- The National Education and Training Strategy for Agriculture (AET Strategy)
- AGRISETA sector skills planning demand data (2008-2009)
- AgriSETA WSP analyses
-
- Skills demand in the commercial agricultural sector
-
- Skills demand forecasting by AgriSETA
- Research needs going forward
-
- SECTION 3 Skills Gaps and scarce skills
-
- Scarce skills at the DAFF
- Scarce skills in the commercial sector
- Supply of skills
-
- APPENDIX 1 Skills demand in the Department of Agriculture Forestry amp Fisheries (200809)
- Appendix 2 AgriSETA registered learnerships
-
AgriSETA June 2010
Tier 2 Within each of the first tier groupings needs were further broken down and organised per target group At this second level needs were grouped by
o General skills development needs (cross‐cutting over different target groups) o Needs experienced by small scale farmers (this group included subsistence
farmers new emerging land reform beneficiaries and small‐scale AgriBEE farmers) o Needs within the commercial agricultural sector (per sub‐sector groupings where
specific needs for such were identified ndash both on‐farm needs and within the secondary sub‐sector or related agri‐businesses)
o Needs of the Department of Agriculture Fisheries and Forestry (DAFF) To further guide and direct the identification and selection of scarce and critical skills the following factors or criteria that could reflect the importance (impact and effect) of a skills shortages were developed as an identification framework
1 Basic Skills Development Promoting basic literacy and numeracy and raising the base level of education for the sector improving the work and livelihood of existing workers
2 Employability Making the employee more employable by improving the fit between their skills and the sector needs
3 Enterprise Viability Improving the capability and feasibility of the enterprise by increasing its effectiveness of or possibilities for profit generation etc
4 Enterprise Sustainability Allow enterprises to survive and grow over an extended period of time without compromising the value of renewable resources thereby creating long‐term meaningful employment for larger numbers of people
5 Sector Growth Enabling the sector to develop or pursue new opportunities or improve the effectiveness of current operations
6 Sector Competitiveness Enabling the sector to compete more effectively in the international arena improving market intelligence and interpretation productivity cost efficiency etc
7 Human Resource Development Capacity Improving the access to quality provision of training to the agri sector
Based on this research and consultation framework the following skills development needs and priorities were identified
Agriculture Sector Analysis 33
AgriSETA June 2010
GENERAL NEEDS SMALL‐SCALE FARMER
NEEDS COMMERCIAL SECTOR
NEEDS DAFF NEEDS
RECRUITMENT RELATED SKILLS NEEDS Primary agriculture is the entry point into the world of work for large numbers of people in rural areas However the sector has negative connotations amongst sections of the youth and in parts of the country and is viewed as a last resort for some in the search for employment) The effect is that despite an unemployment rate of approximately 26 (now over 30) farmers find it difficult to recruit workers to meet seasonal demands This has resulted in the government approving the contracting of foreign labour to meet such temporary needs (workers are recruited mainly from Zimbabwe and Mozambique)
Labour in this farming sector is provided primarily by family members and no real recruitment constraints can be identified
The agricultural sector still manages to attract technical and management skills as it is perceived to include a better lifestyle and there is a strong tradition of agriculture in SA Increasing crime related security risks associated with farming may have a negative impact
The Department has identified a number of occupations in which they are experiencing long‐term vacancies Some of these result from a general shortage of such skills in SA while others arise from the inability of the public sector to compete with the private sector (less favourable employment image working conditions and equity considerations) Priority vacancies include Veterinarians Agricultural
Engineers Plant Health
Specialists Agricultural
Statisticians Plant Health Pest Risk
Analysts ICT Specialists Agricultural
Economists Agricultural Food and
Quarantine Technicians
Agro‐meteorologists Pasture Scientists Plant Production
Specialists Specialised Food
Analysts SKILLS GAPS RELATED NEEDS
bull Low literacy and numeracy levels ndash both amongst workers within the sector at large and at ownermanager level in many of the small‐scale farming
bull Farm management
Farm Management (Mainly owners managers) bull Farm management amp
entrepreneurship bull Resource
management and record keeping
bull Financial planning
A critical constraint is the poor educational levels of a large proportion of the labour force in the sector demanding a considerable effort and investment in ABET and other life skills
A particularly big need exists for skills upgrading amongst Extension Officers ndash particularly with regard to redress the historical neglect of small‐scale farmers and resource strapped farmers
Agriculture Sector Analysis 34
AgriSETA June 2010
Agriculture Sector Analysis 35
GENERAL NEEDS SMALL‐SCALE FARMER
NEEDS COMMERCIAL SECTOR
NEEDS DAFF NEEDS
skills (and general management skills in other agricultural businesses) coupled with a business orientation and entrepreneurship skills
bull A general need to increase compliance with environmental occupational health and safety animal welfare produce safety and hygiene standards regulations and requirements (local and international standards)
and management bull Project management bull Business plan
development Marketing and processing bull Processing and
packaging bull Transport
management bull Marketing produce
including branding bull Planning for
marketing bull Knowledge of
markets Technical knowledge and skills bull Production
management (related to specific enterprise)
bull Demonstration of production techniques
bull Natural resources management
Mechanical knowledge bull Farm maintenance bull Repairs of machinery
and equipment bull Electrical
maintenance and installation
programmes Need for improved management skills and relevant technological knowledge for increasing productivity levels and improved production methods Rising importance for environmentally responsible production and processing management systems Rising competitive and international markets increases need for business and marketing abilities among owners and managers Increasing requirements for compliance with environmental health and safety and international trade standards Information technology although not a priority is increasing in importance Business management ability is becoming increasingly important as more farmers are making decisions about restructuring their businesses diversification and developing supplementary sources of income
Critically improved farm management and business skills within an agricultural context to support the majority of BEE and emerging farmers Skills upgrading requirements for existing Extension Officers include bull Agricultural
economics bull Agricultural
management bull Business and
financial management
bull Technical and production related skills including o Animal husbandryo Poultry o Crop production o Horticulture
SKILLS SHORTAGES Generally SA has a shortage of entrepreneurs and people who have the business acumen drive motivation and
The profile of these farmers reflects a large contingent of older and less educated people who are generally less flexible tend to stick to
The commercial agri sector will increasingly have to compete in the global market and the ever increasing need to increase productivity to
DAFF us experiencing problems are especially sourcing people in specialised science related fields (learning fields experiencing few
AgriSETA June 2010
Agriculture Sector Analysis 36
GENERAL NEEDS SMALL‐SCALE FARMER
NEEDS COMMERCIAL SECTOR
NEEDS DAFF NEEDS
perseverance to become a successful farmer Given the high risks involved in the agricultural sector (natural elements outside onersquos control) the agri sector does not compete successfully for this ldquoscarce resourcerdquo Moreover as with other professional and skilled occupations there is a tendency for younger qualified people to move to urban areas
known practices and are less likely to experiment with new technology Within this target group candidates with good entrepreneurial ability are scarce There is a perceived shortage of Agricultural Extensionists and advisors to assist this target group However a large pool of young unemployed graduates exists who could assist such emerging farmers if they were mobilised and made accessible to farmers Similarly the potential pool of retired commercial farmers who could serve as mentors to this target group
remain profitable and viable it can be stated that many of the existing farmers and managers owners lack business management and entrepreneurial orientation Equity policy and the need to become BEE compliant requires that commercial enterprises appoint and develop black owners directors managers Changing local and global consumer preferences require farmers to change traditional farming methods and practices Skills and knowledge requirements include bull Global food and
international quality standards
bull Product traceability requirements
bull Organic produce and products
Specific occupations identified as being in short supply are
bull Production Managers (food processing)
bull Product specialisation to international specifications (research skills)
bull Forklift drivers heavy vehicletruck drivers and mobile plant operators
bull Experienced and competent artisans (millwrights electricians fitters
enrolments andor pass rates at HET institutions with the result that too few qualified persons come onto the labour market) Examples of such skills shortages identified by the Department include Agricultural Engineers bull Plant Health
Specialists (Nematology Entomology Plant Pathology)
bull Statisticians (specialised agricultural knowledge)
bull Plant Health Pest Risk Analysts
bull Agricultural Economists (production and resource economists)
bull Agricultural Food and Quarantine Technicians
bull Agro‐meteorologists Early warning Specialists
bull Pasture Scientists bull Plant Production
Specialists (eg ornamental crops hydroponics)
bull Specialised Food Analysts (pesticide residue analysts processed food and dairy analysts wine and spirit analysts)
AgriSETA June 2010
Agriculture Sector Analysis 37
GENERAL NEEDS SMALL‐SCALE FARMER
NEEDS COMMERCIAL SECTOR
NEEDS DAFF NEEDS
and turners bull Agricultural
Equipment Technicians
bull Pest and weed controllers
bull Horticultural specialists
LABOUR SHORTAGES AND RELATED SKILLS NEEDS Given an employment rate of some 26 (2009 currently estimated at over 30expanded definition) per definition there cannot be a labour shortage It is however difficult for people who have never worked before to integrate into the agricultural sector workforce Coupled with an aging workforce (30‐60 being over 40) means that most agri enterprises will within the next 5‐10 years be looking at replacing a large proportion of their workforce There could be an insufficient pool of people willing and able to participate The impact of HIVAIDS is also not always factored in to understanding the diminishing pool of resources available Labour shortages have been reported within selected geographical areas and in particular occupations Examples include cane cutters in the sugar industry chicken catchers in the poultry industry pickers in the fruit industry and animal handlers in feedlots as well as dairy parlour workers It is however believed that these shortages may reflect a recruitment problem as a result of the very harsh working conditions and the relatively poor remuneration (which makes these occupations unpopular) At present such ldquoshortagesrdquo are addressed through contracting labour from neighbouring countries
AgriSETA WSP analyses
Skills demand in the commercial agricultural sector
Information for demand for skills from WSP data is available for 1 673 employers who submitted their WSPs for the 200910 period The table below shows data on sub‐sector WSP submission relative to size of the sub‐sector as well as subsector data from all registered organisations and those who submitted WSPs Data for registered employers shows that there were 239 076 employees employed by the 17 234 registered organisations As previously stated 97 898 employees were employed by the organisations submitting WSPs This constitutes 41 of employees employed by registered organisations
Table 20 Employment and sub‐sector data drawn from WSP analyses
Sub‐sector
All Re
gistered
Employers
Small employers (0‐49)
Med
ium and
large
employers (50+)
Total W
SPs received
Total W
SPs received
as of
all registered em
ployers
WSP
received med
ium and
large orgs
WSPs received
as of
med
ium amp large em
ployers
WSPs received
small
employers
WSPs received
as of small
enterprises
EmployeesPer
Profile
CoffeeTea 40 33 7 9 23 5 71 4 12 483 Fibre 1 710 1 676 34 34 2 22 65 12 07 6 539
AgriSETA June 2010
Agriculture Sector Analysis 38
Sub‐sector
All Re
gistered
Employers
Small employers (0‐49)
Med
ium and
large
employers (50+)
Total W
SPs received
Total W
SPs received
as of
all registered em
ployers
WSP
received med
ium and
large orgs
WSPs received
as of
med
ium amp large em
ployers
WSPs received
small
employers
WSPs received
as of small
enterprises
EmployeesPer
Profile
Fruit 371 277 94 162 44 76 81 86 31 27 873 Grain 648 581 67 77 12 48 72 29 5 22 129 Milling 335 279 56 61 18 35 63 26 9 4 630 Pest Control 213 209 4 8 4 2 50 6 3 119 Poultry 391 305 86 66 17 46 53 20 7 19 187 Primary 12 121 10 776 1 345 1144 9 513 38 631 6 136 034 Red meat 1107 1 018 89 70 6 45 51 25 2 7 475 Seed 167 149 18 24 14 13 72 11 7 2 127 Sugar 71 45 26 13 18 10 38 3 7 10 478 Tobacco 60 46 14 5 8 3 21 2 4 2 002
Totals 17 234 15 394 1 840 1 673 10 818 44 855 16 239 076
Source 1 AgriSETA WSP 2009 data
Only 10 of all registered employers submitted WSPs for the 200910 period Of these 49 were medium and large sized employers and 51 small However only 16 small employers submitted their WSPs relative to the number of registered small employers and 44 medium and large employers submitted WSPs relative to the number of registered medium and large employers As such skills demand statistics provides more representative data on the requirements of medium and large employers Data for skills demand in the commercial agricultural sector is based on data for permanent employees as well as casual and seasonal employees
Skills demand forecasting by AgriSETA
Forecasting for skills demand the AgriSETA has estimated that the demand for skilled employees at different levels in the next few years is 510 686 This is based on WSP data analyses over the last 5 years and projected demand for the formal commercial agricultural sector and factoring in the demand that at maximum would result from completion of the land restitution programme in South Africa The table below reflects the skills that are on demand as well as the estimates for demand over the next five years by major occupational category35
35 AgriSETA 2010
AgriSETA June 2010
Table 21 Demand for skills by occupational category
Major Occupation (OFO)Estimated Demand
Group Title1 Managers (commercial and small emerging farmers) 264 3702 Professionals 4 1413 Technicians and Trade workers 8 9255 Clerical and administrative workers 8006 Sales workers 4007 Machinery operators and drivers 5 8008 Elementary workers 226 250
Total 510 686Source AgriSETA WSP data and SSP demand forecasts
Research needs going forward
As has been set out in the sector analysis and the scenarios derived from that analysis the sector is faced by both significant and profound change and also great uncertainty It therefore follows that the task of focussing limited resources (basically levy income in the formal sector and NSF funds for the emergent farming sector) is difficult Whilst the general thrust of training remains broadly as described in the 2006‐10 SSP Updates some considerable work is required to achieve targeted effective interventions during the 2011‐2016 period The following research questions will need to be addressed in preparing the next SSP
bull In relation to the managers and owner‐managers of commercial farms and enterprises what skills are needed to enable them to help bring about the more optimistic scenario and manage the risks associated with the less optimistic ones
bull In terms of professional and technical competencies do the current education and training institutions coupled with the learning programmes available through the AgriSETA (learnerships skills programmes and the like) meet the needs of the sector
bull In the emerging agricultural sector do the current programmes funded by sources external to the AgriSETA (eg NSF) meet all the identified needs What gaps are there and how should they be addressed
bull In relation to governmentrsquos growth strategy and industrial action plans what skills are required for developing the aquaculture sub‐sector What programmes are available How can the SETA support the skills needs for this sub‐sector
bull Given the increasing levels of casual and contract labour how can skills be developed to meet the needs of the formal commercial sector and the emerging enterprise sector
bull How can the demand in each of the priority areas be quantified and agreement be reached on numbers of people to be trained
Agriculture Sector Analysis 39
AgriSETA June 2010
SECTION 3 Skills Gaps and scarce skills
Scarce skills at the DAFF
The level of scarce skills at DAFF can be determined by the vacancy rate While the average vacancy rate in the department as at 31 March 2009 was 17 there were some posts that had very high vacancy rates as reflected in the table below Indicating the possibility that the Department is experiencing difficulties in finding suitable candidates in the South African labour market to fill these posts
Table 22 Scarce skill occupations and vacancy rates (DAFF March 2009) Critical occupations Number of posts Posts filled Vacancy rate ()
Agricultural animal oceanography forestry and other sciences
167 119 287
Engineering sciences related 2 1 50Engineers and related professions 13 6 538Farming forestry advisors and farm managers 11 4 636Finance and economics related 73 53 274Horticulturists foresters agricultural and forestry technicians
350 221 369
Legal related 6 4 333Mechanical engineering technicians 3 2 333Risk management and security services 6 4 333Social sciences related 1 0 100Veterinarians 34 24 294
Source DAFF Annual Report 20082009
Skills are also scarce at senior management level The department also reports on difficulties it has filling senior management services vacancies with some of them staying vacant for up to twelve months because no suitable candidates can be found The department would then resort to re‐advertisement and head hunting This was the case with 22 of 18 SMS posts in March 2009
Scarce skills in the commercial sector
The following occupations have previously been projected as scarce (extremely hard to fill vacancies) by AgriSETA in the commercial agricultural sector over the next five years
Table 23 Scarce and critical skills in the commercial agricultural sector
Occupation Code
Group Occupation Critical Skills Intervention Comments
139903 Managers Laboratory Manager
Technology AI nutrition
HET
221101 Professionals Accountant (General)
General HET
221102 Professionals Management Accountant
Farm financial management
HET Focus on support advice to farmers new enterprises
222101 Professionals Commodities Trader
Export administration supply chain
FET Learnership Skills
Agriculture Sector Analysis 40
AgriSETA June 2010
Agriculture Sector Analysis 41
Occupation Code
Group Occupation Critical Skills Intervention Comments
management Programme
224301 Professionals Economist Agricultural HET
Mainly for Department of Agriculture and para statals commodity organisations
233101 Professionals Chemical Engineer
Chemical processes in food production
HET Industries such as sugar processing
233301 Professionals Electrical Engineer
Installation and maintenance
HET Processing industry
233401 Professionals Electronics Engineer
Computerised production prosesses
HET Processing industry
233501 Professionals Industrial Engineer
Productivity and efficiency
HET Processing industry
233904 Professionals
Instrument Engineer (Defence Force)
Installation and maintenance
HET
Not for defence ‐ sugar industry
233502 Professionals Mechanical Engineer
FETHET Equity reasons
233902 Professionals Agricultural Engineer
Farm layout and infrastructure
HET Mainly in Government
311101 Technicians and trades workers
Agricultural Technician
Installation and maintenance
FETHET
234102 Professionals Agricultural Scientist
Agri research HETFET Especially in horticulture
234201 Professionals Chemist HET Processing industry
234202 Professionals Food Technologist
Food safety HACCP
FETHET Across sector
234701 Professionals Veterinarian HET Mainly in Government
311101 Technicians and trades workers
Agricultural Technician
Farm infrastructure
FET Mainly needed in government
311401 Technicians and trades workers
Chemistry Technician
FETHET EE reasons
312907 Technicians and trades workers
Chemical Engineering Technician
FET Learnership
Mainly EE reasons
312402 Technicians and trades workers
Electronic Engineering Technician
Weak stream production infra
FETHET Mainly tobacco industry
233904 Professionals
Instrument Engineer (Defence Force)
Instrument technician
FET
Occupation needed Instrument Technician (not defence force) Mainly sugar processing sector
321202 Technicians and trades workers
Diesel Motor Mechanic
FET Learnership
To include tractor mechanic
321204 Technicians and trades workers
Small Engine Mechanic
Agricultural equipment
FET Learnership
Throughout sector
AgriSETA June 2010
Agriculture Sector Analysis 42
Occupation Code
Group Occupation Critical Skills Intervention Comments
322301 Technicians and trades workers
Metal Fabricator
Artisan FET Learnership
322303 Technicians and trades workers
Welder Welder (First Class)
Artisan FET Learnership
323203 Technicians and trades workers
Fitter‐Welder Artisan FET Learnership
Mainly sugar ndash multi‐skilled
323202 Technicians and trades workers
Fitter And Turner
Artisan FET Learnership
Tobacco and sugar
323501 Technicians and trades workers
Millwright Artisan FET Learnership
Wide‐spread need
341101 Technicians and trades workers
Electrician (General)
Artisan FET Learnership
Wide‐spread need
342101 Technicians and trades workers
Air‐Conditioning And Refrigeration Mechanic
Artisan FET Learnership
Sugar pack houses cold chain
Source AgriSETA Sector Skills Plans
Supply of skills
South Africarsquos agriculture skills are produced in high schools agricultural colleges FET colleges and Higher Education institutions In high school a large cohort of learners take Agricultural Science as a subject In 2003 there were 42 Agricultural High Schools offering Agricultural Science as a subject These students and those in high schools taking the subject could progress to taking agriculture as a focus area for further education In 2004 there were 10 FET colleges offering vocationally directed agricultural programmes These FET colleges offered complete qualifications and short courses Eleven Colleges of Agriculture can offer qualifications up to degree level and 19 universities offer qualifications in Agriculture ranging from agricultural economics animal and plant sciences and horticulture among others at under and post graduate levels (Department of Agriculture 2006) While long term planning of skilling of new entrants in the sector can be done through close consultation between the sector agricultural schools and colleges FET colleges and HET institutions so that they teach relevant skills there are other avenues for training for those who are already employed in the sector for example skills programmes and learnerships There are 15 registered qualifications for the primary agriculture sub sectors Currently AgriSETA has 94 registered learnerships that can address the skills needs of the identified scarce skills These are captured in Appendix 2 AgriSETA has approved accredited a number of training providers across the country to deliver the theoretical and practical components of these learnerships These include agricultural colleges FET colleges and private providers Currently the AgriSETA has 246 registered and approved providers distributed nationally as follows
AgriSETA June 2010
Table 29 AgriSETA approved training providers (2010) Province Number of providers
Gauteng 72
(29)
KwaZulu Natal 20
(8)
Limpopo 35
(14)
North West 30
(12)
Northern Cape 3
(1)
Free State 15
(6)
Mpumalanga 14
(6)
Western Cape 26
(11)
Eastern Cape 31
(13) Total 246
The providers are small to large organisations In primary agriculture small providers appear to offer the most training in rural areas and community projects (AgriSETA 2010) Most of the operating providers will be in FET colleges and agricultural colleges The AgriSETA is unable to meet the total demands for skills across the duality of their sector There seems to be fairness in the approval of training for both permanent and casual and seasonal workers In 200809 the AgriSETA approved 559 learnerships as follows
Table 30 AgriSETA learnerships approved for grant purposes (2008‐2009)
Source AgriSETA learnership data analysis
Agriculture Sector Analysis 43
AgriSETA June 2010
Agriculture Sector Analysis 44
Provision of skills programmes in the same year attracted grants for 2 706 employees
Table 31 Participation by learners in skills programmes in the AgriSETA (200809)
Source AgriSETA Skills programmes data analysis
AgriSETA June 2010
APPENDIX 1 Skills demand in the Department of Agriculture Forestry amp Fisheries (200809)
Source DAFF Annual Report 2008‐20009
Agriculture Sector Analysis 45
AgriSETA June 2010
Agriculture Sector Analysis 46
Appendix 2 AgriSETA registered learnerships Registered Learnership NQF Level SAQA Registration NoLearnership in Agri Sales and Service 4 22 Q 220001 20 178 4Learnership Agricultural Machinery Technician 2 22 Q 220007 20 160 2Learnership in Specialist Agricultural Machinery Technician 5 22 Q 220009 21 258 5Agri Trade Processes 2 22 Q 220013 30 125 2FETC Meat Examination Applying Basic Business Principles 4 30 Q 3000 2823 164 4Further Education and Training Certificate Seed Marketing Execute Seed Trials 4 22 Q 220025 21 126 4Further Education and Training Certificate Seed Research and Development Certify as Seed Unit 4 22 Q 220027 21 121 4FETC Seed Research and Development Conduct a Field Inspection of a Seed Unit 4 22 Q 220028 20 120 4Seed Research and Development Operations Operate in a Team 3 22 Q 220020 22 121 3Seed Research and Development Operations Apply Basic Business Principles 3 22 Q 220021 22 121 3National Certificate Seed Processing and Packaging Operate in a Team 3 22 Q 220026 21 123 3Sugar Industry Technical Maintenance worker 2 22 Q 220011 39 128 2National Certificate Sugar Manufacturing and Refining Technical Maintenance 3 30 Q300003 23 146 3Further Education and Training Certificate Manufacturing Technical MaintenanceProduce Components by Performing Engineering Turning Operations
4 30 Q 3000 1321 173 4
FETC Manufacturing Technical Maintenance Produce Components by Performing Milling Operations 4 30 Q 3000 1521 173 4 FETC Manufacturing Technical Maintenance Develop and Fabricate from Complex Drawing 4 30 Q 3000 1420 173 4National Certificate in Sugar Technology 5 22 Q 220036 22 140 5Further Education and Training Certificate Sugar Processing 4 22 Q 220035 31 144 4National Certificate in Sugar Technology Processing Sugar Refining 2 22 Q 220037 28 124 2National Certificate in Sugar Technology Processing Juice Preparation 2 22 Q 220038 28 124 2National Certificate in Sugar Technology Processing Crystallisation 2 22 Q 220039 27 122 2National Certificate in Sugar Technology Processing Laboratory Practice 2 22 Q 220040 25 124 2National Certificate in Sugar Technology Processing Extraction 2 22 Q 220041 28 122 2NC Rooibos Production Applying Basic Business Principles 2 30 Q 3000 2427 130 2 NC Rooibos Processing Applying Basic Business Principles 2 30 Q 3000 2224 123 2 National Certificate Cigarette Production 3 22 Q 220046 23 121 3
AgriSETA June 2010
REFERENCES AgriSETA 2010 AgriSETA 20082009 Annual report Pretoria AgriSETA Agricultural Research Council httpwwwarcagriczahomeasppid=272 Avert South African HIV and AIDS statistics Available on httpwwwavertorgsafricastatshtm Centre for Development Enterprise 2008 Land reform in South Africa Getting back on track CDE Research No 16 DAFF 2010 Quarterly economic review of the agriculture sector Pretoria DAFF DAFF 2009 Annual report 20082009 Pretoria DAFF Department of Agriculture 2008 Strategic plan 2008 Pretoria Department of Agriculture DTI An introduction to the South African economy Available on httpwwwthedtigovzapublicationsagroprocessinghtm Eastern Cape Provincial Government Eastern Cape Provincial Growth and Development Strategy 2004 ndash 2014 Economic Commission for Africa 2009 Developing African agriculture through regional value chains Addis Ababa Economic Commission for Africa Economic Report Free State Province 2005 Provincial Growth and Development Strategy 2005 ndash 2014 GCIS 2010 SA Yearbook 200910rdquo Agriculture forestry and fisheries Pretoria GCIS Greenberg S 2010 Status report on land and agricultural policy in South Africa 2010 Institute for Poverty Land and Agrarian Studies School of Government University of the Western Cape Research report Ingelozi Management Solutions 2008 HIVAIDS in the South African agricultural sector Towards the development of a long term intervention Research report KwaZulu Natal Provincial Government 2006 KwaZulu Natal Provincial Growth and Development Strategy Limpopo Provincial Government Growth and Development Strategy 2004 ndash 2014 Mhone G (2000) Enclavity and Constrained Labour Absorbtive Capacity in Southern African Countries Geneva International Labour Office Moyo S The Agrarian question and the developmental state in South Africa In Edigheji O et al 2010 Constructing a democratic developmental state in South Africa HSRC PRESS
Agriculture Sector Analysis 47
AgriSETA
Agriculture Sector Analysis
National Treasury Republic of South Africa 2010 National Budget 2010 ndash National Budget Review 2010 Pretoria National Treasury Northern Cape Provincial Government Agriculture and agro‐processing sector strategy North West Provincial Government North West Provincial Growth and Development Strategy 2004 ndash 2014 Province of the Western Cape 2008 The Ikapa growth and development strategy White Paper SABCOHA SA Business Coalition on HIV and AIDS wwwsabcohaorg SACAU httpwwwsacauorghostingsacauSacauWebnsfHomehtmOpenForm South African Government 2010 20102011 ndash 20122013 Industrial Policy Action Plan Republic of South Africa Statistics South Africa 2005 Census of commercial agriculture 2002 Report No 110201 Pretoria Statistics South Africa Statistics South Africa 2009 Census of commercial agriculture 2007 Statistical release P1101 Pretoria Statistics South Africa Statistics South Africa 2010 General household survey 2009 Statistical release P0318 Pretoria Statistics South Africa Statistics South Africa 2010 Gross domestic product first quarter 2010 Statistical release P0441 Pretoria Statistics South Africa Statistics South Africa 2010 Quarterly labour force survey Quarter 1 2010 Statistical release P0211 Pretoria Statistics South Africa Vink N amp van Rooyen J 2009 The economic performance of agriculture in South Africa since 1994 The implications for food security Pretoria DBSA development planning division working paper series No 17 Webster E 2004 the Dual Economy from a book by Van Holdt K and Webster E Work restructuring and the Crisis of Social reproduction and 10 years of restructuring post apartheid workplaces University of Natal Press Workinfocom httpwwwworkinfocomfreesub_for_legresdatalraempassoc3htm Xingwana L 2008 Challenges and Opportunities for Land and Agrarian Reform towards 2025 Speech delivered at the Agri‐Consultation Protea Ranch Hotel Polokwane 30 July 2008
- Table of contents
- SECTION 1 THE AGRICULTURAL LANDSCAPE
- 11 Size and shape of the Agricultural sector
-
- Overview
- Distribution of agricultural production
- The structure of the agriculture sector in South Africa
- Categories of farming enterprises
- Employment trends
- Employment categories and remuneration
- Stakeholders in the Agricultural sector
-
- National government departments
- Sector representatives
-
- 12 Factors impacting development in the Agriculture sector
-
- Future sector economic growth and development
-
- South African sector growth plans (IPAP2)
- International Trade
- Global recession and rise in food prices
-
- Land reform
- Reliance on imports
- Water
- The labour market
- Consumer trends
- HIVAIDS
- Farm safety and security
- Broad-based Black Economic Empowerment
-
- Conclusions and scenarios
- SECTION 2 DEMAND FOR SKILLS
-
- AgriSETA registered employers and employee coverage
- Employee coverage in the AgriSETA
-
- 21 Skills demand
-
- The National Education and Training Strategy for Agriculture (AET Strategy)
- AGRISETA sector skills planning demand data (2008-2009)
- AgriSETA WSP analyses
-
- Skills demand in the commercial agricultural sector
-
- Skills demand forecasting by AgriSETA
- Research needs going forward
-
- SECTION 3 Skills Gaps and scarce skills
-
- Scarce skills at the DAFF
- Scarce skills in the commercial sector
- Supply of skills
-
- APPENDIX 1 Skills demand in the Department of Agriculture Forestry amp Fisheries (200809)
- Appendix 2 AgriSETA registered learnerships
-
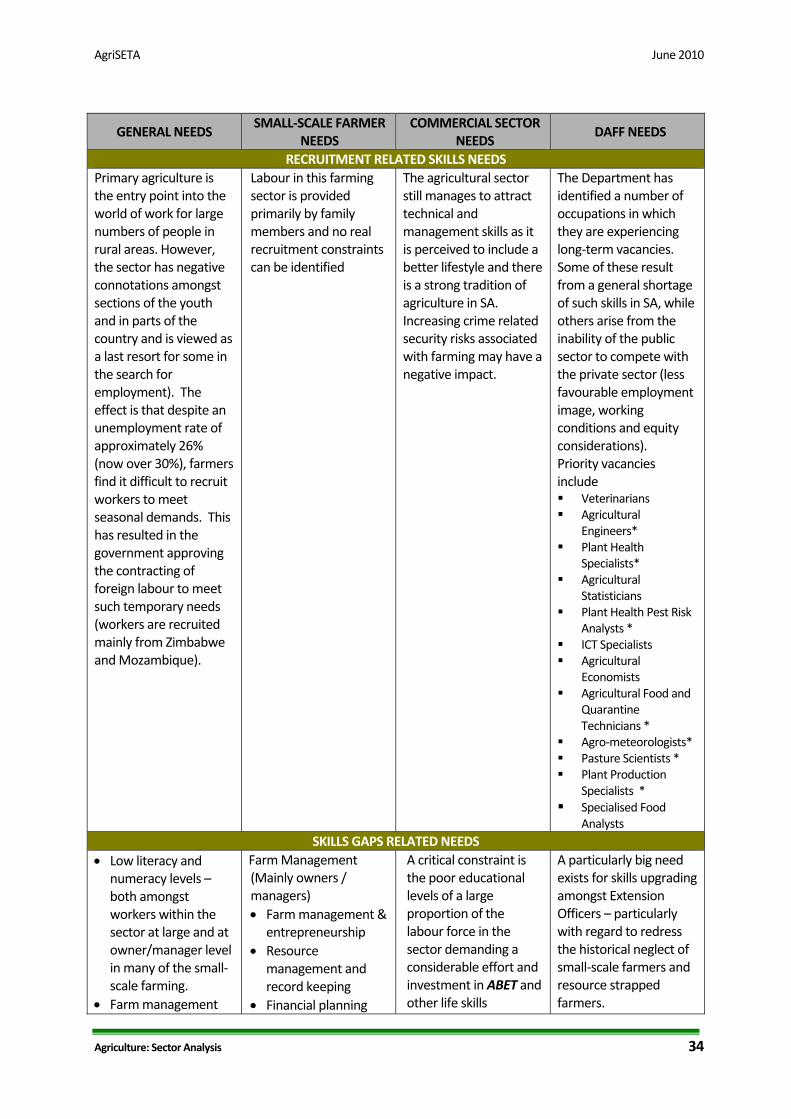
AgriSETA June 2010
GENERAL NEEDS SMALL‐SCALE FARMER
NEEDS COMMERCIAL SECTOR
NEEDS DAFF NEEDS
RECRUITMENT RELATED SKILLS NEEDS Primary agriculture is the entry point into the world of work for large numbers of people in rural areas However the sector has negative connotations amongst sections of the youth and in parts of the country and is viewed as a last resort for some in the search for employment) The effect is that despite an unemployment rate of approximately 26 (now over 30) farmers find it difficult to recruit workers to meet seasonal demands This has resulted in the government approving the contracting of foreign labour to meet such temporary needs (workers are recruited mainly from Zimbabwe and Mozambique)
Labour in this farming sector is provided primarily by family members and no real recruitment constraints can be identified
The agricultural sector still manages to attract technical and management skills as it is perceived to include a better lifestyle and there is a strong tradition of agriculture in SA Increasing crime related security risks associated with farming may have a negative impact
The Department has identified a number of occupations in which they are experiencing long‐term vacancies Some of these result from a general shortage of such skills in SA while others arise from the inability of the public sector to compete with the private sector (less favourable employment image working conditions and equity considerations) Priority vacancies include Veterinarians Agricultural
Engineers Plant Health
Specialists Agricultural
Statisticians Plant Health Pest Risk
Analysts ICT Specialists Agricultural
Economists Agricultural Food and
Quarantine Technicians
Agro‐meteorologists Pasture Scientists Plant Production
Specialists Specialised Food
Analysts SKILLS GAPS RELATED NEEDS
bull Low literacy and numeracy levels ndash both amongst workers within the sector at large and at ownermanager level in many of the small‐scale farming
bull Farm management
Farm Management (Mainly owners managers) bull Farm management amp
entrepreneurship bull Resource
management and record keeping
bull Financial planning
A critical constraint is the poor educational levels of a large proportion of the labour force in the sector demanding a considerable effort and investment in ABET and other life skills
A particularly big need exists for skills upgrading amongst Extension Officers ndash particularly with regard to redress the historical neglect of small‐scale farmers and resource strapped farmers
Agriculture Sector Analysis 34
AgriSETA June 2010
Agriculture Sector Analysis 35
GENERAL NEEDS SMALL‐SCALE FARMER
NEEDS COMMERCIAL SECTOR
NEEDS DAFF NEEDS
skills (and general management skills in other agricultural businesses) coupled with a business orientation and entrepreneurship skills
bull A general need to increase compliance with environmental occupational health and safety animal welfare produce safety and hygiene standards regulations and requirements (local and international standards)
and management bull Project management bull Business plan
development Marketing and processing bull Processing and
packaging bull Transport
management bull Marketing produce
including branding bull Planning for
marketing bull Knowledge of
markets Technical knowledge and skills bull Production
management (related to specific enterprise)
bull Demonstration of production techniques
bull Natural resources management
Mechanical knowledge bull Farm maintenance bull Repairs of machinery
and equipment bull Electrical
maintenance and installation
programmes Need for improved management skills and relevant technological knowledge for increasing productivity levels and improved production methods Rising importance for environmentally responsible production and processing management systems Rising competitive and international markets increases need for business and marketing abilities among owners and managers Increasing requirements for compliance with environmental health and safety and international trade standards Information technology although not a priority is increasing in importance Business management ability is becoming increasingly important as more farmers are making decisions about restructuring their businesses diversification and developing supplementary sources of income
Critically improved farm management and business skills within an agricultural context to support the majority of BEE and emerging farmers Skills upgrading requirements for existing Extension Officers include bull Agricultural
economics bull Agricultural
management bull Business and
financial management
bull Technical and production related skills including o Animal husbandryo Poultry o Crop production o Horticulture
SKILLS SHORTAGES Generally SA has a shortage of entrepreneurs and people who have the business acumen drive motivation and
The profile of these farmers reflects a large contingent of older and less educated people who are generally less flexible tend to stick to
The commercial agri sector will increasingly have to compete in the global market and the ever increasing need to increase productivity to
DAFF us experiencing problems are especially sourcing people in specialised science related fields (learning fields experiencing few
AgriSETA June 2010
Agriculture Sector Analysis 36
GENERAL NEEDS SMALL‐SCALE FARMER
NEEDS COMMERCIAL SECTOR
NEEDS DAFF NEEDS
perseverance to become a successful farmer Given the high risks involved in the agricultural sector (natural elements outside onersquos control) the agri sector does not compete successfully for this ldquoscarce resourcerdquo Moreover as with other professional and skilled occupations there is a tendency for younger qualified people to move to urban areas
known practices and are less likely to experiment with new technology Within this target group candidates with good entrepreneurial ability are scarce There is a perceived shortage of Agricultural Extensionists and advisors to assist this target group However a large pool of young unemployed graduates exists who could assist such emerging farmers if they were mobilised and made accessible to farmers Similarly the potential pool of retired commercial farmers who could serve as mentors to this target group
remain profitable and viable it can be stated that many of the existing farmers and managers owners lack business management and entrepreneurial orientation Equity policy and the need to become BEE compliant requires that commercial enterprises appoint and develop black owners directors managers Changing local and global consumer preferences require farmers to change traditional farming methods and practices Skills and knowledge requirements include bull Global food and
international quality standards
bull Product traceability requirements
bull Organic produce and products
Specific occupations identified as being in short supply are
bull Production Managers (food processing)
bull Product specialisation to international specifications (research skills)
bull Forklift drivers heavy vehicletruck drivers and mobile plant operators
bull Experienced and competent artisans (millwrights electricians fitters
enrolments andor pass rates at HET institutions with the result that too few qualified persons come onto the labour market) Examples of such skills shortages identified by the Department include Agricultural Engineers bull Plant Health
Specialists (Nematology Entomology Plant Pathology)
bull Statisticians (specialised agricultural knowledge)
bull Plant Health Pest Risk Analysts
bull Agricultural Economists (production and resource economists)
bull Agricultural Food and Quarantine Technicians
bull Agro‐meteorologists Early warning Specialists
bull Pasture Scientists bull Plant Production
Specialists (eg ornamental crops hydroponics)
bull Specialised Food Analysts (pesticide residue analysts processed food and dairy analysts wine and spirit analysts)
AgriSETA June 2010
Agriculture Sector Analysis 37
GENERAL NEEDS SMALL‐SCALE FARMER
NEEDS COMMERCIAL SECTOR
NEEDS DAFF NEEDS
and turners bull Agricultural
Equipment Technicians
bull Pest and weed controllers
bull Horticultural specialists
LABOUR SHORTAGES AND RELATED SKILLS NEEDS Given an employment rate of some 26 (2009 currently estimated at over 30expanded definition) per definition there cannot be a labour shortage It is however difficult for people who have never worked before to integrate into the agricultural sector workforce Coupled with an aging workforce (30‐60 being over 40) means that most agri enterprises will within the next 5‐10 years be looking at replacing a large proportion of their workforce There could be an insufficient pool of people willing and able to participate The impact of HIVAIDS is also not always factored in to understanding the diminishing pool of resources available Labour shortages have been reported within selected geographical areas and in particular occupations Examples include cane cutters in the sugar industry chicken catchers in the poultry industry pickers in the fruit industry and animal handlers in feedlots as well as dairy parlour workers It is however believed that these shortages may reflect a recruitment problem as a result of the very harsh working conditions and the relatively poor remuneration (which makes these occupations unpopular) At present such ldquoshortagesrdquo are addressed through contracting labour from neighbouring countries
AgriSETA WSP analyses
Skills demand in the commercial agricultural sector
Information for demand for skills from WSP data is available for 1 673 employers who submitted their WSPs for the 200910 period The table below shows data on sub‐sector WSP submission relative to size of the sub‐sector as well as subsector data from all registered organisations and those who submitted WSPs Data for registered employers shows that there were 239 076 employees employed by the 17 234 registered organisations As previously stated 97 898 employees were employed by the organisations submitting WSPs This constitutes 41 of employees employed by registered organisations
Table 20 Employment and sub‐sector data drawn from WSP analyses
Sub‐sector
All Re
gistered
Employers
Small employers (0‐49)
Med
ium and
large
employers (50+)
Total W
SPs received
Total W
SPs received
as of
all registered em
ployers
WSP
received med
ium and
large orgs
WSPs received
as of
med
ium amp large em
ployers
WSPs received
small
employers
WSPs received
as of small
enterprises
EmployeesPer
Profile
CoffeeTea 40 33 7 9 23 5 71 4 12 483 Fibre 1 710 1 676 34 34 2 22 65 12 07 6 539
AgriSETA June 2010
Agriculture Sector Analysis 38
Sub‐sector
All Re
gistered
Employers
Small employers (0‐49)
Med
ium and
large
employers (50+)
Total W
SPs received
Total W
SPs received
as of
all registered em
ployers
WSP
received med
ium and
large orgs
WSPs received
as of
med
ium amp large em
ployers
WSPs received
small
employers
WSPs received
as of small
enterprises
EmployeesPer
Profile
Fruit 371 277 94 162 44 76 81 86 31 27 873 Grain 648 581 67 77 12 48 72 29 5 22 129 Milling 335 279 56 61 18 35 63 26 9 4 630 Pest Control 213 209 4 8 4 2 50 6 3 119 Poultry 391 305 86 66 17 46 53 20 7 19 187 Primary 12 121 10 776 1 345 1144 9 513 38 631 6 136 034 Red meat 1107 1 018 89 70 6 45 51 25 2 7 475 Seed 167 149 18 24 14 13 72 11 7 2 127 Sugar 71 45 26 13 18 10 38 3 7 10 478 Tobacco 60 46 14 5 8 3 21 2 4 2 002
Totals 17 234 15 394 1 840 1 673 10 818 44 855 16 239 076
Source 1 AgriSETA WSP 2009 data
Only 10 of all registered employers submitted WSPs for the 200910 period Of these 49 were medium and large sized employers and 51 small However only 16 small employers submitted their WSPs relative to the number of registered small employers and 44 medium and large employers submitted WSPs relative to the number of registered medium and large employers As such skills demand statistics provides more representative data on the requirements of medium and large employers Data for skills demand in the commercial agricultural sector is based on data for permanent employees as well as casual and seasonal employees
Skills demand forecasting by AgriSETA
Forecasting for skills demand the AgriSETA has estimated that the demand for skilled employees at different levels in the next few years is 510 686 This is based on WSP data analyses over the last 5 years and projected demand for the formal commercial agricultural sector and factoring in the demand that at maximum would result from completion of the land restitution programme in South Africa The table below reflects the skills that are on demand as well as the estimates for demand over the next five years by major occupational category35
35 AgriSETA 2010
AgriSETA June 2010
Table 21 Demand for skills by occupational category
Major Occupation (OFO)Estimated Demand
Group Title1 Managers (commercial and small emerging farmers) 264 3702 Professionals 4 1413 Technicians and Trade workers 8 9255 Clerical and administrative workers 8006 Sales workers 4007 Machinery operators and drivers 5 8008 Elementary workers 226 250
Total 510 686Source AgriSETA WSP data and SSP demand forecasts
Research needs going forward
As has been set out in the sector analysis and the scenarios derived from that analysis the sector is faced by both significant and profound change and also great uncertainty It therefore follows that the task of focussing limited resources (basically levy income in the formal sector and NSF funds for the emergent farming sector) is difficult Whilst the general thrust of training remains broadly as described in the 2006‐10 SSP Updates some considerable work is required to achieve targeted effective interventions during the 2011‐2016 period The following research questions will need to be addressed in preparing the next SSP
bull In relation to the managers and owner‐managers of commercial farms and enterprises what skills are needed to enable them to help bring about the more optimistic scenario and manage the risks associated with the less optimistic ones
bull In terms of professional and technical competencies do the current education and training institutions coupled with the learning programmes available through the AgriSETA (learnerships skills programmes and the like) meet the needs of the sector
bull In the emerging agricultural sector do the current programmes funded by sources external to the AgriSETA (eg NSF) meet all the identified needs What gaps are there and how should they be addressed
bull In relation to governmentrsquos growth strategy and industrial action plans what skills are required for developing the aquaculture sub‐sector What programmes are available How can the SETA support the skills needs for this sub‐sector
bull Given the increasing levels of casual and contract labour how can skills be developed to meet the needs of the formal commercial sector and the emerging enterprise sector
bull How can the demand in each of the priority areas be quantified and agreement be reached on numbers of people to be trained
Agriculture Sector Analysis 39
AgriSETA June 2010
SECTION 3 Skills Gaps and scarce skills
Scarce skills at the DAFF
The level of scarce skills at DAFF can be determined by the vacancy rate While the average vacancy rate in the department as at 31 March 2009 was 17 there were some posts that had very high vacancy rates as reflected in the table below Indicating the possibility that the Department is experiencing difficulties in finding suitable candidates in the South African labour market to fill these posts
Table 22 Scarce skill occupations and vacancy rates (DAFF March 2009) Critical occupations Number of posts Posts filled Vacancy rate ()
Agricultural animal oceanography forestry and other sciences
167 119 287
Engineering sciences related 2 1 50Engineers and related professions 13 6 538Farming forestry advisors and farm managers 11 4 636Finance and economics related 73 53 274Horticulturists foresters agricultural and forestry technicians
350 221 369
Legal related 6 4 333Mechanical engineering technicians 3 2 333Risk management and security services 6 4 333Social sciences related 1 0 100Veterinarians 34 24 294
Source DAFF Annual Report 20082009
Skills are also scarce at senior management level The department also reports on difficulties it has filling senior management services vacancies with some of them staying vacant for up to twelve months because no suitable candidates can be found The department would then resort to re‐advertisement and head hunting This was the case with 22 of 18 SMS posts in March 2009
Scarce skills in the commercial sector
The following occupations have previously been projected as scarce (extremely hard to fill vacancies) by AgriSETA in the commercial agricultural sector over the next five years
Table 23 Scarce and critical skills in the commercial agricultural sector
Occupation Code
Group Occupation Critical Skills Intervention Comments
139903 Managers Laboratory Manager
Technology AI nutrition
HET
221101 Professionals Accountant (General)
General HET
221102 Professionals Management Accountant
Farm financial management
HET Focus on support advice to farmers new enterprises
222101 Professionals Commodities Trader
Export administration supply chain
FET Learnership Skills
Agriculture Sector Analysis 40
AgriSETA June 2010
Agriculture Sector Analysis 41
Occupation Code
Group Occupation Critical Skills Intervention Comments
management Programme
224301 Professionals Economist Agricultural HET
Mainly for Department of Agriculture and para statals commodity organisations
233101 Professionals Chemical Engineer
Chemical processes in food production
HET Industries such as sugar processing
233301 Professionals Electrical Engineer
Installation and maintenance
HET Processing industry
233401 Professionals Electronics Engineer
Computerised production prosesses
HET Processing industry
233501 Professionals Industrial Engineer
Productivity and efficiency
HET Processing industry
233904 Professionals
Instrument Engineer (Defence Force)
Installation and maintenance
HET
Not for defence ‐ sugar industry
233502 Professionals Mechanical Engineer
FETHET Equity reasons
233902 Professionals Agricultural Engineer
Farm layout and infrastructure
HET Mainly in Government
311101 Technicians and trades workers
Agricultural Technician
Installation and maintenance
FETHET
234102 Professionals Agricultural Scientist
Agri research HETFET Especially in horticulture
234201 Professionals Chemist HET Processing industry
234202 Professionals Food Technologist
Food safety HACCP
FETHET Across sector
234701 Professionals Veterinarian HET Mainly in Government
311101 Technicians and trades workers
Agricultural Technician
Farm infrastructure
FET Mainly needed in government
311401 Technicians and trades workers
Chemistry Technician
FETHET EE reasons
312907 Technicians and trades workers
Chemical Engineering Technician
FET Learnership
Mainly EE reasons
312402 Technicians and trades workers
Electronic Engineering Technician
Weak stream production infra
FETHET Mainly tobacco industry
233904 Professionals
Instrument Engineer (Defence Force)
Instrument technician
FET
Occupation needed Instrument Technician (not defence force) Mainly sugar processing sector
321202 Technicians and trades workers
Diesel Motor Mechanic
FET Learnership
To include tractor mechanic
321204 Technicians and trades workers
Small Engine Mechanic
Agricultural equipment
FET Learnership
Throughout sector
AgriSETA June 2010
Agriculture Sector Analysis 42
Occupation Code
Group Occupation Critical Skills Intervention Comments
322301 Technicians and trades workers
Metal Fabricator
Artisan FET Learnership
322303 Technicians and trades workers
Welder Welder (First Class)
Artisan FET Learnership
323203 Technicians and trades workers
Fitter‐Welder Artisan FET Learnership
Mainly sugar ndash multi‐skilled
323202 Technicians and trades workers
Fitter And Turner
Artisan FET Learnership
Tobacco and sugar
323501 Technicians and trades workers
Millwright Artisan FET Learnership
Wide‐spread need
341101 Technicians and trades workers
Electrician (General)
Artisan FET Learnership
Wide‐spread need
342101 Technicians and trades workers
Air‐Conditioning And Refrigeration Mechanic
Artisan FET Learnership
Sugar pack houses cold chain
Source AgriSETA Sector Skills Plans
Supply of skills
South Africarsquos agriculture skills are produced in high schools agricultural colleges FET colleges and Higher Education institutions In high school a large cohort of learners take Agricultural Science as a subject In 2003 there were 42 Agricultural High Schools offering Agricultural Science as a subject These students and those in high schools taking the subject could progress to taking agriculture as a focus area for further education In 2004 there were 10 FET colleges offering vocationally directed agricultural programmes These FET colleges offered complete qualifications and short courses Eleven Colleges of Agriculture can offer qualifications up to degree level and 19 universities offer qualifications in Agriculture ranging from agricultural economics animal and plant sciences and horticulture among others at under and post graduate levels (Department of Agriculture 2006) While long term planning of skilling of new entrants in the sector can be done through close consultation between the sector agricultural schools and colleges FET colleges and HET institutions so that they teach relevant skills there are other avenues for training for those who are already employed in the sector for example skills programmes and learnerships There are 15 registered qualifications for the primary agriculture sub sectors Currently AgriSETA has 94 registered learnerships that can address the skills needs of the identified scarce skills These are captured in Appendix 2 AgriSETA has approved accredited a number of training providers across the country to deliver the theoretical and practical components of these learnerships These include agricultural colleges FET colleges and private providers Currently the AgriSETA has 246 registered and approved providers distributed nationally as follows
AgriSETA June 2010
Table 29 AgriSETA approved training providers (2010) Province Number of providers
Gauteng 72
(29)
KwaZulu Natal 20
(8)
Limpopo 35
(14)
North West 30
(12)
Northern Cape 3
(1)
Free State 15
(6)
Mpumalanga 14
(6)
Western Cape 26
(11)
Eastern Cape 31
(13) Total 246
The providers are small to large organisations In primary agriculture small providers appear to offer the most training in rural areas and community projects (AgriSETA 2010) Most of the operating providers will be in FET colleges and agricultural colleges The AgriSETA is unable to meet the total demands for skills across the duality of their sector There seems to be fairness in the approval of training for both permanent and casual and seasonal workers In 200809 the AgriSETA approved 559 learnerships as follows
Table 30 AgriSETA learnerships approved for grant purposes (2008‐2009)
Source AgriSETA learnership data analysis
Agriculture Sector Analysis 43
AgriSETA June 2010
Agriculture Sector Analysis 44
Provision of skills programmes in the same year attracted grants for 2 706 employees
Table 31 Participation by learners in skills programmes in the AgriSETA (200809)
Source AgriSETA Skills programmes data analysis
AgriSETA June 2010
APPENDIX 1 Skills demand in the Department of Agriculture Forestry amp Fisheries (200809)
Source DAFF Annual Report 2008‐20009
Agriculture Sector Analysis 45
AgriSETA June 2010
Agriculture Sector Analysis 46
Appendix 2 AgriSETA registered learnerships Registered Learnership NQF Level SAQA Registration NoLearnership in Agri Sales and Service 4 22 Q 220001 20 178 4Learnership Agricultural Machinery Technician 2 22 Q 220007 20 160 2Learnership in Specialist Agricultural Machinery Technician 5 22 Q 220009 21 258 5Agri Trade Processes 2 22 Q 220013 30 125 2FETC Meat Examination Applying Basic Business Principles 4 30 Q 3000 2823 164 4Further Education and Training Certificate Seed Marketing Execute Seed Trials 4 22 Q 220025 21 126 4Further Education and Training Certificate Seed Research and Development Certify as Seed Unit 4 22 Q 220027 21 121 4FETC Seed Research and Development Conduct a Field Inspection of a Seed Unit 4 22 Q 220028 20 120 4Seed Research and Development Operations Operate in a Team 3 22 Q 220020 22 121 3Seed Research and Development Operations Apply Basic Business Principles 3 22 Q 220021 22 121 3National Certificate Seed Processing and Packaging Operate in a Team 3 22 Q 220026 21 123 3Sugar Industry Technical Maintenance worker 2 22 Q 220011 39 128 2National Certificate Sugar Manufacturing and Refining Technical Maintenance 3 30 Q300003 23 146 3Further Education and Training Certificate Manufacturing Technical MaintenanceProduce Components by Performing Engineering Turning Operations
4 30 Q 3000 1321 173 4
FETC Manufacturing Technical Maintenance Produce Components by Performing Milling Operations 4 30 Q 3000 1521 173 4 FETC Manufacturing Technical Maintenance Develop and Fabricate from Complex Drawing 4 30 Q 3000 1420 173 4National Certificate in Sugar Technology 5 22 Q 220036 22 140 5Further Education and Training Certificate Sugar Processing 4 22 Q 220035 31 144 4National Certificate in Sugar Technology Processing Sugar Refining 2 22 Q 220037 28 124 2National Certificate in Sugar Technology Processing Juice Preparation 2 22 Q 220038 28 124 2National Certificate in Sugar Technology Processing Crystallisation 2 22 Q 220039 27 122 2National Certificate in Sugar Technology Processing Laboratory Practice 2 22 Q 220040 25 124 2National Certificate in Sugar Technology Processing Extraction 2 22 Q 220041 28 122 2NC Rooibos Production Applying Basic Business Principles 2 30 Q 3000 2427 130 2 NC Rooibos Processing Applying Basic Business Principles 2 30 Q 3000 2224 123 2 National Certificate Cigarette Production 3 22 Q 220046 23 121 3
AgriSETA June 2010
REFERENCES AgriSETA 2010 AgriSETA 20082009 Annual report Pretoria AgriSETA Agricultural Research Council httpwwwarcagriczahomeasppid=272 Avert South African HIV and AIDS statistics Available on httpwwwavertorgsafricastatshtm Centre for Development Enterprise 2008 Land reform in South Africa Getting back on track CDE Research No 16 DAFF 2010 Quarterly economic review of the agriculture sector Pretoria DAFF DAFF 2009 Annual report 20082009 Pretoria DAFF Department of Agriculture 2008 Strategic plan 2008 Pretoria Department of Agriculture DTI An introduction to the South African economy Available on httpwwwthedtigovzapublicationsagroprocessinghtm Eastern Cape Provincial Government Eastern Cape Provincial Growth and Development Strategy 2004 ndash 2014 Economic Commission for Africa 2009 Developing African agriculture through regional value chains Addis Ababa Economic Commission for Africa Economic Report Free State Province 2005 Provincial Growth and Development Strategy 2005 ndash 2014 GCIS 2010 SA Yearbook 200910rdquo Agriculture forestry and fisheries Pretoria GCIS Greenberg S 2010 Status report on land and agricultural policy in South Africa 2010 Institute for Poverty Land and Agrarian Studies School of Government University of the Western Cape Research report Ingelozi Management Solutions 2008 HIVAIDS in the South African agricultural sector Towards the development of a long term intervention Research report KwaZulu Natal Provincial Government 2006 KwaZulu Natal Provincial Growth and Development Strategy Limpopo Provincial Government Growth and Development Strategy 2004 ndash 2014 Mhone G (2000) Enclavity and Constrained Labour Absorbtive Capacity in Southern African Countries Geneva International Labour Office Moyo S The Agrarian question and the developmental state in South Africa In Edigheji O et al 2010 Constructing a democratic developmental state in South Africa HSRC PRESS
Agriculture Sector Analysis 47
AgriSETA
Agriculture Sector Analysis
National Treasury Republic of South Africa 2010 National Budget 2010 ndash National Budget Review 2010 Pretoria National Treasury Northern Cape Provincial Government Agriculture and agro‐processing sector strategy North West Provincial Government North West Provincial Growth and Development Strategy 2004 ndash 2014 Province of the Western Cape 2008 The Ikapa growth and development strategy White Paper SABCOHA SA Business Coalition on HIV and AIDS wwwsabcohaorg SACAU httpwwwsacauorghostingsacauSacauWebnsfHomehtmOpenForm South African Government 2010 20102011 ndash 20122013 Industrial Policy Action Plan Republic of South Africa Statistics South Africa 2005 Census of commercial agriculture 2002 Report No 110201 Pretoria Statistics South Africa Statistics South Africa 2009 Census of commercial agriculture 2007 Statistical release P1101 Pretoria Statistics South Africa Statistics South Africa 2010 General household survey 2009 Statistical release P0318 Pretoria Statistics South Africa Statistics South Africa 2010 Gross domestic product first quarter 2010 Statistical release P0441 Pretoria Statistics South Africa Statistics South Africa 2010 Quarterly labour force survey Quarter 1 2010 Statistical release P0211 Pretoria Statistics South Africa Vink N amp van Rooyen J 2009 The economic performance of agriculture in South Africa since 1994 The implications for food security Pretoria DBSA development planning division working paper series No 17 Webster E 2004 the Dual Economy from a book by Van Holdt K and Webster E Work restructuring and the Crisis of Social reproduction and 10 years of restructuring post apartheid workplaces University of Natal Press Workinfocom httpwwwworkinfocomfreesub_for_legresdatalraempassoc3htm Xingwana L 2008 Challenges and Opportunities for Land and Agrarian Reform towards 2025 Speech delivered at the Agri‐Consultation Protea Ranch Hotel Polokwane 30 July 2008
- Table of contents
- SECTION 1 THE AGRICULTURAL LANDSCAPE
- 11 Size and shape of the Agricultural sector
-
- Overview
- Distribution of agricultural production
- The structure of the agriculture sector in South Africa
- Categories of farming enterprises
- Employment trends
- Employment categories and remuneration
- Stakeholders in the Agricultural sector
-
- National government departments
- Sector representatives
-
- 12 Factors impacting development in the Agriculture sector
-
- Future sector economic growth and development
-
- South African sector growth plans (IPAP2)
- International Trade
- Global recession and rise in food prices
-
- Land reform
- Reliance on imports
- Water
- The labour market
- Consumer trends
- HIVAIDS
- Farm safety and security
- Broad-based Black Economic Empowerment
-
- Conclusions and scenarios
- SECTION 2 DEMAND FOR SKILLS
-
- AgriSETA registered employers and employee coverage
- Employee coverage in the AgriSETA
-
- 21 Skills demand
-
- The National Education and Training Strategy for Agriculture (AET Strategy)
- AGRISETA sector skills planning demand data (2008-2009)
- AgriSETA WSP analyses
-
- Skills demand in the commercial agricultural sector
-
- Skills demand forecasting by AgriSETA
- Research needs going forward
-
- SECTION 3 Skills Gaps and scarce skills
-
- Scarce skills at the DAFF
- Scarce skills in the commercial sector
- Supply of skills
-
- APPENDIX 1 Skills demand in the Department of Agriculture Forestry amp Fisheries (200809)
- Appendix 2 AgriSETA registered learnerships
-
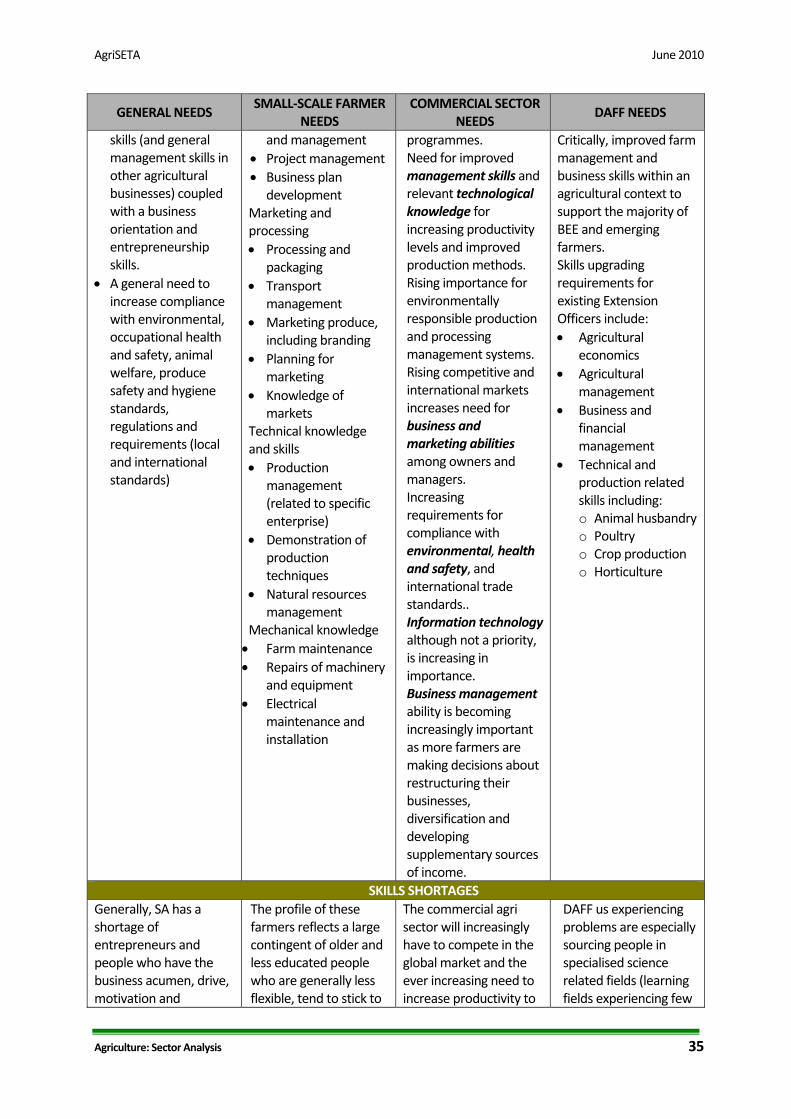
AgriSETA June 2010
Agriculture Sector Analysis 35
GENERAL NEEDS SMALL‐SCALE FARMER
NEEDS COMMERCIAL SECTOR
NEEDS DAFF NEEDS
skills (and general management skills in other agricultural businesses) coupled with a business orientation and entrepreneurship skills
bull A general need to increase compliance with environmental occupational health and safety animal welfare produce safety and hygiene standards regulations and requirements (local and international standards)
and management bull Project management bull Business plan
development Marketing and processing bull Processing and
packaging bull Transport
management bull Marketing produce
including branding bull Planning for
marketing bull Knowledge of
markets Technical knowledge and skills bull Production
management (related to specific enterprise)
bull Demonstration of production techniques
bull Natural resources management
Mechanical knowledge bull Farm maintenance bull Repairs of machinery
and equipment bull Electrical
maintenance and installation
programmes Need for improved management skills and relevant technological knowledge for increasing productivity levels and improved production methods Rising importance for environmentally responsible production and processing management systems Rising competitive and international markets increases need for business and marketing abilities among owners and managers Increasing requirements for compliance with environmental health and safety and international trade standards Information technology although not a priority is increasing in importance Business management ability is becoming increasingly important as more farmers are making decisions about restructuring their businesses diversification and developing supplementary sources of income
Critically improved farm management and business skills within an agricultural context to support the majority of BEE and emerging farmers Skills upgrading requirements for existing Extension Officers include bull Agricultural
economics bull Agricultural
management bull Business and
financial management
bull Technical and production related skills including o Animal husbandryo Poultry o Crop production o Horticulture
SKILLS SHORTAGES Generally SA has a shortage of entrepreneurs and people who have the business acumen drive motivation and
The profile of these farmers reflects a large contingent of older and less educated people who are generally less flexible tend to stick to
The commercial agri sector will increasingly have to compete in the global market and the ever increasing need to increase productivity to
DAFF us experiencing problems are especially sourcing people in specialised science related fields (learning fields experiencing few
AgriSETA June 2010
Agriculture Sector Analysis 36
GENERAL NEEDS SMALL‐SCALE FARMER
NEEDS COMMERCIAL SECTOR
NEEDS DAFF NEEDS
perseverance to become a successful farmer Given the high risks involved in the agricultural sector (natural elements outside onersquos control) the agri sector does not compete successfully for this ldquoscarce resourcerdquo Moreover as with other professional and skilled occupations there is a tendency for younger qualified people to move to urban areas
known practices and are less likely to experiment with new technology Within this target group candidates with good entrepreneurial ability are scarce There is a perceived shortage of Agricultural Extensionists and advisors to assist this target group However a large pool of young unemployed graduates exists who could assist such emerging farmers if they were mobilised and made accessible to farmers Similarly the potential pool of retired commercial farmers who could serve as mentors to this target group
remain profitable and viable it can be stated that many of the existing farmers and managers owners lack business management and entrepreneurial orientation Equity policy and the need to become BEE compliant requires that commercial enterprises appoint and develop black owners directors managers Changing local and global consumer preferences require farmers to change traditional farming methods and practices Skills and knowledge requirements include bull Global food and
international quality standards
bull Product traceability requirements
bull Organic produce and products
Specific occupations identified as being in short supply are
bull Production Managers (food processing)
bull Product specialisation to international specifications (research skills)
bull Forklift drivers heavy vehicletruck drivers and mobile plant operators
bull Experienced and competent artisans (millwrights electricians fitters
enrolments andor pass rates at HET institutions with the result that too few qualified persons come onto the labour market) Examples of such skills shortages identified by the Department include Agricultural Engineers bull Plant Health
Specialists (Nematology Entomology Plant Pathology)
bull Statisticians (specialised agricultural knowledge)
bull Plant Health Pest Risk Analysts
bull Agricultural Economists (production and resource economists)
bull Agricultural Food and Quarantine Technicians
bull Agro‐meteorologists Early warning Specialists
bull Pasture Scientists bull Plant Production
Specialists (eg ornamental crops hydroponics)
bull Specialised Food Analysts (pesticide residue analysts processed food and dairy analysts wine and spirit analysts)
AgriSETA June 2010
Agriculture Sector Analysis 37
GENERAL NEEDS SMALL‐SCALE FARMER
NEEDS COMMERCIAL SECTOR
NEEDS DAFF NEEDS
and turners bull Agricultural
Equipment Technicians
bull Pest and weed controllers
bull Horticultural specialists
LABOUR SHORTAGES AND RELATED SKILLS NEEDS Given an employment rate of some 26 (2009 currently estimated at over 30expanded definition) per definition there cannot be a labour shortage It is however difficult for people who have never worked before to integrate into the agricultural sector workforce Coupled with an aging workforce (30‐60 being over 40) means that most agri enterprises will within the next 5‐10 years be looking at replacing a large proportion of their workforce There could be an insufficient pool of people willing and able to participate The impact of HIVAIDS is also not always factored in to understanding the diminishing pool of resources available Labour shortages have been reported within selected geographical areas and in particular occupations Examples include cane cutters in the sugar industry chicken catchers in the poultry industry pickers in the fruit industry and animal handlers in feedlots as well as dairy parlour workers It is however believed that these shortages may reflect a recruitment problem as a result of the very harsh working conditions and the relatively poor remuneration (which makes these occupations unpopular) At present such ldquoshortagesrdquo are addressed through contracting labour from neighbouring countries
AgriSETA WSP analyses
Skills demand in the commercial agricultural sector
Information for demand for skills from WSP data is available for 1 673 employers who submitted their WSPs for the 200910 period The table below shows data on sub‐sector WSP submission relative to size of the sub‐sector as well as subsector data from all registered organisations and those who submitted WSPs Data for registered employers shows that there were 239 076 employees employed by the 17 234 registered organisations As previously stated 97 898 employees were employed by the organisations submitting WSPs This constitutes 41 of employees employed by registered organisations
Table 20 Employment and sub‐sector data drawn from WSP analyses
Sub‐sector
All Re
gistered
Employers
Small employers (0‐49)
Med
ium and
large
employers (50+)
Total W
SPs received
Total W
SPs received
as of
all registered em
ployers
WSP
received med
ium and
large orgs
WSPs received
as of
med
ium amp large em
ployers
WSPs received
small
employers
WSPs received
as of small
enterprises
EmployeesPer
Profile
CoffeeTea 40 33 7 9 23 5 71 4 12 483 Fibre 1 710 1 676 34 34 2 22 65 12 07 6 539
AgriSETA June 2010
Agriculture Sector Analysis 38
Sub‐sector
All Re
gistered
Employers
Small employers (0‐49)
Med
ium and
large
employers (50+)
Total W
SPs received
Total W
SPs received
as of
all registered em
ployers
WSP
received med
ium and
large orgs
WSPs received
as of
med
ium amp large em
ployers
WSPs received
small
employers
WSPs received
as of small
enterprises
EmployeesPer
Profile
Fruit 371 277 94 162 44 76 81 86 31 27 873 Grain 648 581 67 77 12 48 72 29 5 22 129 Milling 335 279 56 61 18 35 63 26 9 4 630 Pest Control 213 209 4 8 4 2 50 6 3 119 Poultry 391 305 86 66 17 46 53 20 7 19 187 Primary 12 121 10 776 1 345 1144 9 513 38 631 6 136 034 Red meat 1107 1 018 89 70 6 45 51 25 2 7 475 Seed 167 149 18 24 14 13 72 11 7 2 127 Sugar 71 45 26 13 18 10 38 3 7 10 478 Tobacco 60 46 14 5 8 3 21 2 4 2 002
Totals 17 234 15 394 1 840 1 673 10 818 44 855 16 239 076
Source 1 AgriSETA WSP 2009 data
Only 10 of all registered employers submitted WSPs for the 200910 period Of these 49 were medium and large sized employers and 51 small However only 16 small employers submitted their WSPs relative to the number of registered small employers and 44 medium and large employers submitted WSPs relative to the number of registered medium and large employers As such skills demand statistics provides more representative data on the requirements of medium and large employers Data for skills demand in the commercial agricultural sector is based on data for permanent employees as well as casual and seasonal employees
Skills demand forecasting by AgriSETA
Forecasting for skills demand the AgriSETA has estimated that the demand for skilled employees at different levels in the next few years is 510 686 This is based on WSP data analyses over the last 5 years and projected demand for the formal commercial agricultural sector and factoring in the demand that at maximum would result from completion of the land restitution programme in South Africa The table below reflects the skills that are on demand as well as the estimates for demand over the next five years by major occupational category35
35 AgriSETA 2010
AgriSETA June 2010
Table 21 Demand for skills by occupational category
Major Occupation (OFO)Estimated Demand
Group Title1 Managers (commercial and small emerging farmers) 264 3702 Professionals 4 1413 Technicians and Trade workers 8 9255 Clerical and administrative workers 8006 Sales workers 4007 Machinery operators and drivers 5 8008 Elementary workers 226 250
Total 510 686Source AgriSETA WSP data and SSP demand forecasts
Research needs going forward
As has been set out in the sector analysis and the scenarios derived from that analysis the sector is faced by both significant and profound change and also great uncertainty It therefore follows that the task of focussing limited resources (basically levy income in the formal sector and NSF funds for the emergent farming sector) is difficult Whilst the general thrust of training remains broadly as described in the 2006‐10 SSP Updates some considerable work is required to achieve targeted effective interventions during the 2011‐2016 period The following research questions will need to be addressed in preparing the next SSP
bull In relation to the managers and owner‐managers of commercial farms and enterprises what skills are needed to enable them to help bring about the more optimistic scenario and manage the risks associated with the less optimistic ones
bull In terms of professional and technical competencies do the current education and training institutions coupled with the learning programmes available through the AgriSETA (learnerships skills programmes and the like) meet the needs of the sector
bull In the emerging agricultural sector do the current programmes funded by sources external to the AgriSETA (eg NSF) meet all the identified needs What gaps are there and how should they be addressed
bull In relation to governmentrsquos growth strategy and industrial action plans what skills are required for developing the aquaculture sub‐sector What programmes are available How can the SETA support the skills needs for this sub‐sector
bull Given the increasing levels of casual and contract labour how can skills be developed to meet the needs of the formal commercial sector and the emerging enterprise sector
bull How can the demand in each of the priority areas be quantified and agreement be reached on numbers of people to be trained
Agriculture Sector Analysis 39
AgriSETA June 2010
SECTION 3 Skills Gaps and scarce skills
Scarce skills at the DAFF
The level of scarce skills at DAFF can be determined by the vacancy rate While the average vacancy rate in the department as at 31 March 2009 was 17 there were some posts that had very high vacancy rates as reflected in the table below Indicating the possibility that the Department is experiencing difficulties in finding suitable candidates in the South African labour market to fill these posts
Table 22 Scarce skill occupations and vacancy rates (DAFF March 2009) Critical occupations Number of posts Posts filled Vacancy rate ()
Agricultural animal oceanography forestry and other sciences
167 119 287
Engineering sciences related 2 1 50Engineers and related professions 13 6 538Farming forestry advisors and farm managers 11 4 636Finance and economics related 73 53 274Horticulturists foresters agricultural and forestry technicians
350 221 369
Legal related 6 4 333Mechanical engineering technicians 3 2 333Risk management and security services 6 4 333Social sciences related 1 0 100Veterinarians 34 24 294
Source DAFF Annual Report 20082009
Skills are also scarce at senior management level The department also reports on difficulties it has filling senior management services vacancies with some of them staying vacant for up to twelve months because no suitable candidates can be found The department would then resort to re‐advertisement and head hunting This was the case with 22 of 18 SMS posts in March 2009
Scarce skills in the commercial sector
The following occupations have previously been projected as scarce (extremely hard to fill vacancies) by AgriSETA in the commercial agricultural sector over the next five years
Table 23 Scarce and critical skills in the commercial agricultural sector
Occupation Code
Group Occupation Critical Skills Intervention Comments
139903 Managers Laboratory Manager
Technology AI nutrition
HET
221101 Professionals Accountant (General)
General HET
221102 Professionals Management Accountant
Farm financial management
HET Focus on support advice to farmers new enterprises
222101 Professionals Commodities Trader
Export administration supply chain
FET Learnership Skills
Agriculture Sector Analysis 40
AgriSETA June 2010
Agriculture Sector Analysis 41
Occupation Code
Group Occupation Critical Skills Intervention Comments
management Programme
224301 Professionals Economist Agricultural HET
Mainly for Department of Agriculture and para statals commodity organisations
233101 Professionals Chemical Engineer
Chemical processes in food production
HET Industries such as sugar processing
233301 Professionals Electrical Engineer
Installation and maintenance
HET Processing industry
233401 Professionals Electronics Engineer
Computerised production prosesses
HET Processing industry
233501 Professionals Industrial Engineer
Productivity and efficiency
HET Processing industry
233904 Professionals
Instrument Engineer (Defence Force)
Installation and maintenance
HET
Not for defence ‐ sugar industry
233502 Professionals Mechanical Engineer
FETHET Equity reasons
233902 Professionals Agricultural Engineer
Farm layout and infrastructure
HET Mainly in Government
311101 Technicians and trades workers
Agricultural Technician
Installation and maintenance
FETHET
234102 Professionals Agricultural Scientist
Agri research HETFET Especially in horticulture
234201 Professionals Chemist HET Processing industry
234202 Professionals Food Technologist
Food safety HACCP
FETHET Across sector
234701 Professionals Veterinarian HET Mainly in Government
311101 Technicians and trades workers
Agricultural Technician
Farm infrastructure
FET Mainly needed in government
311401 Technicians and trades workers
Chemistry Technician
FETHET EE reasons
312907 Technicians and trades workers
Chemical Engineering Technician
FET Learnership
Mainly EE reasons
312402 Technicians and trades workers
Electronic Engineering Technician
Weak stream production infra
FETHET Mainly tobacco industry
233904 Professionals
Instrument Engineer (Defence Force)
Instrument technician
FET
Occupation needed Instrument Technician (not defence force) Mainly sugar processing sector
321202 Technicians and trades workers
Diesel Motor Mechanic
FET Learnership
To include tractor mechanic
321204 Technicians and trades workers
Small Engine Mechanic
Agricultural equipment
FET Learnership
Throughout sector
AgriSETA June 2010
Agriculture Sector Analysis 42
Occupation Code
Group Occupation Critical Skills Intervention Comments
322301 Technicians and trades workers
Metal Fabricator
Artisan FET Learnership
322303 Technicians and trades workers
Welder Welder (First Class)
Artisan FET Learnership
323203 Technicians and trades workers
Fitter‐Welder Artisan FET Learnership
Mainly sugar ndash multi‐skilled
323202 Technicians and trades workers
Fitter And Turner
Artisan FET Learnership
Tobacco and sugar
323501 Technicians and trades workers
Millwright Artisan FET Learnership
Wide‐spread need
341101 Technicians and trades workers
Electrician (General)
Artisan FET Learnership
Wide‐spread need
342101 Technicians and trades workers
Air‐Conditioning And Refrigeration Mechanic
Artisan FET Learnership
Sugar pack houses cold chain
Source AgriSETA Sector Skills Plans
Supply of skills
South Africarsquos agriculture skills are produced in high schools agricultural colleges FET colleges and Higher Education institutions In high school a large cohort of learners take Agricultural Science as a subject In 2003 there were 42 Agricultural High Schools offering Agricultural Science as a subject These students and those in high schools taking the subject could progress to taking agriculture as a focus area for further education In 2004 there were 10 FET colleges offering vocationally directed agricultural programmes These FET colleges offered complete qualifications and short courses Eleven Colleges of Agriculture can offer qualifications up to degree level and 19 universities offer qualifications in Agriculture ranging from agricultural economics animal and plant sciences and horticulture among others at under and post graduate levels (Department of Agriculture 2006) While long term planning of skilling of new entrants in the sector can be done through close consultation between the sector agricultural schools and colleges FET colleges and HET institutions so that they teach relevant skills there are other avenues for training for those who are already employed in the sector for example skills programmes and learnerships There are 15 registered qualifications for the primary agriculture sub sectors Currently AgriSETA has 94 registered learnerships that can address the skills needs of the identified scarce skills These are captured in Appendix 2 AgriSETA has approved accredited a number of training providers across the country to deliver the theoretical and practical components of these learnerships These include agricultural colleges FET colleges and private providers Currently the AgriSETA has 246 registered and approved providers distributed nationally as follows
AgriSETA June 2010
Table 29 AgriSETA approved training providers (2010) Province Number of providers
Gauteng 72
(29)
KwaZulu Natal 20
(8)
Limpopo 35
(14)
North West 30
(12)
Northern Cape 3
(1)
Free State 15
(6)
Mpumalanga 14
(6)
Western Cape 26
(11)
Eastern Cape 31
(13) Total 246
The providers are small to large organisations In primary agriculture small providers appear to offer the most training in rural areas and community projects (AgriSETA 2010) Most of the operating providers will be in FET colleges and agricultural colleges The AgriSETA is unable to meet the total demands for skills across the duality of their sector There seems to be fairness in the approval of training for both permanent and casual and seasonal workers In 200809 the AgriSETA approved 559 learnerships as follows
Table 30 AgriSETA learnerships approved for grant purposes (2008‐2009)
Source AgriSETA learnership data analysis
Agriculture Sector Analysis 43
AgriSETA June 2010
Agriculture Sector Analysis 44
Provision of skills programmes in the same year attracted grants for 2 706 employees
Table 31 Participation by learners in skills programmes in the AgriSETA (200809)
Source AgriSETA Skills programmes data analysis
AgriSETA June 2010
APPENDIX 1 Skills demand in the Department of Agriculture Forestry amp Fisheries (200809)
Source DAFF Annual Report 2008‐20009
Agriculture Sector Analysis 45
AgriSETA June 2010
Agriculture Sector Analysis 46
Appendix 2 AgriSETA registered learnerships Registered Learnership NQF Level SAQA Registration NoLearnership in Agri Sales and Service 4 22 Q 220001 20 178 4Learnership Agricultural Machinery Technician 2 22 Q 220007 20 160 2Learnership in Specialist Agricultural Machinery Technician 5 22 Q 220009 21 258 5Agri Trade Processes 2 22 Q 220013 30 125 2FETC Meat Examination Applying Basic Business Principles 4 30 Q 3000 2823 164 4Further Education and Training Certificate Seed Marketing Execute Seed Trials 4 22 Q 220025 21 126 4Further Education and Training Certificate Seed Research and Development Certify as Seed Unit 4 22 Q 220027 21 121 4FETC Seed Research and Development Conduct a Field Inspection of a Seed Unit 4 22 Q 220028 20 120 4Seed Research and Development Operations Operate in a Team 3 22 Q 220020 22 121 3Seed Research and Development Operations Apply Basic Business Principles 3 22 Q 220021 22 121 3National Certificate Seed Processing and Packaging Operate in a Team 3 22 Q 220026 21 123 3Sugar Industry Technical Maintenance worker 2 22 Q 220011 39 128 2National Certificate Sugar Manufacturing and Refining Technical Maintenance 3 30 Q300003 23 146 3Further Education and Training Certificate Manufacturing Technical MaintenanceProduce Components by Performing Engineering Turning Operations
4 30 Q 3000 1321 173 4
FETC Manufacturing Technical Maintenance Produce Components by Performing Milling Operations 4 30 Q 3000 1521 173 4 FETC Manufacturing Technical Maintenance Develop and Fabricate from Complex Drawing 4 30 Q 3000 1420 173 4National Certificate in Sugar Technology 5 22 Q 220036 22 140 5Further Education and Training Certificate Sugar Processing 4 22 Q 220035 31 144 4National Certificate in Sugar Technology Processing Sugar Refining 2 22 Q 220037 28 124 2National Certificate in Sugar Technology Processing Juice Preparation 2 22 Q 220038 28 124 2National Certificate in Sugar Technology Processing Crystallisation 2 22 Q 220039 27 122 2National Certificate in Sugar Technology Processing Laboratory Practice 2 22 Q 220040 25 124 2National Certificate in Sugar Technology Processing Extraction 2 22 Q 220041 28 122 2NC Rooibos Production Applying Basic Business Principles 2 30 Q 3000 2427 130 2 NC Rooibos Processing Applying Basic Business Principles 2 30 Q 3000 2224 123 2 National Certificate Cigarette Production 3 22 Q 220046 23 121 3
AgriSETA June 2010
REFERENCES AgriSETA 2010 AgriSETA 20082009 Annual report Pretoria AgriSETA Agricultural Research Council httpwwwarcagriczahomeasppid=272 Avert South African HIV and AIDS statistics Available on httpwwwavertorgsafricastatshtm Centre for Development Enterprise 2008 Land reform in South Africa Getting back on track CDE Research No 16 DAFF 2010 Quarterly economic review of the agriculture sector Pretoria DAFF DAFF 2009 Annual report 20082009 Pretoria DAFF Department of Agriculture 2008 Strategic plan 2008 Pretoria Department of Agriculture DTI An introduction to the South African economy Available on httpwwwthedtigovzapublicationsagroprocessinghtm Eastern Cape Provincial Government Eastern Cape Provincial Growth and Development Strategy 2004 ndash 2014 Economic Commission for Africa 2009 Developing African agriculture through regional value chains Addis Ababa Economic Commission for Africa Economic Report Free State Province 2005 Provincial Growth and Development Strategy 2005 ndash 2014 GCIS 2010 SA Yearbook 200910rdquo Agriculture forestry and fisheries Pretoria GCIS Greenberg S 2010 Status report on land and agricultural policy in South Africa 2010 Institute for Poverty Land and Agrarian Studies School of Government University of the Western Cape Research report Ingelozi Management Solutions 2008 HIVAIDS in the South African agricultural sector Towards the development of a long term intervention Research report KwaZulu Natal Provincial Government 2006 KwaZulu Natal Provincial Growth and Development Strategy Limpopo Provincial Government Growth and Development Strategy 2004 ndash 2014 Mhone G (2000) Enclavity and Constrained Labour Absorbtive Capacity in Southern African Countries Geneva International Labour Office Moyo S The Agrarian question and the developmental state in South Africa In Edigheji O et al 2010 Constructing a democratic developmental state in South Africa HSRC PRESS
Agriculture Sector Analysis 47
AgriSETA
Agriculture Sector Analysis
National Treasury Republic of South Africa 2010 National Budget 2010 ndash National Budget Review 2010 Pretoria National Treasury Northern Cape Provincial Government Agriculture and agro‐processing sector strategy North West Provincial Government North West Provincial Growth and Development Strategy 2004 ndash 2014 Province of the Western Cape 2008 The Ikapa growth and development strategy White Paper SABCOHA SA Business Coalition on HIV and AIDS wwwsabcohaorg SACAU httpwwwsacauorghostingsacauSacauWebnsfHomehtmOpenForm South African Government 2010 20102011 ndash 20122013 Industrial Policy Action Plan Republic of South Africa Statistics South Africa 2005 Census of commercial agriculture 2002 Report No 110201 Pretoria Statistics South Africa Statistics South Africa 2009 Census of commercial agriculture 2007 Statistical release P1101 Pretoria Statistics South Africa Statistics South Africa 2010 General household survey 2009 Statistical release P0318 Pretoria Statistics South Africa Statistics South Africa 2010 Gross domestic product first quarter 2010 Statistical release P0441 Pretoria Statistics South Africa Statistics South Africa 2010 Quarterly labour force survey Quarter 1 2010 Statistical release P0211 Pretoria Statistics South Africa Vink N amp van Rooyen J 2009 The economic performance of agriculture in South Africa since 1994 The implications for food security Pretoria DBSA development planning division working paper series No 17 Webster E 2004 the Dual Economy from a book by Van Holdt K and Webster E Work restructuring and the Crisis of Social reproduction and 10 years of restructuring post apartheid workplaces University of Natal Press Workinfocom httpwwwworkinfocomfreesub_for_legresdatalraempassoc3htm Xingwana L 2008 Challenges and Opportunities for Land and Agrarian Reform towards 2025 Speech delivered at the Agri‐Consultation Protea Ranch Hotel Polokwane 30 July 2008
- Table of contents
- SECTION 1 THE AGRICULTURAL LANDSCAPE
- 11 Size and shape of the Agricultural sector
-
- Overview
- Distribution of agricultural production
- The structure of the agriculture sector in South Africa
- Categories of farming enterprises
- Employment trends
- Employment categories and remuneration
- Stakeholders in the Agricultural sector
-
- National government departments
- Sector representatives
-
- 12 Factors impacting development in the Agriculture sector
-
- Future sector economic growth and development
-
- South African sector growth plans (IPAP2)
- International Trade
- Global recession and rise in food prices
-
- Land reform
- Reliance on imports
- Water
- The labour market
- Consumer trends
- HIVAIDS
- Farm safety and security
- Broad-based Black Economic Empowerment
-
- Conclusions and scenarios
- SECTION 2 DEMAND FOR SKILLS
-
- AgriSETA registered employers and employee coverage
- Employee coverage in the AgriSETA
-
- 21 Skills demand
-
- The National Education and Training Strategy for Agriculture (AET Strategy)
- AGRISETA sector skills planning demand data (2008-2009)
- AgriSETA WSP analyses
-
- Skills demand in the commercial agricultural sector
-
- Skills demand forecasting by AgriSETA
- Research needs going forward
-
- SECTION 3 Skills Gaps and scarce skills
-
- Scarce skills at the DAFF
- Scarce skills in the commercial sector
- Supply of skills
-
- APPENDIX 1 Skills demand in the Department of Agriculture Forestry amp Fisheries (200809)
- Appendix 2 AgriSETA registered learnerships
-
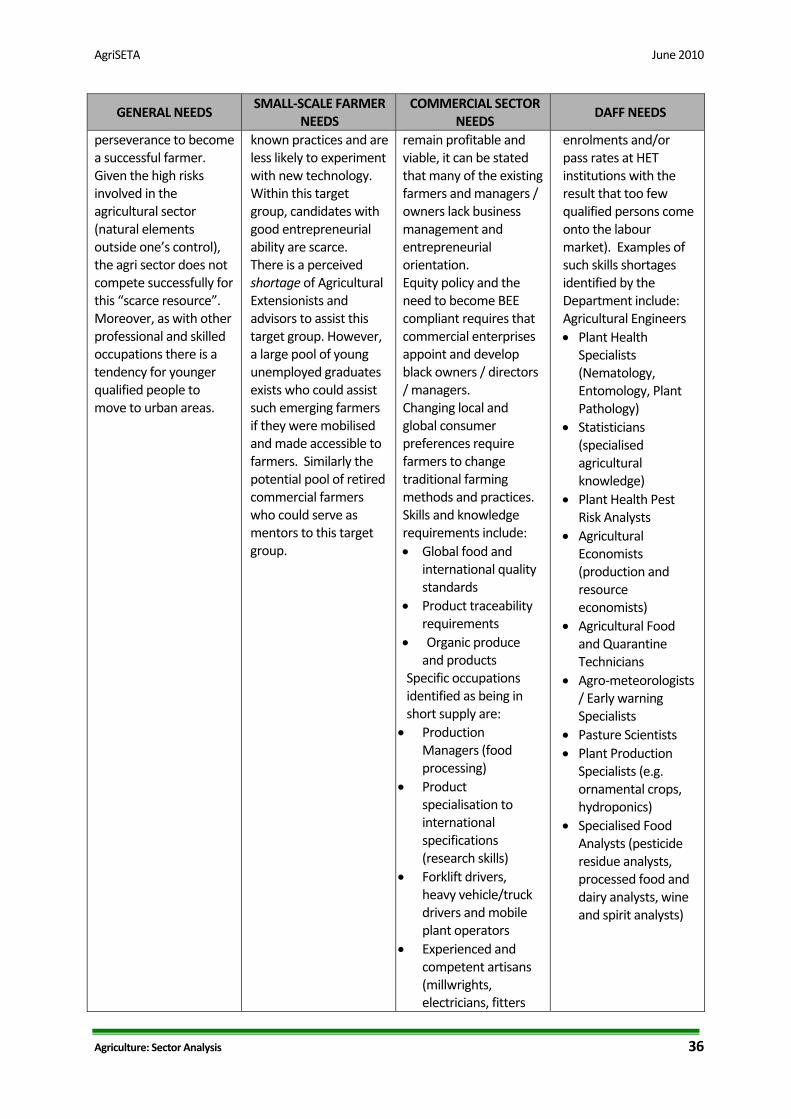
AgriSETA June 2010
Agriculture Sector Analysis 36
GENERAL NEEDS SMALL‐SCALE FARMER
NEEDS COMMERCIAL SECTOR
NEEDS DAFF NEEDS
perseverance to become a successful farmer Given the high risks involved in the agricultural sector (natural elements outside onersquos control) the agri sector does not compete successfully for this ldquoscarce resourcerdquo Moreover as with other professional and skilled occupations there is a tendency for younger qualified people to move to urban areas
known practices and are less likely to experiment with new technology Within this target group candidates with good entrepreneurial ability are scarce There is a perceived shortage of Agricultural Extensionists and advisors to assist this target group However a large pool of young unemployed graduates exists who could assist such emerging farmers if they were mobilised and made accessible to farmers Similarly the potential pool of retired commercial farmers who could serve as mentors to this target group
remain profitable and viable it can be stated that many of the existing farmers and managers owners lack business management and entrepreneurial orientation Equity policy and the need to become BEE compliant requires that commercial enterprises appoint and develop black owners directors managers Changing local and global consumer preferences require farmers to change traditional farming methods and practices Skills and knowledge requirements include bull Global food and
international quality standards
bull Product traceability requirements
bull Organic produce and products
Specific occupations identified as being in short supply are
bull Production Managers (food processing)
bull Product specialisation to international specifications (research skills)
bull Forklift drivers heavy vehicletruck drivers and mobile plant operators
bull Experienced and competent artisans (millwrights electricians fitters
enrolments andor pass rates at HET institutions with the result that too few qualified persons come onto the labour market) Examples of such skills shortages identified by the Department include Agricultural Engineers bull Plant Health
Specialists (Nematology Entomology Plant Pathology)
bull Statisticians (specialised agricultural knowledge)
bull Plant Health Pest Risk Analysts
bull Agricultural Economists (production and resource economists)
bull Agricultural Food and Quarantine Technicians
bull Agro‐meteorologists Early warning Specialists
bull Pasture Scientists bull Plant Production
Specialists (eg ornamental crops hydroponics)
bull Specialised Food Analysts (pesticide residue analysts processed food and dairy analysts wine and spirit analysts)
AgriSETA June 2010
Agriculture Sector Analysis 37
GENERAL NEEDS SMALL‐SCALE FARMER
NEEDS COMMERCIAL SECTOR
NEEDS DAFF NEEDS
and turners bull Agricultural
Equipment Technicians
bull Pest and weed controllers
bull Horticultural specialists
LABOUR SHORTAGES AND RELATED SKILLS NEEDS Given an employment rate of some 26 (2009 currently estimated at over 30expanded definition) per definition there cannot be a labour shortage It is however difficult for people who have never worked before to integrate into the agricultural sector workforce Coupled with an aging workforce (30‐60 being over 40) means that most agri enterprises will within the next 5‐10 years be looking at replacing a large proportion of their workforce There could be an insufficient pool of people willing and able to participate The impact of HIVAIDS is also not always factored in to understanding the diminishing pool of resources available Labour shortages have been reported within selected geographical areas and in particular occupations Examples include cane cutters in the sugar industry chicken catchers in the poultry industry pickers in the fruit industry and animal handlers in feedlots as well as dairy parlour workers It is however believed that these shortages may reflect a recruitment problem as a result of the very harsh working conditions and the relatively poor remuneration (which makes these occupations unpopular) At present such ldquoshortagesrdquo are addressed through contracting labour from neighbouring countries
AgriSETA WSP analyses
Skills demand in the commercial agricultural sector
Information for demand for skills from WSP data is available for 1 673 employers who submitted their WSPs for the 200910 period The table below shows data on sub‐sector WSP submission relative to size of the sub‐sector as well as subsector data from all registered organisations and those who submitted WSPs Data for registered employers shows that there were 239 076 employees employed by the 17 234 registered organisations As previously stated 97 898 employees were employed by the organisations submitting WSPs This constitutes 41 of employees employed by registered organisations
Table 20 Employment and sub‐sector data drawn from WSP analyses
Sub‐sector
All Re
gistered
Employers
Small employers (0‐49)
Med
ium and
large
employers (50+)
Total W
SPs received
Total W
SPs received
as of
all registered em
ployers
WSP
received med
ium and
large orgs
WSPs received
as of
med
ium amp large em
ployers
WSPs received
small
employers
WSPs received
as of small
enterprises
EmployeesPer
Profile
CoffeeTea 40 33 7 9 23 5 71 4 12 483 Fibre 1 710 1 676 34 34 2 22 65 12 07 6 539
AgriSETA June 2010
Agriculture Sector Analysis 38
Sub‐sector
All Re
gistered
Employers
Small employers (0‐49)
Med
ium and
large
employers (50+)
Total W
SPs received
Total W
SPs received
as of
all registered em
ployers
WSP
received med
ium and
large orgs
WSPs received
as of
med
ium amp large em
ployers
WSPs received
small
employers
WSPs received
as of small
enterprises
EmployeesPer
Profile
Fruit 371 277 94 162 44 76 81 86 31 27 873 Grain 648 581 67 77 12 48 72 29 5 22 129 Milling 335 279 56 61 18 35 63 26 9 4 630 Pest Control 213 209 4 8 4 2 50 6 3 119 Poultry 391 305 86 66 17 46 53 20 7 19 187 Primary 12 121 10 776 1 345 1144 9 513 38 631 6 136 034 Red meat 1107 1 018 89 70 6 45 51 25 2 7 475 Seed 167 149 18 24 14 13 72 11 7 2 127 Sugar 71 45 26 13 18 10 38 3 7 10 478 Tobacco 60 46 14 5 8 3 21 2 4 2 002
Totals 17 234 15 394 1 840 1 673 10 818 44 855 16 239 076
Source 1 AgriSETA WSP 2009 data
Only 10 of all registered employers submitted WSPs for the 200910 period Of these 49 were medium and large sized employers and 51 small However only 16 small employers submitted their WSPs relative to the number of registered small employers and 44 medium and large employers submitted WSPs relative to the number of registered medium and large employers As such skills demand statistics provides more representative data on the requirements of medium and large employers Data for skills demand in the commercial agricultural sector is based on data for permanent employees as well as casual and seasonal employees
Skills demand forecasting by AgriSETA
Forecasting for skills demand the AgriSETA has estimated that the demand for skilled employees at different levels in the next few years is 510 686 This is based on WSP data analyses over the last 5 years and projected demand for the formal commercial agricultural sector and factoring in the demand that at maximum would result from completion of the land restitution programme in South Africa The table below reflects the skills that are on demand as well as the estimates for demand over the next five years by major occupational category35
35 AgriSETA 2010
AgriSETA June 2010
Table 21 Demand for skills by occupational category
Major Occupation (OFO)Estimated Demand
Group Title1 Managers (commercial and small emerging farmers) 264 3702 Professionals 4 1413 Technicians and Trade workers 8 9255 Clerical and administrative workers 8006 Sales workers 4007 Machinery operators and drivers 5 8008 Elementary workers 226 250
Total 510 686Source AgriSETA WSP data and SSP demand forecasts
Research needs going forward
As has been set out in the sector analysis and the scenarios derived from that analysis the sector is faced by both significant and profound change and also great uncertainty It therefore follows that the task of focussing limited resources (basically levy income in the formal sector and NSF funds for the emergent farming sector) is difficult Whilst the general thrust of training remains broadly as described in the 2006‐10 SSP Updates some considerable work is required to achieve targeted effective interventions during the 2011‐2016 period The following research questions will need to be addressed in preparing the next SSP
bull In relation to the managers and owner‐managers of commercial farms and enterprises what skills are needed to enable them to help bring about the more optimistic scenario and manage the risks associated with the less optimistic ones
bull In terms of professional and technical competencies do the current education and training institutions coupled with the learning programmes available through the AgriSETA (learnerships skills programmes and the like) meet the needs of the sector
bull In the emerging agricultural sector do the current programmes funded by sources external to the AgriSETA (eg NSF) meet all the identified needs What gaps are there and how should they be addressed
bull In relation to governmentrsquos growth strategy and industrial action plans what skills are required for developing the aquaculture sub‐sector What programmes are available How can the SETA support the skills needs for this sub‐sector
bull Given the increasing levels of casual and contract labour how can skills be developed to meet the needs of the formal commercial sector and the emerging enterprise sector
bull How can the demand in each of the priority areas be quantified and agreement be reached on numbers of people to be trained
Agriculture Sector Analysis 39
AgriSETA June 2010
SECTION 3 Skills Gaps and scarce skills
Scarce skills at the DAFF
The level of scarce skills at DAFF can be determined by the vacancy rate While the average vacancy rate in the department as at 31 March 2009 was 17 there were some posts that had very high vacancy rates as reflected in the table below Indicating the possibility that the Department is experiencing difficulties in finding suitable candidates in the South African labour market to fill these posts
Table 22 Scarce skill occupations and vacancy rates (DAFF March 2009) Critical occupations Number of posts Posts filled Vacancy rate ()
Agricultural animal oceanography forestry and other sciences
167 119 287
Engineering sciences related 2 1 50Engineers and related professions 13 6 538Farming forestry advisors and farm managers 11 4 636Finance and economics related 73 53 274Horticulturists foresters agricultural and forestry technicians
350 221 369
Legal related 6 4 333Mechanical engineering technicians 3 2 333Risk management and security services 6 4 333Social sciences related 1 0 100Veterinarians 34 24 294
Source DAFF Annual Report 20082009
Skills are also scarce at senior management level The department also reports on difficulties it has filling senior management services vacancies with some of them staying vacant for up to twelve months because no suitable candidates can be found The department would then resort to re‐advertisement and head hunting This was the case with 22 of 18 SMS posts in March 2009
Scarce skills in the commercial sector
The following occupations have previously been projected as scarce (extremely hard to fill vacancies) by AgriSETA in the commercial agricultural sector over the next five years
Table 23 Scarce and critical skills in the commercial agricultural sector
Occupation Code
Group Occupation Critical Skills Intervention Comments
139903 Managers Laboratory Manager
Technology AI nutrition
HET
221101 Professionals Accountant (General)
General HET
221102 Professionals Management Accountant
Farm financial management
HET Focus on support advice to farmers new enterprises
222101 Professionals Commodities Trader
Export administration supply chain
FET Learnership Skills
Agriculture Sector Analysis 40
AgriSETA June 2010
Agriculture Sector Analysis 41
Occupation Code
Group Occupation Critical Skills Intervention Comments
management Programme
224301 Professionals Economist Agricultural HET
Mainly for Department of Agriculture and para statals commodity organisations
233101 Professionals Chemical Engineer
Chemical processes in food production
HET Industries such as sugar processing
233301 Professionals Electrical Engineer
Installation and maintenance
HET Processing industry
233401 Professionals Electronics Engineer
Computerised production prosesses
HET Processing industry
233501 Professionals Industrial Engineer
Productivity and efficiency
HET Processing industry
233904 Professionals
Instrument Engineer (Defence Force)
Installation and maintenance
HET
Not for defence ‐ sugar industry
233502 Professionals Mechanical Engineer
FETHET Equity reasons
233902 Professionals Agricultural Engineer
Farm layout and infrastructure
HET Mainly in Government
311101 Technicians and trades workers
Agricultural Technician
Installation and maintenance
FETHET
234102 Professionals Agricultural Scientist
Agri research HETFET Especially in horticulture
234201 Professionals Chemist HET Processing industry
234202 Professionals Food Technologist
Food safety HACCP
FETHET Across sector
234701 Professionals Veterinarian HET Mainly in Government
311101 Technicians and trades workers
Agricultural Technician
Farm infrastructure
FET Mainly needed in government
311401 Technicians and trades workers
Chemistry Technician
FETHET EE reasons
312907 Technicians and trades workers
Chemical Engineering Technician
FET Learnership
Mainly EE reasons
312402 Technicians and trades workers
Electronic Engineering Technician
Weak stream production infra
FETHET Mainly tobacco industry
233904 Professionals
Instrument Engineer (Defence Force)
Instrument technician
FET
Occupation needed Instrument Technician (not defence force) Mainly sugar processing sector
321202 Technicians and trades workers
Diesel Motor Mechanic
FET Learnership
To include tractor mechanic
321204 Technicians and trades workers
Small Engine Mechanic
Agricultural equipment
FET Learnership
Throughout sector
AgriSETA June 2010
Agriculture Sector Analysis 42
Occupation Code
Group Occupation Critical Skills Intervention Comments
322301 Technicians and trades workers
Metal Fabricator
Artisan FET Learnership
322303 Technicians and trades workers
Welder Welder (First Class)
Artisan FET Learnership
323203 Technicians and trades workers
Fitter‐Welder Artisan FET Learnership
Mainly sugar ndash multi‐skilled
323202 Technicians and trades workers
Fitter And Turner
Artisan FET Learnership
Tobacco and sugar
323501 Technicians and trades workers
Millwright Artisan FET Learnership
Wide‐spread need
341101 Technicians and trades workers
Electrician (General)
Artisan FET Learnership
Wide‐spread need
342101 Technicians and trades workers
Air‐Conditioning And Refrigeration Mechanic
Artisan FET Learnership
Sugar pack houses cold chain
Source AgriSETA Sector Skills Plans
Supply of skills
South Africarsquos agriculture skills are produced in high schools agricultural colleges FET colleges and Higher Education institutions In high school a large cohort of learners take Agricultural Science as a subject In 2003 there were 42 Agricultural High Schools offering Agricultural Science as a subject These students and those in high schools taking the subject could progress to taking agriculture as a focus area for further education In 2004 there were 10 FET colleges offering vocationally directed agricultural programmes These FET colleges offered complete qualifications and short courses Eleven Colleges of Agriculture can offer qualifications up to degree level and 19 universities offer qualifications in Agriculture ranging from agricultural economics animal and plant sciences and horticulture among others at under and post graduate levels (Department of Agriculture 2006) While long term planning of skilling of new entrants in the sector can be done through close consultation between the sector agricultural schools and colleges FET colleges and HET institutions so that they teach relevant skills there are other avenues for training for those who are already employed in the sector for example skills programmes and learnerships There are 15 registered qualifications for the primary agriculture sub sectors Currently AgriSETA has 94 registered learnerships that can address the skills needs of the identified scarce skills These are captured in Appendix 2 AgriSETA has approved accredited a number of training providers across the country to deliver the theoretical and practical components of these learnerships These include agricultural colleges FET colleges and private providers Currently the AgriSETA has 246 registered and approved providers distributed nationally as follows
AgriSETA June 2010
Table 29 AgriSETA approved training providers (2010) Province Number of providers
Gauteng 72
(29)
KwaZulu Natal 20
(8)
Limpopo 35
(14)
North West 30
(12)
Northern Cape 3
(1)
Free State 15
(6)
Mpumalanga 14
(6)
Western Cape 26
(11)
Eastern Cape 31
(13) Total 246
The providers are small to large organisations In primary agriculture small providers appear to offer the most training in rural areas and community projects (AgriSETA 2010) Most of the operating providers will be in FET colleges and agricultural colleges The AgriSETA is unable to meet the total demands for skills across the duality of their sector There seems to be fairness in the approval of training for both permanent and casual and seasonal workers In 200809 the AgriSETA approved 559 learnerships as follows
Table 30 AgriSETA learnerships approved for grant purposes (2008‐2009)
Source AgriSETA learnership data analysis
Agriculture Sector Analysis 43
AgriSETA June 2010
Agriculture Sector Analysis 44
Provision of skills programmes in the same year attracted grants for 2 706 employees
Table 31 Participation by learners in skills programmes in the AgriSETA (200809)
Source AgriSETA Skills programmes data analysis
AgriSETA June 2010
APPENDIX 1 Skills demand in the Department of Agriculture Forestry amp Fisheries (200809)
Source DAFF Annual Report 2008‐20009
Agriculture Sector Analysis 45
AgriSETA June 2010
Agriculture Sector Analysis 46
Appendix 2 AgriSETA registered learnerships Registered Learnership NQF Level SAQA Registration NoLearnership in Agri Sales and Service 4 22 Q 220001 20 178 4Learnership Agricultural Machinery Technician 2 22 Q 220007 20 160 2Learnership in Specialist Agricultural Machinery Technician 5 22 Q 220009 21 258 5Agri Trade Processes 2 22 Q 220013 30 125 2FETC Meat Examination Applying Basic Business Principles 4 30 Q 3000 2823 164 4Further Education and Training Certificate Seed Marketing Execute Seed Trials 4 22 Q 220025 21 126 4Further Education and Training Certificate Seed Research and Development Certify as Seed Unit 4 22 Q 220027 21 121 4FETC Seed Research and Development Conduct a Field Inspection of a Seed Unit 4 22 Q 220028 20 120 4Seed Research and Development Operations Operate in a Team 3 22 Q 220020 22 121 3Seed Research and Development Operations Apply Basic Business Principles 3 22 Q 220021 22 121 3National Certificate Seed Processing and Packaging Operate in a Team 3 22 Q 220026 21 123 3Sugar Industry Technical Maintenance worker 2 22 Q 220011 39 128 2National Certificate Sugar Manufacturing and Refining Technical Maintenance 3 30 Q300003 23 146 3Further Education and Training Certificate Manufacturing Technical MaintenanceProduce Components by Performing Engineering Turning Operations
4 30 Q 3000 1321 173 4
FETC Manufacturing Technical Maintenance Produce Components by Performing Milling Operations 4 30 Q 3000 1521 173 4 FETC Manufacturing Technical Maintenance Develop and Fabricate from Complex Drawing 4 30 Q 3000 1420 173 4National Certificate in Sugar Technology 5 22 Q 220036 22 140 5Further Education and Training Certificate Sugar Processing 4 22 Q 220035 31 144 4National Certificate in Sugar Technology Processing Sugar Refining 2 22 Q 220037 28 124 2National Certificate in Sugar Technology Processing Juice Preparation 2 22 Q 220038 28 124 2National Certificate in Sugar Technology Processing Crystallisation 2 22 Q 220039 27 122 2National Certificate in Sugar Technology Processing Laboratory Practice 2 22 Q 220040 25 124 2National Certificate in Sugar Technology Processing Extraction 2 22 Q 220041 28 122 2NC Rooibos Production Applying Basic Business Principles 2 30 Q 3000 2427 130 2 NC Rooibos Processing Applying Basic Business Principles 2 30 Q 3000 2224 123 2 National Certificate Cigarette Production 3 22 Q 220046 23 121 3
AgriSETA June 2010
REFERENCES AgriSETA 2010 AgriSETA 20082009 Annual report Pretoria AgriSETA Agricultural Research Council httpwwwarcagriczahomeasppid=272 Avert South African HIV and AIDS statistics Available on httpwwwavertorgsafricastatshtm Centre for Development Enterprise 2008 Land reform in South Africa Getting back on track CDE Research No 16 DAFF 2010 Quarterly economic review of the agriculture sector Pretoria DAFF DAFF 2009 Annual report 20082009 Pretoria DAFF Department of Agriculture 2008 Strategic plan 2008 Pretoria Department of Agriculture DTI An introduction to the South African economy Available on httpwwwthedtigovzapublicationsagroprocessinghtm Eastern Cape Provincial Government Eastern Cape Provincial Growth and Development Strategy 2004 ndash 2014 Economic Commission for Africa 2009 Developing African agriculture through regional value chains Addis Ababa Economic Commission for Africa Economic Report Free State Province 2005 Provincial Growth and Development Strategy 2005 ndash 2014 GCIS 2010 SA Yearbook 200910rdquo Agriculture forestry and fisheries Pretoria GCIS Greenberg S 2010 Status report on land and agricultural policy in South Africa 2010 Institute for Poverty Land and Agrarian Studies School of Government University of the Western Cape Research report Ingelozi Management Solutions 2008 HIVAIDS in the South African agricultural sector Towards the development of a long term intervention Research report KwaZulu Natal Provincial Government 2006 KwaZulu Natal Provincial Growth and Development Strategy Limpopo Provincial Government Growth and Development Strategy 2004 ndash 2014 Mhone G (2000) Enclavity and Constrained Labour Absorbtive Capacity in Southern African Countries Geneva International Labour Office Moyo S The Agrarian question and the developmental state in South Africa In Edigheji O et al 2010 Constructing a democratic developmental state in South Africa HSRC PRESS
Agriculture Sector Analysis 47
AgriSETA
Agriculture Sector Analysis
National Treasury Republic of South Africa 2010 National Budget 2010 ndash National Budget Review 2010 Pretoria National Treasury Northern Cape Provincial Government Agriculture and agro‐processing sector strategy North West Provincial Government North West Provincial Growth and Development Strategy 2004 ndash 2014 Province of the Western Cape 2008 The Ikapa growth and development strategy White Paper SABCOHA SA Business Coalition on HIV and AIDS wwwsabcohaorg SACAU httpwwwsacauorghostingsacauSacauWebnsfHomehtmOpenForm South African Government 2010 20102011 ndash 20122013 Industrial Policy Action Plan Republic of South Africa Statistics South Africa 2005 Census of commercial agriculture 2002 Report No 110201 Pretoria Statistics South Africa Statistics South Africa 2009 Census of commercial agriculture 2007 Statistical release P1101 Pretoria Statistics South Africa Statistics South Africa 2010 General household survey 2009 Statistical release P0318 Pretoria Statistics South Africa Statistics South Africa 2010 Gross domestic product first quarter 2010 Statistical release P0441 Pretoria Statistics South Africa Statistics South Africa 2010 Quarterly labour force survey Quarter 1 2010 Statistical release P0211 Pretoria Statistics South Africa Vink N amp van Rooyen J 2009 The economic performance of agriculture in South Africa since 1994 The implications for food security Pretoria DBSA development planning division working paper series No 17 Webster E 2004 the Dual Economy from a book by Van Holdt K and Webster E Work restructuring and the Crisis of Social reproduction and 10 years of restructuring post apartheid workplaces University of Natal Press Workinfocom httpwwwworkinfocomfreesub_for_legresdatalraempassoc3htm Xingwana L 2008 Challenges and Opportunities for Land and Agrarian Reform towards 2025 Speech delivered at the Agri‐Consultation Protea Ranch Hotel Polokwane 30 July 2008
- Table of contents
- SECTION 1 THE AGRICULTURAL LANDSCAPE
- 11 Size and shape of the Agricultural sector
-
- Overview
- Distribution of agricultural production
- The structure of the agriculture sector in South Africa
- Categories of farming enterprises
- Employment trends
- Employment categories and remuneration
- Stakeholders in the Agricultural sector
-
- National government departments
- Sector representatives
-
- 12 Factors impacting development in the Agriculture sector
-
- Future sector economic growth and development
-
- South African sector growth plans (IPAP2)
- International Trade
- Global recession and rise in food prices
-
- Land reform
- Reliance on imports
- Water
- The labour market
- Consumer trends
- HIVAIDS
- Farm safety and security
- Broad-based Black Economic Empowerment
-
- Conclusions and scenarios
- SECTION 2 DEMAND FOR SKILLS
-
- AgriSETA registered employers and employee coverage
- Employee coverage in the AgriSETA
-
- 21 Skills demand
-
- The National Education and Training Strategy for Agriculture (AET Strategy)
- AGRISETA sector skills planning demand data (2008-2009)
- AgriSETA WSP analyses
-
- Skills demand in the commercial agricultural sector
-
- Skills demand forecasting by AgriSETA
- Research needs going forward
-
- SECTION 3 Skills Gaps and scarce skills
-
- Scarce skills at the DAFF
- Scarce skills in the commercial sector
- Supply of skills
-
- APPENDIX 1 Skills demand in the Department of Agriculture Forestry amp Fisheries (200809)
- Appendix 2 AgriSETA registered learnerships
-
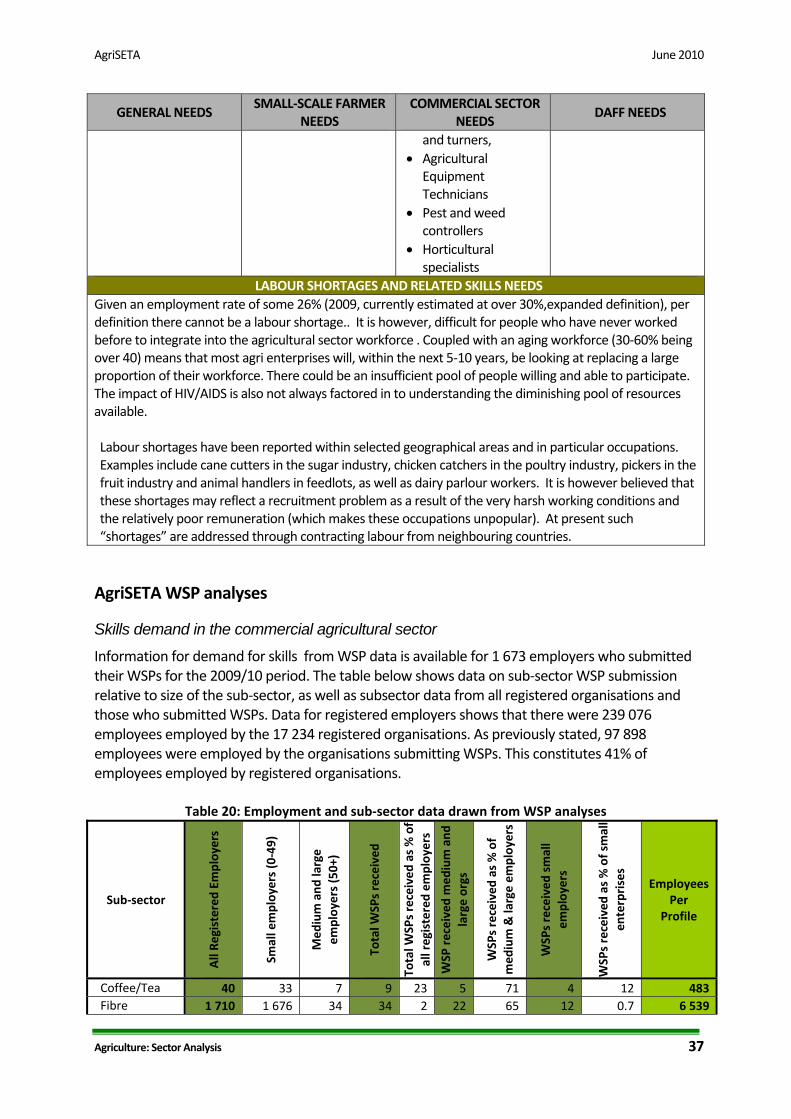
AgriSETA June 2010
Agriculture Sector Analysis 37
GENERAL NEEDS SMALL‐SCALE FARMER
NEEDS COMMERCIAL SECTOR
NEEDS DAFF NEEDS
and turners bull Agricultural
Equipment Technicians
bull Pest and weed controllers
bull Horticultural specialists
LABOUR SHORTAGES AND RELATED SKILLS NEEDS Given an employment rate of some 26 (2009 currently estimated at over 30expanded definition) per definition there cannot be a labour shortage It is however difficult for people who have never worked before to integrate into the agricultural sector workforce Coupled with an aging workforce (30‐60 being over 40) means that most agri enterprises will within the next 5‐10 years be looking at replacing a large proportion of their workforce There could be an insufficient pool of people willing and able to participate The impact of HIVAIDS is also not always factored in to understanding the diminishing pool of resources available Labour shortages have been reported within selected geographical areas and in particular occupations Examples include cane cutters in the sugar industry chicken catchers in the poultry industry pickers in the fruit industry and animal handlers in feedlots as well as dairy parlour workers It is however believed that these shortages may reflect a recruitment problem as a result of the very harsh working conditions and the relatively poor remuneration (which makes these occupations unpopular) At present such ldquoshortagesrdquo are addressed through contracting labour from neighbouring countries
AgriSETA WSP analyses
Skills demand in the commercial agricultural sector
Information for demand for skills from WSP data is available for 1 673 employers who submitted their WSPs for the 200910 period The table below shows data on sub‐sector WSP submission relative to size of the sub‐sector as well as subsector data from all registered organisations and those who submitted WSPs Data for registered employers shows that there were 239 076 employees employed by the 17 234 registered organisations As previously stated 97 898 employees were employed by the organisations submitting WSPs This constitutes 41 of employees employed by registered organisations
Table 20 Employment and sub‐sector data drawn from WSP analyses
Sub‐sector
All Re
gistered
Employers
Small employers (0‐49)
Med
ium and
large
employers (50+)
Total W
SPs received
Total W
SPs received
as of
all registered em
ployers
WSP
received med
ium and
large orgs
WSPs received
as of
med
ium amp large em
ployers
WSPs received
small
employers
WSPs received
as of small
enterprises
EmployeesPer
Profile
CoffeeTea 40 33 7 9 23 5 71 4 12 483 Fibre 1 710 1 676 34 34 2 22 65 12 07 6 539
AgriSETA June 2010
Agriculture Sector Analysis 38
Sub‐sector
All Re
gistered
Employers
Small employers (0‐49)
Med
ium and
large
employers (50+)
Total W
SPs received
Total W
SPs received
as of
all registered em
ployers
WSP
received med
ium and
large orgs
WSPs received
as of
med
ium amp large em
ployers
WSPs received
small
employers
WSPs received
as of small
enterprises
EmployeesPer
Profile
Fruit 371 277 94 162 44 76 81 86 31 27 873 Grain 648 581 67 77 12 48 72 29 5 22 129 Milling 335 279 56 61 18 35 63 26 9 4 630 Pest Control 213 209 4 8 4 2 50 6 3 119 Poultry 391 305 86 66 17 46 53 20 7 19 187 Primary 12 121 10 776 1 345 1144 9 513 38 631 6 136 034 Red meat 1107 1 018 89 70 6 45 51 25 2 7 475 Seed 167 149 18 24 14 13 72 11 7 2 127 Sugar 71 45 26 13 18 10 38 3 7 10 478 Tobacco 60 46 14 5 8 3 21 2 4 2 002
Totals 17 234 15 394 1 840 1 673 10 818 44 855 16 239 076
Source 1 AgriSETA WSP 2009 data
Only 10 of all registered employers submitted WSPs for the 200910 period Of these 49 were medium and large sized employers and 51 small However only 16 small employers submitted their WSPs relative to the number of registered small employers and 44 medium and large employers submitted WSPs relative to the number of registered medium and large employers As such skills demand statistics provides more representative data on the requirements of medium and large employers Data for skills demand in the commercial agricultural sector is based on data for permanent employees as well as casual and seasonal employees
Skills demand forecasting by AgriSETA
Forecasting for skills demand the AgriSETA has estimated that the demand for skilled employees at different levels in the next few years is 510 686 This is based on WSP data analyses over the last 5 years and projected demand for the formal commercial agricultural sector and factoring in the demand that at maximum would result from completion of the land restitution programme in South Africa The table below reflects the skills that are on demand as well as the estimates for demand over the next five years by major occupational category35
35 AgriSETA 2010
AgriSETA June 2010
Table 21 Demand for skills by occupational category
Major Occupation (OFO)Estimated Demand
Group Title1 Managers (commercial and small emerging farmers) 264 3702 Professionals 4 1413 Technicians and Trade workers 8 9255 Clerical and administrative workers 8006 Sales workers 4007 Machinery operators and drivers 5 8008 Elementary workers 226 250
Total 510 686Source AgriSETA WSP data and SSP demand forecasts
Research needs going forward
As has been set out in the sector analysis and the scenarios derived from that analysis the sector is faced by both significant and profound change and also great uncertainty It therefore follows that the task of focussing limited resources (basically levy income in the formal sector and NSF funds for the emergent farming sector) is difficult Whilst the general thrust of training remains broadly as described in the 2006‐10 SSP Updates some considerable work is required to achieve targeted effective interventions during the 2011‐2016 period The following research questions will need to be addressed in preparing the next SSP
bull In relation to the managers and owner‐managers of commercial farms and enterprises what skills are needed to enable them to help bring about the more optimistic scenario and manage the risks associated with the less optimistic ones
bull In terms of professional and technical competencies do the current education and training institutions coupled with the learning programmes available through the AgriSETA (learnerships skills programmes and the like) meet the needs of the sector
bull In the emerging agricultural sector do the current programmes funded by sources external to the AgriSETA (eg NSF) meet all the identified needs What gaps are there and how should they be addressed
bull In relation to governmentrsquos growth strategy and industrial action plans what skills are required for developing the aquaculture sub‐sector What programmes are available How can the SETA support the skills needs for this sub‐sector
bull Given the increasing levels of casual and contract labour how can skills be developed to meet the needs of the formal commercial sector and the emerging enterprise sector
bull How can the demand in each of the priority areas be quantified and agreement be reached on numbers of people to be trained
Agriculture Sector Analysis 39
AgriSETA June 2010
SECTION 3 Skills Gaps and scarce skills
Scarce skills at the DAFF
The level of scarce skills at DAFF can be determined by the vacancy rate While the average vacancy rate in the department as at 31 March 2009 was 17 there were some posts that had very high vacancy rates as reflected in the table below Indicating the possibility that the Department is experiencing difficulties in finding suitable candidates in the South African labour market to fill these posts
Table 22 Scarce skill occupations and vacancy rates (DAFF March 2009) Critical occupations Number of posts Posts filled Vacancy rate ()
Agricultural animal oceanography forestry and other sciences
167 119 287
Engineering sciences related 2 1 50Engineers and related professions 13 6 538Farming forestry advisors and farm managers 11 4 636Finance and economics related 73 53 274Horticulturists foresters agricultural and forestry technicians
350 221 369
Legal related 6 4 333Mechanical engineering technicians 3 2 333Risk management and security services 6 4 333Social sciences related 1 0 100Veterinarians 34 24 294
Source DAFF Annual Report 20082009
Skills are also scarce at senior management level The department also reports on difficulties it has filling senior management services vacancies with some of them staying vacant for up to twelve months because no suitable candidates can be found The department would then resort to re‐advertisement and head hunting This was the case with 22 of 18 SMS posts in March 2009
Scarce skills in the commercial sector
The following occupations have previously been projected as scarce (extremely hard to fill vacancies) by AgriSETA in the commercial agricultural sector over the next five years
Table 23 Scarce and critical skills in the commercial agricultural sector
Occupation Code
Group Occupation Critical Skills Intervention Comments
139903 Managers Laboratory Manager
Technology AI nutrition
HET
221101 Professionals Accountant (General)
General HET
221102 Professionals Management Accountant
Farm financial management
HET Focus on support advice to farmers new enterprises
222101 Professionals Commodities Trader
Export administration supply chain
FET Learnership Skills
Agriculture Sector Analysis 40
AgriSETA June 2010
Agriculture Sector Analysis 41
Occupation Code
Group Occupation Critical Skills Intervention Comments
management Programme
224301 Professionals Economist Agricultural HET
Mainly for Department of Agriculture and para statals commodity organisations
233101 Professionals Chemical Engineer
Chemical processes in food production
HET Industries such as sugar processing
233301 Professionals Electrical Engineer
Installation and maintenance
HET Processing industry
233401 Professionals Electronics Engineer
Computerised production prosesses
HET Processing industry
233501 Professionals Industrial Engineer
Productivity and efficiency
HET Processing industry
233904 Professionals
Instrument Engineer (Defence Force)
Installation and maintenance
HET
Not for defence ‐ sugar industry
233502 Professionals Mechanical Engineer
FETHET Equity reasons
233902 Professionals Agricultural Engineer
Farm layout and infrastructure
HET Mainly in Government
311101 Technicians and trades workers
Agricultural Technician
Installation and maintenance
FETHET
234102 Professionals Agricultural Scientist
Agri research HETFET Especially in horticulture
234201 Professionals Chemist HET Processing industry
234202 Professionals Food Technologist
Food safety HACCP
FETHET Across sector
234701 Professionals Veterinarian HET Mainly in Government
311101 Technicians and trades workers
Agricultural Technician
Farm infrastructure
FET Mainly needed in government
311401 Technicians and trades workers
Chemistry Technician
FETHET EE reasons
312907 Technicians and trades workers
Chemical Engineering Technician
FET Learnership
Mainly EE reasons
312402 Technicians and trades workers
Electronic Engineering Technician
Weak stream production infra
FETHET Mainly tobacco industry
233904 Professionals
Instrument Engineer (Defence Force)
Instrument technician
FET
Occupation needed Instrument Technician (not defence force) Mainly sugar processing sector
321202 Technicians and trades workers
Diesel Motor Mechanic
FET Learnership
To include tractor mechanic
321204 Technicians and trades workers
Small Engine Mechanic
Agricultural equipment
FET Learnership
Throughout sector
AgriSETA June 2010
Agriculture Sector Analysis 42
Occupation Code
Group Occupation Critical Skills Intervention Comments
322301 Technicians and trades workers
Metal Fabricator
Artisan FET Learnership
322303 Technicians and trades workers
Welder Welder (First Class)
Artisan FET Learnership
323203 Technicians and trades workers
Fitter‐Welder Artisan FET Learnership
Mainly sugar ndash multi‐skilled
323202 Technicians and trades workers
Fitter And Turner
Artisan FET Learnership
Tobacco and sugar
323501 Technicians and trades workers
Millwright Artisan FET Learnership
Wide‐spread need
341101 Technicians and trades workers
Electrician (General)
Artisan FET Learnership
Wide‐spread need
342101 Technicians and trades workers
Air‐Conditioning And Refrigeration Mechanic
Artisan FET Learnership
Sugar pack houses cold chain
Source AgriSETA Sector Skills Plans
Supply of skills
South Africarsquos agriculture skills are produced in high schools agricultural colleges FET colleges and Higher Education institutions In high school a large cohort of learners take Agricultural Science as a subject In 2003 there were 42 Agricultural High Schools offering Agricultural Science as a subject These students and those in high schools taking the subject could progress to taking agriculture as a focus area for further education In 2004 there were 10 FET colleges offering vocationally directed agricultural programmes These FET colleges offered complete qualifications and short courses Eleven Colleges of Agriculture can offer qualifications up to degree level and 19 universities offer qualifications in Agriculture ranging from agricultural economics animal and plant sciences and horticulture among others at under and post graduate levels (Department of Agriculture 2006) While long term planning of skilling of new entrants in the sector can be done through close consultation between the sector agricultural schools and colleges FET colleges and HET institutions so that they teach relevant skills there are other avenues for training for those who are already employed in the sector for example skills programmes and learnerships There are 15 registered qualifications for the primary agriculture sub sectors Currently AgriSETA has 94 registered learnerships that can address the skills needs of the identified scarce skills These are captured in Appendix 2 AgriSETA has approved accredited a number of training providers across the country to deliver the theoretical and practical components of these learnerships These include agricultural colleges FET colleges and private providers Currently the AgriSETA has 246 registered and approved providers distributed nationally as follows
AgriSETA June 2010
Table 29 AgriSETA approved training providers (2010) Province Number of providers
Gauteng 72
(29)
KwaZulu Natal 20
(8)
Limpopo 35
(14)
North West 30
(12)
Northern Cape 3
(1)
Free State 15
(6)
Mpumalanga 14
(6)
Western Cape 26
(11)
Eastern Cape 31
(13) Total 246
The providers are small to large organisations In primary agriculture small providers appear to offer the most training in rural areas and community projects (AgriSETA 2010) Most of the operating providers will be in FET colleges and agricultural colleges The AgriSETA is unable to meet the total demands for skills across the duality of their sector There seems to be fairness in the approval of training for both permanent and casual and seasonal workers In 200809 the AgriSETA approved 559 learnerships as follows
Table 30 AgriSETA learnerships approved for grant purposes (2008‐2009)
Source AgriSETA learnership data analysis
Agriculture Sector Analysis 43
AgriSETA June 2010
Agriculture Sector Analysis 44
Provision of skills programmes in the same year attracted grants for 2 706 employees
Table 31 Participation by learners in skills programmes in the AgriSETA (200809)
Source AgriSETA Skills programmes data analysis
AgriSETA June 2010
APPENDIX 1 Skills demand in the Department of Agriculture Forestry amp Fisheries (200809)
Source DAFF Annual Report 2008‐20009
Agriculture Sector Analysis 45
AgriSETA June 2010
Agriculture Sector Analysis 46
Appendix 2 AgriSETA registered learnerships Registered Learnership NQF Level SAQA Registration NoLearnership in Agri Sales and Service 4 22 Q 220001 20 178 4Learnership Agricultural Machinery Technician 2 22 Q 220007 20 160 2Learnership in Specialist Agricultural Machinery Technician 5 22 Q 220009 21 258 5Agri Trade Processes 2 22 Q 220013 30 125 2FETC Meat Examination Applying Basic Business Principles 4 30 Q 3000 2823 164 4Further Education and Training Certificate Seed Marketing Execute Seed Trials 4 22 Q 220025 21 126 4Further Education and Training Certificate Seed Research and Development Certify as Seed Unit 4 22 Q 220027 21 121 4FETC Seed Research and Development Conduct a Field Inspection of a Seed Unit 4 22 Q 220028 20 120 4Seed Research and Development Operations Operate in a Team 3 22 Q 220020 22 121 3Seed Research and Development Operations Apply Basic Business Principles 3 22 Q 220021 22 121 3National Certificate Seed Processing and Packaging Operate in a Team 3 22 Q 220026 21 123 3Sugar Industry Technical Maintenance worker 2 22 Q 220011 39 128 2National Certificate Sugar Manufacturing and Refining Technical Maintenance 3 30 Q300003 23 146 3Further Education and Training Certificate Manufacturing Technical MaintenanceProduce Components by Performing Engineering Turning Operations
4 30 Q 3000 1321 173 4
FETC Manufacturing Technical Maintenance Produce Components by Performing Milling Operations 4 30 Q 3000 1521 173 4 FETC Manufacturing Technical Maintenance Develop and Fabricate from Complex Drawing 4 30 Q 3000 1420 173 4National Certificate in Sugar Technology 5 22 Q 220036 22 140 5Further Education and Training Certificate Sugar Processing 4 22 Q 220035 31 144 4National Certificate in Sugar Technology Processing Sugar Refining 2 22 Q 220037 28 124 2National Certificate in Sugar Technology Processing Juice Preparation 2 22 Q 220038 28 124 2National Certificate in Sugar Technology Processing Crystallisation 2 22 Q 220039 27 122 2National Certificate in Sugar Technology Processing Laboratory Practice 2 22 Q 220040 25 124 2National Certificate in Sugar Technology Processing Extraction 2 22 Q 220041 28 122 2NC Rooibos Production Applying Basic Business Principles 2 30 Q 3000 2427 130 2 NC Rooibos Processing Applying Basic Business Principles 2 30 Q 3000 2224 123 2 National Certificate Cigarette Production 3 22 Q 220046 23 121 3
AgriSETA June 2010
REFERENCES AgriSETA 2010 AgriSETA 20082009 Annual report Pretoria AgriSETA Agricultural Research Council httpwwwarcagriczahomeasppid=272 Avert South African HIV and AIDS statistics Available on httpwwwavertorgsafricastatshtm Centre for Development Enterprise 2008 Land reform in South Africa Getting back on track CDE Research No 16 DAFF 2010 Quarterly economic review of the agriculture sector Pretoria DAFF DAFF 2009 Annual report 20082009 Pretoria DAFF Department of Agriculture 2008 Strategic plan 2008 Pretoria Department of Agriculture DTI An introduction to the South African economy Available on httpwwwthedtigovzapublicationsagroprocessinghtm Eastern Cape Provincial Government Eastern Cape Provincial Growth and Development Strategy 2004 ndash 2014 Economic Commission for Africa 2009 Developing African agriculture through regional value chains Addis Ababa Economic Commission for Africa Economic Report Free State Province 2005 Provincial Growth and Development Strategy 2005 ndash 2014 GCIS 2010 SA Yearbook 200910rdquo Agriculture forestry and fisheries Pretoria GCIS Greenberg S 2010 Status report on land and agricultural policy in South Africa 2010 Institute for Poverty Land and Agrarian Studies School of Government University of the Western Cape Research report Ingelozi Management Solutions 2008 HIVAIDS in the South African agricultural sector Towards the development of a long term intervention Research report KwaZulu Natal Provincial Government 2006 KwaZulu Natal Provincial Growth and Development Strategy Limpopo Provincial Government Growth and Development Strategy 2004 ndash 2014 Mhone G (2000) Enclavity and Constrained Labour Absorbtive Capacity in Southern African Countries Geneva International Labour Office Moyo S The Agrarian question and the developmental state in South Africa In Edigheji O et al 2010 Constructing a democratic developmental state in South Africa HSRC PRESS
Agriculture Sector Analysis 47
AgriSETA
Agriculture Sector Analysis
National Treasury Republic of South Africa 2010 National Budget 2010 ndash National Budget Review 2010 Pretoria National Treasury Northern Cape Provincial Government Agriculture and agro‐processing sector strategy North West Provincial Government North West Provincial Growth and Development Strategy 2004 ndash 2014 Province of the Western Cape 2008 The Ikapa growth and development strategy White Paper SABCOHA SA Business Coalition on HIV and AIDS wwwsabcohaorg SACAU httpwwwsacauorghostingsacauSacauWebnsfHomehtmOpenForm South African Government 2010 20102011 ndash 20122013 Industrial Policy Action Plan Republic of South Africa Statistics South Africa 2005 Census of commercial agriculture 2002 Report No 110201 Pretoria Statistics South Africa Statistics South Africa 2009 Census of commercial agriculture 2007 Statistical release P1101 Pretoria Statistics South Africa Statistics South Africa 2010 General household survey 2009 Statistical release P0318 Pretoria Statistics South Africa Statistics South Africa 2010 Gross domestic product first quarter 2010 Statistical release P0441 Pretoria Statistics South Africa Statistics South Africa 2010 Quarterly labour force survey Quarter 1 2010 Statistical release P0211 Pretoria Statistics South Africa Vink N amp van Rooyen J 2009 The economic performance of agriculture in South Africa since 1994 The implications for food security Pretoria DBSA development planning division working paper series No 17 Webster E 2004 the Dual Economy from a book by Van Holdt K and Webster E Work restructuring and the Crisis of Social reproduction and 10 years of restructuring post apartheid workplaces University of Natal Press Workinfocom httpwwwworkinfocomfreesub_for_legresdatalraempassoc3htm Xingwana L 2008 Challenges and Opportunities for Land and Agrarian Reform towards 2025 Speech delivered at the Agri‐Consultation Protea Ranch Hotel Polokwane 30 July 2008
- Table of contents
- SECTION 1 THE AGRICULTURAL LANDSCAPE
- 11 Size and shape of the Agricultural sector
-
- Overview
- Distribution of agricultural production
- The structure of the agriculture sector in South Africa
- Categories of farming enterprises
- Employment trends
- Employment categories and remuneration
- Stakeholders in the Agricultural sector
-
- National government departments
- Sector representatives
-
- 12 Factors impacting development in the Agriculture sector
-
- Future sector economic growth and development
-
- South African sector growth plans (IPAP2)
- International Trade
- Global recession and rise in food prices
-
- Land reform
- Reliance on imports
- Water
- The labour market
- Consumer trends
- HIVAIDS
- Farm safety and security
- Broad-based Black Economic Empowerment
-
- Conclusions and scenarios
- SECTION 2 DEMAND FOR SKILLS
-
- AgriSETA registered employers and employee coverage
- Employee coverage in the AgriSETA
-
- 21 Skills demand
-
- The National Education and Training Strategy for Agriculture (AET Strategy)
- AGRISETA sector skills planning demand data (2008-2009)
- AgriSETA WSP analyses
-
- Skills demand in the commercial agricultural sector
-
- Skills demand forecasting by AgriSETA
- Research needs going forward
-
- SECTION 3 Skills Gaps and scarce skills
-
- Scarce skills at the DAFF
- Scarce skills in the commercial sector
- Supply of skills
-
- APPENDIX 1 Skills demand in the Department of Agriculture Forestry amp Fisheries (200809)
- Appendix 2 AgriSETA registered learnerships
-
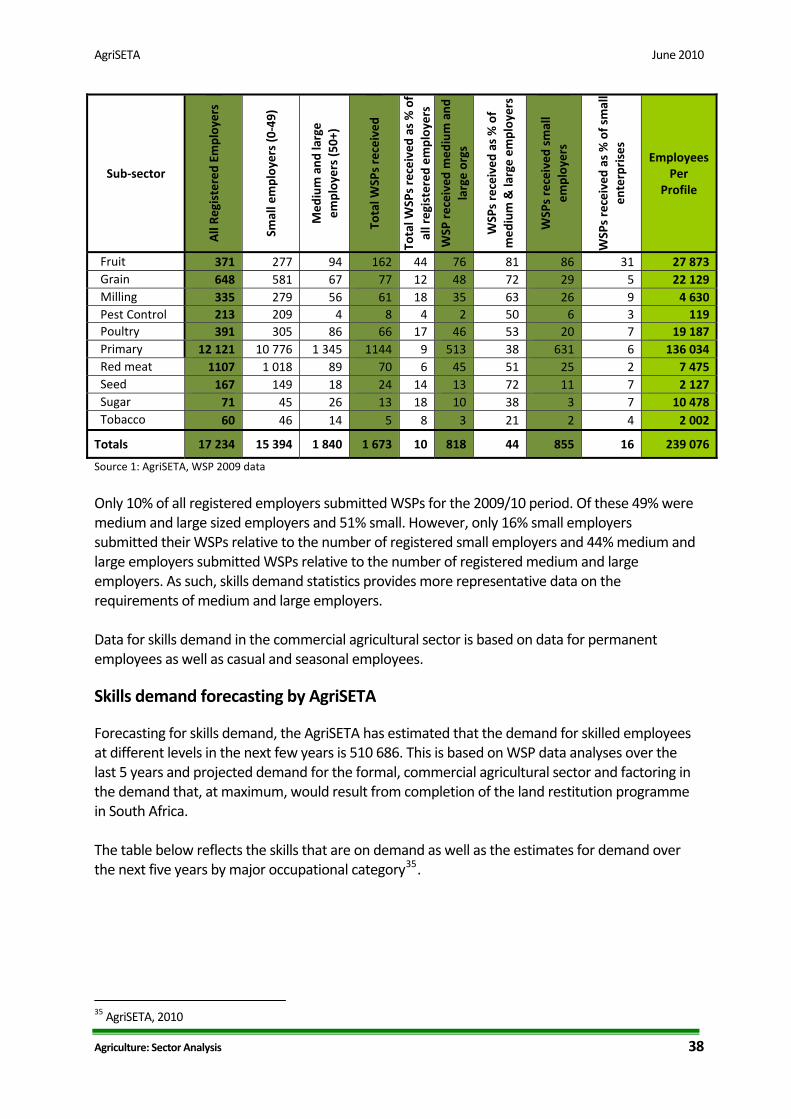
AgriSETA June 2010
Table 21 Demand for skills by occupational category
Major Occupation (OFO)Estimated Demand
Group Title1 Managers (commercial and small emerging farmers) 264 3702 Professionals 4 1413 Technicians and Trade workers 8 9255 Clerical and administrative workers 8006 Sales workers 4007 Machinery operators and drivers 5 8008 Elementary workers 226 250
Total 510 686Source AgriSETA WSP data and SSP demand forecasts
Research needs going forward
As has been set out in the sector analysis and the scenarios derived from that analysis the sector is faced by both significant and profound change and also great uncertainty It therefore follows that the task of focussing limited resources (basically levy income in the formal sector and NSF funds for the emergent farming sector) is difficult Whilst the general thrust of training remains broadly as described in the 2006‐10 SSP Updates some considerable work is required to achieve targeted effective interventions during the 2011‐2016 period The following research questions will need to be addressed in preparing the next SSP
bull In relation to the managers and owner‐managers of commercial farms and enterprises what skills are needed to enable them to help bring about the more optimistic scenario and manage the risks associated with the less optimistic ones
bull In terms of professional and technical competencies do the current education and training institutions coupled with the learning programmes available through the AgriSETA (learnerships skills programmes and the like) meet the needs of the sector
bull In the emerging agricultural sector do the current programmes funded by sources external to the AgriSETA (eg NSF) meet all the identified needs What gaps are there and how should they be addressed
bull In relation to governmentrsquos growth strategy and industrial action plans what skills are required for developing the aquaculture sub‐sector What programmes are available How can the SETA support the skills needs for this sub‐sector
bull Given the increasing levels of casual and contract labour how can skills be developed to meet the needs of the formal commercial sector and the emerging enterprise sector
bull How can the demand in each of the priority areas be quantified and agreement be reached on numbers of people to be trained
Agriculture Sector Analysis 39
AgriSETA June 2010
SECTION 3 Skills Gaps and scarce skills
Scarce skills at the DAFF
The level of scarce skills at DAFF can be determined by the vacancy rate While the average vacancy rate in the department as at 31 March 2009 was 17 there were some posts that had very high vacancy rates as reflected in the table below Indicating the possibility that the Department is experiencing difficulties in finding suitable candidates in the South African labour market to fill these posts
Table 22 Scarce skill occupations and vacancy rates (DAFF March 2009) Critical occupations Number of posts Posts filled Vacancy rate ()
Agricultural animal oceanography forestry and other sciences
167 119 287
Engineering sciences related 2 1 50Engineers and related professions 13 6 538Farming forestry advisors and farm managers 11 4 636Finance and economics related 73 53 274Horticulturists foresters agricultural and forestry technicians
350 221 369
Legal related 6 4 333Mechanical engineering technicians 3 2 333Risk management and security services 6 4 333Social sciences related 1 0 100Veterinarians 34 24 294
Source DAFF Annual Report 20082009
Skills are also scarce at senior management level The department also reports on difficulties it has filling senior management services vacancies with some of them staying vacant for up to twelve months because no suitable candidates can be found The department would then resort to re‐advertisement and head hunting This was the case with 22 of 18 SMS posts in March 2009
Scarce skills in the commercial sector
The following occupations have previously been projected as scarce (extremely hard to fill vacancies) by AgriSETA in the commercial agricultural sector over the next five years
Table 23 Scarce and critical skills in the commercial agricultural sector
Occupation Code
Group Occupation Critical Skills Intervention Comments
139903 Managers Laboratory Manager
Technology AI nutrition
HET
221101 Professionals Accountant (General)
General HET
221102 Professionals Management Accountant
Farm financial management
HET Focus on support advice to farmers new enterprises
222101 Professionals Commodities Trader
Export administration supply chain
FET Learnership Skills
Agriculture Sector Analysis 40
AgriSETA June 2010
Agriculture Sector Analysis 41
Occupation Code
Group Occupation Critical Skills Intervention Comments
management Programme
224301 Professionals Economist Agricultural HET
Mainly for Department of Agriculture and para statals commodity organisations
233101 Professionals Chemical Engineer
Chemical processes in food production
HET Industries such as sugar processing
233301 Professionals Electrical Engineer
Installation and maintenance
HET Processing industry
233401 Professionals Electronics Engineer
Computerised production prosesses
HET Processing industry
233501 Professionals Industrial Engineer
Productivity and efficiency
HET Processing industry
233904 Professionals
Instrument Engineer (Defence Force)
Installation and maintenance
HET
Not for defence ‐ sugar industry
233502 Professionals Mechanical Engineer
FETHET Equity reasons
233902 Professionals Agricultural Engineer
Farm layout and infrastructure
HET Mainly in Government
311101 Technicians and trades workers
Agricultural Technician
Installation and maintenance
FETHET
234102 Professionals Agricultural Scientist
Agri research HETFET Especially in horticulture
234201 Professionals Chemist HET Processing industry
234202 Professionals Food Technologist
Food safety HACCP
FETHET Across sector
234701 Professionals Veterinarian HET Mainly in Government
311101 Technicians and trades workers
Agricultural Technician
Farm infrastructure
FET Mainly needed in government
311401 Technicians and trades workers
Chemistry Technician
FETHET EE reasons
312907 Technicians and trades workers
Chemical Engineering Technician
FET Learnership
Mainly EE reasons
312402 Technicians and trades workers
Electronic Engineering Technician
Weak stream production infra
FETHET Mainly tobacco industry
233904 Professionals
Instrument Engineer (Defence Force)
Instrument technician
FET
Occupation needed Instrument Technician (not defence force) Mainly sugar processing sector
321202 Technicians and trades workers
Diesel Motor Mechanic
FET Learnership
To include tractor mechanic
321204 Technicians and trades workers
Small Engine Mechanic
Agricultural equipment
FET Learnership
Throughout sector
AgriSETA June 2010
Agriculture Sector Analysis 42
Occupation Code
Group Occupation Critical Skills Intervention Comments
322301 Technicians and trades workers
Metal Fabricator
Artisan FET Learnership
322303 Technicians and trades workers
Welder Welder (First Class)
Artisan FET Learnership
323203 Technicians and trades workers
Fitter‐Welder Artisan FET Learnership
Mainly sugar ndash multi‐skilled
323202 Technicians and trades workers
Fitter And Turner
Artisan FET Learnership
Tobacco and sugar
323501 Technicians and trades workers
Millwright Artisan FET Learnership
Wide‐spread need
341101 Technicians and trades workers
Electrician (General)
Artisan FET Learnership
Wide‐spread need
342101 Technicians and trades workers
Air‐Conditioning And Refrigeration Mechanic
Artisan FET Learnership
Sugar pack houses cold chain
Source AgriSETA Sector Skills Plans
Supply of skills
South Africarsquos agriculture skills are produced in high schools agricultural colleges FET colleges and Higher Education institutions In high school a large cohort of learners take Agricultural Science as a subject In 2003 there were 42 Agricultural High Schools offering Agricultural Science as a subject These students and those in high schools taking the subject could progress to taking agriculture as a focus area for further education In 2004 there were 10 FET colleges offering vocationally directed agricultural programmes These FET colleges offered complete qualifications and short courses Eleven Colleges of Agriculture can offer qualifications up to degree level and 19 universities offer qualifications in Agriculture ranging from agricultural economics animal and plant sciences and horticulture among others at under and post graduate levels (Department of Agriculture 2006) While long term planning of skilling of new entrants in the sector can be done through close consultation between the sector agricultural schools and colleges FET colleges and HET institutions so that they teach relevant skills there are other avenues for training for those who are already employed in the sector for example skills programmes and learnerships There are 15 registered qualifications for the primary agriculture sub sectors Currently AgriSETA has 94 registered learnerships that can address the skills needs of the identified scarce skills These are captured in Appendix 2 AgriSETA has approved accredited a number of training providers across the country to deliver the theoretical and practical components of these learnerships These include agricultural colleges FET colleges and private providers Currently the AgriSETA has 246 registered and approved providers distributed nationally as follows
AgriSETA June 2010
Table 29 AgriSETA approved training providers (2010) Province Number of providers
Gauteng 72
(29)
KwaZulu Natal 20
(8)
Limpopo 35
(14)
North West 30
(12)
Northern Cape 3
(1)
Free State 15
(6)
Mpumalanga 14
(6)
Western Cape 26
(11)
Eastern Cape 31
(13) Total 246
The providers are small to large organisations In primary agriculture small providers appear to offer the most training in rural areas and community projects (AgriSETA 2010) Most of the operating providers will be in FET colleges and agricultural colleges The AgriSETA is unable to meet the total demands for skills across the duality of their sector There seems to be fairness in the approval of training for both permanent and casual and seasonal workers In 200809 the AgriSETA approved 559 learnerships as follows
Table 30 AgriSETA learnerships approved for grant purposes (2008‐2009)
Source AgriSETA learnership data analysis
Agriculture Sector Analysis 43
AgriSETA June 2010
Agriculture Sector Analysis 44
Provision of skills programmes in the same year attracted grants for 2 706 employees
Table 31 Participation by learners in skills programmes in the AgriSETA (200809)
Source AgriSETA Skills programmes data analysis
AgriSETA June 2010
APPENDIX 1 Skills demand in the Department of Agriculture Forestry amp Fisheries (200809)
Source DAFF Annual Report 2008‐20009
Agriculture Sector Analysis 45
AgriSETA June 2010
Agriculture Sector Analysis 46
Appendix 2 AgriSETA registered learnerships Registered Learnership NQF Level SAQA Registration NoLearnership in Agri Sales and Service 4 22 Q 220001 20 178 4Learnership Agricultural Machinery Technician 2 22 Q 220007 20 160 2Learnership in Specialist Agricultural Machinery Technician 5 22 Q 220009 21 258 5Agri Trade Processes 2 22 Q 220013 30 125 2FETC Meat Examination Applying Basic Business Principles 4 30 Q 3000 2823 164 4Further Education and Training Certificate Seed Marketing Execute Seed Trials 4 22 Q 220025 21 126 4Further Education and Training Certificate Seed Research and Development Certify as Seed Unit 4 22 Q 220027 21 121 4FETC Seed Research and Development Conduct a Field Inspection of a Seed Unit 4 22 Q 220028 20 120 4Seed Research and Development Operations Operate in a Team 3 22 Q 220020 22 121 3Seed Research and Development Operations Apply Basic Business Principles 3 22 Q 220021 22 121 3National Certificate Seed Processing and Packaging Operate in a Team 3 22 Q 220026 21 123 3Sugar Industry Technical Maintenance worker 2 22 Q 220011 39 128 2National Certificate Sugar Manufacturing and Refining Technical Maintenance 3 30 Q300003 23 146 3Further Education and Training Certificate Manufacturing Technical MaintenanceProduce Components by Performing Engineering Turning Operations
4 30 Q 3000 1321 173 4
FETC Manufacturing Technical Maintenance Produce Components by Performing Milling Operations 4 30 Q 3000 1521 173 4 FETC Manufacturing Technical Maintenance Develop and Fabricate from Complex Drawing 4 30 Q 3000 1420 173 4National Certificate in Sugar Technology 5 22 Q 220036 22 140 5Further Education and Training Certificate Sugar Processing 4 22 Q 220035 31 144 4National Certificate in Sugar Technology Processing Sugar Refining 2 22 Q 220037 28 124 2National Certificate in Sugar Technology Processing Juice Preparation 2 22 Q 220038 28 124 2National Certificate in Sugar Technology Processing Crystallisation 2 22 Q 220039 27 122 2National Certificate in Sugar Technology Processing Laboratory Practice 2 22 Q 220040 25 124 2National Certificate in Sugar Technology Processing Extraction 2 22 Q 220041 28 122 2NC Rooibos Production Applying Basic Business Principles 2 30 Q 3000 2427 130 2 NC Rooibos Processing Applying Basic Business Principles 2 30 Q 3000 2224 123 2 National Certificate Cigarette Production 3 22 Q 220046 23 121 3
AgriSETA June 2010
REFERENCES AgriSETA 2010 AgriSETA 20082009 Annual report Pretoria AgriSETA Agricultural Research Council httpwwwarcagriczahomeasppid=272 Avert South African HIV and AIDS statistics Available on httpwwwavertorgsafricastatshtm Centre for Development Enterprise 2008 Land reform in South Africa Getting back on track CDE Research No 16 DAFF 2010 Quarterly economic review of the agriculture sector Pretoria DAFF DAFF 2009 Annual report 20082009 Pretoria DAFF Department of Agriculture 2008 Strategic plan 2008 Pretoria Department of Agriculture DTI An introduction to the South African economy Available on httpwwwthedtigovzapublicationsagroprocessinghtm Eastern Cape Provincial Government Eastern Cape Provincial Growth and Development Strategy 2004 ndash 2014 Economic Commission for Africa 2009 Developing African agriculture through regional value chains Addis Ababa Economic Commission for Africa Economic Report Free State Province 2005 Provincial Growth and Development Strategy 2005 ndash 2014 GCIS 2010 SA Yearbook 200910rdquo Agriculture forestry and fisheries Pretoria GCIS Greenberg S 2010 Status report on land and agricultural policy in South Africa 2010 Institute for Poverty Land and Agrarian Studies School of Government University of the Western Cape Research report Ingelozi Management Solutions 2008 HIVAIDS in the South African agricultural sector Towards the development of a long term intervention Research report KwaZulu Natal Provincial Government 2006 KwaZulu Natal Provincial Growth and Development Strategy Limpopo Provincial Government Growth and Development Strategy 2004 ndash 2014 Mhone G (2000) Enclavity and Constrained Labour Absorbtive Capacity in Southern African Countries Geneva International Labour Office Moyo S The Agrarian question and the developmental state in South Africa In Edigheji O et al 2010 Constructing a democratic developmental state in South Africa HSRC PRESS
Agriculture Sector Analysis 47
AgriSETA
Agriculture Sector Analysis
National Treasury Republic of South Africa 2010 National Budget 2010 ndash National Budget Review 2010 Pretoria National Treasury Northern Cape Provincial Government Agriculture and agro‐processing sector strategy North West Provincial Government North West Provincial Growth and Development Strategy 2004 ndash 2014 Province of the Western Cape 2008 The Ikapa growth and development strategy White Paper SABCOHA SA Business Coalition on HIV and AIDS wwwsabcohaorg SACAU httpwwwsacauorghostingsacauSacauWebnsfHomehtmOpenForm South African Government 2010 20102011 ndash 20122013 Industrial Policy Action Plan Republic of South Africa Statistics South Africa 2005 Census of commercial agriculture 2002 Report No 110201 Pretoria Statistics South Africa Statistics South Africa 2009 Census of commercial agriculture 2007 Statistical release P1101 Pretoria Statistics South Africa Statistics South Africa 2010 General household survey 2009 Statistical release P0318 Pretoria Statistics South Africa Statistics South Africa 2010 Gross domestic product first quarter 2010 Statistical release P0441 Pretoria Statistics South Africa Statistics South Africa 2010 Quarterly labour force survey Quarter 1 2010 Statistical release P0211 Pretoria Statistics South Africa Vink N amp van Rooyen J 2009 The economic performance of agriculture in South Africa since 1994 The implications for food security Pretoria DBSA development planning division working paper series No 17 Webster E 2004 the Dual Economy from a book by Van Holdt K and Webster E Work restructuring and the Crisis of Social reproduction and 10 years of restructuring post apartheid workplaces University of Natal Press Workinfocom httpwwwworkinfocomfreesub_for_legresdatalraempassoc3htm Xingwana L 2008 Challenges and Opportunities for Land and Agrarian Reform towards 2025 Speech delivered at the Agri‐Consultation Protea Ranch Hotel Polokwane 30 July 2008
- Table of contents
- SECTION 1 THE AGRICULTURAL LANDSCAPE
- 11 Size and shape of the Agricultural sector
-
- Overview
- Distribution of agricultural production
- The structure of the agriculture sector in South Africa
- Categories of farming enterprises
- Employment trends
- Employment categories and remuneration
- Stakeholders in the Agricultural sector
-
- National government departments
- Sector representatives
-
- 12 Factors impacting development in the Agriculture sector
-
- Future sector economic growth and development
-
- South African sector growth plans (IPAP2)
- International Trade
- Global recession and rise in food prices
-
- Land reform
- Reliance on imports
- Water
- The labour market
- Consumer trends
- HIVAIDS
- Farm safety and security
- Broad-based Black Economic Empowerment
-
- Conclusions and scenarios
- SECTION 2 DEMAND FOR SKILLS
-
- AgriSETA registered employers and employee coverage
- Employee coverage in the AgriSETA
-
- 21 Skills demand
-
- The National Education and Training Strategy for Agriculture (AET Strategy)
- AGRISETA sector skills planning demand data (2008-2009)
- AgriSETA WSP analyses
-
- Skills demand in the commercial agricultural sector
-
- Skills demand forecasting by AgriSETA
- Research needs going forward
-
- SECTION 3 Skills Gaps and scarce skills
-
- Scarce skills at the DAFF
- Scarce skills in the commercial sector
- Supply of skills
-
- APPENDIX 1 Skills demand in the Department of Agriculture Forestry amp Fisheries (200809)
- Appendix 2 AgriSETA registered learnerships
-
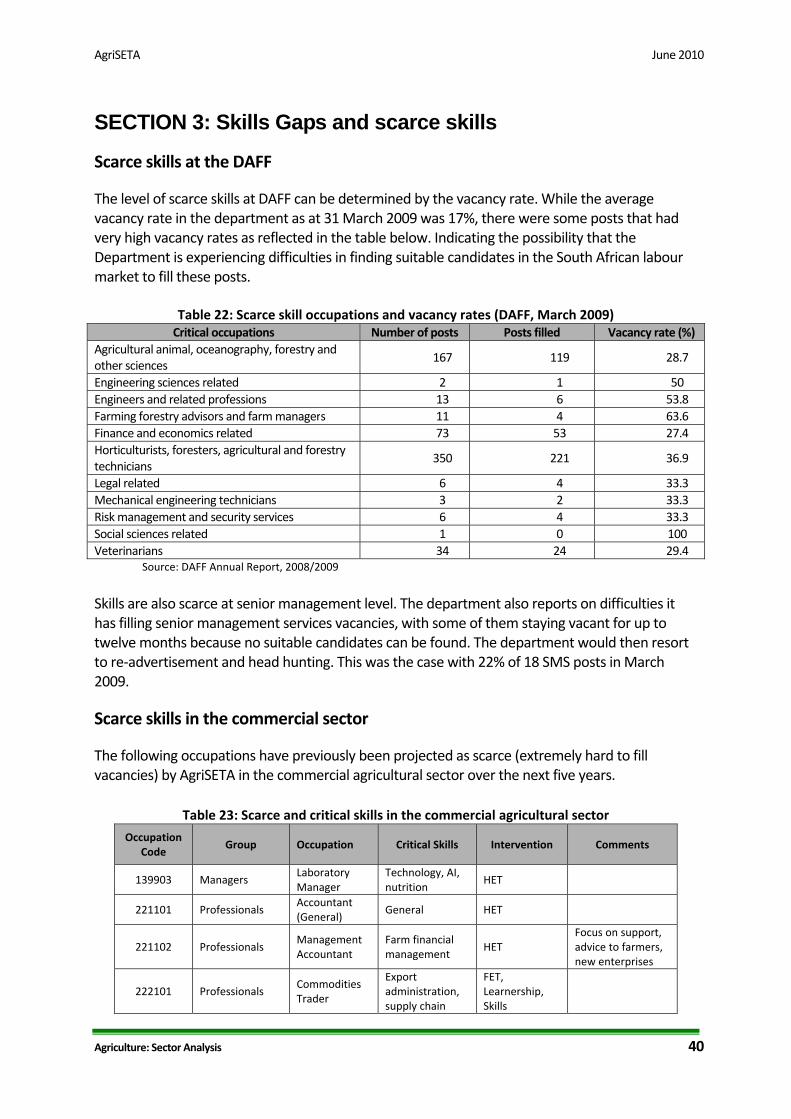
AgriSETA June 2010
SECTION 3 Skills Gaps and scarce skills
Scarce skills at the DAFF
The level of scarce skills at DAFF can be determined by the vacancy rate While the average vacancy rate in the department as at 31 March 2009 was 17 there were some posts that had very high vacancy rates as reflected in the table below Indicating the possibility that the Department is experiencing difficulties in finding suitable candidates in the South African labour market to fill these posts
Table 22 Scarce skill occupations and vacancy rates (DAFF March 2009) Critical occupations Number of posts Posts filled Vacancy rate ()
Agricultural animal oceanography forestry and other sciences
167 119 287
Engineering sciences related 2 1 50Engineers and related professions 13 6 538Farming forestry advisors and farm managers 11 4 636Finance and economics related 73 53 274Horticulturists foresters agricultural and forestry technicians
350 221 369
Legal related 6 4 333Mechanical engineering technicians 3 2 333Risk management and security services 6 4 333Social sciences related 1 0 100Veterinarians 34 24 294
Source DAFF Annual Report 20082009
Skills are also scarce at senior management level The department also reports on difficulties it has filling senior management services vacancies with some of them staying vacant for up to twelve months because no suitable candidates can be found The department would then resort to re‐advertisement and head hunting This was the case with 22 of 18 SMS posts in March 2009
Scarce skills in the commercial sector
The following occupations have previously been projected as scarce (extremely hard to fill vacancies) by AgriSETA in the commercial agricultural sector over the next five years
Table 23 Scarce and critical skills in the commercial agricultural sector
Occupation Code
Group Occupation Critical Skills Intervention Comments
139903 Managers Laboratory Manager
Technology AI nutrition
HET
221101 Professionals Accountant (General)
General HET
221102 Professionals Management Accountant
Farm financial management
HET Focus on support advice to farmers new enterprises
222101 Professionals Commodities Trader
Export administration supply chain
FET Learnership Skills
Agriculture Sector Analysis 40
AgriSETA June 2010
Agriculture Sector Analysis 41
Occupation Code
Group Occupation Critical Skills Intervention Comments
management Programme
224301 Professionals Economist Agricultural HET
Mainly for Department of Agriculture and para statals commodity organisations
233101 Professionals Chemical Engineer
Chemical processes in food production
HET Industries such as sugar processing
233301 Professionals Electrical Engineer
Installation and maintenance
HET Processing industry
233401 Professionals Electronics Engineer
Computerised production prosesses
HET Processing industry
233501 Professionals Industrial Engineer
Productivity and efficiency
HET Processing industry
233904 Professionals
Instrument Engineer (Defence Force)
Installation and maintenance
HET
Not for defence ‐ sugar industry
233502 Professionals Mechanical Engineer
FETHET Equity reasons
233902 Professionals Agricultural Engineer
Farm layout and infrastructure
HET Mainly in Government
311101 Technicians and trades workers
Agricultural Technician
Installation and maintenance
FETHET
234102 Professionals Agricultural Scientist
Agri research HETFET Especially in horticulture
234201 Professionals Chemist HET Processing industry
234202 Professionals Food Technologist
Food safety HACCP
FETHET Across sector
234701 Professionals Veterinarian HET Mainly in Government
311101 Technicians and trades workers
Agricultural Technician
Farm infrastructure
FET Mainly needed in government
311401 Technicians and trades workers
Chemistry Technician
FETHET EE reasons
312907 Technicians and trades workers
Chemical Engineering Technician
FET Learnership
Mainly EE reasons
312402 Technicians and trades workers
Electronic Engineering Technician
Weak stream production infra
FETHET Mainly tobacco industry
233904 Professionals
Instrument Engineer (Defence Force)
Instrument technician
FET
Occupation needed Instrument Technician (not defence force) Mainly sugar processing sector
321202 Technicians and trades workers
Diesel Motor Mechanic
FET Learnership
To include tractor mechanic
321204 Technicians and trades workers
Small Engine Mechanic
Agricultural equipment
FET Learnership
Throughout sector
AgriSETA June 2010
Agriculture Sector Analysis 42
Occupation Code
Group Occupation Critical Skills Intervention Comments
322301 Technicians and trades workers
Metal Fabricator
Artisan FET Learnership
322303 Technicians and trades workers
Welder Welder (First Class)
Artisan FET Learnership
323203 Technicians and trades workers
Fitter‐Welder Artisan FET Learnership
Mainly sugar ndash multi‐skilled
323202 Technicians and trades workers
Fitter And Turner
Artisan FET Learnership
Tobacco and sugar
323501 Technicians and trades workers
Millwright Artisan FET Learnership
Wide‐spread need
341101 Technicians and trades workers
Electrician (General)
Artisan FET Learnership
Wide‐spread need
342101 Technicians and trades workers
Air‐Conditioning And Refrigeration Mechanic
Artisan FET Learnership
Sugar pack houses cold chain
Source AgriSETA Sector Skills Plans
Supply of skills
South Africarsquos agriculture skills are produced in high schools agricultural colleges FET colleges and Higher Education institutions In high school a large cohort of learners take Agricultural Science as a subject In 2003 there were 42 Agricultural High Schools offering Agricultural Science as a subject These students and those in high schools taking the subject could progress to taking agriculture as a focus area for further education In 2004 there were 10 FET colleges offering vocationally directed agricultural programmes These FET colleges offered complete qualifications and short courses Eleven Colleges of Agriculture can offer qualifications up to degree level and 19 universities offer qualifications in Agriculture ranging from agricultural economics animal and plant sciences and horticulture among others at under and post graduate levels (Department of Agriculture 2006) While long term planning of skilling of new entrants in the sector can be done through close consultation between the sector agricultural schools and colleges FET colleges and HET institutions so that they teach relevant skills there are other avenues for training for those who are already employed in the sector for example skills programmes and learnerships There are 15 registered qualifications for the primary agriculture sub sectors Currently AgriSETA has 94 registered learnerships that can address the skills needs of the identified scarce skills These are captured in Appendix 2 AgriSETA has approved accredited a number of training providers across the country to deliver the theoretical and practical components of these learnerships These include agricultural colleges FET colleges and private providers Currently the AgriSETA has 246 registered and approved providers distributed nationally as follows
AgriSETA June 2010
Table 29 AgriSETA approved training providers (2010) Province Number of providers
Gauteng 72
(29)
KwaZulu Natal 20
(8)
Limpopo 35
(14)
North West 30
(12)
Northern Cape 3
(1)
Free State 15
(6)
Mpumalanga 14
(6)
Western Cape 26
(11)
Eastern Cape 31
(13) Total 246
The providers are small to large organisations In primary agriculture small providers appear to offer the most training in rural areas and community projects (AgriSETA 2010) Most of the operating providers will be in FET colleges and agricultural colleges The AgriSETA is unable to meet the total demands for skills across the duality of their sector There seems to be fairness in the approval of training for both permanent and casual and seasonal workers In 200809 the AgriSETA approved 559 learnerships as follows
Table 30 AgriSETA learnerships approved for grant purposes (2008‐2009)
Source AgriSETA learnership data analysis
Agriculture Sector Analysis 43
AgriSETA June 2010
Agriculture Sector Analysis 44
Provision of skills programmes in the same year attracted grants for 2 706 employees
Table 31 Participation by learners in skills programmes in the AgriSETA (200809)
Source AgriSETA Skills programmes data analysis
AgriSETA June 2010
APPENDIX 1 Skills demand in the Department of Agriculture Forestry amp Fisheries (200809)
Source DAFF Annual Report 2008‐20009
Agriculture Sector Analysis 45
AgriSETA June 2010
Agriculture Sector Analysis 46
Appendix 2 AgriSETA registered learnerships Registered Learnership NQF Level SAQA Registration NoLearnership in Agri Sales and Service 4 22 Q 220001 20 178 4Learnership Agricultural Machinery Technician 2 22 Q 220007 20 160 2Learnership in Specialist Agricultural Machinery Technician 5 22 Q 220009 21 258 5Agri Trade Processes 2 22 Q 220013 30 125 2FETC Meat Examination Applying Basic Business Principles 4 30 Q 3000 2823 164 4Further Education and Training Certificate Seed Marketing Execute Seed Trials 4 22 Q 220025 21 126 4Further Education and Training Certificate Seed Research and Development Certify as Seed Unit 4 22 Q 220027 21 121 4FETC Seed Research and Development Conduct a Field Inspection of a Seed Unit 4 22 Q 220028 20 120 4Seed Research and Development Operations Operate in a Team 3 22 Q 220020 22 121 3Seed Research and Development Operations Apply Basic Business Principles 3 22 Q 220021 22 121 3National Certificate Seed Processing and Packaging Operate in a Team 3 22 Q 220026 21 123 3Sugar Industry Technical Maintenance worker 2 22 Q 220011 39 128 2National Certificate Sugar Manufacturing and Refining Technical Maintenance 3 30 Q300003 23 146 3Further Education and Training Certificate Manufacturing Technical MaintenanceProduce Components by Performing Engineering Turning Operations
4 30 Q 3000 1321 173 4
FETC Manufacturing Technical Maintenance Produce Components by Performing Milling Operations 4 30 Q 3000 1521 173 4 FETC Manufacturing Technical Maintenance Develop and Fabricate from Complex Drawing 4 30 Q 3000 1420 173 4National Certificate in Sugar Technology 5 22 Q 220036 22 140 5Further Education and Training Certificate Sugar Processing 4 22 Q 220035 31 144 4National Certificate in Sugar Technology Processing Sugar Refining 2 22 Q 220037 28 124 2National Certificate in Sugar Technology Processing Juice Preparation 2 22 Q 220038 28 124 2National Certificate in Sugar Technology Processing Crystallisation 2 22 Q 220039 27 122 2National Certificate in Sugar Technology Processing Laboratory Practice 2 22 Q 220040 25 124 2National Certificate in Sugar Technology Processing Extraction 2 22 Q 220041 28 122 2NC Rooibos Production Applying Basic Business Principles 2 30 Q 3000 2427 130 2 NC Rooibos Processing Applying Basic Business Principles 2 30 Q 3000 2224 123 2 National Certificate Cigarette Production 3 22 Q 220046 23 121 3
AgriSETA June 2010
REFERENCES AgriSETA 2010 AgriSETA 20082009 Annual report Pretoria AgriSETA Agricultural Research Council httpwwwarcagriczahomeasppid=272 Avert South African HIV and AIDS statistics Available on httpwwwavertorgsafricastatshtm Centre for Development Enterprise 2008 Land reform in South Africa Getting back on track CDE Research No 16 DAFF 2010 Quarterly economic review of the agriculture sector Pretoria DAFF DAFF 2009 Annual report 20082009 Pretoria DAFF Department of Agriculture 2008 Strategic plan 2008 Pretoria Department of Agriculture DTI An introduction to the South African economy Available on httpwwwthedtigovzapublicationsagroprocessinghtm Eastern Cape Provincial Government Eastern Cape Provincial Growth and Development Strategy 2004 ndash 2014 Economic Commission for Africa 2009 Developing African agriculture through regional value chains Addis Ababa Economic Commission for Africa Economic Report Free State Province 2005 Provincial Growth and Development Strategy 2005 ndash 2014 GCIS 2010 SA Yearbook 200910rdquo Agriculture forestry and fisheries Pretoria GCIS Greenberg S 2010 Status report on land and agricultural policy in South Africa 2010 Institute for Poverty Land and Agrarian Studies School of Government University of the Western Cape Research report Ingelozi Management Solutions 2008 HIVAIDS in the South African agricultural sector Towards the development of a long term intervention Research report KwaZulu Natal Provincial Government 2006 KwaZulu Natal Provincial Growth and Development Strategy Limpopo Provincial Government Growth and Development Strategy 2004 ndash 2014 Mhone G (2000) Enclavity and Constrained Labour Absorbtive Capacity in Southern African Countries Geneva International Labour Office Moyo S The Agrarian question and the developmental state in South Africa In Edigheji O et al 2010 Constructing a democratic developmental state in South Africa HSRC PRESS
Agriculture Sector Analysis 47
AgriSETA
Agriculture Sector Analysis
National Treasury Republic of South Africa 2010 National Budget 2010 ndash National Budget Review 2010 Pretoria National Treasury Northern Cape Provincial Government Agriculture and agro‐processing sector strategy North West Provincial Government North West Provincial Growth and Development Strategy 2004 ndash 2014 Province of the Western Cape 2008 The Ikapa growth and development strategy White Paper SABCOHA SA Business Coalition on HIV and AIDS wwwsabcohaorg SACAU httpwwwsacauorghostingsacauSacauWebnsfHomehtmOpenForm South African Government 2010 20102011 ndash 20122013 Industrial Policy Action Plan Republic of South Africa Statistics South Africa 2005 Census of commercial agriculture 2002 Report No 110201 Pretoria Statistics South Africa Statistics South Africa 2009 Census of commercial agriculture 2007 Statistical release P1101 Pretoria Statistics South Africa Statistics South Africa 2010 General household survey 2009 Statistical release P0318 Pretoria Statistics South Africa Statistics South Africa 2010 Gross domestic product first quarter 2010 Statistical release P0441 Pretoria Statistics South Africa Statistics South Africa 2010 Quarterly labour force survey Quarter 1 2010 Statistical release P0211 Pretoria Statistics South Africa Vink N amp van Rooyen J 2009 The economic performance of agriculture in South Africa since 1994 The implications for food security Pretoria DBSA development planning division working paper series No 17 Webster E 2004 the Dual Economy from a book by Van Holdt K and Webster E Work restructuring and the Crisis of Social reproduction and 10 years of restructuring post apartheid workplaces University of Natal Press Workinfocom httpwwwworkinfocomfreesub_for_legresdatalraempassoc3htm Xingwana L 2008 Challenges and Opportunities for Land and Agrarian Reform towards 2025 Speech delivered at the Agri‐Consultation Protea Ranch Hotel Polokwane 30 July 2008
- Table of contents
- SECTION 1 THE AGRICULTURAL LANDSCAPE
- 11 Size and shape of the Agricultural sector
-
- Overview
- Distribution of agricultural production
- The structure of the agriculture sector in South Africa
- Categories of farming enterprises
- Employment trends
- Employment categories and remuneration
- Stakeholders in the Agricultural sector
-
- National government departments
- Sector representatives
-
- 12 Factors impacting development in the Agriculture sector
-
- Future sector economic growth and development
-
- South African sector growth plans (IPAP2)
- International Trade
- Global recession and rise in food prices
-
- Land reform
- Reliance on imports
- Water
- The labour market
- Consumer trends
- HIVAIDS
- Farm safety and security
- Broad-based Black Economic Empowerment
-
- Conclusions and scenarios
- SECTION 2 DEMAND FOR SKILLS
-
- AgriSETA registered employers and employee coverage
- Employee coverage in the AgriSETA
-
- 21 Skills demand
-
- The National Education and Training Strategy for Agriculture (AET Strategy)
- AGRISETA sector skills planning demand data (2008-2009)
- AgriSETA WSP analyses
-
- Skills demand in the commercial agricultural sector
-
- Skills demand forecasting by AgriSETA
- Research needs going forward
-
- SECTION 3 Skills Gaps and scarce skills
-
- Scarce skills at the DAFF
- Scarce skills in the commercial sector
- Supply of skills
-
- APPENDIX 1 Skills demand in the Department of Agriculture Forestry amp Fisheries (200809)
- Appendix 2 AgriSETA registered learnerships
-
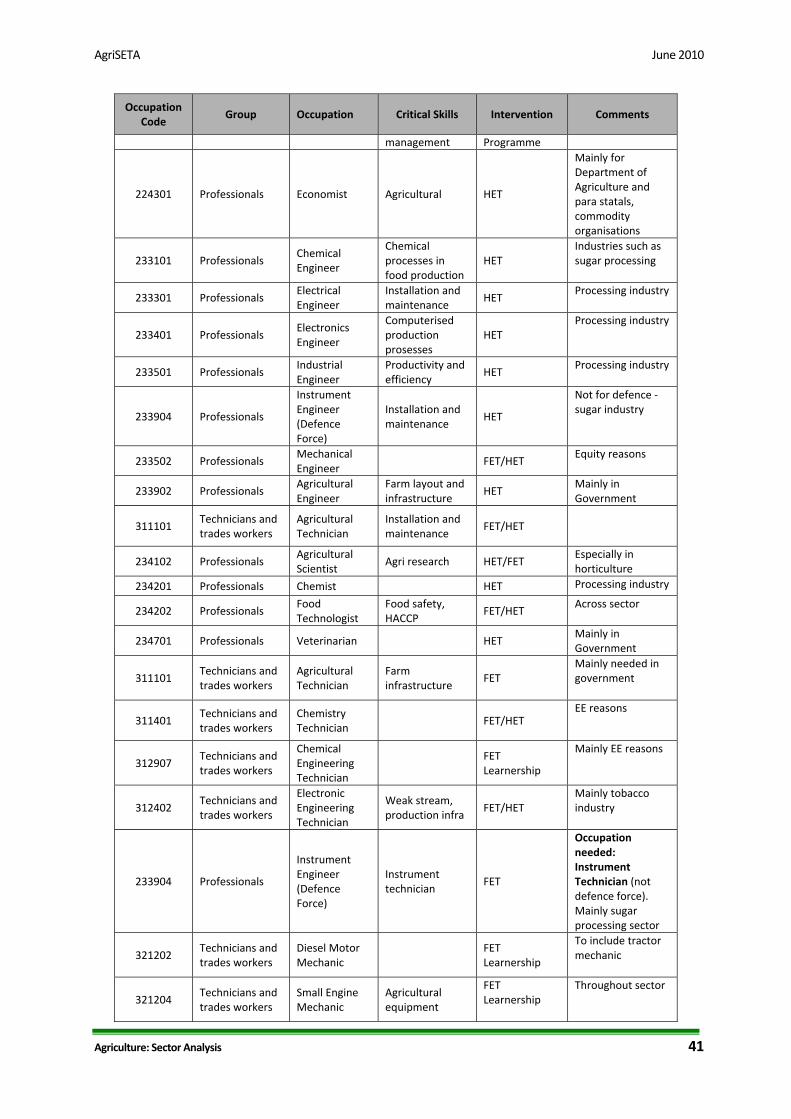
AgriSETA June 2010
Agriculture Sector Analysis 41
Occupation Code
Group Occupation Critical Skills Intervention Comments
management Programme
224301 Professionals Economist Agricultural HET
Mainly for Department of Agriculture and para statals commodity organisations
233101 Professionals Chemical Engineer
Chemical processes in food production
HET Industries such as sugar processing
233301 Professionals Electrical Engineer
Installation and maintenance
HET Processing industry
233401 Professionals Electronics Engineer
Computerised production prosesses
HET Processing industry
233501 Professionals Industrial Engineer
Productivity and efficiency
HET Processing industry
233904 Professionals
Instrument Engineer (Defence Force)
Installation and maintenance
HET
Not for defence ‐ sugar industry
233502 Professionals Mechanical Engineer
FETHET Equity reasons
233902 Professionals Agricultural Engineer
Farm layout and infrastructure
HET Mainly in Government
311101 Technicians and trades workers
Agricultural Technician
Installation and maintenance
FETHET
234102 Professionals Agricultural Scientist
Agri research HETFET Especially in horticulture
234201 Professionals Chemist HET Processing industry
234202 Professionals Food Technologist
Food safety HACCP
FETHET Across sector
234701 Professionals Veterinarian HET Mainly in Government
311101 Technicians and trades workers
Agricultural Technician
Farm infrastructure
FET Mainly needed in government
311401 Technicians and trades workers
Chemistry Technician
FETHET EE reasons
312907 Technicians and trades workers
Chemical Engineering Technician
FET Learnership
Mainly EE reasons
312402 Technicians and trades workers
Electronic Engineering Technician
Weak stream production infra
FETHET Mainly tobacco industry
233904 Professionals
Instrument Engineer (Defence Force)
Instrument technician
FET
Occupation needed Instrument Technician (not defence force) Mainly sugar processing sector
321202 Technicians and trades workers
Diesel Motor Mechanic
FET Learnership
To include tractor mechanic
321204 Technicians and trades workers
Small Engine Mechanic
Agricultural equipment
FET Learnership
Throughout sector
AgriSETA June 2010
Agriculture Sector Analysis 42
Occupation Code
Group Occupation Critical Skills Intervention Comments
322301 Technicians and trades workers
Metal Fabricator
Artisan FET Learnership
322303 Technicians and trades workers
Welder Welder (First Class)
Artisan FET Learnership
323203 Technicians and trades workers
Fitter‐Welder Artisan FET Learnership
Mainly sugar ndash multi‐skilled
323202 Technicians and trades workers
Fitter And Turner
Artisan FET Learnership
Tobacco and sugar
323501 Technicians and trades workers
Millwright Artisan FET Learnership
Wide‐spread need
341101 Technicians and trades workers
Electrician (General)
Artisan FET Learnership
Wide‐spread need
342101 Technicians and trades workers
Air‐Conditioning And Refrigeration Mechanic
Artisan FET Learnership
Sugar pack houses cold chain
Source AgriSETA Sector Skills Plans
Supply of skills
South Africarsquos agriculture skills are produced in high schools agricultural colleges FET colleges and Higher Education institutions In high school a large cohort of learners take Agricultural Science as a subject In 2003 there were 42 Agricultural High Schools offering Agricultural Science as a subject These students and those in high schools taking the subject could progress to taking agriculture as a focus area for further education In 2004 there were 10 FET colleges offering vocationally directed agricultural programmes These FET colleges offered complete qualifications and short courses Eleven Colleges of Agriculture can offer qualifications up to degree level and 19 universities offer qualifications in Agriculture ranging from agricultural economics animal and plant sciences and horticulture among others at under and post graduate levels (Department of Agriculture 2006) While long term planning of skilling of new entrants in the sector can be done through close consultation between the sector agricultural schools and colleges FET colleges and HET institutions so that they teach relevant skills there are other avenues for training for those who are already employed in the sector for example skills programmes and learnerships There are 15 registered qualifications for the primary agriculture sub sectors Currently AgriSETA has 94 registered learnerships that can address the skills needs of the identified scarce skills These are captured in Appendix 2 AgriSETA has approved accredited a number of training providers across the country to deliver the theoretical and practical components of these learnerships These include agricultural colleges FET colleges and private providers Currently the AgriSETA has 246 registered and approved providers distributed nationally as follows
AgriSETA June 2010
Table 29 AgriSETA approved training providers (2010) Province Number of providers
Gauteng 72
(29)
KwaZulu Natal 20
(8)
Limpopo 35
(14)
North West 30
(12)
Northern Cape 3
(1)
Free State 15
(6)
Mpumalanga 14
(6)
Western Cape 26
(11)
Eastern Cape 31
(13) Total 246
The providers are small to large organisations In primary agriculture small providers appear to offer the most training in rural areas and community projects (AgriSETA 2010) Most of the operating providers will be in FET colleges and agricultural colleges The AgriSETA is unable to meet the total demands for skills across the duality of their sector There seems to be fairness in the approval of training for both permanent and casual and seasonal workers In 200809 the AgriSETA approved 559 learnerships as follows
Table 30 AgriSETA learnerships approved for grant purposes (2008‐2009)
Source AgriSETA learnership data analysis
Agriculture Sector Analysis 43
AgriSETA June 2010
Agriculture Sector Analysis 44
Provision of skills programmes in the same year attracted grants for 2 706 employees
Table 31 Participation by learners in skills programmes in the AgriSETA (200809)
Source AgriSETA Skills programmes data analysis
AgriSETA June 2010
APPENDIX 1 Skills demand in the Department of Agriculture Forestry amp Fisheries (200809)
Source DAFF Annual Report 2008‐20009
Agriculture Sector Analysis 45
AgriSETA June 2010
Agriculture Sector Analysis 46
Appendix 2 AgriSETA registered learnerships Registered Learnership NQF Level SAQA Registration NoLearnership in Agri Sales and Service 4 22 Q 220001 20 178 4Learnership Agricultural Machinery Technician 2 22 Q 220007 20 160 2Learnership in Specialist Agricultural Machinery Technician 5 22 Q 220009 21 258 5Agri Trade Processes 2 22 Q 220013 30 125 2FETC Meat Examination Applying Basic Business Principles 4 30 Q 3000 2823 164 4Further Education and Training Certificate Seed Marketing Execute Seed Trials 4 22 Q 220025 21 126 4Further Education and Training Certificate Seed Research and Development Certify as Seed Unit 4 22 Q 220027 21 121 4FETC Seed Research and Development Conduct a Field Inspection of a Seed Unit 4 22 Q 220028 20 120 4Seed Research and Development Operations Operate in a Team 3 22 Q 220020 22 121 3Seed Research and Development Operations Apply Basic Business Principles 3 22 Q 220021 22 121 3National Certificate Seed Processing and Packaging Operate in a Team 3 22 Q 220026 21 123 3Sugar Industry Technical Maintenance worker 2 22 Q 220011 39 128 2National Certificate Sugar Manufacturing and Refining Technical Maintenance 3 30 Q300003 23 146 3Further Education and Training Certificate Manufacturing Technical MaintenanceProduce Components by Performing Engineering Turning Operations
4 30 Q 3000 1321 173 4
FETC Manufacturing Technical Maintenance Produce Components by Performing Milling Operations 4 30 Q 3000 1521 173 4 FETC Manufacturing Technical Maintenance Develop and Fabricate from Complex Drawing 4 30 Q 3000 1420 173 4National Certificate in Sugar Technology 5 22 Q 220036 22 140 5Further Education and Training Certificate Sugar Processing 4 22 Q 220035 31 144 4National Certificate in Sugar Technology Processing Sugar Refining 2 22 Q 220037 28 124 2National Certificate in Sugar Technology Processing Juice Preparation 2 22 Q 220038 28 124 2National Certificate in Sugar Technology Processing Crystallisation 2 22 Q 220039 27 122 2National Certificate in Sugar Technology Processing Laboratory Practice 2 22 Q 220040 25 124 2National Certificate in Sugar Technology Processing Extraction 2 22 Q 220041 28 122 2NC Rooibos Production Applying Basic Business Principles 2 30 Q 3000 2427 130 2 NC Rooibos Processing Applying Basic Business Principles 2 30 Q 3000 2224 123 2 National Certificate Cigarette Production 3 22 Q 220046 23 121 3
AgriSETA June 2010
REFERENCES AgriSETA 2010 AgriSETA 20082009 Annual report Pretoria AgriSETA Agricultural Research Council httpwwwarcagriczahomeasppid=272 Avert South African HIV and AIDS statistics Available on httpwwwavertorgsafricastatshtm Centre for Development Enterprise 2008 Land reform in South Africa Getting back on track CDE Research No 16 DAFF 2010 Quarterly economic review of the agriculture sector Pretoria DAFF DAFF 2009 Annual report 20082009 Pretoria DAFF Department of Agriculture 2008 Strategic plan 2008 Pretoria Department of Agriculture DTI An introduction to the South African economy Available on httpwwwthedtigovzapublicationsagroprocessinghtm Eastern Cape Provincial Government Eastern Cape Provincial Growth and Development Strategy 2004 ndash 2014 Economic Commission for Africa 2009 Developing African agriculture through regional value chains Addis Ababa Economic Commission for Africa Economic Report Free State Province 2005 Provincial Growth and Development Strategy 2005 ndash 2014 GCIS 2010 SA Yearbook 200910rdquo Agriculture forestry and fisheries Pretoria GCIS Greenberg S 2010 Status report on land and agricultural policy in South Africa 2010 Institute for Poverty Land and Agrarian Studies School of Government University of the Western Cape Research report Ingelozi Management Solutions 2008 HIVAIDS in the South African agricultural sector Towards the development of a long term intervention Research report KwaZulu Natal Provincial Government 2006 KwaZulu Natal Provincial Growth and Development Strategy Limpopo Provincial Government Growth and Development Strategy 2004 ndash 2014 Mhone G (2000) Enclavity and Constrained Labour Absorbtive Capacity in Southern African Countries Geneva International Labour Office Moyo S The Agrarian question and the developmental state in South Africa In Edigheji O et al 2010 Constructing a democratic developmental state in South Africa HSRC PRESS
Agriculture Sector Analysis 47
AgriSETA
Agriculture Sector Analysis
National Treasury Republic of South Africa 2010 National Budget 2010 ndash National Budget Review 2010 Pretoria National Treasury Northern Cape Provincial Government Agriculture and agro‐processing sector strategy North West Provincial Government North West Provincial Growth and Development Strategy 2004 ndash 2014 Province of the Western Cape 2008 The Ikapa growth and development strategy White Paper SABCOHA SA Business Coalition on HIV and AIDS wwwsabcohaorg SACAU httpwwwsacauorghostingsacauSacauWebnsfHomehtmOpenForm South African Government 2010 20102011 ndash 20122013 Industrial Policy Action Plan Republic of South Africa Statistics South Africa 2005 Census of commercial agriculture 2002 Report No 110201 Pretoria Statistics South Africa Statistics South Africa 2009 Census of commercial agriculture 2007 Statistical release P1101 Pretoria Statistics South Africa Statistics South Africa 2010 General household survey 2009 Statistical release P0318 Pretoria Statistics South Africa Statistics South Africa 2010 Gross domestic product first quarter 2010 Statistical release P0441 Pretoria Statistics South Africa Statistics South Africa 2010 Quarterly labour force survey Quarter 1 2010 Statistical release P0211 Pretoria Statistics South Africa Vink N amp van Rooyen J 2009 The economic performance of agriculture in South Africa since 1994 The implications for food security Pretoria DBSA development planning division working paper series No 17 Webster E 2004 the Dual Economy from a book by Van Holdt K and Webster E Work restructuring and the Crisis of Social reproduction and 10 years of restructuring post apartheid workplaces University of Natal Press Workinfocom httpwwwworkinfocomfreesub_for_legresdatalraempassoc3htm Xingwana L 2008 Challenges and Opportunities for Land and Agrarian Reform towards 2025 Speech delivered at the Agri‐Consultation Protea Ranch Hotel Polokwane 30 July 2008
- Table of contents
- SECTION 1 THE AGRICULTURAL LANDSCAPE
- 11 Size and shape of the Agricultural sector
-
- Overview
- Distribution of agricultural production
- The structure of the agriculture sector in South Africa
- Categories of farming enterprises
- Employment trends
- Employment categories and remuneration
- Stakeholders in the Agricultural sector
-
- National government departments
- Sector representatives
-
- 12 Factors impacting development in the Agriculture sector
-
- Future sector economic growth and development
-
- South African sector growth plans (IPAP2)
- International Trade
- Global recession and rise in food prices
-
- Land reform
- Reliance on imports
- Water
- The labour market
- Consumer trends
- HIVAIDS
- Farm safety and security
- Broad-based Black Economic Empowerment
-
- Conclusions and scenarios
- SECTION 2 DEMAND FOR SKILLS
-
- AgriSETA registered employers and employee coverage
- Employee coverage in the AgriSETA
-
- 21 Skills demand
-
- The National Education and Training Strategy for Agriculture (AET Strategy)
- AGRISETA sector skills planning demand data (2008-2009)
- AgriSETA WSP analyses
-
- Skills demand in the commercial agricultural sector
-
- Skills demand forecasting by AgriSETA
- Research needs going forward
-
- SECTION 3 Skills Gaps and scarce skills
-
- Scarce skills at the DAFF
- Scarce skills in the commercial sector
- Supply of skills
-
- APPENDIX 1 Skills demand in the Department of Agriculture Forestry amp Fisheries (200809)
- Appendix 2 AgriSETA registered learnerships
-
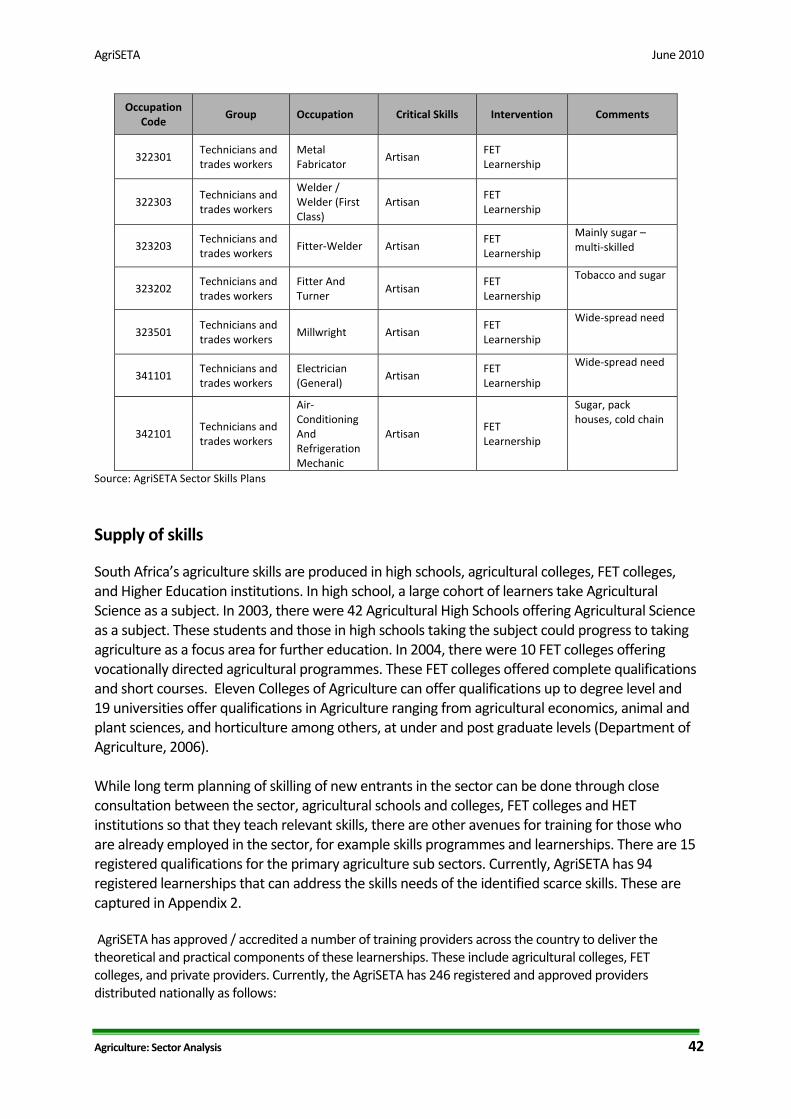
AgriSETA June 2010
Agriculture Sector Analysis 42
Occupation Code
Group Occupation Critical Skills Intervention Comments
322301 Technicians and trades workers
Metal Fabricator
Artisan FET Learnership
322303 Technicians and trades workers
Welder Welder (First Class)
Artisan FET Learnership
323203 Technicians and trades workers
Fitter‐Welder Artisan FET Learnership
Mainly sugar ndash multi‐skilled
323202 Technicians and trades workers
Fitter And Turner
Artisan FET Learnership
Tobacco and sugar
323501 Technicians and trades workers
Millwright Artisan FET Learnership
Wide‐spread need
341101 Technicians and trades workers
Electrician (General)
Artisan FET Learnership
Wide‐spread need
342101 Technicians and trades workers
Air‐Conditioning And Refrigeration Mechanic
Artisan FET Learnership
Sugar pack houses cold chain
Source AgriSETA Sector Skills Plans
Supply of skills
South Africarsquos agriculture skills are produced in high schools agricultural colleges FET colleges and Higher Education institutions In high school a large cohort of learners take Agricultural Science as a subject In 2003 there were 42 Agricultural High Schools offering Agricultural Science as a subject These students and those in high schools taking the subject could progress to taking agriculture as a focus area for further education In 2004 there were 10 FET colleges offering vocationally directed agricultural programmes These FET colleges offered complete qualifications and short courses Eleven Colleges of Agriculture can offer qualifications up to degree level and 19 universities offer qualifications in Agriculture ranging from agricultural economics animal and plant sciences and horticulture among others at under and post graduate levels (Department of Agriculture 2006) While long term planning of skilling of new entrants in the sector can be done through close consultation between the sector agricultural schools and colleges FET colleges and HET institutions so that they teach relevant skills there are other avenues for training for those who are already employed in the sector for example skills programmes and learnerships There are 15 registered qualifications for the primary agriculture sub sectors Currently AgriSETA has 94 registered learnerships that can address the skills needs of the identified scarce skills These are captured in Appendix 2 AgriSETA has approved accredited a number of training providers across the country to deliver the theoretical and practical components of these learnerships These include agricultural colleges FET colleges and private providers Currently the AgriSETA has 246 registered and approved providers distributed nationally as follows
AgriSETA June 2010
Table 29 AgriSETA approved training providers (2010) Province Number of providers
Gauteng 72
(29)
KwaZulu Natal 20
(8)
Limpopo 35
(14)
North West 30
(12)
Northern Cape 3
(1)
Free State 15
(6)
Mpumalanga 14
(6)
Western Cape 26
(11)
Eastern Cape 31
(13) Total 246
The providers are small to large organisations In primary agriculture small providers appear to offer the most training in rural areas and community projects (AgriSETA 2010) Most of the operating providers will be in FET colleges and agricultural colleges The AgriSETA is unable to meet the total demands for skills across the duality of their sector There seems to be fairness in the approval of training for both permanent and casual and seasonal workers In 200809 the AgriSETA approved 559 learnerships as follows
Table 30 AgriSETA learnerships approved for grant purposes (2008‐2009)
Source AgriSETA learnership data analysis
Agriculture Sector Analysis 43
AgriSETA June 2010
Agriculture Sector Analysis 44
Provision of skills programmes in the same year attracted grants for 2 706 employees
Table 31 Participation by learners in skills programmes in the AgriSETA (200809)
Source AgriSETA Skills programmes data analysis
AgriSETA June 2010
APPENDIX 1 Skills demand in the Department of Agriculture Forestry amp Fisheries (200809)
Source DAFF Annual Report 2008‐20009
Agriculture Sector Analysis 45
AgriSETA June 2010
Agriculture Sector Analysis 46
Appendix 2 AgriSETA registered learnerships Registered Learnership NQF Level SAQA Registration NoLearnership in Agri Sales and Service 4 22 Q 220001 20 178 4Learnership Agricultural Machinery Technician 2 22 Q 220007 20 160 2Learnership in Specialist Agricultural Machinery Technician 5 22 Q 220009 21 258 5Agri Trade Processes 2 22 Q 220013 30 125 2FETC Meat Examination Applying Basic Business Principles 4 30 Q 3000 2823 164 4Further Education and Training Certificate Seed Marketing Execute Seed Trials 4 22 Q 220025 21 126 4Further Education and Training Certificate Seed Research and Development Certify as Seed Unit 4 22 Q 220027 21 121 4FETC Seed Research and Development Conduct a Field Inspection of a Seed Unit 4 22 Q 220028 20 120 4Seed Research and Development Operations Operate in a Team 3 22 Q 220020 22 121 3Seed Research and Development Operations Apply Basic Business Principles 3 22 Q 220021 22 121 3National Certificate Seed Processing and Packaging Operate in a Team 3 22 Q 220026 21 123 3Sugar Industry Technical Maintenance worker 2 22 Q 220011 39 128 2National Certificate Sugar Manufacturing and Refining Technical Maintenance 3 30 Q300003 23 146 3Further Education and Training Certificate Manufacturing Technical MaintenanceProduce Components by Performing Engineering Turning Operations
4 30 Q 3000 1321 173 4
FETC Manufacturing Technical Maintenance Produce Components by Performing Milling Operations 4 30 Q 3000 1521 173 4 FETC Manufacturing Technical Maintenance Develop and Fabricate from Complex Drawing 4 30 Q 3000 1420 173 4National Certificate in Sugar Technology 5 22 Q 220036 22 140 5Further Education and Training Certificate Sugar Processing 4 22 Q 220035 31 144 4National Certificate in Sugar Technology Processing Sugar Refining 2 22 Q 220037 28 124 2National Certificate in Sugar Technology Processing Juice Preparation 2 22 Q 220038 28 124 2National Certificate in Sugar Technology Processing Crystallisation 2 22 Q 220039 27 122 2National Certificate in Sugar Technology Processing Laboratory Practice 2 22 Q 220040 25 124 2National Certificate in Sugar Technology Processing Extraction 2 22 Q 220041 28 122 2NC Rooibos Production Applying Basic Business Principles 2 30 Q 3000 2427 130 2 NC Rooibos Processing Applying Basic Business Principles 2 30 Q 3000 2224 123 2 National Certificate Cigarette Production 3 22 Q 220046 23 121 3
AgriSETA June 2010
REFERENCES AgriSETA 2010 AgriSETA 20082009 Annual report Pretoria AgriSETA Agricultural Research Council httpwwwarcagriczahomeasppid=272 Avert South African HIV and AIDS statistics Available on httpwwwavertorgsafricastatshtm Centre for Development Enterprise 2008 Land reform in South Africa Getting back on track CDE Research No 16 DAFF 2010 Quarterly economic review of the agriculture sector Pretoria DAFF DAFF 2009 Annual report 20082009 Pretoria DAFF Department of Agriculture 2008 Strategic plan 2008 Pretoria Department of Agriculture DTI An introduction to the South African economy Available on httpwwwthedtigovzapublicationsagroprocessinghtm Eastern Cape Provincial Government Eastern Cape Provincial Growth and Development Strategy 2004 ndash 2014 Economic Commission for Africa 2009 Developing African agriculture through regional value chains Addis Ababa Economic Commission for Africa Economic Report Free State Province 2005 Provincial Growth and Development Strategy 2005 ndash 2014 GCIS 2010 SA Yearbook 200910rdquo Agriculture forestry and fisheries Pretoria GCIS Greenberg S 2010 Status report on land and agricultural policy in South Africa 2010 Institute for Poverty Land and Agrarian Studies School of Government University of the Western Cape Research report Ingelozi Management Solutions 2008 HIVAIDS in the South African agricultural sector Towards the development of a long term intervention Research report KwaZulu Natal Provincial Government 2006 KwaZulu Natal Provincial Growth and Development Strategy Limpopo Provincial Government Growth and Development Strategy 2004 ndash 2014 Mhone G (2000) Enclavity and Constrained Labour Absorbtive Capacity in Southern African Countries Geneva International Labour Office Moyo S The Agrarian question and the developmental state in South Africa In Edigheji O et al 2010 Constructing a democratic developmental state in South Africa HSRC PRESS
Agriculture Sector Analysis 47
AgriSETA
Agriculture Sector Analysis
National Treasury Republic of South Africa 2010 National Budget 2010 ndash National Budget Review 2010 Pretoria National Treasury Northern Cape Provincial Government Agriculture and agro‐processing sector strategy North West Provincial Government North West Provincial Growth and Development Strategy 2004 ndash 2014 Province of the Western Cape 2008 The Ikapa growth and development strategy White Paper SABCOHA SA Business Coalition on HIV and AIDS wwwsabcohaorg SACAU httpwwwsacauorghostingsacauSacauWebnsfHomehtmOpenForm South African Government 2010 20102011 ndash 20122013 Industrial Policy Action Plan Republic of South Africa Statistics South Africa 2005 Census of commercial agriculture 2002 Report No 110201 Pretoria Statistics South Africa Statistics South Africa 2009 Census of commercial agriculture 2007 Statistical release P1101 Pretoria Statistics South Africa Statistics South Africa 2010 General household survey 2009 Statistical release P0318 Pretoria Statistics South Africa Statistics South Africa 2010 Gross domestic product first quarter 2010 Statistical release P0441 Pretoria Statistics South Africa Statistics South Africa 2010 Quarterly labour force survey Quarter 1 2010 Statistical release P0211 Pretoria Statistics South Africa Vink N amp van Rooyen J 2009 The economic performance of agriculture in South Africa since 1994 The implications for food security Pretoria DBSA development planning division working paper series No 17 Webster E 2004 the Dual Economy from a book by Van Holdt K and Webster E Work restructuring and the Crisis of Social reproduction and 10 years of restructuring post apartheid workplaces University of Natal Press Workinfocom httpwwwworkinfocomfreesub_for_legresdatalraempassoc3htm Xingwana L 2008 Challenges and Opportunities for Land and Agrarian Reform towards 2025 Speech delivered at the Agri‐Consultation Protea Ranch Hotel Polokwane 30 July 2008
- Table of contents
- SECTION 1 THE AGRICULTURAL LANDSCAPE
- 11 Size and shape of the Agricultural sector
-
- Overview
- Distribution of agricultural production
- The structure of the agriculture sector in South Africa
- Categories of farming enterprises
- Employment trends
- Employment categories and remuneration
- Stakeholders in the Agricultural sector
-
- National government departments
- Sector representatives
-
- 12 Factors impacting development in the Agriculture sector
-
- Future sector economic growth and development
-
- South African sector growth plans (IPAP2)
- International Trade
- Global recession and rise in food prices
-
- Land reform
- Reliance on imports
- Water
- The labour market
- Consumer trends
- HIVAIDS
- Farm safety and security
- Broad-based Black Economic Empowerment
-
- Conclusions and scenarios
- SECTION 2 DEMAND FOR SKILLS
-
- AgriSETA registered employers and employee coverage
- Employee coverage in the AgriSETA
-
- 21 Skills demand
-
- The National Education and Training Strategy for Agriculture (AET Strategy)
- AGRISETA sector skills planning demand data (2008-2009)
- AgriSETA WSP analyses
-
- Skills demand in the commercial agricultural sector
-
- Skills demand forecasting by AgriSETA
- Research needs going forward
-
- SECTION 3 Skills Gaps and scarce skills
-
- Scarce skills at the DAFF
- Scarce skills in the commercial sector
- Supply of skills
-
- APPENDIX 1 Skills demand in the Department of Agriculture Forestry amp Fisheries (200809)
- Appendix 2 AgriSETA registered learnerships
-
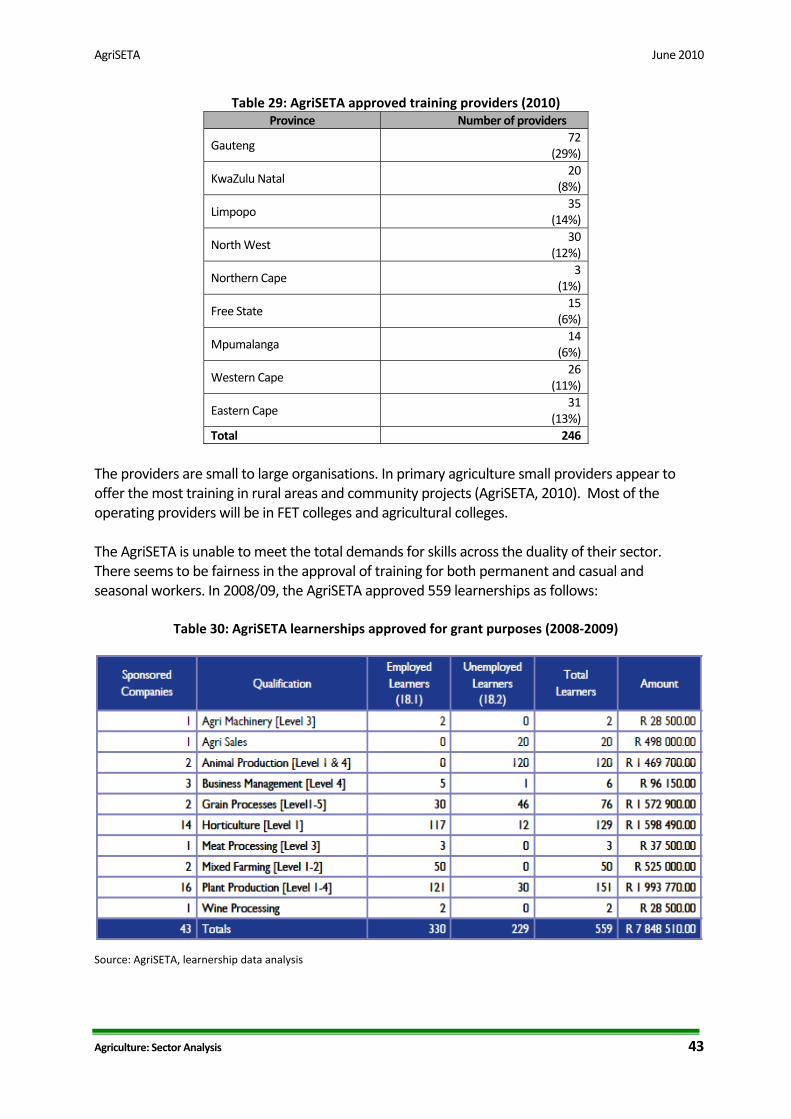
AgriSETA June 2010
Agriculture Sector Analysis 46
Appendix 2 AgriSETA registered learnerships Registered Learnership NQF Level SAQA Registration NoLearnership in Agri Sales and Service 4 22 Q 220001 20 178 4Learnership Agricultural Machinery Technician 2 22 Q 220007 20 160 2Learnership in Specialist Agricultural Machinery Technician 5 22 Q 220009 21 258 5Agri Trade Processes 2 22 Q 220013 30 125 2FETC Meat Examination Applying Basic Business Principles 4 30 Q 3000 2823 164 4Further Education and Training Certificate Seed Marketing Execute Seed Trials 4 22 Q 220025 21 126 4Further Education and Training Certificate Seed Research and Development Certify as Seed Unit 4 22 Q 220027 21 121 4FETC Seed Research and Development Conduct a Field Inspection of a Seed Unit 4 22 Q 220028 20 120 4Seed Research and Development Operations Operate in a Team 3 22 Q 220020 22 121 3Seed Research and Development Operations Apply Basic Business Principles 3 22 Q 220021 22 121 3National Certificate Seed Processing and Packaging Operate in a Team 3 22 Q 220026 21 123 3Sugar Industry Technical Maintenance worker 2 22 Q 220011 39 128 2National Certificate Sugar Manufacturing and Refining Technical Maintenance 3 30 Q300003 23 146 3Further Education and Training Certificate Manufacturing Technical MaintenanceProduce Components by Performing Engineering Turning Operations
4 30 Q 3000 1321 173 4
FETC Manufacturing Technical Maintenance Produce Components by Performing Milling Operations 4 30 Q 3000 1521 173 4 FETC Manufacturing Technical Maintenance Develop and Fabricate from Complex Drawing 4 30 Q 3000 1420 173 4National Certificate in Sugar Technology 5 22 Q 220036 22 140 5Further Education and Training Certificate Sugar Processing 4 22 Q 220035 31 144 4National Certificate in Sugar Technology Processing Sugar Refining 2 22 Q 220037 28 124 2National Certificate in Sugar Technology Processing Juice Preparation 2 22 Q 220038 28 124 2National Certificate in Sugar Technology Processing Crystallisation 2 22 Q 220039 27 122 2National Certificate in Sugar Technology Processing Laboratory Practice 2 22 Q 220040 25 124 2National Certificate in Sugar Technology Processing Extraction 2 22 Q 220041 28 122 2NC Rooibos Production Applying Basic Business Principles 2 30 Q 3000 2427 130 2 NC Rooibos Processing Applying Basic Business Principles 2 30 Q 3000 2224 123 2 National Certificate Cigarette Production 3 22 Q 220046 23 121 3
AgriSETA June 2010
REFERENCES AgriSETA 2010 AgriSETA 20082009 Annual report Pretoria AgriSETA Agricultural Research Council httpwwwarcagriczahomeasppid=272 Avert South African HIV and AIDS statistics Available on httpwwwavertorgsafricastatshtm Centre for Development Enterprise 2008 Land reform in South Africa Getting back on track CDE Research No 16 DAFF 2010 Quarterly economic review of the agriculture sector Pretoria DAFF DAFF 2009 Annual report 20082009 Pretoria DAFF Department of Agriculture 2008 Strategic plan 2008 Pretoria Department of Agriculture DTI An introduction to the South African economy Available on httpwwwthedtigovzapublicationsagroprocessinghtm Eastern Cape Provincial Government Eastern Cape Provincial Growth and Development Strategy 2004 ndash 2014 Economic Commission for Africa 2009 Developing African agriculture through regional value chains Addis Ababa Economic Commission for Africa Economic Report Free State Province 2005 Provincial Growth and Development Strategy 2005 ndash 2014 GCIS 2010 SA Yearbook 200910rdquo Agriculture forestry and fisheries Pretoria GCIS Greenberg S 2010 Status report on land and agricultural policy in South Africa 2010 Institute for Poverty Land and Agrarian Studies School of Government University of the Western Cape Research report Ingelozi Management Solutions 2008 HIVAIDS in the South African agricultural sector Towards the development of a long term intervention Research report KwaZulu Natal Provincial Government 2006 KwaZulu Natal Provincial Growth and Development Strategy Limpopo Provincial Government Growth and Development Strategy 2004 ndash 2014 Mhone G (2000) Enclavity and Constrained Labour Absorbtive Capacity in Southern African Countries Geneva International Labour Office Moyo S The Agrarian question and the developmental state in South Africa In Edigheji O et al 2010 Constructing a democratic developmental state in South Africa HSRC PRESS
Agriculture Sector Analysis 47
AgriSETA
Agriculture Sector Analysis
National Treasury Republic of South Africa 2010 National Budget 2010 ndash National Budget Review 2010 Pretoria National Treasury Northern Cape Provincial Government Agriculture and agro‐processing sector strategy North West Provincial Government North West Provincial Growth and Development Strategy 2004 ndash 2014 Province of the Western Cape 2008 The Ikapa growth and development strategy White Paper SABCOHA SA Business Coalition on HIV and AIDS wwwsabcohaorg SACAU httpwwwsacauorghostingsacauSacauWebnsfHomehtmOpenForm South African Government 2010 20102011 ndash 20122013 Industrial Policy Action Plan Republic of South Africa Statistics South Africa 2005 Census of commercial agriculture 2002 Report No 110201 Pretoria Statistics South Africa Statistics South Africa 2009 Census of commercial agriculture 2007 Statistical release P1101 Pretoria Statistics South Africa Statistics South Africa 2010 General household survey 2009 Statistical release P0318 Pretoria Statistics South Africa Statistics South Africa 2010 Gross domestic product first quarter 2010 Statistical release P0441 Pretoria Statistics South Africa Statistics South Africa 2010 Quarterly labour force survey Quarter 1 2010 Statistical release P0211 Pretoria Statistics South Africa Vink N amp van Rooyen J 2009 The economic performance of agriculture in South Africa since 1994 The implications for food security Pretoria DBSA development planning division working paper series No 17 Webster E 2004 the Dual Economy from a book by Van Holdt K and Webster E Work restructuring and the Crisis of Social reproduction and 10 years of restructuring post apartheid workplaces University of Natal Press Workinfocom httpwwwworkinfocomfreesub_for_legresdatalraempassoc3htm Xingwana L 2008 Challenges and Opportunities for Land and Agrarian Reform towards 2025 Speech delivered at the Agri‐Consultation Protea Ranch Hotel Polokwane 30 July 2008
- Table of contents
- SECTION 1 THE AGRICULTURAL LANDSCAPE
- 11 Size and shape of the Agricultural sector
-
- Overview
- Distribution of agricultural production
- The structure of the agriculture sector in South Africa
- Categories of farming enterprises
- Employment trends
- Employment categories and remuneration
- Stakeholders in the Agricultural sector
-
- National government departments
- Sector representatives
-
- 12 Factors impacting development in the Agriculture sector
-
- Future sector economic growth and development
-
- South African sector growth plans (IPAP2)
- International Trade
- Global recession and rise in food prices
-
- Land reform
- Reliance on imports
- Water
- The labour market
- Consumer trends
- HIVAIDS
- Farm safety and security
- Broad-based Black Economic Empowerment
-
- Conclusions and scenarios
- SECTION 2 DEMAND FOR SKILLS
-
- AgriSETA registered employers and employee coverage
- Employee coverage in the AgriSETA
-
- 21 Skills demand
-
- The National Education and Training Strategy for Agriculture (AET Strategy)
- AGRISETA sector skills planning demand data (2008-2009)
- AgriSETA WSP analyses
-
- Skills demand in the commercial agricultural sector
-
- Skills demand forecasting by AgriSETA
- Research needs going forward
-
- SECTION 3 Skills Gaps and scarce skills
-
- Scarce skills at the DAFF
- Scarce skills in the commercial sector
- Supply of skills
-
- APPENDIX 1 Skills demand in the Department of Agriculture Forestry amp Fisheries (200809)
- Appendix 2 AgriSETA registered learnerships
-