agriculture and groundwater feeding billions from the ground up
TRANSCRIPT

Agriculture and Groundwater
Feeding Billions from the Ground Up
January 20 2017
Overview of Session
10.00-10.05: Introduction: Joachim Von Braun, Director, ZEF, Bonn, Germany
10.05-10.15: Global status of groundwater use (in agriculture) and its impact on
freshwater systems–Petra Doell, Goethe Universität Frankfurt
10.15-10.25: Groundwater in Global Food Security – Current Knowledge and
Outlook–Karen Villholth, IWMI, Pretoria, South Africa.
10.25-10.35: Tackling the challenges of agricultural groundwater use in OECD
Countries-Guillaume Gruere, OECD, Paris, France.
10.35-10.45: Agricultural groundwater use in China: challenges, solutions and
outlook - Jinxia Wang, CCAP & Peking University, Beijing, China.
10.45-10.55: Groundwater use in India and SSA: opportunities, challenges,
solutions and outlook - Claudia Ringler, IFPRI, Washington DC.
10.55-12.00: Chair moderated Q&A with panel and audience and conclusions
1. GLOBAL STATUS OF GROUNDWATER USE
(IN AGRICULTURE) AND ITS IMPACT ON
FRESHWATER SYSTEMS
Prof. Dr. Petra Döll Goethe University Frankfurt
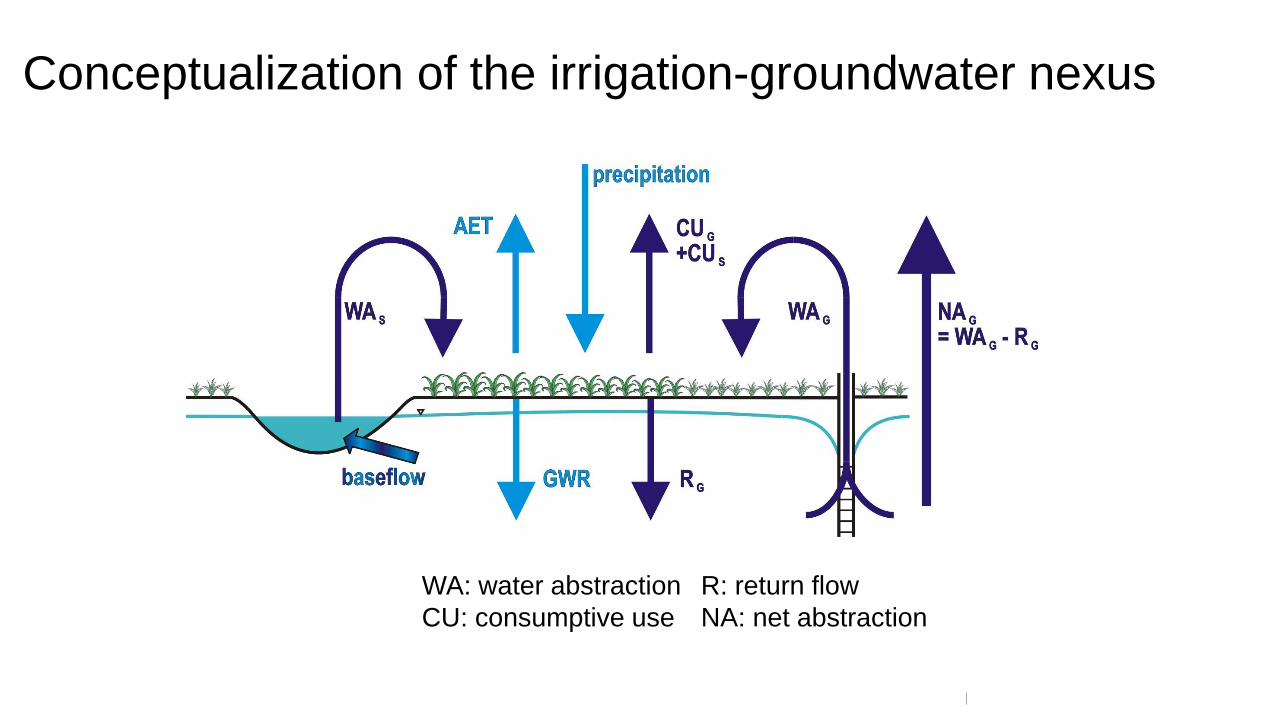
Conceptualization of the irrigation-groundwater nexus
WA: water abstraction
CU: consumptive use
R: return flow
NA: net abstraction
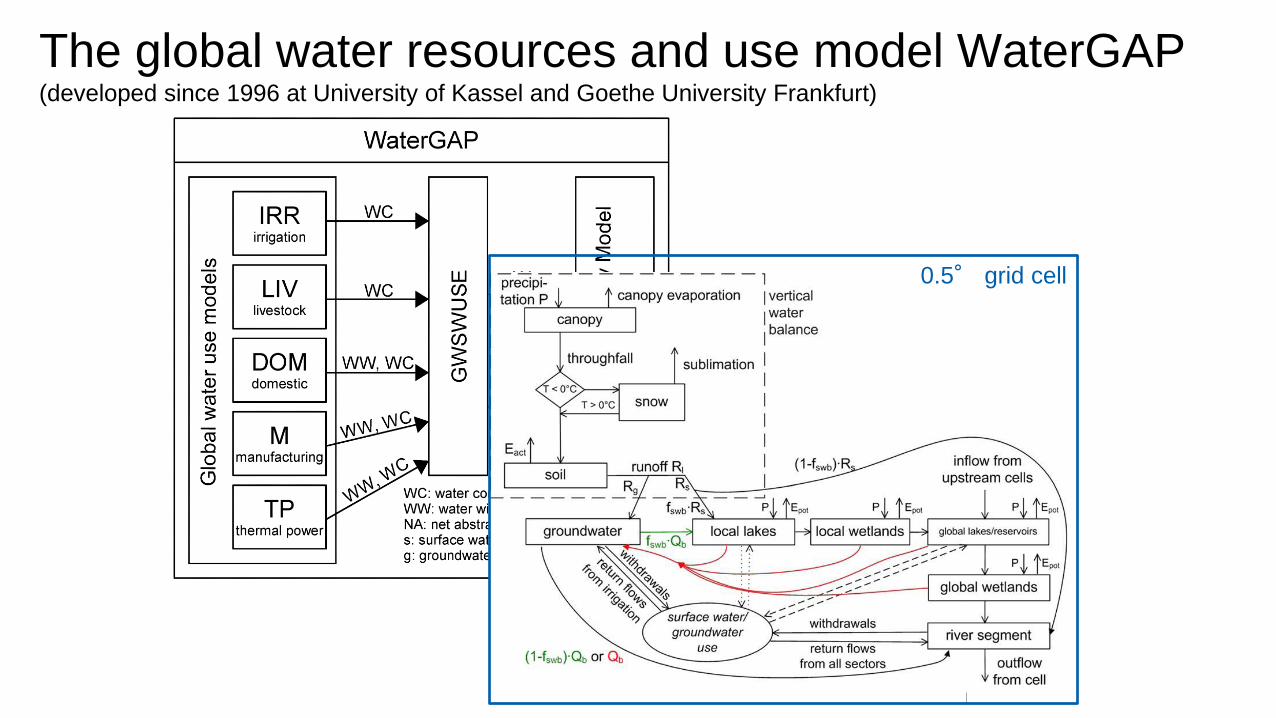
The global water resources and use model WaterGAP (developed since 1996 at University of Kassel and Goethe University Frankfurt)
0.5° grid cell
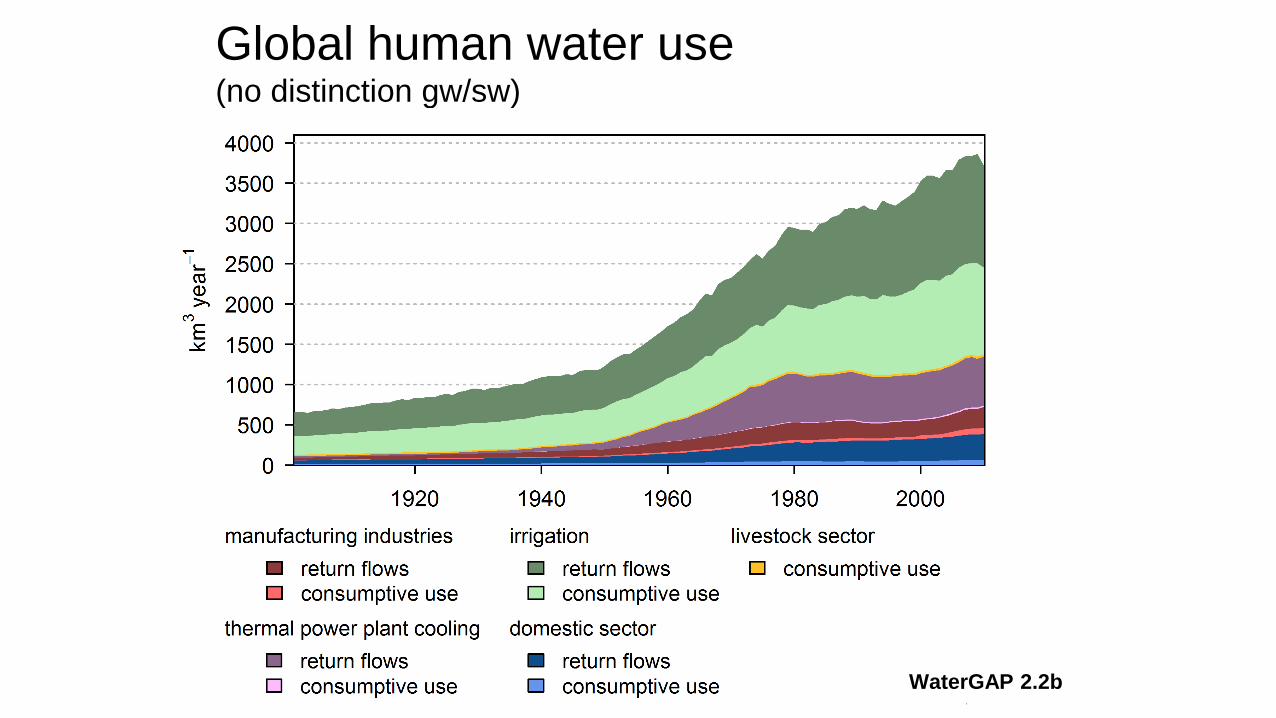
Global human water use (no distinction gw/sw)
WaterGAP 2.2b

Global water use 2003-2009 (WaterGAP 2.2b)
Total Abstractions
(km³/yr) GW Fraction
(%) Consumptive
use (km³/yr) GW Fraction
(%)
Irrigation (70% of
optimum in gw
depletion areas) 2492 24 1149 37
Livestock 30 0 30 0
Domestic 362 36 60 37
Manufacturing 289 27 62 26
Thermal power 615 0 17 0
Total 3788 22 1317 35
NAs = 1479 km3/yr, NAg = -162 km3/yr
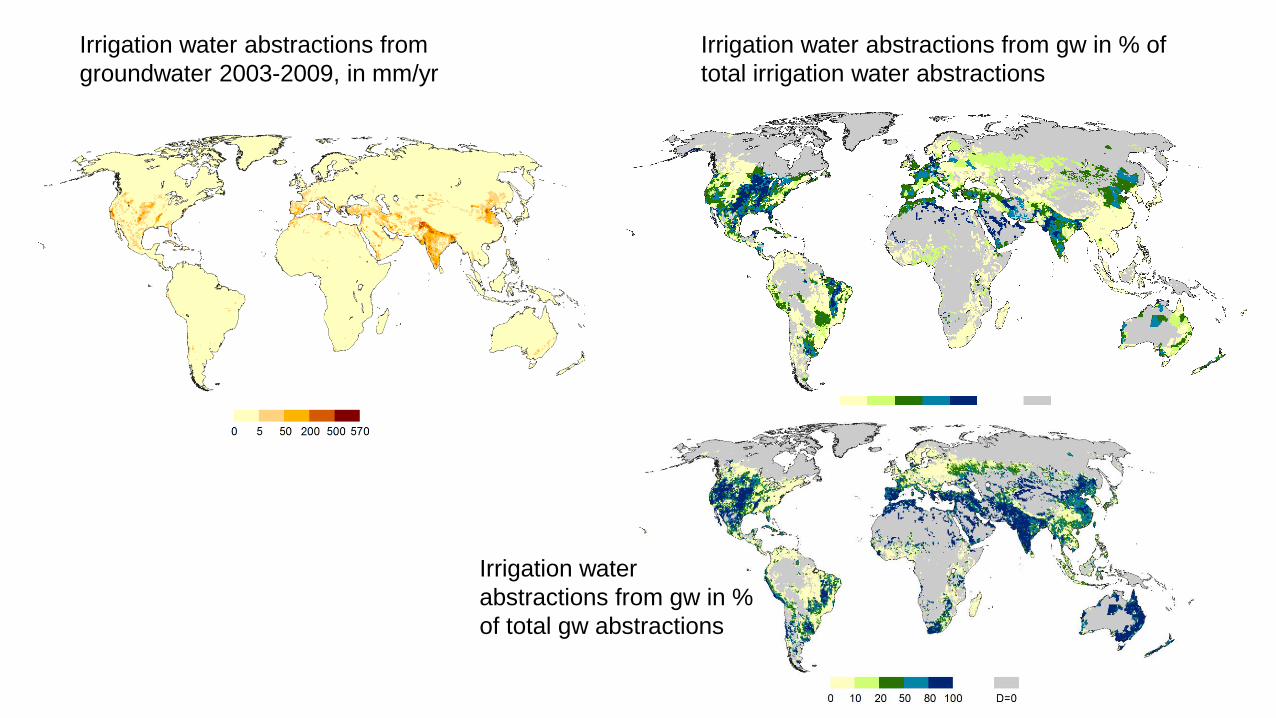
Irrigation water abstractions from
groundwater 2003-2009, in mm/yr
Irrigation water abstractions from gw in % of
total irrigation water abstractions
Irrigation water
abstractions from gw in %
of total gw abstractions
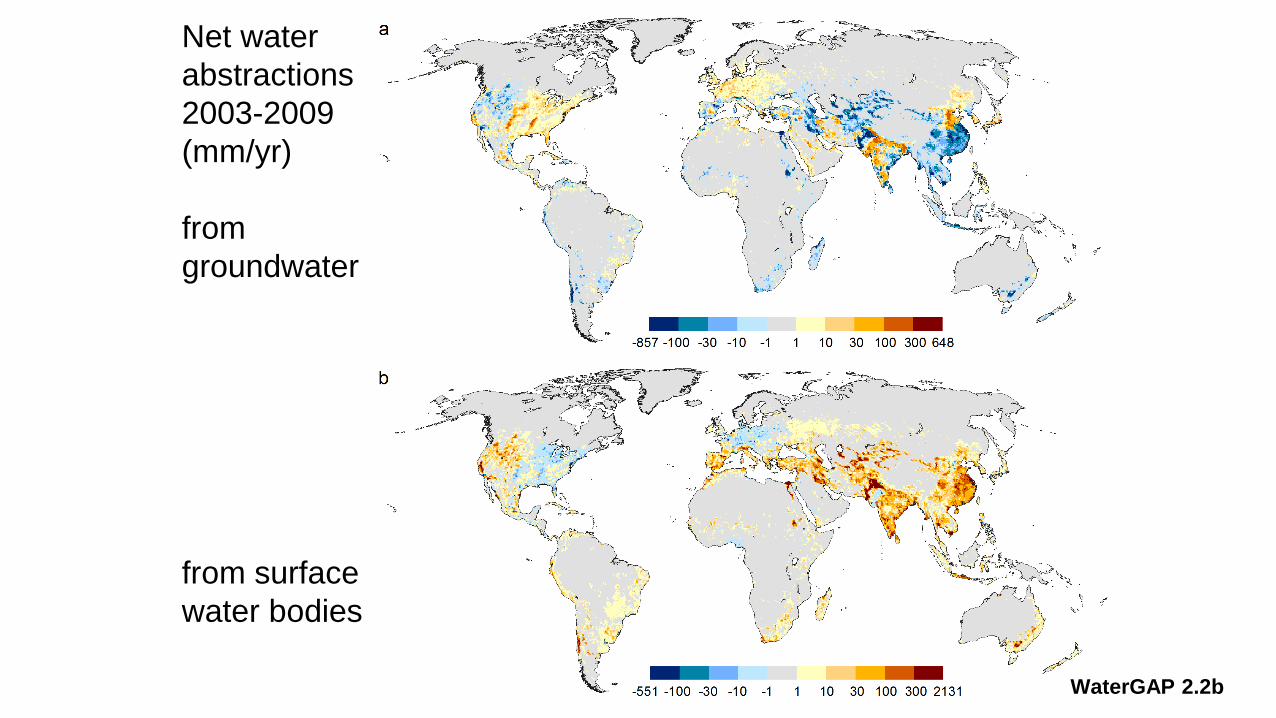
Net water
abstractions
2003-2009
(mm/yr)
from
groundwater
from surface
water bodies
WaterGAP 2.2b
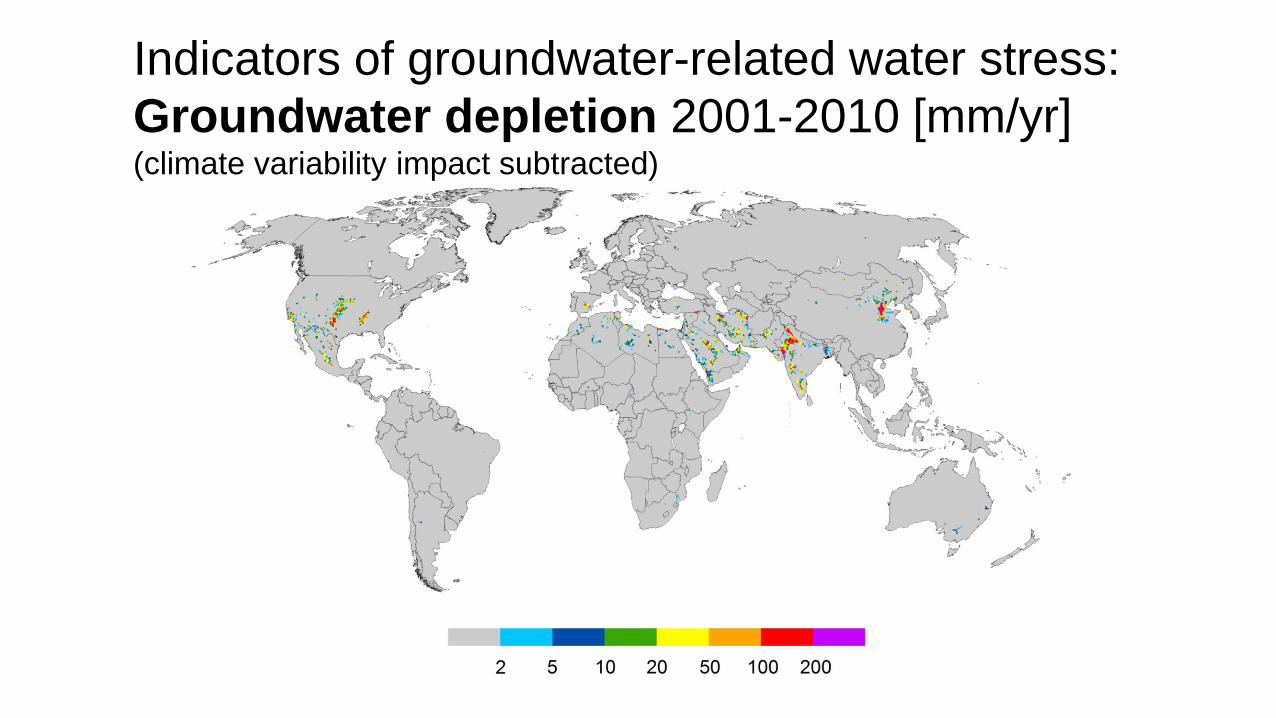
Indicators of groundwater-related water stress:
Groundwater depletion 2001-2010 [mm/yr] (climate variability impact subtracted)
,
Date Slide no.
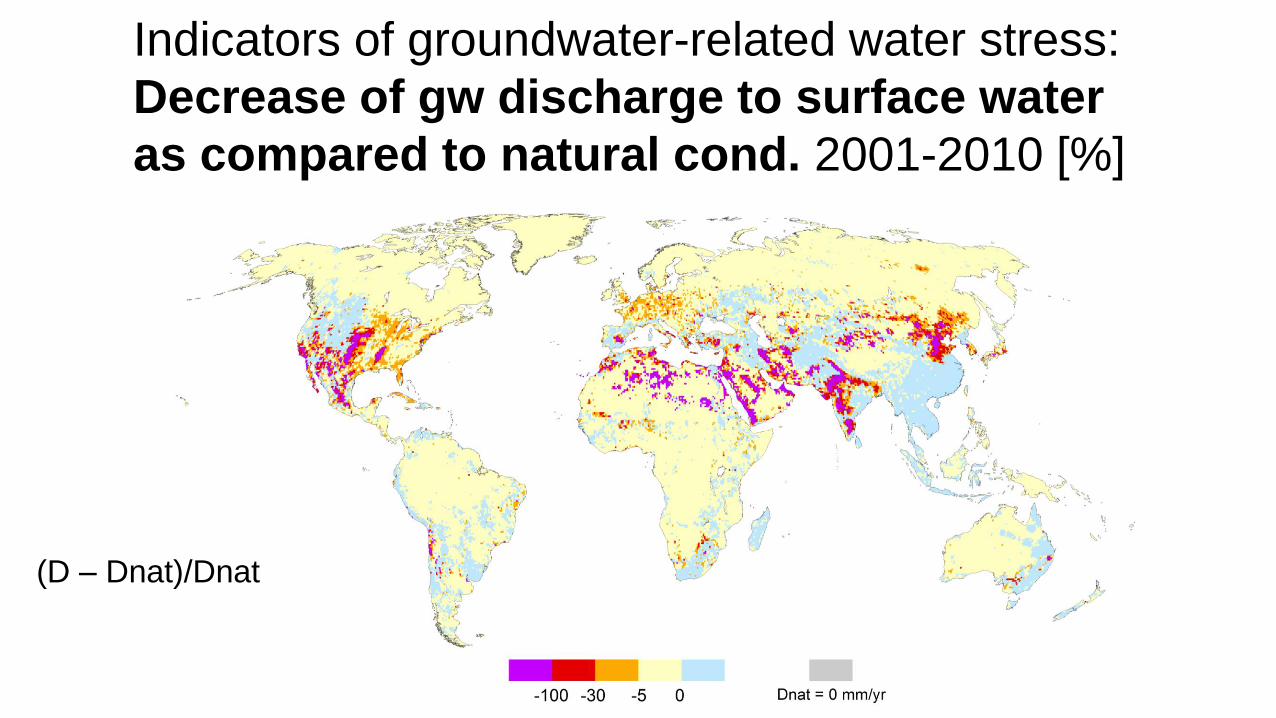
Indicators of groundwater-related water stress:
Decrease of gw discharge to surface water
as compared to natural cond. 2001-2010 [%]
(D – Dnat)/Dnat

2. GROUNDWATER IN GLOBAL FOOD
SECURITY – CURRENT KNOWLEDGE
AND OUTLOOK
Karen G. Villholth IWMI, International Water Management Institute
Principal Researcher & Sub-Theme Leader, South Africa
GRIPP Coordinator
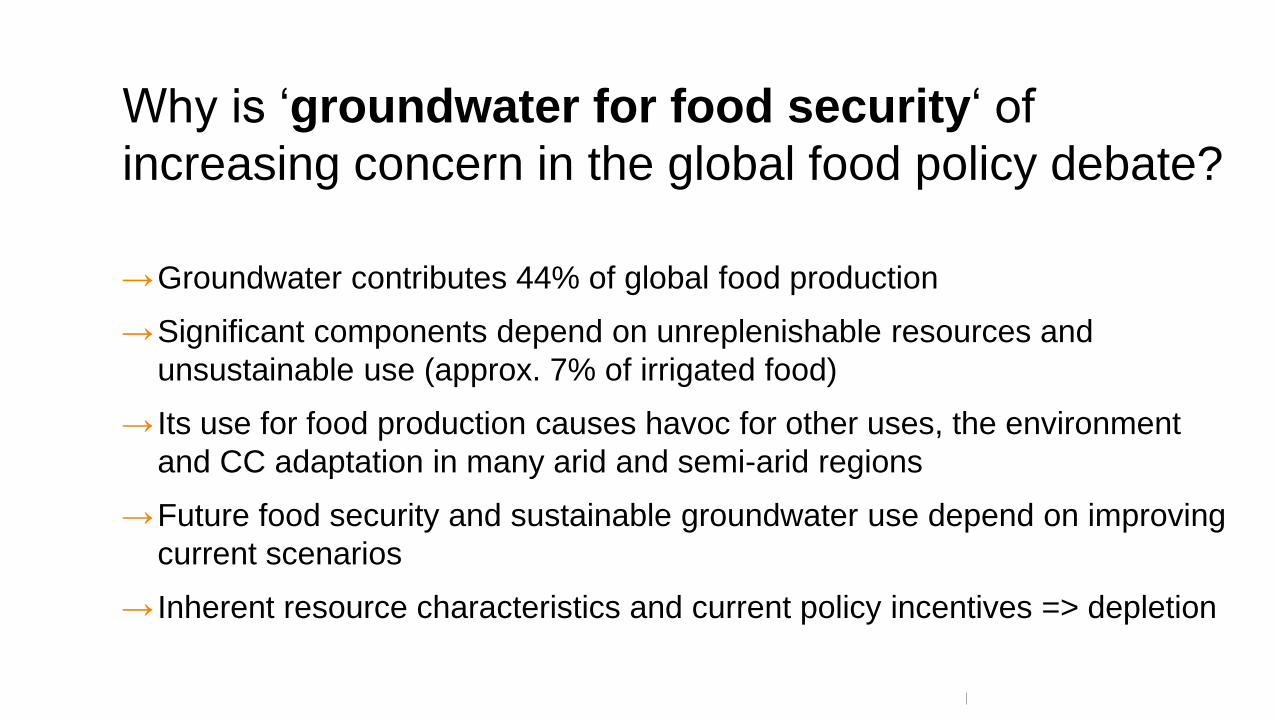
Why is ‘groundwater for food security‘ of
increasing concern in the global food policy debate?
→Groundwater contributes 44% of global food production
→Significant components depend on unreplenishable resources and
unsustainable use (approx. 7% of irrigated food)
→ Its use for food production causes havoc for other uses, the environment
and CC adaptation in many arid and semi-arid regions
→Future food security and sustainable groundwater use depend on improving
current scenarios
→ Inherent resource characteristics and current policy incentives => depletion
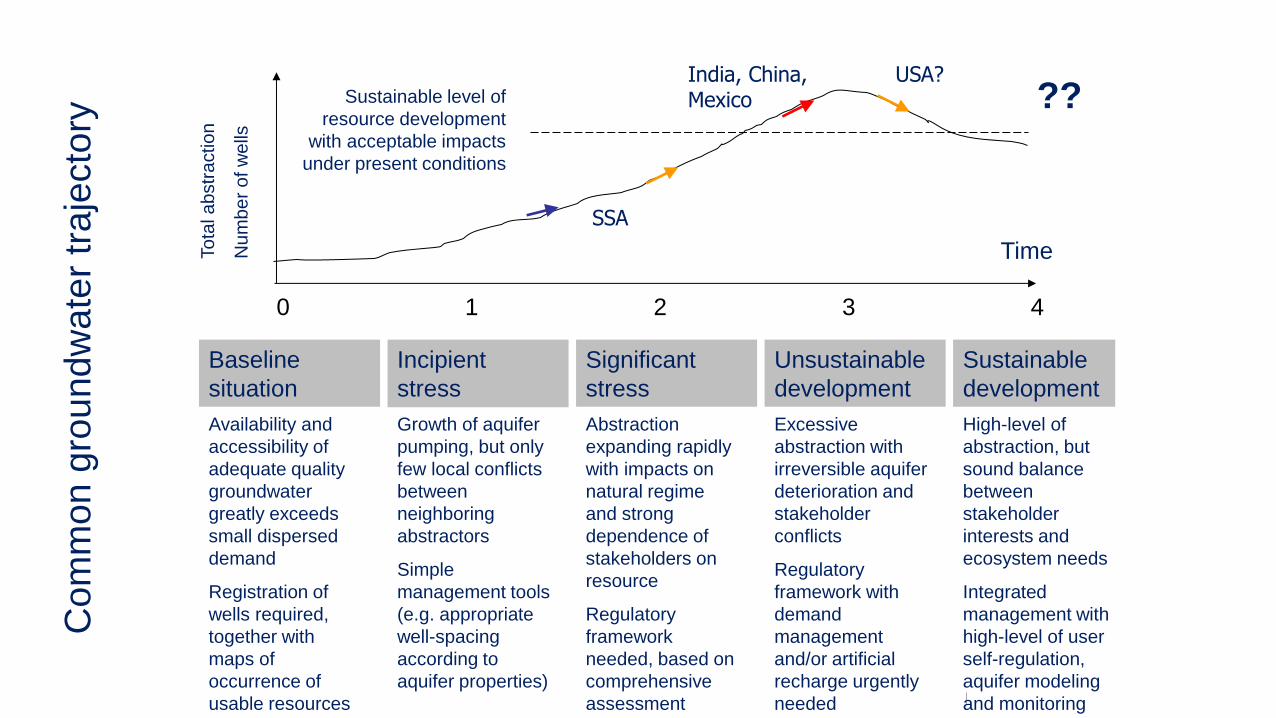
Baseline
situation
0
Availability and
accessibility of
adequate quality
groundwater
greatly exceeds
small dispersed
demand
Registration of
wells required,
together with
maps of
occurrence of
usable resources
1
Growth of aquifer
pumping, but only
few local conflicts
between
neighboring
abstractors
Simple
management tools
(e.g. appropriate
well-spacing
according to
aquifer properties)
Significant
stress
2
Abstraction
expanding rapidly
with impacts on
natural regime
and strong
dependence of
stakeholders on
resource
Regulatory
framework
needed, based on
comprehensive
assessment
Unsustainable
development
3
Excessive
abstraction with
irreversible aquifer
deterioration and
stakeholder
conflicts
Regulatory
framework with
demand
management
and/or artificial
recharge urgently
needed
Sustainable
development
4
High-level of
abstraction, but
sound balance
between
stakeholder
interests and
ecosystem needs
Integrated
management with
high-level of user
self-regulation,
aquifer modeling
and monitoring
Time Tota
l abstr
action
Nu
mb
er
of w
ells
Sustainable level of
resource development
with acceptable impacts
under present conditions
India, China, Mexico
SSA
USA?
?? C
om
mon
gro
und
wate
r tr
aje
cto
ry
Incipient
stress
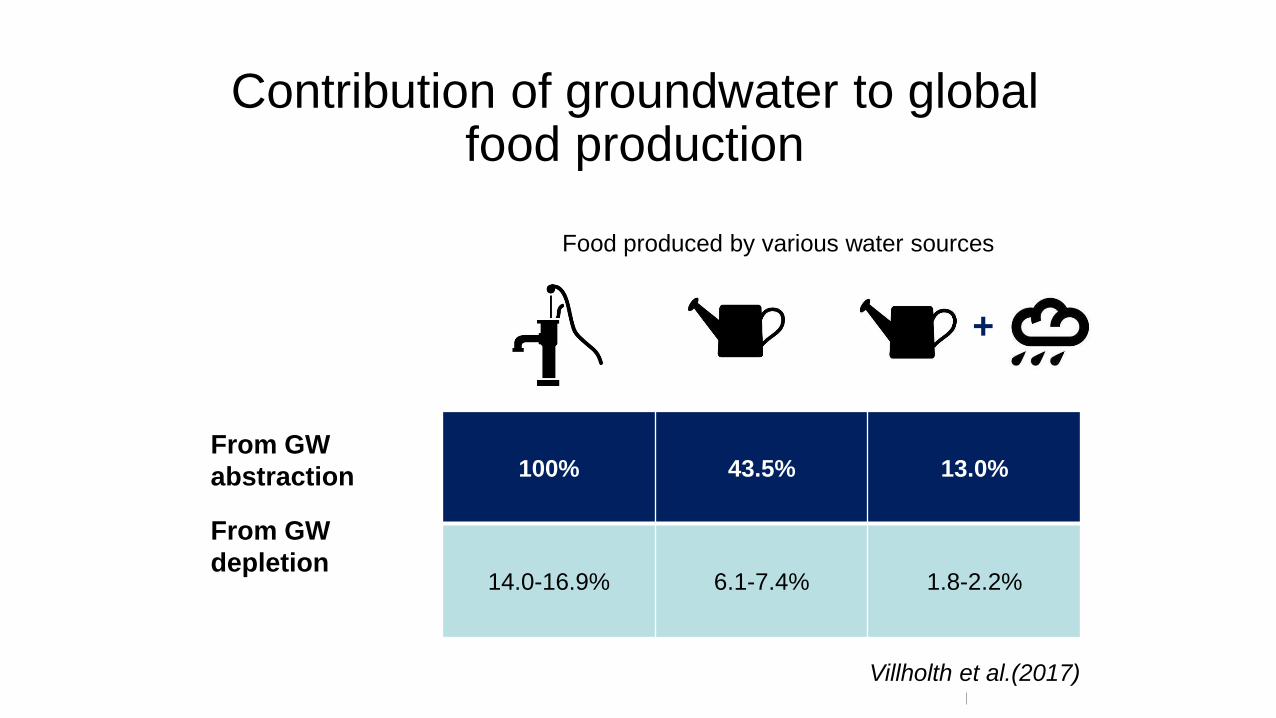
100% 43.5% 13.0%
14.0-16.9% 6.1-7.4% 1.8-2.2%
Contribution of groundwater to global food production
+
From GW
abstraction
From GW
depletion
Food produced by various water sources
Villholth et al.(2017)
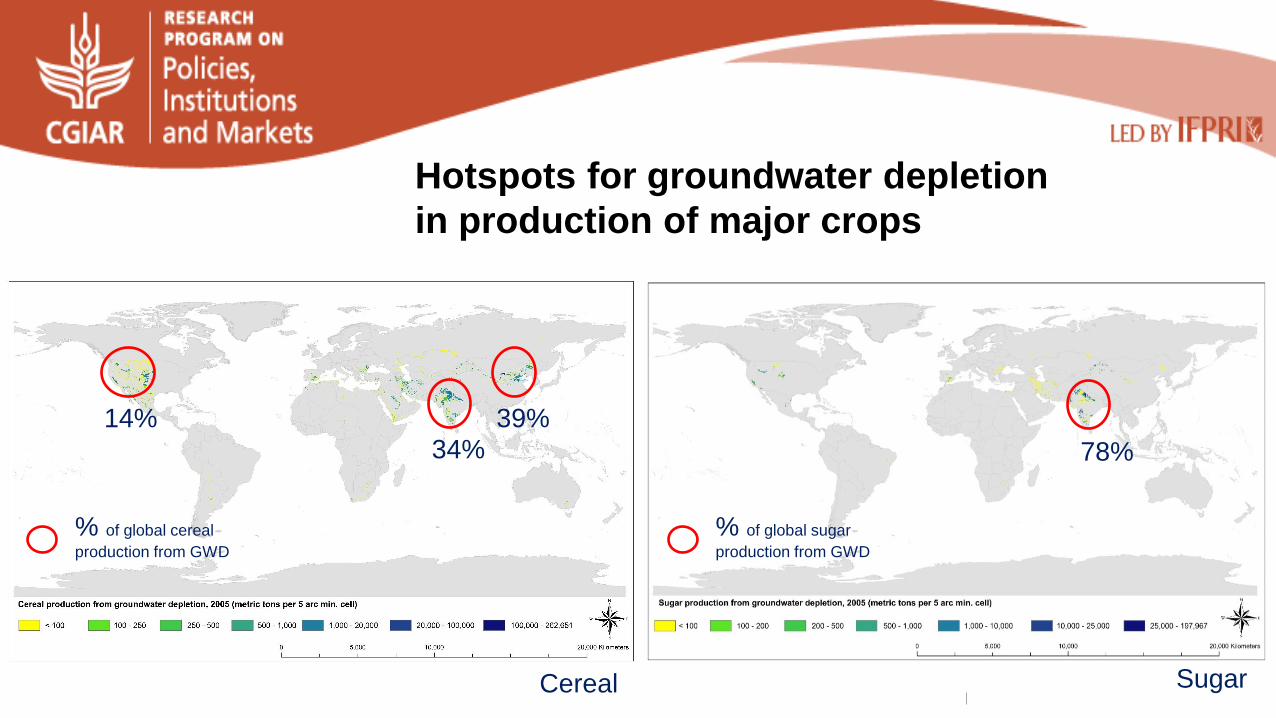
34% 14% 39%
Cereal
78%
% of global sugar
production from GWD
Hotspots for groundwater depletion
in production of major crops
Sugar
% of global cereal
production from GWD
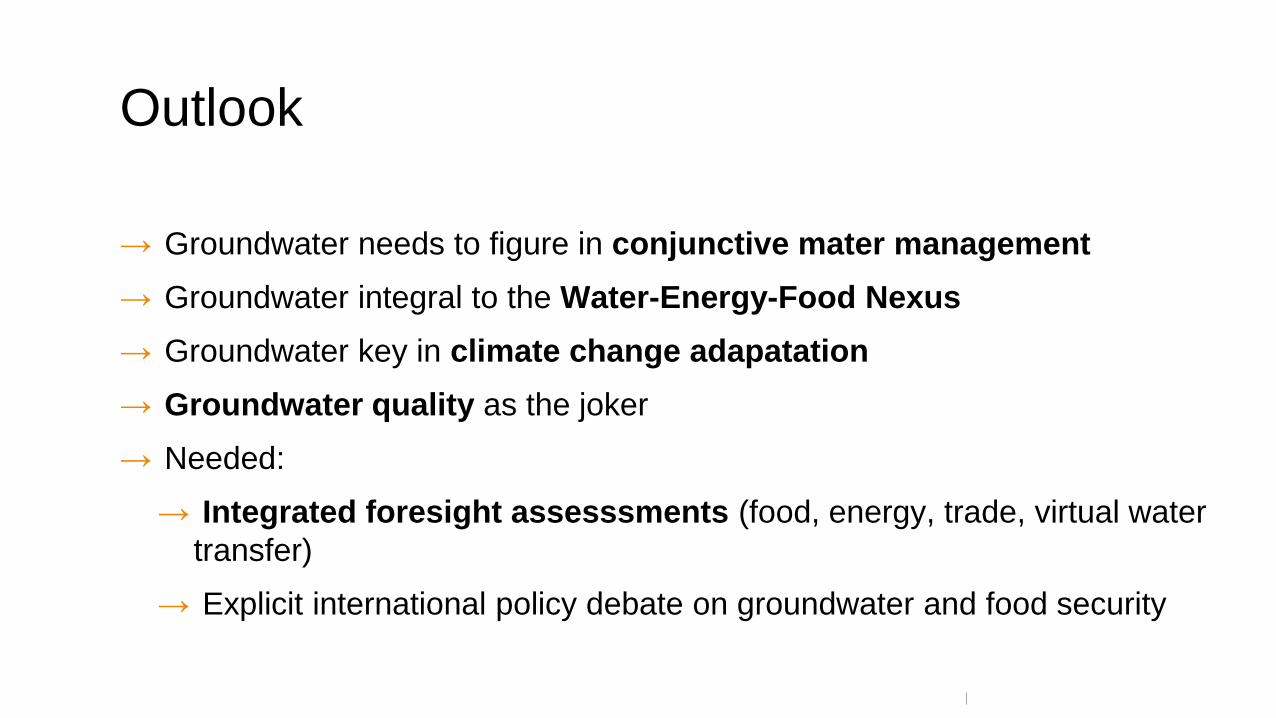
Outlook
→ Groundwater needs to figure in conjunctive mater management
→ Groundwater integral to the Water-Energy-Food Nexus
→ Groundwater key in climate change adapatation
→ Groundwater quality as the joker
→ Needed:
→ Integrated foresight assesssments (food, energy, trade, virtual water
transfer)
→ Explicit international policy debate on groundwater and food security
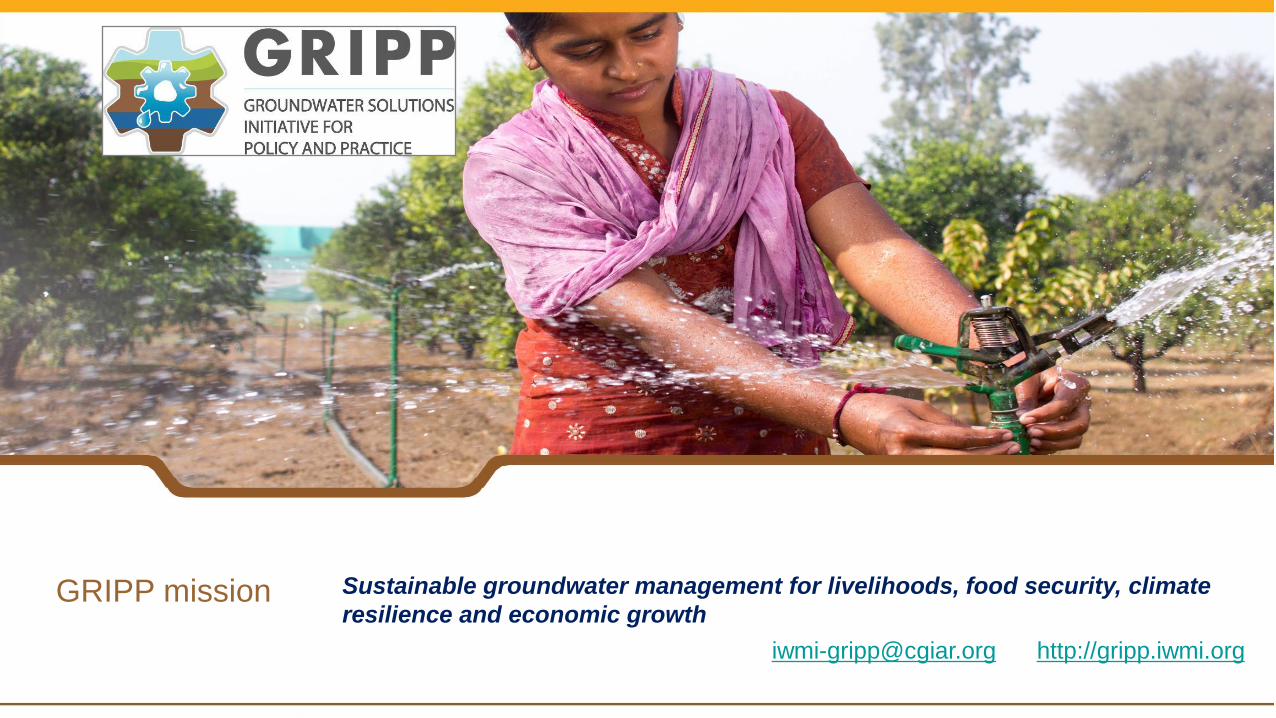
GRIPP mission Sustainable groundwater management for livelihoods, food security, climate
resilience and economic growth
[email protected] http://gripp.iwmi.org
GRIPP Collaborating Partners

3. TACKLING THE CHALLENGES OF
AGRICULTURAL GROUNDWATER USE IN
OECD COUNTRIES
Dr. Guillaume Gruere Senior Policy Analyst, OECD
Based on OECD (2015)
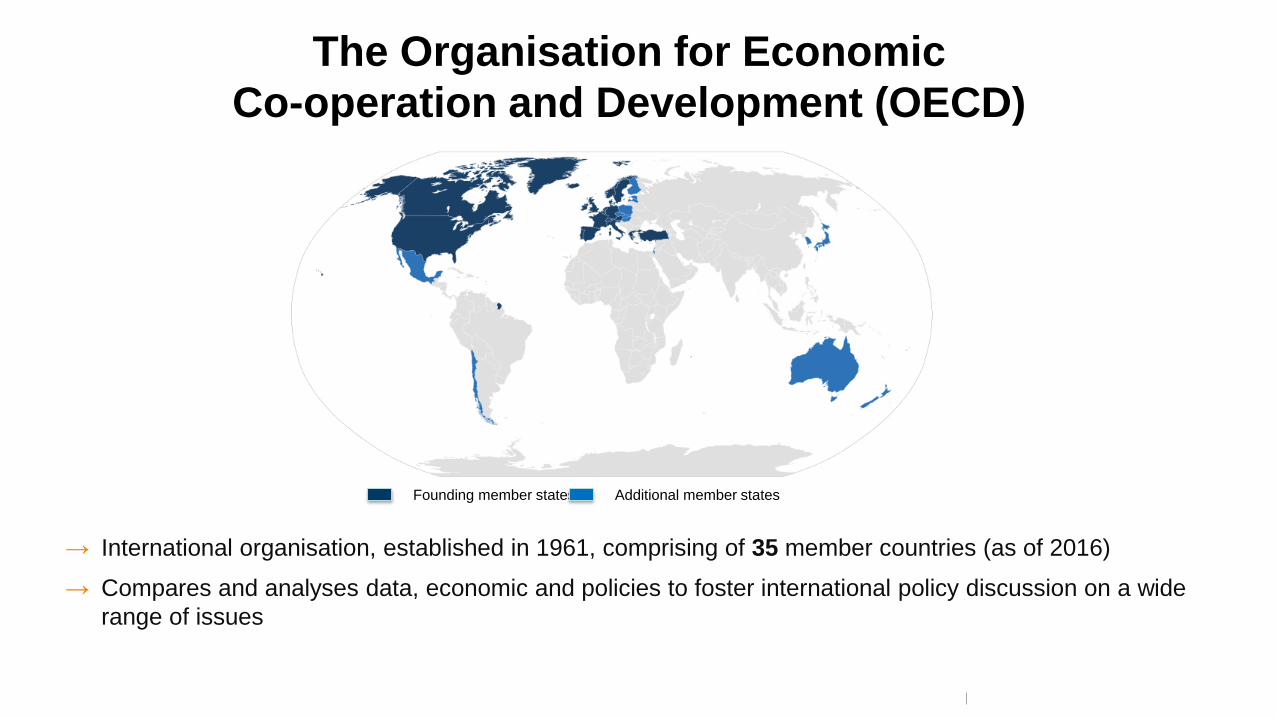
→ International organisation, established in 1961, comprising of 35 member countries (as of 2016)
→ Compares and analyses data, economic and policies to foster international policy discussion on a wide
range of issues
The Organisation for Economic
Co-operation and Development (OECD)
Founding member states Additional member states
Source: OECD (2015) and Margat and van der Gun (2013).
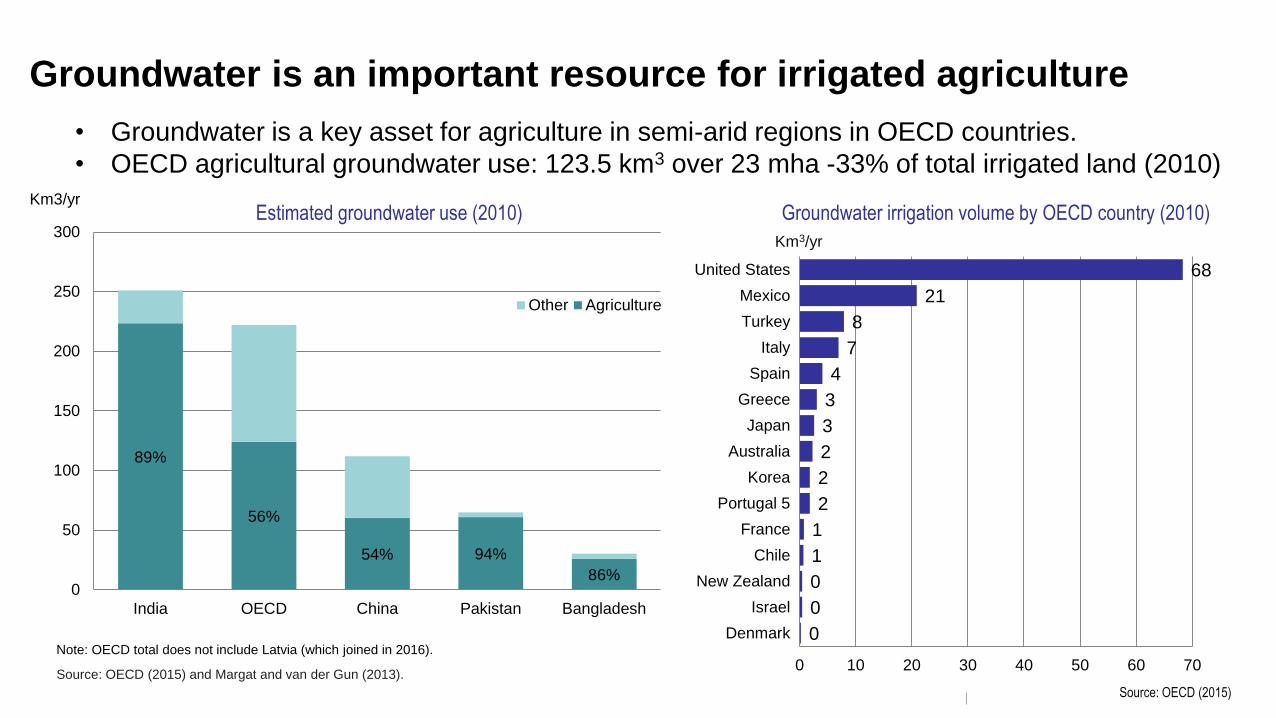
Groundwater is an important resource for irrigated agriculture
• Groundwater is a key asset for agriculture in semi-arid regions in OECD countries.
• OECD agricultural groundwater use: 123.5 km3 over 23 mha -33% of total irrigated land (2010)
0
0
0
1
1
2
2
2
3
3
4
7
8
21
68
0 10 20 30 40 50 60 70
Denmark
Israel
New Zealand
Chile
France
Portugal 5
Korea
Australia
Japan
Greece
Spain
Italy
Turkey
Mexico
United States
89%
56%
54% 94%
86% 0
50
100
150
200
250
300
India OECD China Pakistan Bangladesh
Other Agriculture
Km3/yr
Note: OECD total does not include Latvia (which joined in 2016).
Estimated groundwater use (2010) Groundwater irrigation volume by OECD country (2010)
Km3/yr
Source: OECD (2015)

Groundwater is increasingly used in top OECD irrigating countries
Trends in use for top 10 OECD groundwater
irrigators (1990-2010)
US Greece
Mexico Japan
Turkey Australia
Italy ? Korea
Spain Portugal ?
Note: 1991-2013 for Spain. Note: 1991 data is used instead of 1990 for Spain.
Source: OECD (2015)
Trends in agricultural groundwater use (km3/yr)

Intensive groundwater pumping can lead to:
→ Long term depletion of aquifers (ex. Mexico, S. Ogallala Aquifer in US)
→ Significant negative environmental externalities, including:
→ Stream depletion (e.g., Spain)
→ Salinity and infiltration of polluted water (e.g., Italy)
→ Aquifer compaction and land subsidence (e.g., California)
Intensive groundwater use leads to major challenges
Dr J. Poland’s picture of land subsidence
in Mendota, San Joaquin Valley, California, USA, 1925-77. Source: OECD (2015)
Externalities reported in 20 OECD surveyed regions
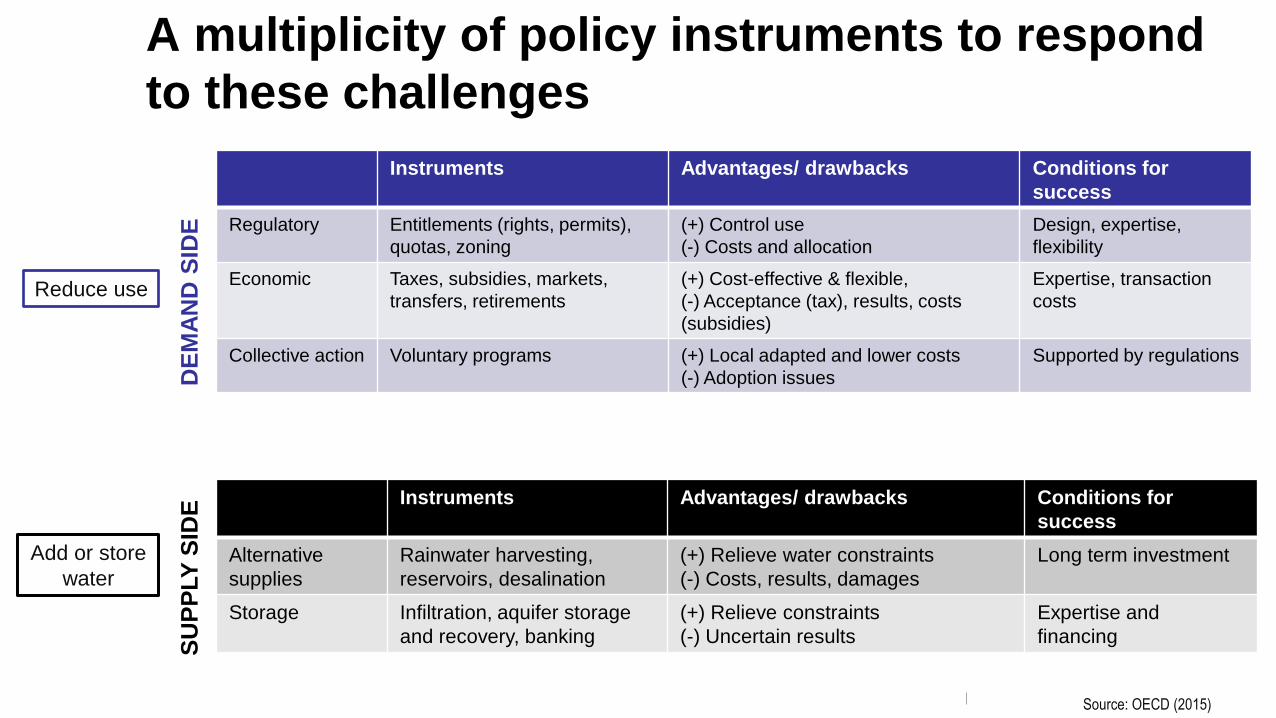
A multiplicity of policy instruments to respond
to these challenges
Instruments
Advantages/ drawbacks Conditions for
success
Regulatory Entitlements (rights, permits),
quotas, zoning
(+) Control use
(-) Costs and allocation
Design, expertise,
flexibility
Economic Taxes, subsidies, markets,
transfers, retirements
(+) Cost-effective & flexible,
(-) Acceptance (tax), results, costs
(subsidies)
Expertise, transaction
costs
Collective action Voluntary programs (+) Local adapted and lower costs
(-) Adoption issues
Supported by regulations
Instruments Advantages/ drawbacks Conditions for
success
Alternative
supplies
Rainwater harvesting,
reservoirs, desalination
(+) Relieve water constraints
(-) Costs, results, damages
Long term investment
Storage Infiltration, aquifer storage
and recovery, banking
(+) Relieve constraints
(-) Uncertain results
Expertise and
financing
DE
MA
ND
SID
E
SU
PP
LY
SID
E
Reduce use
Add or store
water
Source: OECD (2015)
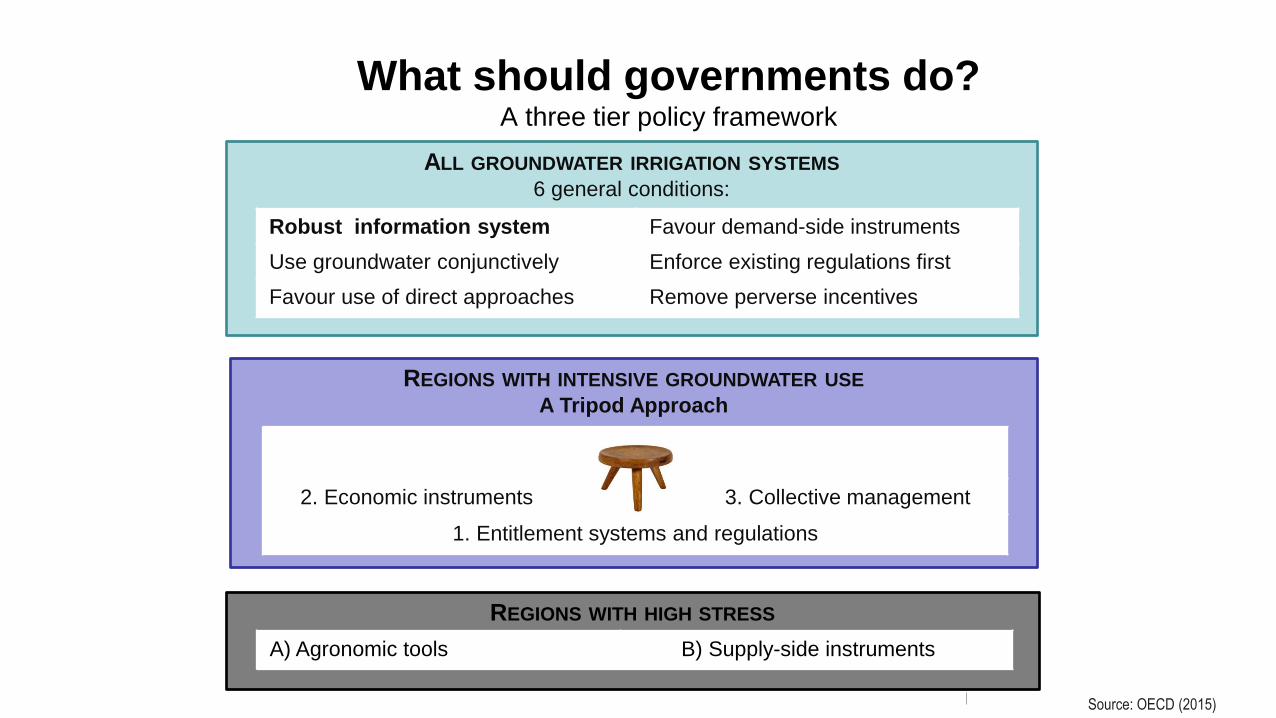
What should governments do? A three tier policy framework
ALL GROUNDWATER IRRIGATION SYSTEMS 6 general conditions:
Robust information system Favour demand-side instruments
Use groundwater conjunctively Enforce existing regulations first
Favour use of direct approaches Remove perverse incentives
REGIONS WITH INTENSIVE GROUNDWATER USE A Tripod Approach
2. Economic instruments 3. Collective management
1. Entitlement systems and regulations
REGIONS WITH HIGH STRESS
A) Agronomic tools B) Supply-side instruments
Source: OECD (2015)
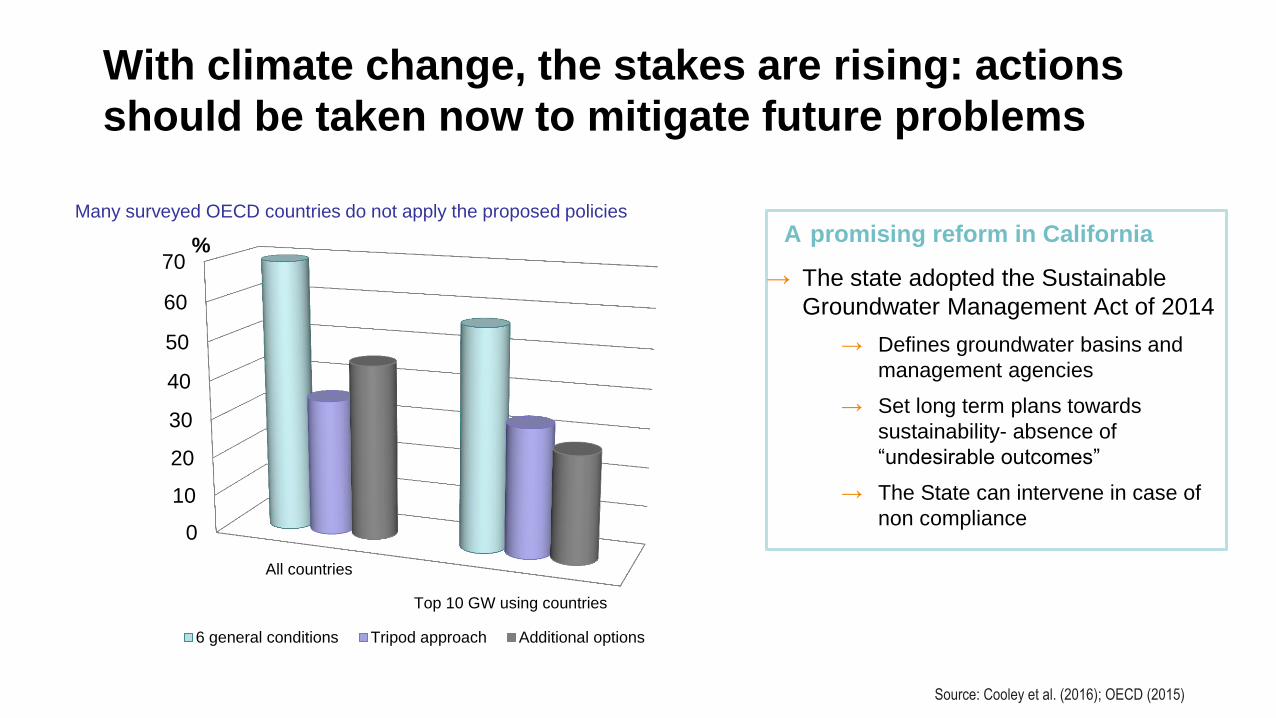
With climate change, the stakes are rising: actions
should be taken now to mitigate future problems
A promising reform in California
→ The state adopted the Sustainable
Groundwater Management Act of 2014
→ Defines groundwater basins and
management agencies
→ Set long term plans towards
sustainability- absence of
“undesirable outcomes”
→ The State can intervene in case of
non compliance
Date Slide no.
0
10
20
30
40
50
60
70
All countries
Top 10 GW using countries
%
6 general conditions Tripod approach Additional options
Source: Cooley et al. (2016); OECD (2015)
Many surveyed OECD countries do not apply the proposed policies
4. AGRICULTURAL GROUNDWATER USE IN
CHINA: CHALLENGES, SOLUTIONS AND
OUTLOOK
Prof. Jinxia Wang Chinese Center for Agricultural Policy
School of Advanced Agricultural Sciences
Peking University
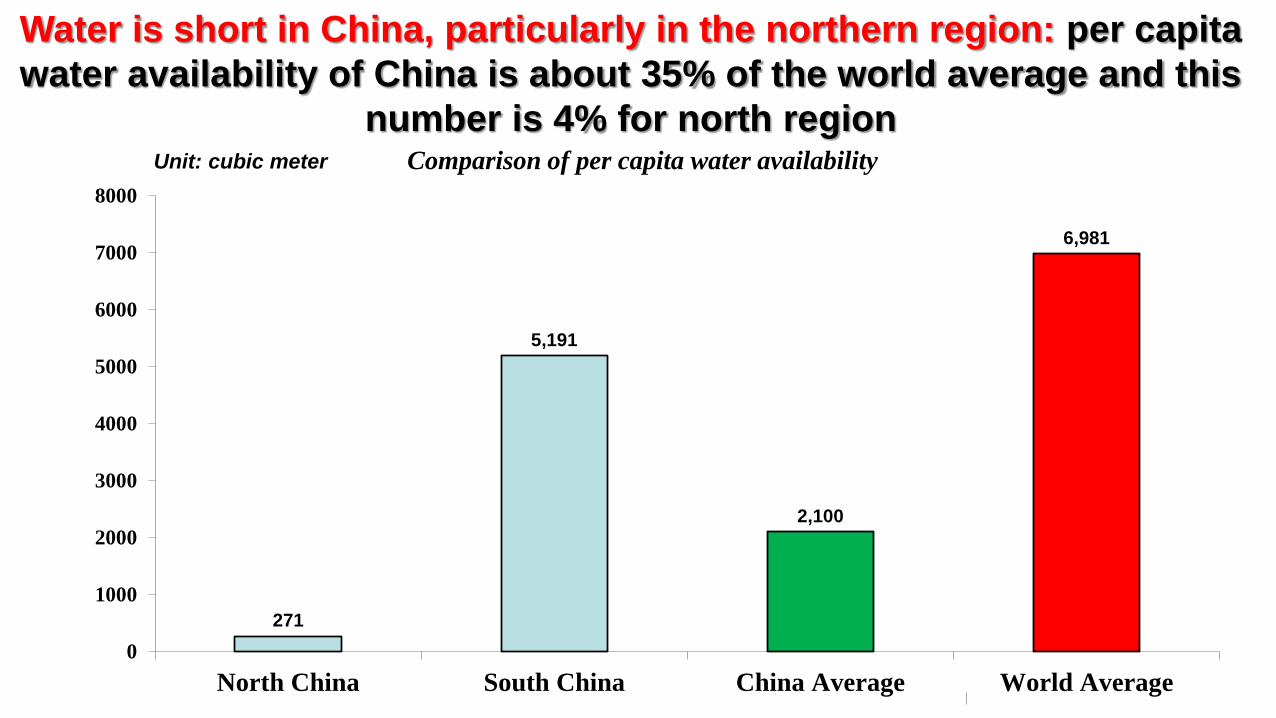
271
5,191
2,100
6,981
0
1000
2000
3000
4000
5000
6000
7000
8000
North China South China China Average World Average
Comparison of per capita water availability Unit: cubic meter
Water is short in China, particularly in the northern region: per capita
water availability of China is about 35% of the world average and this
number is 4% for north region
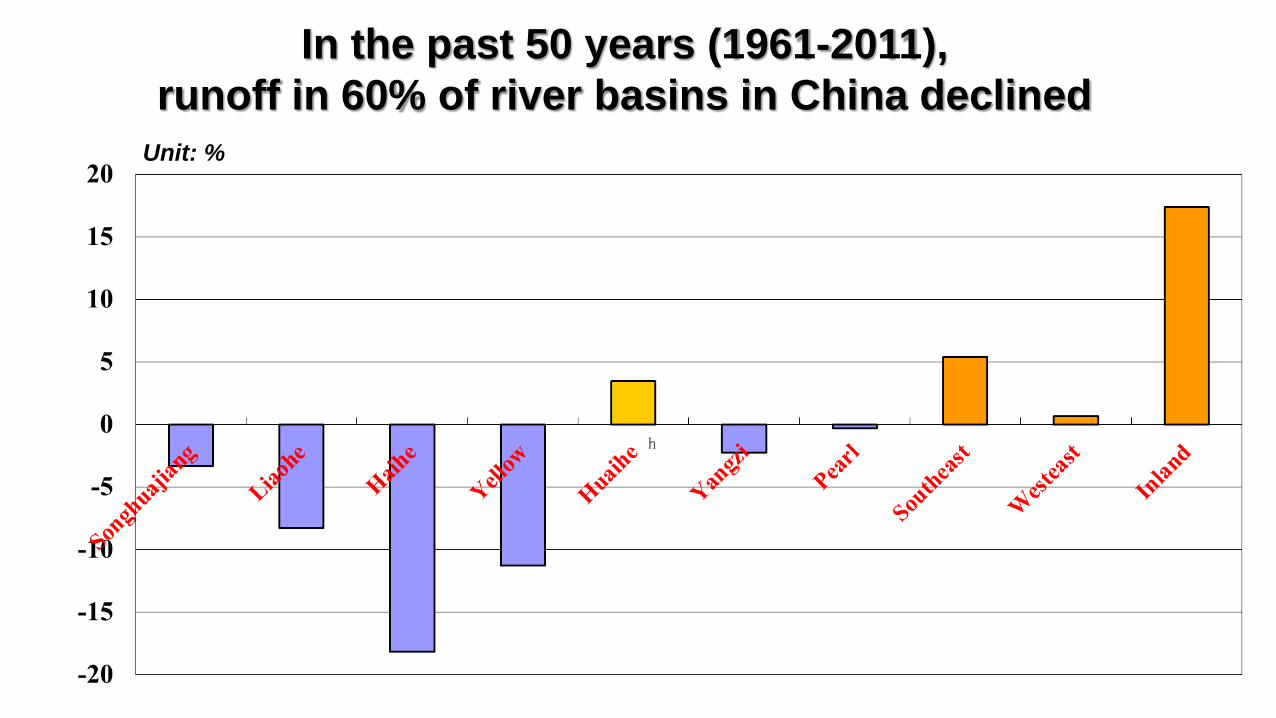
In the past 50 years (1961-2011),
runoff in 60% of river basins in China declined
Unit: %

Expansion of groundwater irrigation in Northern China
Share of groundwater irrigated area (%)
Wang et al., IJWRD, 2009
The share of groundwater irrigation reached 58% (Jiangxi, Guangdong and Yunnan
Provinces); Groundwater extraction in China increased from less than 10 km3 in
1950 to over 112 km3 in 2014 , increasing by more than 11 times.

Groundwater overdraft in China
→Since the late 1990s, groundwater overdraft has become
one of China’s most serious natural resource problems
→Presently, there are 400 regions whose groundwater
overdraft exceeds their sustainable capacity, and the total
area of these regions is 11% of plain areas in China
→In the Hai river basin, 91% of the plain areas belong to
overdraft regions
→Over-drafting groundwater has caused declines in
groundwater tables, land subsidence, the intrusion of
seawater into fresh water aquifers, and desertification

Change in Average Water Level 1995-2004 2004-2016
Increased : 16% 25%
→No Change: 18% 52% 3% 37%
→Decreased < 0.25 m/year : 17% 9%
→Decreasing 0.25 to 1.5 m/year : 40% 25%
→Decreasing > 1.5 m/year : 8% 48% 38% 63%
52%
Groundwater tables are falling, with variations across time
and space in Northern China (share of villages)
Based on large field survey in 400 villages in 6 provinces in Northern China (Hebei, Henan, Shanxi,
Shaanxi, Liaoning and Inner Mongolia provinces, 2004 and 2016

Government policies on managing groundwater
2004 2016
→Wells drilled by permit only
→Regulation on pump spacing
→Water extraction fee
→Moving towards pricing policies
Less than 5% of villages 22%
Less than 7% of villages 20%
Zero Zero
Not very fast Not very fast
Based on large field survey in 400 villages in 6 provinces in Northern China (Hebei, Henan, Shanxi,
Shaanxi, Liaoning and Inner Mongolia provinces, 2004 and 2016
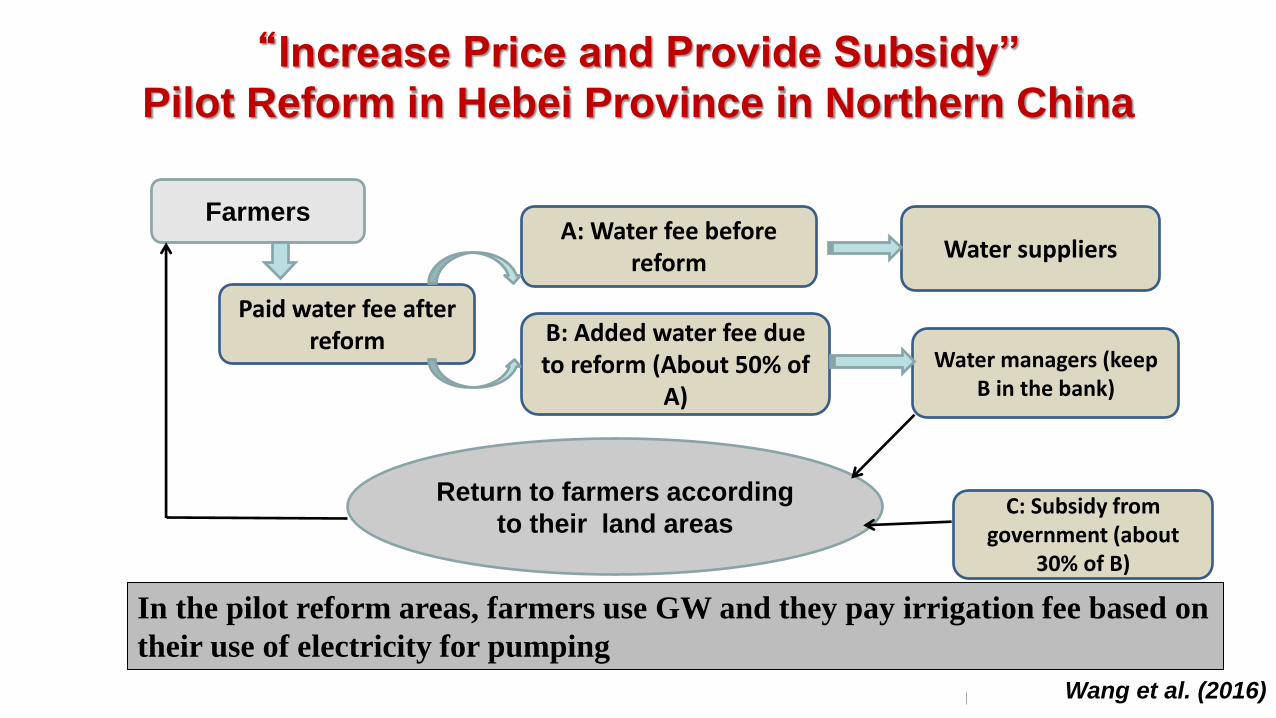
“Increase Price and Provide Subsidy”
Pilot Reform in Hebei Province in Northern China
Farmers A: Water fee before
reform
B: Added water fee due to reform (About 50% of
A)
Paid water fee after reform
Water suppliers
Water managers (keep B in the bank)
C: Subsidy from government (about
30% of B)
Return to farmers according
to their land areas
In the pilot reform areas, farmers use GW and they pay irrigation fee based on
their use of electricity for pumping
Wang et al. (2016)
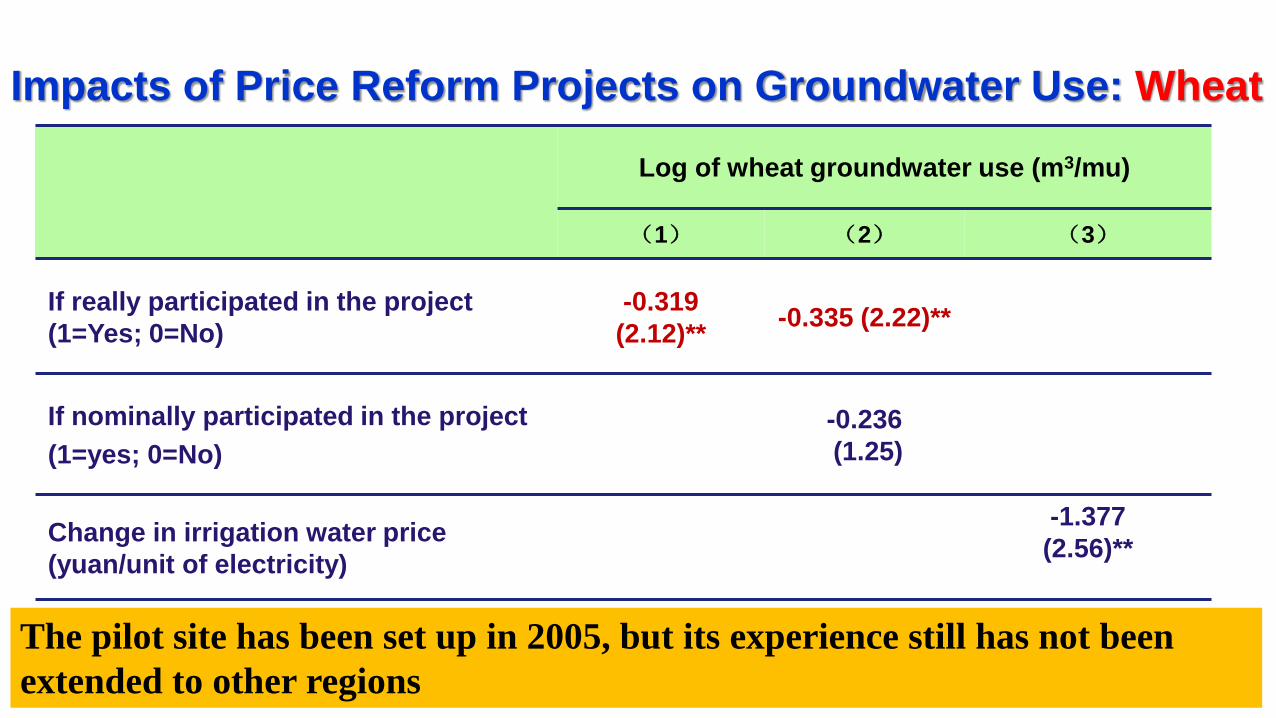
Impacts of Price Reform Projects on Groundwater Use: Wheat
Log of wheat groundwater use (m3/mu)
(1) (2) (3)
If really participated in the project
(1=Yes; 0=No)
-0.319
(2.12)** -0.335 (2.22)**
If nominally participated in the project
(1=yes; 0=No)
-0.236
(1.25)
Change in irrigation water price
(yuan/unit of electricity)
-1.377
(2.56)**
The pilot site has been set up in 2005, but its experience still has not been
extended to other regions
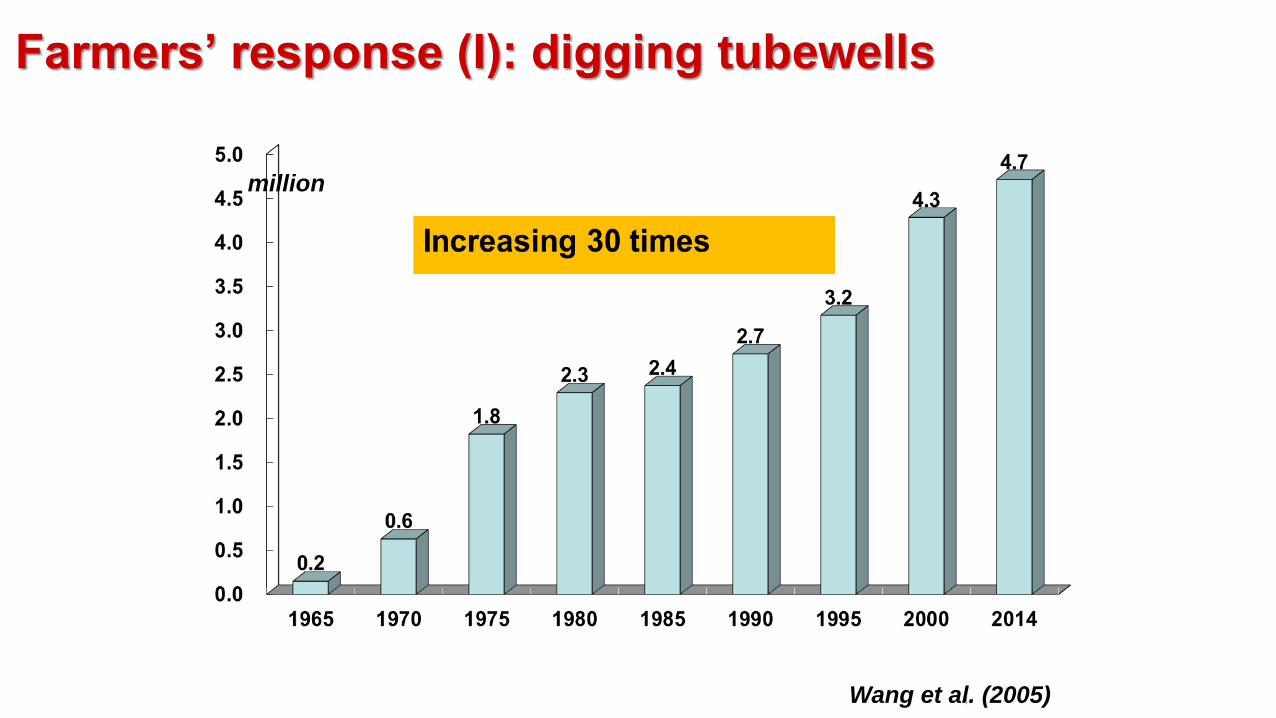
Farmers’ response (I): digging tubewells
million
Wang et al. (2005)
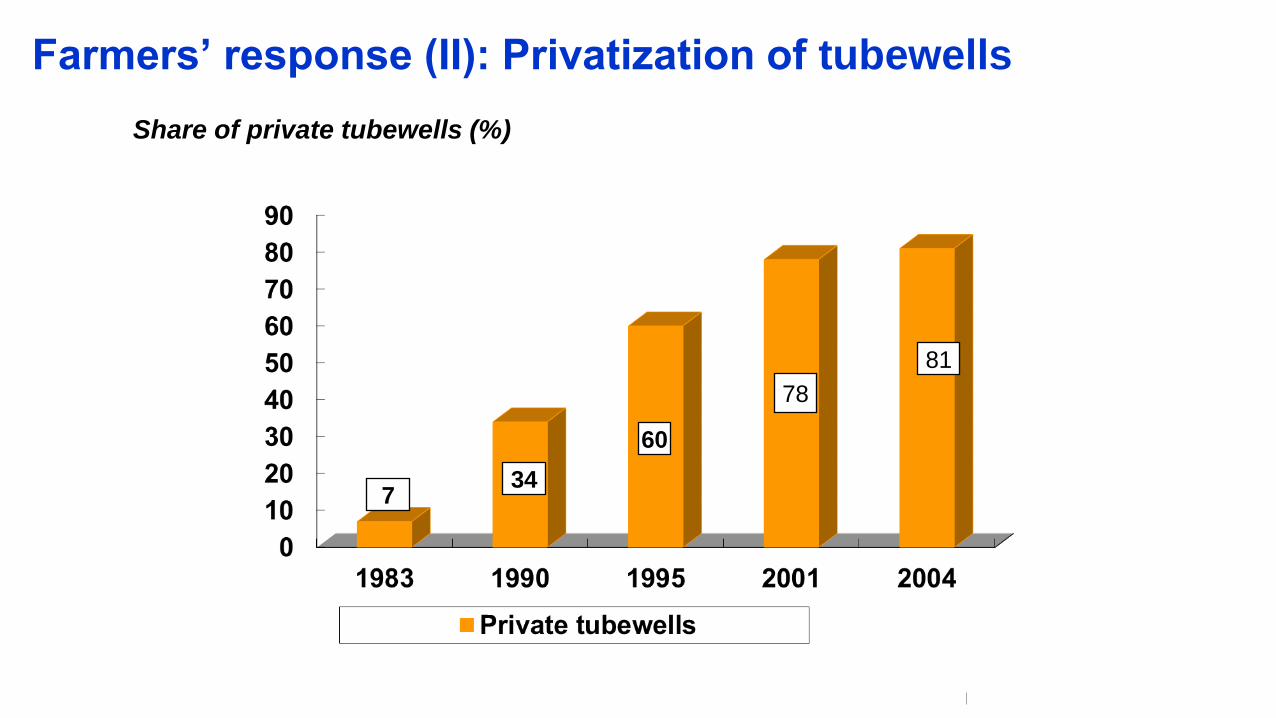
Farmers’ response (II): Privatization of tubewells
Share of private tubewells (%)
34
60
78
81
7

Impact of tubewell privatization on agricultural production, farmer incomes and groundwater tables
Share of sown areas Crop yield Per
capita
income
GW
Table Wheat Maize Cotton Other cash
crops
Wheat
Maize
Private
tubewell
(%)
Coe. -3.0 2.8 0.10 0.06 182 -7.1 6.8 0.02
t value
2.23** 1.83* 4.27** 2.39** 1.05 0.03 2.98*** 7.19***
Dependent
variables
- Improve the adjustment of cropping structure, increase farmers’ income but accelerate the
decline of GW table
- Policy makers need to consider a set of new complementary policies that can restrict
groundwater use and also provide incentive to farmers for sustainable water use
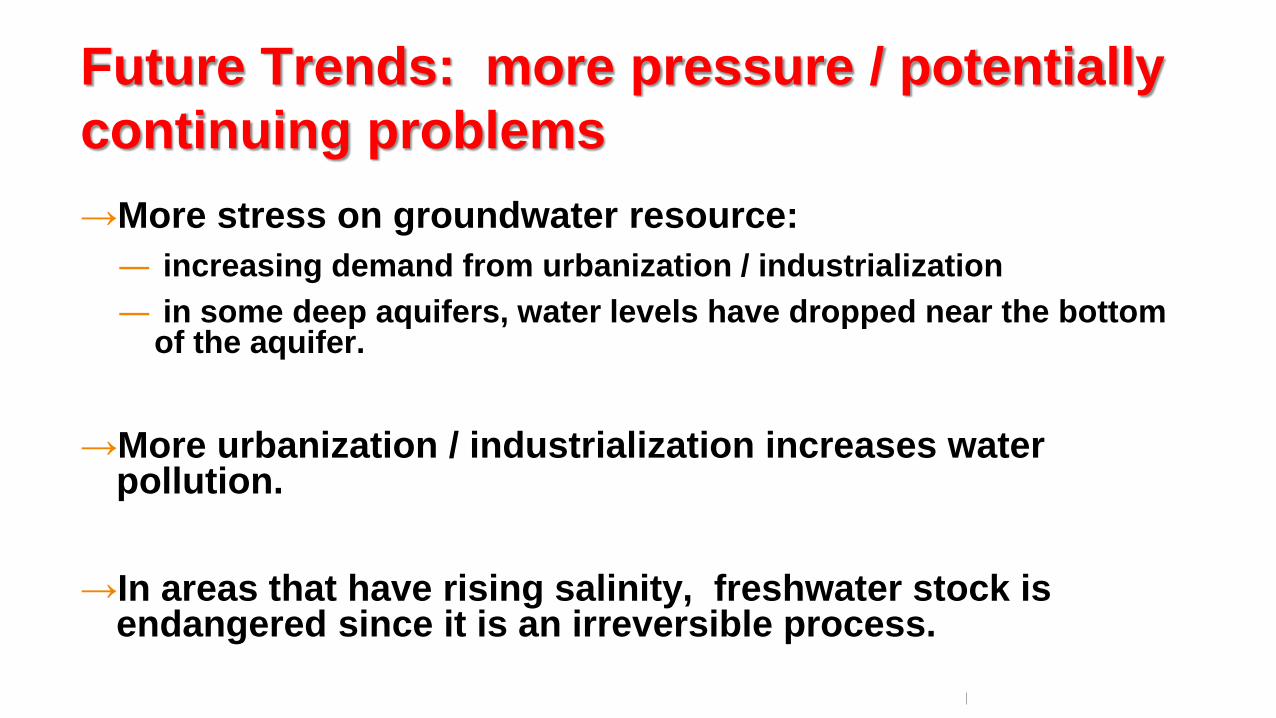
Future Trends: more pressure / potentially
continuing problems
→More stress on groundwater resource:
― increasing demand from urbanization / industrialization
― in some deep aquifers, water levels have dropped near the bottom of the aquifer.
→More urbanization / industrialization increases water pollution.
→In areas that have rising salinity, freshwater stock is endangered since it is an irreversible process.

Deterioration of groundwater quality
→Based on monitoring data for 778 tubewells in 2006,
groundwater in 61% was polluted and not suitable for
drinking
→In 2015, the number of monitored tubewells expanded to
2,013, and the share of tubewells whose groundwater was
polluted was even higher, reaching 80%
→This indicates that controlling groundwater has not
attracted enough attention from the government, and the
pollution status continuously deteriorates.

Dealing with growing water scarcity: Implementation of Water
demand management strategy: “Three red line” policy
→Control total water use
→Increase water use efficiency
→Control water pollution
How to implement in rural areas?
Control withdrawal or consumption?
How to realize real water saving?
5. GROUNDWATER USE IN INDIA AND SUB-
SAHARAN AFRICA: OPPORTUNITIES,
CHALLENGES, SOLUTIONS AND OUTLOOK
Dr. Claudia Ringler International Food Policy
Research Institute (IFPRI)
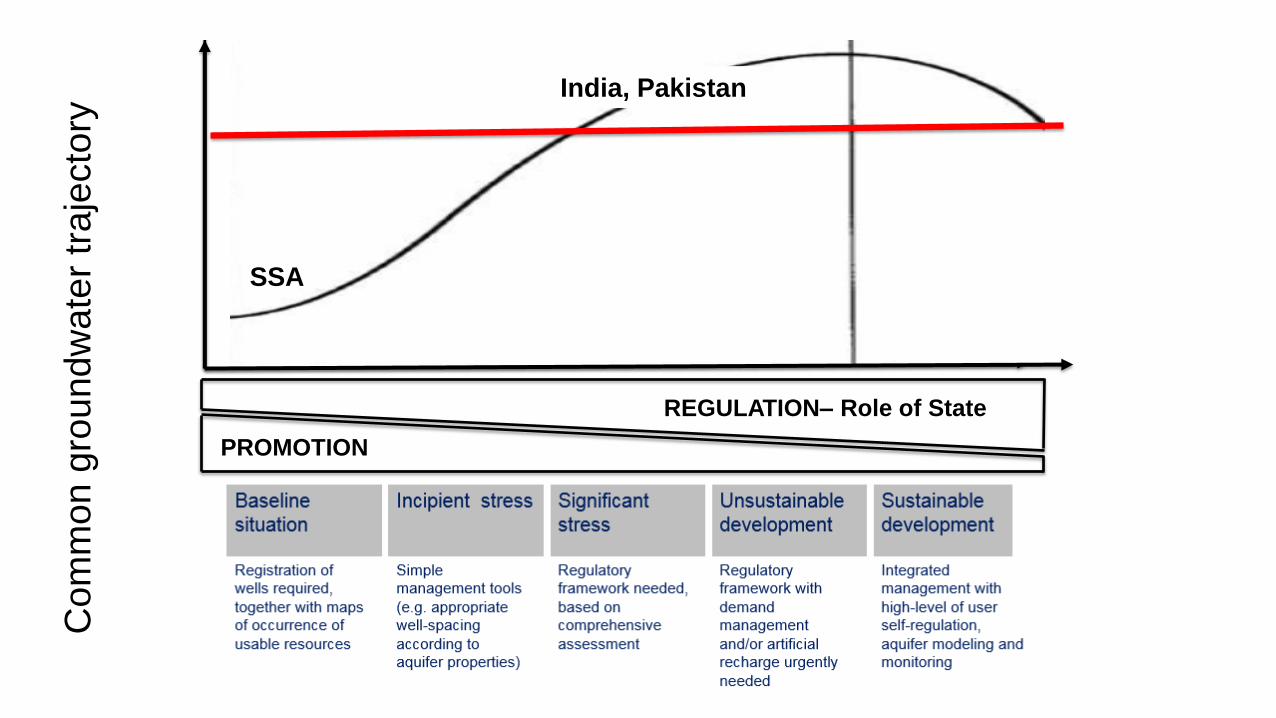
Com
mon
gro
und
wate
r tr
aje
cto
ry
REGULATION– Role of State
PROMOTION
SSA
India, Pakistan
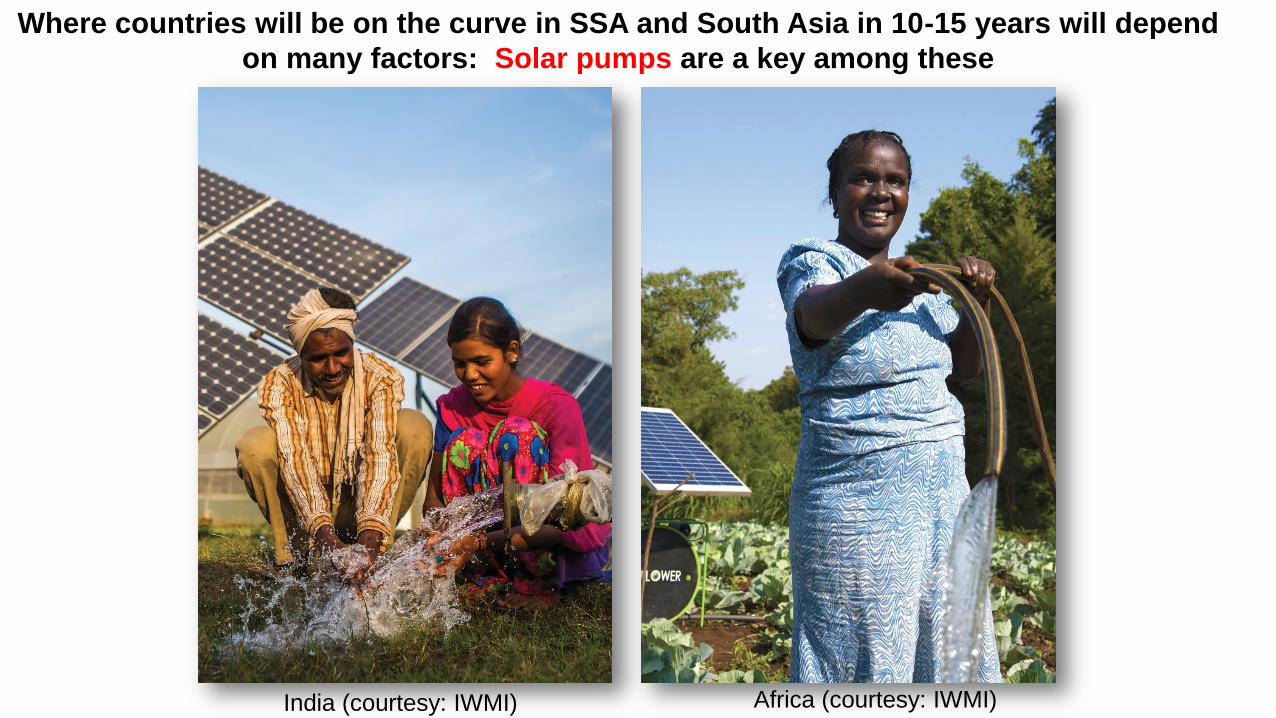
Where countries will be on the curve in SSA and South Asia in 10-15 years will depend
on many factors: Solar pumps are a key among these
India (courtesy: IWMI) Africa (courtesy: IWMI)
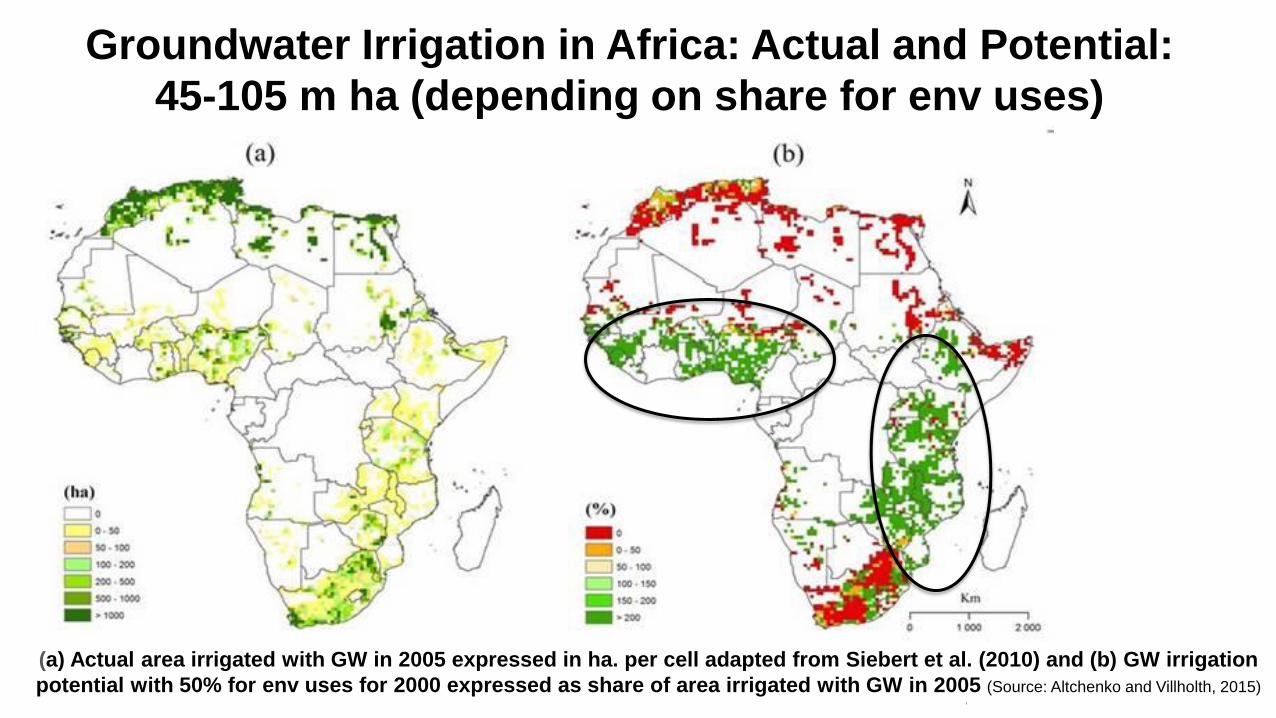
Groundwater Irrigation in Africa: Actual and Potential:
45-105 m ha (depending on share for env uses)
(a) Actual area irrigated with GW in 2005 expressed in ha. per cell adapted from Siebert et al. (2010) and (b) GW irrigation
potential with 50% for env uses for 2000 expressed as share of area irrigated with GW in 2005 (Source: Altchenko and Villholth, 2015)
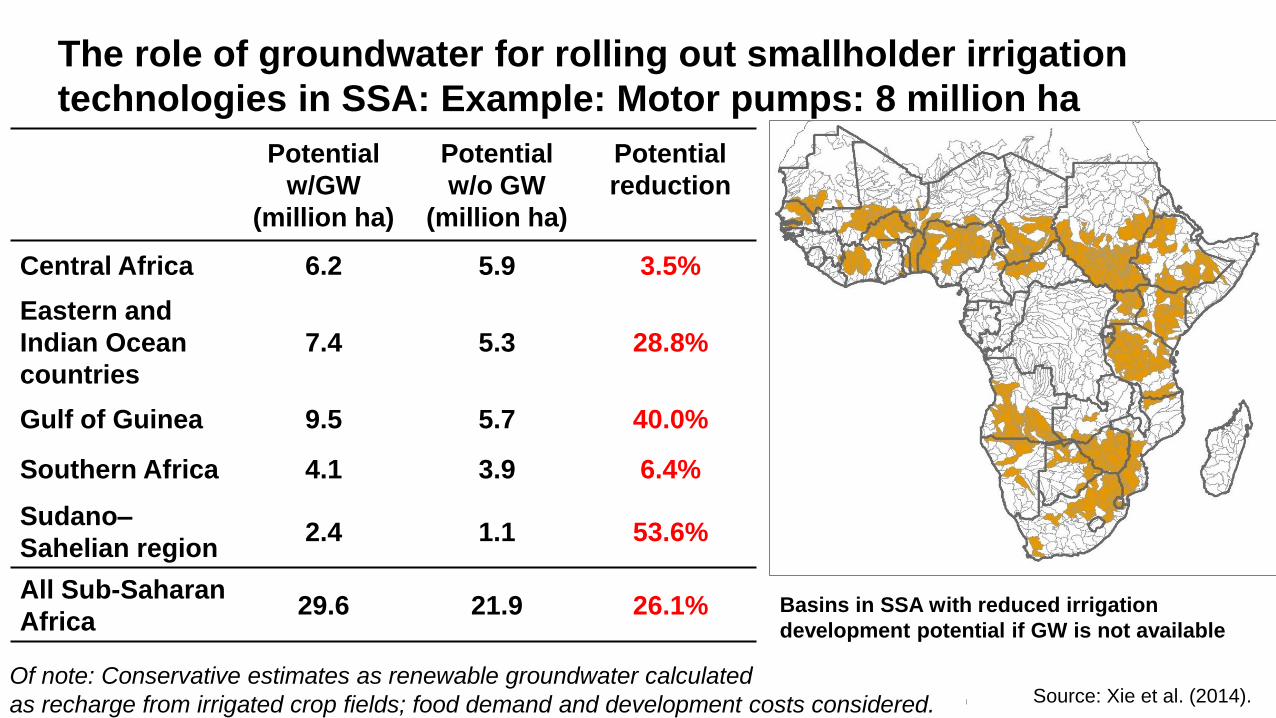
The role of groundwater for rolling out smallholder irrigation
technologies in SSA: Example: Motor pumps: 8 million ha
Potential
w/GW
(million ha)
Potential
w/o GW
(million ha)
Potential
reduction
Central Africa 6.2 5.9 3.5%
Eastern and
Indian Ocean
countries
7.4 5.3 28.8%
Gulf of Guinea 9.5 5.7 40.0%
Southern Africa 4.1 3.9 6.4%
Sudano–
Sahelian region 2.4 1.1 53.6%
All Sub-Saharan
Africa 29.6 21.9 26.1% Basins in SSA with reduced irrigation
development potential if GW is not available
Source: Xie et al. (2014).
Of note: Conservative estimates as renewable groundwater calculated
as recharge from irrigated crop fields; food demand and development costs considered.

Courtesy: IWMI Flickr
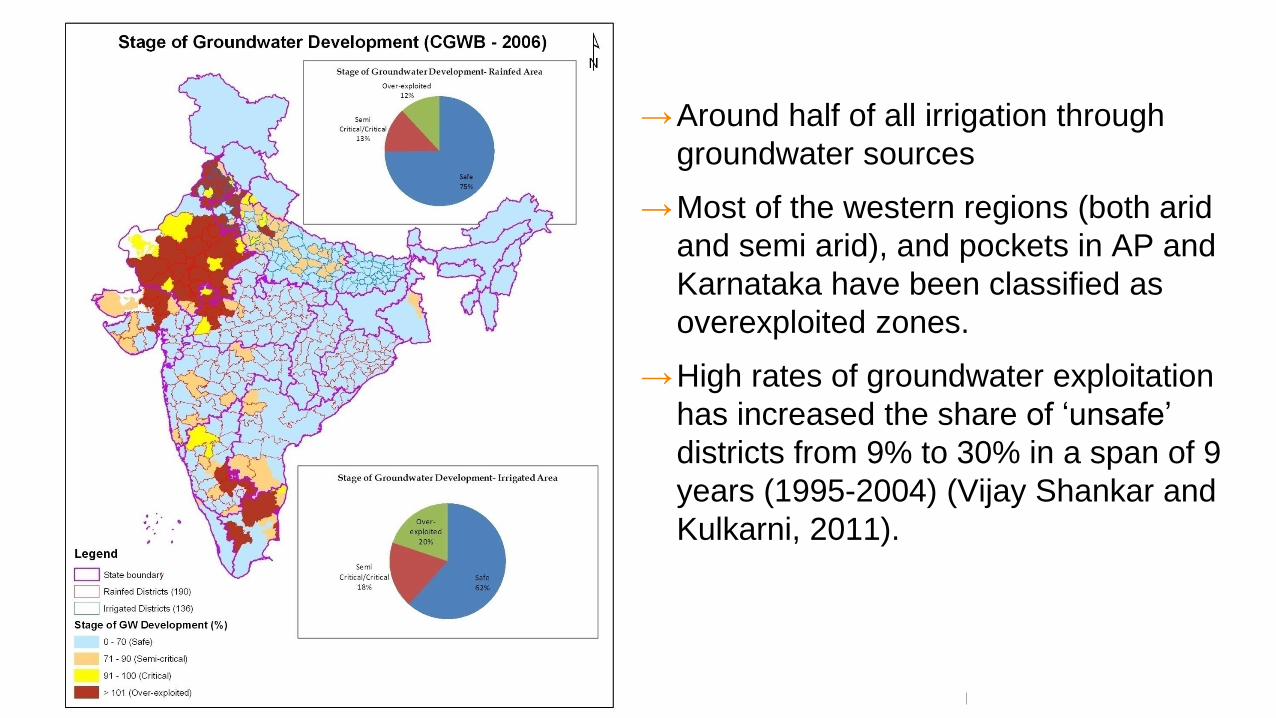
→Around half of all irrigation through
groundwater sources
→Most of the western regions (both arid
and semi arid), and pockets in AP and
Karnataka have been classified as
overexploited zones.
→High rates of groundwater exploitation
has increased the share of ‘unsafe’
districts from 9% to 30% in a span of 9
years (1995-2004) (Vijay Shankar and
Kulkarni, 2011).
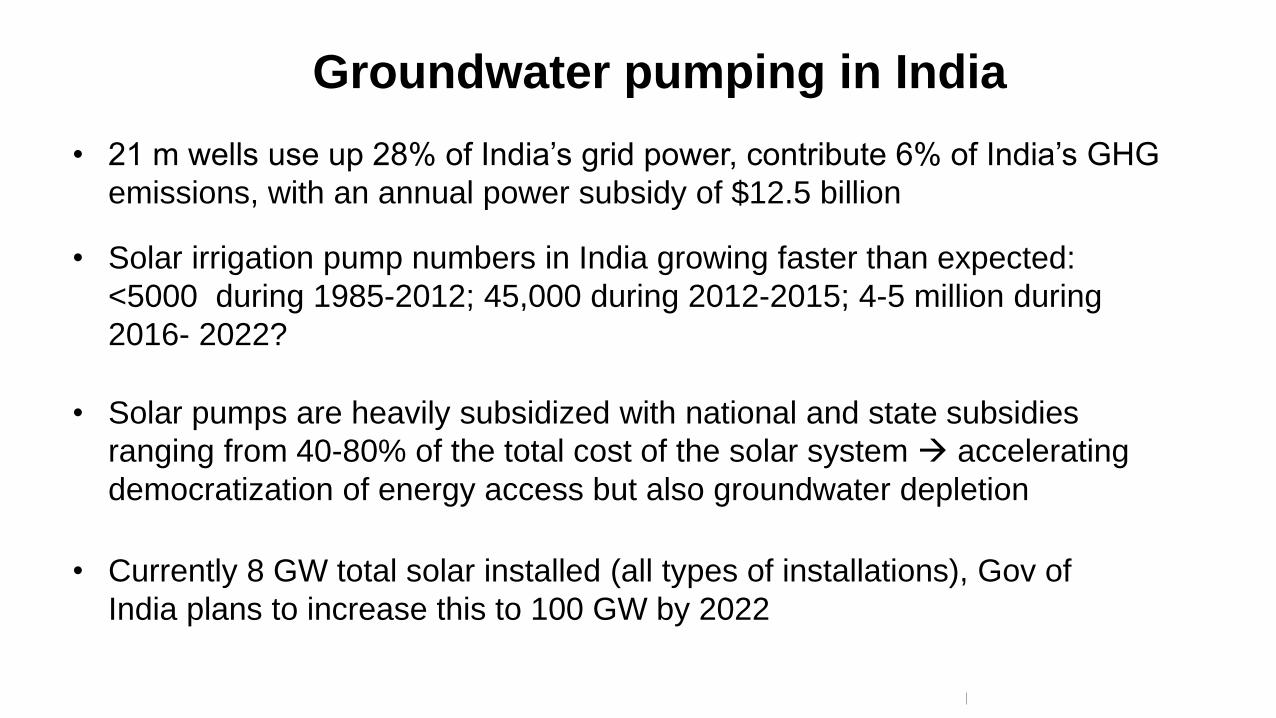
Groundwater pumping in India
• Solar irrigation pump numbers in India growing faster than expected:
<5000 during 1985-2012; 45,000 during 2012-2015; 4-5 million during
2016- 2022?
• 21 m wells use up 28% of India’s grid power, contribute 6% of India’s GHG
emissions, with an annual power subsidy of $12.5 billion
• Solar pumps are heavily subsidized with national and state subsidies
ranging from 40-80% of the total cost of the solar system accelerating
democratization of energy access but also groundwater depletion
• Currently 8 GW total solar installed (all types of installations), Gov of
India plans to increase this to 100 GW by 2022
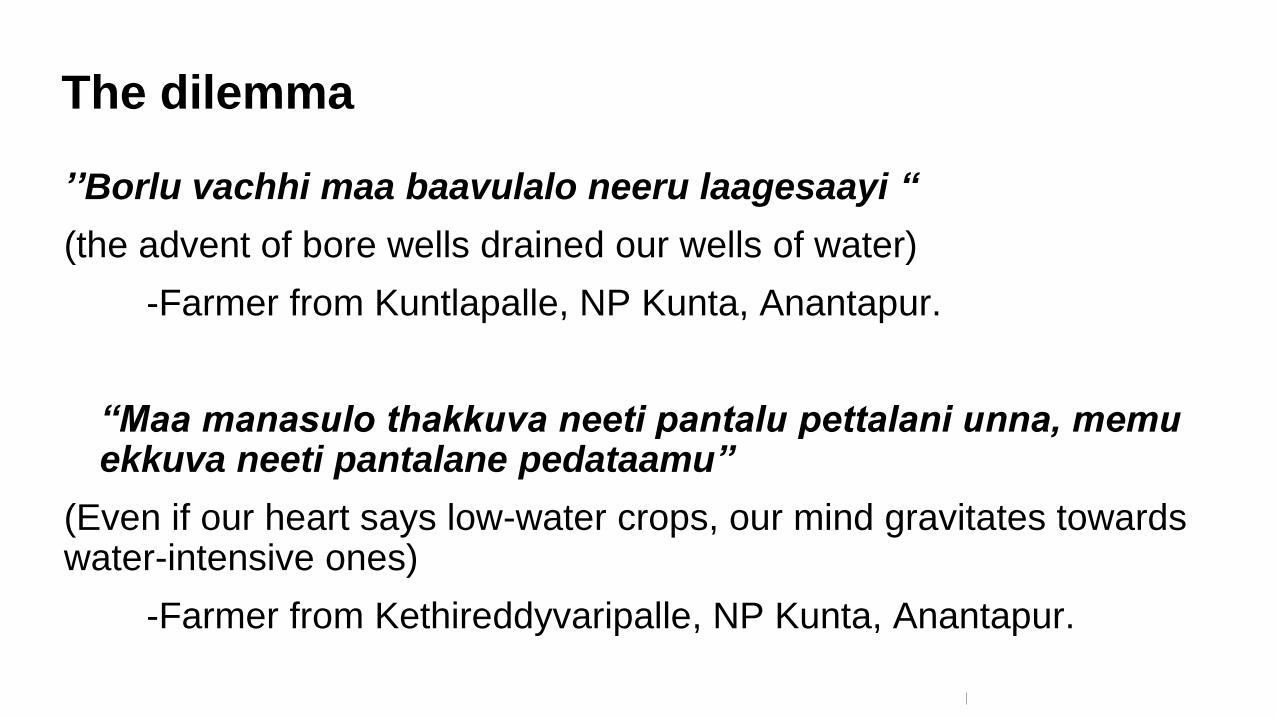
The dilemma
’’Borlu vachhi maa baavulalo neeru laagesaayi “
(the advent of bore wells drained our wells of water)
-Farmer from Kuntlapalle, NP Kunta, Anantapur.
“Maa manasulo thakkuva neeti pantalu pettalani unna, memu ekkuva neeti pantalane pedataamu”
(Even if our heart says low-water crops, our mind gravitates towards water-intensive ones)
-Farmer from Kethireddyvaripalle, NP Kunta, Anantapur.
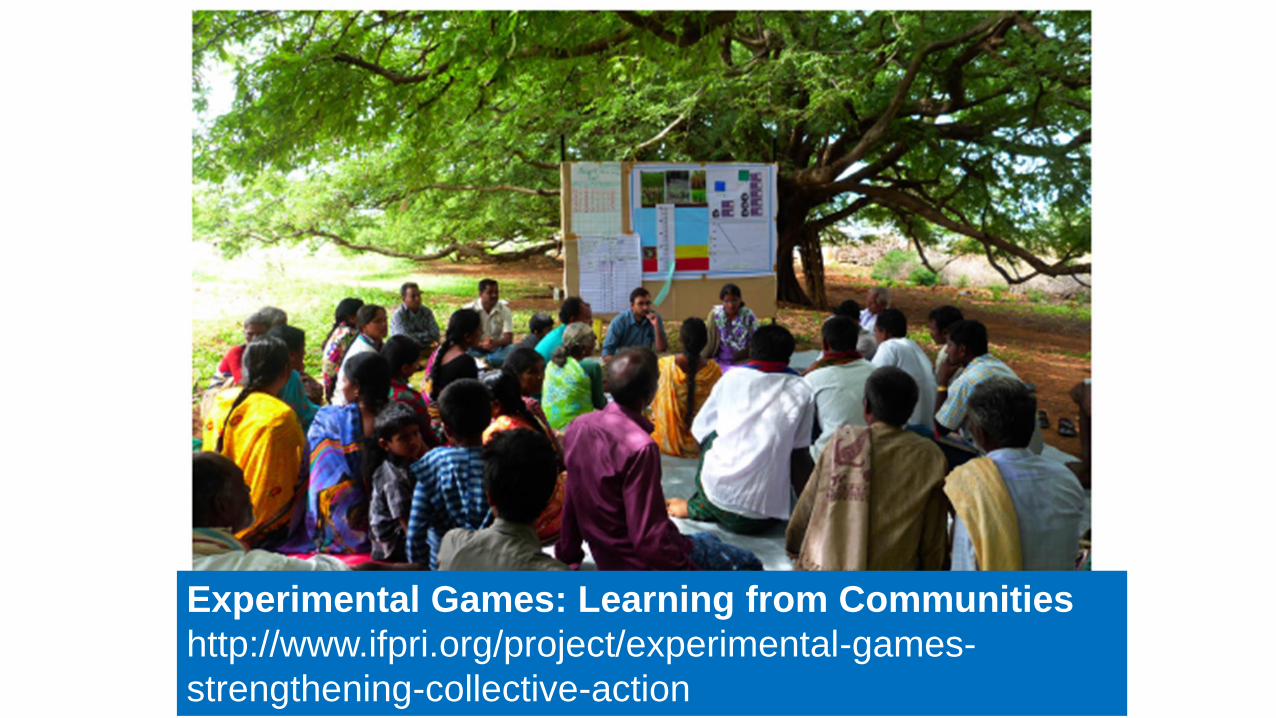
Experimental Games: Learning from Communities
http://www.ifpri.org/project/experimental-games-
strengthening-collective-action
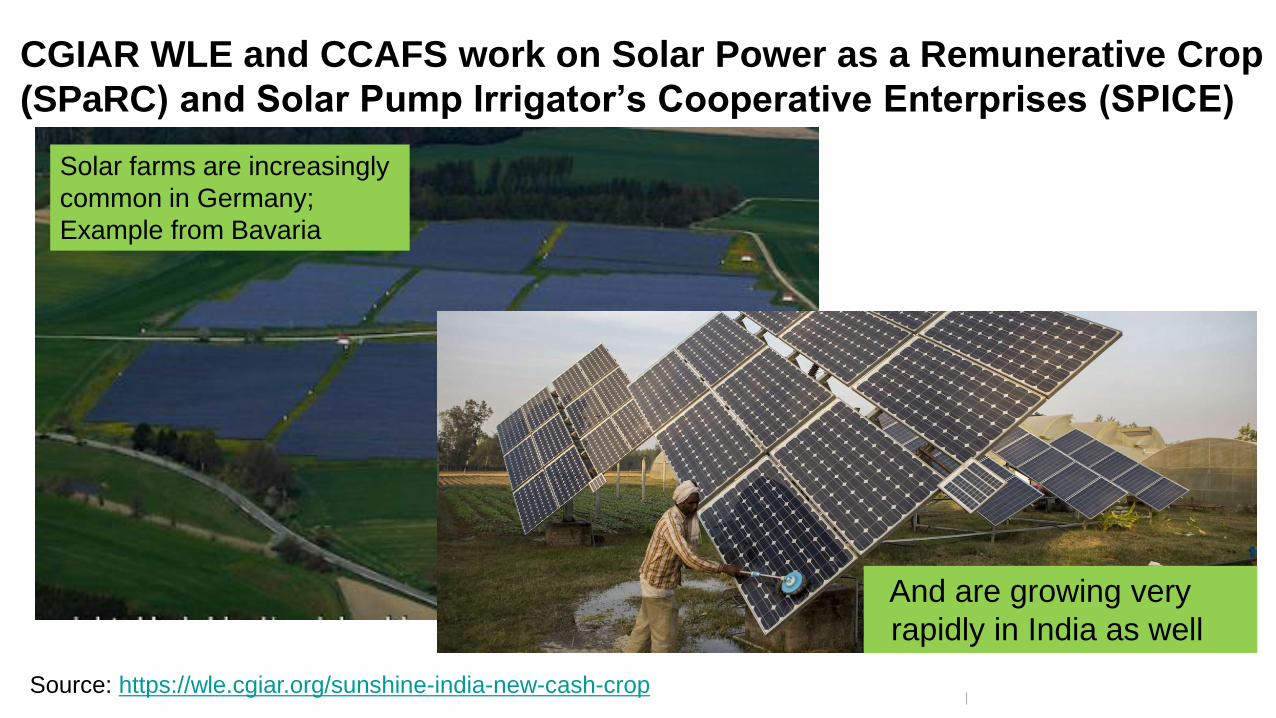
CGIAR WLE and CCAFS work on Solar Power as a Remunerative Crop
(SPaRC) and Solar Pump Irrigator’s Cooperative Enterprises (SPICE)
Source: https://wle.cgiar.org/sunshine-india-new-cash-crop
And are growing very
rapidly in India as well
Solar farms are increasingly
common in Germany;
Example from Bavaria

References (1/3)
→ Altchenko, Y. and K.G. Villholth (2015), Mapping irrigation potential from renewable groundwater in Africa – a quantitative hydrological approach,
Hydrology and Earth System Sciences, Vol. 19, N. 2, pp. 1055-1067. doi:10.5194/hess-19-1055-2015.
→ Closas, A. and K.G. Villholth (2016), “Aquifer Contracts - A Means to Solving Groundwater Over-exploitation in Morocco?”, Colombo, Sri Lanka:
International Water Management Institute (IWMI). 20p. (Groundwater Solutions Initiative for Policy and Practice (GRIPP) Case Study Series 01).
doi: 10.5337/2016.211.
→ Cooley, H., M. Cohen, R. Phuraisamban, and G. Gruere (2016), “Water risk hotspots for agriculture: The case of the southwest United States”,
OECD Food, Agriculture and Fisheries Papers, No. 96, OECD Publishing, Paris. DOI: http://dx.doi.org/10.1787/5jlr3bx95v48-en
→ Döll, P., Müller Schmied, H., Schuh, C., Portmann, F., and A. Eicker (2014), Global-scale assessment of groundwater depletion and related
groundwater abstractions: Combining hydrological modeling with information from well observations and GRACE satellites, Water Resources
Research, Vol. 50, pp. 5698–5720, doi: 10.1002/2014WR015595.
→ Döll, P., Hoffmann-Dobrev, H., Portmann, F.T., Siebert, S., Eicker, A., Rodell, M., Strassberg, G., and B. Scanlon (2012), Impact of water
withdrawals from groundwater and surface water on continental water storage variations, J. Geodynamics , Vol. 59-60, pp. 143-156.
doi:10.1016/j.jog.2011.05.001.
→ Döll, P. and K. Fiedler (2008), Global-scale modeling of groundwater recharge, Hydrological Earth System Sciences, Vol. 12,pp. 863-885
→ Foster, S., G. Tyson, L. Konikow, E. Custodio, K. Villholth, J. van der Gun, and R. Klingbeil (2015), “Food Security and Groundwater”, International
Association of Hydrogeologists, Strategic Overview Series.6 pp, https://iah.org/?taxonomy=resource-category&term=iah-strategic-overview-series
→ Giordano, M. and K.G. Villholth (eds.) (2007), The Agricultural Groundwater Revolution: Opportunities and Threats to Development, CABI, in
association with IWMI. 419 pp. ISBN-13: 978 1 84593 172 8.
→ Margat, J. and J. van der Gun (2013), Groundwater around the World: A Geographic Synopsis, CRC Press, Taylor and Francis, London.

References (2/3)
→ Meinzen-Dick, R., Chaturvedi, R., Domenech, L., Ghate, R., Janssen, M.A., Rollins, N, and K. Sandeep (2014), “Games for Groundwater
Governance: Field Experiments in Andhra Pradesh”, CSID Working Paper Series, CSID-2014-006, India.
https://csid.asu.edu/sites/csid.asu.edu/files/csid_wp_2014-006.pdf
→ OECD (2015), Drying wells, rising stakes: Towards sustainable groundwater use in agriculture, OECD Studies on Water, OECD Publishing, Paris.
http://dx.doi.org/10.1787/9789264238701-en
→ Shah, T., J.J. Burke, and K.G. Villholth (2007), Groundwater: a global assessment of scale and significance, in D. Molden (Ed.), Water for Food,
Water for Life. Comprehensive Assessment of Water Management in Agriculture Synthesis Report. Earthscan. ISBN: 978-1-84407-396-2.
→ Villholth, K.G. (2013), Groundwater irrigation for smallholders in Sub-Saharan Africa – a synthesis of current knowledge to guide sustainable
outcomes, Water International, Vol. 38, N. 4, pp. 369–391, DOI: 10.1080/02508060.2013.821644 (received a Best Paper of the Year Award by
IWRA in 2014).
→ Villholth, K.G., A. Sood, N. Liyanage, and T. Zhu (2017),The role of groundwater and depleting aquifers in global irrigated food production, Nature
Communications (In revision).
→ Wang, J., Li, Y., Huang, J., Yan T. and T. Sun (2017), Growing Water Scarcity, Food Security and Government Responses in China, Global Food
Security, 10..1016/j.gfs.2017.01.003
→ Wang, J., Zhang, L. and J. Huang (2016), How could we realize a win–win strategy on irrigation price policy? Evaluation of a pilot reform project in
Hebei Province, China, Journal of Hydrology, Vol. 539, pp. 379-391; doi:10.1016/j.jhydrol.2016.05.036
→ Wang, J., Huang, J., Huang, Q. and S. Rozelle (2009), The Evolution of China’s Groundwater Governance: Productivity, Equity and the
Environment, Quarterly Journal of Engineering Geology and Hydrogeology, Vol. 42, pp. 267–280.
→ Wang, J., Huang, J., Rozelle, S., Huang, Q, and L. Zhang (2009), Understanding the Water Crisis in Northern China: What Government and
Farmers are Doing?, Water Resources Development, Vol. 25, N. 1,pp. 141–158.
References (3/3)
→ Wang, J., Huang, J., Rozelle, S., Huang, Q. and A. Blanke (2007), Agriculture and Groundwater Development in Northern China: Trends, Institutional
Responses, and Policy Options, Water Policy, Vol. 9, N. S1, pp. 61–74.
→ Wang, J., Huang, J., Huang, Q. and S. Rozelle (2006), Privatization of Tubewells in North China: Determinants and Impacts on Irrigated Area,
Productivity and the Water Table, Hydrogeology Journal, Vol. 14, pp. 275-285.
→ Wang, J., Huang, J. and S. Rozelle (2005), Evolution of Tubewell Ownership and Production in the North China Plain, Australian Journal of Agricultural
and Resource Economics, Vol, 49, N. 2, pp. 177-195.
→ Xie, H., L. You, B. Wielgosz and C. Ringler (2014), Estimating the potential for expanding smallholder irrigation in Sub-Saharan Africa, Agricultural
Water Management, Vol. 131, N.1, pp. 183–193.10.1016/j.agwat.2013.08.011.
Additional resources on agricultural groundwater use in India :
→ https://wle.cgiar.org/sunshine-india-new-cash-crop ;
→ http://www.iwmi.cgiar.org/iwmi-tata/PDFs/iwmi-tata_water_policy_research_highlight-issue_10_2016.pdf?galog=no ;
→ https://wle.cgiar.org/research/annual-report/2015/sustainably-using-the-hidden-water-below-our-feet-for-food-and-prosperity ;
→ http://www.ifpri.org/project/experimental-games-strengthening-collective-action
Additional resources on agricultural groundwater use in Sub-Saharan Africa:
→ https://ilssi.tamu.edu/
→ https://wle.cgiar.org/research/annual-report/2015/ensuring-womens-access-to-irrigation-for-food-security