agricultural management effects on soil microbial dynamic under peanut cropping systems in semi
TRANSCRIPT
Agricultural Management Effects on Soil Microbial Dynamic Under Peanut Cropping Systems in Semi-Arid Soil
By
Brandon Melester, B.S.
A Thesis In
MICROBIOLOGY
Submitted to the Graduate Faculty of Texas Tech University in
Partial Fulfillment of the Requirements for
the Degree of
MASTER OF SCIENCE
Approved
Dr. John C. Zak Chair of Committee
Dr. Veronica Acosta-Martinez
Dr. Michael San Francisco
Dr. Fred Hartmeister Dean of the Graduate School
August, 2010

Copyright 2010, Brandon Melester

Texas Tech University, Brandon Melester, August 2010
ii
TABLE OF CONTENTS
ABSTRACT .......................................................................................................................... iv
LIST OF TABLES ............................................................................................................... vi
LIST OF FIGURES ............................................................................................................ vii
I. INTRODUCTION TO MICROBIAL DYNAMICS, MICROBIAL EVALUATION AND AGRICULTURAL PRACTICES .......................................... 1
Introduction ......................................................................................................................... 1 Arbuscular Mycorrhiza ................................................................................................. 1
Microbial Communities ................................................................................................ 4
Microbial Biomass ........................................................................................................ 5 FAME ........................................................................................................................... 5 Soil Enzymes ................................................................................................................ 6 Tillage ........................................................................................................................... 7 Objectives and Hypothesis ............................................................................................ 8 References ......................................................................................................................... 11
II. EFFECTS OF MANAGEMENT PRACTICES IN A SEMI-ARID AGROECOSYSTEM ON SOIL MICROBIAL BIOMASS AND MICROBIAL COMPOSITION ...................................................................................................... 16
Introduction ....................................................................................................................... 16 Methods............................................................................................................................. 18
Plot Design ........................................................................................................................................ 18 Crop Management Treatments .................................................................................... 20 Sampling ..................................................................................................................... 20 Microbial Biomass Carbon ......................................................................................... 20 Microbial Community Structure ................................................................................. 21 Data Analysis .............................................................................................................. 22

Texas Tech University, Brandon Melester, August 2010
iii
Results ............................................................................................................................... 23 Effects of Tillage on MBC .......................................................................................... 23 Effects of Irrigation on MBC ...................................................................................... 23 Effects of Nitrogen on MBC ....................................................................................... 24 Changes in field conditions ......................................................................................... 24 Influences between MBC, nutrients, and enzymatic activities .......................................... 25 Temporal changes in MBC ......................................................................................... 25 FAME ......................................................................................................................... 26 Discussion ......................................................................................................................... 28
Nitrogen ...................................................................................................................... 28 Tillage ......................................................................................................................... 29 Irrigation ..................................................................................................................... 30 Soil characteristics and seasonal variation .................................................................. 30 References ......................................................................................................................... 32
III. EFFECTS OF MANAGEMENT PRACTICES IN A SEMI-ARID AGROECOSYSTEM ON SOIL MICROBIAL ENZYMATIC ACTIVITY ........................................................................................................ 50
Introduction ....................................................................................................................... 50 Methods............................................................................................................................. 54
Plot Design ........................................................................................................................................ 54 Crop Management Treatments .................................................................................... 56 Sampling ..................................................................................................................... 56 Enzyme Assays ........................................................................................................... 57 Data Analysis .............................................................................................................. 57 Results ............................................................................................................................... 58
Effect of Irrigation ...................................................................................................... 58 Effects of Nitrogen ...................................................................................................... 60 Tillage Effects ............................................................................................................ 62 Combined enzymatic and nutrient effect .................................................................... 64 Effect of nutrients ....................................................................................................... 65 Correlations between enzyme activity levels .............................................................. 65 Changes in key nutrient levels .................................................................................... 65 Discussion ......................................................................................................................... 67
Effects of Irrigation ..................................................................................................... 67 Response to nitrogen application ................................................................................ 68 Response to tillage type .............................................................................................. 69 Influence of nutrient and other enzymes ..................................................................... 70 Conclusion ........................................................................................................................ 70 References ......................................................................................................................... 73
Texas Tech University, Brandon Melester, August 2010
iv
ABSTRACT
Recent agricultural practices have been shifting towards low-input sustainable
systems as it’s becoming more evident that the cost and negative side effects associated
with current agricultural practices are becoming increasingly too great. As much of our
current agriculture occurs in semi-arid regions of the United States increasing attention is
being focused on management practices that decrease water consumption along with
decreasing overall energy inputs.
West Texas produces more peanuts than any other area of the Unite States outside
of Georgia. Currently, over 320,000 tons are produced annually in the south plains. In
order to improve those numbers without increasing input, it will be imperative to
understand how agricultural management affects soil quality and microbial dynamics.
The soil microbial biota has tremendous influence on the overall soil quality. Soil quality
and the sustainability of agroecosystems are greatly reliant on the activity and diversity of
the soil microbial community and the processes they facilitate. Understanding the
interactions between management practices and the soil microbiota will be a key
component in developing the best system to maximize crop productivity while decreasing
soil inputs.
The effects of tillage, nitrogen, and irrigation management within a peanut
cropping system in West Texas were examined over a two year study to determine the
effects they had on structural and functional microbial dynamics. Microbial Biomass
Carbon and Fatty Acid methyl Ester analysis were used to examine how these
managements practices affected the soil microbe structure and composition. Enzyme

Texas Tech University, Brandon Melester, August 2010
v
assays of phosphodiesterase, β-glucosaminidase, β-glucosidase, alkaline phosphatase, and
α-galactosidase were made over the two year period to determine the effect of
agricultural management on soil microbe functioning.
Tillage was not shown to have any effect on the structural or functional microbial
dynamics. It was concluded that strip-tillage would be ideal for these systems due to
lower cost and less disturbance while producing the same benefit. Full Irrigation
significantly increases β-glucosidase activity, bacterial abundance, and MBC. Irrigation
reductions were shown to produce “hangover effects” in which microbial activity,
biomass and abundance not only decreased during the irrigation reduction but were also
lower in subsequent seasons. Nitrogen had differential effects on microbial dynamics.
The results indicated that while there was no significant effect on microbial biomass
carbon, nitrogen addition did have differential effects on enzymatic activity. Reduction
in bacterial abundance was shown to be associated with nitrogen addition. These results
indicate that crop management decisions will have consequences that either maintain the
activity and diversity of the soil microbial community or alter composition and activity
such that great inputs of energy are needed to compensate for the loss of microbial
dynamics.

Texas Tech University, Brandon Melester, August 2010
vi
LIST OF TABLES
2.1. Correlation matrix comparing soil extractable nutrients to Microbial Biomass Carbon ......................................................................................................................... 35
2.2. Correlation matrix comparing soil extracellular enzymes to Microbial Biomass
Carbon ......................................................................................................................... 35
3.1. P-values for comparisons of the three different irrigation treatments effects on
soil extracellular enzyme activity ............................................................................. 76
3.2. Correlation matrix between interactions of soil enzymes and soil nutrients ............... 77
3.3. Correlation matrix between all extracellular soil enzymes effects on each other ........ 78
Texas Tech University, Brandon Melester, August 2010
vii
LIST OF FIGURES
2.1. Plot design of study site (2007) .................................................................................................... 36
2.2. The effect of strip tillage compared to conventional tillage on Microbial Biomass
Carbon (a) 2007-2008 (b) Seasons ............................................................................. 37
2.3. The effect of late season drought compared to full irrigation on Microbial Biomass
Carbon (a) 2007-2008 (b) Seasons ............................................................................ 38
2.4. The effect of all irrigation levels on Microbial Biomass Carbon
(a) 2008 (b) Seasons ................................................................................................... 39
2.5. The effect of nitrogen on Microbial Biomass Carbon
(a) 2007 (b) Seasons ................................................................................................... 40
2.6. Monthly changes in nutrient dynamics and microbial functionality
(a) Discriminate function analysis .............................................................................. 41
2.6. Monthly changes in nutrient dynamics and microbial functionality
(b) Vector correlations ................................................................................................ 42
2.7. Changes in Microbial Biomass Carbon across growing seasons 2007-2008
(a) Seasonal (b) Monthly (c) Extended Months ......................................................... 43
2.8. Relative bacterial and fungal abundances
(a) Seasonal totals for bacteria and fungi abundance (b) Seasonal Fungi:Bacteria ratio ............................................................................................................................. 44
2.9. Relative bacteria and fungi groups abundances
(a) Fungal groups (b) Bacterial groups ...................................................................... 45
2.10. Effects of nitrogen on relative bacteria abundances
(a) 2007 (b) Seasonal ................................................................................................. 46
2.11. Effects of nitrogen on relative fungi abundance
(a) 2007 (b) Seasonal ................................................................................................. 47
2.12. Effects of irrigation on relative Gram-positive bacteria abundance
(a) 2007-2008 (b) Seasonal ........................................................................................ 48
2.13. Effects of irrigation on relative Gram-negative bacteria abundance
(a) 2007-2008 (b) Seasonal ....................................................................................... 49

Texas Tech University, Brandon Melester, August 2010
viii
3.1. Study site (2007) ............................................................................................................................... 79
3.2. Effects of irrigation of phosphodiesterase activity
(a) 2007-2008 (b) Seasonal .......................................................................................................... 80
3.3. Effect of irrigation on β-glucosaminidase activity (a) 2007-2008 (b) Seasonal .................................................................................................................. 81
3.4. Effects of irrigation on β-glucosidase activity
(a) 2007-2008 (b) Seasonal .................................................................................................................. 82
3.5. Effects of irrigation on alkaline phosphatase activity
(a) 2007-2008 (b) Seasonal .......................................................................................................... 83
3.6. Effects of irrigation on α-galactosidase activity
(a) 2007-2008 (b) Seasonal ................................................................................................................... 84
3.7. Comparison of 3 irrigation levels on collective enzyme activity
(a) Discriminate function analysis (b) Vector correlations ................................................. 85
3.8. Discriminate function analysis on effect of nitrogen on collective enzyme activity ..... 86
3.9. Effect of nitrogen on phosphodiesterase activity
(a) 2007 (b) Seasonal ..................................................................................................................... 87
3.10. Effect of nitrogen on β-glucosaminidase activity
(a) 2007 (b) Seasonal ................................................................................................. 88
3.11. Effect of nitrogen on β-glucosidase activity
(a) 2007 (b) Seasonal ................................................................................................. 89
3.12. Effect of nitrogen on alkaline phosphatase activity
(a) 2007 (b) Seasonal ................................................................................................. 90
3.13. Effect of nitrogen on α-galactosidase activity
(a) 2007 (b) Seasonal ................................................................................................. 91
3.14. Seasonal nitrogen effect on collective enzyme activity
(a) Discriminate function analysis ............................................................................................... 92
3.14. Seasonal nitrogen effect on collective enzyme activity
(b) Vector correlations .................................................................................................................... 93

Texas Tech University, Brandon Melester, August 2010
ix
3.15. Effect of tillage on phosphodiesterase activity
(a) 2007-2008 (b) Seasonal .......................................................................................................... 94
3.16. Effect of tillage on β-glucosaminidase activity
(a) 2007-2008 (b) Seasonal ................................................................................................................... 95
3.17. Effect of tillage on β-glucosidase activity
(a) 2007-2008 (b) Seasonal ................................................................................................................... 96
3.18. Effect of tillage on alkaline phosphatase activity
(a) 2007-2008 (b) Seasonal .......................................................................................................... 97
3.19. Effect of tillage on α-galactosidase activity
(a) 2007-2008 (b) Seasonal ................................................................................................................... 98
3.20. Yearly tillage effect on collective enzyme activity and nutrient dynamics
(a) Discriminate function analysis ............................................................................................... 99
3.20. Yearly tillage effect on collective enzyme activity and nutrient dynamics
(b) Vector correlations .................................................................................................................. 100
3.21. Season variation in soil extractable nitrate .............................................................. 101
3.22. Seasonal variation in soil extractable ammonium ................................................. 102
3.23. Season variation in soil phosphorus ........................................................................ 103
3.24. Seasonal variation in soil organic matter .............................................................. 104

Texas Tech University, Brandon Melester, August 2010
1
CHAPTER 1
INTRODUCTION TO SOIL MICROBIAL DYNAMICS, MICROBIAL EVALUATION METHODS AND AGRICULTURAL PRACTICES
Introduction
The interactions between management practices and the soil biota and subsequent
effects on the performance of crops are of great agricultural importance. Moreover
there is a large potential for increased productivity in understanding these interactions
and managing them effectively (Watt et al. 2006). However, despite the important roles
of the soil microbiota in agroecosystem functioning (e.g.,Verhoef and Brussaard 1990)
very little is known of their activities, diversities, composition, and abundance under
semi-arid conditions in a peanut-based cropping systems (e.g., Acosta-Martinez et al.
2003). Soil quality and the sustainability of agroecosystems are reliant on the activity
and diversity of the soil microbial community and the processes they facilitate (Pankhurst
et al. 1996). Soil microbes are sensitive to disturbances from management decisions and
will alter activity rates, biomass, and community structure accordingly to the severity and
duration of the disturbance (e.g., Bossio et al. 1998, Schloter et al. 2003). Understanding
how to manipulate environmental conditions to fully utilize the microbial potential will
be invaluable in moving forward in developing more sustainable agroecosystems.
Arbuscular Mycorrhiza
Microorganisms are vital to all terrestrial ecosystems by performing essential
functions such as decomposition, mineralization and nutrient transfer to plants (Prescott

Texas Tech University, Brandon Melester, August 2010
2
et al. 2005). Nitrogen and phosphorous are two essential macro-nutrients that
microorganisms use to complete key steps in cycling and uptake (Cardon and Gage
2006). Plant productivity in natural and managed ecosystems is often limited by nitrogen
and phosphorous (Chapin et al. 1986), and interactions between the soil microflora and
plants to increase nutrient availability become crucial (Richardson 2001, Biro et al.
2000).
Arbuscular mycorrhizae (AM) are the largest group of mycorrhizae (Wright 2005)
and are one of the most important symbioses in terrestrial ecosystems (Smith and Read,
1997). AM fungi (AMF) influence soil carbon fluxes as well as nutrient dynamics of
plants, soils, and the atmosphere (Treseder and Cross 2006). There are some 150 known
AMF species (Vandenkoornhuyse 2002) that form symbiotic relationships with
approximately 80-85% of all terrestrial plant species (Vandenkoornhuyse 2002) including
various cropping systems (Zak and McMichael 2001). AM fungi are key mediators
between above-ground plant biomass and available soil nutrients (Read et al. 1992).
Arbuscular mycorrhizae are intracellular symbiontes that form arbusculars, which
are intricately branched haustoria (hyphal tips) in the cortex cells of a plant root (Smith
and Read, 2006).Arbuscules are the site of nutrient exchange between the plant and the
fungus. Arbuscular mycorrhiza benefit the host plant by increasing uptake of phosphorus
(P), zinc (Zn), copper (Cu), and nickel (Ni) and may increase resistance to soil-borne
pathogens, insect herbivores, and drought (Smith and Read 1997, Wright 2005).
The primary benefit of forming arbuscular mycorrhiza for most plants occurs
through the increased P uptake as phosphorus is one of the most limiting nutrients of

Texas Tech University, Brandon Melester, August 2010
3
plants (Tressier and Raynal 2003). The necessity to form this symbiotic relationship with
the AM fungi arises from the morphological and physiological characteristics of root
systems combined with low levels of soil P and the immobility of P in the soil matrix
(Wright 2005). Many plant roots exhibit slow growth rates that make it extremely
difficult to react to nutrient changes in the environment, and a large number of the roots
also have insufficient branching, lateral roots, and root hairs to fulfill their P demands
(Wright 2005). Plants that form the symbiotic relationship with AM fungi depend on the
AM hyphae as an extension of the roots to access a greater nutrient pool (Leyval et al.
2002, Wright 2005). Furthermore, research has shown that mycorrhizal plants are more
effective at using organic P than nonmycorrhizal plants (Wright 2005). The AMF
mycelium receives 3-20% net photosynthate produced by host and 37-47% of carbon (C)
delivered below ground (Treseder and Cross 2006). This substantial allocation of C
demonstrates how valuable this symbiosis is to plant nutrient uptake; otherwise the plant
would not invest such a large percentage of net photosynthate to sustain the arbuscular
mycorrhizal relationship. AM fungi also increase the aggregate stability of soil reducing
wind and soil erosion (Liang et al. 2008, Wright 2005). The production of the
hydrophobic, insoluble, recalcitrant C glomalin protein by the AMF is the means by
which they are able to aggregate soil particles.
AM fungi can be increasingly important in agroecosystems to compensate for
lower overall microbial activity and nutrient cycling resulting from high input of nutrients
and disturbance from plowing (Dick 1994). Most agricultural plants form arbuscular
mycorrhizae and as a result there has been a greater effort made to understand how AM

Texas Tech University, Brandon Melester, August 2010
4
fungi can improve crop productivity and reduce fertilizer inputs (Smith and Read 1997,
Zak et. al. 1998). However, there is been very little research into the establishment and
maintenance of AMF within annual agricultural ecosystems under arid and semi-arid
conditions (Smith and Read 1997, Zak and McMichael 2001).
Microbial Communities
Bacteria are estimated to be the most numerous group of microorganisms found in
soil even though they account for less than half of the microbial biomass due to their
small size (Kennedy 1999). Bacterial community composition and diversity in
agricultural systems has a key role in the cycling of nutrients within these systems. These
influences include key roles in the cycling of N, S, C, methane and other nutrients
decomposition, and compound transformation (Zak et al. 1994, Kennedy 1999). Soil
bacteria also play a large role in the formation of soil structure (Tisdall 1991). A vast
array of bacteria is present and affects agroecosytems and has the potential to be altered
due to environmental stresses and management practices (Kennedy 1999).
Soil fungi comprise the largest portion of the soil microbial biomass and in many
terrestrial systems are responsible for the majority of the ecosystem processes.
Saprophytic fungi are extremely important in soil dynamics because of their roles in
decomposition, C and N storage and sources, soil stabilization, and biochemical
processes (Bills et al. 2004, Went and Stark 1968). Fungi have been shown to be
biological control agents in some agricultural systems (Hall and Papierok 1982) and

Texas Tech University, Brandon Melester, August 2010
5
important decomposers and nutrient supplier to agroecosystems (Lodge 1997, Miller and
Lodge 2007, Hietschmidt et al. 1996). Fungal abundance and diversity have been shown
to be susceptible to changes in agricultural management practices such as tillage and in
turn these changes can influence the nutrient cycles of that system (Miller and Lodge
1997).
Microbial Biomass
The microbial biomass is an important regulator of nutrient transformation and
storage of many vital nutrients including N, P, and S and is also a key component of
organic C mineralization (Nunan et. al. 1998, Horwarth and Paul 1994). Previous
research has demonstrated that microbial biomass is a sensitive indicator of differences in
sustainable cropping systems, including examining effects of tillage, crop rotations, and
soil type on nutrient turnover and organic C (Anderson and Domsch 1989, Horwath and
Paul 1994) and also considered to be the most reliable indicator of soil quality (Gil-Sotres
et al. 2004).
FAME
Fatty Acid Methyl Ester (FAME) analysis is a technique that relies on the
different fatty acids among organisms to indentify species or groups present using gas
chromatography (GC) of the volatile fatty acid methyl esters extracted from
microorganisms (Kunitsky et. al. 2006, Sasser 1990). The MIDI Sherlock Microbial
Identification System developed procedure is a cheap, quick, and reliable system that has

Texas Tech University, Brandon Melester, August 2010
6
helped create libraries with over 1,500 bacterial species and over 200 species of yeast for
pure systems (Kunitsky et al. 2006). The FAME analysis has been shown to be an
effective tool in estimating of AM fungi biomass, as well as monitoring the degree to
which microbes are affected by management practices in agricultural soils (Olsson et al.
1999). FAME analysis has many advantages in describing microbial community
structure over culture-based methods in that FAME avoids selectivity toward fast
growing organisms on media. However, the technique can extract fatty acids from clay-
organic matter complexes and may include fatty acid profiles that are no longer present in
the soils in the community structure assessment (Acosta-Martinez et al. 2004). To date
16:1ω5c has been identified as an indicative fatty acid marker for AM fungi (Madan et al.
2001, Olsson et al. 1999) while 18:1ω9c, 20:1ω9c, 20:2ω6c, and 22:1ω9c have the
potential to be additional AMF fatty acid markers (Madan et al. 2001). Pankhurst et al.
1997 showed that FAME profiles can be used as an effective indicator to detecting
changes microbial compositions in response to agricultural management practices.
Soil Enzymes
Microorganisms are the main source of enzymes in the soils and thus the
composition and abundance of the soil microbial community controls soil processes (e.g.,
Acosta-Martinez et al. 2004). These microbial enzymes play vital roles in critical soil
processes such as decomposition, nutrient cycling, decomposition of xenobiotics, and soil
aggregation (Barea et al. 1996, Reynolds et al. 2003). The products from the reactions

Texas Tech University, Brandon Melester, August 2010
7
from the microbial enzymes are extremely important in driving soil nutrient dynamics
(Acosta-Martinez et al. 2004).
Previous research has shown that soils from the rhizosphere region have greater
enzymatic activity than that of non-rhizosphere soils (Dick 1994) and this can be
explained by the greater species diversity associated with the rhizosphere. Roots can
excretes carbon that can stimulate microbial activity increasing nutrient cycling within
the root –region and benefitting the plant directly (Dick 1994). Different agricultural
management practices can increase or decrease the soil enzyme production (Bandick and
Dick 1999) and thereby can have significant effects on nutrient availability and soil
organic matter levels. A decrease in microbial enzyme production will result in a
decrease in mineralization and cycling of nitrogen and phosphorous necessary to sustain
productivity. (Mina et al 2001). Understanding the specific interaction between
management practices and microbial dynamics in the rhizosphere of annual cropping
systems will be important in developing techniques to maximize efficiency of
agroecosystems while reducing inputs.
Tillage
Strip-tillage (or minimal tillage) combines the benefits of conventional tillage and
no-till agriculture. The process disturbs the row but leaves the furrow undisturbed with a
complete residue cover. The undisturbed soil will retain moisture more effectively than
the disturbed soils with this moisture available to the crop plants (Musick et al. 1977). In
a semi-arid system conventional tillage provides advantages over no-till agriculture

Texas Tech University, Brandon Melester, August 2010
8
through reduction in wind erosion but also can lead to soil compaction, loss of organic
matter and disruption of soil aggregates (Deng and Tabatabai 1996, Dick 1984, Doran
1980). Strip-tillage is a management technique that combines the benefits associated
with conventional tillage while reducing the negative effects. The effects of tillage will
have strong impacts on microbial diversity (Kennedy 1999). The minimal tillage
approach used in agricultural systems has been shown to increase the soil microbial
biomass and soil enzymatic activity (Dalal 1989, Spedding et al. 2004, Follett and
Schimel 1989). As agriculture shifts towards minimal tillage it will be important to know
exactly what affect it will have on the microbial dynamics of the soil.
Objectives and Hypotheses
Objective1: Evaluate the response of the microbial biomass to tillage, irrigation, and nitrogen under
a peanut cropping system in semi-arid soils.
Hypotheses
1) Tillage, irrigation, and nitrogen fertilizer will each have significant negative
effects on the size of the microbial biomass.
As water is limiting in semi-arid environments differences in irrigation schedules
should have the largest negative impact on the size of the microbial biomass. An increase
in the microbial biomass is expected to be correlated with increases in irrigation.
2) Traditional tillage during the growing season will negatively impact the
amount of microbial biomass that develops.
Strip-tillage should have a measureable positive effect on soil microbial biomass
due to the residue cover in the furrows and a decrease in disturbance. It was expected

Texas Tech University, Brandon Melester, August 2010
9
that the decrease in disturbance of soil aggregates in strip-tillage practices as compared to
conventional tillage would contribute to increased microbial biomass carbon C as the
result of keeping the fungal mycelia network intact.
3) Nitrogen application should decrease the microbial biomass by changing soil
microbial community structure. Increased soil nitrogen will allow fast growing microbes
to become dominant during period of optimum soil moisture.
Objective 2: Evaluate the response of the microbial community structure to tillage, irrigation, and
nitrogen of a peanut cropping system in semi-arid soils.
Hypotheses
1) Irrigation will increase the bacterial contributions to microbial community
structure.
As fungi have the ability to translocate water through their mycelium and survive
at lower water potentials, irrigation should favor a shift towards a bacterial dominated
system.
2) Tillage will change the microbial community structure to a bacterial dominated
system. Soils under strip-tillage are expected to have greater relative fungi abundance
associated with them. Conventional tillage should result in more disruption on mycelial
networks and negatively affect the fungal abundances.
3) Nitrogen fertilization will alter the structure of the soil microbial community
and reduce complexity.
Texas Tech University, Brandon Melester, August 2010
10
Objective 3: Evaluate the response of microbial enzyme production to tillage, irrigation, and nitrogen
of a peanut cropping system in semi-arid soils.
Hypotheses
1) Reduction in irrigation should result in reduced microbial enzyme production
for measured enzymes.
2) As irrigation will increase microbial activity, those enzymes associated with
the bacterial assemblages should increase accordingly.
3) Conventional-tillage should have a negative effect on the enzyme activity
levels as this practice is most disruptive to the soil microbial community particularly
fungi populations through disruption of hyphae.
4) Nitrogen was expected to have negatives effect on phosphodiesterase and
alkaline phosphatase activity levels and to positively affect β-glucosamindase, β-
glucosidase, and α-galactosidase.
Phosphodiesterase and alkaline phosphatase activity levels are expected to decline
with nitrogen inputs because these enzymes are associated with P cycling and are
expected to have an inverse relationship with N. The other enzymes are involved in C
cycling and would be expected to increase as a limiting nutrient such as nitrogen is
added.

Texas Tech University, Brandon Melester, August 2010
11
References
Acosta-Martinez, V., D. Rowland, et al. 2008. Microbial community structure and funtionality under peanut-based cropping systems in a sandy soil. Biol Fertil Soils 44: 681-692. Acosta-Martinez, v., D. R. Upchurch, et al. 2004. Early impacts of cotton and peanut cropping systems on selected soil chemical, physical, microbiological and biochemical properties. Biol Fertil Soils 40: 44-54. Acosta-Martinez, V., T. M. Zobeck, et al. 2003. Enzyme activities and microbial community structure in semiarid agricultural soils. Biol Fertil Soils 38: 216-227. Barea, J. M., C. Azcon-Aguilar, et al. 1999. Interactions between Mycorrhizal Fungi and Rhizosphere Microorganisms within the Context of Sustainable Soil-Plant Systems. Multitrophic Interactions in Terrestrial Systems: 36th Symposium of the British Ecological Society. A. C. Gange and V. K. Brown, Cambridge University Press: 65-78. Bashan, Y. 1998. Inoculants of plant growth-promoting bacteria for use in agriculture. Biotechnology advances. 16: 729-770 Biro, B., K. Koves-Pechy, et al. 2000. Interrelations between Azospirillum and Rhizobium nitrogen-fixers and arbuscular mycorrhizal fungi in the rhizosphere of alfalfa in sterile, AMF-free or normal soil conditions. Applied Soil Ecology 15(2): 159-168. Bills, G., M. Christensen, M. Powell, and G. Thorn. 2004. Saprobic soil fungi. In: Biodiversity of fungi: Inventory and monitoring methods (G.M. Mueller, G. Bills, and M.S. Foster, Eds.). Elsevier. Pgs. 271-302. Bossio, D.A., Scow, K.M., Gunapala, N., Graham, K.J. 1998. Determinants of soil microbial communities: effects of agricultural management, season, and soil type on phospholipid fatty acid profies. Micobial Ecology. 36: 1-12 Chapin, F. S., P. M. Vitousek, et al. 1986. The nature of nutrient limitation in plant communities. The American Naturalist 127: 48-58. Dalal, R.C. (1989). “Long-term effects of no-tillage, crop residue, and nitrogen application of properties of a vertisol.” SSSAJ. 53: 1511-1515 Deng, S. P. and M. Tabatabai 1997. Effect of tillage and residue management on enzyme activities in soils: III. Phosphates and arylsufatase. Biol Fertil Soils 24(141-146).

Texas Tech University, Brandon Melester, August 2010
12
Dick, R. P. 1994. Soil Enzyme Activities as Indicators of Soil Quality. Defining Soil Quality for a Sustainable Environment. J. W. Doran, D. C. Coleman, D. F. Bezdicek and B. A. Stewart. Madison, WI, AGRIS: 107-124. Erel, O. and S. Avci 2002. Semi-automated enzymatic measurement of serum zinc concentration. Clinical Biochemistry 35(1): 41-47. Follett, R.F., Schimel, D.S. 1989. Effects of tillage practices on microbial biomass dynamics. SSSAJ. 53: 1091-1096. Gardes, M. and T. D. Bruns 1993. ITS primers with enhanced specificity for basidiomycetes - application to the identification of mycorrhize and rust. Molecular Ecology 2: 113-118. Gil-Sotres, F., C. Trasar-Cepeda, et al. 2004. Different approaches to evaluating soil quality using biochemical properties. Soil Biology and Biochemistry 37: 877-887. Hall, R.A., Papierok. B. 1982. Fungi as biological control agents of arthropods of agricultural and medical importance. Parasitology. 84: 205-240. Hietshmidt, R.K., Short, R.E., Grings, E.E. 1996. Ecosystems, sustainability, and animal agriculture. Journal of Animal Science. 74: 1395-1405. Horwath, W. R. and E. A. Paul 1994. Microbial Biomass. Methods of Soil Analysis, Part 2. Microbolgical and Biochemical Properties. J. M. Bigham. Madison, WI, Soil Society of America: 753-772. Kennedy, A.C. 1999. Bacterial diversity in agroecosystems. Agriculture, Ecosystems and Environment. 74: 65-76. Kunitsky, G., G. Osterhout, et al. 2006. Identification of Microorganisms using Fatty Acid Methyl Ester (FAME) Analysis and the MIDI Sherlock Microbial Identification System. Encyclopedia of Rapid Microbiological Methods, Volume 3. M. J. Miller, PDA/DHI. 3. Leyval, C., E. J. Joner, et al. 2002. Potential of arbuscular mycorrhizal fungi for bioremediation. Mycorrhizal Technology in Agriculture: From Genes to Bioproducts. S. Gianiazzi, H. Schuepp, J. M. Barea and K. Haselwandter. Basel; Boston, Birkhauser: 175-186. Liang, Z., R. A. Drijber, et al. 2008. A DGGE-cloning method to characterize arbuscular mycorrhizal community structure in soil. Soil Biology and Biochemistry 40(4): 956-966. Lodge, D.J. (1997). “Factors related to decomposer fungi in tropical forest.” Biodiversity and Conservation. 6: 681-688.

Texas Tech University, Brandon Melester, August 2010
13
Ma, W. K., S. D. Siciliano, et al. 2005. A PCR-DGGE method for detectinf arbuscular mycorrhizal fungi in cultivated soils. Soil Biology and Biochemistry 37: 1589-1597. Mader, P., et al., 2000. Arbuscular mycorrhizae in a long-term field trial coparing low-input (organic, biological) and high-input (conventional) farming systems in a crop rotation. Biol Fertil Soils 31: 150-156. McMichael, B. L. and J. C. Zak 2006. The Role of Rhizotrons and Minirhizotrons in Evaluating the Dynamics of Rhizoplane-Rhizosphere. Soil Biology. K. G. Mukerji, C. Manoharachary and J. Singh, Springer-Verlag Berling Heidelberg. 7: 71-87. Miller, R.M., Lodge, D.J. 2007. Fungal Responses to Disturbance: Agriculture and Forestry. Environmental and Microbial Relationships. Christian P. Kubicek and Irina S. Druzhinina. Springer Berlin Heidelberg: 47-68. Moore, J. M., S. Klose, et al. 2000. Soil microbial biomass carbon and nitrogen as affected by cropping systems. Biol Fertil Soils 31: 200-210. Musick, J.T., Wiese, A.F., Allen, R.R. 1977. Management of bed-furrow irrigated soil with limited- and no-tillage systems. ASAE. 20: 666-672. Nunan, N., M. A. Morgan, et al. 1998. Ultraviolet absorbance (280 nm) of compounds released from soil during chloroform fumigation as an estimate of the microbial biomass. Soil Biology and Biochemistry 30: 1599-1603. Pankhurst, C.E., Oohel-Keller, K., Doube, B.M., Gupta, V.V.S.R. 1996. Biodiversity of soil microbial communities in agricultural systems. Biodiversity and Conservation. 5: 197-209. Prescott, L. M., J. P. Harley, et al. 2005. Microbiology. New York, McGraw-Hill. Reynolds, H. L., A. Packer, et al. 2003. Grassroots Ecology: Plant-Micorbe-Soil Interactions As Drivers Of Plant Community Structure And Dynamics. Ecology 84(9): 2281-2291. Richardson, A. E. 2001. Prospects for using soil microorganisms to improve the acquisition of phosphorus by plants. Australian Journal of Plant Physiology 28: 897-906. Sanders, I. R., J. P. Clapp, et al. 1996. The genetic diversity of arbuscular mycorrhizal fungi in natural ecosystems-a key to understanding the ecology and functioning of the mycorrhizal symbiosis. New Phytologist 133: 123-134.

Texas Tech University, Brandon Melester, August 2010
14
Schloter, M., Dilly, O., Munch, J.C. 2003. Indictors for evaluating soil quality. Agriculture, Ecosystems, and Environment. 98: 255-262. Sen, R. 2003. The root-microbe interface: new tools for sustainable plant production. New Phytologist. 157: 391-394. Smith, S. E. and D. J. Red 1997. Mycorrhizal Symbiosis, Academic Press. Smith, S. E., Smith, F. A, et al. 2003. Mycorrhizal fungi can dominate phosphate supply to plants irrespective of growth response. Plant Physiology 133(16-20). Souza, F. d., G. A. Kowalchuk, et al. 2004. PCR-Denaturing Gradient Gel Electrophoresis Profiling of Inter- and Intraspecies 18S rRNA Gene Sequence Heterogeneity Is an Accurate and Sensitive Method To Assess Species Diversity of Arbuscular Mycorrhizal Fungi of the Genus Gigaspora. Applied and Environmental Microbiolgy 70(3): 1413-1424. Spedding, T.A., Hamel, C. Mehuys, Madramootoo, C.A. 2004. Soil microbial dynamics in maize-growing soil under different tillage and residue management system. Soil Biology and Biochemistry. 36: 499-512. Tabatabai, M. 1994. Soil Enzymes. Methods of soil analysis. Part 2. Microbiological and biochemical properties. R. Weaver, J. Angle and P. Bottomley. Madison, Wisconson, SSSA: 775-833. Tisdall, J.M. 1991. Fungal hyphae and structural stability of soil. Aust. J. Soi Res. 29: 729-743. Treseder, K. K. and A. Cross 2006. Global Distrubtions of Arbuscular Mycorrhizal Fungi. Ecosystems 9: 305-316. Watt, M., J. A. Kirkegard, et al. 2006. Rhizosphere biology and crop productivity-a review. Australian Journal of Research 44: 299-317. Went, F.W., Stark, N. 1968. The biological and mechanical role of soil fungi. Proceedings of the National Academy of Sciences of the United States of America. 60: 497-504. Wright, S. F. 2005. Management of Arbuscular Mycorrhizal Fungi. Roots and Soil Management: Interactions Between Roots and the Soil. R. W. Zobel and S. F. Wright. Madison, WI, American Society of Agronomy: 183-197. Wynne, J. C., G. H. Elkan, et al. 1980. Greenhouse evaluationsof strains of Rhizobium for peanuts. Agronomy Journal 72: 645-649.

Texas Tech University, Brandon Melester, August 2010
15
Vainio, E. J. and J. Hantula 2000. Direct analysis of wood-inhabiting fungi using denaturing gradient gel electrophoresis of amplified ribosomal DNA. Mycological Research 104(8): 927-936. Vandenkoornhuyse, P., R. Husband, et al. 2002. Arbuscular mycorrhizal community composition associated with two plant species in a grassland ecosystem. Molecular Ecology 11: 1555-1564. Verhoef, H. A. and Brussaard, L. 1990. Decomposition and nitrogen mineralization in natural and agroecosystems: the contribution of soil animals. Biochemistry 11: 175-211. Zak, J. C. 1992. Responses of soil fungal communities to disturbances. The Fungal Community (2nd Edition). G. Carroll and D. T. Wicklow. New York, Marcel Dekker: 403-425. Zak, J. C., Willig, M.R., Moorhead, D.L., Lildman, H.G., 1994. Functional diversity of bacterial communities: a quantitative approach. Soil Biol. Biochem. 26: 1101-1108. Zak, J. C. and B. McMichael 2001. Agroecology of Arbuscular Mycorrhizal Activity. Structure and Function in Agrecosystem Design and Management. Boca Raton, FL, CRC Press: 145-156. Zak, J. C., B. McMichael, et al. 1998. Arbuscular-mycorrhizal colonization dynamics of cotton (Gossypium hirsutum L.) growing under several production systems on the Southern High Plains, Texas. Agriculture, Ecosystems & Environment 68(3): 245-254. Zhang, Q. and J. C. Zak 1998. Effects of water and nitrogen mendment on soil microbial biomass and fine root production in a semi-arid environment in West Texas. Soil Biology and Biochemistry 30(1): 39-45.

Texas Tech University, Brandon Melester, August 2010
16
CHAPTER 2
EFFECTS OF MANAGEMENT PRACTICES IN A SEMI-ARID AGROECOSYSTEM ON SOIL MICROBIAL BIOMASS & MICROBIAL COMPOSITION
Introduction
Agro-management practices such as tillage, irrigation, herbicide and pesticide
applications, and fertilizer applications can have substantial negative impacts on
agricultural systems (Welbaum et al. 2004). These production decisions directly affect
soil quality by influencing the chemical and physical make-up of the soil, the activity and
diversity of the soil microflora and the soil macro and micro fauna and their activity
(Watt et al. 2006, Bossio et al. 1998, Yeates et al. 1997, Lupwayi et al. 1998). Greater
understandings of the negative impacts of traditional agricultural practices are needed if
there is to be a shift towards developing more sustainable agricultural systems (Pankhurst
et al. 1996). In order for this to occur, it is important to understand the affects of the
different management practices used and to determine which of these practices supports a
sustainable agro ecosystem.
Watt et al. (2006) emphasized that there is a large potential for increasing
productivity by managing properly the interactions between management practices and
the soil microflora Moreover understanding the interactions between microbial activity
and management practices may be key to developing sustainable agricultural systems that
maximize crop productivity while reducing inputs.
Saprophytic and symbiotic soil bacteria and fungi have large impacts on the
functioning of agroecosystems through their contributions to decomposition by regulating

Texas Tech University, Brandon Melester, August 2010
17
nutrient cycles (Miller and Lodge 2007). The inputs of carbon and nutrients from plants
influences the abundance of fungi and bacteria in the rhizosphere by driving nutrient
cycles (Acosta-Martinez et al. 2004, Zak et al. 1994, Kennedy 1999). In highly managed
agroecosystems, however, the most common response to management decisions is a
reduced responses in microbial activity resulting from high input of nutrients and
disturbance from plowing (Dick 1994).
A key indicator to how the agricultural soil management practices are affecting
microbial dynamics is through the evaluation of microbial biomass. The microbial
biomass is an important regulator of nutrient transformation and storage of many vital
nutrients including N, P, and S and is also a key component of organic C mineralization
(e,g., Nunan et. al. 1998, Horwarth and Paul, 1994). Previous research has demonstrated
that microbial biomass is a sensitive indicator of differences in sustainable cropping
systems, including the effects of tillage, crop rotations, and soil type on nutrient turnover
and organic C (e,g., Anderson and Domsch 1989, Horwath and Paul 1994). Moreover
the amount and dynamics of soil microbial biomass also considered to be the most
reliable indicator of soil quality (Gil-Sotres et al. 2004).
For a semi- arid agroecosystem, the dynamics of the soil microbial biomass is
regulated in part by the seasonal distribution of precipitation, which can impose a major
stress on the soil microbial community in addition that as a result of management
practices. To maximize sustainability of cropping system in semi-arid environments and
to reduce costs associated with irrigation, tillage practices and fertilizer application this

Texas Tech University, Brandon Melester, August 2010
18
study was conducted within a peanut cropping system to evaluate key production impacts
on soil microbial biomass.
Methods Plot Design
Field plots for this two year study (2007 and 2008) were established at the USDA-
ARS Cropping System Research Laboratory in Lubbock, Texas USA (101⁰ 47’ west
longitude; 33⁰ 45’ north latitude; 993m elevation. The field soil is an Olton clay loam
(mixed, superactive, thermic and aridic soil) and are classified as Paleustolls (Bronson et
al. 2004). Previous to the initiation of this study, the field was under conventional cotton
production for 6 growing seasons. In November 2006, the whole circular field was
portioned into 36 concentric rows. Approximately 1.3 hectares (3.3 acres), one half of a
circular field was prepared for peanut production to assess the impacts of irrigation,
nitrogen, and tillage on soil microbial dynamics and microbial functionality.
The sample site was divided into six equally sized triangular plots that are labeled
plots 1-6. Every two plots receive the same imposed conditions so that there were two
replicates for each treatment. Within each of the plots, different tillage techniques were
applied alternating between conventional tillage and strip tillage zones. In the
conventional tillage rows there was rye planted in the furrow only and in the strip tillage
portions rye was planted across the bed and the furrow. Within the plots zones of strip
and conventional tillage rows alternated respectively starting from the outside of the
plots. There were two strip and two conventional tillage sections within each zone. Two

Texas Tech University, Brandon Melester, August 2010
19
alternating conventional and strip tillage sections of six rows each were sampled in each
plot.
Plots 1 and 2 served as the control and did not receive nitrogen fertilizer in year
2007. The remaining Plots 3, 4, 5, and 6 received 30lb/acre (33.6 kg/Hectare) of URAN
(Urea Ammonium Nitrate) on July 25th, August 9th, August 27th, September 24th and
September 24th in 2007. In 2008, Plots 1 through 6 received URAN 35 lb/acre (39.2
Kg/Ha) on July 8th, August 1st and September 2nd. Thus, all Plots received nitrogen in
2008.
There were 2 levels of irrigation applied in 2007. Plots 1, 2, 5 and 6 received full
irrigation (100-100-100% EvapoTranspiration (ET)), where 100% ET irrigation refers to
the amount of water supplemented to the crop that equals the total loss of water through
evaporation from the soil and the total transpiration form the aerial parts of the plant. For
2007 full irrigation was determined to be 1.5 inches of water. The late growing seasons
last from beginning of August till the end of October. Plots 3 and 4 were kept under late
deficit treatment (100-100-50%ET), applying only 0.75 inch of irrigation (half) during
the last 90 days while maintain full irrigation prior to. There were 3 levels of irrigation in
year 2008. Plots 1 and 2 received full irrigation (100-100-100%ET). Plots 3 and 4 were
kept under late deficit treatment (100-100-50%ET). Plots 5 and 6 were under early deficit
irrigation. They were irrigated with half of the regular irrigation 90.75 inch quantity in
initial 45 days (beginning of May to mid-June).

Texas Tech University, Brandon Melester, August 2010
20
Crop Management Treatments
In 2007, the treatments applied to the field were: 1) Full Irrigation and no
Nitrogen (plots 1 & 2), 2) Nitrogen and a Late Season Drought (Plots 3 &4), and 3) Full
Irrigation and added Nitrogen (Plots 5 & 6). In 2008, the applied treatments were: 1) Full
Irrigation and added Nitrogen (Plots 1 & 2), 2) Late Season Drought and added Nitrogen
(Plots 3 & 4), and 3) an Early Season Drought and added Nitrogen (Plots 5 & 6). As with
2007 there were alternating conventional and strip tillage rows that were sampled (Figure
2.1).
Sampling
Four soil samples were taken within each plot; two from conventional tillage rows
and two strip tillage rows. For each sample, soil was collected from three different
locations across the plot to account for any variations that may be present within each
section of the zone and combined per row. Soil samples were collected from a depth of
15cm, with approximately 330g of samples taken for each replicate sample. Once
samples were taken, they were kept in a cooler and stored at 4⁰ C until they were
processed for enzymatic analysis.
Microbial Biomass Carbon
The chloroform fumigation and extraction method (Nunan et al. 1998, Vance et
al. 1987) was used to assess microbial biomass carbon (MBC) in response to
management practices. For each sample collection a 10 g dry weight equivalent was

Texas Tech University, Brandon Melester, August 2010
21
measured out for each soil sample. A 10 g dry-weight equivalent is determined by drying
5.0 g soil for 48 hrs at 60°C and measuring the % soil moisture. Two 10 g dry-weight
equivalent sub-samples of each field sample were placed in a dessicator with a moist
paper towel at the bottom to impede the desiccation of soil samples during the
fumigation. Twenty five ml of ethanol-free chloroform with anti-bumping granules will
be added along with the moist paper towel in a dessicator for the fumigation. A second
sub-set of samples were placed within a dessicator without chloroform to serve as a
control. All samples were fumigated for 48 hrs. Soil samples were then extracted using
50ml of a 0.5 M K2SO4 solution, shaken for 1 hours and then filter through Whatman #32
150mm filter paper. To determine the microbial biomass present in each sample, a
subsample of the filtered K2SO4 was read at 280nm according to the procedure described
by Nunan et. al. (1998). To obtain the amount of microbial biomass carbon, the control
absorbance values are subtracted from the fumigated absorbance values and multiplied by
the KEC.
Microbial Community Structure
To evaluate the impacts of management decisions on the structure of the soil microbial
community fatty Acid Methyl Ester (FAME) analyses were conducted (referenced
needed) To conduct the FAME analyses a 3 gram dry weight equivalents were collected
from each treatment plot. The soil samples were first subjected to a saponification step
(45g sodium hydroxide, 150ml methanol, and 150ml distilled water) and boiled in a
100ºC water bath for 30 minutes. Samples were then methylated using a 325ml 6.0N

Texas Tech University, Brandon Melester, August 2010
22
hydrochloric acid, and 275ml methyl alcohol reagent. Subsequently, 200ml hexane,
200ml methyl tert-butyl ether reagent were used to extract the methyl esters into the
organic phase. Lastly, samples were run through a gas chromatography (6890 GC Series
II Hewlett Packard, Wilmington, DE, USA) with a temperature program that increased
the temperature 5ºC per minute starting at 170ºC and ending at 270ºC. A GC detector
measured the peaks from the volatile methyl esters and the Sherlock MIS Software
(MIDI, Inc. Newark, DE) was used to obtain the types and proportional abundances of
each peak.
Data Analysis
Changes in microbial biomass levels in response to different management
practices across seasons and across years were evaluated using one-way ANOVA. The
overall impacts of management affects on microbial were evaluated using mANOVA.
Influences of soil nutrients levels on microbial biomass and the influence of the enzyme
levels on each other were evaluated using bivariate correlations. Statistical analyses
including one-way ANOVA, mANOVA, bivariate correlations were performed using
SPSS 14.0 for windows. Each data set underwent the Least Significant Difference (LSD)
post hoc test when significance (p ≤ 0.05) was indicated on the one-way ANOVA and
mANOVA.
Discriminant function analysis (DFA) was employed to visualize microbial
responses to managanement practices in multivariate space, using MATLAB (Natick,
Massachusetts). DFA analyzed microbial responses to 2007 and 2008 separately. For

Texas Tech University, Brandon Melester, August 2010
23
each DFA, 1000 randomized (bootstrap) iterations were performed in order to build null
distributions from which to compare actual sampling distribution.
Results
Effects of Tillage on MBC
There was no significant difference (p= 0.732) between the overall MBC levels
between the conventional and strip tillage treatments across seasons and the two years of
the study (Figure 2.2a). There was also no significant (p ≤ 0.05) difference seen in MBC
levels between the two treatments within any of the seasons. The overall MBC was
greater in 2008 than in 2007 for both tillage types (Figure 2.2b).
Effects of Irrigation on MBC
Full irrigation vs. late season drought 2007-2008
There was a significant difference in irrigation’s affect on MBC. Overall MBC
was highest across both years and across seasons under full irrigation (p = 0.01) than that
of reducing irrigation resulting in a late season drought (LSD) across both 2007 and
2008(Figure 2.3a). MBC was greater in the full irrigation treatments in every season
compared to LSD. MBC was statistically (p ≤ 0.05) greater fall 2007 and summer 2008
and partially separated in fall 2008 (Figure 2.3b).

Texas Tech University, Brandon Melester, August 2010
24
Full irrigation vs. late season drought vs. early season drought
During 2008, full irrigation produced greater MBC than LSD and early season
drought (ESD) but difference were only significantly different (p ≤ 0.05) from MBC
associated with the “late season drought.” While MBC from the ESD plots appeared
greater than MBC from LSD treatment plots, the values were not significance (p = 0.858)
(Figure 2.4a). Full irrigation produced a consistent pattern of greater MBC than LSD and
ESD within seasons but was significantly greater than LSD in summer 2008 only. The
greatest difference in MBC between LSD and ESD was seen in summer 2008, although
the difference was not considered significant (Figure 2.4b).
Effects of Nitrogen on MBC
Nitrogen fertilization of a peanut cropping system did not have an overall effect
on MBC across years and seasons (Figure 2.5a). There were statistical differences
between fertilized and no fertilizer plots within seasons. There was a trend of the MBC
being higher in both treatments for the summer season compared to the fall, thought this
pattern was only significant (p ≤ 0.05) for the no-nitrogen treatments (Figure 2.5b).
Changes in field conditions
There was a clear separation in microbial structure among all sample dates and
October 2008 among (Figure 2.6a). Note that 1 is also different from 6, 5, 3 and 2. The
mANOVA confirmed that there was a significant (p ≤ 0.05) difference in what between
this month from the rest of what –expand your comparisons. The DFA also showed that
Texas Tech University, Brandon Melester, August 2010
25
microbial community structure in July 2007 separated out from all of the other months
other than October 2007 and that October 2007 separated out from all other months
except July 2007 (Figure 2.6a). Microbial community structure for July and October
2007 was shown to be different from all other months by mANOVA (p ≤ 0.05). Vector
analysis demonstrated that nutrient dynamics and soil organic matter were the driving
force for this temporal separation (Figure 2.6b).
Influences between MBC, nutrients, and enzymatic activity
All significant correlations between MBC and soil nutrients across both growing
seasons were negative (Table 2.1). Some of these negative correlations with MBC
included phosphorus (-28%), potassium (-36%), magnesium (-35%), Boron (-31%) and
manganese (-37%). There were no overall significant relationships between MBC and
levels of extractable NO3 and NH4. No strong correlations were detected between MBC
and any of the measured microbial enzymes with the highest being 17% with α-
galactosidase (Table 2.2).
Temporal changes in MBC
Seasonally, MBC did not change significantly as there was only a significant
difference in MBC between fall 2007 and fall 2008 with MBC in 2008 being significantly
greater at that time period (p ≤ 0.05). There were no differences in MBC levels within
either year (Figure 2.7a). levels of MBC were the highest in October of 2008 and it’s the
lowest in October 2007 (Figure 2.7b & 2.7c).

Texas Tech University, Brandon Melester, August 2010
26
FAME
The relative abundances of fungal FAMES were greater than the relative bacteria
abundances % within every season (Figure 2.8a). The fungi:bacteria ratio of relative
abundance was the highest in the fall season of 2007 and the lowest in the summer of
2008 (Figure 2.8b). In both sampling periods the changes in the fungi:bacterial ratios
were the result of fluctuations in the relative fungal abundances and not those of the soil
bacteriaFungal abundance was significantly greater in fall 2007 and decreased
significantly in summer 2008. Both years showed a significant increase in the
fungi:bacteria raito from the summer to fall (Figure 2.8a & 2.8b).
The relative abundance of Arbuscular Mycorrhizal Fungal FAME profiles and
saprophytic fungi FAME profiles remained consistent and almost identical in all seasons
except during summer 2008. The relative abundance of saprophytic fungi FAMEs
decreased significantly during this season (Figure 2.9a). There was a significant and
positive correlation between MBC levels and relative abundance of saprophytic fungal
FAME levels (R=.361).
The relative abundances of Gram-Positive bacteria FAME profiles remained
consistent throughout all the growing seasons and were significantly higher than the
relative abundances for Gram-Negative bacteria and actinomycetes (Figure 2.9b).
Nitrogen Effects
Nitrogen addition had a significant negative effect (p ≤ 0.05) on the relative
bacteria abundances across 2007 when compared to those plots that received no

Texas Tech University, Brandon Melester, August 2010
27
additional nitrogen (Figure 2.10a). There were seasonal effects with no significant
difference between the relative bacterial abundances in the summer. However, the level
of bacterial FAMES within nitrogen application was significantly less in the fall season
that year.
Nitrogen did not have a significant effect on the relative fungi abundances for the
2007 data combined (Figure 2.11a). However, when looking within the seasons fungal
abundances increased positively to nitrogen addition in the fall season 2007. There were
no differences in the relative fungi abundance % between the nitrogen and no nitrogen
plots in summer 2007 (Figure 2.11b).
Effects of Irrigation
Overall Gram -Positive FAME levels were lower under late season drought
compared to full irrigation (p ≤ 0.05). The overall Gram -Positive relative abundance
levels decreased across both years under late Season Drought when compared to Full
Irrigation (Figure 2.12a). The relative abundances Gram-Positive FAME levels were
greater under full irrigation in every season but the differences were only significant for
fall 2007 (2.12b). Gram-Negative relative abundances exhibited a positive response to the
LSD treatment when compared to Full irrigation (Figure 2.13a). However, this response
to LSD by the Gram-Negative bacteria was not seen in every season. The relative
abundance was greater under LSD in summer 2007 and fall 2008 but only significantly
greater in fall 2008. In summer 2008, the relative Gram-Negative abundance was greater
under full irrigation and no response was able to be measured for fall 2007 as a result of
insufficient amounts of relative Gram-Negative abundance in that season (Figure 2.13b)

Texas Tech University, Brandon Melester, August 2010
28
Discussion
Nitrogen
One of the goals of this study was to understand the impact that nitrogen
application had on the soil microbiological dynamics in a semi-arid agroecosystem.
Previous research examining nitrogen inputs effect on MBC have produced contradictory
results of both positive and negative responses of soil MBC to nitrogen (Moore et al.
2000). The results from this study indicated that nitrogen did not have any significant
effect on the soil MBC.
Nitrogen did elicit a significant response from the soil bacteria associated with the
peanut cropping system. The relative bacteria abundances of FAME profiles responded
negatively to short-term nitrogen application. It is hard to speculate to the true
relationship between added N and relative bacteria abundance due to short-term data
collected. This response could be the result of N inhibition on soil microbial
communities through repression of soil enzyme activity (Bardgett et al. 1999).
Alternatively, the increased N could be reducing the need for N-fixing bacteria in the soil.
Previous research yielding similar results concluded increased N inputs could promote
the growth of certain nematodes which in turn decrease a certain population of the
sustained bacteria (Sarathchandra et al. 2001).
The relative fungal abundance showed an opposite but lesser response to soil
nitrogen addition. The N application effect was not considered significant for the
duration of the study but was considered significant in the fall season when the relative
fungi abundance was at its greatest. The relatively small amount of data collected in the

Texas Tech University, Brandon Melester, August 2010
29
short-term portion of this study makes it is difficult to speculate whether N did have an
effect on fungal abundance or not. Because N fertilization has been shown to cause
chances in the abundance of fungal species (Sarathchandra et al. 2001) and the result was
near significant we feel comfortable to at least suggest that there is a small effect.
The effects seen as result of N application reflect short term results. The data
obtained is only valuable when evaluating short-term management strategies. The effects
of long-term N application can have dramatically different effects than that of short-term
application (Marchner et al. 2003) and such long-term evaluation of N application and its
effect on relative microbial abundance are needed to fully understand the consequences
of this management practice.
Tillage
The two tillage methods compared in this study did not differ in result from one
another. The level of MBC remained almost exactly the same, as did all the relative
microbial abundance within the conventional and strip tillage samples. MBC has often
been shown as a sensitive indicator to changes in tillage practices (Anderson and
Domsch, 1989, Horwath and Paul 1994, Jackson and Calderon 2003) but it has also been
shown to be non-responsive to tillage management changes (Calderon and Jackson 2002,
Aslam et al. 1999). The lack of difference between the two tillage treatments is probably
a result of the similarity between them as strip tillage is a reduction of conventional
tillage. These results indicate that when strategizing between tillage treatments, effects
other than microbial responses such as soil aggregation or erosion should be considered

Texas Tech University, Brandon Melester, August 2010
30
when trying to determine which method will be more beneficial for that particular
agroecosystem.
Irrigation
Full irrigation had a significantly positive effect on the soil MBC and Gram-
Positive bacteria abundance. These results are not surprising as water is necessary for
any successful agroecosystem. These results further demonstrate the necessity of water
for crop productivity. Further research will be needed to determine ways to minimize
irrigation without reducing microbial dynamics. One short-term method evaluated in this
study was timing of irrigation. The effects of late season irrigation and early season
irrigation were inclusive in this study but the results suggest that further investigation
may lead to promising results. Although there were no significant differences between
the LSD and ESD irrigation treatments, variables measured all followed a pattern of
higher levels associated with ESD indicating that irrigation is more influential in the later
part of the growing season. Although this should be evaluated over more than one
growing season, it would appear if water is limited irrigating in the later months will help
to maximize the soil microflora potential.
Soil characteristics and seasonal variation
FAME analysis indicated that the soil in this study was fungal dominated, with
the fungi:bacteria ratios being significantly greater in the fall seasons compared to the
summers. The relative fungi abundance were almost exactly the same between

Texas Tech University, Brandon Melester, August 2010
31
saprophytic fungi and mycorrhizal fungi in all seasons with the exception of the summer
2008 season in which saprophytic fungi displayed a significant decrease in abundance.
Gram-Positive bacteria made up the highest concentration of bacteria in the soil, a result
consistent with other research (Ibekwe and Kennedy 1999). Actinomycetes and Gram-
Negative bacteria abundance were both relatively low and did not display much variation.
This information can be used in future research to help focus on the microbial groups that
could have the most influence on agroecosystems due to their abundance.
DFAs showed strong monthly variation in the plots mainly as the result of
nutrient fluxes. The October 2008 month separate out most significantly followed by the
October 2007 month. Interestingly enough, these two months also represented the
extreme high and low in MBC months with October 2008 displaying the highest MBC
and October 2007 resulting in the lowest MBC. Although, there were no significant
correlations between individual nutrients and soil MBC levels, it would certainly appear
that there may be some interaction between the combined levels of soil nutrients and the
MBC. There results also indicated that there may be some key shifts going on between
the September and October months as each year the MBC between these two months
were the greatest. More detailed examination of trends in these months may provide
insight into soil nutrient shifts and their effects.
Texas Tech University, Brandon Melester, August 2010
32
References Acosta-Martinez, v., D. R. Upchurch, et al. 2004. Early impacts of cotton and peanut cropping systems on selected soil chemical, physical, microbiological and biochemical properties. Biol Fertil Soils 40: 44-54. Anderson, T.H., and Domsch, K.H. 1989. Ratios of microbial biomass carbon to total organic carbon in arable soils. Soil Biology and Biochemistry. 21: 471-479. Aslam, T., Choudhary, M.A., Saggar, S. 1999. Tillage impacts on soil mictobial biomass C, N, and P, earthworms and agronomy after two years of cropping following permanent pasture in New Zealand. Soil and Tillage Research. 51: 103-111. Bardgett, R.D., Mawdsley, J.L., Edwards, S., Hobbs, P.J., RodwellJ.S., Davies, W.J. 1999. Plant species and nitrogen effects on soil biological properties of temperate upland grasslands. Functional Ecology 13: 650-660. Bossio, D.A., Scow, K.M., Gunapala, N., Graham, K.J. 1998. Determinants of soil microbial communities: effects of agricultural management, season, and soil type on phospholipid fatty acid profies. Microbial Ecology 36: 1-12. Calderόn, F.J., Jackson, L.E. 2002. Rototilage, disking and subsequent irrigation:effects on soil nitrogen dynamics, microbial biomass, and carbon dioxide efflux. J. Environ Qual. 31: 752-758. Dick, R. P. 1994. Soil Enzyme Activities as Indicators of Soil Quality. Defining Soil Quality for a Sustainable Environment. J. W. Doran, D. C. Coleman, D. F. Bezdicek and B. A. Stewart. Madison, WI, AGRIS: 107-124. Gil-Sotres, F., C. Trasar-Cepeda, et al. 2004. Different approaches to evaluating soil quality using biochemical properties. Soil Biology and Biochemistry 37: 877-887. Gilbert, D. Amblard, C., Bourdier, G., Francez, A.J. 1998. Short-term effect of nitrogen enrichment on the microbial communities of a peatland. Hydrobiologia. 373/374: 111-119. Horwath, W. R. and Paul E. A. 1994. Microbial Biomass. Methods of Soil Analysis, Part 2. Microbolgical and Biochemical Properties. J. M. Bigham. Madison, WI, Soil Society of America: 753-772. Ibekwe, A.M., Kennedy, A.C. 1999. Fatty acid methyl ester (FAME) profiles as a tool to investigate structure of two agricultural soils. Plant and Soil. 206: 151-161.

Texas Tech University, Brandon Melester, August 2010
33
Jackson, L.E., F. J. Calderon, K. L. Steenwerth, K. M. Scow and D. E. Rolston. 2003. Responses of soil microbial processes and community structure to tillage events and implications for soil quality Geoderma. 114: 305-315. Kennedy, A.C. 1999. Bacterial diversity in agroecosystems. Agriculture, Ecosystems and Environment. 74: 65-76. Lupwayi, N.Z., Rice, W.A., Clayton, G.W. 1998. Soil microbial diversity and community structure under wheat as influenced by tillage and crop rotation. Soil Biology and Biochemistry. 30: 1733-1741. Marchner, P., Kandeler, E., Marschner, B. 2003. Structure and function of the soil microbial community in a long-term fertilizer experiment. Soil Biology and Biochemistry. 35: 453-461. Mendes, I.C., Bandick, A.K., Dick,. R.P., and Bottemley. P.J. 1999. Microbial Biomass and Activities in Soil Aggregates Affected by Winter Cover Crops. Soil Science Society of American Journal. 63: 873-881. Miller, R.M., Lodge, D.J. 2007. Fungal Responses to Disturbance: Agriculture and Forestry. Environmental and Microbial Relationships. Christian P. Kubicek and Irina S. Druzhinina. Springer Berlin Heidelberg: 47-68. Moore, J.M., Klose, S., Tabatabai, M.A. 2000. Soil microbial biomass carbon and nitrogen as affected by cropping systems. Biol Fertl Soils. 30: 200-210. Nunan, N., M. A. Morgan, et al. 1998. Ultraviolet absorbance (280 nm) of compounds released from soil during chloroform fumigation as an estimate of the microbial biomass. Soil Biology and Biochemistry 30: 1599-1603. Pankhurst, C.E., Oohel-Keller, K., Doube, B.M., Gupta, V.V.S.R. 1996. Biodiversity of soil microbial communities in agricultural systems. Biodiversity and Conservation. 5: 197-209. Rodriquez-Kabana, R. 1986. Organic and inorganic nitrogen amendments to soil as nematode suppressants. J Nemato. 8: 129-134. Sarathchandra, S.U., Ghani, A., Yeates, G.W., Burch, G., Cox, N.R. 2001. Effect of nitrogen and phosphate ferilisers on microbial and nematode diversity in pasture soil. Soil Biology and Biochemistry. 33: 953-964. Vance, E.D., Brookes, P.C., Jenkinson, D.S. 1987. An extraction method for measuring soil microbial biomass C. Soil Biology and Biochemistry. 19: 703-707.

Texas Tech University, Brandon Melester, August 2010
34
Verhoef, H. A. and L. Brussaard 1990. Decomposition and nitrogen mineralization in natural and agroecosystems: the contribution of soil animals. Biochemistry 11: 175-211. Welbaum, G.E., Sturz, A.V., Dong, Z., Nowak, J. 2004. Managing Soil Microorganisms to Improve Productivity of Agro-Ecosystems. Critical Reviews in Plant Sciences. 23: 175-193. Watt, M., J. A. Kirkegard, et al. 2006. Rhizosphere biology and crop productivity-a review. Australian Journal of Research 44: 299-317. Yeates, G.W., Bardgett, R.D., Cook, R., Hobbs, P.J., Bowling, P.J., Potter, J.F. 1997. Faunal and microbial diversity in three Welsch grassland soils under conventional and organic management regimes. Journal of Applied Ecology. 34: 453-470. Zak, J. C., Willig, M.R., Moorhead, D.L., Lildman, H.G., 1994. Functional diversity of bacterial communities: a quantitative approach. Soil Biology and Biochemistry.. 26: 1101-1108.

Texas Tech University, Brandon Melester, August 2010
35
Table 2.1. Correlation matrix comparing soil nutrients and edaphic characteristics to Microbial Biomass Carbon from soil samples collected across the growing seasons of 2007-2008. All numbers represent r calculated using Pearson Correlation. The r values range from 1 to -1 with being a 100% positive correlation and -1 a 100% negative correlation. Significant r values are indicated in bold. Note [MBC= microbial biomass C, NO3 = soil extractable nitrate, NH4= soil extractable ammonium, P= soil extractable phosphorus, K= soil extractable potassium, Mg= soil extractable magnesium, Ca= soil extractable calcium, S= soil extractable sulfur, B= soil extractable boron, Zn= soil extractable zinc, Mn= soil extractable manganese, Fe= soil extractable iron, Cu= soil extractable copper, CEC= cation exchange].
NO3 NH4 pHw P K Mg Ca S B Zn Mn Fe Cu CEC
MBC 0.12 0.04 0.03 0.28 0.36 0.35 0.09 0.03 0.31 0.09 0.37 0.27 0.25 0.03
Table 2.2. Correlation matrix comparing soil extractable nutrients to Microbial Biomass Carbon from soil samples collect across the growing seasons of 2007-2008. All numbers represent r calculated using pearson correlation. The r values range from 1 to -1 with being a 100% positive correlation and -1 a 100% negative correlation. Significant r values are indicated in bold. Note [MBC= microbial biomass, Phosph= phosphodiesterase, Glucomini= β-glucosaminidase, Glucosidase= β-glucosidase, Alkaline= alkaline phosphatase, Alpha= α-galactasidase].
Phospho Gucomini Glucosi Alk Alpha
MBC -0.03 0.07 0.04 0.13 0.17

Texas Tech University, Brandon Melester, August 2010
36
Figure 2.1. Plot design established to study the effects of irrigation, nitrogen fertilization, and tillage on soil microbial dynamics and community structure associated with a peanut cropping system in semi-arid west-Texas in year 2007. The numbers indicated refer to the different Plots. Tillage treatment and Plot alignment remained the same in 2008. Irrigation and nitrogen treatments differed in Plots 1,2,5, and 6 in 2008.

Texas Tech University, Brandon Melester, August 2010
37
Figure 2.2. The effect of strip tillage compared to conventional tillage treatments on Microbial Biomass Carbon (MBC) associated with a peanut cropping system in semi-arid West Texas. (a)Total MBC from 2007-2008. Values are means± S.E., n= 96. (b) MBC in each of the summer and fall seasons in both 2007 and 2008. Values are means± S.E., n=24. Groups statistically (p ≤ 0.05) different are indicated with different letters above mean bars.
a.
Mic
rob
ial B
iom
ass C
(
g/
g s
oil)
100
200
300
400
500
600Conventional
Strip
a a
b. Summer 07 Fall 07 Summer 08 Fall 08
Mic
rob
ial B
iom
ass C
(
g/
g s
oil)
100
200
300
400
500
600
700Conventional
Strip
b
abb b
abab
a
ab

Texas Tech University, Brandon Melester, August 2010
38
Figure 2.3. The effect of late season drought (LSD) compared to full irrigation (Full) on Microbial Biomass Carbon (MBC). (a)Total MBC from 2007-2008. Values are means± S.E., n= 64. (b) MBC in each of the summer and fall seasons in both 2007 and 2008. Values are means± S.E., n=16. Groups statistically different are indicated with different letters above mean bars.
a.
Mic
rob
ial B
iom
ass C
(
g/
g s
oil)
100
200
300
400
500
600 Full
LSD a
b
b. Summer 07 Fall 07 Summer 08 Fall 08
Mic
robia
l B
iom
ass C
(
g/
g s
oil)
100
200
300
400
500
600
700Full
LSD
bc bc
ab
c
a
bc
a
ab

Texas Tech University, Brandon Melester, August 2010
39
Figure 2.4. The effect of late season drought (LSD) and early season drought (ESD) compared to full irrigation (Full) on Microbial Biomass Carbon (MBC). (a)Total MBC from 2007. Values are means± S.E., n= 32. (b) MBC in each of the summer and fall seasons in both 2007 and 2008. Values are means± S.E., n=16. Groups statistically different are indicated with different letters above mean bars.
a.
Mic
rob
ial B
iom
ass C
(
g/
g s
oil)
100
200
300
400
500
600
700Full
LSD
ESD a
bab
b. Summer 08 Fall 08
Mic
robia
l B
iom
ass C
(
g/
g s
oil)
100
200
300
400
500
600
700Full
LSD
ESD a
b
ab
a
ab ab

Texas Tech University, Brandon Melester, August 2010
40
Figure 2.5. The effect of nitrogen application compared to nitrogen application treatments on Microbial Biomass Carbon (MBC). (a)Total MBC from 2007-2008. Values are means± S.E., n= 32. (b) MBC in each of the summer and fall seasons in both 2007 and 2008. Values are means± S.E., n=16. Groups statistically (p ≤ 0.05) different are indicated with different letters above mean bars.
a.
Mic
rob
ial B
iom
ass C
(
g/
g s
oil)
100
200
300
400
500
600No nitrogen
nitrogen
a a
b. Summer 07 Fall 07
Mic
robia
l B
iom
ass C
(
g/
g s
oil)
100
200
300
400
500
600
700 No nitrogen
nitrogen
a
ab
c
bc

Texas Tech University, Brandon Melester, August 2010
41
Figure 2.6. (a) Discriminate function analysis (DFA) examining microbial and nutrient dynamics associated with different management programs associated with a peanut production system in semi-arid West Texas conditions in the various months in 2007 and 2008 using different enzyme activity levels, nutrient levels, and MBC as the parameters. Note [1= June 07, 2= July 07, 3= Sept. 07, 4= Oct. 07, 5= June 08, 6=July 08, 7=Sept. 08, 8= Oct. 08, Phosph= phosphodiesterase, Glucomini= β-glucosaminidase, Glucosidase= β-glucosidase, Alkaline= alkaline phosphatase, Algal= α-galactasidase, NO3 = soil extractable nitrate, NH4= soil extractable ammonium, P= soil extractable phosphorus, K= soil extractable potassium, Mg= soil extractable magnesium, Ca= soil extractable calcium, S= soil extractable sulfur, B= soil extractable boron, Zn= soil extractable zinc, Mn= soil extractable manganese, Fe= soil extractable iron, Cu= soil extractable copper, CEC= cation exchange, MBC= microbial biomass C].
a.
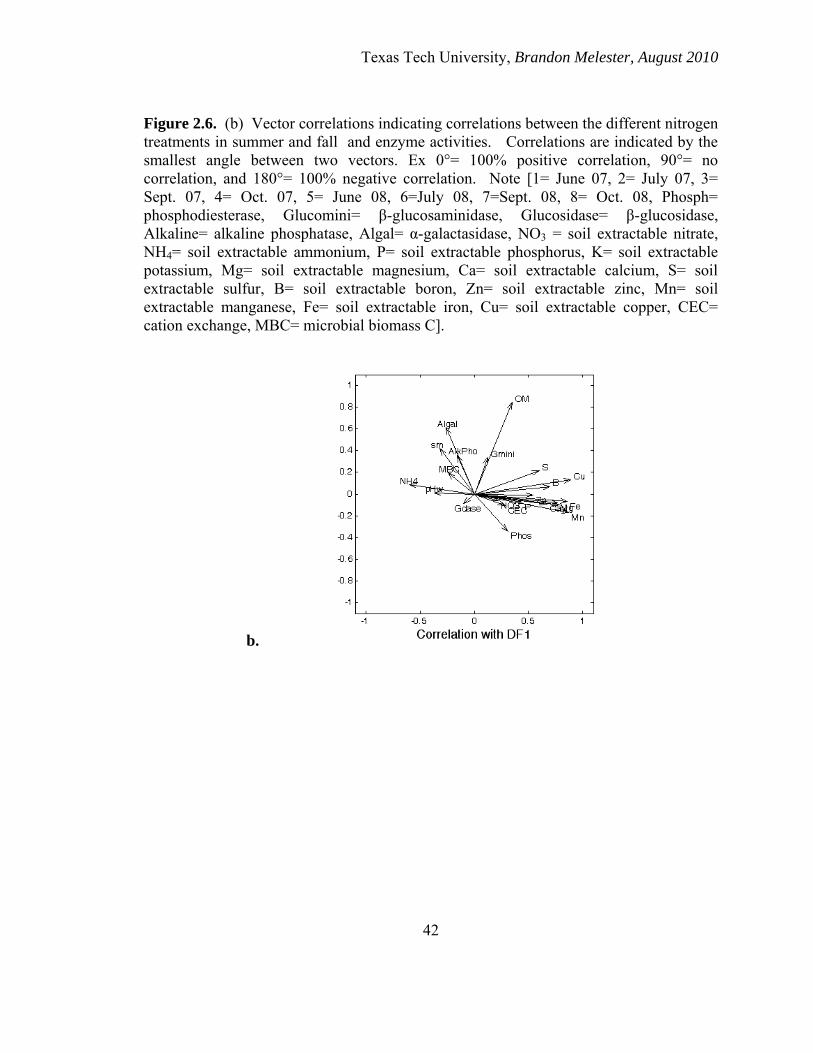
Texas Tech University, Brandon Melester, August 2010
42
Figure 2.6. (b) Vector correlations indicating correlations between the different nitrogen treatments in summer and fall and enzyme activities. Correlations are indicated by the smallest angle between two vectors. Ex 0°= 100% positive correlation, 90°= no correlation, and 180°= 100% negative correlation. Note [1= June 07, 2= July 07, 3= Sept. 07, 4= Oct. 07, 5= June 08, 6=July 08, 7=Sept. 08, 8= Oct. 08, Phosph= phosphodiesterase, Glucomini= β-glucosaminidase, Glucosidase= β-glucosidase, Alkaline= alkaline phosphatase, Algal= α-galactasidase, NO3 = soil extractable nitrate, NH4= soil extractable ammonium, P= soil extractable phosphorus, K= soil extractable potassium, Mg= soil extractable magnesium, Ca= soil extractable calcium, S= soil extractable sulfur, B= soil extractable boron, Zn= soil extractable zinc, Mn= soil extractable manganese, Fe= soil extractable iron, Cu= soil extractable copper, CEC= cation exchange, MBC= microbial biomass C].
b.
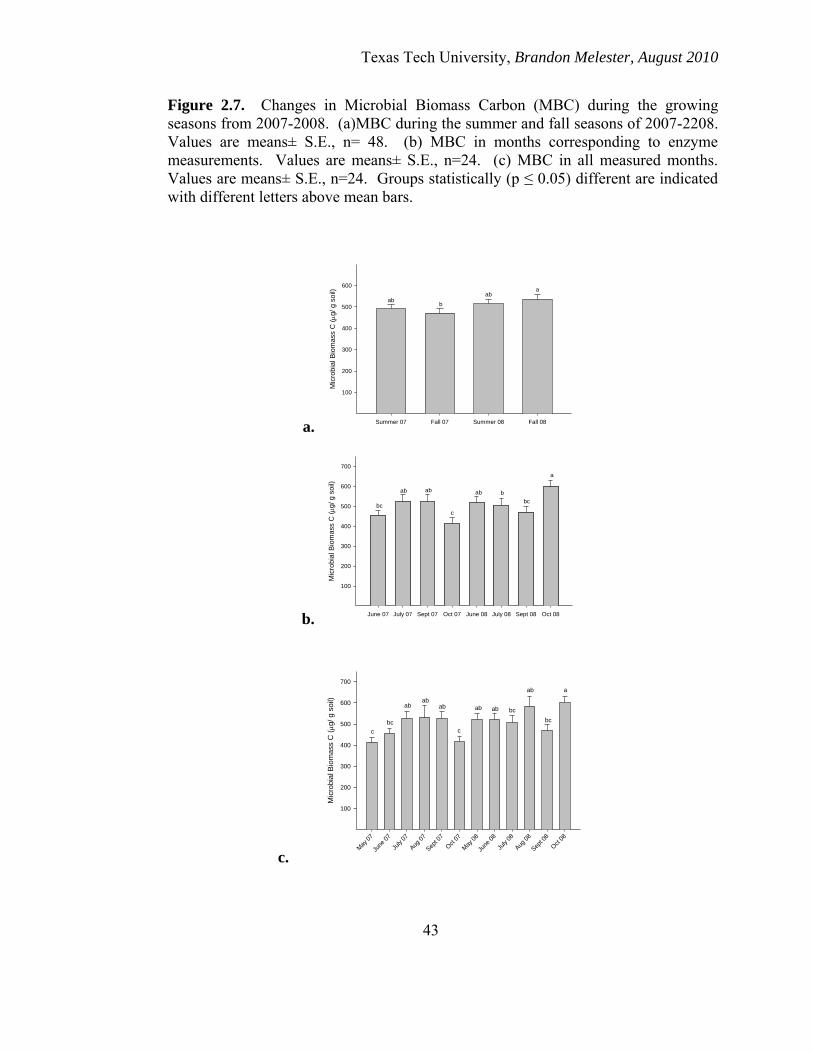
Texas Tech University, Brandon Melester, August 2010
43
Figure 2.7. Changes in Microbial Biomass Carbon (MBC) during the growing seasons from 2007-2008. (a)MBC during the summer and fall seasons of 2007-2208. Values are means± S.E., n= 48. (b) MBC in months corresponding to enzyme measurements. Values are means± S.E., n=24. (c) MBC in all measured months. Values are means± S.E., n=24. Groups statistically (p ≤ 0.05) different are indicated with different letters above mean bars.
a. Summer 07 Fall 07 Summer 08 Fall 08
Mic
rob
ial B
iom
ass C
(
g/
g s
oil)
100
200
300
400
500
600
b
aab
ab
b. June 07 July 07 Sept 07 Oct 07 June 08 July 08 Sept 08 Oct 08
Mic
rob
ial B
iom
ass C
(
g/
g s
oil)
100
200
300
400
500
600
700
bc
ab ab
c
ab b
bc
a
c. M
ay 0
7
June
07
July 0
7
Aug
07
Sep
t 07
Oct 0
7
May
08
June
08
July 0
8
Aug
08
Sep
t 08
Oct 0
8
Mic
robia
l B
iom
ass C
(
g/
g s
oil)
100
200
300
400
500
600
700
c
bc
abab
ab
c
ab ab bc
ab
bc
a

Texas Tech University, Brandon Melester, August 2010
44
Figure 2.8. Relative bacteria and fungi abundances measured by fatty acid methyl ester (FAME) analysis across two growing seasons in a peanut production system in West Texas. (A) Relative FAME abundance (%) of bacteria and fungi. (B) Change in the Fungal:Bacterial ratio during the growing seasons 2007-2008. Means were calculated by relative fungi abundance (%) over relative bacteria abundance (%). Groups statistically (p ≤ 0.05) different are indicated with different letters above mean bars.
a. Summer 07 Fall 07 Summer 08 Fall 08
Re
lative
Mic
rob
ial A
bu
nd
an
ce (
%)
10
15
20
25
30
Bacteria
Fungi
b. Summer 07 Fall 07 Summer 08 Fall 08
Re
lative
Mic
rob
ial A
bu
nd
an
ce (
%)
Fu
ngal:B
acte
rial R
atio
0.5
1.0
1.5
2.0
2.5
b
a
c
b
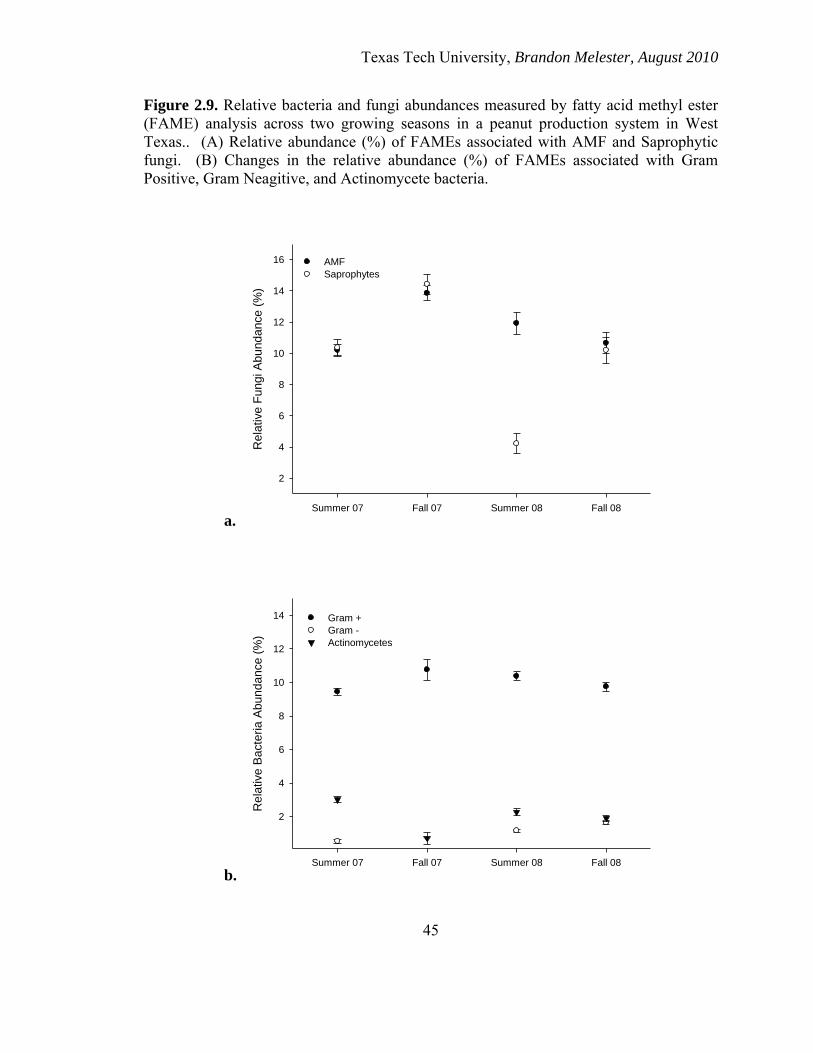
Texas Tech University, Brandon Melester, August 2010
45
Figure 2.9. Relative bacteria and fungi abundances measured by fatty acid methyl ester (FAME) analysis across two growing seasons in a peanut production system in West Texas.. (A) Relative abundance (%) of FAMEs associated with AMF and Saprophytic fungi. (B) Changes in the relative abundance (%) of FAMEs associated with Gram Positive, Gram Neagitive, and Actinomycete bacteria.
a. Summer 07 Fall 07 Summer 08 Fall 08
Re
lative
Fu
ngi A
bun
da
nce (
%)
2
4
6
8
10
12
14
16 AMF
Saprophytes
b. Summer 07 Fall 07 Summer 08 Fall 08
Re
lative
Ba
cte
ria
Ab
un
da
nce (
%)
2
4
6
8
10
12
14 Gram +
Gram -
Actinomycetes
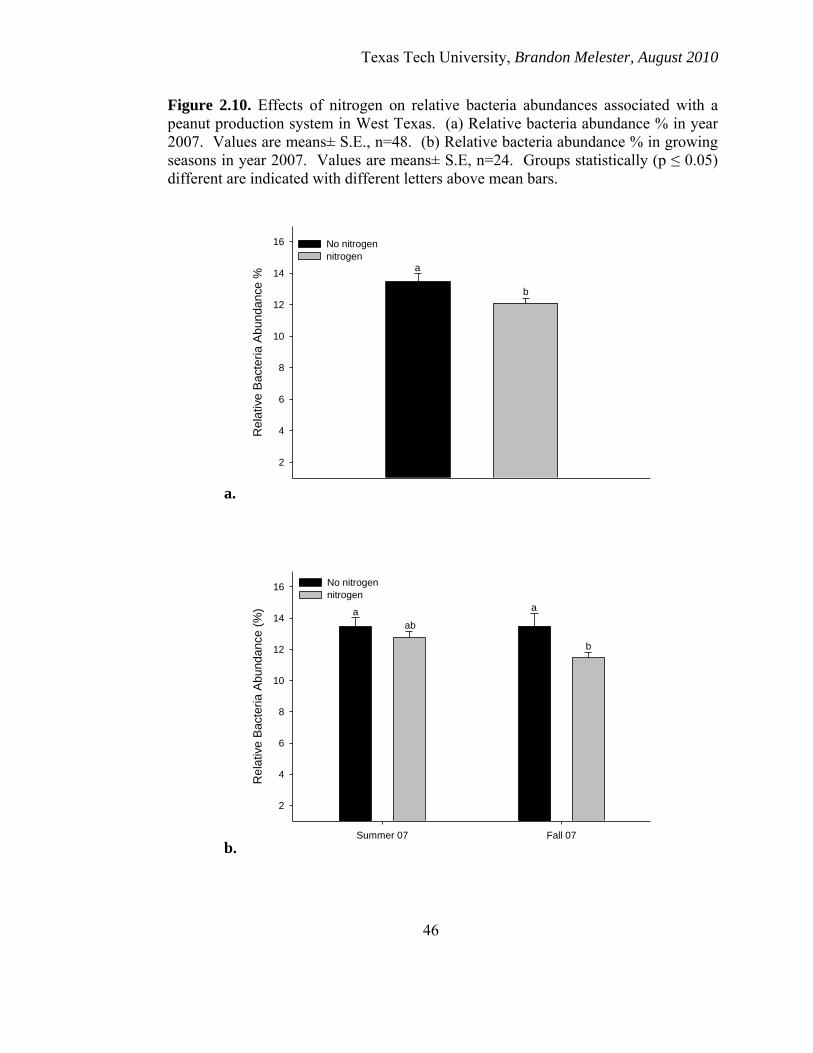
Texas Tech University, Brandon Melester, August 2010
46
Figure 2.10. Effects of nitrogen on relative bacteria abundances associated with a peanut production system in West Texas. (a) Relative bacteria abundance % in year 2007. Values are means± S.E., n=48. (b) Relative bacteria abundance % in growing seasons in year 2007. Values are means± S.E, n=24. Groups statistically (p ≤ 0.05) different are indicated with different letters above mean bars.
a.
Re
lative
Ba
cte
ria
Ab
un
da
nce
%
2
4
6
8
10
12
14
16 No nitrogen
nitrogen a
b
b. Summer 07 Fall 07
Rela
tive B
acte
ria A
bunda
nce (
%)
2
4
6
8
10
12
14
16 No nitrogen
nitrogen
a
ab
a
b

Texas Tech University, Brandon Melester, August 2010
47
Figure 2.11. Effects of nitrogen on relative fungi abundance associated with a peanut production system in West Texas. (a) Relative fungi abundance % in year 2007. Values are means± S.E., n=48. (b) Relative fungi abundance % in growing seasons in year 2007. Values are means± S.E, n=24. Groups statistically (p ≤ 0.05) different are indicated with different letters above mean bars.
a.
Re
lative
Fu
ngi A
bu
nd
an
ce
(%
)
5
10
15
20
25
30No nitrogen
nitrogen
a
a
b. Summer 07 Fall 07
Rela
tive F
ungi A
bunda
nce (
%)
10
20
30
No nitrogen
nitrogen
c c
b
a

Texas Tech University, Brandon Melester, August 2010
48
Figure 2.12. Effects of irrigation on relative Gram-Positive bacteria abundance associated with a peanut production system in West Texas. (a) Relative gram-positive bacteria abundance % in year 2007 & 2008. Values are means± S.E. (b) Relative Gram-Positive abundance % in growing seasons in years 2007 & 2008. Values are means± S.E. Groups statistically (p ≤ 0.05) different are indicated with different letters above mean bars.
a.
Re
lative
Gra
m-P
ositiv
e B
acte
ria
Ab
un
da
nce
(%
)
2
4
6
8
10
12Full Irrigation
LSD a
b
b. Summer 07 Fall 07 Summer 08 Fall 08
Rela
tive G
ram
-Positiv
e B
acte
ria A
bunda
nce (
%)
2
4
6
8
10
12
14 Full Irrigation
LSD
abcbc
a
c
ab
abc ab
abc

Texas Tech University, Brandon Melester, August 2010
49
Figure 2.13. Effects of irrigation on relative Gram-Negative bacteria abundance %. (a) Differences In relative gram-negative bacteria abundance % in year 2007 & 2008. Values are means± S.E. (b) Differences in relative Gram-Negative abundance % in growing seasons in years 2007 & 2008. Values are means± S.E. Groups statistically (p ≤ 0.05) different are indicated with different letters above mean bars. * indicates values too low to be displayed on graph.
a.
Re
lative
Gra
m-N
ega
tive
Ba
cte
ria
Ab
un
da
ce
(%
)
0.2
0.4
0.6
0.8
1.0
1.2Full Irrigation
LSD
b
a
b. Summer 07 Fall 07 Summer 08 Fall 08
Rela
tive G
ram
-Negative B
acte
ria A
bunda
nce (
%)
0.5
1.0
1.5
2.0
2.5 Full Irrigation
LSD a
bb
bc
cc
*

Texas Tech University, Brandon Melester, August 2010
50
CHAPTER 3
EFFECTS OF MANAGEMENT PRACTICES IN A SEMI-ARID AGROECOSYSTEM
ON SOIL MICROBIAL ENZYMATIC ACTIVITY
Introduction
Enzymes are biological catalysts that facilitate reactions without undergoing
permanent chemical changes and are necessary for any biochemical reaction to take place
under most natural conditions. In all terrestrial ecosystems, microbial enzymes are
essential to perform necessary ecosystem processes by breaking down organic and
inorganic compounds into useable forms for subsequent biomass production by plants
and soil microbes. While the production of enzymes have multiple levels of regulation,
from their synthesis to their reactivity, for microbial enzymes excreted into the soil,
activity is influenced by soil pH, ionic strength, soil temperature, and the presence and
absence of clay and organic matter that can bind soil enzymes (Dick and Tabatabai
1993).
For the soil ecosystem, enzymes can be found both in the form of intracellular
enzymes and extracellular enzymes. While soil enzymes originate mainly from plants
and microorganisms, the largest portion originates from the microbial biomass (Tabatabai
1994). As bacteria and fungi are the main source of enzymes in the soils the composition
and abundance of microbes that produce these degradative enzymes controls soil
processes (Acosta-Martinez et al. 2004). Decomposition rates, nutrient cycling,
decomposition of xenobiotics, and soil aggregation are critical soil processes that are
controlled by the microbial enzyme activities (Barea et al. 1996, Reynolds et al. 2003).

Texas Tech University, Brandon Melester, August 2010
51
Once extracellular enzymes are produced the activity of these molecules can become
uncoupled from biological activity. While extracellular enzymes can be degraded over
time, a significant portion becomes stabilized by binding to clay particles and forming
complexes (Boyd and Mortland 1990). The enzymes in these enzyme-clay complexes
still have activity but their activity is significantly reduced, thus directly impacting rates
of critical ecosystem processes. Formation of these complexes with clay can also causes
the enzymes to be immobilized, thus completely decreasing activity (Dick and Tabatabai
1987). For most terrestrial ecosystems it is known that the activity and production of
extracellular enzymes are influenced by vegetation composition, agricultural practices,
such as tillage and chemical applications, and levels of organic matter (Tabatabai 1994).
It is not unreasonable to expect the management practices used in agriculture soils can
have affects on the activity of the enzymes in the soils (Bandick and Dick 1999).
Changes in concentration and activity of certain extracellular enzymes in the soil
can have strong impacts on the nutrient cycles of those soils. Substantial changes in the
dynamics of extracellular enzymes will often be seen in the rhizosphere region where
previous research has shown greater enzymatic activity than that of non-rhizosphere soils
(e.g. Dick 1994). This can be explained by the greater amount of plant material and
microorganisms and species diversity associated with the rhizosphere compared to the
bulk soil. The roots themselves excrete carbon to stimulate microbial activity that can
increase the production of microbial enzymes (Dick 1994). Soil enzymes can lead to
higher levels of crop yields when the byproducts of their reactions including increased
mineralization are utilized by the roots in the rhizosphere (Dick and Tabatabai 1993).

Texas Tech University, Brandon Melester, August 2010
52
The activity of many soil enzymes has been found to correlate with the fertility status of
soils (Dick and Tabatabai 1993) and enzyme assays give an estimate of the microbial
activity of the soil in relationship to the management practices that are employed.
For agricultural systems, enumerating the seasonal levels of hydrolases,
phosphatases, phosphodiesterase and β-glucosidase (e.g., Acosta Martinez et al. 2009)
provide key insight to the soil quality of the system. Hydrolases are a class of enzymes
that catalyze the hydrolysis of proteins, nucleic acids, starches, fats, phosphoric acids,
and other macromolecule substances. Included in the hydrolases are the phosphatase
enzymes which catalyze the hydrolysis of esters and anhydrides of phosphoric acids.
Phosphatses play important roles in P and N cycles in soils making them valuable
enzymes to examine when trying to understand microbial dynamics (Dick and Tabatabai
1993). Acid phosphatase or alkaline phosphatase, phosphodiesterase, β-glucosidase, α-
galactosidase, and β-glucosaminidase all contribute to P and N dynamics in soils.
Acid phosphatase and alkaline phosphatase are two important
phosphomonoesterases that have been shown to be pivotal in soil organic P
mineralization and have been seen to be specifically involved in hydrolysis in soils of β-
glycerophosphate, phenylphosphate, β-napthyl phosphate, and p-nitrophenyl (Tabatabai
1994). The two enzymes differ in pH ranges of their optimum activity. Acid
phosphatases have optimum activity in the acidic pH ranges and are usually most active
in soils with a pH of around 6. Alkaline phosphatases have optimum activity in the
alkaline pH ranges and have been shown to be most active with a pH of around 8 (Dick
and Tabatabai 1993). The activity of acid and alkaline phosphatase has been shown to

Texas Tech University, Brandon Melester, August 2010
53
become more active in certain cropping systems as organic P becomes more limited
(Baligar et al. 1988).
Phosphodiesterase has been the least studied phosphatase in soils and is believed
to potentially be an important component of the P cycle and contributes to the
degradation of nucleic acids in the soil (Tabatabai 1994). Moreover, Phosphodiesterase
has been suggested to be an extracellular enzyme utilized by Arbuscular Mycorrhizal
fungi in their symbiosis with plants (Lindahl et al. 2005).
β-glucosidase is an important extracellular soil enzyme that provides a major
energy source for soil microbes and has been positively correlated to crop yields (Dick
1997). β-glucosaminidase is a key extracellular enzyme involved in N mineralization
that hydrolyzes C-N bonds of organic sugars free NH3 that can be uptaken by plants
(Dick 1997, Ekenler and Tabatabai 2002). α-galactosidase is another enzyme involved in
C dynamics by hydrolyzing melibiose and lactose (Dick 1997).
Tillage and crop-residue management can have significant impacts on microbial
mediated biochemical reactions in the soil (Dalal 1989, Spedding et al. 2004). These
impacts are the result of the effects the tillage practices on altering the distribution, and
activities of soil microbial communities and in turn an effect on the soil microbial
enzymes (Dick 1984). Organic C and N have been shown to accumulate at the soil
surface (0-2. cm) under reduced tillage involving crop residue placement (Havlin et al.
1990). Extracellular soil enzymes have been shown to be significantly affected by tillage
(Deng and Tabatabai 1996) and in general have lower activity in no-tillage management
compared to conventional tillage (Doran 1980, Angers et al. 1993).

Texas Tech University, Brandon Melester, August 2010
54
The objective of this component of the overall project was to evaluate the response of the
microbial activity (enzyme production) to tillage, irrigation, and nitrogen of a peanut
cropping system in semi-arid soils.
Methods Plot Design
Field plots for this two year study (2007 and 2008) were established at the USDA-
ARS Cropping System Research Laboratory in Lubbock, Texas USA (101⁰ 47’ west
longitude; 33⁰ 45’ north latitude; 993m elevation. The field soil was a mixed superactive,
thermic and aridic soil (Olton clay loam) and are classified as Paleustolls (Bronson et al.
2004). Previous to the initiation of this study, the field was used for continuous cotton
production under conventional tillage for a duration of 6 growing seasons. The circular
field was portioned into 36 concentric rows prior to the initiation of this study in
November 2006. Approximately 1.3 hectares (3.3 acres), one half of a circular field was
prepared for peanut production to assess the impacts of irrigation, nitrogen, and tillage on
soil microbial dynamics and microbial functionality.
The sample site was divided into six equally sized triangular plots that are labeled
plots 1-6. Every two plots receive the same imposed conditions so that there were two
replicates for each treatment. Within each of the plots, different tillage techniques were
applied alternating between conventional tillage and strip tillage zones. In the
conventional tillage rows there is rye planted in the furrow only and in the strip tillage
portions rye is planted across the bed and the furrow. The plots alternate between zones

Texas Tech University, Brandon Melester, August 2010
55
of strip and conventional tillage rows respectively starting from the outside of the plots.
There are two strips and two conventional tillage sections within each zone. Two
alternating conventional and strip tillage sections of six rows each were sampled in each
plot.
Zone 1 and 2 served as the control and did not receive nitrogen fertilizer in year
2007. The remaining zones 3, 4, 5, and 6 received 30lb/acre (33.6 kg/Hectare) of URAN
(Urea Ammonium Nitrate) on July 25th, August 9th, August 27th, September 24th and
September 24th in 2007. In 2008, zones 1 through 6 received URAN 35 lb/acre (39.2
Kg/Ha) on July 8th, August 1st and September 2nd. All 6 zones received nitrogen
fertilization in 2008.
In 2007, two levels of irrigation were implemented. Zone 1, 2, 5 and 6 served as
controls and received full irrigation (100-100-100% EvapoTranspiration (ET)). 100% ET
irrigation is defined as the amount of water supplemented to the crop equaling the total
loss of water through evaporation (water lost from the soil to the atmosphere) and the
total transpiration (subsequent water lost from aerial parts of the plant). For 2007 full
irrigation was determined to be 1.5 inches of water. The late growing seasons last from
beginning of August till the end of October. Zones 3 and 4 were kept under late deficit
treatment (100-100-50%ET), applying only 0.75 inch of irrigation (half) during the last
90 days while maintain full irrigation prior to. There were 3 levels of irrigation in year
2008. Zones 1 and 2 received full irrigation (100-100-100%ET). Zones 3 and 4 were
kept under late deficit treatment (100-100-50%ET). Zones 5 and 6 were under early

Texas Tech University, Brandon Melester, August 2010
56
deficit irrigation. They were irrigated with half of the regular irrigation 90.75 inch
quantity in initial 45 days (beginning of May to mid-June).
Crop Management Treatments
In 2007, the treatments applied to the field were: 1) Full Irrigation and no
Nitrogen (plots 1 & 2), 2) Nitrogen and a Late Season Drought (plots 3 &4), and 3) Full
Irrigation and added Nitrogen (plots 5 & 6). In 2008, the applied treatments were: 1) Full
Irrigation and added Nitrogen (plots 1 & 2), 2) Late Season Drought and added Nitrogen
(plots 3 & 4), and 3) an Early Season Drought and added Nitrogen (plots 5 & 6). As with
2007 there were alternating conventional and strip tillage rows that were sampled (Figure
3.1).
Sampling
Four soil samples were taken within each plot; two from conventional tillage rows
and two strip tillage rows. For each sample, soil was collected from three different
locations across the plot to account for any variations that may be present within each
section of the zone and combined per row. Soil samples were collected from depth of
15cm, with approximately 330g of samples taken for each replicate sample. Once
samples were taken, they were kept in a cooler and stored at 4⁰ C until they were
processed for enzymatic analysis.

Texas Tech University, Brandon Melester, August 2010
57
Enzyme Assays
Alkaline phosphatase, phosphodiesterase, β-glucosaminidase, β-glucosidase, and
α-galactosidase were measured for activity in all samples following the procedures
described by Tabatabai (1994) at their optimal pH value. Results were expressed in
milligrams of p –nitrophenol released per kilogram soil per hour (Acosta-Martinez et. al.
2003). Absorbance was measured at 400 nm, the optimal wavelength of p –nitrophenol
(Eril and Avci 2002).
Data Analysis
Differences in individual enzymatic activities in response to different
management practices were evaluated using one-way ANOVA. The overall impacts of
management affects on the total microbial enzymatic activities of the soil and total
nutrient influence of the soil were evaluated using mANOVA. Influences of soil
nutrients levels on enzymatic activities and the influence of the enzyme levels on each
other were evaluated using bivariate correlations. All analyses were performed using
SPSS 14.0 for windows. Each data set underwent the Least Significant Difference (LSD)
post hoc test when significance (p ≤ 0.05) was indicated on the one-way ANOVA and
mANOVA.
Discriminant function analysis (DFA) was employed to visualize microbial
responses to managanement practices in multivariate space, using MATLAB (Natick,
Massachusetts). DFA analyzed microbial responses to 2007 and 2008 separately. For
each DFA, 1000 randomized (bootstrap) iterations were performed in order to build null
distributions from which to compare actual sampling distribution.

Texas Tech University, Brandon Melester, August 2010
58
Results
Effect of Irrigation
Full Irrigation vs. Late Season Drought (LSD) for the 2007-2008 growing seasons
Phosphodiesterase Activity
There was not a significant (p = 0.065) effect of the LSD treatment on
phosophodiesterase activity when compared to the full irrigation control (Figure 3.2a)
over the two year period. However, there did appear to be the trend of higher levels of
phosphodiesterase activity in the full irrigation treatment when compared to the levels
seen in the LSD treatment. This pattern was further revealed when the phosphodiesterase
levels between the two treatments were compared throughout the individual seasons.
Phosphodiesterase activities were consistently greater (p ≤ 0.05) under full irrigation
treatment than when exposed to late season drought in the fall months of 2007 (Figure
3.2b).
β-Glucosaminidase Activity
β-glucosaminidase activity did not differ in response to irrigation (p= 0.137)
(Figure 3.3a). There was a noticeable pattern of higher β-glucosaminidase under full
irrigation than LSD β-glucosaminidase levels. This was seen in the summer months of
2008 when the β-glucosaminidase levels of the Full Irrigation treatment were
significantly (p ≤ 0.05) higher than that of the β-glucosaminidase levels of the LSD
treatment (Figure 3.3b).

Texas Tech University, Brandon Melester, August 2010
59
β-Glucosidase Activity
The effect of the full irrigation treatment was overall significantly (p ≤ 0.05)
greater than that of the LSD treatment on the levels of β-glucosidase activity across both
sampling seasons (Figure 3.4a). The effect of irrigation treatment resulted from the fall
months of 2007, in which the full irrigation treatment produced significantly (p ≤ 0.05)
higher β-glucosidase levels than the LSD treatment for this same period (Figure 3.4b).
Alkaline Phosphatase Activity
There was no significant (p= 0.44) difference seen between the full irrigation
treatment and the LSD treatment on the overall levels of alkaline phosphatase activity
across both sampling seasons (Figure 3.5a). This trend of no difference between the two
treatments was observed in each of the summer and fall seasons in 2007 and 2008
respectively (Figure 3.5b).
α-Galactosidase Activity The activity levels of α-galactosidase did not exhibit any overall difference (p=
0.754) between the full and LSD irrigation treatments (Figure 3.6a). Furthermore, no
difference could be seen in the summer and fall months in both 2007 and 2008 (Figure
3.6b).
Full Irrigation vs. Late Season Drought (LSD) vs. Early Season Drought (ESD) during
growing season of 2008
The mANOVA showed that there was not a significant difference between the
three irrigation treatments when all enzymes are used. Furthermore, DFAs showed that

Texas Tech University, Brandon Melester, August 2010
60
the irrigation treatment groups do not separate out for both years combined (Figure 3.7a).
However, if either phosphodiesterase or α-galactosidase data are removed as parameters
the mANOVA detected significant differences across irrigation treatments (p ≤ 0.05).
Phosphodiesterase and α-galactosidase activity levels were shown to be affected the least
by the three irrigation treatments (Figure 3.7b). One-way ANOVA showed that there
were significant (p ≤ 0.05) differences between the LSD and ESD treatments for β-
glucosaminidase and alkaline phosphatase activity levels with full higher levels in
response to ESD treatments. A significant difference between full vs. LSD for β-
glucosidase activity levels was seen with full irrigation producing higher enzymatic
activity levels (Tale 3.1).
Effects of Nitrogen
No nitrogen vs. Nitrogen Application: 2007
Effect on combined enzyme activity
The mANOVA indicated that the addition of nitrogen did not have a significant
effect on the combined enzyme activity compared to the no nitrogen treatment. There
were patterns seen on the levels of enzyme activities for the individual enzymes and the
effect of the two treatments varied depending on the Individual enzyme examined across
the growing season (Figure 3.8).
Phosphodiesterase Activity
There were no significant (p = 0.263) effect on phosphodiesterase levels between
the nitrogen and no nitrogen treatment (Figure 3.9a). There were also no seasonal

Texas Tech University, Brandon Melester, August 2010
61
differences seen between the phosphodiesterase activity levels in the two treatments
(Figure 3.9b).
β-Glucosaminidase Activity
There were no significant (p= 0.086) effects of nitrogen on the overall levels of β-
glucosaminidase activities. However there did appear to be a trend of lower levels
associated with the nitrogen treatments across the growing seasons (Figure 3.10a).
When looking at the summer and fall seasons, there are no statistical significant
differences between the two treatments (Figure 3.10b).
β-Glucosidase Activity
The nitrogen and no nitrogen treatments showed no significant (p= 0.685)
differences in the overall β-glucosidase activity levels (Figure 3.11a). The nitrogen
treatment did display significantly (p ≤ 0.05) greater β-glucosidase activity levels in the
fall than that of the no nitrogen treatment (Figure 3.11b).
Alkaline Phosphatase Activity
The overall levels of alkaline phosphatase activity appeared to be greater with the
no nitrogen treatment compared to treatment with nitrogen (Figure 3.12a) but there
wasn’t a significant (p= 0.111) difference. The no nitrogen treatment was statistically no
greater than the nitrogen treatment in both the summer and fall season even though it
appeared to have a pattern of greater alkaline phosphates activity (Figure 3.12b).

Texas Tech University, Brandon Melester, August 2010
62
α-Galactosidase Activity
There were no significant differences (p= 0.652) between the nitrogen and no
nitrogen treatment on the overall α-galactosidase activity levels (Figure 3.13a). The
activity of this enzyme did not differ across season irrespective of the addition of nitrogen
(Figure 3.13b).
Combined enzymatic effect across growing seasons in 2007
The mANOVA found that the there were no significant (p≤ 0.05) differences
between the no nitrogen and nitrogen treatments for all enzymes combined for either the
summer or fall seasons. However, enzyme activities under nitrogen addition during
summer sampling approached significant differences in comparison to no-nitrogen
summer (p= 0.092) and no nitrogen fall (p= 0.082). There was a significant seasonal
difference (p ≤ 0.001) difference seen between the summer and fall nitrogen treatments.
This was further seen in DFA which displayed a separation between the nitrogen summer
treatments from the rest of the treatments (Figure 3.14a). This separation was driven
most by the levels of β-glucosidase activity (Figure 3.14b).
Tillage Effects: Conventional vs. Strip (2007-2008)
Phosphodiesterase Activity
Levels of phosphodiesterase activity were overall higher under conventional
tillage than activity levels across years under strip-tillage (Figure 3.15a) but the levels
were not significantly different (p= 0.77). Moreover, the enzyme activity levels between
the two treatments were not significantly different during any of the summer or fall

Texas Tech University, Brandon Melester, August 2010
63
seasons in 2007 and 2008. However, the fall season of 2008 had significantly lower
levels of phosphodiesterase activity than all the other seasons for both tillage treatments
(Figure 3.15b).
β-Glucosaminidase Activity There was no significant (p= 0.424) difference in β-glucosaminidase between the
conventional and tillage treatments on the overall levels of β-glucosaminidase activity
across all seasons (Figure 3.16a). Within seasons, β-glucosaminidase levels differed only
during the 2008 season when the summer levels were significantly higher for the
conventional summer and the strip fall of 2008 (Figure 3.16b).
β-Glucosidase Activity
There was no significant difference (p= 0.412) between the overall levels of β-
glucosidase activity between the conventional and strip tillage treatments across both
growing seasons (Figure 3.17a). There were no significant (p ≤ 0.05) differences in β-
glucosidase activity levels between the two tillage treatments within any of the seasons.
However, there was an observed seasonal difference as the summer seasons had
significantly lower levels of activity than the fall seasons for both the conventional and
strip tillage treatments (Figure 3.17b).
Alkaline Phosphatase Activity
There was no significant difference (p= 0.736) between the overall levels of
alkaline phosphatase activity between the conventional and strip tillage treatments across
both years (Figure 3.18a). While there were no significant (p ≤ 0.05) difference observed

Texas Tech University, Brandon Melester, August 2010
64
in alkaline phosphatase levels between the two treatments within any of the seasons,
alkaline phosphatase levels for the strip tillage treatments in 2007 were lower than those
observed under conventional tillage (Figure 3.18b). However, for the 2008 growing
season, the levels of alkaline phosphatase activities were higher during the fall under the
strip tillage treatment.
α-Galactosidase Activity
Across both growing seasons, α-galactosidase activity was not significantly
different between the conventional and strip tillage treatments (p= 0.373) (Figure 3.19a).
There were no significant (p ≤ 0.05) differences between the two tillage treatments within
any of the seasons, however the α-galactosidase levels were significantly less in 2007
than 2008 for both treatments (Figure 3. 19b).
Combined enzymatic and nutrient effect
The mANOVA indicated that tillage did not impact the total soil nutrient and
extracellular enzyme dynamics (p= 0.575). However, when examining the annual tillage
effect there was a separation of the different groups (p ≤ 0.001). Discriminate function
analysis (Figure 3.20) displayed the groups separating out by different years. There was
a complete separation among the nutrient and enzymatic effects of the conventional
treatment between 2007 and 2008. The DFA did not show a complete separation
between nutrient and enzyme dynamics between the strip 2007 treatment and strip 2008
treatment but the subsequent ANOVA indicated that overall nutrient and enzymatic
levels were significantly different between the two growing years (p ≤ 0.001).

Texas Tech University, Brandon Melester, August 2010
65
Effect of nutrients
Correlation between nutrient levels and enzyme levels
Ammonium (NH4) and organic matter (OM) levels had the highest correlations
with individual enzyme. Phosphodiesterase activities showed correlated (-0.43) with
NH4 levels. OM was shown to have the strongest and largest number of significant
correlations with the most enzymes with including phosphodiesterase (-0.21), β-
glucosaminidase (0.33), alkaline phosphatase (0.29), along with α-galactosidase (0.43).
The levels of β-glucosaminidase was the least related to any of the soil nutrient
parameters measured (Table 3.2).
Correlations between enzyme activity levels
Alkaline phosphatase and α-galactosidase showed the strongest significant
correlation (36%) of activity levels followed by β-glucosaminidase and α-galactosidase
(33%). Activity of β-glucosaminidase had the most significant correlations with other
(Table 3.3).
Changes in key nutrient levels (growing seasons of 2007-2008)
Soil Extractable Nitrate
NO3 levels were highly variable across all treatments in 2007 compared to the
levels in 2008 (Figure 3.21). There was no statistical difference between NO3 levels in
the summer and fall of 2008. There was much more variability in the NO3 levels in the
different seasons during 2007. The levels in the summer of 2007 were statistically
Texas Tech University, Brandon Melester, August 2010
66
greater than levels seen in any other season in any of the two years. Conversely, the
levels in the fall of 2007 were statistically lower than any other season in either of the
two years (Figure 3.21).
Soil Extractable Ammonium (NH4) Dynamics
NH4 levels across all treatments remained very consistent from the summer of
2007 through the summer of 2008 (Figure 3.22). In the fall 2008 the levels showed a
significant increase. NH4 levels in the fall of 2008 exhibited 15 fold increase when
compared to the NH4 levels from the summer 2008 growing season (Figure 3.22).
Soil Phosphorus (P) dynamics
P levels showed no statistical (p ≤ 0.05) differences between the seasons within an
individual year but exhibited significant differences between the two years irrespective of
season (Figure 3.23).
% Soil Organic Matter (OM) dynamics
OM levels remained almost completely consistent throughout the 2007 and 2008
growing season with one exception. The levels of soil organic matter (OM) were
significantly (p ≤ 0.05) greater in the summer of 2008 than either season of 2007 or the
fall of 2008 (Figure 3.24).

Texas Tech University, Brandon Melester, August 2010
67
Discussion
The worlds’ population is continually proliferating and as a result so must the
worlds’ food supply. Increasing the efficiency of modern agriculture will be monumental
in helping to meet the ever rising food demands of a growing human population. Current
agricultural practices such as chemical inputs and irrigation are becoming more
expensive and are not as sustainable as low-input systems (Clark et al. 1998, Zak and
McMichael 2001). Furthermore, global climate changes may present even more
difficulties in maintaining and improving on current productivity (Adam et al. 1990).
Finding low input solutions to maximizing agricultural production will not only cut down
on cost and potentially increase productivity but will also help create more sustainable
agroecosystems even in a more unpredictable climate (Stainforth et al. 2005).
Understanding how agricultural practices affect the microbial dynamics of the soil will be
essential to developing the most effective and sustainable agroecosystems. Determining
which tillage technique, irrigation strategies, and fertilizer application are the best for a
particular agroecosystem will be the key to developing the most efficient system. The
semi-arid conditions in West Texas impose unique challenges to developing sustainable
production systems under increasing costs of fertilizers and greater demands for limited
water supplies.
Effects of Irrigation
As full irrigation maintained higher plant growth and provided consistently
optimum conditions for microbial activity, one would expect the highest levels of enzyme
Texas Tech University, Brandon Melester, August 2010
68
activities under these conditions thin in either early of late season drought. The latter two
treatments were established to determine if a reduction in irrigation at specific periods in
crop growth would not have detrimental effects. Full irrigation only produced
significantly (p ≤ 0.05) greater activity levels for β-glucosidase suggesting that having
consistent moisture alone will not provide for maximum microbial activity.
β-glucosaminidase and alkaline phosphatase did not show any differences to the
overall response to the different irrigation treatments but the ANOVA confirmed that
they did show significant differences between the late season drought treatment and the
early season drought treatment within particular seasons. This seasonal pattern may
suggest that β-glucosaminidase and alkaline phosphatase production is highly dependent
on when adequate soil moisture available. Both enzymes displayed significantly greater
activity levels in the early season drought treatment than they did in the late season
drought treatment in 2008 suggesting that seasonal differences in either production or the
densities of microbes producing these enzymes may be contributing to the observed
pattern.
Response to nitrogen application
Levels of β-glucosaminidase showed the strongest response to nitrogen
significantly increasing with its input. This result was to be expected due to its role in N
cycling by breaking C-N bonds of amides and releasing NH3 in the process used in N
mineralization which provides a useable form of N for plants (Dick, 1997). Moreover β-
glucosaminidase can contribute 5-10% of the organic N in the soil surface by hydrolyzing

Texas Tech University, Brandon Melester, August 2010
69
amino sugars (Ekenler and Tabatabai, 2002). This result suggest that β-glucosaminidase
is aiding in N cycling.
β-glucosidase is involved in the hydrolysis of glycosidic molecules releasing
glucose to be used for and energy source for the micro flora (Dick 1997) and would not
be expected to be strongly affected by N inputs. It indeed did not display an overall
response to the nitrogen application but did show significantly greater levels of activity
with nitrogen application in the fall season. One explanation for this observation is a lag
response to altered C:N ratios in the soil from plant growth during the summer. Soil
enzymes have been shown to respond to changing C:N ratios in soil (Sinsabaugh et al.
2005) and β-glucosidase is directly involved in soil C dynamics.
Alkaline phosphatase showed consistently lower levels of activity in the nitrogen
treated plots compared to the no nitrogen treatment. This trend may be a result of
nitrogen addition creating a competitive disadvantage to organisms that secrete alkaline
phosphatase.
Response to tillage type
Soil enzymes can be accurate and sensitive indicators to agricultural management
treatments (Deng & Tabatabai, 1996, Dick 1997, Burns and Dick 2002) including the
short-term effects of tillage practices (Kandeler et al. 1999). However, this hasn’t always
been shown to be the case. Conversely, studies have shown that soil enzymes do not
always respond to changes in tillage (Mina et al. 2008). In this study, tillage had no
impact on the activity of any of the extracellular soil enzymes measured within seasons or

Texas Tech University, Brandon Melester, August 2010
70
overall in this study. The lack of a functional response to tillage treatments could have
been affected by the soil composition of the agricultural plots in this study or the
cropping system studied. Tietjen showed that clay-enzyme complexes can reduce the
activity of alkaline phosphatase but increased the activity of β-glucosidase. Clay
particles can also indirectly affect the activity of various soil enzymes forming bonds to
other cationic particles which can alter the pH affecting the optimal activity or interact
with the enzymes themselves (Boyd and Mortaland 1990). The affects of tillage
treatment on the functional responses in the soil measured by enzymatic activity may
indeed be there but outweighed by the effect of the formation of clay-enzyme complexes.
Influence of nutrients and other enzymes on enzymatic activity levels
Soil organic matter (OM) had the broadest correlation with enzyme activity
levels, significantly correlating with phosphodiesterase, β-glucosaminidase, alkaline
phosphatase, and α-galactosidase, the most notable being β-glucosaminidase (33%) and
α-galactosidase (43%). This result is consistent with other research which has shown
OM to be a driving force in N mineralization and C cycling (Fontaine et al. 2003),
processes directly affected by β-glucosaminidase and α-galactosidase (Dick 1997). This
indicates that OM levels may be an appropriate measure of microbial functionality
irrespective of cropping management.
Conclusion
Irrigation had an affect on enzymatic activity. phosphodiesterase and β-
glucosaminidase activity was greater under constant irrigation while others did not

Texas Tech University, Brandon Melester, August 2010
71
exhibit any response to irrigation schedule. The differential response suggests that
composition of the soil microbial community changed in response to irrigation. Nitrogen
fertilization directly impacted the activity of β-glucosaminidase, an enzyme directly
involved in N mineralization and cycling dynamics. Nitrogen inputs significantly
increased short-term β-glucosidase activity in the fall seasons. This is mostly likely due
to a secondary effect due to the fact that β-glucosidase is involved in proving C for soil
microbes and not N cycling. Tillage was not found to significantly impact the activity
levels of the measured soil enzymes. This contradicts most of the previous research.
This result may be due to other variables having stronger affects on enzymatic activity
levels than tillage or that the impacts of tillage in this system were short-lived. As seen in
other studies, soil organic matter appears to be the best measure of the level of soil
functionality and microbial dynamics.
The outcome of this study was the determination of the importance of irrigation to
peanut cropping systems in a semi-arid environment. Full irrigation is needed to
maximize the activity and abundance of the soil microbial community. Furthermore,
attempts to conserve water and reduce water quantities will not only hinder the soil
microbial activity and abundance in that particular growing season but will also
negatively affect them in subsequent growing seasons even if full irrigation is re-
implemented. Strip-tillage was not shown to have any negative impacts on microbial
dynamics in comparison and therefore should be considered a better tillage option
because of the reduced soil erosion and energy required associated with this practice.

Texas Tech University, Brandon Melester, August 2010
72
Nitrogen addition had minimal effects on the system and appears to be an unnecessary
expenditure when growing peanut crops in this particular system.

Texas Tech University, Brandon Melester, August 2010
73
References
Acosta-Martínez, V., T. M. Zobeck, et al. 2003. Enzyme activities and microbial community structure in semiarid agricultural soils. Biol Fertil Soils 38: 216-227. Acosta-Martinez, v., D. R. Upchurch, et al. 2004. Early impacts of cotton and peanut cropping systems on selected soil chemical, physical, microbiological and biochemical properties. Biol Fertil Soils 40: 44-54. Adams, R.M., Rosenzweig, C., Peart, R.M., Ritchie, J.T., McCarl, B.A., Glyer, J.D., Curry, R.B., Jone, J.W., Boote, K.J., Allen, L.H. 1990. Global climate change and US agricultura. Nature. 345:219-224. Angers, D., Bissonnette, N., Legere, A., Samson, N. 1993. Microbial and biochemical changes induced b rotation and tillage in a soil under barley production. Can J Soil Sci. 73: 39-50. Baligar, V.C., Wright, R.J., Smedley M.D. 1988. Acid phosphatase activity in soils of the appalachian region. Soil Science Society of America 52: 1612-1616. Bandick, A,K., Dick, R.P. 1999. Field management effects on soil enzyme activities.” Soil Biology and Biochemistry. 31: 1471-1479. Barea, J. M., C. Azcon-Aguilar, et al. 1996. Interactions between Mycorrhizal Fungi and Rhizosphere Microorganisms within the Context of Sustainable Soil-Plant Systems. Multitrophic Interactions in Terrestrial Systems: 36th Symposium of the British Ecological Society. A. C. Gange and V. K. Brown, Cambridge University Press: 65-78. Boyd S.A. and Mortaland M.M. 1990. Enzyme Interactions with Clays and Clay-Organic Matter Complexes. Soil Biochemisty, Volume 6. J-M. Bollag and G. Stotzky, Marcel Dekker Inc. 270 Madison Avenue, New York, New York 10016: 1-28. Clark, M. S., Horwath, W. R., Shennan, C., Scow, K.M. 1998. Changes in soil chemical properties resulting from organic and low-input farming practices. Agron. J. 90: 662-671. Dalal, R.C. 1989. Long-term effects of no-tillage, crop residue, and nitrogen application of properties of a vertisol. SSSAJ. 53: 1511-1515 Deng, S. P. and M. Tabatabai 1997. Effect of tillage and residue management on enzyme activities in soils: III. Phosphates and arylsufatase. Biol Fertil Soils 24(141-146).
Texas Tech University, Brandon Melester, August 2010
74
Dick, P.R. 1994. Soil enzyme activities as indicators of soil quality. In Defining Soil
Quality for a Sustainable Environment. Soil Sci. Soc. Am.. Edited by Doran et al. Madison, WI: Special Publication. 107-124. Dick, P.R. 1997. Soil Enzymes as Intergative Indictors of Soil Health. Biological Indictors of Soil Health. Edited by Pankhurst et al. CAB International, Wallingford, England 121-157 Dick, R.P. and M.A. Tabatabai. 1987. Polyphosphates as sources of phosphorus for plants. Fert. Res.. Vol. 12: 107-118. Dick, P.R. and Tabatabai, M.A. 1993. Significane and Potential Uses of Soil Enzymes. Soil Microbiolgy Ecology: Applications in Agricultural and Environmental Management. Edited by F. Blaine Metting, Jr. Marcel Dekker, Inc. New York, New York 10016: 95-127. Dick, P.R., Tabatabai, M.A. 1993. Potential uses of soil enzymes. Soil Microbial Ecology. B.Metting. Marcel Dekker Inc. New York, New York, pp. 95-127. Ekenler, M. and Tabatabai, M.A. 2002. β-Glucosaminidase activity of soils: effect of cropping systems and its relationship to nitrogen mineralization. Biol Fertil Soils. 36:
367-376. Erel, O. & Avci, S. 2002. Semi-automated enzymatic measurement of serum zinc concentration. Clinical Biochemistry. 35: 41-47. Fontaine, S., Mariotti, A., Abbadie, L. 2003. The priming effect of organic matter: a question of microbial competition. Soil Biology and Biochemistry. 35: 837-843. Havlin J.L., Kissel, D.E., Maddux, L.D., Claasseen, M.M. and Long, J.H., 1990. Crop rotation and tillage effects on soil organic carbon and nitrogen. Soil Sci. Soc. Am. J. 54, pp. 448–452. Kandeler, E., Tscherko D., Spiegel, H. 1999. Long-term monitoring of microbial biomass, N minerlisation and enzyme activities of a Chernozem under different tillage management. Biol Fertil Soils. 28: 343-351. Lindahl, B.D., Finlay, R., Cairney, J.W. 2005. Ezymatic Activities of Mycelia in Mycorrhizal Fungal Communities. The Fungal Community: Its Organization and Role in the Ecosystem Third Edition. J. Dighton, J.F. White, P. Oudemans. Taylor & Francis Group, LLC, Boca Raton, FL 33487-2742: 331-348.

Texas Tech University, Brandon Melester, August 2010
75
Mina, B.L., Saha, S., Kumar, N., Srivastva, A.K., Gupta, H.S. 2008. Changes in soil nutrient content and enzymatic activity under conventional and zero-tillage practices in an Indian sandy clay loam soil. Nutr Cycl Argoecosyst. 82: 273-281.
Reynolds, H. L., A. Packer, et al. 2003. Grassroots Ecology: Plant-Micorbe-Soil Interactions As Drivers Of Plant Community Structure And Dynamics. Ecology 84(9): 2281-2291. Sinsabaugh, R.L., Gallo, M.E., Lauber, C., Waldrop, M.P., Zak, D.R. 2005. Extracellular enzyme activities and soil organic dynamics for northern hardwood forest receiving stimulated nitrogen deposition. Biogeochemisty. 75: 201-215. Spedding, T.A., Hamel, C. Mehuys, Madramootoo, C.A. 2004. Soil microbial dynamics in maize-growing soil under different tillage and residue management system. Soil Biology and Biochemistry. 36: 499-512. Stainforth, D.A., Aina, T., Christensen, C., Collins. M., Faull, N., Frame, D.J., Kettleborough, J.A., Knight. S., Martin, A., Murphy, J.M., Piani, C., Sexton, D., Smith, L.A., Spicer, R.A., Thorpe, A.J., Allern, M.R. 2005. Uncertainty in predictions of the climate response to rising levels of greenhouse gases. Nature. 433: 403-406 Tabatabai, M. (1994). Soil Enzymes. Methods of soil analysis. Part 2. Microbiological and biochemical properties. R. Weaver, J. Angle and P. Bottomley. Madison, Wisconson, SSSA: 775-833 Tietjen, T. and Wetzel, R.G. 2003. Extracellular enzyme-clay mineral complexes: Enzyme absorption, alteration of enzyme activity, and protection from photodegradation. Aquatic ecology. 37: 331-339. Verhoeven, J.T.A., Maltby, E., Schmitz, M.B. 1990. Nitrogen and phosphorus mineralization in fens and bogs. Journal of Ecology. 78: 713-726. Zak, J.C., McMichael, B. 2001. Argoecology of Arbuscular Mycorrhizal Activity. Structure and Function in Agroecosystem Design and Management. M. Shiyomi, H. Koizumi. CRS Press: 145-166.

Texas Tech University, Brandon Melester, August 2010
76
Table 3.1. P-values for comparisons of the three different irrigation treatments imposed in 2008 for a peanut cropping system. Values were considered significant at p ≤ 0.05. Significant values are indicated in bold. Note [Phospho= phosphodiesterase, Glucosamini= β-glucosaminidase, Glucosidase= β-glucosidase, Alkaline= alkaline phosphatase, Alpha= α-galactosidase, Full= full irrigation, LSD= late season drought, ESD= early season drought].
Phospho Glucosamini Glucosidase Alkaline Alpha
Full vs. LSD 0.55 0.07 0.08 0.44 0.91 Full vs. ESD
0.88
0.89
0.05
0.16
0.81
LSD vs.ESD
0.45
0.05
0.82
0.03
0.90

Texas Tech University, Brandon Melester, August 2010
77
Table 3.2. Correlation matrix comparing soil extractable nutrients to extracellular soil enzyme activity from soil samples collect under peanut cultivation for two growing seasons of 2007-2008. All numbers represent r calculated using Pearson Correlations. The r values range from 1 to -1 with being a 100% positive correlation and -1 a 100% negative correlation. Significant r values are indicated in bold. Note [Phosph= phosphodiesterase, Glucomini= β-glucosaminidase, Glucosidase= β-glucosidase, Alkaline= alkaline phosphatase, Alpha= α-galactasidase, NO3 = soil extractable nitrate, NH4= soil extractable ammonium, P= soil extractable phosphorus, K= soil extractable potassium, Mg= soil extractable magnesium, Ca= soil extractable calcium, S= soil extractable sulfur, B= soil extractable boron, Zn= soil extractable zinc, Mn= soil extractable manganese, Fe= soil extractable iron, Cu= soil extractable copper, CEC= cation exchange, OM= soil organic matter].
NO3
NH4 P K Mg Ca S B Zn Mn Fe Cu
CEC OM
Phospho 0.04 0.43 0.02 0.13 0.19 0.29 0.24 0.24 0.04 0.22 0.13 0.18 0.26 0.21
Gucomi 0.02 0.11 0.03 0.10 0.02 0.10 0.11 0.01 0.06 0.05 0.01 0.10 0.08 0.33
Glucosi
d 0.16 0.13 0.04 0.01 0.07 0.08 0.18 0.25 0.09 0.03 0.01 0.08 0.04 0.01
Alkaline 0.06 0.18 0.09 0.13 0.15 0.08 0.08 0.10 0.16 0.11 0.22 0.16 0.03 0.29
Alpha 0.05 0.15 0.11 0.18 0.27 0.25 0.03 0.18 0.22 0.36 0.24 0.27 0.17 0.43

Texas Tech University, Brandon Melester, August 2010
78
Table 3.3. Correlation matrix between all extracellular soil enzymes collected under peanut cultivation throughout the growing seasons of 2007-2008. All numbers represent r calculated using Pearson Correlations. The r values range from 1 to -1 with being a 100% positive correlation and -1 a 100% negative correlation. Significant r values are indicated in bold. Note [Phosph= phosphodiesterase, Glucomini= β-glucominidase, Glucosidase= β-glucosidase, Alkaline= alkaline phosphatase, Alpha= α-galactasidase].
Phospho Gucomini Glucosidase Alk Alpha
Phospho 1.00 Gucomini 0.03 1.00
Glucosidase 0.18 0.23 1.00 Alk -0.06 0.24 0.17 1.00
Alpha -0.16 0.34 0.16 0.36 1.00

Texas Tech University, Brandon Melester, August 2010
79
Figure 3.1. Plot design for established to study the effects of irrigation, nitrogen fertilization, and tillage on soil microbial dynamics and community structure associated with a peanut cropping system in semi-arid west-Texas in year 2007. The numbers indicated refer to the different zones. Tillage treatment and zone alignment remained the same in 2008. Irrigation and nitrogen treatments differed in plots 1, 2, 5, and 6 in 2008.

Texas Tech University, Brandon Melester, August 2010
80
Figure 3.2. The effect of late season drought (LSD) compared to full irrigation (Full) on phosphodiesterase activity levels associated with a peanut cropping system. (a)Total phosphodiesterase activity levels across two years, 2007-2008. Values are means± S.E., n=64. (b) Phosphodiesterase levels in each of the summer and fall seasons in both 2007 and 2008. Values are means ± S.E, n= 16. Groups statistically (p ≤ 0.05) different are indicated with different letters above mean bars.
a.
Ph
osp
ho
die
ste
rase
Activity
(mg P
n k
g-1
so
il h
-1)
20
40
60
80
Full
LSD a
a
b.
Summer 07 Fall 07 Summer 08 Fall 08
Ph
osp
ho
die
ste
rase
Activity
(m
g k
g-1
so
il h
-1)
20
40
60
80
100
120Full
LSD
abc
bc
ab
c
a
ab
dd

Texas Tech University, Brandon Melester, August 2010
81
Figure 3.3. The effect of late season drought (LSD) compared to full irrigation (Full) on β-glucosaminidase activity levels within a peanut cropping system. (a)Total β-glucosaminidase activity across two growing seasons, 2007-2008. Values are means± S.E., n= 64. (b) β-glucosaminidase levels in each of the summer and fall seasons in both 2007 and 2008. Values are means± S.E., n=16. Groups statistically different are indicated with different letters above mean bars.
a.
-G
luco
sa
min
ida
se
Activity
(mg P
N k
g-1
so
il h
-1)
2
4
6
8
10
12
14
16
18Full
LSD
a
a
b. Summer 07 Fall 07 Summer 08 Fall 08
-G
lucoscam
inid
ase
(m
g P
N k
g-1
soil-1
)
5
10
15
20
25
Full
LSD
ab
bc bc
ab
a
bc
c
c

Texas Tech University, Brandon Melester, August 2010
82
Figure 3.4. The effect of late season drought (LSD) compared to full irrigation (Full) on β-glucosidase activity levels within a peanut cropping system. (a)Total β-glucosidase activity levels across two growing seasons, 2007-2008. Values are means± S.E., n= 64. (b) β-glucosidase levels in each of the summer and fall seasons in both 2007 and 2008. Values are means± S.E., n=16. Groups statistically (p ≤ 0.05) different are indicated with different letters above mean bars.
a.
-G
luco
sid
ase
Activity
(mg P
N k
g-1
so
il h
-1)
20
40
60
80 Full
LSD
a
b
b. Summer 2007 Fall 2007 Summer 2008 Fall 2008
-G
lucosid
ase A
ctivity
(mg P
N k
g-1
soil
h-1
)
20
40
60
80
100
120Full
LSD
c c
a
bc bc
c
ab
bc

Texas Tech University, Brandon Melester, August 2010
83
Figure 3.5. The effect of late season drought (LSD) compared to full irrigation (Full) on alkaline phosphatase activity levels from a peanut cropping system. (a)Total alkaline phosphatase activity levels from 2007-2008. Values are means± S.E., n= 64. (b) Alkaline phosphatase levels in each of the summer and fall seasons in both 2007 and 2008. Values are means± S.E., n=16. Groups statistically (p ≤ 0.05) different are indicated with different letters above mean bars.
a.
Alk
alin
e P
ho
sp
ha
tase
Activity
(mg P
n k
g-1
so
il h
-1)
20
40
60
80
100
120
140Full
LSD
aa
b. Summer 07 Fall 07 Summer 08 Fall 08
Alk
alin
e P
hosphata
se A
ctivity
(mg P
N k
g-1
soil
h-1
)
30
60
90
120
150
180
210Full
LSD
aa
a aa
a
aa

Texas Tech University, Brandon Melester, August 2010
84
Figure 3.6. The effect of late season drought (LSD) compared to full irrigation (Full) on α-galactosidase activity levels from a peanut cropping system. (a) Total α-galactosidase activity levels from 2007-2008. Values are means± S.E., n= 64. (b) α-galactosidase levels in each of the summer and fall seasons in both 2007 and 2008. Values are means± S.E., n=16. Groups statistically (p ≤ 0.05) different are indicated with different letters above mean bars.
a.
-G
ala
cto
sid
ase
Activity
(mg P
N k
g-1
so
il h
-1)
2
4
6
8
10
12
14
16 Full
LSD a
a
b. Summer 07 Fall 07 Summer 08 Fall 08
-G
ala
cto
sid
ase
(mg P
N k
g-1
soil
h-1
)
5
10
15
20Full
LSD
abc
bc
cbc
aa
aab

Texas Tech University, Brandon Melester, August 2010
85
Figure 3.7. (a) Discriminate function analysis (DFA) comparing the differences of the three different irrigation treatment imposed in 2008 on a peanut cropping system using different enzyme activity (phosphodiesterase, β-glucosaminidase, β-glucosidase, alkaline phosphatase, α-galactosidase) levels as the parameters. (b) Vector correlations indicating correlations between irrigation treatments and enzyme activities. Correlations are indicated by the smallest angle between two vectors. Ex 0°= 100% positive correlation, 90°= no correlation, and 180°= 100% negative correlation. Note [1= full irrigation, 2= late season drought, 3= full season drought, Phos= phosphodiesterase, Gmini= β-glucosaminidase, Gdase= β-glucosidase, AlkPho= alkaline phosphatase, Agal= α-galactosidase].
a.
b.

Texas Tech University, Brandon Melester, August 2010
86
Figure 3.8. Discriminate function analysis (DFA) comparing no nitrogen application and nitrogen application to a peanut cropping system using phosphodiesterase, β-glucosaminidase, β-glucosidase, alkaline phosphatase, and α-galactosidase activity levels as the parameters.

Texas Tech University, Brandon Melester, August 2010
87
Figure 3.9. The effects of nitrogen application on phosphodiesterase activity levels from a peanut cropping system. (a)Total phosphodiesterase activity levels across two growing years, 2007-2008. Values are means± S.E., n= 32. (b) Phosphodiesterase levels in each of the summer and fall seasons in both 2007 and 2008. Values are means± S.E., n=16. Groups statistically (p ≤ 0.05) different are indicated with different letters above mean bars.
a.
Ph
osp
ho
die
ste
rase
Activity
(mg P
N k
g-1
so
il h
-1)
20
40
60
80
100
No nitrogen
nitrogen a
a
b. Summer 07 Fall 07
Phosphodie
ste
rase A
ctivity
(mg P
n k
g-1
soil
h-1
)
20
40
60
80
100
120 No nitrogen
nitrogen
a
b
a
aa

Texas Tech University, Brandon Melester, August 2010
88
Figure 3.10. The effect of no nitrogen application compared to nitrogen application treatments on β-glucosaminidase activity levels from a peanut cropping system. (a)Total β-glucosaminidase activity levels across two growing years, 2007-2008. Values are means± S.E., n= 32. (b) β-glucosaminidase levels in each of the summer and fall seasons in both 2007 and 2008. Values are means± S.E., n=16. Groups statistically (p ≤ 0.05) different are indicated with different letters above mean bars.
a.
-G
luco
sa
min
ida
se
Activity
(mg P
N k
g-1
so
il h
-1)
5
10
15
20 No nitrogen
nitrogen
a
a
b. Summer 07 Fall 07
-G
lucosam
inid
ase A
ctivity
(mg P
n k
g-1
soil
h-1
)
5
10
15
20
25 No nitrogen
nitrogen
a
a
a a

Texas Tech University, Brandon Melester, August 2010
89
Figure 3.11. The effect of nitrogen on β-glucosidase activity levels from a peanut cropping system. (a)Total β-glucosidase activity levels from 2007-2008. Values are means± S.E., n= 32. (b) β-glucosidase levels in each of the summer and fall seasons across two growing seasons, 2007-2008. Values are means± S.E., n=16. Groups statistically (p ≤ 0.05) different are indicated with different letters above mean bars.
a.
-G
luco
sid
ase
Activity
(mg P
N k
g-1
so
il h
-1)
20
40
60
80
No nitrogen
nitrogen
a
a
b. Summer 07 Fall 07
-G
lucosid
ase A
ctivity
(mg P
N k
g-1
soil
h-1
)
20
40
60
80
100 No nitrogen
nitrogen
bc
c
b
a

Texas Tech University, Brandon Melester, August 2010
90
Figure 3.12. The effect of no nitrogen application compared to nitrogen application treatments on alkaline phosphatase activity levels from a peanut cropping system. (a)Total alkaline phosphatase activity levels from 2007-2008. Values are means± S.E., n= 32. (b) Alkaline phosphatase levels in each of the summer and fall seasons across two growing years, 2007- 2008. Values are means± S.E., n=16. Groups statistically (p ≤ 0.05) different are indicated with different letters above mean bars.
a.
Alk
alin
e P
ho
sp
ha
tase
Activity
(mg P
N k
g-1
so
il h
-1)
20
40
60
80
100
120
140
160No nitrogen
nitrogen
a
a
b. Summer 07 Fall 07
Alk
alin
e P
hosphata
se A
ctivity
(mg P
N k
g-1
soil
h-1
)
30
60
90
120
150
180
210 No nitrogen
nitrogen
a
aa
a

Texas Tech University, Brandon Melester, August 2010
91
Figure 3.13. The effect of nitrogen application compared to nitrogen application treatments on α-galactosidase activity levels in a peanut cropping system. (a)Total α-galactosidase activity levels from 2007-2008. Values are means± S.E., n= 32. (b) α-Galactosidase levels in each of the summer and fall seasons across two growing years, 2007 -2008. Values are means± S.E., n=16. Groups statistically (p ≤ 0.05) different are indicated with different letters above mean bars.
a.
-G
ala
cto
sid
ase
Activity
(mg P
N k
g-1
so
il h
-1)
2
4
6
8
10
12
14 No nitrogen
nitrogen
a
a
b. Summer 07 Fall 07
-G
ala
cto
sid
ase A
ctivity
(mg P
N k
g-1
soil
h-1
)
2
4
6
8
10
12
14
16
18 No nitrogen
nitrogen
a
a
aa

Texas Tech University, Brandon Melester, August 2010
92
Figure 3.14. (a) Discriminate function analysis (DFA) comparing the differences of nitrogen and no nitrogen application in different seasons in 2007 using different enzyme activity (phosphodiesterase, β-glucosaminidase, β-glucosidase, alkaline phosphatase, α-galactosidase) levels as the parameters. Note [1= no nitrogen summer, 2= nitrogen summer, 3= no nitrogen fall, 4= no nitrogen fall, Phos= phosphodiesterase, Gmini= β-glucosaminidase, Gdase= β-glucosidase, AlkPho= alkaline phosphatase, Agal= α-galactosidase].
a.

Texas Tech University, Brandon Melester, August 2010
93
Figure 3.14. (b) Vector correlations indicating correlations between the different nitrogen treatments in summer and fall and enzyme activities. Correlations are indicated by the smallest angle between two vectors. Ex 0°= 100% positive correlation, 90°= no correlation, and 180°= 100% negative correlation. Note [1= no nitrogen summer, 2= nitrogen summer, 3= no nitrogen fall, 4= no nitrogen fall, Phos= phosphodiesterase, Gmini= β-glucosaminidase, Gdase= β-glucosidase, AlkPho= alkaline phosphatase, Agal= α-galactosidase].
b.

Texas Tech University, Brandon Melester, August 2010
94
Figure 3.15. The effects of strip tillage compared to conventional tillage on phosphodiesterase activity levels in a peanut cropping system. (a) Total phosphodiesterase activity levels from 2007-2008. Values are means± S.E., n= 96. (b) Phosphodiesterase levels in each of the summer and fall seasons across two growing years, 2007- 2008. Values are means± S.E., n=24. Groups statistically (p ≤ 0.05) different are indicated with different letters above mean bars.
a.
Ph
osp
ho
die
ste
rase
Activity
(mg P
N k
g-1
so
il h
-1)
20
40
60
80
Conventional
Strip a
a
b. Summer 07 Fall 07 Summer 08 Fall 08
Phosphodie
ste
rase A
ctivity
(mg P
N k
g-1
soil
h-1
)
20
40
60
80
100
Conventional
Strip
a
a
a
a
aa
b
b

Texas Tech University, Brandon Melester, August 2010
95
Figure 3.16. The effect of strip tillage compared to conventional tillage treatments on β-glucosaminidase activity levels in a peanut cropping system. (a) Total β-glucosaminidase activity levels from 2007-2008. Values are means± S.E., n= 96. (b) β-glucosaminidase levels in each of the summer and fall seasons across two growing years, 2007- 2008. Values are means± S.E., n=24. Groups statistically (p ≤ 0.05) different are indicated with different letters above mean bars.
a.
-G
luco
sa
min
ida
se
Activity
(mg P
N k
g-1
so
il h
-1)
2
4
6
8
10
12
14
16
18 Conventional
Srip a
a
b. Summer 07 Fall 07 Summer 08 Fall 08
-G
lucosam
inid
ase A
ctivity
(mg P
N k
g-1
soil
h-1
)
2
4
6
8
10
12
14
16
18
20
22 Conventional
Strip
ab
ab
ab
ab
a
abab
b

Texas Tech University, Brandon Melester, August 2010
96
Figure 3.17. The effect of strip tillage compared to conventional tillage on β-glucosidase activity levels in a peanut cropping system. (a) Total β-glucosidase activity levels from 2007-2008. Values are means± S.E., n= 96. (b) β-glucosidase levels in each of the summer and fall seasons across two growing years, 2007- 2008. Values are means± S.E., n=24. Groups statistically (p ≤ 0.05) different are indicated with different letters above mean bars.
a.
-G
luco
sid
ase
Activity
(mg P
N k
g-1
so
il h
-1)
20
40
60
80 Conventional
Strip a
a
b. Summer 07 Fall 07 Summer 08 Fall 08
-G
lucosid
ase A
ctivity
(mg P
N k
g-1
soil
h-1
)
20
40
60
80
Conventional
Strip
b b
aa
b
b
a
ab
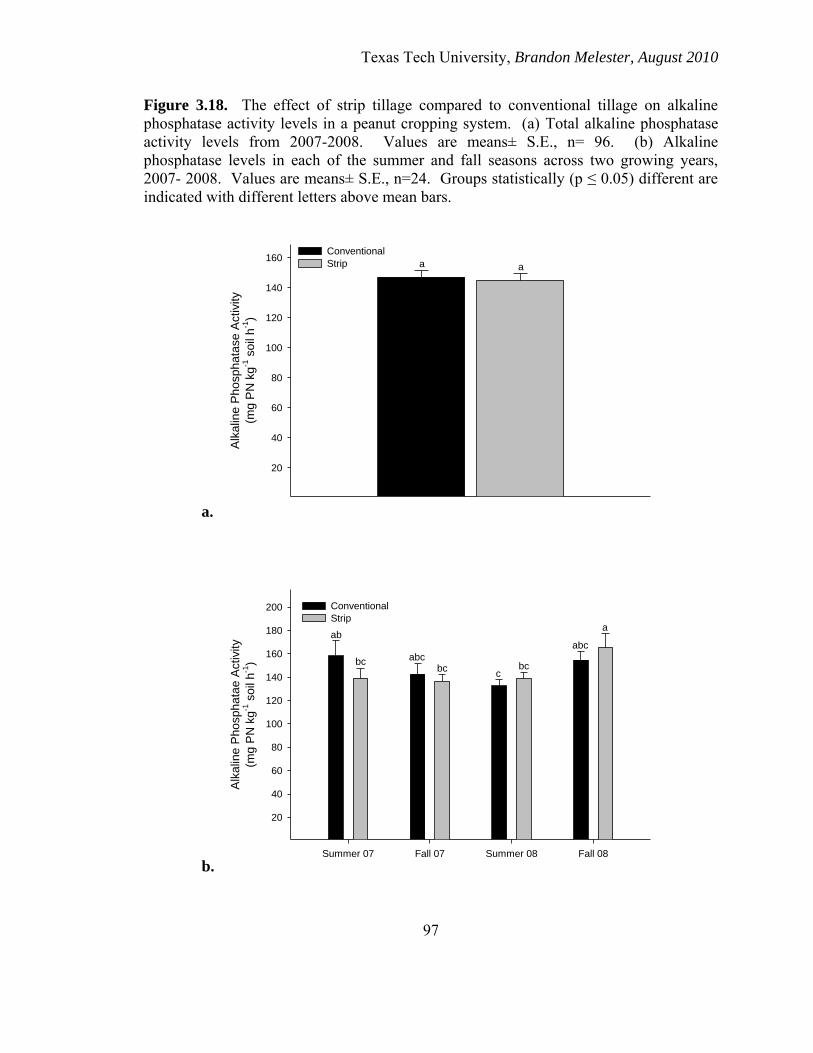
Texas Tech University, Brandon Melester, August 2010
97
Figure 3.18. The effect of strip tillage compared to conventional tillage on alkaline phosphatase activity levels in a peanut cropping system. (a) Total alkaline phosphatase activity levels from 2007-2008. Values are means± S.E., n= 96. (b) Alkaline phosphatase levels in each of the summer and fall seasons across two growing years, 2007- 2008. Values are means± S.E., n=24. Groups statistically (p ≤ 0.05) different are indicated with different letters above mean bars.
a.
Alk
alin
e P
ho
sp
ha
tase
Activity
(mg P
N k
g-1
so
il h
-1)
20
40
60
80
100
120
140
160Conventional
Strip a a
b. Summer 07 Fall 07 Summer 08 Fall 08
Alk
alin
e P
hosphata
e A
ctivity
(mg P
N k
g-1
soil
h-1
)
20
40
60
80
100
120
140
160
180
200 Conventional
Strip
ab
bc abcbc
cbc
abc
a

Texas Tech University, Brandon Melester, August 2010
98
Figure 3.19. The effect of strip tillage compared to conventional tillage on α-galactosidase activity levels in a peanut cropping system. (a) Total α-galactosidase activity levels from 2007-2008. Values are means± S.E., n= 96. (b) α-Galactosidase levels in each of the summer and fall seasons across two growing years, 2007- 2008. Values are means± S.E., n=24. Groups statistically (p ≤ 0.05) different are indicated with different letters above mean bars.
a.
-G
ala
cto
sid
ase
Activity
(g P
N k
g-1
so
il h
-1)
2
4
6
8
10
12
14
16 Conventional
Strip
aa
b. Summer 07 Fall 07 Summer 08 Fall 08
-G
ala
cto
sid
ase A
ctivity
(mg P
N k
g-1
soil
h-1
)
2
4
6
8
10
12
14
16
18Conventional
Strip
bcbc
c c
a
ab
aab

Texas Tech University, Brandon Melester, August 2010
99
Figure 3.20. (a) Discriminate function analysis (DFA) comparing the differences of conventional and strip tillage in 2007 and 2008 using different enzyme activity levels and nutrient levels as the parameters. Note [1= conventional 07, 2= strip 07, 3= conventional 08, 4= strip 08, Phosph= phosphodiesterase, Glucomini= β-glucosaminidase, Glucosidase= β-glucosidase, Alkaline= alkaline phosphatase, Alpha= α-galactasidase, NO3 = soil extractable nitrate, NH4= soil extractable ammonium, P= soil extractable phosphorus, K= soil extractable potassium, Mg= soil extractable magnesium, Ca= soil extractable calcium, S= soil extractable sulfur, B= soil extractable boron, Zn= soil extractable zinc, Mn= soil extractable manganese, Fe= soil extractable iron, Cu= soil extractable copper, CEC= cation exchange].
a.

Texas Tech University, Brandon Melester, August 2010
100
Figure 3.20. (b) Vector correlations indicating correlations between the different nitrogen treatments in summer and fall and enzyme activities. Correlations are indicated by the smallest angle between two vectors. Ex 0°= 100% positive correlation, 90°= no correlation, and 180°= 100% negative correlation. Note [1= conventional 07, 2= strip 07, 3= conventional 08, 4= strip 08, Phosph= phosphodiesterase, Glucomini= β-glucosaminidase, Glucosidase= β-glucosidase, Alkaline= alkaline phosphatase, Alpha= α-galactasidase, NO3 = soil extractable nitrate, NH4= soil extractable ammonium, P= soil extractable phosphorus, K= soil extractable potassium, Mg= soil extractable magnesium, Ca= soil extractable calcium, S= soil extractable sulfur, B= soil extractable boron, Zn= soil extractable zinc, Mn= soil extractable manganese, Fe= soil extractable iron, Cu= soil extractable copper, CEC= cation exchange].
b.
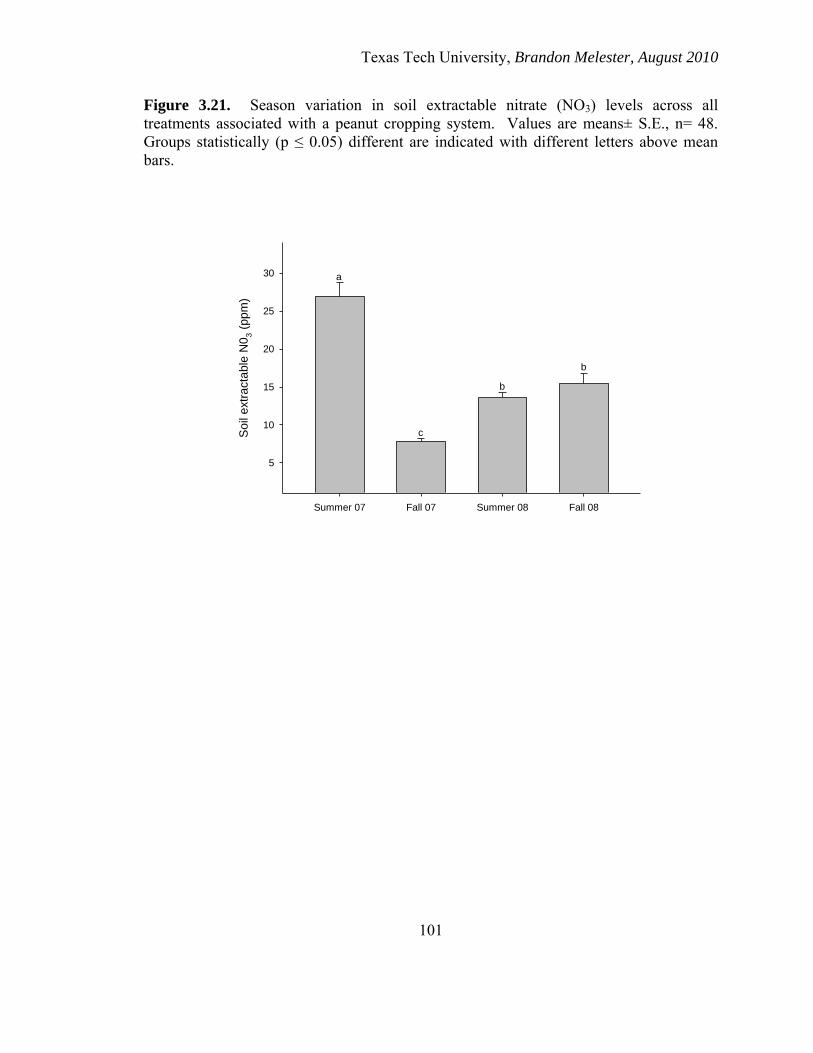
Texas Tech University, Brandon Melester, August 2010
101
Figure 3.21. Season variation in soil extractable nitrate (NO3) levels across all treatments associated with a peanut cropping system. Values are means± S.E., n= 48. Groups statistically (p ≤ 0.05) different are indicated with different letters above mean bars.
Summer 07 Fall 07 Summer 08 Fall 08
Soil
extr
acta
ble
N0
3 (
pp
m)
5
10
15
20
25
30 a
c
b
b

Texas Tech University, Brandon Melester, August 2010
102
Figure 3.22. Seasonal variation in soil extractable ammonium (NH4) levels across all treatments associated with a peanut cropping system. Values are means± S.E., n= 48. Groups statistically (p ≤ 0.05) different are indicated with different letters above mean bars.
Summer 07 Fall 07 Summer 08 Fall 08
So
il e
xtr
acta
ble
NH
4 (
pp
m)
1.0
1.5
2.0
10.0
12.0
14.0
16.0
18.0
b
b
b
a

Texas Tech University, Brandon Melester, August 2010
103
Figure 3.23. Seasonal variation in soil phosphorus (P) levels associated with a peanut cropping system. Values are means± S.E., n= 48. Groups statistically (p ≤ 0.05) different are indicated with different letters above mean bars.
Summer 07 Fall 07 Summer 08 Fall 08
Soil
P (
pp
m)
10
20
30
40
50
60
70a
a
b
b

Texas Tech University, Brandon Melester, August 2010
104
Figure 3.23. Seasonal variation in soil organic matter (OM) levels associated with a peanut cropping system. Values are means± S.E., n= 48. Groups statistically (p ≤ 0.05) different are indicated with different letters above mean bars.
Summer 07 Fall 07 Summer 08 Fall 08
% S
oil
Org
an
ic M
att
er
0.2
0.4
0.6
0.8
1.0
1.2
1.4
1.6
b
b
a
b