agricultural commissioners’ crop reports santa barbara...
TRANSCRIPT

California Department of Food and Agriculture
Agricultural Commissioners’ Crop Reports
Santa Barbara County
1931-1940
California County Agricultural Commissioners' Reports from the California Department of Food and Agriculture. This collection consists of annual crop and livestock data from each of the 58 California Counties. The collection covers 1915-1981; digitization of the rest of the collection is forthcoming. This digitization project was funded by the Giannini Foundation of Agricultural Economics, http://giannini.ucop.edu/ . The work was completed by the staff of the Giannini Foundation Library, University of California, Berkeley, http://are.berkeley.edu/library/ . Please contact the Library to consult the originals.


,: , r, r I
m
AGRICULTURAL CROP REPORT
of
SANTA BARBARA COUNTY
Compiled by
Eugene S. Kel].ogg~
County Agricu].tllral Commissioner
January ]., 1952

AGRICULTURAL CROP REPORT
Santa Barbara County? California
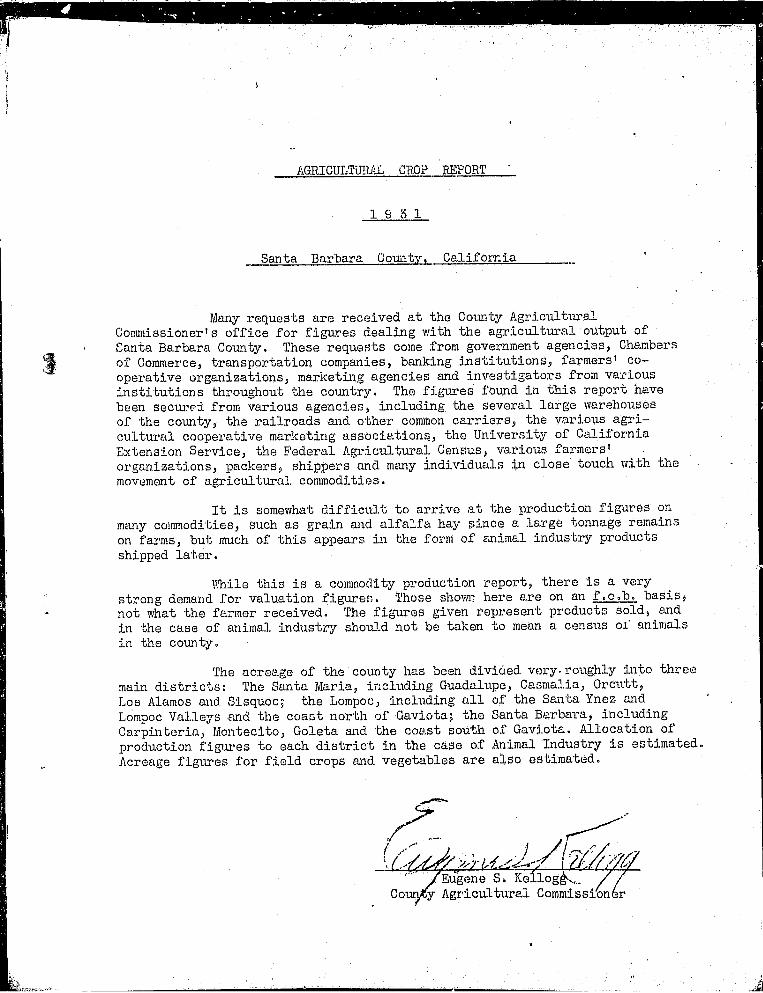
Many requests are received at the Co]m’Dy Agricultt~a!Conmissioner’ s office for figures dealing with the agricultural output ofSanta Barbara County. These requests come from government agencies, Chambersof Commerce, transportation companies, banking institutions~ farmers’ co-operative organizations~ marketing agencies and investigators from variousinstitutions throughout the country. The figures found in this report havebeen sectu’ed from various agencies, including the several large warehousesof the county~ the railroads and other common carriers, the various agri-cultural cooperative marketing associations, the University of CaliforniaExtension Service, the Federal Agricultural Census, various farmers’organizations, packers~ shippers and mm]y individuals M’] close touch with themovement of agricultural, commodities.
It is somewhat difficult to arrive at the production figures onmany commodities, such as grain ~md alfalfa hay since a large tonnage remainson farms, but much of this appears in the form of snimal industry productsshipped later.
IA~ile this is a coimnodity production report, there is a verystrong demand for valuation f:[gurre:~. Those sho,m~ here are on an foo.bo basis~not what ’the farmer received. The figa~res given represent products sold~ andin the case of animal industry sho~3.d not be taken to mean a census of animalsin the colmtyo
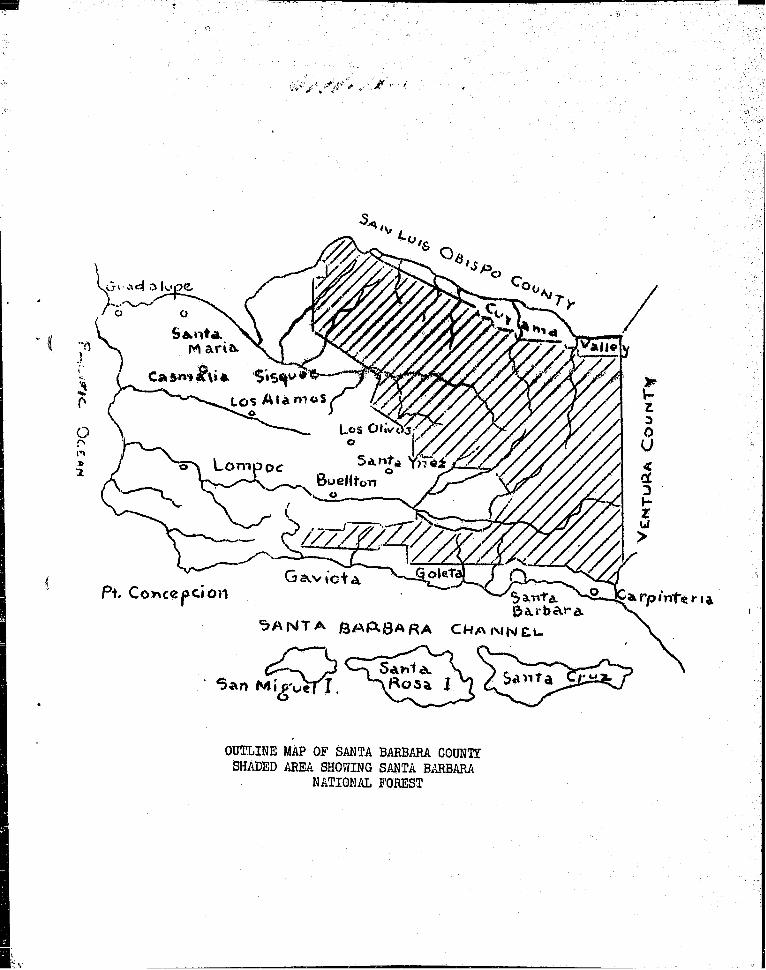
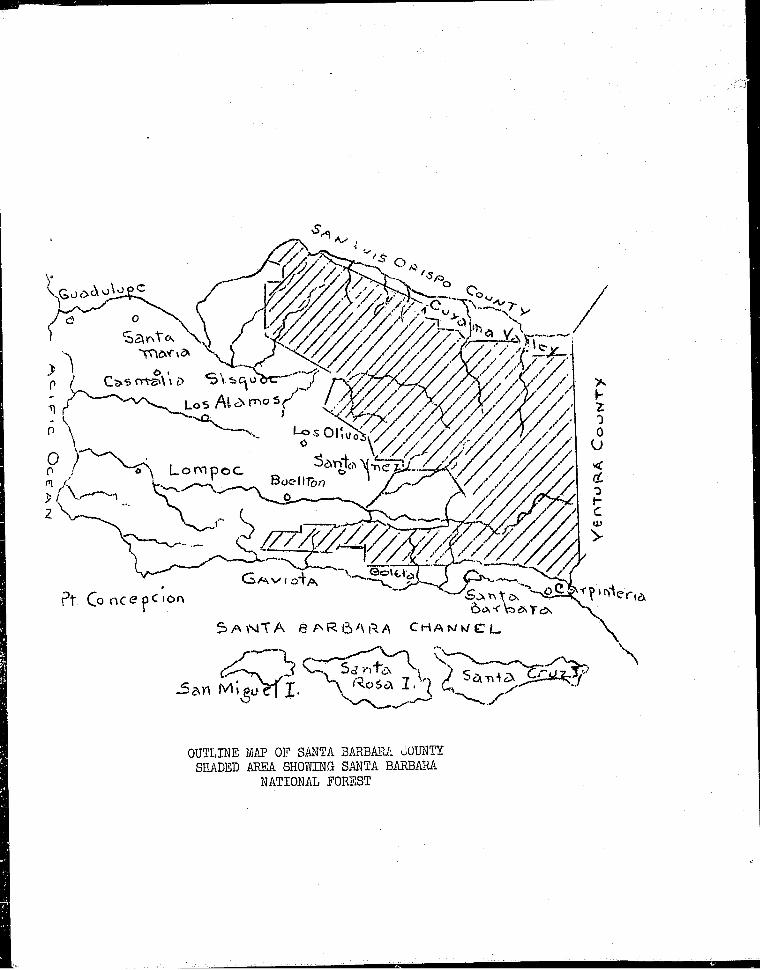
The acreage of the co~mty has been divided, very.~.:ough!y into threemain districts: The Santa Maria, including Guadalupe, Casma.lia, Orcutt,Los Alamos and Sisquoc~ the Lompoc, including all of the Santa Ynez andL6mpoc Valleys stud the coast north of Gaviota~ the Santa Bar,.~bara, includingCarpinteria, P,l.ontecito~ Goleta ~a~d the coast south of Gaviota° Allocation ofproduction figtu’es to each district in the case of Anfmal Industry is estimated.Acreage figures for field crops and vegetables are also estimated.
~--’* j //
f, ....."" , ~’..,~ /I..-.,/,< ,.~" .-
...... /Eu% ;ne s. /l"Co,~y Agricttlturai CommissiOner
AGRICULTUP~’~. CROP REPORT
1.9 ~ ].
Santa Barbara County~ California
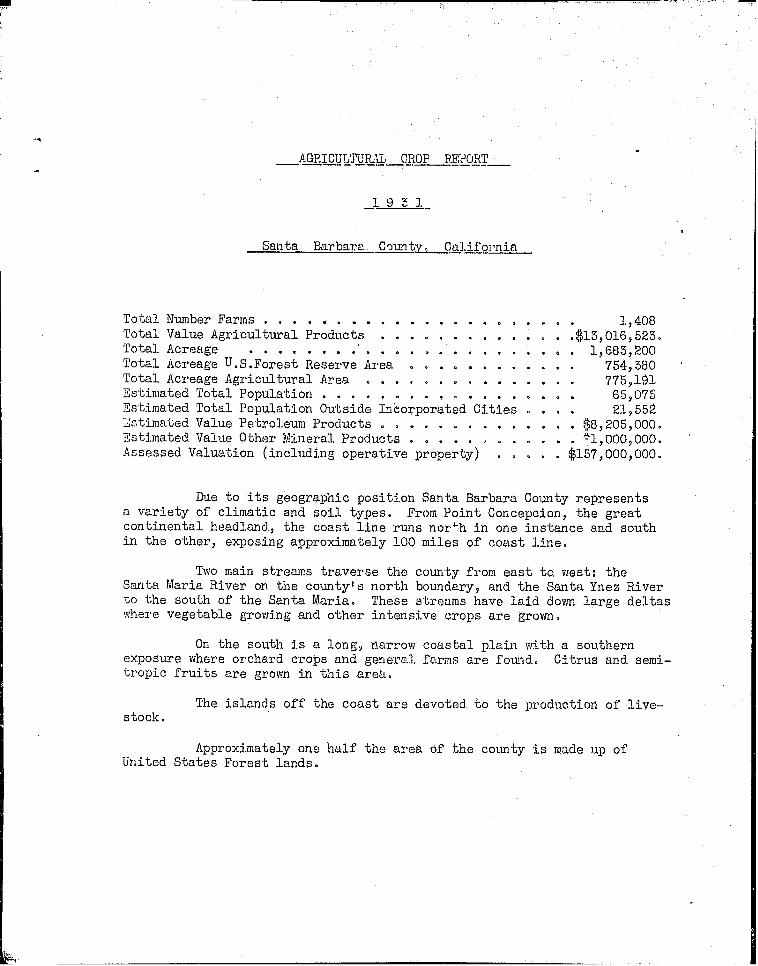
Total Number Farms ...................... 1,408Total Value Agricultural Products .............. $13~016~525oTotal Acreage ....................... 1,683,~00Total Acreage U.S.Forest Reserve Area ........ 754~380Total Acreage Agricultural Area ............ 775~191Estimated Total Population ............... 65~075Estimated Total Population 0~tside Incorporated Cities .... 21,552Estimated Value Petroleum Products .............. $8,205,000oEstimated Value Other Mineral Products ............ ~i,000~000oAssessed Valuation (including operative property) ..... $157,000,000.
Due to its geographic position Santa BarbaraCounty representsa variety of climatic and soil types. From Point Concepcion, the greatcontinental headland, the coast line r~s north in one instance and southin the other~ exposing approximately lO0 miles of coast line.
Two main streams traverse the county from east to west: theSanta Maria River on the county’s north boundary, and the Santa Ynez Riverto the south of the Santa Maria° These streams have laid doom large deltaswhere vegetable growing and other intensive crops are grovmo
On the south is a long~ ~arrow coastal plain with a southernexposure where orchard crops and general farms are found. Citrus and semi-tropic fruits are grovm in this area°
The islands off the coast are devoted to the production of live-stock.
Approximately one half the area of the county is made up ofUnited States Forest lands°
AGRICULTU!O’~ CROP REPORT
1951
Santa Barbara Comity? California
Many requests are received at the Cmmty AgriculturalCommissioner’s office for figures dealing with the agricultural output ofSanta Barbara County° These requests colne from government agencies, Chambersof Commerce, transportation companies, banking instituZions, farmers’ co-operative organizations~ marketing agencies and ~ivestigators from variousinstitutions throughout the country° The figures found in this report havebeen sectu’ed from various agencies, including the several large warehousesof the county, the railroads and. other common carriers~ the various agri-cultural cooperative marketing association~, the University of CaliforniaExtension Service, the Federal Agriculttu-al Census, various farmers’organizations, packers~ shippers and many individuals in close touch with themovement of agricultural commodities.
It is somewhat difficlfl.t to arrive at the production figures onmany commodities, such as grain and alfalfa hay since a large tonnage remainson farms, but much of this appears Lu the form of snimal indnstry productsshipped later.
~.%ile this is a coimnoc]ity production report, there is a verystrong demand for valuation figures. Those sho~n~ here are on an foo.b, basis~not what the farmer received. The fishes given represent products sold, andin the case of ~limal industry shotu!d not be taken to mean a census oi animalsin the cmmtyo
The acreage of the county has been divided very. roughly into threemain districts: The Santa Maria, iucluding Guadalupe, Casma].ia, 0rcutt,Los Alamos and Sisquoc~ the Lompoc~ including all of the Santa Ynez andLompec Valleys and the coast north of Oaviota~ the Santa Barbara, includingCarpinteria, Montecito, Goleta and the coast south of Gaviota. Allocation ofproduction figtu’es to each district in the case of Animal Industry is estimated.Acreage figt~es for field crops and vegetables are also estimated.
- -"~"" IEu’gene S, Kel:tog~j -_~_/. Co u~r y Agric~lturai Commission6r

AGRI ObW~TLq~iI CROP REPORT
193].
Santa Barbara County~ California
Total Number Farms ...................i$ 1,408Total Value Agricultural Products ............. 15,016,523.
. 1,685,200Total Acreage .....................Total Acreage U.S.Forest Reserve Area ......... 754,580
Total Acreage Agricultural Area ............... 778,191
Estimated Total Population .............. 65,075
Estimated Total Population Outside Incorporated Cities .... 21,852
Zstimated ValuePetroleum Products ............. $8,205,000.
Estimated Value Other Mineral Products ....t ........
~i,000~000.
Assessed Valuation (including operative proper y) ..... $157,000,000.
Due to its geographic position Santa Barbara County representsa variety of climatic and soil types. From Point Concepcion, the greatcontinental headland, the coast line rm]s north in one instance and southin the other, exposing approximately i00 miles of coast line.
Two main streams traverse the county from east to west: theSanta Maria River on the county’s north boundary, and the Santa Ynez Riverto the south of the Santa Maria. These streams have laid doom large deltaswhere vegetable growing and other intensive crops are grovm.
On the south is a long~ narrow coastal plain with a southernexposure where orchard crops and general farms are found. Citrus and semi-tropic fruits are groom in this area.
The islands off the coast are devoted to the production of live-stock.
Approximately one half the area of the county is made up ofUnited States Forest lands.
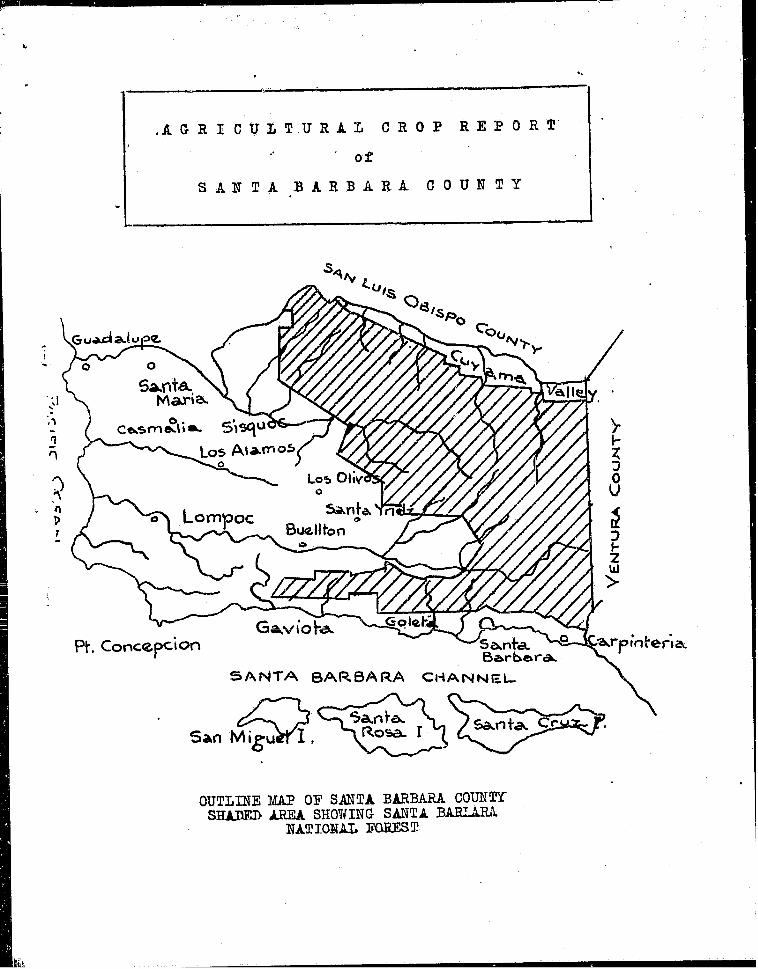
AGR I CUZTUR~]] CROP REPORT
oT
S AN T A B A R B A R A C 0 U,,~N T Y
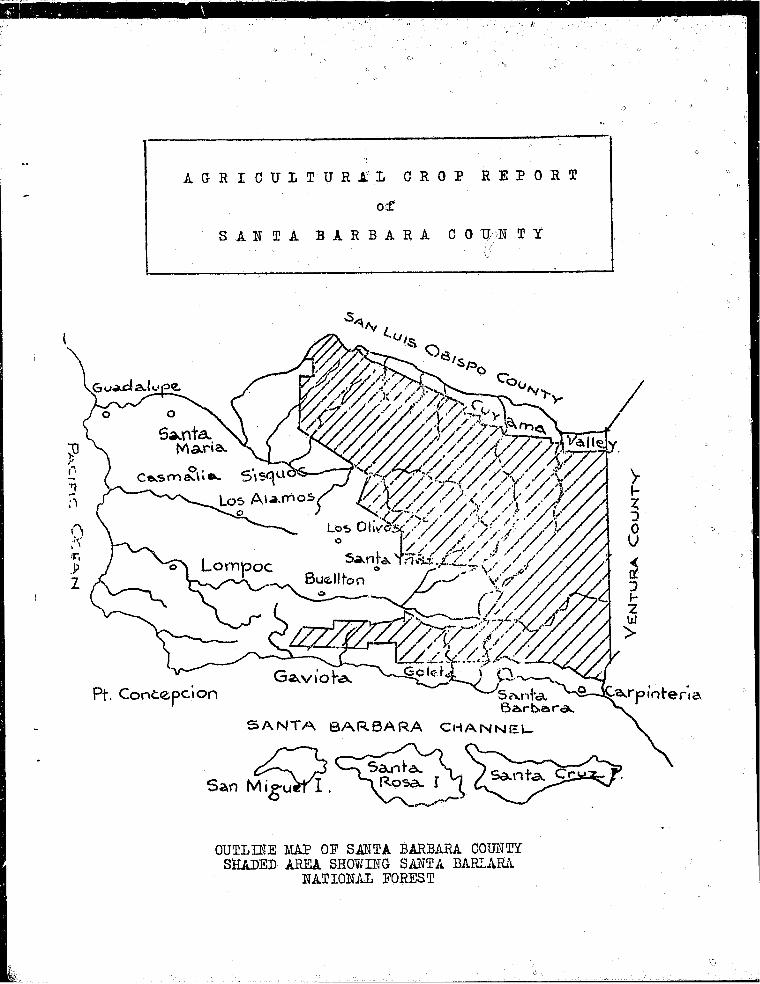
OUTLINE MAP OF SANTA BARBARA COUNTYSHADED AREA SHO~ING SANTA BARLARA
NAT IONA~ FOREST

co-
o
0~r_3
o
cd
4~
m
,--3
#q
c~
~’~ ~H 0
’~ e-.I 0 0e--t ~ 0 0
o~ ~ o o03 r-I o ~,’~
d
0o ~ o IO~ ~ ~0 Io t,o
~ dr-.t
~1~ o,~ ~ I~o ~ co Ii--t
u’~ ~ o I1--I
o
o
.t
,.--Io
r-I
oco,-I
,-I
o~D,-I
r-I
o~
~0
co
o’~,-.-I
I
,.z
c
I
n
o
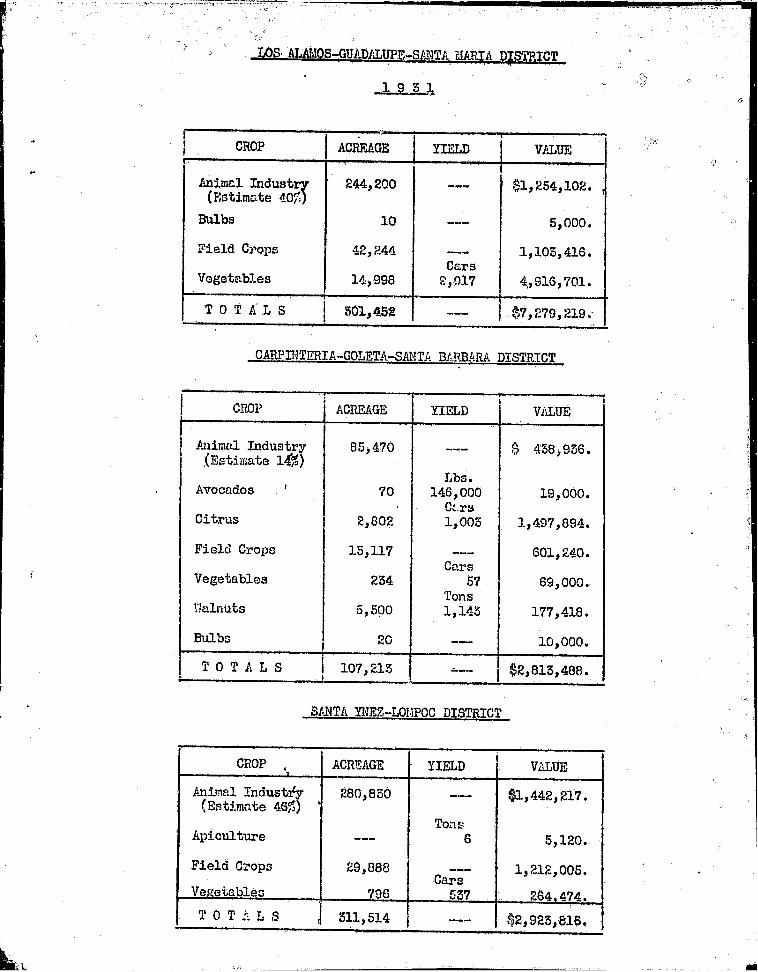
LOS. ALA~IQS--GUADIff~UPE~S#,~TA. ,, ., MARINA D~[S’fRICT
_i9
, , 2
,|I ’ ’t
CROP ACI~F~.GE YIELD I V~LUE
Animal Industry 244,200(Estimate 40%)
$I, 254,102.
Bulbs i0 5,000.
Field Crops 4% 244 i, 105,416.Cars
Vegetables 14,998 o,017 4,916,701.i
T 0 T A L S I 501,452I $7,279,219."
CARPYI’~TERIA-GOLETA-SANTA B’~RBARA DISTRICT
CROP ’ACREAGE YIELD ] VALUE
~limal Industry 85,470.(Estimate 14~,.~
$ 458,956.
Lbs.Avocados ’ 70 146,000 19,000.
C~.rsCitrus I 2,802 1,005 1,497,894.
Fiel~ Crops 1~,I17 601,240.Cars
Vegetables r 254 57 69,000.Tons
Walnuhs 5,500 l, 145 177,418.
Bulbs 20 I0,000.
T 0 T A L S-- i I07,21S $2,815,488.!
StaTA ~EZ-LONPOC DISTRICT
CROP , ACREAGE YIELD .
~mimal Industryi . V~LUE
~80,850(Estimate 46%)
$1,442,217.
Ton sApiculture 6 5,120.
Field Crops 29,888Cars
1,212,005.
Vegetables 796 557I ,, 264,474-
TOTALS 511,514 l --- $2,923,816.
H
©

rxJ
r-I
h-
k
\\
\r~
o~,-i
o~,-.4
o,-i
rJ
0J’~0
.j.-
r-i 0 0 0 0 ~ 0 G
0 ~ ~ ,-4 bO CO ,-I
o ~ S c~ c~ c~ c~cO 0 0 0 G 0 0 0
C~ r-~ L~ rH CO
C~
r-
..m
~Z~O
r- r-I
r-
C
o¢
CO0
Cc
r
0
im r..~
0 0 0 0 0 0CO 0 0 0 0 ~ 0
r-l "~ r-i 0
r-4
r-i 0 ~ 0 0 0 0 00 CO 0 .0 .0 0 0,-
L~3 :
CD~0
0
kO~003
0
~0
I
I
I
0 0 0 0 0 0 00 0 0 .0 -0 0 0 I
co o o o~o~,.o ~.o o
o ,’LO O0
0 0 0 0 0 0 0 0~, 0 0 0 -0 .0 0 0 I
0 0 0 ~0 ~u~ ~0 0
~ o ~c~ ~ ~
~ I~, ¯ , . ...... 1 i III

o \0
C
H
0
A
I:0
,--I
0
H
O
O~
O~,-i
O i
Oh .r-’l~
~" ~
Cu3O2
tr~
O
co
e.D
O~ 04~ L’O ’~14 LO 0~. O0 t’O ~C) (;:0 ~.0 tO r,-.4 0 0.,~
~ O ~-O G~ OJ ~- G) r-I O~ O20 H O r-I O,1r’--I q3 COr-I ~.D ~ r-I ~.O
b..,. H r~ i~-I (~ H~,~’~ ~ ~
~ ~,~ ~ R~ ~, ~ ~ # ~0 ~ o~,~ ~,02 r’--~ r-~ Ob r-’-I ,~,D r"l ~.D ,0"~ 0
g~ OO N O .H g~ O ~1 "O
I.O
O~H
.Ob.-(.o
,’-4
.... ni
o~o
~o
,o~or-Io~O~
t.O
O
og
O
Cr’~
lid O"O ,H
m4.~
m (1)
o mh0.H
m ¯N ~
N
m %bl]~
O

0
<;
G
,--t
r-t
--°
0
C~r-I
,
c~ZO~r-~
IO~
~o~1~
C~O~r-’l
\ I0a?
!°L~’~
O~(~H
.~ (3 0 r-IeO 0 ~0
c; d S d
b,. Co to b--
~ ar
0
0E-~H
0
g~oE-’I C,~
III
iI
C) E) l>- L~.I.~ CO L~
0 ¢M 0 ~0 0 b- I>:
I~~ (:~ ’CO
0 ~.0 ~g ¢’~
E}0
0
r~l
F.-~I
~ql
Ol
I--11
P~I
~i~I
¯ |
r--I I
0
i

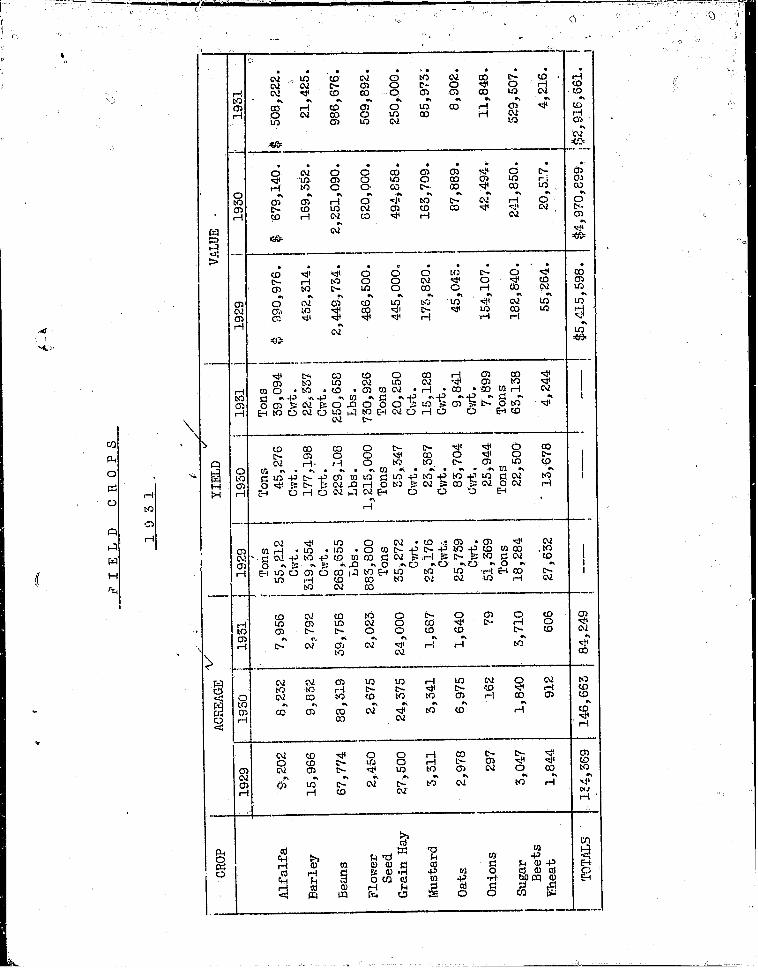
F~ELD CROPS
i 3i
| " I
CROPl
DISTRICT KINDS ACREAGE I YIELD V~UE,i
Cwt.
ILos Alamos- Baby 2,180 8,721 $ 26,165.
San£a Maria Llmas
Small 13,603 34,008 102,024.VFnites
Pinks 2,275 5,682 18,466.B
Misc. 737 2,949 8,847.E
Lompoc- SmallA Santa Ynez V~ites 1,898 14,252 40,561.
N Pinks 255 1,909 5,441.
S Misc. 250 1,875 5,625.
Baby 8,872 66,541 192,969.Limis
Limas 71 550 1,590.
Santa Barbara CommonLimas 6,290 59;344 278,942.
BabyLimas 391 5,457 10,759.
SeedBeans 2,956 29,880 295,289.
T 0 T A L S j 59,756 229,108 $986,676.
II
NOTE: Acreage is estimated. Yield and valueare actual.
il

.PTOTAl. ACREAGE, .YIELD ;aND W’~UE
of each Variety of Beans
BE~S I ACREAGE YIELD VALUE
1950 1951 { 1930 I 1931 ?qBO I 1951 .
!I
2,528 ICwt. Cwt.
Pinks, 21,547 59,553 7,591 $ 225,249. $ 23,907.
Small~hites 32,692 15,501 91,776 48,240 445,114. 142,585.
BabyLimas 22,387 11,443 , 112,654 1 78,699 591,066. I 229,891.
CommonLimas 6,172 6,561 47,852 59,874 552,490 280,532.
Seed IBeans 4,680, 2,956 I ~i,869 29,880 628,035. 295,289.
!
Mis~. 1,041 987 i 2,674 4,824 11,156. 14,472.
TOTALS 88,319 39,756 556,558 229,108 s$2,251,090. ! $986,676.
NOTE: Acreage is estimated. Yield and value are actual.
CROP DISTRICT iACREAGE I YIELD VALUE, ,|
0 Cwt.NI Lompoc 79 7,899 $11,8480NS !

CROP
AN
FDSL EOGEWADERSRD
EN
DISTRICT
S~uta Maria
Lompoc
TOTALS
KINDS
(msc.)(Nast.)(Sw.Peas)
(Sw.Peas)’ (mac.)! (Garden)
ACREAGE
1,255
2O0’50088
2,025
YIELD
LBs,
125,,000210,000150,000
72,876I 148,246
24,804
ii 750,926
47,569.96,400.16,125o
$509,892. i
. ’,CROP ] DISTRICT I ACREAGE ’ YIELD VALUE
I TonsLompoc-
G i Santa Ynez I I0,000 7,500 $ 90~000.
A A Santa Barbara 1,250 16,250.
N ~ Santa Maria 11,500 145,750.! i
2,500iY
II, 500
tTOTALS l 24,000 20~2B0 ! $250,000.
I
il
ICROP DISTRICT I ACREAGE YIELD VALUE
M Cwt.
US Lompoc 1,687 15~128 $85,975.
T !AR TOTALS I 1,687 15,128 $8o,970°
CROP I DISTRICT i ACREAGE YIELD VALUEI
S Tons.
U B Lompoc 2,959 56,221 $466,654.
GEA E Santa Maria 751 6,917 62,875.
RT
65,158 $529,507.A
S T 0 T A L S ] 5,710

CROP i DIS ICT YIELD i V LUECwt.
B I
A Lompoc- , !R I SsntaYnez i 539 4,310 $ 4,300.
E , Santa Maria 2,255 18,027 17,125.Y
i 2,792 22,537 $21,425.TOTALS ;
CROP I DISTRICTtI
0 I Lompoc-A Santa YnezTS Santa Maria
ACREAGE
152
i, 488
YIELD
1,640
Cwt.
915
8,928
VALUE
$ 867.
8,055
T 0 T A L S ! I 9,841 r $ 8,902.
CROP DISTRTCT ...... ~CREAGE YIELD "VALUE .........
W ...... Lompoch ............................... . ..................................H Santa Ynez 285 1,998 $ 2,085.EA Santa Maria ~2! 2,246 2,155.T
t ’T 0 T A L’S 1 " 606 , 4}244 $:4;2i6.
CROP
AL’FALFA
TDISTRICT ACRE.AGE YIELD
TonsLompoc- I .... :S~nta Ynez 2,’055 11,094
Santa Maria ~ 5,905 28,000
V~UE
TOTALSi
7,956t
564,000.

,V~ GE T’ABL, E’ C R0 P~S__.
1.9 3.1
iDISTRICT
GUADkLUPE-SANTA MARIA
; KINDS i ACRFAGEii
YIELD
i ~ Cars’ ! :I A~ise i 97 55I Bell Peppersl 57 I 50
i Broccoli 2i51
155
Cabbage 36 24
Carrots 5,432 ! 2,942dauliflower 4,478 i 2,624
~eleNJ 108 i 180ChiCory 76 i 65
Lettuce 5,279 I 2~186~ixed Veg. 889
1751
I Parsi~y 26 55
VALUE
Eab
$ 26~057.26,654.76,560.
5,300°1~568,385.1~155,552.
77,150~30,105.
i,095~860.578,696.14,925.
Peas 891!
137 148~i12.
i Spinach 50 20 7,545.
Tomat6es i,~86!
695 510,060.
14,998 * 9,917 $4;916,701.
i2
iI
Cars
Bell Peppers I ~ 2 $ 1,030.
Carrots 178 I 153 68,372.
Cauliflower 247 ’I 145 67,825.
I L@iPOC Ce].eiv 70 46,890.
Lettuce I 15 1118
I8,510~
~.Itixed Veg. I 26,880.27,617.20~550.
TOTAL ~
64 i
i055
Peas ! ].62 , 25
.I Tomatoes58 !
~29796 537 $264,474,,
Cars
S~TA ’ Green Limas I 176 48 $ 60,000.
BARBARA Peas ! 58 9 9,0OO.
TOTAL I I254 57 $ 69,000.
ii
T 0 T A L S . 16,028 i0,~ ’~i $5,250,175.
NOTE: Actual survey of acreage taken quarterly Shows that anaverage of 20% of acreage credited above to Santa Maria-Guadalupe originated in Oso Flaco, San Luis Obispo County,but was packed in Santa Barbara County.

ORCIIARD CROPS
].951
DISTRICT KINDS ACREAGE i YIELD I VALUE
Tons iSantaBarbara Walnuts 5,500 i~145 $ 177,418o
ICars
ILemons 2,526 956 I $1,481,800o
SantaBarbara Oranges 466 45 15,].94.
t
I Grapefruit 10 2 900.
[
Totals Citrus 2,802 t 1005 $1,497,894.I I
Lbs.
Santa iBarbara Avocados 7O 146,000 $ 19,000.
T 0 T A L S 8,572 - - - $1,694,512.(All Orchard Crops)
APICULTURE
CROP YIELD
Honey
I
i VALUE
6 tons t $5,120.l
BULBS
Ii

i

GIANNINI FOUNDATION OFAGRICULTURAL ECONOk~ICII
lIBRARY
AGRICULTURAL CROP REPORT
of
SANTA BARBARA COUNTY.
4 Compiled by
Eugene S, Ke~logg,
County Agricult~ra! Com~is sioner
January i, 19~

A~IC~TURAL C~P REPO~
1952
Santa Barbara County, California
Many requests are received at the County AgriculturalCommissioner’s office for figures dealing with the agricultural output ofSanta Barbara County. These requests come from government agencies,Chambers of Commerce, transportation companies, banking institutions, farmers~
cooperative organizations, marketing agencies and investigators from variousinstitutions throughout the country. The figures found in this report havebeen secured from various agencies, including the several large warehousesof the county, the railroads and other co,non carriers, the various agricultur-al cooperative marketing associations, the University of California ExtensionService, the Federal Agricultural Census, various farmers’ organizations,packers, shippers and many individuals in close touch with the movement ofagricultural col~nodities.
It is somewhat difficult to arrive at the production figtu-es onmany commodities, such as grain and alfalfa hay, since a large tonnage remainson farms, but much of this appears in the form of animal industry productsshipped later.
While this is a commodity production report, there is a verystrong demand for valuation figures. Those shovm here are on an f.o.b, basis,not what the farmer received. The figulres given represent products sold, andin the case of animal in~n~try should not be taken to mean a census of animalsin the county.
The acreage of the county has been divided very roughly intothree main districts: the Santa Maria, including Guadalupe, Casmalia, Orcutt,Los Alamos and Sisquoc; the Lompoc, including all of the S~mta Ynez andLompoc Valleys and the coast north of Gaviota; the Santa Barbara, includingCarpinteria, Montecito, Goleta and the coast south of Gaviota. Allocation ofproduction figures to each district in the case of Animal Industry is estimated.Acreage figures for field crops and vegetables are also estimated.
/ .~, . . j"
/ S. Kellogg ///County Agricultural Co~missiort6r /

AGR/CULTU~ CROP I~IPORT
°.
1952
Santa Barbara County. California
Total Number Farms ........................ 1,408Total ~lue Agrim~Itural Products ............. ~JlI,690,204.Total Acreage ...................... 1,683,200Total Acreage U.S.Forest Rcserve l~ea .......... , . 754,880Total Acreage Agricultural l~ea ............. 775,191Estimated Total Population ................. 65,075Estimated Total Population Outside Incorporoted Cities .... 21,552Estimated Value Petroleum Products ............. ~)4,760,000.Estimated Value Other Mineral Products .......... 500,000.Assessed Valuation (including operative’property) ......
Due to its geographic position Santa Barbara County representsa variety of climatic and soil types. From Point Concepcion, the greatcontinental headland, the coast line runs north in one h~s’~ce and southin the other, e;~osing approximately i00 miles of coast line.
Two main streams traverse the c6unty from east to west: theSanta ~aria River on the county’s north bounda~j, and the Santa Ynez Riverto the south of the Santa ~aria. ~ese streams have laid dmm lar~o deltaswhere vegctm~ble growing and other intensive crops are grm-n.
On the south is a long, narrow coastal plain with a southernexposure where orchard crops ~nd general farms are found. Citrus and semi-tropic fruits are &Term in this ~ea.
stock.The islemds off the coast are devoted to the production of live-
ApproXimately one h~if the area of the county is made up of UnitedStates Forest lands.
.A G R I C UL T U RA IJ C R O P R E P O R T
" of
SANTA BARBARA COUNTY
O
F"r. Concepcion
Lompoc
OUTLINE MAP OF SANTA BARBARA COUNTYSHAIIKI> AREA SHONING SANTA BARLARA
NAT IONAL FO2F~ T

o
o
u’~ ~ ,-I~
0’...0 C~
~,--I
~0 ,-I
o~ ~r-1
r-~ O
J ! =
o~ ~o ~ ,-I o o r’-tco ,--I rH *~ O O tO
O
O~o~ ~ ~ r-’l
~.- o u~ O O I~D O ~O i-I @ I 00
r-~ O rH ~-~,-I CO
c’b 0 CO ~ 0 " I
r-t ~’~ Ot~
~ o ~ ~ u~ Ico
~o u~ ,-I ~ I ~o
~o o d gr-i o3
D--
+
o~ C/3
~~j o
E~
O
.~I ~ ~r~ ~
f~o
+ ___
co
d d .,? ~

LLOS AL~,IOS-GUADALUPE-SANTA MARIA DISTRICT
1952
CROPi YIELD
I ACREAGE IVALUE
fmimal Industry(Estimate 40%) 244,200 $ 820,120.
Bulbs I0 4,000.
IField Crops 48,987 1,179,678.
CarsVegetables 15,955 10,715 4,483,651.
TOTALS 509,150 --- $6,487,429.
C/d~PINTERIA-GOLETA-S~]TA B;~. DISTRICT
CROP ,~CP2:,~GE YIELD ii
VI~UE
Animal Industry(Estimate 14%) 85,470 --- $ 287,042.
Lbs.Avocados 70 147,560 I 12,925.
Cars
Citrus 3,155 958 I 1,401,600.
Field Crops 9,075 --- 515,705.Cars
Vegetables 405 54 51,600.Tons
Walnuts 4,205 2,174 496,211.
Bulbs 50 --- I 8,000.
TOTALS 102,590 !" --- . $2,571,079.
ST~TA YNEZ-LOMPOC DISTRICT
CROP ACREAGE YIELD Vf~UE
~limal Industry(Estimate 46%) 280,850 $ 9&5,158.
Tons
Apiculture i00 9,000.
Field Crops 47,805 $1,517,119.Cars
Vegetables 1,407 7].8 562,459.
TOTALS 550,042 ~ --- $2,651,696.


i
>
r--t
0 r-I 0 0 0 0 ~ 0 0
0 0 ~.0 r-I r-I ~0 CO r-I
I~0 ~ 0 0 0 0 0 0 0D..- ’~ 0 0 0 ¯ LO ~ 0 0
~. ~ ,o o o o~o°0 ,aD 0 0 0 ,0"; CD0"~ 0 0 0 ~0 ~ ,~ 0 I
IO~ ~ LO 0 ~.0
II
/
I
cO
H
.<
~ ~ o ~ o o~o°(.0 0 CO 0 "0 "0H H 1.~ IL~ 0 ~ 0 ~ ,~. 0 I
itO I
~ iz:l o [’.--
;It
o o4" ~0g g o .ore°o~ ~ o o ~o,~.,
,~.0 ~Q eOo Io I
I
0
r-~
hO O
~g~.~~~~ CObOO~,-I r-i
~NNNNN~NNgNgN~ r-4,-4
NNNNNNN~N°°N"N u~tO
,-I ,-I ,-I ,’-I 0 ,--I e,~ ~O 0 CO ,-’lo~,-t
o
~o,-t
~.r.i
0

c
Q
rj
C
; ¯,’-I C~ toP-4 0
o’~ o ,--t,-.I
,..-.Ie-t ,~
or--I
t~
f-I
’~ ~ OI
0’~ I,-.I F~ 0,l 0 i-1~ I
,--t
to o,.-I ~,~ 0~ o ¯ o~t,o ° l
IE-I ,-I ~.P I
,-t
c ’ It,o I
It~
i.o i~ o oboo~
o ~ B.-
t.mr-tlO o o l~-
to
o o o~ ot~
~g ~2 0g
o r/)
E-I0
0 B-,
c~ c;o
0"~ or-t
r"t’
,-t,-4
o c~o~
oo
,-I
o~
O~ ~o~,-I E~
to
oH [--t
0t~O~ ~o
E-t
H
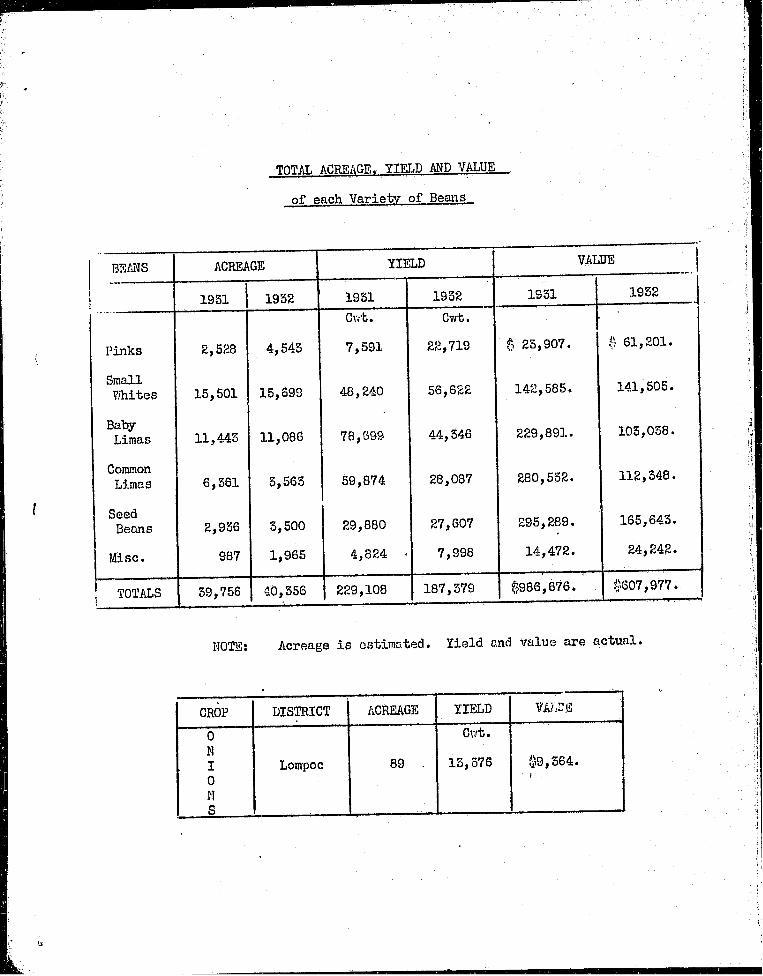
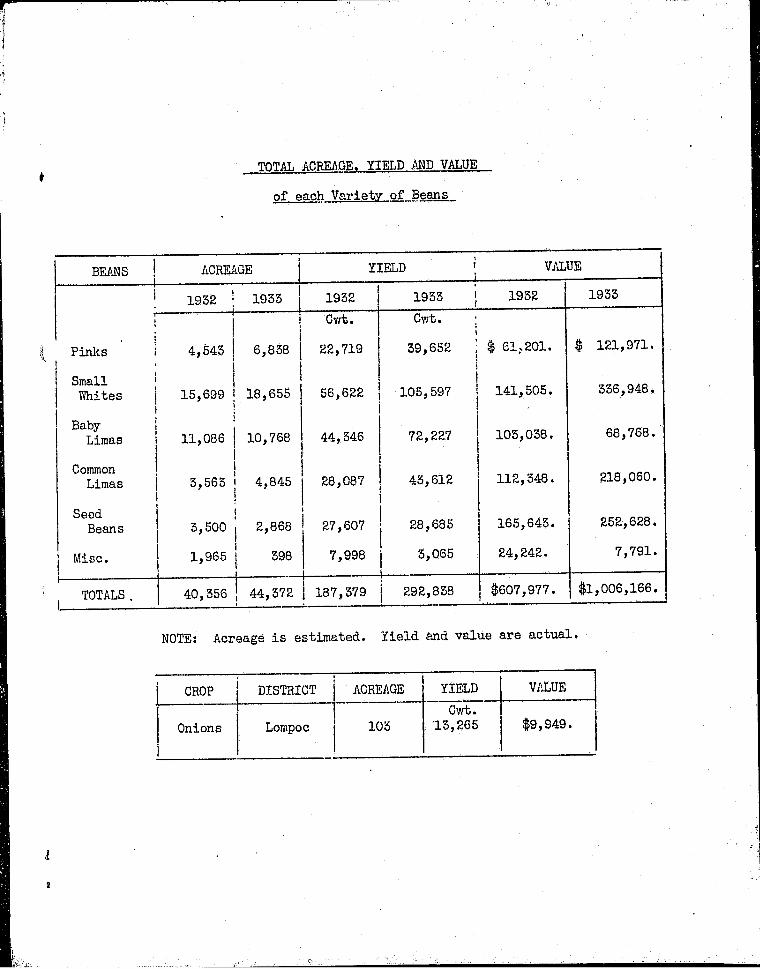
TOTAL ACREAGE, YIELD AND VALUE
of each Variety of Bem~s
BE2aS ACREAGE YIELD VALUE
1951 1952 1951 1952 1951 1952
Cut. Cwt.
Pinks 2,528 4,545 7,591 22,719 25,907. 61,201.
SmallV,%ites 15,501 15,699 48,240 56,622 142,585. 141,505.
BabyLimas 11,445 11,086 78,G99 44,546 229,891. 105,058.
CommonLimas 6,561 5,565 59,874 28,087 280,552. 112,548.
SeedBeans 2,956 5,500 29,880 27,607 295,289. 165,645.
M~sc. 987 1,965 4,824 7,998 14,472. 24,242.
l
TOTALS 59,756 ¢0,556 229,108 187,579 $986,676. ~S07,977.
NOTE: Acreage is cstimated. Yield and value are actual,
CROP DISTRICT ACREAGE YIELD
0 C~.
NI Lompoc 89 15,576 $9,564.0
I
NS
I|
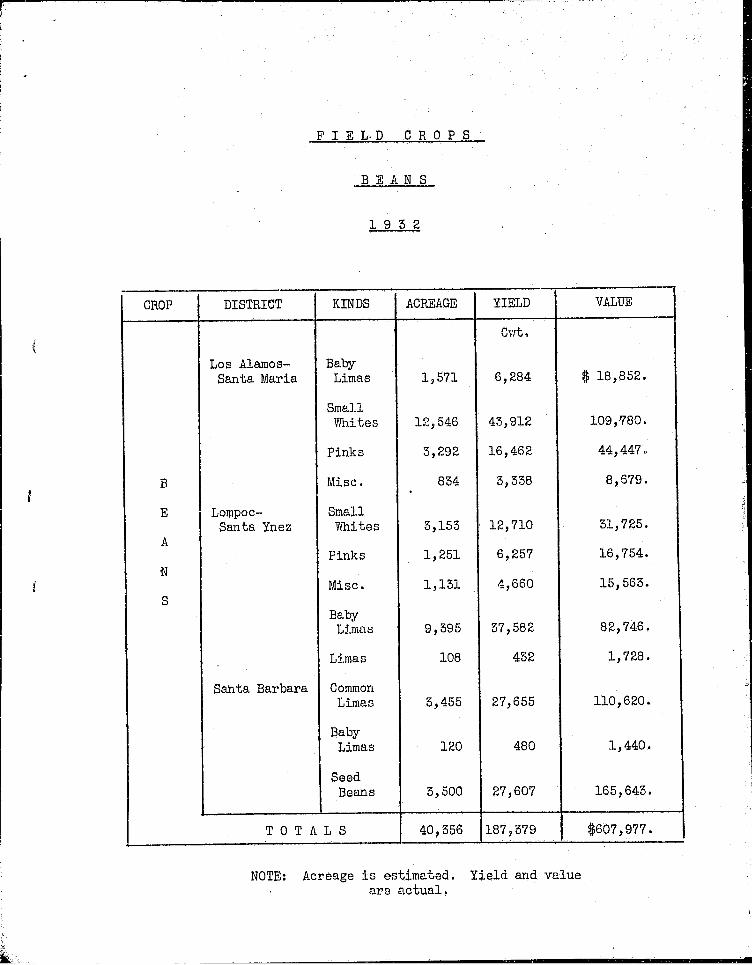
FIELD CROPS
BEANS
1932
ACREAGE VALUEYIELDKINDSDISTRICTCROP
B
E
A
S
Cwt °
6,284
43,912
16,462
5,558
12,710
6,257
4,660
57,582
452
27,655
480
27,607
BabyLimas
Sma].lWhites
Pinks
Misc.
Small~ites
Pinks
Misc.
BabyLimas
Limas
CommonLimas
BabyLimas
SeedBeans
Los Alamos-Santa Maria
Lompoc-Santa Ynez
Santa Barbara
$ 18,852.
109,780.
44,447~
8,679.
51,725.
16,754.
15,565.
82,746.
1,728.
110,620.
1,440.
165,645.
1~571
12,546
5,292
854t
5,155
1,281
1,151
9,595
108
5,455
120
5,500
TOTALS $607,977.40,556 187,579
NOTE: Acreage is estimated. Yield and valueare actual.

CROP
AN
FDL SOGENAEER DRDS
EN
DISTRICT
Lompoc
Santa Maria
TOTALS
KINDS
Misc.Garden
Misc.
ACREAGE
70055
1,000
1,755
VALUE
$550,000.1,600.
500,000.
$851,600.
CROP DISTRICT ACREAGE YIELD VALUE
TonsLompoc-
G Santa Ynez 14,968 22,451 $224,400.
RHA A Santa Barbara 2,000 5,000 56,000.
IYN Santa Maria 14,000 14,000 140,000.L_
TOTALS 50,968 59,451 $400,400.
CROP DISTRICT ACREAGE YIELD VALUE
M Cwt.US Lqmpoc- 4,542 51,615 $140,256.
T Santa YnezAR TOTALS 4,542 51,615D I $140,256.
CROP DISTRICT ACREAGE YIELD VALUE
S TonsU B Lompoc 2,745 57,914 $275,619.qEA ~E Santa Maria 1,055 9,959 74,772,RT
S TOTALS 5j800 47,875 $548,591., , Q ,

CROP
BARLEY
DISTRICT
Lompoc-Santa Ynez
Santa Maria
T 0 T A L S
ACRF~kGE
i0,500
YIELD
C~,~.
49,181
75,425
124,606
VALUE
$26,700.
c9,975.
$86,875.
CROP
0ATS
AT
DISTRICT
Lompoc-Santa Ynez
Ss~ta Maria
TOTALS
ACREAGE YIELD
Cwt.
1,186 8,088
15,204.
21,292
DISTRICT
Lompoc-Santa Ynez
Santa Maria
TOTALS
ACREAGE
i, 58].
568
1,949
:[IELD
Cwt
15,808
5,689
19,497
VALUE
$ 6,470.
10,167.
$16~657.
VALUE
$12,194
5~006
~’~ 200.
CROP
ALFALFA
DISTRICT
Lompoc-Santa Ynez
Santa Maria
TOTALS
ACREAGE _
5,118
5,950
9,068
YIELD
Tons
15,500
28,500
44,000
VidLUE
$124,000.
228,000.
$552,000.
- <> "
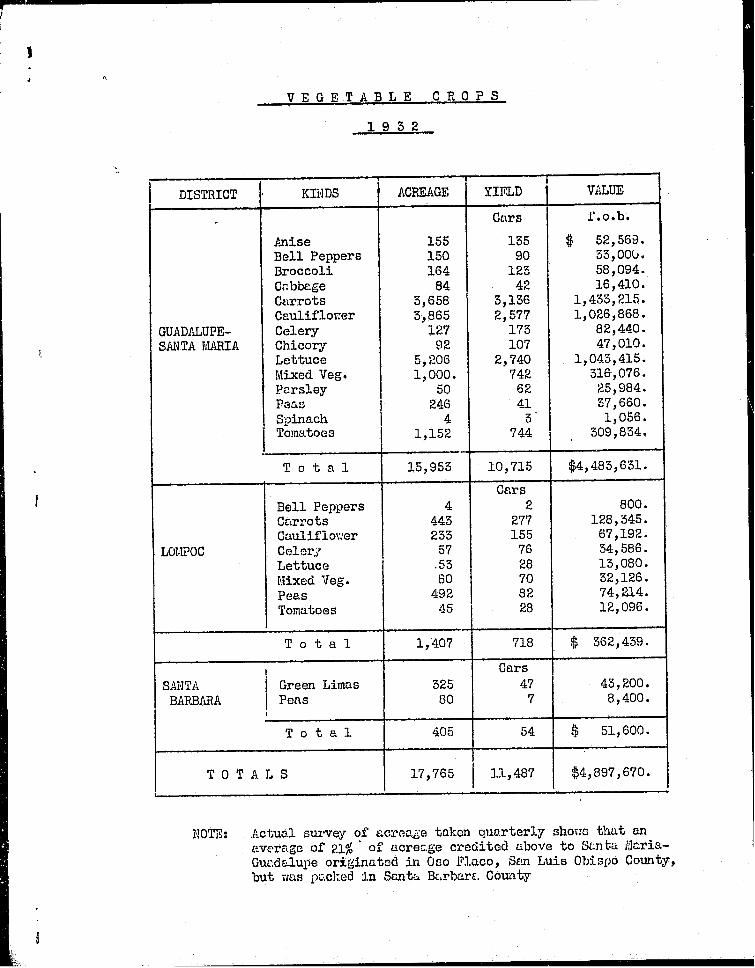
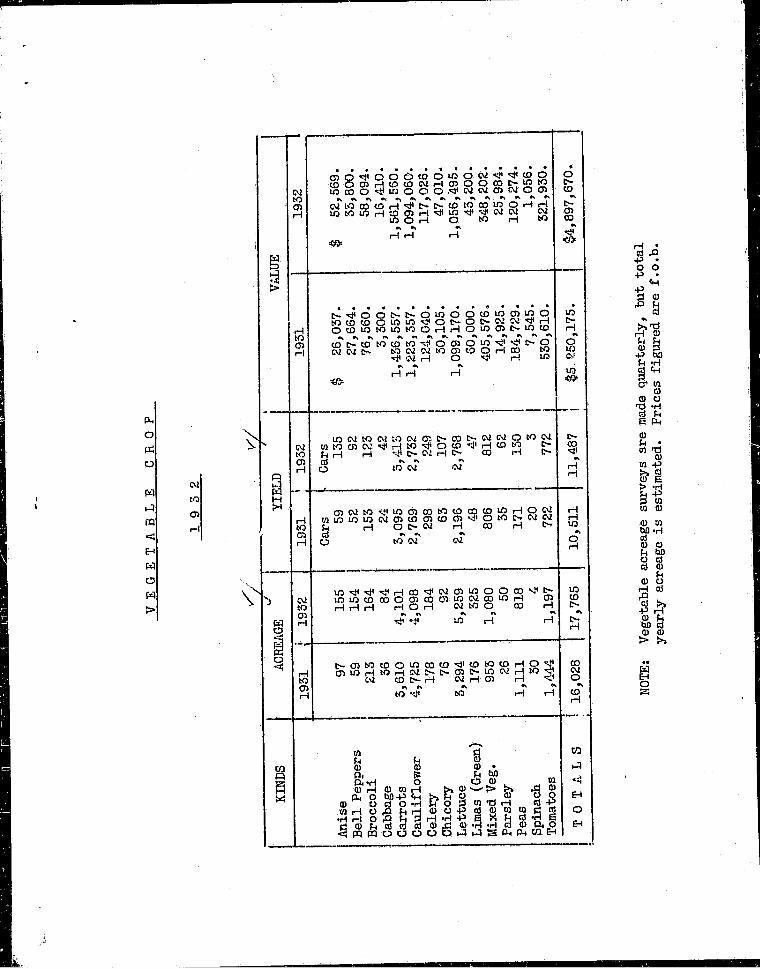
VEGETABLE CROPS
1952
I
DISTRICT KIi,IDS ACREAGE YIFLD 1 W~UE
Cars f.o.b.
~mise 155 155 $ 52,569.Bell Peppers 150 9O 55,00b.Broccoli 164 125 58,094.C~bbage 84 42 16,410.Carrots 5,658 5,156 1,435,215.Cauliflower 5,865 2,577 1,026,868.
GUAD~LUPE- Celery 127 175 82,440.SANTA ~.~/LI A Chicory 92 107 47,010.
Lettuce 5,206 2,740 1,045,415.Mixed Veg. 1,000. 742 516,076.Parsley 5O 62 25,984.Peas 246 41 57,660.Spinach 4 5~ 1,056.Tomatoes 1,152 744 509,834.
Total 15,955 10,715 $4,485,651.
Cars
Bell Peppers 4 2 800.Carrots 445 277 128,545.Cauliflower 255 155 67,192.
LOMPOC Celery- 57 76 54,586.Lettuce .55 28 18,080.Mixed Veg. 80 7O 52,126.
Peas 492 82 74, 2i4.Tomatoes 45 28 12,096.
Total 1,407 718 $ 562,459.
Cars
S~,]TA ] Green Limas 525 47 45,200.BARB/dlA ] Peas 80 7 8,400.
!
Total 405 54 $ 51,600.
TOTALS 17,765 11,487 $4,897,670.
NOTE: Actual survey of acrease taken quarterly shows that anaverage of 21%" of acrec, ge credited above to S~mt.a ~.]aria-Guadalupe originated in Oso Flaco, San Luis 0bispo County,but ~as packed in Santa ~rbar~. County

O R C H A RD C R O’P S
-1952
DISTRICT KINDS ACREAGE YIELD VALUE
Tons f.o.b.
SantaBarbara Walnuts 4,205 2,174 $ 496,211.
Cars,
L emon s 2,725 895 $1,576,500.
Santa Oranges 4OO 57 22,700
BarbaraGrapefruit i0 6 2,400.
Totals Citrus 5,],35 958 $1,401,600.
I Lbs.
SantaBarbara Avocados 70 147,360 $ 12,925.
I
TOTALS 7,410 $1,910,754.
(All Orchard CropS)
APICULTURE
CROP YIELD VALUE
TonsHoney i00 $9,000.
BULBS
CROP ACRES V~UE
Bulbs 4O $].2,000.
l


AGRICULTURAL CROP RE-PORT
SANTA BARBARA COUNTY
Compiled by
Eugene S. Kellogg
County Agricultural Commissioner
I
January i, i~84

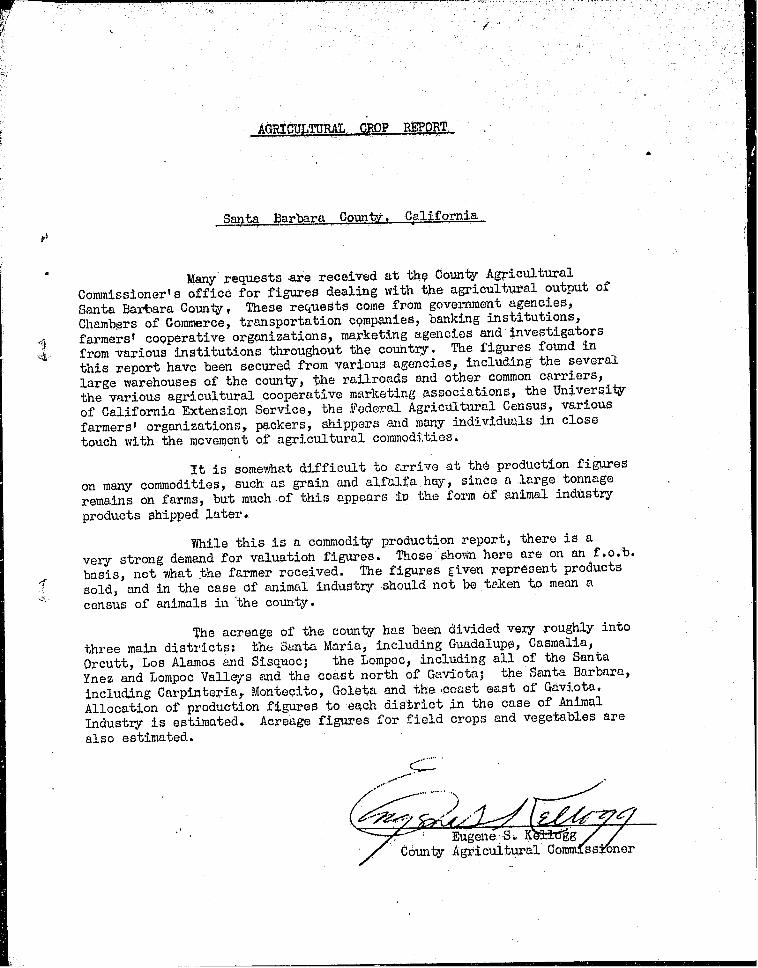
AGRICUL~JRAL CROP REPORT
Santa Barbara County, California
Many requests are received at the County AgriculturalCommissioner’s office for figures dealing ~ith the agricultural outputof Santa Barbara County. These requests come from government agencies,Chambers of Commerce, transportation comp~mies, banking institutions,farmers’ cooperative organizations, marketing agencies ~d investigatorsfrom various institutions throughout the country. ~le ~igtu-es fouhd inthis report have been secured from various aEencies, including theseveral large warehouses of the county, the railroads and other commoncarriers, the various agricultural cooperative marketing associations,the UnivErsity of California Extension Service, the Federal AgriculturalCensus, various farmers’ organizations, packers, shippers and manyindividuals in close touch with the movEmEnt of agricultural commodities.
It is somewhat difficult to arrive at the production figureson many commodities, such as grain and alfalfa hay, since a large tonnageremains on farms, but much of this appears in the form of animal industryproducts shipped later.
While this is a commodity production report, there is a verystrong demand for valuation figures. Those sho~mhere are on ~un f.o.b.basis, not what the farmer received. The figtu’es given representproducts sold, and in the case of animal industry should not be takento me~ a census of animals in the county.
The acreage of the county has been divided very roughly intothree main districts: the Santa Maria, including Guadalupe, Casmalia,Orcutt, Los Alamos and Sisquoc; the Lompoc, including all of theSanta Ynez and Lompoc Valleys and the coast north of Gaviota; the SantaBarbara, including Carpinteria, ~ontecito, Goleta ond the coast south ofGaviota. Allocation of production figures to each district in the caseof Animal Industry is estimated. Acreage figures for field crops andvegetables arc also estimated.
..~.~--"
" ugono S.- / /
f County Agricultural Commisa~one~

AGRICULTURAL CROP REPORT
193S
Santa Barbara County. 0 California
4 Total Number Farms ......................Total Value Agricultural Products- ¯ .............Total Acreage " t R s r e A e ............
TotalAcreage G.S3or s e e v r a ...........
Total Acreage Agricultural Area ..............Estimated Total Population .... I c r o e ........Estimated Total Population Outside n o p rat d Cities ....Estimated Value Petroleum Products .............Estimated Value Other Mineral Productsxt ¯Assessed Valuation Non-operative Prope" y (~’-eal estate ~d "
improvements) .......P ive’p " r~)" i " Total Assessed Valuation (including o erat rope ¯ ¯
1,408$10,074,440.
1,685,200754,580775,191
65,07521,552
$2,431,676.500,000,
$64,205,770,.$127,009,515.
Due to its geographic position Santa Barbara County represents avariety of climatic and soil types. From Point Concepcion, the greatcontinental headland, the coast line runs north in one instance and east inthe other, exposing approximately i00 miles of coast line.
Two main streams traverse the county from east to west: theSanta Maria River on the county’s north boundary, and the Santa Ynez Riverto the south of the Santa Maria. These streams have laid down large deltaswhere vegetable growing and other intensive crops are groom.
On the south is a long, narrow coastal plain vdth a southernexposure where orchard crops and general farms are found. Citrus and semi-
tropic fruits are grown in this area.
The islands off the coast are devoted to the production of live-
stock.
Approximately one half the area of the county is made up of United
States Forest lands.

I
° ~i
.,A G R I C TJZ T U R ~ Z C R O P R E P O R T
"" Of
SANTA BARBARA "COUNTY
/
El
Lom~oc
Pi’. concept;on
¯ .* .’ / ; .,.’.
OUTLINE N~ OF SANTA BARBARA COUNTYSHADED AREA SH0~ING SANTA BARI~tP~t
NAT IONA~ FOREST,

cJ

o :>
LOS ~LA~OS-GUADALUPE-SANTA MARIA DISTRICT
1953
CROP ACREAGE YIELD VALUE
]Animal Industry 185,000 $ 555,470.
Bulbs I0 5,000.
Field Crops 55,445 1,~57,876.Cers
Vegetables 16,152 ¯ 10,2865,692,564.
TOTALS 254,605 $5,608,910.
CARPINTF2IA-GOLETA-SANTA BARBARA DISTRICT
CROP ACREAGE YIELD VALUE
Animal Industry 105,700 $ 511,600.Lbs
Avocados .70 42,020 5,908.Cars
Citrus 5,209 795 844,471.
Field Crops 9,656 495,848.Cars
Vegetables 744 85 100,024.Tons
Walnuts 4,205 i, 586 555,850.
Bulbs 50 6,000.
TOTALS 121,614 $2,117,681.
SANTA YNEZ-LO~r20C DISTRICT
CROP ACREAGE YIELD VALUE
Animal Industry 525,500 $ 977,755.Tons
Ap~culture 50 5,500.
Field Crops 40,248 1,081,055.Oars
Vegetables 1,575 807 285,561.
TOTALS 564,921 $2,547,849.

p
~0 ~
~ ~ o ~ ~
t~t.o g ~ ~,-I ~ ~ ~
do
L’oo~ ~ 0 ~ o ~ ~ coH c¢
~ ~ ~ ~ o ~ o ~.o
..~ CO 0 O~ 0"~.~ CO
co g ~ co ~o ~
,-I ~t~ ,.-I
o~r.-t
oI
I
~o~ r~ ~ c’~ ~D ~’~ IL~
H . I o~ ~ ~oo~ I
I
o ~ ~ ~ o H o ~ ~ ~!0 I:~ [,o o~ ~o ~ ~
i.~ o
or-I.
t~~D
04 ~ I~ u’~ ~ ~ ’~ CO 0CO O~ ~0
~’~ 0 I.O ~’~ ~" O~ ~0 0
t0 o4 cD to o ~’~ o ~ o
tr~ ~ cr~
° ~’o ~.~ ~ ~oI~1 ~ 0
!
r.O
I--4
~Z
I-I
o o~ ~ 0 ~ ~ ~ ~ ~ ~ co
corH
d 00
c~0
c~ d0
~ d c~ d 00 0 0 0 0 00
0L’O
~.D 0r’t O r"l ~1
d ~¢-I
c~0
c~ d o d~
~ d LO0 0 0 0 0 O~,--I r"l u~ 0 1.0 ~. ¢.D 0 0
o o co~
~1 6") CO r"-I ~-I¢D r-I rH a’~
~,o I(Do o o o o o oco LO
~0 0 0 -0 .0 0 I
CO 0 CO 0 ~0 ~0
r H
~ ~ o o o o o o0"1
.0 .0 00 0 ~ 0 ~¢’D
¢.0 ~D
~ ~ o ~ o o o of.D C) 00 O
bO ~C)
J
o
~ ~ ~.~(DE~

r
i
P~O0~CD
E-I
O
L, t3!
r-9:
Q
~ t.o ~1 o ~ r-I~ o
~ ,.~
o~o-t
o ~ o~,~~~
~o~ o~ ~~
H"
i ,,
~o
~o~
~ ~0~ ~0 ~rH
~ ~o~ ~o~ ~ oo oo
,~o.
o
~4o.1
m..o
~..~m ID
t~
%
N~
g~
g
I
I

I1.1o
o
u
o
.j-. to 03
r.~ o~o 0~
~; 4 c;
H t-I .~l
O
t,o
O
r-tN3
0
H
H ~ t~"~ ~ ~"¢~ ¯ 0~3 ’~ I
~’3 0 0 t"- CO
.p H G ~..... ,
¢~ ir~ 1.~ O o
o ou~ co
r~
o ~~ t~
ore30"~i-.I
o2 oo
tL
c~I-.I
0~i-I
I-
L’OO~ go
C~Z 0
I"4
inO~ g~
E-t
H...~

t
FIELD CROPS
BEAN S~.
19 3
CROP
I
iI
1
L
B
A
N
DISTRICT
Los Alamos-’ Santa Maria
Ili
Lompoc-Santa Ynez i
ItI
I
iI
Santa Barbara!I
I
KINDS i !I,
BabyLimas
Small t~ites
Pinks I
Misc.
SmallWhites
Pinks
Misc.
BabyLimas
Common
Limas
BabyLimas
t
! Seedi
Beansi
lTOTALS
2,290
15~491
YIELD
Cwt.
12,595
92,944
5,462 32,773
156 £58
5,164 ~ 12,655
1,376 6,879
242 2,127
8,535 58,544
4,845 43,612
143 I 1,290I
z
2,868 ; 28,685
44,372 : 292,858
VALUE
42,816.
292,755.
99,958.
3,986.
44,215.
22,013.
3,805.
20,792.
218,060.
5,160.
252,628.
$1,006,166.
NOTE: Acreage is estimated.are actual.
Yield and value
TOTAL ACREAGE, YIELD ,~D VALUE
of each Variety of Beans
{ 1952 1958 19521 1955 i 1952 1955
: J Cv~.i~
I Cwt.
Pinks 4,543 6,838 22,719 59,652 ! $ 61.201. $ 121,971.
I
Small I iWhites i 15,699 ! 18,655 { 86,622 105,597 ! 141,505. 336,948.
t
,; f i }
Baby /{
1I
I68,768.
I218,060.
Seedi
Ii
Common I
5’565 I 4’845 I28’087 I! 1I
Limas 45,612 112,548.
’
I
I ~3,500 I 2,868 I 27,607
! IBeans 28,685 165,645. 252,628.
{’ 1,965i
1Misc. i 598r
7,998 7,791.
i1
5,065 24,242.
! l
iTOTALS 40,556 44,372i 187,379 { 292,858 $607,977 $1,006,166"[
NOTE: Acreage is estimated. Yield ~md value are actual.
CROP i DISTRICT ! ACREAGE
Onions j Lompoc I} 103
YIELD
Cwt."15,265 $9,949.

CROP DISTRICT iKINDS ACREAGE VkLUE
AN
F~ Sw.Peas 52O $105,657.
L S Lompoc Misc. 48O 120,000.
OGEW A E Santa Maria Misc. 982 248,000.
ERDRDS ,
E TOTALS 1,982 $471,657.N
J
ICROP I DISTRICT ACREAGE YIELD I VALUEI
Tons1
~
Lompoc-I
G Santa Ynez 7,500 11,280. $112,500.
RHAA S~mta Barbara 1,800 2,000 20,000.
IY~nn%n ~aria I0.000 i0,000 ! i00,000.
T 0 T A L S 19,500 25,250 $252,500.
CROP
MUSTARD
DISTRICT ACREAGE
Lompoc-S~mta Ynez
Soata Maria
TOTALS
7,091
58O
7,471
YIELD
Cwt.
63,812
5,557
69,169
VALUE
$246,464.
23,988.
CROP DISTRICT ACREAGE I YIELD i VALUEI
S Tons
U B Lompoc 2,080 ~8,819 $255,970.
GEA E Santa Maria 1,492 20,079 117,865.
RTS .
TOTALS 5,572 58,898 ! $355,855.|

CROP DISTRICT ACREAGE YIELD VI~UE
Cwt.BA Lompoc-R Santa Ynez 4,240 42, ~97 $38,157.LE Santa Maria 10,715 171,451 154,288.
Y l*
TOTALS 14,955 ! 213,828 $192,445.
CROP I DISTRICT
0 I Lompoc-A ’ S~Ita Ynez
S Santa ~,,iaria
ACREAGE
i
YIELD
Cwt."
10,485
13,469
23,952
VALUE
T 0 T A L S 2,430 $34,580.
CROP DISTRICT ACREAGE YIELD VALUE
WHEAT
Lompoc-Santa Ynez
Santa Maria
TOTALS 5,092
Cwt.
20,839
20,357
41,176 $48,595.
CROP i DISTRICT ACRF~GE YIELD W~LUE
A TonsL Lompoc-F Ssnta Ynez 2,070 10,550 $ 82,800.AL Santa Maria 6,000 29,000 232,000.FA TOT,ALS 8,070 I 39,550 1 5314,800.

VEGETABLE CROPS
!
DISTRICT KINDS t ACREAGE YIELD VALUE
Cars f.o.b.
Anise 155 98 $ 27,967.Bell Peppers 14 9 4,280.Broccoli 210 154 90,027.Cabbage 12 8 1,248.
Carrots 5,565 5,125 1,175,955.Cauliflower 5,200 2,504 560,825.
GUADALUPE-.- Celery 442 292 109,512~
SANTA MARIA Chicory 5S 66 18,555.* Lettuce 5,054 2,527 1,082,690.
Mixed Veg. 1,674 857 250,176.o Parsley I0 11 4,884.
Peas 590 6O 48,825.Tomatoes 1,594 797 569,660.
Total 16,152 lO, 286 $5,692,564.
Oars f.o.b.Broccoli 15 ll 650.Carrots 465 452 140,695.Cauliflower 22 16 5,575.Celery 215 141 48,152.
LON~OC Chicory 7 8 2,475.
Lettuce 56 28 i0,590 ¯Mixed Veg. 172 88 25,580.
Peas 571 57 56,425.
Tomatoes 52 26 ll, 790
Total 1,575 807 $ 285,561.i
Cars f.o.b.
SANTA Green Limas 569 48 $ 65,024.
BARBARA Peas 575 55 55,000.
Totals 744 85 $ 100,024.
TOTALS 18,269 11,176 $4,078,149.I
* Included are 1782 carloads shipped by truck.
NOTE: Actual survey of acreage taken quarterly shows that anaverage of 24% of acreage credited above to Smuta Maria-Guadalupe originated in 0so Flaco, San Luis Obispo County,but was packed in Santa Barbara County.

0RC~ARD CRePS
DISTRICT KINDS ACREAGE I YIELD VALUE
Tons f.o.b.
SantaBarbara Walnuts
iI 4,205 ! l, 586 $ 555,850.
l
t i C;rsl Lemons $ 811,650.I i 2,875 ~ 755
’I ~ ;
Santa ! Oranges i 52.6 ~ 5B 51,945.
Barbara fGrapefruit I
ilO i
i2 876.
4 tTotal Citrus 5,209 j 795 $ 844,471.
ILbs.
SantaiI
Barbarai Avocados I
7O 42,020 $ 3,9o8.
| ,.’ II ..... [
! IT 0 T A L S ~ I
(All Orchard Crops) i 7,484 $1,204,209.
i
APICULTURE
CROP I
Honey I
YIELD
1 VALUE 1’l’ons
$5,500,50
BULBS
ICROP t
L
t
~CRES VALUE I
40 $9,000. I


¯ ,,- ¯
AGRICULTURAL CROP
of
REPORT
GIANN|NI FOUNDATION OF
A~tII|CULTIJ RAL ECONOMIP..41LIBRARy
SANTA BARBARA COUNTY
!
Compiled by
Eugene S. Kellogg
County Agricultural Commissioner
January i, 1955

AGRICULTURAL CROP REPORT .
Santa Barbara ,County, California
Many requests are received at the County AgriculturalCommissioner’ s office for figures dealing with the agricultural output ofSanta Barbara County. These requests come from government agencies,Chambers of Commerce, transportation companies, banking institutions,farmers’ cooperative organizations, marketing agencies and investigatorsfrom various institutions throughout the country. The figures found inthis report have been secured from various agencies, including the severallarge warehouses of the county, the railroads and other common carriers,the various agricultural cooperative marketing associations, the Universityof California Extension Service, the Federal Agri~Itural Census, variousfarmers’ organizations, packers, shippers and many individuals in closetouch with the movement of agricultural commodities.
It is somewhat difficult to arrive at the production figureson many commodities, such as grain and alfalfa h~, since a large tonnageremains on farms, but much of this appears in the form of animal industryproducts shipped later.
While this is a commodity production report, there is avery strong demand for valuation figures. Those shown here are on an f.o.b.basis, not what ~he farmer received. The figures given represent productssold, and in the case of animal industry should not be t~ken to mean acensus of animals in the county.
The acreage of the county has been divided very roughly intothree main districts: th~ Santa Maria, including Guadalupe, Casmalia,Orcutt, Los Alamos and Sisquoc; the Lompoc, including all of the SantaYnez and Lompoc Valleys and the coast north of Gaviota; the Santa Barbara,including Carpinteria, Montecito, Goleta and the coast east of Gaviota.Allocation of production figures to each district in the case of AnimalIndustry is estimated. Acreage figures for field crops and vegetables arealso estimated.
l
County Agricultural ComH~Ssi~ner

AGRICULTURAL CROP REPORT .
1954
Santa Barbara County, California
Total Number Farms ....................Total Value Agricultural Products .............Total Acreage. ¯ ~ ¯ ~ ~ ~ ..............Total Acreage U.S.F res e eve Area ........Total Acreage Agricultural Area ..............Estimated Total Population ................Estimated Total Population Outside Incorporated Cities ¯ ¯Estimated Value Petrole~n Products ...........Estimated Value Other Mineral Products ....Assessed Valuation Non-operative Property (real estate and
1,408$11,205,008.
1,685,200754,580775,191
67,50022,200
$6,471,680.500,000
improvements) ..... . . . . $64,186,180.
Total Assessed Valuation (including operati~-e’property) $159,651,452.
Due to its geographic position Santa Barbara County representsa variety of climatic and soil types. FrQm Point Concepcion, the greatcontinental headland, the coast line runs north in one instance and eastin the other, exposing approximately lO0 miles of coast line.
Two main streams traverse the county from east to west: theSanta Maria River on the county’s north bo~idary, and the Santa Ynez Riverto the south of the Santa Maria. Those streams have laid do~m largedeltas where vegetable growing and other intensive crops are grown.
On the south is a long, narrow coastal plain with a southernexposure where orchard crops and general farms are found. Citrus and semi-tropic fruits are grown in this area.
Th@ islands off the coast are devoted to the production of live-
stock.
Approximately one half the area of the county is made up of United
States Forest lands.
O
/
P’t. Concept-ion
OUTLINE MAP OF SANTA BARBARA COUNTYSHADED AR~,. SHOWING SANTA B~.dlBARA
NATIONAL FOREST

0
C
c
,]
~C~O¸
o o ~ o 00
o’~ co oo~
03i.o k’~ co
o ~ o
020
d,.~,
d c; d ,,4 d O~ co ~.D
~~ O
o ~ c~co o~ e.D
,<t O3 0 O~ cot,Q0"~
c0
t’O 0 O~
~-t r.D t-.,.
~o o ~ ,-t~0 t~ ~.. o’~ r-t
O ,-t Pt,-4 ~D
i
o’~4~ 0 ~.~
oE-I
o r..-t % 0
o
"’ il . , ...... J
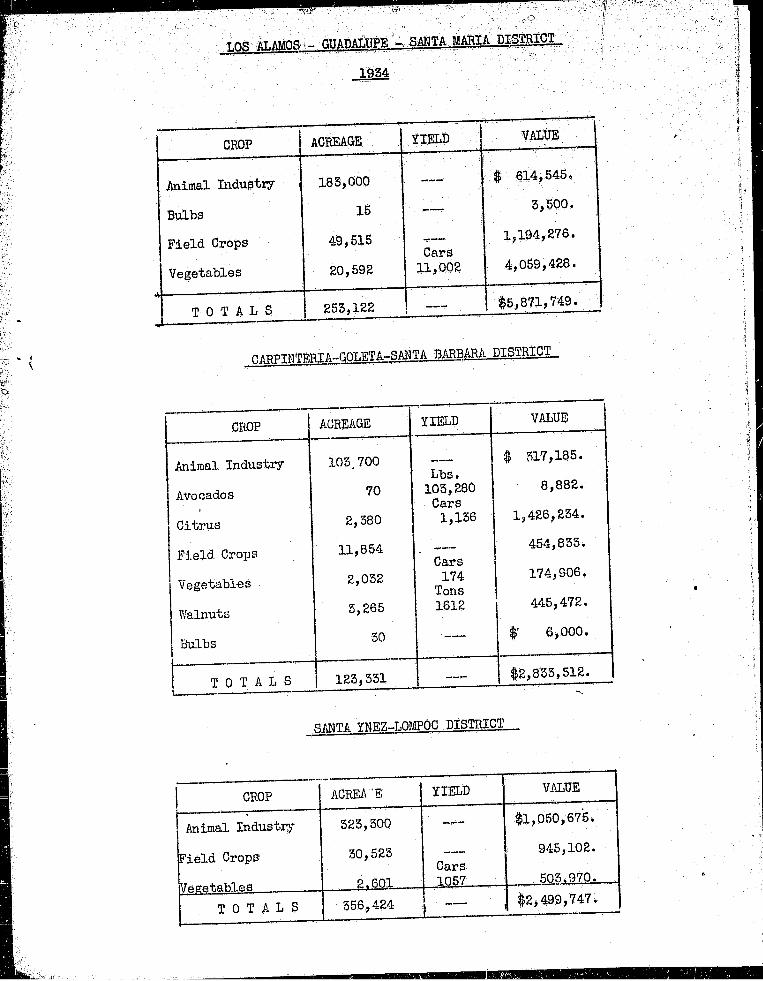
CROP
imal Industry
IB bs
IField Crops
J TOTALS
ACREAGE
185,000
15
49,515
20,592
255,122
YIELD
Cars!1, O0 2
VALUE
$ 614,545.
5,500.
1~194,276.
4,059,428.
$5,871,749.
CARPINTERIA-GOLETA-SANTA B~d~BAPJ~ DISTRICT
CROP
Animal Industry
Ave c ado s
Citrus
Field Crops
Vegetables
Walnuts
Bulbs
TOTALS
ACREAGE
105.700
7O
2,580
11,884
2,052
5,265
5O
YIELD VALUE
$ 517,185.Lbs.
105,280 8,882.
Cars1,136 1,426,254.
454,855.Cars
174 174,906.Tons1612 445,472.
1 -- $’ 6,000.
$2,855,512.128,551
_SANTA YNEZ-LON[POC DISTRICT
CROP
Animal Industry
{ield Crops
Vegetables
T 0 T A L S
ACREAGE
525,500
50,525
2~601
556,424
YIELD
Cars_1057
VI~UE
$i,050,675.
945,102.
505,970-
$2,499,747.
m
}[
osoo o
LO U’~ ~ 0"~ r-t O~ 0CO
~ o~r-i o
~ ~ 8 8 8 8 80 0 0 0 0 0 0
0 r-’l
,-T
o 8 c~o o o
o
~ ~ o o o~8~0~
I-"
oco o
o o° ~o .o
~0 ~1~ o 0
~ ~ ~ ~ s~, ~
o~o
~o’o o o o
~ ~ ~ o .o .~oo~o~
o I
o I ’o !
ooL~O
o~, ~ ~ ;---1
~
\

I:N
0
rJ
C
0.) 4.~ m
0 °* ,~-I
d~g..~ t~r~
~~.~
~.~ ~°~
., g~.~o ~m n::l ¯
gqg .
b, #,~.4 o-~
C)

0
o
I ¯co
COL,oi-I
L,O ~ O 0L’OL’O
L’O 0CO
o~L’O
t,
r-I or-I
~r--I ~L"OL’O ~"00
O~ o~o ~ 1r-I0r-I
L~’~ II
r-I I
oL’OO~ I
Ir-i
,,
LOL,O C’.C-..r-’l
O2L,O ¢0 0 C~"~ O Z L~
0 r"l
r--I r-I O~
0 r~
0 ,,.)0
i

TOTAL ACREAGE, YIELD AND VALUE
of each Variety of Beans
ACREAGE
Pinks
Small~ites i
Baby iLimas i
CommonLimas
SeedBeans
Misc.
TOTalS
I
I 1955 { 1954I-
[ I6,858 I 4,322
18,655 i
I
10,768 ;
4,845
2,868
598
15,546
9,224
I VI~UEt YIELD ,
1953 1954 ~: 1955 1934
Cwt.I
59,652l!I 105,, 597
!i
72,227
6,273 ! 45,612
!l
3,596 ; 28,685I
790 i 3,065I
I
Cwt.
20,216 $ 121,971.
79,595 556,948.
I’
56,101 68,768i
50,187
25,886
4,848
$ 80,000.
249,526.
I
44,372 I, 59,351 ’ 292,838 256,651
218,060.
252,628.
7,791.
$1~06,166.
195,227.
286,627.
159,056.
24,184.
$’ 974,420.
NOTE: Acreage is estimated. Yield and value are actual.
CROP<.
i DISTRICT~",
ACREAGE
OnionsiLompoc I
I03
Potatoes ISanta Maria I 815
i
YIELD I VALUEt
15,568 I $ 19,210.I
16~,0001 114,100.

_LI E L D C R 0 P S ."
BEANS
19 5 4~
CROP
B
E
A
N
S
DISTRICT
Los Alamos-Santa Maria
Lompoc-Smlta Ynez
Santa Barbara
KINDS
Bal~yLimas
SmallWhites
Pinks
Misc.
Small~ites
Pir~s
Misc.
, Baby] Limas
CommonLimas
SeedBeans
~,li sc
TOTALS
ACREAGE
2,815
].4,500
5,596
544
846
726
561
6,409
6,275
5,596
85
59,551
YIELD
Cwt.
11,260
74,316
16,061
1,671
VALUE
$ 58,284.
254,095-
61,052.
8,021.
5,07’7 15,251.
18,968.4,155
2,497 12,625.
t
44,841 156,945.
50,187
25,886
680
256,651
286,627.
159,056.
5,540.
974,420.
NOTE: Acreage is estimated. Yield and valueare actual
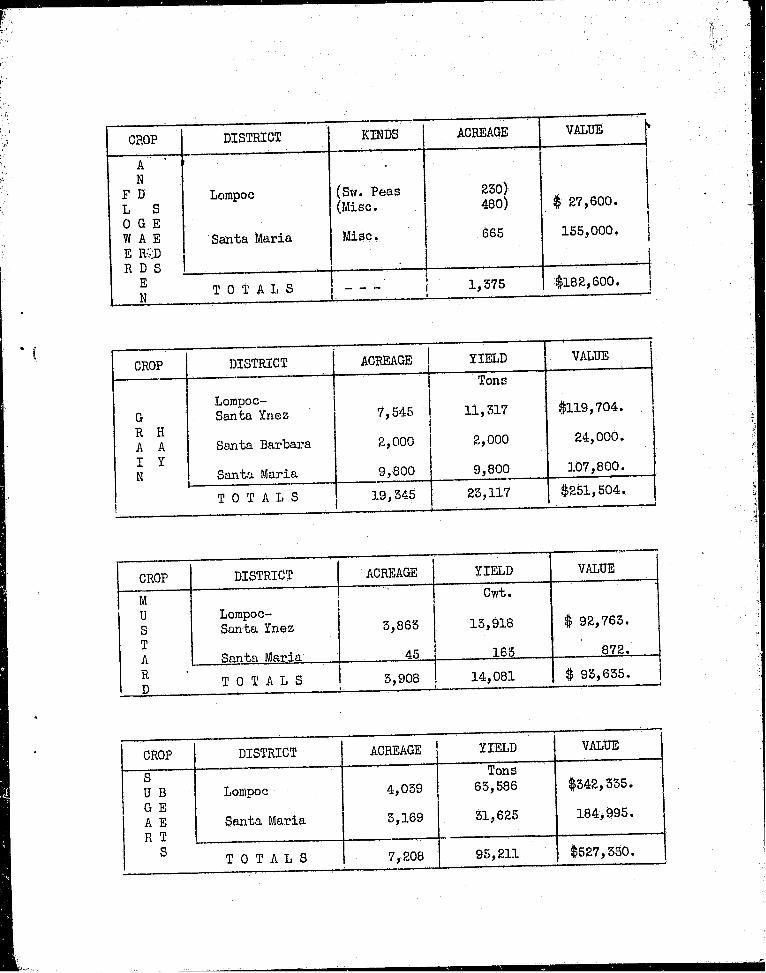
VALUECROP DISTRICT KINDS ACREAGE
AN
FD Lompoc (Sw. Peas 2 o)L S (Misc. 48o) $ 27,600.
0GEWAE Santa Maria Misc. 665 155,000.
E R:::D
E T 0 T A L S _ _ _ 1,575 $182,600.N
CROP
GR HA AI YN
DISTRICT ACREAGE YIELD VALUE
TonsI
Lompoc-Santa Ynez 7,545 I 11,517 $119,704.
Santa Barbara 2,000 2,000 24,000.
Santa Maria 9,800 9,800 107,800.
T 0 T A L S 19,545 25,117 $251,504.
VALUECROP DISTRICT ACREAGE YIELD
M Cwt.
U Lompoc- $ 92,765.S Santa Ynez 5,865 15,918
T 872.A Santa Maria 45 165
R TOTALS 5,908 14,081 $ 95,655.
i VALUECROP DISTRICT ACREAGE , YIELD
IS
Tons
UB Lompoc 4,059 65,586 $542,555.
GEAE S~ta Maria 5,169 51,625 184,995.
RTS TOTALS 7,208 t 95,211 $527,550.
i

CROP DISTRICTI ACREAGEi
YIELD I VALUE
B Lompoc- Cv~a.
A Santa Ynez 2,286 18,298 $18,298.
RL Santa Barbara I 20 2OO 290.
E Iy Smlta Maria 6,254 57,528 57,528
TOTALS 8,560 56,026 $56,116.
VALUE
!
DISTRICT ACREAGE YIELD I VALUE
Cwt.
Lompoc-Sm~ta Ynez 1,000 lO,O00 $15,500.
Santa Maria I 691 4,895 6,116.
YIELDACREAGEDISTRICTCROPCwt.5,559
800
5,580
0ATS
$ 4,805~
1,520.
6,855.
464
80
1,121
Lompoc-Ss~ita Ynez
Santa Barbara
Santa Maria
T 0 T A L S 1,665 $ 12,958.9,759
CROP
WHEAT
T 0 T A L S 1,691 14,895 $19,616.
CROP
ALFALFA
DISTRICT
Lompoc-Santa Ynez
Sm~ta Maria
TOTALS
ACREAGE , YIELD
2,171
5,700
: 7,871
Tons
i10,855
l 26,700
l57,555
VALUE
$105,122.
259,600.
$542,722.
mi
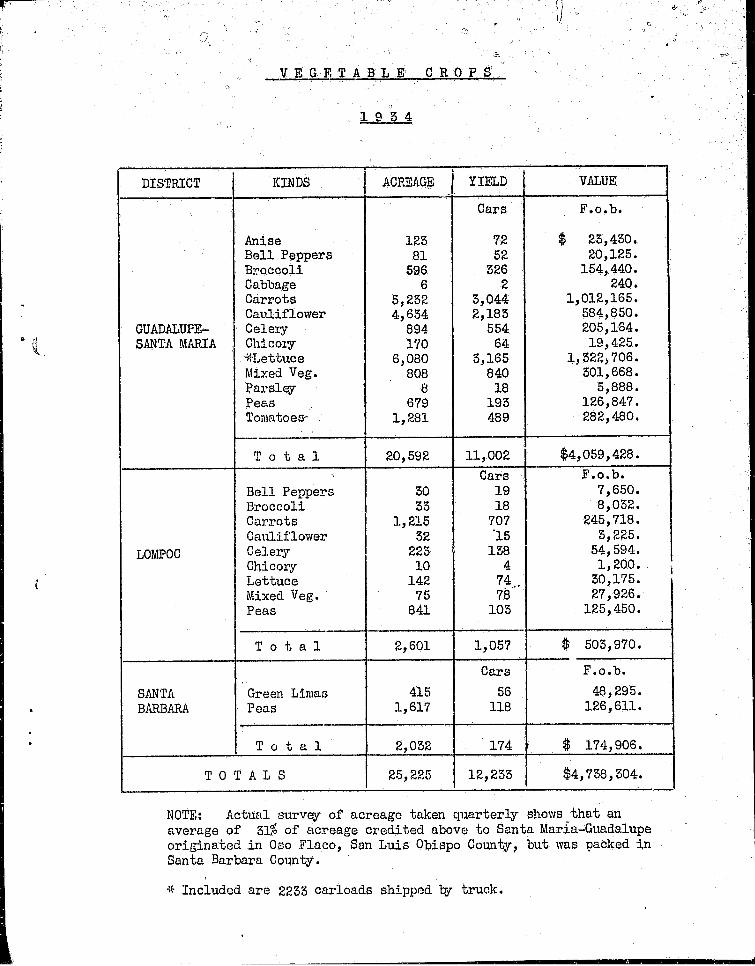
VEGETABLE CROPS
:sr
1.954
i
DISTRICTi
KINDS ACREAGE I YIELD VALUE
Cars F.o.b.
Anise 125 72 $ 25,450.Bell Peppers 81 52 20,125.Broccoli 596 526 154,440.Cabbage 6 2 240.Carrots 5,252 5,044 1,012,165.CatLliflower 4,634 2,185 584,850.
GUADALUPE- Celery 894 554 205,164.SANTA MARIA Chicozy 170 64 19,425.
*Lettuce 6,080 5,165 1,322,706.Mixed Veg. 8O8 84O 501,668.
~ Parsley 8 18 5,888.Peas 126,847.Tomatoes-~
679 195I, 281 489 282,480.
Total 20,592 11,002 $4,059,428.4 Cars F.o.b.
Bell Peppers 50 19 7,650.Broccoli 55 18 8,052.Carrots 1,215 7O7 245,718.Ca1~iflower 52 ’15 5,225.
LOMPOC Celery 225 158 54,594.Chicory i0 4 1,200.Lettuce 142 74. 30,175.Mixed Veg. 75 78 27,926.Peas 841 105 125,450.
Total 2,601 1,057 $ 505,970.ii
Cars F.o.b.
SANTA Green Limas 415 56 48,295.BARBARA Peas 1,617 118 126,611.
Total 2,052 174 $ 174,906.
TOTALS 25,225 12,255 $4,758,504.
NOTE: Actual survey of acreage t~cen ~mrter~v shows that anaverage of 5L~ of acreage credited above to Santa Maria-Guadalupeoriginated in Oso Flaco, San Luis Obispo County, but was oacked inSanta Barbara Cmmty.
* Included are 2255 carloads shipped by truck.
|

ORCHARD CROPS
19 84
DISTRICTI
KINDS I ACREAGE
iYIELD i VALUE
tons f.o.b.
Santa !
Barbara Walnuts 5265 1612 $ 445,472.
c rs
1,988 i05~ $1,374,028.
Barbara
i
LemonsSanta
Oranges 582 78 50,868.
I Grapefruit I0 5 1,558.
T o t a ]. Citrus 2,580 1156 $1,426,234.
L:b8
SantaBarbara Avocados ?0 105,280 8,882.
T 0 T A L S(All Orchard Crops) 5,715 --- $1,880,888.
BULBS
CROP
Bulbs
I ACRES VALUE
I 45 $9,500.
¯ ,, ....... II F I

/o
(~IANNINI FOUNDATION gl~;AGRICULTURAL ErCONIDMI~
LIBRARY
AGRICULTURAL CROP
of
REPORT
_ i
SANTA BARBARA COUNTY
Compiled l~j
Eugene S, Kellogg
Colmty Agricultural Commissioner
I
I
January l, 1956
i
A~P~CUL~PA~ ,C, ROP ~o_R~T.
Santa Barbara . County, Cg.lifornia
Many requests are received at the County AgriculturalCommissioner’ s office for figures dealing with the agricultural output ofSanta Bar~ara County, These requests come from govelmment agencies,Chambers of Commerce, transportation companies, banking institutions,farmers T cooperative organizations, marketing agencies and investigatorsfrom various institutions throughout the country. The figures found inthis report have been secured from various agencies, including the severallarge warehouses of the co~ty, the railroads and other common carriers,the various agricultural cooperative marketing associations, the Universityof California Extension Service, the Foderal Agricultural Census, variousfarmers’ organizations, packers, shippers s~d many individuals in closetouch with the movement of agricultural commodities.
It is somewhat difficult to arrive at the production figureson many commodities, such as grain and alfalfa hay, since a large tonnageremains on farms, but much .of this appears i~ the form of animal industryproducts shipped later.
While this is a commodity production report, there is avery strong demand for valuation figures. Those shown here are on an f.o.b.basis, not what the farmer received. The figures given represent prodnctssold, and in the case af animal industry should not be t2ken to mean acensus of animals in the county.
The acreage of the county has been divided very roughly intothree main districts: the Santa l~aria, including Guadalup~, Casmalia,Orcutt, Los Alamos ~Id Sisqmoc; the Lompoc, including all of the SantaYnez and Lompoc Valleys ~md the coast north of Gaviota~ the S~ta Barbara,including Carpinteria~ Montecito, Goleta and the .coast east of Gaviota.Allocation of production figures to each district in the case of AnimalIndustry is estimated. Acreage figures for field crops and vegetables arealso estimated.
@I
County Agricultural Commfssi~oner

AGRICULTURAL CROP REPORT_ .
1955~
Santa Barbara County, California
I
Total Number Farms ¯ ¯ .....Total Value Agricultural Products .......Total Acreage .....
~ ¯ " ~ ~ ~ ............Total Acreage U[S.Forest eserv r a .........Total Acreage Agricultural Area ........ ’ ....
Estimated Total Population 0utside " " " " " "Estimated Total Population "" incorporated’Cities "
Estimated Value Petroleum Products .............Estimated Value Other Mineral Products ..........Assessed Valuation ~on-operative Property (real estate and
improvements) ...... " .....
Total Assessed Val atian (includin ’operati ep operty)
......... 1,408 /.... $14,677,179.1,683,200 ;I"
754,380 w
775,191~67,50022,200 ~--~
$5,750,000.500,000
$78,155,850.$].55,547,622.
Due to its geographic position Santa Barbara County representsa variety of climatic and soil typos. From Point Concepcion, the great
continental headland, the coast line runs north in one instance and eastin the other, exposing approximately lO0 miles of coast line.
Two main streams traverse the County from east to west: theSanta Maria River on the county’s north boundary, and the Santa Ynez Riverto the south of the Santa Maria. These streams have laid down largedeltas where vegetable growing and other int~sive crops are gro~vn.
On the south is a long, narrow coastal plain with a southernexposure where orchard crops and general farms are found. Citrus and semi-tropic fruits are groom in this area.
The islands off the coast are devoted to the produc%ion of live-
stock.
Approximately one-half the area of the county is made up of
United States Forest lands.s
a r
m
Ct. Co nc e f,c ,o~
/
//
OUTLINE M~IP OF S~NTA BARBA~N: COUNTYSHADED AREA SHOWING SANTA BARBA_RA
NATIONAL FOREST

o
o
,-Q
co

LOS ALId~0S - GUADALUPE - SANTA I~dIIA DISTRICT
1955
CROP i ACREAGEi
YIELD VALUE
Imimal Industry* ] 244,000 $I, 9x ~, 670.
{Field Crops I, 71,102 i, 698,710.
! Cars
Vegetables ~ 21,459 9,556 4,005,586.1
T 0 T A L S 536,541 --- $7,615,766.
CARPINTERIA-GOLETA--S~-~TA BA[~IG~A DISTRICT
CROP
imimal Industr~
Avocados
Citrus
Field Crops
Vegetables
Walnuts
TOTALS
ACREAGE
61,000
2OO
5,585
10,320
2,755I
5,260
80,898
YIELD
Tons157Cars
1,915
Cars5O5Tons
1,824
$ 582,755.
14,160.
1,857,184.
541,559.
527,040.
457,029.
$5,559,485.
SANTAYREZ - LO~0C DISTRICT
!
CROP ACREAGE YIELD W~UE
Animal Industry* 505,000 i $1,550,954. iii
Field Crops 49,940 1,591,884. iCars
Vegetables 5,959 1,425 579,110.
T 0 T A L S 558,879 --- $5,501,928.
* Estimated
r-I 0 #’- O,Zr~
~t 60 ~. 02~o rH ~"
m,
o
0 0 ~ 0 I.~ 0 0 ot~D 0 0 O~ ~t r-’l 0 0
O~
O3 "~ ~ ~- r-I O~ 0
~ ~4 o~ ~; ~ ~ ~ Oo Oo~. ~
~0 0 r-I
~6"4 r’4 u’~ u’~
tc~ ~o~ ~ ~- ~- oO~
OO ~0
CO ’~ 0 0 0 °04-~ C~
LO 8 1r-t. I
r-’l t.O L’O ,.~ C--
0"~ 0 0 0 t~ (.D I.O 0~
I ItO LO 0 0 LO 0 0 ce4 ..~ I I
I
0~ OD t~ 0 0 O-P 0
N~ 0 ~,0 0 0 0 .Q ~ 0 0~0 ’~ 0 0 0 ~O~M ~,. 0
~I I
¯ ,0 ., * CO I !
u~ i...]
o ~ ;~ ~ otJE-~
°~
0
0
0
t~.M
1"4
r~0
g
%
m ,¢..t

1.0
,z.’O9
O~ r-’lt’-- tO ~f3
L~" ~ ~--# 0 0
CO l.r~ ~3 ~ L~ O~ CO0
0 ~ ~x~ O~ 0 r-I" 0 L~ I
D~. LO b-CO0 ~t<~ 0
I0 o~ t, ~ 0+) L~ .~ ..,~ r’~
i..~;
,"dtO 0
I ? ~ ~ o + + ,! . o
-III
’ItO O~ I~,°
me:0 t ~o ®I~,~,ir-I ~"t mO ’~1
L’,".’+ O~ CT3 +l:t3 + +,. ,~’~I+ u3 "~ r.-I ~.
I
M 7
ior~I
Itc,
.,+4 r--i,~,t "o
~I +

I-I
c~
oir~
i-4
~ ~~0~ o~
~~ 0
rg c~ ~o o2 b~ to cu!
I
FI.c~j
!
~ ~ ~omom~m~m.~,~"
N,-I
r-t
t~
~.~ ¢x~ r--I ’,~’ ~ r-I CO C~. O0 0"~ r,.O O0 CO ~-0 0";~ "~-o 1,q b-b.,:’~ LO O) CYJlO bOIJ-J r~r--lr-~ l~) ~0 I
Ir-I I
b ~o
.... I
.... l~
Igr~.rl
~ °~’ --~
o

r.D
0
0
!
. k¯ ! I

TOT~ff. ACREAGE~ YIELD AND Vi,LUE
of each Variety of Beans
Pinks
SmallWhites
BabyLimas
CommonLimas
SeedBeans
~lisc.
TOTALS
1954 ].955
4,522 9,195
15,546 12,775
9,224 6~977
6,275 5,260
5,596 5,060
790 4,599
59,551
YIELD
1954 I1955 i
Cwt.
20,216
79,395
56,101
50,187
25,886
4,848
66,499
50,597
52,580
29,809
28,151
VALUE
1954
80,000.
249,526.
195,227.
~:.8o, 6,~7.
1955
177,251.
202,821.
188,988.
289,248.
224,091
iii,081.
41,862 256,651 284,614 ~974,420. $i,195,480.
NOTE: Acreage is estimated. Yield add value are acthal.
CROP
Onions
Potatoes
DISTRICT
Lompoc
Santa Maria
ACREAGE
245
1,659
YIELD
Cwt.
50,451
559,679.
VI~UE
,}

FIELD CROPS
.B E £N S
1955
CROP
B
E
A
N
S
r !
DISTRICT t I VALUE
C~.
Los l~amos- Baby 1,807 9,055 $ 55,881.Santa Maria, Limas
Small 11,650 58,156 177,575.Whites
Pinks 7,580 45,476 140,975.
JMisc. 5,712 ! £0~187 78,691.
Lompoc- Small 1,145 25,446.Santa Ynez V~ites
Pinks 1,6].5 11,702 56,276,
Misc. 887 7,964 52,590.
BabyLim£’~ 5,170 41,562 155,107.
Santa Barbara Common 5,260" 52,580 289,248.Limas
SeedBeans 5,060 29,809 224t091.
T 0 T A L S 41,862 284,614 $1,195,480.
NOTE: Acreage is estimated. Yield and valueare actual.
¯ , ! d
CROP.
AN
FDL SOGEWAEERDRDS
E
DISTRICT KINDS ACREAGE Vt, I",UE
(Sw.Peas ~5o) Lompoc (Nasturtium& ) $ 75,000.
(Mixed 71o)
Santa Maria same as 82O 170,000.
above
T 0 T A L S. _ _ _ 1,780 $245,000.
CROP
I
DISTRICT
i Lompoc-G Santa YnezR HA A i Santa BarbaraI YN
~ , Santa Maria ,
I TOTALS
ACREAGE i YIELD
I Tonsi
9,500 i 18,424
2,000 1 2,800I
16,O00 ~ 20,000
27,500 I 41,224
VALUE
$147,816.
28,000.
200,000.
$375,816.
YIELD 1 VALUECROP DISTRICT ACREAGE
J c~t.M $506,875.U Lompoc- 6,115 61,124
S S~ita YnezT 27,906.A Santa Maria 56O 5,599
R iD TOTALS 6,673 ! 66,725 $554,781.
YIELD I VALUE __h
DISTRICTCROP ACREAGE
Ton s59,510
54,823
SUBGEAERT
S
$217,152.
i92,119.
5,520
5,629
Lompoc 1
Santa Maria
’ t i 74,155 I$409, .71.T 0 T A L S I 6,949 ; , , _

l
CROP I DISTRICT
!
B i Lompoc-A I Santa Ynez
L ! Santa Mariai
E l
Y TOTALS
ACREAGE
9,740
11,400
21,140
YIFLD
Cwt.
146,108
156,856
282,964
VALUE
$124,192.
i16,527.
$240,519.
L° 1ATs I
DISTRICT
Lompoc-Santa Ynez
Santa Maria
TOTALS
ACREAGE
10,525
YIELD
Cwt.
107,220
VALUE
$ 51,852.
52,172.
$104,004.
I VI~UECROP DISTRICT ACRK~GE YIELD
Cwt.
W Lompoc- $ 65,406.H Santa Ynez 5,488 52,525
E 26,251.A Santa Maria 1,825 20,985
T
T 0 T A L S 5,515 ~ 75,510 $ 91,657.
VALUECROP DISTRICT ACREAGE YIELD
A Tons
L Lompoc-$108,900.
F Santa Ynez 2,420 12,100
A 206,800.L Santa Maria 5,500 25,850
FA TOTALS 7,920 t 57,950 $515,700.

VEGETABLE C R.O P S
Dec.l,1954- Dec. l, 1955
DISTRICT
GUADALUPE-SANTA MARIA
SANTABARBARA
KINDS
AniseBell PeppersBroccoliCabbage
f CarrotsCauliflowerCeleryChicory
*LettuceMixed Veg.ParsleyPeasTomatoes
,
Totals,,
IlI11 Carrots
CeleryChicor~j
*Lettuce
Cars84 i47
501,8].42,410
45799
2,2861,275
52156
150151557106
3,6644,512
725184
5,95].2,000
501,997
$
1,792 [ 555 ’
1,90515277
1,182625
VALUE
f.o.b.32,455.51,575.
196,090.15,120.
724,272.813,725.247,050.
45,950.857,589.507,645.
12,771.145,824.375,740.
~Mixed and
T o t a 1 s 3,959
Green Limas 552
Peas , 2,401
, T o t a 1 s 2,755 305
...... ÷T 0 T A L S
.~ i1,284 I
I 279,492. ,68242 i 26,460.
25 15,875.
570 : 215,722.104 I 45,561.
1,425 : $ 579,110.
Cars I f.o.b.
54 ~ 57,910.
251 269,150.
$ 527,040.
$ 4,909,556.
NOTE: Actual survey of acreage taken quarterly shows that ~ averageof 55% of acreage credited above to Santa Maria-Guada].upeoriginated in Oso F].aco, San Luis Obispo Co~Ity, but was packed
in Santa Barbara County.
*Included are 2210 carloads shipped by truck from Santa Maria and Lompoc.
I

ORCHARD CROPS
1955
t BEARINGDISTRICT KINDS
I ACREAGEYIELD W~LUE
Tons f.o.b.
SantaBarbara Wa[hluts 5,200 1,824 $ 457,029.
Cars
Lemons 5,065 1,855 $1,804:, 520.SantaBarbara Oranges 52O 58 52,664.
Total Citmls .5,585 1,915 $1,857,184.
TonsSantaBarbara Avocados 2OO 157 $ 14,160.
T 0 T A L S 6,845(All Orchard Crops) !’, --- I $2,508,575.

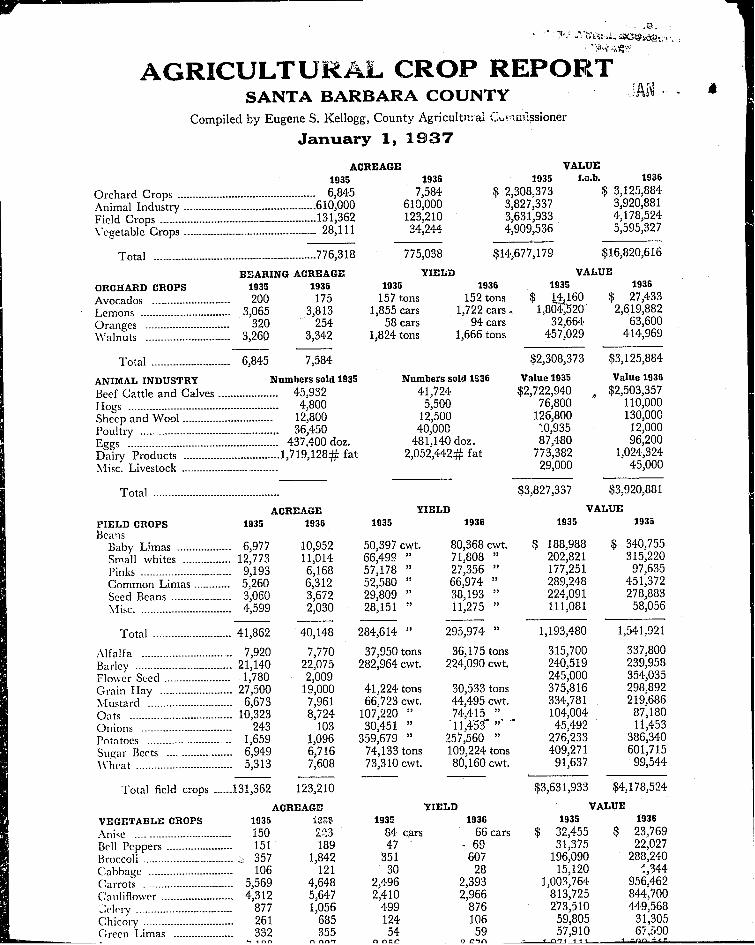
AGRICULTURAL CROPSANTA BARBARA COUNTY
Compiled by Eugene S. Kellogg, County Agricultm’at C~.,.~,m!ssioner
January 1, 1937
REPORT
!
J
ACREAGE!935
Orchard Crops .............................................. 6,845Animal Industry ...................................................Field Crops .................................................... 131,362Vegetable Crops ............................................ 28,111
Total ......................................................776,318
B~ARING ACREAGEORCHARD CROPS 1935 1936Avocados .......................... 200 175Lemons .............................. 3,065 3,813Oranges ............................ 320 254Walnuts ............................ 3,260 3,342
Total .......................... 6,845 7,584
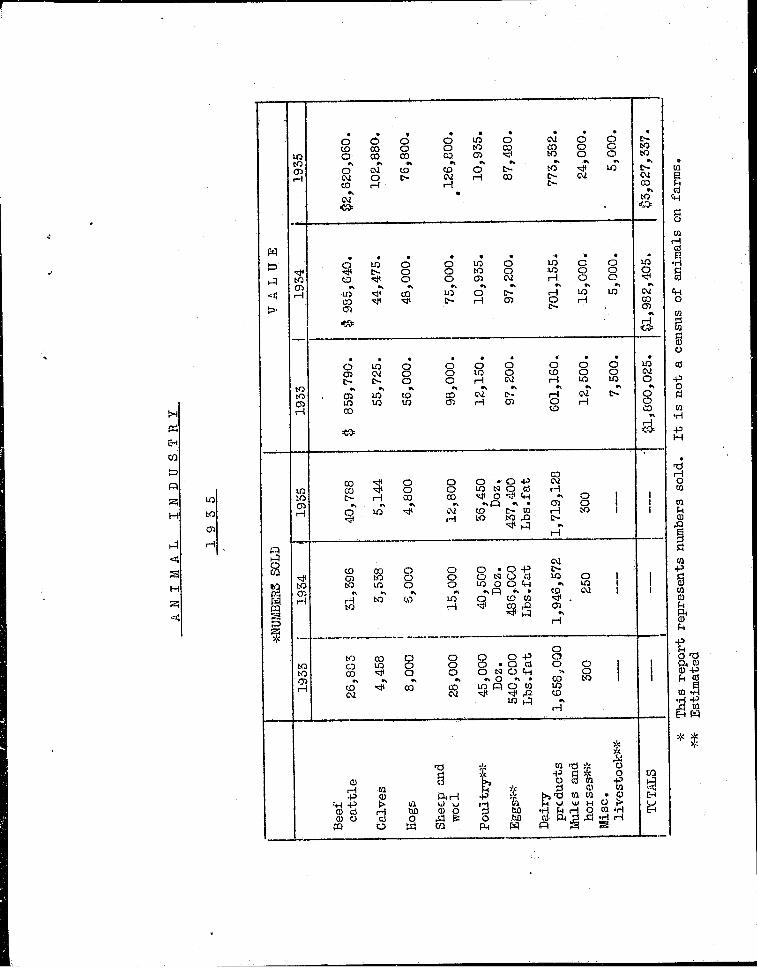
ANIMAL INDUSTRY Numbers sold 1935Beef Cattle and Calves .................... 45,932Hogs .................................................. 4,800Sheep and Wool .............................. 12,800Poultry .............................................. 36,450Eggs .................................................. 437,400 doz.Dairy Products ................................ 1,719,128:~ fatMisc. Livestock ................................
1935157 tons
1,855 cars58 cars
1,824 tons
19367,584
610,000123,21084,244
775,038
YIELD1936
152 tons1,722 cars
94 cars1,666 tons
1935$ 2,308,373
3,827,3373,631,9334,909,536
$14,677,179
1935$ ~16o
1,804,520’32,664
457,029
VALUEf.o.b. 1936
$ 3,125,8843,920,8814,178,5245,595,327
$16,820,616
VALUE1936
$ 27,4332,619,882
63,600414,969
$2,308,373 $3,125,884
Numbers sold 1~36 Value 1935 Value 193641,724 $2,722,940 ~ $2,503,3575,500 76,800 110,000
12,500 126,800 130,00040,000 ~.(1,935 12,300
481,140 doz. 87,480 96,2002,052,442:~ fat 773,382 1,024,324
29,000 45,000
Total ..........................................
ACREAGEFIELD CROPS 1935 1936Beans
Baby Limas .................. 6,977 10,952Small whites ................ 12,773 11,014Pinks .............................. 9,193 6,168Common Limas ............ 5,260 6,312Seed Beans .................... 3,060 3,672Misc ............................... 4,599 2,030
Total .......................... 41,862 40,148
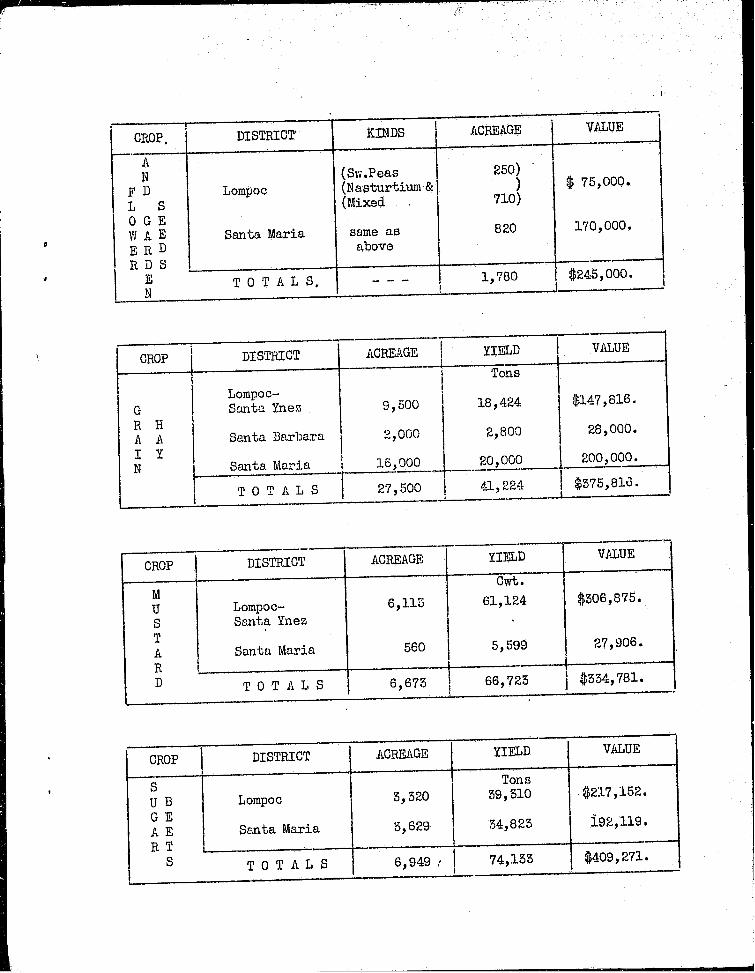
Alfalfa .............................. 7,920 7,770Barley ................................ 21,140 22,075Flox~ er Seed ...................... 1,780 2,009Grain Hay ........................ 27,500 19,000Mustard ............................ 6,673 7,961Oats .................................. 10,323 8,724Onions .............................. 243 103Potatoes ............................ 1,659 1,096Sugar Beets ...................... 6,949 6,716Wheat ................................ 5,313 7,608
Total field crops ...... t31,362 123,210
ACREAGEVEGETABLE CROPS 1935 i,g~$Anise ............................... i50 29.3Bell Peppers ...................... 151 189Broccoli .............................. z 357 1,842Cabbage ............................ 106 121Carrots .............................. 5,569 4,648Cauliflower ........................ 4,312 5,647:’.elrry ................................ 877 1,056Chicorv .............................. 261 685Green ’Limas .................... 332 355
YIELD1935
50,397 cwt.66,499 "57,178 "52,58O "29,809 "28,151 "
284,614 "
37,950 tons282,964 ewt.
41,224 tons66,723 cwt.
107,220 "30,451 "
359,679 "74,133 tons73,310 cwt.
1936
80,368 cwt.71,808 "27,356 "66,974 "38,193 "11,275 "
295,974 "
36,175 tons224,090 cwt.
30,533 tons44,495 cwt.74,415 ""1 i,453~ "
257,560 "109,224 tons80,160 cwt.
YIELD193~
84 cm’s4735130
2,4962,410
49912454
$3,827,337 $3,920,881
VALUE1935 193~
$ 188,988 $ 340,755202,821 315,220177,251 97,fi35289,248 451,372224,091 278,883111,081 58,056
1,193,480 1,541,921
315,700 337,800240,519 239,958245,000 354,035375,816 298,892334,781 219,686104,004 87,18045,492 11,453
276,233 386,340409,271 601,71591,637 99,544
$3,631,933 $4,178,524
VALUE1936 1935 1936
66 cars $ 32,455 $ 23,76969 31,375 22,027607 196,090 288,24028 15,120 ~.,344
2,393 1,003,764 956,4622,966 813,725 844,700
876 273,510 449,568106 59,805 31,30559 57,910 67.590

.’alnuts ............................ 3,260 3,342
Total .......................... 6,845 7,584
.~NIMAL INDUSTRY Numbers sold 1935
Beef Cattle and Calves .................... 45,932
Hogs .................................................. 4,800
Sheep and Wool .............................. 12,80036,450Poultry ..............................................
437,400 doz.Eggs ..i~ro.£t.ucts-.~--::.~-::’~-’.:-l,Y19,128q~: fatDairyMisc. Livestock ................................
Total ..........................................ACREAGE
FIELD CROPS 1935 193GBeans
Baby Limas .................. 6,977 10,952Small whites ............... 12,773 11,014
Pinks .............................. 9,193 6,168
Common Limas ............ 5,260 6,312Seed Beans .................... 3,060 3,672
Misc ............................... 4,599 2,030
Total .......................... 41,862 40,148
Alfalfa .............................. 7,920 7,770
Barley ................................ 21,140 22,075Flower Seed ...................... 1,780 2,009
Grain Hay ........................ 27,500 19,000
Mustard ............................ 6,673 7,961
Oats .................................. 10,323 8,724
Onions .............................. 243 103
Potatoes ............................ 1,659 1,096
Sugar Beets ...................... 6,949 6,716
Wheat ................................ 5,313 7,608
Total field crops ...... 131,362 123,210
1,824 tons 1,666 tons
Numbers sold 193641,7245,500
12,50040,000
481,140 doz.2,052,442:~ fat
YIELD1935
50,397 cwt.66,499 "57,178 "52,580 "29,809 "28,151 "
284,614 "
37,950 tons282,964 cwt.
41,224 tons66,723 cwt.
107,220 "30,451 "
359,579 "74,133 tons73,310 cwt.
1936
80,368 cwt.71,808 "27,356 "66,974 "38,193 "11,275 "
295,974 "
36,175 tons224,090 cwt.
3(1,533 tons44,495 cwt.74,415 "11,453 "
257,560 "109,224 tons80,160 cwt.
,664457,029
$2,308,373
Value 1935$2,722,940
76,800126,80010,93587,480
773,38229,000
$3,827,337
ACREAGE YIELD
VEGETABLE CROPS 1935 1936 1935 1936
Anise ................................ 150 223 84 cars 66 cars
Bell Peppers ...................... 151 189 47 69
Broccoli .............................. 357 1,842 351 607
Cabbage ............................ 106 121 30 28
Carrots .............................. 5,569 4,648 2,496 2,393
Cauliflower ........................ 4,312 5,647 2,410 2,966
¯ Belery ................................ 877 1,056 499 876
Chicory .............................. 261 685 124 106
Green Limas .................... 332 355 54 59
Lettuce .............................. 7,133 9,287 2,856 3,670
Mixed & Misc. Veg ......... 2,673 879 1,411 1,647
Peas .................................... 4,398 5,256 387 166
Tomatoes .......................... 1,792 4,056 535 1,335
63,600414,969
$3,125,884
Value 1936$2,503,357
110,000130,00012,00096,200
1,024,32445,000
$3,920,881
VALUE1935 1935
$ 188,988 $ 340,755202,821 315,220177,251 97,635289,248 451,372224,091 278,883111,081 58,056
1,193,480 1,541,921
315,700 337,800240,519 239,958245,000 354,035375,816 298,892334,781 219,686104,004 87,18045,492 11,453
276,233 386,340409,271 601,71591,637 99,544
$3,631,933 $4,178,524
VALUE1935
$ 32,455 $31,375
196,09015,120
1,003,764813,725273,51059,80557,910
1,071,111565,977414,954373,740
193623,76922,027
288,2404,344
956,462844,700449,568
31,30567,500
1,589,745540,426183,94l593,300
Total .......................... 28,111 34,244 11,284 13,988 $4,909,536 $5,595,327
NOTE: Survey of acreage planted indicates that 6555 acres of vegetables packed in the Santa Maria-Guadalul. ~ District were grown in Oso Flaco, San Luis Obispo County.
NOTE: Values of all crops shown are f.o.b, basis; not what the farmer received.1,551
Total Number Farms ................................................................................... :::::::::::::::::::::::::::::::::::::::::::::::::::Total Value Agricultural Products ................................................................. 1,683,200Total Acreage .................................................................. 754,380.Total Acreage U. S. Forest Reserve Area ......................................................................................... 932,915Total Acreage Agricultural Area ........................................................................................................ 72,884Estimated Total Population ............................................................................................................... 23,084Estimated Total Population Outside Incorporated Cities ................................................................ 5,750,000Estimated Value Petroleum Products ................................................................................................ 500,000Estimated Value Other Mineral Products ..........................................................................................Assessed Valuation Non-operatlve Property (real estate and improvements) ..............................
$89,428~838

tIIARRINI FOIdNDATI~N ~(~
:/- .i. " AGRICULTURAL CROP REPORT .JAw; SANTA BARBARA COUNTY
Compiled by Eugene S. Kellogg, County AgTicultural Commissioner
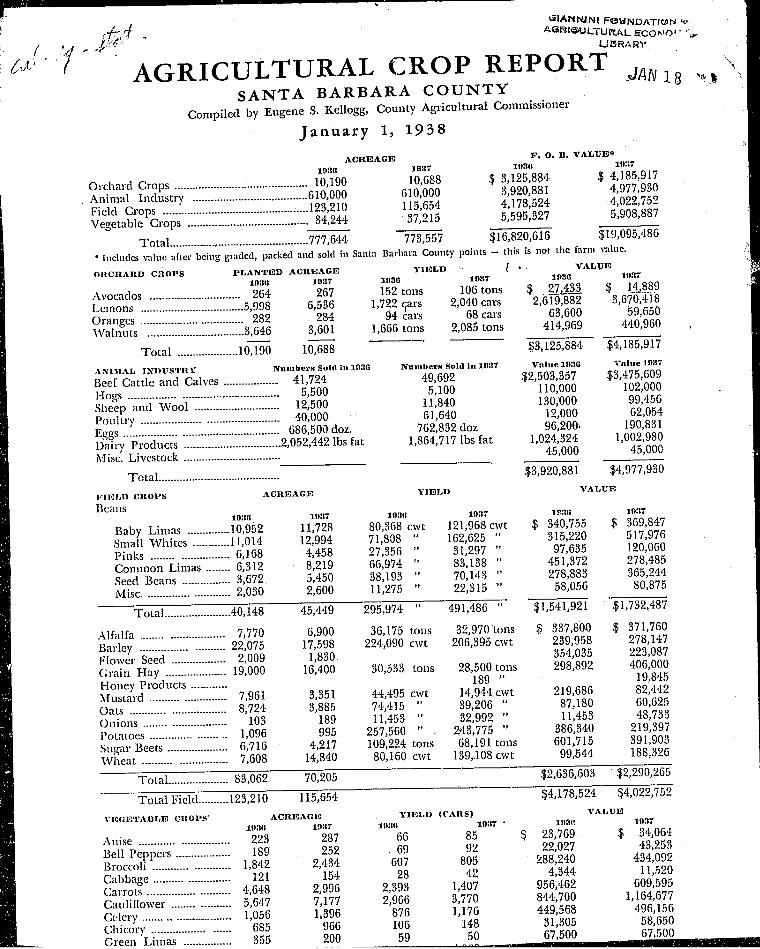
January 1, 1938
ACREAGE1936 1937
Orchard Crops ............................................ 10,190 10,688
Animal Industry ...................................... 610,000 610,000
Field Crops ................................................ 123,210 115,854
Vegetable Crops ....................................... : 34,244 37,215
F. 0. B. VALUE*1936 1|)37
$ 3,125,884 $ 4,185,9173,920,881 4,977.9304,178,524 4,022,7525,595,327 5,908,887
Total .............................................. 777,644 773,557* Includes value after being graded, packed and sold in Santa Barbara Cotmty points -- this is not the farm value.
$16,820,616 $19,095,486
0IICIIARD CROPS pLANTED A(]REAGE YIELD
1933 1937 1936
Avocados .............................. 264 267 152 tonsLemons .................................. 5,998 6,586 1,722 qarsOranges ................................ 282 284 94 cars
Walnuts ................................ 3,646 3,601 1,666 tons
Total .................... 10,190 10,688
VALUE193~ 1939 1937
106 tons $ , 27 4~33 $ !~,8_892,040 cars 2,619,882 3,670,418
68 ca~ 63,600 59,6502,085 tons 414,969 440,960
$3,125,884 "$4,185,917
Numbers Sold in 1937 Value 1936 Ynlue 1937
49,692 $2,503,357 $3,475,6095,100 110,000 I02,000
11,840 130,000 99,45661,640 12,000 62.054
762,832 doz 96,200~ 190,8311,864,717 tbsfat 1,024,324 1,002,980
45,000 45,000
~$3,920,881 $4,977,9B0
VALUE
A NI,~IAL INDUS’rR Y Numbers Sold tn 19’~6
Bee[ Cattle and Cah, es .................. 41,724Hogs ................................................ 5,500Sheep and Wool ............................ 12,500Poultry ............................................ 40,000Eggs .................................................. 686,500 doz.Dai~T Products ................................ 2,052,442 lbs fatMisc. Livestock ................................
Total ........................................
I," I E l,l) CROPS .ICREAG I;] yIELD
~1,541,921 ~$1,732387
$ 337,800 $ 371,760239,958 278,147354,035 223,087298,892 406,000
19,845219,686 82,44287,180 60,62511,453 48,733
386,340 219,397601,715 391,90399,544 188,326
Beans19116 11}37 19311 1937 11~39 19117
Baby Limas .............. 10,952 11,728 80,368 cwt 121;968cwt $ 340,755 $ 369,84-7
Small Whites ............ 11,014 12,994 71,808 " 162,625 " 315,220 517,976
Pinks ........................ 6,168 4,458 27,356 " 31,297 " 97,635 12(1,060
Comlnon Limas ........ 6,312 8,219 66,974 " 83,138 " 451,372 278,485
Seed Beans ................ 3,672 5,450 38,193 " 70,143 " 278,883 365,244
Misc ........................... 2,030 2,600 11,275 " 22,315 " 58,056 80,875
Total ...................... 40,148 45,449 295,974 " 491,486 "
6,900 36,175 tons 32,970 tons17,598 224,090 cwt 206,395 cwt1,830
16,400 30,533 tons 28,500 tons189 "
3,351 44,495 cwt 14,944 cwt3,885 74,415 " 39,206 "
189 11,453 " 32,992 "995 257,560 " 243,775 "
4.217 109,224 tons 68,191 tons14,840 80,160 cwt 139,.108 cwt
Alfalfa .......................... 7,770Barley .......................... 22,075Flower Seed .................. 2,009(;rain Hay .................... 19,000Honey Products ............Mustard ........................ 7,961Oats .............................. 8,724Onions .......................... 103Potatoes ....................... 1,096Sugar Beets .................... 6,716Wheat .......................... 7,608
Total .................... 83,062 70,205 ~2,636,603 $2,290,265
Total Field .......... 123,210 115,654 $4,178,524 $4,022,752
VE(IE’I~ABI~E cn0PS" ACREAGB YIELI) (CARS) VALUE
a93. 193r 19".~ a93r 193.~ 193z
Anise ............................ 223 287 66 85 $ 23,769 $ 34,064
Bell Peppers .................. 189 252 . 69 92 22,027 43,253
Broccoli ........................ 1,842 2,434 607 805 288,240 434,092
Cabbage ........................ 121 154 28 42 4,344 11,520
Carrots .......................... 4,648 2,996 2,393 1,407 956,462 609,595
Cauliflower .................. 5,647 7,177 2,966 3,770 844,700 1,164,677
Celery ........................... 1,056 1,396 876 1,176 449,568 496,156
Chicory . ....................... 685 966 106 148 31,305 58,650
Greeu’Limas ................ 355 200 , .,59. .~.~50 - 67,500 67,500
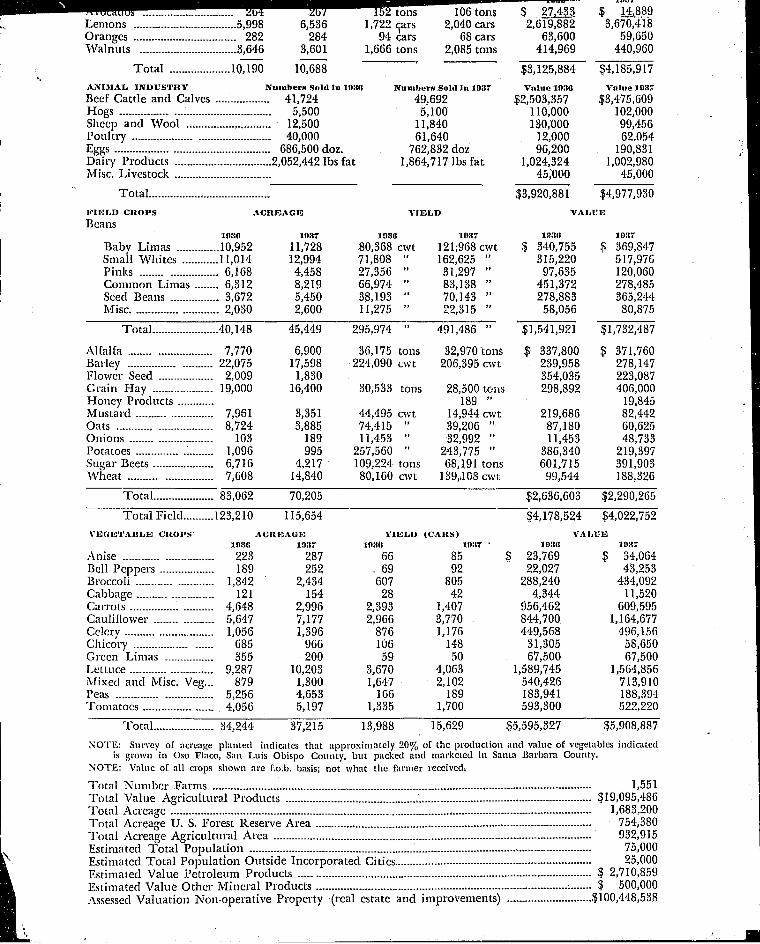
Lemons ...... " ..........................5,998 6,536Oranges .................................. 282 284Walnuts ................................ 3,646 3,601
Total .................... 10,19----0 10,688
ANIMAL INDUSTRY Numbern Sold in 1936
Bee[ Cattle and Calves ........ 41,724Hogs ................................................ 5~500Sheep and Wool ............................ 12,500Poultry ............................................ 40,000Eggs .................................................. 686,500 doz.Daily Products ................................ 2,052,442 lbs fatMisc. Livestock ................................
Total ........................................
I~" I l~J LD CROPS .a-CREAGE
1,72~~arscars
1,666 tons
2,040 cars68 cars
2,085 tons
Numbers Sold In 1937
49,6925,100
11,84061,640
762,832 doz1,864,717 lbs fat.
YIELD
Beaus1936 1937 1936
Baby Limas .............. 10,952 11,728 80,368 cwtSmall Whites ............ 11,014 12,994 71,808 "Pinks ........................ 6,168 4,458 27,356 "Common Limas ........ 6,312 8,219 66,974 "Seed Beans ................ 3,672 5,450 38,193 "Misc ........................... 2,030 2,600 11,275 "
:$ g7 4,_~332,619,882
63,600414,969
Total ...................... 40,148 45,449
Alfalfa .......................... 7,770 6,900Barley .......................... 22,075 17,598Flower Seed .................. 2,009 1,830Grain Hay .................... 19,000 16,400Honey Products ............Mustard ........................ 7,961 3,351Oats .............................. 8,724 3,885Onions .......................... 103 189Potatoes ........................ 1,096 995Sugar Beets .................... 6,716 4,217Wheat .......................... 7,608 14,840
~o.J,
:$ 1J~8895,670,418
59,650440,960
~3,125,884Value 1936
$2,503,357110,000130,’000
12,00096,200
1,024,32445i000
:$3,920,881’
~4,185,917
Value 1937
:$3,475,609102,00099,45662,054
190,8511,002,980
45,000
~4,977,930
VALUE
1937 1936 19:17
121;968 cwt ~ 340,755 $ 369,847162,625 " 315,220 517,97631,297 " 97,635 120,06083,138 " 451,372 278,48570,143 " 278,883 365,24422,315 " 58,056 80,875
295,974 " 491,486 " $1,541,921 :$1,732,487
36,175 tons 32,970tons :$ 337,800 ~ 371,76022%090 cwt 206,595 cwt 239,958 278,147
354,035 223,08730,533 tons 28,500 teus 298,892 406,000
189 " 19,84544,495 cwt 14,944 cwt 219,686 82,44274,415 " 39,206 " 87,180 60,62511,453 " 32,992 " 11,453 48,733
257,560 " 243,775 " 386,340 219,397109,224 tons 68,191 tons 601,715 391,90380,160 cwt 139,108 cwt 99,544 188,326
Total .................... 83,062 70,205 :$2,636,603 $2,290,265
Total Field .......... 123,210 115,654 ~4,178,524 $%022,752VEGETABLE CROPS" ACREAGE Y1Ehl) (CAllS) V.ALUE
1936 1937 1936 19:17 " 19:1(I 1937Anise ............................ 223 287 66 85 $ 23,769 $ 34,064Bell Peppers .................. 189 252 . 69 92 22,027 43,253Broccoli ........................ 1,842 2,434 607 805 288,240 434,092Cabbage ........................ 121 154 28 42 4,344 11,520Carrots .......................... 4,648 2,996 2,393 1,407 956,462 609,595Cauliflower .................. 5,647 7,177 2,966 3,770 844,700 1,164,677Celery ............................ 1,056 1,396 876 1,176 449,568 496,156Chicory ........................ 685 966 106 148 31,305 58,650Green Limas ................ 355 200 59 50 67,500 67,500Lettuce .......................... 9,287 10,203 3,670 4,063 1,589,745 1,564,856Mixed and Misc. Veg... 879 1,300 1,647 2,102 540,426 713,910Peas .............................. 5,256 %653 166 189 183,941 188,394Tomatoes ...................... %056 5,197 1,335 1,700 593,300 522,220
Total .................... 34,244 37,215 13,988 15,629 $5,595,327 $5,908,887
NOTE: Survey oE acreage planted indicates that approximately 20% o[ the production and wfiue of vegetables indicatedis grown in Oso Ylaco, San Luis Obispo County, but packed and marketed in Santa Barbara County.
NOTE: Value o[ all crops shown are f.o.b, basis; not what the farmer received.
Total Number Farms ............................................................................................................................. 1,551Total Vah.le Agricultural Products ..................................................................................................... ~19,095,486Total Acreage ........................................................................................................................................... 1,683,200Total Acreage U. S, Forest Reserve Area ........................................................................................... 754,380Total Acreage Agricultural Area ......................................................................................................... 932,915Estimated Total Population ................................................................................................................. 75,000Estimated Total Population Outside Incorporated Cities ................................................................. 25,000Estimated Value Petroleum Products ................................................................................................ $ 2,710,859Estinlated Vahle Other Mineral Products ........................................................................................... $ 500,000/~ssessed Valuation Non-operative Property (real estate and improvements) ............................ $100,448,538

)

(CORRECTED, Destroy Previous Copy.
.AGRICULTURAL CROPSANT :BARBARA COUNTY
Compiled by Eu~ S. Kellogg, County Agricultural Commissioner
Jan:uary 1, 1939ACREAGE *F.0.B, VALUE
1937 193S 1937 193S
Orchard Crops ............................................. 10,681 11,069 $ 4,185,917 $ 2,670,120
Animal Industry ....................................... 610,000 610,000 4,977,930 5,427,489
Field Crops .................................................. 116,951 132,559 4,128,152 3,917,298
Vegetable Crops .......................................... 34,570 27,608 5,803,487 5,649,698
Total .............................................. :.772,202 "781,236 $19,095,486 $17,664,605
*Includcs value after being graded, packed and sold in Santa Barbara County points; this is not the farm value.
0ItGHJknD CROPS Planted P_erenge Yield Value
1937 193S 1937 t93S 1937 193S
Avocados ................................ 267 267 106 tons 120 tons $ 14,889 $ 18,505
Lemons .................................... 6,561 7,151 2,040 cars 2,157 cat;a 3,670,418 2,293,745
Orangcs .................................. 284 281 68 cars 77 cars 59,650 ~23,-11"~"
Walnuts .................................. 3,569 3,370 2,085 tons 1,234 tons 440,960 334,755
Total ....................... :10,681 11,069 $4,185,917 $2,670,120
ANI~IAI* I~’DUSTRY Numbers Sold 19:~7
Bee[ Cattle and Calves .................... 49,692Hogs .................................................. 5 100Sheep and Wool ............................ 11,840Poultry .............................................. 61,640Eggs .................................................. 762,832 dozDairy Products ................................ 1,864,717 lbs fatMisc. Livestock ................................
Total .....................................
Numbers Sold 1938 Value 1937 Value 193S
55,907 $3,475,609 $3,871,9774,900 102,000 70,560
24,029 99,456 112,358103,271 62,054 48,084524,598 doz. 190,831 135,458
2,431,4411bsfat 1,002.980 1,154,05245,000 35,000
$4,977,930 $5,427,489
F’IEI,D CIt0PS Acreage Yiehl
Beans 193r 193s 193r
Baby Limas .............. 11,728 11,125 121,968 cwt.Small Whites ..~. ...... 12,994 1~,689 162,525 "Pinks ...................... 4,458 5,537 31,297 "Common Limas ...... 8,219 5,83-ti 83,138 "Seed Beans ............ 5,450 2,111 70,143 "Misc ......................... 2,600 5,328 22,315 "
Total .................. 45,4"-----77t-943,626 491,486 "
Alfalfa ............................ 6,900 7,064 32,970 tonsBarley ............................ 17,598 18,549 206,395 cwt.Flower Seed .................. 1,830 2,199Grain Hay .................... 16,400 22,000 28,500 tonsHt,ney Products 189 "Mustard ........................ 3,351 3,221 14,944 cwt.O~ts ................................ 3,885 7,209 39,206 "Onions ............................ 189 246 32,992 "
Dried Peppe;s .............. 234Potatoes .......................... 995 1,593 243,775Sugar Bects .................. 4,217 7,408 68,191 tonsCanning Tomamcs ...... 1,297 255 14,000 "Wheat .......................... 14,840 18,955 139,108 cwt.
Total .................. 71,502 88,933
Total Field Crops ...... 116,951 132,559
"Vlllne
1938 1937 1938
94,998 cwt. $ 369,847 $ 240,67372,860 " 517,976 185,88933,757 " 120,060 118,78669,737 " 278,485 297,4742~735 " 365,244 145,54533,339 " 80,875 141,477
329,426 " $1,732,487 ~1,129,844
47,461 tons $ 371,760 $ 379,768288,271 cwt. 278,147 249,735
223,087 389,30028,933 tons 406,000 261,897
38 " 19,845 3,01527,115 cwt. 82,442 108,86378,457 " 60,625 88,36024,661 " 48,733 19,799
234 tons 45,630471,538 cwt. 219,397 433,421123,369 tons 391,903 618,127
2,805 " 105,400 25,245173,411 cwt. 188,326 164,294
$2,395,665 $2,787,454$4,128,152 $3,917,298
VEG E~PAIILE CROPS 19:W 1938 1937
Anise ............................. 287 174 85Bell Peppers .................. 252 107 92Broccoli ............................ 2,434 1,885 805Cabbage .......................... 154 118 42Carrots ............................ 2,996 1,745 1,407
Yield Value
1938 1937 1938
Cars
85 $ 34,064 $ 29,42326 43,253 10,3%
847 434,092 311,21544 11,520 15,285
1,105 609,595 453,775
Cat:liflower .................... 5,829 5,562 3,770 3,083 1,164,677 785,163
Celery . ........................... 1,396 1,910 1,176 1,394 496,156 471,361
Chlcor" 966 456 148 157 ;"- " -- - -~" --:- - -i
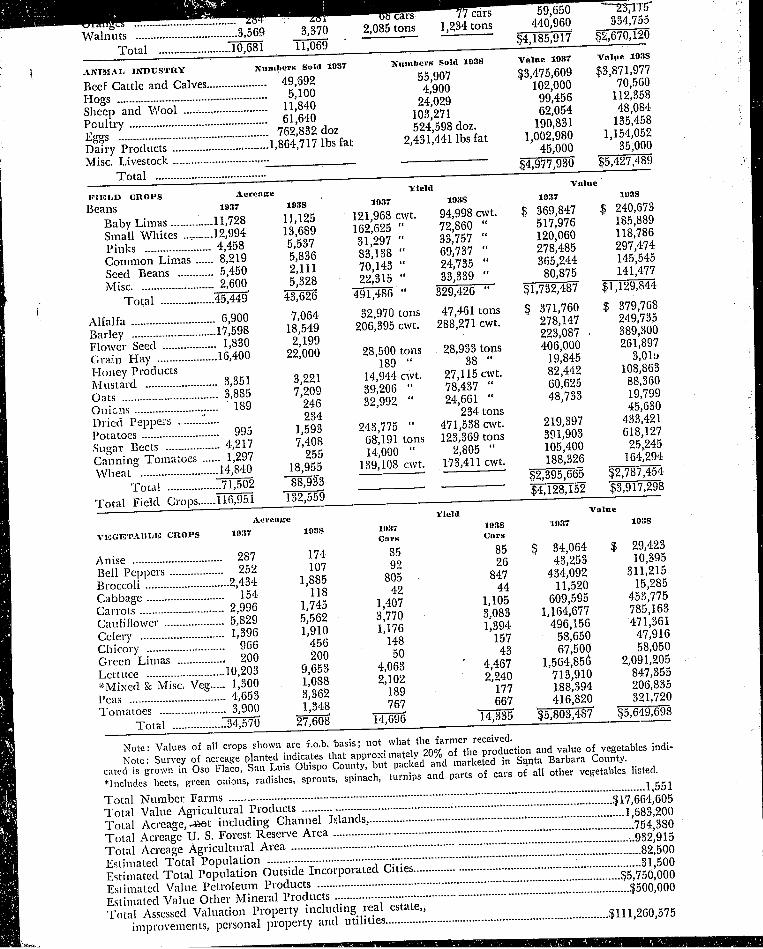
2,085 tonscRrs
1,234 tons
ANI.MAIJ ]NDUSqPRY
Beef Cattle and Calves .................... 49,6925.100Hogs ...................................................
Sheep and Wool ............................ 11,840
Poultry .............................................. 61,640
Eggs ......... 762,832Dairy "i~ro(it;c£"’IIIIII~III~III]~III[]~ ......... 1,864,717
Misc. Livestock ................................Total .....................................
Numbers Sold 1937
dOZ
lbs fat
2~’untbers Sold 1938 Value 1937 Vahle JI,3S
55,907 $3,475,609 $3,871,977
4,900 102,000 70,560
24,029 99,456 112,358
103,271 62,054 48,084
524,598 doz. 190,851 135,458
2,431,441 lbs fat 1,002,980 1,154,05245,000 35,000
5,427,489Value
1937 1938
369,847 $ 240,673517,976 185,889120,060 118,786278,485 297,474365,244 145,54580,875 141,477
~1,732,487
$ 371,760 $ 379,768278,147 249,735223,087 389,300406,000 261,89719,845 3,01~82,442 108,86360,625 88,36048,733 19,799
45,630219,397 433,421391,903 618,127105,400 25,245188,326 164,294
$2,395,665 ~~$4,128,152 ~8
Yieldi~IEIJD CROPS Acreage
BeallS 1937 1938 1937 1938
Baby Limas .............. 11,728 11,125 121,968 cwt. 94,998 cwt.
Small Whites .., ...... 12,994 13,689 162,625 " 72,860 "
Pinks ...................... 4,458 5,537 31,297 " 33,757 "
Common Limas ...... 8,219 5,836 83,138 " 69,737 "
Seed Beans ............ 5,450 2,111 70,143 " 24,735 "
Misc ......................... 2,600 5,328 22,315 " 33,339 "
Total ................... ~ ~ 491,486 " 329,426 "
Alfalfa ............................ 6,900 7,064 32,970 tons 47,461 tons
Barley ............................ 17,598 18,549 206,395 cwt. 288,271 cwt.
Flower Seed .................. 1,830 2,199
Grain Hay .................... 16,400 22,000 28,500 tons 28,933 tons
Honey Products189 " 38 "
Mustard ........................ 3,351 3,221 14,944 cwt. 27,115 cwt.
Oats ................................ 3,885 7,209 39,206 " 78,437 "
Onions ....................... : .... 189 246 32,992 " 24,661 "
234 234 tonsDried Peppers ................Potatoes .......................... 995 1,593 243,775 471,538 cwt.
Sugar Beets .................. 4,217 7,408 68,191 tons 123,369 tons
Canning Tomatoes ...... 1,297 255 14,000 " 2,805 "
Wheat ................ 14,840 18,955 139,108 cwt_ 173,41i cwt--
To tal .................. 71,502 "--g~, 9"33
Total Field Crops ...... 116,951VolueYield
akcreage 1938
VEG~qPAIILE CROPS 19:17 193S 1937 1938 1937
Ctllr~t Cars
Anise .............................. 287 174 85 85 $ 34,064 ~ 29,423
Bell Peppers .................. 252 107 92 26 43,253 10,395
Broccoli ............................ 2,434 1,885 805 847 434,092 311,215
Cabbage .......................... 154 118 42 44 11,520 15,285
Carrots ............................ 2,996 1,745 1,407 1,105 609,595 453,775
Cauliflower. ................... 5,829 5,562 3,770 3,083 1,164,677 785,163
Celery ............................ 1,396 1,910 1,176 1,394 496,156 471,361
Chicory .......................... 966 456 148 157 58,650 47,916
Green Limas ................ 200 200 50 43 67,500 58,050
Lettuce .......................... 10,203 9,653 4,063°
4,467 1,564,856 2,091,205
*Mixed ~ Misc. Veg ..... 1,300 1,088 2,102 2,240 713,910 847,355
Peas ................................ 4,653 3,362 189 177 188,394 206,835
Tomatoes ...................... 3,900 1,348 767 667 416,820 321,720
Total ................. ~ 27,60------8 ~ ~ $5,8o3,487"~5,649,698
Note: Values of all crops shown are f.o.b, basis; not what the farmer received.Note: Survey of acreage planted indicates that approxl mately 20% of the production and value of vegetables indi-
cated is grown in Oso Flaeo, San Luis Obispo County, but packed and marketed in Sa.nta Barbara County.*Includes beets, green onions, radishes, sprouts, spinach, turnips and parts of cars of all other vegetables listed.
N lmber Farms ......................................................... " ............................................................................... 1,551..... :..-:.: ..... ¥ ................................................................. : ................TotalTotal Acreage,.-wt mchtdlng Channel lstanus,. ................................................................................... ’
Total reage U. S, Forest Reserve Area ..................... - .............................................................................754’Bn80AC ¯ ¯ ¯ * ............................................. ZlO~,~xo
Total Acreage Agrleultutal Alea ................................................................. i ..............................................o. =.n
Estimated ~otal Populatmn .- ....... ;----;- ...................2-".2:": ............................... ~’;;;¯ ’ . a Po ~ulation Outskte mcorporatea t~lues ................................................................... ~’~’;;~n’nnaEsmnated Tot, 1 l .... ¢~,t~u,uvu,.’ . z ue Petroleum Products ................................................................................................ - ......Eslmmted \ al _ _ buu,uuu
Estimated Value Other Mineral Products ................................................................................................Total Assessed Valuation Property including real estate,,
improvements, personal property and utilities ..........................................................................$111,260,575

II

P, ./
AGRICULTURAL CROP REPORTSANTA BARBARA COUNT~Y,.NN~I~, ~.-o~,,,o.’r,’,~ ~"
Compiled by Eugene S. Kellogg, County Agricultural ,~ommissi’o~ ~cOv,-~i"~:’-’
JANUARY 1,, 1940~.~v ~.~
*F.O.B. VALUE
Ii
ACREAGE
1938 1939
Orchard Crops .......................................... 11,069 11,739
Animal Industry ........................................ 610,000 610,000
Field Crops .............................................. 134,302 125,228
Vegetable Crops ........................................ 27,608 32,172
1938 1939
$ 2,670,120 $ 3,573,8925,427,489 5,381,3794,66%095 5,196,1345,649,698 5,461,917
To tal .................................................. 782,979 779,139 $18,411,402 $19, 613,322*Includes value after being graded, packed and sold in Santa Barbara County points; this is not tlle farm value.
ORCHARD CROPS Pianted /Lereage
1938 1939
Avocados .............................. 267 273*Lemons ................................ 7,151 7,779Oranges .............................. 2.81 281Walnuts .............................. 3,370 3,406
Total ......................... -11,069 "11,739
Yield
1938 1939 1938
120 tons 335 tons $ 18,5052,157 cars *2,909 cars 2,293,745
77 cars 60 cars 23,1151,234 tons 1,680 tons 334,755
*2285 cars packed fruit; 624 cars loose fruit and by-products.
$2,670,120
Vnhze
1939
$ 28,8453,21-0T2~
25,300309,621
$3,573,892
ANIMAL INDUSTRY Nulnbers Sold 1938
Beef Cattle and Calves ................ 55,907Hogs .................................................. 4,900Slfeep and Wool .............................. 2%029Poultry .............................................. 103,271Eggs .................................................. 524,598 doz.Dairy Products ................................ 2,431,441 lbs.fatMisc. Livestock ................................
Total ......................................
Numbers Sold 1939
53,8076,1771%98588,134
587,056 doz.2,582,083 lbs.[at
Vnlue J938
$3,871,97770,560
112,35848,084
135,4581,15%052
35,000$5,427,489
Value 1939
$3,760,12081,33084,28950,877
143,3671,211,396
50,0005,381,379
,A_ereagcl~i ELD GROPS
Beans 1938 1939
Baby Limas .............. 11,125 7,056Small Whites ............ 13,689 8,400Pinks .......................... 5,537 5,353Common Limas ........ 5,836 5,936Garbanzos ................ 2,477 5,867Seed Beans .................. 2,111 2,128Misc ............................ 2,851 4,301
Total .................... 43,-’--62"6 39,04--’----~
*Beets, SugarBeets Shipped ........ 2,350 2,287Beets Processed ........ 5,058 6,458
(sngar)Total .................... 7,408 8,745
Alfaffa .............................. 7,064 7,914
Barley .............................. 18,549 18,103Flower Seed .................... 2,199 2,339
Grain Ha),. ..................... 22,000 20,417Honey Products ..............Mustard Seed ................. 4.964 4,951Oats .................................. 7,209 7,689Onions .............................. 246 293
Dried Peppers ................ 234 308Potatoes .......................... 1,593 1,868Canning Tomatoes ........ 255 472Wheat .............................. 18,955 13,088
Total .................... .q0--,-~6 86,18"-------~
Total Field Crops ..!34,302 1~.5,228
*Includes only beets grown in Santa Barbara County.
Yield Vllllle
~93S 1939 1938 1939
94,998 cwt. 64,485 cwt. $ 240,673 $ 179,158
72,860 " 44,577 " 185,889 148,545
33,757 " 3%704 " 118,786 134,842
69,737 " 59,340 " 297,474 292,620
11,387 " 40,867 " 56,935 169,35724,735 " 2%917 " 145,545 159,880
21,952 " 34,811 " 84,542 117,991
329,426 " 303,701 " $1,129,844 $1,202,393
34.219 tons 40.253 tons 171,057 204,387
89,150 " 113,140 " 1,139,658 1,483,292(suga~ (sugar)
]23,369 " 153,39-------3 " 1.310.715 1,687.679
47,461 " 49,798 " 379,768 398,384
288,271 cwt. 19t,016 cwt. 249,735 168,285389,300 445,800
28,933 tons 27,750 tons 261,897 291,00038 tons 42tons 3,015 4,880
41,77I cwt. 44,585 cwt. 163,072 257,03978,437 " 77,244 " 88,360 94,767
24,661 " 29,339 " 19,799 14,670234 tons 539 tons 45,630 130,438
471,538 cwt. 250,312 cwt. 433,421 234,4172,805 tons 9,440 tons 25,245 94,400
173,411 cwt. 135,370 cwt. 164,294 171,982$3,534,251 $3,993,741$4,664,095 $5,196,134

airy -ro ucts" .............................. ". ,.’- --- ". ":Misc. Livestock ................................
Total ..... $5,427,489 5,381,379
FIELD CROPS Acreage
Beans 193S 1Ore
Baby Limas .............. 11,125 7,056Small Whites ............ 13,689 8,400Pinks .......................... 5,537 5,353Common Lilnas ........ 5,836 5,936G~rbanzos ................ 2,477 5,867Seed Beans .................. 2,111 2,128Misc ........................... 2,851 4,301
Total ................... "43,626 39,04---"---i
*’Beets, SugarBeets Shipped ........ 2,350 2,287Beets Processed ........ 5,058 6,458
(sugar)Total .................... 7,408 8,745
Alfalfa .............................. 7,064 7,.q 14Barley .............................. 18,549 18,103Flower Seed .................... 2,199 2,839Grain Hay ...................... 22,000 20,417Honey Products ..............Mustard Seed ................. 4.964 4,951Oats .................................. 7,209 7,689Onions .............................. 246 293Dried Peppers ................ 234 308Potatoes ]. 9,3 1,868Canning Tomatoes ........ 255 472Wheat .............................. 18,955 13,088
Total .................... §0,676 -86,187
Total Field Crops ..134,302 1’25,228*Includes only beets grown in Santa Barbara County.
Yield Value
1938 1933 1938 1939
94,998 cwt. 6~485cwt. $ 240,673 $ 179,15872,860 " 44,577 " 185,889 148,54533,757 " 34,704 " 118,786 134,84269,737 " 59,340 " 297,474 292,62011,387 " 40,867 " 56,935 169,35724,735 " 24,917 " 145,545 159,88021,952 " 34,811 "’ 84,542 117,991
329,426 " 303,701 " $1,129,844 $1,202,393
34.219tons 40,253 tons 171,057 204,38789,150 " 113,140 " 1,139,658 1,483,292
(sugaO (sugar)
12~,369 " 153,39-"------3 " 1.310.715 1,687.679
47,461 " 49,798 " 379,768 398,384288,271 cwt. 194,016 cwt. 249,735 168,285
389,300 445,80028,933 tons 27,750 tons 261,897. 291,000
38 tons 42 tons 3,015 4,88041,771 cwt. 44,585 ~vt. 163,072 257,03978,437 " 77.244 " 88,360 94,76724,661 " 29,339 " 19,799 14,670
234 tons 539 tons 45,630 130,438471,538 cwt. 250,312 cwt. 433,421 234,417
2,805 tons 9,440 tons 25,245 94,400173,411 cwt. 135,370 cwt. 164,294 171 982
$3,534,251 $3,993,741$--~,664,095 $5,196,134
Acreage
VEGF~qPAIILE CROPS 1938 1939 1938Cars
Anise ................................ 174 274 85Bell Peppers .................... 107 83 26Broccoli ............................ 1,885 3,694 847Cabbage ............................ 118 138 44Carrots .............................. 1,745 2,838 1,105Cauliflower ...................... 5,562 6,751 3,083Celery .............................. 1,910 2,034 1,394Chicory .............................. 456 531 157Green Limas .................. 200 326 43Lettuce ............................ 9,653 1.0,297 ~,,467Mixed and Misc ........... 1,008 725 2,240Peas .................................. 3,362 2,989 177Tomatoes ........................ 1,348 1,492 667
T~tal .................... 27,60"-~8 32,17------~2 14,33-------5
Viehl Value
1939 1938 1939
Cars
74 $ 29,423 $ 24,88212 10,395 6,255
702 311,215 329,25562 15,285 17,169
1,164 453,775 463,7143,013 785,163 765,0611,495 471,361 598,808
204 47,916 62,27283 58,050 83,878
4,286 2,091,205 1,738,6663,254 847,355 1,048,702
266 206.835 159,004432 321,720 164,260
15,047 $5,649,698 $5,461,917
Note: Acreage of each crop plante,1 as indicated, except mixed and miscellaneous, which includes also acreage forasparagus, artichokes, beets, onions, parsley, radishes, rhubarb, spinach and turnips.
Note: Considerable percentage of acreage in broccoll, carrots, cauliflower, celery, chicory, and lettuce shipped inmixed cars.
Note: Survey of acreage planted indicates that approxlmately 20% of the production and value of vegetables indi-cated is grown in Oso Flaco, San Luis Obispo County, hut packed and marketed in Santa Barbara County.
Note: Values of all crops shown are f.o.b, basis; not what the farmer received.Total Number Farms .......................................................................................................................... 1,551
Total Value Agricultural Products .................................................................................................... ‘$ 19,613,322
Total Acreage, not including Channel Islands,. ............................................................................. 1,683,200
Total Acreage U. S. Forest Keserve Area .......................................................................................... 754,380
Total Acreage Agricultural Area ........................................................................................................ 932,915
Estimated Total Population ................................................................................................................ 85,000
Estimated Total Population Outside Incorporated Cities ................................................................ 31,645
Estimated Value Petroleum Products ................................................................................................ $ 6,709,816Estimated Value Other Mineral Products .......................................................................................... $ 500,000
Total Assessed Valuation Property including real estate,,improvements, personal property and utilities .......................................................................... ,$111,766,935


AGRICULTURAL CROPSANTA BARBARA COUNTY 16
Compiled by Eugene S. Kellogg, County Agricultural Commissioner
JANUARY 1, 1941
GIANN|..H UOUNDATI;2,N tJI-AGRICULTURAL ECONOMicS
LIBRARV
REPORT
1939
Orchard Crops ....................................11,739Animal Industry .................................610,000Field Crops .............................................126,498Vegetable Crops ................................. 32,172
Total ................................................780,409
A.CRI~AGE *F,O.~B. VALUE
1940 1939 1940
12,290 $3,573,892 $3,623,924610,000 5,417,956 6,743,321128,310 5,051,707 5,358,18428,68_0 5,461,917 5,049,697
779,280 $19,505,472 $20,775,126*Includes value after being graded, packed and sold in Santa Barbara County points; this is not the farm value.
ORCHARD CROPS Planted 2kereage
1939 1940
Avocados ..........................................273 303Lemons .............................................7,779 8,208Oranges .............................................281 269Walnuts .............................................3,406 3,510
Total .......................................11,739 i2,290
Yield
1939 1940
335 tons 257 tons2,909 cars "3,414 cars
60 cars 101 cars1,680 tons 1,407 tons
*2,290 cars packed fruit; 1,124 cars loose fruit and by-products.
F, O. B. Value
1939 1940
$28:845 $ 38,1903,210,126 3,222,679
25,300 17,995309,621 345,060
$3,573,892 83,623,924
ANIltIAL INDU SrI~RY
*Beef Cattle and Calves ..........Hogs ....................................................Sheep and Wool ............................Poultry ..............................................Eggs ....................................................Dairy Products ............................Misc. Livestock ............................
Total ...........................................
Numbers Sold 1939 l~rumbers Sold 1940 V:|iue 1939 Valtze 1940
53,807 66,038 $3,760,120 ’$4,847,0577,677 8,658 97,830 116,896
14,985 13,438 84,289 98,515103,434 108,964 55,251 66,728587,056 doz. 486,418 doz. 143,367 107,654
2,63,1,256 lbs. fat 3,051,823 lbs. fat 1,227,131 1,451,471.................. 50,000 55,000
*Includes sale of feeders and all cattle sold.$5,417,956 $6,743,321
FIELD CROPS
Beans 1939Baby Limas ........................ 7,056Small Whites ..................... 8,400Pinks .......................................5,353Common Limas ............... 7,206Garbanzos ...........................5,867Seed Beans ........................ 2,128Miscellaneous .................. 4,301
Total ...........................40,311*Sugar Beets
Beets shipped .................. 2,287Beets processed ............ 6,458(Sugar) Total .................. 8,745
Alfalfa .................................7,914Barley ....................................18,103Flower Seed .................... 2,339Grain Hay ...........................20,417Honey Products .....................Mustard .................................4,951
Acreage
1940 1939
7,716 64,485 cwt.15,956 44,577 "8,541 34,704 "7,685 59,340 "5,037 40,867 "2,173 24,917 "3,’356 34,811 "
50,464 303,701
Yield
1940
58,884 cwt.93,309 "51,977 "75,067 "21,170 "31,183 "24,255 "
355,845 "
3,265 40,253 tons6,349 113,140 tons9,614 153,393 tons
8,050 49,798 tons9,960 194,016 cwt.2,742
19,500 27,750 tons42 tons
3,805 44,585 cwt.
56,804 tons109,880 tons166,684 tons
40,250 tons96,500 cwt.
24,500 tons278 tons
34,736 cwt.Oats ..........................................7,689Onions ....................................293Canning Peppers ..................Dried Peppers .................. 308Potatoes ..............................1,868Canning Spinach ..................Canning Tomatoes ...... 472Wheat ....................................13,088
Total .................................86,187Total Field Crops ..... 126,498
6,355 77,244200 29,33975
285 5392,159 250,312
24O1,394 9,440.
13,467 135,37077,846 .........
128,310 .........
CWt. 54,228 cwt.CWt. 19,907 CWt.
310 tonstons 356 tonscwt. 443,449 cwt.
960 tonstons 18,122 tonscwt. 57,387 cwt.
*includes only sugar beets grown in Santa Barbara County.
F. O. B, Vnlue
1939
$ 179,158148,545.134,842292,620169,357159,880117,991
$1,202,393
1940
$ 175,397289,257172,503319,03493,674
293,42890,357
"$1,433,650
204,3871,338,8651,543,252
398,334168,285445,800291,000
4,880257,03994,76714,670
130,438234,417
94,400171,982
$3,849,314
277,8101,154,2201,432,030’
329,75082,841
479,468285,50032,996
396,72746,09319,90710,07589,000
452,79414,400
181,22071,733
$3,924,5345,051,707 5,358,184

Pinks .......................................~.3~5"Common Limas ............... 7,206Garbanzos ...........................5,867Seed Beans ........................ 2,128Miscellaneous .................. 4,301
Total ...........................*Sugar Beets
Beets shipped .................. 2,287Beets processed ............ 6,458(Sugar) Total’. ................. 8,745
Alfalfa .................................7,914Barley ....................................18,103Flower Seed ..................... 2,339Grain Hay ...........................20,417Honey Products .....................Mustard .................................4,951Oats ..........................................7,689Onions ....................................293Canning Peppers ..................Dried Peppers .................. 308Potatoes ..............................1,868Canning Spinach ..................Canning Tomatoes ...... 472Wheat ....................................13,088
Total .................................86,187
7,685 59,340 "5,037 40,867 "2,173 24,917 "3:356 34,811"
50,464 303,701 "
75,067 " ~92,620 ~1-9 ,U~4
21,170 " 169,857 93,674
31,183 " 159,880 293,42824,255 " 117,991 90,357
355,845 " $1,202,398 $1,433,650
3,265 40,253 tons 56,804 tons6,349 113,140tons 109,880tons
].53,393 tons 166,684 tons
8,050 49,798 tons 40,250 ton39,960 194,016 cwt. 96,500 cwt.2,742 .....................
19,500 27,750 tons 24,500 tons42 tons 278 tons
44,585 ewt. 34,736 cwt.6,355 77,244 cwt. 54,228 cwt.
200 29,339 cwt. 19,907 cwt.75 310 tons285 539 tons 356 tons
2,159 250,312 cwt. 443,449 cwt.240 960 tons
1,394 9,440. tons 18,122 tons13,467 ,135,370 cwt.. 57,387 cwt."77,846 .........
Total Field Crops ..... 1--26,498 -128,310 .........*includes only sugar beets grown in Santa Barbara County.
204,387 277,8101,338,865 1,154,2201,543,252 1,432,030
398,384 329,750168,285 82,841445,800 479,468291,000 285,500
4,880 32,996257,039 396,72794,767 46,09314,670 19,907
10,075130,438 89,000234,417 452,794
14,40094,400 181,220
171,982 71,733$3;849,314 $3,924,5345,051,707 5,358,184
VEGET~I.HLE CROPS 1939 1949
Anise .................................274 237Artichokes .............................. 115Bell Peppers .................. 83 67Broccoli ...........................3,694 2,069Cabbage ........................... 138 241Carrots ..............................2,838 1,835Cauliflower .................. 6,751 6,815Celery .................................2,034 1,544Chicory ..............................531 363Cucumbers .............................. 30Green Limas .................. 326 243Lettuce ..............................10,297 9,750Mixed and Misc ....... 725 408Par sley ....................................... 8Peas .......................................2,989 2,782Tomatoes ...........................1,492 1,173
Total ........................32,172 28,680
Yield F. O. B. "Value
1939 1940 1939 1940
C~lr~ Cx~rg
74 101 $ 24,882 $ 30,64334 23,14047 6,255 24,273
702 1,058 329,255 620,59562 131 17,160 29,997
1,164 984 463,714 439,2333,013 3,626 765,061 1,093,4741,495 1,742 598,808 583,132
204 285 62,272 100,07239 14,40828 83,878 28,180
4,286 4,173 1,738,666 1,393,5443,254 524 1,048,702 170,071
18 7,584266 274 159,004 345,973432 325 164,260 145,378
15.0-47’ 13,389 $5,461,917 }~5,049,697
Note: Acreage of each crop planted as indicated, except mixed and miscellaneous, which includes alsoacreage for asparagus, artichokes, beeLs, onions, parsleF, radishes, rhubarb, spinach and turnips.
Note: Considerable percentage of acreage in broccoli, carrots, cauliflower, celery, chicory and lettuceshipped in mixed cars, which is reflected in yield per acre figures.
Note: 1940 production for mixed and miscellaneous does not show acreage as such for artichokes, cu-cumbers and parsley, as shown as mixed and miscellaneous in 1939.
Note: Values of all crops shown are Lo.b. basis; not what the farmer received.1,551
Total Number Farms .....................................................................................................................................................................20,775,126To~al Value Agricultural Products .................................................................................................................................$ 1,683,200
Total Acreage, including Channel Islands ...............................................................................................................754,380Total Acreage U. S. Forest ......................................................................................................................................................70,555Total Population--U. S. 1940 Census ...........................................................................................................................Total Population Outside Incorporated Cities ......................................................................................................
22,400
Estimated Value Petroleum Products ...........................................................................................................................$ 5,385,226
Estimated Value Other Mineral Products ...............................................................................................................~ 500,000Total Assessed Valuation Property, including real estate,
improvements, personal property and utilities .............................................................................$111,562,129