agricultural and recreational impacts from surface flow changes
TRANSCRIPT
Journal of Agricultural and Resource Economics 25(2):533-546Copyright 2000 Western Agricultural Economics Association
Agricultural and Recreational Impactsfrom Surface Flow Changes Due to
Gold Mining Operations
David K. Lambert and W. Douglass Shaw
Nevada ranks third in the world in gold production. In order to operate the massiveopen pit gold mines, the State of Nevada granted mining companies a temporarypermit to pump groundwater from near the open pits and dispose of it. Certaininstream flows have nearly doubled relative to average historical flows in recentyears. Following pit closure, surface flows will likely decline from historical levels.This study measures the impacts of these changing water supplies on downstreamagricultural and recreational users. We argue that the creation of temporary changesin water rights for the downstream users would likely mitigate future losses bothgroups are expected to experience.
Key words: discrete stochastic programming, mine dewatering, water resourceeconomics
Introduction
Conflicts over control of natural resources have shaped the West. Gold mining activitiesgenerated some of the earliest property rights issues influencing Western resource law(Libecap). The scale of modern gold mining operations and the appropriateness of insti-tutions established over 137 years ago to assign property rights associated with miningcontribute to the ongoing debate about the role of precious metal mining in the changinglandscape of the West.
Current gold mining technology in the Great Basin is based upon large open pit goldmines that may extend 800 feet below the water table and cover over 500 acres ofsurface area. Such technology requires enormous quantities of water to be dischargedfrom the pits to allow mining to continue.' Initiating this "dewatering" process called fortemporary groundwater rights to be granted by Nevada's State Water Engineer to goldmining companies in northern Nevada's Humboldt River Basin (HRB). The magnitudeof dewatering poses significant externalities on other water users within the basin. For
Lambert is professor and chair, Department of Agricultural Economics, North Dakota State University, and Shaw is associateprofessor, Department of Applied Economics and Statistics, University of Nevada.
An earlier version of this paper was presented at the First World Congress of Environmental and Resource Economics,Venice, Italy, July 1998. The authors very much appreciate the hydrologic expertise provided by John Tracy of the DesertResearch Institute, and the comments and assistance on this project offered by Eric Huszar and Noelwah Netusil. Seminarparticipants at the Universities of Edinburgh and York, and the Queen's University of Belfast are likewise acknowledged fortheir constructive input. An anonymous reviewer's insightful critique greatly helped to focus this manuscript. We also thankBenny Hodges of the Pershing County Water Conservation District for pertinent information about agricultural water usein that area of Nevada. This research was supported by a grant from the National Science Foundation and U.S. Environ-mental Protection Agency's Watersheds Grants Program. Opinions are the authors' alone and the usual disclaimer applies.
The extraction technique often used in Nevada is known as "heap leaching" and requires removal of vast quantities ofrock containing microscopic particles of gold that are later separated from the ore via a chemical (cyanide) leaching process.
Journal of Agricultural and Resource Economics
a period of approximately 15 years, instream flows in the Humboldt River Basin willdouble due to water discharges from pit dewatering. Mines have been disposing ofnearly a half million (445,000) acre-feet per year. Approximately 65% of this water isdischarged into tributaries of the Humboldt River. This discharge would be worthapproximately $223 million if valued at $500 per acre-foot, the current e paid by theU.S. Fish and Wildlife Service to purchase water rights from farmers in a nearbyirrigation district (Ise and Sunding).2 Although rapid approval was granted to goldmining companies for temporary claims to discharged groundwater, lack of institutionalflexibility may limit the ability of downstream users to enjoy temporary gains from theincreased flows during gold mining activities. Similarly, downstream users may loseduring the post-mining period as massive quantities of water are diverted to fill theabandoned open pits.
Most analyses of Western water use explore allocation of scarce supplies amongcompeting users (Colby; Keplinger et al.; Willis and Whittlesey 1998a, b). The probleminvestigated here results from institutional water rights rigidities when historical flowswithin a watershed are temporarily changed due to upstream actions. The objective ofthis research is to quantify gains and losses resulting from gold mining operations todownstream agricultural and recrereational water users. Programming techniquescombine both agricultural and recreational users to measure expected impacts undercurrent water rights agreements, as well as when downstream rights are temporarilymodified in response to flow changes resulting from the gold mining operations.
Background on Nevada Water Allocation
Under a comprehensive water act passed by the Nevada legislature in 1913, all potentialappropriators must make an application to the Office of the State Engineer for a permit[Nevada Revised Statutes (N.R.S.), ch. 48]. Federal laws, including interstate agree-ments and water rights given to Native Americans, are considerations in grantingpermits, in addition to the primary criterion that the water will be put to a beneficialuse (Bingham and Gould). Groundwater in Nevada is still largely unadjudicated, butNevada water law has been interpreted such that the groundwater near the minesbelongs to the "people" of Nevada, making the State Engineer the trustee for thisresource (Bingham and Gould). The mines' temporary water rights were not similarlymatched with temporary water rights being given to downstream irrigators, generatingat least a temporary disequilibrium in water rights institutions that have been in placefor most of the 20th century.
Although surface water supplies in the basin increase during dewatering, downstreamfarmers operate under water rights firmly established over 70 years ago. Maximumapplication of irrigation water is set by the local irrigation district.3 We hypothesize thatthese constraints limit the potential benefits farmers could gain from the temporary
2 In their 1998 analysis, Ise and Sunding focus on the Truckee-Carson Rivers' Newlands Project, which is approximately50 miles from our study area. The $500 price per acre-foot paid by the U.S. Fish and Wildlife Service reflects permanenttransfer of the water from agriculture to the federal government, and may not be completely reflective of general market(within agriculture) transactions. However, as the mining operations may affect water allocation for more than 100 years,we use this estimate of sales value rather than a short-term rental market value.
3 The board of directors of the irrigation district has the power to establish bylaws, rules, and regulations for the distribu-tion and use of water in the district, under the 1913 Nevada Irrigation District Act (N.R.S. 539.233).
534 December 2000
Flow Impacts Due to Gold Mining Operations 535
increase in flows. Benefits still do accrue to the irrigators because of the reduced proba-bility of extremely low flows during droughts. However, these benefits are most properlyconsidered as externalities since property rights are not granted to downstream users.We explore whether additional benefits could be realized if water rights were adjustedto allow temporary access to the increased water supplies.
Existing water storage facilities and distribution channels in the HRB were originallydeveloped to service agricultural producers near the river's terminus. Most agriculturalproducers are members of the Pershing County Water Conservation District (PCWCD)located near the town of Lovelock, Nevada. The PCWCD was formed in 1926 to consoli-date water rights for farmers in the region. This effort was part of the Humboldt Project,involving creation of approximately 38,000 acres of irrigable farmland. The PCWCDclaims that the necessary water rights to farm the 38,000 acres were acquired bynegotiating a contract with the U.S. Bureau of Reclamation. The exact nature of thiscontract, however, seems a matter of dispute (McColm). Following withdrawals fromRye Patch Reservoir, which is about 25 miles upstream of Lovelock, water not divertedinto the PCWCD canals disappears into the ground a short distance downstream intoan area known as the Humboldt Sink.4
Pumping of water from the pits will cease after the mines close. Though exact mag-nitudes have not been disclosed by the gold mines for competitive reasons, annualpumping costs are apparently substantial (Huszar, Netusil, and Shaw). It is virtuallycertain that no existing economic activity, including agricultural production, couldwarrant continued pumping and discharge of the water even if groundwater rights weretransferred to downstream beneficiaries. It is expected that for a period of 100 yearsfollowing mine closures, instream flows in the Humboldt River Basin will decrease asthe gold mines cease pumping out the water and discharging to the river.5 Net farmincome is expected to decline in the future due to conversion to less water-intensivecrops. Farm incomes are also expected to become more volatile as the probability of lowflows increases, thus reducing crop production when supplies are inadequate to sustainirrigation during the growing period.
Recreational users at Rye Patch Reservoir represent the other significant group ofdownstream users currently affected by the northern Nevada mining operations.Conflicts have often arisen between recreational users and irrigators dependent on RyePatch storage (see Huszar et al.). Annual visitation has averaged about 67,000 recrea-tional visitors at Rye Patch Stae Park, the easiest access point to the reservoir. Visitoruse increased an average of 6% annually between 1980 and 1996. The recreational valueof Rye Patch is positively related to water levels in the reservoir (Huszar et al.).
Water levels at Rye Patch have generally been adequate to sustain the existing sportfishery, as well as other water-based recreational use of the reservoir. However, occa-sional shortages have temporarily diminished recreational values. For example, the1992 draining of the reservoir to satisfy downstream PCWCD demands for irrigation
4 The Humboldt Sink is the flat terminus area for the river, located just west of the town of Lovelock, which in turn is 90miles from Reno, the largest city in northern Nevada. In wet years a shallow water pool in the sink may be visible, and indry years no water may be seen at all. There is no active water-based recreation in the Humboldt Sink-with the possibleexception of bird watching in some months. Highly variable flows make exporting any water remaining in wet years out ofthe basin a poor economic prospect.
5 All estimates of instream flows during and after mining operations were derived from data provided in a 1997 reportprepared by Hydrologic Consultants, Inc.
Lambert and Shaw
Journal ofAgricultural and Resource Economics
water killed millions of fish. Subsequent visitation at the reservoir declined during the
post-draining period.The 1992 fish kill may have been a violation of the public interest (Bingham and
Gould; Huszar et al.).6 Although complaints could have been filed with the State Engi-neer, the incident went unchallenged in Nevada. The fishery recovered in 1996, after
much effort by the state fisheries agency. This incident highlights the rivalry between
environmental groups favoring recreation interests and downstream farmers.
The impacts of flow increases during the dewatering period are uncertain. Increased
reservoir volume may have a positive impact on recreational values. Conversely, in-
creased water supplies could induce downstream irrigators to plant crops having higher
water requirements. The impacts of reduced flows following mine closure are also
uncertain. Water-based recreation values at Rye Patch may either increase or decrease
depending upon downstream farmer planting decisions. A model capable of identifying
costs and benefits to both user groups is thus necessary to determine the distributional
impacts of the mining externalities.In the section that follows, we describe a model developed to analyze impacts of
changing flow rates on farm income in the PCWCD and recreational values associated
with Rye Patch Reservoir. Farm income and recreational value changes are then
examined based on both the current water rights held by farmers in the PCWCD, as
well as potential gains if irrigators were allowed to benefit from the ephemeral increases
in flow. A concluding section addresses the potential gains and losses to farmers and
recreational users under a more flexible approach to water rights assuming temporary
environmental changes.
The Model
A multiperiod discrete stochastic programming (DSP) model is developed to estimate the
expected impacts of changes due to flow perturbations resulting from mine dewateringand subsequent filling of pit lakes.7 The DSP model identifies a network of decisionnodes linked over time. Each node is conditional upon past events and decisions. Giventhe state of nature existing at each node, decisions are made conditional upon expecta-tions of future events. Past decisions can be modified, for example, by withholding waterfrom low-value crops when intrayear water supplies are insufficient to irrigate all acresplanted in the spring.
We assume that releases from Rye Patch Reservoir are controlled by the PCWCDwater manager, and therefore coincide with irrigation needs expressed by farmers.Planting decisions are based on expectations of water availability, as well as dynamiccropping considerations for the two perennial crops grown in the area-alfalfa hay andalfalfa grown for certified seed production. The model is thus driven by farmer plantingdecisions, which are in turn based on expectations of water supplies over the year. Final
6 The PCWCD maintains that legal authority to control reservoir levels rests with the district water master, but the threatof implementation of a doctrine of public trust similar to that exercised by the State of California in the Mono Lake contro-versy may suggest that the State Engineer, or the U.S. Bureau of Reclamation, should more carefully manage Rye Patch'sfishery (Loomis; Huszar et al.).
7 The dynamic stochastic programming model is widely used. Recent applications include those by Featherstone, Baker,and Preckel; Lambert and McCarl; and Keplinger et al.
536 December 2000
Flow Impacts Due to Gold Mining Operations 537
I ,OUU
1,400
' 1,200
° 1,000
) 800a3)
) 6000< 400
200
01945 1955 1965 1975 1985 1995
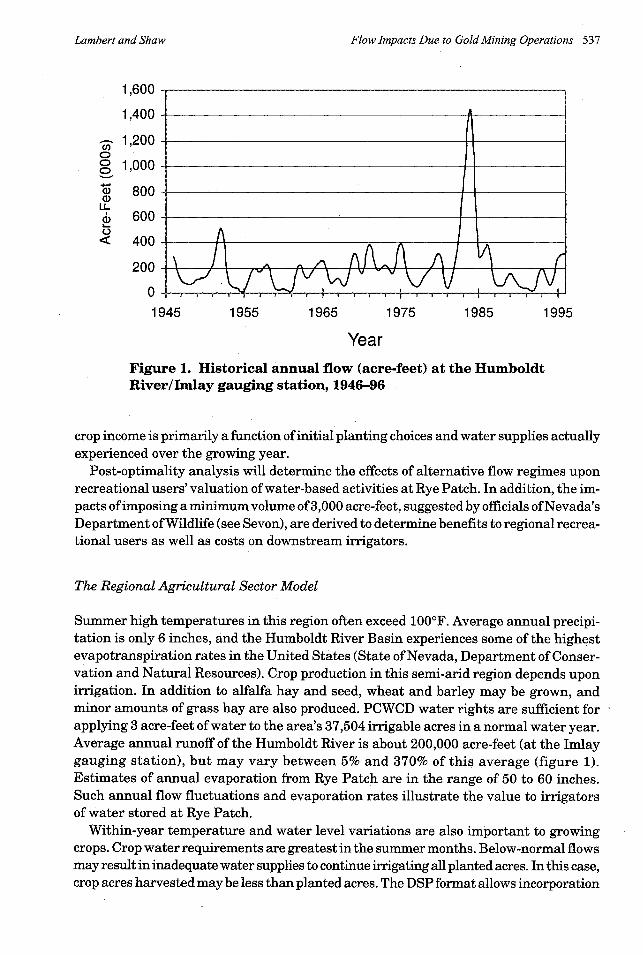
YearFigure 1. Historical annual flow (acre-feet) at the HumboldtRiver/Imlay gauging station, 1946-96
crop income is primarily a function of initial planting choices and water supplies actuallyexperienced over the growing year.
Post-optimality analysis will determine the effects of alternative flow regimes uponrecreational users' valuation of water-based activities at Rye Patch. In addition, the im-pacts of imposing a minimum volume of 3,000 acre-feet, suggested by officials of Nevada'sDepartment of Wildlife (see Sevon), are derived to determine benefits to regional recrea-tional users as well as costs on downstream irrigators.
The Regional Agricultural Sector Model
Summer high temperatures in this region often exceed 100°F. Average annual precipi-tation is only 6 inches, and the Humboldt River Basin experiences some of the highestevapotranspiration rates in the United States (State of Nevada, Department of Conser-vation and Natural Resources). Crop production in this semi-arid region depends uponirrigation. In addition to alfalfa hay and seed, wheat and barley may be grown, andminor amounts of grass hay are also produced. PCWCD water rights are sufficient forapplying 3 acre-feet of water to the area's 37,504 irrigable acres in a normal water year.Average annual runoff of the Humboldt River is about 200,000 acre-feet (at the Imlaygauging station), but may vary between 5% and 370% of this average (figure 1).Estimates of annual evaporation from Rye Patch are in the range of 50 to 60 inches.Such annual flow fluctuations and evaporation rates illustrate the value to irrigatorsof water stored at Rye Patch.
Within-year temperature and water level variations are also important to growingcrops. Crop water requirements are greatest in the summer months. Below-normal flowsmay result in inadequate water supplies to continue irrigating all planted acres. In this case,crop acres harvested may be less than planted acres. The DSP format allows incorporation
Lambert and Shaw
I f\n
A
Journal ofAgricultural and Resource Economics
of alternative future water conditions over the growing year, including inadequatesupplies to grow all acres planted. Planting decisions will therefore reflect responses tothe probabilities of low flows and subsequent loss of some planted acres. Either feweracres may be planted, or crops may be planted that have lower water requirements.
The Regional Agricultural Sector and River Flows
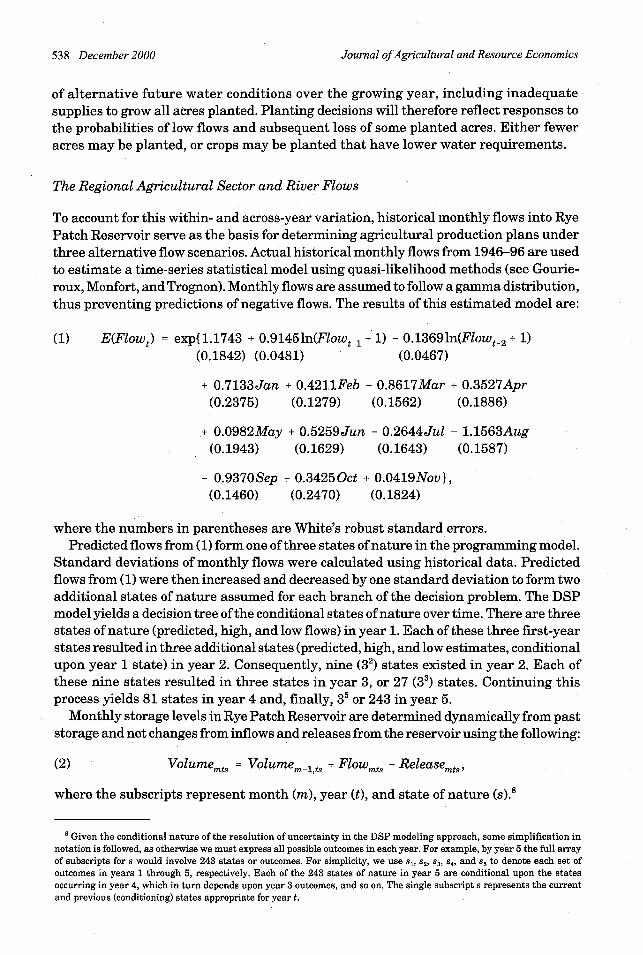
To account for this within- and across-year variation, historical monthly flows into RyePatch Reservoir serve as the basis for determining agricultural production plans underthree alternative flow scenarios. Actual historical monthly flows from 1946-96 are usedto estimate a time-series statistical model using quasi-likelihood methods (see Gourie-roux, Monfort, and Trognon). Monthly flows are assumed to follow a gamma distribution,thus preventing predictions of negative flows. The results of this estimated model are:
(1) E(Flow,) = exp{1.1743 + 0.91451n(Flowt_1 + 1) - 0.13691n(Flowt 2 + 1)(0.1842) (0.0481) (0.0467)
+ 0.7133Jan + 0.4211Feb + 0.8617Mar + 0.3527Apr(0.2375) (0.1279) (0.1562) (0.1886)
+ 0.0982May + 0.5259Jun - 0.2644Jul - 1.1563Aug(0.1943) (0.1629) (0.1643) (0.1587)
- 0.9370Sep + 0.34250ct + 0.0419Nov},(0.1460) (0.2470) (0.1824)
where the numbers in parentheses are White's robust standard errors.Predicted flows from (1) form one of three states of nature in the programming model.
Standard deviations of monthly flows were calculated using historical data. Predictedflows from (1) were then increased and decreased by one standard deviation to form twoadditional states of nature assumed for each branch of the decision problem. The DSPmodel yields a decision tree of the conditional states of nature over time. There are threestates of nature (predicted, high, and low flows) in year 1. Each of these three first-yearstates resulted in three additional states (predicted, high, and low estimates, conditionalupon year 1 state) in year 2. Consequently, nine (32) states existed in year 2. Each ofthese nine states resulted in three states in year 3, or 27 (33) states. Continuing thisprocess yields 81 states in year 4 and, finally, 35 or 243 in year 5.
Monthly storage levels in Rye Patch Reservoir are determined dynamically from paststorage and net changes from inflows and releases from the reservoir using the following:
(2) Volumets = Volumem ts + Flowmts - Releasemts,
where the subscripts represent month (m), year (t), and state of nature (s).8
8 Given the conditional nature of the resolution of uncertainty in the DSP modeling approach, some simplification innotation is followed, as otherwise we must express all possible outcomes in each year. For example, by year 5 the full arrayof subscripts for s would involve 243 states or outcomes. For simplicity, we use s1, S2, S3, S4, and s5 to denote each set ofoutcomes in years 1 through 5, respectively. Each of the 243 states of nature in year 5 are conditional upon the statesoccurring in year 4, which in turn depends upon year 3 outcomes, and so on. The single subscript s represents the currentand previous (conditioning) states appropriate for year t.
538 December 2000
Flow Impacts Due to Gold Mining Operations 539
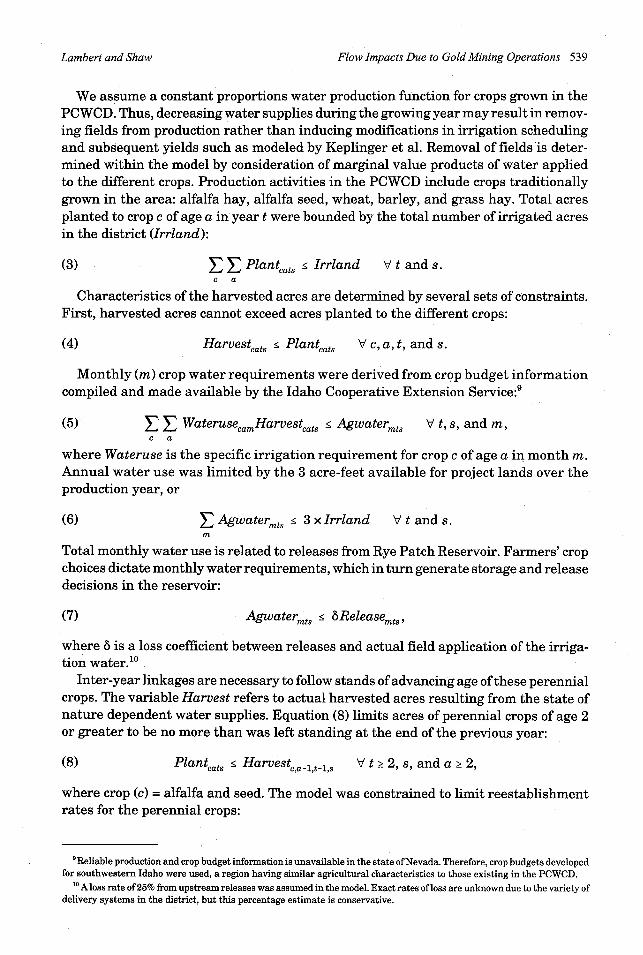
We assume a constant proportions water production function for crops grown in thePCWCD. Thus, decreasing water supplies during the growing year may result in remov-ing fields from production rather than inducing modifications in irrigation schedulingand subsequent yields such as modeled by Keplinger et al. Removal of fields is deter-mined within the model by consideration of marginal value products of water appliedto the different crops. Production activities in the PCWCD include crops traditionallygrown in the area: alfalfa hay, alfalfa seed, wheat, barley, and grass hay. Total acresplanted to crop c of age a in year t were bounded by the total number of irrigated acresin the district (Irrland):
(3) i i Plantats < Irrland V t and s.c a
Characteristics of the harvested acres are determined by several sets of constraints.First, harvested acres cannot exceed acres planted to the different crops:
(4) Harvestcats < Plantcat V c, a, t, and s.
Monthly (m) crop water requirements were derived from crop budget informationcompiled and made available by the Idaho Cooperative Extension Service:9
(5) E V WaterusecamHarvestcats Agwaterts V t, s, and m,c a
where Wateruse is the specific irrigation requirement for crop c of age a in month m.Annual water use was limited by the 3 acre-feet available for project lands over theproduction year, or
(6) Agwatermts < 3 x rrland V t and s.m
Total monthly water use is related to releases from Rye Patch Reservoir. Farmers' cropchoices dictate monthly water requirements, which in turn generate storage and releasedecisions in the reservoir:
(7) Agwatermts < Releasemts,
where 6 is a loss coefficient between releases and actual field application of the irriga-tion water. 10
Inter-year linkages are necessary to follow stands of advancing age of these perennialcrops. The variable Harvest refers to actual harvested acres resulting from the state ofnature dependent water supplies. Equation (8) limits acres of perennial crops of age 2or greater to be no more than was left standing at the end of the previous year:
(8) Plantcats Harvestatls V t 2, s, and a > 2,
where crop (c) = alfalfa and seed. The model was constrained to limit reestablishmentrates for the perennial crops:
9 Reliable production and crop budget information is unavailable in the state of Nevada. Therefore, crop budgets developedfor southwestern Idaho were used, a region having similar agricultural characteristics to those existing in the PCWCD.
10 A loss rate of 25% from upstream releases was assumed in the model. Exact rates of loss are unknown due to the variety ofdelivery systems in the district, but this percentage estimate is conservative.
Lambert and Shaw
Journal ofAgricultural and Resource Economics
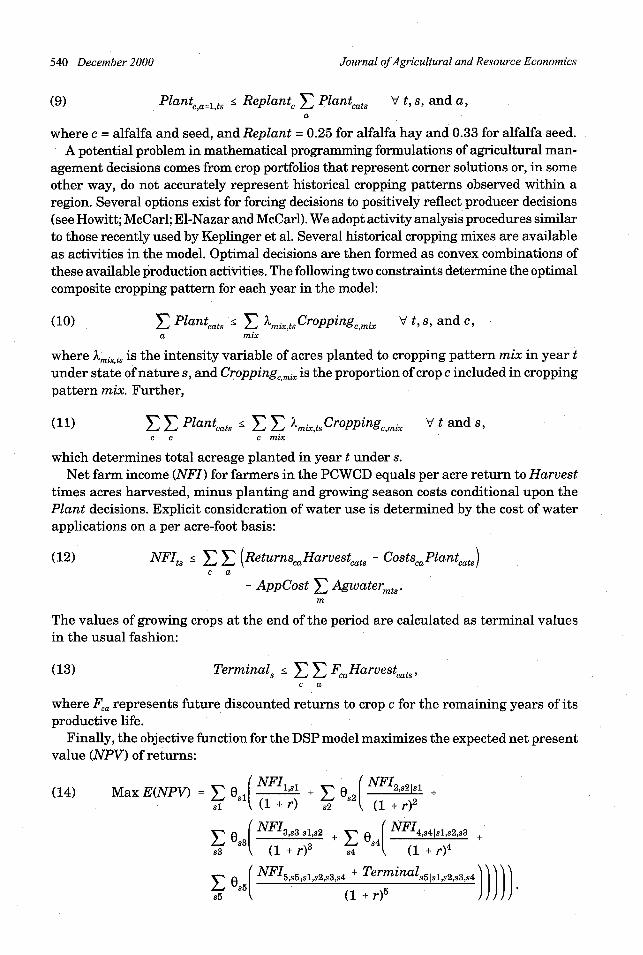
(9) Plant,a=lts < Replant, E Plantcat V t, s, and a,a
where c = alfalfa and seed, and Replant = 0.25 for alfalfa hay and 0.33 for alfalfa seed.A potential problem in mathematical programming formulations of agricultural man-
agement decisions comes from crop portfolios that represent corner solutions or, in someother way, do not accurately represent historical cropping patterns observed within aregion. Several options exist for forcing decisions to positively reflect producer decisions(see Howitt; McCarl; El-Nazar and McCarl). We adopt activity analysis procedures similarto those recently used by Keplinger et al. Several historical cropping mixes are availableas activities in the model. Optimal decisions are then formed as convex combinations ofthese available production activities. The following two constraints determine the optimalcomposite cropping pattern for each year in the model:
(10) E Plantcats < E mixtsCroppingcmix V t, s, and c,a mix
where 'mix,ts is the intensity variable of acres planted to cropping pattern mix in year tunder state of nature s, and Cropping, mx is the proportion of crop c included in croppingpattern mix. Further,
(11) Z Z Plantcats < E miCroppingmix V t and s,c c c mix
which determines total acreage planted in year t under s.Net farm income (NFI) for farmers in the PCWCD equals per acre return to Harvest
times acres harvested, minus planting and growing season costs conditional upon thePlant decisions. Explicit consideration of water use is determined by the cost of waterapplications on a per acre-foot basis:
(12) NFIts < • (ReturnscaHarvestcats - CstscaPlantats)c a
- AppCost E Agwatermts .m
The values of growing crops at the end of the period are calculated as terminal valuesin the usual fashion:
(13) Terminal < Fa Harvestcats,c a
where Fa represents future discounted returns to crop c for the remaining years of itsproductive life.
Finally, the objective function for the DSP model maximizes the expected net presentvalue (NPV) of returns:
(14) Max E(NPV) = O el ( 1 E I s2 ( NF21 +sl + I (1 + r) s +(r) 2
s33,s3 I sls2+ - )
s4 7 4s 2s3 (1 + r) 3 s4 (1 + r)4
Z5,s5lsl,s2,s3,s4 s5+Tmn l ,s2,s3, s4 ji)flQ (^Ws S( + ±Terminal)O5 (1 + r)5
540 December 2000
Flow Impacts Due to Gold Mining Operations 541
The conditional uncertainty of the model is illustrated by full use of subscripts in (14).Net farm income in year 2, for example, depends upon the state of nature that occursin year 2 (s2) conditional upon the preceding year's state (sl). The probability of eachstate of nature occurring is represented by 0.
The Regional Recreation Sector
Primary water-based recreation in the Humboldt River Basin relates to use of Rye PatchReservoir. Most visits to this 171,000 acre-feet capacity reservoir are water based,primarily fishing. Changes in Humboldt River flows due to upstream mining activitiescould potentially increase recreational use at the reservoir during dewatering. Weexpect this relationship to be true, as past data show that annual visitation is greaterin higher than average water years (see Huszar et al.). Conversely, after cessation ofmining activities, pit filling will decrease river flows for a period of up to 100 years.Decreased flow impacts are expected to be relatively small, but might increase theprobability that irrigators will again drain Rye Patch under drought conditions.
Most past recreational demand studies focus on demand changes due to water qualityor other environmental changes. Demographic changes and changes in water allocationinfrastructure have generated recent research activity linking water quantity to water-based recreation demand (see, for example, Fadali and Shaw; Ward et al.; Loomis;Jakus, Dowell, and Murray; Eiswerth et al.).
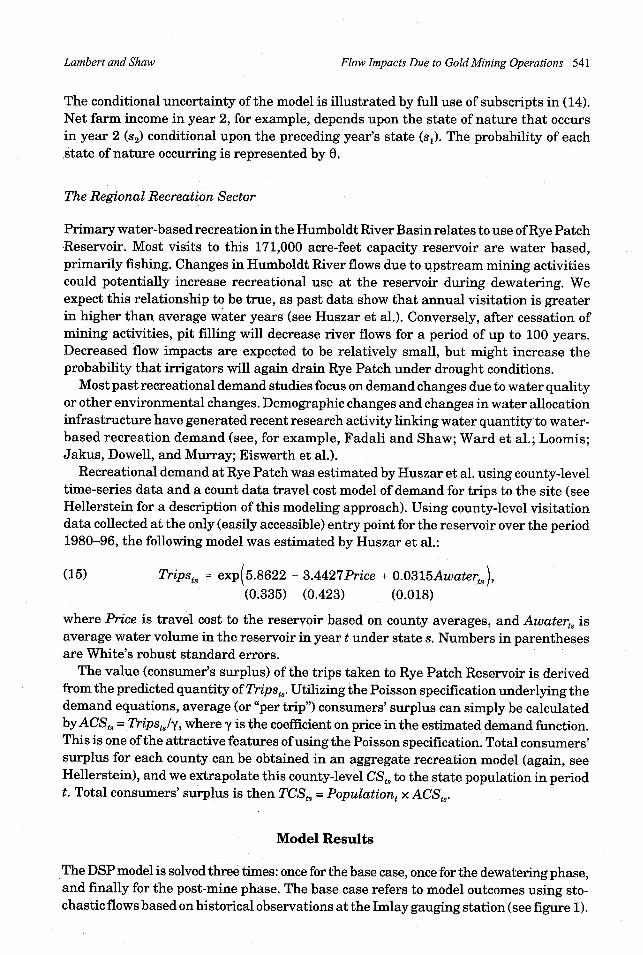
Recreational demand at Rye Patch was estimated by Huszar et al. using county-leveltime-series data and a count data travel cost model of demand for trips to the site (seeHellerstein for a description of this modeling approach). Using county-level visitationdata collected at the only (easily accessible) entry point for the reservoir over the period1980-96, the following model was estimated by Huszar et al.:
(15) Tripst% = exp(5.8622 - 3.4427Price + 0.0315Awatert),
(0.335) (0.423) (0.018)
where Price is travel cost to the reservoir based on county averages, and Awatert isaverage water volume in the reservoir in year t under state s. Numbers in parenthesesare White's robust standard errors.
The value (consumer's surplus) of the trips taken to Rye Patch Reservoir is derivedfrom the predicted quantity of Tripsts. Utilizing the Poisson specification underlying thedemand equations, average (or "per trip") consumers' surplus can simply be calculatedbyACSts = Tripst/y, where y is the coefficient on price in the estimated demand function.This is one of the attractive features of using the Poisson specification. Total consumers'surplus for each county can be obtained in an aggregate recreation model (again, seeHellerstein), and we extrapolate this county-level CSt, to the state population in periodt. Total consumers' surplus is then TCSts = Populationt x ACStS.
Model Results
The DSP model is solved three times: once for the base case, once for the dewatering phase,and finally for the post-mine phase. The base case refers to model outcomes using sto-chastic flows based on historical observations at the Imlay gauging station (see figure 1).
Lambert and Shaw
Journal ofAgricultural and Resource Economics
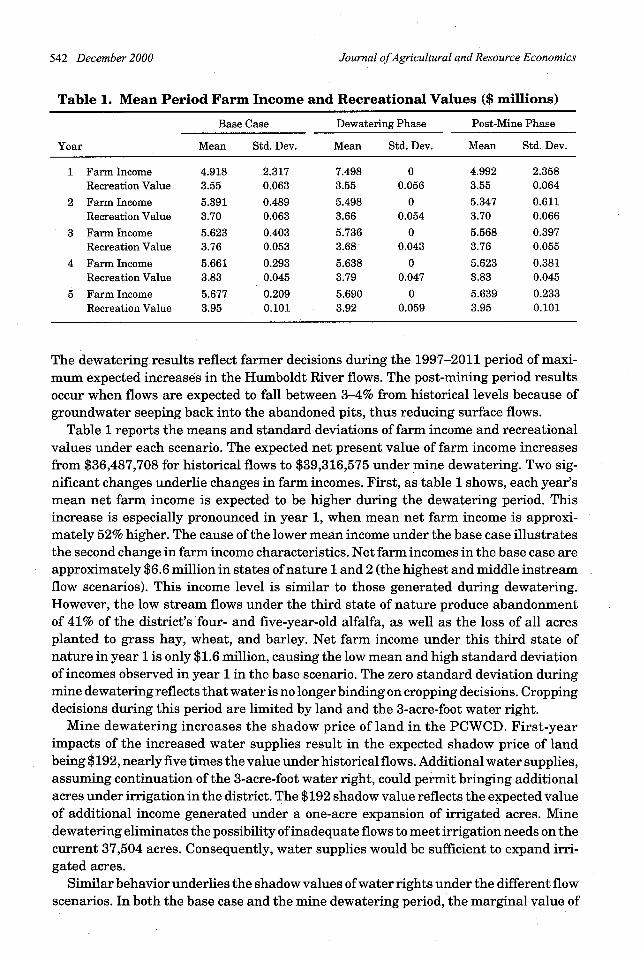
Table 1. Mean Period Farm Income and Recreational Values ($ millions)
Base Case Dewatering Phase Post-Mine Phase
Year Mean Std. Dev. Mean Std. Dev. Mean Std. Dev.
1 Farm Income 4.918 2.317 7.498 0 4.992 2.358Recreation Value 3.55 0.063 3.55 0.056 3.55 0.064
2 Farm Income 5.391 0.489 5.498 0 5.347 0.611Recreation Value 3.70 0.063 3.66 0.054 3.70 0.066
3 Farm Income 5.623 0.403 5.736 0 5.568 0.397Recreation Value 3.76 0.053 3.68 0.043 3.76 0.055
4 Farm Income 5.661 0.293 5.638 0 5.623 0.381Recreation Value 3.83 0.045 3.79 0.047 3.83 0.045
5 Farm Income 5.677 0.209 5.690 0 5.639 0.233Recreation Value 3.95 0.101 3.92 0.059 3.95 0.101
The dewatering results reflect farmer decisions during the 1997-2011 period of maxi-mum expected increases in the Humboldt River flows. The post-mining period resultsoccur when flows are expected to fall between 3-4% from historical levels because ofgroundwater seeping back into the abandoned pits, thus reducing surface flows.
Table 1 reports the means and standard deviations of farm income and recreationalvalues under each scenario. The expected net present value of farm income increasesfrom $36,487,708 for historical flows to $39,316,575 under mine dewatering. Two sig-nificant changes underlie changes in farm incomes. First, as table 1 shows, each year'smean net farm income is expected to be higher during the dewatering period. Thisincrease is especially pronounced in year 1, when mean net farm income is approxi-mately 52% higher. The cause of the lower mean income under the base case illustratesthe second change in farm income characteristics. Net farm incomes in the base case areapproximately $6.6 million in states of nature 1 and 2 (the highest and middle instreamflow scenarios). This income level is similar to those generated during dewatering datn.However, the low stream flows under the third state of nature produce abandonmentof 41% of the district's four- and five-year-old alfalfa, as well as the loss of all acresplanted to grass hay, wheat, and barley. Net farm income under this third state ofnature in year 1 is only $1.6 million, causing the low mean and high standard deviationof incomes observed in year 1 in the base scenario. The zero standard deviation duringmine dewatering reflects that water is no longer binding on cropping decisions. Croppingdecisions during this period are limited by land and the 3-acre-foot water right.
Mine dewatering increases the shadow price of land in the PCWCD. First-yearimpacts of the increased water supplies result in the expected shadow price of landbeing $192, nearly five times the value under historical flows. Additional water supplies,assuming continuation of the 3-acre-foot water right, could permit bringing additionalacres under irrigation in the district. The $192 shadow value reflects the expected valueof additional income generated under a one-acre expansion of irrigated acres. Minedewatering eliminates the possibility of inadequate flows to meet irrigation needs on thecurrent 37,504 acres. Consequently, water supplies would be sufficient to expand irri-gated acres.
Similar behavior underlies the shadow values of water rights under the different flowscenarios. In both the base case and the mine dewatering period, the marginal value of
542 December 2000
Flow Impacts Due to Gold Mining Operations 543
water rights is similar in those states of nature in which water supplies are adequateto irrigate and harvest all planted acres. Additional water rights would add approx-imately $25-45 per acre-foot to E(NPV). However, the 3-acre-foot constraint is notbinding under low flow years in the base case (as well as under low flow states in thepost-mine period). In cases where the constraint is not binding, the shadow value of thewater right is zero. Conversely, positive marginal values occur under all states of naturein the mine dewatering phase. During these years, irrigation supplies are adequate toirrigate all acres under all states of nature. Additional temporary water rights under themine dewatering period would allow producers to plant higher valued crops and takeadvantage of these transitory flow increases.
Table 1 also shows that recreational values are always smaller than the farm incomefor each scenario. The agricultural sector gains most of the benefits during the dewater-ing phase. In fact, the model predicts a smaller total value in the regional recreationsector during mine dewatering.
Mean visitor use at Rye Patch State Park drops slightly under the mine dewater-ing period. Flows into the reservoir increase due to dewatering, but mean reservoirvolumes fall slightly as farmers plant more water-intensive crops and irrigatethroughout the season. Larger releases are necessary to meet the greater irrigationdemands. However, the standard deviation of the surplus associated with recrea-tional use at Rye Patch decreases under dewatering. Storage levels are more uniformacross states of nature during the mine dewatering period. Mean storage volumesdecrease, but probabilities of a resource crash associated with reservoir draining aregreatly reduced.
The Impact of Pit Lake Filling
Farmers and ranchers operating near the mine pits are concerned about the directeffects of changes in surface and subsurface water flows when the mining operationscease pumping and the pits fill with water. Because the exact relationship betweenpumping and the volume and shape of the area's aquifers is not known, it would bedifficult to predict the economic impacts associated with the pit lakes filling in the mineareas. However, we can estimate downstream impacts from pit lake filling.
The expected net present value of the five-year model is $36,257,833, a reduction ofabout $230,000 (0.6%) from the base case. Each year's expected net farm income issimilar to the incomes expected under the historical flows. However, the reduced flowsunder the post-mine period result in more states of nature in which irrigation suppliesare inadequate to fully irrigate all planted acres through the growing season. There isalso a larger variation across states of nature in planted acres under the post-mine flowscenario. As expected, farmers' planting decisions are sensitive to the probabilitydistribution of expected irrigation supplies during the growing season.
Resource values are also expected to fall for farmers in the PCWCD when the minesclose. Land values, as reflected in mean land shadow prices, are lower than under thebase case in three of the five years of the model. Because there is an increasedprobability of receiving less than the full 3 acre-feet of irrigation water for all 37,504acres of the district, the shadow price of the 3-acre-foot water right constraint is slightlyreduced from the base case.
Lambert and Shaw
Journal ofAgricultural and Resource Economics
Maintenance of a Minimum Pool Volume inRye Patch Reservoir
Prevention of the collapse of the sport fishery in Rye Patch Reservoir requires mainten-
ance of a minimum pool volume of 3,000 acre-feet (Sevon). The DSP model was solved
again with this volume constraint. Results were obtained for the current dewateringperiod, as well as the impact of the minimum volume constraint followint fing mine closure.
There are no farm income impacts of this minimum pool constraint during the
dewatering period. Instream flows are adequate due to the mine discharges to maintain
the same optimal cropping mixture when no volume constraint is imposed. Impacts of
the volume constraint are received solely as benefits to visitors to Rye Patch State Park.
The expected consumer surplus of visitor use increases an average of $1,823 each year.
The lowest increase in expected consumer surplus is $1,225 in year 2, and the greatest
increase is $2,320 in year 3.Imposition of the minimum pool constraint does change farm incomes during pit lake
formation following mine closures. Maintaining a minimum 3,000 acre-feet of water in
Rye Patch reduces annual net farm incomes by an average of $27,743 over the five
years. Expected net present value over the five-year period falls $200,773 from the
$36,257,833 expected with no minimum pool constraint. Increases in expected consumer
surplus at Rye Patch State Park are similar to the increases expected under mine
dewatering. The average increase is $847 per year, ranging from an increase of $222 in
year 2 to $2,213 in year 5.
Relaxation of the 3-Acre-Foot Water Right Limit
A major objective of this study has been to quantify the cost to downstream users of
rigidities in water rights institutions that prevent their ability to take advantage of the
increased instream flows resulting from mine dewatering. Consequently, the 3-acre-foot
water right limit was relaxed. During mine dewatering, relaxation of this limit increasesthe expected net present value of the five-year model by $1,035,288, to $40,351,841.Average water use over all states of nature is 3.112 acre-feet applied per acre. It is
probable that more water could have been used profitably had constraints not beenimposed to match historical 'cropping mixtures (constraints 10 and 11). The two lowervalued crops, wheat and barley, were planted beyond rotational requirements becauseof the crop mix constraints.
The potential benefits of increasing agricultural water rights to the increased flowsresulting from mine dewatering are illustrated by increases in the shadow prices of irri-gated land. Significant increases in land shadow prices have already been mentioned.However, these shadow prices increased even more when farmers were able to utilize
the increased flows by relaxing the 3-acre-foot constraint. Holding irrigated landconstant at 37,504 acres, the potential gain of additional water rights during mine
dewatering increases land values to an average of $215 per acre.
Summary and Conclusions
This study addresses an interesting resource allocation problem. For a period of about
15 years, typical instream flows in one of the driest watersheds in the United States are
temporarily doubled due to ephemeral water rights granted to several large gold mining
544 'December 2000
Flow Impacts Due to Gold Mining Operations 545
companies operating near the headwaters of the Humboldt River in northern Nevada.Although groundwater rights were quickly granted to the gold mines, subsequentdownstream user rights were not adjusted to allow full enjoyment of the externality.Even with no increases in downstream user rights, agricultural producers and recrea-tional users benefit by the reduction in flow volatility. However, economic benefits ofsecuring agricultural rights in the increased flows are approximately $1 million in netpresent value of returns over the five years modeled. The shadow price of land increasesapproximately $100, reflecting conversion to higher valued, more water-intensivecropping patterns.
The potential for increasing recreational values also exists under the mine dewateringphase with additional institutional changes. Specifically, Nevada wildlife officialsmaintain that a 3,000 acre-foot minimum volume should be established to avoid lossof the sport fishery at Rye Patch Reservoir. Imposition of this requirement has noimpact on agricultural irrigation values during the mine dewatering phase. Annualvisitor values increase an average of $1,823 during dewatering with the minimumvolume constraint.
New water rights claimants argue for changing the structure of rights establishedunder earlier social and economic environments, but fundamental changes havegenerally evolved slowly in the West, often getting bogged down in litigation. In contrastto this often slow development, we have analyzed a rapid and significant shock in thestructure of water rights which came about when the Nevada State Engineer grantedtemporary rights for groundwater extraction and disposal to gold mining corporations.A complete accounting of the economic and environmental impacts of such action in thisarid state may not be known for decades.
We add a final word of caution about our results. While southern Nevada is veryrapidly growing and contains the vast majority of the state's population, northernNevada is very sparsely populated; Southern area residents do not visit the north, andrecreational resources such as Rye Patch Reservoir are thus not widely used. Considera traditional benefit-cost analysis where the benefits of an activity such as gold miningare pitted against the costs of concern to environmental interests. In any situation suchas this, the benefits as calculated from producers' surplus estimates (i.e., those linkedto profits from gold sales) are almost certain to dominate the environmental costsbecause the total economic damages measured in human terms will be small in theaggregate. This is simply because there are not many users over which to aggregate.Our analysis has not considered the benefits of environmental protection to nonusers,and we have attempted to consider future populations only in the simplest fashion. Wewould therefore caution against using our estimated dollar values in the broader contextof comparing the benefits from gold mining to the costs of water-resource impacts.
[Received May 1999; final revision received February 2000.]
References
Bingham, J. L., and G. A. Gould. "Opportunities to Protect Instream Flows and Wetland Uses of Waterin Nevada." Resource Pub. No. 189, undated.
Colby, B. "Estimating the Value of Water in Alternative Uses." Nat. Resour. J. 29(1989):511-18.Eiswerth, M., J. Englin, E. Fadali, and W. D. Shaw. "The Value of Water Levels in Water-Based Recre-
ation: A Pooled Contingent Behavior-Revealed Preference Approach." Water Resour. Res. (2000):forthcoming.
Lambert and Shaw
Journal ofAgricultural and Resource Economics
El-Nazar, T., and B. A. McCarl. "The Choice of Crop Rotation: A Modeling Approach and Case Study."Amer. J. Agr. Econ. 68(1987):127-36.
Fadali, E., and W. D. Shaw. "Can Recreation at a Lake Constitute a Market for Banked AgriculturalWater?" Contemporary Econ. Policy 16(1998):433-41.
Featherstone, A. M., T. Baker, and P. Preckel. "Modeling Dynamics and Risk Using Discrete StochasticProgramming: A Farm Capital Structure Application." InApplications of Dynamic Programming toAgricultural Decision Problems, ed., C. R. Taylor, pp. 145-69. Boulder CO: Westview Press, 1993.
Gourieroux, C., A. Monfort, and A. Trognon. "Pseudo Maximum Likelihood Methods: Theory." Econo-metrica 52(1984):681-700.
Hellerstein, D. "Using Count Data Models in Travel Cost Analysis with Aggregate Data."Amer. J. Agr.
Econ. 73(1991):860-66.Howitt, R. E. "Positive Mathematical Programming." Amer. J. Agr. Econ. 77(1995):329-42.Huszar, E., W. D. Shaw, J. Englin, and N. Netusil. "Recreational Damages from Reservoir Storage Level
Changes." Water Resour. Res. 35,11(1999):3489-94.Huszar, E., N. Netusil, andW. D. Shaw. "Contingent Valuation of Some Mining Externalities." Discuss.
pap., Dept. of Appl. Econ. and Statis., University of Nevada, Reno, 2000.Hydrologic Consultants, Inc. "Report on the Hydrologic Impacts of Mining Operations in the Humboldt
River Basin." HCI, Lakewood CO, 1997.Ise, S., and D. L. Sunding. "Reallocating Water from Agriculture to the Environment Under a Voluntary
Purchase Program." Rev. Agr. Econ. 20(1998):214-26.Jakus, P., P. Dowell, and M. Murray. "The Effect of Fluctuating Water Levels on Reservoir Fishing."
Discuss. pap., Dept. of Agr. Econ., University of Tennessee, Knoxville, 1999.Keplinger, K. O., B. A. McCarl, M. E. Chowdhury, and R. D. Lacewell. "Economic and Hydrologic Impli-
cations of Suspending Irrigation in Dry Years." J. Agr. and Resour. Econ. 23(1998):191-205.Lambert, D. K., and B. A. McCarl. "Sequential Modeling of White Wheat Marketing Strategies."
N. Cent. J. Agr. Econ. 11(1989):105-15.Libecap, G. D. Contracting for Property Rights. London: Cambridge University Press, 1989.Loomis, J. B. "Balancing Public Trust Resources of Mono Lake and Los Angeles' Water Rights: An Eco-
nomic Approach." Water Resour. Res. 23(1987):1449-56.McCarl, B. A. "Cropping Activities in Agricultural Sector Models: A Methodological Proposal." Amer.
J. Agr. Econ. 64(1987):768-72.McColm, M. "Community Pasture-Wetlands Restoration Project." Western Sportsman [a publication
of the Nevada Wildlife Federation] (April 1995):8, 15.Sevon, M. Supervising Fisheries Biologist, Nevada Department of Wildlife, Reno. Memorandum to Ed
Solbus, 25 January 1995.State of Nevada, Department of Conservation and Natural Resources. "Nevada Water Facts." Carson
City NV, 1992.Ward, F., R. Cole, R. Deitner, and K. Green-Hammond. "Limiting Environmental Program Contradic-
tions: A Demand Systems Application to Fishery Management."Amer. J. Agr. Econ. 79(1997):803-13.White, H. A. "A Heteroskedasticity-Consistent Covariance Matrix Estimator and a Direct Test for
Heteroskedasticity." Econometrica 48(1980):817-38.Willis, D. B., and N. K. Whittlesey. "The Effect of Stochastic Irrigation Demands and Surface Water
Supplies on On-Farm Water Management." J. Agr. and Resour. Econ. 23(1998a):206-24.-- . "Water Management Policies for Streamflow Augmentation in an Irrigated River Basin." J. Agr.and Resour. Econ. 23(1998b):170-90.
546 December 2000