agribusiness development opportunities in eastern … · 2016-02-09 · agribusiness development...
TRANSCRIPT

AGRIBUSINESS DEVELOPMENT OPPORTUNITIES IN EASTERN INDONESIA
Socio-Economic Review
Prepared for
The Australian Center for International Agricultural Research
By
Collins Higgins Consulting Group Pty Ltd July 2012
Agribusiness Development Opportunities in Eastern Indonesia – Socio-Economic Review
2
Preface A report prepared for the Australian Centre for International Agricultural Research (ACIAR) by the Collins Higgins Consulting Group Pty Ltd., under the Project Eastern Indonesia Agribusiness Development Opportunities (EI-ADO)1.
The report presents a socio-economic review of three provinces in Indonesia selected for the EI-AIPD project, namely, Nusa Tenggara Timur (NTT), West Nusa Tenggara (NTB) and East Java (EJ).
The research for the report was carried out between April and July 2012. The report involved the analysis of secondary data and key informant interviews with people involved in several agricultural sectors of the three aforementioned provinces.
Authors of this study are Emmanuel Santoyo Rio and Rouja Johnstone. Extensive research assistance was provided by Teddy Kristedi, I Wayan Mudita, Kuntoro Boga, Hermansyah Pany.
Thanks must go to all the people who helped provide information for this study, especially Government counterparts and organizations, and the many key informants who generously gave their time to answer questions.
The views expressed in this report are those of the consultants and do not necessarily reflect the views of the ACIAR or the Government of Indonesia.
Stuart Higgins
Director
Collins Higgins Consulting Group Pty Ltd
Sydney, Australia
July 2012
1 To Be Cited as: Collins Higgins Consulting Group (2012) Project Analysis of Agribusiness Development Opportunities in Easter Indonesia – Socio-Economic Review. Prepared for the Australian Centre for International Agricultural Research by Collins Higgins Consulting Group Pty Ltd.
Agribusiness Development Opportunities in Eastern Indonesia – Socio-Economic Review
3
Table of Contents
Introduction ...................................................................................................................................7 Economic, social, agricultural and rural poverty context ...............................................................7 Nusa Tenggara Timur .................................................................................................................11 West Nusa Tenggara ..................................................................................................................12 East Java ....................................................................................................................................13 Conclusion ..................................................................................................................................15
1 Introduction .................................................................................................................................18 2 Methodology................................................................................................................................20 3 Economic, Social, Agricultural and Rural Poverty Context .........................................................21
3.1 Education ...........................................................................................................................21 3.2 Health services ..................................................................................................................21 3.3 Economy ............................................................................................................................22 3.4 Food Security and Market Demand ...................................................................................25 3.5 Agricultural policy...............................................................................................................26 3.6 Agricultural research ..........................................................................................................28 3.7 Infrastructure......................................................................................................................29 3.8 Credit .................................................................................................................................29 3.9 Poverty...............................................................................................................................30 3.10 Sources of income of poor households..............................................................................31 3.11 Gender disparities..............................................................................................................33
4 Provincial profiles ........................................................................................................................36 4.1 Nusa Tengara Timur (East Nusa Tengara)........................................................................36
4.1.1 Education..................................................................................................................39 4.1.2 Poverty .....................................................................................................................39 4.1.3 Migration ...................................................................................................................42 4.1.4 Economy...................................................................................................................42 4.1.5 Agriculture ................................................................................................................44 4.1.6 Trade ........................................................................................................................47 4.1.7 Infrastructure ............................................................................................................48 4.1.8 Credit ........................................................................................................................51
4.2 Nusa Tengara Barat (West Nusa Tenggara) .....................................................................52 4.2.1 Education..................................................................................................................54 4.2.2 Poverty .....................................................................................................................55 4.2.3 Migration ...................................................................................................................56 4.2.4 Economy...................................................................................................................57 4.2.5 Agriculture ................................................................................................................58 4.2.6 Infrastructure ............................................................................................................62 4.2.7 Credit ........................................................................................................................62
4.3 Jawa Timur (East Java) .....................................................................................................63 4.3.1 Education..................................................................................................................64 4.3.2 Poverty .....................................................................................................................64 4.3.3 Migration ...................................................................................................................66 4.3.4 Economy...................................................................................................................66 4.3.5 Agriculture ................................................................................................................67 4.3.6 Infrastructure ............................................................................................................70 4.3.7 Credit ........................................................................................................................72
5 Conclusion ..................................................................................................................................73 6 References..................................................................................................................................78

Agribusiness Development Opportunities in Eastern Indonesia – Socio-Economic Review
4
List of Tables Table 1: Population, growth rate, population density and average household size in Indonesia
(2010).......................................................................................................................................21 Table 2: Adult literacy rate by province and sex (percent) (2010) ...................................................21 Table 3: Agricultural production by commodity groups....................................................................23 Table 4: Average yields for food crops in Indonesia (2011) ............................................................24 Table 5: Average yields for selected vegetables in Indonesia (2010) .............................................24 Table 6: Official poverty line, number and percentage of poor people in Indonesia (1996-2010) ...30 Table 7: Number and percentage of poor people using a factor of 1.5 of official poverty line (2010)
.................................................................................................................................................30 Table 8: Literacy rates of women in rural and urban areas in selected provinces (2010) ...............33 Table 9: Number of female-headed households in rural and urban areas by province (2010)........34 Table 10: Percentage of female-headed households that work by province (2010)........................34 Table 11: Districts, sub-districts and villages in NTT (2010)............................................................36 Table 12: Population and density of NTT (2008) .............................................................................37 Table 13: Population by gender and age in NTT (2008)..................................................................38 Table 14: Adult literacy rate by province and sex (percent) (2010) .................................................39 Table 15: Poverty rates in NTT and national level (percent) (2004-2009).......................................39 Table 16: Number and percentage of poor people in NTT by district (2007)...................................40 Table 17: Number and percentage of poor people in NTT and selected districts (2010) ................40 Table 18: Percentage of population with access to potable water,..................................................41 Table 19: General welfare indicators (2008)....................................................................................41 Table 20: Sources of employment in NTT (2009-2010)...................................................................42 Table 21: Structure of RGDP in NTT 2000-2008.............................................................................42 Table 22: District RGDP and per capita income in NTT (2008) .......................................................44 Table 23: Average production area and productivity of food crops in NTT (2004-2008) .................44 Table 24: Potential vs. actual utilization of land in NTT (2008)........................................................45 Table 25: Variation in prices of selected commodities in NTT (2007-2009) ....................................45 Table 26: Prices of key commodities in NTT (2010) ........................................................................46 Table 27: Agricultural goods entering and leaving NTT province ....................................................48 Table 28: Condition of roads in NTT (2008) ....................................................................................49 Table 29: Credit to the agricultural sector in NTT (2008).................................................................51 Table 30: Districts and villages in NTB ............................................................................................52 Table 31: Average family size and number of households in selected districts in NTB (2010) .......53 Table 32: Population in NTB by sex (2010) .....................................................................................53 Table 33: Population in NTB by age (2010).....................................................................................53 Table 34: Completion rates by district by sex (2010).......................................................................54 Table 35: Adult literacy rate by province and sex (percent) (2010) .................................................54 Table 36: Illiteracy rates by district (2010) .......................................................................................55 Table 37: Poverty rates and percentage of female-headed households in selected districts (2010)
.................................................................................................................................................55 Table 38: Number and percentage of poor people in NTB and selected districts (2010) ................55 Table 39: General welfare indicators (2008)....................................................................................56 Table 40: Migration trends in NTB (2010)........................................................................................56 Table 41: Structure of RGDP in NTB (2004-2008) ..........................................................................57 Table 42: Average size of plots in NTB (2010) ................................................................................58 Table 43: Average production area and productivity of some food crops in NTB (2005-2010) .......58 Table 44: Number and Quality of Primary and Secondary Roads in NTB (2010) ...........................62 Table 45: Number of bank offices in NTB and total credit disbursed (2010) ...................................62 Table 46: Population and density per district and sex (2010)..........................................................63 Table 47: Sub-district and villages per regency/district in East Java...............................................64 Table 48: Adult literacy rate by province and sex (percent) (2010) .................................................64 Table 49: Number and percentage of poor people by province (2010-2011) ..................................65 Table 50: Number and percentage of poor people in East Java and selected districts (2010) .......65 Table 51: General welfare indicators (2008)....................................................................................66 Table 52: Structure of RGDP in East Java 2006-2010 ....................................................................67

Agribusiness Development Opportunities in Eastern Indonesia – Socio-Economic Review
5
Table 53: Average production area and productivity of food crops in East Java (2005-2010) ........68 Table 54: Number and quality of roads, railroads, ports and airports (2010) ..................................71

Agribusiness Development Opportunities in Eastern Indonesia – Socio-Economic Review
6
List of Abbreviations and Acronyms ACIAR Australian Center for International Agricultural Research ADB Asian Development Bank AIPD-Rural Australia Indonesia Partnership for Decentralisation – Rural Economic
Program DFAT Australian Government’s Department of Foreign Affairs and Trade BPR People’s Credit Bank BPS Baden Pusat Statistik (Statistics Indonesia) BRI Bank Rakyat Indonesia BULOG State Logistics Board DKP Dewan Ketahanan Pangan EI-ADO Analysing Agribusiness Development Opportunities in Eastern Indonesia EJ East Java FAO Food and Agricultural Organization GDP Gross Domestic Product GNI Gross National Income GOI Government of Indonesia IFAD International Fund for Agricultural Development IFPRI International Food Policy Research Institute KPPOD Komite Pemantauan Pelaksanaan Otonomi Daerah (Regional Autonomy
Watch Committee) MFI Microfinance institution MICI Monitoring Investment Climate in Indonesia NTB Nusa Tenggara Barat NTT Nusa Tenggara Timur LPEM-FEUI Institute of Economic and Social Research - Faculty of Economic
University of Indonesia (Lembaga Penyelidikan Ekonomi dan Masyarakat – Fakultas Ekonomi Universitas Indonesia)
RD&E Research, development and extension RGDP Regional Gross Domestic Product Rp Rupiah SADI Smallholder Agricultural Development Initiative SBD Southwest Sumba Regency (Kabupaten Sumba Barat Daya) SME Small and medium enterprise TFP Total factor productivity TTU North Central Timor Regency (Kabupaten Timor Tengah Utara) TTS Timor Tengah Selatan UNDP United Nations Development Programme USDA United States Department of Agriculture WFP World Food Programme

Agribusiness Development Opportunities in Eastern Indonesia – Socio-Economic Review
7
Executive Summary Introduction This socio-economic review provides a summary of the social and economic characteristics, issues and trends in three provinces in Indonesia: Nusa Tenggara Timur (NTT), West Nusa Tenggara (NTB) and East Java (EJ), and in four districts within each of these provinces, which were selected by ACIAR as potential districts on which to focus their poverty alleviation efforts. The information in this review serves to compliment the Literature Review of Key Commodities to allow an informed selection of five commodities for value chain analysis in the 12 pre-selected districts.
The socio-economic review therefore provides an overview of demographic trends in Indonesia; poverty distribution and trends; agricultural production and markets; agribusiness infrastructure; macroeconomic, policy and political economy affecting the agricultural sector; emerging trends and constraints in smallholder commercialisation; and recent major policy and/or regulatory considerations affecting agricultural development, especially in Eastern Indonesia.
Economic, social, agricultural and rural poverty context Indonesia’s 1.91 million square kilometres of land extends over 17,000 islands and it is the world’s fourth most populated nation, with 237.6 million inhabitants in 2010. The population grew at 1.49 percent per annum between 2000 and 2010 (BPS, 2012). The average population density in Indonesia in 2011 was 124 people per km2 (up from 107 people per km2 in 2010) with large variations between provinces. The average size of household in the country is 3.9 (BPS, 2012).
The adult literacy rate in Indonesia in 2010 was 92.91 percent. This was 95.35 for men and 90.52 for women (BPS, 2012), with important differences between provinces.
In Indonesia life expectancy at birth (largely an outcome of health and nutrition) has been increasing in recent years, but important differences persist between provinces and between urban and rural areas. In 2010, life expectancy in the country was 70.9 years, compared to 70.4 in 2007 (BPS, 2010).
Indonesia’s economy is well diversified and market-based, with a GNI per capita of US$3,005 in 2010 (BPS, 2011). Growth in GDP in 2011 is estimated at 6.46 percent and averaged around 5.8 percent (5.7 - 6.5 percent) per annum between 2005 and 2011 (BPS, 2011). In 2010, industry generated approximately 48 percent of GDP; agriculture around 15 percent, and services 37 percent. Manufacturing dominates exports, with oil and gas accounting for around 20 percent of exports in 2011 (BPS, 2011).
The share of the agricultural sector in the overall economy declined from 41 percent of GDP in 1970 to around 15 percent of GDP in 2011. However, agriculture still contributes significantly to Indonesia’s economic growth. For instance, it accounted for around 14 percent of GDP between 2007 and 2010 (BPS, 2012). It also employed 42.47 percent of the total work force in 2011 (BPS, 2012), making it the largest sector by employment in the economy.
Indonesian agricultural production is increasingly shifting away from food crops particularly towards horticulture and estate crop production. Nonetheless, the bulk of agricultural production in Indonesia remains in food crops (Rajah and McCulloch, 2012). This shift away from food crop production has been seen across all regions, leading to weak growth in food crops across Indonesia, particularly in Java and Eastern Indonesia, although Java still dominates national agricultural production.

Agribusiness Development Opportunities in Eastern Indonesia – Socio-Economic Review
8
The decrease in contribution from the food crops sub-sector to agriculture can be attributed to a number of factors, including limited land availability and poor land quality, deteriorating infrastructure, poor water management, inadequate knowledge sharing and training/extension services, poor post-harvest handling and processing, poor governance and rural institutional support, and inappropriate decentralisation policies.
Horticultural production, i.e. vegetable and fruits, has increased in recent years. However, product quality and its value-added processing still face many problems and need further improvements to meet client demand and to expand domestic and export market demand.
Such improvements are of high strategic priority as the vegetable and fruit consumption level in Indonesia is still lower than national dietary standards and FAO’s recommendation. Local products have difficulties competing in quality, diversity and/or price with imported products, especially in supplying medium/high-level income consumers and modern supermarkets (GOI, et.al., 2009).
Trade and market liberalisation has also encouraged diversification into higher-value export crops and government spending on agriculture services, irrigation, and research on specific high-value crops. Agricultural research investment in estate crops has been much higher than in food crops. Therefore, regions with estate crops have generally benefited from better government support to improvements in productivity.
By 2005, the largest land use category was estate crops (oil palm, cocoa, rubber, etc.). These products (including rubber, palm oil, shrimps, coffee, copra, cocoa and livestock) constituted 12 percent of total exports in 2006.
Agricultural value added per worker increased from about US$450 in 1970 to over US$700 in 2000 (1995 prices). However, nearly all the growth in productivity occurred between 1968 and 1992. By the mid-1990s, agricultural growth again relied almost entirely on bringing new land under cultivation (IFAD, 2007).
While actual potential yields will to some extent depend on the specific environmental conditions prevailing in each province, large gaps between high yield provinces and the rest suggest ample scope for raising Indonesia’s agricultural productivity. If yields across Indonesian provinces converge towards the yields found in the best performing provinces for each crop, large gains in agricultural productivity could be realized.
Although Indonesian agriculture has diversified away from food crops, overall food security has improved. The hunger index score2 for Indonesia has declined from a high of over 28 in 1981 to 13.2 in 2010 (IFPRI, 2010). According to Rada and Regmi (2010), if the current trends in food availability, agricultural trade, and economic development continue, the hunger index is expected to decline below 2 by 2020.
The total calorie share of starchy roots—a low-value product—has been consistently replaced by high-value foods, such as vegetable oils, meats, fish/seafood, and fruits and vegetables. Indonesians are also increasingly purchasing packaged food with some value added, rather than purchasing unprocessed products from local wet markets. In 1998, less than 22 percent of packaged food was sold in standardized retail outlets, such as supermarkets, hypermarkets, and discount and convenience stores, rather than in independent corner “mom-and-pop” stores. In 2008, over 34 percent of sales were through standardized stores (Rada and Regmi (2010).
2 The hunger index is an equally weighted index of three measures: the proportion of undernourished population as a percentage of the total population; the prevalence of underweight children under the age of 5; and the under-5 mortality rate (IFPRI, 2010).

Agribusiness Development Opportunities in Eastern Indonesia – Socio-Economic Review
9
Indonesia’s agricultural exports have focused primarily on tropical perennial products in which it has comparative advantage, whereas its imports have included feed for its growing poultry sector (in response to greater consumer demand for meat) and food for its citizens.
Indonesia’s agricultural export value has grown on average almost 9 percent annually, from a base of nearly $900 million in 1975 to nearly $20 billion in 2009 (FAO, 2011). Growth has been driven by increases in tropical perennial crops, such as rubber, cocoa, coffee, and palm oil.
Despite growth in agricultural production, population and income growth have contributed to Indonesia’s agricultural import increases. The value of agricultural imports grew from over $650 million in 1975 to nearly $7 billion in 2009, an 8 percent average annual increase (FAO, 2011).
According to Rada and Regmi (2010) the emphasis of Indonesia’s agricultural policy has shifted from self-sufficiency on food (rice) towards an industrial export-oriented development strategy, since the mid-1980s, and trade liberalisation and a sharp currency devaluation after the Asian financial crisis of 1997 have increased the incentive of producers to focus on tropical perennial crops.
Rada and Regmi (2010) also suggest that research investments have benefited Indonesian agricultural development. Agricultural technology growth between 1985 and 2005 varied across subsectors, being greatest in perennial (export) crops (2.20 percent), followed by livestock (1.70 percent), and least in annual (food) crops (0.67 percent). This analysis suggests that policy reforms and currency devaluation created incentives for increased agricultural trade and generated growth in agricultural productivity. Furthermore, Rada et al. (2010) indicate that technology growth was driven more from private and other non-government sources than from public agricultural research investments.
Poor infrastructure remains an obstacle for rural development in Indonesia. There has been substantial progress in narrowing the gap in access to roads, water, and reliable lighting in the country. Despite this progress, considerable disparities remain between urban and rural sectors, and between rich and poor within each sector. Poor infrastructure in terms of rural roads and irrigation systems are binding constraints to rural development and geographical disadvantages can only be alleviated by the provision of adequate infrastructure.
Geographical isolation will contribute to rural inequality, and less connected localities will have less access to sources of income (inputs, knowledge, markets) and will experience lower rates of growth.
Commercial banks, with a few exceptions, have largely been uninterested in providing finance to agriculture, agribusiness or rural SMEs, and trade-related money flows and trade-related financial products remain weak or non-existent.
In the absence of sufficient formal credit, finance may come either from within the sector itself, through advances between businesses, often in the form of inputs or product, or from financial service providers, ranging from moneylenders to MFIs, and to banks. Financial service providers have funding resources, but may not understand sectors well, and are constrained by legal frameworks and collateral issues. An objective of increasing access to finance to the value chains is to leverage the value chain relationships so that financial service providers can benefit from the advantages that value chain players have in extending credit to each other.
Poverty in Indonesia has been falling both in terms of the poverty rate and total numbers of the poor for the last few decades (See Table 6). Official figures show that poverty in Indonesia fell substantially from about 40 percent in 1976 to 11 percent in 1996 (ADB, 2009). The 1997-98 crisis pushed the poverty rate back up significantly. However, the return of robust economic growth since

Agribusiness Development Opportunities in Eastern Indonesia – Socio-Economic Review
10
2002, amid political and macroeconomic stability, has seen poverty reduction in Indonesia resume (Rajah and McCulloch, 2012).
In 2011 the official poverty rate stood at 12.5 percent, having come down from 23.4 percent in 1999. This means that the total number of the poor in Indonesia fell from 48 million in 2005 to about 30 million in 2011 (BPS, 2011). Despite the rapid urbanisation and the significant structural transformation of the Indonesian economy, the majority of the poor remain rural. They still primarily work in agriculture and derive the majority of their income from agriculture.
Poverty rates have fallen particularly sharply in Eastern Indonesia, Kalimantan and Java. However, the geographic distribution of the poor remains largely unchanged. Java is still home to 56 percent of the poor, including 67 percent of the urban poor and 50 percent of the rural poor in the country (Rajah and McCulloch, 2012).
Eight provinces saw double-digit percentage point reductions in rural poverty rates over the period 1999 to 2005. These were Jambi, East Kalimantan, West Kalimantan, Nusa Tenggara Barat (NTB), Nusa Tenggara Timor (NTT), Maluku and Papua. Of these, only two provinces (NTB and NTT) were able to achieve this without also recording strong growth in the quantity of agricultural production, thus growth in the quantity of agricultural production has been closely associated with reductions in rural poverty across provinces (Rajah and McCulloch 2012).
Rajah and McCulloch (2012) report that 63 percent of poor Indonesian workers were engaged in the agriculture sector in 2008. The importance of agriculture is even more pronounced amongst poor rural workers, of which 75 percent were primarily engaged in agriculture. Trading and industry contributed a further 15 percent of employment for poor rural workers.
Agriculture is therefore an important source of income for the poorest Indonesian households and remains important, although less so, for the near-poor. However agriculture is likely to be even more important as a source of income for poor households in rural areas. However, available data on the sources of income for poor households is less accessible and comprehensive.
Further evidence shows that both agricultural and non-agricultural sources of income are important for rural households in Indonesia, both poor and non-poor. For instance, agricultural income contributed 43 percent of rural households’ income in 2002, with about 35 percent coming from self-employment and about 9 percent coming from wages. By contrast, non-agricultural sources provided about 43 percent of rural households’ income, with 21 percent coming from self-employment and 22 percent coming from wages (Rajah and McCulloch, 2012).
Available data shows that around 50 percent of farm income for rural households came from food crops in 2002. Estate crops provide about one-third of farm income for rural households. However, food crops appear to be more important for poor rural households compared to non-poor households. The pattern of income sources for rural Indonesian households has been remarkably stable over time. The largest change was by a sharp jump in the income share of estate crops in household income (Rajah and McCulloch, 2012).
For poor agricultural workers, achieving productivity gains while remaining in agriculture has been the principal means of exiting poverty. It has also been shown that moving from rural agriculture to the rural non-farm economy is important. By contrast, rural-urban migration appears to play a relatively small role in explaining exits from poverty amongst poor rural agricultural workers. While the majority of the poor remain in rural agriculture, remaining in rural agriculture has also been the principal means of exiting poverty in Indonesia.
Women’s participation in agricultural production in Indonesia is high, particularly in rice production where 75 percent of farm labour is provided by women (FAO, 2002). Despite women’s considerable participation in the agricultural workforce they continue to be largely unrecognised as

Agribusiness Development Opportunities in Eastern Indonesia – Socio-Economic Review
11
farmers, fishers, or livestock producers. As a result their work is invisible and they do not have control or power over essential decision making such as resources for production. They have little access to productivity producing inputs such as credit, fertilizer and extension opportunities. They also lack control over their produce (FAO, 2011).
Women have a major responsibility for farm management but little access to training because customarily male heads of households are invited to training sessions (FAO, 2004). Additionally in rural areas women’s literacy rates are below those for men and further limit their access to agricultural learning opportunities (BPS, 2012).
The civil code in Indonesia impedes women from entering into contracts on their own behalf, requiring that husbands, by their presence or permission, assist women in formalising contracts. As a result, married women find it difficult to engage in formal financial activities such as accessing micro credit or opening a bank account. Furthermore under Indonesian tax regulation women are not entitled to separate tax numbers, presenting a further obstacle to individual formal agricultural business activities (ADB, 2006).
Female-headed households are particularly vulnerable to fluctuations in household incomes. As a result, women who are the sole income generators are more likely to accept lower rates of income as a trade-off for reliability of their income stream. In Indonesia, more rural female-headed households work than their urban counterparts. NTT has the highest rate of working rural female heads of households, which could identify them as candidates for targeted commodity selection (such as home gardens with fruits and vegetables, or livestock that does not require them to be far from the household, i.e. chickens), allowing them to stay close to home to accommodate their domestic work burdens.
Nusa Tenggara Timur NTT has enjoyed substantial growth along with significant improvement in indicators of social development and poverty reduction over the last decade, although illiteracy and the incidence of poverty remain high, particularly in rural areas. Over the period 2004–2010, poverty rates fell from 27.86 to 20.48 percent. Furthermore, when the number of near poor is also taken into account, the number of people living under vulnerability increases considerably. There is also a relatively high variation in poverty between people living in urban and rural areas in NTT, with rural areas being substantially poorer. Almost half of households (575,943) in the province are poor.
NTT has a relatively small economy compared to other provinces in Indonesia and it is largely an agricultural province where large proportions of the population depend on agriculture for a living. Of the 2,061,229 people reported to be working in the province in 2010, 65 percent work in agriculture. Between 2000 and 2008, the share of agriculture in the provincial economy declined sharply, leading the trend for nearly all other sectors, shifting mainly to services, which increased by 7 percent. In NTT this likely reflects migration out of agriculture due to productivity at or below subsistence, and into services.
The average (per capita) income in the province has risen dramatically in recent years, from Rp 3,658,383 in 2006, to Rp 5,515,943 in 2010 (an increase of 50.8 percent). However, this is still considerably lower than the national average (per capita) income of Rp 23,975,197.
The food crop sub-sector of the agricultural sector is the largest contributor (21 percent) to RGDP in NTT, followed by livestock (10.6 percent), fisheries (4.3 percent), and estate crops (4.3 percent). Maize is considered by the Provincial Government the most important food crop, followed by rice, mung beans and peanuts. Despite their high production levels, cassava and sweet potato remain out of the government’s priority commodity list – both are regarded as an alternative buffer for local

Agribusiness Development Opportunities in Eastern Indonesia – Socio-Economic Review
12
food stuff needs. Moreover, there is no established market for them due to the absence of food processing industries in NTT (SADI, 2010).
Most trade that takes place in NTT involves agricultural products, which are predominantly traded in small regional markets and onto larger markets in the main centres.
The main agricultural products exported to other regions include cashew nuts, coffee, candlenut, seaweed, tamarind and cattle, most of which have relatively low added value, and are destined for Surabaya and to a lesser extent to South Sulawesi and Bali (ADB, 2009). Exports from NTT to other countries totalled only US$17.4 million in 2005 (Barlow and Gondowarsito, 2007). Most products (agricultural, natural resources – especially manganese) from NTT are exported to Australia and other Asian countries. NTT has also been a traditional exporter of seaweed and fish to China and Japan, although in 2008 the export volume for both these commodities dropped significantly (SADI 2010).
There are a number of important constraints to agricultural and rural development in NTT province. At the social and cultural level there is a focus on subsistence farming, limited trust and implementation of the rule of law (theft of crops), and high levels of illiteracy (Cervantes-Godoy and Dewbre 2010). There are also important gender inequalities due to traditional beliefs, a low status for agriculture and an increasing interest in other more profitable sectors.
Farmers are still regarded as having limited (modern) agricultural knowledge partly resulting from lack of access to formal education and vocational training for farmers, and a limited number of extension workers operating in the province. In 2010, NTT had a total of 1,392 agricultural extension workers, most of which (1,096) were men. Furthermore, farmers lack incentives (and support) to invest in practical technologies, which can improve quality and quantity of production.
Productivity levels for most commodities are still below the national average due to pests, crop age, poor soil fertility, and climatic problems. Productivity is further impacted by poor irrigation infrastructure; even when infrastructure does exist, it is mostly poorly maintained.
Physical infrastructure, such as roads, ports, and rural utilities (i.e. electricity, sanitation and safe water) is also limited, complicating access to retail markets where prices tend to be better.
In terms of marketing, there are weak links between different value chain actors, farmers have limited access to market information, there is a limited infrastructure to store, process, handle and transport products, and there is generally limited product certification. A reported lack of processing industries and large traders also limit market opportunities for small farmers.
Access to credit for farmers in NTT is limited due to the perceived high risk and lack of financial instruments to help farmer’s access money. Only 1.3 percent of credit from the government and 1.4 percent of credit from private banks goes to the agricultural sector. There are also problems with land rights and titling, which creates obstacles for access to credit and undermines and discourages investment.
West Nusa Tenggara NTB has enjoyed substantial growth along with significant improvement in indicators of social development and poverty reduction over the last decade. In recent years, equity in access to education has improved, although completion rates are still low and gender disparities in access to education and completion persist. Literacy rates have improved, but at 81.05 percent are still lower than national rates.
While poverty rates in NTB have declined from 28.1 percent of the population in 2000 to 21.6 percent in 2010, the incidence of poverty remains high, particularly in rural areas. When the

Agribusiness Development Opportunities in Eastern Indonesia – Socio-Economic Review
13
number of near poor is taken into account, the number of people living under vulnerability increases considerably to almost 60 percent.
The economy of NTB is dominated by the mining and quarrying sector, which contributes 36.3 percent of GDP. Second to this is the agricultural sector with a contribution of 19.9 percent of GDP. Industry accounts for only 5 percent of GDP. The growth of the economy of NTB province in 2010 was estimated at 6.3 percent (SADI, 2010).
Agriculture is clearly important to the economy of NTB. It is a major production sector, the largest employer, and the sector that the poor rely on most for subsistence. Over 47 percent of the population over the age of 15 works in agriculture, thus making it the largest employment sector in the province.
The NTB government’s strategy to develop agriculture is to support the cultivation of rice as the principal commodity, and focus on three other commodities throughout the province, namely cattle, maize and seaweed (SADI 2010). However, productivity levels for most commodities in the province are still below the national average.
Of the 1,106,599 ha of potential agricultural area in NTB, only around half (497,893 ha) is used for agricultural purposes (SADI, 2011), suggesting an opportunity for expansion of farming activities. The average size of plots is 0.52 ha.
Most trade that takes place in NTB involves agricultural products, which are predominantly traded in small regional markets and onto larger markets in the main centres.
The main agricultural commodities exported by NTB are maize and cashews, according to SADI (2011). While maize is mainly marketed to Bali and East Java, some is also exported to Malaysia. In 2007, 3,000 tons of maize was exported to Malaysia from NTB. Prices fluctuate between 1,700 and 2,800/kg dry grain. SADI (2011) also reports that cashews are exported to India and Vietnam (for further processing), and to China (without information on volumes and/or values).
As in other provinces in Indonesia, the irrigation infrastructure in NTB is poor and has been poorly maintained. The physical infrastructure, such as roads, ports, and rural utilities (i.e. electricity, sanitation and safe water) is also limited, complicating access to retail markets where prices tend to be better. For instance, only 45.6 percent or roads are considered to be in good condition.
The processing industry needed to support the agricultural sector has been showing good performance, although agro-industries – important in an economy dominated by agricultural employment – are still a very small component of the agricultural sector. There are a reported 208 branches of commercial banks and 112 branches of the rural bank scattered around NTB province. There are also 3,551 reported cooperatives operating in the province as well as 17 micro finance institutions. It is estimated that among these financial institutions they have provided credit for up to Rp 9.5 billion. However, it is unclear as to how much of this credit has been allocated to the agricultural sector and how.
East Java East Java has made important improvements in social and economic development in recent years, however it still lags behind in a number of key social and economic indicators. East Java ranks relatively low in most education attainment indicators compared to other provinces in Java and the national average. In 2008 the adult literacy rate of men and women in East Java was 92 percent and 83 percent, respectively, both lower than the national level of 95 percent and 89 percent.
Although East Java has almost universal access to primary education, access to secondary education is still low and a challenge for many districts. In 2009, the net enrollment rate in East

Agribusiness Development Opportunities in Eastern Indonesia – Socio-Economic Review
14
Java was 95 percent for primary level, 70 percent for junior secondary, and 48 percent for senior secondary level.
East Java has the largest number of people living in poverty in Indonesia (BPS, 201). In 2011, the poverty rate was 13.9 percent, ranking among the top ten poorest provinces in Indonesia, above the national poverty rate of 12.4 percent (BPS, 2012). In absolute terms, this figure represents about 5.2 million people in East Java who live below the poverty line, higher than any other province in Indonesia. Nevertheless, the poverty rate in East Java declined from 23 percent in 2000 to 17 percent in 2009 to the current 14 percent in 2011.
Poverty in East Java is a largely rural phenomenon. During the last decade, the poverty rate in rural areas has been consistently higher than in urban areas and the ratio of rural to urban poor was 1.7 in 2009. When the number of vulnerable people is considered, the near poor—defined here as the number of people under the official poverty line multiplied by a factor of 1.5—cause the rates of poverty in East Java to increase considerably to more than 50 percent.
East Java is the second largest contributor to Indonesia’s economy. The largest contributor to the RGDP in East Java at current prices in 2010 were the trade, hotel and restaurant sector with 29.5 percent, followed by the manufacturing industry sector with 27.5 percent, and the agricultural sector with 15.8 percent. Economic growth in East Java in the last three years has been of 5.9 percent (2008), 5 percent (2009), and 6.7 percent (2010) (BPS, 2012).
There has been very little change to the economic structure of the province in the last decade and growth in agriculture and industry has been slow. Economic growth suffered a major set-back due to the Asian financial crisis in 1997. Despite this, the average annual income per capita of Rp 8.2 million (in 2008) has remained the second highest in Java and among the top ten in the country (World Bank, 2011).
Agriculture takes up about 74 percent of the land in East Java and there is limited opportunity to expand beyond this (World Bank, 2011). There is also a low land-labour ratio with too many farmers working the limited available land, resulting in a large number of smallholdings, with an average 0.4 ha per household with slight variations between districts (World Bank, 2011). Such relatively small plots are thus mainly focused on subsistence farming, with limited surplus produce for sale. Ninety percent of farmers who sell their products often face low prices and high production costs.
A recent report by the World Bank (2011) suggests that improvement in land to farmer ratio can only happen if the numbers of farmers are reduced by helping them move out to other non-farming employment. Interventions to achieve this may want to focus on facilitating diversification into higher value-added agriculture products such as horticulture, livestock breeding and organic farming; improving the skills through extension services and non-formal trainings; and providing greater access to credit (World Bank, 2011).
The majority of agriculture employment in East Java consists of unskilled labour. In 2009, 94 percent of labour in the agricultural sector was unskilled (World Bank, 2011).
East Java has a total of 907,374 ha of irrigation, divided between small-scale irrigation within the district, inter-district irrigation and inter-province irrigation.
The province suffers from poor transport infrastructure. Overall, district roads remain in a worse condition than provincial or national roads, affecting farmers and many smaller rural businesses. Poor roads are a significant obstacle to the integration of producers to large wholesale and retail markets, where they can fetch better prices than at local village markets or from collectors. The state of the infrastructure and transport links influences both the cost and length of time needed for transportation, thus directly affecting profitability and competitiveness.
Agribusiness Development Opportunities in Eastern Indonesia – Socio-Economic Review
15
East Java’s ratio of credit to GDP is relatively low compared to other large provinces in Indonesia. At 19 percent of its GDP, credit in East Java is lower than the national average of 31 percent. Agriculture is still deemed as a risky investment sector by banks (94.7 percent of farmers never obtain credit). The share of credit allocated to the agriculture sector remains low at only 4 percent for the last three years. The low proportion of credit allocated to the agriculture sector is similar with trends in other provinces. The default risk in agriculture is perceived as high.
Conclusion Indonesia is still a youthful country, with more than 70 percent of its population under the age of 40. It is also a country growing at a relatively low rate of 1.49 percent per year, with average annual growth rates in rural areas only 0.77 percent over the last decade (UNDP, 2012). Despite important improvements in education, a large proportion of Indonesia’s population is unskilled. Addressing this problem will require sustanined efforts from the public and private sector in education and training. Furthermore, while gender gaps in primary and secondary education are beginning to close, women tend to receive less further education and vocational skills training, which prevents them from pursuing their own livelihoods. Women are also less likely than men to be reached by extension services to be able to increase the resilience of agricultural livelihoods.
Low levels of productivity are causing migration out of agriculture due to productivity at or below subsistence and into services or government employment. In some cases, this is highly gender-biased. However, overall rural to urban migration appears to play a relatively small role in explaining exits from poverty amongst poor rural agricultural workers. While the majority of the poor remain in rural agriculture, remaining in rural agriculture has also been the principal means of exiting poverty in Indonesia (Rajah and McCulloch, 2012).
Agriculture is increasingly consuming most of the land in some parts of the country, most notably in East Java, and soon there will be limited opportunity to expand beyond this. As more and more farmers work the limited available land, this will result in a larger number of smallholdings. Such relatively small plots, which are mainly focused on subsistence farming, have limited surplus produce for sale. These types of farmers who sell their products often face low prices and high production costs. Increasing production will depend more on increasing productivity and making better use of existing resources, which will only come about with better agricultural techniques, acquired through training and education.
Typically, non-farm activities are a way out of poverty. However, there seems to be very limited available and reliable information in this area, which therefore warrants further study. It is important to note, nonetheless, that adequate infrastructure is key for the development of non-farm activities, mainly rural SMEs. Reliable rural roads help rural populations access key services, including education and health, and improve opportunities for non-farm income generating activities. However, the infrastructure in Indonesia—including the three provinces under study—is limited and poor, especially in rural areas. The poor state of much infrastructure limits the potential of individuals to access social services, such as schools and hospitals, and develop business opportunities. This also includes access to clean water, electricity and irrigation systems. Improving the populations’ access to social services and better infrastructure will be key in poverty alleviation efforts.
The transportation infrastructure in Indonesia is also generally limited. The preferred method of transporting goods within and between islands in the selected provinces is trucks and ferries. When public transport is weak and receives relatively little investment, many families and individuals are tempted to buy (cheap) cars or motos. The rise in the number of private vehicles in Indonesia has been accompanied by a significant expansion in (poor quality) road networks, while rail networks in contrast have seen decreases. However, the quality of roads remains generally

Agribusiness Development Opportunities in Eastern Indonesia – Socio-Economic Review
16
poor, particularly in rural areas, affecting the poorer families more. At the provincial level, this presents a stark picture. Few quality roads and the resultant high numbers of impassable roads, makes access to farm lands and markets difficult.
While overall poverty levels in Indonesia, and the three provinces under study, have decreased, the geographic distribution of the poor remains largely unchanged. The majority remain in rural areas, where around half the country’s population lives, still primarily working in agriculture and deriving the majority of their income from agriculture, despite the rapid urbanisation and significant structural transformation of the Indonesian economy.
Addressing poverty through smallholder commercialization is a big challenge as there are a number of determinants in commercializing smallholder agriculture. Consideration has to be given to both the input and output sides of production, together with the decision-making behaviour of farm households in production and marketing simultaneously. Production decisions of commercialized farmers are based on market signals and comparative advantages, whereas those of subsistence farmers are based on production feasibility and subsistence requirements, and selling only whatever surplus product is left after household consumption requirements are met (Jaleta, Gebremedhin et al. 2009).
Perceived financial and labour risks compel subsistence farmers to stick to the self-sufficiency objectives both in their production and consumption decisions. Furthermore, market and price fluctuations make market-oriented resource-allocation decisions of semi-subsistence farmers difficult, as cash income is increasingly important to guarantee household food security. Policy measures and focused interventions can play an important role in mitigating these risks. This can include improving the links between farmers and input sellers and buyers, to facilitating farmers’ access to information and/or credit in kind.
Whether smallholder commercialization creates more employment opportunities depends on the nature of the commodities grown, the technologies used in the production process, and whether additional agricultural processing is involved. This review has found however, that for most food and estate crops the processing capability is limited.
Increasing market participation has a positive impact on value chain actors such as input suppliers, output traders, transporters, processors, financiers and others. These actors may change the forms of products via processing, storing or transporting from one point to another based on market demands.
The drive towards a higher level of commercialisation consistent with broad-based growth and increasing farmer incomes depends on several factors, including effective institutions; improved infrastructure; knowledge management; adequate incentives; stakeholder’s initiative; and finally, a conducive environment.
Institutions, both formal and informal, have an important impact on the economic performance of different sectors and in the facilitation or hindrance of a smallholder commercialization process. Values, norms, sanctions, taboos, cultures and traditions also strongly influence smallholder production and marketing decisions, including those related to input use. Socio-cultural and religious factors determine consumption preferences of households, which can be a motivating or demotivating factor for household commercialization (Jaleta, Gebremedhin et al. 2009).
Factors facilitating commercialization are mechanisms which will reduce transaction costs arising from activities such as exchange of goods and financial assets; enforcement of contracts; risk reduction; formation of organizations; and the acquisition and dissemination of information. Other important factors in increasing farm family incomes and agricultural commercialization include markets; contracts; farmer organizations and trade associations; standards; the formalisation of

Agribusiness Development Opportunities in Eastern Indonesia – Socio-Economic Review
17
business transactions; monitoring and evaluation; research and extension; and credit and insurance.
Improved infrastructure facilitates the movement of commodities, people and information, enhancing both the process of finding new commercial opportunities and the gains from price difference over space and over time. Lower transportation and marketing costs contribute to increased demand resulting in larger volumes of production and smaller margins between farmer and consumer prices. The building of new infrastructure and the rehabilitation and proper maintenance of existing infrastructure are both essential (Purcell, Gent et al. 2008).
Finally, for commercialization to thrive there has to be cooperation among different stakeholders (in order to gain from improved access to technology, credit and markets) and the will to innovate (in order to stay abreast of competition from domestic and international markets). However, cooperation and innovation will not occur unless there are appropriate incentives and policies in place (Purcell, Gent et al. 2008).
As this review highlights, there are important data gaps among the three selected provinces, which is further accentuated at the district level. Whilst this may impede a clear assessment of the preferred commodities to select for this study, it provides clear guidance as to where further research needs to be done and areas where the upcoming value chain studies can contribute to data collection. This includes information on prices and the creation of value along the value chain; existing wholesale and retail markets at the district and provincial level; processors and processing facilities; the state of irrigation at the district level; the role of collectors and traders in marketing; and the different sources of income of poorer households in different districts and the proportion of each source of income to the total income.

Agribusiness Development Opportunities in Eastern Indonesia – Socio-Economic Review
18
1 Introduction In 2011 the Australian Government’s Department of Foreign Affairs and Trade (DFAT) invested in a significant project - Analysing Agribusiness Development Opportunities in Eastern Indonesia (EI-ADO). The aim of EI-ADO is to identify agricultural commodity value chains and private sector agribusiness development opportunities with the most potential to increase incomes of poor men and women (not just farmers) in East Nusa Tenggara (NTT), West Nusa Tenggara (NTB) and East Java. The outcomes of this work will be the focus of a new DFAT program: Australia Indonesia Partnership for Decentralisation – Rural Economic Program (AIPD-Rural).
AIPD-Rural has the goal of increasing income of more than one million poor male and female farmers in Eastern Indonesia by 30 percent in a period of ten years. In particular AIPD-Rural supports efforts to increase value chain competitiveness through better farm practices, better access to input and output markets and an enhanced business enabling environment for agribusiness.
The EI-ADO project is being implemented through ACIAR and comprises a number of short research activities undertaken in 2012 and early 2013 to inform the AIPD-Rural program. These studies will provide a better understanding of the rural sector, market actors, potential lead commodities, ease of doing business (including local regulation/policy), infrastructure that support the agricultural sector, access to finance and district profile.
The main purpose of this socio-economic review is to inform the selection of five value chains for further study in the 12 pre-selected districts. In Phase 2 of the EI-ADO project, five commodity value chain analyses will be conducted across the three selected provinces. This work will analyse and identify agribusiness development constraints and opportunities for the lead commodities identified in Phase 1.
This socio-economic overview focuses on the provinces of Nusa Tenggara Timur (NTT), West Nusa Tenggara (NTB) and East Java (EJ), and in four districts within each province, selected by ACIAR as potential districts where to focus work on poverty alleviation. The review provides a summary of the social and economic characteristics, issues and trends in each province.
The key research questions addressed in this socio-economic review are:
• Which agribusiness commodity chains have the most potential for improving incomes of poor farmers in NTT, NTB and East Java?
• What are the main agricultural products and markets, their production characteristics, issues, trends, geographic distribution and relative value and the importance of different sectors?
• What is the current state, locations and effectiveness of important agribusiness infrastructure such as roads, ports and processing, wholesale and retail markets, plants and facilities?
• What is the state of poverty, distribution and trends and what potential is there for poverty alleviation through smallholder commercialisation? How?
• What demographic trends are occurring and how will they impact poverty reduction and agribusiness value chain growth efforts? How can non-farm enterprises and urban migration influence attempts at productivity growth and poverty alleviation of the rural poor?
• What macroeconomic, policy and political economy factors affect agricultural sectors and how do they affect access of poor farmers to markets?

Agribusiness Development Opportunities in Eastern Indonesia – Socio-Economic Review
19
• What emerging trends and constraints are affecting smallholder attempts at commercialisation and increased competitiveness in value chains?
This socio-economic overview provides a description of:
• Agricultural production and markets: current situation, issues, trends, location and relative importance of different sectors.
• Agribusiness infrastructure: location and effectiveness of important roads, ports and processing, wholesale and retail markets, input and technology providers, plants and facilities.
• Poverty: distribution, trends and the potential for poverty alleviation through smallholder commercialisation.
• Demographic trends: trends, issues and impact on poverty reduction and agribusiness value chain growth. The role of non-farm enterprises and urban migration to determine to what extent those factors can facilitate productivity growth and poverty alleviation of the rural poor should also be considered.
• Macroeconomic, policy and political economy: affecting agriculture sectors and how they affect access of poor farmers to markets.
• Smallholder commercialisation: emerging trends and constraints affecting smallholder commercialisation.
• Recent major policy and/or regulatory considerations affecting agricultural development, especially in Eastern Indonesia.
The outline of the report is as follows: Section 2 briefly describes the methodology used to gather information for this review; Section 3 presents a review of the socio-economic characteristics of Indonesia, with a brief introduction to the three provinces that are the main focus of this project, namely NTT, NTB and East Java. Section 4 presents socio-economic data of the three provinces under study along with specific data to each of the four districts selected in each of the aforementioned provinces. Section 5 concludes this review.

Agribusiness Development Opportunities in Eastern Indonesia – Socio-Economic Review
20
2 Methodology This socio-economic review is based on data from secondary sources and information gathered through consultations with key informants.
The data was collected through the engagement of researchers at the local level and the main source of statistical data used is the Bureau of Statistics, the Province in Figures annual reports compiled by local government and key donor reports that have been identified. However, as can be expected there are gaps in the available data that limit the potential for analysis. These information gaps mainly relate to specific information on:
• Markets – number and location of main and secondary markets in each province and district, as well as average distance to markets.
• Prices of main commodities – trends and changes in prices overtime of the main agricultural commodities in different regions/provinces/districts.
• Sources of income – main sources of income of poorer households in different regions/provinces/districts.
• Number of farmers growing each commodity – detailed data on the number of households growing each agricultural commodity.
• Irrigation – number of irrigated hectares and how they are managed.
Addressing these informantion gaps requires further research, particularparticularly fieldwork, and it is expected that the following phase of this project will be able to gather some of this information.

Agribusiness Development Opportunities in Eastern Indonesia – Socio-Economic Review
21
3 Economic, Social, Agricultural and Rural Poverty Context Indonesia’s 1.91 million square kilometres of land extends over 17,000 islands, of which 6,000 are inhabited. Indonesia is the world’s fourth most populated nation, with 237.6 million inhabitants in 2010. The population grew at 1.49 percent per year between 2000 and 2010 (BPS, 2012). In 2005, 48 percent of the population lived in urban areas.
In 2010, there were 35,299,150 boys and 33,304,383 girls under the age of 15 in Indonesia, with 78,969,160 men and 78,083,952 women between 15 and 64 years old, and 5,362,873 men and 6,622,078 women older than 64 years old.
The average population density in Indonesia was 124 people per km2 (up from 107 people per km2 in 2010) with large variations between provinces. The average size of households in the country is 3.9 (BPS, 2012) (See Table 1).
Table 1: Population, growth rate, population density and average household size in Indonesia (2010)
Population (thousands) Growth Rate Population
Density
Number of Households
(millions) Avg household
size
NTT 4,683.30 2.07 96 1.01 4.6 NTB 4,500.20 1.17 242 1.25 3.6 East Java 37,476.80 0.76 784 10.38 3.3 Indonesia 237,641.30 1.49 124 61.16 3.9
Source: BPS, 2012
3.1 Education The adult literacy rate in Indonesia in 2010 was 92.91 percent. This was 95.35 for men and 90.52 for women (BPS, 2012), with important differences between provinces. This indicates that there is still unequal access to education for men and women (See Table 2), although this is decreasing in most provinces.
Table 2: Adult literacy rate by province and sex (percent) (2010)
Male Female Total NTT 90.76 86.56 88.59 NTB 85.94 76.74 81.05 East Java 92.77 84.16 88.34 Indonesia 95.35 90.52 92.91
Source: BPS, 2012
In 2010, the school enrollment ratio for 7 to 12 year olds was 98.02 percent, 86.24 percent for 13 to 15 years old, dropping to 56.01 percent for 16 to 18 year olds (BPS, 2012). Again, there are important differences in school enrollment rations between provinces and between boys and girls.
3.2 Health services In 2007, Indonesia had 1,319 hospitals with 122,295 beds and 8,234 community centers (puskemas). This means that each puskemas served on average 27,404 people. In the same year, there were about 11,810 doctors in the country, each doctor serving an avarage of 19,106 people. The capital city Jakarta and other provincial capitals excluded the number of people served by each health centre and doctor would be much higher. This would range from 8,194 people per puskemas in Papua province to 53,352 in Banten province. Equally, the number of people served per doctor would vary from 6,572 people in Benkulu province to 37,199 people per doctor in Maluku province (DKP and WFP, 2009).

Agribusiness Development Opportunities in Eastern Indonesia – Socio-Economic Review
22
In 2007, 94 percent of households had a health facility within 5 kms from their household/village. However, this also has important variations between provinces. For instance, in several provinces, namely Kalimantan Barat, Sulawesi Barat, NTT, Papua, NAD, Maluku and Sulawesi Tenggara, only 90 percent of households had a health facility within 5 km from their house (DKP and WFP, 2009).
In 2010, only 44 percent of households in Indonesia had access to clean water as a source of drinking water. The provinces with the poorest access to drinking water were Banten (22.32 percent), Kepulauan Riau (23.82 percent) and Bengkulu with only 23.82 households with access to drinking water (BPS, 2012).
In Indonesia life expectancy at birth (largely an outcome of health and nutrition) has been increasing in recent years, but important differences persist between provinces and between urban and rural areas. In 2010, life expectancy in the country was 70.9 years, compared to 70.4 in 2007 (BPS, 2010), while the Food Security and Vulnerability Atlas of Indonesia (2009) reported that life expectancy in 2007 was 68 years (DKP and WFP, 2009).
3.3 Economy Indonesia’s economy is well diversified and market-based, with a GNI per capita of US$3,005 in 2010 (BPS, 2011). Growth in GDP in 2011 is estimated at 6.46 percent and averaged around 5.8 percent (5.7 - 6.5 percent) per annum between 2005 and 2011 (BPS, 2011).
In 2010, industry generated approximately 48 percent of GDP; agriculture around 15 percent, and services 37 percent. Manufacturing dominates exports, with oil and gas accounting for around 20 percent of exports in 2011 (BPS, 2011).
Although the Indonesian agricultural sector has continued to grow, its share in the overall economy declined from 41 percent of GDP in 1970 to around 15 percent of GDP in 2011. However, agriculture still contributes significantly to Indonesia’s economic growth. For instance, it accounted for around 14 percent of GDP between 2007 and 2010 (BPS, 2012). It also employed 43 percent of the total work force in 2006, 43.03 percent in 2009 and 42.47 percent in 2011 (BPS, 2012), making it the largest sector by employment in the economy. These figures also reflect the relatively low agricultural labour productivity in the country.
The major significant shift in the agricultural sector in Indonesia in recent years has been in the reduction of food crops contribution to the sector from 61 percent to 49.4 percent between 1970 and 2007 (a decrease of 19 percent), and the increase in fisheries from 9 percent to 16.1 percent (an increase of 79 percent), and in livestock from 6 percent to 12.7 percent (an increase of 112 percent) over the same period (IFAD, 2008).
The share of the value of agricultural production derived from food crops fell dramatically since the late 1980s and especially between 1999 and 2005. Growth in the quantity of food crop production has lagged growth in other agricultural commodities, especially in the 1999-2005 period, growing by only 0.5 percent on an annual basis (Rajah and McCulloch, 2012).
After contracting during the pre-crisis period, horticulture led agricultural growth, growing annually by some 12.4 percent per year between 1999 and 2005. Estate crops also recorded significant annual growth of 4.5 percent between 1985 and 1998 and accelerating further to 6.6 percent over 1998 to 2005. The result is that the pattern of Indonesian agricultural production has increasingly shifted away from food crops and particularly towards horticulture and estate crop production. Nonetheless, the bulk of agricultural production in Indonesia remains in food crops (Rajah and McCulloch, 2012).

Agribusiness Development Opportunities in Eastern Indonesia – Socio-Economic Review
23
The decrease in contribution from the food crops sub-sector to agriculture can be attributed to a number of factors, including limited land availability and poor land quality. The last Agricultural Census (2003) found that between 1983 and 2003, agricultural land declined and the average land-holding per farmer narrowed from 1.3 hectares (ha) to 0.7 ha per farmer3. Other constraints to food crop production include deteriorating infrastructure, poor water management, inadequate knowledge sharing and training/extension services, poor post-harvest handling and processing, poor governance and rural institutional support and inappropriate decentralisation policies (GOI, et.al., 2009).
The shift away from food crop production has been seen across all regions. Food crop growth has been weak in all regions and has been particularly weak in Java and Eastern Indonesia, although Java still dominates national agricultural production. In particular, Java produces over 50 percent of the food crops (and 55 percent of rice) produced in Indonesia.
However, Java experienced a growth in the quantity of food crop production of only 0.3 percent on an annual basis between 1999 and 2005. Eastern Indonesia saw the quantity of food crop production contract by 0.5 percent on average each year over the same period (Rajah and McCulloch, 2012).
In contrast, horticultural production, i.e. vegetable and fruits, has increased in recent years. Horticulture led agricultural growth with 12.4 percent per year over the 1999-2005 period. However, product quality and its value-added processing still face many problems and need further improvements to meet client demand and to expand domestic and export market demand.
Such improvements are of high strategic priority as the vegetable and fruit consumption level in Indonesia is still lower than national dietary standards and FAO’s recommendation. Local products have difficulties competing in quality, diversity and/or price with imported products, especially in supplying medium/high-level income consumers and modern supermarkets (GOI, et.al. 2009).
Estate crops also recorded significant annual growth of 6.6 percent between 1998 and 2005. Despite the fact that Indonesian agricultural production has increasingly shifted away from food crops and particularly towards horticulture and estate crop production, the bulk of agricultural production in Indonesia remains in food crops (Rajah and McCulloch, 2012) (See Table 3).
Table 3: Agricultural production by commodity groups
Revenue Share (%) 1985 1999 2005
Food Crops 61.6 62.5 51.8 Horticulture 9.7 7.3 12.7 Estate Crops 17.0 18.1 21.2 Livestock 9.9 9.1 11.8 Fish 4.5 3.0 2.6
Source: Rada & Fuglie (N/D) in Raja and McCulloch 2012.
Trade and market liberalisation has also encouraged diversification into higher-value export crops and government spending on agriculture services, irrigation, and research on specific high-value crops. Agricultural research investment in estate crops has been much higher than in food crops. Therefore, regions with estate crops have generally benefited from better government support to improvements in productivity.
3 A report by USDA (2009) claims that the average size of plots of small holders in Indonesia is as small as 0.3 ha.

Agribusiness Development Opportunities in Eastern Indonesia – Socio-Economic Review
24
By 2005, the largest land use category was estate crops (oil palm, cocoa, rubber, etc.). These crops were cultivated on over 18.5 million hectares (25 percent ot total), partly as a result of the Government’s crop diversification policy in the mid-1980s that extended the area devoted to growing estate crops by 10 million hectares (ha) between 1980 and 2000 (IFAD, 2008).
These products (including rubber, palm oil, shrimps, coffee, copra, cocoa and livestock) constituted 12 percent of total exports in 2006.
Other major land use categories include lowland rice, cultivated on 7.9 million ha (11 percent), of which 4.7 million ha benefit from some form of irrigation; dryland crops/horticulture, 10.8 million ha (14 percent); and woodland and swamps, 13.6 million ha (18 percent). Temporarily fallow land accounts for 11.3 million ha (15 percent); shifting cultivation, 3.8 million ha (5 percent); and meadows, 2.4 million ha (3 percent).
Despite the significant decline in the contribution of agricultural value added to GDP and the relatively low productivity, agricultural value added per worker increased from about US$450 in 1970 to over US$700 in 2000 (1995 prices). However, nearly all the growth in productivity occurred between 1968 and 1992. By the mid-1990s, agricultural growth again relied almost entirely on bringing new land under cultivation (IFAD, 2007).
There appears to be considerable scope for raising agricultural productivity in Indonesia. While agricultural yields in Indonesia are largely comparable to those found in other Southeast Asian countries, there is substantial variation in agricultural productivity across Indonesia’s provinces. In particular, there is a large gap between the yields found in those provinces with the highest yields for certain crops and the yields for those crops found in most other provinces (Rajah and McCulloch, 2012).
While actual potential yields will to some extent depend on the specific environmental conditions prevailing in each province, large gaps between high yield provinces and the rest suggest ample scope for raising Indonesia’s agricultural productivity. If yields across Indonesian provinces converge towards the yields found in the best performing provinces for each crop, large gains in agricultural productivity could be realised, with increases of order of magnitude of 30 percent for rice yields and as much as 190 percent for coconut yields (Rajah and McCulloch, 2012) (See Table 4 and Table 5).
Table 4: Average yields for food crops in Indonesia (2011)
Rice Maize Soybean Peanut Mungbean Cassava Sweet Potato
NTT 3.03 2.12 1.01 1.22 0.85 9.95 8.22 NTB 4.94 5.12 1.12 1.44 1.12 14.59 12.55 East Java 5.49 4.52 1.45 1.28 1.12 20.22 15.34 Indonesia 4.98 4.56 1.37 1.28 1.15 20.30 12.33
Source: BPS, 2011
Table 5: Average yields for selected vegetables in Indonesia (2010)
Cabbage Chilli Potato Shallot Tomato NTT 23.27 4.03 13.98 10.27 19.21 NTB 5.55 4.04 4.20 4.20 7.07 East Java 18.15 3.70 13.48 7.69 12.69 Indonesia 20.51 5.60 15.94 9.57 N/A
Source: BPS, 2011
The differences in agricultural growth across Indonesia may also reflect differences in the availability of additional agricultural land, in input usage, and productivity gains mostly linked to the
Agribusiness Development Opportunities in Eastern Indonesia – Socio-Economic Review
25
production of estate crops. For instance, densely populated Java is land-constrained and already employs significant amounts of agricultural inputs (Rajah and McCulloch, 2012).
Indonesia is also highly vulnerable to the impact of climate change. It is likely that the country will be afflicted by prolonged droughts and more frequent extreme weather events, such as heavy rainfall leading to large-scale flooding. As an archipelago with more than 17,000 islands, Indonesia is also vulnerable to rising sea levels. These factors will affect agriculture, fisheries and forestry, reducing food security and damaging the livelihoods of the rural population, and in particular the rural poor (IFAD, 2008).
3.4 Food Security and Market Demand Although Indonesian agriculture has diversified away from food crops, overall food security has improved. In general terms, food security means that a country has sufficient food available (target of 2,100 calories per person per day) that can be readily accessed (physically available as well as affordable) and utilized by it citizens (nutrients consumed and absorbed by individuals).
The hunger index score4 for Indonesia has declined from a high of over 28 in 1981 to 13.2 in 2010 (IFPRI, 2010). According to Rada and Regmi (2010), if the current trends in food availability, agricultural trade, and economic development continue, the hunger index is expected to decline below 2 by 2020. However, the limited growth in agricultural (crop) productivity suggests that imports of food may have played a key role in improving consumer availability and accessibility to food.
Indonesia’s higher income levels have also improved food accessibility for most of its citizens. Increased education, better nutrition, and improved food safety and sanitation have contributed to better food utilization in the country.
Greater food consumption and increased purchasing power have contributed to the average Indonesian per capita food availability growing from 1,726 calories per capita per day in 1961 to 2,890 calories in 2003 (FAO, 2009) (2,538.42 calories per capita per day in 2007) (FAO, 2011).
The sources of these calories have changed radically. The total calorie share of starchy roots—a low-value product—has been consistently replaced by high-value foods, such as vegetable oils, meats, fish/seafood, and fruits and vegetables. For instance, between 1961 and 2003, starchy root crops as a share of total calories consumed per capita per day fell an annual average 2.5 percent, from 20 percent to 7 percent. Cassava, long considered an inferior food in Indonesia, is now the dominant starchy root. The share of vegetable oil nearly tripled between 1961 and 2003, peaking at more than 9 percent. Meat and fish/seafood as a share of calories rose only 1.1 percent and 1 percent, respectively. Sugars and sweeteners and vegetables and fruits remained constant.
Indonesians are also increasingly purchasing packaged food with some value added, rather than purchasing unprocessed products from local wet markets. The total value of such purchases grew from $4.2 billion in 1998 to over $16 billion in 2008. In addition to the changes in the actual consumer food basket, the outlets through which these products are purchased have also undergone a change. In 1998, less than 22 percent of packaged food was sold in standardized retail outlets, such as supermarkets, hypermarkets, and discount and convenience stores, rather than in independent corner “mom-and-pop” stores. In 2008, over 34 percent of sales were through standardized stores (Rada and Regmi (2010).
4 The hunger index is an equally weighted index of three measures: the proportion of undernourished population as a percentage of the total population; the prevalence of underweight children under the age of 5; and the under-5 mortality rate (IFPRI, 2006).

Agribusiness Development Opportunities in Eastern Indonesia – Socio-Economic Review
26
This stresses the importance of investments in post-harvest handling and agro processing, adequate storage (including cold/cool storage), packaging facilities, and transportation, among others.
Indonesia’s agricultural exports have focused primarily on tropical perennial products in which it has comparative advantage, whereas its imports have included feed for its growing poultry sector (in response to greater consumer demand for meat) and food for its citizens.
Indonesia’s agricultural export value has grown on average almost 9 percent annually, from a base of nearly $900 million in 1975 to nearly $20 billion in 2009 (FAO, 2011). Growth has been driven by increases in tropical perennial crops, such as rubber, cocoa, coffee, and palm oil. As of 2008, Indonesia was the second largest exporter of palm oil and the fourth largest exporter of coffee (USDA, 2008). While growth was evident in palm oil and rubber following Indonesia’s move toward industrialization in the mid-1980s, growth was exponential following the economy’s recovery after the Asian financial crisis.
Between 1975 and 2007, palm oil and rubber accounted for nearly half of total export value, with rubber’s share alone nearing a third. Between 2000 and 2007, shares associated with palm oil and rubber switched, with palm oil representing nearly 33 percent of total export value.
Indonesia has one of the most open markets for agricultural imports in Asia with import tariffs below world average levels. For instance, in 2006, the average bound rate, a set tariff level above which import tariffs cannot be raised, was 48 percent in Indonesia compared with the global average of 62 percent. More importantly, the actual tariffs that were applied to agricultural imports averaged only 9 percent in Indonesia compared with the world average of 19 percent (Rada and Regmi, 2010).
Despite growth in agricultural production, population and income growth have contributed to Indonesia’s agricultural import increases. The value of agricultural imports grew from over $650 million in 1975 to nearly $7 billion in 2009, an 8 percent average annual increase, to meet the needs of a growing population that increased from less than 100 million in 1961 to nearly 230 million in 2009 (FAO, 2011).
Indonesian food import trends reflect food preferences and lifestyle changes of increasingly educated, urban, and wealthy consumers. Cereals, which accounted for over 60 percent of total imports in 1975, have accounted for only about a quarter of agricultural imports since 1991. Instead, imports of feed and fodder to meet the needs of the growing poultry sector and foods to satisfy new demands have risen. For example, the value of imports of feed and fodder increased an average 34 percent each year between 1967 and 2007. Similarly, the value of imports of soybean (food item) increased an average 12 percent per year between 1975 and 2007 (Rada and Regmi, 2010).
3.5 Agricultural policy Agricultural policy in Indonesia focused for decades on achieving food self-sufficiency and price stability, especially in rice. The government used a wide variety of policy instruments in pursuing those goals, but mainly subsidies to purchased inputs. A typical example is a large subsidy for fertilizer, but water (irrigation systems), fuel, credit, tree planting materials, and pesticides were also subsidized. Substantial sums of public money have been spent financing investments in agricultural research, innovation and dissemination (Cervantes-Godoy and Dewbre 2010).
Some authors (Rada and Regmi, 2010) claim that the emphasis on food (rice) self-sufficiency has shifted towards an industrial export-oriented development strategy, since the mid 1980s, and trade liberalisation and a sharp currency devaluation after the Asian financial crisis of 1997 have increased the incentive of producers to focus on tropical perennial crops. However, it seems that

Agribusiness Development Opportunities in Eastern Indonesia – Socio-Economic Review
27
although diminished there has been constant government intervention, in the form of subsidies or tariffs, in the agricultural sector.
Most of the support for individual commodities has been through or has required complementary interventions through trade or border policy. The most important example is the support given to rice producers by government financed purchases of rice at prices above what would have prevailed in the market place. Other commodities, mainly sugar, have benefited from high tariff protection (Cervantes-Godoy and Dewbre 2010).
Indonesia’s largest farm input subsidy was for many years a fertilizer subsidy. Over the seven year period from 1984 to 1990 this subsidy averaged 9 percent of the total development budget. (The development budget, largely financed through development assistance, refers to non-salary expenditures made to promote economic development.) Fertilizer subsidies started to fall in the early 1990s, and were entirely eliminated by 2000 (Cervantes-Godoy and Dewbre 2010).
However, fertilizer subsidies were later reinstituted and in 2009 they had risen to Rp 16 trillion, representing 30 percent of the entire agriculture budget in that year (Barichello, 2010).
Agricultural credit has also received subsidies from time to time in Indonesia. Early efforts to encourage farmers to shift to high yielding rice varieties featured credit subsidies as one means of helping farmers finance their seed purchases. There have also been many smaller programs to offer farmers credit at rates lower than available through traditional lenders such as input sellers, money lenders, and more recently formal bank sources such as the state owned bank, Bank Rakyat Indonesia (BRI) lending at the village level (Cervantes-Godoy and Dewbre 2010).
Over the years many other development projects have included some kind of interest subsidy to encourage adoption of higher yielding varieties, better planting material for tree crops, as well as better farm practices. Most of these programs have provided limited quantities of subsidized credit, so that not all farmers had access to this credit each year and most farmers who did could not obtain all the financing they wished to obtain with subsidy.
Given the importance of rice in Indonesia, government policy for rice began in the 1970s with a focus on stabilizing its price, a task charged to the food logistics agency, BULOG (State Logistics Board), a state-owned enterprise. Subsequently, public policy has been focused on raising the domestic price and attempting to increase the degree of self-sufficiency (Cervantes-Godoy and Dewbre, 2010).
BULOG used trade policy, domestic market purchases, and stockholding to set and enforce floor and ceiling prices. When prices threatened to fall below the floor, BULOG would purchase domestic rice in order to keep prices at or above the floor. When prices rose and were likely to exceed the ceiling, BULOG would sell stocks or purchase imports in order to keep domestic prices beneath the ceiling. Examination of these efforts prior to 1997 suggested strongly that BULOG seriously attempted to stabilize rice prices, as opposed to having tried to protect rice producers by systematically raising them (Barichello 1998). BULOG’s monopoly on rice trade was removed in 1998/99, and their domestic procurement efforts fell considerably after 1997 (Cervantes-Godoy and Dewbre, 2010).
Although there has been a history of government support for some food crops other than rice and sugar, notably for soybeans and corn, they were never as important as those for rice and sugar and have virtually disappeared in recent years.
Cervantes-Godoy and Dewbre (2010) report that there is now a bound tariff on some food crops where BULOG non-tariff barriers existed previously. The bound rate for soybean meal was 45 percent in 1995, declining to 40 percent in 2004. The comparable rates for both wheat and wheat flour were 30 percent and 27 percent, in 1995 and 2004, respectively. However, as is the case for

Agribusiness Development Opportunities in Eastern Indonesia – Socio-Economic Review
28
many agricultural commodities in Indonesia, actual rates are considerably lower. Moreover, wheat and wheat flour tariffs have no direct effect on domestic production, given there is no commercial production of that cereal in Indonesia.
Since the beginning of the 1990s, there has been no control over imports of maize and the tariff has been zero. So although Indonesia has been a net importer of maize, the domestic maize industry has been competing freely with imports. This has been to the advantage of the livestock sector, particularly the growing poultry sector which has been the major user of corn as a primary ingredient in animal feed.
An important recent development in the tree crops sector is the encouragement of biofuel production. The objective of the government is to convert 6 million hectares of land to biofuel production, based on increased oil palm production (Basri, and Patunru, 2006). The expectation is that this would generate increased production of 22.5 million kilolitres of biofuel and create 3–5 million jobs. Additional biofuel initiatives have been proposed: banning crude palm oil exports and diverting this production to biodiesel production, and banning sugarcane molasses exports to use them instead for bioethanol production. Estimates of the 2007 budget cost ranged from Rp 1 to 13 trillion for these initiatives. In late 2008 mixing regulations for gasoline were introduced to require the addition of biofuels (Cervantes-Godoy and Dewbre, 2010).
The stated policy objective is to absorb more crude palm oil produced in Indonesia and increase its value-added instead of exporting the currently large and growing volume. In addition the program is aimed at increasing the supply of green fuels produced in Indonesia to combat global warming, and, it is argued, reducing unemployment. So far, only about 10 to 15 percent of domestic production of crude palm oil is being used to produce biofuels (Cervantes-Godoy and Dewbre, 2010).
3.6 Agricultural research Rada and Regmi (2010) suggest that research investments have benefited Indonesian agricultural development. For instance, TFP estimates5, which account for crops, livestock, and cultured fisheries, indicate that Indonesia’s agricultural productivity increased 2.18 percent per year during the early years of investment when the focus was on food (rice) self-sufficiency. A shift in focus favoring industrial development resulted in a dramatic slowdown of agricultural productivity growth to less than 1 percent between 1985 and 1997. Market liberalization and sharp currency devaluation following the Asian financial crisis promoted the development of export-oriented tropical perennial crops. Subsequently, TFP estimates more than tripled to 2.41 percent between 1998 and 2006 (Fuglie, 2009).
An analysis by Rada et al. (2010) finds that agricultural technology growth between 1985 and 2005 varied across subsectors, being greatest in perennial (export) crops (2.20 percent), followed by livestock (1.70 percent), and least in annual (food) crops (0.67 percent). This analysis suggests that policy reforms and currency devaluation created incentives for increased agricultural trade and generated growth in agricultural productivity. Furthermore, Rada et al. (2010) indicate that technology growth was driven more from private and other nongovernment sources than from public agricultural research investments.
5 Elevating agricultural total factor productivity (TFP) growth is generally the goal of any public agricultural research investment. TFP provides the most complete productivity measure, compared with partial land or labor productivity measures, because it accounts for all farm inputs, rather than a single input, related to production (Rada and Regmi, 2010).

Agribusiness Development Opportunities in Eastern Indonesia – Socio-Economic Review
29
3.7 Infrastructure Poor infrastructure remains an obstacle for rural development in Indonesia. There has been substantial progress in narrowing the gap in access to roads, water, and reliable lighting in the country. Despite the progress, considerable disparities remain between urban and rural sectors, and between rich and poor within each sector.
For all infrastructure indicators (access to markets, roads, electricity, piped water and lighting) there are great disparities between urban and rural areas and it can be inferred that remote villages will tend to have more problems to access income generating opportunities and higer poverty incidence than better connected villages.
It can also be suggested that geographical isolation will contribute to rural inequality, and less connected localities will have less access to sources of income (inputs, knowledge, markets) and will experience lower rates of growth.
Poor infrastructure in terms of rural roads and irrigation systems are binding constraints to rural development and geographical disadvantages can only be alleviated by the provision of adequate infrastructure.
3.8 Credit Policy efforts in the farm credit area in Indonesia since the mid-1980s have included the improved provision of formal sector credit through BRI. According to Cervantes-Godoy and Dewbre (2010), this relatively unsubsidized source of credit has been successful and now accounts for a larger share of credit provided to the agriculture sector. However, as will be explained later, other authors claim that in some of the studied provinces, access to credit is not perceived as easily accesible by farmers. Further, it appears that there has been a decline in the amount of subsidized credit being offered.
Commercial banks, with a few exceptions, have largely been uninterested in providing finance to agriculture, agribusiness or rural SMEs, and trade-related money flows and trade related financial products remain weak or non-existent.
The financial sector, in particular the larger banks, are reluctant to invest in agriculture because it is perceived as a high risk sector, or one with a poor loan repayment record. On the other hand the agribusiness community views the interest rates as being nearly punitive compared with the returns to agricultural activities and the collateral requirements as being unrealistic. Documentation procedures and loan repayment schedules also steer lenders to the informal loan market.
The limited data available suggests that there are an important number of microfinance institutions (MFIs) that have been active in rural and agricultural lending to farmers, small traders, and small processors in the rural sector. However, it is not clear what has been their impact in agricultural development in Indonesia.
In the absence of sufficient formal credit, finance may come either from within the sector itself, through advances between businesses, often in the form of inputs or product, or from financial service providers, ranging from moneylenders to MFIs, and to banks. Financial service providers have funding resources, but may not understand sectors well, and are constrained by legal frameworks and collateral issues. An objective of increasing access to finance to the value chains is to leverage the value chain relationships so that financial service providers can benefit from the advantages that value chain players have in extending credit to each other.

Agribusiness Development Opportunities in Eastern Indonesia – Socio-Economic Review
30
3.9 Poverty Poverty in Indonesia has been falling both in terms of the poverty rate and total numbers of the poor for the last few decades (See Table 6). Official figures show that poverty in Indonesia fell substantially from about 40 percent in 1976 to 11 percent in 1996 (ADB, 2009). The 1997-98 crisis then pushed the poverty rate back up significantly. However, the return of robust economic growth since 2002, amid political and macroeconomic stability, has seen poverty reduction in Indonesia resume (Rajah and McCulloch, 2012).
In 2011 the official poverty rate stood at 12.5 percent, having come down from 23.4 percent in 1999. This means that the total number of the poor in Indonesia fell from 48 million in 2005 to about 30 million in 2011 (BPS, 2011).
Table 6: Official poverty line, number and percentage of poor people in Indonesia (1996-2010)
Poverty Line (Ruphias) Num of poor people (mill) Percentage of poor people Urban Rural Urban Rural Urban Rural
1996 42,032 31,366 9.42 24.59 13.39 19.78 2000 91,632 73,648 12.30 26.40 14.60 22.38 2005 150,799 117,259 12.40 22.70 11.68 19.98 2010 232,989 192,354 11.10 19.93 9.87 16.56
Source: BPS, 2012
The official poverty rate is now lower than pre-crisis levels (after taking into account a 1996 change in the way official poverty lines are calculated). In comparing the pre- and post-crisis periods, it is notable that the pace of poverty reduction has slowed and the geographic pattern of poverty reduction has also shifted.
Poverty rates have fallen particularly sharply in Eastern Indonesia, Kalimantan and Java. However, the geographic distribution of the poor remains largely unchanged. Java is still home to 56 percent of the poor, including 67 percent of the urban poor and 50 percent of the rural poor in the country (Rajah and McCulloch, 2012).
Eastern Indonesia has achieved a drop in the poverty rate from over 35 percent in 1999 to just over 20 percent in 2010, but still having the highest poverty rate in the country. While Eastern Indonesia has the highest rate of poverty in the country, Java has the highest number of poor as it is a much more densely populated area. However, poverty reduction has been much more rapid in Eastern Indonesia, Kalimantan and Java than it has been in Sumatra and Sulawesi (Rajah and McCulloch, 2012).
It is important to note, that overall official national poverty rates mask a large number of people who live just above the national poverty line, and are also highly vulnerable to poverty.
For instance, when the official poverty line is multiplied by a factor of 1.5 to consider the people who are very close to poverty, the near poor, we find that the the number and percentage of poor people in Indonesia increases considerably (See Table 6 and Table 7).
Table 7: Number and percentage of poor people using a factor of 1.5 of official poverty line (2010)
Official poverty line Official poverty line multiplied by a factor of 1.5
Number of poor people (mill)
Percentage of poor people
Number of poor people (mill)
Percentage of poor people
NTT 1.02 21.76 2.57 54.7 NTB 1.02 21.76 2.69 59.6 East Java 5.58 14.87 19.13 51 Indonesia 31.06 13.33 105.89 44.5
Note: Calculation done by Daniel Nugraha Source: BPS, 2010

Agribusiness Development Opportunities in Eastern Indonesia – Socio-Economic Review
31
Despite the rapid urbanisation and the significant structural transformation of the Indonesian economy the majority of the poor remains rural. They still primarily work in agriculture and derive the majority of their income from agriculture. In 2002, 58 percent of the poor in Indonesia relied on agriculture for their survival, a share hat dropped to 52 percent by 2008. The post-crisis recovery of agriculture has been slower than for other sectors. For example, GDP per worker in agriculture has been growing much more slowly than in other sectors.
However, there has been no shortage of government policies, as well as substantial increases in budgetary expenditures, to support various parts of the agricultural sector looking to increase this apparent low level of agricultural productivity. From 2001 to 2008 real national government expenditures on agriculture rose by 11 percent per year. This resulted in agriculture doubling its share of total government spending (including by sub-national governments) from 3 percent to 6 percent by 2008 (Cervantes-Godoy and Dewbre 2010).
This perhaps indicates that increases in agricultural productivity will be more likely a result of interventions from other stakeholders in the agricultural sector, namely the private sector or international development organisations; or through different approaches to the ones already taken.
Eastern Indonesia has the highest rate of rural poverty in the country, despite a drop of nearly 20 percent between 1999 and 2010. In 2010, rural poverty rates in Eastern Indonesia were reported to be just under 25 percent, while in Java they were around 17 percent. The lowest rate of poverty nationwide is in Kalimatan, which has achieved 9 percent poverty rates, a much lower rate than the national average of 16 percent (Rajah and McCulloch 2012).
Eight provinces saw double-digit percentage point reductions in rural poverty rates over the period 1999 to 2005. These were Jambi, East Kalimantan, West Kalimantan, Nusa Tenggara Barat (NTB), Nusa Tenggara Timor (NTT), Maluku and Papua. Of these, only two provinces (NTB and NTT) were able to achieve this without also recording strong growth in the quantity of agricultural production, thus growth in the quantity of agricultural production has been closely associated with reductions in rural poverty across provinces (Rajah and McCulloch 2012).
While NTT and NTB have reduced their rural poverty rate by 19 percent and 11 percent respectively, they have an annual agricultural output growth of 3.6 and 2 percent, while East Java has a poverty decline rate of 7.9 percent and an agricultural growth rate of 2.4 percent.
There has been a greater divergence in experience across regions in terms of rural poverty reduction than for urban poverty. For instance, urban poverty is around 20 percent both in Eastern Indonesia and Java, which is almost exactly following the national average. The rate of urban poverty reduction is much more uniform across the country.
The links between poverty reduction and agricultural production have been clearly demonstrated by Rajah and McCulloch (2012). They argue that the provinces that have performed better in terms of rural poverty reduction and agricultural growth tended to perform better across all agricultural commodity groups but particularly with estate crops and horticulture. For provinces that saw particularly weak rural poverty reduction, growth was subdued across most commodity groups and, in particular, food crop production. Therefore, recent evidence suggests that agriculture remains closely linked to poverty reduction in Indonesia, particularly in rural areas (Rajah and McCulloch 2012).
3.10 Sources of income of poor households Rajah and McCulloch (2012) report that 63 percent of poor Indonesian workers were engaged in the agriculture sector in 2008. The importance of agriculture is even more pronounced amongst
Agribusiness Development Opportunities in Eastern Indonesia – Socio-Economic Review
32
poor rural workers, of which 75 percent were primarily engaged in agriculture. Trading and industry contributed a further 15 percent of employment for poor rural workers.
A large proportion of the rural poor and near-poor have informal sources of income, mainly in the form of employment on the family farm. According to Rajah and McCulloch (2012), 83 percent of rural agricultural workers were either self-employed in agriculture or family workers. By contrast, only 15 percent of agriculture workers were primarily employed as wage labourers – two-thirds of which were in casual employment, in 2006.
In 2002, agriculture provided 36 percent of income to the poorest 20 percent of Indonesian households. Importantly, agriculture provided more than 20 percent of income for the poorest 60 percent of households. Agriculture is therefore an important source of income for the poorest Indonesian households and remains important, although less so, for the near-poor. However these figures are an average for across Indonesian households in both rural and urban areas. Agriculture is likely to be even more important as a source of income for poor households in rural areas. Available data on the sources of income for poor households is less accessible and comprehensive.
Further evidence shows that both agricultural and non-agricultural sources of income are important for rural households in Indonesia, both poor and non-poor. For instance, agricultural income contributed 43 percent of rural households’ income in 2002, with about 35 percentage points coming from self-employment and about 9 percent points coming from wages. By contrast, non-agricultural sources provided about 43 percent of rural households’ income, with 21 percentage points coming from self-employment and 22 percentage points coming from wages.
Previous evidence also suggests that agricultural activities are the dominating or even main source of income for rural self-employed farming households. Non-farm self-employment seems to be less important as a source of income for rural self-employed farming households.
For instance, evidence provided by Schwarze & Zeller (2005) (in Rajah and McCulloch, 2012) reinforces the importance of agricultural income for the rural poor. In Central Sulawesi, agriculture provides 89 percent of income for the poorest households, compared to 69 percent of rural households in general. Self-employed non-farm activities provide only 3 percent of income to poor rural households while non-farm wage labour provides a further 7 percent. Therefore non-farm income contributes only 10 percent of poor rural household income in Central Sulawesi. The evidence from Central Sulawesi also shows that most agricultural income for poor rural households comes from self-employed farming. Agricultural wage labour provides only 16 percent of income for the poorest rural households in Central Sulawesi – although this is higher than the 9 percent of income it contributed to all rural households in the province in general.
Available data also shows that around 50 percent of farm income for rural households came from food crops in 2002. Estate crops provide about one-third of farm income for rural households. However, food crops appear to be more important for poor rural households compared to non-poor households. The pattern of income sources for rural Indonesian households has been remarkably stable over time. The largest change was by a sharp jump in the income share of estate crops in household income (Rajah and McCulloch, 2012).
The majority of Indonesia’s poor have remained rural and working in agriculture despite decades of growth, development, structural transformation and urbanisation. This also puts into question the efficiency of the sharp increase in government investment in agriculture described above.
McCulloch et al (2007) explored the ways in which poor agricultural workers try to escape poverty. Their study found that for poor rural agriculture workers, achieving productivity gains while remaining in agriculture has been the principal means of exiting poverty. It has also been shown

Agribusiness Development Opportunities in Eastern Indonesia – Socio-Economic Review
33
that moving from rural agriculture to the rural non-farm economy is important. By contrast, the study found that rural-urban migration appeared to play a relatively small role in explaining exits from poverty amongst poor rural agricultural workers.
The study by McCulloch et al (2007) suggests that, while the majority of the poor remain in rural agriculture, remaining in rural agriculture has also been the principal means of exiting poverty in Indonesia.
3.11 Gender disparities Women are crucial in the transformation of the products of agriculture into food and nutritional security for their households. They are often the farmers who cultivate food crops and produce commercial crops alongside the men in their households as a source of income. When women have an income, substantial evidence indicates that the income is more likely to be spent on food and children’s needs. Women are generally responsible for food selection and preparation and for the care and feeding of children. Women are the key to food security for their households (Quisumbing, et. al., 1995).
Women play a triple role in agricultural households: productive, reproductive, and social. The productive role, performed by both men and women, focuses on economic activities; the reproductive role, almost exclusively done by women, includes child bearing and rearing; household maintenance, including cooking, fetching water, and fuelwood; and the social role or community building, often dominated by women, which includes arranging funerals, weddings, and social events.
Women’s contribution to children’s health and nutrition outcomes is vitally important. In Indonesia where 40 percent of households are food insecure (FAO, 2004) larger numbers of rural women are engaging in external income earning activities to supplement their family consumption budgets. This is often at the expense of reproductive and social care roles, where the additional work burden leaves women less time at home.
Women’s participation in agricultural production in Indonesia is high, particularly in rice production where 75 percent of farm labour is provided by women (FAO, 2002). Despite women’s considerable participation in the agricultural workforce they continue to be largely unrecognised as farmers, fishers, or livestock producers. As a result their work is invisible and they do not have control or power over essential decision making such as resources for production. They have little access to productivity producing inputs such as credit, fertilizer and extension opportunities. They also lack control over their produce (FAO, 2011).
Women have a major responsibility for farm management but little access to training because customarily male heads of households are invited to training sessions (FAO, 2004). Additionally in rural areas women’s literacy rates are below those for men and further limit their access to agricultural learning opportunities (BPS, 2012) (See Table 8).
Table 8: Literacy rates of women in rural and urban areas in selected provinces (2010)
Rural Urban NTT 83.9 96.8 NTB 73.4 81.2 East Java 78.3 90.8 Indonesia 86.5 94.4
Source: BPS online, 2012
The civil code in Indonesia impedes women from entering into contracts on their own behalf requiring that husbands, by their presence or permission, assist women in formalising contracts. As a result married women find it difficult to engage in formal financial activities such as accessing

Agribusiness Development Opportunities in Eastern Indonesia – Socio-Economic Review
34
micro credit, or opening a bank account. Furthermore under Indonesian tax regulation women are not entitled to separate tax numbers, presenting a further obstacle to individual formal agricultural business activities (ADB, 2006).
Women have major domestic reproductive and social responsibilities that are key to the viability of household budgets, consumption and health. This is in addition to physically onerous agricultural workloads and tasks that are largely unpaid and invisible. Women use almost all they earn on household expenditure so increasing women’s incomes brings benefits to the household in terms of social expenditure such as health, education and care of vulnerable family members like children and the elderly (FAO 2011).
On the other hand, female-headed households are particularly vulnerable to fluctuations in household incomes. As a result women who are the sole income generators are more likely to accept lower rates of income as a trade-off for reliability of their income stream. This results in exposure to manipulation of employers or buyers, particularly in informal activities such as harvesting and sale of produce (Coles and Mitchell, 2011).
For instance, reports have shown (World Bank, 2012) that female-headed households tend to be affected more negatively than the average household by higher food prices. This arises from two distinct characteristics of female-headed households—they tend to be poorer than average—and hence to spend more of their income on food— and are much less likely to be farmers.
The number of female headed households is consistent between rural and urban areas but NTB shows the highest number of female-headed households in Indonesia (Table 9). This is important because female-headed households will tend to be more vulnerable, and frequently poorer, than other type of households, and will require special help to be able to play active roles in value chains.
Table 9: Number of female-headed households in rural and urban areas by province (2010)
Rural Urban NTT 15.5 16.8 NTB 21.9 22.5 East Java 15.7 15.8 Indonesia 13.44 14.39
Source: BPS online, 2012
In Indonesia, more rural female-headed households work than their urban counterparts (Table 10). NTT has the highest rate of working rural female heads of households, which could identify them as candidates for targeted commodity selection (such as home gardens with fruits and vegetables, or livestock that does not require them to be far from the household, i.e. chickens) allowing them to stay close to home to accommodate their domestic work burdens.
Table 10: Percentage of female-headed households that work by province (2010)
Rural Urban NTT 81.4 54.0 NTB 67.2 62.6 East Java 65.2 57.0 Indonesia 66.41 55.73
Source: BPS online, 2012.
In the sphere of agricultural research, development and extension (RD&E), women are well represented. In 2003, 28 percent of the researchers at the country’s public agricultural RD&E agencies were women. In addition, 21 percent of the PhD-qualified researchers, 34 percent of those with MSc degrees, and 25 percent of those with BSc degrees were women. This data suggests that Indonesia does not have a big gender gap in education. In fact, more than half of the

Agribusiness Development Opportunities in Eastern Indonesia – Socio-Economic Review
35
students enrolled in the country’s science programs were female in the early 2000s. Generally speaking, female students tend to be drawn more towards lecturing positions at universities or government officer positions rather than strictly research positions, as the latter are perceived as jobs that allow them less time with their family (STADS, Haryono et al. 2007).

Agribusiness Development Opportunities in Eastern Indonesia – Socio-Economic Review
36
4 Provincial profiles 4.1 Nusa Tengara Timur (East Nusa Tengara) Nusa Tenggara Timur (NTT) province is an archipelago in South-eastern Indonesia. NTT was officially established as a province on 1 September 1965. The province has a land surface of approximately 47,350 km2 (2.49 percent of the total land size of Indonesia) and about 200,000 km2 of water. Geographically, NTT is bordered on the west by Nusa Tenggara Barat (NTB) Province, in the north by the Flores Sea, on the south by the Indian Ocean, and in the east by East Timor. The provincial waters stretch from Palue Island in Flores Sea (North) to Ndana Island in Timor Sea (South) and from the west end of Komodo Island to Alor in the East.
NTT has 566 islands of which only 246 are named and 42 are inhabited, the largest four of which are: Flores (30 percent of the total size of NTT), Sumba (23 percent), Timor (30 percent), and Alor (4 percent).
NTT province was decentralised in 2000 and within three years the province grew from 12 to 20 regencies (districts) and one municipality (Table 11). In 2010, one new district was added—the island of Sabu was divided from Kupang City and established as a regency (district).
Table 11: Districts, sub-districts and villages in NTT (2010)
District/City Sub-districts Villages Sumba Barat 6 53 Sumba Timur 22 156 Kupang 30 240 Timor Tengah Selatan 32 240 Timor Tengah Utara 24 175 Belu 24 208 Alor 17 175 Lembata 9 144 Flores Timur 18 226 Sikka 21 160 Ende 20 214 Ngada 9 94 Manggarai 9 149 Rate Ndao 8 80 Manggarai Barat 7 121 Sumba Barat Daya 8 96 Sumba Tengah 4 43 Nagekeo 7 100 Manggarai Timur 6 114 Kota Kupang 6 47 NTT 2008 4 49
Source: SADI, 2010
The province is divided into 21 regencies (districts) and 290 sub-districts, with 2,980 villages. Administratively, the biggest regencies (districts) in NTT are Sumba Timur (14.78 percent of the total population), Kupang (12.5 percent), Timor Tengah Selatan (8.3 percent), Alor (6 percent), and Manggarai Barat (6.2 percent) (Table 12) (SADI 2010).
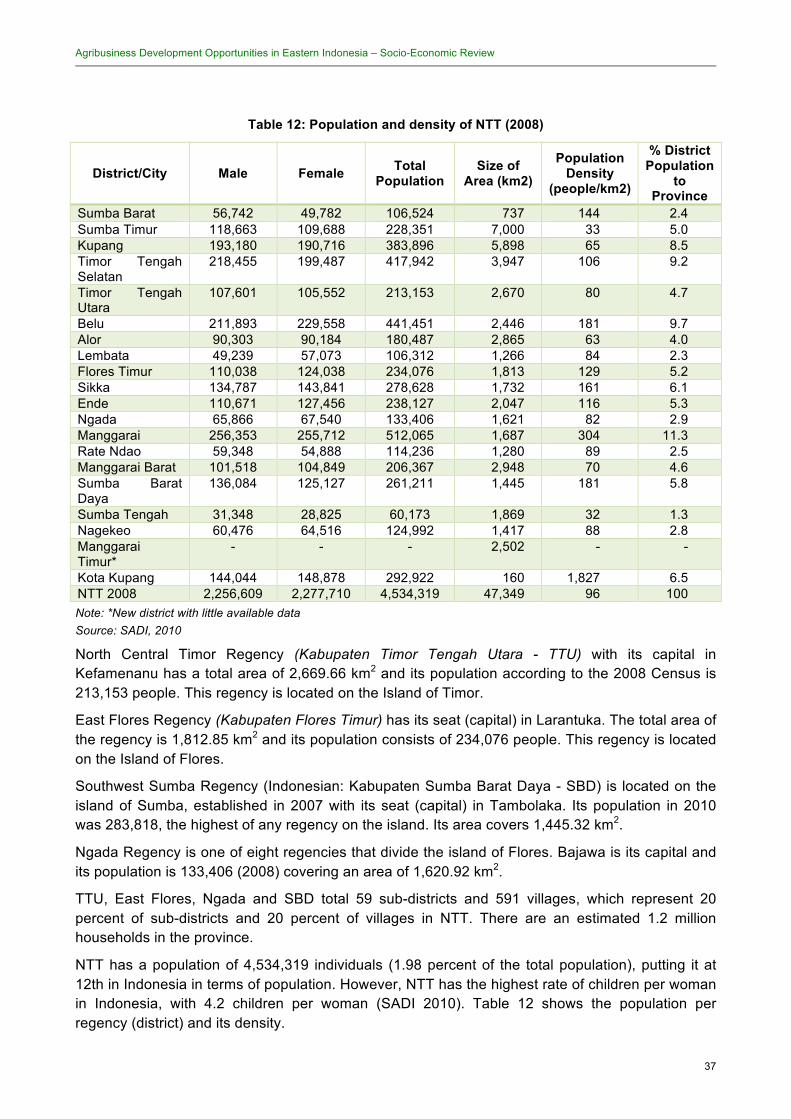
Agribusiness Development Opportunities in Eastern Indonesia – Socio-Economic Review
37
Table 12: Population and density of NTT (2008)
District/City Male Female Total Population
Size of Area (km2)
Population Density
(people/km2)
% District Population
to Province
Sumba Barat 56,742 49,782 106,524 737 144 2.4 Sumba Timur 118,663 109,688 228,351 7,000 33 5.0 Kupang 193,180 190,716 383,896 5,898 65 8.5 Timor Tengah Selatan
218,455 199,487 417,942 3,947 106 9.2
Timor Tengah Utara
107,601 105,552 213,153 2,670 80 4.7
Belu 211,893 229,558 441,451 2,446 181 9.7 Alor 90,303 90,184 180,487 2,865 63 4.0 Lembata 49,239 57,073 106,312 1,266 84 2.3 Flores Timur 110,038 124,038 234,076 1,813 129 5.2 Sikka 134,787 143,841 278,628 1,732 161 6.1 Ende 110,671 127,456 238,127 2,047 116 5.3 Ngada 65,866 67,540 133,406 1,621 82 2.9 Manggarai 256,353 255,712 512,065 1,687 304 11.3 Rate Ndao 59,348 54,888 114,236 1,280 89 2.5 Manggarai Barat 101,518 104,849 206,367 2,948 70 4.6 Sumba Barat Daya
136,084 125,127 261,211 1,445 181 5.8
Sumba Tengah 31,348 28,825 60,173 1,869 32 1.3 Nagekeo 60,476 64,516 124,992 1,417 88 2.8 Manggarai Timur*
- - - 2,502 - -
Kota Kupang 144,044 148,878 292,922 160 1,827 6.5 NTT 2008 2,256,609 2,277,710 4,534,319 47,349 96 100 Note: *New district with little available data Source: SADI, 2010
North Central Timor Regency (Kabupaten Timor Tengah Utara - TTU) with its capital in Kefamenanu has a total area of 2,669.66 km2 and its population according to the 2008 Census is 213,153 people. This regency is located on the Island of Timor.
East Flores Regency (Kabupaten Flores Timur) has its seat (capital) in Larantuka. The total area of the regency is 1,812.85 km2 and its population consists of 234,076 people. This regency is located on the Island of Flores.
Southwest Sumba Regency (Indonesian: Kabupaten Sumba Barat Daya - SBD) is located on the island of Sumba, established in 2007 with its seat (capital) in Tambolaka. Its population in 2010 was 283,818, the highest of any regency on the island. Its area covers 1,445.32 km2.
Ngada Regency is one of eight regencies that divide the island of Flores. Bajawa is its capital and its population is 133,406 (2008) covering an area of 1,620.92 km2.
TTU, East Flores, Ngada and SBD total 59 sub-districts and 591 villages, which represent 20 percent of sub-districts and 20 percent of villages in NTT. There are an estimated 1.2 million households in the province.
NTT has a population of 4,534,319 individuals (1.98 percent of the total population), putting it at 12th in Indonesia in terms of population. However, NTT has the highest rate of children per woman in Indonesia, with 4.2 children per woman (SADI 2010). Table 12 shows the population per regency (district) and its density.

Agribusiness Development Opportunities in Eastern Indonesia – Socio-Economic Review
38
NTT province has an average population density of approximately 96 individuals per square kilometre, ranking 16th nationally in population density. Kupang City is the only large town in the province with a population of nearly 300,000 and a population density of 1.827 individuals/km². The rest of the province has a scattered population averaging just 90 persons/km2. The island of Sumba has the lowest population density of the main islands, with an overall density of 77 persons/km2.
Of the four districts selected for this study, SBD has the highest number of residents with 5.8 percent of the total population in the province, or about 263,000 people. This is followed by East Flores (5.2 percent), TTU (4.7 percent), and Ngada with only 2.9 percent of the total population. Accordingly, population density is highest in SBD and East Flores with 181 and 129 people/km2 respectively.
According to a study by SADI (2010) regencies and sub-districts in NTT show regional variations in economic development and many districts struggle with underdevelopment due to isolation and lack of infrastructure and transportation links. Inadequate transportation links limit resources and people’s mobility, as well as the exchange of information and regular interaction. Naturally there is a concentration of development around the administrative centre and capital city of Kupang and other district capitals.
The fact that the islands of NTT are scattered and isolated from one another has meant that many government development programs have had a largely sectorial focus, and have resulted in the limited, poorly integrated development of tourism, agriculture, and mining potential—now reinforced by fiscal and administrative decentralization. The overall effect has been a general lack of economic development in NTT and little improvement in competitiveness (SADI 2010).
NTT has 1,014,000 households (2010). The average family size in the province is 4.6 people. The percentage of female-headed households in NTT in 2010 was 15.8 percent, slightly lower than 16.7 percent reported in 2009. This figure is lower in rural areas, where in 2010, 15.6 percent of households were female-headed (BPS, 2012).
Table 13 shows that in 2008 in NTT 62 percent of the province’s total population were in a productive age (between 16 and 64 years old). The dependency ratio is low (0.60), reflecting the small size of the elderly population (5 percent), a short life expectancy (69.9 years at birthin 2010), and a high fertility rate, with 33 percent of the population under the age of 14.
As of February 2011, NTT had 2.23 million people considered economically active. Of these, 2.18 million people were employed and 59,660 were unemployed, representing an open unemployment rate of 2.7 percent (BPS, 2012).
Table 13: Population by gender and age in NTT (2008)
Male Female All Age Total % Total % Total %
0-14 767,403 34 730,903 32 1,498,306 33 15-64 1,389,006 62 1,437,207 63 2,826,213 62 65 + 100,200 4 109,600 5 209,800 5 Total 2,256,609 100 2,277,710 100 4,534,319 100
Source: NTT in Figures, 2009
There are at least 40 ethno-linguistic groups in NTT. Each ethnic group has a separate language, as where Dawan is spoken by the biggest group in NTT, Atoni is spoken in TTS and TTU. Most people under 50-60 years in NTT are fluent in bahasa Indonesia. Bahasa is the primary dialect for communication.
The ethnic and language differences are to some extent paralleled in societal and cultural behaviour. However, there are fundamental underlying socio-cultural characteristics common

Agribusiness Development Opportunities in Eastern Indonesia – Socio-Economic Review
39
across NTT, with traditional leadership mainly defined by genealogical territory. First-comers to a location possess key land rights, while more recent arrivals have less entitlement. The principal kinship group of NTT communities is the clan, the head of which manages traditional activities along with older kinspersons. Each group has rites and procedures involving land, marriage, burial, inheritance, labour exchange, environmental management and other key functions, and it is here that social divergences arise (Barlow and Gondowarsito 2007).
The development of agribusiness must understand local behaviours and patters of exchange and cooperation. For instance, all clans in NTT practice cooperation, where kelompok of 10-15 families are formed to undertake farming and household tasks. However, there are differences in the decision-making processes and level of participation between different ethnic groups (Barlow and Gondowarsito 2007).
NTT also has an important religious diversity with 8.7 percent of the population being Muslim, 34 percent Christian (Protestant), 55.85 percent Catholic, 0.2 percent Hindu and 0.02 percent Buddhist.
4.1.1 Education In recent years, equity of access to education has improved in Indonesia and in NTT. Primary and secondary school enrolment, the ratio between the total population at school age and the actual population attending school, has increased. In, 2010, 96.49 percent of 7 to 12 year olds, 81.24 percent of 13 to 15 year olds and 49.22 percent of 16 to 18 ear olds were enrolled in school, which is better than national averages, and represents and improvement from previous years (BPS, 2012). There is no available data disaggregated by gender.
Data for 2010 shows that male literacy in this province is 90.76 percent and female literacy is 86.56 percent, with a combined total of 88.59 percent (BPS, 2012). Although this has improved in recent years, this is still lower than the national level for both groups (See Table 14).
Table 14: Adult literacy rate by province and sex (percent) (2010)
Male Female Total NTT 90.76 86.56 88.59 NTB 85.94 76.74 81.05 East Java 92.77 84.16 88.34 Indonesia 95.35 90.52 92.91
Source: BPS, 2012
4.1.2 Poverty NTT has enjoyed substantial growth along with significant poverty reduction over the last decade, although the incidence of poverty remains high, particularly in rural areas. Over the period 2004–2011, poverty rates fell from 27.86 to 20.48 percent (See Table 15).
Recent data (BPS, 2012) shows just under 21 percent of the population in the province lives under the poverty threshold, set by the Indonesian government at Rp 181,679 in rural areas and Rp 267 669 in urban areas. This amounts to just under one million people and places NTT as the 5th poorest province in the country after West Papua, Papua, Maluku, and Gorontalo. Table 15 shows that NTT follows general national poverty alleviation trends.
Table 15: Poverty rates in NTT and national level (percent) (2004-2009)
2004 2005 2006 2007 2008 2009 2010 2011 National 16.66 16.69 17.75 16.58 15.42 14.15 13.33 12.36 NTT 27.86 28.19 29.34 27.51 25.65 23.31 23.03 20.48 NTB 25.26 25.92 27.17 27.17 23.81 22.78 21.55 19.67

Agribusiness Development Opportunities in Eastern Indonesia – Socio-Economic Review
40
EJ N/A N/A N/A N/A N/A N/A 15.26 13.85 Source: NTT in Figures, 2010; NTB in Figures, 2010
There is a relatively high variation in poverty between people living in urban and rural areas in NTT, with rural areas being substantially poorer. In terms of households, almost half of households (575,943) in the province are poor. Table 16 shows the number and percentage of poor people in 2007 by district in NTT.
As the table illustrates, SBD is the second poorest district in the province, with 43 percent of its population classed as poor. TTU is ranked 9th in terms of poverty with 30 percent of its population being poor, followed by Ngada with 17 percent and East Flores with 14 percent of its population being poor.
This data illustrates the severity of poverty in NTT. The entire island of Sumba suffers chronic poverty, with more than 40 percent of the overall population being poor. Twelve out of 21 districts/cities have poverty rates above the provincial average of 27.5 percent. The three districts with the largest absolute number of poor (over 100,000 each)—Manggarai, Timor Tengah Selatan (TTS), and Kupang District—all have average poverty rates above 30 percent.
When the official poverty line is multiplied by a factor of 1.5 to consider the people who are very close to poverty, the near poor, we find that the the number and percentage of poor people in the province increases considerably (See Table 17).
Table 16: Number and percentage of poor people in NTT by district (2007)
District/City Number of poor people Percent Sumba Tengah 76,100 43.05 Sumba Barat Daya 53,300 42.96 Sumba Barat 43,500 42.74 Sumba Timur 82,800 39.08 Timor Tengah Selatan 147,500 37.43 Lembata 33,500 34.45 Manggarai 150,500 31.41 Kupang 111,600 31.32 Timor Tengah Utara 60,400 30.12 Alor 48,200 28.49 Rote Ndao 30,100 28.26 Manggarai Barat 53,500 27.96 Belu 83,900 21.02 Ende 46,000 20.33 Sikka 50,500 19.15 Ngada 21,800 17.28 Nagakeo 18,900 16.05 Flores Timur 31,200 14.38 Kota Kupang 20,300 7.50 Manggarai Timur n.a n.a Sabu Raijua n.a n.a NTT 1,163,600 27.51
Source: NTT in Figures, 2011
Table 17: Number and percentage of poor people in NTT and selected districts (2010)
Official povery line Official povery line multiplied by a factor 1.5
District/City Number poor people Percent Number poor people Percent Sumba Barat Daya 85,100 29.87 220,234 77.2 Timor Tengah Selatan 52,300 22.72 121,908 52.9 Ngada 17,200 12.05 62,132 43.5 Flores Timur 22,400 9.61 122,764 52.8 NTT 1,021.6 21.58 54.7

Agribusiness Development Opportunities in Eastern Indonesia – Socio-Economic Review
41
Note: Calculation done by Daniel Nugraha Source: BPS, 2010
The geographical distribution of poverty usually mirrors that of infrastructure development and access to markets, with poor transportation networks in remoter areas limiting economic opportunities for households.
For instance, regarding access to potable water twenty percent (20.9 percent) of the population in the province has access to potable water in their households. Just over one third (34.4 percent) have group access to water, and almost 43 percent have access to water from public sources (see Table 18). Statistics for 2010 show that almost 50 percent of households in NTT have access to decent clean water for drinking.
Table 18: Percentage of population with access to potable water, disaggregated according to type of access (2010)
Type of Access (%) Individual Household 20.88 Group Access 34.42 Public 42.98 Others 1.72
Source: BPS, 2011
Other indicators also point to the unequal access to services in the province, in comparison with national averages (See Table 19). These figures suggest that NTT falls short of the national average in areas such as life expectancy, literacy and sanitation, and falls far behind in other areas such as electrification. At the same time, the figures show that NTT is achieving good results in education relative to national averages.
Table 19: General welfare indicators (2008)
Indicator NTT NTB EJ National
Life Expectancy (years) (2008) 69.4 66.3 71.2 70.5 Literacy (2008) 87.7 80.38 87.80* 92.2 Net School Enrolment Rates (2008) − elementary − junior secondary − senior secondary
93.7 77.4 47.6
98,12* 85,81* 56,92*
98.57* 88.00* 58.44*
97.8 66.8 44.2
Households with piped water supply (%) (2008) − rural − urban
08 63
10 35
10 44
Households with public or private electricity (%) (2005) − rural − urban
25 93
71 88
81 96
Households with no access to private or public toilets (%) (2005) − rural − urban
48 04
66 36
43 12
Households with dirt floors (%) (2008) − rural − urban
48 08
14
9
19 06
Note: *2009 Sources: NTT in Figures, 2010; NTB in Figures, 2010; BPS, 2012

Agribusiness Development Opportunities in Eastern Indonesia – Socio-Economic Review
42
4.1.3 Migration The available data on migration in NTT is incomplete, unreliable and inconsistent. Given that migration is a key social phenomenon in NTT, as in all of Indonesia, which has important social and economic repercussions, it is highly recommended that this issue is explored further.
4.1.4 Economy NTT has a relatively small economy compared to other provinces in Indonesia and it is largely an agricultural province where large proportions of the population depend on agriculture for a living. Of the 2,061,229 people reported to be working in the province in 2010, 1,333,638 (65 percent) work in agriculture, while 489,250 (24 percent) work in trade, transportation, finance and services, and 238,341 (12 percent) work in manufacturing, mining, electricity, gas and water, and construction (Table 20).
Table 20: Sources of employment in NTT (2009-2010)
Industry 2009 2010 Agriculture, forestry, hunting, and fisheries 68.15 64.7 Mining 1.65 1.46 Manufacturing and processing 6.23 6.98 Electricity, gas, and piped water 0.12 0.08 Construction 2.62 3.03 Trade 6.9 7.31 Transportation 4.26 4.77 Bank, insurance, lease, building/land, and other services 0.6 0.47 Public services 9.48 11.18
Source: NTT in Figures, 2011
Table 21 details the contribution of various sectors to the RGDP in 2000 and 2008, clearly demonstrating the significance of agriculture. There are several noteworthy shifts in the RGDP structure between 2000 and 2008. The share of agriculture in the provincial economy declined sharply, leading the trend for nearly all other sectors, and these shifted mainly to services, which increased by 7 percent. While a shift out of agriculture is typical of a development transition, in NTT this more likely reflects migration out of agriculture due to productivity at or below subsistence, and into services – especially the growing ranks of the civil service and the economic importance of government administration.
Table 21: Structure of RGDP in NTT 2000-2008
Contribution to RGDP Sector
2000 2008
% Change
1. Agriculture 43.4 40.4 -3.0 2. Mining & Excavation 3.5 1.3 -2.1 3. Industry 2.0 1.6 -0.4 4. Power, Gas, & Consumption Water 0.6 0.4 -0.2 5. Building/Construction 7.6 6.9 -0.7 6. Commerce 17.6 15.7 -1.9 7. Transportation & Communication 7.6 6.4 -1.2 8. Financial, Rental, and Corporate Service 3.4 3.8 0.4 9. Services 16.5 23.5 7.1
Source: NTT in Figures, 2011

Agribusiness Development Opportunities in Eastern Indonesia – Socio-Economic Review
43
The average (per capita) income in the province has risen dramatically in recent years, from Rp 3,658,383 in 2006, to Rp 5,515,943 in 2010 (an increase of 50.8 percent). However, this is still considerably lower than the national average (per capita) income of Rp 23,975,197.
The monthly average expenditure per capita in NTT in 2011 was Rp 384,025 for all expenses, of which Rp 222,575 (58 percent) would be spent on food. The main source of income for households in rural areas is agriculture. However, during the dry season people in the highlands will raise animals and collect non-timber forest products such as bee honey, tamarind pods, and firewood, among others.
In 2012, the minimum regional wage for NTT province is Rp 925,000, an increase of Rp 75,000 (8.8 percent) from the 2011 minimum regional wage of Rp 850,000.
There is wide variation in output among the districts. Between 2006 and 2008, the districts with the lowest growth rates were also among the poorest: Sumba Tengah (3.4 percent), Manggarai Timur (3.5 percent), Sikka (4.2 percent), Manggarai Barat (4.3 percent), and Flores Timor (4.3 percent). The provincial capital and centre of government, Kupang City, has the highest economic growth with 7.2 percent on average (SADI, 2010).
As in all of Indonesia, NTT has experienced price inflation, with a mean annual inflation in the early 2000s of 13 percent; although inflation rates started to slow down in 2007 with a year-on-year figure of almost 11 percent (Barlow and Gondowarsito, 2007). However, there are variations in the prices of basic items: while increases in transport costs are almost double the national average, health and education costs are among the lowest. Similarly, rice prices in some parts of NTT are among the highest in Indonesia, yet meat prices are well below the national average (Barlow and Gondowarsito, 2007).

Agribusiness Development Opportunities in Eastern Indonesia – Socio-Economic Review
44
Table 22 shows the RGDP and per capita income (in Rupiah) by district in 2008. As the table shows, Kota Kupang had the highest RGDP in 2008 (Rp 3,593 billion) followed by Kupang (Rp 1,924 billion), Timor Tengah Selatan (Rp 1,766 billion) and Belu (Rp 1,474 billion).
At the lower end, Sumba Tengah (Rp 225 billion), Lembata (Rp 316 billion) and Rote Ndao (Rp 463 billion) were the smallest in terms of RGDP. Regarding RGDP per capita, Kota Kupang is highest with Rp 12,266,064, followed by Ende with Rp 5,728,036 and Sumba Barat with Rp 5,585,596. These are all still significantly lower than the GDP per capita for Indonesia of Rp 23,029,566. The regencies with the lowest RGDP per capita are Manggarai (Rp 1,837,657), Sumba Barat Daya (Rp 2,779,362) and (Rp 2,972,383), which have considerably lower RGDP per capita than the provincial GDP per capita of Rp 4,676,998.
Between 2006 and 2008, the districts with the lowest growth rates were also among the poorest: Sumba Tengah (3.4 percent), Manggarai Timur (3.5 percent), Sikka (4.2 percent), Manggarai Barat (4.3 percent), and Flores Timor (4.3 percent). The provincial capital and centre of government, Kupang City, has the highest economic growth with 7.2 percent on average (SADI, 2010).
As in all of Indonesia, NTT has experienced price inflation, with a mean annual inflation in the early 2000s of 13 percent; although inflation rates started to slow down in 2007 with a year-on-year figure of almost 11 percent (Barlow and Gondowarsito, 2007). However, there are variations in the prices of basic items: while increases in transport costs are almost double the national average, health and education costs are among the lowest. Similarly, rice prices in some parts of NTT are among the highest in Indonesia, yet meat prices are well below the national average (Barlow and Gondowarsito, 2007).

Agribusiness Development Opportunities in Eastern Indonesia – Socio-Economic Review
45
Table 22: District RGDP and per capita income in NTT (2008)
District/City 2008 RGDP (billions)
2008 Population
RGDP per capita (Rupiah)
Manggarai 941 512,065 1,837,657 Sumba Barat Daya+ 726 261,211 2,779,362 Lembata+ 316 106,312 2,972,383 Belu 1,474 441,451 3,338,989 Timor Tengah Utara 721 213,153 3,382,547 Alor 663 180,487 3,673,395 Sumba Tengah+ 225 60,173 3,739,219 Manggarai Barat 827 206,367 4,007,424 Rote Ndao+ 463 114,236 4,053,013 Timor Tengah Selatan 1,766 417,942 4,225,467 Nagekeo+ 566 124,992 4,528,290 Flores Timur 1,115 234,076 4,763,410 Sikka 1,333 278,628 4,784,157 Kupang 1,924 383,896 5,011,774 Sumba Timur 1,175 228,351 5,145,587 Ngada 739 133,406 5,539,481 Sumba Barat+ 595 106,524 5,585,596 Ende 1,364 238,127 5,728,036 Kota Kupang 3,593 292,922 12,266,064 Manggarai Timur 681 - - Nusa Tenggara Timur 21,207 4,534,319 4,676,998 Indonesia 4,951,357 215,000,000 23,029,566
Source: SADI, 2010
4.1.5 Agriculture The food crop sub-sector of the agricultural sector is the largest contributor (21 percent) to RGDP in NTT, followed by the livestock (10.6 percent), fisheries (4.3 percent), and estate crop (4.3 percent) sub-sectors. Maize is considered by the Provincial Government the most important food crop, followed by rice, mung beans and peanuts (See Table 24). Despite their high production levels, cassava and sweet potato remain out of the government’s priority commodity list – both commodities are regarded as an alternative buffer for local food stuff needs. Moreover, there is no established market for them due to the absence of food processing industries in NTT (SADI, 2010).
Table 24: Average production area and productivity of food crops in NTT (2004-2008)
Commodity Production (tonnes) Area (Ha) Productivity (t/ha) Rice 522,050 138,349 3.77 Maize 588,183 195,743 3.00 Soybean 2,116 1,615 1.31 Cassava 899,767 66,291 13.57 Sweet potatoes 108,005 10,594 10.19 Mung bean 19,372 18,253 1.06 Peanut 19,405 14,424 1.35
Source: BPS online, 2012
Table 25 presents and estimation of the potential and actual utilization of land in NTT by type of utilization. These figures suggest that there is still ample dry and wet land available for agricultural

Agribusiness Development Opportunities in Eastern Indonesia – Socio-Economic Review
46
use. However, there is available data as to the quality of that land or other potential socio-economic and/or legal problems to use it.
Table 25: Potential vs. actual utilization of land in NTT (2008)
Land utilization Available potential (ha)* Actual utilization (ha) ** % Utilization
(2008) Dry land and horticulture 1,528,308 527,774 35% Wetland (rice fields) 284,103 128,584 45% Estates 888,931 632,722 71%
* Processed from Recapitulation of Potential Areas for Farming in NTT Province. ** Processed based on the physical presence of food and horticultural crops and estates (Strategic Plans of the Agricultural and Estate Office 2009)
With regard to prices of food crops, the limited available data suggests that between 2007 and 2009 there was an increase of almost 20 percent (18.8 percent) in prices of maize. Cassava has seen an increase of almost 30 percent (27.2 percent), while peanuts and mung bean have experienced smaller increases in prices. Rice saw an increase of almost 60 percent in prices between 2006 and 2008 (Table 26).
Table 26: Variation in prices of selected commodities in NTT (2007-2009)
Average prices % increase Commodity Unit Quality
2007 2008 2009 2007-2009 Maize 100 kg Dry grains 204,950 243,452 243,452 18.79 Cassava 100 kg Fresh roots 139,136 176,905 176,905 27.15 Peanut 100 kg Dry grains 797,279 868,155 868,155 8.89 Mungbean 100 kg Dry grains 706,861 796,875 796,875 12.73
Source: BPS Provinsi NTT, 2011

Agribusiness Development Opportunities in Eastern Indonesia – Socio-Economic Review
47
Table 27 shows the prices of different commodities in 2010 at different stages of the value chain.

Agribusiness Development Opportunities in Eastern Indonesia – Socio-Economic Review
48
Table 27: Prices of key commodities in NTT (2010)
Wetland rice
Dryland rice Maize Cassava Sweet
Potato Mungbean Peanut
Price Farm-Gate (Rp)
3,178.39 3,178.39 2,434.52 1,769.65 7,968.75 8,681.55
Price Wholesale (Rp)
5,284.47 5,284.47 2,250.00
Price Retail (Rp)
5,732 5,732 5,000 7,000.00 7,000 22,000 18,000
Total Value Farm gate (Rp billion)
981 405 1,591 1,827 107 174
Total Value Wholesale (Rp billion)
1,632 675 1,471
Total Value Retail (Rp 000,000)
1,770,420 731,948 3,268,115 7,227,759 848,995 296,120 361,044
Per Hectare Value Farm gate (Rp)
5,620,164 6,636,219 6,506,005 17,832,715 0 6,802,776 10,506,488
Per Hectare Value Wholesale (Rp)
9,344,225 11,033,542 6,012,894 0 0 0 0
Per Hectare Value Retail (Rp)
10,135,566 11,967,948 13,361,988 70,538,808 56,739,624 18,780,998 21,783,758
Source: Data collected.
Mango, banana, guava, papaya and pineapple are among the most commonly grown fruits in NTT. Mango is cultivated on 6,963.70 ha, producing 104,669 tonnes in 2010, with an average retail price of Rp 10,000 per kilo (BPS, 2011). Banana is harvested from 2,605 ha, producing 187,911 tonnes in 2010, with the total value of banana production at retail markets estimated at Rp 93,955 million (BPS, 2011). Other fruits grown in the province include jackfruit, avocado and mandarins.
NTT is a difficult region to produce vegetables due to its short intense wet season, long dry season and landscapes considerably less fertile and more fragile than Java or Bali. The major vegetable crops in NTT are red kidney bean, Chinese cabbage, pumpkin, shallot and egg plant.
The estate crop subsector is the fourth largest contributor to NTT’s RGDP in the agriculture sector, making up 10.62 percent, or Rp 825.3 billion, to the agriculture sector GRDP in 2008, less than the contribution from the fisheries subsector. Cashew, coconut, candlenut, coffee and cocoa are the main estate crops grown prominently in NTT. Almost 160,000 ha of coconut are harvested each year, as well as 176,948 ha of cashew nuts, almost 80,000 ha of candlenut, 54,453 ha of coffee and 46,447 ha of cocoa. Other minor crops include vanilla, clove, kapok and betel nut. These crops suffer from low levels of productivity due to poor cultivation techniques and low implementation of inputs.
The livestock farming subsector is the second largest contributor to NTT’s RGDP for the agricultural sector. Livestock are both farmed and sold for income and kept for domestic consumption. In NTT, pigs are raised primarily for local consumption, and along with buffaloes are

Agribusiness Development Opportunities in Eastern Indonesia – Socio-Economic Review
49
considered a cultural commodity. Livestock farming occurs throughout NTT, but is more heavily concentrated in West Timor Island, Kupang, TTS, Belu and TTU. The contribution of NTT to total national production of livestock is around 5 percent, placing the province at number six in Indonesian cattle production.
The national demand for beef is strong and is predicted to grow for the foreseeable future as a result of rising incomes. Farmers in NTT have the potential to benefit from a strong cattle market locally and nationally. Almost 600,000 heads of cattle were raised in NTT in 2010 fetching an average farm-gate price of Rp 3.47 million per head. Cattle are sold to traders in West Timor Island who pass them up through a trading chain to Surabaya and Jakarta. Only beef for local consumption is slaughtered in NTT.
Cattle farmers often lack adequate capital to buy their own calves, and have limited access to financial resources. The result is that farmers will fatten cattle belonging to others under one of two prevalent profit sharing schemes: a) an equal share system, where a dealer entrusts his/her cows to a farmer for fattening. The proceeds from the sales of the cows will be shared equally on a 50/50 basis; b) a weight based system where a dealer entrusts his/her cows to a farmer for fattening for 6-12 months. The margins from the sales price will be shared equally on a 50/50 basis. The dealer will have the full discretion to select which cows he/she will entrust to farmers for fattening or reselling. Weight is typically estimated and often not measured accurately. These conditions put farmers in a weak bargaining position, compounded by farmers’ daily cash needs, which lead them to borrow their commissions in advance, and repay them at the time of sale, at a discounted price. Unfair pricing often results.
Sea products such as fish, prawn, cuttlefish, sea cucumber, seaweed, and other sea products contribute significantly to NTT’s RGDP for the agricultural sector. In 2007, fishery production amounted 103,825 tons. About 101,217 tons or 97.5 percent of the production are caught from sea, while the remaining tons (2.51 percent) are produced from land fishery. By species, groupers are the most common fish products, followed by tuna, sardine, sailfish, and puffer fish. In 2008, 36,093 families relied on fisheries as the source of their livelihoods. Flores is the area where most of the population works in the fishery subsector (Lembata, Flores Timur, Sikka, and Ende districts).
The climate in NTT favours seaweed cultivation and there is strong potential to expand production. In 2010, 463,171.18 tonnes of seaweed were produced in NTT. Seaweed is dried and baled, and shipped mainly to Surabaya through the ports in Kupang and Maumere (SADI, 2010). There is also strong and growing international demand for carageenen from seaweed for use in food, cosmetics, etc. The southern Philippines has been the traditional supplier of carageenen, but regional conflict and increasing uncertainty in the supply chain is resulting in an increasing shift in sourcing to Eastern Indonesia, with the potential for basic processing to follow.
4.1.6 Trade Most trade that takes place in NTT involves agricultural products, which are predominantly traded in small regional markets and onto larger markets in the main centres. Much trade takes place within the province, and may involve bartering, particularly in remote areas, where small local sellers exchange goods in kind (Barlow and Gondowarsito, 2007).
There are two types of traders/middlemen, those with their own capital, and those representing large dealers – with large dealer representatives making up most of the market. Middlemen work at the village and district level, and usually have established operating areas. Village level traders can deal directly with a sub-district or district trader. Traders will determine prices based on their internal network information or existing contracts with his/her partners, and pricing tends to be non-transparent.

Agribusiness Development Opportunities in Eastern Indonesia – Socio-Economic Review
50
The main agricultural products exported from NTT to other regions include cashew nuts, coffee, candlenut, seaweed, tamarind and cattle (Table 29), most of which have relatively low added value, and are destined for Surabaya and to a lesser extent to South Sulawesi and Bali (ADB, 2009). Virtually all agricultural products exported to these locations are not traded in local markets because traders between islands mostly go directly to the producers. However, inter-island traders are relatively few in number, allowing them to enjoy monopolistic conditions through the relatively isolated, limited quantities and established business connections in Surabaya (ADB, 2009).
Table 29: Agricultural goods entering and leaving NTT province
Goods Coming In Goods Going Out Agricultural, plantation and forest products
Coffee, candlenuts, copra, cacao, vanilla, cloves, cashews, bananas, peanuts, mung beans, soybeans, tamarind, lac, bananas, honey, coriander, great morinda, rice, livestock feed, corn, small red onions, turmeric, citrus peel, sandalwood, lumber, processed wood, fustic, teak beams
Marine products
Pearls, seaweed, shark fins, squid, oysters, dried sea slugs, shrimp/lobster, skipjack tuna, grouper, dried fish, ray gills, smoked fish, flying fish, deho/komo fish and other ornamental fish, fish powder, agar-agar
Basic foodstuffs and groceries
Rice, sugar, cooking oil, flour, margarine, eggs, milk, corn, iodized salt, soap, livestock feed, snacks, food ingredients, small red onions, garlic, soft drinks, alcoholic beverages, readymade clothing, dried fish, bran, soybeans, peanuts, cigarettes, matches, konveksi, brem (fermented rice cake), plastic bags, mineral water, mixed goods, tobacco
Livestock Cattle, water buffalo, horses, goats, pigs Source: NTT Province Trade and Industry Office, 2009 in LPEM-FEUI, 2010
The large amount of primary goods exported from NTT reflects the economic structure of the province, in which the agriculture sector makes a significant contribution to RGDP, averaging 40 percent between 2006 and 2008, albeit declining over the years (LPEM-FEUI, 2010).
Overall, exports from NTT province to other countries totalled only US$17.4 million in 2005 (Barlow and Gondowarsito, 2007). Most products (agricultural, natural resources) from NTT are exported to Australia and other Asian countries. Bank Indonesia reports that during the first quarter of 2009, the largest importer of NTT commodities was China, with 23.1 million tonnes out of 23.5 million tonnes of exported goods going to China, consisting mainly of manganese6. NTT has also been a traditional exporter of seaweed and fish to China and Japan, although in 2008 the export volume for both these commodities dropped significantly7 (SADI 2010).
4.1.7 Infrastructure
As of 2003, NTT had 1.3 percent (57,770 ha) of the total national irrigated land.
The limited available information suggested the following problems with respect to the development of irrigation systems in NTT:
• There are few complete permanent irrigation systems;
• Integrated water management systems are yet to be developed;
6 Manganese was discovered in NTT in 2000, and exports to China have grown steadily since then. 7 Bank Indonesia, 1st Quarterly Report (2009).

Agribusiness Development Opportunities in Eastern Indonesia – Socio-Economic Review
51
• Primary irrigation systems are mostly located on unstable and steeply sloping areas or river embankments, thus prone to damage during the dry season;
• More than 55 percent of the irrigation infrastructure was built over a decade ago and has suffered damage.
The transportation infrastructure in NTT is generally limited. The traditional distribution system for agricultural commodities in NTT involves farmers, sellers, poolers/middlemen, and inter-island dealers, with trade taking place around the major towns. Commercial commodities are exported mainly to Surabaya, with additional destinations including Makassar, Jakarta, and/or international markets (mostly to East Timor) via seaports.
Within the province, the preferred method of transporting goods between islands is trucks and ferries.
NTT has a total of 19,417.10 km of roads, of which 1,406.77 km are national roads, 2,718.89 km are provincial roads, most of which are asphalted (2,327.69 km), and 16,321.30 km are provincial roads, most of which are dirt roads (BPS Provinsi NTT, 2011). Nearly 60 percent of all roads in the province are in poor-to-impassable condition (Table 30). In addition, 76 percent of all roads are district roads – critical for farmers in accessing markets – and nearly half of these roads are in poor-to-impassable condition (SADI 2010). Nine out of the 21 districts have less than one kilometre of roadway per square kilometre of arable land area, making access to farmlands and markets difficult.
Table 30: Condition of roads in NTT (2008)
Good Fair Mildly Damaged
Severely Damaged Total Road
Status (km) (%) (km) (%) (km) (%) (km) (%) Km %
National 403 32 555 44 272 21 43 3 1,273 8 Provincial 109 4 413 17 701 28 1,271 51 2,493 16 District 1,486 13 3,656 28 4,439 38 2,530 22 12,111 76 No-Status 1,201 8 Total 1,998 13 4,624 29 5,411 34 3,843 24 15,877
Source: NTT in Figures, 2011
It would be expected that roads facilitate access to agricultural input and output markets, lowering costs and enhancing revenue. On the other hand, access to roads improves access to other non-farm opportunities, i.e., facilitating small enterprise businesses, as usually see with higher non-agriculture revenue among those with access to roads. Lastly, access to road facilitates connectivity to wider employment opportunities in other villages or in urban areas.
For the most part, products are exported by ship through the larger sea ports in NTT, such as Tenau, Atapupu and Ende, of which only Tenau can receive large vessels with container facilities. The majority of goods arriving from Surabaya come through the port at Tenau in Kupang (the main trading gateway), which is also where a large part of exported goods from NTT leave the province. The main exception is trade with Timor L’este where most goods are exchanged by road through West Timor.
NTT has 10 national, 9 regional and 29 local seaports. Of these, 15 ports are where most trading takes place. Among them, the port of Flores Timor is one of the most active, with almost half of the arriving and departing boats using this port. Kupang and Manggarai Barat are also important ports in this province.
Agribusiness Development Opportunities in Eastern Indonesia – Socio-Economic Review
52
The two reported ports in Kupang (Tenau and Sabu Seba) tend to have more traffic of people from ships and ferries than the aforementioned ports, which is also the case for the amount of goods loaded and unloaded in the different ports.
Ferry costs and waiting times add considerable cost to the transportation of goods, with ferry costs accounting for as much as 72-79 percent of overall transportation costs and waiting times reaching 76 percent of the overall journey time (LPEM-FEUI, 2010). Transportation by ferry is also affected by weather conditions, in which strong winds and high waves restrict sailing in the months of January and February.
In addition to road and sea transport links, the many isolated islands in NTT also require an air transportation system. There are 15 airports throughout the districts/cities in NTT province. Kupang City Airport (El Tari) is the central hub for air travel in NTT with just under 500,000 arrivals and departures in 2008, followed by Manggarai Barat Airport (Komodo), Ende Airport (H.H. Aroebusman), and Sumba Timur Airport (Mauhau) – with each of these three seeing about one tenth the passenger traffic of Kupang.
In NTT, the tradition distribution system for agricultural commodities involves farmers, sellers, poolers/middlemen, and inter-island dealers, with trade taking place around the major towns, including Atambua, So’e, Kefamenu, Waingapu, Waikabukak, Maumere, Ende, Bajawa, Ruteng, and Larantuka. Commercial commodities are exported to mainly to Surabaya, with additional destinations including Makassar, Jakarta, and/or international markets (mostly to East Timor) via seaports in NTT.
The total flow of goods for NTT is a small fraction of the figures for Eastern Indonesia, with just over 1,100 thousand tons being unloaded compared to a mere 266,000 tons loaded, reflecting more consumer goods flowing into NTT than agricultural commodities flowing out. 170,000 tons of loaded goods were listed as exports, although this figure is questionable. There are no direct international shipments from NTT (there is no agency authorized to issue certificates of origin) and exports typically transit Surabaya – with NTT exports usually incorporated into East Java’s statistics. A small amount of goods legally heading to East Timor may be counted as exports (although the border is recognized as being very porous8).
Two factors cause increased costs for goods coming in or out of Kupang. The first is the low load factors of ships bound to Tenau Kupang, which forces shipping lines to charge higher rates on goods shipped to NTT. In the end, goods are sold at higher prices in Kupang. The second problem is the fact that there are no warehouses operating 24 hours from which manage the loading and unloading of ships. Tenau is a 24 hour port, but operations are limited by the supporting infrastructure such as warehouses, which have limited hours. This extends the period of time the ship stays in port, and increases costs. This contributes to the higher cost of goods moving out of NTT as well as goods coming into the province, and contributes to the poor competitiveness of NTT products in national and international markets.
Timber, beef cattle, tamarind, and kemiri (Aleurites moluccana) shipments are closely supervised at NTT seaports, with other commodities subject less thorough supervision. Official and unofficial fees are charged on commodities exported via NTT seaports. A study by the SMERU Research Institute on the business climate in NTT (March 2007) concludes that excessive supervision will not only affect transportation costs, but will also affect transportation time. To illustrate, Kupang District
8 Goods enjoying GOI subsidies, especially gasoline and rice, are believed to flow illegally into East Timor across the land border. There are no reliable estimates of the quantities or values. Similarly, live cattle are believed to walk across the border into NTT owing to the limited market opportunities for beef cattle in East Timor.

Agribusiness Development Opportunities in Eastern Indonesia – Socio-Economic Review
53
has more road checkpoints than other districts (10 checkpoints mostly operated by police). Too many checkpoints increases costs and discourages farmers and small dealers from bringing their commodities to markets in Kupang. For example, a tamarind or kemiri dealers in TTU, will prefer to sell products in Attambua over Kupang even though the market price is better in Kupang – the checkpoints and levies on the journey to Kupang make it uncompetitive.
4.1.8 Credit
Despite agriculture contributing over 40 percent of the RGDP of NTT and employing almost 70 percent of the provincial workforce, only 1.3 percent of credit from the government and 1.4 percent of credit from private banks goes to the agricultural sector. The People’s Credit Bank provides the agricultural sector with 9 percent of its credits (Table 31).
Table 31: Credit to the agricultural sector in NTT (2008)
Indicators Contribution to RGDP 8.7 trillion % of NTT’s RGDP from agriculture 40.39 %
Agricultural Employment (2008) 1,448,174 individuals % of NTT labour force in agriculture 69.42%
Government Credit to the Agricultural Sector
Rp. 63,530 million
% of Government Bank Credit going to Agricultural Sector 1.29%
Private Credit to Agriculture Sector Rp. 6,582 million
% of Private Bank Credit going to Agricultural Sector 1.42%
People’s Credit Bank (BPR) Credit to Agricultural Sector
Rp. 2,599 million
% of People’s Credit Bank (BPR) Credit going to Agricultural Sector 8.75%
Source: NTT Central Bureau of Statistics (2006-2009) and NTT 2008 – 2013 Regional Medium Term Development Plan.
Consumer credit dominates lending in NTT. While aggregate investment credit provision shows significant improvement in the last few years, most small business units in NTT still experience difficulties in gaining access to finance. The main reasons given by small business owners include complicated processes and, most importantly, collateral requirements9 (SADI, 2010).
Over the period 2005-2009, investment and working capital credits were allocated mainly to the commercial sector, with investments in agriculture increasing slightly but becoming an increasingly small proportion of overall bank credits (SADI, 2010).
9 Indonesian law requires national banks to obtain collateral mainly in the form of land certificates. Provincial banks are not subject to the same collateral requirements as national banks.

Agribusiness Development Opportunities in Eastern Indonesia – Socio-Economic Review
54
4.2 Nusa Tengara Barat (West Nusa Tenggara) West Nusa Tenggara (NTB) province is an archipelago that consists of two main islands namely, Lombok Island (4,738.65km2) and Sumbawa Island (15,414.5km2). The Province borders Nusa Tenggara Timur (NTT) to the East, Java Sea and Flores Sea to the North, the Indian Ocean to the South and the Lombok Straight/Bali Province to the West. NTB covers 20,153km2 of land and 29,159km2 of sea.
The capital, Mataram, is situated in West Lombok, in the regency (district) of Lombok Barat (Kabupaten Lombok Barat) and lies on the western side of the island of Lombok. It is also the largest city of the province, with a population of 402,296 in 2010 (2010 Census).
NTB has 10 districts (including Bima City). Table 32 lists the districts and villages in NTB. The four selected districts for the EI-ADO project are West Lombok with 10 sub-districts and 88 villages; North Lombok with 5 sub-districts and 33 villages; Dompu with 8 sub-districts and 70 villages and Bima with 18 sub-districts and 177 villages.
Table 32: Districts and villages in NTB
District/city Sub-districts Villages Mataram City 6 50 Lombok Barat (West Lombok) 10 88 Lombok Utara (North Lombok) 5 33 Lombok Tengah 12 124 Lombok Timur 20 119 Jumlah 53 414 Sumbawa 24 165 Dompu 8 70 Bima 18 177 Sumbawa Barat 8 49 Bima City 5 38 Nusa Tenggara Barat 116 913
Source: NTB in Figures, 2011
The total population of the province is 4,500,212 people (2,183,646 men and 2,316,566 women) growing at a rate of 1.2 percent a year. This is just under the national average of 1.5 percent. The distribution of the population is uneven between the two main islands, with about 70 percent of the population living on Lombok, which has less than a quarter of the total land area.
Besides the two main islands, there are approximately 332 islets (282 named and 50 unnamed), of which only 16 are inhabited. The average density of the population is 230/km2. The population density of Lombok Island is 652/km2, while the density of Sumbawa Island is much lower at 83/km2.
North Lombok Regency (district) covers 809.53 km2 and is located on the island of Lombok. Its capital is Tanjung, situated on the North West coast of the island, with a population of 200,063 people.
West Lombok Regency (district) covers 1,053.92 km2. It is located on the island of Lombok and its capital is Gerung. The total population of the district is 599,986 people.
Dompu Regency covers 2,324.60 km2 and is located on the island of Sumbawa with its capital in Dompu. The total population of the district is 219,216 people.

Agribusiness Development Opportunities in Eastern Indonesia – Socio-Economic Review
55
Bima Regency covers 4,389.40 km2 and is located on the island of Sumbawa. Its capital is Woha. The regency excludes, but completely surrounds, Bima City (Kota). It has two non-contiguous parts; one part is the northern half of Sanggar Peninsula, which is dominated by Mount Tambora, and the other half is the easternmost quarter of the island (exlcuding Bima City). Between the two parts is Dompu Regency. To the north east of the Tambora dominated sector is Sanggar Bay, where three bodies of water border the Regency Bima Bay, Waworada Bay, and Sape Strait.
The district is nearly co-terminus with the former Sultanate of Bima and includes the nearby islands of Sangeang, Banta, and Managate. The island of Kambing, which lies in Bima Bay, is also part of this regency. The total population of this district is 439,228 people.
Table 34 shows that the average number of persons per family in NTB is 3.6. There is some variation between districts, with families being larger in Dompu with an average number of 4.13 family members, and smaller in North Lombok with 3.61 people per family on average.
Table 31: Average family size and number of households in selected districts in NTB (2010)
North Lombok
West Lombok Dompu Bima NTB
Average number of people/family
3.61 3.67 4.13 4.00 3.61
Number of households 55,395 163,554 53,073 109,921 1,248,115
Source: BPS, 2011
North Lombok has 4 percent of the total provincial population, West Lombok 13 percent, Dompu 5 percent and Bima 10 percent. In terms of population density, West Lombok is by far the most densely populated district of the four selected districts, with 569 people/km2, followed by East Lombok with 247/km2, Bima with 100/km2 and finally Dompu with only 94 people/km2.
Table 34 shows the population of NTB across the four selected districts disaggregated by sex. The number of women is slightly higher across all NTB districts except for Dompu. This can likely be explained by the migration trends that suggest that most migrants from Dompu are women.
Table 34: Population in NTB by sex (2010)
North Lombok West Lombok Dompu Bima NTB Male 98,667 293,528 110,908 218,759 2,183,646 Female 101,405 306,458 108,308 220,469 2,316,566 Total 200,072 599,986 219,216 439,228 4,500,212
Source: NTB in Figures, 2011
The age distribution of the population is described in Table 33. This data suggests a dependency ratio of 2:1, with two working age adults for each child or elderly person.
Table 33: Population in NTB by age (2010)
Age brackets North Lombok West Lombok Dompu Bima NTB
0-14 62,749 151,592 77,842 149,597 1,176,470 15-64 128,672 248,250 132,904 265,862 2,830,279 65+ 8,643 25,624 8,236 23,769 205,256
Source: NTB in Figures, 2011
The majority of the population of NTB (95.3 percent) is Muslim. Of the four selected districts, Dompu and Bima have the largest Muslim population at 98.2 percent and 99.6 percent, respectively, while the Muslim population in North Lombok and West Lombok is slightly lower—90.7 percent for North Lombok and 92.9 percent for West Lombok. In these districts there is a

Agribusiness Development Opportunities in Eastern Indonesia – Socio-Economic Review
56
greater Hindu population, representing 9.9 percent in North Lombok and 6.6 percent in West Lombok. Other religious groups make up a much smaller percentage.
In NTB, 90 percent of the population of North and West Lombok is of Sasal ethnicity, in Dompu and Bima 90 percent of the people are Mbojo.
4.2.1 Education In recent years, equity of access to education has improved in Indonesia and in NTB. Primary and secondary school enrolment, the ratio between the total population at school age and the actual population attending school, has increased. In, 2010, 98 percent of 7 to 12 year olds, 87 percent of 13 to 15 year olds and 58 percent of 16 to 18 year olds were enrolled in school, which is better than national averages, and represents and improvement from previous years (BPS, 2012). There is no available data disaggregated by gender.
In terms of completion rates, only 4 percent of male students in NTB have obtained a university degree, compared to 2.4 percent of female graduates (Table 34). It is interesting to note that the highest rate of university graduates appears to be women in North Lombok and the lowest rate is men in North Lombok. The data also suggest that the greatest disparity between the sexes exists at the level of elementary school with 25.3% of males completing elementary school compared to only 15.2 percent of female students.
Table 34: Completion rates by district by sex (2010)
Elementary school Junior high High school University District Male Female Male Female Male Female Male Female
West Lombok
23.66 12.69 15.55 12.69 16 9.87 2.66 1.44
Dompu 20.62 19.66 16.13 19.66 22.68 19.47 6.05 3.22 Bima 21.29 15.83 13.95 15.83 22 17.47 3.46 3.04 North Lombok
26.02 19.10 13.96 19.10 13,31 30.69 1.32 8.04
Total NTB 25.27 15.17 15.37 15.17 17.85 13.45 3.96 2.35 Source: Provincial Government 2011
Data for 2010 shows that male literacy in this province is 85.94 percent and female literacy is 76.74 percent, with a combined total of 81.05 percent (BPS, 2012). Although this has improved in recent years, this is still lower than the national level for both groups.
Table 35: Adult literacy rate by province and sex (percent) (2010)
Male Female Total
NTT 90.76 86.56 88.59 NTB 85.94 76.74 81.05 East Java 92.77 84.16 88.34 Indonesia 95.35 90.52 92.91
Source: BPS, 2012
Among the four selected districts, North Lombok has the highest rate of illiteracy with over 23 percent of the population over 10 years of age being illiterate, followed by West Lombok with 21 percent, Bima with 12 percent and Dompu with 11.3 percent of illiteracy (See Table 36). As the table also shows, women in the province are much more likely to be illiterate than men.

Agribusiness Development Opportunities in Eastern Indonesia – Socio-Economic Review
57
Table 36: Illiteracy rates by district (2010)
Regency Male Female Total West Lombok 15.72 25.96 21.03 Lombok Tengah 17.00 30.89 24.37 Lombok Timur 12.84 21.58 17.62 Sumbawa 7.78 11.31 9.53 Dompu 8.45 14.23 11.33 Bima 9.54 15.19 12.32 Sumbawa Barat 6.59 10.50 8.53 Kota Mataram 5.49 9.42 7.54 Kota Bima 4.10 6.83 5.48 North Lombok 17.94 28.86 23.34 Total 12.06 20.60 16.51
Source: NTB in Figures, 2011
4.2.2 Poverty Poverty rates in NTB have declined since 2000, from 28.1 percent to 21.6 percent of the population in 2010. The poverty rates for 2010 in NTB and the selected districts are presented in Table 37. These figures suggest that North Lombok district has the highest poverty rate of the four selected districts, which is twice the provincial average, and Bima has the lowest poverty rates.
The rate of female-headed poor households is an indicator of further vulnerability of the population. Bima has the highest rate of female headed households at 5.1 percent, and Dompu has the lowest with 1.2 percent.
Table 37: Poverty rates and percentage of female-headed households in selected districts (2010)
North Lombok
West Lombok Dompu Bima NTB
Poverty Rate (% of poor people from total population)
43.12 21.59 19.89 19.41 21.55
Rate of female headed poor households N/A 3.79 1.20 5.13 4.36
Source: NTB in Figures, 2011
When the official poverty line is multiplied by a factor of 1.5 to consider the people who are very close to poverty, the near poor, we find that the number and percentage of poor people in the province increases considerably (See Table 38).
Table 38: Number and percentage of poor people in NTB and selected districts (2010)
Factor 1.5 District/City Number of poor
people Percent Number of poor
people Percent
Lombok Barat 129,800 21.59 377,461 62.8 Dompu 43,700 19.89 197,011 47.4 Bima 85,200 19.41 127,572 58.0 Lombok Utara 86,300 43.12 159,527 79.9 NTB 972,300 21.58 2,688,028 59.6
Note: Calculation done by Daniel Nugraha Source: BPS, 2010
Table 39 shows that NTB rates lower in some standard indicators, such as average life expectancy and literacy rates, compared to national averages. Furthermore, recent data shows that only 53 percent of households own a telephone, significantly lower than the national average of 72 percent.

Agribusiness Development Opportunities in Eastern Indonesia – Socio-Economic Review
58
Similarly, only 3.5 percent of households have a computer compared to 6.4 percent at the national level.
Table 39: General welfare indicators (2008)
Indicator NTT NTB EJ National
Life Expectancy (years) (2008) 69.4 66.3 71.2 70.5 Literacy (2008) 87.7 80.38 87.80* 92.2 Net School Enrolment Rates (2008) − elementary − junior secondary − senior secondary
93.7 77.4 47.6
98,12* 85,81* 56,92*
98.57* 88.00* 58.44*
97.8 66.8 44.2
Households with piped water supply (%) (2008) − rural − urban
08 63
10 35
10 44
Households with public or private electricity (%) (2005) − rural − urban
25 93
71 88
81 96
Households with no access to private or public toilets (%) (2005) − rural − urban
48 04
66 36
43 12
Households with dirt floors (%) (2008) − rural − urban
48 08
14
9
19 06
Note: *2009 Sources: NTT in Figures, 2011; NTB in Figures, 2011; EJ in Figures, 2011
Other indicators of poverty and vulnerability such as water supply, electrification and house type show sharp disparities between urban and rural settings. These however, are similar to national averages. Finally, the percentage of households with decent clean water as source of drinking water in NTB is 46 percent against a national rate of 44 percent (Statistics Indonesia 2012).
4.2.3 Migration
Table 40 gives an insight into migration trends in NTB. The percentage of migrants out of the total population is around 1 percent across most districts and across NTB as a whole. In North Lombok this rate is considerably lower with only 0.5 percent of the population migrating, largely in search of better working opportunities. It is also interesting to note that while across NTB 67 percent of the migrants are male, in Dompu and Bima 96 percent and 80 percent are female, respectively. This trend could be linked to the nature of jobs offered to women overseas, as many women find employment as domestic workers.
Table 40: Migration trends in NTB (2010)
North Lombok
West Lombok Dompu Bima NTB
Average age of migrants 27-30 27-30 27-30 27-30 27-30
Total migrants 1,074 6,230 1,911 2,122 56,150 Male (% of migrants) 56% 87% 4% 20% 67%
Female (% of migrants) 44% 13% 96% 80% 33%
% of Total population 0.5% 1.0% 0.9% 0.5% 1.2%
Source: NTB in Figures, 2011
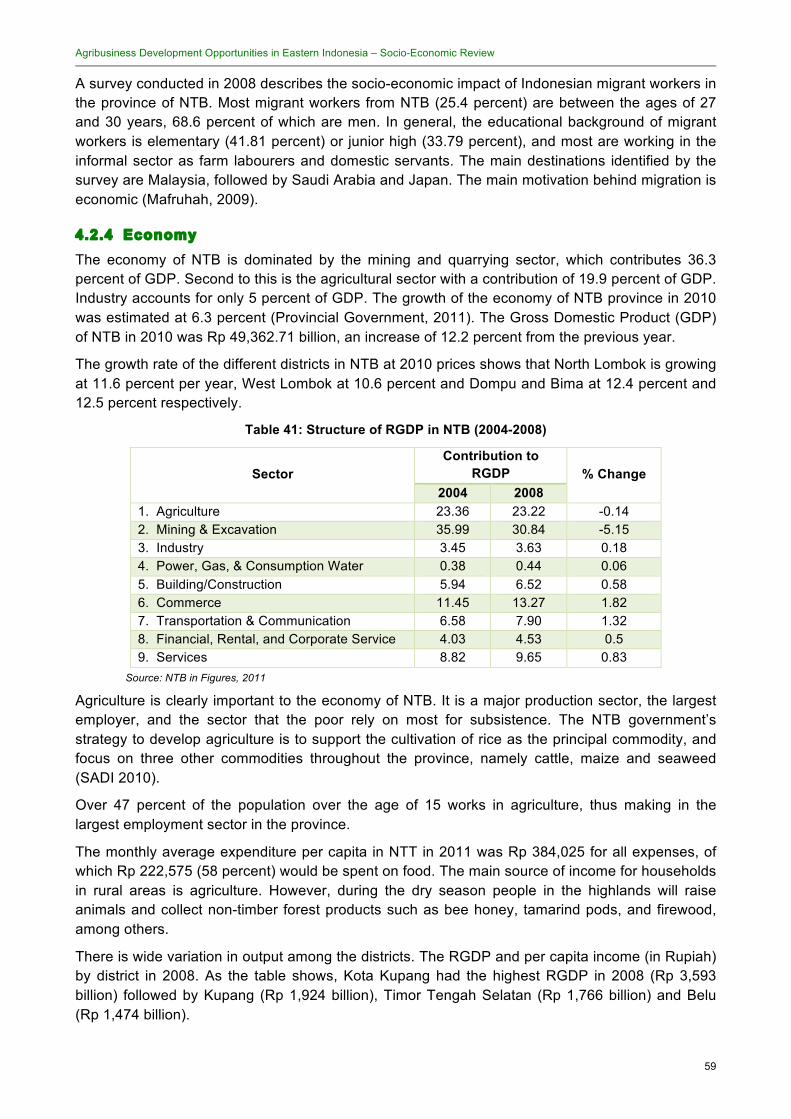
Agribusiness Development Opportunities in Eastern Indonesia – Socio-Economic Review
59
A survey conducted in 2008 describes the socio-economic impact of Indonesian migrant workers in the province of NTB. Most migrant workers from NTB (25.4 percent) are between the ages of 27 and 30 years, 68.6 percent of which are men. In general, the educational background of migrant workers is elementary (41.81 percent) or junior high (33.79 percent), and most are working in the informal sector as farm labourers and domestic servants. The main destinations identified by the survey are Malaysia, followed by Saudi Arabia and Japan. The main motivation behind migration is economic (Mafruhah, 2009).
4.2.4 Economy The economy of NTB is dominated by the mining and quarrying sector, which contributes 36.3 percent of GDP. Second to this is the agricultural sector with a contribution of 19.9 percent of GDP. Industry accounts for only 5 percent of GDP. The growth of the economy of NTB province in 2010 was estimated at 6.3 percent (Provincial Government, 2011). The Gross Domestic Product (GDP) of NTB in 2010 was Rp 49,362.71 billion, an increase of 12.2 percent from the previous year.
The growth rate of the different districts in NTB at 2010 prices shows that North Lombok is growing at 11.6 percent per year, West Lombok at 10.6 percent and Dompu and Bima at 12.4 percent and 12.5 percent respectively.
Table 41: Structure of RGDP in NTB (2004-2008)
Contribution to RGDP Sector
2004 2008 % Change
1. Agriculture 23.36 23.22 -0.14 2. Mining & Excavation 35.99 30.84 -5.15 3. Industry 3.45 3.63 0.18 4. Power, Gas, & Consumption Water 0.38 0.44 0.06 5. Building/Construction 5.94 6.52 0.58 6. Commerce 11.45 13.27 1.82 7. Transportation & Communication 6.58 7.90 1.32 8. Financial, Rental, and Corporate Service 4.03 4.53 0.5 9. Services 8.82 9.65 0.83
Source: NTB in Figures, 2011
Agriculture is clearly important to the economy of NTB. It is a major production sector, the largest employer, and the sector that the poor rely on most for subsistence. The NTB government’s strategy to develop agriculture is to support the cultivation of rice as the principal commodity, and focus on three other commodities throughout the province, namely cattle, maize and seaweed (SADI 2010).
Over 47 percent of the population over the age of 15 works in agriculture, thus making in the largest employment sector in the province.
The monthly average expenditure per capita in NTT in 2011 was Rp 384,025 for all expenses, of which Rp 222,575 (58 percent) would be spent on food. The main source of income for households in rural areas is agriculture. However, during the dry season people in the highlands will raise animals and collect non-timber forest products such as bee honey, tamarind pods, and firewood, among others.
There is wide variation in output among the districts. The RGDP and per capita income (in Rupiah) by district in 2008. As the table shows, Kota Kupang had the highest RGDP in 2008 (Rp 3,593 billion) followed by Kupang (Rp 1,924 billion), Timor Tengah Selatan (Rp 1,766 billion) and Belu (Rp 1,474 billion).
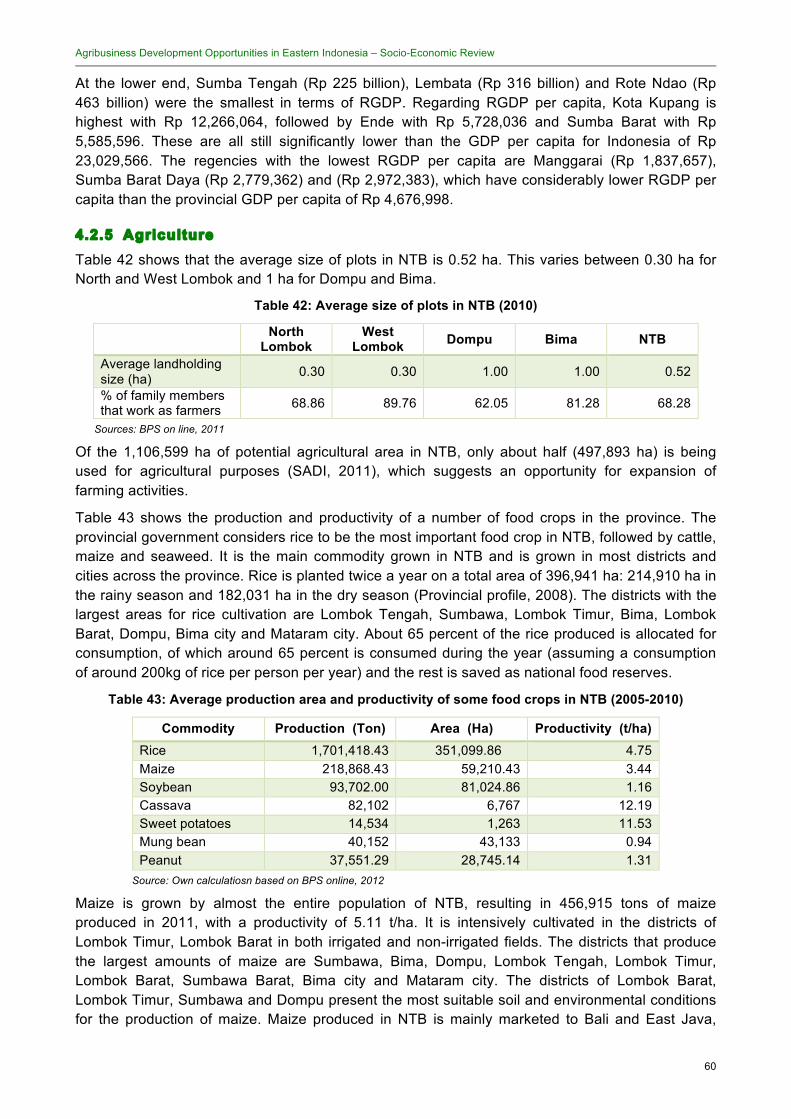
Agribusiness Development Opportunities in Eastern Indonesia – Socio-Economic Review
60
At the lower end, Sumba Tengah (Rp 225 billion), Lembata (Rp 316 billion) and Rote Ndao (Rp 463 billion) were the smallest in terms of RGDP. Regarding RGDP per capita, Kota Kupang is highest with Rp 12,266,064, followed by Ende with Rp 5,728,036 and Sumba Barat with Rp 5,585,596. These are all still significantly lower than the GDP per capita for Indonesia of Rp 23,029,566. The regencies with the lowest RGDP per capita are Manggarai (Rp 1,837,657), Sumba Barat Daya (Rp 2,779,362) and (Rp 2,972,383), which have considerably lower RGDP per capita than the provincial GDP per capita of Rp 4,676,998.
4.2.5 Agriculture Table 42 shows that the average size of plots in NTB is 0.52 ha. This varies between 0.30 ha for North and West Lombok and 1 ha for Dompu and Bima.
Table 42: Average size of plots in NTB (2010)
North Lombok
West Lombok Dompu Bima NTB
Average landholding size (ha) 0.30 0.30 1.00 1.00 0.52
% of family members that work as farmers 68.86 89.76 62.05 81.28 68.28
Sources: BPS on line, 2011
Of the 1,106,599 ha of potential agricultural area in NTB, only about half (497,893 ha) is being used for agricultural purposes (SADI, 2011), which suggests an opportunity for expansion of farming activities.
Table 43 shows the production and productivity of a number of food crops in the province. The provincial government considers rice to be the most important food crop in NTB, followed by cattle, maize and seaweed. It is the main commodity grown in NTB and is grown in most districts and cities across the province. Rice is planted twice a year on a total area of 396,941 ha: 214,910 ha in the rainy season and 182,031 ha in the dry season (Provincial profile, 2008). The districts with the largest areas for rice cultivation are Lombok Tengah, Sumbawa, Lombok Timur, Bima, Lombok Barat, Dompu, Bima city and Mataram city. About 65 percent of the rice produced is allocated for consumption, of which around 65 percent is consumed during the year (assuming a consumption of around 200kg of rice per person per year) and the rest is saved as national food reserves.
Table 43: Average production area and productivity of some food crops in NTB (2005-2010)
Commodity Production (Ton) Area (Ha) Productivity (t/ha) Rice 1,701,418.43 351,099.86 4.75 Maize 218,868.43 59,210.43 3.44 Soybean 93,702.00 81,024.86 1.16 Cassava 82,102 6,767 12.19 Sweet potatoes 14,534 1,263 11.53 Mung bean 40,152 43,133 0.94 Peanut 37,551.29 28,745.14 1.31
Source: Own calculatiosn based on BPS online, 2012
Maize is grown by almost the entire population of NTB, resulting in 456,915 tons of maize produced in 2011, with a productivity of 5.11 t/ha. It is intensively cultivated in the districts of Lombok Timur, Lombok Barat in both irrigated and non-irrigated fields. The districts that produce the largest amounts of maize are Sumbawa, Bima, Dompu, Lombok Tengah, Lombok Timur, Lombok Barat, Sumbawa Barat, Bima city and Mataram city. The districts of Lombok Barat, Lombok Timur, Sumbawa and Dompu present the most suitable soil and environmental conditions for the production of maize. Maize produced in NTB is mainly marketed to Bali and East Java,

Agribusiness Development Opportunities in Eastern Indonesia – Socio-Economic Review
61
however available information does not reveal the use of the maize once sold. In 2007, 3,000 tonnes of maize was exported to Malaysia from NTB. During that year, prices fluctuated between 1,700 and 2,800/kg of dry grain.
Peanut is traditionally a highly cultivated commodity in all districts and cities in NTB, with 37,965 tons of peanut produced in 2011. It is safe to assume that majority of farmers would grow some peanuts for home consumption given that it can be planted on irrigated and non-irrigated fields following the harvest of rice. Peanut is typically harvested in April to November, but in dry land and non-irrigated areas is planted during the rainy season and harvested between February and April. While peanut has been cultivated for many years in the province, farmers have begun cultivating it intensively following heavy investment from companies guaranteeing purchase and price (i.e. Garuda Food). Peanut has strong market potential at the national level as the country imports as many as 100,000 tonnes of peanuts annually.
Indonesia is still a net importer of soybean, accounting for an estimated 60 percent of the soybean consumed. The production of soy has seen stark increases in recent years perhaps as a response to high prices nationally and internationally. In 2009, almost 100,000 ha of soy were harvested in NTB. It is planted and cultivated in most districts and cities of the province, under irrigation, rainfed and dryland production systems, and is usually planted shortly after harvesting rice. In dryland areas, soy is planted during the rainy season. The districts where most soy is produced are Lombok Tengah, Dompu, Sumbawa and Bima. The overall productivity of soy in NTB is still low at around 1.4 t/ha (2009), with the potential to increase to up to 2.5 t/ha by adopting improved practices used in other provinces.
There are several challenges with soy cultivation in NTB, such as adoption of new/best practices (seed, fertilizer and technology), poor management of soy in wetlands, lack of technological extension, lack of partnerships and trade regulations in soy agribusiness. However, there are opportunities to encourage farmers to grow more soy and to improve the soy value chain. For instance, investors can support local farmers with production facilities, processing technologies and purchase and price guarantees. This can also be related to exploring new products, such as tofu, tempe, soy milk and vegetable oil. There are also opportunities in farmers taking a coordinated approach to do collective marketing of soy between regions and islands.
Mung bean is cultivated by farmers throughout NTB and the province boasts a nationally acclaimed variety of mung bean called Sampeong. NTB has almost 40,000 ha of potential area for mung bean cultivation, yet only 18,836 ha are currently used to grow the crop. The productivity of mung bean cultivation in NTB has increased consistently over the years, from 7.5 t/ha in 2004 to almost 10 t/ha in 2008.
Annual and tree crops grown in NTB include cashews, coconut, coffee, cocoa, areca nut, tamarind, vanilla, pepper, candlenut, palmyra and gomuti palm and sugar cane. Seasonal crops grown in NTB include cotton, local and Virginia tobacco, castor beans and spices. Reports indicate an increase in the total size of local estates during 2008. In 2007, there were 198,783 ha of local estates, which increased to 202,811 by 2008.
Cashew is an important commodity in NTB, not only because it grows well, but because it can grow on barren lands and does not compete with other commodities for space or resources. It also helps to conserve land. Furthermore, cashew is mainly an export-oriented commodity and as such it has an important potential market. The fact that cashew trade and cultivation are labour intensive provides an opportunity for increased employment. Currently, up to 4,000 tonnes of cashew nuts are produced every year in NTB throughout West Lombok, Dompu, Bima and Sumbawa. NTB has more than 650,000 hectares of potential land for cashew cultivation, but currently only around 200,000 hectares of cashew are cultivated.

Agribusiness Development Opportunities in Eastern Indonesia – Socio-Economic Review
62
With regard to fruit production, mango, rambutan and bananas are grown by a large proportion of the population in NTB. Mango, for example, is grown by almost the entire population of NTB and production has increased notably in the last decade from 71,958 tonnes in 2001 to 613,206 in 2008 (SADI, 2010). Mango is grown in the most arid parts of NTB, and also in the poorest areas of the province (SADI, 2010). Mango, as other fruits, offers the possibility of helping the poorest farmers in the province, in particular women (female-headed households or women with limited mobility) if it is grown in home gardens or near homes. Areas with high potential for mango production are West Lombok, Lombok Tengah, Lombok Timur, Sumbawa Barat, Dompu, and Bima distrits. Among the most popular varieties of mango cultivated are Arummanis, Manalagi, Golek and Gedong Gincu.
Rambutan is grown in areas of NTB with a wet climate, but with a short rainy season, especially around Mataram, Lombok Tengah, and Lombok Timur. It is cultivated on a more limited scale in Lombok Barat, such as in Lingsar and Narmada municipalities, and in Pringgaata, Batuklian Utara and Mantang municipalities in Lombok Tengah district. The most commonly cultivated variety in these areas is Narmada, which has a high demand due to the thick and dry meat that peels off easily and its sweet flavour. Lombok Barat and Lombok Tengah districts are the two areas with the highest potential to grow rambutan in NTB. It is estimated that only 10 percent of the potential area for growing rambutan has been used.
Banana is grown throughout most districts in NTB and is harvested all year long. Average monthly production in 2008 amounted to 35-40 tonnes, however production fluctuates depending mainly on weather conditions, largely due to the prevalent use of traditional cultivation methods. Nevertheless, production seems to have an increasing tendency. For instance, between 2005 and 2007, production of bananas in NTB grew from almost 60,000 tonnes to over 75,000 tonnes per year. Types and varieties grown include kapok, ambon, king and golden, and a local variety called the wood banana, known for its quality, sweetness, and fragrance. This variety has been cultivated on a limited basis by breeders in Lombok Island.
In NTB, banana is usually cultivated in home gardens, wetlands and yards, with no special treatment provided. Young trees are usually cloned from mother trees within the area. While this presents opportunities for poorer families, in particular female-headed households and women with limited mobility, it also poses the challenges for marketing, the potential for expansion of cultivated areas, and disease control. However, bananas have a strong demand in local and regional markets, in particular in Bali. In 2006, shipments of bananas to Bali reached 60,897 tonnes, while around 73,000 tonnes were absorbed by local markets (NTB in Figures, 2010).
The major vegetable crops in NTB include shallot, chilli, yardlong bean and swamp cabbage. NTB also performs above the national average in cabbages and tomatoes. Even though NTB is the fourth largest producer of shallots in the country, its productivity is half the national average of 20.51 t/ha.
NTB is well known for its livestock production, and is recognised as one of the top cattle/beef producers in Indonesia. The livestock sector in the province is prioritized by the Government. In 2008, NTB exported around 12,000 head of beef to up to 14 provinces in Indonesia. This province contributes more than 30,000 head of beef each year to the National Cattle Meat Self Reliance Program Acceleration (P2SDS). This makes NTB one of the highest producers of cattle at the national level. Furthermore, NTB seems to have a surplus of cattle. In 2008, the population of cattle was estimated at just under 550,000 head and by 2011, this figure raised to 685,810 (BPS, 2012). However, it is claimed that NTB has the capability of accommodating up to 1,370,250 head of cattle, showing the clear opportunities for growth. There were an estimated 105,391 heads of buffalo in NTB in 2010 (NTB in Figures, 2011).
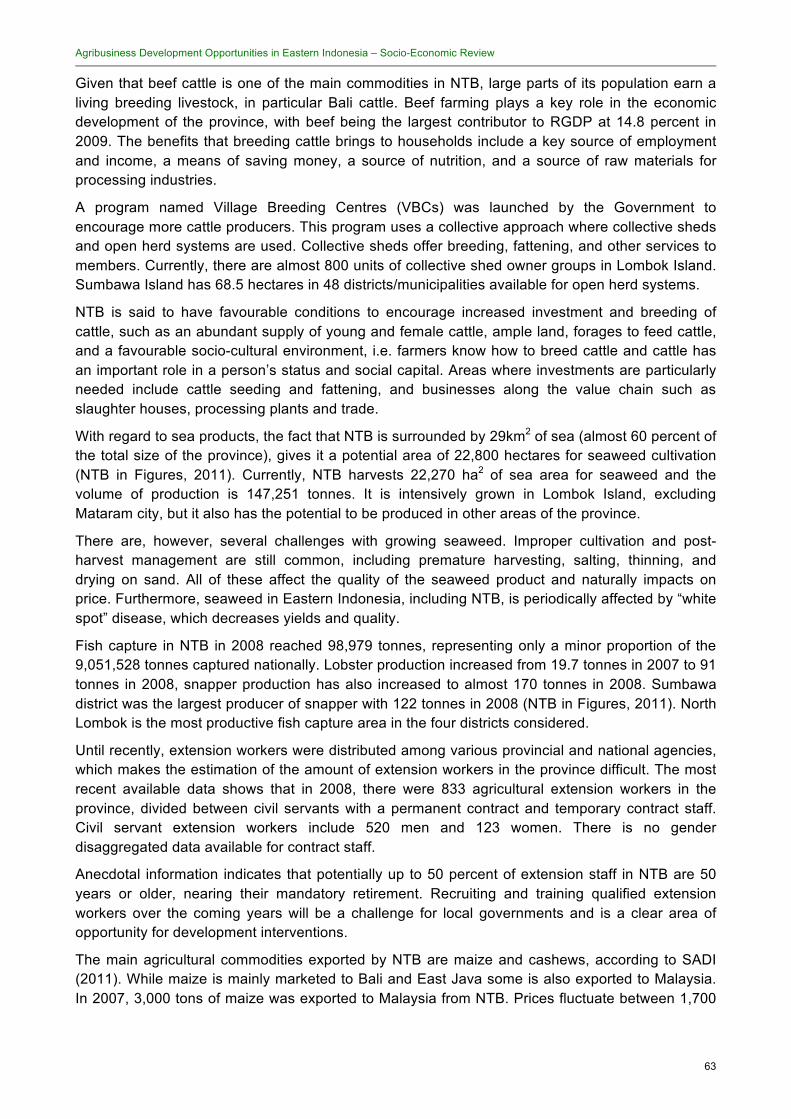
Agribusiness Development Opportunities in Eastern Indonesia – Socio-Economic Review
63
Given that beef cattle is one of the main commodities in NTB, large parts of its population earn a living breeding livestock, in particular Bali cattle. Beef farming plays a key role in the economic development of the province, with beef being the largest contributor to RGDP at 14.8 percent in 2009. The benefits that breeding cattle brings to households include a key source of employment and income, a means of saving money, a source of nutrition, and a source of raw materials for processing industries.
A program named Village Breeding Centres (VBCs) was launched by the Government to encourage more cattle producers. This program uses a collective approach where collective sheds and open herd systems are used. Collective sheds offer breeding, fattening, and other services to members. Currently, there are almost 800 units of collective shed owner groups in Lombok Island. Sumbawa Island has 68.5 hectares in 48 districts/municipalities available for open herd systems.
NTB is said to have favourable conditions to encourage increased investment and breeding of cattle, such as an abundant supply of young and female cattle, ample land, forages to feed cattle, and a favourable socio-cultural environment, i.e. farmers know how to breed cattle and cattle has an important role in a person’s status and social capital. Areas where investments are particularly needed include cattle seeding and fattening, and businesses along the value chain such as slaughter houses, processing plants and trade.
With regard to sea products, the fact that NTB is surrounded by 29km2 of sea (almost 60 percent of the total size of the province), gives it a potential area of 22,800 hectares for seaweed cultivation (NTB in Figures, 2011). Currently, NTB harvests 22,270 ha2 of sea area for seaweed and the volume of production is 147,251 tonnes. It is intensively grown in Lombok Island, excluding Mataram city, but it also has the potential to be produced in other areas of the province.
There are, however, several challenges with growing seaweed. Improper cultivation and post-harvest management are still common, including premature harvesting, salting, thinning, and drying on sand. All of these affect the quality of the seaweed product and naturally impacts on price. Furthermore, seaweed in Eastern Indonesia, including NTB, is periodically affected by “white spot” disease, which decreases yields and quality.
Fish capture in NTB in 2008 reached 98,979 tonnes, representing only a minor proportion of the 9,051,528 tonnes captured nationally. Lobster production increased from 19.7 tonnes in 2007 to 91 tonnes in 2008, snapper production has also increased to almost 170 tonnes in 2008. Sumbawa district was the largest producer of snapper with 122 tonnes in 2008 (NTB in Figures, 2011). North Lombok is the most productive fish capture area in the four districts considered.
Until recently, extension workers were distributed among various provincial and national agencies, which makes the estimation of the amount of extension workers in the province difficult. The most recent available data shows that in 2008, there were 833 agricultural extension workers in the province, divided between civil servants with a permanent contract and temporary contract staff. Civil servant extension workers include 520 men and 123 women. There is no gender disaggregated data available for contract staff.
Anecdotal information indicates that potentially up to 50 percent of extension staff in NTB are 50 years or older, nearing their mandatory retirement. Recruiting and training qualified extension workers over the coming years will be a challenge for local governments and is a clear area of opportunity for development interventions.
The main agricultural commodities exported by NTB are maize and cashews, according to SADI (2011). While maize is mainly marketed to Bali and East Java some is also exported to Malaysia. In 2007, 3,000 tons of maize was exported to Malaysia from NTB. Prices fluctuate between 1,700
Agribusiness Development Opportunities in Eastern Indonesia – Socio-Economic Review
64
and 2,800/kg dry grain. SADI (2011) also reports that cashews are exported to India and Vietnam (for further processing), and to China (without information on volumes and/or values).
4.2.6 Infrastructure
In 2010 the length of roads crossing NTB reached 2,474.5 km. Based on the official classification of roads, 632.17 km of those are national roads and 1,772.27 km are provincial roads. In terms of road conditions, only 45.6 percent are considered to be good.
Table 44: Number and Quality of Primary and Secondary Roads in NTB (2010)
North Lombok
West Lombok Dompu Bima NTB
Good (km) 41.47 232.25 38.00 33,940.00 467.53 Moderate (km) 61.66 29.92 52.20 46.34 364.51 Damaged (km) 149.69 184.31 98.09 343.38 801.03
District road District road District road
District road
Provincial road
Railroads (km) 0 0 0 0 0 Ports and landing sites 0 1 0 1 3
Airports 0 0 0 1 3 Source of data: NTB in Figures, 2011
By 2010 the number of motor vehicles circulating in these islands had reached 877,950 units, an increase of 13.2 percent from the previous year. This consists of: 32,581 cars, 4,558 buses, 32,320 trucks/vans, and 808,491 motorcycles. The increase of vehicles can be seen as a clear improvement in mobility, and the large number of trucks and vans suggests an increase in the volume of goods transported (SADI, 2010).
Air transportation in NTB takes place via three airports: Selaparang Mataram, the Airport Brang Seeds in Sumbawa and Bima Airport in Salahuddin. Air traffic has also increased overall over the last few years, mainly due to tourism.
In addition to roads and air, maritime transport has played an important role in NTB with thousands of foreign and national ships uploading and unloading cargo and passengers.
4.2.7 Credit Table 45 shows the number of agro-credit providers in NTB and in the districts selected for this study. As the table shows, Bima district has a higher number of agro-credit providers than the three other districts, representing almost ten percent of the total number of commercial and rural banks’ branches in the province.
Table 45: Number of bank offices in NTB and total credit disbursed (2010)
North Lombok
West Lombok
Dompu Bima NTB
Commercial Bank 6 7 10 22 208 Rural Bank 4 19 4 16 112 Number of bank offices 10 36 14 38 320 No of saving accounts 1,281,532 Cooperatives 97 375 184 216 3,551 Funds Deposit (IDR) 8,55 Billion Credit Disbursed (IDR) 9,5 Billion
Source: BPS online, 2012
As of 2009, NTB also had 17 micro finance institutions (SADI, 2011).

Agribusiness Development Opportunities in Eastern Indonesia – Socio-Economic Review
65
4.3 Jawa Timur (East Java) East Java (Indonesian: Jawa Timur, Javanese: Jawa Wétan) is located on the eastern part of the island of Java and includes neighboring Madura and other islands to its east (the Kangean and Sapudi groups) and to its north Bawean and the Masalembu Islands.
The provincial capital is Surabaya, the second largest city in Indonesia and a major industrial centre and port. The province covers 47,963.00 km2 and has a total population of 37,476,757 people (16 percent of Indonesia’s population). The province has a population density of 770 people/km2 (Indonesian Government, 2010), with almost 50 percent of its residents living in urban areas. The population of East Java is almost equally split between men and women, with women being marginally more.
Table 46: Population and density per district and sex (2010)
Situbondo Sampang Malang Trenggalek East Java Male 315,912 427,896 1,232,841 406,450 18,503,516 Female 331,707 449,876 1,214,210 398,632 18,973,241 Total 647,619 877,772 2,447,051 805,082 37,476,757 Population density (people/km2)
395 712 756 638 781
Source: East Java in Figures, 2011
There are 9,230,205 children under the age of 15 in East Java. The population over the age of 65 is 2,884,762 people, resulting in a 2:1 dependency ratio, with two working adults supporting one dependent.
In 2010, East Java had 10,379,500 million households. The average family size in the province is 3.3 people, with an average of 3 people per family in Situbondo, 3.5 in Trenggaek, 3.7 in Malang and 4 members per family in Sampang (SYI, 2011).
The percentage of female-headed households in East Java in 2010 was 15.8 percent, slightly lower than 16.7 percent reported in 2009. This figure is lower in rural areas where in 2010, 15.2 percent of households were headed by women. This is important because women are associated with aspects of household welfare. Female-headed households are, for example, typically poorer than male-headed households and tend to have a restricted labour force and access to income opportunities.
In East Java over 95 percent of the population is Muslim. There is also a small Protestant population (2.2 percent) and a smaller Catholic population (1.3 percent). There are also smaller groups of Hindu (0.6 percent), Buddhist (0.3 percent), and other religious groups in the province.
East Java can be divided into two areas: East Java mainland and Madura Island. The first comprises 90 percent of the province and the second only 10 percent. East Java is divided in 29 regencies (districts) and 9 cities. These in turn are divided into 662 sub-districts and 8,506 villages.
The four districts selected for this study are Malang, Sampang, Situbondo and Trenggalek (See Table 47). Malang regency is located in the central region of East Java and its capital is Kepanjen. It covers an area of 3,238.26km2 and has a population of 2,447,051 people. Among the selected regencies, Malang is by far the most populated district and is also the most densely populated with 756 people/km2.
Trenggalek Regency is in the west region of the province, with the central government located in Trenggalek City. This regency has an area of 1,261.40 km2 and has a population of 805,082
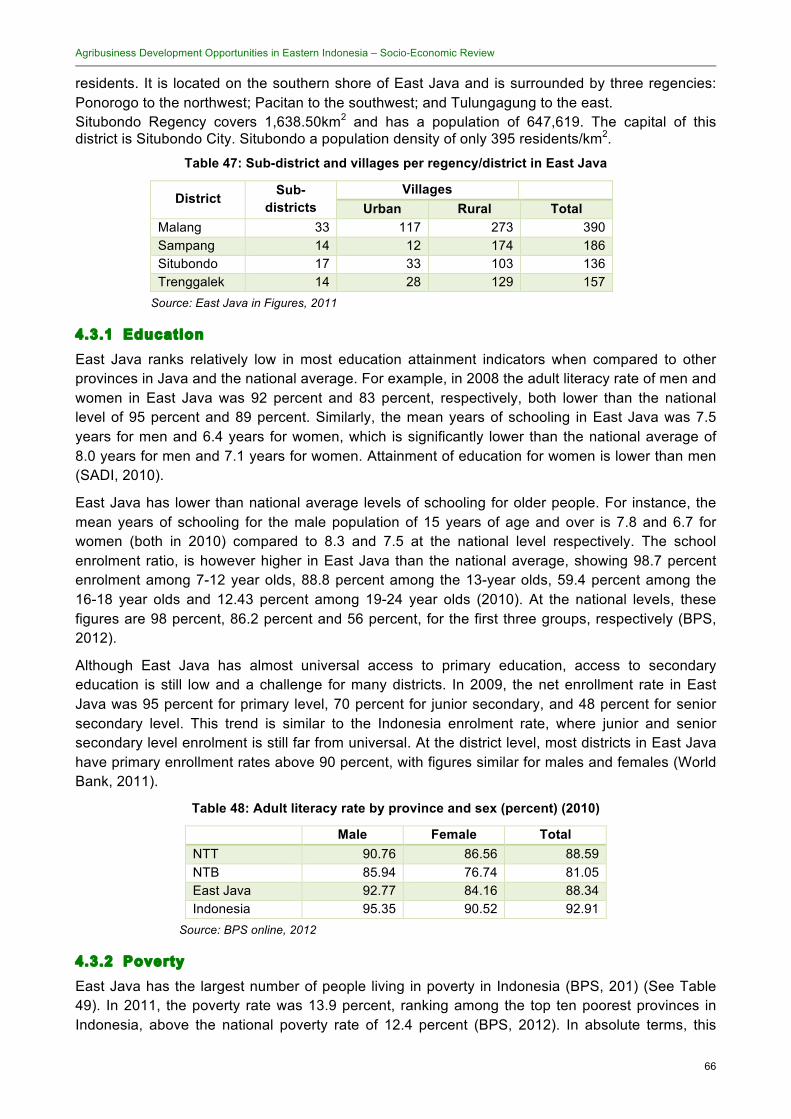
Agribusiness Development Opportunities in Eastern Indonesia – Socio-Economic Review
66
residents. It is located on the southern shore of East Java and is surrounded by three regencies: Ponorogo to the northwest; Pacitan to the southwest; and Tulungagung to the east. Situbondo Regency covers 1,638.50km2 and has a population of 647,619. The capital of this district is Situbondo City. Situbondo a population density of only 395 residents/km2.
Table 47: Sub-district and villages per regency/district in East Java
Villages District Sub-
districts Urban Rural Total Malang 33 117 273 390 Sampang 14 12 174 186 Situbondo 17 33 103 136 Trenggalek 14 28 129 157
Source: East Java in Figures, 2011
4.3.1 Education East Java ranks relatively low in most education attainment indicators when compared to other provinces in Java and the national average. For example, in 2008 the adult literacy rate of men and women in East Java was 92 percent and 83 percent, respectively, both lower than the national level of 95 percent and 89 percent. Similarly, the mean years of schooling in East Java was 7.5 years for men and 6.4 years for women, which is significantly lower than the national average of 8.0 years for men and 7.1 years for women. Attainment of education for women is lower than men (SADI, 2010).
East Java has lower than national average levels of schooling for older people. For instance, the mean years of schooling for the male population of 15 years of age and over is 7.8 and 6.7 for women (both in 2010) compared to 8.3 and 7.5 at the national level respectively. The school enrolment ratio, is however higher in East Java than the national average, showing 98.7 percent enrolment among 7-12 year olds, 88.8 percent among the 13-year olds, 59.4 percent among the 16-18 year olds and 12.43 percent among 19-24 year olds (2010). At the national levels, these figures are 98 percent, 86.2 percent and 56 percent, for the first three groups, respectively (BPS, 2012).
Although East Java has almost universal access to primary education, access to secondary education is still low and a challenge for many districts. In 2009, the net enrollment rate in East Java was 95 percent for primary level, 70 percent for junior secondary, and 48 percent for senior secondary level. This trend is similar to the Indonesia enrolment rate, where junior and senior secondary level enrolment is still far from universal. At the district level, most districts in East Java have primary enrollment rates above 90 percent, with figures similar for males and females (World Bank, 2011).
Table 48: Adult literacy rate by province and sex (percent) (2010)
Male Female Total NTT 90.76 86.56 88.59 NTB 85.94 76.74 81.05 East Java 92.77 84.16 88.34 Indonesia 95.35 90.52 92.91
Source: BPS online, 2012
4.3.2 Poverty East Java has the largest number of people living in poverty in Indonesia (BPS, 201) (See Table 49). In 2011, the poverty rate was 13.9 percent, ranking among the top ten poorest provinces in Indonesia, above the national poverty rate of 12.4 percent (BPS, 2012). In absolute terms, this
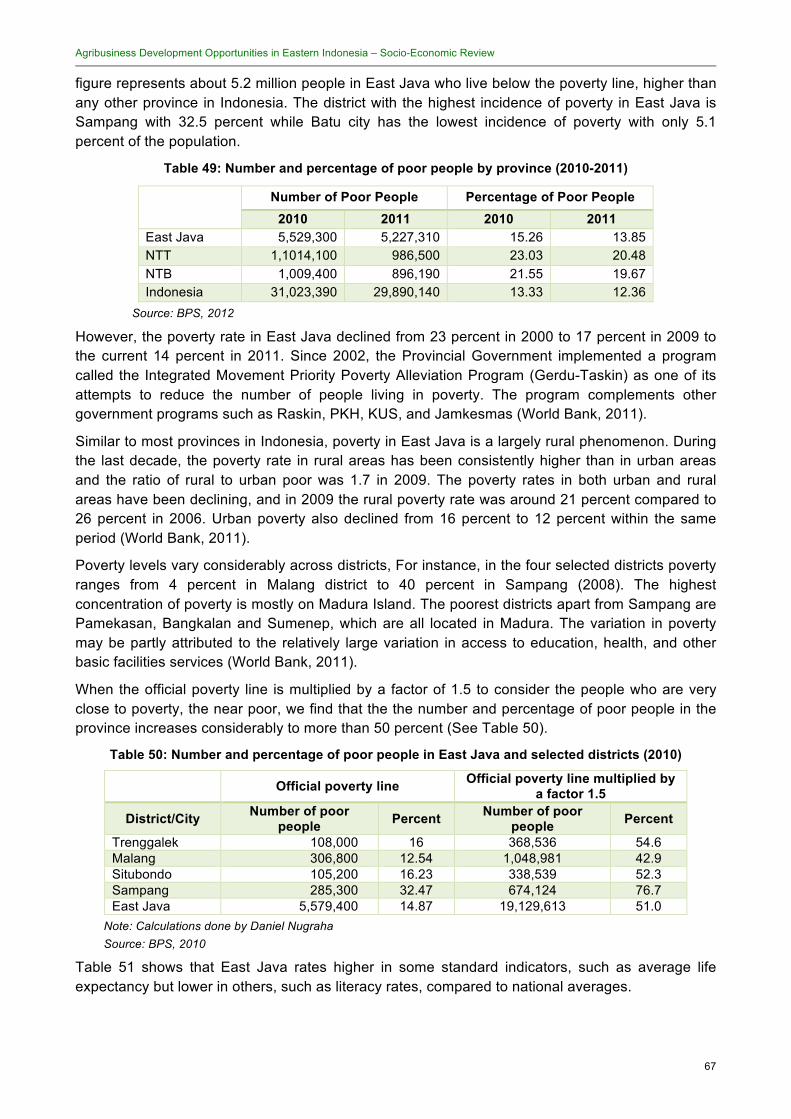
Agribusiness Development Opportunities in Eastern Indonesia – Socio-Economic Review
67
figure represents about 5.2 million people in East Java who live below the poverty line, higher than any other province in Indonesia. The district with the highest incidence of poverty in East Java is Sampang with 32.5 percent while Batu city has the lowest incidence of poverty with only 5.1 percent of the population.
Table 49: Number and percentage of poor people by province (2010-2011)
Number of Poor People Percentage of Poor People
2010 2011 2010 2011 East Java 5,529,300 5,227,310 15.26 13.85 NTT 1,1014,100 986,500 23.03 20.48 NTB 1,009,400 896,190 21.55 19.67 Indonesia 31,023,390 29,890,140 13.33 12.36
Source: BPS, 2012
However, the poverty rate in East Java declined from 23 percent in 2000 to 17 percent in 2009 to the current 14 percent in 2011. Since 2002, the Provincial Government implemented a program called the Integrated Movement Priority Poverty Alleviation Program (Gerdu-Taskin) as one of its attempts to reduce the number of people living in poverty. The program complements other government programs such as Raskin, PKH, KUS, and Jamkesmas (World Bank, 2011).
Similar to most provinces in Indonesia, poverty in East Java is a largely rural phenomenon. During the last decade, the poverty rate in rural areas has been consistently higher than in urban areas and the ratio of rural to urban poor was 1.7 in 2009. The poverty rates in both urban and rural areas have been declining, and in 2009 the rural poverty rate was around 21 percent compared to 26 percent in 2006. Urban poverty also declined from 16 percent to 12 percent within the same period (World Bank, 2011).
Poverty levels vary considerably across districts, For instance, in the four selected districts poverty ranges from 4 percent in Malang district to 40 percent in Sampang (2008). The highest concentration of poverty is mostly on Madura Island. The poorest districts apart from Sampang are Pamekasan, Bangkalan and Sumenep, which are all located in Madura. The variation in poverty may be partly attributed to the relatively large variation in access to education, health, and other basic facilities services (World Bank, 2011).
When the official poverty line is multiplied by a factor of 1.5 to consider the people who are very close to poverty, the near poor, we find that the the number and percentage of poor people in the province increases considerably to more than 50 percent (See Table 50).
Table 50: Number and percentage of poor people in East Java and selected districts (2010)
Official poverty line Official poverty line multiplied by a factor 1.5
District/City Number of poor people Percent Number of poor
people Percent
Trenggalek 108,000 16 368,536 54.6 Malang 306,800 12.54 1,048,981 42.9 Situbondo 105,200 16.23 338,539 52.3 Sampang 285,300 32.47 674,124 76.7 East Java 5,579,400 14.87 19,129,613 51.0
Note: Calculations done by Daniel Nugraha Source: BPS, 2010
Table 51 shows that East Java rates higher in some standard indicators, such as average life expectancy but lower in others, such as literacy rates, compared to national averages.
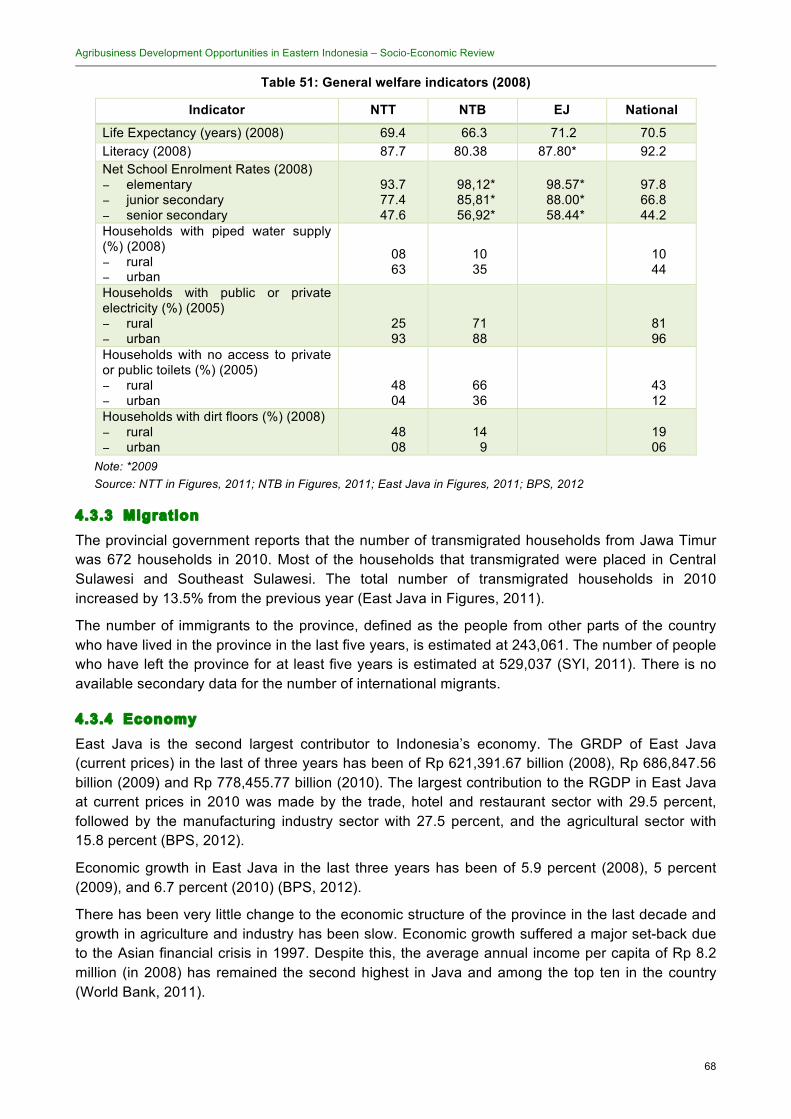
Agribusiness Development Opportunities in Eastern Indonesia – Socio-Economic Review
68
Table 51: General welfare indicators (2008)
Indicator NTT NTB EJ National
Life Expectancy (years) (2008) 69.4 66.3 71.2 70.5 Literacy (2008) 87.7 80.38 87.80* 92.2 Net School Enrolment Rates (2008) − elementary − junior secondary − senior secondary
93.7 77.4 47.6
98,12* 85,81* 56,92*
98.57* 88.00* 58.44*
97.8 66.8 44.2
Households with piped water supply (%) (2008) − rural − urban
08 63
10 35
10 44
Households with public or private electricity (%) (2005) − rural − urban
25 93
71 88
81 96
Households with no access to private or public toilets (%) (2005) − rural − urban
48 04
66 36
43 12
Households with dirt floors (%) (2008) − rural − urban
48 08
14
9
19 06
Note: *2009 Source: NTT in Figures, 2011; NTB in Figures, 2011; East Java in Figures, 2011; BPS, 2012
4.3.3 Migration The provincial government reports that the number of transmigrated households from Jawa Timur was 672 households in 2010. Most of the households that transmigrated were placed in Central Sulawesi and Southeast Sulawesi. The total number of transmigrated households in 2010 increased by 13.5% from the previous year (East Java in Figures, 2011).
The number of immigrants to the province, defined as the people from other parts of the country who have lived in the province in the last five years, is estimated at 243,061. The number of people who have left the province for at least five years is estimated at 529,037 (SYI, 2011). There is no available secondary data for the number of international migrants.
4.3.4 Economy East Java is the second largest contributor to Indonesia’s economy. The GRDP of East Java (current prices) in the last of three years has been of Rp 621,391.67 billion (2008), Rp 686,847.56 billion (2009) and Rp 778,455.77 billion (2010). The largest contribution to the RGDP in East Java at current prices in 2010 was made by the trade, hotel and restaurant sector with 29.5 percent, followed by the manufacturing industry sector with 27.5 percent, and the agricultural sector with 15.8 percent (BPS, 2012).
Economic growth in East Java in the last three years has been of 5.9 percent (2008), 5 percent (2009), and 6.7 percent (2010) (BPS, 2012).
There has been very little change to the economic structure of the province in the last decade and growth in agriculture and industry has been slow. Economic growth suffered a major set-back due to the Asian financial crisis in 1997. Despite this, the average annual income per capita of Rp 8.2 million (in 2008) has remained the second highest in Java and among the top ten in the country (World Bank, 2011).

Agribusiness Development Opportunities in Eastern Indonesia – Socio-Economic Review
69
Table 52: Structure of RGDP in East Java 2006-2010
Contribution to RGDP Sector
2006 2010 % Change
1. Agriculture 17.1 15.7 -1.4 2. Mining & Excavation 2.1 2.2 0.1 3. Industry 29.2 27.5 -1.7 4. Power, Gas, & Consumption Water 1.5 1.5 0.0 5. Building/Construction 4.0 4.5 0.5 6. Commerce 27.2 29.5 2.3 7. Transportation & Communication 5.3 5.5 0.2 8. Financial, Rental, and Corporate Service 4.6 4.9 0.3 9. Services 8.8 8.7 7.1
Source: Own calculations based on East Java in Figures, 2011
The economic activity in East Java is concentrated mostly in five districts, with Kota Surabaya accounting for over 26 percent of the total GDP and together with another three districts, namely Sidoarjo, Gresik, Malang and Kediri city contributed to about 52 percent to the overall GDP of East Java in 2008 (World Bank, 2011). These are the five most industrialised areas in the province.
Of the four districts selected for this study, Malang contributes most to the overall provincial GDP in 2008, with 4 percent, while the other three districts contribute 1 percent each. The disparity between district economies seems to persist with some districts consistently doing well, while others being consistently poor. In 2008, Malang city has the third largest GDP per capita, while Sampang and Treggalek are consistently very poor (World Bank, 2011).
There are also important disparities in the income that households receive in different districts. For instance, while the annual average household income in East Java in 2008 was Rp 20,771,660, the average annual income of households in Malang was Rp 13,484,050.63, Rp 13,133,915.61 in Situbondo, and a much lower average annual income of households in Trenggalek and Sampang at Rp 8,963,685.71 and Rp 6,901,791.83 respectively (World Bank, 2011).
In addition to low per capita rates in many of the districts, many have growth rates consistently below the provincial average and many have slipped back in comparison to the growth experienced in the 1980s and 1990s.
As of February 2011, East Java had 20.25 million people considered economically active. Of these, 19.41 million people were working and 845,650 unemployed, representing an open unemployment rate of 4.2% (BPS, 2011).
The reported percentage of people within families that work as farmers also varies from the provincial average of 68 percent. For example, while on average 62 percent of family members work as farmers in Malang district, this figure goes up to 68.9 percent in Situbondo, and to 81.3 percent in Trenggalek and up to 89.7 percent in Sampang district, reflecting the variable dependency on farming of families from different districts in this province (Agricultural Census, 2003).
4.3.5 Agriculture Agriculture takes up about 74 percent of the land in East Java and there is limited opportunity to expand beyond this (World Bank, 2011). There is also a low land-labour ratio (0.4 ha per farmer) with too many farmers working the limited available land, thus resulting in a large number of smallholdings, with an average of 0.4 ha per household with slight variations between districts (World Bank, 2011). Such relatively small plots are thus mainly focused on subsistence farming,

Agribusiness Development Opportunities in Eastern Indonesia – Socio-Economic Review
70
with limited surplus produce for sale. Ninety percent of farmers who sell their products often face low prices and high production costs.
According to the last agricultural census (2003) the average size of land owned by farmers in East Java is 0.46 ha. This of course varies across the province. For instance, the average size of landholding in Trenggalek and Sampang districts is 0.39 ha, while it is 0.46 ha in Situbondo and 0.48 ha in Malang district (Agricultural Census, 2003).
A recent report by the World Bank (2011) suggests that improvement in land to farmer ratio can only happen if the numbers of farmers are reduced by helping them move out to other non-farming employment. Interventions to achieve this may want to focus on facilitating diversification into higher value-added agriculture products such as horticulture, livestock breeding and organic farming; improving the skills through extension services and non-formal trainings; and providing greater access to credit (World Bank, 2011).
Farming in East Java is predominantly small scale and based on owner-occupied farms covering only a few hectares and frequently even less (average of 0.4 ha per household). A high percentage of farmers own the land where they work. According to the last agricultural census (Census 2003), 85 percent of farmers in Trenggalek own their land, while 10% are landless and only 6 percent lease land to farm.
Table 53 shows the average production of some food crops in East Java between 2005 and 2010.
Table 53: Average production area and productivity of food crops in East Java (2005-2010)
Commodity Production (Ton)
Area (Ha)
Productivity (t/ha)
Rice 10,188,979 1,804,050 5.64 Maize 4,761,502 1,207,930 3.93 Soybean 313,228 238,329 1.31 Cassava 3,591,880 220,880 16.35 Sweet potatoes 148,530 14,427 10.31 Mung bean 152,102 72,005 1.13 Peanut 208,527 176,213 1.18
Source: Own calculations based on BPS, 2012
In 2011, East Java produced 10,576,543 tonnes of paddy rice in a harvested area of 1,926,796 ha, resulting in a productivity of 5.49 t/ha, one of the highest in the country (BPS, 2012). Among the selected districts for this study, Malang is the district with the highest production and productivity, while Trenggalek has the lowest production and harvested area, with a considerable lower level of productivity. In Eastern Java, Jember district is the highest producer of paddy rice (851,598 t from 153,331 ha), while Pamekasan is the lowest (130,991 t from 22,637 ha) in the province. The harvested areas and production of dryland paddy are considerably lower than those of wetland paddy.
With regard to maize, East Java is by far the province with the highest production of maize in the country, and one of the provinces with the highest productivity. In 2011, the province produced 5,443,705 tonnes of maize (up from 4,252,182 tonnes in 2007) from a harvested area of 1,204,063 ha, with a productivity of 4.44 t/ha (BDS, 2012). The district with the highest area harvested is Sumenep, followed by Tuban, and Sampang districts. Trenggalek is one of the districts with the lowest harvested areas and production of maize in the province.
East Java has increased its production of soy bean from 277,281 in 2008 to 366,999 tonnes in 2011, the highest production in the country. The total harvested area was 252,815 ha, achieving a productivity of 1.5 t/ha, one of the highest in the country, behind Sumatra Selatan (1.58 t/ha), Sulawesi Selatan (1.57 t/ha) and West Java (15.7 t/ha) (SBD, 2012). Sampang is one of the
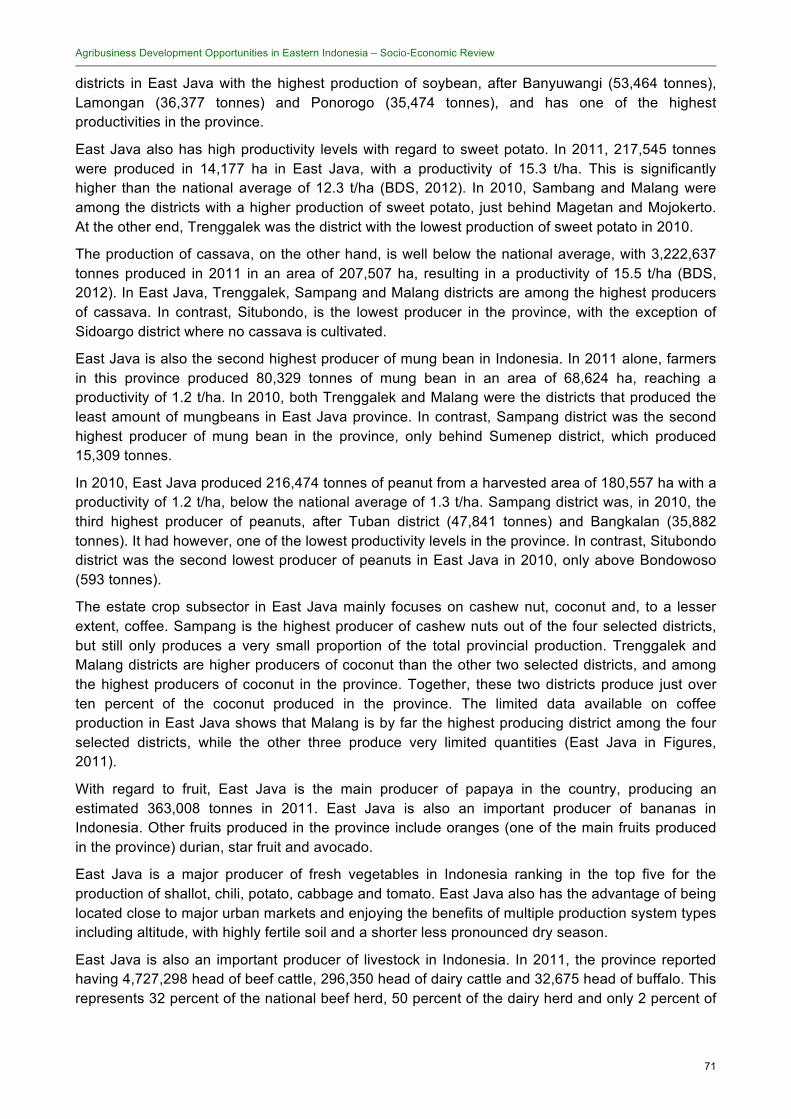
Agribusiness Development Opportunities in Eastern Indonesia – Socio-Economic Review
71
districts in East Java with the highest production of soybean, after Banyuwangi (53,464 tonnes), Lamongan (36,377 tonnes) and Ponorogo (35,474 tonnes), and has one of the highest productivities in the province.
East Java also has high productivity levels with regard to sweet potato. In 2011, 217,545 tonnes were produced in 14,177 ha in East Java, with a productivity of 15.3 t/ha. This is significantly higher than the national average of 12.3 t/ha (BDS, 2012). In 2010, Sambang and Malang were among the districts with a higher production of sweet potato, just behind Magetan and Mojokerto. At the other end, Trenggalek was the district with the lowest production of sweet potato in 2010.
The production of cassava, on the other hand, is well below the national average, with 3,222,637 tonnes produced in 2011 in an area of 207,507 ha, resulting in a productivity of 15.5 t/ha (BDS, 2012). In East Java, Trenggalek, Sampang and Malang districts are among the highest producers of cassava. In contrast, Situbondo, is the lowest producer in the province, with the exception of Sidoargo district where no cassava is cultivated.
East Java is also the second highest producer of mung bean in Indonesia. In 2011 alone, farmers in this province produced 80,329 tonnes of mung bean in an area of 68,624 ha, reaching a productivity of 1.2 t/ha. In 2010, both Trenggalek and Malang were the districts that produced the least amount of mungbeans in East Java province. In contrast, Sampang district was the second highest producer of mung bean in the province, only behind Sumenep district, which produced 15,309 tonnes.
In 2010, East Java produced 216,474 tonnes of peanut from a harvested area of 180,557 ha with a productivity of 1.2 t/ha, below the national average of 1.3 t/ha. Sampang district was, in 2010, the third highest producer of peanuts, after Tuban district (47,841 tonnes) and Bangkalan (35,882 tonnes). It had however, one of the lowest productivity levels in the province. In contrast, Situbondo district was the second lowest producer of peanuts in East Java in 2010, only above Bondowoso (593 tonnes).
The estate crop subsector in East Java mainly focuses on cashew nut, coconut and, to a lesser extent, coffee. Sampang is the highest producer of cashew nuts out of the four selected districts, but still only produces a very small proportion of the total provincial production. Trenggalek and Malang districts are higher producers of coconut than the other two selected districts, and among the highest producers of coconut in the province. Together, these two districts produce just over ten percent of the coconut produced in the province. The limited data available on coffee production in East Java shows that Malang is by far the highest producing district among the four selected districts, while the other three produce very limited quantities (East Java in Figures, 2011).
With regard to fruit, East Java is the main producer of papaya in the country, producing an estimated 363,008 tonnes in 2011. East Java is also an important producer of bananas in Indonesia. Other fruits produced in the province include oranges (one of the main fruits produced in the province) durian, star fruit and avocado.
East Java is a major producer of fresh vegetables in Indonesia ranking in the top five for the production of shallot, chili, potato, cabbage and tomato. East Java also has the advantage of being located close to major urban markets and enjoying the benefits of multiple production system types including altitude, with highly fertile soil and a shorter less pronounced dry season.
East Java is also an important producer of livestock in Indonesia. In 2011, the province reported having 4,727,298 head of beef cattle, 296,350 head of dairy cattle and 32,675 head of buffalo. This represents 32 percent of the national beef herd, 50 percent of the dairy herd and only 2 percent of

Agribusiness Development Opportunities in Eastern Indonesia – Socio-Economic Review
72
buffaloes in the country. As a result, in 2011 East Java produced 110,940 tonnes of meat (beef) and 573 tonnes of buffalo meat (BPS, 2012).
The total number of livestock shipped out of East Java has seen a decline in recent years. For example, the number of cows shipped out of East Java has decreased to 126,830, in comparison to 146,832 in 2009 and 143,499 in 2008 (East Java in figures, 2011). Most of the large livestock shipped out of East Java came from Ngawi and Banyuwangi districts, with 18,424 and 17,668 cows exported by these districts, respectively.
Regarding small livestock, households in East Java are more prone to raising chicken and hens, most probably mainly for household consumption. The production of eggs in East Java in 2010 was 257,529,013 kg, the largest contribution coming from Blitar district (94,819,206 kg). Trenggalek district produced 2,594,251 kg of eggs, Malang produced 12,328,113 kg of eggs, Situbongo a much lower 592,610 kg and Sampang only produced 448,131 kg making the lowest producer of eggs in the province.
East Java has a reported population of 467,210 fishermen and fishpond farmers. Trenggalek district reports a population of 11,903 fishermen/fishpond farmers, out of which 9,610 practice marine fisheries. In Malang district there are 10,255 reported fishermen/fishpond farmers, of which 2,175 practice marine fishery, 2,749 practice fresh water pond fishing and 2,434 practice floating net fishing (East Java in Figures, 2011). Situbondo reports having 14,214 fishermen/fishpond farmers, of which 12,109 practice marine fishery. Sampang has 31,086 fishermen/fishpond farmers, of which 27,203 practice marine fishery and 3,441 fish in brackish water ponds (East Java in Figures, 2011). Malang district has the highest value of fish production in 2010, followed by Sampang. At the provincial level they are among the highest, just after Sumenep and Lamongan.
4.3.6 Infrastructure East Java has a total of 907,374 ha of irrigation, divided between small-scale irrigation within the district, inter-district irrigation and inter-province irrigation. Malang district is one of the districts in the province with the largest area of irrigation at 42,325 ha. Of these, over 30,000 ha are in field sizes less than 1,000 ha, mostly within the district. Situbondo district has more than 30,000 ha of irrigation. Over 20,000 ha of these are in areas of more than 3,000 ha, most probably in large plantations or estates. Trenggalek district has a total of 11,500 ha of irrigation, mostly in smaller areas of irrigation of less than 1,000 ha within the district.
Table 54 shows a breakdown of the availability of roads and other transportation links at provincial and district levels (for East Java and the four selected districts for this study). As the table shows, Sampang has the poorest quality of roads and links among the four selected districts. Poor roads are a significant obstacle to the integration of producers to large wholesale and retail markets, where they can fetch better prices than at local village markets or from collectors. The state of the infrastructure and transport links influences both the cost and length of time needed for transportation, thus directly affecting profitability and competitiveness.

Agribusiness Development Opportunities in Eastern Indonesia – Socio-Economic Review
73
Table 54: Number and quality of roads, railroads, ports and airports (2010)
Situbondo Sampang Malang Trenggalek East Java
Good (km) 106.26 29.02 128.80 228.14 312.00 Moderate (km) 15.95 - - 208.46 1,236.42 Damaged (km) 4.80 88.55 - 523.33 452.86 Railroads (km) 895.75 Ports and landing sites 4 0 0 0 11 Airports 0 0 1 0 4
Source: Jawa Timur Province in figures, Hasil Survey Sosial Ekonomi Nasional Tahun 2010 Provinsi Jawa Timur
Overall, district roads remain in a worse condition than provincial or national roads, affecting farmers and many smaller rural businesses. Poor roads are a significant obstacle to the integration of producers to large wholesale and retail markets, where they can fetch better prices than at local village markets or from collectors. The state of the infrastructure and transport links influences both the cost and length of time needed for transportation, thus directly affecting profitability and competitiveness.
There is also a provincial rail link, and a number of ports and airports which link up the districts and the province with other neighbouring islands and the rest of the world. Of the four selected districts, only Situbondo has four ports or landing sites and only Malang has an airport, thus making the other districts entirely reliable on their road network to reach the first airport or port in order to link-up with external markets (East Java in Figures, 2011). Furthermore, literature suggests that the main port facility of Tanjung Perak is reaching maximum capacity thus limiting the future growth of volume of trade going through (World Bank, 2011).
Infrastructure is perceived by the private sector as the most critical constraint to their operations. According to a Regional Autonomy Watch Committee (Komite Pemantauan Pelaksanaan Otonomi Daerah) KPPOD and The Asia Foundation survey (2007), the majority of enterprises identify (poor) infrastructure as the main constraint to their operation. Nationally, 34.6 percent of enterprises considered poor infrastructure as the main constraint to do business, while in East Java 23.2 percent of enterprises identified it as their main area of concern.
Similarly, the Institute of Economic and Social Research - Faculty of Economic Universitas of Indonesia (Lembaga Penyelidikan Ekonomi dan Masyarakat – Fakultas Ekonomi Universitas Indonesia) LPEM FEUI’s Monitoring Investment Climate in Indonesia (MICI) Survey (2006) identified infrastructure issues, particularly electricity and transportation as among the factors that constitute a large constraint for business activity and expansion, together with macroeconomic instability, and corruption (World Bank, 2011).
The results of the survey, conducted by KPPOD and The Asia Foundation (2007) suggest that infrastructure is highlighted in both the national and East Java context as the most important impediment to do business. The second major constraint to business development in East Java is perceived to be the district government interaction with business people, followed by access to financial resources.
What this suggests, is that existing and potential business enterprises down the value chain, such as transportation, cold storage, and processing will suffer from the poor state of the infrastructure, including roads and ports, access to electricity and transaction costs.
The poor state of infrastructure is seen as one of the key drivers of the high logistics costs, driving the share of this cost to around 14 percent of the total production cost (World Bank, 2011).

Agribusiness Development Opportunities in Eastern Indonesia – Socio-Economic Review
74
The same study argues that the main obstacles to do business for farmers are low price of their products, expensive agricultural inputs and insufficient capital, among others.
4.3.7 Credit East Java has a relatively large number of banks in comparison to the rest of Indonesia. In 2008, East Java had 5.9 branches of banks for every one hundred km2, significantly higher than the Indonesian average (0.5 banks per 100 km2) and similar to the other provinces in Java such as West Java and Central Java. East Java’s ratio of banks per 10,000 people is also higher than the national average (World Bank, 2011).
Nonetheless, East Java’s ratio of credit to GDP is relatively low compared to other large provinces in Indonesia. At 19 percent of its GDP, credit in East Java is lower than the national average of 31 percent. Lack of demand for credit is reflected in the fact that many companies in East Java indicate that they often rely on self-financing or on funds from their companies’ headquarters. Companies do not generally rely on credit from banks for financing their business activities, including production and expansion. Medium size companies in East Java rely on self-financing from retained earnings or from partnerships in the form of joint ventures.
On the other hand, many of the retailers and traders that are involved in trading activities are often financed by suppliers, where factories or distributors provide the stock of goods with deferred or installment payment systems that are adjusted to the traders’ or retailers’ income (World Bank, 2011). However, the share of allocated credit used for investment and working capital in East Java is relatively high, suggesting that financing is not a constraint to growth.
The cost of capital in East Java generally follows national trends, however real lending rates for loans in East Java was 4.2 percent in 2008, slightly higher than the national rate at 3.3 percent. The slight difference in the cost of capital is explained by the difference in inflation rate between East Java and the national average (World Bank, 2011).
Agriculture is still deemed as a risky investment sector by banks. The share of credit allocated to the agriculture sector remains low at only 4 percent for the last three years. The low proportion of credit allocated to the agriculture sector is similar with the trends in other provinces in Indonesia. The default risk in agriculture is perceived as high, compared to the manufacturing and trade sectors.
Although still in its initial stage, several efforts have been introduced by some financial institutions such as training their officers on the agricultural risk appraisal and to hedge the risk using insurance instruments. Providing greater access to credit for the agriculture sector would be important to revitalize the sector that absorbs the largest employment in East Java, particularly to increase its productivity (World Bank, 2011).
In general, it appears that banks are reluctant to lend to agricultural businesses as well as to micro, small, and medium enterprises (SMEs). Lack of expertise and larger overhead costs on the part of banks are among the reasons behind the limited credit provided. The structure of credit is dominated by medium enterprises with around 65% of the total credit allocated to this segment. Small enterprises only have around 29% and micro enterprises a mere 6 percent of total credit to SMEs (World Bank, 2011).
The main barriers to credit for small businesses are the legal entity and official legal status; collateral requirements that respond to their capacity; and relatively high interest rates. Furthermore, there is a gap between the loan size required by SMEs and the loans provided by commercial banks.
Therefore, while credit is available in East Java it is mainly accessible to the medium to large entrepreneurs with small businesses being unable to take advantage of the financial services.

Agribusiness Development Opportunities in Eastern Indonesia – Socio-Economic Review
75
5 Conclusion The aim of this socio-economic review is to provide data that aids the selection of commodities for further research in five value chain studies. To this effect, the review has provided a comprehensive snapshot of the economic, social, agricultural and rural poverty context in Indonesia and the various socio-economic variables that make up the provinces of NTT, NTB and East Java.
In summary, Indonesia is still a youthful country, with more than 70 percent of its population (238 million) under the age of 40. It is also a country growing at a relatively low rate of 1.49 percent per year, with average annual growth rates in rural areas of only 0.77 percent over the last decade (UNDP, 2012). Despite important improvements in education (adult literacy rate of 92.91 percent), a large proportion of Indonesia’s population has limited skills. Addressing this problem will require monumental efforts from the public and private sector in education and training. Furthermore, while gender gaps in primary and secondary education are beginning to close, women tend to receive less further education and vocational skills training, which prevents them from pursuing their own livelihoods. Women are also less likely than men to be reached by extension services to be able to increase the resilience of agricultural livelihoods.
Indonesia’s life expectancy at birth has been increasing in recent years, largely an outcome of health and nutrition, yet important differences persist between provinces and between urban and rural areas. In 2010, life expectancy in the country was 70.9 years, compared to 70.4 in 2007.
While overall poverty levels in Indonesia, and the three provinces under study, have decreased, the geographic distribution of the poor remains largely unchanged. The majority remain in rural areas, where around half the country’s population lives, still primarily working in agriculture and deriving the majority of their income from agriculture, despite the rapid urbanisation and significant structural transformation of the Indonesian economy.
The share of the agricultural sector in the overall economy declined from 41 percent of GDP in 1970 to around 15 per cent in 2011. However, agriculture still contributes significantly to Indonesia’s economic growth. Furthermore, Indonesian agricultural production is increasingly shifting away from food crops, particularly towards horticulture and estate crop production. Nonetheless, the bulk of agricultural production in Indonesia remains in food crops. This shift away from food crop production has been seen across all regions, leading to weak growth in food crops across Indonesia, particularly in Java and Eastern Indonesia, although Java still dominates national agricultural production.
The decrease in contribution from the food crops sub-sector to agriculture can be attributed to a number of factors, including limited land availability and poor land quality, deteriorating infrastructure, poor water management, inadequate knowledge sharing and training/extension services, poor post-harvest handling and processing, poor governance and rural institutional support, and inappropriate decentralisation policies. Trade and market liberalisation has also encouraged diversification into higher-value export crops and government spending on agriculture services, irrigation, and research on specific high-value crops. Agricultural research investment in estate crops has been much higher than in food crops. Therefore, regions with estate crops have generally benefited from better government support to improvements in productivity.
Low levels of productivity are causing migration out of agriculture due to productivity at or below subsistence and into services or government employment. In some cases, this is highly gender-biased, as in the case of Dompu district in NTB where around 95 percent of migrants (estimated at 1 percent of the district population) are reported to be women, most probably going to work as domestic workers in other provinces or other countries in the region. However, overall rural to urban migration appears to play a relatively small role in explaining exits from poverty amongst
Agribusiness Development Opportunities in Eastern Indonesia – Socio-Economic Review
76
poor rural agricultural workers. While the majority of the poor remain in rural agriculture, remaining in rural agriculture has also been the principal means of exiting poverty in Indonesia (Rajah and McCulloch, 2012).
Agriculture is increasingly using most of the land available in some parts of the country, most notably in East Java, and soon there will be limited opportunity to expand beyond this. As more and more farmers work the limited available land, this will result in a larger number of smallholdings, already low at an average of 0.4 ha per household, and even less according to some reports. Such relatively small plots, which are mainly focused on subsistence farming, have limited surplus produce for sale. These types of farmers who sell their products often face low prices and high production costs. Increasing production will depend more on increasing productivity and making better use of existing resources, which will only come about with better agricultural techniques, acquired through training and education.
While actual potential yields will depend to some extent on the specific environmental conditions prevailing in each province, large gaps between high yield provinces and the rest suggest ample scope for raising Indonesia’s agricultural productivity. Despite growth in agricultural production, population and income growth have contributed to Indonesia’s agricultural import increases. The value of agricultural imports grew from over $650 million in 1975 to nearly $7 billion in 2009, an 8 per cent average annual increase (FAO, 2011).
Since the mid-1980s, the emphasis of Indonesia’s agricultural policy has shifted from self-sufficiency on food (rice) towards an industrial export-oriented development strategy. Trade liberalisation and a sharp currency devaluation after the Asian financial crisis of 1997 have increased the incentive of producers to focus on tropical perennial crops.
For poor agricultural workers, achieving productivity gains while remaining in agriculture has been the principal means of exiting poverty. However, addressing poverty through smallholder commercialization presents quite a challenge as there are a number of determinants in commercializing smallholder agriculture. Consideration has to be given to both the input and output sides of production, together with the decision-making behaviour of farm households in production and marketing simultaneously. Production decisions of commercialized farmers are based on market signals and comparative advantages, whereas those of subsistence farmers are based on production feasibility and subsistence requirements, and selling only whatever surplus product is left after household consumption requirements are met (Jaleta, Gebremedhin et al. 2009).
Perceived financial and labour risks compel subsistence farmers to adhere to the self-sufficiency objectives both in their production and consumption decisions. Furthermore, market and price fluctuations make market-oriented resource-allocation decisions of semi-subsistence farmers difficult, as cash income is increasingly important to guarantee household food security. Policy measures and focused interventions can play an important role in mitigating these risks. This can include improving the links between farmers and input sellers and buyers, to for instance, facilitating farmers’ access to information and/or credit in kind.
Whether smallholder commercialization creates more employment opportunities depends on the nature of the commodities grown, the technologies used in the production process, access to information and markets, and whether additional agricultural processing is involved.
This review has found however, that most agricultural trade in NTT is predominantly traded in small regional markets and onto larger markets in the main centres. Furthermore, for most food and estate crops the processing capability is limited. For example, there is no cocoa processing industry in NTT. Cocoa beans are sold through traders to Surabaya and Makassar where most cocoa processing industries are based. There is very little coffee processing in NTT, although coffee cherry peeling and washing is developing mainly through small donor and NGO assistance

Agribusiness Development Opportunities in Eastern Indonesia – Socio-Economic Review
77
projects in Flores. Coffee from NTT is shipped mainly to East Java (Surabaya). Some NTT coffee may be exported, but this is typically done through Surabaya as there is no facility for certificates of origin in NTT.
A similar situation is found in NTB, where as in other provinces in Indonesia, the irrigation infrastructure is poor and has been poorly maintained. The physical infrastructure, such as roads, ports, and rural utilities (i.e. electricity, sanitation and safe water) is also limited, complicating access to retail markets where prices tend to be better. For instance, only 45.6 per cent or roads in NTB are considered to be in good condition. The processing industry needed to support the agricultural sector has been showing good performance, although agro-industries – important in an economy dominated by agricultural employment – are still a very small component of the agricultural sector.
Furthermore, this review found that commercial banks, with a few exceptions, have largely been uninterested in providing finance to agriculture, agribusiness or rural SMEs, and trade-related money flows and trade-related financial products remain weak or non-existent. For instance, a study in East Java found that that the main obstacles to doing business for farmers are the low price of their products, expensive agricultural inputs and insufficient capital.
In the absence of sufficient formal credit, finance may come either from within the sector itself, through advances between businesses, often in the form of inputs or products, or from financial service providers, ranging from moneylenders to MFIs, and to banks. Financial service providers have funding resources, but may not understand sectors well, and are constrained by legal frameworks and collateral issues. An objective of increasing access to finance to the value chains would be to leverage the value chain relationships so that financial service providers can benefit from the advantages that value chain players have in extending credit to each other.
Increasing market participation has a positive impact on value chain actors such as input suppliers, output traders, transporters, processors, financiers and others. These actors may change the forms of products via processing, storing or transporting from one point to another based on market demands.
The drive towards a higher level of commercialisation consistent with broad-based growth and increasing farmer incomes depends on several factors, including effective institutions; improved infrastructure; knowledge management; adequate incentives; stakeholder’s initiative; and finally, a conducive environment.
Institutions, both formal and informal, have an important impact on the economic performance of different sectors and in the facilitation or hindrance of a smallholder commercialization process. Values, norms, sanctions, taboos, cultures and traditions also strongly influence smallholder production and marketing decisions, including those related to input use. Socio-cultural and religious factors determine consumption preferences of households, which can be a motivating or demotivating factor for household commercialization (Jaleta, Gebremedhin et al. 2009). For instance, the system of communal ownership of land found in some parts of NTT, where village leaders and elite members exercise discretionary control over the management of communal property and where overlapping rights exist, may be a disincentive for individual investments that could improve productivity.
Factors facilitating commercialization are mechanisms which will reduce transaction costs arising from activities such as exchange of goods and financial assets; enforcement of contracts; risk reduction; formation of organizations; and the acquisition and dissemination of information. The large amount of official and unofficial fees that are reported to be collected in seaports in NTT or the excessive checkpoints in roads in Kupang district in NTT will discourage farmers from bringing their products to markets due to excessive transportation costs and time.
Agribusiness Development Opportunities in Eastern Indonesia – Socio-Economic Review
78
Other important factors in increasing farm family incomes and agricultural commercialization include markets; contracts; farmer organizations and trade associations; standards; the formalisation of business transactions; monitoring and evaluation; research and extension; and credit and insurance.
Typically, non-farm activities are another way out of poverty. However, there seems to be very limited available and reliable information in this area, which therefore warrants further study. It is important to note, nonetheless, that adequate infrastructure is crucial for the development of non-farm activities, mainly rural SMEs. Good rural roads help rural populations’ access key services, including education and health, and improve opportunities for non-farm income generating activities. However, the infrastructure in Indonesia, including the three provinces under study is limited and poor, especially in rural areas. The poor state of much infrastructure limits the potential of individuals to access social services, such as schools and hospitals, and develop business opportunities. This also includes access to clean water, electricity and irrigation systems.
The transportation infrastructure in Indonesia is also generally limited. The preferred method of transporting goods within and between islands in the reviewed provinces is trucks and ferries. When public transport is weak and receives relatively little investment, many families and individuals are tempted to buy (cheap) cars or motos. The rise in the number of private vehicles in Indonesia has been accompanied by a significant expansion in (poor quality) road networks, while rail networks in contrast have seen decreases. However, the quality of roads remains generally poor, particularly in rural areas, affecting the poorer families more. At the provincial level, this presents a stark picture. Few quality roads and the resultant high numbers of impassable roads, makes access to farm lands and markets difficult.
In a country like Indonesia, the number and quality of ports is also of key importance. However, the situation of the ports is also poor. In NTT only the port in Tenau can receive large vessels with container facilities. Furthermore, ferry costs and waiting times add considerable cost to the transportation of goods, with ferry costs accounting for as much as 72-79 percent of overall transportation costs and waiting times reaching 76 percent of the overall journey time.
In East Java there is a provincial rail link, and a number of ports and airports which link up the districts and the province with other neighbouring islands and the rest of the world. Of the four districts reviewed here, only Situbondo has four ports or landing sites and only Malang has an airport, thus making the other districts entirely reliable on their road network to reach the first airport or port in order to link-up with external markets. Furthermore, this review found that the main port facility of Tanjung Perak is reaching maximum capacity thus limiting the future growth of volume of trade passing through it.
It is not surprising then, that infrastructure is perceived by the private sector in East Java as the most critical constraint to their operations. The second major constraint to business development in East Java is perceived to be the poor relationships between district government and with business people, followed by access to financial resources.
Finally, for commercialization to thrive there has to be cooperation among different stakeholders (in order to gain from improved access to technology, credit and markets) and the will to innovate (in order to stay abreast of competition from domestic and international markets). However, cooperation and innovation will not occur unless there are appropriate incentives and policies in place (Purcell, Gent et al. 2008). The limited evidence found on this topic suggests that the level of cooperation between farmers, and between farmers and other stakeholders is low.
As this review has highlighted, there are important data gaps among the three selected provinces, which is further accentuated at the district level. Whilst this may somewhat impede a clear assessment of the preferred commodities to select for this study, it provides clear guidance as to

Agribusiness Development Opportunities in Eastern Indonesia – Socio-Economic Review
79
where further research needs to be done and areas where the upcoming value chain studies can contribute to data collection. This includes information on prices and the creation of value along the value chain; existing wholesale and retail markets at the district and provincial level; processors and processing facilities; the state of irrigation at the district level; the role of collectors and traders in marketing; and the different sources of income of poorer households in different districts and the proportion of each source of income to the total income.

Agribusiness Development Opportunities in Eastern Indonesia – Socio-Economic Review
80
6 References Asian Development Bank (2006) Country Gender Assessment: Indonesia
Asian Development Bank (2009). Trade and Growth Hprizons for Nusa Tenggara Timur and Timor-Leste. Southeast Asia Working Paper Series, No. 4.
Barichello, R. (2010). A Review of Current Agricultural Issues and the Policy Framework in Indonesia, Consultant’s report prepared for the OECD project Economic Importance of Agriculture for Sustainable Economic Development and Poverty Reduction, Paris, October 2010.
Basri, M. and Patunru, A. (2006), "Survey of Recent Developments", Bulletin of Indonesian Economic Studies, p. 295-319.
Barlow, C. and R. Gondowarsito (2007). Socio-economic conditions and poverty alleviation in Nusa Tenggara Timur.
Badan Pusat Statistik-Statistics Indonesia (2012) Trends of Selected Socio-Economic Indicators of Indonesia. Statistical Yearbook of Indonesia.
Badan Pusat Statistik-Statistics (BPS) Indonesia (2011) Strategic Data. BPS.
Baden Pusat Statistik (BPS) Provinsi Nusa Tenggara Barat (2011). Nusa Tenggara Barat, Province in Figures 2011.
Baden Pusat Statistik (BPS) Provinsi Nusa Tenggara Timur (2011). Nusa Tenggara Timur, Province in Figures 2011.
Baden Pusat Statistik (BPS) Provinsi Jawa Timur (2011), East Java, Province in Figures 2011.
Badan Pusat Statistik-Statistics (BPS) Indonesia (2010), Strategic Data. BPS.
Baden Pusat Statistik (BPS) (2010), 2010 Indonesia Population Census.
Baden Pusat Statistik (BPS) Provinsi Nusa Tenggara Barat (2010). Nusa Tenggara Barat, Province in Figures 2010.
Baden Pusat Statistik (BPS) Provinsi Nusa Tenggara Timur (2010). Nusa Tenggara Timur, Province in Figures 2010.
Baden Pusat Statistik Provinsi Nusa Tenggara Timur (2009). Nusa Tenggara Timur, Province in Figures 2009.
Badan Pursat Statistik (BPS) (2003), Agricultural Census 2003.
Cervantes-Godoy, D. and J. Dewbre (2010), Economic Importance of Agriculture for Sustainable Development and Poverty Reduction: Findings from a Case Study of Indonesia, OECD.
Coles, C. and J. Mitchell, (2009) ‘Gender and agricultural value chains – a review of current knowledge and practice and their policy implications’, ODI Paper forthcoming for UN FAO SOFA 2010, ODI, UK.
Dewan Ketahanan Pangan and World Food Programme (2009), A Food Security and Vulnerability Atlas of Indonesia.
FAOSTAT (2011), FAO Online Database, FAO.
FAOSTAT (2009), FAO Online Database, FAO.
FAO (2008), Gender and Land Rights. Indonesia Country Report.

Agribusiness Development Opportunities in Eastern Indonesia – Socio-Economic Review
81
FAO (2004), Women in Agriculture, Environment and Rural Production.
Fuglie, K.O. 2009. “Sources of Growth in Indonesian Agriculture,” Journal of Productivity Analysis, Online First, September 16.
ICAR (2012) Global Conference on Women in Agriculture: Synthesis Report
IFAD (2008), Republic of Indonesia. Country Strategic Opportunities Programme.
IFPRI (2010), Markets for High-Value Commodities In Indonesia: Promoting Competitiveness And Inclusiveness, Project Note, December 2010.
Jaleta, M., B. Gebremedhin, et al. (2009), Smallholder commercialization: Processes, determinants and impact, International Livestock Research Institute, Kenya.
KPPOD and The Asia Foundation (2007) - Komite Pemantauan Pelaksanaan Otonomi Daerah (KPPOD) and the Asia Foundation. 2008. “Local Economic Governance in Indonesia: A Survey of Business in 243 Regencies/Cities in Indonesia, 2007”, Jakarta.
LPEM-FEUI and The Asia Foundation (2010), Transportation of Goods in East Nusa Tenggara: Problems and Costs.
LPEM-FEUI (2007). Monitoring Investment Climate in Indonesia: A Report from the Mid 2006 Survey, Report in collaboration with the World Bank, Jakarta.
Mafruhah, Izza and Nunung Sri Mulyani (2009) The problems of Indonesian migrant workers. (Case studies in Sragen Regency of Central Java, Indonesia).
McCulloch, N., Weisbrod, J. and Timmer, P. (2007), “Pathways out of Poverty During an Economic Crisis: An Empirical Assessment of Rural Indonesia”, World Bank Policy Research Working Paper 4173, March 2007.
Purcell, T., R. v. Gent, et al. (2008). Zambia Participatory Value Chain Management for Poverty Reduction, FAO.
Quisumbing, Agnes R. & Brown, Lynn R. & Feldstein, Hilary Sims & Haddad, Lawrence James & Peña, Christine, 1995. "Women: The key to food security," Food policy reports 5, International Food Policy Research Institute (IFPRI).
Rada, Nicholas, and Anita Regmi, 2010, Trade and Food Security Implications from the Indonesian Agricultural Experience, WRS-10-01, Economic Research Service, U.S. Department of Agriculture, May, pp. 19.
Rajah, R. and N. McCulloch (2012). Agricultural Growth and Poverty Reduction in Indonesia – a Synthesis of Recent Evidence.
SADI (2010), Provincial Profile NTB.
SADI (2010), Provincial Profile NTT.
Stads, G.-J., Haryono, et al. (2007). Agricultural R&D in Indonesia: policy, investments, and institutional profile, ASTI Country Report.
The Government of Indonesia (GOI), National Development Planning Agency (BAPPENAS), et al. (2009). National Medium-Term Priority Framework (NMTPF) 2010 – 2014
The World Bank (2012). "Gender equality is smart economics." Indonesia Economic Quarterly.
The World Bank (2011). East Java Growth Diagnostic: Identifying the Constraints to Inclusive Growth in Indonesia’s Second Largest Province.

Agribusiness Development Opportunities in Eastern Indonesia – Socio-Economic Review
82
The World Bank, FAO and IFAD (2009), Gender in Agriculture Sourcebook.
UNDP (2012) One Planet to Share Sustaining Human Progress in a Changing Climate, UNDP.
USDA (2009) Agricultural Economy & Policy Paper: INDONESIA.