aging. · health insurance coverage (short. 1992; short, monheit, & 13eauregard, 1989; u.s....
TRANSCRIPT

DOCUMENT RESUME
ED 367 124 EC 302 853
AUTHOR LaPlante, Mitchell P.TITLE Disability, Health Insurance Coverage, and
Utilization of Acute Health Services in the UnitedStates. Disability Statistics Report 4.
INSTITUTION California Univ., San Francisco. Inst. for Health andAging.
SPONS AGENCY National Inst. on Disability and RehabilitationResearch (ED/OSERS), Washington, DC.; Office of theAssistant Secretary for Planning and Evaluation(DHHS), Washington, D.C.
PUB DATE Oct 93CONTRACT G0087C2014NOTE 265p.; For related reports, see ED 336 905 and EC 302
851-852.PUB TYPE Reports Research/Technical (143) Statistical
Data (110)
EDRS PRICE MF01/PC11 Plus Postage.DESCRIPTORS Adults; Age Differences; Children; *Demography;
*Disabilities; *Realth Insurance; *Health Services;*Incidence; Medical Services; National Surveys;Physicians; Sex Differences; Statistical Data
IDENTIFIERS Impairment Severity; National Health InterviewSurvey
ABSTRACTThis report uses data from the 1989 National Health
Interview Survey to estimate health insurance coverage of childrenand nonelderly adults with disabilities and their utilization ofphysician and hospital care as a function of health insurance status.In part 1, national statistics on disability and insurance status areprovided for different measures and categories of disability.Estimates of the percent of the population with various types ofinsurance coverage or with no insurance coverage are provided bysociodemographic and disability status. In part 2, logisticregression models controlling for sociodemographic factors measurethe impact of insurance on utilization of health services. In part 3,the relationships of poverty, employment, and disability with privateinsurance, public insurance, and no insurance are examined in thecontext of policy options. Among highlights of the report's findingsare: (1) an estimated 11.5 percent of the 35.3 million uninsuredpeople in the United States have some activity limitation; (2) adultswith activity limitation are slightly more likely than those withoutlimitation to be uninsured; (3) men with severe disability have moreaccess to Medicare than women, but women have more access toMedicaid; (4) children with activity limitation are as likely asthose without limitation to be uninsured (about 15.8 percent); and(5) uninsured adults with disabilities have from 19 percent to 44percent fewer physician contacts than similar adults with insurance.Extensive tablss detail the study's findings. Appendices includestandard error information and the questionnaires used in thesurveys. (Contains 43 references.) (DB)

isw
A ID A
AIL ih
All
41111h Ala
I to
2
U S DEPARTMENT OF EDUCATIONOffice of Educational Research ard Improvement
ED CATIONAL RESOURCES INFORMATIONCENTER (ERIC)
This document has been reproduced asreceived from the person or organizationoriginating it
C Minor changes have been made to improvereproduction quality
points of view or opinions stated in this document do not necessarily represent officialOEM positron or policy
II
BEST COPY NUEMPRIMINNEmon

DISABILITY, HEALTH INSURANCE COVERAGE, ANDUTILIZATION OF ACUTE HEALTH SERVICES IN THE
UNITED STATES
Mitchell P. La Plante, Ph.D.
Disability Statistics ProgramInstitute for Health & Aging
University of California, San Francisco201 Filbert Street, Suite 500San Francisco, CA 94133
Final report submitted to the Office of theAssistant.Secretary for Planning and Evaluation,
Department of Health and Human Servicesand the
National institute for Disability and Rehabilitation Research,Department of Education
Under NIDRR CA #G0087C2014April 22, 1993
3

Disability and health insurance
ACKNOWLEDGMENTSThis report was produced for the U.S. Department of Health and Human Services,
Office of the Assistant Secretary for Planning and Evaluation and the U.S. Department ofEducation, National Institute on Disability and Rehabilitation Research. Michele Adlerwas the ASPE Project Officer and Sean Sweeney was the NIDRR Project Officer. BingJiang provided programming support throughout and painstakingly laid out all thetables. Steve Kaye provided expert editorial assistance. Xuilan Zhang conducted theimputation of missing family income. Additional editorial and clerical support wasprovided by Juliana Cyril and Janet Smith.
SYMBOLS
Data not availableCategory not applicableEstimate does not meet standard of reliability or precision (more than30% relative standard error)
t Estimate is exactly U or is greater than 0 and standard error isindeterminate (too few Primary Sampling Units to calculate error)Standard error is exactly 0 or is indeterminate (too few PrimarySampling Units to ca:culate error)
SUGGESTED CITATION
La Plante, M. P. (1993). Disability, Health Insurance Coverage, andUtilization of Acute Health Services in the United States. Washington, DC:U.S. Department of Health and Human Services.

Disability and health insurance
Contents
List of Text Tables iii
List of Text Figures iii
Introduction 1
Highlights 1
Background 2
Data and Methods 3
Definitions 3
Accuracy of the Estimates 4
Results 61. Health Insurance Coverage, Sociodemographic
Characteristics and Disability 61.1 Adults 61.2 Children 291.3 Trends 35
2. Disability, Insurance, and Health Services Use 372.1 Physician Contacts 37
2.1.1 Adults 372.1.2 Children 40
2.2 Hospitalization 402.2.1 Adults 402.2.2 Children 42
3. Disability, Poverty, Employment, andInsurance 453.1 Adults 453.2 Children 48
Conclusions 48
References 50
List of Detailed Tables 52
Detailed Tables 53
Appendix A: Standard errors for text tables 91
Appendix B: Standard errors for detailed tables 107
Appendix C: Questionnaires 146

ifi Disability and he4lth insurance
TEXT TABLES
TABLE A. Comparison of Four Study Estimates of the Percent of the Population UnderAge 65 with Health Insurance by Type of Insurance Coverage: United States,1987, 1989, and 1990 5
TABLE B. Type of Health Insurance Coverage Among Adults Aged 18 to 64, bySociodernographic Characteristics, by Gender: United States, 1989 7
TABLE C. Type of Health Insurance Coverage Among Children and Adults, by Disability:United States, 1989 17
TABLE D. Type of Health Insurance Coverage Among Adults Aged 18 to 64, by Disabilityand Health Status, by Gender: United States, 1989 18
TABLE E. Type of Health Insurance Coverage Among Adults Aged 18 to 64 by Level ofDisability: United States, 1989 22
TABLE F. Distribution of Adults Aged 18 to 64 on Medicare la) Employment and WorkDisability Status: United States, 1989 22
TABLE G. Percent of People Aged 18 to 64 with Employer-Provided Insurance andPercent with Such Coverage in Their Own Name, by Gender, Work Disability,and Marital Status: United States, 1989 25
TABLE H. Percent of People Aged 18 to 64 with Public Insurance and Percent Uninsured,by Gender, Work Disability, and Marital Status: United States, 1989 26
TABLE I. Logistic Regression Models of the Likelihood of Private, Public, and NoInsurance Coverage Among Adults Aged 18 to 64: United States, 1989 28
TABLE J. Type of Health Insurance Coverage Among Children Aged 0 to 17, bySociodemographic Characteristics, by Gender: United States, 1989 30
TABLE K. Type of Health Insurance Coverage Among Children Aged 0 to 17, byDisability and Health Status, by Gender: United States, 1989 33
TABLE L. Type of Health Insurance Coverage Among Children and Adults, by Age, Race,and Disability: United States, 1984 and 1989 36
TABLE M. Logistic Regression Models of the Likelihood of Physician Contact AmongAdults Aged 18 to 64: United States, 1989 38
TABLE N. Logistic Regression Models of the Likelihood of Physician Contact AmongChildren Aged 0 to 17: United States, 1989 41
TABLE 0. Logistic Regression Models of the Likelihood of Hospitalization in Past 6Months Among Adults Aged 18 to 64: United States, 1989 43
TABLE P. Logistic Regression Models of the Likelihood of Hospitalization AmongChildren Aged 0 to 17: United States, 1999 44
TEXT FIGURES
FIGURE 1. Percent of men and women aged 25 to 44 who are uninsured, by ratio of familyincome to poverty level: United States, 1989 15
FIGURE 2. Percent distribution ot type of health insurance coverageamong adults aged 18to 64, by disability status: United States, 1989 16
FIGURE 3. Percent distribution of type of health insurance coverage among adults aged 18to 64, by disability status: United States, 1989
FIGURE 4. Percent distribution of type of health insurance coverage among adults aged 18to 64 by work disability status, by gender: United States, 1989 15
FIGURE 5. Percent distribution of type of health insurance coverage among adults aged 18to 64 by respondent-assessed health status: United States, 1989 26

Disability and health insurance 1
INTRODUCTIONHealth insurance facilitates access to health services
and provides some protection against large andunforeseen health care expenses (Office of Health Policy& U.S. Department of Health and Human Services, 1987).However, at least 33 million Americans under age 65 lackhealth insurance coverage (Short. 1992; Short, Monheit, &13eauregard, 1989; U.S. Bureau of the Census, 1991a) andtne rate of uninsurance appears to be rising(Himmelstein, Woolhandler, & Wolfe, 1992; U.S. Bureauof the Census, 1991a; U.S. Bureau of the Census, 1991b;U.S. Bureau of the Census, 1992) especially since 1989.The Tate of uninsurance is high among racial and ethnicminorities and people with low incomes. Thesepopulations have elevated rates of illness and elevatedneed for health services (Bunker, Gomby, & Kehrer,1989), raising the issue of how well the American healthcare system provides coverage to populations withelevated health needs.
People with disabilities as a group rank highestamong populations with elevated need for short- andlong-term health services. People with disabilities havesignificantly higher rates of physician contacts andhospitalization compared to those without disabilitiesand 3.6 times higher per capita costs of care in 1980 (Rice& La Plante, 1992). Like other nonelderly Americans,children and adults with disabilities are at risk of beinguninsured for health care (Mathematica Policy Research,1989) and as a result may receive less care than theinsured (Davis & Rowland, 1983).
Disability occurs when health impairments (caused bycongenital or developmental conditions, chronic illness,or injury) limit human action or activities. The severity ofdisability can be defined from minor to major by theimportance of the actions and activities that are limitedand the degree to which they are limited (Verbrugge,1990). Since disability causes people to withdraw fromwork, and employment is the gateway to privateinsurance coverage, many people unable to work dependon public insurance coverage. But public insurancecoverage is provided to people with the most "severe"disabilities and people who are poor in certain "needy"categories, such as single parents with children. Peoplewith less "severe" disabilities and marginal financialmeans are at greater risk of being uninsured(Mathematica Policy Research, 1989).
This report uses data from the 1989 National HealthInterview Surveythe largest and most recent sample ofthe U.S. population with detailed disability and healthinsurance informationto estimate health insurancecoverage of children and nonelderly adults withdisabilities and their utilization of physician and hospitalcare as a function of health insurance status. The resultsare divided in three sections: in part 1, national statisticson disability and insurance status are provided forseveral different measures and categories of disability.Estimates of the percent of the population with various
types of insurance coverage (private, Medicare,Medicaid, military, and other insurance) or with noinsurance coverage are provided by sociodernographicand disability status. In part 2, the relationship ofinsurance to the utilization of health care of people withdisabilities is examined. Logistic regression models thatsimultaneously control for other sociodemographicfactors are developed to measure the impact of insuranceon utilization of health services. Finally, in Part 3, therelationships of poverty, employment, and disabilitywith private insuranceand whether employment-basedor notpublic insurance, and uninsurance are examinedto help frame certain policy options.
HIGHLIGHTSAn estimated 35.3 million people under 65 years oldwere without health insurance in the United States in1989. Among the uninsured were 4.1 million peoplelimited in activity-547,000 children and 3.5 millionadultsmaking up 11.5% of all uninsured people.Adults with activity limitation are slightly morc likelythan those without limitation to be uninsured (17.8%versus 16.6%).Although people who need assistance in self-care(ADL) or routine activities (IADL) have a somewhatlower rate of uninsurance than people withoutassistance needs, 393,000 of those needing assistance,or 13.1%, remain uninsured.About 1.4 million people unable to work at a job orbusiness are uninsured.Men with severe disability have more access toMedicare than women, but women have more accessto Medicaid, regardless of disability status.Close to 45% of older adults out of the labor force andreceiving Medicare have private insurance.Spousal insurance benefits greatly assist women whohave severe disabilities. Of women unable to workwho have employer-provided insurance, 76.4% have itin another person's name.Unmarried men are more likely than married men orunmarried women to be uninsured. Public insurancecovers unmarried men less well than unmarriedwomen, particularly for less severely disabled andnon-disabled people.Children with activity limitation are as likely as thosewithout limitation to be uninsured (about 15.8%).About 547,000 children with limitations in school orplay (for those under 5) are uninsured.Uninsured adults with disabilities have from 19% to44% fewer physician contacts and from 29% to 65%fewer hospitalizations than similarly disabled peoplewith insurance, depending on the level of disability.Among adults unable to work, those withoutinsurance have 15.2 annual physician visits, 24% lowerthan the 20.0 annual physician contacts of peopleunable to work who are insured.

2Disability and health insurance
Among adults unable to work, those withoutinsurance average 31.7 annual hospitalizations per 100persons, significantly lower than the rate of 52.9annual hospitalizations of those with insurance.Of children with disabilities, the uninsured have 34%fewer physician contacts than the insured, and a lowerrate of hospitalization.Approximately 691,000 adults who are unable to workare poor and uninsured.About a third of children limited in major activity(school or play) are poor, and a quarter of those areuninsured.
BACKGROUNDThe uninsured are people who cannot obtain
affordable private health insurance plans and areineligible for or fail to avail themselves of publicprograms. People with private coverage fall into twomain groups: those that have coverage from an employeror spouse's employer and those that buy coverage otherthan through an employer. Private health insurance ismore readily available to people who are employed year-round in full-time jobs with large employers, or whohave a spouse who is so employed. Despite the fact thatmost people obtain insurance through employment, notall employers offer insurance and the majority of theuninsured are actually workers or dependents of workers(Monheit, Hagan, Berk, & Farley, 1985). This fact has ledto serious consideration of options to reduce theprevalence of uninsurance by encouraging employers tooffer insurance to all employees and their dependents.For people who are not offered private coverage from anemployer, having private coverage is highly associatedwith ability to pay.
The nation's two principal public programs areMedicare and Medicaid. Medicare and Medicaid aredesigned to overcome the problems of obtaining privateinsurance that people with severe disabilities and certainpoor people experience. Medicare is a federal programproviding health care coverage to disabled adults underage 65 who have received cash benefits under the SocialSecurity Disability Insurance (SSDI) program for at leasttwo years. Medicare also covers people receiving cashbenefits under the Railroad Retirement System or withend-stage renal disease.
Medicaid is jointly financed by the federalgovernment and the states and provides health insurancecoverage to certain individuals and families with limitedincome and resources. Adults with disabilities who havenot worked sufficiently in the past to qualify for SSDIand are poor may receive Supplemental Security Income(SSD and are covered by Medicaid. Certain children withdisabilities may also receive SSI and are covered byMedicaid. In addition, Medicaid covers adults andchildren enrolled in Aid to Families with DependentChildren (AFDC) and pregnant women and childrenunder age 6 in families with incomes up to 133% of the
poverty line. People who incur large medicalexpenditures but who have income and resources abovethe Medicaid eligibility level can be covered by optional"medically needy" programs. In 1989, 39 states hadmedically needy programs. A number of other categoriesof people are covered by some of the states (SocialSecurity Administration, 1991). People who receive bothSSDI and SSI are covered by Medicare and Medicaid.Medicaid may reimburse durable medical equipmentpurchases and long-term care services for Medicarebeneficiaries in some states. State Medicaid programspay the premiums for Supplemental Medical Insuranceunder Medicare and deductibles and copayments fordual-eligibles.
Under 1986 legislation, Medicare has been made thesecondary payer for services that are covered by privateplans through an employer (either the individual's or afamily member's) with over 100 employees. This hasreduced Medicare payments for services covered byprivate insurance offered by large employers. DisabledMedicare beneficiaries may retain private coverage whenpossible since it may pay for services and drugs thatMedicare does not pay for. But the role of privateinsurance is not as well understood for nonelderlyMedicare beneficiaries as for elderly beneficiaries.
Private insurance plans and Medicare cover primarilyacute health care, i.e., hospitalization and physicianservices. Medicare also provides home-health servicesfor people requiring skilled nursing services. Medicaidcovers these services, but also provides additional long-term services coverage, including long-term institutionalservices and personal assistance services for people whoneed help in basic life activities (ADLs and IADLs) insome states.
Medical treatment is freely provided at Department ofDefense medical facilities to all military personnel, bothactive and retired after 20 or more years of service, andtheir dependents and survivors. CHAMP-US providesreimbursement for private medical services obtained bybeneficiaries living outside military hospital catchmentareas, minus a deductible and copayment (U.S. Congress& Congressional Budget Office, 1988). The VeteransAdministration provides subsidized health care servicesto veterans discharged from active service because of anillness or injury incurred or aggravated while on duty, toveterans with service-connected disabilities, to formerprisoners of war, to veterans exposed to Agent Orange inVietnam, to veterans aged 65 and older, and to otherveterans unable to pay for care. A number ofpublications provide further details concerning privatehealth insurance, Medicare and Medicaid coverage, andmilitary and Veterans' health care (Health InsuranceAssociation of America, 1991; Social SecurityAdministration, 1991; Systemetrics/McGraw-Hill, 1990;U.S. Congress & Congressional Budget Office, 1988; U.S.General Accounting Office, 1989; U.S. House ofRepresentatives & Committee on Ways and Means, 1992).

Disability and health insurance 3
DATA AND METHODSThe data used in this study are obtained from public
use tapes containing information from the 1989 HealthInsurance Supplement to the National Health InterviewSurvey (NH1S). The 1989 NHIS yielded 116,929interviews with individuals living in households. In thecore questionnaire, respondents were asked aboutdemographic and selected health characteristics,including self-rated health and disability. Non-responseto the core questionnaire was 5.1%. Though healthinsurance questions were intended for all respondents,3,289 individuals participating in the core did notparticipate in the supplement. Since sociodemographicand health characteristics are found to be similar betweenrespondents and non-respondents, the data are re-weighted, with non-respondents excluded, to match 1989noninstitutional population totals for 64 age-sex-race cells(Adams & Benson, 1990). Non-response to the entiresurvey is handled in the same way. Because of the highenrollment of the elderly in Medicare, the analysis isrestricted to people under age 65.
Estimates from the 1989 NHIS are compared with 1984NHIS estimates to discern any recent trends in healthcoverage. In 1984 a full sample was conducted and105,290 people were interviewed. The non-response ratefor health insurance questions, which were part of thecore questionnaire in 1984, was 3.6%. Other than theirposition in the survey, there were no major changes inthe insurance questions from 1984 to 1989. Thus, the re-weighted 1989 estimates should be comparable withthose from 1984. However, small differences that may bestatistically significant could be due to differences in non-response that could not be fully accounted for by re-weighting, for example, if respondents in the two yearsdiffer on any unmeasured variables.
The NHIS is a highly stratified multi-stage complexsample that requires special methods for calculating theerrors of estimates (Wolter, 1985). Standard errors ofestimates are calculated using RTIFREQS, SESUDAAN,RATIOEST, and RTILOGIT software provided by theResearch Triangle Institute. The Taylor serieslinearization method is used with a design incorporatingstratum and PSU variables. Standard errors for estimatesof proportions (e.g., percent with insurance), means (e.g.,average number of physician visits), and ratios (e.g.,average length of hospital stay per discharge) are shownin Appendix tables. These errors are found to be morereliable overall than error formulas provided by NCHS(smaller average design effects), particularly for meansand ratios (La Plante, 1991a). Errors for logistic regressionestimates are calculated using RTILOGIT.
About 16.4% of sample individuals had missing dataon family income. In these cases, values are imputedusing polytomous logistic regression prediction models,which are estimated separately for families andindividuals as a function of age, education, race, and
occupation of individuals or family heads.1 Povertyestimates are consistent with those from the CurrentPopulation Survey (CPS) at the 95% confidence level.About 18.5% (±0.6%) of children and 9.7% (±0.3%) ofadults aged 18 to 64 are estimated to be poor, slightlylower than the estimates of 19.6% (±0.6%) and 10.2%(±0.2%) from the CPS (U.S. Bureau of the Census, 1991a).Family income is the only variable imputed in the NHISsample.
The annual number of physician contacts (includingtelephone contacts) is estimated in the NHIS using thenumber of contacts that occur in the two-week periodprior to the interview and multiplying by 26. Thisprocedure reduces bias due to forgetting and is allowablebecause the survey is conducted continuously over theentire year. Similarly, hospital discharges reported forthe 6-month period prior to the interview are multipliedby 2 to yield an annual estimate. Average length of stayis computed for completed hospitalizations (hencedischarges and not episodes are used) for a particularpopulation group as the ratio of total hospital days to thenumber of discharges for the group (for discharges in thepast 6 months).
A difference statistically significant at the p<0.05 levelof probability or better is the criterion used in this study.A stricter level of probability might result in importantdifferences being rejected as insignificant for lo w-prevalence disability groups.
DEFINITIONSDisability is defined operationally as a limitation in
activity due to chronic mental, physical, or emotionalhealth problems. Disabilities are categorized accordingto severity. For children under 5 years old, categoriesinclude being unable to take part in ordinary playactivities, limitation in the kind or amount of play, orlimitations in other activity (e.g., can't go out in the cold).For children aged 5 to 17 years, categories includeinability to perform self-care activities (ADLs) withoutassistance from others, inability to attend school,limitation in the amount or kind of school work (i.e.,attending special classes or being limited in schoolattendance), and limitation in activities outside of school(e.g., sports). Disability categories for adults includeinability to perform self-care activi ties (ADLs) androutine activities (IADLs) without assistance from others,inability to work at a job or business or to do housework,limitation in the amount or kind of work or housework,and limitation in activities other than work or housework(e.g., recreation and civic activities).
A person is defined to have health insurance if theindividual was covered by a private health insuranceplan, Medicare, Medicaid, or military coverage, asdetermined by answers to the questions reproduced inthe Appendix to this report. In 1989, people were first
1 These results are available from the author by request.

4 Disability and health insurance
asked about Medicare coverage (Section M, Q. lb).Interviewers then asked about specific health insuranceplans covering hospital, doctor, or dental bills (Q. 4-8).Interviewers were trained to consider only privatelyfinanced health plans (National Center for HealthStatistics, 1990). People not covered by Medicare or aprivate plan were then asked to choose the main reasonthey did not have such coverage (Q. 9b) from a list of 7specific reasons (Card M). The 3,344 respcndents of allages who listed "some other plan" as a reason areconsidered insured. Subsequent questions ascertainedcoverage by Medicaid and military insurance. All peoplereceiving AFDC (Q. 10) or SSI (Q. 11),2 or possessing aMeclicaid card (Q. 13), are considered covered byMedicaid. A small number of people (about 520,000weighted estimate) indicated that they were covered byother public assistance programs (Q. 14) but did not haveMedicare or a private plan, were not on AFDC or SSI anddid not have a Medicaid card, did not have militarycoverage, and did not say they had a plan in response toQ. 9b. It is not clear what this meansbeing "covered"by a public assistance program may mean that a persongoes to a clinic for a limited array of free services, whichis not an organized health planso these people werenot considered insured.
The NHIS does not include active military personnel,but it does include dependents not living on militaryba.:es. The NHIS categorizes people as having militaryinsurance if they receive military retirement or VApensions or both (Q. 16c), are dependents of active orretired military personnel covered by CHAMP-US (Q.17b), are dependents or survivors of disabled veteranscovered by CHAMP-VA (Q. 17d), or benefit from anyother program providing health care for militarydependents or survivors (Q. 18b).
A residual category is made up of people who statedon question 9b that they had a plan, but on subsequentquestions were not identified as having Medicaid ormilitary insurance. These plans may include suchcoverage as the Indian Health Service, state or localprograms, self-insurance, or philanthropies, and arecategorized as undefined. Individuals having none of thetypes of plans enumerated are considered uninsured.
2 All states are required to provide Medicaid coverage to AFDCrecipients. In most states, SSI recipiency confers Medicaidentitlement. Twelve states use more restrictive eligibility rulesthan those used in the federal SSI program. However, suchstates are required to allow applicants to deduct medicalexpenses from countable income, referred to as section 209(b)spend-down. Numerous exceptions require extendingMedicaid to a variety of_people with disabilities under specialcircumstances (Ruther, Reilly, Silverman, SE Abbott, 1990).Because these criteria are complicated and vary from state tostate, they are not measured in the NHIS. Toerefore, thepractice is to include all persons on SSI as being eligible forMedicaid (Ries, 1991) which may result in some individualsresiding in the states that use more restrictive criteria beingdefined as having Medicaid when they actually do not. Thiserror is most likely negligible.
Medicare, Medicaid, and military coverage are furthercombined into the category public coverage.
ACCURACY OF THE ESTIMATESIn 1989, 35.3 million people in the United States under
65 years old-16.5% of the populationwere withouthealth insurance (Table A). This estimate of theuninsured lies midrange between the lowest and highestindependent estimates of the uninsured.3 Using the samesurvey data, Ries (1991) obtains a lower estimate of 33.6million uninsured (15.7%). This discrepancy can beexplained by differences in the way non-response ishandled by Ries compared to the present analysis. Bothunit non-response (the respondent fails to answer theentire questionnaire) and item non-response (therespondent fails to answer a specific question) are treateddifferently by Ries.
In Ries's report, unit non-response was not treatedsystematically across types of plans due to an editingerror in the data that was discovered in the course ofconducting this study (LaPlante, 1991b; Par3ons, 1991).For private insurance and Medicare estimates, Rieshandled unit non-response in the usual way, byreweighting the survey respondents (see Data andMethods). But for public assistance (predominantlyMedicaid) and military coverage, records were editedincorrectly to indicate that the respondent did not havethese types of coverage, when unit non-response had infact occurred. This editing problem has a small effect onRies's estimate of the percent with public assistancecoverage, changing from 6.2% to a corrected estimate of6.4% (Parsons, 1991). The percent with military coverageis unaffected by the unit non-response correction.
Item non-response arises when someone is unsure ofhis or her coverage for a particular type of insuranceplan. This accounts for most of the difference betweenthe estimates shown in Table A. The difference of 0.5% inestimates of private insurance coverage is entirely due toitem non-response. Ries excluded people who did notknow whether they were covered by a private insuranceplanthey are assumed in this study not to be coveredby a private plan. The estimate for Medicaid coverage ishigher in this study because all persons claiming to havea Medicaid card were considered covered by Medicaid,whereas Ries included only those with a currently validcard. The latter rule omits people who were covered butcould not produce their carddefinitely a problem forpeople away from home at the time of the interview butfor whom proxy respondents indicated they were
3 In 1989, approximately 31 million people were uninsuredduring any quarter of the year based on data from the Survey ofIncome and Program Participation (Short, 1992). It is estimatedthat about 37 million people were uninsured during the firstquarter of 1987 from the National Medical Expenditure Survey(Short et al., 1989). These surveys yield different estimatesbecause of differences in questioning, reference periods, andsampling.
0

Disability and health insurance 5
TABLE A. Comparison of Four Study Estimates of the Percent of the Population Under Age 65 withHealth Insurance by Type of Insurance Coverage: United States, 1987, 1989, and 1990
Private Medicare Medicaid Military Not insuredStudy: (%) (%) (%) (%) (%)Ries: 1989 NHIS 75.9 1.4 6.2a 2.4 15.7LaPlante: 1989 NHIS 75.4 1.4 6.6 2.4 16.5Short, K: 1990 SIPP 75.9 1.5 8.2 2.6 14.6
Short, P: 1987 NMES 75.4 7.2b 17.4
Sources: Short, K. (1992, May). Health Insurance Coverase: 1987-1990 (Selected data from the Survey of Income andProgram Participation). Current Population Reports, Series P-70 (29). Washington, D.C.: U.S. Bureau of the Census. Ries,P. (1991). Characteristics of Persons With and Without Health Care Coverage: United States, 1989. Advance Data fromVital and Health Statistics (201). Hyattsville, Maryland: National Center for Health Statistics. Short, P. F., Monheit, A. C.,
Beauregard, K. (1989). A Profile of Uninsured A.mericans. National Medical Expenditure Survey Research Findings 1(DHHS Pub. No. PHS 89-3443). Rockville, Maryland: Public Health Service, Agency for Health Care Policy and Research.a Includes a small number of people with other public assistance coverage.b Percent with public coverage only.
covered by Medicaid. The proportion uninsured is lowerin Ries's study because unit and item non-responses wereexcluded (weighted number approximately 9.7 millionpersons: 6.9 million unit non-response and 2.8 millionitem non-response). In this study, unit non-response isexcluded but item non-response is considereduninsured.4 Thus, the rate of uninsurance is 16.5% of thepopulation under age 65.
Estimates of the fraction of the population withprivate insurance are statistically identical from theNHIS, SIPP, and NMES. More variation occurs forMedicaid estimates. Estimates of Medicare and Medicaidcoverage can be compared with administrative statistics.From the NHIS, the estimated number of people onMedicare in 1989 is 141,000 (±52,000) children and2,823,000 (±150,000) adults (see Results section, Table C),for a total of 2,964,000 (±192,000) people. The confidenceinterval on this estimate overlaps the Health CareFinancing Administration figure of 3,171,000 peopleunder age 65 enrolled in Medicare under Part A hospitalinsurance (Social Security Administration, 1990, Table7.B5) on July 1, 1989. Thus, the NHIS estimates Medicarecoverage quite precisely and agrees with the SIPPestimate.
NHIS estimates of people on Medicaid are 7,562,000(±696,000) children and 6,635,000 (±478,000) adults, for atotal of 14,197,000 (±1,122,000) nonelderly people. This islower than the HCFA figure of 20,379,000 people underage 65 who used Medicaid during 1989 (Social SecurityAdministration, 1990, Table 7.E2) of whom 10.3 millionwere under age 21. The HCFA figure is a count for thewhole year, and it should be higher than the number ofpeople covered at a point in time as in the NHIS.
4 To be exact, Ries estimate of the uninsured is 33.7 million.The proportion is calculated thus: 33.7 million/(214.3 million -9.7 million (unit and item nonresponse))=15.7%. Here theuninsured is 35.2 million, which ecluals Ries' estimate of 33.7million plus 1.6 million excluded by Ries as item nonresponse.
Respondents were also asked in the NHIS if they hadused Medicaid in the past year. Approximately 12.5million nonelderly said they had, but this estimate ismuch less than the 20.4 million recipients reported by theMedicaid program to have used services in the past year.So even by this method of estimating, a substantial gap inthe estimates between the NHIS and the Medicaidprogram remains. Medicaid use is highly dynamic andpeople may not remember services used earlier in theyear. Thus, it is difficult to reconcile NHIS estimates ofpeople covered by Medicaid with independent programstatistics.
From the 1990 Survey of Income and ProgramParticipation (SIPP), 8.2% of nonelderly people (17.9million ±1.1 million) are estimated to be covered byMedicaid (Short, 1992), 1.6 percentage points above theNHIS estimate (Table A). The higher proportion coveredby Medicaid accounts for the lower estimate of theuninsured from the SIPP than the NHIS (14.6% ±0.6%versus 16.5% ±0.4%) since the SIPP and NHIS estimatesfor private insurance, Medicare, and military coverageare comparable. Thus, there is some evidence that theNHIS estimate of the Medicaid-covered population islow, and the estimate of the percent of the populationuninsured is somewhat higher.
From the NHIS, approximately 5.2 million people(±1.4 million) are estimated to have military coverage.This compares with 5.3 million military beneficiaries,including dependents of active personnel and retireesand their dependents, an estimate from theCongressional Budget Office estimate for 1986 based onDepartment of Defense administrative data (U.S.Congress & Congressional Budget Office, 1988). Manydependents of active military personnel may be living onbase, so the CB0 estimate is not directly comparable tothe NHIS. But the NH1S also includes some peopleeligible for VA who may not be eligible for militarybenefi ts. Since there is agreement between NHIS and
1

6Disability and health 4nsurance
SIPP estimates of military coverage (which includesCHAMP-US, CHAMP-VA, or other military coverage), itseems that the enumeration of this population isreasonable.
RESULTS
1 HEALTH INSURANCE COVERAGE, SOCIODEMO-GRAPHIC CHARACTERISTICS, AND DISABILITY
Our purpose here is to describe how insurancecoverage varies by socio-demographic characteristicsincluding age, race, Hispanic origin, educationalattainment, labor force status, and poverty to serve as acontext for examining the relationship of disability toinsurance coverage.
1.1 AdultsIn Table B, estimates of the health insurance coverage
of the adult population aged 18 to 64 years are shown bytype of insurance (private only, public only, public andprivate, plans not defined as public or private, anduninsured) and sociodemographic characteristics.Estimates of the percent of the population coverP-1 byMedicare or by Medicaid are also included. The categorypublic includes Medicare, Medicaid, and militaryinsurance. Estimates for mPre detailed categories ofinsurance coverage are shown in Table 1. In both tables,all insurance categories labeled "only" and the uninsuredare mutually exclusive and exhaustive and thus, exceptfor rounding error, sum to 100%.5
SociodemographicsIn 1989, the nonelderly adult population comprised
150.3 million people, 74.7% of whom were covered byprivate insurance only, 5.7% by public insurance only(Medicare, Medicaid, or military), 2.5% by private andpublic, and 0.4% by undefined plans, leaving 16.7% of thenonelderly adult population uninsuredsome 25.2million nonelderly adults.
Medicare covered 1.9% of the nonelderly adultpopulation, Medicaid 4.4%, and roilitary 2.5%. In all,8.2% received insurance from the federal government.Notably, about a third of the publicly insured haveprivate insurance. About 50% of people with militarycoverage have private insurance, as do 42% of those withMedicare, and 9% of those with Medicaid. People withpublic coverage may have private insurance to pay fordeductible and co-insurance amounts charged forcovered services (except under Medicaid) and to pay fornon-covered services.
The percent of the population with private coveragerises with age. Medicare coverage and military coverageare higher among people aged 45 to 64 years, butMedicaid coverage declines with age. Still, the net result
5 In Table 1, the categories flagged as excluding militarycoverage add together with the categories any military coverageand unmsud to total lon.o% (except for rounding error).
is that the percent uninsured decreases with age. About28.3% of people 18-24 years old are uninsured, which isabout 2.5 times as high as for people aged 45 to 64(t=25.64, p<.001).
Black people are more likely to have only publicinsurance coverage than are white people (13.9% versus4.5%, t=17.64, p<.001) or people of other races (13.9%versus 8.0%, t=6.35, p<.001). Blacks also have a lowerrate of private insurance coverage than whites (58.2%versus 77.3%, t =21.4, p<.001) and a higher rate ofuninsurance (24.3% versus 15.5%, t=13.12, p<.001).People of other races are also more likely than whitepeople to be uninsured (22.7% versus 15.5%, t=4.71,p<.001), but are not significantly different from blackpeople.
The proportion with private coverage is very highamong college graduates (91.8%) and declinessubstantially with lower levels of educational attainment.This high proportion reflects the comprehensive benefitsthat accompany higher status jobs as well as the ability ofhighly educated people to pay for private insurance ifthey do not receive health insurance throughemployment. Medicare and Medicaid coverage bothincrease with lower levels of educational attainment, butmilitary coverage is highest for high school graduatesand those with some college. Low educationalattainment is associated with poverty, as reflected by thehigher proportion of people with Medicaid coverage.Medicare coverage is also higher for those with loweducation. Though public coverage appears tocompensate for the decline in private coverage for thosewith lower educational attainment, it does not do sofully, and the rate of uninsurance increases aseducational attainment declines.
For all age groups, higher education is stronglypositively associated with private insurance andnegatively associated with public coverage (particularlyMedicaid) and with being uninsured. About 42.8% ofadults aged 18 to 24 who have not graduated from highschool are uninsured. Among people aged 45 to 64,Medicare coverage increases with lower educationalattainment, consistent with the profile of Social SecurityDisability Insurance beneficiaries as predominantly olderworkers with low educational attainment (Social SecurityAdministration, 1987). Despite this, 20.8% of people aged45 to 64 who have not completed high school areuninsured, compared to less than 9% of those with highereducation. Unlike poverty and disability, with which it iassociated, low educational attainment does not confereligibility for public insurance.
Married people are much more likely than unmarriedpeople to have private insurance (e.g., 83.6% marriedversus 51.7% separated, t=21.91, p<.001) and less likely tobe uninsured (e.g., 12.6% married versus 19.7% widowed,t=5.74, p<.001 ). Although 20.5% of separated people

Disabilihj and health insurance7
TABLE B. Type of Health Insurance Coverage Among Adults Aged 18 to 64, by Sociodemographic Characteristics, by Gender:
United States, 1989
Popula tion(1,000s)
SampleSize
With Insurance
NotInsured
Medi-care
Medi-caid
Priva teOnly
PublicOnly
Privateand
Public
UndefinedPlansOnly
Total 150,309 68,211 74.7 5.7 2.5 0.4 16.7 1.9 4.4
Age18-24 years 25,401 11,013 62.7 7.1 1.1 0.7 28.3 0.4 6.1
25-44 years 78,794 35,589 77.2 4.9 1.4 0.0 16.3 0.9 4.2
45-64 years 46,114 21,609 77.0 6.3 5.2 0.4 11.1 4.3 3.9
RaceWhite 127,549 56,501 77.3 4.5 2.5 0.3 15.5 1.8 3 3
Black 17,477 9,480 58.2 13.9 2.6 1.0 24.3 3 0 12.1
Other 5,283 2.230 65.5 8.0 2.5 1.4 * 22.7 0.7 6.6
EthnicityHispanic 12,118 5,326 52.2 9.9 1.7 0.7 35.5 1.8 8.8
Non-I lispanic 138,191 62,885 76.7 5.3 2.6 0.4 15.1 1.9 4.0
EducationLess than 12 years 27,181 12,676 50.7 14.6 3.3 0.5 30.8 5.0 12.8
12 years 59,345 27,021 74.6 5.1 2.5 0.5 17.3 1.5 3.9
Some college 32,511 14,535 81.3 3.2 2.3 0.4 12.9 0.8 1.9
College graduate 30,583 13,649 89.9 1.3 1.9 0.2 6.8 0.8 0.4
Unknown 689 330 43.9 16.1 5.9 0.3 33.8 9.6 16.7
Age & Ed uca tion18-24 years &
Less than 12 years 5,333 2,378 40.6 14.6 1.3 0.8 42.8 0.9 14.1
12 years 10,897 4,746 60.3 7.1 1.1 0.9 30.6 0.3 5.9
Some college 7,269 3,092 77.6 3.2 0.9 0.6 17.8 0.2 1.7
College graduate 1,819 757 84.1 0.7 1.1 0.3 13.8 0.4 * 0.1 *
Unknown 83 40 38.0 12.0 15.7 0.0 t 34.3 10.1 25.3
25-44 years &Less than 12 years 10,307 4,723 47.0 15.2 1.7 0.3 35.8 2.7 14.7
12 years 30,151 13,755 75.7 4.9 1.5 0.4 17.7 0.8 4.2
Some college 17,961 8,058 82.3 3.0 1.4 0.3 12.9 0.5 2.0
College graduate 20,032 8,892 90.9 1.0 0.9 0.2 7.0 0.4 0.4
Unknown 344 161 41.8 16.2 6.9 0.5 34.5 8.7 19.6
45-64 yearsLess than 12 years 11,542 5,575 58.8 14.1 5.6 0.6 20.8 9.0 10.6
12 years 18,296 8,520 81.2 4.3 5.1 0.4 8 9 33 2.1
Some college 7,281 3,385 82.2 3.6 5.8 0.4 8.0 2.2 1.6
College graduate 8,733 4,000 88.8 2.0 4.3 0.1 " 4.8 1.8 0.5
Unknown 263 129 48.4 17.3 1.5 " 0.0 1- 32.8 10.7 10.2
Marital StatusMarried 98,752 44,703 80.9 3.5 2.7 0.3 12.6 1.5 2.0
Widowed 3,310 1,607 61.1 13.4 5.3 0.4 * 19.7 7.5 8.9
Divorced 11,511 5,366 63.8 11.2 2.4 0.7 21.9 3.1 9.5
Separa ted 3,599 1,766 49.1 21.6 2.6 0.7 26.0 2.9 20.5
Never married 32,937 14,675 64.0 7.8 1.7 0.6 25.9 1.9 7.5
Unknown 199 94 61.8 5.8 5.0 * 0.0 t 27.3 3.9 * 6.6
Employment StatusCurrently employed 113,327 50,944 81.3 1.7 1.7 0.3 15.1 0.3 1.0
Unemployed 4,641 2,139 45.7 12.1 1.7 0.5 39.9 0.6 10.7
Not in labor force 32,341 15,128 55.6 18.8 5.5 0.8 19.3 7.4 15.4
Employment Status & AgeCurrently employed &
18-24 years 17,646 7,337 68.5 2.6 0.7 0.6 27.5 0.2 1.5
25-44 years 64,285 28,774 82.9 1.5 1.2 0.2 14.3 0.3 1.1
45-64 years 31,396 14,633 85.3 1.5 3.3 0.3 9.6 0.6 0.5
1_3

6Disability and health insurance
TABLE B. Type of Health Insurance Coverage Among Adults Aged 18 to 64, by Sociodemographic Characteristics, by Gertder:United States, 1989
Unemployed &
Popula t ion(1,000s)
SampleSize
With Insurance
NotInsured
Medi-care
Medi-caid
PrivateOnly
%
PublicOnly
%
Priva teand
Public%
UndefinedPlansOnly
%
18-24 years 1,384 617 40.5 12.3 1.3 * 0.8 45.1 0.6 * 11.825-44 years 2,400 1,109 43.3 13.6 1.3 0.4 * 41.4 0.4 * 12.245-64 years 858 413 60.8 7.9 3.6 0.4 * 27.3 1.2 4.9Not in labor force &18-24 years 6,371 2,859 51.5 18.4 2.2 1.1 26.8 1.0 17.425-44 years 12,109 5,706 53.6 21.2 2.5 0.7 22.0 4.4 19.045-64 years 13,860 6,563 59.3 16.9 9.6 0.7 13.5 13.0 11.5
Family IncomeUnder $5,000 5,743 2,668 33.8 28.2 2.2 0.9 34.9 4.1 27.3$5,000-56,999 3,689 1,717 27.0 31.0 2.6 1.3 38.1 7.0 27.6$7,000-$9,999 5,095 2,504 28.3 27.1 2.9 0.7 41.0 6.2 24.3510,000-814,999 12,298 5,743 45.9 11.8 2.8 0.9 38.5 4.3 9.4515,000-519,999 16,317 7,508 62.5 6.2 2.7 0.6 28.0 3.0 4.5520,000-524,999 11,907 5,395 75.8 4.2 2.6 0.4 17.0 1.7 2.4525,000-834,999 30,144 12,504 82.4 2.2 2.7 0.4 12.3 1.4 1.1$35,000-549,999 33,464 15,053 87.4 1.4 2.3 0.1 8.8 0.6 0.6$50,000 or more 31,653 14,119 91.4 0.9 2.3 0.2 5.3 0.5 0.3
Poverty LevelUnder 0.50 5,112 2,397 27.3 31.7 2.2 1.0 37.9 2.1 31.30.50 to under 1.00 9,543 4,562 29.4 27.6 2.0 1.0 40.1 5.5 25.41.00 to under 1.25 6,063 2,877 43.4 13.0 2.2 0.6 40.8 4.1 10.91.25 to under 1.50 6,945 3,276 53.5 10.5 2.0 0.7 33.2 3.8 7.61.50 to under 1.75 10,712 4,973 67.6 5.5 2.7 0.4 23.8 2.4 3.91.75 to under 2.00 17,583 8,001 77.7 3.2 2.0 0.5 16.6 1.7 1.92.00 and above 94,352 42,1 z5 85.6 1.7 2.7 0.3 9.7 1.2 0.7
Age and I'overty Level18-24 years &
Under 0.50 2,118 937 46.3 19.6 1.4 * 1.3 * 31.5 0.3 * 18.90.50 to under 1.00 2,780 1,248 39.0 18.2 0.9 * 1.4 40.5 0.7 17.01.00 to under 1.25 1,528 693 38.5 12.6 0.7 * 0.0 t 48.2 0.4 11.11.25 to under 1.30 1,506 683 49.0 10.0 1.1 0.9 39.1 0.7 8.71.50 to under 1.75 2,079 926 52.5 6.9 1.7 0.6 * 38.4 1.0 * 5.11.75 to under 2.00 3,452 1,506 68.1 3.9 0.9 0.9 * 26.2 0.4 * 2.62.00 and above 11,938 5,020 76.2 2.2 1.2 0.5 19.8 0.3 1.425-44 years &Under 0.50 2,235 1,070 12.6 41.9 2.4 0.6 42.5 1.7 * 43.10.50 to under 1.00 4,474 2,156 26.7 27.4 1.9 0.7 43.3 3.5 26.81.00 to under 1.25 3,167 1,489 47.2 11.2 1.6 0.6 39.3 2.8 10.11.25 to under 1.50 3,638 1,689 56.9 7.0 1.4 0.4 * 34.3 1.6 6.01.50 to under 1.75 6,530 3,022 74.2 4.1 1.6 0.4 19.7 1.1 2.91.75 to under 2.00 10,255 4,648 81.9 2.2 1.2 0.4 14.2 0.7 1.42.00 and above 48,496 21,515 87.7 1.2 1.2 0.2 9.7 0.5 0.545-64 years &Under 0.50 759 390 17.5 35.4 3.8 1.1 " 42.3 8.5 31.50.50 to under 1.00 2,290 1,158 22.9 39.4 3.3 1.0 * 33.3 15.5 33.01.00 to under 1.25 1,367 695 40.0 17.5 5.2 1.2 * 36.0 11.3 12.51.25 to under 1.50 1,801 904 50.5 18.0 4.2 1.2 26.1 10.8 10.01.50 to under 1.75 2,103 1,025 62.2 8.3 6.8 0.5 22.2 7.8 5.71.75 to under 2.00 3,875 1,847 75.0 5.0 5.1 0.6 * 14.3 5.4 2.62.00 and above 33,919 15,590 86.1 2.3 5.3 0.3 6.1 2.5 0.7

Disability and health insurance 9
TABLE B. Type of Health Insurance Coverage Among Adults Aged 18 to 64, by Sociodemographic Characteristics, by Gender:United States, 1989
Popula tion(1,000s)
Sa mpleSi4e
With Insurance
NotInsured
%
Medi-care
%
Medi-caid
%
PrivateOnly
%
PublicOnly
%
Priva te.
andPublic
%
UndefinedPlansOnly
%
All Men 73,112 32,250 74.7 3.8 2.8 0.4 18.3 2.1 2.3
Age18-24 years 12,396 5,267 63.6 2.9 0.9 0.5 32.1 0.5 2.4
25-44 years 38,647 16,780 77.1 2.8 1.4 0.4 18.4 1.0 2.0
45-64 years 22,069 10,203 76.7 6.0 6.4 0.5 10.4 4.9 2.8
RaceWhite 62,664 27,278 76.9 3.1 2.9 0.3 16.9 2.0 1.8
Black 7,900 3,928 60.0 8.4 2.6 1.2 27.8 3.5 5.7
Other 2,549 1.044 66.6 5.8 2.0 1.4 24.2 0.8 4.8
EthnicityHispanic 5,844 2,513 52 0 5.1 1.8 1.0 40.1 1.8 4.3
Non-Hispanic 67,269 29,737 76.6 3.7 2.9 0.4 16.4 2.1 2.2
EducationLess than 12 years 13,576 6,139 52.7 9.9 3.5 0.6 33.4 5.7 7.4
12 years 27,052 11,962 73.8 3.2 2.7 0.5 19.8 1.7 1.9
Some college 15,275 6,633 80.7 2.1 2.8 0.5 13.9 0.7 0.7
College graduate 16,786 7,321 89.2 1.1 2.4 0.1 7.2 1.0 0.3
Unknown 424 195 41.8 13.5 3.9 * 0.4 * 40.3 7.8 12.5
Age & Education18-24 years &
Less than 12 years 2,891 1,262 43.9 6.0 1.2 0.7 48.2 1.1 5.6
12 years 5,268 2,242 61.2 2.7 0.8 0.6 34.7 0.4 2.2
Some college 3,342 1,391 79.6 1.2 0.6 0.4 ' 18.2 0.1 0.4 *College graduate 843 347 83.8 0.0 0.5 0.3 15.3 0.5 * 0.0
Unknown 52 25 28.7 12.8 * 13.1 * 0.0 t 45.4 7,7 * 22.0
25-44 years &Less than 12 years 5,187 2,271 48.7 9.1 1.3 0.3 * 40.4 3.2 8.1
12 years 14,079 6,164 75.2 2.5 1.4 0.5 20.4 0.9 1.8
Some college 8,555 3,681 81.9 1.6 1.8 0.6 14.2 0.4 0.8
College graduate 10,630 4,575 90.3 0.7 1.0 0.1 7.£ 0.6 0.3
Unknown 197 89 37.9 12.5 3.0 1.0 45.7 75 * 13.2
45-64 yearsLess than 12 years 5,498 2,606 61.0 12.5 6.7 0.8 19.0 10.6 7.7
12 years 7,704 :),556 79.8 4.7 6.5 0.6 8.4 3.9 1.8
Some college 3,378 1,561 79.0 4.2 7.7 0.5 * 8.7 2.1 0.7
College graduate 5,313 2.399 88.0 1.9 5.4 0.2 4.5 2.0 0.4
Unknown 175 81 50.1 14.8 2.3 0.0 t 32.8 8.2 9.0 "
Marital StatusMarried 48,774 21,630 80.6 2.8 3.3 0.3 13.0 1.9 1.6
Widowed 515 249 61.6 13.1 5.8 0.6 * 19.0 7.3 8.1
Divorced 4,481 ',969 61.8 8.1 3.5 1.2 25.4 3.9 3.6
Separated 1,199 555 55.5 9.6 2.0 0.7 32.2 2.4 6.3
Never married 18,039 7,798 63.5 4.5 1.3 0.7 30.0 2.0 3.7
Unknown 105 49 66.4 4.0 6.4 0.0 t 23.2 4.3 2.3 *
Employment StatusCurrently employed 62,141 27,259 80.0 1.1 1.9 0.3 16.6 0.3 0.6
Unemployed 2,370 1,049 39.5 8.4 1.5 0.5 50.1 0.6 " 6.7
Not in labor force 8,601 3,942 45.7 21.5 9.6 1.4 21.8 15.3 14.1
Employment Status & AgeCurrently employed &
18-24 years 9,216 3,875 65.9 1.4 0.6 0.5 31.6 0.2 0.9
25-44 years 35,503 15.357 81.4 0.9 1.2 0.3 16.2 0.3 0.6
45-64 years 17,422 8 027 84.7 1.5 4.1 0.3 9.4 0.5 0.3

10Disability and health insurance
TABLE B. Type of Health Insurance Coverage Among Adults Aged 18 to 64, by Sociodemographic Characteristics, by Gender:United States, 1989
Unemployed &
Population(1,000s)
SampleSiZe
With insurance
NotInsured
Medi-care
Medi-caid
Priva teOnly
PublicOnly
Privateand
Public
UndefinedPlansOnly
18-24 years 718 313 39.0 4.6 0.9 " 0.2 55.3 0.9 4.625-44 years 1,199 527 32.1 10.7 1.1 0.6 55.4 0.4 8.645-64 years 453 209 59.9 8.1 3.4 * 0.7 27.9 0.5 4.8 *Not in labor force &18-24 years 2,463 1,079 61.8 8.2 1.9 0.8 27.4 1.4 7.825-44 years 1,945 896 26.4 32.0 4.4 2.3 34.9 15.1 24.045-64 years 4,193 1,967 45.2 24.3 16.6 1.4 12.4 23.6 13.2
Family IncomeUnder $5,000 2,208 968 36.6 17.1 0.9 0.8 44.6 3.9 15.0$5,00046,999 1,477 664 28.6 21.3 1.3 2.2 46.5 6.7 15.557,000-$9,999 1,989 942 26.0 20.6 3.0 0.9 49.6 9.0 14.8$10,000414,999 5,396 2,438 42.2 9.9 2.7 1.2 44.0 5.8 6.5515,000-519,999 7,558 3,343 58.7 5.1 3.1 0.6 * 32.5 3.7 2.8520,000-524,999 5,730 2,528 74.5 2.7 3.0 0.4 * 19.4 2.2 1.4525,000-534,999 15,186 6,624 80.9 1.8 3.2 0.4 13.7 1.6 0.8$35,000449,999 17,187 7,575 86.1 1.0 2.8 0.2 * 9.9 0.7 0.3$50,000 or more 16,382 7,168 90.3 0.8 2.7 0.2 6.1 0.6 0.2
Poverty LevelUnder 0.50 1,880 822 30.6 17.5 0.9 1.3 497 2.3 15.60.50 to under 1.00 3,883 1,782 30.3 19.8 1.3 1.3 47.3 6.3 16.21.00 to tmder 1.25 2,733 1,252 42.3 8.6 2.3 0.7 46.0 5.3 6.31.25 to under 1.50 3,188 1,445 52.1 8.4 1.9 0.6 " 37.1 5.0 4.41.50 to under 1.75 5,254 2,377 66.2 4.5 2.8 0.6 25.9 3.0 2.41.75 to under 2.00 8,612 3,830 76.9 2.3 2.2 0.5 18.2 1.7 1.12.00 and above 47,563 20,742 84.0 1.5 3.2 0.3 11.0 1.3 0.5
Age and Poverty Level18-24 years &
Under 0.50 828 347 47.5 9.4 0.5 1.5 41.1 0.3 8.80.50 to under 1.00 1,216 536 41.7 7.7 1.1 1.5 " 48.1 0.9 7.21.00 to under 1.25 707 319 38.5 2.9 0.3 0.0 t 58.4 0.3 2.61.25 to under 1.50 707 305 49.3 3.1 * 0.7 " 0.4 46.4 1.1 3.31.50 to under 1.75 1,061 466 52.4 4.6 1.4 * 0.2 41.3 1.8 2.71.75 to under 2.00 1,726 750 66.7 2.2 0.3 0.7 30.1 0.3 1.4 *2.00 and above 6,152 2,544 75.6 1.1 1.0 0.3 22.1 0.3 * 0.825-44 years &Under 0.50 741 326 16.4 20.4 0.5 0.6 * 62.0 0.7 * 19.70.50 to under 1.00 1,809 818 28.1 17.6 1.2 * 0.9 52.1 4.0 16.01.00 to under 1.25 1,477 660 46.0 7.1 13 " 1.0 * 44.3 3.8 5.81.25 to under 1.50 1,720 770 55.2 5.0 1.0 0.4 " 38.4 1.9 3.61.50 to under 1.75 3,197 1,432 72.5 2.7 1.8 0.7 22.3 1.4 1.61.75 to under 2.00 4,983 2,178 80.8 1.5 1.3 0.4 * 16.1 0.7 0.92.00 and above 24,721 10,596 85.7 1.0 1.4 0.3 11.7 0.6 0.545-64 years &Under 0.50 311 149 19.3 32.2 2.9 2.3 433 11.6 * 23.80.50 to under 1.00 858 428 18.5 41.6 1.9 * 1.7 " 36.3 19.0 29.51.00 to under 1.25 550 273 37.4 20.1 7.1 0.9 34.5 15.8 12.51.25 to under 1.50 761 370 47.7 20.7 4.9 1.2 25.4 15.5 7.31.50 to under 1.75 996 479 60.5 10.1 7.6 0.8 21.0 9.4 4.51.75 to under 2.00 1,903 902 75.9 4.4 6.1 0.8 * 12.8 5.7 1.62.00 and above 16,689 7,602 84.5 2.5 6.7 0.3 6.0 2.8 0.6
16

Disabilihy and health insurance
TABLE B. Type of Health Insurance Coverage Among Adults Aged 18 to 64, by Sociodemographic Characteristics, by Gender:United States,1989
11
Popula tion(1,000s)
SampleSi 7. e
With Insurance
NotInsured
Medi-care
Medi-caid
Priva teOnly
PublicOnly
Privateand
Public
UndefinedPlansOnly
All Women 77,197 35,961 74.7 7.5 2.2 0.4 15.3 1.7 6.4
Age18-24 years 13,005 5,746 61.9 11.1 1.4 1.0 24.6 0.4 9.5
25-44 years 40,147 18,809 77.2 6.9 1.3 0.2 14.3 0.8 6.2
45-64 years 24,046 11,406 77.3 6.5 4.0 0.3 11.8 3.8 4.9
RaceWhite 64,885 29,223 77.8 5.8 2.1 0.3 14.1 1.6 4.7Black 9,578 5,552 56.7 18.4 2.6 0.8 21.5 2.7 17.4
Other 2,734 1,186 64.4 10.0 3.0 1.4 " 21.3 0.6 8.3
EthnicityHispanic 6,274 2,813 52.3 14.3 1.7 0.5 31.2 1.9 13.1
Non-Hispanic 70,923 33,148 76.7 6.9 2.2 0.4 13.9 1.6 5.8
EducationLess than 12 years 13,605 6,537 48.8 19.4 3.1 0.5 28.3 4.3 18.3
12 years 32,293 15,059 75.2 6.7 2.4 0.5 15.3 1.4 5.6Some college 17,236 7,902 81.7 4.2 1.8 0.3 12.0 0.9 2.9
College graduate 13,798 6,328 90.8 1.5 1.3 0.2 6.3 0.5 0.5
Unknown 265 135 47.2 20.3 9.0 * 0.0 t 23.5 12.5 233
Age & Education18-24 years &
Less than 12 years 2,441 1,116 36.5 24.7 1.5 0.9 36.4 0.6 24.2
12 years 5,629 2,504 59.3 11.3 1.5 1.2 26.7 0.3 9.3Some college 3,928 1,701 76.0 4.8 1.1 0.8 17.3 0.3 2.8College graduate 1'76 410 84.3 1.4 15 0.2 12.6 0.2 * 0.1 *
Unknown 31 15 53.9 10.6 20.3 " 0.0 t 15.2 " 14.2 30.9
25-44 years &Less than 12 years 5,120 2,452 45.2 21.3 2.0 0.3 31.2 2.2 21.4
12 years 16,072 7,591 76.0 6.9 1.5 0.3 15.2 0.7 6.4
Some college 9,406 4,377 82.8 4.3 1.1 0.1 11.7 0.6 3.2College graduate 9,402 4,317 91.7 1.2 0.8 0.2 6.0 0.3 0.5
Unknown 147 72 47.1 21.3 12.1 0.0 t 19.5 10.3 28.1
45-64 yearsLess than 12 years 6,044 2,969 56.8 15.6 4.7 0.5 * 22.5 7.5 13.2
12 years 10,592 4,964 82.3 3.9 4.1 0.3 93 2.9 2.4
Some college 3,902 1,824 85.0 3.1 4.1 0.3 * 7.5 2.2 2.4
College graduate 3,420 1,601 90.0 2.1 2.5 0.1 * 5.2 1.4 0.7
Unknown 88 48 44.9 22.2 0.0 t 0.0 t 32.9 15.6 12.5 *
Marital StatusMarried 49,978 23,073 81.2 4.1 2.1 0.3 12.3 1.1 2.5
Widowed 2,795 1,358 61.0 13.5 5.2 0.4 19.8 7.6 9.1
Divorced 7,030 3,397 65.1 13.2 1.7 0.3 19.7 2.7 13.2
Separated 2,400 1,211 45.9 27.6 2.9 0.7 22.8 3.2 27.6Never married 14,899 6,877 64.6 11.6 2.2 0.6 21.0 1.8 12.1
Unknown 94 45 56.8 7.9 * 34 0.0 t 31.9 3.5 11.3
Employment StatusCurrently employed 51,186 23,685 82.9 2.3 1.4 0.3 13.2 0.4 1.6
Unemployed 2,271 1,090 52.2 16.1 2.0 0.5 29.2 0.6 14.9
Not in labor force 23,740 11,186 59.2 17.8 4.0 0.6 18.4 4.6 15.9
Employment Status & AgeCurrently employed &
18-24 years 8,430 3,662 71.4 4.0 0.9 0.8 23.0 0.2 2.3
25-44 years 28,782 13,417 84.7 2.2 1.1 0.2 11.9 0.3 1.7
45-64 years 13,974 6,606 86.0 1.6 2.3 0.2 9.9 0.6 0.9

12Disability and health insurance
TABLE B. Type of Health Insurance Coverage Among Adults Aged 18 to 64, by Sociodemographic Characteristics, by Gender:United States, 1989
Unemployed &
Popula tion(1,000s)
SampleSi 7. e
With Insurance
NotInsured
Medi-care
Medi-caid
Priva teOnly
PublicOnly
Privateand
Public
UndefinedPlansOnly
18-24 years 666 304 42.2 20.6 1.7 1.5 34.1 02 * 19.725-44 years 1,201 582 54.5 16.4 1.5 * 0.2 * 27.3 0.4 * 15.745-64 years 405 204 61.9 7.6 3.8 * 0.0 t 26.7 2.1 * 49Not in labor force &18-24 years 3,909 1,780 45.0 24.8 2.5 1.2 26.5 0.8 23.425-44 years 10,164 4,810 58.8 19.1 2.1 0.4 '19.5 2.4 18.045-64 years 9,667 4,596 65.3 13.6 6.5 0.5 14.0 8.4 10.7
Family IncomeUnder $5,000 3,535 1,700 32.0 35.1 3.0 0.9 28.9 4.2 35.0$5,00046,999 2,212 1,053 26.0 37.4 3.5 0.6 32.5 7.2 35.6$7,00049,999 3,106 1,562 29.8 31.3 2.8 0.6 35.5 43 30.4$10,000414,999 6,902 3,305 48.9 13.3 2.8 0.7 34.3 3.2 11.7$15,000419,999 8,759 4,165 65.7 7.2 2.3 0.5 24.2 2.4 5.9520,000424,999 6,176 2,867 77.0 5.5 2.3 0.5 * 14.8 1.3 3.3525,000434,999 14,958 6,880 83.9 2.7 2.2 0.4 10.9 1.2 1.4$35,000449,999 16,277 7,478 88.8 1.8 1.7 0.1 * 7.6 0.5 0.9$50,000 or more 15,271 6,951 92.5 1.0 1.8 0.2 4.5 0.5 0.4
Poverty LevelUnder 0.50 3,231 1,575 25.4 40.0 2.9 0.8 31.0 2.0 40.50.50 to under 1.00 5,661 2,780 28.8 32.9 2.4 0.8 35.1 5.0 31.71.00 to under 1.25 3,329 1,625 44.2 16.6 2.1 0.5 36.6 3.2 14.71.25 to under 1.50 3,757 1,831 54.8 12.3 2.2 0.8 30.0 2.8 10.31.50 to under 1.75 5,458 2,596 69.0 6.4 2.5 0.3 * 21.8 1.8 5.31.75 to under 2.00 8,971 4,171 78.5 4.0 1.9 0.5 15.1 1.6 2.72.00 and above 46,789 21,383 87.3 1.9 2.1 0.3 8.4 1.0 0.9
Age and Poverty Level18-24 years &
Under 0.50 1,290 590 45.5 26.1 1.9 * 1.1 253 0.3 " 25.40.50 to under 1.00 1,564 712 36.9 26.3 0.8 1.3 34.7 0.5 24.71.00 to under 1.25 822 374 38.5 21.0 1.0 0.0 t 39.5 0.5 * 18.4'125 to under 1.50 799 378 48.6 16.1 1.4 '1.3 * 32.6 0.4 13.41.50 to under 1.75 1,018 460 32.5 9.2 2.0 1.0 35.3 0.2 * 7.61.75 to under 2.00 1,726 756 69.5 5.6 1.6 1.2 22.2 0.5 * 3.82.00 and above 5,785 2,476 77.0 3.5 1.4 0.8 17.3 03 2.125-44 years &.Under 0.50 1,494 744 10.6 52.6 3.3 0.6 * 32.8 2.1 * 54.60.50 to under 1.00 2,665 1,338 25.8 34.0 2.4 0.6 373 3.1 34.01.00 to under 1.25 1,690 829 48.2 14.8 1.7 03 35.0 1.9 13.91.25 to under '1.50 1,918 919 58.5 8.7 1.7 0.3 * 30.7 13 8.21.50 to under 1.75 3,333 1,590 75.9 5.4 1.5 0.0 17.2 0.8 4.11.75 to under 2.00 5,272 2,470 83.0 2.9 1.2 0.4 12.5 0.7 2.02.00 and above 23,775 10,919 89.7 13 1.1 0.2 7.8 0.4 0.645-64 years &
Under 0.50 447 241 16.3 37.6 4.4 0.2 * 41.5 6.4 36.90.50 to under 1.00 1,432 730 25.6 38.1 4.2 0.5 * 31.6 13.4 35.11.00 to under 1.25 817 422 41.8 15.8 3.9 1.4 37.0 8.4 12.61.25 to under 1.50 1,040 534 52.5 16.1 3.6 1.2 * 26.6 7.4 11.91.50 to under 1.75 '1,108 546 63.7 6.7 6.0 03 23.3 63 6.81.75 to under 2.00 1,973 945 74.1 5.6 4.2 0.4 * 15.8 5.1 3.62.00 and above 17,229 7,988 87.6 2.2 3.9 0.2 6.2 2.2 0.8
Source: National Health Interview Survey (author's tabulations from public use tapes).Note: Standard errors for estimates appear in Appendix TABLE A-1.
Estimate has low statistical reliability (relative standard error > 30%).t Estimate is exactly 0 or standard error is indeterminate.

Disability and health insurance 13
receive Medicaid-the highest of any group-they aremore than twice as likely as married people to beuninsured (t=11.75, p<.001). Of those who are separated,women are much more likely than men to receiveMedicaid (27.6% versus 6.3%, t=10.97, p<.001), reflectingthe linkage of Aid to Families with Dependent Children(AFDC) with Medicaid eligibility.
Employment is the gateway to private healthinsurance coverage. About 83.0% of people who workedin the two weeks prior to being interviewed have privatecoverage. Less than 4% of people who worked in the twoweeks prior to being interviewed have public insurance,and 15.1% are uninsured. The working uninsured,numbering 17.1 million people, make up about 68% of alluninsured working-aged people.
A small percentage of the employed receive Medicare(0.3%). However, this estimate translates to 13.9% of allpeople on Medicare aged 18 to 64 who work. Thisappears to be a large fraction, given the expectation thatfew Medicare beneficiaries work.6 Several other surveysprovide estimates for the working age population whoreceive SSDI benefits (all of whom receive Medicare aftera two-year waiting period) or who are covered byMedicare and are employed. In the 1984 SIPP, 5.0% ofSSDI recipients were employed (Martini, 1990). In the1990 CPS, 16.3% of the 3.2 million people aged 16 to 64who were covered by Medicare any time during the yearworked during the year (U.S. Bureau of the Census,1991a). Much of this work was irregular: only 3.7% ofthose on Medicare worked year-round, full-time.Therefore, it may be concluded that most of the workreported by Medicare beneficiaries is at a low capacity.This is as expected, given the fact that the Social Security"substantial gainful activity" eligibility standard was setat monthly earnings less than $300 in 1989.7
6 SSDI beneficiaries can test their ability to work during a 45month period without losing SSDI benefits or Medicarecoverage (U.S. House of Representatives e.t Committee on Waysand Means, 1992). Beneficiaries may earn more than the SCAlevel during a "trial work period" of 9 months (which may notbe consecutive within a 5 year period) with no effect on cashbenefits or Medicare coverage as long as they remain severely_impaired according to program standards. Income below $200per month ($190 in 1989) is not counted. After that, they aregranted an extended period of eligibility that can last up to 36months (hence 45 total months) during which they can continueto receive cash benefits if they fail to work above the SGA level.However, if they earn more than the SCA level for threemonths, cash benefits stop. Depending on when cash paymentscease, Medicare coverage may continue for 3 to 24 months, butnot to exceed 48 months total. If Medicare eligibility endsbecause of such work activity, and the former-beneficiaryremains severely impaired by program eligibility standards, heor she may purchase Medicare protection (so-called Medicarebuy-in). These "work incentives" have not been very effective.On an annual basis, less than 1% of SSDI beneficiaries leave therolls to engage in work above SCA. A somewhat larger, butstill qu:te small percentage engage in trial work, but areunsucc2ssful in leaving the rolls (Muller, 1992).7 Martini (1990) found in the 1984 SIPP that average earnings ofpeople receiving SSDI or SS1 were $507 per month and explainsthat this could be due to imputation of SSDI benefits and of
Several reasons can be given as to why surveys yieldhigher estimates of people on Medicare who are workingthan do administrative records. First, people with end-stage renal disease (ESRD) are covered by Medicarewhether or not they work. The ESRD program isseparate from the SSDI program. Of the 3.1 millionMedicare beneficiaries under age 65, about 58,000 haveESRD only (Social Security Administration, 1990). If allESRD recipients worked, this could add almost 2% tosurvey estimates that do not separate out this population.Second, in a confidential survey, people may report workevents they are reluctant to report to the Social SecurityAdministration for fear of losing benefits. Third, ifworking individuals erroneously think they are coveredby Medicare, this will inflate estimates of the percent onMedicare who work.
Being out of the work force is associated with muchlower rates of private insurance coverage, higher rates ofpublic insurance coverage, and higher rates ofuninsurance. The unemployed are 40% less likely thanthe employed to have private insurance (47.4% versus83.0%, t=28.8, p<.001), and 39.9% are uninsured.Unemployed people without private health insurance areoften viewed as having lost coverage, but a substantialnumber may have had jobs that did not provideinsurance. Beginning in 1985, federal COBRA legislationrequires employee group health plans to offer continuedcoverage to terminated workers and their dependents atgroup rates (plus 2% administration fee) for up to 18months (29 months if eligible for SSI or SSDI and 36months for death and other events). This may enableunemployed workers to keep private insurance, if theycan afford to pay the premiums. About 10.7% of theunemployed receive Medicaid, reflecting the associationof unemployment with poverty and serving as areminder that many unemployed may not be able to payto continue coverage under COBRA. Only a few of theunemployed receive Medicare (less than 1%). Theunemployed make up about 7% of all uninsured adults.
People without a job and who are not looking forwork (not in the labor force), are more likely thanemployed or unemployed people to have a seriousdisability and to be aided by public programs: 7.4%receive Medicare and 15.4% receive Medicaid. Those notin the labor force are half as likely as the unemployed tobe uninsured (19.3% versus 39.9%, t=15.85, p<.001) andare more likely than the employed to 1):., uninsured(19.3% versus 15.1%, t=7.80, p<.001). They make upabout 25% of all uninsured adults.
The proportion of the employed with privateinsurance increases with age from 69.2% at ages 18 to 24to 88.6% at ages 45 to 64, reflecting age differences in the
missing earnings, as well as individuals being permitted to earnmore than the SCA level during a Trial Work l'eriod underSSDI and the Section 1619 waiver program under SS1. About8% of people aged 18 to 64 on SS1 worked in December, 1988(Scott, 1992). The average monthly earnings was $92.

14Disability and health insurance
nature of work and employment-related benefits. Part-time jobs, for example, are less likely to provide healthinsurance. It is not possible to distinguish full-time frompart-time work in the NHIS, but estimates from the CPSfor 1989 indicate that employees under age 25 are muchmore likely to be working part-time-17.2% of maleemployees aged 20-24 worked part-time compared to3.9% at ages 25 to 54, whereas 26.4% of female employeesaged 20 to 24 worked part-time compared to 20.1% atages 25 to 54 (U.S. Bureau of the Census, 1991c, Table649). Older workers also have better benefits as a resultof having higher status jobs.
Unemployed workers aged 45 years and older aremore likely to have private coverage than those under 45(64.4% versus 41.8%, t=6.39, p<.001). Older unemployedworkers are more likely than younger unemployedworkers to have had jobs that provided insurance, andmay be better able than younger unemployed workers toafford to continue any health insurance they had.
Among people not in the labor force, younger adultsare more likely to receive Medicaid than Medicare,reflecting the high degree of poverty in this population.The proportion with private insurance and theproportion with Medicare coverage increase with age. Atages 45 to 64, 9.6% have both private and publicinsurance. In addition to private insurance, 5.8% haveMedicare, 2.6% have military, and 1.3% have Medicaid(Table 1). Close to 45% of people aged 45 to 64 who arenot in the labor force and who receive Medicare haveprivate insurance coverage as do 44% of people who havemilitary coverage. In contrast, 11% of people withMedicaid have private insurance.
Almost all people (93.6%) in families with incomes of$50,000 or more have private insurance and only 5.3% areuninsured. Although Medicaid covers about a quarter ofpeople with family incomes under $10,000, more than athird are uninsured. In families with incomes twice thepoverty level, 88.3% have private insurance, declining to29.5% of people in families with incomes below half thepoverty level. About 40% of working-age adults infamilies with incomes below 125% of the poverty line areuninsured. Just above the poverty threshold, Medicaidcoverage drops by 14.5 percentage points, but privatecoverage rises 14.2 percentage points, and the rate ofuninsurance remains as high for people near poverty asfor people in poverty. At 150% of poverty and above,public coverage is below 6% and declines further withincreasing income, as does the rate of uninsurance.
Adults aged 25 and older in extreme poverty relyheavily on public coverage-over 40% are covered bypublic plans alone, mainly Medicaid. Those aged 18 to 24in poverty have a higher rate of private coverage thanolder poor people. Some are covered by parents' policies,particularly if they are still attending school and aresingle. At ages 25 and above, people with family incomesless than half the poverty threshold have the lowest levelof private coverage-12.6% at ages 25 to 44 and 17.5% at
ages 45 to 64-and though they have high rates ofMedicaid coverage, about 42% are uninsured. Thus,about 5 million extremely poor adults aged 18 to 64 arehighly dependent on public insurance, but at the sametime they face the eligibility limitations of publicassistance programs, and 37.9% are uninsured.
Medicare is correlated with poverty, especially at theolder working ages, but not as strongly as is Medicaidcoverage. These data reconfirm our expectations:Medicaid covers the poor-but not all poor-andMedicare covers the older working-age population withdisabilities, particularly those out of the labor force andwith low educational attainment, characteristics that areassociated with poverty.
GenderSimilar themes occur for men and women, but with
different emphases. Men and women have identicallevels of private coverage, but women are more likely tohave public coverage (7.5% versus 3.8% with public only,t=175, p<.001) and men are more likely to be uninsured(18.3% versus 15.3%, t=7.5, p<.001). Women are almostthree times as likely to be covered by Medicaid (6.4%versus 2.3%, t=18.33, p<.001). Below age 45, men areabout 30% more likely than women to be uninsured (forages 18 to 24, t=7.1; for ages 25 to 44, t=6.40; both p<.001),but at ages 45 and above, women are about 13% morelikely to be uninsured than men (t=3.30, p<.001). Womenwho are black or who have not completed high school orwho are of Hispanic origin are about three times as likelyas men in these categories to be covered by Medicaid.Among unemployed people aged 25 to 44, men are morethan twice as likely as women to be uninsured (55.4%versus 27.3%, t=9.0, p<.001).
Among men and women both, the poor are mostlikely to be uninsured. But men ages 25 to 44 who arepoor are the only group more likely to be uninsured thanto have ins-urance: 62.0% of men aged 25 to 44 withfamily incomes less than half the poverty threshold areuninsured (Figure 1), a rate 90% higher than amongwomen (t=7.60, p<.001). Of those in poverty aged 25 to44, women are 2.5 times as likely as men to haveMedicaid (t=9.84, p<.001). Thus, for poor women, publicinsurance compensates for lack of access to privateinsurance, though it does not do so completely, and athird remain uninsured. For poor men, public insurancecompensates to a much smaller degree, and two-thirdsremain uninsured.
For poor people aged 45 to 64, the rate of uninsuranceis similar for men and women, with women somewhatmore likely to be covered by Medicaid than men (e.g., atincomes under 0.50 times poverty, t=2.43, p<.05), and thereverse occurring for Medicare (e.g., at incomes 0.50 tounder 1.00 times poverty, t=2.17, p<.05). Because oldermen and women alike can receive SS! and SSDI, publicinsurance compensates for lack of access to privateinsurance more equitably by gender.

Disability and health insurance 15
100
80
Under0.50
0.50to
under1.00
1.00to
under1.25
1.25to
under1.50
1.50to
under1.75
ill Men 0 Women
1.75to
under2.00
2.00and
above
Figure 1. Percent of men and women aged 25 to 44 who are uninsured, by ratio of family income to poverty level:United States, 1989
Disability and poor healthDisability does affect one's chance of being uninsured.
Among adults, the disabled population, similar to othersociodemographic groups, has significantly less access toprivate insurance (62.9% versus 79.3%). But they aremore likely to have public insurance or to have bothpublic and private insurance, and are much more likelyto be covered by Medicare or by Medicaid. With respectto uninsurance, people with disabilities fare a little worsethan the rest of the population. The rate of uninsuranceis statistically significantly higher for adults with activitylimitation than for those with no limitation (Table C): ofthe estimated 19.8 million adults aged 18 to 64 withactivity limitation, 17.5% were uninsured compared to16.3% of adults without activity limitation (t=2.05, p<.05).People with disabilities fare better than black andHispanic minority populations and the poor.
However, the uninsurance rate varies by severity ofdisability (Figure 2). People with the most severedisabilities are in fact less likely to be uninsured thanthose without a disability. About 12.1% of people withlimitations in self-care (ADL) are uninsured (Table 0),
significantly lower than the 16.6% of people not limitedin activity (t=2.23, p<.05). People who need assistance inroutine activities (IADL) are also less likely to beuninsured than those not limited in activity (13.5% versus16.6%, t=2.72, p<.01).
The majority of people with the most severedisabilities are unable to work (87.1% of those needingassistance in self-care and 74.4% of those needingassistance in routine activities). As just described, peoplewith assistance needs in basic life activities experience alower rate of uninsurance than others who are unable towork (Table 0). Cross-tabulating categories of basic lifeactivities with work disability enables the data to bereorganized into a more meaningful scale (Table E).Among people who do not need assistance in basic lifeactivities, those unable to work are in fact more likelythan those without limitation to be uninsured (19.1%versus 16.6%, t=2.93, p<.01). Likewise, people who arelimited in the amount or kind of work they can do aremore likely than those without limitation to be uninsured(20.2% versus 16.6%, t=3.79, p<.001). However, the rateof uninsurance among people limited in activities other

16 Disability and health insurance
100
80
60
-1
40
20
0
Needs assistance in basiclife activities
Does not need assistance in basiclife activities
A.IWAV7
Self-care Routine Unable to Limited in Other No(ADL) care
(IADL)work amt/ kind
of worklimitation limitation
Private only El Public & Private D Public only EI Uninsured E Undefined
Figure 2. Percent distribution of type of health insurance coverage among adults aged 18 to 64, by disability status:United States, 1989
than work (16.0%) is the same as for those withoutlimitation.
Whether measured by major activity limitation, worklimitation, or limitation in basic life activities, private in-surance coverage declines with increasing severity ofdisability, while public insurance coverage rises (TableD). Inability to work is a central concept to eligibility forfederal disability benefits among working-age people.Almost 8 million people aged 18 to 64 are classified in theI\IHIS as unable to work at a job or business. This groupis half as likely as people not limited in activity to becovered solely by private insurance (34.3% versus 66.3%,t=41.7, p<.001) and more than 8 times as likely to havepublic insurance (33.9% versus 3.7% have public insur-ance alone, t= 36.6, p<.001; 13.2% versus 1.6% have bothpublic and private insurance, t=19.6, p<.001). Comparedto people with less severe work disability, people unableto wc,:k have much lower private insurance coverage(Figure 2). Since employment is the gateway to privateinsurance, people who are unable to work are at greaterrisk of not having private insurance. Certainly, theproportion with private coverage would be even lower if
people were not able to continue coverage with theirformer employers or were not covered by a spouse'splan. At the same time, inability to work is a thresholdfor public insurance which is targeted towards certainpeople who are unable to work.
About a quarter of people who are unable to work arecovered by Medicare and about another quarter byMedicaid (Table D). At least 29% of those on Medicarehave Medicaid as well (Table 2). Medicaid pays thedeductibles and copayments for Medicare beneficiaries.About 1.2% of people unable to work have privateinsurance, Medicare, and Medicaid, a curious result sinceit is not clear why people would retain private coverageif they are entitled to Medicare and Medicaid.
Medicare coverage drops from 23.9%, for peopleunable to work, to 3% for other people with disabilities,and to 0.4% for those without a limitation. Medicare isnot exclusively targeted to those who say they arc unableto work: only 67.6% of people aged 18 to 64 on Medicarestate that they are unable to work, while 6.7% are limitedin the amount or kind of work they can do, 5.6% arelimited in other activities, and 20.2% arc not limited in
0 0

TA
BL
E C
. Typ
e of
Hea
lth I
nsur
ance
Cov
erag
e A
mon
g C
hild
ren
and
Adu
lts, b
y D
isab
ility
: Uni
ted
Stat
es, 1
989
With
Ins
uran
ce
Tot
alPr
ivat
eO
nly
SE
I'ubl
icPr
ivat
e an
d_O
nly
Publ
icE
stim
ate
SEE
stim
ate
SE
Num
ber
of p
eopl
e in
thou
sand
s
Und
efin
edpl
ans
Not
Insu
red
Med
icar
eE
stim
ate
SEM
edic
aid
Est
imat
eSE
Est
imat
eSE
Est
imat
eE
stim
ate
SEE
stim
ate
SE
Und
er a
ge 6
521
4,31
40
156,
775
2,44
116
,475
591
4,80
418
297
474
35,2
8689
52,
964
9614
,196
561
With
act
ivity
lim
itatio
n23
,198
425
12,7
8829
54,
472
151
1,74
265
133
214,
062
136
2,27
475
3,75
214
5W
ithou
t act
ivity
lim
itatio
n19
1,11
62,
759
143,
986
2,26
812
,003
504
3,06
215
484
168
31,2
2481
969
050
10,4
4446
9
Age
s 0-
1764
,005
044
,522
870
7,95
034
91,
058
8635
541
10,1
2043
714
126
7,56
234
8W
ith a
ctiv
ity li
mita
tion
3,43
811
71,
986
8177
161
122
1712
554
743
207
831
65'W
ithou
t act
ivity
lim
itatio
n60
,567
1,06
242
,536
836
7,17
932
893
679
342
419,
574
414
121
256,
731
321
Age
s 18
-64
150,
309
011
2,25
31,
701
8,52
528
13,
746
135
620
5325
,165
547
2,82
389
6,63
523
9W
ith a
ctiv
ity li
mita
tion
19,7
6036
210
,802
253
3,70
012
21,
620
6612
121
3,51
511
62,
254
742,
921
115
With
out a
ctiv
ity li
mita
tion
130,
549
1,87
510
1,45
01,
561
4,82
421
02,
126
104
499
4521
,650
497
569
403,
713
166
Perc
ent d
istr
ibut
ion
Und
er a
ge 6
510
0.0
73.2
0.5
7.7
0.3
2.2
0.1
0.5
0.0
16.5
0.3
1.4
0.0
6.6
0.2
With
act
ivity
lim
itatio
n10
0.0
55.1
#0.
719
.3#
0.6
7.5
#0.
30.
6 j
0.1
17.5
0.5
9.8
#0.
316
.2 #
0.6
With
out a
ctiv
ity li
mita
tion
100.
075
.30.
56.
30.
31.
60.
10.
40.
016
.30.
40.
40.
05.
50.
2
Age
s 0-
1710
0.0
69.6
0.8
12.4
0.5
1.7
0.1
0.6
0.1
15.8
0.6
0.2
0.0
11.8
0.5
With
act
ivity
lim
itatio
n10
0.0
57.8
#1.
522
.4#
1.5
3.5
#0.
50.
40.
115
.91.
20.
6 t
0.2
24.2
#1.
6W
ithou
t act
ivity
lim
itatio
n10
0.0
70.2
0.8
11.9
0.5
1.5
0.1
0.6
0.1
15.8
0.6
0.2
0.0
11.1
0.5
Age
s 18
-64
100.
074
.70.
45.
70.
22.
50.
10.
40.
016
.70.
31.
90.
14.
40.
2W
ith a
ctiv
ity li
mita
tion
100.
054
.7 #
0.7
18.7
#0.
68.
2#
0.3
0.6
0.1
17.8
0.5
11.4
#0.
414
.8 #
0.5
With
out a
ctiv
ity li
mita
tion
100.
077
.70.
43.
70.
21.
60.
10.
40.
016
.60.
30.
40.
02.
80.
1
Sour
ce: N
atio
nal H
ealth
Int
ervi
ew S
urve
y (a
utho
r's ta
bula
tions
fro
m p
ublic
use
tape
s).
f Si
gnif
ican
tly d
iffe
rent
fro
m p
eopl
e no
t lim
ited
in a
ctiv
ity, p
<0.
05 (
two-
taile
d t-
test
).§
Sign
ific
antly
dif
fere
nt f
rom
peo
ple
not l
imite
d in
act
ivity
, p<
0.01
(tw
o-ta
iled
t-te
st).
# Si
gnif
ican
tly d
iffe
rent
fro
m p
eopl
e no
t lim
ited
in a
ctiv
ity, p
<0.
001
(tw
o-ta
iled
t-te
st).
3

18 Disability and health insurance
TABLE D. Type of Health Insurance Coverage Among Adults Aged 18 to 64, by Disability and Health Status, by Gender:United States, 1989
Popula tion(1,000s)
SampleSize
With Insurance
NotInsured
(%)
Medi-care(%)
Medi-caid(%)
PrivateOnly(%)
Private UndefinedPublic and PlansOnly Public Only
(%) (%) (%)
Total 150,309 68,211 74.7 5.7 2.5 0.4 16.7 1.9 4.4
Ile-.1th StatusExcellent 57,392 25,595 81.1 2.5 1.6 0.3 14.5 0.4 1.6
Very good 44,376 20,088 79.0 3.8 1.9 0.3 15.0 0.9 2.8
Good 34,491 15,846 69.2 7.0 2.6 0.5 20.7 1.7 5.8
Fair 10,016 4,742 53.9 16.9 6.2 0.9 22.1 7.9 14.1
Poor 3,554 1,713 30.6 36.0 12.8 0.5 20.1 23.5 27.5
Unknown 480 227 63.3 9.0 0.9 0.4 26.4 0.4 * 8.5
Major ActivityUnable to perform major activity 6,772 3,".26 34.1 33.9 13.5 1.0 17.4 25.0 25.6
Limited in arnount/kind of major activity 7,498 3,465 62.7 10.8 6.5 0.6 19.4 5.0 9.2
Limited in other activity 5,490 2,540 69.1 10.9 3.9 0.1 16.1 3.3 9.0
Not limited in activity 130,549 58,980 77.7 3.7 1.6 0.4 16.6 0.4 2.8
Work ActivityUnable to work 7,980 3,818 34.3 34.3 13.2 0.9 17.3 23.9 26.8
Limited in amount/kind of work 6,776 3,106 66.3 8.0 5.4 0.5 19.8 2.8 6.7
Limited in other activity 5,004 2,307 71.5 8.5 4.0 0.3 15.8 3.2 6.6
Not lirnited in activity 130,549 58,980 77.7 3.7 1.6 0.4 16.6 0.4 2.8
Basic Life ActivitiesNeeds help in self care (ADL) 780 370 21.2 40.8 24.7 1.3 12.1 35.8 36.9
Needs help in routine activities (IADL) 2,210 1,067 35.6 36.9 13.8 0.3 * 13.5 25.6 30.7
Not limited in basic life activities 147,320 66,774 75.6 5.0 2.2 0.4 16.8 1.3 3.8
Work Activity & Basic Life ActivitiesUnable to work &
Needs help in self care (ADL) 680 325 18.4 42.2 26.4 0.6 * 12.4 38.7 38.1
Needs help in routine activities (IADL) 1,644 800 28.8 41.9 15.9 0.2 * 13.3 30.7 34.3
Not limited in basic life activities 5,656 2,693 37.8 31.2 10.9 1.1 19.1 20.2 23.2
Limited in amount/kind of work &Needs help in self care (ADL) 59 25 40.3 * 25.0 17.0 7.1 10.6 15.8 28.3 "Needs help in routine activities (IADL) 355 167 57.8 19.1 7.7 0.0 t 15.4 10.1 17.3
Not limited in basic life activities 6,362 2,914 67.0 7.2 5.2 0.5 20.2 2.3 5.9
Limited in other activity &Needs help in self care (ADL) 40 19 36.6 40.1 8.5 5.2 * 9.5 18.2 30.1
Needs help in routine activities (IADL) 201 94 52.2 27.1 8.6 1.0 " 11.1 10.7 24.1
Not limited in basic life activities 4,763 2,194 72.6 7.4 3.7 0.3 16.0 2.7 5.7
Not limited in activity &Needs help in self care (ADL) 1 * 1 100.0 t 0.0 t 0.0 t 0.0 i- 0.0 t 0.0 t 0.0 tNeeds help in routine activities (IADL) 10 6 24.5 50.4 0.0 t 0.0 t 25.2 31.9 39.8
Not limited in basic life activities 130,538 58,973 77.7 3.7 1.6 0.4 16.6 0.4 2.8
Work Activity & Health StatusUnable to work &
Excellent 369 172 50.5 17.8 10.0 0.5 * 21.3 16.2 17.1
Very good 669 304 48.3 25.9 8.2 1.8 15.8 18.5 19.3
Good 1,874 879 42.3 27.0 10.2 0.5 20.0 18.0 21.5
Fair 2,537 1,234 33.1 35.1 15.0 1.1 15.7 24.6 28.1
Poor 2,490 1,208 23.3 43.5 15.7 0.7 16.8 30.5 '.>2.7
Unknown 40 ' 21 29.2 47.1 0.0 1- 5.3 18.4 " 5.3 * 36.5 *
Limited in amount/kind of work &Excellent 779 351 66.9 7.4 6.1 0.7 18.9 2.7 7.2
Very good 1,534 687 74.4 5.9 4.1 0.2 15.4 2.5 4.3
Good 2,480 1,129 66.2 8.3 5.8 0.6 * 19.2 2.5 6.8
Fair 1,587 747 60.5 9.1 5.3 0.8 24.2 3.1 8.2
Poor 375 180 57.5 10.9 7.3 0.0 t 24.3 5.5 7.8
Unknown 21 12 44.0 0.0 t 9.1 0.0 t 46.9 0.0 t 9.1

Disability and health insurance
TABLE D. Type of Health Insurance Coverage Among Adults Aged 18 to 64, by Disability and Health Status, by Gender:United States, 1989
19
Popula tion(1,000s)
SampleSize
With Insurance
NotInsured
(%)
Medi-care(%)
Medi-caid(%)
PrivateOnly
(%)
PublicOnly
(%)
Privateand
Public(%)
UndefinedPlansOnly
(%)
Limited in other activity &Excellent 823 369 79.2 3.9 3.7 0.3 12.9 0.8 * 2.1Very gr od 1,441 646 78.3 4.4 5.1 0.1 12.1 1.9 3.4Good 1,637 767 72.2 8.2 2.8 0.3 16.5 2.0 6.9Fair 849 400 59.6 13.4 3.9 0.8 * 22.3 6.2 10.4Poor 235 117 41.2 33.6 7.0 0.0 t 18.2 16.0 26.6Unknown 18 8 67.1 0.0 t 0.0 t 0.0 t 32.9 0.0 t 0.0 t
Not limited in activity &Excellent 55,420 24,703 81.5 2.3 1.4 0.3 14.4 0.3 1.5Very good 40,733 18,451 79.7 3.3 1.7 0.3 15.0 0.5 2.5Good 28,501 13,071 71.0 5.5 1.8 0.5 21.1 0.5 4.6Fair 5,043 2,361 61.2 10.8 2.5 0.8 24.7 1.3 9.4Poor 453 208 42.5 16.6 4.8 * 0.0 t 36.1 3.9 15.5Unknown 399 186 67.6 6.0 * 0.5 0.0 t 25.8 0.0 t 6.0
All Men 73,112 32,250 74.7 3.8 2.8 0.4 18.3 2.1 2.3
I lealth StatusExcellent 30,711 13,376 80.8 1.3 1.7 0.3 16.0 0.4 0.6Very good 21,151 9,325 78.7 2.2 2.2 0.3 16.7 0.8 1.4Good 15,155 6,736 68.6 4.4 3.1 0.6 23.3 2.0 2.9Fair 4,131 1,895 51.7 14.8 8.2 1.3 24.1 10.7 9.7Poor 1,754 818 29.2 34.7 16.2 0.8 19.2 28.7 21.3Unknown 212 100 56.8 9.6 * 1.0 " 1.0 31.6 0.0 t 8.6
Major ActivityUnable to perform major activity 3,801 1,774 29.9 34.8 16.2 1.4 17.7 30.0 22.4Limited in amount/kind of major activity 3,394 1,511 62.8 7.7 7.6 0.6 21.2 4.0 5.0Limited in other activity 2,232 988 74.7 5.4 4.9 0.1 14.9 2.1 3.4Not limited in activity 63,685 27,977 78.0 1.6 1.7 0.4 18.3 0.3 1.0
Work ActivityUnable to work 3,867 1,807 29.5 35.8 16.0 1.4 17.3 30.3 23.1Limited in amount/kind of work 3,291 1,463 63.4 7.1 7.5 0.6 * 21.4 3.3 4.8Limited in other activity 2,270 1,003 75.4 3.8 5.1 0.2 15.5 1.8 1.9Not limited in activity 63,685 27,977 78.0 1.6 1.7 0.4 18.3 0.3 1.0
Basic Life ActivitiesNeeds help in self care (ADL) 365 172 18.3 41.4 30.0 1.9 8.4 47.7 32.5Needs help in routine activities (1ADL) 812 385 25.6 44.0 17.5 0.1 * 12.8 37.1 28.8Not limited in basic life activities 71,935 31,693 75.5 3.1 2.5 0.4 18.4 1.5 1.9
Work Activity & Basic Life ActivitiesUnable to work &
Needs help in self care (ADL) 331 156 17.0 42.6 30.8 0.9 * 8.7 49.8 32.2Needs help in routine activities (IADL) 663 318 20.9 47.7 18.8 0.1 * 12.4 40.5 31.4Not limited in basic life activities 2,872 1,333 32.9 32.3 13.7 1.8 19.4 25.7 20.1
Limited in amount/kind of work &Needs help in self care (ADL) 23 10 29.4 26.7 16.8 18.4 8.7 25.4 * 35.3Needs help in routine activities (IA DL) 119 52 43.4 28.3 12.8 0.0 t 15.4 21.2 21.8Not limited in basic life activities 3,150 1,401 64.4 6.2 7.2 0.5 21.7 2.5 4.0
Limited in other activity &Needs help in self care (ADL) 10 " 5 24.3 41.7 33.9 0.0 t 0.0 t 33.9 * 40.3 *Needs help in routine activities (IADL) 29 14 60.3 24.9 7.8 0.0 t 7.0 26.1 0.0 tNot limited in basic life activities 2,231 984 75.8 3.3 4.9 0.2 15.7 1.3 1.8
Not limited in activity &Needs help in self care (ADL) 1 1 100.0 t 0.0 t 0.0 t 0.0 t 0.0 t 0.0 t 0.0 tNeeds help in routine activities (IA DL) 1 ' 1 0.0 i 0.0 t 0.0 t 0.0 t 100.0 t 0.0 t 0.0 tNot limited in basic life activities 63,682 27,975 78.0 1.6 1.7 0.4 18.3 0.3 1.0

20 Disability and health insuranceTABLE D. Type of Health Insurance Coverage AmongAdults Aged 18 to 64, by Disability and Health Status, by Gender:United States, 1989
Population(1,000s)
SampleSize
With Insurance
NotInsured
(%)
Medi-care(%)
Medi-caid(%)
Priva teOnly(%)
PublicOnly
(%)
Privateand
Public(%)
UndefinedPlansOnly
(%)
Work Activity & Health StatusUnable to work &
Excellent 213 99 50.2 18.8 11.9 0.9 18.3 20.1 16.3Very good 327 144 44.2 28.9 8.2 * 37 * 15.0 17.9 21.3Good 848 394 36.2 29.6 12.3 1.2 20.8 23.4 19.8Fair 1,179 555 26.0 36.5 18.9 1.3 17.4 33.1 23.3Poor 1,275 602 21.1 43.8 18.9 1.0 15.2 37.8 26.4Unknown 25 13 22.0 * 47.6 * 0.0 t 8.6 * 21.7 * 0.0 t 38.9Limited in amount/kind of work &Excellent 442 195 62.2 6.8 8.6 1.1 21.3 2.8 * 6.3Very good 767 338 71.7 5.7 6.3 0.0 t 16.4 3.5 3.9Good 1,189 524 63.6 8.3 7.5 0.4 * 20.2 3.0 ' 5.1Fair 694 314 55.9 6.1 7.5 1.4 29.1 3.4 4.1Poor 189 87 60.3 10.6 * 10.1 * 0.0 t 19.0 6.1 6.2 *Unknown 9 5 36.5 0.0 t 0.0 t 0.0 t 63.5 0.0 t 0.0 tLimited in other activity &Excellent 475 209 81.0 2.3 * 4.6 0.0 t 12.1 0.9 " 0.4 *Very good 771 329 78.8 2.2 * 5.8 0.0 t 13.1 1.8 * 0.2Good 674 304 71.8 5.0 4.4 0.4 18.4 1.9 4 3.6Fair 280 127 70.2 4.8 4.1 * 1.0 20.0 3.0 * 1.7 *Poor 65 31 54.5 15.1 * 12.3 * 0.0 t 18.2 * 1.9 * 17.0 *Unknown 6 3 70.4 0.0 t 0.0 t 0.0 t 29.6 0.0 t 0.0 1-Not limited irt activity &Excellent 29,581 12,873 81.3 1.1 1.4 0.3 16.0 0.2 0.4Very good 19,286 8,514 79.5 1.6 1.8 0.3 16.9 0.4 1.0Good 12,445 5,514 71.1 2.3 1.9 0.6 24.1 0.5 1.4Fair 1,978 899 62.8 6.3 2.7 1.3 26.9 1.0 * 4.7Poor 224 98 42.1 9.0 * 6.9 ' 0.0 t 42.0 3.8 * 6.9 *Unknown 171 79 62.4 5.0 * 1.3 * 0.0 t 31.4 0.0 t 5.0 *
All Women 77,197 35,961 74.7 7.5 2.2 0.4 15.3 1.7 6.4
Health StatusExcellent 26,682 12,219 81.5 3.9 1.5 0.4 12.8 0.4 2.8Very pod 23,226 10,763 79.3 5.2 1.7 0.3 13.4 0.9 4.2Good 19,336 9,110 69.6 9.1 2.2 0.4 18.7 1.4 8.1Fair 5,886 2,847 55.4 19 4 4.8 0.6 20.7 5.9 17.1Poor 1,800 895 31.9 37.2 9.6 0.2 21.0 18.5 33.5Unknown 268 127 68.5 8.5 * 0.7 0.0 t 22.2 0.8 * 8.3 "
Major ActivityUnable to perform major activity 2,971 1,452 39.5 32.7 10.2 0.5 * 17.1 18.7 29.8limited in amount/kind of major activity 4,104 1,954 62.5 13.4 5.7 0.5 17.8 5.9 12.8Limited in other activity 3,258 1,552 65.2 14.6 3.2 0.1 16.9 4.1 12.8Not limited in activity 66,865 31,003 77.4 5.6 1.6 0.4 14.9 0.5 4.6
Work ActivityUnable to work 4,113 2,011 38.8 32.9 10.6 0.4 " 17.4 17.9 30.3Limited in amount/kind of work 3,486 1,643 69.0 8.7 3.4 0.5 18.4 2.3 8.4Limited in other activity 2,733 1,304 68.3 12.4 3.0 0.4 * 16.0 4.3 10.5Not limited in activity 66,865 31,003 77.4 5.6 1.6 0.4 14.9 0.5 4.6
Basic Life Activities.
Needs help in self care (ADL) 415 198 23.7 40.2 20.1 0.8 15.3 25.4 40.8Needs help in routine activities (IADL) 1,397 682 41.3 32.8 11.7 0.4 13.8 18.9 31.7Not limited in basic life activities 75,385 35,081 75.6 6.8 1.9 0.4 15.3 1.2 5.7

Disability and health insurance 21
TABLE D. Type of Health Insurance Coverage Among Adults Aged 18 to 64, by Disability and Health Status, by Gender:United States, 1989
Popula tion(1,000s)
SampleSize
With Insurance
NotInsured
(%)
Medi-care(%)
Medi-caid(%)
PrivateOnly(%)
Priva tePublic andOnly Public
(%) (%)
UndefinedPlansOnly
(%)
Work Activity & Basic Life ActivitiesUnable to work &
Needs help in self care (ADL) 349 169 19.8 4 '..9 22.1 0.3 15.9 28.1 43.8Needs help in routine activities (IADL) 981 482 34.1 ")8.0 13.9 0.3 * 13.8 24.1 36.2Not limited in basic life activities 2,784 1,360 42.8 30.0 8.0 0.4 18.8 14.4 26.5
Limited in amount/kind of work &Needs help in self care (ADL) 36 * 15 47.1 * 24.0 " 17.1 " 0.0 t 11.8 * 9.8 * 24.0 *Needs help in routine activities (IADL) 237 115 65.0 14.4 5.2 0.0 t 15.4 4.4 * 15.1Not limited in basic life activities 3,213 1,513 69.5 8.2 3.1 0.5 18.7 2.0 7.8
Limited in other activity &Needs help in self care (ADL) 30 14 40.7 * 39.6 * 0.0 t 6.9 12.7 12.9 * 26.7 *Needs help in routine activities (IADL) 171 80 50.8 27.5 8.7 * 1.2 * 11.8 * 8.1 28.3Not limited in basic life activities 2,532 1,210 69.8 11.0 2.7 0.3 * 16.3 3.9 9.1
Not limited in activity &Needs help in self care (ADL) 0 1. 0 0.0 t 0.0 t 0.0 t 0.0 t 0.0 t 0.0 t 0.0 tNeeds help in routine activities (IADL) 9 * 5 28.1 * 57.9 * 0.0 t 0.0 t 14.0 * 36.7 45.7Not limited in basic life activities 66,856 30,998 77.5 5.6 1.6 0.4 14.9 0.5 4.6
Work Activity & Health StatusUnable to work &
Excellent 156 73 50.9 16.3 7.4 0 0 t 25.4 10.9 18.2Very good 342 160 32.1 23.1 8.3 0.0 t 16.5 19.0 17.5Good 1,026 485 47.2 24.8 8.6 0.0 t 19.4 13.6 22.8Fair 1,358 679 39.3 34.0 11.6 0.9 * 14.2 17.2 32.3Poor 1,215 606 25.7 43.3 12.3 0.4 * 18.4 22.9 39.4Unknown 16 * 8 40.7 46.3 0.0 t 0.0 t 13.0 * 13.6 " 32.7 *
Limited in amount/kind of work &Excellent 337 156 73.1 8.2 2.8 0.0 t 15.9 2.5 * 8.5Very good 767 349 77.2 6.2 1.8 " 0.3 * 14.4 1.4 * 4.7Good 1,291 605 68.6 8.3 4.2 0.7 * 18.3 2.0 8.3Fair 893 433 64.1 11.4 3.6 0.5 * 20.4 2.8 * 11.4Poor 186 93 54.7 11.2 4.4 0.0 t 29.7 4.8 9.4 *Unknown 12 7 49.8 0.0 t 16.3 * 0.0 t 33.9 * 0.0 t 16.3 *
Limited in other activity &Excellent 349 160 76.8 6.1 2.5 * 0.7 * 13.9 0.5 * 4.3 *Very good 670 317 77.7 6.9 4.2 0.3 " 11.0 2.1 * 7.0Good 963 463 72.5 10.4 1.6 * 0.2 15.2 2.1 * 9.3Fair 569 273 54.3 17.7 3.9 0.7 * 23.4 7.8 14.7Poor 170 86 36.2 40.6 5.0 * 0.0 t 18.3 21.4 30.3Unknown 12 * 5 65.5 0.0 t 0.0 t 0.0 t 34.5 * 0.0 t 0.0 t
Not limited in activity 8::Excellent 25,839 11,830 81.9 3.7 1.4 0.4 12.6 0.4 2.6Very good 21,447 9,937 79.9 4.9 1.6 0.3 13.4 0.5 3.8Good 16,056 7,557 71.0 8.0 1.7 0.4 18.8 0.5 7.1Fair 3,065 1,462 60.2 13.7 2.4 0.5 2.3.2 1.4 * 12.5Poor 229 110 43.0 24.0 2.8 0.0 t 30.2 3.9 24.0Unknown 228 107 71.6 6.8 0.0 t 0.0 t 21.6 0.0 t 6.8 *
Source: National Health Interview Survey (author's tabulations from public use tapes).Note: Standard errors for estimates appear in Appendix TABLE A-2." Estimate has low statistical reliability (relative standard error > 30).t Estimate is exactly 0 or standard error is indeterminate.

22 Disability and health insurance
Table E e of Health Insuratxp2secovera e Among Adults A ed 18 to 64 by Level of Disabilites, 1989With
private WithPopulation rnly SE public SE Uninsured SE
Severity of disability (1,000s) (%) (%) (%) (%) (%) (%)Needs assistance in basic lifeactivitiesSelf-care (ADL) 780 21.2# 2.4 65.5# 3.2 12.1f 2.0Routine care (IADL) 2,210 35.6# 1.8 50.7# 2.0 13.5§ 1.1
Does not need assistance inbasic life activities and is
Unable to work 5,656 37.8# 1.2 42.1# 1.3 19.1§ 0.8Limited amount/kind work 6,362 67.0# 1.0 12.4# 0.8 20.2# 0.9Limited other than work 4,763 72.6# 1.1 11.1# 0.9 16.0 0.9Not limited in activity 130,538 77.7 0.4 5.3 0.1 16.6 0.3
Total 150,309 74.7 0.4 8.2 0.1 16.7 0.3Source: 1989 National Health Interview Survey (author's tabulations from public use tapes)f Significantly different from people not limited in activity, p<.05 (two-tailecl t-test)§ Significantly different from people not limited in activity, p<.01 (two-tailed t-test)# Significantly different from people not limited in activity, p<.001 (two-tailed t-test)
TABLE F. Distribution of Adults Aged 18 to 64 on Medicare by Employment and Work Disability Status:United States, 1989
Total Not Employed EmployedWork activity (1,000s) (%) (1,000s) (%) (1,000s) (%)Unable to work 1,908 67.6 1,856 76.4 51 13.0Limited in amount/kind work 189 6.7 98 4.0 91 23.2Limited in activities other than work 158 5.6 139 5.7 19 4.8Not limited in activity 569 20.2 337 13.9 232 59.0Total 2,822 100.0 2,430 100.0 392 100.0
Source: 1989 National Health Interview Survey (author's tabulations from public use tapes)
activity (Table F). Thus, about a quarter of those onMedicare say they are not limited at all in work.
Medicaid covers 26.8% of people unable to work anddrops to 6.7% for those limited in the amount or kind ofwork they can do. Among people with limitation.s lesssevere than being unable to work at a job or business,Medicaid covers more people than Medicare. Forexample, among people limited in the amount or kind ofwork they can do, Medicaid covers 6.7% versus Medicareat 2.8% (t =6.69, p<.001). This reflects the broadereligibility for Medicaid based on characteristics otherthan disability.8
This surprising result does not depend on whetherrespondents answer for themselves or other respondentsanswer for them. Furthermore, of the 392,000 employed
8 Of people aged 18 to 64, 11.1% on AFDC are unable to work,whereas 66.8% on SSI are unable to work. Those on SSIcomprise 30.3% and those on AFDC 40.2% of people onMedicaid. About 31.8% of those classified as having Medicaidare neither SSI or AFDC recipients.
people estimated to be on Medicare, about 59% state theyare not limited in any activity, a result that is even moresurprising. One reason may be that respondents on SSDIwho have mental conditions may be more likely tointerpret the activity limitation questions in terms ofphysical activity. In 1989, 21% of SSDI beneficiaries hadmental, psychoneurotic, or personality disorders (SocialSecurity Administration, 1991, Table 6.C5). Althoughmany people with mental conditions also have physicalhealth problems, those without physical limitationsmight answer they are not limited in activity. Perhaps amore likely explanation for the large number of non-limited people on Medicare is classification error eitheron activity limitation or type of insurance. Some peoplemay think they are on Medicare when they in fact haveMedicaid. Perhaps some dependents who are not limitedin activity erroneously think they are covered byMedicare.
Of people who need assistance in self-care activities,35.8% are covered by Medicare-the highest rate of

Disabilihj and health insurance 23
Medicare coverage of any populationand 36.9% byMedicaida higher fraction than even among the poor(27.4%, Table B). About 10.8% of people who needassistance in self-care activities have both Medicare andMedicaid, and 5.7% have military coverage (Table 2). Infact, the majority of people needing assistance in self-careactivities-65.5%are covered by some kind of federalgovernment insurance (Figure 2). Furthermore, a highdegree of overlapping private and public coverage occursamong this population. In fact, it is as common to haveboth private and public insurance (24.7%) as it is to haveprivate insurance alone (21.2%). About 17.4% haveprivate insurance and Medicare while 7.2% have privateinsurance and Medicaid (Table 2). Medicare thusaccounts for most of the overlap of private with publicinsurance, with half of working-age people with self-carelimitations who are on Medicare also covered by privateinsurance. Conversely, about 40% of those with privateinsurance have Medicare coverage. About 20% of peoplewith self-care limitations who are on Medicaid haveprivate insurance. Around 50% of those with militarycoverage have private insurance, and about 30% ofpeople on Medicare have Medicaid coverage.
People who need assistance in routine activities(IADL), such as shopping or getting about thecommunity, are as likely as those who need assistance inself care activities to be covered by private insurance(Table D and Figure 2), but they have a lower rate ofpublic coverage (50.7 versus 65.5%, t=4.09, p<.001). Some13.8% have both private and public coverage. Amongpeople who are not limited in basic life activities (ADLand IADL), those who are unable to work are much morelikely than people with less severe limitations to havepublic coverage and much less likely to have privateinsurance (Figure 2).
Public coverage continues to expand with greaterseverity of disability (Table E and Figure 2). However,for people with more severe limitations in basic lifeactivities, private insurance coverage remains about thesame as for those who are unable to workclose to 50%.This pattern is observed for both men and women(Figure 3).9 It would appear that even among peoplewith a disability, a major reason for not having privatehealth insurance is separation from the labor force.Private insurance does not decrease further for peoplewith limitations more severe than inability to work, butpublic insurance increases. One reason that the fractionwith private insurance coverage does not decline withincreasing severity of disability is that people withdisabilities may desire to retain private insurancecoverage.
9 Of people with ADL limitations, the lower rate ofuninsurance for men is not significantly different from women.
Marriage and disabilityAs noted earlier, married people are more likely than
unmarried people to have private insurance. The reverseoccurs for public insurance, though not to the samedegree, leaving unmarried people more likely to beuninsured. Figure 4 shows how insurance coveragevaries by level of work disability for married andunmarried people. Private insurance declines withincreasing severity of work disability far less for marriedpeople than for unmarried people. Being enrolled undera spouse's plan protects against losing insurance in theeventuality of a disability. Public insurance, on the otherhand, increases with greater severity of disability morefor unmarried than married people, especially amongthose unable to work because of a health problem orimpairment. Of people unable to work, public insurancecovers 61.1% of those who aren't married, compared to37.7% of those who are married. The net result is thatmarried and unmarried people who are unable to work-are equally likely to be uninsured. For groups with lesssevere limitations, the rate of uninsurance is about twiceas high for unmarried as for married people (e.g., amongpeople limited in the kind or amount of work they cando, 27.2% of unmarried people are uninsured versus15.6% of married people, 1=6.11, p<.001).
Married people are slightly more likely thanunmarried people to be employed (76.4% versus 73.4%,1=6.64, p<.001). Marriage increases the probability ofhaving employer-provided coverage (76.0% versus55.5%, t =41.8, p < .001) more than it increases theprobability of working, since married individuals canobtain coverage from a spouse's employer if they are notemployed or if they do not receive insurance from theirown employer.
Of men who have insurance provided by an employer,there is no difference in the percentage who have it intheir own name whether married or not. But marriedmen have a higher rate of private insurance coveragethan unmarried men. Married men have a higher laborforce participation rate than unmarried men (89.0%versus 76.9%, t=20.7, p<.001), and this accounts for someof the higher rate of private coverage. Married men maybe more inclined to seek jobs that provide privateinsurance, thereby increasing the likelihood vis-a-viswomen of having coverage in their own name. If so,women may also be more free to accept jobs that don'tprovide health insurance. Women who are unable towork at a job or business, may not have worked enoughyears to qualify for SSDI. For such women, if they aremarried, spousal coverage may be their only option.
Of people covered by an employer-providedinsurance plan, the fraction who have coverage in theirown name is 60.5% for married people compared to71,7% for unmarried people (1=17.2, p<.001). Marriedwomen are less likely to have employer-providedinsurance in their own name than unmarried women(Table G). In fact, among married women unable to work

24 Disability and health insurance
Needs assistance inbasic life activities
Men
Does not need assistance in basiclife activities
Needs assistance inbasic life activities
Women
Does not need assistance in basiclife activities
Self-care Routine Unable to Limited in Other No(AIX) care work amt/ limitation limitation
(LAU) kind ofwork
FdIWlLerx
Self-care Routine Unable to Limited in Other No(ADu care work amt/ limitation limitation
(IADL) kind ofwork
Private only 0 Public & Private Public only 0 Uninsured Undefined
Figure 3. Percent distribution of type of health insurance coverage among men and women aged 18 to 64, by disabilitystatus: United States, 1989
at a job or business, of the 55.9% who have employer-provided private coverage, only 23.6% have it in theirown name.
Thus, marriage is associated with higher rates ofemployer-provided coverage for men and women.However, for women, and especially women with moresevere disabilities, their coverage most often is providedthrough a spouse. Married men are about as likely asunmarried men to have coverage in their own name,regardless of disability level. Unmarried women areespecially more likely to have public insurance thanmarried women, especially women who are unable towork (62.3% versus 27.2%, t =12.6, p<.001). Spousalcoverage enables married women to make up for theirlower rate of public coverage.
Married men are somewhat less likely than unmarriedmen to have public coverage (Table H). For men, maritalstatus generally does not confer greater eligibility for
public insurance. The net result of all of this is thatunmarried men are twice as likely as married men to beuninsured. Unmarried men have a lower rate of publiccoverage than unmarried women, especially those withminor or no disabilities.

Disability and health insurance 25
TABLE G. Percent of People Aged 18 to 64 with Employer-Provided Insurance And Percent With Such Coverage inTheir Own Name, by Gender, Work Disability, and Marital Status: United States, 1989
Unmarried Married(A)
PercentWith
InsurancePlan
Provided byEmployer SE
(B)Percentof (A)With
Plan inOwnName SE
(C)PercentWith
InsurancePlan
Provided byEmployer SE
(D)Percentof (C)With
Plan inOwnName SE
(%) (%) (%) (%) (%) (%) (%) (%)MenUnable to work 19.7 2.0 66.0 5.4 48.2# 1.9 64.7 2.7Limited in amount/kind work 45.4 2.9 81.3 3.4 72.5# 1.8 79.7 1.9Limited in other activities 56.0 3.7 79.3 4.0 80.4# 1.9 80.7 2.1Not limited in activity 57.9 0.7 69.8 0.8 78.3# 0.4 82.6# 0.4Total 55.1 0.6 70.2 0.8 76.6# 0.4 82.0# 0.4
WomenUnable to work 20.6 1.8 60.2 4.7 55.9# 2.0 23.6# 2.3Limited in amount/kind work 50.1 2.6 77.2 3.0 73.4# 1.9 34.9# 2.3Limited in other activities 51.6 2.8 79.5 3.2 68.9# 2.2 32.8# 2.7Not limited in activity 59.4 0.6 72.9 0.7 76.6# 0.4 40.3# 0.5Total 55.8 0.6 73.1 0.7 75.3# 0.4 39.4# 0.5
Source: 1989 National Health Interview Survey (author's tabulations from public use tapes)# Significantly different from unmarried people, p<.001 (two-tailed t-test)
100
80
60
40
20
Married
I I I I
Unable to Limited in Other Nowork amt/kind limitation limitation
of work
Unmarried
Unable to Limited in Other Nowork amt/kind limitation limitation
of work
Private 0 Public El Uninsured
Figure 4. Percent distribution of type of health insurance coverage among adults aged 18 to 64 by work disabilitystatus, by gender: United States, 1989.

26 Disability and health insurance
Table H. Percent of People Aged 18 to 64 with Public Insurance And Percent Uninsured, by Gender, WorkDisability, and Marital Status: United States, 1989
Unmarried MarriedPercent
With PublicInsurance SE
PercentUnin-sured SE
PercentWith PublicInsurance SE
PercentUnin-sured SE
(%) (%) (%) (%) (%) (%) (%) (%)MenUnable to work 59.5 2.5 21.2 2.1 47.3# 1.9 14.9§ 1.4Limited in amount/kind work 19.3 2.3 31.6 2.7 12.3§ 1.3 16.4# 1.5Limited in other activities 9.2 2.1 27.7 3.3 8.7 1.4 10.4# 1.5Not limited in activity 3.2 0.2 29.4 0.6 3.4 0.2 12.8# 0.3Total 7.5 0.3 29.0 0.6 6.1# 0.2 13.0# 0.3
WomenUnable to work 62.3 2.1 17.4 1.7 27.2# 1.8 17.3 1.5Limited in amount/kind work 19.0 2.0 23.9 2.2 7.6# 1.1 14.7# 1.5Limited in other activities 25.1 2.4 17.9 2.2 8.3# 1.3 14.6 1.7Not limited in activity 21.0 0.5 14.8 0.5 5.0# 0.2 11.8# 0.3Total 16.1 0.4 20.7 0.5 6.2# 0.2 12.3# 0.3
Source: 1989 National Health Interview Survey (author's tabulations from public use tapes)§ Significantly different from unmarried people, p.01 (two-tailed t-test).# Significantly different from unmarried people, p<.001 (two-tailed t-test).
100 -
90 -
80 -
70 -
60 -
50 -
40 -
30 -
20 -
10 -
0
Poor Fair Good Very good
4
Excellent
Private only 0 Public & Private ES Public only 12IUninsured 1111 Undefined
Figure 5. Percent distribution of type of health insurance coverage among adults aged 18 to 64 by respondent-assessed health status: United States, 1989.

Disability and health insurance 27
Poor healthAlthough disability and poor health are correlated,
they are not synonymous. For example, among peopleunable to work, 63.0% rate their health as fair or poor,23.5% good, and 13.0% very good to excellent. Somepeople with severely disabling physical impairmentsgenerally rate their health as excellent or very good,including people with developmental disabilities, certainimpairments associated with injury (Ries & Brown, 1991),or people with stabilized chronic illness conditions (suchas cancer in remission). Others with active chronicillness, such as severe circulatory disease, often rate theirhealth as poor.
Private insurance coverage declines continuously ashealth is worse (Figure 5). Unlike inability to work, thereis no significant threshold at which private insurancecoverage drops off. Private insurance coverage declinesand public insurance increases with worse health butpublic insurance expands faster than private insurancedeclines, and the overlap of public insurance with privateinsurance increases. Medicare and Medicaid coveragerates are highest among people in fair to poor health(Table D).
Of people unable to work, those who are in excellenthealth have a significantly lower rate of public coveragethan those in poor health (27.8% versus 59.2%, t=6.84,p<.001), but are not significantly more likely to beuninsured (21.3% versus 16.8%). There is a tendency forthe rate of uninsurance to increase with poorer healthamong people who are limited in activities other thanwork or who are not limited in activity. Among thelatter, those in poor health are significantly more likelythan those in excellent health to be uninsured (36.1%versus 14.4%, t=5.27, p<.001), though they are a smallgroup (about 453,000). Men with minor or no activitylimitation who are in poor health may find it difficult tosecure private insurance due to their health condition butalso cannot qualify for public insurance programs.Among people with minor or no limitations, as health isworse, Medicaid coverage increases for women, but notfor men.
Gender and disabilityOf people who need assistance in self care, men are as
likely as women to have private insurance and as likelyas women to be uninsured. However, men who needassistance in self care are more likely than women to becovered by Medicare (47.7% versus 25.4%, t=4.14, p<.001).Around 22.4% of men who need assistance in self carehave Medicare and private insurance, higher than thosewho have private insurance alone (18.3%). About 13.0%of women who need assistance in self care have bothMedicare and private insurance. Regardless of gender,around half of people on Medicare have privateinsurance. About 60% of men with military coveragehave private insurance as do 40% of women. The rate ofMedicaid coverage is not different by gender.
Of people who need assistance in routine activities,men are more likely than women to have publicinsurance alone (44.0% versus 32.8%, t=3.25, p<.01) or incombination with private insurance (17.5% versus 11.7%,t=2.38, p<.05). Women needing assistance in routineactivities are more likely than men to have privateinsurance alone (41.3% versus 25.6%, t=4.71, p<.001) butare as likely as men to be uninsured. Of people whoneed assistance in routine activities, men are more likelythan women to have military coverage (9.7% vs. 2.0%,t=4.51, p<.001) and are twice as likely as women to haveMedicare (37.1% versus 18.9%, t=6.13, p<.001). The rateof Medicaid coverage does not differ by gender.
Men who are unable to work are more likely to haveMedicare coverage than women (30.3% versus 17.9%,t=7.62, p<.001) and are more likely to have militarycoverage (9.9% vs. 2.7%, t=7.2, p<.001). Women unable towork are more likely than men to have Medicaidcoverage (30.3% versus 23.1%, t=4.42, p<.001). Thisreflects women's historically lower labor forceparticipation than men. Since SSDI is based on years ofwork experience, women's eligibility for SSDI is less thanmen's. So disabled women depend more on Medicaidthan Medicare, but at the cost that they must be poor inorder to receive it.
Of people who are limited in activities other thanwork, women have a much higher rate of Medicaidcoverage than men (10.5% versus 3.3%, t=7.69). But ofpeople with no limitations, women are much more likelythan men to have Medicaid coverage (4.6% versus 1.0%,t=16.1, p<.001).
Regression analysisTo determine the extent to which the above
observations may be sensitive to the interrelationshipsamong variables, logistic regression models are estimatedexamining the relationship of disability (defined on a six-category scale exactly as in Table E) with privateinsurance coverage, public insurance coverage, anduninsurance (defined as Y=1 if the individual has thatparticular form of coverage, else Y=0). The logistic modeldescribes how disability and other variables affect thelikelihood (more exactly the likelihood of the log of theodds ratio) of having one of these forms of insurance.Control variables include age, gender, race, Hispanicorigin, education, marital status, health status, familyincome to poverty ratio, and employment.
Among adults, private insurance is associated withage, being female, being white, being non-Hispanic,education, marriage, good health, affluence, work, andabsence of disability. Public insurance is correlated withbeing black or races other than white, low education,being unmarried, poor health, poverty, not working, anddisability. Age and Hispanic origin have no impact onpublic insurance. Being uninsured is associated withbeing male, being black or races other than white, beingHispanic, low education, being unmarried, good to poor

28 Disability and health insurance
TABLE I. Logistic Regression Models of the Likelihood of Private, Public, and No Insurance Coverage Among Adults Aged 18 to 64:United States, 1989
Private Insurance Public Insurance No
Beta
InsuranceBeta X2 x2 Beta X2 x2 1 X2 x21
InterceptDisability
Needs help in
0.533 14.41 -3.576 321.35 -0.517 13.54
Self care (ADL) -0.549 16.43 # 17.15 # 2.254 303.40 4* 254.72 4* -1.019 32.75 4* 22.65 4*
Routine activities (IADL) -0.437 26.62 # 19.98 # 1.674 403.27 4* 399.87 4* -0.832 6174 tt 53.57 14
Does not need help in basic life activities and isUnable to work -0.513 80.38 4* 63.52 14 1.215 419.53 14 361.16 4 -0.385 35.74 # 27.53 14
Limited in amount/kind of work -0.193 13.92 4* 11.83 4* 0.584 75.68 4* 54.25 44 0.116 4.68 t 4.06
Limited in other activities -0.096 2.36 2.05 0.417 26.83 4* 26.21 14 -0.023 0.12 0.10
(Not limited in activity)Age
Age in years -0.006 0.99 0.47 -0.001 0.02 0.01 -0.016 6.74 § 3.63
Age in years squared 3.85E-04 26.30 # 12.35 4* 1.30E-04 1.62 1.00 -8.04E-05 1.04 0.55
GenderMen (Women) -0.282 152.89 4* 115.40 4* -0.019 0.29 0.20 0.363 239.15 4* 212.32 4*
Race
Black (White) -0.343 120.68 4* 65.65 14 0.477 120.00 14 73.22 44 0.090 7.63 § 4.87
Other (White) -0.556 103.61 # 22.79 it 0.381 23.27 14 7.25 § 0.401 52.14 4* 14.09 14
Hispanic EthnicityHispanic (Non-Hispanic) -0.613 304.26 14 142.69 14 0.054 0.96 0.35 0.581 281.94 14 114.03 4*
EducationYears of education 0.024 2.90 1.90 0.000 0.00 0.00 0.018 1.75 0.99
Years of education squared 0.006 73.02 tt 48.09 4* -0.002 6.01 4.25 -0.007 113.60 # 73.63 4*
Marital StatusMarried 0.573 348.41 14 166.39 # -0.315 42.33 # 16.40 14 -0.483 240.57 it 124.21 4*
Previously married -0.389 93.96 # 66.20 # 0.306 28.10 # 20.14 44 0.158 14.77 4* 9.70 §
(Never married)Health Status
Very good (Excellent) 0.031 1.24 0.56 0.140 9.06 § 6.59 -0.054 3.62 1.78
Good (Excellent) -0.262 80.13 # 50.59 # 0.258 30.35 4* 20.03 44 0.205 46.73 14 30.47 4*
Fair (Excellent) -0.351 58.37 # 37.56 # 0.404 43.50 14 32.59 41 0.171 12.59 14 8.10 §
I'oor (Excellent) -0.653 76.05 4* 54.52 4* 0.662 66.93 44 70.16 41 0.197 5.77 4.29 tUnknown (Excellent) -3.488 8.22 § 4.80 -0.029 0.01 0.01 0.448 6.82 § 2.76
Family Incometo Poverty Ratio
1.75 to under 2.00 (Above 2.00) -0.427 160.31 4* 91.86 it -0.001 0.00 0.00 0.444 154.78 4* 88.73 #
1.50 to under 1.75 (Above 2.00) -0.753 399.79 4* 195.75 4* 0.355 30.86 4* 18.11 # 0.758 367.36 # 191.99 4*
1.25 to under 1.50 (Above 2.00) -1.215 816.71 4* 410.45 4* 0.432 39.89 4* 39.20 4* 1.166 697.08 it 301.89 #
1.00 to under 1.25 (Above 2.00) -1.506 1125.24 4* 426.39 4* 0.661 94.62 4* 62.53 44 1.398 942.68 # 435.21 #
0.50 to under 1.00 (Above 2.00) -1.885 2241.92 4* 950.52 4* 1.269 600.35 4* 340.41 tt 1.259 1000.72 4* 389.46 4*
Less than 0.50 (Above 2.00) -1.798 1147.32 # 234.25 # 1.519 599.24 # 271.98 44 0.996 374.02 # 121.01 4*
Employment StatusUnemployed -!.176 48,00 4* 403.72 4* 0.929 160.70 4* 108.10 44 0.850 270.41 4* 195.04 4*
Not in labor force -0.621 481.97 # 380.67 4* 1.384 1282.77 14 849.50 14 -0 044 2.04 1.54
(Employed)
Sample size 68,211 68,211 68,211
Goodness of fit X2 (Hosmer) 37.24 86.70 153.84
Significance level with 8 degrees of freedom p<0.001 p<0.001 p<0.001
1. e corrected for complex sample design (using RTILOGIT).t p<0.05.
§ p<0.01.
# p<0.001.

Disability and health insurance 29
health, poverty, and being unemployed. Note that beingout of the labor force has a strong negative impact onprivate insurance and a strong positive impact on publicinsurance. Public insurance, all things being equal, doescompensate for the diminished access of people who areout of the labor force to private insurance, and being outof the labor force has no impact on being uninsured.Hispanic origin, however, has a strong negative impacton private insurance, no impact on public insurance, andthus, a strong positive impact on being uninsured. Publicinsurance, all things being equal, does not compensatefor the diminished access of Hispanic people to privateinsurance.
Greater severity of disability lowers the likelihood ofprivate insurance coverage, increases the likelihood ofpublic insurance, and decreases the likelihood ofuninsurance (Table I). In all three models, disability hasan impact independent of labor force status. Thelikelihood of having private insurance is much lower forpeople unable to work than people without limitation,but the likelihood does not decrease further with moresevere limitations in IADL and ADL. However, thelikelihood of public insurance rises continuously withgreater severity of disability. Thus, logistic regressionconfirms the interpretation that with greater severity ofdisability, public insurance expands more than privateinsurance contracts. As we have seen, this pattern alsoresults in people with ADL and IADL limitations beingmore likely to have overlapping private and publiccoverage.
1.2 ChildrenHealth insurance coverage rates for children are
shown in Tables 3 and J. Children are somewhat lesslikely than adults to have private insurance (71.2% versus77.2%, t=6.71, p<.001), and are much more likely thanadults to be covered by public insurance, predominantlyby Medicaid (11.8% versus 4.4%, t=13.7, p<.001).1° Nosignificant difference in the percent uninsured isobserved between children and adults.
Children aged 5-17 are more likely than those aged 0to 4 to have private insurance (73.1% versus 66.7%, t=5.0,p<.001), in part be due to the fact that older children haveolder parents who are more likely to have privateinsurance. Young children are more likely to haveMedicaid (14.9% versus 10.5%, t=4.2, p<.001), as expectedsince Medicaid is targeted toward young children.
Black children are more likely to be uninsured thanwhite children (19.5% versus 14.9%, t=3.77, p<.001), as are
10 Children are eligible for Medicare only if they have end-stage renal disease (children of parents on Medicare are notcovered). Yet, 0.2% of children-141,000 totalare estimated tobe covered by Medicare. Since only 58,000 people under age 65were enrolled in 1989 under the ESIZD program (Social SecurityAdministration, 1991), the estimate cannot reflect the truenumber of children covered under Medicare. Adults areobviously confused about their children's health insurancecoverage, perhaps mistaking Medicare for Medicaid.
children of other races (20.2% versus 14.9%, t=2.39,p<.05). Hispanic children have a low rate of privateinsurance (46.6%) and are two and a half times morelikely than non-Hispanic children to be uninsured (34.1%versus 13.2%, t=7.66, p<.001).
The percent of children uninsured increases withgreater poverty. Of children in families with incomesunder 125% of the federal poverty level, about a third areuninsured. Medicaid covers 60.7% of children in familieswith incomes under half the poverty threshold, yet 28.4%are uninsured. Extremely poor children are much lesslikely than extremely poor adults to have privateinsurance (13.0% versus 29.5%, t=5.40, p<.001), and thusface even greater obstacles in obtaining access to privateinsurance coverage.
No differences are observed in patterns of coveragefor boys and girls.
Disability and poor healthDisability is less common among children than adults.
About 5.4% of children are limited in activity comparedto 13.1% of adults aged 18 to 64. Children with activitylimitation are as likely as children without limitation tobe uninsured (about 15.8%, Table C), but are less likely tohave private insurance alone and are more likely to havepublic insurance alone or both public and privateinsurance. Nondisabled children are 4 times as likely asnondisabled adults to be covered by Medicaid (11.1%versus 2.8%, t =16.3, p<.001) which reflects the moreexpansive targeting of Medicaid to poor child-en than topoor adults. Children with activity limitation are 64%more likely than adults with activity limitation to becovered by Medicaid (24.2% versus 14.8%, t=5.61,p<.001).
Among children aged 5 to 17 who need assistance inself care because of a health problem or impairment,49.9% are covered by Medicaid and 9.7% are uninsured(Table K). However, the rate of uninsurance is notsignificantly different from children who do not needassistance in self care (or are under age 5). About 31.5%of children who are unable to perform their majoractivity are covered by Medicaid, decreasing to 25.9% ofchildren limited in amount or kind of major activity, andto 17.8% of those limited in other activities. Thus,Medicaid coverage is correlated with severity ofchildren's disability.
The rate of uninsurance among children limited inmajor activity is not significantly different from childrenwithout limitation. However, children limited inactivities other than major are somewhat less likely thanchildren without limitation to be uninsured (11.4% versus15.8%, t=2.57, p<.05). In this group, children have a highrate of private insurance coverage, and they benefit frompublic coverage as well. Unlike adults, among children,

30 Disability and health insuranceTABLE J. Type of Health Insurance Coverage Among Children Aged 0 to 17, by Sociodemographic Characteristics, by Gender:United States, 1989
Popula tion(1,000s)
SampleSize
With Insurance
NotInsured
Medi-care
Medi-caid
Priva teOnly
PublicOnly
Privateand
Public
UndefinedPlansOnly
Total 64,005 31,524 69.6 12.4 1.7 0.6 15.8 02 11.8
Age04 years 18,769 9,146 65.2 15.9 1.5 0.7 16.7 0.2 1495-17 years 45,236 22,378 71.3 11.0 1.7 0.5 15.4 02 10.5
RaceWhite 51,612 24,701 74.3 8.9 1.4 0.5 14.9 0.1 8.2Black 9,959 5,680 482 28.6 2.9 0.8 19.5 0.5 29.0Other 2,434 1,143 55.9 20.2 2.0 1.7 20.2 0.9 18.9
EthnicityHispanic 7,948 3,744 45.2 18.6 1.4 0.7 34.1 0.4 18.1Non-Hispanic 56,057 27,780 73.0 11.5 1.7 0.4 13.2 0.2 10.9
Family IncomeUnder $5,000 2,859 1,515 112 59.6 3.4 0.9 24.8 1.0 62.5$5,000-$6,999 2,116 1,079 10.7 51.5 5.7 0.9 * 313 0.4 554$7,000-$9,999 3,273 1,741 17.4 46.7 3.7 0.8 31.4 0.3 48.9$10,000-$14,999 6,162 3,112 37.0 21.7 1.8 1.0 38.4 0.2 213$15,000-$19,999 6,917 3,439 58.1 11.7 2.0 1.0 27.2 0.2 10.7$20,000-$24,999 5,131 2,542 73.2 8.6 1.2 0.8 * 16.2 0.2 5.9$25,000-$34,999 12,896 6,259 83.4 4.2 0.8 0.5 11.1 0.1 2.6$35,000449,999 13,394 6,496 89.5 2.8 1.4 0.3 6.1 0.1 1.7$50,000 or more 11,256 5,341 943 1.2 0.9 0.1 3.5 0.2 * 0.7
Poverty LevelUnder 0.50 4,433 2,321 9.3 57.7 3.6 0.9 * 28.4 0.9 60.70.50 to under 1.00 7,434 3,887 22.9 36.6 3.1 0.9 36.5 0.1 * 38.11.00 to under 125 4,476 2,307 50.4 16.3 2.0 0.6 30.7 0.4 15.31.25 to under 1.50 4,757 2369 62.2 9.7 1.6 1.1 25.5 02 8.71.50 to under 1.75 8,594 4,204 77.8 7.0 1.3 03 13.6 0.4 5.11.75 to under 2.00 11,737 5,692 85.4 3.3 1.2 0.5 9.7 0.2 " 2.02.00 and above 22,574 10,744 90.7 2.2 1.1 0.4 5.6 0.0 1.1
Age and Poverty Level04 years and
Under 0.50 1,553 812 7.3 64.4 1.9 1.5 24.8 0.4 65.30.50 to undu- 1.00 2,348 1,213 19.6 41.2 2.5 1.4 35.3 0.1 42.41.00 to under 1.25 1,348 675 42.7 22.0 2.9 * 1.2 31.2 0.4 * 20.21.25 to under 1.50 1,309 648 55.7 14.3 2.3 0.6 27.1 0.3 * 12.81.50 to under 1.75 2,205 1,061 74.8 7.7 1.4 0.4 15.8 0.6 * 5.61.75 to under 2.00 3,157 1,529 80.6 5.4 1.3 0.5 12.2 0.2 3.62.00 and above 6,849 3,208 90.1 2.9 0.7 03 6.0 0.0 1.6
5-17 years andUnder 0.50 2,880 1,509 10.4 542 4.6 0.6 30.3 1.2 58.20.50 to under 1.00 5,087 2,674 24.5 34.4 3.3 0.6 * 37.1 0.1 36.11.00 to under 1.25 3,128 1,632 53.6 13.8 1.6 0.4 30.5 0.3 13.21.25 to under 1.50 3,448 1,721 64.7 8.0 13 1.2 24.8 0.2 7.21.50 to under 1.75 6,388 3,143 78.9 6.8 1.2 0.3 12.8 0.3 5.01.75 to under 2.00 8,580 4,163 87.2 2.5 1.1 0.5 8.7 0.2 1.52.00 and above 15,725 7,536 90.9 1.9 1.4 0.4 5.4 0.0 1.0

Disability and health insurance
TABLE J. Type of Health Insurance Coverage Amon& Children Aged 0 to 17, by Sociodemographic Characteristics,by Gender:United States, 1989
31
With Insurance
Popula tion(1,000s)
Sam pieSize
Priva teOnly
PublicOnly
Privateand
Public
UndefinedPlansOnly
NotInsured
Medi-care
Medi-caid
All Boys 32,753 16,040 69.6 12.1 1.8 0.6 15.9 0.2 11.6
Age0-4 years 9,607 4,607 65.6 15.4 1.7 0.7 16.7 0.2 14.55-17 years 23,146 11,433 71.3 10.8 1.9 0.5 15.6 0.2 10.4
RaceWhite 26,471 12,626 74.6 8.6 1.5 0.5 14.8 0.1 7.9Black 5,052 2,838 47.1 28.4 3.6 0.7 20.2 0.5 29.5Other 1,230 576 53.2 21.3 1.9 * 2.4 21.2 0.8 18.7
EthnicityHispanic 3,958 1.874 45.5 18.1 1.5 0.8 34.4 0.4 * 17.6Non-Hispanic 28,795 14,166 72.9 11.3 1.9 0.4 13.3 0.2 10.8
Family IncomeUnder $5,000 1,465 762 10.4 60.1 3.7 1.0 24.8 1.2 63.6$5,00046,999 948 495 8.8 52.0 5.9 1.6 * 31.7 0.4 * 55.7$7,00049,999 1,668 879 16.1 45.3 4.2 0.9 33.5 0.1 48.2510,000-514,999 3,126 1,557 37.9 21.2 2.0 0.7 38.2 0.2 20.7515,000419,999 3,648 1,807 57.6 11.9 2.1 1.0 27.4 0.4 * 11.2520,000-524,999 2,527 1,256 74.1 8.3 1.3 0.9 " 15.3 0.1 * 5.7$25,000-$34,999 6,710 3,239 82.5 4.4 1.0 0.6 11.6 0.1 2.7535,000-549,999 6,845 3,307 89.3 2.5 1.8 0.2 * 6.1 0.1 * 1.6$50,000 or more 5,816 2,738 94.2 1.1 1.1 0.1 3.5 0.1 0.8
Poverty LevelUnder 0.50 2,191 1,136 9.1 57.4 3.5 1.3 28.7 1.0 * 60.60.50 to under 1.00 3,722 1,945 22.9 36.4 3.4 0.7 36.6 0.1 38.11.00 to under 1.25 2218 1,134 49.4 16.3 1.7 * 0.7 * 31.9 0.4 15.41.25 to under 1.50 2,544 1,264 62.8 10.1 1.7 0.7 24.7 0.2 9.51.50 to under 1.75 4,365 2,124 76.6 7.5 1.5 0.2 * 14.2 0.4 5.51.75 to under 2.00 6,098 2,941 85.1 3.1 1.4 0.7 * 9.8 0.1 1.92.00 and above 11,615 5,496 90.5 1.9 1.5 0.4 5.7 0.1 * 1.0
Age and Poverty Level0-4 years and
Under 0.50 796 417 7.6 62.2 1.8 * 2.0 26.3 0.8 63.60.50 to under 1.00 1,176 508 21.1 40.3 3.0 1.3 34.4 0.1 * 42.41.00 to under 1.25 647 320 44.0 20.7 2.1 1.4 31.8 0.6 * 16.01.25 to under 1.50 735 354 57.4 14.2 2.4 0.0 t 26.3 0.3 12.71.50 to under 1.75 1,115 526 73.8 9.0 1.4 0.2 15.6 0.4 * 6.71.75 to under 2.00 1,654 781 80.1 4.9 1.8 0.7 12.4 0.2 3.52.00 and above 3,484 1,601 90.0 2.4 1.0 0.4 * 6.1 0.0 t 1.4
5-17 years andUnder 0.50 1,395 719 9.9 54.6 4.5 0.9 " 30.1 1.1 * 58.80.50 to under 1.00 2,546 1,337 23.7 34.5 3.5 0.5 37.7 0.1 36.01.00 to under 1.25 1,571 814 51.6 14.5 1.6 * 0.4 32.0 0.2 14.31.25 to under 1.50 1,809 910 65.0 8.4 1.5 1.0 24.2 0.2 * 8.21.50 to under 1.75 3,250 1,598 77.6 7.0 1.5 0.2 13.7 0.4 5.11.75 to under 2.00 4,444 2,160 86.9 2.4 1.2 0.6 * 8.9 0.0 1.22.00 and above 8,131 3,695 90.7 1.7 1.7 0.4 5.4 0.1 0.9

32 Disability and health insurance
TABLE J. Type of Health Insurance Coverage Among Children Aged 0 to 17, by Sociodemographic Characteristics, by Gender:United States, 1989
With Insurance
Popula tion(1,000s)
SampleSize
PrivateOnly
PublicOnly
Privateand
Public
UndefinedPlansOnly
NotInsured
Medi-care
Medi-caid
All Girls 31,252 15,484 69.5 12.8 1.4 0.5 15.7 0.2 12.0
Age0-4 years 9,162 4,539 64.9 16.5 1.2 0.6 16.7 0.2 * 15.35-17 years 22,090 10,945 71.5 11.2 1.5 0.5 15.3 0.2 10.7
RaceWhite 25,141 12,075 74.0 9.3 1.3 0.5 15.0 0.1 8.5Black 4,907 2,842 49.3 28.9 2.2 0.8 18.7 0.5 28.4Other 1,204 567 58.7 19.0 2.1 0.9 19.3 1.0 19.2
EthnicityHispanic 3,990 1,870 45.0 19.1 1.3 0.6 33.8 0.4 18.6Non-Hispanic 27,262 13,o14 73.1 11.8 1.5 0.3 13.1 0.2 11.1
Family IncomeUnder $5,000 1,394 753 12.1 59.1 3.2 0.8 24.8 0.7 * 61.4$5,000-$6,999 1,168 584 12.2 51.0 5.5 03 30.9 0.3 * 55.2$7,000-$9,999 1,606 862 18.7 48.0 3.3 0.7 29.2 0.5 497$10,000-$14,999 3,036 1,555 36.1 22.3 1.7 1.2 38.6 0.1 21.9$15,000-519,999 3,269 1,632 58.7 11.5 1.9 1.0 27.0 0.1 102$20,000-$24,999 2,604 1,286 72.2 8.8 1.2 * 0.7 * 17.1 0.3 6.2$25,000434,999 6,187 3,020 84.3 4.0 0.6 0.4 10.7 0.2 2.5535,000-$49,999 6,549 3,189 89.6 3.0 1.1 0.3 * 6.0 0.1 1.8$50,000 or more 5,440 2603 94.5 1.3 0.7 * 0.1 * 3.4 0.3 '' 0.5 *
Poverty LevelUnder 0.50 2,243 1,185 9.6 58.1 3.8 0.5 28.0 0.9 60.90.50 to under 1.00 3,712 I 942 23.0 36.8 2.8 1.0 36.4 0.1 38.11.00 to under 1.25 2,258 1,173 51.3 16.2 2.3 0.6 * 29.6 0.4 15.21.25 to under 1.50 2,212 1,105 61.6 9.3 1.3 * 1.5 26.3 0.2 7.91.50 to under 1.75 4,229 2,080 79.1 6.5 1.1 0.4 * 13.0 0.4 4.81.75 to under 2.00 5,639 2,751 85.8 3.5 1.0 0.3 9.5 0.3 2.32.00 and above 10,959 5,248 90.9 2.4 0.8 0.4 5.5 0.0 1.2
Age and Poverty Level0-4 years and
Under 0.50 757 395 7.0 66.7 2.1 1.1 23.2 0.0 t 67.10.50 to under 1.00 1,171 605 18.2 42.2 2.0 1.5 36.2 0.1 * 42.51.00 to under 1.25 701 355 41.4 23.1 3.7 1.0 * 30.7 0.3 22.21.25 to under 1.50 574 294 53.5 14.3 2.1 1.4 28.6 0.3 13.01.50 to under 1.75 1,090 535 75.8 6.3 1.4 0.::: 16.0 0.8 451.75 to under 2.00 1,503 , 748 81.1 6.0 0.6 0.2 12.1 0.2 3.82.00 and above 3,365 1,607 90.3 3.4 0.3 0.2 * 5.8 0.1 " 1.8
5-17 years ezUnder 0.50 1,485 790 11.0 53.8 4.6 * 0.2 30.4 13 57.70.50 to under 1.00 2,541 1,337 25.2 34.3 3.2 0.8 36.5 0.1 * 36.11.00i. under 1.25 1,557 818 55.7 13.1 1.7 0.4 29.0 0.4 * 12.01.25 to under 1.50 1,638 811 64.4 7.5 1.1 1.5 * 25.5 0.1 * 6.11.50 to under, 1.75 3,139 1,545 80.2 6.6 0.9 0.4 11.9 0.3 * 4.91.75 to under 2.002.00 and above
4t 4,136
7,5952,0033,641
87.491.2
2.72.0
1.11.0
0.30.4
8.55.4
J.30.0 t
1.71.0
t
Source: National Health Interview Survey (author's tabulations from public use tapes).Note: Standard errors for estimates appear in Appendix TABLE A-3.
Estimate has low statistical reliability (relative standard error > 30%).t Estimate is exactly 0 or standard error is indeterminate. I

Disability and health insurance 33
TABLE K. Type of Health Insurance Coverage Among Children Aged 0 to 17, by Disability and Health Status, by Gender:United States, 1989
Popubtion Sample(1,000s) Size
With Insurance
NotInsured
Medi-care
Medi-caid
Priva teOnly
PublicOnly
Private Undefineda nd Plans
Public Only
Total 64,005 31,524 69.6 12.4 1.7 0.6 15.8 0.2 11.8
Age0-4 years 18,769 9,146 65.2 15.9 1.5 0.7 16.7 0.2 14.95-17 years 45,236 22,378 71.3 11.0 1.7 0.5 15.4 0.2 10.5
Health StatusExcellent 33,747 16,494 75.9 8.8 1.4 0.5 13.5 0.2 7.8Very good 17,052 8,406 69.4 12.4 1.5 0.6 16.0 0.3 * 11.9Good 10,902 5,495 54.0 20.9 2.5 0.8 21.9 0.3 * 21.0Fair 1,472 727 47.7 29.7 2.5 0.7 19.5 0.6 30.5Poor 190 92 32.2 35.5 1.0 * 0.0 t 31.3 0.0 t 36.6Unknown 643 310 67.0 13.8 1.2 ' 0.2 17.8 0.3 13.2
Major ActivityUnable to perform major activity 346 171 49.5 28.3 4.4 0.7 17.1 0.6 * 31.5Limited in amount/kind of major activity 2,097 1,032 54.3 23.8 4.0 0.2 * 17.8 0.8 25.9Limited in other activity 994 497 68.1 17.5 2.4 * 0.6 * 11.4 O.' 17.8Not limited in activity 60,567 29,824 70.2 11.9 1.5 0.6 15.8 0.2 11.1
Basic Life ActivitiesNeeds help in self care (ADL)-ages 5-17 194 89 38.3 43.7 8 3 * 0.0 t 9.7 1.5 ' 49.9Not limited in basic life activities 63,811 31,435 69.7 12.3 1.6 0.6 15.8 0.2 11.7
All Boys 32,753 16,040 69.6 12.1 1.8 0.6 15.9 0.2 11.6
Age0-4 years 9,607 4,607 65.6 15.4 1.7 0.7 16.7 0.2 * 14.55-17 years 23,146 11,433 71.3 10.8 1.9 0.5 15.6 0.2 10.4
Health StatusExcellent 17,509 8,528 75.8 8.7 1.6 0.5 13.4 0.1 * 7.7Very good 8,576 4,204 69.1 12.2 1.8 0.6 16.3 0.3 * 11.7Good 5,524 2,759 55.1 19.6 2.8 0.6 21.9 0.2 * 20.3Fair 740 362 42.6 32.0 3.1 * 1.2 21.2 0.2 33.3Poor 91 44 28.2 35.3 2.2 0.0 t 34.3 0.0 t 37.5Unknown 313 143 64.5 15.2 0.0 t 0.0 t 20.2 0.0 t 13.3
Major ActivityUnable to perform major activity 201 101 47.9 28.3 3.9 * 1.2 * 18.7 0.0 t 31.1Limited in amount/kind of major activity 1,319 641 55.4 21.9 4.5 0.1 * 18.0 0.8 ' 24.4Limited in other activity 580 289 65.8 18.5 3.0 * 0.6 * 12.1 0.3 * 19.3Not limited in activity 30,653 15,009 70.4 11.5 1.7 0.6 15.8 0.2 10.8
Basic Life ActivitiesNeeds help in self care (ADL)-ages 5-17 130 56 28.4 49.9 10.2 ' 0.0 t 11 6 ' 0.0 t 57.0Not limited in basic life activities 32,623 15,984 69.7 12.0 1.8 0.6 15.9 0.2 11.4

34 Disability and health insurance
TABLE K. Type of Health Insurance Coverage Among Children Aged 0 to 17, by Disability and Health Str.tus, by Gender:United States, 1989
Popula tion(1,000s)
SampleSize
With Insurance
UndefinedPlansOnly
%
NotInsured
%
Medi-care
%
Medi-caid
%
Priva teOnly
%
l'ublicOnly
%
I'rivateand
Public%
All Girls 31,252 15,484 69.5 12.8 1.4 0.5 15.7 0.2 12.0
Age0-4 years 9,162 4,539 64.9 16.5 1.2 0.6 16.7 0.2 15.35-17 years 22,090 10,945 71.5 11.2 1.5 0.5 15.3 0.2 10.7
Health StatusExcellent 16,238 7,966 75.9 8.9 1.2 0.4 13.6 0.2 7.9Very good 8,475 4,202 69.8 12.7 1.3 0.5 15.7 0.3 ' 12.1Good 5,377 2,736 52.9 22.2 2.2 0.9 21.8 0.3 21.8Fair 732 365 52.8 27.4 1.9 0.2 ' 17.8 0.9 27.6Poor 99 48 35.8 35.7 0.0 t 0.0 t 28.5 0.0 t 35.7Unknown 330 167 69.3 12.5 2.4 0.4 * 15.5 0.6 13.1
Major ActivityUnable to perform major activity 146 70 51.7 28.3 5.2 0.0 t 14.8 1.3 32.1Limited in amount/kind of major activity 778 391 52.3 26.9 3.0 0.3 17.5 0.7 28.6Limited in other activity 415 208 71.2 16.3 1.5 * 0.5 10.5 0.0 t 15.8Not limited in activity 29,914 14,815 70.0 12.3 1.4 0.5 15.8 0.2 11.5
Basic Life ActivitiesNeeds help in self care (ADL)-ages 5-17 64 33 58.5 31.2 4.5 * 0.0 t 5.8 4.5 * 35.7Not limited in basic life activities 31,188 15,451 69.6 12.7 1.4 0.5 15.8 0.2 12.0
Source: National I lealth Interview Survey (author's tabulations from public use tapes).Note: Standard errors for estimates appear in Appendix TABLE A-4.
Estimate has low statistical reliability (relative standard error > 30).t Estimate is exactly 0 or standard error is indeterminate.
4

Disabilihj and health insurance 35
no consistent pattern is observed in the rate ofuninsurance with severity of disability.
It can be questioned whether the activity limitationmeasure adequately captures disability in children. Itsconsistency with the Federal definition of developmentaldisabilities has not been demonstrated, and alternativemeasures need to be explored (Levine, Zitter, & Ingram,1990). Respondent-assessed health status provides analternative measure of children whose health isvulnerable.
The proportion of children with private coveragedeclines consistently with worsening health, from 77.3%of children in excellent health to 33.2% of those in poorhealth (Table K). Among children, labor forceparticipation is irrelevant, and one might suspect thestatistics convey that insurers reject coverage for childrenwho are ill. However, an alternative explanation is thatthe availability of public coverage gives parents theoption of dropping covered children's private insurance,for which they may have to pay premiums. UnlikeMedicare, Medicaid does not require copayments" andpays for prescription drugs,12 so there may be less needto retain private coverage as a supplement. Particularlyfor children, the availability of public coverage mayinfluence private coverage, an issue worthy of furtherstudy.
About 288,388 children are covered by SSI due toblindness and other impairments, including those ininstitutions (Social Security Administration, 1990, Table9.B8). The 1989 NHIS yields an estimate of 457,000noninstitutionalized children on SSI. Children on SSI aretypically severely disabled, but the NHIS indicates thatonly 12.6% of children on SSI are limited in self care, and58.5% are not limited in activity. This indicates thateither the SSI question for children is not answeredreliably, with SSI possibly being confused with otherwelfare programs, or that the activity limitation questionis not very reliable, or both.13
1.3 TRENDS
Estimates of insurance coverage for 1984 and 1989were compared by age, race, and disability status (TableL). The rate of uninsurance among children and adults
In general, state governments cannot charge copaymentsexceeding $3.00 per service categ,ory per month(Systemetrics/McGraw-Hill, 1990).12 In 1989, only Alaska failed to provide prescription drugsunder Medicaid. Fifteen states offered prescribed drugs to thecategorically needy only, the rest covered both categoricallyand medically needy populations (Ruther et al., 1990).13 Because the tabulations did not indicate a significant impactof disability on uninsurance of children, regression analysis wasnot undertaken for this group. Furthermore, since the healthinsurance status of children is largely a function of parentalcharacteristics, considerable merging of data files would benecessary to engage in a meaningful-analysis for children.
both increased slightly over this period by 5-6%.14Private insurance declined slightly by 0.5 percentagepoints overall and declined especially for adults aged 18to 44. Medicare and Medicaid coverage increasedslightly overall and for most groups, but not enough tocompensate for the decline in private insurance amongadults aged 18 to 44. The rate of uninsurance increasedsignificantly for children aged 5 to 17. A decline inprivate insurance was compensated by an increase inpublic coverage (mainly Medicaid), but there was asubstantial decline in military and other plans. Theincrease in uninsurance among children should not beweighed highly in terms of policy given its sensitivity tochange in the residual plan category.
Although the rate of uninsurance increased for adultsin all categories of limitation in activity, only among thepopulation not limited in activity was the increasesignificant. Among children limited in amount or kind ofmajor activity, the rate of private coverage declinedsignificantly, leading to a significant increase in the rateof uninsurance. Given the short time period of thiscomparison, it is best not to read too much into thesefindings.
These findings presage more significant changes thathave occurred after 1989 as noted by Himmelstein,Woolhandler, and Wolfe (1992), specifically that the rateof private insurance has declined but has been offset byan expansion of Medicaid for poor children that occurredin 1990 (U.S. Bureau of the Census, 1991a; U.S. Bureau ofthe Census, 1991b; U.S. Bureau of the Census, 1992).
In summary, 4.1 million people under age 65 withdisabilities are uninsured. Over half a million arechildren with disabilities. Approximately 1.5 millionadults with severe disabilitiesthose who needassistance in ADL or IADL or who are unable to workare uninsured, out of 3.5 million uninsured adults withsome level of disability. The 4.1 million uninsuredchildren and adults with disabilities comprise apotentially high risk group that may not receive neededhealth services. Since data from 1984 reveal similarstatistics, we infer that people with disabilities haveexperienced uninsurance as an ongoing problem.
Compared to independent statistics on programparticipation, this study reveals some inconsistencies thataffect the measurement of the uninsured and requ.regreater attention. Medicaid is substantiallyunderreported in the NHIS. Furthermore, it is apparentthat some adults are confused about Medicare coverage:a higher than expected 13.9% of adults on Medicare saythey work, and of those who do work, the majority statethey are not limited in any activities. Some parents
14 Newacheck, McManus, and Cephart (1992) found a 10%increase in the rate of uninsurance among children aged 10through 18.

TA
BL
E L
. Typ
e of
Hea
lth I
nsur
ance
Cov
erag
e A
mon
g C
hild
ren
and
Adu
lts, b
y A
ge, R
ace,
and
Dis
abili
ty: U
nite
d St
ates
, 198
4 an
d 19
89
1984
1989
Med
icar
e'
and/
orPr
ivat
e' M
edic
aid
Popu
latio
n O
nly
Onl
y(1
,000
s)(%
)(%
)
2i
Prva
tew
ithO
ther
Cov
erag
e(%
)
Mili
tary
3
and
Oth
erPl
ans
Onl
y(%
)
Not
Insu
red
(%)
Med
icar
e'Pr
ivat
e2an
d/or
with
Priv
ate'
Med
icai
dO
ther
Popu
latio
n O
nly
Onl
yC
over
age
(1,0
00s)
(%)
(%)
(%)
Mili
tary
3
and
Oth
erPl
ans
Not
Onl
y In
sure
d(%
)(%
)
Adu
lts14
2,58
175
.24.
22.
92.
015
.715
0,30
974
.74.
5$
2.5
#1.
6 #
16.7
#
Age 18
-24
year
s28
,045
65.5
5.2
1.3
2.0
26.0
25,4
0162
.7#
5.5
1.2
2.3
28.3
§25
-44
year
s70
,256
78.2
4.2
1.5
1.3
14.8
78,7
9477
.24:
4.1
1.3
1.1
16.3
#45
-64
year
s44
,280
76.6
3.9
6.0
3.0
10.5
46,1
1477
.04.
7§
5.2
§2.
0 #
11.1
Rac
e Whi
te12
2,66
077
.73.
12.
81.
914
.512
7,54
977
.33.
31.
54:
1.4
#15
.5 #
Bla
ck16
,082
58.3
12.9
3.2
2.6
23.0
17,4
7758
.212
.22.
62.
724
.3O
ther
3,83
965
.25.
62.
74.
522
.05,
283
65.5
6.4
2.5
2.9
t22
.7
Maj
or A
ctiv
i ty
Una
ble
to p
erfo
rm m
ajor
act
ivity
5,77
433
.527
.216
.66.
915
.86,
772
34.1
29.5
13.6
f5.
417
.4L
imite
d in
am
ount
/kin
d of
maj
or a
ctiv
ity7,
861
63.0
9.4
7.0
3.5
17.1
7,49
862
.79.
16.
52.
3 t
19.4
Lim
ited
in o
ther
act
ivity
4,96
970
.08.
24.
62.
015
.25,
490
69.1
9.3
3.9
1.6
16.1
Not
lim
ited
in a
ctiv
ity12
3,97
678
.12.
71.
91.
715
.613
0,54
977
.72.
71.
6§
1.4
§16
.6 #
Chi
ldre
n62
,592
70.3
10.1
1.6
3.0
15.0
64,0
0569
.610
.71.
72.
2 #
15.8
4:
Age 0-
4 ye
ars
18,0
7465
.213
.31.
63.
316
.618
,769
65.2
13.8
1.5
1.8
16.7
5-17
yea
rs44
,518
72.4
8.8
1.6
1.8
14.4
45,2
3671
.39.
51.
72.
0 #
15.4
tR
ace W
hite
51,2
6775
.06.
61.
32.
714
.451
,612
74.3
7.1
1.4
2.2
§14
.9B
lack
9,49
747
.628
.13.
43.
317
.69,
959
48.2
26.9
2.9
2.5
19.5
Oth
er1,
829
56.0
15.8
1.1
6.7
19.4
2,43
455
.918
.42.
03.
4 4:
20.2
Maj
or A
ctiv
ityU
nabl
e to
per
form
maj
or a
ctiv
ity26
246
.923
.16.
77.
615
.734
649
.526
.54.
42.
517
.1L
imite
d in
am
ount
/kin
d of
maj
or a
ctiv
ity1,
985
60.4
20.6
3.2
3.2
12.6
2,09
754
.3f
22.6
4.0
1.4
17.8
$L
imite
d in
oth
er a
ctiv
ity92
569
.79.
03.
03.
714
.699
468
.116
.3f
2.4
1.8
11.4
Not
lim
ited
in a
ctiv
ity59
,420
70.8
9.7
1.5
2.9
15.1
60,5
6770
.210
.21.
52.
3 #
15.8
Sour
ce: N
atio
nal H
ealth
Int
ervi
ew S
urve
y (a
utho
r's ta
bula
tions
fro
m p
ublic
use
tape
s).
1
Exc
lude
s m
ilita
ry.
2In
clud
es c
ombi
natio
ns w
ith m
ilita
ry c
over
age.
3- Exc
lude
s pr
ivat
e, M
edic
are,
and
Med
icai
d.
p<00
5§
p<0.
01#
p<0.
00l

Disability and health insurance 37
appear to be confused about their children's SSI coverageor by how disability is measured in children. Measuresof public insurance coverage and participation in theprograms that confer such coverage need to be furtherexamined and improved. Though there is substantialevidence of content validity, there is evidence that peoplewho should have public coverage do not report it, whileothers who should not have such coverage do. This hasimplications for counting the uninsured and for thequality of public program data.
2 Disability, Insurance, and Health Services Use
In this part, estimates of the annual number ofphysician contacts per person, hospital discharges per100 people, and average length of stay per hospitaldischarge are compared between people with insuranceand those without insurance by disability, health status,and other characteristics. Logistic regression models areestimated to determine the impact of insurance onutilization by level of disability, controlling for healthstatus and other sociodemographic characteristics.
2.1 Physician contacts
2.1.1 AdultsPhysician contacts are estimated using the recalled
number of contacts occurring during the two weeks priorto the time of interview. Having insurance facilitatesaccess to physician care among adults (Table 5). Onaverage, adults have 38% fewer physician contacts if theyare uninsured (3.4 versus 5.5 contacts, t=7.16, p<.001).Compared to people with private insurance or noinsurance, people with Medicare, Medicaid, or militarycoverage have more physician contacts, but thiscomparison is biased because people with thes, types ofcoverage are more likely to have a disabiiity andgenerally worse health.
As expected, physician contacts increase with severityof disability. People who need assistance in self carehave 28.9 physician contacts a year, and those who needassistance in routine care have 23.3 physician contacts ayear. In both these groups no significant differences areobserved between those insured and not insured(significance levels of insured versus uninsuredcomparisons are shown in Table 5). The small samplesize of these populations is compounded by the rate ofuninsurance being less than 15%, and differencesbetween the insured and uninsured are hard to detect.
Among people unable to work, those with insurancehave 20.0 annual physician contacts, 32% higher than thenumber of physician contacts of those without insurance.Regardless of type of insurance, physician contacts forthose unable to work are higher for the insured than theuninsured but are significantly higher only for those withprivate insurance. Of people limited in amount or kindof work, those with insurance have 14 percent higher
physician contacts than those without insurance, but thisdifference is not significant. However, those withMedicaid have significantly more contacts than thosewho are uninsured. Among people limited in activitiesother than work, those with insurance have 9.0 annualphysician contacts, 80% greater than the number ofphysician contacts for those without insurance; thisdifference is highly statistically significant. Last, amongpeople not limited in activity, physician contacts areabout 90% greater for those with insurance than thosewithout insurance. Thus, having insurance issignificantly associated with more physician contactsamong people with disabilities.
Regardless of health status, the number of physiciancontacts is very consistent by type of insurance and,overall, people with insurance have 42% to 104% morephysician contacts than those without insurance.
Men have fewer contacts with doctors than women(3.9 versus 6.4, t=17.7, p<.001), and this generally holdsregardless of level of disability or health status. Menhave 40% fewer physician contacts if they are uninsuredthan if they are insured, while women have 34% fewercontacts if they lack insurance coverage. For uninsuredmen and women both, physician contacts are fewer thanfor insured people for most levels of activity limitationand health status levels, though the effect of insurance(and its statistical significance) is more variable than forthe sample as a whole.
Regression analysisUninsured people may differ from those with
insurance in terms of their health and othersociodemographic characteristics even within categoriesof activity limitation. For example, those with insurancemay have more income, be better educated, be morelikely to perceive themselves to be healthier, and so forth,than similarly disabled people who lack insurance. It isnecessary to test statistically whether the observeddifferences in utilization by disability status can beexplained by differences in health and sociodemographiccharacteristics. We focus on the effect of insurancewithin work disability categories; crude comparisonswithin these ca tegories have already indicated asignificant impact of insurance. A series of logisticregression models is estimated (1) with the threecategories of work disability and insurance specified and(2) with sociodemographic, health status, and incomevariables added in sequential steps (Table M).
The dependent variable is defined as Y=1 if a personhas at least one physician contact during the two weekspreceding the interview; otherwise Y=0. A logistic modelis used to describe how disability and other variablesaffect the likelihood (more exactly the likelihood of thelog of the odds ratio) of having a physician contact. Inmodel A, in which work disability categories and type ofinsurance are specified, the insurance effect is large andsignificant. In model 13, the insurance effect is allowed to
4 5

38Disability and health insurance
TABLE M. Lo istic Re ession Models of the Likelihood of Ph sician Contact Amon Adults A ed 18 to 64: United States, 1989
Model A Model 13 Model C Model D Model E Model FBeta x2 Beta x2 Beta x2 Beta x2 Beta x2 Beta .4," x2 l
Intercept -2.628 5627.24 -2.686 4234.00 -2.451 227.56 -2.789 284.91 -2.687 250.77 -2.826 300.08Insurance
Insured (Uninsured) 0.621 292.07 # 0.686 248.29 # 0.579 166.42 # 0.626 192.65 # 0.608 177.72 # 0.630 195.74 # 120.74 #Work Disability
Unable to work 1.521 1665.53 # 1.741 315.21 # 1.771 314.90 # 1.278 151.37 # 1.288 153.06 # 1.281 152.13 * 126.40 #Limited in amount/kind 0.924 424.52 # 1.196 113.32 # 1.203 112.41 # 0.917 63.47 # 0.921 63.86 # 0.920 63.90 # 47.63 #Limited in other activities 0.769 208.58 # 0.757 21.24 # 0.721 19.03 # 0.476 8.14 § 0.478 8.19 § 0.479 8.25 § 6.36(Not limited in activity)
Insurance and DisabilityInteractions
Unable to work -0.254 5.76 t -0.152 2.00 -0.212 3.80 -0.206 3.57 -0.212 3.79 2.91Limited in amount/kind -0.319 6.78 § -0.284 5.29 1 -0.290 5.42 j -0.291 5.45 -0.290 5.41 3.73Limited in other activities 0.015 0.01 0.059 0.12 0.080 0.21 0.080 0.21 0.078 0.19 0.15(Uninsured and not limited)
AgeAge in years -0.020 8.96 § -0.024 13.24 # -0.024 13.01 # -0.023 12.11 # 10.75 §Age in years squared 2.15E-04 7.41 § 2.22E-04 7.86 § 2.09E-04 6.93 § 2.05E-04 6.66 § 5.93
GenderMen (Women) -0.566 550.62 # -0.536 485.46 # -0.538 487.88 # -0.535 483.39 # 463.59 #
RaceBlack (White) -0.106 7.64 § -0.204 27.78 # -0.189 23.17 # -0.196 25.90 # 23.20 #Other (White) -0.218 9.81 § -0.303 18.70 # -0.285 16.58 # -0.292 17.42 # 15.22 #
Hispanic EthnicityHispanic (Non-I lispanic) -0.025 0.30 -0.078 2.87 -0.069 2.23
EducationYears of education 0.016 0.92 0.012 0.49 0.012 0.48 0.019 1.34 1.13Years of education squared 0.001 2.07 0.002 9.13 § 0.002 7.72 § 0.002 6.49 5.32
Marital StatusMarried 0.188 27.37 # 0.186 26.58 # 0.193 28.43 # 0.196 29.48 # 26.35 §Previously married 0.242 27.16 # 0.231 24.36 # 0.235 25.25 # 0.227 23.52 # 21.62 §(Never married)
Health StatusVery good (Excellent) 0.340 119.10 # 0.342 120.36 # 0.342 120.77 # 104.74 #Good (Excellent) 0.611 338.92 # 0.616 343.52 # 0.612 342.04 # 257.52 #Fair (Excellent) 1.001 443.42 # 1.012 44839 # 1.000 445.00 # 385.85 #Poor (Excellent) 1.412 421.30 # 1.426 425.04 # 1.410 420.95 # 356.65 #Unknown (Excellent) -0.178 0.46 -0.180 0.47
Family Incometo Poverty Ratio
1.75 to under 2.00 (Above 2.00) -0.233 33.94 # -0.212 29.50 § 25.39 #1.50 to under 1.75 (Above 2.00) -0.178 12.83 # -0.155 10.22 § 7.65 §1.25 to under 1.50 (Above 2.00) -0.099 2.901.00 to under 1.25 (Above 2.00) -0.064 1.060.50 to under 1.00 (Above 2.00) -0.117 5.09 tLess than 0.50 (Above 2.00) -0.035 0.27Sample size (for all models) 68,211Goodness of fit X2 (Ilosmer)-Model F 16.50Significance level with 8 degrees of freedom p=0.036
1. x2corrected for complex sample design (using RTILOG1T).2. Reference category is excellent and unknown health status.3. Reference category is poverty ratio not between 1.50 to 2.00.- Variable dropped for final model.
p<0.05.§ p<0.01.
p<0.001.
4 t3

Disability and health insurance .39
vary by work limitation category. The coefficient for thevariable "insured" in model B represents the effect ofhaving insurance versus not having insurance amongpeople who are not limited in activity. The interaction termsmeasure the magnitude of the insurance effect on thelikelihood of having a physician contact for each categoryof work limitation relative to the effect of insurance forpeople not limited in activity. For people unable to workor limited in amount or kind of work, the effect ofinsurance is significantly diminished over the effect forpeople without activity limitation. This reflects thepattern observed in the data presented in Table 5 anddiscussed above, namely that the relative effect ofinsurance is greater among people who are not limited inactivity than among people unable to work or limited inthe amount or kind of work. Nevertheless, the effect ofinsurance is still substantial for people who are unable towork: the probability of having a physician contact in thepast two weeks is .374 if insured and .280 if uninsured, a34% change. By contrast, among people not limited inactivity, the probability of having a physician contact is0.119 if insured and 0.064 if not insured, an 86% change.
The logistic model describes the likelihood ofphysician contact, it does not measure the total volume ofcontacts. The number of contacts estimated in Table 5reflects both the likelihood of having a physician contactand the number of contacts among those with at leastone. If the probabilities obtained from model B aremultiplied by 26 to estimate the annual number ofcontacts, people unable to work and insured would have9.7 contacts compared to the actual estimate of 20.0contacts. Thus, the probability accounts for half of theestimated utilization in Table 5 for people unable to workand insured. For people not limited in activity, theprobability accounts for about 75% of the total number ofcontacts. Because the number of contacts is distributed ina narrow range within a two-week period,15 furtheranalysis of the volume of contacts is not undertaken. Thelogistic analysis describes the greater part of the variationin total contacts and the results parallel the patternsobserved in the crude data for total volume.
The effect of insurance remains large and significantwhen sociodemographic, health status, and incomevariables are controlled. In model F, in which thosevariables are included, the likelihood of physician contactincreases with age, is much lower for men (hugely
15 The distribution of contacts in the past two weeks was 86.8%with none, 9.6% with one, 2.4% with two and 1.3% with morethan two. A separate analysis of the probability of having aphysician contact was done employing respondents' recall ofcontacts for the entire year prior to the interview. This modelalso showed significant effects of insurance and level ofdisability. However, the annual recall data is biaseddownward, yielding an estimate of 3.6 contacts for all adultsaged 18 to 64. The estimate based on two-week recall is 4.9contacts. Because of the problem of forgetting with the annualrecall data, no further analysis of volume is undertaken in thepresent study.
significant), is lower for blacks and other races, but notfor people of Hispanic origin, and increases with highereducation, but is significant only when health status iscontrolled (compare with model C). Married andpreviously married people have a higher likelihood ofphysiciin contact than those never married. Thelikelihood of physician contact increases strongly andsignificantly with poorer health status, and issignificantly lower for people of moderate income from1.5 to 2 times the poverty line than those with incomes 2or more times the poverty line. At income below 1.5times the poverty line, people are as likely to contact aphysician as are those with incomes at 2 times thepoverty line and above. With simultaneous adjustmentfor all sociodemographic, health status, and incomefactors, the insurance interaction for people unable towork falls just below the .05 significance level of beingdifferent from the effect of insurance on people withoutactivity limitation. Only for those limited in the amountor kind of work is the effect of insurance significantly lessthan for people without activity limitation (p<.05). Forthe final model, the Chi-square significance levels beforeand after adjusting for the complex sample design areshown. In general, the significance of the estimatedmodel effects is lower when the complex sample designis taken into account. However, none of the interactionterms for insurance remains significant when thecomplex design is taken into account. Since the maineffect of insurance stays significant, we conclude that theeffect of uninsurance is the same for people withdisabilities as it is for those without disabilities.
Goodness-of-fit statistics indicate that the model is ofborderline fit. Using the Hosmer-Lemeshow test(Hosmer & Lemeshow, 1989), a p value greater than .05indicates a good fit. Here p=.04almost but not quite agood fit. Generally, it is difficult to predict the healthcare utilization of individuals well. However, the aim ofthis analysis is to explore competing explanations of anobserved relationship rather than to find the best-fittingmodel of physician utilization.
The results show that people contact physicians lessoften when they do not have insurance. This is true forpeople with disabilities, since interaction terms fail toindicate a significant difference in the magnitude of theinsurance effect on the likelihood of physician contacts bylevel of disability. People without disabilities who lackinsurance may forego utilization that is more preventiveor elective. The lower utilization of the uninsured withsevere disabilities may mean they forego physicianservices that may be necessary for the maintenance oftheir health, potentially increasing the chance of theircondition worsening or of developing secondaryconditions and increasing their disability.

40Disability and health insurance
2.1.2 ChildrenOn average, uninsured children have 34% fewer
physician contacts than those with insurance, a highlysignificant difference (significance levels are flagged inTable 6). As expected, utilization of physicians increaseswith the severity of disability. Children needingassistance in self care average 15.6 contacts per year,while those unable to perform their major activityaverage 19.8 and those limited in the amount or kind ofmajor activity average 10.0 contacts. Small sample sizesfor these categories result in high standard errors, whichlimit the significance of comparisons among categoriesaccording to insurance status. For children not limited inactivity, a significant difference is observed according toinsurance status, with uninsured children having 40%fewer contacts than insured children.
The annual number of physician contacts increasessystematically with worsening health. Children withoutany insurance have 37% to 45% fewer physician contactsthan those with insurance, according to health status.Children in poor health have similarly high contactswhether insured or not, but there are few children in thiscategory (190,000). Except for children in poor health,children with private insurance have significantly morecontacts than uninsured children regardless of healthstatus. Children with Medicaid coverage havesignificantly more contacts than uninsured children butonly for those whose health is excellent or very good.Children whose health is good or fair are a group ofconcern: the 20% who are uninsured have 40% fewercontacts than those with insurance.
Regression analysisLogistic regression analysis shows that among
children, activity limitation and insurance aresignificantly associated with greater likelihood ofphysician contacts (Table N). The effects of activitylimitation and insurance remain large and significantafter controlling for sociodemographic, health status, andpoverty variables and after adjusting for the complexsample design (model E). No statistically significantinteractions between degree of activity limitation andinsurance status are observed. As for adults then, theeffect of insurance on the likelihood of physician contactsdoes not vary by disability level when sociodemographic,health, and income variables are included.16 Thus, we
16 Because of the small sample sizes within the three categ,oriesof activity limitation for children, the interpretation that the lackof significance of the insurance and activity limitationinteraction terms indicates that the effectof insurance onphysician contacts among children with disabilities is the sameas its effect among all children was verified by re-estimatingmodel E just on the population of children with activitylimitations (n=1,700). A significant effect of insurance (b=0.-139,p<.01) was found when level of disability and the samevariables included in Model E were controlled. In fact, theeffect of insurance among children with disabilities is identicalto the effect for all children when the same exogenous variablesare controlled (b=0.438, p<.00l). Thus, the interpretation that
conclude that children with disabilities, as childrenwithout disabilities, have a lower likelihood of physiciancontacts if uninsured. In this case, the estimated model isa good fit with the data (p>.05).
2.2 Hospitalization
2.2.1 AdultsEstimated rates of hospital discharges per 100 people
per year and average length of stay per hospitaldischarge are shown in Table 7. All estimates excludehospitalization for delivery. Among all adults aged 18 to64, those without insurance have 31% fewerhospitalizations than those with insurance (6.4 vs. 9.3discharges per 100 peopleper year). Hospitalizations aresignificantly lower for the uninsured than the insuredregardless of type of insurance coverage (significancelevels are flagged in Table 7). The higher hospitalizationrates of people with Medicare and Medicaid coverage isdue to their greater likelihood of disability and generallyworse health. When stratified by disability and healthstatus, hospitalization rates are quite similar acrossinsurance types. Generally, within alI categories ofdisability and health status, uninsured people havesignificantly lower rates of hospitalization than theinsured.
The rate of hospitalization increases with the severityof disability. Among people who need assistance in selfcarewith a rate of 82.2 discharges per 100 people ayearno significant difference is observed by insurancestatus, perhaps owing to the small sample size of thispopulation (also the estimated rate is higher among theuninsured than the insured, which seems to be astatistical outlier). Among people who need assistance inroutine activitieswho average 50.9 discharges a yearthe uninsured have a 37% lower hospitalization rate thanthe insured.
Among people unable to work, those withoutinsurance average 31.7 annual hospitalizations per 100people, 40% lower than the 52.9 rate of those withinsurance. People limited in the amount or kind of workthey can do have a 29% lower rate of hospitalization ifuninsured; for these limited in activity other than workthe corresponding figure is 65% lower; and for those notlimited in activity, the rate is 23% lower.
Hospitalization rates increase systematically withworse health, and within all health status categories, ratesfor the uninsured are significantly lower than theinsured.
Uninsurance reduces hospitalization rates more forwomen than men. If uninsured, men have 25% fewerhospitalizations and women have 37% fewer. There arefewer significant differences between insured anduninsured groups for men than women within disability
the effect of insurance is the same for children with disabilitiesas for all children is upheld.

Disability and health insurance
TABLE N. Logistic Regression Models of the Likelihood of Physician Contact Among Children Aged 0 to 17: United States, 1989
41
VariableModel A Model B Model C Model D Model E
Beta x2 Beta x2 Beta x2 Beta x2 Beta x2 x2 I
Intercept -2.416 2267.99 -2.009 78.22 -2.561 115.27 -2.386 92.48 -2.384 387.73
InsuranceInsured (Uninsured) 0.530 98.37 # 0.435 60.76 # 0.471 69.55 # 0.431 56.01 # 0.438 58.29 # 47.12 #
Activity LimitationUnable to perform major activity 1.432 79.70 # 1.578 90.85 # 0.930 27.13 # 0.938 27.57 # 0.946 28.08 # 28.06 #Limited in amount/kind 0.821 119.36 # 1.133 213.97 # 0.780 91.45 # 0.785 92.32 # 0.784 92.17 # 87.49 #Limited in other activities 0.778 52.18 # 1.040 89.38 # 0.765 46.27 # 0.759 45.40 # 0.758 45.25 # 33.79 #(Not limited in activity)
Age
Age in years -0.268 528.03 4 -0.270 524.72 # -0.265 500.95 4 -0.265 502.52 4 401.61 4Age in years squared 0.011 271.44 # 0.011 266.04 4 0.011 248.64 4 0.011 250.82 4 212.22 4
GenderBoys (Girls) 0.067 3.84 0.082 5.57 0.083 5.70 0.083 5.75 4.32
Race
Black (White) -0.383 50.67 # -0.507 85.45 4 -0.483 72.11 4 -0.505 83.50 4 44.14 #Other (White) -0.231 5.78 -0.336 11.99 4 -0.310 10.19 § -0.321 11.09 4 7.35 §
Hispanic EthnicityHispanic (Non-Hispanic) -0.171 9.48 § -0.225 15.97 4 -0.206 13.17 # -0.216 14.75 4 8.49 §
Family EducationYears of education 0.061 3.36 0.072 4.36 0.080 5.21 t 0.071 102.40 4 73.85 #Years of education squared 0.000 0.10 0.000 0.03 0.000 0.13 -
Health StatusVery good (Excellent) 0.395 88.77 4 0.398 89.79 4 0.398 89.98 4 73.13 #Good (Excellent) 0.791 268.94 4 0.804 274.56 4 0.798 272.35 4 187.00 4
Fair (Excellent) 1.254 172.01 4 1.279 176.95 # 1.266 174.95 4 166.18 4
Poor (Excellent) 2.301 102.12 4 2.329 104.65 # 2.306 103.08 # 71.40 #Unknown (Excellent) 0.336 3.83 0.339 3.88 0.338 3.86 2.23
Family Incometo Poverty Ratio
1.75 to under 2.00 (Above 2.00) -0.153 9.85 § -0.135 8.07 § 5.92
1.50 to under 1.75 (Above 2.00) -0.344 33.65 4 -0.320 30.89 4 30.69 #1.25 to under 1.50 (Above 2.00) -0.261 1216 # -0.233 10.19 § 5.78
1.00 to under 1.25 (Above 2.00) -0.160 4.38 -0.129 3.02 2.37
0.50 to under 1.00 (Above 2.00) -0.258 14.08 4 -0.222 11.62 # 9.24 §
Less than 0.50 (Above 2.00) -0.133 2.59 -Sample size (for all models) 31,524Goodness of fit 2C2 (Hosmer)-Model E 13.09Significance level with 8 degrees of freedom p=0.109
I. Z 2 corrected for complex sample design (using RTILOGIT).- Variable dropped for final model.
p<0.05.
§ p<0.01.
# p<0.001.

42 Disabilihy and health insurance
levels. For men with work limitation, the hospitalizationrate is not significantly lower for the uninsured, althoughit is significantly lower for uninsured men limited inactivities other than work and for uninsured menwithout activity limitation. Men who are unable to workand are uninsured have a significantly lowerhospitalization rate than those with private insurance.
Hospitalization rates are lower for uninsured womenregardless of level of work disability. Contrastinguninsured with insured women, rates of hospitalizationare 59% lower if unable to work, 53% lower if limited inamount or kind of work, 64% lower if limited in otheractivities, and 23% lower if not limited. These results arehighly significant. Women with disabilities who areuninsured receive much less hospital care than thosewith insurance and less than men with disabilities whoare uninsured (e.g., of those unable to work, men have43.3 discharges per 100 uninsured versus 20.9 dischargesper 100 uninsured women, t=2.87, p<.01).
Average length of stay does not differ between theworking age insured and uninsured. Standard errors ofthese estimates are quite low (less than 9% for theuninsured), so the sample size appears large enough todiscriminate reasonably well. Unlike rates of hospitaldischarges, no systematic differences in average length ofstay by level of disability are observed, for men andwomen together or separately. Thus, while theuninsured have fewer hospitalizations than the insured,on average they stay as long in the hospital as theinsured.
Regression analysisThe, uninsured may differ from the insured on factors
disposing toward hospitalization even within disabilitylevels. To test whether the lower rates of hospitaldischarge of the uninsured are sensitive to differences inhealth status and other factors, a series of logisticregression models are estimated addingsociodemographic, health status, and income variables inseparate steps (Table 0). The dependent variable isdefined as 1 if an individual had one or more hospitaldischarge during the 6 months preceding the interview.The independent variables of interest are level of workdisability and insurance, controlling for other variables.In model A, the insurance effect is assumed to beconstant across work limitation categories. The effect ofinsurance is large and significant, as is the effect of thelevel of work limitation contrasted with people withoutlimitation. In model B, the insurance effect is allowed tovary by work limitation category. The interaction ofinsurance with disability is significantly higher amongpeople limited in activities other than work. Amongpeople unable to work, the insurance interaction .allsshort of being significant. For those with limitation in theamount or kind of work, the effect is the same as forpeople without activity limitation. This reflects the same
patterns observed in the data presented in Table 7 anddiscussed above.
The effect of insurance remains significant whensociodemographic, health status, and income variablesare controlled (model F). The final column in Table 0shows the Chi-square significance levels of each variableafter adjusting for the complex sample design. Only theinsurance interaction for people limited in activities otherthan work is significant, indicating a higher effect ofinsurance on people without activity limitation.
The likelihood of hospitalization varies nonlinearlywith age. People of races other than white or black havesignificantly lower likelihood of hospitalization. Marriedand previously married people have a higher likelihoodof hospitalization. With poorer health status, thelikelihood increases systematically. People with incomesless than half the poverty level have a higher likelihoodof hospitalization than people with incomes twice thepoverty line. Despite the greater effect of uninsurance onwomen (Table 7), gender does not influence thelikelihood of discharge.
Based on the final model, it is concluded thatuninsurance is associated with lower likelihood ofhospitalization for people with disabilities.
To address the observation that the impact ofuninsurance is greater for women with disabilities (Table7), separate logistic regression models of the likelihood ofhospitalization are estimated by gender. These resultsindicate that the effect of insurance is greater amongwomen (beta=0.631, p<.001) than men (beta=0.244, p<.01),even when sociodemographic, health, and povertyvariables are controlled. No significant disability andinsurance interactions are observed for men or women.Thus, men and women with disabilities are less likely tobe hospitalized if uninsured but the impact ofuninsurance is greater for women than for men.
2.2.2 ChildrenEstimated rates of hospital discharges per 100 children
per year and average length of stay per hospitaldischarge are shown in Table 8. Among children, thosewithout insurance have 11% fewer hospitalizations thanthose with insurance (4.1 vs. 4.6 discharges per 100people), a difference that is not statistically significant.Rates of hospitalization are significantly higher forchildren on Medicaid than children with privateinsurance or no insurance. This is mainly accounted forby higher rates of hospitalization among children under 5who are on Medicaid. Children under 5 have a rate ofhospitalization 2.4 times as high as children 5 years andolder. When stratified by health status, discharge ratesare more comparable across insurance types and fewsignificant differences are observed.
Hospitalization increases systematically with theseverity of children's disability, as measured by activitylimitation. However, the estimated hospitalization ratefor children needing assistance in self care has a high

Disabilihy and health insurance 43
TABLE 0. Logistic Regression Models of the Likelihood of Hospitalization in Past 6 Months Among Adults Aged 18 to 64: United States, 1989
Model A Model B Model C Model D Model E Model F
Beta x2 Beta x2 Beta x2 Beta x2 Beta x2 Beta x2 x2 I
Intercept 4.002 4395.78 -3.918 2883.20 -3.802 193.83 -4.161 224.98 4.228 219.61 -3.994 297.36
InsuranceInsured (Uninsured) 0.379 37.66 # 0.282 12.97 # 0.288 12.78 # 0.363 20.14 # 0.376 21.15 # 0.371 21.13 # 13.42 #
Work DisabilityUnable to work 2.145 1767.26 # 1.897 173.31 4 1.805 152.87 # 1.177 60.11 # 1.173 59.39 # 1.167 59.07 # 48.48 #
Limited in arnount/kind 1.347 379.85 # 1.355 61.20 # 1.304 56.12 # 0.924 27.44 # 0.915 26.85 # 0.927 27.64 # 17.74 #
Limited in other activities 1.087 157.86 # 0.452 2.04 0.400 1.59 0.079 0.06 0.073 0.05 0.073 0.05 0.05
(Not limited in activity)Insurance and Disability
InteractionsUnable to work 0.286 3.44 0.280 3.26 0.190 1.48 0.194 1.53 0.199 1.62 1.57
Limited in amount/kind -0.013 0.00 -0.008 0.00 -0.029 0.02 -0.019 0.01 -0.025 0.02 0.01
limited in other activities 0.704 4.56 t 0.722 4.79 0.732 4.90 0.735 4.93 t 0.735 4.93 4.42
(Uninsured and not limited)Age
Age in years -0.034 8.26 § -0.043 13.54 # -0.042 12.92 # -0.046 15.33 # 15.66 #
Age in years squared 4.18E-04 9.42 §4.69E-04 11.74 # 4.63E-04 11.43 # 5.00E-04 13.54 # 14.21 #
GenderMen (Women) -0.053 1.58 -0.008 0.04 -0.007 0.03
Race
Black (White) 0.043 0.46 -0.071 1.23 -0.087 1.77 -Other (White) -0.180 1.84 -0.295 4.88 I -0.297 4.93 t -0.304 2 5.26 6.01 t
Hispanic EthnicityHispanic (Non-Hispanic) 0.055 0.51 -0.010 0.02 -0.022 0.08
EducationYears of education 0.066 6.42 0.052 3.77 0.055 4.13 0.012 2.60 2.41
Years of education squared -0.004 11.28 # -0.002 2.81 -0.002 2.92 -Marital Status
Married 0.407 35.13 # 0.399 33.70 # 0.407 34.90 # 0.430 39.92 # 30.85 #
Previously married 0.510 37.58 # 0.488 34.24 # 0.487 33.98 # 0.501 36.86 # 31.34 #
(Never married)
Health StatusVery good (Excellent) 0.371 31.71 # 0.369 31.36 # 0.368 3 31.70 # 27.25 #
Good (Excellent) 0.874 184.18 # 0.868 181.19 # 0.871 187.67 # 130.97 #
Fair (Excellent) 1.290 254.61 # 1.280 248.98 # 1.276 255.82 # 157.74 #
Poor (Excellent) 1.745 314.26 # 1.733 306.28 # 1.725 310.69 # 210.29 #
Unknown (Excellent) 0.476 1.44 0.462 1.36
Family Incometo Poverty Ratio
1.75 to under 2.00 (Above 2.00) -0.135 3.47 - - -1.50 to under 1.75 (Above 2.00) 0.068 0.69 - - -1.25 to under 1.50 (Above 2.00) -0.025 0.07 - - -1.00 to under 1.25 (Above 2.00) 0.189 3.90 t - - -0.50 to under 1.00 (Above 2.00) -0.091 1.16 - - -Less than 0.50 (Above 2.00) 0.271 6.95 § 0.266 4 7.50 § 6.53 t
Sample size (for all models) 68,211Goodness of fit X2 (Hosmer)-Model F 29.43Significance level with 8 degrees of freedom p<0.001
1. z 2 corrected for complex sample design (using RTILOGIT).2. Refer2nce category is whites and blacks.3. Referaice category is excellent and unknown health stjtus.4. Refermoe category is poverty ratio 0.50 and higher.- Variable dropped for final model.
p<0.05.§ p<0.01.
p<0.00l.

44 Disability and health insurance
TABLE P. Logistic Regression Models of the Likelihood of Hospitalization Among Children Aged 0 to 17: United States, 1989
VariableModel A Model B Model C
Beta x2 Beta X2 Beta x2 x2 1
Intercept -4.155 1463.38 -3.556 52.27 -4.182 70.47Insurance
Insured (Uninsured) 0.099 0.73 0.208 2.99 0.253 4.42 1 3.92 tActivity Limitation
Unable to perform major activity 2.609 168.19 # 2.659 163.30 # 1.843 61.33 # 67.56 #Limited in amount/kind 1.219 71.27 # 1.493 99.45 # 1.023 41.15 # 22.68 #Limited in other activities 1.304 44.06 # 1.468 53.09 # 1.105 28.61 # 22.60 #(Not limited in activity)
AgeAge in years -0.443 251.17 # -0.440 243.31 # 190.04 #Age in years squared 0.023 201.56 # 0.023 193.64 # 169.40 #
GenderBoys (Girls) 0.105 1.61 -
RaceBlack (White) -0.134 1.32 -0.293 6.17 t 4.77 tOther (White) -0.462 2.77 -0.563 4.10 t 4.54 t
Hispanic EthnicityHispanic (Non-Hispanic) -0.004 0.00 -
Family EducationYears of education 0.161 4.58 t 0.171 4.85 t 2.96 tYears of education squared -0.009 8.85 § -0.008 6.44 t 4.15 t
Health Sta tusVery good (Excelic:nt) 0.355 10.62 # 8.43 #Good (Excellent) 0.943 73.57 # 45.46 #Fair (Excellent) 1.463 70.53 # 49.72 #Poor (Excellent) 2.364 65.55 # 45.51 #Unknown (Excellent)
Sample size (for all models) 31,524Goodness of fit Z2 (Hosmer)-Model F 18.76Significance level with 8 degrees of freedom p=0.016
I. Z2 corrected for complex sample design (using RTILOGIT).2. Reference category is excellent and unknown health status.- Variable dropped for final model.t p<0.05.§ p<0.01.
# p<0.001.

Disability and health insurance 45
degree of sampling error. Among children unable toperform their major activity, those without insuranceaverage 10.3 hospitalizations, significantly lower than the82.9 annual rate for those with insurance. Thehospitalization rate for children on Medicaid unable toperform their major activity is very high (106.8 per 100children). Furthermore, the hospitalization rate forchildren in poor health and who have Medicaid is veryhigh. Hospitalization of children can be catastrophicallyexpensive, and some childfen with large hospital billsmay be covered by Medicaid under medica* needyprograms. This may be the reason that thehospitalization rate is very high for children with severedisabilities or poor health.
Regression analysisLogistic regression analysis shows that insurance does
not significantly predict the likelihood of hospitalization(Table P, model A). Age, face, educational attainment offamily head, degree of disability, and health status aresignificant (model, .C). When these variables arecontrolled, insurance emerges as significant at the p<.05level. None of the interaction terms for insurance anddegree of activity limitation is significant. Poverty doesnot predict the rate of hospitalization of children. Inconclusion, uninsurance has at best a weak effect onhospitalization of children, and certainly pales incomparison to the effect of uninsurance among adults.
Reliability of hospitalization statisticsHospital discharge rates and average length of stay
statistics for children and adults on Medicaidapproximate program statistics. It is estimated thatpeople on Medicaid experience 2.4 million dischargesand 21.1 million days of care. Program statistics indicatein 1986 Oiat 3.7 millions discharges and 29.3 million totaldays of care were covered by Medicaid (Ruther et al.,1990). Thus, the NHIS finds a lower rate of discharge,and a higher average length of stay. For Medicare, thereare 1.1 million discharges estimated compared to 1.2million actual, and 10.2 million days estimates comparedto 9.6 actual. Estimated discharges and days for peopleon Medicaid or Medicare are not necessarily those thatare covered by these programs. Also, mortality andinstitutionalization is not accounted for by NHISestimates. The latter is more significant for Medicaidestimates and may account for the lower estimate of daysof care.
3 Disability, Poverty, Employment, and Insurance
Two important factors associated with high risk ofbeing uninsured are unemployment and poverty.However, because the majority of the uninsured areemployed, the employment relationship provides anattractive option' for policy development. The factors of
disability, poverty, and employment are explored moresystematically in the following sections.
3.1 Adults
In Table 9, data on poverty status, employment,disability, an4 insurance coverage are presented foradults. Federal definitions of severe disability (as definedby the Social Security Administration) and of certainneedy groups with low income and resources (as definedby the Department of Health and Human Services) arethe principal eligibility criteria for public insurance.Earlier tables showed rates of private insurance coverage;here, additional information on the source of privatecoverage is provided. The data are arrayed so that therelationships and interrelationships of disability andpoverty with insurance coverage can be examinedsimultaneously. Poverty is defined as total familyincome below 125% of ale federal poverty line.Significance levels Of statistical comparisons by povertystatus are flagged injable 9. -
About 13.8% of adults aged 18 to 64 are poor. Povertyhas substantial negative associations with employmentand with private insurance, and positive associationswith public insurance and with disability. About a thirdof people who need assistance in basic life activities ofself care (ADL) or routine activities (IADL) or who areunable to work are poor. Among people who needassistance in self care, 32.1% are poor, and of them, 13.5%have private coverage, 81.8% have public insurance, and11.3% are uninsured. About 34.4% of people who needassistance in routine activities are poor, and of them,18.7% have private coverage, 68.2% have publicinsurance, and 21.2% are uninsured. And 34.0% ofpeople who are unable to work are poor, and of them,16.4% have private coverage, 63.2% have public coverage,and 24.4% are uninsured.
Source of coveragePoverty also has an impact on the source of private
coverage. Employment-related private insurance may beprovided through a current or previous employer orunion, or through a family member's current or previousemployer or union. About 90.3% of nor poor peoplewho have private insurance receive it from an employeror union;17 for the 9.7% who don't, they obtain privateinsurance through other sources, such as by purchasingindividual plans or group plans offered by professionaland other membership associations. However, about24.9% of poor adults with private insurance obtain theirinsurance from sources other than employers. Thesefractions are relatively constant by age group. Poor
3 ;3
17,This percentage is cakulated by dividing the percentagewith private insurance from an employer by the percentagewith private insurance, multiplied by 100 and subtracting theresult from 100.

46Disabilihj and health insurance
people who are not working or whose employers do notprovide health insurance may be inclined to purchaseinexpensive limited indemnity plans. In 1989, theinsurance industry collected $96.1 billion in grouppremiums and $11.8 billion in individual premiums(Health Insurance Association of America, 1991). Sincemost of the non-poor obtain their coverage fromemployers, it is likely that a disproportionate share ofindividual plans are purchased by people with lowincomes.
A large fraction of employment-based privatecoverage is obtained from relations with other familymembers, usually through a working spouse's or parent'sprivate health plan. Only 64.4% of non-poor adults withemployment-based private insurance have that coveragein their own name, but only 49.0% of poor people. About44.8% of non-poor people aged 18 to 24 with privateinsurance receive it from an employer in their own name,compared to 24.2% of the non-poor--presumably most ofthe latter have insurance from a parent or legal guardian.
The working poorAs discussed earlier, poor adults are approximately
three times as likely to be uninsured as non-poor adults(39.8% vs. 13.1%). Poor adults are much less likely thannon-poor adults to be employed (47.2% versus 79.9%,t=47.2, p<.001). But employment is also less likely toprovide insurance for the poor: 46.6% of the workingpoor have private insurance compared to 86.4% of theworking non-poor (t=40.6, p<.001).
The working poortotaling 9.7 million peoplearemuch more likely to be uninsured than the working non-poor (45.9% versus 12.1%, t=34.5, p<.001), mostly due totheir lower rate of private health insurance. One of theironies of American health and welfare policy is thatmany poor people who do not work at all are entitled toinsurance coverage while many of those who areworking and struggling are not. Many of the workingpoor work part-time or at low-paying jobs.18 Becausethe working poor have earnings, they are also less likelyto be eligible for public insurance than the non-workingpoor. As a result, the working poor are much more likelyto be uninsured than the working non-poor (45.9% versus12.1%) or the poor people not in the labor force (31.6%).Only unemployed people in poverty have a rate ofuninsurance exceeding the working poor (51.0%).
DisabilityAmong poor people who need assistance in self-care
activities, few have private coverage (13.5%). All but28.1% of those with private insurance obtain coveragefrom employers, about the same fraction as for all poorpeople. Non-poor people who need assistance in selfcare activities have a much higher rate of private
18 No data on hours worked are available in the NI 11S core orinsurance supplement.
coverage (61.1%), though few work (13.0%). They have ahigher likelihood of obtaining private insurance fromsources other than employers (21.3%) than non-poorpeople in general (9.7%). This may indicate that someactually do purchase supplemental private insurance.
People needing assistance in self care who are notpoor also are likely to have insurance from previousemployment, and the proportion with employment-based coverage in their own name is about nine times ashigh as those who are poor (26.3% versus 2.6%, t=5.27,p<.001). In fact, the non-poor needing assistance in selfcare are almost twice as likely to have private insuranceobtained from an employer in their own name (23.6%) asthey are to recently have worked. One would conjecturethat most of those who have this coverage have it as abenefit of disability or retirement pensions. Since theyare not poor, they must rely on Medicare. Of those onSSDI, some may continue their previous employment-based coverage under COBRA during the waiting periodfor Medicare. But such coverage can be expensivetheaverage premium paid for employer group coverage in1989 was $145 per month for an individual and $316 for afamily (Health Insurance Association of America, 1991).People with ADL limitations who are poor dependheavily on public insurance (81.8%), predominantlyMedicaid, and 11.3% are uninsured.
Of the few people with ADL limitations who work,the uninsurance rate for those who are poor is 23.3%less than the rate for all poor peopleand 14.6% for thosewho are not poorwhich is about average. For peoplewith ADL limitations who work and are insured, theirinsurance may not be provided by their currentemployer, but instead may be provided through publicinsurance or through a previous employer or a relative'semployer.
Of people who need assistance in routine activities(IADL) and are not poor, 65.5% have private insuranceand about 89.0% of them obtain their insurance from anemployerthe same as for non-poor people in general.Of the 30.0% who work, 12.7% do not have insurance. Ofpeople who need assistance in routine activities (IADL)and are poor, only 9.8% work and 36.7% of those whowork are uninsured.
People who are unable to work, whether poor or not,are about as likely as those with ADL limitations to haveprivate insurance but are less likely to have publicinsurance. In terms of private and public coverage,people unable to work are similar to people with IADLlimitations, but they are less likely than these limited inthe amount or kind of work to have private insuranceand arc more likely to have public insurance. Of thosewho are unable to work and are not poor, about 52.7%with employment-related coverage do not have coveragein their own namehigher than the average for all non-poor people (35.6%). Thus, people who are unable towork and are not poor are more likely than the averagenon-poor person to obtain private insurance from others'
5 4

DisabiliN and health insurance 47
employment-related plans. However, poor people whoare unable to work are about as likely as the average poorperson to obtain private insurance from others'employment-related plans.
Some people who are classified in the NH1S as unableto work reported some recent work activity in the twoweeks prior to the interviewabout 16.5%.19 Amongnon-poor people unable to work, a higher proportionhave employment-related coverage in their own namethan have worked recently (25.5% versus 21.1%),indicating that a substantial fraction are continuingcoverage from a previous employer.
Most people with limitations in the amount or kind ofwork they can do are employed-76.3% of those who arenon-poor and 53.6% of those who are poor. About 44.3%of the latter group are uninsured. These are the workingpoor with disabilitiespeople who have changed jobs orcut back on the amount of time they work because ofchronic impairments or health problems.
Of people with ADL limitations, those who are poorhave a low rate of uninsurance (11.3%), which is notsignificantly different from those who are not poor(12.4%). But of people with less severe disabilitiesthosewith IADL limitations or those unable to workthosewho are poor are twice as likely as those who are notpoor to be uninsured. Around 40% of poor people withmoderate to minor disabilitiesthose who are limited inamount or kind of work or are limited in activities otherthan workor who are not limited in activity areuninsured: about three times the rate of similarlydisabled people who are not poor. Thus, only poor
19 The category "unable to work" is based on the question"Does any impairment or health problem NOW keep personfrom working at a job or business'?" The two-weekemployment question is "During those two weeks, did personwork at any time at a job or business not counting work aroundthe house? (Include unpaid work in the family farm orbusiness)." A "yes" respoonse to the first question does notnecessarily mean the individual is incapable of working at anyjob. The second question, however, is ambiguous as te thenature of employmentthe individual could be engaged part-time in supported employment or in a full-time job earninghigh salary, or have just worked a day or two without having asteady job. These questions leave unresolved a number ofissues about "inability to work" and the nature ot work.Among laeople who worked during the two weeks, those whoreported they are kept from working at a job are more likely tobe poor than those limited in amount or kind of work they cando (17.6% versus 13.3%, t=2.18, p<.05). And the pattern ofinsurance coverage also differs somewhat between these twogroups. This argues against reclassifying those "unable towork" who are working to the category limited in the amountor kind of work." In short, the "unable to work" question mayor may not address the concept of being unable to work at anyjob or business and further analysis is required to determinewhether people who report some work activity in the past twoweeks are in fact misclassified. This is a task that requiresadditioe.al information about the nature of their employment(sheltc red or not, self-employment, home employment,earnings, etc.) that is not currently available from the NHIS coreor insurance supplement. The strength of some earliercomparisons of people "unable to work" with other groupsmay be diluted if those who report some work activity duringthe two weeks are in fact missclassified as "unabh. to work."
peopie with the most severe disabilities have a relativelylow rate of uninsurance; poor people with less severedisabilities, like the poor in general, have high rates ofuninsurance.
Gender and disabilityOf non-poor people who need assistance in basic life
activities, men are more likely than women to havepublic coverage (for ADL, 65.5% versus 50.4%, t=2.22,p<.05; for IADL, 55.8% versus 33.0%, t=6.03, p<.001),mostly Medicare. Among the poor, men and women areabout as likely to receive public insurance (for ADL.85.6% versus 79.0%; for IADL, 72.9% versus 65.7%),mostly Medicaid. The penetration of public insurance forpoor men with ADL limitations is the highest of anygroup studied: only 3.0% of this group is uninsured. Ofpoor women with ADL limitations, 17.4% are uninsured,significantly higher than the 3.0% of men (t=2.65, p<.01).
Of people unable to work, non-poor men are morelikely to have public coverage than non-poor women(46.1% versus 31.7%, t=6.36). However, among the poor,there is no difference by gender (63.4% and 63.1%). Ofpoor people with less severe disabilities (limitation inactivities other than work) or no disabilities, women aremuch more likely to have public coverage than men. Forexample, of those limited in amount or kind of work,22.0% of poor men have public coverage, compared to33.8% of poor women (t=2.60, p<.05). About 50% of menwho are poor and have less severe disabilities or nodisabilities are uninsured, compared to about a third ofwomen. Of the working poor with less severedisabilities, roughly half of men are uninsured, and about40% of women.
Table 9 can be used to provide estimates of how the25.2 million adults who are uninsured would be affectedby certain policy options including mandating employerhealth coverage and expanding public insurance. If allpeople who work were provided insurance, the rate ofuninsurance among non-poor persons could be reducedto 3.4%; among the poor the uninsurance rate would be18.1%. These are abstract targets, since not all employerswould be expected to insure their workers directly,particularly small businesses. Nevertheless, if allworkers were covered by insurance, this would cover12.5 million non-poor and 4.5 million poor people whowork and are uninsured. The remaining uninsuredwould be those who are unemployed or out of the laborforce. Of the unemployed uninsured, about 1.1 millionare not poor and 0.8 million are poor. People uninsuredand not in the labor force could be addressed throughsome form of public insurance expansion.Approximately 6.3 million people are out of the laborforce and uninsured-3.3 million non-poor and 3.0million poor.

48Disability and health insurance
3.2 ChildreaAbout 25.5% of children are poor (Table 10), and those
in poverty are three times as likely as those not inpoverty to be uninsured (32.7% vs. 10.0%). Significancelevels of non-poor and poor comparisons are flagged inTable 10. As with adults, children who are poor andhave private insurance are twice as likely to obtaininsurance from sources other than employers (18.2%versus 9.3%).
About 39.7% of children in poverty have publiccoverage compared to 5.3% of children who are not poor.Of children aged 5 to 17 who need assistance in self care,36.9% are in poverty, and of them, 80.6% have publiccoverage and 11.6% are uninsured. Of those not poor,32.1% have public coverage and 8.6% are uninsured.About a third of children limited in major activity arepoor, and a quarter of them are uninsured, twice the rateof uninsurance among non-poor children with activitylimitation. Severely disabled poor children are less likelyto be uninsured than other poor children.
Children whose health is good, fair, or poor are morelikely to be poor (42.6%, 48.0%, and 61.4% respectively)and like all children in poverty, about a third of them areuninsured. No differences are found for boys comparedto girls.
Of the 10.1 million children who are uninsured, 4.8million are not poor and 5.3 million are poor. Thenumber of poor children who are uninsured has beenreduced by recent expansions of Medicaid, throughwhich coverage is provided for all infants less than 1 yearold and all children under age 19 (born after September30, 1983) whose family income is below 100% of thepoverty level.
CONCLUSIONS
Some 4.1 million Americans with disabilities have nohealth insurance, public or private, out of a totaluninsured population of 35.3 million adults and children.People with disabilities who lack insurance utilize healthservices significantly less frequently than similarlydisabled people with insurance, even when health statusand sociodemographic factors are controlled statistically.Depending on the degree of disability, adults withoutinsurance have from 19% to 44% fewer physician contactsand from 29% to 65% fewer hospitalizations than thosewith insurance. Children with disabilities have 34%fewer physician contacts if uninsured and a lower rate ofhospitalization, though the effect of uninsurance onhospitalization is weaker than for adults.
Health care reform should guarantee that all peoplewith disabilities have insurance. People with disabilitiesare in worse health in general and are at great risk ofneeding immediate and sustained health services. Whenthey lack insurance, they may not be able to obtain thecare they need, potentially increasing the risk of
worsening health and secondary conditions that mighthave been prevented (Marge, 1988; Pope & Tarlov, 1991).
People are uninsured when they have no privateinsurance and are ineligible for, or fail to avail themselvesof, programs that provide public insurance coverage.Uninsurance is not a problem for those of high economicstatus: only 5.3% of people in families with incomes of$50,000 or more are uninsured. Among adults, privateinsurance is associated with age, being female, beingwhite, being non-Hispanic, education, marriage, goodhealth, affluence, work, and absence of disability. Publicinsurance is correlated with being black or races etherthan white, low education, being unmarried, poor health,poverty, not working, and disability. Among children,private insurance is correlated with affluence, goodhealth, and absence of disability and public insurance isassociated with poverty, poor health, and disability. Thisgeneral pattern suggests that public programscompensate for problems in accessing private insurance.However, public programs do not always compensatewell for reduced access to private insurance, even forpeople in poverty or with disabilities, the two majortarget populations for public programs.
Public insurance is not targeted to all groups that lackaccess to private insurance, and therefore uninsuranceremains a problem. Access to private insurance is greaterfor some populations, depending on factors such asoccupation, industry, and firm size. Spousal benefitsconfer advantage to married individuals and theirdependents. Medicare and Medicaid compensate for lackof access to private insurance, but only for certain peoplewith disabilities and certain groups of poor people. Thisresults in a very uneven patchwork of insurancecoverage.
The fraction of people covered by private insurancedeclines steeply as the severity of disability is greater. Atthe same time, coverage under Medicare and Medicaidincreases, lowering the rate of uninsurance of peopleneeding assistance in basic life activities (ADL or IADL)to slightly below the average for all people. People withmoderate disabilities (who do not need assistance in basiclife activities but are unable to work or are limited in theamount or kind of work they can do) are in fact morelikely than people with severe disabilities or peoplewithout disabilities to be uninsured.
The group with the lowest rate of uninsurance (3.0%)is poor men needing assistance in self care who have thehighest rate of public coverage (85.6%) of any population.Among non-poor men needing assistance in self care,65.5% have public insurance and 10.7% are uninsured.
Access to public insurance is difficult for poor menwith moderate disabilities. Of men who are poor andlimited in the amount or kind of work they can do, 22.0%receive public insurance and half are uninsured, whereas33.8% of women in this category have public insurance,and 36.9% are uninsured. Almost a quarter of poorchildren with disabilities are uninsured.

Disability and health insurance 49
While some people with disabilities go without anyinsurance, many profit by supplementing publiccoverage with private insurance. Private coverage maydefray Medicare deductibles and coinsurance payments,and to pay for non-covered services (U. S. CongressionalBudget Office, 1991). In the present study, about 40% ofnonelderly Medicare beneficiaries are estimated to haveprivate insurance, a finding supported by other research(Muller, 1989; Rubin & Wilcox-Gok, 1991). Fornonelderly people with disabilities on Medicare, privateinsurance may cover Medicare deductibles, copayments,and non-covered services.20 Copayments underMedicare are not limited and enrollees are at risk of highout-of-pocket expenses.
Though there is a market for supplemental Medicarecoverage (Medigap plans) among the elderly, such plansare not widely available for nonelderly Medicarebeneficiaries. Private insurers have little incentive todesign plans to supplement Medicare for nonelderlyMedicare beneficiariesall of whom have pre-existinghealth conditions and impairments and may have highneeds for pharmaceuticals and other services not coveredby Medicare. Therefore, nonelderly Medicarebeneficiaries who have employment-based privateinsurance probably obtain it through a spouse's plan,their own previous employment,21 or their own currentemployment. Since the premiums of employment-basedinsurance are heavily subsidized by employers, it may becost-effective for many Medicare beneficiaries to haveprivate coverage through a spouse.
In 1986, legislation established Medicare as thesecondary payer to employment-based health insurancefor employers with at least 100 employees. Savings areestimated to be $500 million in 1989 (U.S. GeneralAccounting Office, 1991), and more could be recovered(U.S. General Accounting Office, 1992). In 1989,Medicare payments for people with disabilitiesamounted to $10.4 billion (Social SecurityAdministration, 1990, Table 7.B2). The federalgovernment has also begun to shift costs from Medicaidand CHAMP-US to large employer group insuranceplans. These efforts however only cover large employers.About two-thirds of workers work for employers withfewer than 100 employees.
20 In 1989, the Medicare hospital deductible was $560. Becausethe deductible is for each spell of illness, it may be incurredmore than once in a year. Due to catastrophic coverage being ineffect in 1989, there wi no co-payment for hospital days. Thephysician deductible was $75 and the co-payment was 20% ofphysician services. A 20% co-payment is also required fordurable medical equipment. Given the high annual rates ofhospitalization (39.4 per 100 persons) and annual physiciancontacts (13.6 per person) for Iviedicare beneficiaries, outlivs forMedicare beneficiaries may be substantial. Also, privateinsurance may cover services not covered by Medicare,including pharmaceuticals and long-term home health services.21 COBRA terminates upon Medicare cnrollment, so anyindividuals who have private insurance through a previousemployer must have it as a benefit of retirement or disability.
Money saved through such cost-shifting could beapplied to extend public coverage to people with severedisabilities who are uninsured. It is ironic that of peoplewith very severe disabilities who need assistance in selfcare, 12.1% go without any insurance, while half of the35.8% with Medicare also have private coverage.
People with severe disabilities who are uninsured areof particular concern. The 1.4 million adults who areunable to work and are uninsured are a substantialpopulation that may be at great risk of adverse healthconsequences. Their access to health services issignificantly restricted compared to those who are unableto work and who have insurance. Half of them are poor.It is possible that the reduced access that uninsuredpeople with severe disabilities experience could impacttheir survival. People with severe disabilities who areuninsured are an unfortunate example of how theAmerican health care system fails to deliver protectionfor those who most need acute health services.
r -

50 Disability and health insurance
REFERENCESAdams, P. F., & Benson, V. (1990). Current Estimates
from the National Health Interview Survey, 1989. Vitaland Health Statistics, 10(176), 1-121.
Bunker, J. P., Gomby, D. S., & Kehrer, B. H. (Ed.).(1989). Pathways to Health. Menlo Park, California: TheHenry J. Kaiser Foundation.
Davis, K., & Rowland, D. (1983). Uninsured andunderserved: Inequities in health care in the UnitedStates. Milbank Memorial Fund Quarterly: Health andSociety, 6E2), 149-176.
Health Insurance Association of America (1991).Source Book of Health Insurance Data. Washington, DC:Health Insurance Association of America.
Himmelstein, D. U., Woolhandler, S., & Wolfe, S. M.(1992). The vanishing health care safety net: new data onuninsured Americans. International Tournal of HealthServices, 22(3), 381-96.
Hosmer, D. W., & Lemeshow, S. (1989). AppliedLogistic Regression. Toronto: John Wiley & Sons.
LaPlante, M. P. (1991a). Estimating variances forhealth and disability domains in the National healthInterview Survey. Proceedings of the Section on SurveyResearch Methods of the American StatisticalAssociation 684-689.
LaPlante, M. P. (1991b). NHIS 1989 InsuranceSupplement-2nd Memorandum. University ofCalifornia, San Francisco: Institute for Health & Aging,Disability Statistics Program.
Levine, D. B., Zitter, M., & Ingram, L. (Ed.). (1990).Disability Statistics: An Assessment. Washington, DC:National Academy Press.
Marge, M. (1988). Health promotion for persons withdisabilities: Moving beyond rehabilitation. AmericanJournal of Health Promotion, 2(4), 29-44.
Martini, A. (1990). A Labor Force Profile of Personswith Disabilities. (Report prepared for the AssistantSecretary for Planning and Evaluation, DHHS underContract No. HHS-88-0047). Washington, DC:Mathematica Policy Research.
Mathematica Policy Research (1989). PopulationProfile of Disability. Washington, DC: AssistantSecretary for Planning and Evaluation, Department ofHealth and Human Services.
Monheit, A. C., Hagan, M. M., Berk, M. L., & Farley, P.J. (1985). The employed uninsured and the role of publicpolicy. Inquiry, a 348-364.
Muller, L. S. (1989). Health insurance coverage amongrecently entitled disability insurance beneficiaries:Findings from the new beneficiary survey. SocialSecurity Bulletin, 52(11), 2-17.
National Center for Health Statistics (1990). Public UseData Tape Documentation, Part II-FieldRepresentative's Manual, HIS-100, National HealthInterview Survey, 1989. Hyattsville, MD: NationalCenter for Health Statistics.
Newacheck, P. W., McManus, M. A., & Gephart, J.(1992). Health insurance coverage of adolescents: acurrent profile and assessment of trends. Pediatrics,90(4), 589-96.
Office of Health Policy, & U.S. Department of Healthand Human Services (1987). Insuring Catastrophic Illnessfor the General Population.
Parsons, P. E. (1991). Identification of "dummy"records on the 1989 NHIS Health Insurance Public UseData Tape. National Center for Health Statistics, Divisionof Health Interview Statistics.
Pope, A., & Tarlov, A. (Ed.). (1991). Disability inAmerica: Toward a National Agenda for Prevention.Washington, D.C.: National Academy Press.
Rice, D. P., & LaPlante, M. P. (1992). Medicalexpenditures for disability and disabling comorbidity.American Journal of Public Health, 2(5), 739-41.
Ries, P. (1991, June). Characteristics of Persons Withand Without Health Care Coverage: United States, 1989.Advance Data from Vital and Health Statistics (201).Hyattsville, Maryland: National Center for HealthStatistics.
Ries, P., & Brown, S. (1991, May). Disability andHealth Characteristics of Persons by Limitation ofActivity and Assessed Health Status: United States, 1984-88. Advance Data from Vital and Health Statistics (197).Hyattsville, Maryland: National Center for HealthStatistics.
Rubin, J. I., & Wilcox-Gok, V. (1991). Health insurancecoverage among disabled Medicare enrollees. HealthCare Financing Review, 12(4).
Ruther, M., Reilly, T. W., Silverman, H. A., & Abbott,D. B. (1990). Health Care Financing Program Statistics:Medicare and Medicaid Data Book, 1990. Baltimore:Health Care Financing Administration, Office ofResearch and Demonstrations.
Scott, C. G. (1992). Disabled SSI recipients who work.Social Security Bulletin, 55(1), 26-36.
Short, K. (1992, May). Health Insurance Coverage:1987-1990 (Selected data from the Survey of Income andProgram Participation). Current Population Reports,Series P-70 (29). Washington, D.C.: U.S. Bureau of theCensus.
Short, P. F., Monheit, A. C., & Beauregard, K. (1989). AProfile of Uninsured Americans. National MedicalExpenditure Survey Research Findings I (DHHS Pub.No. PHS 89-3443). Rockville, Maryland: Public HealthService, Agency for Health Care Policy and Research.
Social Security Administration (1987). Characteristicsof Social Security Disability Insurance Beneficiaries. U.S.Government Printing Office.
Social Security Administration (1990). AnnualStatistical Supplement, 1990. Social Security Bulletin,5_2(Supp).
Social Security Administration (1991). AnnualStatistical Supplement, 1991. Social Security Bulletin,54(Supp).

Disability and health insurance 51
Systemetrics/McGraw-Hill (1990). Task II: FederalPrograms for Persons with Disabilities. Washington, DC:Department of Health and Human Services, AssistantSecretary for Planning and Evaluation.
U. S. Congressional Budget Office (1991).Restructuring Health Insurance for Medicare Enrollees.Washington, DC: U.S. Congressional Budget Office.
U.S. Bureau of the Census (1991a). Poverty in theUnited States: 1988 and 1989. Current PopulationReports Series P-60 (No. 171). Washington, D.C.: U.S.Bureau of the Census.
U.S. Bureau of the Census (1991b). Poverty in theUnited States: 1990. Current Population Reports SeriesP-60 (No. 175). Washington, D.C.: U.S. Bureau of theCensus.
U.S. Bureau of the Census (1991c). Statistical Abstractof the United States, 1991 (111 ed.). Washington, DC: U.S.Government Printing Office.
U.S. Bureau of the Census (1992). Poverty in theUnited States: 1991. Current Population Reports SeriesP-60 (No. 181). Washington, D.C.: U.S. Bureau of theCensus.
U.S. Congress, & Congressional Budget Office (1988).Reforming the Military Health Care System.Washington, DC: U.S. Government Printing Office.
U.S. General Accounting Office (1989). VA HealthCare: Veterans' Demand for Outpatient Care.(GAO/HRD-89-70). Washington, D.C.: U.S. GeneralAccounting Office.
U.S. General Accounting Office (1991). Medicare:Millions in Disabled Beneficiary Expenditures Shifted toEmployers. (GAO/HRD-91-24). Washington, D.C.: U.S.General Accounting Office, Human Resources Division.
U.S. General Accounting Office (1992). Medicare:Over $1 Billion Should be Recovered from PrimaryHealth Insurers. (GAO/HRD-92-52). Washington, DC:U.S. General Accounting Office.
U.S. House of Representatives, & Committee on Waysand Means (1992). 1992 Green Book. Washington, DC:U.S. G.P.O.
Verbrugge, L. M. (1990). The Iceberg of Disability. In S.M. Stahl (Eds.), The Legacy of Longevity (pp. 55-75).Newbury Park, Pennsylvania: Sage Publications.
Wolter, K. M. (1985). Introduction to VarianceEstimation. New 'iork: Springer-Verlag.

52 Disability and health insurance
DETAILED TABLES
TABLE 1. Type of Health Insurance Coverage Among Adults Aged 18 to 64, bySociodemographic Characteristics, by Gender: United States, 1989 53
TABLE 2. Type of Health Insurance Coverage Among Adults Aged 18 to 64, by Disabilityand Health Status, by Gender: United States, 1989 61
TABLE 3. Type of Health Insurance Coverage Among Children Aged 0 to 17, bySociodemographic Status, by Gender: Unit:4 States, 1989 66
TABLE 4. Type of Health Insurance Coverage Among Children Aged 0 to 17, byDisability and Health Status, by Gender: United States, 1989 69
TABLE 5. Number of Physician Contacts Per Person Per Year Among Adults Aged 18 to64, by Type of Health Insurance Coverage, Disability and Health Status, byGender : United States, 1989 73
TABLE 6. Number of Physician Contacts Per Person Per Year Among Children Aged 0 to17, by Type of Health Insurance Coverage, Disability and Health Status, byGender: United States, 1989 76
TABLE 7. Hospital Discharges Per 100 Persons Per Year and Average Length of Stay PerDischarge Among Adults Aged 18 to 64, by Type of Health InsuranceCoverage, Disability and Health Status, by Gender: United States, 1989 79
TABLE 8. Hospital Discharges Per 100 Persons and Average Length of Stay Per DischargePer Year Among Children Aged 0-17, by Type of Health Insurance Coverage,Disability and Health Status, by Gender: United States, 1989 82
TABLE 9. Source of Health Insurance Coverage Among Adults Aged 18 to 64, byDisability, Health Status, Employment and Poverty, by Gender: United States,1989 85
TABLE 10. Source of Health Insurance Coverage Among Children Aged 0 to 17, byDisability, Health Status, Employment and Poverty, by Gender: United States,1989 88
( t)

TA
BL
E I
. Typ
e of
Hea
lth I
nsur
ance
Cov
erag
e A
mon
g A
dults
Age
d 18
to 6
4, b
y So
ciod
emog
raph
ic C
hara
cter
istic
s, b
y G
ende
r: U
nite
d St
ates
, 198
9
Popu
latio
n(1
,000
s)Sa
mpl
eSi
ze
With
Priv
ate
(%)
With
1Pr
ivat
eO
nly
(%)
Priv
ate
insu
ranc
e an
dM
edic
are
and/
or M
edic
aid
Mili
tary
Und
efin
ed'
Plan
sN
otO
nly
Insu
red
(%)
(%)
Med
i-1
care
Onl
y(%
)
Med
i-1
Med
icar
e &
1ca
idM
edic
aid
Onl
yO
nly
(%)
(%)
With
Eith
er(%
)
Med
i-1
care
Onl
y(%
)
Med
i-1
Med
icar
e &
ica
idM
edic
aid
Onl
yO
nly
(%)
(%)
With
Mili
tary
Mili
tary
Onl
y(%
)(%
)
Mili
tary
&Pr
ivat
eO
nly
(%)
Tot
al15
0,30
968
,211
77.2
74.7
0.7
0.3
0.1
5.8
0.6
330.
42.
51.
11.
30.
416
.7A
ge 18-2
4 ye
ars
25,4
0111
,013
63.9
62.7
0.1
0.5
0.0
630.
1 *
5.3
0.1
2.0
1.5
0.5
0.7
28.3
25-4
4 ye
ars
78,7
9435
,589
78.5
77.2
020.
30.
14.
70.
33.
50.
31.
50.
80.
70.
016
.345
-64
year
s46
,114
21,6
0982
.277
.01.
80.
302
721.
32.
60.
84.
51.
52.
70.
411
.1R
ace W
hite
127,
549
56,5
0179
.877
.30.
70.
30.
14.
60.
52.
50.
32.
51.
01.
30.
315
.5B
lack
17,4
779,
480
60.8
58.2
0.7
0.8
0.1
*14
.112
10.1
0.9
2.6
1.4
0.9
1.0
243
Oth
er5,
283
2,23
068
.065
.502
"03
0.0
7.0
026.
00.
23.
51.
61.
91.
422
.7E
thni
city
His
pani
c12
,118
5,32
653
.952
.20.
40.
50.
19.
80.
67.
40.
71.
91.
00.
80.
735
.5N
on-H
ispa
nic
138,
191
62,8
8579
.276
.70.
703
0.1
5.4
0.6
320.
42.
61.
11.
30.
415
.1E
duca
tion
Les
s th
an 1
2 ye
ars
27,1
8112
,676
54.0
50.7
1.5
0.7
0216
21.
710
.41.
42.
00.
90.
80.
530
.812
yea
rs59
,345
27,0
2177
.174
.60.
70.
40.
15.
10.
43.
10.
22.
71.
31.
30.
517
3So
me
colle
ge32
,511
14,5
3583
.581
303
0.2
0.1
2302
1.4
0.2
3.1
1.3
1.7
0.4
12.9
Col
lege
gra
duat
e30
,583
13,6
4991
.889
.90.
50.
00.
01.
10.
20.
30.
02.
10.
713
0.2
6.8
Unk
now
n68
933
049
.843
.90.
9 *
3.1
1.6
20.9
32 *
8.1
3.9
1.2
*0.
90.
303
33.8
Age
& E
duca
tion
18-2
4 ye
ars
&L
ess
than
12
year
s5,
333
2,37
841
.940
.60.
10.
90.
114
.60.
312
.80.
4 °
1.3
1.1
0.3
0.8
42.8
12 y
ears
10,8
974,
746
61.4
60.3
0.1
0.6
0.0
6.1
0.1
"5.
10.
12.
31.
80.
40.
930
.6So
me
.)ol
lege
7,26
93,
092
783
77.6
0.1
0.1
0.0
1.9
0.0
150.
12.
21.
50.
60.
617
.8C
olle
ge g
radu
ate
1,81
975
785
.284
.10.
40.
0 t
0.0
t0.
40.
0 t
0.1
0.0
t1.
40.
70.
70.
313
.8U
nkno
wn
8340
53.8
38.0
2.4
8.4
4.9
27.7
0.0
t92
2.8
0.0
t0.
0 t
0.0
t0.
0 t
343
25-4
4 ye
ars
&L
ess
than
12
year
s10
,307
4,72
348
.647
.00.
50.
60.
2 *
16.0
0.8
12.6
1.2
1.0
0.5
0.3
40.
335
.812
yea
rs30
,151
13,7
5577
.175
.703
0.4
0.1
4.8
0333
0.2
1.6
0.9
0.7
0.4
17.7
Som
e co
llege
17,9
618,
058
83.8
82.3
0.1
0.2
0.0
2302
1.6
0.1
2.2
1.0
1.1
0312
.9C
olle
ge g
radu
ate
20,0
328,
892
91.9
90.9
020.
00.
00.
70.
103
0.0
1.2
0.5
0.6
0.2
7.0
Unk
now
n34
416
148
.741
.80.
742
2.0
23.1
2.9
"10
.23.
20.
0 t
0.0
t0.
0 t
0.5
34.5
45-6
4 ye
ars
Les
s th
an 1
2 ye
ars
11,5
425,
575
64.4
58.8
3.0
0.6
0317
.13.
17.
42.
13.
21.
21.
50.
620
.812
yea
rs18
,296
8,52
086
.481
21.
703
0.1
"4.
90.
813
0.4
4.8
1.6
2.9
0.4
8.9
Som
e co
llege
7,28
13,
385
88.0
82.2
1.0
0302
3405
0.9
036.
31.
94.
10.
4 *
8.0
Col
lege
gra
dua
te8,
733
4,00
093
.088
.81.
10.
10.
022
0.4
030.
043
1.2
2.9
0.1
4.8
Unk
now
n26
312
949
.948
.40.
80.
0 t
0.0
t15
.74.
85.
15.
13.
1 *
2.3
0.7
0.0
t32
.8M
arita
l Sta
tus
Mar
ried
98,7
5244
,703
83.6
80.9
0.8
020.
133
0.4
1.6
0.1
3.0
1.2
1.6
0.3
12.6
Wid
owed
3,31
01,
607
66.4
61.1
2.6
0.7
0.1
14.7
3.1
631.
64.
42.
21.
80.
419
.7D
ivor
ced
11,5
115,
366
66.2
63.8
0.6
0.6
0.1
*11
.412
7.5
1.1
2.6
1.1
1.1
0.7
21.9
Sepa
rate
d3,
599
1,76
651
.749
.10.
61.
10.
122
.00.
918
.01.
22.
31.
40.
80.
726
.0N
ever
mar
ried
32,9
3714
,675
65.7
64.0
0.4
0.7
0283
055.
80.
81.
00.
50.
40.
625
.9U
nkno
wn
199
9466
.861
.81.
4 '
1.0
0.6
8.8
0.9
3.9
1.1
"2.
0 *
0.0
t2.
0 *
0.0
t27
3
r 1
(11

TA
BL
E 1
. Typ
e of
Hea
lth I
nsur
ance
Cov
erag
e A
mon
g A
dults
Age
d 18
to 6
4, b
y So
ciod
emog
raph
ic C
hara
cter
istic
s, b
y G
ende
n U
nite
d St
ates
,198
9
Popu
latio
n(1
,000
s)Sa
mpl
eSi
ze
With
Priv
ate
(%)
With
'Pr
ivat
eO
nly
(%)
Priv
ate
insu
ranc
e an
dM
edic
are
and/
or M
edic
aid
Mili
tary
Und
efin
ed '
Plan
sN
otO
nly
Insu
red
(%)
(%)
Med
i- '
care
Onl
y(%
)
Med
i- '
Med
icar
e &
Ica
idM
edic
aid
Onl
yO
nly
(%)
(%)
With
Eith
er(%
)
Med
i- '
care
Onl
y(%
)
Med
i-1
Med
icar
e &
'ca
idM
edic
aid
Onl
yO
nly
(%)
(%)
With
Mili
tary
Mili
tary
Onl
y(%
)(%
)
Mili
tary
&Pr
ivat
eO
nly
(%)
Em
ploy
men
t Sta
tus
Cur
rent
ly e
mpl
oyed
113,
327
50,9
4483
.081
.30.
20.
20.
013
0.1
0.8
0.0
2.1
0.8
1.3
0.3
15.1
Une
mpl
oyed
4,64
12,
139
47.4
45.7
0.0
0.6
0.1
10.9
02 *
9.6
0.3
3.0
2.0
1.0
0.5
39.9
Not
in la
bor
forc
e32
,341
15,1
2861
.155
.62.
61.
003
20.8
2.3
12.3
1.7
4.1
2.1
1.4
0.8
19.3
Em
ploy
men
t Sta
tus
dc A
geC
urre
ntly
em
ploy
ed S
t18
-24
year
s17
,646
7,53
769
368
30.
102
0.0
1.7
0.1
130.
01.
71.
30.
40.
627
.525
-4.4
yea
rs64
,285
28,7
7484
.082
.90.
10.
20.
013
0.1
0.9
0.0
1.3
0.5
0.8
0.2
143
45-6
4 ye
ars
31,3
9614
433
88.6
85_3
030.
10.
01.
00.
103
0.1
3.9
1.0
2.8
0.3
9.6
Une
mpl
oyed
&18
-24
year
s1,
384
617
41.8
40.5
0.0
t1.
10.
0 t
122
0310
30.
2 "
1.6
*1.
20.
20.
845
.125
-44
year
s2,
400
1,10
944
.643
30.
00.
60.
112
.30.
111
20.
22.
62.
00.
60.
441
.445
-64
year
s85
841
364
.460
.80.
0 t
0.0
t03
5.1
02 *
3.9
0.7
6.4
3.0
3.3
0.4
273
Not
in la
bor
forc
e &
18-2
4 ye
ars
6,37
12,
859
53.7
51.5
0.2
*12
0.1
17.8
0215
.503
2.9
2.1
0.7
1.1
26.8
25-4
4 ye
ars
12,1
095,
706
56.1
53.6
0.8
1.1
0321
.415
15.8
1.6
2.6
1.9
0.3
0.7
22.0
45-6
4 ye
ars
13,8
606,
563
68.8
59.3
530.
80.
521
.64.
07.
72.
35.
92.
32.
60.
713
5Fa
mily
Inc
ome
Und
er 5
5,00
05,
743
2,66
836
.033
.805
"1.
002
28.8
1.0
23.4
2.3
L9
1.1
0.5
"0.
934
.9S5
,000
-$6,
999
3,68
91,
717
29.6
27.0
0.8
1.4
0.1
31.9
3.4
23.4
2.6
1.9
1.4
0.3
1.3
38.1
57,0
00-5
9,99
95,
095
2,50
431
.228
31.
11.
20.
1 *
28.1
2320
.62.
12.
21.
50.
30.
741
.051
0,00
0-51
4,99
912
,298
5,74
348
.745
.91.
60.
702
12.6
1.4
7.6
0.9
2.2
1.7
0.3
0.9
383
515,
000-
519,
999
16,3
177,
508
65.2
62.5
1.3
0.6
026.
80.
93.
20.
52.
31.
60.
60.
628
.0$2
0,00
0-52
4,99
911
,937
5,39
578
.475
.80.
90.
40.
13.
90.
51.
70.
2 "
3.1
1.7
1.2
0.4
17.0
525,
000-
534,
999
30,1
4413
,504
85.1
82.4
0.7
0.2
0.1
230.
30.
70.
12.
81.
01.
70.
412
3$3
5,00
0-S4
9,99
933
,464
15,0
5389
.787
.403
0.1
*0.
11.
10.
10.
30.
12.
60.
81.
70.
18.
8S5
0,00
0 or
mor
e31
,653
14,1
1993
.691
.40.
40.
10.
00.
70.
10.
10.
02.
40.
61.
80.
25.
3Po
vert
y L
evel
Und
er 0
.50
5,11
22,
397
29.5
27.3
0.4
1.3
0.0
32.6
0.8
29.0
0.8
1.5
0.8
0.4
1.0
37.9
0.50
to u
nder
1.0
09,
543
4,56
231
329
.40.
61.
00.
228
.22.
121
.52.
61.
61.
20.
21.
040
.11.
00 to
und
er 1
.25
6,06
32,
877
45.6
43.4
0.8
0.8
0.2
13.4
1.6
8.4
1.4
1.9
1.4
0.4
0.6
40.8
1.25
to u
nder
1.5
06,
945
3,27
655
.653
.50.
80.
70.
110
.21.
65.
61.
02.
71.
90.
40.
733
.21.
50 to
und
er 1
.75
10,7
124,
973
70_3
67.6
0.9
0.6
0.2
5.5
0.7
2.5
0.4
2.7
1.7
0.9
0.4
23.8
1.75
to u
nder
2.0
017
,583
8,00
179
.777
.70.
703
0.1
3.2
0_5
1.2
0.3
2.0
1.1
0.9
0.5
16.6
2.00
and
abo
ve94
,352
42,1
2588
385
.60.
70.
20.
11.
70.
30.
40.
12.
81.
01.
70.
39.
7Po
vert
y L
evel
and
Age
18-2
4 ye
ars
&U
nder
0.5
02,
118
937
47.7
46.3
0.2
0.4
0.0
t19
.10.
0 t
183
0.1
1.9
1.1
°0.
7 *
1.3
31.5
)03
0 to
und
a 1.
002,
780
1,24
839
.939
.00.
10.
50.
0 t
17.5
0.4
163
0.2
1.6
1.3
0.3
1.4
40.5
)1.
00 to
und
er 1
.25
1,52
869
339
.238
.50.
0 t
0.5
0.0
t11
.20.
210
.10.
32.
21.
90.
10.
0 t
48.2
1.25
to u
nder
1.5
01,
506
683
50.0
49.0
0.1
0.7
0.2
8.7
0.0
t7.
30.
52.
32.
20.
1 '
0.9
39.1
1.50
to u
ndo-
1.7
52,
079
926
54.2
52.5
0.2
1.2
0.1
*5,
80.
63.
60.
22.
72.
50.
20.
638
.41.
75 to
und
er 2
.00
3,45
21,
506
69.0
68.1
0.1
0.3
0.0
2.8
0.1
2.0
0.2
2.1
1.5
0.5
0.9
26.2
2 00
and
abo
ve11
,938
5,02
077
.476
.20.
20.
40.
01.
60.
00.
g0.
11.
81.
10.
50.
519
.8
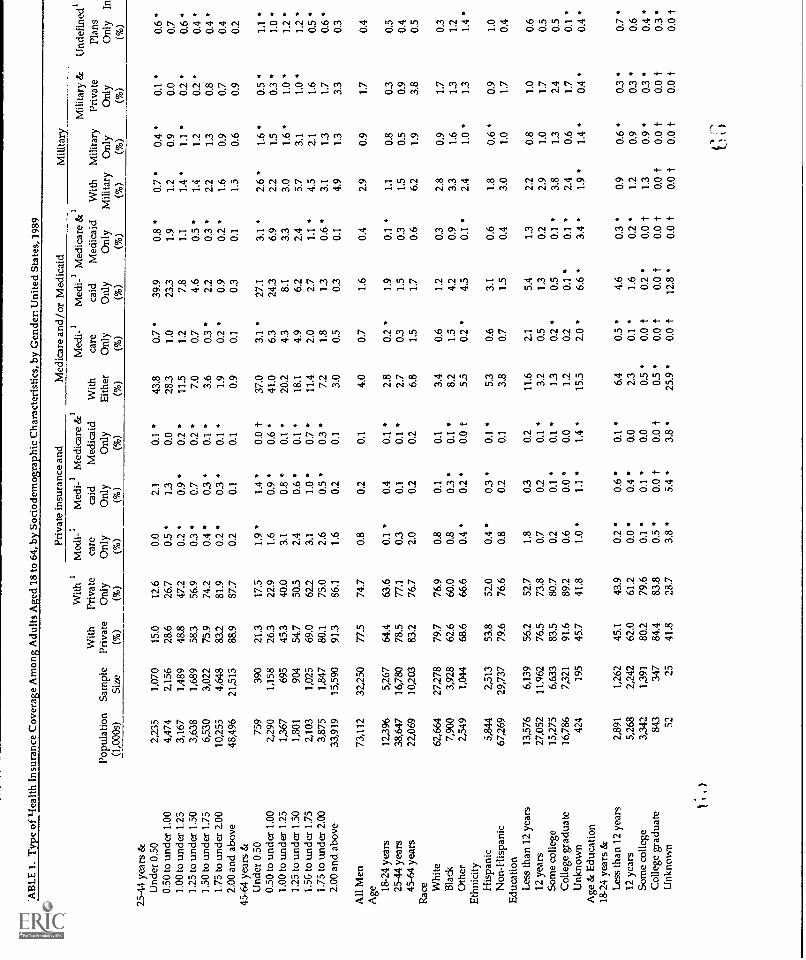
TA
BL
E 1
. Typ
e of
Ule
alth
Ins
uran
ce C
over
age
Am
ong
Adu
lts A
ged
18 to
64,
by
Soci
odem
ogra
phic
Cha
ract
eris
tics,
by
Gen
der:
Uni
ted
Stat
es, 1
989
25-4
4 ye
ars
&
Popu
la li
on(1
,000
s)Sa
mpl
eSi
ze
With
Priv
a te
(%)
With
1
Priv
a te
Onl
y(%
)
Priv
a te
insu
ranc
e an
dM
edic
are
and/
or M
edic
aid
Mili
tary
With
Mili
tary
Mili
tary
Onl
y(%
)(%
)
Mili
tary
&
Priv
ate
Onl
y(%
)
Und
efin
ed1
Plan
sI
Onl
yIn
!
(%)
1
Med
i-1
care
Onl
y(%
)
Med
i-1
Med
icar
e St
1ca
idM
edic
aid
Onl
yO
nly
(%)
(%)
With
Ei C
her
(%)
Mec
ii-1
care
Onl
y(%
)
Med
i-1
Med
icar
e &
Ica
idM
edic
aid
Onl
yO
nly
(%)
(%)
Und
er 0
.50
0.50
2,23
51,
070
15.0
12.6
0.0
2.1
0.1
43.8
0.7
39.9
0.8
"0.
70.
40.
10.
6to
und
er 1
.00
1.00
4,47
42,
156
28.6
26.7
0.5
130.
028
31.
023
31.
91.
20.
90.
00.
7to
und
er 1
.25
1.25
3,16
71,
489
48.8
47.2
0.2
0.9
0.2
11.5
1.2
7.8
1.1
1.4
1.1
0.2
0.6
to u
nder
1.5
01.
503,
638
1,68
958
.356
.90.
30.
70.
27.
00.
74.
60.
5 "
1.4
1.2
0.2
0.4
to u
nder
1.7
51.
75 to
6,53
03,
022
75.9
74.2
0.4
030.
13.
603
2.2
0.3
2.2
1.3
0.8
0.4
unde
r 2.
002.
0010
,255
4,64
883
.281
.90.
203
0.1
1.9
0.2
0.9
0.2
1.6
0.9
0.7
0.4
and
abov
e45
-64
year
s &
48,4
9621
,515
88.9
87.7
0.2
0.1
0.1
0.9
0.1
0.3
0.1
1.5
0.6
0.9
0.2
Und
er 0
.50
0.50
to75
939
021
317
.51.
91.
40.
0 t
37.0
3.1
"27
.13.
1 *
2.6
*1.
60.
51.
1un
der
1.00
1.00
2,29
01,
158
263
22.9
1.6
0.9
0.6
41.0
6324
36.
92.
21.
50.
31.
0to
und
er 1
.25
1.25
1,36
769
545
.340
.03.
10.
8 *
0.1
20.2
438.
13.
33.
01.
61.
01.
2to
und
er 1
.50
1.50
1,80
190
454
.750
.52.
40.
60.
118
.14.
96.
22.
45.
73.
11.
01.
2to
und
er 1
.75
1.75
2,10
31,
025
69.0
62.2
3.1
1.0
0.7
11.4
2.0
2.7
1.1
4.5
2.1
1.6
0.5
*to
und
er 2
.00
2.00
3,87
51,
847
80.1
75.0
2.6
0.5
0.3
7.2
1.8
130.
63.
11.
31.
70.
6 *
and
abov
e33
,919
15,5
9091
.386
.11.
602
0.1
3.0
0.5
030.
14.
91.
33.
30.
3
All
Men
Age
73,1
1232
,250
77.5
74.7
0.8
0.2
0.1
4.0
0.7
1.6
0.4
2.9
0.9
1.7
0.4
18-2
4 ye
ars
25-4
412
,396
5,26
764
.463
.60.
10.
40.
12.
802
1.9
0.1
1.1
0.8
0.3
0.5
year
s45
-64
38,6
4716
,780
78.5
77.1
030.
10.
12.
70.
31.
50.
31.
50.
50.
90.
4ye
ars
Rac
e22
,069
10,2
0383
276
.72.
00.
202
6.8
1.5
1.7
0.6
6.2
1.9
3.8
0.5
Whi
teB
lack
62,6
6427
,278
79.7
76.9
0.8
0.1
0.1
3.4
0.6
1.2
0.3
2.8
0.9
1.7
0.3
Oth
er7,
900
3,92
862
.660
.00.
80.
30.
182
1.5
4.2
0.9
331.
61.
31.
2
Eth
nici
ty2,
549
1,04
468
.666
.60.
40.
20.
0 t
5.5
0.2
4.5
0.1
*2.
41.
0 *
1.3
1.4
His
pani
cN
on-H
ispa
nic
3,84
42,
513
53.8
52.0
0.4
030.
153
0.6
3.1
0.6
1.8
0.6
0.9
1.0
Edu
catio
n67
,269
29,7
3779
.676
.60.
80.
20.
13.
80.
71.
50.
43.
01.
01.
70.
4
Les
s th
an 1
2 ye
ars
13,5
766,
139
56.2
52.7
1.8
0.3
0.2
11.6
2.1
5.4
1.3
2.2
0.8
1.0
0.6
12 y
ears
Som
e27
,052
11,9
6276
.573
.80.
70.
20.
13.
20.
513
0.2
2.9
1.0
1.7
0.5
colle
geC
olle
ge15
,275
6,63
383
.580
.70.
20.
10.
113
0.2
"0.
50.
13.
81.
32.
40.
5gr
adua
teU
nkno
wn
16,7
867,
321
91.6
89.2
0.6
0.0
"0.
01.
20.
20.
1 *
0.1
2.4
0.6
1.7
0.1
*
Age
& E
duca
tion
424
195
45.7
41.8
1.0
1.1
1.4
15.5
2.0
6.6
3.4
1.9
1.4
"0.
40.
4
18-2
4 ye
ars
&L
ess
than
12
year
s2,
891
1,26
245
.143
.90.
20.
60.
16.
40.
54.
60.
30.
90.
60.
30.
712
yea
rsSo
me
5,26
82,
242
62.0
61.2
0.0
0.4
0.0
230.
11.
60.
21.
20.
90.
30.
6co
llege
Col
lege
3,34
213
9180
.279
.60.
10.
10.
00.
50.
0 t
0.2
0.0
t1.
30.
90.
30.
4ga
duat
e84
334
784
.483
.80.
50.
0 t
0.0
t0.
50.
0 t
0.0
t0.
0 t
0.0
t0.
0 t
0.0
t0.
3U
nkno
wn
5225
41.8
28.7
3.8
5.4
3.8
25.9
0.0
t12
.80.
0 t
0.0
t0.
0 t
0.0
t0.
0 t
)

TA
BL
E 1
. Typ
e of
Hea
lth I
nsur
ance
Cov
erag
e A
mon
g A
dults
Age
d 18
to 6
4, b
y So
ciod
emog
raph
ic C
hara
cter
istic
s, b
y G
ende
r:U
nite
d St
ates
, 198
9
Popu
latio
n(1
,000
s)Sa
mpl
eSi
ze
With
Priv
ate
(%)
With
1Pr
iva
teO
nly
(%)
Priv
ate
insu
ranc
e an
dM
edic
are
and/
or M
edic
aid
Mili
tary
Und
efin
ed 1
Plan
sN
otO
nly
Insu
red
(%)
(%)
Med
i-1
care
Onl
y(%
)
Med
i-1
Med
icar
e &
Ica
idM
edic
aid
Onl
yO
nly
(%)
(%)
With
Eith
er(%
)
Med
i-1
care
Onl
y(%
)
Med
i- '
Med
icar
e &
Ica
idM
edic
aid
Onl
yO
nly
(%)
(%)
With
Mili
tary
Mili
tary
Onl
y(%
)(%
)
Mili
tary
&Pr
ivat
eO
nly
(%)
25-4
4 ye
ars
&L
ess
than
12
year
s5,
187
2,27
150
.148
.70.
60.
202
*9.
81.
162
1.3
0.9
0.3
0.3
*0.
3 *
40.4
12 y
ears
14,0
796,
164
76.6
75.2
0.3
020.
02.
40.
313
0.2
*1.
60.
60.
90.
520
.4So
me
colle
ge8,
555
3,68
183
.681
.90.
1 "
0.0
0.0
1.1
0.1
0.6
0.1
*2.
40.
61.
60.
614
.2C
olle
ge g
radu
ate
10,6
304,
575
913
90.3
0.2
0.0
t0.
00.
70.
10.
10.
11.
10.
30.
70.
1 "
7.8
Unk
now
n19
789
40.9
37.9
0.0
t1.
0 *
2.0
15.5
2.3
7.0
3.2
0.0
t0.
0 t
0.0
t1.
045
.745
-64
year
sL
ess
than
12
year
s5,
498
2,60
667
.761
.03.
802
*0.
3 "
15.9
3.8
5.0
1.9
4.1
1.3
2.0
0.8
19.0
12 y
ears
7,70
43,
556
863
79.8
1.8
02 °
025.
21.
01.
00.
36.
72.
04.
10.
68.
4So
me
colle
ge3,
378
1,56
186
.779
.00.
902
0.2
*2.
50.
50.
20.
19.
93.
26.
20.
58.
7C
olle
ge g
radu
ate
5,31
32,
399
93.4
88.0
1.2
0.1
"0.
122
030.
00.
05.
51.
33.
80.
24.
5U
nkno
wn
175
8152
.450
.11.
20.
0 t
0.0
t12
.523
434.
74.
6 *
351.
10.
0 t
32.8
Mar
ital S
tatu
sM
arri
ed48
,774
21,6
3083
.980
.60.
90.
10.
132
0.5
1.1
0.2
3.2
0.9
2.1
0.3
13.0
Wid
owed
515
249
67.4
61.6
150.
0 t
0.0
t13
.93.
66.
11.
56.
21.
1 *
3.8
0.6
"19
.0D
ivor
ced
4,48
11,
969
653
61.8
0.7
020.
06.
51.
72.
20.
86.
02.
72.
51.
225
.4Se
para
ted
1,19
955
557
.555
.50.
70.
10.
0 t
8.2
1.0
5.7
0.3
3.9
2.2
1.2
'0.
732
2N
ever
mar
ried
18,0
397,
798
64.8
633
0.4
0302
4.8
0.6
2.4
0.7
1.1
0.7
0.4
0.7
30.0
Unk
now
n10
549
72.8
66.4
2.6
0.0
t0.
0 t
6.6
1.6
230.
0 t
3.7
*0.
0 1-
3.7
"0.
0 t
232
Em
ploy
men
t Sta
tus
Cur
rent
ly e
mpl
oyed
62,1
4127
,259
82.0
80.0
020.
10.
00.
80.
10.
40.
0 ''
2.2
0.6
1.6
0.3
16.6
Une
mpl
oyed
2,37
01,
049
4i.o
395
0.0
t0.
40.
0 t
7.1
0.4
5.9
0.2
"3.
01.
71.
10.
5 "
50.1
Not
in la
bor
forc
e8,
601
3,94
255
345
.753
0.7
0.6
25.6
4.9
932.
97.
33.
02.
41.
421
.8E
mpl
oym
ent S
ta tu
s &
Age
Cur
rent
ly e
mpl
oyed
&18
-24
year
s9,
216
3,87
566
365
.90.
102
0.0
1.1
0.1
0.6
0.0
t0.
90.
70.
20.
531
.625
-44
year
s35
,503
15,3
5782
681
.40.
20.
10.
00.
80.
105
0.0
1.3
0.3
1.0
0.3
16.2
45-6
4 ye
ars
17,4
228,
027
88.8
84.7
030.
10.
00.
70.
10.
10.
04.
912
3.7
0.3
9.4
Une
mpl
oyed
&18
-24
year
s71
831
339
.939
.00.
0 t
0.9
0.0
t52
0.6
3.1
0.3
*0.
60.
30.
0 1.
0.2
553
25-4
4 ye
ars
1,19
952
733
232
.10.
0 t
0.3
0.0
t8.
90.
2 '
8.0
0.2
3.1
2.1
0.8
0.6
55.4
45-6
4 ye
ars
453
209
633
59.9
0.0
t0.
0 t
0.0
t52
0.5
4.8
0.0
t6.
32.
93.
40.
727
.9N
ot in
labo
r fo
rce
&18
-24
year
s2,
463
1,07
963
.69.
80.
2 "
0.8
028.
40.
46.
20.
61.
61.
10.
60.
827
.4
25-4
4 ye
ars
1,94
589
630
.82.
42.
603
0.7
332
5316
.85.
25.
32.
70.
5 *
2.3
34.9
45-6
4 ye
ars
4,19
31,
967
61.9
45.2
9.5
0.7
0.8
323
737.
73.
311
.64.
44.
31.
412
.4
Fam
ily I
ncom
eU
nder
85,
000
2,20
896
837
.536
.60.
40.
20.
0 t
16.9
1312
32.
01.
80.
80.
40.
844
.685
,000
-56,
999
1,47
766
429
.928
.60.
20.
503
°19
.94.
012
.62.
03.
02.
40.
3 "
2.2
46.5
$7,0
00-$
9,99
91,
989
942
28.9
26.0
1.6
0.7
0221
.04.
011
.02.
63.
42.
30.
30.
949
.681
0,00
0-81
4,99
95,
396
2,43
844
.942
.21.
70.
20.
310
.62.
14.
61.
32.
51.
50.
41.
244
.081
5,00
0419
,999
7,55
83,
343
61.8
58.7
1.6
0.2
'0.
25.
81.
21.
80.
52.
61.
50.
90.
632
382
0,00
0-82
4,99
95,
730
2,52
877
.674
31.
103
0.1
3.3
0.4
*0.
80.
12.
91.
21.
30.
419
.4
$25,
000-
$34,
999
15,1
866,
624
842
80.9
0.3
020.
12.
20.
40.
40.
13.
10.
82.
00.
413
.7
835,
000-
549,
999
17,1
877,
575
88.9
861
0.4
0.1
0.0
0.9
0.1
0.1
0.1
*3.
00.
72.
20.
29.
9
830,
000
or m
ore
16,3
827,
168
92.9
903
0.4
0.0
0.0
0.7
0.1
0.1
0.0
2.8
0.6
210.
26.
1

TA
BL
E 1
. Typ
e of
Hea
lth I
nsur
ance
Cov
erag
e A
mon
g A
dults
Age
d 18
to 6
4, b
y So
ciod
emog
raph
ic C
hara
cter
istic
s, b
y G
ende
r: U
nite
d St
ates
, 198
9
Popu
latio
n(1
,000
s)
Pove
rty
Lev
elU
nder
0.5
01,
880
0.50
to u
nder
1.0
03,
883
1.00
to u
nder
1.2
52,
733
1.25
to u
nder
1.5
03,
188
1.50
to u
nder
1.7
55,
254
1.75
to u
nder
2.0
08,
612
2.00
and
abo
ve47
,563
Pove
rty
Lev
el a
nd A
ge18
-24
year
s &
Und
er 0
.30
828
0.50
to u
nder
1.0
01,
216
1.00
to u
nder
1.2
570
71
25 to
und
er 1
.50
707
1.30
to u
ndo-
1.7
51,
061
1.75
to u
nder
2.0
01,
726
2.00
and
abo
ve6,
152
25-4
4 ye
ars
&U
nder
0_5
074
10.
30 to
und
er 1
.00
1,80
91.
00 to
und
er 1
.25
1,47
71.
25 to
und
er 1
.50
1,72
01.
50 to
und
er 1
.75
3,19
71.
75 to
und
er 2
.00
4,98
32.
00 a
nd a
bove
24,7
2145
-64
year
s &
Und
er 0
.50
311
0.50
to u
nder
1.0
083
81.
00 to
und
er 1
.25
550
1.25
to u
nder
1.5
076
11.
50 to
und
o- 1
.75
996
1 75
to u
nder
2.0
01,
903
2.00
and
abo
ve16
,689
An
Wom
en77
,197
Age 18
-24
year
s13
,003
2.5-
44 y
ears
40,1
4743
-64
year
s24
,046
Rac
e Whi
te64
,885
Bla
ck9,
578
Oth
erft
hnic
ity2,
734
His
pani
c6,
274
Non
llis
pani
c70
,923
C :
)
Sam
ple
Size
With
Priv
ate
(%)
With
Priv
a te
Onl
y(%
)
Priv
ate
insu
ranc
e an
dM
edic
are
and/
or M
edic
aid
Mili
tary
Und
efin
edPl
ans
Not
Onl
yIn
sure
d(%
)(%
)
Med
i-1
care
Onl
y(%
)
Med
i-M
edic
are
&I
caid
Med
icai
dO
nly
Onl
y(%
)(%
)
With
Eith
er(%
)
Med
i-ca
reO
nly
(%)
Med
i-1
Med
icar
e &
caid
Med
icai
dO
nly
Onl
y(%
)(%
)
With
Mili
tary
Mili
tary
Onl
y(%
)(%
)
Mili
tary
&Pr
ivat
eO
nly
(%)
822
315
30.6
0.4
020.
0 t
173
1.0
14.5
0.7
1.6
*0.
90.
31.
349
71,
782
31.6
30.3
0.8
0.4
0.1
19.9
2.8
12.8
2.5
1.7
1.1
0.1
1.3
47.3
1,25
244
.742
.31.
20.
302
9.6
2.0
4.0
1.7
1.5
0.8
0.5
0.7
46.0
1,44
554
.052
.10.
90.
2 *
0.2
8.0
2.2
2.6
1.0
3.0
1.7
0.5
0.6
37.1
2,37
769
.066
.20.
903
024.
61.
113
0.5
3.1
1.5
1.2
0.6
25.9
3,83
079
.076
.90.
80.
20.
12-
50.
50.
60.
22.
00.
81.
10.
518
.220
,742
87.2
84.0
0.7
0.1
0.1
1.7
0.3
0.2
0.1
3.2
0.8
2.2
0.3
11.0
347
48.1
47.5
030.
0 t
0.0
t92
0.0
t8.
80.
0 t
t,..3
0.5
0.2
1.5
41.1
536
42.8
41.7
0.2
0.7
0.0
t8.
00.
66.
40.
10.
70.
50.
2 "
1.5
48.1
319
38.7
385
0.0
t0.
0 t
0.0
t2.
60.
0 t
230.
30.
60.
30.
3 *
0.0
t38
.430
550
.049
30.
0 t
0.0
t0.
43.
3 *
0.0
t2.
20.
60.
60.
3 "
0.3
*0.
446
.446
653
.952
.403
1.1
0.0
t4.
21.
1 "
1.2
0.4
1.9
1.9
'0.
0 t
0.2
41.3
750
67.0
66.7
0.0
t0.
10.
01.
40.
0 t
0.9
0.2
1.2
0.9
0.1
0.7
30.1
2,54
476
.675
.60.
10.
40.
11.
00.
003
0.0
t1.
10.
70.
40.
322
.1
326
17.0
16.4
0.0
t03
0.0
t20
.10.
4 "
18.5
0.3
1.4
0.6
0.2
0.6
62.0
818
293
28.1
0.9
0.3
0.0
t18
.112
132
1.9
1.4
0.8
0.0
t0.
952
.166
047
.646
.00.
40.
6 "
037.
81.
63.
41.
41.
00.
70.
21.
044
377
056
.155
203
0.1
0.3
4.7
0.8
2.6
0.6
1.4
1.0
0.3
0.4
*38
.41,
432
743
72.5
0.4
0.1
*0.
1 *
2.5
0.5
1.1
0.4
2.0
0.7
1.3
0.7
223
2,17
882
.180
.80.
20.
10.
01.
40.
20.
50.
21.
50.
50.
90.
416
.110
,596
87.1
85.7
0.2
0.0
0.0
0.9
0.2
030.
11.
50.
41.
10.
311
.7
149
22.2
193
1.9
0.4
0.0
t32
.03.
220
.03.
44.
22.
50.
62.
343
342
820
.418
31.
30.
102
40.6
9521
.27.
33.
82.
70.
2 *
1.7
*36
.327
344
537
.44.
90.
0 t
0.4
23.7
5.6
7.9
4.2
432.
01.
50.
934
.537
052
.747
.73.
10.
7 *
0.0
t19
.87.
53.
12.
39.
14.
91.
01.
225
.447
968
.160
.533
0.4
0.9
11.7
2.6
1.8
0.9
7.8
3.8
2.3
0.8
21.0
902
82.0
75.9
3.1
0.2
036.
51.
70.
60.
44.
21.
72.
30.
812
.87,
602
91.2
845
1.7
0.1
0.1
3.2
0.5
0.2
0.1
6.5
1.6
4.5
0.3
6.0
35,9
6176
.974
.70.
60.
50.
17.
50.
553
0.4
2.2
1.2
1.2
0.4
153
5,74
663
.461
.90.
10.
60.
09.
70.
18.
60.
22.
92.
22.
21.
024
.618
,809
78.6
77.2
020.
50.
16.
70.
253
031.
61.
01.
00.
214
311
,406
813
77.3
1.6
0.5
027.
71.
13.
40.
83.
01.
11.
10.
311
.8
29,2
2379
.977
.80.
70.
40.
13.
80.
43.
80.
42.
11.
21.
20.
314
.15,
552
593
56.7
0.6
1.2
0.1
19.0
1.0
15.1
0.9
2.1
1.3
1.3
0.8
21.5
1,18
667
.464
.40.
10.
40.
1 *
8.5
0.1
7.4
0.3
4.6
2.1
2.1
1.4
*21
3
2,81
354
.052
.30.
40.
60.
014
.00.
511
50.
92.
01.
40.
6 *
0.5
312
33,1
4878
.976
.70.
60.
50.
16
90.
54.
70.
42.
21.
21.
00.
413
.9
t--;
---i
( k
/

TA
BL
E 1
. Typ
e of
Hea
lth I
nsur
ance
Cov
erag
e A
mon
g A
dults
Age
d 18
to 6
4, b
y So
ciod
emog
raph
icb
Gen
der:
Uni
ted
Stat
es, 1
989
Popu
latio
n(1
,000
s)Sa
mpl
eSi
ze
With
Priv
a te
(%)
With
1
Priv
ate
Onl
y(%
)
Priv
ate
insu
ranc
e an
dM
edic
are
and/
or M
edic
aid
Mili
tary
Und
efin
ed'
Plan
sN
otO
nly
Insu
red
(%)
(%)
Med
i-1
care
Onl
y(%
)
Med
i-I
Med
icar
e &
Ica
idM
edic
aid
Onl
yO
nly
(%)
(%)
With
Eith
er(%
)
Med
i-I
care
Onl
y(%
)
Med
i-I
Med
icar
e &
caid
Med
icai
dO
nly
Onl
y(%
)(%
)
With
Mili
tary
Mili
tary
Onl
y(%
)(%
)
Mili
tary
&Pr
ivat
eO
nly
(%)
Edu
catio
nL
ess
than
12
year
s13
,605
6,53
751
.948
.812
1.0
0320
.813
15.5
1.5
1.8
1.0
1.0
0.5
283
12 y
ears
32,2
9315
,059
77.5
75.2
0.6
0.6
0.1
6.6
0.4
4.6
0.3
2.5
1.4
1.4
0.5
15.3
Som
e co
llege
17,2
367,
902
83.5
81.7
0303
0.1
3.5
0.2
2.3
0.2
2.5
1.4
1.4
0.3
12.0
Col
lege
gra
d ua
te13
,798
6,32
892
.090
.80.
40.
10.
01.
10.
10.
40.
01.
70.
90.
90.
26.
3U
nkno
wn
265
135
36.2
47.2
0.9
631.
9 *
29.4
5.2
10.6
4.6
0.0
t0.
0 t
0.0
1-0.
0 t
2.3.
5
Age
& E
duca
tion
I8-2
4 ye
ars
&L
ess
than
12
year
s2,
441
1,11
638
.036
.50.
0 t
1.2
*0.
0 t
243
0.1
*22
.50.
51.
81.
61.
60.
936
.412
yea
rs5,
629
2,50
460
.859
30.
10.
80.
0 t
9.5
0.1
8.4
0.0
3.4
2.7
2.7
1.2
26.7
Som
e co
llege
3,92
81,
701
77.1
76.0
0.2
0.1
0.0
t3.
10.
02.
50.
12.
92.
12.
10.
817
3C
olle
ge g
radu
ate
976
410
85.8
843
0.2
0.0
t0.
0 t
030.
0 t
0.1
0.0
t2.
51.
31.
30.
2 *
12.6
Unk
now
n31
1574
.253
.90.
0 t
13.6
6.6
30.9
0.0
t3.
175
0.0
t0.
0 t
0.0
t0.
0 t
15.2
23-4
4 ye
ars
&L
ess
than
12
year
s5,
120
2,45
247
.245
.20.
41.
00.
2 *
22.2
0.4
19.0
1.1
1.1
0.7
0.7
0.3
31.2
12 y
ears
16,0
727,
591
77.5
76.0
0.2
0.7
0.1
6.8
0.2
5.4
0.2
1.6
1.1
1.1
0.3
15.2
Som
e co
llege
9,40
64,
377
83.9
82.8
0.0
030.
13.
50.
22.
50.
22.
01.
31.
30.
111
.7C
olle
ge g
rad
u a
te9,
402
4,31
792
.591
.70.
2 *
0.0
0.0
0.7
0.0
0.4
0.0
t1.
30.
80.
80.
26.
0U
nkno
wn
147
7259
.247
.11.
68.
52.
033
.43.
614
.63.
10.
0 t
0.0
t0.
0 t
0.0
t19
.3
45-6
4 yt
nrs
Les
s th
an 1
2 ye
ars
6,04
42,
969
61.5
56.8
230.
90.
418
.12.
59.
62.
22.
31.
11.
10.
5 "
22.5
12 y
ears
10,5
924,
964
86.4
82.3
1.6
030.
14.
70.
71.
50.
53.
41.
31.
30.
39.
3
Som
e co
llege
3,90
21,
824
89 2
83.0
1.2
0.4
0.2
4.1
0.4
1.4
0.4
3.2
0.8
0.8
'0.
37.
5C
oil
ege
grad
ua te
3,42
01.
601
92.5
90.0
1.0
0.1
0.0
t2.
10.
40.
60.
02.
51.
21.
20.
15.
2U
nkno
wn
8848
44.9
44.9
0.0
t0.
0 t
0.0
t22
.29.
66.
5 *
6.0
0.0
t0.
0 1-
0.0
10.
0 t
32.9
Mar
ital S
tatu
sM
a m
ed49
,978
23,0
7383
.381
.20.
60.
20.
03.
40.
32.
10.
1 '
2.8
1.6
1.6
0.3
12.3
Wid
owed
2,70
;1,
358
66.3
61.0
2.8
0.8
0.1
14.9
3.0
6.3
1.6
4.0
2.4
2.4
0.4
'19
.8
Div
orce
d7,
030
3,39
766
.865
.10
50.
90.
114
.50.
810
.91.
30.
40.
2 '
0.2
0.3
19.7
Sepa
rate
d2,
400
1,21
148
845
.90
51.
60.
2 '
28.9
0.9
24.1
1.7
1.6
1.0
1.0
0.7
22.8
Nev
er m
arri
ed14
,899
6,87
766
.864
.60.
41.
10.
213
.00.
410
.00.
80.
90.
40.
40.
621
.0U
nkno
wn
9445
60.2
56.8
0.0
t2.
21.
311
.30.
0 t
5.6
2.2
0.0
10.
0 t
0.0
t0
0 t
31.9
Em
ploy
men
t Sta
tus
Cur
raiti
v cm
plm
,ed
51,1
8623
,685
84.2
82.9
0 2
030
01.
80.
11.
20.
11.
90.
90.
90.
313
.2
Une
mpl
oyed
2,27
11,
090
34.2
32.2
01)
0.9
0.2
15.0
0.0
t13
30.
43.
12.
22.
20.
529
.2N
ot in
labo
r fo
rce
23,7
40l 1
,186
63.2
59.2
1.6
1.0
0.2
19.0
1.4
13.3
1.2
2.9
1.8
1.8
0.6
18.4
Em
ploy
men
t Sta
tus
& A
geC
urre
ntly
em
ploy
ed &
18-2
4 ye
ars
8,43
03,
662
72.3
71.4
0.1
0.2
0.0
t2.
40.
12.
00.
02.
51.
91.
90.
823
.0
25-4
4 ye
ars
28,7
8213
,417
85.7
84.7
0.1
0.3
0.0
1.9
0.1
1.3
0.1
1.3
0 7
0.7
0.2
11.9
43-6
4 ye
ars
13,9
746,
606
88.3
86.0
030.
30.
01.
40.
10
50.
12.
50
80.
80.
29.
9
r-1
Une
mpl
oyed
&(
I15
-24
year
,66
630
443
.942
.20.
0 t
1.3
0.0
t19
.70.
0 t
18.2
0.2
2.6
2.2
2.2
1.5
34.1
25-4
4 ye
ars
1,20
158
256
.034
.30.
10.
9 '
0 2
15.8
0.0
t14
.40.
22.
21.
81.
80.
2 "
27.3
43 6
4 !,
ears
405
204
65.7
61.9
0.0
f0.
0 1
4.9
0.0
i2.
8 '
1.5
6.5
3.2
43.
20.
0 t
26.7

TA
BL
E 1
. Typ
e of
Hea
lth I
nsur
ance
Cov
erag
e A
mon
g A
dults
Age
d 18
to 6
4, b
y So
ciod
emog
raph
ic C
hara
cter
istic
s, b
y G
ende
r:U
nite
d St
ates
, 198
9
Popu
la ti
on(1
,000
s)Sa
mpl
eSi
ze
Wi t
hPr
iva
te(%
)
With
1
I'riv
a te
Onl
y(%
)
Priv
ate
insu
ranc
e an
dM
edic
are
and/
or M
edic
aid
Mili
tary
Und
efin
edPl
ans
Not
Onl
yIn
sure
d(%
)(%
)
Med
i-ca
reO
nly
(%)
Med
i-1
Med
icar
e &
Ica
idM
edic
aid
Onl
yO
nly
(%)
(%)
With
Eith
er(%
)
Med
i-1
care
Onl
y(%
)
Med
i-1
Med
icar
e &
Ica
idM
edia
l id
Onl
yO
nly
(%)
(%)
With
Mili
tary
Mili
tary
Onl
y(%
)(%
)
Mili
tary
&Pr
iva
teO
n1 (%,
Not
in la
bor
forc
e &
18-2
4 ye
ars
25-4
43,
909
1,78
047
.445
.00.
21.
40.
123
.70.
121
.40.
4 "
3.6
2.7
2.7
1.2
26.5
year
s45
-64
10,1
644,
810
61.0
58.8
0.4
1.2
0.2
19.2
0.8
15.6
1.0
2.1
1.8
1.8
0.4
19.5
year
sFa
mily
Inc
ome
9,66
74,
596
71.9
65.3
3.5
0.8
0.3
16.9
2.6
7.6
1.8
3.5
1.5
1.5
0.5
14.0
Und
er $
5,00
0S5
,000
-$6,
999
3,53
51,
700
35.0
32.0
0.5
1.6
0.4
363
0.8
30.4
2.5
2.0
1.3
0.5
0.9
28.9
57,0
00-5
9,99
92,
212
1,05
329
.526
.01.
21.
90.
0 t
39.8
3.0
30.7
3.0
1.1
0.7
0.4
0.6
32.5
510,
000-
514,
999
3,10
61,
562
32.6
29.8
0.8
1.6
0.1
32.7
1.6
26.8
1.9
1.4
1.0
0.3
0.6
*35
.56,
902
3,30
551
.748
.91.
41.
00.
214
.10.
99.
90.
62.
01.
90.
10.
734
.351
5,00
0-51
9,99
98,
759
4,16
568
.165
.71.
00.
80.
2 *
7.6
0.7
4.4
0.5
2.0
1.7
0.3
0.5
24.2
520,
000-
524,
999
6,17
62,
867
79.2
77.0
0.6
0.5
0.0
4.4
0.5
2.6
0.2
3.4
2.2
1.2
0.5
14.8
525,
000-
534,
999
535,
000-
549,
999
14,9
586,
880
86.1
83.9
0.7
0.2
0.1
2.4
0.2
1.0
0.2
2.6
1.2
1.2
0.4
10.9
16,2
777,
478
90.5
88.8
030.
20.
113
0.1
0.6
0.0
2.2
1.0
1.1
0.1
7.6
550,
000
or m
ore
Pove
rty
Lev
el15
,271
6,95
194
.492
.50.
30.
10.
00.
80.
10.
20.
0 t
2.0
0.7
1.4
0.2
4.5
Und
er 0
.50
3,23
11,
575
28.2
25.4
0.4
1.9
0.1
41.5
0.6
37.5
0.9
1.4
0.8
0.5
0.8
31.0
0.50
to u
nder
1.0
05,
661
2,78
031
.228
.80.
61.
40.
233
.91.
627
.52.
61.
51.
20.
20.
833
.11.
00 to
und
er 1
.25
1.25
to u
nder
1.5
03,
329
3,75
71,
625
1,83
146
356
.944
.254
.80.
50.
71.
21.
10.
10.
116
.512
.113 1.
1
12.1 82
1.2
0.9
2.3
2.5
1.9
2.0
0.3
0.4
0.5
0.8
36.6
30.0
1.50
to u
nder
1.7
55,
458
2,59
671
.569
.00.
90.
90.
26.
503
3.8
0.4
2.4
1.9
0.5
0.3
21.8
1.75
to u
nder
2.0
02.
008,
971
4,17
180
.478
.50.
70.
5 *
0.1
3.9
0.5
1.8
0.3
2.1
1.4
0.7
0.5
15.1
and
abov
ePo
vert
y L
evel
and
Age
46,7
8921
,383
89.5
873
0.6
020.
11.
802
0.5
0.1
2.3
1.1
1.2
0.3
8.4
18-2
4 ye
ars
&U
nder
0.5
01,
290
590
47.4
45.5
0.2
0.7
0.0
t25
.60.
0 t
24.4
0.1
2.6
1.4
1.0
1.1
253
0.50
to u
ndu
1.00
1,56
471
237
.636
.90.
0 t
030.
0 t
24.9
0224
.00.
32.
21.
80.
41.
334
.71.
00 to
und
er 1
.25
822
374
39.5
38.5
0.0
t1.
00.
0 t
18.7
0316
.80.
23.
63.
30.
0 t
0.0
t39
.51.
25 to
und
o. 1
.50
799
378
50.0
48.6
0.2
1.2
0.0
t13
.60.
0 t
11.9
0.3
'3.
93.
90.
0 t
1.3
32.6
1.50
to u
nder
1.7
51,
018
460
54.5
52.5
0.0
t1.
40.
27.
60.
0 t
6.0
0.0
t3.
63.
20.
41.
035
31.
73 to
und
er 2
.00
1,72
675
671
.069
.503
0.4
0.0
t4.
20.
13.
20.
13.
12.
00.
91.
222
.22.
00 a
nd a
bove
25-4
4 ye
ars
&5,
785
2,47
678
.477
.00.
2 "
0.5
0.0
t2.
30.
01.
40.
12.
61.
90.
70.
817
3
Und
er 0
.50
1,49
'74
414
.010
.60.
13.
00.
1 "
55.6
0.9
50.4
1.1
0.4
0.3
0.1
0.6
32.8
0.50
to u
nder
1.0
02,
665
1,33
828
.225
.80.
22.
00.
135
.20.
930
.11.
91.
21.
10.
1 "
0.6
373
1.00
to u
nder
1.2
51,
690
829
49.9
48.2
0.1
1.2
0.2
14.8
0.8
11.7
0.9
1.7
*1.
50.
20.
333
.01.
25 to
und
er 1
.50
1,91
891
960
.258
.503
1.2
0.1
9.0
0.5
6.5
0.4
1.5
1.4
0.1
0.3
30.7
1.50
to u
nder
1.7
53,
333
1,59
077
375
.90.
50.
60.
1 "
450.
0 t
3.2
0.2
2.3
2.0
0.4
0.0
17.2
1.75
to u
nder
2.0
05,
272
2,47
084
.283
.00.
20.
40.
123
0.1
130.
31.
81.
30.
50.
412
.52.
00 a
nd a
bove
23,7
7510
,919
90.7
89.7
0.2
0.1
0.1
0.9
0.1
0.4
0.0
1.5
0.8
0.7
0.2
7.8
cJi

TA
BL
E 1
. T A
. e o
f H
ealth
Ins
uran
ce C
over
a e
Am
onA
dults
A e
d 18
to 6
4,1,
Soc
iode
mo
hic
Cha
ract
eris
tics,
bG
ende
r:U
nite
d St
ates
, 198
9
Popu
latio
n(l
,000
s)Sa
mpl
eSi
ze
With
Priv
ate
(%)
VV
ith
Priv
ate
Onl
y(%
)
Priv
ate
insu
ranc
e an
dM
edic
are
and/
or M
edic
aid
Mili
tary
With
Mili
tary
Mili
tary
Onl
y(%
)(%
)
Mili
tary
&Pr
ivat
eO
nly
(%)
Und
efin
ed'
I'lan
sN
otO
nly
Insu
red
(%)
(%)
N4e
di)
care
Onl
y(%
)
lvik
li)ca
idO
nly
(%)
Med
icar
e&I
Med
icai
d
Onl
y(%
)
With
Eith
er(%
)
Med
i-ca
reO
nly
(%)
Med
i) M
edic
are
&"
caid
Med
icai
dO
nly
Onl
y(%
)(%
)
45-6
4 ye
ars
&U
nder
0.5
044
724
120
.616
.31.
92,
00.
0 t
40.5
1.7
32.0
2.9
1.5
1.1
0.4
0.2
41.5
0.50
to u
nder
1.0
01,
432
730
29.8
25.6
1.8
1.4
0.8
41.2
4.3
26.2
6.6
1.3
0.9
0.3
0.5
31.6
1.00
to u
nder
1.2
581
742
245
.741
.82.
01.
40.
0 t
17.9
3.4
8.2
2.8
2.1
1.3
0.6
1.4
37.0
1.25
to u
nder
1.5
01,
040
534
56.1
52.5
1.8
40,
60.
116
.82.
98.
52.
43.
31.
8 *
1.1
1.2
26.6
1.50
to u
nder
1.7
51,
108
546
69.7
63.7
2.9
1.4
0.6
11.2
1.5
3.4
1.3
1.5
0.5
"1.
00.
323
.31.
75 to
und
er 2
.00
1,97
394
578
.374
.12.
10.
70.
37.
82.
02.
00.
72.
01,
01.
0J.
415
.82.
00 a
nd a
bove
17,2
297,
988
91.5
87.6
1.4
0.2
0.1
2.8
0.5
0.4
0.1
3.4
1.1
2.1
0.2
6.2
Sour
ce: N
atio
nal H
ealth
Int
ervi
ew S
urve
y (a
utho
r's ta
bula
tions
fro
m p
ublic
use
tape
s).
Not
e: S
tand
ard
erro
rs f
or e
stim
ates
app
ear
in A
ppen
dix
TA
BL
E B
-1.
1
Exc
ludi
ng m
ilita
ry.
Est
imat
e ha
s lo
w s
tatis
tical
rel
iabi
lity
(rel
ativ
e st
anda
rd e
rror
> 3
0%).
I- E
stim
ate
is e
xact
ly 0
or
stan
dard
err
or is
inde
term
inat
e.
e;)
'f

TA
BL
E 2
. Tj.
e of
Hea
lth I
nsur
ance
Cov
era
e A
mon
Adu
lts A
ed
18 to
64,
b D
isab
ilian
d H
ealth
Sta
tus,
b G
ende
n U
nite
d St
ates
, 198
9
Priv
ate
insu
ranc
e an
dM
edic
are
and/
or M
edic
aid
Mili
tary
With
' Med
ii M
edil
Med
iair
e St
1M
edi-
1 M
ediJ
Med
icar
e &
IM
ilita
ry &
Und
efin
ed'
With
Priv
ate
care
caid
Med
icai
dW
ithca
reca
idM
edic
aid
With
Mili
tary
Priv
ate
Plan
sN
otPo
pula
tion
Sam
ple
Priv
ate
Onl
yO
nly
Onl
yO
nly
Eith
erO
nly
Onl
yO
nly
Mili
tary
Onl
yO
nly
Onl
yIn
sure
d(1
,000
s)Si
ze(%
)(%
)(%
)(%
)(%
)(%
)(%
)(%
)(%
)(%
)(%
)(%
)(%
)(%
)
Tot
al15
0,30
968
,211
77.2
74.7
0.7
030.
15.
80.
63.
50.
42.
51.
11.
30.
416
.7H
ealth
Sta
tus
Exc
elle
ntV
ery
gcod
Goo
dFa
irPo
orU
nkno
wn
Ma)
or A
ctiv
ityU
nabl
e to
per
form
maj
or a
ctiv
ity6,
772
3,22
647
.734
.18.
01.
81.
443
.17.
915
.85.
86.
72.
81.
51.
017
.4L
imite
d in
am
ount
/kin
d of
maj
or a
ctiv
ity7,
498
3,46
569
.262
.72.
01.
10.
312
.71.
46.
51.
24.
91.
53.
20.
619
.4L
imite
d in
oth
er a
ctiv
ity5,
490
2,54
073
.069
.11.
00.
50.
211
.21.
07.
40.
93.
71.
42.
10.
116
.1N
ot li
mite
d in
act
ivity
130,
549
58,9
8079
377
.70.
202
0.0
3.2
0.1
2.5
0.1
2.1
1.0
1.1
0.4
16.6
Wor
k A
ctiv
ityU
nabl
e to
wor
k7,
980
3,81
847
.534
.38.
01.
91.
243
373
173
5.7
6.2
2.6
1.5
0.9
17.3
Lim
ited
in a
mou
nt/k
ind
of w
ork
6,77
63,
106
71.7
663
1.0
0.8
038.
50.
84.
80.
65.
01.
63.
20.
519
.8L
imite
d in
oth
er a
ctiv
ity5,
004
2,30
775
571
.50.
90.
50.
28.
81.
25.
10.
83.
81.
32.
40.
315
.8N
ot li
mite
d in
act
ivity
130,
549
58,9
8079
377
.70.
202
0.0
3.2
0.1
2.5
0.1
2.1
1.0
1.1
0.4
16.6
Bas
ic L
ife
Act
iviti
esN
eeds
hel
p in
sel
f ca
re (
AD
L)
780
370
45.9
21.2
14.5
432.
961
.693
20.8
7.9
5.7
1.1
2.8
1.3
12.1
Nee
ds h
elp
in r
outin
e ac
tiviti
es (
IAD
L)
2,21
01,
067
49.4
35.6
7.8
2.8
1.6
47.5
8.2
182
6.6
4.8
2.4
0.8
0.3
13.5
Not
lim
ited
in b
asic
life
act
iviti
es14
7,32
066
,774
77.8
75.6
0.5
030.
14.
90.
43.
20.
32.
51.
11.
30.
416
.8W
ork
Act
ivity
& B
asic
Lif
e A
ctiv
ities
Una
ble
to w
ork
&N
eeds
hel
p in
sel
f ca
re (
AD
L)
680
325
44.8
18.4
15.6
4.9
2.8
64.9
103
20.4
8.8
5.8
0.9
2.8
0.6
12.4
Nee
ds h
elp
in r
outin
e ac
tiviti
es (
IAD
L)
1,64
480
044
.628
.89.
92.
81.
654
.39.
020
.68.
45.
52.
70.
70.
2 *
133
Not
lim
ited
in b
asic
life
act
iviti
es5,
656
2,69
348
.637
.86.
51.
20.
937
.86.
416
.04.
56.
42.
71.
51.
119
.1L
imite
d in
am
ount
/kin
d of
wor
k &
Nee
ds h
elp
in s
elf
care
(A
DL
)59
2557
340
39.
20.
0t
3.3
373
0.0
t21
.83.
34.
50.
0 t
457.
11`
Nee
ds h
elp
in r
outin
e ac
tiviti
es (
IAD
L)
355
167
655
57.8
1.9
1.8
1.7
*23
.84.
611
31.
93.
6 *
1.3
1.7
0.0
t15
.4N
ot li
mite
d in
bas
ic li
fe a
ctiv
ities
6,36
22,
914
72.2
67.0
0.9
0.7
0.2
7.4
0.6
430.
55.
11.
73.
30.
320
.2L
imite
d in
oth
er a
ctiv
ity &
Nee
ds h
elp
in s
elf
care
(A
DL
)40
1945
.136
.6 *
3.5
0.0
t5.
043
39.
725
.10.
0 t
5.4
5.4
0.0
t5.
29.
5 *
Nee
ds h
elp
in r
outin
e ac
tiviti
es (
IAD
L)
201
9460
.852
.223
5.1
"1.
233
.67.
217
.90.
0 t
2.1
2.1
0.0
t1.
011
.1N
ot li
mite
d in
bas
ic li
fe a
ctiv
ities
4,76
32,
194
763
72.6
0.8
030.
17.
40.
943
0.8
3.8
1.2
2.5
0.3
16.0
Not
lim
ited
in a
ctiv
ity &
Nee
ds h
elp
in s
elf
care
(A
DL
)1
110
0.0
t10
0.0
t0.
0 t
0.0
t0.
0 t
0.0
t0.
0 t
0.0
t0.
0 t
0.0
t0.
0 t
0.0
t0.
0 t
0.0
tN
eeds
hel
p in
rou
tine
activ
ities
(IA
DL
)10
624
.524
30.
0 t
0.0
t0.
0 t
50.4
*10
.618
321
3 *
0.0
I-0.
0 t
0.0
t0.
0 t
25.2
Not
lim
ited
in b
asic
life
act
iviti
es13
0,51
858
,973
79.3
77.7
020.
20.
032
0.1
230.
12.
11.
01.
10.
416
.6
57,3
9225
,595
82.7
81.1
020.
20.
02.
00.
11.
40.
12.
10.
91.
20.
314
.544
,376
20,0
8880
.979
.003
030.
0 *
3503
230.
22.
31.
01.
20.
315
.034
,491
15,8
4671
.869
.20.
50.
50.
17.
00.
64.
80.
42.
71.
21.
40.
520
.710
,016
4,74
260
.153
.93.
20.
703
19.7
2.0
11.0
1.9
4.0
1.7
1.8
0.9
22.1
3,55
41,
713
43.4
30.6
7.7
1.9
1.0
44.4
7.7
18.4
5.1
7.1
2.9
1.5
0.5
20.1
480
227
64.2
633
0.0
t0.
40.
0 t
9.0
0.4
*8.
10.
0 t
0.9
*0.
40.
5 *
0.4
26.4
fI
CC
,

TA
BL
E 2
. Typ
e of
Hea
lth I
nsur
ance
Cov
erag
e A
mon
g A
dults
Age
d 18
to 6
4, b
y D
isab
ility
and
Hea
lth S
tatu
s, b
y G
ende
r: U
nite
d St
ates
, 198
9
Popu
latio
nSa
mpl
e(1
,000
s)Si
ze
With
Priv
ate
(%)
With
'Pr
ivat
eO
nly
(%)
Priv
ate
insu
ranc
e an
dM
edic
are
and/
or M
edic
aid
Mili
tary
Und
efin
edPl
ans
Onl
y(%
)
Not
Insu
red
(%)
Mec
li-I
care
Onl
y(%
)
Med
d M
edic
are
&I
caid
Med
icai
dO
nly
Onl
y(%
)(%
)
With
Eith
er(%
)
Med
dca
reO
nly
(%)
Med
d M
edic
are
&ca
idM
edic
aid
Onl
yO
nly
(%)
(%)
Mili
tary
&W
ithM
ilita
ryPr
ivat
eM
ilita
ryO
nly
Onl
y(%
)(%
)(%
)
Wor
k A
ctiv
ity &
I le
alth
Sta
tus
Una
ble
to w
ork
&E
xcel
lent
369
172
60.4
50.5
4.4
2.1
2325
.94.
07.
65.
12.
20.
71.
1 *
0.5
21.3
Ver
y go
od66
930
456
.548
.32.
91.
81.
030
.86.
810
.35.
75.
71.
71.
6 *
1.8
15.8
Goo
d1,
874
879
52.5
42.3
532.
01.
433
.05.
912
.95.
04.
72.
71.
50.
520
.0Fa
ir2,
537
1,23
448
.133
.19.
713
1.1
45.9
6.4
19.8
5.5
6.2
2.2
2.0
1.1
15.7
Poor
2,49
01,
208
39.0
233
10.2
231.
254
.99.
921
.26.
68.
03.
31.
00.
716
.8U
nkno
wn
4021
29.2
29.2
*0.
0 t
0.0
t0.
0 t
41.8
5336
.50.
0 t
5.3
5.3
0.0
t5.
318
.4L
imite
d in
am
ount
/kin
d of
wor
k &
Exc
elle
nt77
935
173
.066
.90.
20.
91.
1 *
830.
84.
70.
55.
21.
33.
90.
718
.9V
ery
good
1,53
468
778
.574
.40.
703
02 *
5.8
0.7
2.9
0.8
4.4
1.6
"2.
70.
215
.4G
ood
2,48
01,
129
72.0
66.2
0.9
1.1
0.1
8.7
0.9
4.9
0.5
5.6
1.7
3.6
0.6
19.2
Fair
1,58
774
765
.860
.51.
60.
803
10.4
0.5
6.5
0.6
4.1
1.4
2.6
0.8
*24
.2Po
or37
318
064
.857
.51.
90.
0t
1.1
11.0
13 *
551.
27.
12.
94.
3 *
0.0
t24
3U
nkno
wn
2112
53.1
44.0
0.0
t9.
10.
0 t
9.1
0.0
t0.
0 t
0.0
t0.
0 t
0.0
t0.
0 t
0.0
t46
.9L
imite
d in
oth
er a
ctiv
ity &
Exc
elle
nt82
336
982
.979
20.
203
0.2
2.6
031.
60.
0 t
5.1
2.1
3.0
0.3
12.9
Ver
y gc
od1,
441
646
833
783
0.8
0.9
*0.
1 '
5.1
0.8
2.1
0.1
4.5
1.2
*3.
2(.
112
.1G
ood
1,63
776
775
.072
.20.
40.
40.
183
1.0
*5.
90.
52.
60.
81.
80.
316
5Fa
ir84
940
063
.559
.623
0.0
t0.
0 t
143
1.3
*8.
12.
33.
31.
41.
6 *
0.8
723
Poor
235
117
48.2
41.2
1.6
221.
136
.78.
6 ''
185
4.3
4.3
1.7
2.1
0.0
t18
2U
nkno
wn
188
67.1
67.1
0.0
t0.
0t
0.0
t0.
0 t
0.0
t0.
0 t
0.0
t0.
0 t
0.0
1.0.
0 t
0.0
t32
.9 *
Not
lim
ited
in a
ctiv
ity &
Exc
elle
nt55
,420
24,7
0383
.081
.50.
20.
20.
01.
70.
113
0.0
2.0
0.9
1.1
0.3
14.4
Ver
y go
od40
,733
18,4
5181
379
.70.
30.
20.
02.
90.
12.
20.
12.
11.
01.
10.
315
.0G
ood
28,5
0113
,071
72.8
71.0
0303
0.0
5.1
0.2
430.
12.
31.
01.
20.
521
.1Fa
ir5,
043
2,36
163
.761
20.
50.
40.
010
.303
8.5
0.4
3.0
1.5
1.5
0.8
24.7
Poor
453
208
47.4
42.5
1.8
0.8
0.4
18.3
0.5
13.6
0.6
151.
31.
8 *
0.0
t36
.1U
nkno
wn
399
186
68.2
67.6
0.0
t0.
0t
0.0
t6.
00.
0 t
6.0
0.0
t0.
50.
0 t
0.5
0.0
t25
.8
All
Men
73,1
1232
,250
77.5
74.7
0.8
020.
14.
00.
71.
60.
42.
90.
91.
70.
418
3H
ealth
Sta
tus
Exc
elle
nt30
,711
13,3
7682
.480
.80.
20.
10.
00.
90.
105
0.1
2.0
0.7
1.4
0.3
16.0
Ver
y go
od21
,151
9,32
580
.878
.703
020.
02.
003
1.0
0.1
2.4
0.7
1.6
0.3
16.7
Goo
d15
,155
6,73
671
.768
.60.
702
0.1
*4.
30.
72.
10.
43.
21.
12.
00.
62.
33Fa
ir4,
131
1,89
559
.951
.74.
103
0.4
17.8
2.8
6.6
2.2
6.5
2.4
2.8
1.3
24.1
Poor
1,75
481
845
.429
.210
.115
0.8
443
9.6
13.1
4.1
11.6
4.4
2.2
0.8
19.2
Unk
now
n21
210
057
.856
.80.
0 t
0.0
t0.
0 t
8.6
0.0
t8.
60.
0 t
2.0
1.0
1.0
1.0
31.6
Maj
or A
ctiv
ityU
nabl
e to
per
form
maj
or a
ctiv
ity3,
801
1,77
446
.129
.910
.21.
51.
245
.09.
612
.95.
69.
84.
11.
81.
417
.7L
imite
d in
am
ount
/kin
d of
maj
or a
ctiv
ity3,
394
1,51
170
.462
.81.
40.
40.
37.
913
320.
87.
82.
05.
40.
621
2)
Lim
ited
in o
ther
act
ivity
2,23
298
879
.674
.70.
50.
002
5.0
0.8
2.8
0.3
5.6
1.2
4.1
0.1
14.9
Not
lim
ited
in a
ctiv
ity63
,685
27,9
7779
.778
.00.
20.
10.
013
0.1
0.8
0.0
2.1
0.7
1.4
0.4
18.3

TA
BL
E 2
. Typ
e of
Hea
lth I
nsur
ance
Cov
erag
e A
mon
g A
dults
Age
d 18
to 6
4, b
yD
isab
ility
and
Hea
lth S
tatu
s, b
y G
ende
r: U
nite
d St
ates
, 198
9
Wor
k A
ctiv
ityU
nabl
e to
wor
kL
imite
d in
am
ount
/kin
d of
wor
kL
imite
d in
oth
er a
ctiv
ityN
ot li
mite
d in
acd
vity
Bas
ic L
ife
Act
iviti
esN
eeds
hel
p in
sel
f ca
re (
AD
L)
Nee
ds h
elp
in r
outin
e ac
tiviti
es (
IAD
L)
Not
lim
ited
in b
asic
life
act
iviti
esW
ork
Act
ivity
& B
asic
Lif
e A
ctiv
ities
Una
ble
to w
ork
&N
eeds
hel
p in
sel
f ca
re (
A D
L)
Nee
ds h
elp
in r
outin
e ac
tiviti
es (
IAD
L)
Not
lim
ited
in b
asic
life
act
iviti
esL
imite
d in
am
ount
/kin
d of
wor
k &
Nee
ds h
elp
in s
elf
care
(A
DL
)N
eeds
hel
p in
rou
tine
activ
ities
(IA
DL
)N
ot li
mite
d in
bas
ic li
fe a
ctiv
ities
Lim
ited
in o
ther
act
ivity
&N
eeds
hel
p in
sel
f ca
re (
AD
L)
Nee
ds h
elp
in r
outin
e ac
tiviti
es (
IA D
L)
Not
lim
ited
in b
asic
life
act
iviti
esN
ot li
mite
d in
act
ivity
&N
eeds
hel
p in
sel
f ca
re (
AD
L)
Nee
ds h
elp
in r
outin
e ac
tiviti
es (
IAD
L)
Not
lim
ited
in b
asic
life
act
iviti
esW
ork
Act
ivity
& f
leal
th S
tatu
sU
nabl
e to
wor
k &
Exc
elle
nt
Ver
y go
odG
ood
Fair
Poor
Unk
now
nL
imite
d in
am
ount
/kin
d of
wor
k &
Exc
elle
nt
Ver
y go
odG
ood
Fair
Poor
Unk
now
n
Popu
latio
n Sa
mpl
e(1
,000
s)Si
ze
With
Priv
ate
(%)
With
'Pr
ivat
eO
nly
(%)
Priv
ate
insu
ranc
e an
dM
edic
are
and/
or M
edic
aid
Mili
tary
Und
efin
ed 1
Plan
sN
otO
nly
Insu
red
(%)
(%)
Med
i-1
care
Onl
y(%
)
Med
il M
edic
are
dc1
caid
Med
icai
dO
nly
Onl
y(%
)(%
)
With
Eith
er(%
)
Med
i-1
care
Onl
y(%
)
Med
il M
edic
are
&I
caid
Med
icai
dO
nly
Onl
y(%
)(%
)
With
Mili
tary
Mili
tary
Onl
y(%
)(%
)
Mili
tary
&Pr
ivat
eO
nly
(%)
3,86
73,
291
2,27
063
,685 36
581
271
,935
331
663
2,87
2 23 119
3,15
0 10 292,
231 1 1
63,6
82 213
327
848
1,17
91,
275 25 442
767
1,18
969
418
9 9
1,80
71,
463
1,00
327
,977 17
238
531
,693 15
631
81,
333 10 52
1,40
1 5 14 984 1 1
27,9
75 99 144
394
555
602 13 193
338
524
314 87 5
45.5
70.9
80.5
79.7
48.2
43.1
78.0
47.9
39.8
46.5
46.2
56.3
71.6
583
68.1
80.8
100.
0 t
0.0
t79
.7
62.0
52.4
48.5
44.9
40.0
22.0
70.8
78 0
71.1
63.4
70.4
36.5
29.5
63.4
75.4
78.0
183
25.6
75.5
17.0
20.9
32.9
29.4
43.4
64.4
243
603
75.3
100.
0 t
0.0
I-78
.0
50.2
44.2
36.2
26.0
21.1
22.0
62.2
71.7
63.6
55.9
60.3
36.5
103 13 0.5
"0.
2
19.5
11.1 0.6
20.5
12.5 8.6
8.1
4.2
*1.
1
14.1 7.8
03 0.0
t0.
0 t
0.2
4.7
2.4
7.2
13.0
12.9 0.0
t
0.4
1.1
1.1
1.8
2.8
0.0
t
1.4
0.4
0.2
0.1
4.1
2.4
0.1
4.5
2.7
0.8
0.0
t1.
8*
03 0.0
t0.
0t
0.2
0.0
t0.
0t
0.1
3.2
1.7
1.6
0.7
1.6
0.0
1-
0.9
03 0.3
03 0.0
t0.
0t
1.2
0.4
0.2
0.0
2.9
1.2
'0.
1
2.0
1.2
1.1
8.7
1.7
03 *
19.9 0.0
t0.
1 *
0.0
t0.
0 t
0.0
2.0
0.0
t1.
81.
1 1.0
0.0
t
1.4
*
03 0.0
t0.
31.
0 *
0.0
t
46.0 73 33 13 66.7
557
3.1
68.9
603
40.0
43.5
37.9 5.8
543
26.1 2.7
0.0
t0.
0 t
13 27.5
32.7
35.9
48.8
56.6
38.9 7.6
63 7.6
6.8
10.2 0.0
t
9.8
1.1
0.8
0.1
13.7
13.5 0.4
15.1
13.6 8.2
0.0
t11
.9 0.7
0.0
t18
30.
6
0.0
t0.
0 t
0.1
5.8
6.6
8.4
8.9
13.1 0.0
t
0.9
1.2
13 0.7
1.2
0.0
t
13.6 33 13 0.8
133
13.7 1.4
12.8
16.9
12.9
18.1
13.0 2.8
20.4 0.0
t1.
2
0.0
t0.
0 t
0.3
4.1
12.5
10.7
14.6
15.9
38.9 3.9
2.2
3.8
3.0
4.1
*0.
0 t
5.8
0.6
0.2
0.0
10.6 7.8
0.2
11.1 9.0
4.5
8.6
3.5
0.4
0.0
I-0.
0 I-
0.2
0.0
t0.
0 t
0.0
7.0
5.8
5.5
6.3
5.5
0.0
t
0.0
t0.
90.
50.
51.
1 0.0
t
9.9
7.7
5.7
2.1
7.4
9.7
2.8
7.5
10.7
9.9
0.0
t5.
27.
8
213
6.6
5.7
0.0
I-0.
0 -I
-
2.1
3.9
8.1
6.7
10.8
12.6 8.6
7.8
6.0
8.8
7.0
10.5 0.0
t
4.0
2.0
1.3
0.7
1.7
4.8
0.9
1.3
5.5
4.0
0.0
t0.
0 t
2.0
213
6.6
"1.
2
0.0
t0.
0 t
0.7
1.2
1.7
4.2
4.2
4.8
8.6
2.0
1.4
2.1
1.8
4.3
*
0.0
t
1.8
5.4
4.2
1.4
3.0
1.0
°1.
7
3.3
0.7
2.0
0.0
t3.
35.
5
0.0
t0.
0 t
4.3
0.0
t0.
0 t
1.4
2.0
2.7
1.7
2.4
1.2
0.0
t
5.8
4.3
6.1
5.1
6.2
0.0
t
1.4
0.6
0.2
0.4
1.9
0.1
0.4
0.9
0.1
1.8
18.4 0.0
t0.
5 *
0.0
t0.
0 t
0.2
*
0.0
t0.
0 t
0.4
0.9
*37 1.
21.
31.
08.
6
1.1
0.0
t0.
41.
40.
0 t
0.0
t
17.3
21.4
15.5
183
8.4
12.8
18.4
8.7
12.4
19.4 8.7
15.4
21.7 0.0
I-7.
015
.7 0.0
t10
0.0
118
.3
183
15.0
20.8
17.4
15.2
21.7
213
16.4
20.2
29.1
19.0
63.5

TA
BLE
2. T
ype
of H
ealth
Insu
ranc
e C
over
age
Am
ong
Adu
lts A
ged
18 to
64,
by
Dis
abili
ty a
nd H
ealth
Uni
ted
Sta
tus,
by
Gen
den
Sta
tes,
198
9
Priv
ate
insu
ranc
e an
dM
edic
are
and/
or M
edic
aid
Mili
tary
With
' Med
iJ M
edi-1
Med
icar
e 80
Med
i-14e
dii M
edic
are
&I
Mili
tary
& U
ndef
ined
1
With
Priv
ate
care
caid
Med
icai
dW
ithca
reca
idM
edic
aid
With
Mili
tary
Priv
ate
Pla
nsN
otP
opul
atio
n S
ampl
eP
rivat
eO
nly
Onl
yO
nly
Onl
y(1
,000
s)S
ize
(%)
(%)
(%)
(%)
(%)
Eith
erO
nly
Onl
yO
nly
Mili
tary
Onl
yO
nly
O11
.1)y
_In
smur
)el
(%)
(%)
(%)
(%)
(%)
(%)
(%)
(,7
Lim
ited
in o
ther
act
ivity
&E
xcel
lent
475
209
85.6
81.0
0.0
t0.
0t
0.4
0.9
0.5
0.0
t0.
0 t
6.0
1.8
4.2
0.0
t12
.1
Ver
y go
od77
132
984
.778
.80.
90.
0t
0.0
t2.
10.
90.
20.
0 t
6.0
1.1
*4.
90.
0 t
13.1
Goo
d67
430
476
.271
.80.
0 t
0.0
t03
4.8
133.
00.
34.
60.
54.
10.
418
.4
Fai
r28
012
774
370
.21.
20.
0t
0.0
t3.
80.
0 t
0.7
1.0
5.9
2.2
2.8
1.0
20.0
Poo
r65
3166
.754
.50.
G t
8.0
0.0
t17
.00.
0 t
7.1
0.0
t12
.36.
1'
4.3
0.0
t18
.2
Unk
now
n6
370
.470
.40.
0 t
0.0
T0.
0 t
0.0
t0.
0 t
0.0
t0.
0 t
0.0
t0.
0 t
0.0
1.0.
0 t
29.6
Not
lim
ited
in a
ctiv
ity &
Exc
elle
nt29
,581
12,8
7382
.781
.30.
10.
10.
0 t
!I 6
0.1
0.4
0.0
1.9
0.6
',.2
0.3
16.0
Ver
y go
od19
,286
8,51
481
379
.50.
20.
1'
0.0
1.3
0.1
0.8
0.0
2.0
0.6
1.4
0.3
16.9
Goo
d12
,445
5,51
473
.171
.10.
30.
10.
01.
80.
1 *
1.3
0.1
2.4
0.8
1.6
0.6
24.1
Fai
r1,
978
899
65.5
62.8
0.1
0.1
0.1
5.1
0.2
3.9
0.6
3.9
1.5
2.3
1.3
26.9
Poo
r22
498
49.0
42.1
2.9
0.5
0.0
t10
.70.
0 t
6.3
0.0
t6.
21.
73.
3 *
0.0
t42
.0U
nkno
wn
171
7963
.762
.40.
0 t
0.0
t0.
0 t
5.0
0.0
t5.
00.
0 t
1.3
*0.
0 t
1.3
0.0
t31
.4
All
Wom
en77
,197
35,9
6176
.974
.70.
60.
50.
17.
50.
55.
30.
4. 2
.21.
20.
90.
415
.3
Hea
lth S
tatu
sE
xcel
lent
26,6
8212
,219
83.0
81.5
0.2
030.
03.
20.
12.
40.
02.
21.
30.
90.
412
.8
Ver
y go
od23
,226
10,7
6381
.079
.30.
40.
40.
04.
80.
23.
50.
22.
21.
30.
90.
313
.4
Goo
d19
,336
9,11
071
.869
.60.
50.
70.
1 *
9.1
0.5
7.0
0.4
2.2
1.2
1.0
0.4
18.7
Fai
r5,
886
2,84
760
355
.42.
51.
00-
321
.01.
414
.11.
72.
31.
21.
10.
620
.7
Poo
r1,
800
895
41.5
31.9
5.3
2.2
1.2
44.6
5.8
23.6
6.0
2.7
1.4
0.8
0.2
21.0
Unk
now
n26
812
769
.268
.50.
0 t
0.7
0.0
t93
0.8
7.7
0.0
t0.
0 t
0.0
t0.
0 t
0.0
I-22
.2
Maj
or A
ctiv
ityU
nabl
e to
per
form
maj
or a
ctiv
ity2,
971
1,45
249
.639
.55.
22.
21.
640
.75.
619
.66.
12.
61.
11.
10.
517
.1
Lim
ited
in n
ount
/kin
d of
maj
or a
ctiv
ity4,
104
1,95
468
.262
.52.
41.
60.
416
.71.
59.
21.
52.
51.
11.
30.
517
.8
Lim
ited
in o
ther
act
ivity
3,23
81,
552
68.4
65.2
1.4
0.8
0.2
15.4
1.2
10.5
1.4
2.4
1.6
0.8
0.1
16.9
Not
lim
ited
in a
ctiv
ity66
,865
31,0
0379
.077
.403
0.4
0.0
5.1
0.2
4.2
0.1
2.2
1.2
6.9
0.4
14.9
Wor
k A
ctiv
ityU
nabl
e to
wor
k4,
113
2,01
149
338
.85.
823
1341
.24.
920
.95.
62.
71.
21.
10.
417
.4
Lim
ited
in a
mou
nt/k
ind
of w
ork
3,48
61,
643
72.4
69.0
0.8
1.2
0.3
9.7
0.5
6.3
0.7
2.5
1.3
1.1
0.5
"18
.4
Lim
ited
in o
ther
act
ivity
2,73
31,
304
713
683
1.2
0.8
0.2
°13
31.
68.
21.
32.
11.
20.
90.
416
.0
Not
lim
ited
in a
ctiv
ity66
,865
31,0
0379
.077
.403
0.4
0.0
5.1
0.2
4.2
0.1
2.2
1.2
0.9
0.4
14.9
Bas
ic L
ife A
ctiv
ities
Nee
ds h
elp
in s
elf c
are
(AD
L)41
519
843
.823
.710
.043
3.0
57.2
5.8
27.3
5.6
4.2
0.5
2.6
0.8
153
Nee
ds h
elp
in r
outin
e ac
tiviti
es (
IAD
L)1,
397
682
53.0
413
6.0
3.1
1.8
42.7
5.0
20.7
5.9
2.0
1.1
0.7
0.4
13.8
Not
lim
ited
in b
asic
life
act
iviti
es75
,385
35,0
8177
375
.60.
50.
40.
06.
60.
44.
90.
32.
21.
30.
90.
415
3W
ork
Act
ivity
& B
asic
Life
Act
iviti
esU
nabl
e to
wor
k &
Nee
ds h
elp
in s
elf c
are
(AD
L)34
916
941
.919
.810
.95.
33.
561
.15.
827
.76.
64.
20.
62.
40.
315
.9
Nee
ds h
elp
in r
outin
e ac
tiviti
es (
IAD
L)98
148
247
.934
.18.
12.
91.
950
.25.
923
.18.
02.
00.
80.
80.
313
.8
Not
lim
ited
in b
asic
life
act
iviti
es2,
784
1,36
050
.842
.84.
41.
70.
835
.54.
519
.24.
62.
81.
41.
10.
418
.8
Lim
ited
in a
mou
nt/k
ind
of w
ork
&N
eeds
hel
p in
sel
f car
e (A
DL)
3615
64.2
47.1
"9.
80.
0-I
0.0
i33
.80.
0 t
24.0
0.0
t7.
30.
0 t
7.3
'0.
0 t
11.8
*
Nee
ds h
elp
in r
outin
e ac
tiviti
es (
li,D
L)23
711
570
.265
.00.
81.
91.
716
.80.
910
.51.
12.
8 '
1.9
*0.
9 '
0.0
t15
.4
N,',
lim
ited
in b
asic
life
act
iviti
es3,
213
1,51
372
.769
.50.
71.
10.
28.
90.
5 "
5.7
0 6
2.4
1.3
1.1
0.5
18.7
Lim
ited
tn o
ther
act
ivity
/Cr
01" z cr tf Iz
vb"
...

TA
BL
E 2
. Typ
e of
Hea
lth I
nsur
ance
Cov
erag
e A
mon
g A
dults
Age
d 18
to 6
4, b
y D
isab
ility
and
Hea
lth S
tatu
s,by
Gen
der:
Uni
ted
Stat
es, 1
989
Popu
lado
n Sa
mpl
e(1
,000
s)Si
ze
With
Priv
ate
(%)
With
'Pr
ivat
eO
nly
(%)
Priv
ate
insu
ranc
e an
dM
edic
are
and/
or M
edic
aid
Mili
tary
Und
efin
edPl
ans
04,)1y
Not
Insm
ur)e
d
Med
i-1
Med
il M
edic
are
&ca
reca
idM
edic
aid
Onl
yO
nly
Onl
y(%
)(%
)(%
)
With
Eith
er(%
)
Med
i-1
Med
il M
edic
are
&I
care
caid
Med
icai
dO
nly
Onl
yO
nly
(%)
(%)
(%)
Mili
tary
&W
ithM
ilita
ryPr
ivat
eM
ilita
ryO
nly
Onl
y(%
)(%
)(%
)
Nee
ds h
elp
in s
elf
care
(A
DL
)30
1440
740
.70.
0 t
0.0
t0.
0 t
39.6
12.9
26.7
0.0
t0.
0 1-
0.0
t0.
0 t
6.9
12.7
Nee
ds h
elp
in r
outin
e ac
tiviti
es (
IAD
L)
171
8059
.550
.81.
45.
91.
434
.95.
320
.90.
0 t
1.3
1.3
0.0
t1.
211
.8N
ot li
mite
d in
bas
ic li
fe a
ctiv
ities
2,53
21,
210
72.4
69.8
120.
40.
111
.61.
27.
11.
42.
21.
20.
90.
316
.3N
ot li
mite
d in
act
ivity
&N
eeds
hel
p in
sel
f ca
re (
AD
L)
o0
0.0
t0.
0 t
0.0
t0.
0t
0.0
t0.
0 t
0.0
t0.
0 t
0.0
t0.
0 t
0.0
t0.
0 t
0.0
t0.
0 t
Nee
ds h
elp
in r
outin
e ac
tiviti
es (
IAD
L)
95
28.1
28.1
0.0
t0.
0t
0.0
t57
.912
.121
.224
50.
0 t
0.0
t0.
0 t
0.0
t14
.0N
ot li
mite
d in
bas
ic li
fe a
ctiv
ities
66,8
5630
,998
79.0
773
0.3
0.4
0.0
5.1
0.2
420.
12.
21.
20.
90.
414
.9W
ork
Act
ivity
& H
ealth
Sta
tus
Una
ble
to w
ork
&E
xcel
lent
156
7358
.350
.94.
10.
62.
723
.71.
4 *
12.2
2.6
0.0
t0.
0 t
0.0
t0.
0 t
25.4
Ver
y go
od34
216
060
.452
.13.
41.
91.
929
.07.
08.
25.
63.
51.
80.
50.
0 t
16.5
Goo
d1,
026
485
55.8
472
3.8
2312
*30
.63.
814
.74.
63.
01.
51.
30.
0 t
19.4
Fair
1,35
867
950
.939
36.
91.
91.
143
.44.
224
34.
82.
30.
61.
60.
914
2Po
or1,
215
606
38.0
25.7
7.3
3.0
1.3
53.2
6.5
26.7
7.7
3.1
1.7
0.7
0.4
18.4
Unk
now
n16
840
.740
.70.
0 t
0.0
t0.
0 t
463
13.6
32.7
0.0
t0.
0 t
0.0
t0.
0 t
0.0
t13
.0L
imite
d in
am
ount
/kin
d of
wor
k &
Exc
elle
nt33
71c
475
.973
.10.
0 t
0.8
0.6
9.2
0.7
5.8
1.3
1.9
0.5
1.3
*0.
0 t
15.9
Ver
y go
od76
734
979
.077
.203
0302
5.2
0.3
3.6
0.6
2.8
1.8
1.0
*0.
314
.4G
ood
1,29
160
572
.868
.60.
81.
802
9.7
035.
90.
42.
71.
41.
30.
718
.3Fa
ir89
343
367
.764
.113
1203
13.2
0.4
9.2
0.7
1.8
1.1
0.8
0.5
20.4
Poor
186
9359
.154
.71.
00.
0t
1.1
11.8
137.
01.
23.
71.
42.
30.
0 t
29.7
Unk
now
n12
766
.149
.8 *
0.0
t16
30.
0 t
163
0.0
t0.
0 t
0.0
t0.
0 t
0.0
t0.
0 t
0.0
t33
.9L
imite
d in
oth
er a
ctiv
ity &
Exc
elle
nt34
916
079
376
.80.
50.
70.
0 t
4.9
0.0
t3
7 "
0.0
t3.
82.
51.
30.
713
.9V
ery
good
670
317
81.8
77.7
0.8
1.9
*03
8.5
0.7
430.
32.
91.
31.
30.
311
.0G
ood
963
463
74.2
72.5
0.7
0.7
0.0
t10
.80.
83.
00.
61.
31.
00.
20.
215
.2Fa
ir56
927
358
.254
32.
90.
0t
0.0
t19
.52.
011
.82.
9 "
2.0
1.0
*1.
00.
723
.4Po
or17
086
41.1
36.2
27 '
0.0
t15
443
11.8
22 9
5.9
1.3
0.0
t1.
3 4
0.0
t18
3U
nkno
wn
125
65.5
65.5
0.0
t0.
0t
0.0
t0.
0 t
0.0
t0.
0 t
0.0
t0.
0 t
0.0
t0.
0 t
0.0
t34
.5N
ot li
mite
d in
act
ivity
&E
xcel
lent
25,8
3911
,830
833
81.9
0.2
030.
0 "
2.9
0.1
230.
02.
21.
30.
90.
412
.6V
ery
good
21,4
479,
937
81.4
79.9
030.
40.
0 t
430.
13.
40.
12.
21.
20.
90.
31.
4G
ood
16,0
567,
557
72.7
71.0
0.2
030.
0 t
7.6
0.2
.6.
60.
12.
21.
21.
00.
418
.8Fa
ir3,
065
1,46
262
.660
20.
80.
70.
0 t
13.6
0.3
11.5
0.3
*2.
51.
50.
90.
523
.2Po
or22
911
045
.843
.00.
81.
10.
925
.81.
120
.81.
20.
9 *
0.9
0.0
t0.
0 t
30.2
Unk
now
n22
810
771
.671
.60.
0 t
0.0
t0.
0 t
6.8
"0.
0 t
6.8
0.0
t0.
0 t
0.0
t0.
0 t
0.0
t21
.6
Sour
ce: N
atio
nal H
ealth
Int
ervi
ew S
urve
y (a
utho
r's ta
bula
tions
fro
m p
ublic
use
tape
s).
Not
e: S
tand
ard
erro
rs f
or e
stim
ates
app
ear
in A
ppen
dix
TA
BL
E 1
1-2.
Exc
ludi
ng m
ilita
ry.
Est
imat
e ha
s lo
w s
tatis
tical
rel
iabi
lity
(rel
ativ
e st
anda
rd e
rror
> 3
0%).
t Est
imat
e is
exa
ctly
0 o
r st
anda
rd e
rror
is in
dete
rmin
ate.
V1

s 7
TA
BLE
3. T
ype
of H
ealth
Insu
ranc
e C
over
age
Am
ong
Chi
ldre
n A
ged
0 to
17,
by
Soc
iode
mog
raph
ic S
tatu
s, b
y G
ende
n U
nite
d S
tate
s, 1
989
Tot
alA
ge 0-4
year
s5-
17 y
ears
Rac
e Whi
teB
lack
Oth
erE
thni
city
His
pani
cN
on-H
ispa
nic
Fam
ily In
com
eU
nder
$5,
000
55,0
00-5
6.99
957
,000
-59,
999
510,
000-
514.
999
$15,
000-
$19,
999
520,
000-
524,
999
S25
,000
-$34
,999
535,
0000
-549
,999
$50,
000
or m
ore
Pov
erty
Lev
elU
nder
0.5
00.
50 to
und
er 1
.00
1.00
to u
nder
1.2
51.
25 to
und
er 1
.50
1.50
to u
nder
1.7
51.
75 to
und
er 2
.00
2.00
and
aho
y,.
Age
and
Pov
erty
Lev
el0-
4 ye
ars
and
Und
er 0
.50
0.50
to u
nder
1 0
01.
00 to
und
er 1
.25
1.25
to u
nder
1.5
01.
50 to
und
er 1
.75
1.75
to u
nder
2.0
02.
00 a
nd a
bove
5-17
yea
rs a
ndU
nder
0.5
00.
50 to
und
er 1
.00
1.00
to u
nder
1.2
51.
25 to
und
er 1
.50
1.50
to u
nder
1.7
51.
75 to
und
er 2
.00
2 00
and
abo
ve
With
Pop
ulat
ion
Sam
ple
Priv
ate
(1,0
00s)
Siz
e
With
1
Priv
ate
Onl
y
Priv
ate
insu
ranc
e an
d
Med
i-1ca
re
Onl
y
Med
i-1 M
edic
are
&I
caid
Med
icai
d
Onl
yO
nly
Med
icar
e an
d/or
Med
icai
d
With
Eith
er
Med
i-1ca
re
Onl
y
Mili
tary
Med
i-1 M
edic
are
Scl
caid
Med
icai
dW
ithO
nly
Onl
yM
ilita
ry
Mili
tary
dc
Mili
tary
Priv
ate
Onl
yO
nly
Und
e&ne
d1
Pla
nsN
otO
nly
Insu
red
64,0
0531
,524
712
69.6
0.1
1.1
0.0
18,7
699,
146
66.7
65.2
0.1
*45
,236
22,,7
873
.171
30.
0
51,6
129,
959
2,43
4
24,7
015,
680
1,14
3
75.7
51.1
58.0
743
48.2
55.9
7,94
83,
744
46.6
45.2
56,0
5727
,780
74.7
73.0
2,85
92,
116
3,27
36,
162
6,91
75,
131
12,8
9613
,394
11,2
56
4,43
374
344,
476
4,75
78,
594
11,7
3722
,574
1,55
32,
348
1348
1,30
92,
205
3,15
76,
849
2,88
05,
087
3,12
83,
448
6,38
88,
580
1,7
25
1,51
51,
079
1,74
13,
112
3,43
92,
542
6,25
96,
496
5341
2321
3,88
72,
307
2,36
94,
204
5,69
210
,744 81
21,
213
675
648
1,06
11,
529
3,20
8
1,50
92,
674
1,63
21,
721
3,14
34,
163
7,53
6
14.7
16.3
21.1
38.9
60.1
74.4
84.2
90.9
953
13.0
26.0
52.4
63.8
79.1
86.6
91.8 93
22.1
45.6
58.0
76.2
81.9
90.8
15.0
27.8
55.3
66.0
80.1
883
92.3
11.2
10.7
17.4
37.0
58.1
73.2
83.4
89.5
943
9.3
22.9
50.4
62.2
77.8
85.4
90.7 7.3
19.6
42.7
55.7
74.8
80.6
90.1
10.4
24.5
53.6
64.7
78.9
87.2
90.9
0.0
0.0
0.5
1.1
1.1
0.9
2.2
0.5
0.0
0.0
0.0
0.1
0.0
-t
12.0
0.1
10.6
0.1
2.2
1.6
15.1
0.1
13.7
10.7
0.1
93
83 293
19.4
0.1
03 *
0.0
1-
7.2
26.5
18.0
0.0
1.0
0.1
18.3
0.2
16.8
0.1
1.1
0.2
11.1
0.1
9.7
0.0
1-0.
0 t
0.0
1-0.
0 t
0.1
"0.
00.
00.
00.
1
0.0
t0.
0 1-
0.1
0.1
0 1
0.1
0.0
0.0
t0.
0 t
0.3
03 0.0
0.1
0.0
t
0.0
t0.
0 t
0.1
0.0
0.1
0.1
0.0
33 4.7
3.7
1.6
1.7
0.9
03 0.5
0.3
3.6
2.7
1.7
1.4
0.9
0.5
0.4
1.9
2.4
2.1
2.0
1.2
0.6
0.4
4.4
2.9
1.6
1.1
0.7
0.4
0.3
0.1
0.0
t0.
0 t
0.0
1-0.
00.
0 t
0.0
0.0
1-0.
0 1
al 0.0
t0.
0 t
0.0
t0.
10.
00.
0 t
0.0
t0.
0 t
0.0
t0.
0 t
0.1
0.0
t0.
0 t
0.1
0.0
t0.
0 1-
0.0
t0.
00.
0 1-
0.0
1-
62.7
55.4
49.2
213
10.9
6.2
2.7
1.8
0.9
61.0
38.1
15.6 8.8
5.5
2.2
1.2
65.4
42.5
20.6
13.1 6.2
3.8
1.6
58.6
36.1
13.4
7.2
5.2
1.7
1.0
0.2
0.0
t03 0.
00.
10.
20.
10.
10.
1
0.3
0.1
0.1 0.0
t0.
2 *
0.1
0.0
0.1
0.1
0.2 0.0
t0.
5 *
0.1
0.0
0.4
0.0
0.1
0.0
t0.
10.
10.
0
58.2
503
45.2
19.5
8.9
4.9
2.2
1.2
0.4
56.4
353
13.4 7.2
4.2
1.5
0.8
63.1
39.9
18.0
10.7
4.3
2.9
1.1
52.8
33.2
11.5
5.8
4.1
1.0
0.6
0.0
0.1
*
0.0
0.1
0.4
2.4
2.1
0.2
2.1
1.5
0.6
2.1
23 2.8
1.6
1.6
1.7
0.4
0.6
1.1
0.2
*1.
81.
403
0.0
2.2
1.7
0.5
0.7
0.4
0.0
0.1
*0.
0 1
0.0
1-0.
0 -(
-0.
00.
0 1-
0.5
0.0
0.1
0.1
0.0
0.0
t0.
0 t
03 0.0
0.0
t0.
0 1-
0.0
0.0
t0.
0 1-
0.7
0.0
0.1
0.1
0.0 0.0
t0.
0 t
0.5
1.8
1.2
23 2.9
3.7
23 2.4
1.2
0.5
1.6
2.8
2.5
2.9
2.3
2.1
0.9 13
*4.
43.
52.
92.
92.
0
03 1.7
2.0
2.1
2.8
2.0
2.2
0.4
0.8
1.2
*2.
02.
63.
41.
91.
50.
7
0.4
*1.
22.
5 *
2.3
2.6
1.6
1.4
0.9
*1.
2 *
3.7
3.4
2.9
23 1.7
0.1
1.2
2.0
*1.
92.
51.
41.
2
0.0
t1.
00.
0 t
0.2
0.2
*03 0.
40.
905 0.
0 t
03 0.2
0.1
02 0.6
0.8
0.0
t0.
00.
6 *
0.0
f0.
10.
5 *
02 *
0.0
t0.
50.
0 t
0.1
03 0.6
1.0
0.6
15.8
0.7
16.7
0.5
15.4
0.5
0.8
1.7
14.9
19.5
20.2
0.7
34.1
0.4
13.2
0.9
0.9
0.8
1.0
1.0
0.8
0.5
03 "
0.1
0.9
0.9
0.6
1.1
0.3
0.5
0.4
1.5
1.4
*1.
20.
6 *
0.4
*0.
503
*
0.6
0.6
0.4
1.2
0.3
0.5
0.4
24.8
31.3
31.4
38.4
27.2
16.2
11.1 6.1
3.5
28.4
36.5
30.7
25.5
13.6
9.7
5.6
24.8
353
31.2
27.1
15.8
12.2
6.0
303
37.1
30.5
24.8
12.8 8.7
5.4

TA
BL
E 3
. Te
of H
ealth
Ins
uran
ce C
over
a e
Am
on C
hild
ren
A e
d 0
to 1
7, b
Soc
iode
mo
ra h
ic S
tatu
s, b
Gen
der:
Uni
ted
Stat
es, 1
989
All
Boy
sA
ge 0-4
year
s9,
607
4,60
767
.265
.60.
113
0.0
14.7
0.1
13.1
0.1
2.4
2.0
030.
716
.75-
17 y
ears
23,1
4611
,433
73.2
713
0.1
1.2
0.0
105
0.1
9.1
0.1
*2.
21.
50.
70.
515
.6R
ace W
hite
26,4
7112
,626
76.1
74.6
0.0
0.9
0.0
7.9
0.0
6.8
0,0
2.2
1.6
0.5
0.5
14.8
Bla
ck5,
052
2,83
850
.747
.10.
12.
70.
129
.802
26.5
022.
31.
40.
801
20.2
Oth
er1,
230
576
55.1
53.2
0.4
030.
0 f
19.1
0.0
f18
.003
4.2
3.0
1.2
*2.
421
.2E
thni
city
His
pani
c3,
958
1,87
446
.945
.50.
0 f
1.1
0.1
17.7
0.1
16.2
0.3
1.8
Non
-His
pani
c28
,795
14,1
6674
.872
.90.
11.
20.
210
.9O
. I9.
50.
0 *
23Fa
mily
Inc
ome
Und
er $
5,00
01,
465
762
14.1
10.4
0.0
f3.
40.
263
.80.
259
.10.
8 "
0.1
0.1
AO
1-
1,0
24.8
$5,0
00-5
6,99
994
849
514
.78.
80.
0 t
430.
0 t
55.7
0.0
t50
.90.
423
0.7
1.6
1.6
31.7
57,0
00-S
9,99
91,
668
879
20.3
16.1
0.0
t4.
20.
0 t
48.3
0.1
44.0
0.0
-I1.
21.
20.
0 t
0.9
335
S10,
000-
$14,
999
3,12
61,
557
39.9
37.9
0.0
1-1.
80.
0 f
20.7
0.0
1-18
.60.
22.
523
0.2
0.7
38.2
515,
000-
519,
999
3,64
81,
807
59.7
57.6
0.1
1.6
0.1
11.5
0.1
9.4
0.0
f2.
623
0.2
1.0
27.4
520,
000-
524,
999
2,52
71,
256
75.4
74.1
0.0
f0.
90.
0 t
5.8
0.1
4.7
0.0
f4.
03,
50.
40.
915
352
5,00
0-53
4,99
96,
710
3,23
983
.582
.50.
10.
30.
0 f
2.8
0.0
2.3
0.0
f2.
72.
00.
60.
611
.683
5,00
0-54
9,99
96,
845
3,30
791
.189
.30.
10.
70.
0 t
1.7
0.0
1.0
0.0
f2.
61.
51.
10.
26.
1$3
0,00
0 or
mor
e3,
816
2,73
893
394
.20.
1 *
0.4
0.0
f0.
90.
00.
50.
0 f
1.2
0.6
0.6
0.1
3.5
Pove
rty
Lev
elU
nder
0.5
02,
191
1,13
612
.69.
10.
0 f
3.4
0.2
60.8
0256
.40.
60.
10.
10.
0 f
1328
.70.
50 to
und
er 1
.00
3,72
21,
945
26.3
22.9
0.0
t2.
90.
0 t
38.1
0.0
f35
.00.
11.
71.
20.
40.
7 *
36.6
1.00
to u
nder
1.2
52,
218
1,13
451
.149
.40.
11.
50.
0 f
15.6
0.1
13.8
0.2
*2.
42.
20.
20.
731
.91.
25 to
und
er 1
.50
2,54
41,
264
64.5
62.8
0.1
1.7
0.0
t9.
60.
0 t
7.6
0223
2.2
0.0
f0.
724
.71.
50 to
und
er 1
.75
4,36
52,
124
78.1
76.6
0.1
0.9
0.0
5.8
0.2
4.5
0.0
t3.
22.
803
0.2
14.2
1.75
to u
nder
2.0
06,
098
2,94
186
.485
.10.
10.
50.
0 1-
2.0
0.0
1.2
0.0
-12.
51.
70.
70.
79.
82.
00 a
nd a
bove
11,6
153,
496
92.0
90.6
0.0
0.5
0.0
t1.
10.
00.
50.
0 f
2 1
1.4
0.9
0.4
5.7
Age
and
Pov
erty
Lev
el0-
4 ye
ars
and
Und
er 0
.50
796
417
9.4
7.6
0.0
f1.
80.
0 f
63.9
0.2
"61
.30.
50.
20.
20.
0 f
2.0
*26
30.
50 to
und
er 1
.00
1,17
660
824
.121
.10.
0 1-
3.0
0.0
t42
.40.
0 t
39.3
0.1
0.9
0.9
0.0
t1.
3 "
34.4
1.00
to u
nder
1.2
564
732
046
.144
.00.
31.
20.
0 t
18.7
0.4
16.8
0.0
.14.
13.
50.
61.
431
.81.
23 to
und
er 1
.50
735
354
59.8
57.4
032.
10.
0 t
13.0
0.0
f10
.30.
0 t
3.9
3.6
*0.
0 t
0.0
t26
.01.
50 to
und
er 1
.75
1,11
552
675
.273
.80.
11.
00.
27.
00.
25.
50.
0 I-
3.5
330.
20.
215
.61.
73 to
und
er 2
.00
1,65
478
182
.080
.10.
10.
90.
0 f
3.7
0.1
2.4
0.0
f3.
223
0.8
*0.
712
42.
00 a
nd a
bove
3.48
41,
601
91.0
90.0
0.0
t0.
60.
0 f
1.4
0.0
t0.
70.
0 1-
2.1
1.7
030.
46.
15-
17 y
ears
and
Und
er 0
.50
1,39
371
914
.49.
90.
0 -1
4.3
0359
.00.
253
.70.
60.
10.
1 *
0.0
-I0.
930
.10.
50 to
und
er 1
.00
2,54
61,
337
27.3
23.7
0.0
t2.
90.
0 f
36.0
0.0
t33
.00.
12.
01.
40.
60.
537
.71.
00 to
und
er 1
.25
1,57
181
453
.251
.60.
0 f
1.6
0.0
f14
.30.
0 f
12.5
0.2
1.7
1.7
°0.
0 f
0.4
32.0
1.23
to u
ndo.
150
1,80
991
066
.463
.00.
0 t
1.5
0.0
182
0.0
f6.
30.
2 *
1.7
1.7
0.0
1-1.
024
.21.
50 to
und
er 1
.75
3,23
01,
598
79.1
77.6
0.2
0.9
0.0
f5.
40.
24.
10.
0 f
3.1
2.7
030.
213
.71.
75 to
und
er 2
.00
4,44
42,
160
88 1
86.9
0.0
0.4
0.0
f1.
30.
0 f
0.8
0.0
1-2.
31.
50.
70.
68.
92.
00 a
nd a
bove
8,13
13,
895
92.4
90.7
0.0
0.5
0.0
1-1.
00.
00.
50
0 f
2 4
1 2
1.2
0.4
5.4
Priv
ate
insu
ranc
e an
d1
With
Med
i-1
Med
i-1
Med
icar
e &
IM
edi-
1M
edij
Med
icar
e &
1M
ilita
ry &
Und
efin
ed1
With
Priv
ate
care
caid
Med
icai
dW
ithca
reca
idM
edic
aid
With
Mili
tary
Priv
ate
Plan
sN
otPo
pula
tion
Sam
ple
Priv
ate
Onl
yO
nly
Onl
yO
nly
Eith
erO
nly
Onl
yO
nly
Mili
tary
Onl
yO
nly
Onl
yIn
sure
d(1
,000
s)Si
ze%
%%
%%
%%
%%
%%
%%
%
Med
icar
e an
d/or
Med
icai
dM
ilita
ry
32,7
5316
,040
71.4
69.6
0.1
1.2
0.0
11.7
0.1
103
0.1
231.
70.
60.
615
.9
1.5
1.7
0.4
0.6
0.8
34.4
0.4
133

TA
BL
E 3
. Typ
e of
Hea
lth I
nsur
ance
Cov
erag
e A
mon
g C
hild
ren
Age
d 0
to 1
7, b
y So
ciod
emog
raph
ic S
tahi
s, b
y G
ende
r: U
nite
d St
ates
, 198
9
All
Gir
lsA
ge 0-4
year
s5-
17 y
ears
Rac
e Whi
teB
lack
Oth
erE
thni
city
His
pani
cN
on-H
ispa
nic
Fam
ily I
ncom
eU
nder
$5,
000
$5,0
00-$
6,99
9S7
,000
-$9,
999
510,
000-
$14,
999
$15,
000-
519,
999
520,
000-
524,
999
525,
000-
$34,
999
535,
000-
549,
999
$50,
000
or m
ore
Pove
rty
Lev
elU
nder
0.5
00.
50 to
und
er 1
.00
1.00
to u
nder
1.2
51.
25 to
und
er 1
.50
1.50
to u
nder
1.7
51.
75 to
und
er 2
.00
2.00
and
abo
veA
ge a
nd P
over
ty L
evel
0-4
year
s an
dU
nder
0.5
00.
50 to
und
er 1
.00
1.00
to u
nder
1.2
51.
25 to
und
er 1
.50
1.50
to u
nder
1.7
51.
75 to
und
er 2
.00
2.00
and
abo
ve5-
17 y
inrs
&U
ndør
0.5
00.
50 to
und
er 1
.00
1.00
to u
nder
1.2
51.
25 to
und
er 1
.50
1.50
to u
nder
1.7
51.
75 to
und
er 2
.00
2 00
and
abo
ve
With
Popu
latio
nSa
mpl
ePr
ivat
e(1
,000
s)Si
ze
With
Priv
ate
Onl
y
Priv
ate
insu
ranc
e an
d
Mec
li-1
care
Onl
y
Med
i-1
caid
Onl
y
Med
icar
e tc
1M
edic
aid
Onl
y
Med
icar
e an
d/or
Med
icai
d
With
Eith
er
Med
i-1
Med
i-1
care
add
Onl
yO
nly
Mili
tary
Med
icar
e &
IM
edic
aid
With
Mili
tary
Onl
yM
ilita
ryO
nly
Mili
tary
&Pr
ivat
eO
nly
Und
efir
ied1
Plan
sN
otO
nly
Insu
red
31,2
5215
,484
71.0
9,16
24,
539
66.1
22,0
9010
,945
73.0
25,1
414,
907
1,20
4
12,0
752,
842
.56
7
75.3
51.6
60.8
3,99
01,
870
46.4
27,2
6213
,614
74.6
1,39
41,
168
1,60
63,
036
3,26
92,
604
6,18
76,
549
5,44
0
2,24
33,
712
2,25
82,
212
4,22
95,
639
10,9
59 757
1,17
170
157
41,
090
1,50
333
65
1,48
52,
541
1,55
71,
638
3,13
94,
136
7,59
5
753
584
862
1,55
51,
632
1286
3,02
03,
189
2,60
3
1,18
51,
942
1,17
31,
105
2,08
02,
751
5,24
8
395
605
355
294
535
748
1,60
7
790
1,33
781
881
11,
545
2,00
33,
641
153
17.7
22.0
37.8
60.6
73.4
84.9
90.7
95.2
13.4
25.8
53.6
62.9
80.1
86.7
91.7 9.1
20.1
452
55.6
77.2
81.7
90.6
15.6
28.4
57.4
655
81.1
88.5
92.2
69.5
0.0
1.0
0.0
12.2
0.1
10.9
0.0
2.0
1.6
0.4
64.9
0.1
1.0
0.0
t15
.50.
214
.271
.50.
01.
00.
010
.80.
19.
5
74.0
493
58.7
0.0
0.0
0.5
0.9
1.7
0.7
0.0
t0.
10.
0 t
45.0
0.0
1.0
0.1
73.1
0.0
1.0
03-
12.1
0.0
t3.
20.
0 t
12.2
0.0
t5.
00.
0 t
18.7
0.0
+33
0.0
t36
.10.
0 t
1.4
0.0
+58
.70.
0 t
1.7
0.0
t72
.20.
01.
00.
0 t
843
0.0
030.
089
.60.
0 t
0.3
0.0
t94
.50.
20.
10.
0 t
9.6
23.0
513
61.6
79.1
85.8
90.9 7.0
18.2
41.4
53.5
75.8
81.1
903
11.0
25.2
55.7
64.4
80.2
87.4
91.2
0.0
t0.
0 -I
0.2
0.1
0.0
0.1
0.0
t
0.0
10.
0 t
03 03 0.0
t0.
10.
0
0.0
t0.
0 t
0 1
0.1
0.1
0.1
0.0
3.8
2,5
2.0
1.0
0.8
0.4
0.2
2.1
1.9
2.9
1.8
1.4 03 0.2
4.6
2.8
1.6
0.7
0.6
0.4
0.2
0.0
t0.
0 t
0.0
t0.
0 t
0.1 0.0
t0.
0 t
0.0
0.0
t0.
0 1-
0.0
t0.
0 t
0.0
t0.
0
0.0
t00 0.
0 t
0.0
0.1
0.0
0.0
+
8.6
28.8
19.7
0.1
0.4
0.0
18.8
0211
20.
1
61.5
55.2
50.2
22.0
103
65 2.7
1.9
0.8
612
38.2
15.5 8.0
5.1
2.6
13 67.1
42.6
22.4
133
53 4.0
1.9
58.2
36.2
12.4 6.1
5.0
2.0
1.0
0.2
0.0
t05 0.
10.
1 03 0.1
0.1
0.1
0.4
0.1 02 0.0
t03 02 0.
0
0.0
t0.
10.
0 t
0.0
t0.
80.
10.
1 05 0.1 03 0.0
t0.
1 02 0.0
+
7.5
26.5
18.1
0.0
t23
2.1
0.1
0.1
1.9
1.4
0.5
0.0
0.1
0.5
2.0
23 1.4
1.6
1.9
0.5
03 0.4
1.0
17.4
0.2
1.7
1303
9.9
0.0
2.1
1.7
0.4
57.3
49.7
46.4
20.4
8.4
5.1
2.2
1.5
0.4
56.4
35.5
13.1 6.7
3.9
1.8
1.0
65.0
40.4
19.0
11.2
3.1
3.5
1.6
52.0
333
105
5.1
4.1
1.2
0.8
0.6 03 0.0
t0.
00.
0 t
0.0
t0.
0 t
0.0
0.0
+
0.5
0.0
0.0
+0.
00.
00.
0 +
0.0
t
0.0
t0.
00.
0 '
0.0
t0.
0 t
0.0
t0.
0 +
0.8
0.0
t0.
0 t
0.1
0.0
0.0
10
f
1.1
"1.
51.
1 22 3.2
3.5
1.9
22 1.2
0.9
1.4
3.1
2.8
2.5
2.0
1.9
1.7
1.7
4.7
3.1
2.4
2.6
1.8
0.5 13 2.4
2.7
2.5
1.8
2.0
0.7
'0.
81.
11.
82.
933 1.
71.
40.
8
0.7
1.1
2.8
2.4
23 15 1.4
1.7
1.5
3.8
31 2.4
2.3
1.7
0.1
1.0
2.4
2.1 23 12 13
0.0
t0.
50.
0 t
0.4
0.2
0.1 02 0.8
0.4
0.0
t0.
30.
20.
20.
10_
50.
6
0.0
t0.
10.
60.
0 t
0.0
+0.
20.
1
0.0
t0.
30.
0 t
03 0.2
0.6
0.8
0.5
15.7
0.6
16.7
0.5
15.3
0.5
0.8
0.9
15.0
18.7
193
0.6
33.8
0313
.1
0.8
0.3
0.7 12 1.0
0.7
0.4
0.3
0.1
0.5
1.0
0.6
1.5
0.4
03 *
0.4
1.1
*1.
51.
01.
40.
50.
20.
2 *
0.2
0.8
0.4
1.5
0.4
03 0.4
24.8
30.9
29.2
38.6
27.0
17.1
10.7
6.0
3.4
28.0
36.4
29.6
263
13.0
9.5
5.5
23.2
36.2
30.7
28.6
16.0
12.1 5.8
30.4
36.5
29.0
25.5
11.9 8.5
5.4
Sour
ce: N
atio
nal I
lcal
th I
nter
view
Sur
vey
(aut
hor's
tabu
latio
ns f
rom
pub
lic u
se ta
pt...
).N
ote:
Sta
ndar
d er
rors
for
mtim
ates
app
ear
in A
ppen
dix
TA
BL
E 1
3-3
I E
xclu
ding
mili
tary
.E
stim
ate
has
low
sta
tistic
al r
elia
bilit
y (r
elat
ive
stan
dard
err
or30
%).
t Est
imat
e L
s ex
actly
0 o
r st
anda
rd e
rror
is in
dete
rnun
ate.

T A
BL
E 4
.T
ype
of H
ealth
Ins
uran
ce C
over
age
Am
ong
Chi
ldre
n A
ged
0 to
17,
by
Dis
abili
ty a
nd H
ealth
Sta
tus,
by
Gen
der:
Uni
ted
Stat
es, 1
989
Popu
latio
n Sa
mpl
e(1
,000
s)Si
ze
With
Priv
ate
Priv
ate
(%)
With
1
Onl
y(%
)
Priv
ate
insu
ranc
e an
dM
edic
are
and/
or M
edic
aid
Mili
tary
Plan
sO
nly
(%)
Not
Insu
red
(%)
Med
i-1
Med
i-1
Med
icar
e &
1ca
reca
idM
edic
aid
Onl
yO
nly
Onl
y(%
)(%
)(%
)
With
Eith
er(%
)
Med
i- M
edi-
1 M
edic
are
&I
care
caid
Med
icai
dO
nly
Onl
yO
nly
(%)
(%)
(%)
Mili
tary
& U
ndef
ined
With
Mili
tary
Priv
ate
Mili
tary
Onl
yO
nly
(%)
(%)
(%)
To
tal
64,0
0531
,524
71.2
69.6
0.1
"1.
10.
012
.00.
110
.60.
12.
21.
60.
50.
615
.8A
ge 0-4
year
s18
,769
9,14
666
.765
.20.
11.
10.
015
.10.
113
.70.
024
2.1
020.
716
.75-
17 y
ears
45,2
3622
,378
73.1
713
0.0
1.1
0.0
10.7
0.1
930.
1 "
2.1
1.5
0.6
0.5
15.4
Hea
lth S
tatu
sE
xcel
lent
33,7
4716
,494
77.3
75.9
0.1
0.9
0.0
1-7.
90.
16.
90.
02.
31.
80.
50.
513
.5V
ery
good
17,0
528,
406
71.0
69.4
0.0
1.1
0.0
*12
.10.
110
.70.
11.
91.
603
0.6
16.0
Goo
d10
,902
5,49
556
.554
.00.
0 *
1.7
0 0
21.2
0.2
192
0.0
*2.
21.
40.
70.
821
.9Fa
ir1,
472
727
50.2
47.7
0.0
t2.
21.
0 t
30.7
0.2
27.8
0.3
*1.
61.
203
*0.
719
.5Po
or19
092
33.2
32.2
0.0
t1.
00.
0 t
36.6
0.0
t35
.50.
0 t
0.0
t0.
0 t
0.0
t0.
0 t
313
Unk
now
n64
331
068
.267
.003
0.9
0.0
t13
.50.
0 t
12.3
0.0
t1.
61.
60.
0 t
0.2
17.8
Maj
or A
ctiv
ityU
nabl
e to
per
form
maj
or a
ctiv
ity34
617
153
.949
.50.
0 t
4.4
0.0
t32
.10.
6 *
25.9
0.0
t1.
80.
60.
0.
0.7
17.1
Lim
ited
in a
mou
nt/k
ind
of m
ajor
act
ivity
2,09
71,
032
58.2
543
033.
10.
226
.30.
122
30.
2 *
1.6
1.1
030.
217
.8L
imite
d in
oth
er a
ctiv
ity99
449
770
.468
.10.
0 t
1.4
0217
.80.
0 t
163
0.0
t2.
1 "
130.
80.
611
.4N
ot li
mite
d in
act
ivity
60,5
6729
,824
71.8
70.2
0.0
1.0
0.0
113
0.1
10.0
0.1
2.2
1.7
0.5
0.6
15.8
Bas
ic L
ife
Act
iviti
esN
eeds
hel
p in
sel
f ca
re (
AD
L)-
ages
5-1
719
489
46.6
383
0.0
t4.
813
49.9
0.0
+43
.70.
0 t
2.0
0.0
t2.
00.
0 t
9.7
Not
lim
ited
in b
asic
life
act
iviti
es63
,811
31,4
3571
.369
.70.
1 *
1.1
0.0
*11
.80.
110
50.
12.
21.
70,
50.
615
.8M
ajor
Act
ivity
& H
ealth
Sta
tus
Una
ble
to p
erfo
rm m
ajor
act
ivity
&E
xcel
lent
4672
76.4
76.4
0.0
t0.
00.
0 +
0.0
t0.
00.
0 1-
0.0
t4.
74.
7 *
0.0
t0.
018
.9V
ery
good
5928
42.7
38.8
0.0
t3.
90.
0 t
283
*0.
0 1
24.4
0.0
t0.
0 t
0.0
1-0.
0 1-
4.0
28.9
*G
ood
8242
63.0
523
0.0
t10
.70.
0 t
32.5
0.0
I-19
.10.
0 t
2.6
0.0
0.0
t0.
015
.2Fa
ir10
754
53.2
51.2
0.0
2.1
0.0
t38
31.
832
30.
0 t
1.9
0.0
t0.
00.
010
.5Po
or44
2132
.127
.60.
0 +
4.6
0.0
t49
.70.
0 t
45.1
0.0
t0.
0 t
0.0
t0.
0 t
0.0
i-22
.8U
nkno
wn
94
42.5
42.5
0.0
1.0.
00.
0 t
57.5
"0.
0 t
57.5
0.0
0.0
t0.
0 t
0.0
t0.
0 t
0.0
tL
imite
d in
am
ount
/kin
d of
maj
or a
ctiv
ity &
Exc
elle
nt50
925
263
.557
30.
45.
40.
0 t
22.2
0.0
t15
.90.
0 t
2.7
1.9
0.4
0.0
183
Ver
y go
od50
424
163
.661
.40.
0 t
1.6
0.6
17.2
0.0
t14
.60.
4 *
1.6
*1.
60.
0 t
0.4
19.4
Goo
d72
935
956
.552
30.
52.
603
31.5
0327
.60.
0 t
1.4
0.5
0.7
"03
14.8
Fair
269
138
53.2
50.5
0.0
t2.
70.
0 t
31.5
0.0
t28
.30.
50.
80.
8 *
0.0
t0.
017
.3Po
or73
3419
.419
.40.
0 t
0.0
0.0
42.5
0.0
t42
.50.
0 t
0.0
0.0
t0.
0 t
0.0
38.1
Unk
now
n14
858
.643
.10.
0 1-
15.6
0.0
1-49
.30.
0 t
33.7
0.0
+0.
0 1-
0.0
t0.
00.
07.
6L
imite
d in
oth
er a
ctiv
ity &
Exc
elle
nt22
310
776
.274
.40.
0 t
1.8
*0.
0+
-10
.7 *
0.0
t8.
90.
0 t
222.
20.
0 t
0.8
11.9
Ver
y go
od33
116
582
.781
.40.
0 t
0.0
t0.
610
20.
0 t
9.6
0.0
I.13
0.7
0.7
*1.
25.
9G
ood
337
170
61.9
59.2
0.0
I2.
20.
025
30.
0 1
23.1
0.0
+1.
40.
90.
50.
014
.0Fa
ir83
4258
.751
.20.
0 I
2.4
0.0
t28
.00.
0 1
25.5
0.0
1-7.
92.
8 *
5.1
0.0
13.0
Poor
169
0.0
t0.
0 +
0.0
+0.
0t
0.0
+38
.20.
0 t
38.2
0.0
t0.
00.
0 t
0.0
t0.
061
.8U
nkno
wn
54
0.0
t0.
0 t
0.0
t0.
0t
0.0
t10
0.0
t0.
0 t 1
00.0
t0.
0 t
0.0
0.0
t0.
0 t
0.0
0.0
t
c7IN

TA
BL
E 4
. Typ
e of
Hea
lth I
nsur
ance
Cov
erag
e A
mon
g C
hild
ren
Age
d 0
to 1
7, b
y D
isab
ility
and
Hea
lth S
tatu
s, b
y G
ende
r: U
nite
d St
ates
, 198
9
Popu
latio
n Sa
mpl
e(1
,000
s)Si
ze
With
1W
ithPr
ivat
ePr
ivat
eO
nly
(%)
(%)
Priv
ate
insu
ranc
e an
dM
edic
are
and/
or M
edic
aid
Mili
tary
Und
efin
ed1
Plan
sN
otO
nly
Insu
red
(%)
(%)
Med
i2 M
edi-
1 M
edic
are
&I
care
caid
Med
icai
dO
nly
Onl
yO
nly
(%)
(%)
(%)
With
,E
ither
(%)
Med
i-1
Med
i-1
Med
icar
e te
lca
reca
idM
edic
aid
Onl
yO
nly
Onl
y(%
)(%
)(%
)
With
Mili
tary
Mili
tary
Onl
y(%
)(%
)
Mili
tary
&Pr
ivat
eO
nly
(%)
Not
lim
ited
in a
ctiv
ity &
Exc
elle
nt32
,969
16:1
1377
.576
.20.
00.
80.
0 t
7.7
0.1
6.7
0.0
2.3
1 .8
0.5
0.5
13.4
Ver
y go
od16
,159
7,97
271
.169
.60.
11.
10.
011
.90.
110
.50.
11.
91.
60.
30.
516
.1
Goo
d9,
755
4,92
456
.354
.00.
01.
60.
0 t
20.2
0.2
18.4
0.0
231
.50.
70.
822
.7
Fair
Poor
1,01
349
345
.346
.20.
0 t
2.1
0.0
t29
.90.
127
.40.
413
130.
0-I
-1.
021
.5
Unk
now
n58
2860
.860
.80.
0 t
0.0
t0.
0 t
18.6
0.0
-I18
.60.
0 +
0.0
f0.
0 t
0.0
t0.
0 t
20.7
614
294
69.4
68.5
030.
60.
0 t
11.2
0.0
t10
30.
0 t
1.6
1.6
0.0
t0.
218
.4
All
Boy
sA
ge32
,753
16,0
4071
.469
.60.
1 "
1.2
0.0
11.7
0.1
103
0.1
2.3
1.7
0.6
0.6
15.9
0-4
year
s5-
179,
607
4,60
767
.265
.60.
113
0.0
14.7
0.1
13.1
0.1
*2.
42.
003
0.7
16.7
year
sH
ealth
Sta
tus
23,1
4611
,433
73.2
71.3
0.1
1.2
0.0
*10
.30.
19.
10.
12.
21.
50.
70.
515
.6
Exc
elle
nt17
,509
8,52
877
.475
.80.
10.
80.
0 t
7.8
0.0
6.8
0.0
2.5
. 180.
70.
513
.4
Ver
y go
odG
ood
8,57
64,
204
70.9
69.1
0.0
130.
011
.90.
110
.20.
12.
11.
70.
40.
616
.3
Fair
5,52
42,
759
57.9
55.1
0.1
1.9
0.0
i 20.
50.
118
.20.
12.
01.
20.
70.
621
.9
Poor
740
362
45.7
42.6
0.0
1-2.
80.
0 t
333
0.0
t30
.00.
22.
01.
50.
21.
221
.2
Unk
now
n91
4430
.328
.20.
0 t
2.2
0.0
t37
.50.
0 t
353
0.0
t0.
0 t
0.0
t0.
0 t
0.0
t34
3
Maj
or A
ctiv
ity
313
143
64.5
64.5
0.0
t0.
0I.
0.0
t13
30.
0 t
133
0.0
t1.
9 *
1.9
0.0
t0.
01.
20.2
Una
ble
to p
erfo
rm m
aior
act
ivity
201
101
51.8
47.9
0.0
t3.
90.
0 t
31.1
0.0
t25
.10.
0 t
3.2
1.1
0.0
.11.
218
.7
Lim
ited
in a
rnou
nt/k
ind
of m
ajor
act
ivity
Lim
ited
1,31
964
159
.953
.40.
433
0.1
*24
.80.
0 t
20.5
031.
81.
20.
50.
118
.0
in o
ther
act
ivity
Not
580
289
68.8
65.8
0.0
t1.
703
193
0.0
t17
30.
0 t
2.2
1.2
1.0
0.6
12.1
limite
d in
act
ivity
Bas
ic L
ife
Act
iviti
es30
,633
15,0
0972
.170
.40.
01.
10.
010
.90.
19.
60.
12.
31.
70.
60.
615
.8
Nee
ds h
elp
in s
elf
care
(A
DL
)-ag
es 5
-17
130
5638
.528
.40.
0 t
7.1
0.0
t57
.00.
0 t
49.9
0.0
t3.
00.
0 t
3.0
0.0
t11
.6 *
Not
lim
ited
in b
asic
life
act
iviti
esM
ajor
Act
ivity
& 1
leal
th S
ta L
is32
,623
15,9
8471
.669
.70.
11.
20.
0 *
11.5
0.1
10.1
0.1
2.3
1.7
0.6
0.6
15.9
Una
ble
to p
erfo
rm m
ajor
act
ivity
&E
xcel
lent
Ver
y
3014
78.1
78.1
0.0
t0.
0t
0.0
f0.
0 t
0.0
t0.
0 t
0.0
t7.
373
0.0
t0.
0 t
14.6
good
3919
40.8
40.8
0.0
t0.
0t
0.0
t10
.40.
0 t
10.4
*0.
0 t
0.0
t0.
0 +
0.0
t5.
942
.9 *
Goo
dFa
ir45
2363
.55F
.50.
0 +
8.0
0.0
1-27
.70.
0 f
14.9
0.0
t4.
80.
0 t
0.0
+0.
0 t
16.8
*
6233
45.6
'il.9
0.0
t3.
60.
0 t
46.7
0.0
t39
.90.
0 1.
330.
0 t
0.0
1-0.
0 +
113
Poor
18 *
933
.722
.40.
0 t
113
*0.
0 i
66.7
0.0
t55
.40.
0 t
0.0
t0.
0 t
0.0
t0.
0 +
10.9
Unk
now
nL
imite
d in
am
ount
/kin
d of
maj
or a
ctiv
ity &
73
29.0
29.0
0.0
t0.
0t
0.0
t71
.00.
0 t
71.0
0.0
t0.
0 t
0.0
t0.
0 t
0.0
t0.
0 t
Exc
elle
ntV
ery
364
183
68.0
613
0.5
5.7
0.0
t18
.70.
0 I.
12.5
0.0
t1,
61.
10.
50.
0 t
18.4
good
303
143
63.9
62.5
0.0
t1.
40.
0 t
15.7
0.0
t13
.60.
71.
91.
9 *
0.0
t0.
01.
19.9
Goo
d46
222
159
.053
.80.
72.
60.
4*
30.1
0.0
t25
.90.
0 t
22 *
0.8
1.0
'0.
4'
13.8
Fair
149
7447
.342
.50.
0 t
4.8
0.0
+34
.90.
0 t
292
0.8
1.4
1.4
0.0
t0.
0 +
213
Poor
3415
13.5
13.5
0.0
t0.
0t
0.0
t46
.00.
0 t
46.0
0.0
f0.
0 t
0.0
t0.
0 t
0.0
+40
.5
Unk
now
n8
523
.6 *
23.6
0.0
+0.
0t
0.0
t62
30.
0 t
62.3
0.0
t0
0 t
0.0
t0.
0 t
0.0
+14
.1

TA
BL
E 4
. Typ
e of
Hea
lth I
nsur
ance
Cov
erag
e A
mon
g C
hild
ren
Age
d 0
to 1
7, b
y D
isab
ility
and
Hea
lth S
tatu
s, b
y G
ende
n U
nite
d St
ates
, 198
9
Lim
ited
in o
ther
act
ivity
&E
xcel
lent
Ver
y go
odG
ood
Fair
Poor
Unk
now
nN
ot li
mite
d in
act
ivity
&E
xcel
lent
Ver
y go
odG
ood
Fair
Poor
Unk
now
n
All
Gir
lsA
ge 0-4
year
s5-
17 y
ears
Hea
lth S
tatu
sE
xcel
lent
Ver
y go
odG
ood
Fair
Poor
Unk
now
nM
ajor
Act
ivity
Una
ble
to p
erfo
rm m
ajor
act
ivity
Lim
ited
in a
mou
nt/k
ind
of m
ajor
act
ivity
Lim
ited
in o
ther
act
ivity
Not
lim
ited
in a
ctiv
ityB
asic
Lif
e A
ctiv
ities
Nee
ds h
elp
in s
elf
care
(A
DL
)-ag
es 5
-17
Not
lim
ited
in b
asic
life
act
iviti
esM
ajor
Act
ivity
& H
ealth
Sta
tus
Una
ble
to p
erfo
rm m
ajor
acC
-ity
&E
xcel
lent
Ver
y go
odG
ood
Fair
Poor
Unk
now
n
Popu
latio
n Sa
mpl
e(1
,000
s)Si
ze
Priv
ate
insu
ranc
e an
dM
edic
are
and/
or M
edic
zid
Med
i- M
edi-
1 M
edic
are
&I
With
care
caid
Med
icai
dE
ither
Onl
yO
nly
Onl
y(%
)(%
)(%
)(%
)
Mili
tary
With
' Med
i2 M
edi-
1 M
edic
are
dr1
Mili
tary
& U
ndef
ined
With
Priv
ate
care
caid
Med
icai
dW
ithM
ilita
ryPr
ivat
ePl
ans
Not
Priv
ate
Onl
yO
nly
Onl
yO
nly
Mili
tary
Onl
yO
nly
Onl
yIn
sure
d(%
)(%
)(%
)(%
)(%
)(%
)(%
)(%
)(%
)(%
)
127
6375
.774
.00.
0 t
1.7
*0.
0 t
82 "
0.0
t6.
5 *
0.0
t1.
313
*0.
0 -I
.1.
315
.2 *
204
100
79.7
77.6
0.0
+0.
01-
1.0
*13
.70.
0 t
12.7
0.0
t1.
10.
0 -I
-1.
1 *
1.0
*6.
6 *
197
9860
.455
.70.
0 -I
-3.
8*
0.0
+28
.00.
0 t
24.2
0.0
f2.
4 *
1.5
*0.
9 *
0.0
113
.941
2152
.448
.20.
0 t
0.0
f0.
0 f
28.2
*0.
0 -I
-28
.20.
0 t
9.9
*5.
7 *
4.2
*0.
0 t
13.7
*8
50.
0 t
0.0
1-0.
0 t
0.0
t0.
0 t
44.6
"0.
0 t
44.6
*0.
0 +
0.0
t0.
0 t
0.0
f0.
0-I
-55
.43
"2
0.0
t0.
0 t
0.0
1-0.
0t
0.0
t10
0.0
t0.
0 t 1
00.0
-I-
0.0
-I-
0.0
t0.
0 t
0.0
1-0.
0-I
-0.
0 t
16,9
888,
268
77.6
76.1
0.1
*0.
70.
0 f
7.6
0.0
*6.
70.
0 *
2.5
1.8
0.7
0.5
13.3
8,03
03,
942
71.1
69.3
0.0
*1.
40.
011
.70.
110
.10.
1 *
2.2
1.8
0.3
0.6
163
4,82
12,
417
57.6
55.2
0.0
+1.
70.
0 t
19.2
0.1
17.3
0.1
*1.
91.
20.
7 *
0.7
23.1
488
234
44.6
42.2
0.0
1-2.
4*
0.0
t31
.50.
0 -t
29.2
0.0
-I-
1.4
*1.
4 *
0.0
1-1.
823
.032
1553
.853
.80.
0 t
0.0
-I-
0.0
t10
.8 "
0.0
+10
.8 *
0.0
+0.
0 f
0.0
tC
.0 f
0.0
t35
.429
413
367
.267
.20.
0 t
0.0
f0.
0 t
9.6
0.0
t9.
60.
0 1-
2.1
2.1
*0.
0 1-
0.0
t21
.1
31,2
5215
,484
71.0
69.5
0.0
'1.
00.
012
.20.
110
.90.
0 "
2.0
1.6
0.4
0.5
15.7
9,16
24,
539
66.1
64.9
0.1
*1.
00.
0 t
15.5
0.2
*14
.20.
0 -I
-23
2.1
0.1
0.6
16.7
22,0
9010
,945
73.0
71.5
0.0
*1.
00.
010
.80.
1 *
9.5
0.1
1.9
1.4
0.5
0.5
153
16,2
387,
966
77.1
75.9
0.0
*0.
90.
0 +
8.0
0.1
6.9
0.0
*2.
11.
803
0.4
13.6
8,47
54,
202
71.1
69.8
0.1
'1.
00.
0 '
123
0.1
*11
.10.
11.
71.
403
*0.
515
.75,
377
2,73
655
.152
.90.
0 *
1.6
0.0
1-22
.10.
220
.10.
0 1-
2.4
1.7
0.6
*0.
921
.873
236
554
.752
.80.
0 t
1.6
"0.
01-
28.1
0.4
*25
.60.
51.
20.
9 *
0.3
02 *
17.8
9948
35.8
35.8
0.0
t0.
0f
0.0
t35
.70.
0 t
35.7
0.0
1-0.
0 1-
0.0
t0.
0 f
0.0
t28
.533
016
771
.769
30.
61.
80.
0-I
-13
.70.
0 t
11.3
0.0
t1.
2 *
1.2
0.0
t0.
415
.5
146
7056
.851
.70.
0 f
5.2
0.0
f33
.513
*27
.00.
0 1-
0.0
r0.
0 1-
0.0
-I-
0.0
t14
.877
839
155
.352
30.
0 f
2.6
"0.
428
.903
25.3
0.0
t13
'1.
0 *
0.0
-I-
0317
.541
520
872
.871
.20.
0 t
0.9
*0.
0 t
15.8
0.0
f14
.90.
0 f
2.0
1.4
'0.
60.
510
.529
,914
14,8
1571
.470
.00.
0 *
1.0
0.0
f11
.60.
1 *
10.4
0.0
*2.
11.
70.
40.
515
.8
6433
63.0
58.5
0.0
1-0.
0t
4.5
"35
.70.
0 f
31.2
0.0
f0.
0 1-
0.0
+0.
0 f
0.0
-t5.
8 *
31,1
8815
,451
71.0
69.6
0.0
1.0
0.0
f12
20.
110
.90.
0 *
2.0
1.6
0.4
0.5
15.8
16 *
873
.173
.10.
0 f
0.0
1-0.
0 t
0.0
f0.
0 1-
0.0
t0.
0 t
0.0
t0.
0 1-
0.0
t0.
01-
26.9
*19
946
.834
.80.
0 t
12.0
*0.
0 f
65.2
0.0
53.2
0.0
0.0
+0.
0 f
0.0
f0.
0 f
0.0
1-37
1962
.548
.50.
0 f
14.0
0.0
t38
2 *
0.0
-t24
.2 *
0.0
t0.
0 1-
0.0
t0.
0 t
0.0
t13
3 *
4521
63.8
63.8
0.0
t0.
0t
0.0
26.7
*43
72.4
*0.
00.
0 t
0.0
1-0.
0 t
0.0
1-9.
426
1231
.031
.0 *
0.0
f0.
00.
0 f
38.2
0.0
+38
.2 *
0.0
f0.
0 t
0.0
f0.
00.
0 t
30.8
"2
110
0.0
1-10
0.0
1-0.
00.
0t
0.0
t0.
0 f
0.0
1-0.
0 t
0.0
1-0.
0 f
0.0
t0.
0 t
0.0
f0.
0 f

TA
BL
E 4
. Typ
e of
Hea
lth I
nsur
ance
Cov
erag
e A
ntor
tzL
Chi
ldre
n A
ged
0 to
17,
by
Dis
abili
ty a
nd H
ealth
Sta
tus,
by
Gen
den
Uni
ted
Stat
es, 1
989
Lim
ited
in a
mou
nt/k
ind
of m
ajor
act
ivity
&E
xcel
lent
Ver
y go
odG
ood
Fair
Poor
Unk
now
nL
imite
d in
oth
er a
ctiv
ity &
Exc
elle
nt
Ver
y go
odG
ood
Fair
Poor
Unk
now
nN
ot li
mite
d in
act
ivity
&E
xcel
lent
Ver
y go
odG
ood
Fair
Poor
Unk
now
n
Popu
latio
n Sa
mpl
e(1
,000
s)Si
ze
Priv
ate
insu
ranc
e an
d
With
iM
edi-
1 M
edi-
1 M
ecli.
.sar
e &
IW
ithPr
ivat
eca
reca
idM
edic
aid
Priv
ate
Onl
yO
nly
Onl
yO
nly
(%)
(%)
(%)
(%)
(%)
Med
icar
e an
d/or
Med
icai
d
Med
i- M
edi-
1 M
edic
are
&I
With
care
caid
Med
icai
dE
ither
Onl
yO
nly
Onl
y(%
)(%
)(%
)
144
6952
.147
.30.
0 t
4.8
*0.
0 f
30.9
0.0
f24
.620
198
63.2
59.8
0.0
f2.
0*
IA *
19.3
0.0
1.16
.026
713
852
.249
.60.
0 f
2.7
*0.
0 +
34.0
0.9
*30
.412
064
60.5
60.5
0.0
t0.
0f
0.0
t27
.20.
0 t
27.2
4019
24.4
*24
.4 *
0.0
t0.
0t
0.0
t39
.60.
0 f
39.6
*7
310
0.0
t66
.00.
0 f
34.0
0.0
t34
.0 *
0.0
f0.
0 f
9644
76.9
74.9
0.0
f2.
0*
0.0
t14
.00.
0 f
12.0
*12
765
87.4
87.4
0.0
t0.
0t
0.0
t4.
50.
0 t
4.5
140
7264
.264
.20.
0 t
0.0
t0.
0 +
21.6
0.0
t21
.642
2164
.854
.00.
0 t
4.8
0.0
1-27
.70.
0 f
22.9
*8
40.
0 t
0.0
t0.
0 t
0.0
t0.
0 t
31.6
0.0
f31
.62
20.
0 t
0.0
t0.
0 +
0.0
t0.
0 f
100.
0 t
0.0
-I-
100.
0 f
15,9
817,
845
77.4
76.2
0.0
0.8
0.0
I-7.
80.
16.
88,
128
4,03
071
.169
.80.
10.
90.
0i-
12.2
0.1
11.0
4,93
42,
507
54.9
52.8
0.0
1.4
0.0
-I-
213
0.2
19.5
525
259
51.8
49.9
0.0
t1.
80.
0 t
28.4
0.2
25.7
Mili
tary
Mili
tary
& U
ndef
ined
1
With
Mili
tary
Priv
ate
Plan
sN
otM
ilita
ryO
nly
Onl
yO
nly
Insu
red
(%)
(%)
(%)
0.0
f5.
33.
8 *
0.0
t1.
111
"0.
0 .1
-0.
0 +
0.0
t0.
0 +
0.0
t0.
0 t
0.0
t0.
0 f
0.0
t0.
0 t
0.0
t0.
0 t
0.0
t3.
5 *
3.5
0.0
f1.
71.
70.
0 1-
0.0
t0.
0 t
0.0
t5.
90.
0 t
0.0
f0.
0 +
0.0
t0.
0 t
0.0
+0.
0 +
0.0
2.1
1.7
0.1
1.7
1.4
0.0
+2.
71.
90.
71.
212
*
(%)
(%)
(%)
0.0
t0.
0 f
18.0
0.0
-I.
1.0
*18
.60.
0 t
0.1
16.3
0.0
t0.
0 t
12.3
0.0
i0.
0 t
36.0
0.0
f0.
0 t
0.0
f
0.0
t0.
0 +
7.6
0.0
f1.
64.
7*0.
0 f
0.0
t14
.25.
90.
0 +
12.3
0.0
1-0.
01-
68.4
0.0
f0.
0 f
0.0
t
030.
413
.603
0.5
15.9
0.7
1.0
22.4
0.0
-I-
0.2
20.2
2613
69.5
69.5
0.0
t0.
0f
0.0
t28
.30.
0 t 2
830.
0 t
0.0
f0.
0 i
0.0
t0.
0 f
2.2
320
161
71.5
69.7
0.6
12 *
0.0
f12
.70.
0 -h
11.0
0.0
+1.
2 *
1.2
0.0
1-0.
4 *
16.0
Sour
ce N
atio
nal H
ealth
Int
ervi
ew S
urve
y (a
utho
r's ta
bula
tions
fro
m p
ublic
use
tape
s).
Not
e St
anda
rd e
rror
s fo
r es
timat
es a
ppea
r in
App
endi
x T
AB
LE
B-4
.E
xclu
ding
mili
tary
.E
stim
ate
has
low
sta
tistic
al r
elia
bilit
y (r
elat
ive
stan
dard
err
or >
30%
).t E
stim
ate
is e
xact
ly 0
or
stan
dard
err
or is
inde
term
inat
e
itM

TA
BL
E 5
. Num
ber
of P
hysi
cian
Con
tact
s Pe
r Pe
rson
Per
Yea
r A
mon
g A
dults
Age
d 18
to 6
4, b
y T
ype
of H
ealth
Ins
uran
ce C
over
age,
Dis
abili
ty a
nd H
ealth
Stat
us, b
y G
ende
r :
Uni
ted
Stat
es, 1
989
Typ
e of
Hea
lth I
nsur
ance
Cov
erag
e
Popu
latio
n Sa
mpl
e(1
,000
s)Si
zeA
llA
nyPe
rson
s Pr
ivat
ePr
ivat
eO
nly
Any
Publ
icPu
blic
Onl
yM
edic
are
Med
icai
dM
ilita
ry
All
Insu
red
All
Not
Insu
red
Num
ber
of p
hysi
cian
am
tact
s
Tot
al15
0,30
968
211
5.2
5.2
it5.
0ti
10.0
I#10
.0t#
13.6
ti11
.0ti
7.5
i#5.
53.
4
Age 18
-24
year
s25
,401
11,0
133.
94.
2#
4.1
#7.
4#
7.4
#6.
5 *
8.4
#4.
9§
4.5
#2.
325
-44
year
s78
,794
35,5
895.
05.
0#
4.9
#9.
5#
9.6
#13
.6#
9.5
#8.
2#
5.3
#3.
645
-64
year
s46
,114
21,6
096.
26.
0#
5.7
#11
.5#
12.1
#14
.0#
16.0
#7.
7#
6.4
#4.
2
Hea
lth S
tatu
sE
xcel
lent
Ver
y57
,392
25,5
953.
23.
3#
3.3
#4.
9#
4.8
#4.
35.
9#
4.3
§3.
4#
2.1
good
44,3
7620
,088
4.3
4.7
#4.
7#
5.3
#5.
1#
7.1
#5.
7#
4.8
#4.
7#
2.3
Goo
d34
,491
15,8
466.
06.
6#
6.5
#7.
7#
7.1
#6.
6#
7.2
#9.
4#
6.6
#3.
5Fa
ir10
,016
4,74
210
.912
.2#
12.0
#12
.9#
12.5
,14
3#
13.0
#10
.812
.2#
6.4
Poor
3,55
41,
713
23.7
25.9
t26
.9t
24.4
t24
.6t
23.3
27.9
§21
.125
.2t
17.8
Unk
now
n48
022
72.
32.
22.
24.
4 *
4.8
*0.
0 -I
-5.
1*
0.0
1-2.
5*
1.8
*
Maj
or A
ctiv
ityU
nabl
e to
per
form
maj
or a
ctiv
ity6,
772
3,22
620
.024
.1§
25.7
#17
.716
.716
.719
317
520
.9t
15.6
Lim
ited
in a
mou
nt/k
ind
of m
ajor
act
ivity
7,49
83,
465
10.9
10.8
10.6
13.2
t13
.7t
13.6
153
t10
311
.29.
8L
imite
d in
oth
er a
ctiv
ity5,
490
2,54
08.
18.
6#
8.6
#10
.6#
10.9
#8.
1t
11.9
#8.
6t
8.9
#4.
0N
ot li
mite
d in
act
ivity
130,
549
58,9
803.
94.
2#
4.2
#5.
8#
6.0
#6.
0#
6.2
#5.
4#
43#
2.3
Wor
k A
ctiv
ityU
nabl
e to
wor
k7,
980
3,81
819
.222
.4§
23.6
§17
.516
.916
.319
316
.920
.0t
15.2
Lim
ited
in a
mou
nt/k
ind
of w
ork
6,77
63,
106
9.9
10.4
10.4
9.1
8.2
7.1
*9.
59.
910
.28.
3L
imitx
l in
othe
r ac
tiviti
es5,
004
2,30
78.
48.
6§
8.4
§12
3#
12.6
§15
.6 "
t13
.5§
9.0
9.0
#5.
0N
ot li
mite
d in
wor
k/ot
her
activ
ities
130,
549
58,9
803.
94.
2#
4.2
#5.
8#
6.0
#6.
0#
6.2
#5.
4#
43#
23
Bas
ic L
ife
Act
iviti
esN
eeds
hel
p in
sel
f ca
re (
AIM
)78
037
028
.928
.441
.125
.730
.720
.232
.120
.2*
29.2
26.5
"N
eeds
hel
p in
rou
tine
activ
ities
(IA
DL
)2,
210
1,06
723
327
327
.518
.815
.819
.719
.521
.2*
22.3
29.8
Not
lim
ited
in b
asic
life
act
iviti
es14
7,32
066
,774
4.8
4.9
#4.
8#
83#
8.5
#10
.9#
8.9
#6.
9#
5.1
#3.
0

TA
BL
E S
. Num
ber
of P
hysi
cian
Con
tact
s Pe
r Pe
rson
Per
Yea
r A
mon
g A
dults
Age
d 18
to 6
4, b
y T
ype
of H
ealth
Ins
uran
ceC
over
age,
Dis
abili
ty a
nd H
ealth
Sta
tus,
by
Gen
der
:U
nite
d St
ates
, 198
9
Typ
e of
Hea
lth I
nsur
ance
Cov
erag
e
Popu
latio
n Sa
mpl
e(1
,00(
Js)
Size
All
Any
Pers
ons
Priv
ate
Priv
ate
Onl
yA
nyPu
blic
Publ
icO
nly
Med
icar
e
cont
acts
Med
icai
dM
ilita
ryA
llIn
sure
d
All
Not
Insu
red
Num
ber
of p
hysi
cian
All
Men
73,1
1232
,72.
10.
3.9
4.0
#3.
8#
9.1
#8.
8#
13.1
#9.
4#
7.5
#4.
2#
2.5
Age 18
-24
year
s12
,396
5,26
72.
63.
1#
3.0
#4.
03.
06.
85.
02.
6 *
3.1
#1.
725
-44
year
s38
,647
16,7
803.
53.
5§
3.5
§83
#9.
1#
13.2
#7.
8#
7.5
Of
3.7
#2.
645
-64
year
s22
,069
10,2
035.
25.
1§
4.7
t10
.3#
10.3
#13
.4#
13.6
#8.
0#
5.4
§3.
4
Hea
lth S
tatu
sE
xcel
lent
Ver
y30
,711
13,3
762.
52.
6#
2.6
#4.
7§
4.0
2.7
*6.
04.
6§
2.7
#1.
5go
od21
,151
9,32
53.
23.
5#
3.4
#4.
1#
3.1
5.4
§3.
74.
1§
3.5
#1.
6G
ood
15,1
556,
736
4.5
5.1
#4.
9#
6.2
§4.
5$
4.4
3.8
8.9
§5.
1#
2.8
Fair
4,13
11,
895
9.0
10.4
#10
.2#
10.8
#10
.0§
14.3
#10
.5$
6_3
10.2
#4.
9Po
orU
nkno
wn
1,75
481
820
.523
323
.720
.920
.122
.221
.423
.721
.814
.921
210
00.
4*
0.7
0.7
"0.
0 t
0.0
t0.
0 1-
0.0
1-0.
0 t
0.6
0.0
t
Maj
or A
ctiv
ityU
nabl
e to
per
form
maj
or a
ctiv
ity3,
801
1,77
417
.122
.4#
24.4
#15
.013
.415
.8$
14.4
17.4
18.3
#11
.2L
imite
d in
am
ount
/kin
d of
mai
or a
ctiv
ity3,
394
1,51
17.
77.
67.
58.
68.
65.
88.
78.
57.
77.
5L
imite
d in
oth
er a
ctiv
ity2,
232
988
6.0
6.3
627.
87.
9 '
3.2
*6.
89.
96.
43.
7N
ot li
mite
d in
act
ivity
63,6
8527
,977
2.8
3.1
#3.
1#
3.9
#3.
3§
5.6
#3.
043
#3.
1#
1.6
Wor
k A
ctiv
ityU
nabl
e to
wor
k3,
866
1,80
716
.621
.4#
23.2
#14
.813
.315
.414
.317
.117
.7§
11.6
Lim
ited
in a
mou
nt/ld
nd o
f w
ork
3,29
11,
463
7.5
7.5
7.6
7.8
8.5
3.9
83 *
837.
67.
1L
imite
d in
oth
er a
ctiv
ities
2,27
01,
003
6.7
736.
995
5.8
9.1
3.1
*10
.8f
7.2
4.0
Not
lim
ited
in w
ork/
othe
r ac
tiviti
es63
,685
27,9
772.
83.
1#
3.1
if3.
9#
33§
5.6
#3.
04.
3#
3.1
#1.
6
Bas
ic L
ife
Act
iviti
esN
eeds
hel
p in
sel
f ca
re (
AD
L)
365
172
29.5
28.3
46.2
24.9
303
21.5
34.2
*24
.1 *
29.1
34.4
Nee
ds h
elp
in r
outin
e ac
tiviti
es (
IAD
L)
812
385
16.4
24.0
$22
.914
.710
.417
.411
.120
.017
.111
.2N
ot li
mite
d in
bas
ic li
fe a
ctiv
ities
71,9
3531
,693
3.6
3.8
#3.
7#
7.4
#7.
1#
10.4
#6.
9#
6.8
#3.
9#
2.3
1 A

TA
BL
E 5
. Num
ber
of P
hysi
cian
Con
tact
s Pe
r Pe
rson
Per
Yea
r A
mon
g A
dults
Age
d 18
to 6
4, b
y T
ype
of H
ealth
Ins
uran
ce C
over
age,
Dis
abili
ty a
nd H
ealth
Sta
tus,
by
Gen
der
:U
nite
d St
ates
, 193
9
Typ
e of
Hea
lth I
nsur
ance
Cov
erag
e
Popu
latio
n Sa
mpl
e(L
000s
)Si
zeA
llA
nyPe
rson
s Pr
ivat
ePr
ivat
eO
nly
Any
Publ
icPu
blic
Onl
yM
edic
are
Med
icai
dA
llM
ilita
ryIn
sure
d
All
Not
Insu
red
Num
ber
of p
hysi
cian
con
tact
s
All
Wom
en77
,197
35,9
616.
46.
4#
62#
10.6
*10
.5#
142
011
.6#
7.4
#6.
7#
4.4
Age 18
-24
year
s13
,005
5,74
65.
152
#5.
1#
8.4
#8.
5#
6.1
9.2
#5.
7$
5.7
#3.
225
-44
year
s40
,147
18,8
096.
46.
4§
6.3
§9.
9#
9.8
#14
."#
10.1
#8.
8f
6.7
#4.
945
-64
year
s24
,046
11,4
067.
06.
8#
6.6
§12
.8#
13.7
#14
.7#
17.2
#7.
073
#4.
8
Hea
lth S
tatu
sE
xcel
lent
26,6
8112
,219
4.0
4.1
4.1
5.0
f5.
0$
5.8
"5.
8§
4.0
4.2
3.0
Ver
y go
od23
,226
10,7
635.
45.
8#
5.8
#6.
1#
5.9
#8.
5f
6.2
§5.
6§
5.8
#3.
1G
ood
19,3
369,
110
7.1
7.8
#7.
7#
8.5
#8.
0*
9.0
§8.
1#
9.9
§7.
8#
4.1
Fair
5,88
62,
847
12.3
13.4
#13
.1#
14.4
#13
.9#
14.4
#14
.1#
20.0
13.5
#7.
5Po
or1,
800
895
26.9
28.6
29.6
$28
.028
.825
.032
.0$
10.3
t28
.6$
20.4
Unk
now
n26
812
73.
8*
3232
8.4
9.1
0.0
1-9.
20.
0 -I
.3.
83.
9 *
Maj
or A
ctiv
ityU
nabl
e to
per
form
maj
or a
ctiv
ity2,
970
1,45
223
.726
.126
.921
.721
.318
.724
.018
.2 *
24.1
21.4
Lim
ited
in a
mou
nt/k
ind
of m
ajor
act
ivity
4,10
41,
954
13.6
13.5
13.2
16.2
16.1
17.9
17.4
14.8
13.9
12.0
Lim
ited
in o
ther
act
ivity
3,25
81,
552
9.6
103
#10
.4#
11.7
#11
.7#
9.8
t12
.8#
6.5
*10
.7#
4.1
Not
lim
ited
hi'a
ctiv
ity66
,865
31,0
035.
053
#53
#6.
6#
6.8
#6.
3§
6.8
#6.
4#
5.4
#3.
0
Wor
k A
ctiv
ityU
nabl
e to
wor
k4,
113
2,01
121
.523
.223
.920
.620
.617
.722
.816
.522
.118
.6L
imite
d in
am
ount
/kin
d of
wor
k3,
486
1,64
312
.013
.112
.910
.57.
911
.710
.114
.712
.69.
5L
imite
d in
oth
er a
ctiv
ities
2,73
31,
304
9.8
9.8
§9.
8§
13.6
§14
.4§
17.8
15.1
§5.
110
.5§
5.8
Not
lim
ited
in w
ork/
othe
r ac
tiviti
es66
,865
31,0
035.
053
#5.
3#
6.6
#6.
8#
6.3
§6.
8#
6.4
#5.
4#
3 0
Bas
ic L
ife
Act
iviti
esN
eeds
hel
p in
sel
f ca
re (
AD
L)
415
198
28.4
28.5
377
26.5
31.0
17.9
30.7
13.9
*29
.422
.7 "
Nee
ds h
elp
in r
outin
e ac
tiviti
es (
IAD
L)
1,39
768
227
.428
.929
.222
.120
.122
.423
.924
.4 *
25.4
39,8
Not
lim
ited
in b
asic
life
act
iviti
es75
385
35,0
815.
96.
0#
6.0
#8.
9#
9.0
#11
.4#
9.5
#7.
0#
6.3
#3.
7
Sour
ce: N
atio
nal F
Ieal
th I
nter
view
Sur
vey
(aut
hor's
tabu
latio
ns f
rom
pub
lic u
se ta
pes)
.N
ote:
Sta
ndar
d er
rors
for
est
imat
es a
ppea
r in
App
endi
x T
AB
LE
B-5
.' E
stim
ate
has
low
sta
tistic
al r
elia
bilit
y (r
elat
ive
stan
dard
erro
r >
30%
).f
Est
imat
e is
exa
ctly
0 o
r st
anda
rd e
rror
is in
dete
rmin
ate.
t Sig
nifi
cant
ly d
iffe
rent
fro
m u
nins
ured
p<
.05
§ Si
gnif
ican
tly d
iffe
rent
fro
m u
nins
ured
p<
.01.
# Si
gnif
ican
tly d
iffe
rent
fro
m u
nins
ured
p<
.001
.
15
1rs

TA
BL
E 6
. Num
ber
of P
hysi
cian
Con
tact
s Pe
r Pe
rson
Per
Yea
r A
mon
g C
hild
ren
Age
d 0
to 1
7, b
y T
ype
of H
ealth
Ins
uran
ce C
over
age,
Dis
abili
ty a
nd H
ealth
Sta
tus,
by G
ende
r : U
nite
d St
ates
, 198
9
Typ
e of
Hea
lth I
nsur
ance
Cov
erag
e
Tot
al
Age 0-
4 ye
ars
5-17
yea
rs
Hea
lth S
tatu
sE
xcel
lent
Ver
y go
odG
ood
Fair
Poor
Unk
now
n
Maj
or A
ctiv
ityU
nabl
e to
per
form
maj
or a
ctiv
ityL
imite
d in
am
ount
/kin
d of
maj
or a
ctiv
ityL
imite
d in
oth
er a
ctiv
ityN
ot li
mite
d in
act
ivity
Bas
ic L
ife
Act
iviti
esN
eeds
hel
p in
sel
f ca
re (
AD
L)-
ages
5-1
7N
ot li
mite
d in
bas
ic li
fe a
ctiv
ities
Popu
latio
n Sa
mpl
e(1
,000
s)Si
zeA
llA
nyPe
rson
s Pr
ivat
ePr
ivat
eO
nly
Any
Publ
icPu
blic
Onl
yM
edic
aid
64,0
05
18,7
6945
,236
33,7
4717
,052
10,9
021,
472
190
643
346
2,09
799
460
,567 19
463
,811
31,5
24
9,14
672
,378
16,4
948,
406
5,49
572
792 31
0
171
1,03
249
729
,824 89
31,4
35
Num
ber
of p
hysi
cian
con
tact
s
4.5
6.8
35 3.4
4.6
63 12.7
22.9
4.2
19.8
10.6
10.0 4.1
15.6 4.4
4.7
7.3
3.7
3.6
4.9
7.2
16.7
26.0
4.8
22.9
10.9
10.6 43 20.6 4.7
# # # # # # § # # N
4.7
7.3
3.7
3.6
4.9
7.3
17.1
26.0 4.8
24.7
11.0
10.6 4.4
25.0 4.7
# # # # # # # # # #
4.9
6.7
3.9
3.4
4.8
5.8
93 20.8 5.8
14.1
10.5 9.5
43 9.0
4.9
# # # # #
* t # #
5.0
6.8
4.0
3.4
5.0
5.8
9.4
20.7 5.7
*
15.7
10.6
9.4
4.4
10.8
5.0
#5.
0#
#6.
8#
#3.
9#
#3.
5#
#4.
5§
5.7
9.6
20.8
$6.
6 *
t
14.6
11.1 9.6
#4.
2#
9.4
#5.
0#
All
Mili
tary
Insu
red
All
Not
Insu
red
4.9
§4.
7#
3.1
6.3
7.2
#4.
74.
3§
3.7
#2.
3
3.2
$6.
8t
8.3
$4.
5 *
0.0
t0.
0 t
0.0
1-10
.7 *
8.3
4.8
#
3.6
#2.
14.
9#
2.7
6.8
#43
13.8
j8.
123
322
.34.
9*
0.6
203
17.1
10.8
9.9
10.3
83 *
4.3
#2.
6
0.0
1-15
.8 *
13.9
*5.
0§
4.7
#3.
0
G.%

TA
BL
E 6
. Num
ber
of P
hysi
cian
Cr
ntac
ts P
er P
erso
n Pe
r Y
ear
Am
ong
Chi
ldre
n A
ged
0 to
17,
by
Typ
e of
Hea
lth I
nsur
ance
Cov
erag
e, D
isab
ility
and
Hea
lth S
tatu
s,by
Gen
der
: Uni
ted
Stat
es, 1
9S9
All
Boy
s
Age 0-
4 ye
ars
5-17
yea
rs
Hea
lth S
tatu
sE
xcel
lent
Ver
y go
odG
ood
Fair
Poor
Unk
now
n
Maj
or A
ctiv
ityU
nabl
e to
per
form
maj
or a
ctiv
ityL
imite
d in
am
ount
/kin
d of
maj
or a
ctiv
ityL
imite
d in
oth
er a
ctiv
ityN
otlim
ited
in a
ctiv
ity
Bas
ic L
ife
Act
iviti
esN
eeds
hel
p in
sel
f ca
re (
AD
L)-
ages
5-1
7N
ot li
mite
d in
bas
ic li
fe a
ctiv
ities
1
Typ
e of
Hea
lth I
nsur
ance
Cov
erag
e
Popu
latio
n Sa
mpl
e(1
,000
s)Si
zeA
llPe
rson
sA
nyPr
ivat
ePr
ivat
e
Onl
yA
nyPu
blic
Publ
icO
nly
Num
ber
of p
hysi
cian
Med
icai
d
cont
acts
Mili
tary
All
Insu
red
All
Not
Insu
red
32,7
5316
,040
4.8
5.0
#5.
0#
5.5
#5.
6#
5.6
#5.
7t
5.1
#3.
1
9,60
74,
607
7.5
8.2
*8.
3#
7.5
#7.
7#
7.7
#7.
08.
1#
4.7
23,1
4611
,433
3.6
3.8
#3.
8#
4.4
#4.
4#
4.4
#5.
13.
9#
2.4
17,5
098,
528
3.5
3.7
#3.
7#
3.9
#3.
9#
4.1
#3.
43.
7#
2.2
8,57
642
045.
05.
4#
5.4
#5.
3§
5.4
§4.
7$
9.4
f5.
4#
2.9
5,52
42,
759
6.7
8.0
#8.
2#
6.0
$6.
2$
5.9
f9.
0 *
7.5
#3.
874
036
214
.619
.4§
19.9
§12
.312
.312
.57.
116
.2$
8.6
*91
4429
.034
7*
354
27.1
27.2
27.1
0.0
t30
.725
.831
214
33.
44.
04.
053
"53
6.0
0.0
t43
*0.
0
201
101
16.1
16.1
16.9
14.0
15.0
*14
.40.
0 t
15.5
18.8
*
1,31
964
111
311
.411
.711
.812
.512
.612
.811
.710
358
028
911
.812
.812
.710
.910
.611
.19.
012
.28.
9 *
30,6
5315
,009
4.3
4.6
#4.
6#
4.7
*4.
8#
4.6
#5.
5§
4.6
#2.
5
130
5613
.313
.718
.6 *
11.1
13.4
*11
.70.
0 t
13.5
11.3
*
32,6
2315
,984
4.7
5.0
#5.
0#
5.4
#53
#5.
5#
5.8
§5.
1#
3.1
"s4

Ui
TA
BL
E 6
. Num
ber
of P
hysi
cian
Con
tact
s Pe
r Pe
rson
Per
Yea
r Am
ong
Chi
ldre
n A
ged
0 to
19,
by
Typ
e of
Hea
lth I
nsur
ance
Cov
erag
e,D
isab
ility
and
Hea
lth S
tatu
s,by
Gen
der
: Uni
ted
Stat
es, 1
989
Typ
e of
Hea
lth I
nsur
ance
Cov
erag
e
All
Gir
ls
Age 0-
4 ye
er3
5-17
yea
rs
Hea
lth S
tatu
sE
xcdl
ent
Ver
y go
odG
ood
Fair
Poor
Unk
now
n
MaO
r A
ctiv
ityU
nabl
e to
per
form
mai
or a
ctiv
ityL
imite
d in
am
ount
/kin
d of
maj
or a
ctiv
ityL
imite
d in
oth
er a
ctiv
ityN
ot li
mite
d in
act
ivity
Bas
ic L
ife
Act
iviti
esN
eeds
hel
p in
sel
f ca
re (
AD
L)-
ages
5-1
7N
ot li
mite
d in
bas
ic li
fe a
ctiv
ities
Popu
latio
n Sa
mpl
e(1
,000
s)Si
zeA
llA
nyPe
rson
s Pr
ivat
ePr
ivat
eO
nly
Any
Publ
icPu
blic
Onl
yM
edic
aid
Mili
tary
All
Insu
red
All
Not
Insu
red
31,2
52
9,16
222
,090
16,2
388,
475
5,37
773
2 99 330
146
778
415
29,9
14 6431
,188
15,4
84
4,53
910
,945
7,96
64,
202
2,73
636
5 48 167 70
391
208
14,8
15 3315
,451
Num
ber
of p
hysi
cian
con
tact
s
4.1
6.0
3.4
3.2
4.1
5.9
10.8
17.4 4.9
24.8 92 7.6
3.9
20.4
4.1
4.4
63 3.6
3.5
4.5
6.4
14.3
193
5.5
31.5
10.0 7.7
4.1
29.1 43
if 4 if * # 4 * *
4.4
63 3.6
3.5
4.5
6.4
14.8
19.3
5.4
34.7 9.8
7.8
4.1
313 43
if 4 # # # 4 0 N
43 5.9
33 2.8
4.3
5.6
5.7
14.7 63 14.2 8.6
7.0
3.9
2.0
43
§ § 4 § § §
4.4
5.9
3.5
2.9
45 5.5
6.0
14.7 6.1
16.8 8.0
7.7
4.0
23 4.4
if § 4 §
*
§ #
4.4
6.0
3.5
2.8
4.4
5.5
6.0
14.7 72 14.8
9.0
7.0
4.0
2.0
4.5
§ § 4 4 § 5
4.0
5.6
3.3
3.0
3.6
7.7
0.0
t0.
0 t
0.0
t
0.0
t5.
97.
1
4.0
0.0
t4.
0
4.4
63 3.6
3.4
4.4
6.1
11.5
17.0
5.5
26.6 93 7.6
4.1
20.2 43
Si 4 if if II 4 if 01
3.0
4.7
23 1.9
2.5
4.9
7.5
18.4 1.4
14.1 9.0
7.4
2.8
242
3.0
Sour
ce: N
atio
nal I
leal
th I
nter
view
Sur
vey
(aut
hor's
tabu
latio
ns f
rom
publ
ic u
se ta
pts)
.N
ote:
Sta
ndar
d er
rors
for
mtim
ates
appe
ar in
App
endi
x T
AB
LE
3-6
.E
stim
ate
has
low
sta
tistic
al r
elia
bilit
y (r
elat
ive
stan
dard
erro
r >
30%
).t E
stim
ate
is e
xact
ly 0
or
stan
dard
err
or is
inde
term
inat
e.Si
gnif
ican
tly d
iffe
rent
fro
m u
nins
ured
p<
.05.
§ Si
gnif
ican
tly d
iffe
rent
fro
m u
nins
ured
p<
.01.
it Si
gnif
ican
tly d
iffe
rent
fro
m u
nins
ured
p<
.001
.
12
00

TA
BL
E 7
. Hos
pita
l Dis
char
ges
Per
100
Pers
ons
Per
Yea
r an
d A
vera
ge L
engt
h of
Sta
y Pe
r D
isch
arge
Am
ong
Adu
lts A
ged
18 to
64,
bY
Typ
e of
Hea
lth I
nsur
ance
Cov
erag
e, D
isab
ility
and
Hea
lth S
tatu
s, b
y G
ende
r: U
nite
d St
ates
, 198
9
Tot
al
Age 18
-24
year
s25
-44
year
s45
-64
year
s
I le
alth
Sta
tus
Exc
elle
ntV
ery
good
Goo
dFa
irPo
orU
nkno
wn
Maj
or A
ctiv
ityU
nabl
e to
per
form
maj
or a
ctiv
ityL
imite
d in
am
ount
/kin
d of
maj
or a
ctiv
ityL
imite
d in
oth
er a
ctiv
ityN
ot li
mite
d in
act
ivity
Wor
k A
ctiv
ityU
nabl
e to
wor
kL
imite
d in
am
ount
/kin
d of
wor
kL
imite
d in
oth
er a
ctiv
ities
Not
lim
ited
in w
ork/
othe
r ac
tiviti
ts
Bas
ic L
ife
Act
iviti
esN
eeds
hel
p in
sel
f ca
re (
AD
L)
Nee
ds h
elp
in r
outin
e ac
tiviti
es 'I
AD
L)
Not
lim
ited
in b
asic
life
act
iviti
es
13
All
Pers
ons
1-11
)
Typ
eof
I le
alth
Ins
uran
ce C
over
age
Publ
ic
Onl
yM
edic
are
Med
icai
dA
nyPr
ivat
ePr
ivat
eO
nly
Any
Publ
ic
Al.O
SH
DA
LO
SH
DA
LO
SH
DA
LO
SH
DA
LO
SH
DA
LO
SH
DA
LO
S
8.8
6.1
8.2
#5.
77.
6$
53$
24.8
#8.
124
.4N
7.7
39.4
N9.
2$
26.6
#8.
7
6.6
5.1
5.5
4.5
5.4
4.3
16.1
§5.
516
.8§
5.2
10.5
*20
.620
3§
5.5
7.0
5.5
6.4
5.2
6.2
4.9
20.0
N7.
7$
20.4
N6.
737
.8N
8.8
$ 21
.1N
7 8
13.2
7.0
12.3
N6.
311
.0$
5.9
$ 32
.8N
8.9
34.5
N93
41.6
N9.
242
.3N
10.
9
3.6
4.1
3.6
$4.
03.
63.
97.
3N
5.4
*9.
1#
3.8
5.2
*25
.69.
8§
4.6
5.8
4.8
5.8
$4.
75.
8$
4.7
83§
4.9
9.6
§5.
45.
2 *
2.9
10.4
$3.
910
.75.
511
.6#
5.0
11.1
N5.
016
.6U
5.6
13.9
N6.
418
.3§
8.4
14.0
§5.
926
.17.
827
3§
8.3
$ 25
.6§
7336
.1N
9.4
§ 33
.9N
7.7
48.8
N7.
335
.0N
10.
865
.78.
680
.0N
7.8
76.8
N7.
173
.0N
9.3
67.8
N9.
370
.4#
10.5
77.7
N9.
863
10.0
2.5
2.6
2.6
2.6
22.9
4.1
25.1
*4.
10.
0 t
0.0
t26
.54.
1
53.1
9.1
61.7
N9.
161
.7N
8353
.1§
9.7
49.7
$9.
052
.1§
10.1
56.3
§ 10
.524
.46.
225
.6§
6.1
24.8
§5.
833
.0#
8.1
32.6
§7.
933
.5$
5.9
35.0
§9.
813
.85.
214
.4N
4.9
13.9
#4.
923
.5#
6.1
23.5
N6.
738
.2N
7.4
19.9
§5.
25.
44.
75.
4§
4.4
$5.
4$
4.5
10.4
#4.
911
.1N
5.1
5.8
33 *
$ 12
.1N
5.1
49.2
8.7
56.9
N8.
855
.1N
7.8
51.2
#9.
247
.1§
8.3
50.8
#9.
552
.9N
9.9
20.7
6 0
22.8
$5.
822
.7$
5.9
18.7
7.9
15.6
103
133
5.2
15.0
11.4
17.0
6.7
16.7
N5.
916
.4#
6.0
34.3
N9.
4$
39.7
N 1
0.5
$ 53
.7 *
59.
8$
36.1
§9.
95.
44.
75.
4§
4.4
$5.
4$
4.5
10.4
N4S
11.1
N5.
15.
83.
3$
12.1
N5.
1
82.2
13.6
75.5
14.8
100.
317
.973
.213
.284
.714
.463
.414
.885
.814
.950
.98.
858
.0$
8 6
56.9
$8.
251
.48.
547
.88.
149
.49.
751
.98.
17.
85.
57.
5#
5.2
7.1
§4.
9$
19.7
7.1
19.2
#6.
333
.1N
7.5
20.6
7.6
All
Insu
red
All
Not
Insu
red
HD
AL
OS
HD
AL
OS
9.3
N6.
16.
46.
8
6.7
4.7
6.1
6.2
73$
5.5
5.9
5.7
13.8
N6.
98.
19.
2
3.8
$4.
02.
55.
1
6.0
$4.
84.
34.
611
.7N
5.1
7.0
7.6
$ 28
.6N
8.1
$ 17
.66.
074
.5N
8.4
30.8
9.9
5315
9.0
"20
.7 "
56.7
#9.
135
.793
$ 26
.4N
6.4
16.2
5.1
15.5
#5.
25.
05.
05.
7§
4.5
$4.
26.
1
52.9
#8.
631
.79.
422
.0$
6.1
15.7
4.9
19.0
N6.
9$
6.6
3.8
5.7
§4.
5$
4.2
6.1
79.5
14.5
$ 10
1.8
8.5
53.6
$8.
534
.012
.08.
3#
5.4
5.7
63
1 ; 4

1J5
TA
BL
E 7
. Hos
pita
l Dis
char
ges
Per
100
Pers
ons
Per
Yea
r an
dA
vera
ge L
engt
h of
Sta
y Pe
r D
isch
arge
Am
ong
Adu
lts A
ged
18 to
64,
by
Typ
e of
Hea
lth I
nsur
ance
Cov
erag
e, D
isab
ility
and
Hea
lth S
tatu
s, b
y G
ende
r: U
nite
d St
ates
, 198
9
Typ
e of
Hea
lth I
nsur
ance
Cov
erag
e
All
Men
Age 18
-24
year
s25
-44
year
s45
-64
year
s
Hea
lth S
tatw
sE
xcel
lent
Ver
y go
odG
ood
Fair
Poor
Unk
now
n
Maj
or A
ctiv
ityU
nabl
e to
per
form
maj
or a
ctiv
ityU
mite
d in
am
ount
/kin
d of
maj
orac
tivity
Lim
ited
in o
ther
act
ivity
Not
lim
ited
in a
ctiv
ity
Wor
k A
ctiv
ityU
nabl
e to
wor
kL
imite
d in
am
ount
/ldnd
of
wor
kL
imite
d in
oth
er a
ctiv
ities
Not
lim
ited
in w
ork/
othe
r ad
iviti
es
Bas
ic L
ife
Act
iviti
esN
eeds
hel
p in
sel
f ca
re (
AD
L)
Nee
ds h
elp
in r
outin
e ac
tiviti
es (
IAD
L)
Not
lim
ited
in b
asic
life
act
iviti
es
All
Pers
ons
Any
Priv
ate
Priv
ate
Onl
yA
nyPu
blic
Publ
ic
Onl
y
* *
t
Med
icar
eM
edic
aid
§
Ali
Insu
red
All
Not
Insu
red
HD
AL
OS
HD
AL
OS
HD
AL
OS
HD
AL
OS
HD
AL
OS
HD
AL
OS
HD
AL
OS
HD
AL
OS
HD
AL
OS
8.4
5.6
6.0
14.2 33 5.5
11.3
27.0
653
6.4
*
53.6
24.0
11.7 4.8
52.7
24.0
12.5 4.8
104.
048
.2 7.5
6.5
6.2
5.7
72 4.1
5.1
5.9
8.3
9.1
17.7
9.0
62 3.7
52 8.9
62 5.0
5.2
14.8
9.4
5.7
7.9
5.9
4.8
5.5
5.4
5313
.4§
63
333.
95.
45.
012
3§
5.1
283
8.8
87.7
§7.
90.
0 f
0.0
f
64.4
§8.
925
.65.
712
.63.
64.
9f
4.8
632
f8.
825
.95.
813
.7§
4.1
4.9
4.8
88.6
f 17
.264
39.
87.
3.$
5.2
7.1
4.6
5.2
11.8
t
32 5.4
12.1
§25
.177
.5 0.0
f
64.9
253
11.7
4.9
63.6
25.5
127
t4.
9
134.
961
.7 6.8
5.5
5.4
5.2
5.9
3.9
5.0
5.2
8.9
6.8
0.0
f
8.5
5.8
3.7
4.7
8.4
5.8
42 4.7
20.6
9.7
5k
27.2
#
13.7
202
#33
.7#
7.2
t7.
217
3 §
38.8
§68
.4f
30.4
*
50.6
72.7
20.7
'f7.
7§
49.5
21.4
25.4
§7.
7§
83.2
§44
.221
.6N
8.9
8.7
73 9.4
5.0
7.4
73 8.5
102
2.4
93 10.0 42 6.9
9.1
10.0
*
9.1
6.9
14.1 9.6
7.4
27.0
11.0
22.6
34.9
11.0
8.9
14.9
33.5
572
33.6
44.6
17.7
15.5
8.3
43.7
13.5
21.6
8.3
99.8
f 34
.720
.8
# # # t
*
j
*
t #
9.4
9.9
7.1
10.6
5.3
8.4
9.8
83 10.7
2.4
9.1
173
6.0
83 8.7
20.7
18.4 83 14.8
9.4
7.7
39.8
#
18.6
32.5
§43
.8#
0.0
t2.
019
.7 *
$49
.7§
65.6 0.0
f
51.1
13.1
20.0
*
1.9
49.2
16.1
362
*1.
9
70.1
§49
.432
.2#
10.1
20.6
7.3
10.6 0.0
t4.
0 t
9.9
*
7.8
11.7 0.0
f
102
6.4
10.7 4.0
f
9.9
6.4
21.6
t4.
0 f
17.2
10.7
t73
32.4
20.2
21.9
51.8 9.4
4.7
13.7
37.2
82.1
37.6
53.6
18.0
262
7.9
52.7
17.4
18.6
7.9
117.
040
.123
.7
# t # #
" *
t f"
#
10.0 7.6
7.1
12.0
11.0 3.4
83 8.9
113
2.4
9.6
20.1 5.9
93 9.4
21.5
13.1 93 15.6
7.0
8.5
8.8
5.4
6.0
14.8
3.4
5.7
12.6
29.0
71.5 4.7
55.9
24.7
12.8
5.0
54.7
24.7
14.0
5.0
93.5
49.5 7.8
§ # § §"
§ f §
6.4
5.9
5.5
7.0
4.0
5.2
5.5
8.7
8.9
2.4
9.0
6.5
3.8
4.9
8.8
6.5
5.1
4.9
15.8
9.9
f5.
5
6.6
6.2
6.2
8.8
2.8
4.4
6.9
20.8
40.2 9.9
*
42.7
212
5A 3.7
433
21.7 4.4
3.7
218.
039
.2 5.9
7.3
6.7
63 9.9
5.1 43 8.6
6.4
10.1
33.5 9.4
4.9
26 6.9
93 4.9
2.6
*69 10
.1 5.1
7.1
1 1
CO

TA
BL
E 7
. Hos
pita
i Dis
char
ges
Per
100
Pers
ons
Per
Yea
r an
d A
vera
ge L
engt
h of
Sta
y Pe
r D
isch
arge
Am
ong
Adu
ltsA
ged
18 to
64,
by
Typ
e of
Hea
lth I
nsur
ance
Cov
erag
e, D
isab
ility
and
Hea
lth S
tatu
s, b
y G
ende
n U
nite
d St
ates
, 198
9
Ali
Wom
en
Age 18
-24
yew
s25
-44
year
s45
-64
year
s
Hea
lth S
tatu
sE
xcel
lent
Ver
y go
odG
ood
Fair
Poor
Unk
now
n
Maj
or A
ctiv
ityU
nabl
e to
per
form
mai
or a
ctiv
ityL
imite
d in
am
ount
/kin
d.of
maj
or a
ctiv
ityL
imite
d in
oth
er a
ctiv
ityN
ot li
mite
d in
act
ivity
Wor
k A
ctiv
ityU
nabl
e to
wor
kL
imite
d in
am
ount
/kin
d of
wor
kL
imite
d in
oth
er a
ctiv
ities
Not
lim
ited
in w
ork/
oihe
r ac
tiviti
es
Bas
ic L
ife
Act
iviti
esN
eeds
hel
p in
sel
f ca
re (
AO
L)
Nee
ds h
elp
in r
outin
e ac
tiviti
es (
IAD
L)
Not
lim
ited
in b
asic
life
act
iviti
es
All
Pers
ons
Typ
e of
Hea
lth I
nsur
ance
Cov
erag
e
All
Insu
red
4 4 4 4
All
Not
Insu
red
Any
Priv
ate
Priv
ate
Onl
yA
nyPu
blic
Publ
icO
nly
Med
icar
eM
edic
aid
HD
AL
OS
HD
AL
OS
HD
AL
OS
HD
AL
OS
HD
AL
OS
HD
AL
OS
HD
AL
OS
HD
AL
OS
HD
AL
AS
93 7.4
8.0
123
3.9
6.0
103
25.5
65.9 62 52.4
24.8
15_3 6.1
46.0
17.6
20.7 6.1
62.9
52.5
8.2
5.8
43 5.3
6.8
4.1
4.4
5.1
7.4
8.1
3.8
9.2
63 6.0
4.4
8.4
5.7
7.5
4.4
11.8
8.5
5.2
83 62 7.5
11.2 4.0
6.1
10.8
26.6
77.0 42 58.5
23.6
15.8 5.9
51.5
20.0
19.5
5.9
62.7
55.0
7.8
# 4 4 4 4 § § # # # # # § § 4 N
53 3.7 52 63 4.1
4.4
4.9
78 7.8
2.6
9.5
6.5
5.7
4.2
8.7
5.9
7.1
4.2
11.5 8.0
5.2
4 4
*
8.1 62 7.2
10.3 4.0
6.1
10.3
25.9
76.1 42 58.6
243
153
5.8
49.1
20.3
19.7
5.8
76.8
55.2
7.5
§ 4 4 4 § § # # # # # # § 4 §
5.1
3.5
4.7
6.0
3.8
4.5
4.9
63 7.5
2.6
8.1
5.8
5.6
42 7.1
5.9
7.0
4.2
14.6
7.6
4.8
*
4 4
23.3
16.8
19.9
31.8 7.4
8.9
163
34.3
78.0
162
56.9
39.8
24.6
11.6
53.0
15.7
38.6
11.6
62.7
57.1
18.6
# § # # § 4 # # # # # # # If # N #
7.6
4.8
7.9
482 5.
73.
94.
710
.14
8.4
7.0
t
10.4 7.4
6.8
43 9.4
4.6
9.5
43 11.8
47.
86.
9
23.2
18.3
193
39.1 8.4
9.8
13.6
34.2
77.4
17.5
56.5
39.7
253
11.9
50.7
17.2
44.3
11.9
71.1
58.1
18.5
# § # # § 4 § # N § # # # # # # N
6.7
4.5
6.5
8.1
3.1 43 5.0
73 83 7.0
t
8.9
5.9
6.8
4 4
7.9
4.0
9.5
4.4
13.9
§7.
45.
7
38.8
#
0.0
t44
.3#
39.0
#
10.3 7.8
16.7
47.6
§77
.7#
0.0
t
54.0
§45
.0§
44.7
#83
*
53.2
#
9.3
59.8 83 52.3
49.3
34.2
#
82 0.0
t10
2 4
7.4
25.6 2.7
6.5
6.5
9.1
0.0
t
9.8
5.8
6.9
32 8.8
2.5
73 3.2
9.6
8.6
7.8
24.6
20.3
20.8
37.3
10.0
12.1
14.1
34.1
75.0
17.7
58.9
40.5
18.8
12.9
53.0
13.7
38.8
12.9
63.9
58.2
19.6
# § # # § 4 4 § # § # § # N § # #
8.1
5.0
8.0
410
.1 3.0
3.9
52 11.6
48.
87.
0 t
11.2 83 5.0
4.6
10.2 43 9.7
4.6
13.9
48.
573
9.8
7.9
8.5
12.9
4.2
6.3
11.1
283
77.5 5.7
57.8
27.7
17.4 63 51.3
19.5
23.1 63 66.1
56.0 8.6
# # § 4 4 # # # # # # 4 # § # 4 4 #
5.8
4.0
5.4
6.7
4.0
4.4
4.9
7.7
8.0
4.1
9.2
6.3
6.0
4.2
8.4
5.7
7.8
4.2
12.7 7.7
5.2
62 6.0
5.6
7.6
2.1
4.2
7.1
15.0
22.4 8.1
26.4
113
4.8
4.9
20.9 9.1
8.4
"4.
9
45.4
31.2 5.6
62 5.6
4.9
0.5
5.1
4.7
6.6
5.5
9.5
3.0
9.2
5.5
6.6
5.4
9.5
5.0
4.3
5.4
4.7
16.6 5.2
I ID
=H
ospi
tal d
isch
arge
s pe
r 10
0 pe
rson
sA
LO
S=A
vera
ge le
ngth
of
stay
per
hos
pita
l epi
sode
Sour
ce: N
atio
nal H
ealth
Int
ervi
ew S
urve
y (a
utho
r's ta
bula
tions
fro
m p
ublic
use
tape
s).
Not
e St
anda
rd e
rror
s fo
r es
timat
es a
ppea
r in
App
endi
x T
AB
I.E
B-7
.E
stim
ate
has
low
sta
tistic
al r
elia
bilit
y (r
elat
ive
stan
dard
err
or >
30%
).t E
stim
ate
is e
xact
ly 0
or
stan
dard
err
or is
inde
term
inat
e.Si
gnif
ican
tly d
iffe
rent
fro
m u
nins
ured
p<
.05.
§ Si
gnif
ican
tly d
iffe
rent
fro
m u
nins
ured
p<
.01.
ft S
igni
fica
ntly
dif
fere
nt f
rom
uni
nsur
ed p
<.0
0l.
1 1
8C
O

TA
BL
E 8
. Hos
pita
l Dis
char
ges
Per
100
Pers
ons
and
Ave
rage
Len
gth
of S
tay
Per
Dis
char
ge P
er Y
ear
Am
ong
Chi
ldre
n A
ged
G-1
7, b
y T
ype
of H
ealth
Ins
uran
ceC
over
age,
Dis
abili
tyan
d H
ealth
Sta
tus,
by_
Gen
der:
Uni
ted
Stat
es, 1
989
Typ
e of
Hea
lth I
nsur
ance
Cov
erag
e
All
Pers
ons
HD
AL
OS
Any
Priv
ate
Priv
ate
Onl
yA
nyPu
blic
Publ
ic
Onl
y_
HD
AL
OS
Med
ica
idM
ilita
ry
HD
AL
OS
All
Insu
red
HD
AID
S
All
Not
Insu
red
HD
AL
OS
HD
AL
OS
HD
AL
OS
HD
AL
OS
HD
AID
S
Tot
al4.
56.
23.
95.
93.
85.
88.
4#
6.6
8.6
#6.
68.
3#
6.4
9.4
3.7
$4.
66.
04.
17.
4
Age 0-
4 ye
ars
5-17
yea
rs7.
73.
26.
75.
85.
73.
26.
95.
15.
63.
16.
85.
116
.0 4.0
#5.
010
.3$
16.2 4.0
#4.
711
.0 *
$15
.93.
8#
5.4
8.8
"19
.0 4.9
*3.
05.
1§
7.7
3.3
6.0
6.1
7.4
2.7
10.1 4.1
Hea
lth S
tatu
sE
xcel
lent
2.6
5.1
2.3
4.5
2.3
4.3
5.9
§4.
46.
0§
3.9
5.1
$4.
78.
9 *
$4.
02.
74.
42.
111
.4V
ery
good
4.0
6.3
4.2
6.8
4.3
6.9
3.2
4.4
3.5
4.5
3.6
4.4
1.2
3.0
t4.
16.
63.
64.
6G
ood
7.7
6.0
7.5
5.6
7.5
5.5
9.6
5.6
9.9
5.4
9.2
6.1
15.2
2.7
#8.
15.
56.
48.
4Fa
ir18
.48.
814
.610
.2*
15.4
10.2
23.9
9.6
26.0
9.6
21.8
4.9
66.6
6.1
18.7
9.9
$ 17
.54.
0Po
or87
.49.
596
.46.
267
.06.
314
8.2
12.1
123.
113
.514
8.2
*12
.10.
0 t
0.0
t11
0.2
10.4
$37.
43.
7 *
Unk
now
n3.
74.
03.
03.
23.
03.
211
.15.
012
.15.
08.
07.
339
.1 *
1.0
t4.
5*
4.0
0.0
0.0
t
Ma)
or A
ctiv
ityU
nabl
e to
per
form
maj
or a
ctiv
ity70
.49.
271
.4§
7.1
66.1
§7.
310
9.9
*§11
.0 *
106.
7§
11.9
106.
8§
6.7
127.
48.
5 t
82.9
#9.
210
.382
Lim
ited
in a
mou
nt/k
ind
of m
ajor
act
ivity
14.3
6.4
13.3
7.8
14.0
7.9
17.6
4.8
19.8
4.9
18.8
4.8
0.0
-1-
0.0
t15
.26.
710
.34.
4L
imite
d in
oth
er a
ctiv
ity13
.815
.4 *
11.8
14.1
*12
.214
.113
.922
915
.822
.9 *
11.0
30.3
39.0
*5.
012
.516
.323
.311
.?N
ot li
mite
d in
act
ivity
3.6
5.3
3.2
5.0
3.1
4.9
6.1
§5.
06.
3§
4.7
5.8
§5.
58.
63.
3$
3.6
4.9
3.6
7.4
Bas
ic L
ife
Act
iviti
esN
eeds
hel
p in
sel
f ca
re (
AD
L)-
ages
5-1
736
.510
.443
.714
.253
.114
.227
.5*
5.8
32.8
5.8
28.7
5.8
0.0
1-0.
0 t
38.4
10.7
18.7
4.0
fN
ot li
n-tit
ed in
bas
ic li
fe a
ctiv
iti4.
46.
13.
85.
73.
75.
68.
1#
6.7
83#
6.6
8.0
#6.
49.
43.
7$
4.4
5.9
4.1
7.4
1:3
00 ts.)

TA
BL
E 8
. Hos
pita
l Dis
char
ges
Per
100
Pers
ons
and
Ave
rage
Len
gth
of S
tay
Per
Dis
char
ge P
er Y
ear
Am
ong
Chi
ldre
n A
ged
0-17
, by
Typ
e of
Hea
lth I
nsur
ance
Cov
erag
e, D
isab
ility
and
Hea
lth S
tatu
s, b
y G
ende
r. U
nite
d St
ates
,198
9 All
Pers
ons
AL
OS
Typ
eof
Hea
lth I
nsur
ance
Cov
erag
e
Publ
ic
Onl
yM
edic
aid
Mili
tary
All
Insu
red
HD
AL
OS
All
Not
Insu
red
Any
Priv
ate
HD
AL
OS
Priv
ate
Onl
yA
nyPu
blic
HD
HD
AL
OS
HD
AL
OS
FID
AL
OS
HD
AL
OS
HD
AID
SH
O A
LO
S
All
Boy
s0.
30.
70.
41.
00.
41.
113
1.2
131.
413
1.4
4.1
1.3
0.4
0.8
0.5
1.0
Age 0-
4 ye
ars
5-17
yea
rs0.
803
0.9
1.2
0.9
0.4
1.5
1.4
0.9
0.4
1.6
1.4
3.1
0.8
0.5
433.
10.
90.
55.
03.
10.
90.
65.
410
.02.
41.
02.
70.
903
1.0
1.4
1.3
0.6
1.8
0.9
Hea
lth S
tatu
sE
xcel
lait
Ver
y
030.
703
1.0
0.3
1.0
2.0
0.8
2.2
0.6
1.9
0.6
5.6
1.9
030.
80.
62.
5go
odG
ood
0.6
2.1
0.8
2.9
0.9
2.9
1.0
0.5
130.
71.
20.
5-
-0.
82.
51.
21.
4
Fair
0.9
0.8
130.
613
0.5
2.2
2.1
2.5
2.2
2.4
2.5
8.8
0.8
1.1
0.8
132.
03.
21.
93.
66.
13.
86.
16.
60.
87.
10.
86.
90.
852
.8-
3.6
2.2
5.9
0.9
Poor
28.0
7.0
70.1
1.2
18.7
3.5
66.8
8.6
45.8
12.6
66.8
8.6
--
40.6
7.5
12.4
-U
nkno
wn
2.7
'..5
2.7
0.7
2.7
0.7
123
2.3
12.3
2311
.62.
132
3-
331.
5-
Mai
or A
ctiv
ityU
nabl
e to
per
form
maj
or a
ctiv
ity14
.80.
823
.50.
815
.21.
039
.91.
131
.01.
441
.21.
110
63-
18.0
0.8
9.2
-L
imite
d in
am
ount
/kin
d of
maj
or a
ctiv
ity2.
71.
83.
03.
43.
23.
57.
21.
18.
41.
27.
71.
1-
-3.
12.
03.
50.
9L
imite
d in
oth
er a
ctiv
ity3.
68.
943
12.0
4.5
12.0
9.1
16.2
10.5
16.2
8321
.052
.60.
64.
09.
67.
21.
4N
ot li
mite
d in
act
ivity
030.
603
0.9
030.
91.
11.
013
1.0
1.0
1.2
3.9
1.5
030.
70.
51.
1
Bas
ic L
ife
Act
iviti
esN
eeds
hel
p in
sel
f ca
re (
AD
L)-
ages
5-1
79.
583
7.5
-10
.1-
14.9
2.3
18.2
2315
.723
--
10.5
9.4
22.8
-N
ot li
mite
d in
bas
ic li
fe a
ctiv
ities
030.
70.
41.
00.
41.
113
1313
1.4
131.
54.
113
0.4
0.8
0.5
1.0

TA
BL
E 8
. Hos
pita
l Dis
char
ges
Per
100
Pers
ons
and
Ave
rage
Len
gth
of S
tay
Per
Dis
char
ge P
er Y
ear
Am
ong
Chi
ldre
n A
ged
0-17
, by
Typ
e of
Hea
lth I
nsur
ance
Cov
erag
e,D
isab
ility
and
Hea
lth S
tatu
s, b
Gen
den
Uni
ted
Stat
es, 1
989
All
Gir
ls
Age 0-
4 ye
ars
5-17
yea
rs
Hea
lth S
tatu
sE
xcel
lent
Ver
y go
odG
ood
Fair
Poor
Unk
now
n
Maj
or A
ctiv
ityU
nabl
e to
per
form
maj
or a
ctiv
ityL
imite
d in
am
ount
/kin
d of
maj
or a
ctiv
ityL
imite
d in
oth
er a
ctiv
ityN
ot li
mite
d in
act
ivity
Bas
ic L
ife
Act
iviti
esN
eeds
hel
p in
sel
f ca
re (
AD
L)-
ages
5-1
7N
ot li
mite
d in
bas
ic li
fe a
ctiv
ities
All
Pers
ons
Typ
e of
Hea
lth I
nsur
ance
Cov
erag
e
All
Insu
red
All
Not
Insu
red
Any
Priv
ate
Priv
ate
Onl
yA
nyPu
blic
Publ
icO
nly
Med
icai
dM
ilita
ry
HD
AL
OS
HID
AL
OS
HI)
AL
OS
HD
AL
OS
HD
AL
OS
HD
AL
OS
HD
AL
OS
HI)
AL
OS
HD
AL
OS
03 0.7
03 0.3
0.4
1.0
4.8
36.2 1.6
26.0
4.0
4.7
0.2
29.6 0.3
0.7
12 0.9
1.7
0.7
1.0
35 12 - 3.7
1.6
3.1
0.8
2.1
0.8
03 0.6
0.4
03 0.5
13 4.8
51.7 2.2
32.3 5.0
4.5
0.2
48.1 0.3
0.6
1.5
0.4
0.6
0.7
1.6
3.6
1.4 - 2.0
32 1.3
0.6
23 0.6
03 0.6
0.4
0.3
0.5 13 5.0
51.7 22 35.1 52 4.6
03 513 03
0.6
1.5
0.4
0.6
0.7
1.6
3.6
1.4 - 2.0
3.2
13 0.7
23 0.6
1.1
2.7
0.9
1.0
1.1 22 7.6
78.7 -
60.1 63 4.9
0.9
15.2
1.1
1.7
1.0
4.7
1.7
3.0
0.6
9.8
1.2 - 7.7
0.9 - 0.8 - 1.7
1.2
2.9
0.9
1.0
1.2
23 8.1
78.7 -
69.5
7.0
5.3
0.9
16.9 1.2
1.8
1.0
5.3
1.6
3.0
0.7
9.8
12 - 7.7
0.9 - 0.8 - 1.8
1.2
2.9
0.9
1.0
1.2
22 63 78.7 -
61.6 6.6
5.5
0.8
15.2
1.2
0.8
1.1 13 2.3
3.4
0.7
3.0
1.2 - 1.6
0.9 - 1.0 - 0.8
32 7.2
2.4
2.9
2.7
9.7
78.0 - - - - 32 - 3.2
0.2
02 0.5
0.2 - 0.4 - - - - - 0.2 - 0.2
03 0.8
0.3
0.3
0.5
1.2
4.8
47.9 1.8
29.6
4.3
3.7
02 31.2 03
0.7
0.9
1.0
0.6
0.8
1.0
43 13 - 3.7
1.8
1.5
0.5
2.1
0.7
0.8
2.2
0.7
0.9
0.9
2.1
15.0
38.8 -
11.6 73
30.8 0.8
0.8
2.8
3.9
1.1
9.1
0.5
2.2
1.5
1.2 - - 1.0
6.4
3.4
2.8
HD
=H
ospi
tal d
isch
arge
s pe
r 10
0 pe
rs3n
sA
LO
S=A
vera
ge le
ngth
of
stay
per
hos
pita
l epi
sode
- St
anda
rd e
rror
is e
xact
ly 0
or
is in
dete
rmin
ate
(too
few
Pri
mar
y Sa
mpl
ing
Uni
ts to
cal
cula
te e
rror
).
CO
41u

TA
BL
E 9
. Sou
rce
of H
ealth
Ins
uran
ce C
over
age
Am
ong
Adu
lts A
ged
18 to
64,
by
Dis
abili
ty, H
ealth
Sta
tus,
Em
ploy
men
t and
Pov
erty
, by
Gen
der:
Uni
ted
Stat
es, 1
989
Of
Peop
le N
ot in
Pov
erty
, Per
cent
with
Priv
ate
No
Insu
ranc
eIn
sur-
Priv
ate
From
ance
Popu
- Pe
rcen
tIn
sura
nce
Em
ploy
er R
ecen
tan
dla
tion
Not
In
Priv
Ate
From
In O
wn
Em
ploy
- Pu
blic
Rec
ently
(1,0
00s)
Pov
erty
Ins
uran
ce E
mpl
oyer
Nam
em
ent I
nsur
ance
anc
e E
mpl
oyed
No
Insu
r-
Of
Peop
le in
Pov
erty
, Per
cent
with
Priv
ate
No
Insu
ranc
eIn
sur-
Priv
ate
From
ance
Perc
ent
Insu
ranc
e E
mpl
oyer
Rec
ent
No
and
InPr
ivat
eFr
omIn
Ow
n E
mpl
oy-
Publ
icIn
sur-
Rec
ently
Pove
rty
Insu
ranc
e E
mpl
oyer
Nam
ern
ent I
nsur
ance
anc
e E
mpl
oyed
Tot
alA
ge15
0,30
986
.2#
83.9
#75
.8#
48.8
#79
.9#
5.2
#13
.1*
9.7
#13
.835
.026
.312
.947
.226
.439
.821
.7
18-2
4 ye
ars
25-4
4 ye
ars
45-6
4 ye
ars
Hea
lth S
tatu
s
25,4
0178
,794
46,1
14
74.7
#87
.5#
90.4
#
712
85.2
87.6
# # #
62.7
78.9
76.6
# # #
28.1
53.3
51.0
# # #
76.7
#85
.8#
71.7
#
4.9
32 8.8
# # #
24.5
12.7 83
# 18
.3#
9.8
#5.
6
$25
.3#
12.5
#9.
6
42.3
32.0
313
31.4
25.1
21.5
7.6
15.7
14.2
48.0
52.4
343
18.3
27.4
35.0
39.4
41.8
35.7
215
24.5
15.7
Exc
elle
nt
Ver
y go
odG
ood
57,3
9244
,376
34,4
91
91.2
#88
.6*
81.9
#
86.4
85.7
80.9
# # #
77.8
78.0
72.9
# # #
50.2
51.0
46.6
# * #
84.5
#82
.2#
76.8
#
3.1
3.9
6.0
# # #
11.8
12.1
15.5
#9.
2#
93#
11.1
#8.
8#
11.4
#18
.1
44.2
4. f
.0
30.5
32.4
33.2
23.4
14.5
15.5
12.2
56.9
55.1
49.0
14.3
193
25.9
423
372
44.3
25.0
22.6
24.9
Fair
Poor
10,0
163,
554
713
#60
.1#
74.9
62.1
# #66
.953
.3# #
42.2
28.9
# #61
.1#
29.5
#15
.139
.6# #
165
15.5
#10
.6#
5.9
§28
.739
.923
.415
.217
.510
310
.8 5329
.512
943
.162
.736
.027
.114
.56.
3U
nkno
wn
480
80.4
#75
.4#
61.9
#36
.5#
72.1
#4.
3*
§21
.4$
142
19.6
183
*18
.374
39.5
32.6
*46
.825
.3M
ajor
Act
ivity
Una
ble
to p
erfo
rm m
ajor
act
ivity
6,77
266
.0#
63.2
#53
.3#
28.1
#24
.9#
39.5
#13
.9#
4.7
34.0
17.4
11.7
6.1
9.4
62.7
24.3
43L
imite
d in
am
ount
/kin
d of
maj
or a
ctiv
ity7,
498
79.9
#79
.5#
70.8
*44
.5#
71.2
#12
.8#
145
#9.
9#
20.1
28.4
20.8
11.6
43.1
35.4
38.7
18.9
Lim
ited
in o
ther
act
ivity
5,49
081
.8#
83.2
#74
.6#
46.2
#69
.6#
8.5
#12
2#
8.4
.t18
.227
218
.57.
829
.842
533
313
.0N
ot li
mite
d in
act
ivity
130,
549
87.8
#85
.0#
76.9
#50
.0*
82.9
#3.
4#
13.0
#9.
9#
12.2
38.7
29.4
143
54.1
19.3
42.5
25.0
Wor
k A
ctiv
ityU
nabl
e to
wor
k7,
980
64.5
#64
.5#
53.9
#25
.5#
21.1
#38
.9#
13.4
#4.
035
.516
.410
.65.
68.
263
.224
.43.
7L
imite
d in
am
ount
/kin
d of
wor
k6,
776
82.1
#80
.2#
72.4
#46
.5#
763
#10
.1#
15.0
#10
.7#
17.9
32.7
24.1
133
53.6
28.3
42.1
23.7
Lim
ited
in o
ther
act
iviti
es5,
004
84.7
#83
.5#
74.8
#49
.3#
74.8
#8.
3#
12.1
#8.
8#
153
31.2
22.9
9.9
37.1
35.0
36.1
15.9
Not
lim
ited
in w
ork/
othe
r ac
tiviti
es13
0,54
987
.8#
85.0
#76
.9#
50.0
#82
.9#
3.4
#13
.0#
9.9
If12
.238
.729
.414
354
.119
.342
.525
.0E
mpl
oym
ent S
tatu
sC
urre
ntly
em
ploy
ed11
3,32
791
.4#
86.4
#79
.0#
57.5
#10
0.0
t2.
9#
12.1
il12
.1#
8.6
46.6
37.3
23.7
100.
0 t
8.0
43.9
45.9
Une
mpl
oyed
4,64
167
.6#
60.0
#53
.8#
23.6
#0.
0 1-
6.8
*34
.6#
0.0
t32
.421
314
.64.
40.
0 t
28.6
51.0
0.0
tN
ot in
labo
r fo
rce
32,3
4170
.8#
75.9
#64
.0#
13.2
#0.
0 t
15.7
#14
.3#
0.0
t29
.225
.216
.73.
00.
0 i
45.2
31.6
0.0
iB
asic
Lif
e A
ctiv
ities
Nee
ds h
elp
in s
elf
care
(A
DL
)78
067
.9#
61.1
#48
.1#
23.6
#13
.057
.8#
12.4
1.9
32.1
13.5
9.7
2.6
9.0
81.8
11.3
2.1
Nee
ds h
elp
in r
outin
e ac
tiviti
es (
IAD
L)
2,21
065
.6#
65.5
#58
.3#
25.8
#30
.0#
41.6
#9.
4#
3.8
34.4
18.7
12.6
7.6
9.8
68.2
21.2
3.6
Not
lim
ited
in b
asic
life
act
iviti
es14
7,32
086
.6#
84.2
#76
.1#
49.2
#80
.7#
4.6
* #
13.1
#9.
8#
13.4
35.9
27.0
13.2
49.1
24.1
40.8
22.6
Pove
rty
Lev
elU
nder
0.5
05,
112
- -
-10
0.0
t29
.519
.05.
235
.633
.937
.917
.60.
50 to
und
er 1
.00
9,54
3-
- -
100.
0 f
313
23.1
11.4
453
29.5
40.1
20.9
1.00
to u
nder
1.2
36,
063
- -
--
- -
- -
--
- -
- -
--
- -
- -
--
- -
100.
0 f
45.6
37.5
21.6
59.9
15.2
40.8
26.4
1.25
to u
nder
1.5
06,
945
100.
0 1-
53.6
46.7
27.7
63.5
12.5
33.2
21.8
- -
--
- -
- -
--
- -
- -
--
- -
- -
--
- -
1.50
to u
ncle
s. 1
.75
10,7
1210
0.0
t70
362
.635
.572
.78.
123
.816
.91.
75 to
und
er 2
.00
17,5
8310
0.0
t79
.771
.740
.376
.15.
216
.611
.72.
00 a
nd a
bove
94,3
5210
0.0
t88
380
.153
.582
.64.
49.
77.
6
1'5

TA
BL
E 9
. Sou
rce
of H
ealth
Ins
uran
ce C
over
age
Am
ong
Adu
lts A
ged
18 to
64,
by
Dis
abili
ty, H
ealth
Sta
tus,
Em
ploy
men
t and
Pov
erty
, by
Gen
der:
Uni
ted
Stat
es, 1
989
Of
Peop
le N
ot in
Pov
erty
, Per
cent
with
Priv
ate
No
Insu
ranc
ePr
ivat
eFr
omPo
pu-
Perc
ent 1
Insu
ranc
e E
mpl
oyer
Rec
ent
No
latio
nN
ot I
nPr
ivat
eFr
omIn
Ow
n E
mpl
oy-
Publ
icIn
sur-
(1,0
00s)
Pov
erty
Ins
uran
ce E
mpl
oyer
Nam
em
ent I
nsur
ance
anc
e
Of
Peop
le in
Pov
erty
, Per
cent
with
Priv
ate
No
Insu
ranc
eIn
sur-
From
ance
Perc
ent
Insu
ranc
e E
mpl
oyer
Rec
ent
No
and
InPr
ivat
eFr
omIn
Ow
n E
mpl
oy-
Publ
icIn
sur-
Rec
ently
Pove
rty
Insu
ranc
e E
mpl
oyer
Nam
em
ent I
nsur
ance
anc
e E
mpl
oyed
Insu
r-an
cePr
ivat
ean
dR
ecen
tlyE
mpl
oyed
All
Men
73,1
1288
.4#
83.0
#75
.0#
59.8
#88
.4#
5.2
# 14
.5#
11.9
#11
.635
.8A
ge 18-2
4 ye
ars
12,3
9677
.8#
70.4
#61
.7#
30.4
#79
.5#
2.7
# 27
.4#
21.5
#72
.243
.325
-44
year
s38
,647
89.6
#83
.7#
77.1
#64
.4#
94.6
#2.
8#
14.6
*12
.5#
10.4
33.7
45-6
4 ye
ars
22,0
6992
.2#
87.8
#77
.9#
65.9
#82
.1#
10.4
#8.
1#
6.4
#7.
828
.4H
ealth
Sta
tus
Exc
elle
nt30
,711
92.0
#85
.7#
77.1
#60
.1#
91.8
#2.
7#
13.1
#10
.9#
8.0
44.9
Ver
y go
od21
,151
90.4
#84
.6#
77.3
#63
.3#
90.8
#3.
7#
13.7
# 11
5#
9.6
45.2
Goo
d15
,155
85.0
#79
.1#
71.5
*57
.8#
86.3
#63
* 17
.7#
14.4
#15
.029
.8Fa
ir4,
131
74.9
#72
.6#
655
#53
.5#
71.1
#17
.7#
17.9
*13
.4§
25.1
21.8
Poor
1,75
463
.5#
62.3
#54
.1#
36.6
#32
3#
44.7
# 14
.8#
6.7
36.5
16.0
Unk
now
n21
280
.9#
68.5
#57
.3#
41.9
§75
.5§
5.6
$ 27
.222
.019
.112
.4M
ajor
Act
ivity
Una
ble
to p
erfo
rm m
ajor
act
ivity
3,80
167
.7#
61.1
#51
.1#
33.6
#24
.9#
45.7
# 14
.0N
5.0
32.3
14.7
Lim
ited
in a
mou
nt/k
ind
of m
ajor
act
ivity
3,39
482
.6#
78.5
*71
3#
57.8
#83
.5#
13.6
§ 15
.7#
11.9
#17
.432
.4L
imite
d in
oth
er a
ctiv
ity2,
232
89.6
#85
.6#
78.0
N63
.3#
87.5
#7.
9#
11.8
#10
.2#
10.4
28.4
Not
lim
ited
in a
ctiv
ity63
,685
89.9
#84
.1#
762
#61
.0#
91.5
#2.
8N
14.
5#
123
#10
.140
.4W
ork
Act
ivity
Una
ble
to w
ork
3,86
666
.8#
61.1
#50
.9#
33.3
#24
.1#
46.1
# 13
.6#
4.8
33.2
14.2
Lim
ited
in a
mou
nt/k
ind
of w
ork
3,29
183
.0#
78.7
#71
.5#
58.1
#84
.4#
13.1
$ 15
.9#
12.1
#17
.032
.7L
imite
d in
oth
er a
ctiv
ities
2,27
090
.8#
85.1
#77
.9#
633
Of
87.4
#8.
1$
12.1
# 10
3#
9.2
34.7
Not
lim
ited
in w
ork/
othe
r ac
tiviti
es63
,685
89.9
#84
.1#
76.2
#61
.0#
91.5
#2.
8#
145
# 12
3#
10.1
40.4
Em
ploy
men
t Sta
tus
Cur
rent
ly e
mpl
oyed
62,1
4191
.9#
85.4
#77
.8#
63.9
#10
0.0
t2.
9#
13.4
#13
.4#
8.1
43.4
Une
mpl
oyed
2,37
067
.6#
523
#46
.4#
25.9
#0.
05.
9#
42.8
#0.
032
.417
.1N
ot in
labo
r fo
rce
8,60
168
.6#
633
#56
.2#
293
#0.
026
.6#
16.7
#0.
031
.426
.9B
asic
Lif
e A
ctiv
ities
Nee
ds h
elp
in s
elf
care
(A
DL
)36
570
.7#
61.4
#45
.9#
25.8
#14
.965
.5§
10.7
$1.
529
316
.5N
eeds
hel
p in
rou
tine
activ
ities
(IA
DL
)81
266
.9#
55.9
#50
.3#
30.7
#30
.9#
55.8
# 10
.2f
3.4
33.1
172
Not
lim
ited
in b
asic
life
act
iviti
es71
,935
88.7
#83
.3#
75.4
#60
.2#
89.2
#45
# 14
5#
12.0
#11
336
.6Po
vert
y L
evel
Und
er 0
.50
1,88
0-
- -
100.
031
.50.
50 to
und
er 1
.00
3,88
3-
- -
100.
031
.61.
00 to
und
er 1
.25
2,73
3-
- -
- -
--
- -
- -
--
- -
- -
--
- -
- -
-10
0.0
44.7
1.25
to u
nder
1.5
03,
188
100.
054
.046
.033
.976
210
237
.129
.1-
- -
1.50
to u
nder
1.7
55,
254
100.
069
.061
.646
283
.273
25.9
20.2
1.75
to u
nder
2.0
08,
612
100.
079
.071
354
386
.84.
418
.214
.32.
00 a
nd a
bove
47,5
6310
0.0
872
79.1
64.0
90.1
4.7
11.0
9.4
77.1
16.3
59.2
17.3
313
9.8
56.4
7.7
26.8
20.7
68.7
155
21.0
16.5
41.5
36.8
32.4
17.9
67.7
5.5
353
20.9
66.8
10.3
73.3
15.1
65.6
13.7
16.1
12.1
37.2
38.8
12.8
7.4
16.6
61.6
12.4
*12
.438
.431
.8 '
113
6.9
10.8
62.1
242
15.6
59.5
23.2
20.6
11.5
*51
.230
.730
.618
.468
.77.
7
10.6
6.5
103
63.4
24.8
15.7
62.6
22.0
26.6
15.0
57.8
16.5
30.6
18.4
68.7
7.7
34.5
24.6
100.
0 t
4.5
12.0
4.0
0.0
t18
.017
.743
0.0
140
.8
"14
.86.
010
.485
.613
.09.
913
.572
.927
.716
.761
.414
.5
19.4
6.5
45.4
18.4
23.8
14.5
57.0
21.1
37.1
25.7
71.9
11.0
47.4
31.0
48.6
30.4
51.1
36.2
37.0
20.1
49.8
34.0
44.6
31.9
553
38.2
42.4
20.6
26.8
8.4
50.5
255
25.4
5347
.728
.041
.127
.651
.836
3
24.6
5.1
48.1
29.2
49.7
31.7
51.8
363
52.4
52.4
65.4
0.0
t33
.00.
0 t
3.0
1.1
18.2
4.1
49.0
323
49.7
27.8
473
302
46.0
34.4
- -
--
- -
- -
--
- -
- -
--
--

TA
BL
E 9
. Sou
rce
of H
ealth
Ins
uran
ce C
over
age
Am
ong
Adu
lts A
ged
18 to
64,
by
Dis
abili
ty, H
ealth
Sta
tus,
Em
ploy
men
t and
Pove
rty,
by
Gen
der:
Uni
ted
Stat
es, 1
989
All
Wom
enA
ge 18-2
4 ye
ars
25-4
4 ye
ars
45-6
4 ye
ars
Hea
lth S
tatu
sE
xcel
lent
Ver
y go
odG
ood
Fair
Poor
Unk
now
nM
ajor
Act
ivity
Una
ble
to p
erfo
rm m
ajor
act
ivity
Lim
ited
in a
mou
nt/k
ind
of m
ajor
act
ivity
Lim
ited
in o
ther
act
ivity
Not
lim
ited
in a
ctiv
ityW
ork
Act
ivity
Una
ble
to w
ork
Lim
ited
in a
mou
nt/k
ind
of w
ork
Lim
ited
in o
ther
act
iviti
esN
ot li
mite
d in
wor
k/ot
her
activ
ities
Em
ploy
men
t Sta
tus
Cur
rent
ly e
mpl
oyed
Une
mpl
oyed
Not
in la
bor
forc
eB
asic
Lif
e A
ctiv
ities
Nee
ds h
elp
in s
elf
care
(A
DL
)N
eeds
hel
p in
rou
tine
activ
ities
(IA
DL
)N
ot li
mite
d in
bas
ic li
fe a
ctiv
ities
Pove
rty
Lev
elU
nder
0.5
00.
50 to
und
er 1
.00
1.00
to u
nder
1.2
51.
25 to
und
er 1
.50
1.50
to u
nder
1.7
51.
75 to
und
er 2
.00
2.00
and
abo
ve
Of
Peop
le N
ot in
Pov
erty
, Per
cent
with
Priv
ate
Insu
ranc
ePr
ivat
eFr
omPo
pu-
Perc
ent
Insu
ranc
e E
mpl
oyer
Rec
ent
latio
nN
ot I
nPr
ivat
eFr
omIn
Ow
n E
mpl
oy-
Publ
ic(1
,000
s) P
over
ty I
nsur
ance
Em
ploy
er N
ame
men
t Ins
uran
ce
Of
Peop
le in
Pov
erty
, Per
cent
with
No
Priv
ate
No
ance
Priv
ate
From
I-
Insu
r-In
sura
nce
No
and
Perc
ent
Insu
ranc
e E
mpl
oyer
Rec
ent
No
and
Insu
r- R
ecen
tlyIn
Priv
ate
From
In O
wn
Em
ploy
- Pu
blic
Insu
r- R
ecen
tlyan
ce E
mpl
oyed
Pov
erty
Ins
uran
ce E
mpl
oyer
Nam
em
ent I
nsur
ance
anc
e E
mpl
oyed
77,1
9784
.2#
84.8
#76
.5#
37.9
#71
.5*
5.3
# 11
.7 #
7.5
*15
.834
.525
.710
.538
.832
.834
.415
2
13,0
0571
.7#
72.0
#63
.7#
25.7
#73
.9#
7.1
# 21
.5 #
14.9
283
41.5
31.5
6.0
41.7
26.3
32.5
14.8
40,1
4785
.4*
86.7
#80
.7 #
42.0
#76
.9#
3.6
# 10
.7 #
7.2
#14
.630
.823
.912
.341
.235
.635
.516
.424
,046
88.8
*87
.4 *
753
#36
.7 *
61.7
* 7.
4*
8.9
04.
8*
11.2
33.1
21.8
12.7
29.8
35.4
34.9
13.0
26,6
8190
.4#
87.2
#78
.6#
38.7
#75
.9#
3.5
* 10
.4 #
73#
9.6
43.6
325
113
46.5
22.8
35.1
163
23,2
2686
.9#
86.7
#78
.7#
39.4
*74
.1#
4.2
# 10
.6 #
7.2
#13
.143
.131
.811
.947
325
332
.216
.519
,336
79.6
#82
.4#
74.1
#37
.2 *
68.8
# 5.
7#
13.7
#8.
4#
20.4
30.8
23.5
10.5
39.4
33.0
37.9
17.3
5,88
668
.8#
76.6
#68
.0#
335
#53
.60
13.1
# 15
.4 #
8.5
31.2
24.3
18.3
10.1
25.1
45.5
32.4
11.0
1,80
056
.8#
61.9
#52
4 #
20.5
#26
.4#
34.1
# 16
3 #
5.1
43.2
14.6
8.3
3.6
9.9
63.6
27.2
4.6
268
80.0
#80
.9 #
65.6
#32
2 #
69.4
t 33
§ 16
.8 t
8.0
20.0
22.8
*22
.8 *
3.6
*40
.433
.244
.125
.2 *
2,97
063
.9#
66.1
#56
.3#
20.7
#25
.0#
31.2
# 13
.8 #
4.4
36.1
20.5
12.1
5.3
7.9
63.4
23.1
3.2
4,10
477
.7*
80.4
#70
.4#
32.7
#60
.4#
12.1
# 13
.5 #
8.0
§22
.325
.918
.79.
032
.543
.333
.013
.03,
258
76.4
#81
.2 #
71.9
#32
.4#
55.2
* 9.
0#
12.5
#6.
923
.626
.817
.96.
723
.446
.130
.98.
666
,865
85.8
#85
.9 #
77.7
#39
.0#
743
# 3.
9*
11.5
#7.
6#
14.2
37.6
28.6
115
44.2
27.2
36.1
173
4,11
362
.4#
68.1
#56
.9 #
17.7
#18
.1#
31.7
# 13
.2 #
3.2
37.6
18.3
10.6
4.8
6.5
63.1
24.2
263,
486
813
#81
.5#
73.3
#35
.40
68.4
# 7.
2#
14.1
#9.
4#
18.7
32.8
23.5
11.1
45.8
33.8
36.9
19.0
2,73
379
.6#
81.9
#71
.9#
36.0
#63
.0#
8.6
# 12
.1#
7.4
20.4
29.8
21.6
8.0
29.3
42.0
31.1
10.0
66,8
6585
.8#
85.9
#77
.7#
39.0
#74
3#
3.9
# 11
5 #
7.6
#14
.237
.628
.611
544
.227
.236
.117
.3
51,1
8690
.7#
87.7
it80
.5#
49.6
# 10
0.0
1-2.
8#
10.5
#10
.5#
9.3
50.0
40.2
22.7
100.
0 t
11.7
39.1
39.1
2,27
167
.6#
67.8
#61
.6#
21.2
#0.
0 1-
7.7
# 26
.0 §
0.0
t32
.425
.817
.44.
80.
0 t
39.6
35.9
0.0
t23
,740
71.6
#78
.5 #
66.7
7.6
#0.
011
.9#
13.4
40.
0 1-
28.4
24.6
16.4
2.5
0.0
1-46
.931
.00.
0 i
415
655
#60
.9 #
50.3
#21
.611
.150
.4#
14.1
2.2
*34
511
35.
80.
0 1-
8.0
*79
.017
.42.
9 *
1,39
764
.971
.2 N
63.1
#22
.8#
29.4
# 33
.0#
9.0
#4.
035
.119
.512
.463
7.8
65.7
22.8
3.4
*75
,385
84.6
#85
.1#
76.8
#38
.2 #
72.3
# 4.
7#
11.7
#7.
6*
15.4
353
26.5
10.8
40.5
30.8
35.1
15.8
3,23
1-
100.
028
.218
.84.
529
.942
.831
.011
.65,
661
- -
-10
0.0
31.2
22.5
9337
.435
.335
.114
.53,
329
- -
--
--
- -
- -
--
- -
- -
--
- -
- -
-10
0.0
46.3
37.8
183
50.0
18.7
36.6
19.7
3,75
710
0.0
56.9
473
22.5
52.8
143
30.0
15.6
_ -
.-
- -
- -
--
- -
- -
--
- -
- -
5,45
810
0.0
71.5
63.6
25.3
62.5
8.9
21.8
13.7
8,97
110
0.0
80.4
72.0
26.8
65.9
5.9
15.1
9.2
46,7
8910
0.0
89.5
81.2
42.8
75.1
4.1
8.4
5.8
Sour
ce: N
atio
nal H
ealth
Int
ervi
ew S
urve
y (a
utho
r's ta
bula
tions
fro
m p
ublic
use
tape
s).
Not
e: S
tand
ard
erro
rs f
or e
stim
ates
app
ear
in A
ppen
dix
TA
BL
E B
-9.
1 Po
vert
y de
fine
d as
und
er 1
25%
fed
eral
pov
erty
thre
shol
d.E
stim
ate
has
low
sta
tistic
al r
elia
bilit
y (r
elat
ive
stan
dard
err
or >
30%
).t E
stim
ate
is e
xact
ly 0
or
stan
dard
err
or is
inde
term
inat
e.Si
gnif
ican
tly d
iffe
rent
fro
m p
erso
ns in
pov
erty
p<
.05.
§ Si
gnif
ican
tly d
iffe
rent
fro
m p
erso
ns in
pov
erty
p<
.01.
Sign
ific
antly
dif
fere
nt f
rom
per
sons
in p
over
ty p
<.0
01.
1.29
CX
)

TA
BL
E 1
0. S
ourc
e of
Hea
lth I
nsur
ance
Cov
erag
e A
mon
g C
hild
ren
Age
d 0
to 1
7, b
y D
isab
ility
, Hea
lth S
tatu
s, E
mpl
oym
ent a
nd P
over
ty, b
y G
ende
n U
nite
d St
ates
, 198
9
Popu
latio
n(1
,000
s)Sa
mpl
eSi
ze
Perc
ent
I
Not
In
Pove
rty
Insu
ranc
e
Of
Peop
le N
ot in
Pov
erty
, Per
cent
with
Priv
ate
Insu
ranc
eN
oPr
ivat
eFr
omPu
blic
Insu
r-
Em
ploy
erIn
sura
nce
ance
Tot
al64
,005
31,5
2474
.5 #
85.4
#79
.2#
5.3
#10
.0
Age 0-
4 ye
ars
18,7
699,
146
72.0
#83
.1#
77.1
#6.
4#
11.1
4-17
yea
rs45
,236
22,3
7875
.5 #
86.4
#80
.1#
4.8
#9.
6H
ealth
Sta
tus
Exc
elle
nt33
,747
16,4
9481
.3 #
87.5
#81
.1#
4.4
#8.
7
Ver
y go
od17
,052
8,40
674
.0 #
84.7
#78
.8#
5.6
#10
.5G
ood
10,9
025,
495
57.4
#80
.2#
74.4
#73
#13
.8Fa
ir1,
472
727
52.0
73.7
#67
.5#
13.6
#13
.8Po
or19
092
38.6
§60
.5#
60.5
#16
.1§
23.4
Unk
now
n64
331
076
.4 #
81.7
#70
3#
7.5
#12
.2
Maj
or A
ctiv
ityU
nabl
e to
per
form
maj
or a
ctiv
ity34
617
166
.7 #
71.5
#69
.4#
19.4
#12
.2L
imite
d in
am
ount
/kin
d of
maj
or a
ctiv
ity2,
097
1,03
263
.4 #
77.6
#72
.7#
12.5
#12
.9L
imite
d in
oth
er a
ctiv
ity99
449
773
3 #
85.7
#81
.7#
6.8
#8.
4N
ot li
mite
d in
act
ivity
60,5
6729
,824
74.9
#85
.7#
79.4
#5.
0#
9.9
Bas
ic L
ife
Act
iviti
esN
eeds
hel
p in
sel
f ca
re (
AD
L)-
ages
5-1
719
489
63.1
#66
.4#
59.8
#35
.3#
8.6
Not
lim
ited
in b
asic
life
act
iviti
es63
,811
31,4
3574
.5 #
85.5
#79
3#
5.2
#10
.0
Pove
rty
Lev
elU
nder
0.5
04,
433
2,32
1-
- -
0.50
to u
nder
1.0
07,
434
3,88
7-
- -
1.00
to u
nder
1.2
54,
476
2,30
7-
- -
- -
--
- -
- -
--
- -
1.25
to u
nder
1.5
04,
757
2,36
910
0.0
63.8
57.5
11.2
25.5
1.50
to u
..der
1.7
58,
594
4,20
410
0.0
79.1
73.5
8313
.61.
73 to
und
er 2
.00
11,7
375,
692
100.
086
.680
.44.
59.
72.
00 a
nd a
bove
22,5
7410
,744
100.
091
.885
.433
5.6
1 3
Of
Peop
le in
Pov
erty
, Per
cent
with
Priv
a te
Insu
ranc
ePr
ivat
eFr
om
Insu
ranc
eEm
ploy
er
Perc
ent
No
InPu
blic
Insu
r-Po
vert
yIn
sura
nce
ance
#25
.529
.724
.339
.732
.7
#28
.024
.320
.345
.631
.1#
24.5
32.2
26.2
36.9
33.5
#18
.732
.826
.535
.534
.1#
26.0
32.0
26.2
37.9
31.6
#42
.624
.620
.545
.032
.8
§48
.024
.721
.252
.325
.661
.416
.112
.8*
49.4
36.2
§23
.624
.814
.539
.435
.8
$33
318
.717
.1*
59.5
26.9
#36
.624
.619
.354
.026
.2
§26
.728
.622
.355
.919
.8#
25.1
30.1
24.6
38.5
333
36.9
12.7
12.7
80.6
11.6
#25
.529
.824
.339
.532
.8
100.
013
.08.
461
.428
.410
0.0
26.0
21.0
39.7
36.5
100.
052
.445
.518
330
.7-
- -
- -
--
- -
- -
--
- -
t

TA
BL
E 1
0. S
ourc
e of
Hea
lth I
nsur
ance
Cov
era
e A
mon
Chi
ldre
n A
ed
0 to
17,
b D
isab
ili, H
ealth
Sta
tus
Em
lo m
ent a
nd P
ovb
Gen
den
Uni
ted
Stat
es 1
989
Popu
latio
n(1
,000
s)Sa
mpl
eSi
ze
Perc
ent 1
Not
In
Pove
rty
Insu
ranc
e
Of
Peop
le N
ot in
Pov
erty
, Per
cent
with
Perc
ent
InPo
vert
y
Of
Peop
le in
Pov
erty
, Per
cent
with
Priv
ate
Insu
ranc
eN
oPr
ivat
eFr
omPu
blic
Insu
r-E
mpl
oyer
Insu
ranc
e an
ce
Priv
ate
Insu
ranc
eN
oPr
ivat
eFr
omPu
blic
lnsu
r-In
sura
nceE
mpl
oyer
Ins
uran
ce a
nce
All
Boy
s32
,753
16,0
4075
.2 #
85.3
#79
.1#
5.5
#10
2#
24.8
29.4
24.2
39.5
33.2
Age 0-
4 ye
ars
9,60
74,
607
72.7
#83
.1#
76.9
#6.
7#
112
#27
325
.121
344
.531
.34-
17 y
ears
23,1
4611
,433
762
#86
2#
80.0
#5.
0#
9.7
#23
.831
.425
.537
.134
.1H
ealth
Sta
tus
Exc
elle
nt17
,509
8,52
881
.8 #
873
#81
2#
4.6
#9.
0#
182
32.8
26.7
35.9
33.2
Ver
y go
od8,
576
4,20
475
.0 #
84.4
#77
.9#
5.8
#10
.8#
25.0
30.6
24.6
38.5
32.7
Goo
d5,
524
2,75
958
.6 #
80.9
#75
.1#
8.0
#13
.0#
41.4
253
21.7
42.6
34.6
Fair
740
362
51.0
67.7
#62
.9#
14.7
#17
.849
.022
.719
.756
.224
.6Po
or91
4430
.6 #
62.2
§62
2#
183
19.6
69.4
16.3
102
*46
.040
.8U
nkno
wn
312
143
71.7
#81
.9#
69.8
#5.
7#
12.5
528
.320
.613
.239
.539
.9M
ajor
Act
ivity
Una
ble
to p
erfo
rm m
ajor
act
ivity
201
101
65.5
#70
.1#
67.8
#17
.7#
12.5
34.5
16.9
143
59.8
30.6
Lim
ited
in a
mou
nt/k
ind
of m
ajor
act
ivity
1,31
964
164
.9 #
78.4
#73
2#
12.4
#13
.1#
35.1
25.8
203
52.4
27.1
Lim
ited
in o
ther
act
ivity
580
289
71.0
#86
.1#
823
#6.
8#
8.6
$29
.026
.520
.957
220
.7N
ot li
mite
d in
act
ivity
30,6
5315
,009
75.8
#85
.6#
793
#5.
2#
10.1
#24
229
.824
.638
.133
.9B
asic
Lif
e A
ctiv
: les
Nee
ds h
elp
self
car
e (A
DL
)-ag
5-17
130
5659
.959
.9#
51.8
#41
.7§
11.0
40.1
6.7
"6.
787
.412
.6N
ot li
mite
d in
bas
ic li
fe a
ctiv
ities
32,6
2315
,984
75.2
#85
.4#
792
#5.
4#
102
#24
.829
324
339
.233
.4Po
vert
y L
evel
Und
er 0
.50
2,19
11,
136
-10
0.0
12.6
8.9
60.9
28.7
0.50
to u
nder
1.0
03,
722
1,94
5-
- -
100.
026
321
.239
.736
.61.
00 to
und
er 1
.23
2,21
81,
134
- -
-_
. --
- -
- -
-10
0.0
51.1
443
18.0
31.9
1.25
to u
nder
1.5
02,
544
1,26
410
0.0
64.5
58.5
11.8
24.7
- -
--
- -
- -
--
- -
- -
-1.
50 to
und
er 1
.75
4,36
52,
124
100.
078
.172
29.
014
.21.
75 to
und
er 2
.00
6,09
82,
941
100.
086
.480
.54.
49.
82.
00 a
nd a
bove
11,6
155,
496
100.
092
.085
53.
45.
7
13
1 :4
00

TA
BL
E 1
0.So
urce
of
Hea
lth I
nsur
ance
Cov
erag
e A
mon
g C
hild
ren
Age
d 0
to 1
7, b
y D
isab
ility
, Hea
lth S
tatu
s,E
mpl
oym
ent a
nd P
over
ty, b
y G
ende
r: U
nite
d St
ates
, 198
9
Popu
latio
n(1
,000
s)
All
Gir
ls31
,252
Age 0-
4 ye
ars
9,16
24-
17 y
ears
22,0
90H
ealth
Sta
tus
Exc
elle
nt16
,238
Ver
y go
od8,
475
Goo
d5,
377
Fair
732
Poor
99U
nkno
wn
330
Maj
or A
ctiv
ityU
nabl
e to
per
form
maj
or a
ctiv
ity14
6L
imite
d in
am
ount
/kin
d of
maj
or a
ctiv
ity77
8L
imite
d in
oth
er a
ctiv
ity41
5N
ot li
mite
d in
act
ivity
29,9
14B
asic
Lif
e A
ctiv
ities
Nee
ds h
elp
in s
elf
care
(A
DL
)-ag
es 5
-17
64N
ot li
mite
d in
bas
ic li
fe a
ctiv
ities
31,1
88Po
vert
y L
evel
Und
er 0
.50
2,24
30.
50 to
und
er 1
.00
3,71
21.
00 to
und
er 1
.25
2,25
81.
25 to
und
er 1
.50
2,21
21.
50 to
und
er 1
.75
4,22
91.
75 to
und
er 2
.00
5,63
92.
00 a
nd a
bove
10,9
59
Of
Peop
le N
ot in
Pov
erty
, Per
cent
with
Priv
ate
Perc
ent
Insu
ranc
eN
oN
oSa
mpl
e N
ot I
nPr
ivat
eFr
omPu
blic
Insu
r-In
sur-
Size
Pove
rty
Insu
ranc
e E
mpl
oyer
Insu
ranc
e an
cean
ce
Of
Peop
le in
Pov
erty
, Per
cent
with
Priv
ate
Perc
ent
Insu
ranc
eIn
Priv
ate
From
Publ
icPo
vert
y In
sura
nceE
mpl
oyer
Ins
uran
ce
15,4
8473
.7*
85.6
4,53
971
.3*
83.2
10,9
4574
.7#
86.5
7,96
680
.8*
87.6
4,20
273
.1#
85.0
2,73
656
.2#
79.4
365
53.0
79.5
4845
.959
.416
780
.8#
81.5
.70
68.3
#73
.339
160
.8#
76.2
208
76.6
#85
.2
14,8
1574
.0#
85.8
3369
.6#
77.9
15,4
5173
.7#
85.6
1,18
5-
- -
1,94
2-
- -
1,17
3-
- -
- -
-
1,10
510
0.0
62.9
2,08
010
0.0
80.1
2,73
110
0.0
86.7
5,24
810
0.0
91.7
Sour
ce: N
atio
nal H
ealth
Int
ervi
ew S
urve
y (a
utho
r's ta
bula
tions
fro
m p
ublic
use
tape
s).
Not
e: S
tand
ard
erro
rs f
or e
stim
ates
app
ear
in A
ppen
dix
TA
BL
E B
-10.
Pove
rty
defi
ned
as u
nder
125
% f
eder
al p
over
ty th
resh
old.
Est
imat
e ha
s lo
w s
tatis
tical
rel
iabi
lity
(rel
ativ
e st
anda
rd e
rror
> 3
0%).
t Est
imat
e is
exa
ctly
0 o
r st
anda
rd e
rror
is in
dete
rmin
ate.
Sign
ific
antly
dif
fere
nt f
rom
per
sons
in p
over
ty p
.05.
§ Si
gnif
ican
tly d
iffe
rent
fro
m p
erso
ns in
pov
erty
p<
.01.
# Si
gnif
ican
tly d
iffe
rent
fro
m p
erso
ns in
pov
erty
p<
.001
.
#79
.4#
5.0
#9.
9#
26.3
30.0
24.4
39.9
32.2
#77
.3#
6.1
#10
.9#
28.7
23.6
19.3
46.6
31.0
#80
.2#
4.6
#9.
4#
25.3
33.1
26.8
36.7
32.8
#80
.9#
4.2
#8.
5#
19.2
32.8
26.3
35.1
35.0
#79
.7#
5.4
#10
.2#
26.9
33.4
27.7
37.3
30.6
#73
.8#
6.6
#14
.6#
43.8
23.9
19.4
47.3
31.0
#72
.0#
12.5
#10
.0#
47.0
26.7
22.7
48.1
26.6
§59
.4§
14.9
§25
.854
.115
.915
.953
.430
.7 "
*70
.8#
9.1
§12
.019
.230
.5*
16.4
393
30.1
#71
.4#
21.6
' §11
.831
.721
.4*
21.4
59.0
21.4
#71
.9#
12.8
#12
.7$
39.2
22.8
17.7
56.5
25.0
#81
.0#
6.9
*#8.
123
.432
.224
.653
.618
.3#
79.5
#4.
8*
9.8
#26
.030
.324
.739
.032
.8
§73
.8$
24.1
4.5
30.4
28.9
'28
.962
.28.
9 "
#79
.4#
5.0
#9.
9#
263
30.0
24.4
39.8
32.3
100.
013
.48.
061
.928
.010
0.0
25.8
20.7
39.6
36.4
.. _
.-
- -
- -
-10
0.0
53.6
46.8
18.6
29.6
563
10.6
26.3
- -
--
- -
- -
--
- -
- -
-75
.07.
613
.080
.44.
59.
585
.23.
25.
5
CD

Disabilihy and health insurance 91
APPENDIX ASTANDARD ERRORS FOR TEXT TABLES

92 Disability and health insurance
TABLE A-1. Standard Errors of Estimates of Type of Health Insurance Coverage Among Adults Aged 18 to 64, by SociodemographicCharacteristics, by Gender:United States, 1989
Population(1,000s)
With Insurance
NotInsured
Medi-care
Medi-caid
PrivateOnly
PublicOnly
Privateand
Public
UndefinedPlansOnly
Total 2,073 0.4 0.2 0.1 0.0 0.3 0.1 0.2
Age18-24 years 581 0.8 0.4 0.1 0.1 0.6 0.1 0.325-44 years 1,135 0.5 0.2 0.1 0.0 0.4 0.1 0.245-64 years 710 0.4 0.2 0.2 0.1 0.3 0.2 0.2
RaceWhite 1,948 0.4 0.2 0.1 0.0 0.3 0.1 0.1Black 650 0.8 0.5 0.3 0.1 0.6 0.2 0.5Oche:- 274 1.8 1.1 03 0.4 1.5 0.2 1.1
EthnidtyHispanic 567 1.7 0.7 0.3 02 1.6 0.2 0.7Non-Hispanic 1,970 0.4 0.2 0.1 0.0 0.2 0.1 0.1
EducationLess than 12 years 609 0.8 0.5 0.2 0.1 0.8 0.2 0.412 years 997 0.5 0.2 0.1 0.0 0.3 0.1 0.2Some college 633 0.5 0.2 0.2 0.1 0.4 0.1 0.1College graduate 592 0.3 0.1 0.1 0.0 0.3 0.1 0.0Unknown 55 3.3 2.7 1.6 03 3.3 2.0 2.6
Age & Education18-24 years &
Less than 12 years 158 1.4 0.9 0.2 0.2 1.3 02 0.912 years 328 0.9 0.4 0.2 0.2 0.8 0.1 0.4Some college 290 1.0 0.5 0.2 0.1 0.9 0.1 0.2College graduate 98 1.6 0.4 0.5 0.2 1.5 02 0.1Unknown 15 8.2 5.0 53 - 8.9 4.6 7.5
25-44 years &Less than 12 years 335 1.2 0.7 0.2 0.1 1.2 03 0.712 years 529 0.6 03 0.1 0.1 0.5 0.1 0.2Some college 378 0.5 0.2 0.2 0.1 0.4 0.1 0.2College graduate 421 0.4 0.1 0.1 0.0 0.3 0.1 0.1Unknown 36 4.9 3.8 2.7 0.5 4.9 2.6 3.8
45-64 yearsLess than 12 years 249 0.9 0.6 0.4 0.1 0.6 0.4 0.512 years 364 0.6 03 03 0.1 03 0.2 0.2Some college 188 0.8 0.4 0.5 0.1 0.5 03 0.2College graduate 240 0.6 0.2 0.4 0.1 0.4 0.2 0.1Unknown 28 4.7 4.1 1.0 - 4.5 3.6 3.7
Marital StatusMarried 1,474 0.4 02 0.1 0.0 03 0.1 0.1Widowed 102 1.5 0.8 0.7 0.1 1.2 0.8 0.7Divorced 226 0.8 0.5 0.2 0.1 0.6 03 0.5Separated 111 1.4 1.2 0.4 0.2 1.1 0.4 1.2Never married 690 0.6 03 0.1 0.1 0.5 0.1 0.3Unknown 22 5.2 23 2.2 - 5.3 2.0 2.5
Employment StatusCurrently employed 1,627 03 0.1 0.1 0.0 03 0.0 0.1Unemployed 144 12 0.9 03 0.2 1.2 0.2 0.8Not in labor force 568 0.7 0.6 0.2 0.1 0.5 0.2 0.5
Employment Status & AgeCurrently employed &
18-24 years 415 0.7 0.2 0.1 0.1 0.7 0.1 0.125-44 years 960 0.4 0.1 0.1 0.0 0.3 0.0 0.145-64 years 526 0.4 0.1 0.2 0.1 03 0.1 0.1

Disability and health insurance
TABLE A-1. Standard Errors of Estimates of Type of Health Insurance Coverage Among Adults Aged 18 to 64, by SociodemographicCharacteristics, by Gender United States, 1989
93
Unemployed &
Popula tion(1,000s)
With Insurance
NotInsured
Medi-care
Medi-caid
PrivateOnly
PublicOnly
Privateand
Public
UndefinedPlansOnly
18-24 years 71 2.4 1.4 0.5 0.4 2.3 0.3 1.325-44 years 96 1.4 1.3 0.3 0.2 1.6 02 1.245-64 years 46 2.6 1.6 1.0 0.3 2.3 0.6 1.3
Not in labor force &18-24 years 228 1.5 1.2 03 0.2 1.1 0.2 1.225-44 years 255 1.1 0.9 0.2 0.1 0.8 03 0.945-64 years 270 0.8 0.5 0.4 0.1 0.5 0.4 0.5
Family IncomeUnder $5,000 332 2.9 1.8 0.3 0.2 2.1 0.5 1.7$5,000-$6,999 149 1.6 1.6 0.4 0.4 1.5 0.8 1.6$7,000-$9,999 158 1.2 1.1 0.4 0.2 12 0.5 1.1$10,000-$14,999 288 0.9 0.6 0.2 0.1 0.9 0.3 0.6$15,000-$19,999 395 0.9 03 0.2 0.1 0.8 02 03$20,000-$24,999 352 0.9 0.4 0.3 0.1 0.7 0.2 0.3$25,000434,999 654 0.5 0.2 0.2 0.1 0.4 0.1 0.1$35,000449,999 627 0.4 0.1 0.1 0.0 0.4 0.1 0.1$50,000 or more 813 0.4 0.1 0.2 0.1 0.3 0.1 0.1
Poverty LevelUnder 0.50 333 2.5 1.9 0.4 0.2 2.2 0.4 1.80.50 to under 1.00 286 1.2 1.1 0.2 0.2 1.2 0.4 1.11.00 to under 1.25 215 1.5 0.8 03 0.2 1.3 0.4 0.71.25 to under 1.50 215 13 0.6 03 0.1 1.3 0.4 0.51.50 to uncifm- 1.75 283 1.1 0.5 03 0.1 0.9 0.2 0.41.75 to under 2.00 428 0.6 03 0.2 0.1 0.6 0.2 0.22.00 and above 1,481 03 0.1 0.1 0.0 0.2 0.1 0.0
Age and Poverty Level18-24 years &
Under 0.50 208 4.1 23 0.5 0.5 2.9 0.2 2.30.50 to uncle. 1.00 146 2.7 1.4 0.3 0.3 23 0.2 1.41.00 to under 1.25 as 2.4 1.4 03 - 2.3 02 131.25 to under 1.50 87 25 1.1 0.4 0.3 2.4 0.4 131.50 to under 1.75 100 2.2 1.5 0.5 03 2.1 0.4 0.81.75 to under 2.00 138 4.4 0.5 03 0.4 13 02 0.42.00 and above 287 0.8 02 0.2 0.1 0.7 0.1 0.2
25-44 years &Under 0.50 162 1.4 2.3 0.6 02 2.4 0.5 2.40.50 to under 1.00 159 13 1.5 0.4 02 1.5 0.5 1.51.00 to under 1.25 130 1.9 0.8 0.4 0.2 1.7 0.5 0.8125 to under 1.50 137 1.9 0.7 03 0.1 1.9 03 0.61.50 to under 1.75 189 12 0.4 03 0.2 1.1 0.2 0.41.75 to under 2.00 256 0.8 03 0.2 0.1 0.7 0.1 0.22.00 and above 858 03 0.1 0.1 0.0 03 0.1 0.1
45-64 years &Under 0.50 57 2.2 2.9 1.1 0.8 3.2 1.9 2.90.50 to under 1.00 80 1.4 1.6 0.5 03 1.6 1.2 1.71.00 to under 1.25 63 22 1.6 0.9 0.5 2.1 13 1.41.25 to under 1.50 76 2.0 1.4 0.7 0.4 1.5 1.1 1.01.50 to under 1.75 88 1.8 0.9 1.0 03 1.4 0.9 0.91.75 to under 2.00 137 1.4 0.5 0.6 0.2 1.1 0.6 0.42.00 and above 600 0.4 02 0.2 0.1 0.2 0.1 0.1

94 Disability and health insurance
TABLE A-1. Standard Errors of Estimates of Type of Health Insurance Coverage Among Adults Aged 18 to 64, by SociodemographicCharacteristics, by Gender:United States, 1989
Population(1,000s)
With Insurance
NotInsured
Medi-care
Medi-caid
PrivateOnly
PublicOnly
Privateand
Public
UndefinedPlansOnly
All Men 1,097 0.4 0.1 0.1 0.0 0.3 0.1 0.1
Age18-24 years 348 0.8 0.3 0.1 0.1 0.7 0.1 0.325-44 years 598 0.5 0.2 0.1 0.1 0.5 0.1 0.145-64 years 359 0.5 0.3 0.3 0.1 0.3 0.2 0.2
RaceWhite 1,025 0.4 0.1 0.1 0.0 0.4 0.1 0.1Black 305 1.1 0.5 0.3 0.2 1.0 0.3 0.4Other 138 2.1 1.1 0.5 0.6 1.6 0.3 1.1
EthnicityHispanic 318 1.9 0.6 0.3 0.3 1.8 0.3 0.5Non-Hispanic 1,025 0.4 0.1 0.1 0.0 0.3 0.1 0.1
EducationLess than 12 years 320 1.0 0.4 0.3 0.1 0.9 0.3 0.412 years 515 0.5 0.2 0.1 0.1 0.5 0.1 0.1Some college 329 0.5 0.2 0.2 0.1 0.5 0.1 0.1College graduate 356 0.4 0.1 0.2 0.1 0.4 0.1 0.1Unknown 43 3.9 3.1 13 0.4 4.3 2.4 2.9
Age & Education18-24 years &
Less than 12 years 96 1.7 0.9 0.3 0.4 1.6 0.3 0.812 years 203 1.2 03 0.2 0.1 1.1 0.1 0.3Some college 161 13 0.4 0.2 0.2 1.2 0.1 0.2College graduate 53 2.2 0.0 0.4 0.3 2.2 0.4 0.0Unknown 12 8.6 6.5 5.9 - 11.3 4.3 8.2
25-44 years &Less than 12 years 178 1.5 0.8 0.2 0.1 1.4 0.4 0.712 years 272 0.7 0.2 0.1 0.1 0.7 0.1 0.2Some college 208 0.7 0.2 0.2 0.2 0.7 0.1 0.1College graduate 247 0.5 0.1 0.2 0.1 0.5 0.1 0.1Unknown 26 6.0 3.7 1.7 0.9 62 3.0 3.7
45-64 yearsLess than 12 years 134 1.1 0.7 0.5 0.2 0.8 0.6 0.512 years 190 0.8 0.4 0.5 0.1 0.5 0.4 0.2Some college 94 1.2 0.6 0.7 0.2 0.7 0.4 0.2College graduate 148 0.7 0.3 0.5 0.1 0.5 0.3 0.1Unknown 23 5.7 5.5 1.6 - 5.1 4.8 5.0
Marital StatusMarried 739 0.4 0.2 0.1 0.0 0.3 0.1 0.1Widowed 36 3.5 2.5 1.4 0.5 2.5 1.5 2.0Divorced 128 13 0.7 0.5 0.3 1.1 0.5 0.5Separated 54 22 13 0.6 0.4 2.2 0.6 1.1Never married 444 0.7 03 0.1 0.1 0.7 0.2 0.3Unknown 16 6.9 2.1 3.6 - 6.5 3.0 1.4
Employment StatusCurrently employed 927 0.4 0.1 0.1 0.0 0.4 0.0 0.0Unemployed 101 1.6 1.1 0.4 02 1.9 02 1.0Not in labor force 256 1.2 0.9 0.5 0.2 0.7 0.7 0.8
Employment Status & AgeCurrently employed &
18-24 years 237 0.9 0.2 0.1 0.1 0.9 0.1 0.225-44 years 555 0.4 0.1 0.1 0.1 0.4 0.0 0.145-64 years 302 0.5 0.2 0.2 0.1 0.4 0.1 0.1

Disability and health insurance
TABLE A-1. Standard Errors of Estimates of Type of Health Insurance Coverage Among Adults Aged 18 to 64, by SociodemographicCharacteristics, by Gender: United States, 1989
95
Unemployed &
Population(1,000s)
With Insurance
NotInsured
Medi-care
Medi-caid
PrivateOnly
PublicOnly
Privateand
Public
UndefinedPlansOnly
18-24 years 58 3.5 1.2 0.7 0.2 3.4 0.5 1.325-44 years 64 2.0 1.6 0.4 0.3 2.4 0.3 1.545-64 years 36 3.4 2.3 1.4 0.5 3.1 0.5 2.0
Not in labor force &18-24 years 156 1.9 1.2 0.4 0.4 1.7 0.4 1.225-44 years 84 1.9 2.0 0.7 0.7 1.8 1.3 1.945-64 years 126 1.3 1.0 0.9 0.3 0.8 1.0 0.8
Family IncomeUnder $5,000 170 3.4 1.9 0.3 0.3 2.9 0.7 1.8$5,000-$6,999 81 2.4 1.8 0.4 0.8 2.4 1.2 1.6$7,000-$9,999 78 1.7 1.3 0.6 0.3 1.8 0.9 1.2$10,000-$14,999 154 1.1 0.6 0.3 0.2 1.2 0.5 0.6$15,000-$19,999 208 1.1 0.4 0.3 0.2 1.0 0.4 03$20,000-$24,999 184 1.0 03 0.3 0.1 0.9 0.3 03$25,000-$34,999 336 0.6 0.2 0.2 0.1 0.5 0.1 0.1$35,000-$49,999 339 0.5 0.2 0.2 0.1 0.4 0.1 0.1$50,000 or more 437 0.5 0.1 0.2 0.1 0.4 0.1 0.1
Poverty LevelUnder 0.50 164 3.2 2.1 0.3 0.6 2.9 0.7 2.00.50 to under 1.00 139 1.6 1.2 03 03 1.6 0.6 1.11.00 to under 1.25 111 1.9 0.8 0.4 0.3 1.8 0.6 0.81.25 to under 1.50 115 1.6 0.7 0.4 02 1.6 0.6 0.51.50 to under 1.75 155 1.2 0.5 0.4 0.2 12 0.4 0.41.75 to under 2.00 218 0.8 03 03 0.1 0.7 0.2 022.00 and above 773 03 0.1 0.1 0.1 03 0.1 0.1
Age and Poverty Level18-24 years &
Under 0.50 111 5.1 2.4 0.4 1.1 3.8 03 2.40.50 to under 1.00 80 3.6 13 0.5 0.5 32 0.4 131.00 to under 1.25 52 3.2 1.0 03 - 3.4 03 0.91.25 to under 1.50 55 3.5 1.0 0.5 0.4 3.6 0.6 1.01.50 to under 1.75 61 22 13 0.6 02 23 0.8 0.71.75 to under 2.00 80 1.6 0.6 0.2 0.4 1.5 02 0.52.00 and above 173 1.0 0.2 0.2 0.1 1.0 0.1 02
25-44 years &Under 0.50 69 23 2.8 0.4 0.6 3.0 0.4 2.70.50 to under 1.0s; 79 1.7 1.5 0.5 03 22 0.7 1.51.00 to under 1.25 67 2.4 1.0 0.5 0.4 23 0.8 1.11.25 to under 1.50 77 2.2 0.6 0.4 02 23 0.5 0.61.50 to under 1.75 107 1.4 0.5 0.4 03 13 03 0.41.75 to under 2.00 138 1.0 03 03 0.1 0.9 02 0.22.00 and above 460 0.4 0.1 0.1 0.1 0.4 0.1 0.1
45-64 years &Under 0.50 31 3.6 4.6 1.6 1.7 4.9 3.8 4.10.50 to under 1.00 42 1.9 2.4 0.6 0.7 23 2.1 231.00 to under 1.25 35 3.0 2.8 1.7 0.6 3.1 2.4 2.01.25 to under 1.50 41 2.5 2.0 1.1 0.5 22 1.9 1.41.50 to under 1.75 52 2.5 1.5 12 0.4 2.0 1.4 0.91.75 to under 2.00 73 1.6 0.8 0.8 03 1.2 0.8 0.42.00 and above 304 0.5 0.2 03 0.1 0.3 0.2 0.1

96 Disability and health insurance
TABLE A-1. Standard Errors of Estimates of Type of Health Insurance Coverage Among Adults Aged 18 to 64, by SociodemographicCharacteristics, by Gender: United States, 1989
Popula don(1,000s)
With Insurance
NotInsured
Medi-care
Mew-caid
PrivateOnly
PublicOnly
Privateand
Public
UndefinedPlansOnly
All Women 1,037 0.4 0.2 0.1 0.0 0.3 0.1 0.2
Age18-24 years 301 1.0 0.6 02 0.1 0.8 0.1 0.525-44 years 584 0.5 0.3 0.1 0.0 0.4 0.1 0.345-64 years 383 0.5 0.2 02 0.1 0.3 0.2 0.2
RaceWhite 966 0.4 02 0.1 0.0 0.3 0.1 02Black 375 0.9 0.7 0.4 0.1 0.7 0.3 0.7Other 158 1.9 1.4 0.5 0.4 1.7 0.3 1.3
EthnicityHispanic 266 1.8 1.0 0.3 0.1 1.7 03 1.0Non-Hispanic 999 0.4 02 0.1 0.0 0.3 0.1 02
EducationLess than 12 years 322 0.9 0.7 0.3 0.1 0.9 03 0.612 years 531 0.5 0.3 0.1 0.1 0.4 0.1 0.2Some college 365 0.6 03 02 0.1 0.4 0.1 0.2College graduate 288 0.4 0.2 02 0.0 0.3 0.1 0.1Unknown 27 52 4.3 3.4 - 3.8 3.7 42
Age & Education18-24 years &
Less than 12 years 93 1.8 1.5 0.4 0.3 1.8 02 1.512 years 169 13 0.7 03 02 1.1 0.1 0.6Some college 172 12 0.7 02 02 1.1 0.1 0.4College graduate 66 2.0 0.7 0.9 02 1.6 02 0.1Unknown 8 13.7 8.1 10.5 - 8.7 9.6 12.5
25-44 years &Less than 12 years 185 13 1.0 0.4 0.1 13 03 1.012 years 302 0.7 0.4 0.2 0.1 0.6 0.1 0.3Some college 219 0.7 0.4 0.2 0.0 0.6 0.1 03College graduate 218 0.4 02 02 0.1 03 0.1 0.1Unknown 21 6.8 5.9 5.7 - 4.7 4.5 62
45-64 yearsLess than 12 years 146 1.2 0.8 0.5 02 0.9 0.5 0.712 years 211 0.6 03 03 0.1 0.4 0.3 02Some college 125 0.9 0.4 0.5 0.1 0.6 0.4 0.3College graduate 119 0.8 0.4 0.5 0.1 0.6 0.3 02Unknown 15 8.4 62 - - 8.1 5.8 4.6
Marital StatusMarried 743 0.4 02 0.1 0.0 0.3 0.1 0.1Widowed 94 1.5 0.9 0.7 0.1 12 0.8 0.7Divorced 154 0.9 0.6 0.2 0.1 0.8 0.3 0.7Separated 88 1.6 1.5 0.5 0.3 13 0.5 1.6Never married 351 0.9 0.5 02 0.1 0.6 0.2 0.5Unknown 14 7.1 3.9 2.5 - 7.0 2.5 4.4
Employment StatusCurrently employed 760 0.4 0.1 0.1 0.0 03 0.0 0.1Unemployed 82 1.6 12 0.4 02 1.5 02 1.0Not in labor force 388 0.8 0.6 02 0.1 0.5 0.2 0.6
Employment Status & AgeCurrently employed &
18-24 years 230 1.0 0.4 02 02 0.9 0.1 0.225-44 years 462 0.4 0.2 0.1 0.0 0.4 0.1 0.145-64 years 254 0.4 02 02 0.1 0.4 0.1 0.1

Disability and health insurance
TABLE A-1. Standard Errors of Estimates of Type of Health Insurance Coverage Among Adults Aged 18 to 64, by SociodemographicCharacteristics, by Gender: United States, 1989
97
Unemployed &
Population(1,000s)
With Insurance
NotInsured
Medi-care
Medi-caid
PrivateOnly
PublicOnly
Privateand
Public
UndefinedPlansOnly
18-24 years 40 3.1 2.5 0.9 0.7 3.3 0.2 2.225-44 years 57 2.1 1.7 0.5 0.2 2.0 0.3 1.645-64 years 27 3.9 1.9 1.4 - 3.5 1.0 1.4
Not in labor force &18-24 years 116 1.7 1.4 0.5 0.3 1.4 0.2 1.425-44 years 222 1.1 0.8 0.2 0.1 0.7 0.2 0.845-64 years 196 0.8 0.6 0.4 0.1 0.6 0.4 0.5
Family IncomeUnder $5,000 220 3.4 2.3 0.5 0.3 2.0 0.7 2.4$5,00046,999 92 1.7 2.0 0.5 0.2 1.6 0.9 2.0$7,000-$9,999 102 1.4 13 0.5 0.2 1.4 0.5 13$10,000-$14,999 161 1.1 0.8 03 0.1 1.1 0.3 0.7$15,000-$19,999 215 0.9 0.5 03 0.1 0.8 03 0.4$20,000-$24,999 186 1.0 0.6 0.4 0.2 0.8 0.3 0.5$25,000-$34,999 341 0.6 0.2 0.2 0.1 0.5 0.1 0.2$35,000-$49,999 313 0.5 0.2 0.2 0.0 0.4 0.1 0.1$50,000 or more 390 0.4 0.1 02 0.1 0.3 0.1 0.1
Poverty LevelUnder 0.50 205 2.8 23 0.6 0.2 2.1 0.4 230.50 to under 1.00 172 13 1.3 0.3 0.2 1.2 0.5 131.00 to under 1.25 122 1.5 1.1 0.4 0.2 13 0.5 1.01.25 to under 1.50 111 1.4 0.9 0.4 0.2 1.4 0.4 0.81.50 to under 1.75 146 1.2 0.6 0.4 0.1 1.0 0.3 0.61.75 to under 2.00 233 0.7 0.3 03 0.1 0.7 0.2 0.32.00 and above 738 03 0.1 0.1 0.0 0.2 0.1 0.1
Age and Poverty Level18-24 years &
Under 0.50 137 4.7 3.2 0.8 0.5 3.2 0.2 3.20.50 to under 1.00 90 3.1 2.2 0.3 0.4 2.4 0.2 2.11.00 to under 1.25 54 2.8 2.4 0.5 - 2.6 0.4 2.11.25 to under 130 49 2.9 1.9 0.6 0.6 2.6 0.3 2.11.50 to under 1.75 59 2.9 2.0 0.6 0.5 2.7 0.2 131.75 to under 2.00 83 1.9 0.8 0.5 0.4 1.8 0.3 0.82.00 and above 156 1.0 0.5 03 0.2 0.8 0.1 03
25-44 years &Under 0.50 103 1.4 23 0.8 03 2.2 0.7 2.30.50 to under 1.00 99 1.4 1.8 0.5 0.2 1.6 0.6 1.81.00 to under 1.25 77 1.9 1.2 0.6 0.2 1.7 0.5 1.21.25 to under 1.50 74 2.1 1.1 0.4 0.2 1.9 0.4 0.91.50 to under 1.75 98 1.4 0.6 0.4 0.0 1.2 0.3 031.75 to under 2.00 134 0.8 0.4 0.3 0.1 0.6 0.2 0.32.00 and above 428 0.4 0.2 0.1 0.0 03 0.1 0.1
45-64 years &Under 0.50 36 2.2 3.6 1.3 0.2 3.4 1.7 330.50 to under 1.00 62 1.8 2.0 0.7 0.3 1.9 1.5 2.01.00 to under 1.25 44 2.6 1.7 1.1 0.7 2.4 1.4 1.71.25 to under 1.50 46 2.4 1.7 0.9 0.5 1.9 1.2 1.41.50 to under 1.75 51 22 1.1 1.1 0.2 1.7 1.1 1.21.75 to under 2.00 80 1.6 0.7 0.7 02 1.4 0.7 0.72.00 and above 319 0.4 0.2 03 0.1 03 0.2 0.1
- Standard error is exactly 0 or is indeterminate (too few Primary Sampling Units to calculate error).

98 Disability and health insurance
TABLE A-2. Standard Errors of Estimates of Type of Health Insurance Coverage Among Adults Aged 18 to 64, by Disability and Health Status,by Gender: United States, 1989
Population(1,000s)
With Insurance
NotInsured
(%)
Medi-care(%)
Medi-caid(%)
PrivateOnly(%)
PublicOnly
(%)
Privateand
Public(%)
UndefinedPlansOnly
(%)
Total 2,073 0.4 0.2 0.1 0.0 0.3 0.1 0.2
Health StatusExcellent 1,007 0.4 0.2 0.1 0.0 0.4 0.0 0.1Very good 693 0.5 0.2 0.1 0.1 0.4 0.1 0.2Good 591 0.6 0.3 0.1 0.1 0.5 0.1 0.3Fair 222 0.9 0.7 0.4 0.2 0.8 0.4 0.6Poor 115 1.3 13 0.8 0.2 1.0 1.0 1.3Unknown 48 4.1 2.6 0.6 0.4 43 0.4 2.6
Major ActivityUnable to perform major activity 177 1.1 0.9 0.6 02 0.7 0.8 0.9Limited in amount/kind of major activity 202 0.9 0.7 0.4 0.1 0.8 0.4 0.6Limited in other activity 156 1.0 0.7 0.4 0.1 0.9 0.4 0.6Not limited in activity 1,875 0.4 0.2 0.1 0.0 0.3 0.0 0.1
Work ActivityUnable to work 197 1.0 0.8 0.6 0.2 0.6 0.8 0.9Limited in amount/kind of work 201 0.9 0.6 0.4 0.1 0.8 0.3 0.5Limited in other activity 138 1.1 0.6 0.5 0.1 0.9 03 .0.6Not limited in activity 1,875 0.4 0.2 0.1 0.0 0.3 0.0 0.1
Basic Life ActivitiesNeeds help in self care (ADL) 39 2.4 2.7 2.3 0.7 2.0 2.8 2.8Needs help in routine activities (IADL) 87 1.8 1.7 1.2 0.1 1.1 1.4 1.6Not limited in basic life activities 2,045 0.4 02 0.1 0.0 03 0.1 0.1
Work Activity & Basic Life ActivitiesUnable to work &
Needs help in self care (ADL) 37 2.3 2.7 2.5 0.4 2.1 3.0 2.9Needs help in routine activities (IADL) 70 1.8 1.9 1.3 02 1.2 1.7 1.9Not limited in basic life activities 161 1.2 1.0 0.7 03 0.8 0.9 1.0
Limited in amount/kind of work &Needs help in self care (ADL) 14 12.7 9.2 7.5 5.0 6.1 7.0 9.6Needs help in routine activities (IADL) 31 4.2 3.7 22 - 2.5 2.9 32Not limited in basic life activities 193 1.0 0.6 0.4 0.1 0.9 03 0.5
Limited in other activity &Needs help in self care (ADL) 10 11.6 10.6 6.1 5.1 6.8 8.8 9.9Needs help in routine activities (IADL) 23 6.0 5.4 4.4 1.0 4.4 33 5.6Not limited in basic life activities 132 1.1 0.6 0.4 0.1 0.9 03 0.5
Not limited in activity &Needs help in self care (ADL) 1 - - - - - - -Needs help in routine activities (IADL) 4 20.1 22.3 - - 17.5 20.7 22.2Not limited in basic life activities 1,875 0.4 0.2 0.1 0.0 03 0.0 0.1
Work Activity & Health StatusUnable to work &
Excellent 31 3.3 3.1 2.4 0.5 33 3.5 3.1Very good 39 3.1 2.6 1.5 1.5 2.4 23 2.1Good 84 1.9 1.8 1.1 03 1.5 13 1.5Fair 98 13 1.6 1.1 03 1.1 13 1.5Poor 98 1.4 1.4 1.0 0.2 1.1 13 1.4Unknown 13 10.9 13.6 - 53 9.8 4.9 15.6
Limited in amount/kind of work &Excellent 49 3.1 1.6 13 0.7 23 0.8 1.5Very good 67 1.7 1.0 0.8 0.2 1.4 0.6 0.8Goad 95 1.5 0.8 0.7 0.2 12 0.5 0.8Fair 75 1.9 1.0 0.9 03 1.7 0.8 1.0Poor 31 3.8 2.6 1.8 - 33 1.7 2.2Unknown 7 15.6 - 8.7 - 15.8 - 8.7

Disability and health insurance
TABLE A-2. Standard Errors of Estimates of Type of Health Insurance Coverage Among Adults Aged 18 to 64, by Disability and Health Status,by Gender: United States, 1989
99
Population(1,000s)
With Insurance
NotInsured
(%)
Medi-care(%)
Medi-caid(%)
Priva teOnly(%)
PublicOnly(%)
Privateand
Public(%)
UndefinedPlansOnly(%)
Limited in other activity &Excellent 42 2.2 1.2 1.0 0.3 1.8 0.4 0.7Very good 71 1.6 0.8 1.0 0.1 13 0.5 0.9Good 75 1.7 0.9 0.6 0.2 1.4 0.5 0.9Fair 44 3.0 1.9 1.0 0.5 2.7 1.2 1.8Poor 22 4.7 5.1 3.0 - 4.0 3.9 5.1Unknown 5 14.7 - - - 14.7 - -
Not limited in activity &Excellent 979 0.4 0.1 0.1 0.0 0.4 0.0 0.1Very good 643 0.6 0.2 0.1 0.1 0.5 0.1 0.2Good 544 0.6 0.3 0.1 0.1 0.5 0.1 0.2Fair 136 13 0.7 0.4 03 1.1 0.3 0.7Poor 39 4.1 3.1 1.5 - 4.1 1.2 2.8Unknown 42 4.7 1.9 0.5 - 4.8 - 1.9
All Men 1,097 0.4 0.1 0.1 0.0 0.3 0.1 0.1
Health StatusExcellent 579 0.5 0.1 0.1 0.1 0.4 0.1 0.1Very good 364 0.6 0.2 0.2 0.1 0.6 0.1 0.1Good 309 0.7 03 0.2 0.1 0.7 0.2 0.3Fair 114 13 1.0 0.6 03 1.0 0.7 0.8Poor 69 1.8 1.8 1.4 0.3 1.4 1.6 1.7Unknown 24 5.5 3.3 1.0 1.0 6.0 - 3.1
Major ActivityUnable to perform major activity 112 1.3 1.1 0.9 0.4 0.9 1.1 1.1Limited in amount/kind of major activity 123 13 0.8 0.7 0.2 1.2 0.6 0.7Limited in other activity 81 1.5 0.8 0.7 0.1 1.2 0.5 0.6Not limited in activity 1,004 0.4 0.1 0.1 0.0 0.4 0.0 0.1
Work ActivityUnable to work 116 13 1.1 0.9 0.4 0.9 1.1 1.1Limited in amount/kind of work 121 13 0.8 0.7 0.2 1.2 0.6 0.7Limited in other activity 83 1.4 0.6 0.7 0.2 1.2 0.4 0.5Not limited in activity 1,004 0.4 0.1 0.1 0.0 0.4 0.0 0.1
Basic Life ActivitiesNeeds help in self care (ADL) 28 3.4 4.2 3.5 1.1 23 4.0 3.8Needs help in routine activities (IADL) 49 2.5 2.8 2.0 0.1 1.7 2.5 2.8Not limited in basic life activities 1,082 0.4 0.1 0.1 0.0 0.4 0.1 0.1
Work Activity & Basic Life ActivitiesUnable to work &
Needs help in self care (ADL) 28 3.7 4.5 3.8 0.9 2.5 43 4.2Needs help in routine activities (IADL) 43 2.9 3.2 2.1 0.1 1.8 2.6 3.4Not limited in basic life activities 96 1.4 13 1.0 0.5 1.1 1.1 1.1
Limited in amount/kind of work &Needs help in self care (ADL) 8 18.0 12.7 11.4 11.1 8.5 13.8 14.1Needs help in routine activities (IADL) 17 7.6 7.6 4.7 - 4.9 7.0 6.2Not limited in basic life activities 117 13 0.7 0.7 0.2 1.2 0.4 0.7
Limited in other activity &Needs help in self care (ADL) 5 20.6 22.4 20.7 - - 20.7 22.2Needs help in routine activities (IADL) 9 143 11.7 8.0 - 6.8 13.9 -Not limited in basic life activities 82 1.4 0.6 0.7 0.2 1.2 0.4 0.5
Not limited ill activity &Needs help in self care (ADL) 1 - - - - - -Needs help in routine activities (1ADL) 1 - - - - - - -Not limited in basic life activities 1,004 0.4 0.1 0.1 0.0 0.4 0.0 0.1

100 Disability and health insurance
TABLE A-2. Standard Errors of Estimates of Type of Health Insurance Coverage Among Adults Aged 18 to 64, by Disability and Health Status,by Gender: United States, 1989
Population(1,000s)
With Insurance
NotInsured
(%)
Medi-care(%)
Medi-caid(%)
PrivateOnly(%)
PublicOnly
(%)
Privateand
Public(%)
UndefinedPlansOnly(%)
Work Activity & Health StatusUnable to work &
Excellent 23 5.1 3.6 3.4 0.9 3.8 4.7 3.7Very good 30 4.7 4.1 2.5 2.9 3.6 3.3 3.7Good 55 2.9 2.6 1.8 0.6 2.1 2.4 2.1Fair 59 1.9 2.2 1.7 0.5 1.5 1.9 2.1Poor 61 1.7 2.1 1.5 0.4 1.6 1.9 1.9Unknown 8 11.8 14.6 - 8.4 14.4 - 15.0
Limited in amount/kind of work &Excellent 33 4.1 1.7 2.1 1.1 3.2 1.1 1.7Very good 44 2.4 12 1.4 - 2.2 1.0 1.0Good 72 2.3 1.5 1.1 0.2 1.9 0.9 1.2Fair 44 3.2 1.3 1.7 0.6 2.8 1.3 1.2Poor 21 5.9 3.8 3.1 - 4.0 2.5 3.0Unknown 4 22.9 - - - 22.9 - -
Limited in other activity &Excellent 36 2.7 1.0 1.5 - 2.3 0.7 0.4Very good 47 2.4 0.8 1.2 - 1.8 0.7 0.2Good 45 2.7 1.3 1.2 0.4 2.4 0.8 12Fair 24 4.1 1.9 1.7 0.9 4.2 1.4 1.2Poor 13 9.3 63 8.2 - 6.9 1.9 8.5Unknown 4 25.6 - - - 25.6 - -
Not limited in activity &Excellent 5E6 03 0.1 0.1 0.0 0.4 0.0 0.1Very good 341 0.7 0.2 0.1 0.1 0.6 0.1 0.1Good 286 0.8 0.2 0.2 0.1 0.7 0.1 0.2Fair 75 1.9 0.9 0.6 0.5 1.7 0.5 0.8Poor 23 5.5 3.7 2.7 - 3.4 1.9 3.4Unknown 22 6.1 2.2 12 - 6.4 - 2.2
All Women 1,037 0.4 0.2 0.1 0.0 0.3 0.1 0.2
Health StatusExcellent 483 0.5 03 0.1 0.1 0.4 0.1 0.2Very good 378 0.5 03 0.1 0.1 0.4 0.1 03Good 332 0.6 0.4 02 0.1 0.5 0.1 0.4Fair 141 1.1 0.8 0.5 0.2 1.0 0.5 0.8Poor 75 1.8 1.5 1.0 0.2 1.6 13 1.7Unknown 32 4.5 2.6 0.7 - 4.1 0.8 2.7
Major ActivityUnable to perform major activity 106 1.4 1.4 0.9 0.2 1.2 1.2 13Limited in amount/kind of major activity 117 1.2 0.9 0.6 0.2 1.0 0.5 0.9Limited in other activity 107 1.4 0.9 0.5 0.1 1.1 0.5 0.9Not limited in activity 930 0.4 0.2 0.1 0.0 03 0.0 0.2
Work ActivityUnable to work 129 13 1.1 0.8 0.1 1.0 0.9 12Limited in amount/kind of work 118 13 0.8 0.5 0.2 1.0 0.4 0.7Limited in other activity 89 1.4 1.0 0.5 0.2 1.1 0.6 1.0Not limited in activity 930 0.4 0.2 0.1 0.0 03 0.0 0.2
Basic Life ActivitiesNeeds help in self care (ADL) 34 33 3.6 3.1 0.6 3.0 3.6 3.7Needs help in routine activities (IADL) 63 2.2 2.0 1.4 0.2 1.5 1.6 1.8Not limited in bask life activities 1,021 0.4 0.2 0.1 0.0 0.3 0.1 0.2
1 4 S

Disabilihi and health insurance 101
TABLE A-2. Standard Errors of Estimates of Type of Health Insurance Coverage Among Adults Aged 18 to 64, by Disability and Health Status,by Gender: United States, 1989
Population(1,000s)
With Insurance
NotInsured
(%)
Medi-care(%)
Medi-caid(%)
PrivateOnly
(%)
PublicOnly(%)
Privateand
Public(%)
UndefinedPlansOnly
(%)
Work Activity & Basic Life ActivitiesUnable to work &
Needs help in self care (ADL) 30 3.1 4.0 3.5 0.3 3.3 4.1 4.2Needs help in routine activities (IADL) 51 2.3 2.3 1.7 0.2 1.7 2.2 2.2Not limited in basic life activities 103 1.7 1.3 0.9 0.2 1.2 1.0 13
Limited in amount/kind of work &Needs help in self care (ADL) 12 17.3 13.5 10.0 - 8.5 7.2 133Needs help in routine activities (IADL) 26 42 3.5 2.0 - 32 2.0 3.5Not limited in basic life activities 111 1.3 0.7 0.5 0.2 1.1 0.4 0.7
Limited in other activity &Needs help in self care (ADL) 8 14.1 13.3 - 6.7 8.9 8.6 11.8Needs help in routine activities (IADL) 22 6.6 5.9 5.0 1.2 5.1 2.9 63Not limited in basic life activities 85 1.5 0.9 0.5 0.2 1.2 0.6 0.9
Not limited in activity &Needs help in self care (ADL) - - - - - - - -Needs help in routine activities (IADL) 4 22.4 245 - - 14.6 23.4 24.6Not limited in basic life activities 930 0.4 0.2 0.1 0.0 03 0.0 0.2
Work Activity & Health StatusUnable to work &
Excellent 20 5.6 4.7 3.1 - 5.7 3.6 5.1Very good 28 3.7 3.4 2.1 - 32 3.0 2.6Good 53 23 2.1 1.3 - 2.0 1.7 1.9Fair 63 1.9 2.0 1.4 0.3 1.5 1.6 2.0Poor 62 1.9 1.9 1.4 0.2 1.9 1.7 2.0Unknown 7 20.7 18.0 - - 10.6 11.1 21.4
Limited in amount/kind of work &Excellent 32 3.8 2.5 1.3 - 3.0 1.3 2.5Very good 41 2.5 1.5 0.7 0.3 1.8 0.6 1.2Good 63 1.9 1.0 0.8 0.3 1.6 0.6 1.0Fair 51 23 15 1.1 0.3 1.8 0.9 15Poor 22 5.5 3.4 2.1 - 55 2.3 3.1Unknown 5 213 - 15.1 - 20.8 - 15.1
Limited in other ectivity &Excellent 27 3.6 23 12 0.7 2.9 0.5 1.7Very good 45 2.3 1.5 1.5 03 1.9 0.7 1.9Good 53 2.1 13 0.6 0.2 1.7 0.6 13Fair 34 3.4 2.6 1.2 0.5 2.9 1.6 2.5Poor 18 5.3 5.8 2.5 - 4.4 5.0 5.8Unknown 6 20.8 - - - 20.8 - -
Not limited in activity &Excellent 469 0.5 0.2 0.1 0.1 0.4 0.0 02Very good 352 0.6 03 0.1 0.1 0.4 0.1 0.3Good 306 0.7 0.4 0.2 0.1 0.5 0.1 0.4Fair 92 1.5 1.0 0.5 0.2 13 0.5 0.8Poor 26 5.1 4.1 1.6 - 4.9 1.8 4.2Unknown 29 5.1 2.6 - - 4.6 - 2.6
- Standard error is exactly 0 or is indeterminate (too few Primary Sampling Units to calculate error).

102Disability and health insurance
TABLE A-3. Standard Errors of Estimates of Type of Health Insurance Coverage Among Children Aged 0 to 17, by SociodemographicCharacteristics, by Genden United States, 1989
Population(1,000s)
With Insurance
NotInsured
Medi-care
Medi-caid
PrivateOnly
PublicOnly
Privateand
Public
UndefinedPlansOnly
Total 1,115 0.8 0.5 0.1 0.1 0.6 0.0 0.5
Age0-4 years 400 1.0 0.7 0.2 0.1 0.8 0.1 0.75-17 years 807 0.8 0.5 0.2 0.1 0.6 0.0 0.5
RaceWhite 1,033 0.9 0.4 0.1 0.1 0.7 0.0 0.4Black 431 1.3 1.3 0.4 0.2 1.0 0.2 1.3Other 226 3.1 3.9 0.6 0.6 2.1 0.4 4.0
EthnicityHispanic 565 2.5 1.2 0.3 0.1 2.7 0.2 1.2Non-Hispanic 935 0.7 0.5 0.1 0.0 0.4 0.0 0.5
Family IncomeUnder $5,000 211 1.5 3.0 0.7 03 3.3 0.4 3.1$5,000-$6,999 169 13 3.4 1.7 0.4 2.9 0.2 3.6$7,000-$9,999 160 1.5 2.2 1.0 03 1 .9 0.2 2.2$10,000414,999 224 1.5 1.6 0.3 0.2 1.7 0.1 1.6$15,000-$19,999 228 1.4 1.1 0.4 0.3 1.3 0.1 0.9$20,000-$24,999 199 1.7 1.2 0.3 03 1.2 0.2 1.0S25,000-$34,999 367 0.9 03 0.1 0.1 0.7 0.1 0.3$35,000-$49,999 347 0.7 0.4 0.2 0.1 0.5 0.1 0.3$50,000 or more 390 0.5 0.2 0.2 0.0 0.4 0.1 0.2
Poverty LevelUnder 0.50 339 1.1 3.1 0.9 03 3.1 0.3 3.20.50 to under 1.00 303 1.2 2.2 0.5 0.2 2.0 0.0 2.11.00 to under 1.25 219 2.1 1.4 0.6 03 1.6 0.2 131.25 to under 1.50 208 1.9 1.0 0.3 0.4 1.6 0.1 0.91.50 to under 1.75 248 1.1 0.7 0.2 0.1 0.9 0.2 0.61.75 to under 2.00 277 0.7 0.3 0.2 0.2 0.5 0.1 0.22.00 and above 504 OA 0.2 0.1 0.1 03 0.0 0.1
Age and Poverty Level0-4 years and
Under 0.50 144 1.5 3.9 0.6 0.6 3.1 0.2 3.90.50 to under 1.00 115 1.6 2.8 0.5 0.4 2.6 0.1 2.81.00 to under 1.25 85 2.8 2.1 0.9 0.7 2.5 03 2.11.25 to under 1.50 73 2.4 1.8 0.6 03 2.3 03 131.50 to under 1.75 92 1.8 1.0 03 02 1.5 0.4 0.81.75 to under 2.00 103 13 0.7 0.3 0.2 1.0 0.1 0.62.00 and above 191 0.8 0.5 0.2 0.1 0.5 0.0 0.35-17 years andUnder 0.50 212 1.5 3.1 1.1 0.2 3.5 0.5 3.10.50 to under 1.00 222 1.4 2.1 0.7 0.2 2.1 0.1 2.11.00 to under 1.25 165 2.2 1.4 0.6 0.2 1.9 0.2 1.11.25 to under 1.50 167 2.1 1.1 0.3 0.5 1.7 0.1 0.91.50 to under 1.75 199 1.2 0.9 03 0.2 0.9 0.1 0.71.75 to under 2.00 213 0.6 03 0.2 0.2 0.5 0.1 0.22.00 and above 380 0.4 0.2 0.2 0.1 03 0.0 0.1

Disability and health insurance
TABLE A-3. Standard Errors of Esti Mates of Type of Health Insurance Coverage Among Children Aged 0 to 17, by SociodemographicCharacteristics, by Gender:United States, 1989
103
Population(1,000s)
With Insurance
NotInsured
Medi-care
Medi-caid
PrivateOnly
PublicOnly
Privateand
Public
UndefinedPlansOnly
All Boys 586 0.8 0.5 0.2 0.1 0.5 0.0 0.5
Age0-4 years 228 1.2 0.8 0.2 0.2 0.9 0.1 0.85-17 years 439 0.8 0.5 0.2 0.1 0.5 0.1 0.5
RaceWhite 536 0.8 0.4 0.1 0.1 0.6 0.0 0.4Black 212 1.4 1.5 0.6 0.3 1.1 0.2 1.5Other 108 3.6 4.2 0.8 1.1 2.8 0.5 4.3
EthnicityHispanic 244 2.6 1.4 0.3 0.2 2.3 0.2 1.2Non-Hispanic 485 0.7 0.5 0.2 0.1 0.4 0.0 0.5
Family IncomeUnder $5,000 120 1.7 3.1 0.9 0.5 3.3 0.5 3.285,000-56,999 75 1.8 3.6 2.0 0.7 3.1 0.3 3.757,000-59,999 92 1.6 2.4 1.2 0.5 2.3 0.1 2.5510,000-514,999 115 1.7 1.8 0.4 0.2 1.9 0.2 1.8515,000-519,999 139 1.6 1.1 0.4 0.4 1.5 0.2 1.1
520,000-524,999 114 1.9 1.3 0.4 0.3 1.3 0.1 0.9825,000-$34,999 202 1.2 0.6 0.2 0.2 0.9 0.1 0.4535,000-549,999 195 0.9 0.4 0.3 0.2 0.7 0.1 0.4$50,000 or more 220 0.6 0.3 0.3 0.0 0.5 0.0 0.2
Poverty LevelUnder 0.50 169 1.4 2.9 0.8 0.5 3.0 0.4 3.00.50 to under 1.00 152 1.5 2.0 0.7 0.2 2.1 0.1 2.11.00 to under 1.25 124 2.5 1.6 0.6 0.3 2.0 0.2 1.51.25 to under 1.50 119 2.1 1.2 0.4 0.4 1.8 0.1 1.21.50 to under 1.75 147 1.3 0.9 0.3 0.1 1.0 0.2 0.81.75 to under 2.00 155 1.0 0!4 0.3 0.3 0.8 0.1 0.32.00 and above 266 0.5 0.3 0.2 0.1 0.4 0.0 0.2
Age and Poverty Level0-4 years and t
Under 0.50 77 1.6 4.0 0.6 1.0 3.7 0.4 4.10.50 to under 1.00 68 2.1 3.1 4 0.7 0.5 3.0 0.1 3.11.00 to under 1.25 49 3.5 3.0 ' 1.1 1.1 3.4 0.4 2.81.25 to under 1.50 50 3.0 2.2 0.8 - 2.8 0.3 2.01.50 to under 1.75 60 2.5 1.5 0.6 0.2 2.1 0.3 1.1
1.75 to under 2.00 71 1.9 ;0.9 0.5 0.4 1.4 0.2 0.82.00 and above 116 1.1 0.6 0.3 0.2 0.8 - 0.4
5-17 years andUnder 0.50 105 1.8 3.1 1.1 0.4 3.2 0.41 3.10.50 to under 1.00 117 1.7 2.0 0.9 0.2 2.3 0.1 2.11.00 to under 1.25 96 2.7 1.5 0.7 0.2 2.3 0.2 1.41.25 to under 1.50 95 2.2 1.2 0.5 0.6 1.9 0.2 1.21.50 to under 1.75 121 1.5 1.1 0.4 0.2 1.1 02 0.91.75 to under 2.00 119 0.9 0.4 0.3 0.3 0.8 0.0 0.32.00 and above 210 0.6 0.3 0.2 0.1 0.4 0.1 0.2

104Disability and health insurance
TABLE A-3. Standard Exrors of Estimates of Type of Health Insurance Coverage Among Children Aged 0 to 17, by SoclodemographicCharacteristics, by Gender: United States, 1989
Popula tion(1,000s)
With Insurance
NotInsured
Medi-care
Medi-caid
PrivateOnly
PublicOnly
Private Undefinedand Plans
Public Only
All Girls 608 0.9 0.6 0.1 0.1 0.7 0.1 0.6
Age0-4 years 223 1.1 0.9 0.2 0.1 0.8 0.1 0.85-17 years 441 0.9 0.6 0.2 0.1 0.8 0.1 0.5
RaceWhite 565 1.0 0.5 0.1 0.1 0.9 0.0 0.5Black 249 1.5 1.4 0.4 0.2 1.3 0.2 1.4Other 125 3.1 3.9 0.8 0.5 2.1 0.5 3.9
EthnicityHispanic 348 2.7 1.6 0.4 0.2 3.5 0.1 1.7Non-Hispanic 516 0.7 0.6 0.2 0.1 0.4 0.0 0.5
Family IncomeUnder $5,000 103 1.9 3.5 0.8 0.4 3.8 0.4 3.6$5,000-$6,999 106 1.8 3.8 1.9 02 3.3 0.3 4.0$7,000-$9,999 92 1.9 2.5 0.9 0.4 2.2 0.4 2.5$10,000414,999 143 1.7 1.8 0.4 0.3 2.0 0.1 1.8$15,000419,999 126 1.7 1.4 0.5 0.3 1.5 0.1 1.0$20,000-$24,999 116 2.1 1.4 0.4 0.3 1.6 13 1.4$25,000434,999 200 1.1 0.6 0.2 0.1 1.0 0.1 0.4$35,000449,999 196 0.7 0.4 0.2 0.1 03 0.1 0.3$50,000 or more 207 0.5 0.2 0.2 0.1 0.5 0.1 0.2
Poverty LevelUnder 0.50 184 1.3 3.7 1.1 0.2 3.6 0.4 3.70.50 to under 1.00 177 1.4 2.6 0.5 0.3 22 0.1 2.51.00 to under 1.25 121 2.4 1.8 0.7 0.3 1.9 02 1.61.25 to under 1.50 116 2.4 13 0.4 0.4 23 0.1 1.01.50 to under 1.75 139 13 0.8 03 0.2 1.0 02 0.71.75 to under 2.00 161 0.8 0.4 02 0.1 0.7 0.1 032.00 and above 277 0.5 0.3 0.1 0.1 0.4 0.0 02
Age and Poverty Level04 years and
Under 0.50 77 1.8 4.6 1.0 0.6 33 - 4.60,50 to under 1.00 71 1.8 3.2 0.5 0.6 2.9 0.1 321.00 to under 1.25 53 3.4 3.1 1.2 0.8 2.8 03 3.21.25 to under 1.50 42 3.6 23 0.9 0.7 3.5 03 221.50 to under 1.75 57 22 12 0.5 03 1.9 0.7 1.01.75 to under 2.00 64 1.7 1.1 03 0.2 1.4 02 0.82.00 and above 110 0.8 0.6 0.1 0.1 0.6 0.1 0.4
5-17 years &Under 0.50 122 1.8 3.7 1.5 0.1 4.3 0.6 3.80.50 to under 1.00 134 1.7 2.7 0.6 0.3 2.4 0.1 2.51.00 to under 1.25 91 2.6 1.7 0.7 03 23 0.3 1.41.25 to under 1.50 95 2.7 13 0.4 0.5 23 0.1 1.01.50 to undo. 1.75 113 1.5 1.0 0.3 0.2 1.1 0.1 0.81.75 to under 00 128 0.8 0.4 0.3 0.2 0.7 02 0.32.00 and above 208 03 03 0.2 0.1 0.4 - 0.2
- Standard error is exactly 0 or is indeterminate (too few Primary Sampling Units to calculate error).

Disability and health insurance 105
TABLE A-4. Standard Errors of Estimates of Type of Health Insurance Coverage Among Children Aged 0 to 17, by Disability and Health Status,by Gender: United States, 1989
Population(1,000s)
With Insurance
NotInsured
Medi-care
Medi-caid
PrivateOnly
PublicOnly
Private Undefinedand Plans
Public Only
Total 1,115 0.8 0.5 0.1 0.1 0.6 0.0 0.5
Age0-4 years 400 1.0 0.7 0.2 0.1 0.8 0.1 0.75-17 years 807 0.8 0.5 0.2 0.1 0.6 0.0 0.5
Health StatusExcellent 609 0.7 0.4 0.2 0.1 0.6 0.0 0.4Very good 406 1.1 0.8 0.2 0.1 0.7 0.1 0.8Good 350 1.3 1.0 0.4 0.2 1.1 0.1 1.0Fair 82 2.3 2.2 0.7 0.5 2.0 0.3 2.4Poor 22 5.9 5.6 1.0 - 6.1 - 5.7Unknown 58 3.9 2.5 0.7 0.2 3.5 03 2.4
Major ActivityUnable to perform major activity 32 4.3 4.1 1.7 0.7 3.0 0.6 3.9Limited in amount/kind of major activity 87 2.0 1.7 0.7 0.1 1.6 0.3 1.9Limited in other activity 58 2.3 2.1 0.7 0.3 1.6 0.2 2.2Not limited in activity 1,062 0.8 0.5 0.1 0.1 0.6 0.0 0.5
Basic Life ActivitiesNeeds help in self care (ADL)-ages 5-17 24 5.9 6.6 3.5 - 3.5 1.5 6.6Not limited in basic life activities 1,112 0.8 0.5 0.1 0.1 0.6 0.0 0.5
All Boys 586 0.8 05 0.2 0.1 0.5 0.0 0.5
Age0-4 years 228 1.2 0.8 0.2 0.2 0.9 0.1 0.85-17 years 439 0.8 0.5 0.2 0.1 0.5 0.1 0.5
Health StatusExcellent 304 0.7 0.5 0.2 0.1 0.5 0.0 0.5Very good 260 13 0.9 03 0.1 0.8 0.1 0.8Good 202 1.6 1.0 0.4 0.2 1.3 0.1 1.1Fair 56 3.0 2.9 1.0 0.9 2.9 0.2 3.2Poor 14 7.3 8.0 2.2 - 8.1 - 8.1Unknown 37 5.3 3.4 - - 4.7 - 3.2
Major ActivityUnable to perform major activity 25 5.6 5.2 1.8 12 4.3 - 5.1Limited in amount/kind of major activity 65 23 1.9 1.0 0.1 1.7 0.4 2.1Umited in other activity 42 2.9 2.5 1.1 0.5 2.0 0.3 2.6Not limited in activity 547 0.8 0.5 0.2 0.1 0.5 0.0 0.5
Basic Life ActivitiesNeeds help in self care (ADL)-ages 5-17 22 6.6 8.6 4.8 - 4.8 - 8.1Not limited in basic life activities 584 0.8 0.5 0.2 0.1 0.5 0.0 05

106Disability and health insurance
TABLE A-4. Standard Errors of Estimates of Type of Health Insurance Coverage Among Children Aged 0 to 17, by Disability and Health Status,b Gender: United States, 1989
Appendix BStandard error for detailed tables With Insurance
Population(1,000s)
PrivateOnly
%
PublicOnly
%
Private Undefinedand Plans
Public Only% %
NotInsured
%
Medi-care
%
Medi-caid
%
All Girls 608 0.9 0.6 0.1 0.1 0.7 0.1 0.6
Age0-4 years 223 1.1 0.9 0.2 0.1 0.8 0.1 0.85-17 years 441 0.9 0.6 0.2 0.1 0.8 0.1 0.5
Health StatusExcellent 376 0.9 0.5 0.2 0.1 0.8 0.1 0.5Very good 209 1.3 0.9 0.2 0.1 1.0 0.1 0.9Good 178 1.5 1.3 0.4 0.2 1.2 0.1 1.3Fair 44 2.8 2.7 0.8 0.2 2.2 0.6 2.7Poor 18 8.3 7.6 - - 8.5 - 7.6Unknown 33 4.1 2.9 1.4 0.3 3.3 0.6 2.9
Major ActivityUnable to perform major activity 20 5.8 5.4 3.4 - 3.4 1.3 5.7Limited in amount/kind of major activity 46 2.7 2.5 1.0 0.3 2.4 0.5 2.6Limited in other activity 32 33 2.8 0.9 0.5 2.2 - 2.9Not limited in activity 591 0.9 0.6 0.1 0.1 0.7 0.1 0.5
Basic Life ActivitiesNeeds help in self care (ADL)-ages 5-17 12 9.1 8.6 4.3 - 4.0 4.3 8.9Not limited in basic life activities 607 0.9 0.6 0.1 0.1 0.7 0.1 0.6
- Standard error is exactly 0 or is indeterminate (too few Primary Sampling Units to calculate error).

Disability and health insurance 107
APPENDIX BSTANDARD ERRORS FOR DETAILED TABLES

TA
BL
E B
-1. S
tand
ard
Err
ors
of E
stim
ates
of
Typ
e of
Hea
lth I
nsur
ance
Cov
erag
e A
mon
g A
dults
Age
d 18
to 6
4, b
y So
ciod
emog
raph
ic C
hara
cter
istic
s, b
y G
ende
r: U
nite
dSt
ates
, 198
9
Priv
ate
insu
ranc
e an
dM
edic
are
and/
or M
edic
aid
Mili
tary
With
Med
i-M
edi-
Med
icar
e &
Med
i-M
edi-
Med
icar
e &
Mili
tary
&U
ndef
med
With
Priv
ate
care
caid
Med
icai
dW
ithca
reca
idM
edic
aid
With
Mili
tary
Priv
ate
Plan
sN
otPo
pula
tion
Priv
ate
Onl
yO
nly
Onl
yO
nly
Eith
erO
nly
Onl
yO
nly
Mili
tary
Onl
yO
nly
Onl
yIn
sure
d(1
,000
s)(%
)(%
)(%
)(%
)(%
)(%
)(%
)(%
)(%
)(%
)(%
)(%
)(%
)(%
)
Tot
al2,
073
0.4
0.4
0.0
0.0
0.0
020.
00.
10.
00.
10.
10.
10.
00.
3A
ge.
18-2
4 ye
ars
581
0.8
0.8
0.0
0.1
0.0
0.3
0.0
0.3
0.0
0.2
0.2
0.1
0.1
0.6
25-4
4 ye
ars
1,13
50.
50.
50.
00.
00.
00.
20.
00.
20.
00.
10.
10.
10.
00.
445
-64
year
s71
00.
40.
40.
10.
00.
00.
20.
10.
10.
10.
20.
10.
20.
10.
3R
ace W
hite
1,94
80.
40.
40.
00.
00.
00.
20.
00.
10.
00.
10.
10.
10.
00.
3B
lack
650
0.8
0.8
0.1
0.1
0.0
0.5
020.
40.
10.
30.
20.
20.
10.
6O
ther
274
1.7
1.8
0.1
0.1
0.0
1.1
0.1
1.1
0.1
0.4
0.3
0.2
0.4
1.5
Eth
nici
tyH
ispa
nic
567
1.8
1.7
0.1
0.1
0.0
0.7
0.1
0.7
0.1
0.3
0.2
0.2
0.2
1.6
Non
-/-l
ispa
nic
1,97
00.
30.
40.
00.
00.
002
0.0
0.1
0.0
0.1
0.1
0.1
0.0
0.2
Edu
catio
nL
ess
than
12
year
s60
90.
80.
80.
10.
10.
00.
50.
19.
40.
10.
20.
10.
10.
10.
812
yea
rs99
70.
403
0.0
0.0
0.0
0.2
0.0
0.1
0.0
0.2
0.1
0.1
0.0
0.3
Som
e co
llege
633
0.4
0.5
0.1
0.0
0.0
0.1
0.0
0.1
0.0
0.2
0.1
0.1
0.1
0.4
Col
lege
gra
duat
e59
20.
303
0.1
0.0
0.0
0.1
0.0
0.0
0.0
0.2
0.1
0.1
0.0
0.3
Unk
now
n55
3.4
3.3
031.
40.
72.
91.
11.
81.
40.
60.
50.
30.
33.
3A
ge &
Edu
catio
n18
-24
year
s &
Les
s th
an 1
2 ye
ars
158
1.4
1.4
0.1
020.
11.
002
0.9
0.1
0.3
0.2
0.1
0.2
1.3
12 y
ears
328
0.9
0.9
0.1
0.1
0.0
0.4
0.0
0.4
0.0
0.3
0.3
0.1
0.2
0.8
Som
e co
llege
290
0.9
1.0
0.1
0.1
0.0
0.3
0.0
0.2
0.0
0.5
0.4
0.1
0.1
0.9
Col
lege
gra
duat
e98
1.5
1.6
02-
-02
-0.
1-
0.6
0.4
0.5
0.2
1.5
Unk
now
n15
8.9
8.2
2.4
4.4
337.
3-
422.
8-
--
-8.
925
-44
year
s &
Les
s th
an 1
2 ye
ars
335
1.2
1.2
0.2
0.1
0.1
0.8
0.1
0.7
0.2
0.2
0.1
0.1
0.1
1.2
12 y
eais
529
0.6
0.6
0.0
0.1
0.0
0.2
0.0
0.2
0.0
0.2
0.1
0.1
0.1
0.5
Som
e co
llege
378
050.
50.
00.
00.
00.
20.
00.
20.
00.
20.
13.
20.
10.
4C
olle
ge g
radu
a te
421
0.4
0.4
0.1
0.0
0.0
0.1
0.0
0.1
0.0
0.2
0.1
0.1
0.0
0.3
Unk
now
n36
5.0
4.9
0.7
251.
043
1.4
2.8
1.4
--
-0.
54.
945
-64
year
sL
ess
than
12
year
s24
90.
90.
90.
20.
10.
10.
602
0.4
0.2
0.3
0.2
0.2
0.1
0.6
12 y
ears
364
0.4
0.6
0.1
0.1
0.0
0.3
0.1
0.1
0.1
0.4
0.2
0.3
0.1
0.3
Som
e co
llege
188
0.6
0.8
0.2
0.1
0.1
0.3
0.1
0.1
0.1
0.5
0.3
0.4
0.1
0.5
Col
lege
gra
duat
e24
00.
50.
60.
20.
10.
002
0.1
0.1
0.0
0.4
0.2
0.3
0.1
0.4
Unk
now
n28
4.7
4.7
0.8
--
3.9
1.9
2.0
3.2
1.5
1.4
0.7
-4.
5M
arita
l Sta
tus
Mar
ried
1,47
40.
40.
40.
00.
00.
00.
10.
00.
10.
00.
20.
10.
10.
00.
3W
idow
ed10
21.
41.
50.
402
0.1
1.0
0.4
0.6
0.3
0.5
0.4
0.4
0.1
1.2
Div
orce
d22
60.
80.
80.
10.
10.
00.
50.
20.
40.
10.
20.
20.
20.
10.
6Se
para
ted
111
1.4
1.4
0.2
020.
11.
20.
21.
20.
20.
40.
30.
20.
21.
1N
ever
mar
ried
690
0.6
0.6
0.1
0.1
0.0
0.3
0.1
030.
10.
10.
10.
10.
10.
5U
nkno
wn
225.
45.
21.
41.
00.
62.
90.
91.
91.
11.
4-
1.4
-5.
3
1 7.
1.' :
).

TA
BL
E B
-1. S
tand
ard
Err
ors
of E
stim
ates
of
Typ
e of
Hea
lth I
nsur
ance
Cov
erag
e A
mon
g A
dults
Age
d 18
to 6
4, b
y So
ciod
emog
raph
ic C
hara
cter
istic
s, b
y G
ende
r: U
nite
d St
ates
,198
9
Popu
latio
n(1
,000
s)
With
Priv
a te
(%)
With
Priv
ate
Onl
y(%
)
Priv
ate
insu
ranc
e an
dM
edic
are
and/
or M
edic
aid
Mili
tary
Und
efin
edPl
ans
Not
Onl
yIn
sure
d(%
)(%
)
Med
i-ca
reO
nly
(%)
Med
i-ca
idO
nly
(%)
Med
kare
&M
edic
aid
Onl
y(%
)
With
Eith
er(%
)
Med
i-ca
reO
nly
(%)
Med
i- M
edic
are
&ca
idM
edic
aid
Onl
yO
nly
(%)
(%)
With
Mili
tary
Mili
tary
Onl
y(%
)(%
)
Mili
tary
&Pr
ivat
eO
nly
(%)
Em
ploy
men
t Sta
tus
Cur
rent
ly e
mpl
oyed
L62
703
0.3
0.0
0.0
0.0
0.1
0.0
0.0
0.0
0.1
0.1
0.1
0.0
0.3
Une
mpl
oyed
144
121.
20.
00.
20.
10.
80.
10.
80.
10.
50.
40.
20.
21.
2
Not
in la
bor
forc
e56
80.
70.
70.
10.
10.
10.
50.
10.
50.
10.
30.
20.
10.
10.
5
Em
ploy
men
t Sta
tus
& A
geC
urre
ntly
em
ploy
ed &
18-2
4 ye
ars
415
0.7
0.7
%.,
0.1
0.0
0.2
0.0
0.1
0.0
0.2
0.2
0.1
0.1
0.7
25-4
4 ye
ars
960
0.4
0.4
0.0
0.0
0.0
0.1
0.0
0.1
0.0
0.1
0.1
0.1
0.0
0.3
45-6
4 ye
ars
526
0.3
0.4
0.0
0.0
0.0
0.1
0.0
0.0
0.0
0.2
0.1
0.2
0.1
0.3
Une
mpl
oyed
&18
-24
year
s71
2.4
2.4
-0.
5-
130.
21.
20.
20.
60.
60.
20.
42.
3
25-4
4 ye
ars
961.
51.
40.
00.
20.
11.
20.
11.
20.
10.
60.
60.
20.
21.
6
45-6
4 ye
ars
462.
62.
6-
031.
30.
213
0.4
1.2
0.8
0.9
0.3
2.3
Not
in la
bor
forc
e &
18-2
4 ye
ars
228
1.5
1.5
0.1
0.2
0.1
1.2
0.1
1.1
0.1
0.4
0.3
0.2
0.2
1.1
25-4
4 ye
ars
255
1.1
1.1
0.1
0.2
0.1
0.9
0.2
0.8
0.2
0.4
0.3
0.1
0.1
0.8
45-6
4 ye
ars
270
0.7
0.8
030.
10.
10.
60.
20.
40.
20.
40.
20.
30.
10.
5
Fam
ily I
ncom
eU
nder
$5,
000
332
2.9
2.9
0.2
0.2
0.1
1.8
0.2
1.6
0.4
0.3
0.3
0.2
0.2
2.1
$5,0
00-$
6,99
914
91.
61.
60.
203
0.1
1.6
0.7
1.6
0.4
0.4
0.3
0.2
0.4
1.5
57,0
00-$
9,99
915
81.
31.
20.
20.
30.
11.
103
1.1
0.3
0.3
0.3
0.1
0.2
1.2
510,
000-
514,
999
288
0.9
0.9
0.2
0.1
0.1
0.6
0.2
0.5
0.1
0.3
0.3
0.1
0.1
0.9
515,
000-
S19,
999
393
0.8
0.9
0.1
0.1
0.1
0.3
0.1
0.2
0.1
0.2
0.2
0.1
0.1
0.8
520,
000-
524,
999
352
0.8
0.9
0.1
0.1
0.1
0.4
0.1
0.2
0.1
0.5
0.4
0.2
0.1
0.7
525,
000-
534,
999
654
0.5
0.5
0.1
0.0
0.0
0.1
0.0
0.1
0.0
0.2
0.2
0.2
0.1
0.4
535,
000-
549,
999
627
0.4
0.4
0.1
0.0
0.0
0.1
0.0
0.0
0.0
0.2
0.1
0.1
0.0
0.4
550,
000
or m
ore
813
030.
40.
10.
00.
00.
10.
00.
00.
00.
20.
10.
20.
10.
3
Pove
rty
Lev
elU
nder
0.5
031
12.
62.
50.
203
0.0
1.8
031.
80.
20.
30.
20.
20.
22.
2
0.50
to u
nder
1.0
028
61.
21.
20.
10.
20.
11.
103
1.0
0.3
0.2
0.2
0.1
0.2
1.2
1.00
to u
nder
1.2
321
51.
51.
50.
20.
20.
10.
703
0.6
0.2
0.4
0.4
0.1
0.2
1.3
1.25
to u
nder
1.5
021
513
1.3
0.2
0.2
0.1
0.6
0.2
0.4
0.2
0.3
0.3
0.1
0.1
1.3
1 50
to u
nder
1.7
528
31.
01.
10.
20.
10.
10.
50.
103
0.1
0.4
0.3
0.2
0.1
0.9
1.75
to u
nder
2.0
042
80.
60.
60.
10.
10.
00.
20.
10.
10.
10.
20.
20.
10.
10.
6
2.00
and
abo
ve1,
481
030.
30.
00.
00.
00.
10.
00.
00.
00.
20.
10.
10.
00.
2
Pove
rty
Lev
el a
nd A
ge18
-24
year
s &
Und
er 0
.50
208
4.2
4.1
0.2
0.2
-23
-23
0.1
0.6
0.4
0.4
0.5
2.9
0.50
to u
nder
1.0
014
62.
72.
70.
10.
2-
1.4
0.2
130.
10.
40.
30.
20.
32.
3
1.00
to u
nder
1.2
586
2.4
2.4
-03
-13
0.2
1.3
0.2
0.7
0.7
0.1
-2.
3
1.25
to u
nder
1.5
087
2.5
2.5
0.1
030.
213
-1.
10.
30.
60.
60.
10.
32.
4
1.50
to u
nder
1 7
510
02.
12.
20.
20.
40.
10.
90.
40.
70.
11.
31.
30.
10.
32.
1
1.75
to u
nder
2.0
013
81.
41.
40.
10.
10.
00.
50.
10.
40.
10.
40.
30.
20.
41.
3
2.00
and
abo
ve28
70.
80.
80.
10.
10.
00.
20.
00.
10.
00.
30.
20.
10.
10.
7
1 5
I;1
-5

TA
BL
E B
-1. S
tand
ard
Err
ors
of E
stim
ates
of
Typ
e of
Hea
lth I
nsur
ance
Cov
erag
e A
mon
g A
dults
Age
d 18
to 6
4, b
y So
ciod
emow
aphi
cC
hara
cter
istic
s, b
y G
ende
r: U
nite
d St
ates
, 198
9
25-4
4 ym
rs &
Und
er 0
.50
0.50
to u
nder
1.0
01.
00 to
und
er 1
.25
1.25
to u
nder
1.5
01.
50 to
und
o- 1
.75
1.75
to u
nder
2.0
02.
00 a
nd a
bove
45-6
4 ye
ars
&U
nder
0.5
00.
50 to
und
er 1
00
1 00
to u
nder
1 2
51.
23 to
und
er 1
.30
5o to
und
er 1
73
1 73
to u
nder
2 0
02
00 a
nd a
bove
All
Men
Age 18
-24
y ea
rs23
-44
year
s45
-64
year
sR
ace W
hite
Bla
ckO
ther
Eth
nici
tyH
ispa
nic
Non
-lin
:pan
icE
duca
tion
Les
s th
an 1
2 ye
ars
12 y
ears
Som
e co
llege
Col
lege
gra
duat
eU
nkno
wn
Age
& E
duca
tion
18-2
4 ye
ars
&L
ess
than
12
year
s12
yea
rsSo
me
colle
geC
olle
ge g
radu
a te
Unk
now
n
Popu
latio
n(1
,000
s)
With
Priv
a te
(%)
With
Priv
ate
Onl
y(%
)
Priv
ate
insu
ranc
e an
d
Med
i-M
edi-
care
caid
Onl
yO
nly
(%)
(%)
Med
icar
e &
Med
icai
dO
nly
(%)
Med
icar
e an
d/or
Med
icai
dM
ilita
ry
With
Eith
er(%
)
Med
i-ca
reO
nly
(%)
Med
i-ca
id
Onl
y(%
)
162
159
130
137
189
236
858 57 80 63 76 ss 137
600
1.7
1.4
1313
1.8
1.9
1.9
1.1
0 7
0.3
23 1.4
23 2.0
1.7
1.1
03
1.9
1.2
0.8
03 2.2
1.4
2.2
2.0
1.8
1.4
0.4
0.0
0.2
0.1
0.1
0.2
0.1
0.0
0.9
0.3
0.7
0.5
0.5
0.4
0.1
0.6
0.3
03 02 0.1
0.1
0.0
0.5
0.3
0.3
0 3
0.4
0.2
0.0
0.1
0.0
0.1
0.1
0.1
0.0
0.0
0.2
0.1
0.1
0.3
0.1
0.0
1,09
70.
40.
40.
10.
00.
0
348
398
359
1,02
530
513
8
318
1,02
5
320
515
329
356 43 96 203
161 53 12
0.8
0.5
0.4
0.4
1.1
2.0
1.9
0.8
0.5
0.5
0.4
1.1
2.1
0.1
0.0
0.1
0.1
0.1
0.2
1.9
0.1
0.4
0.4
1.0
0.5
0.5
0.4
4.1
1.0
0.5
0.5
0.4
3.9
1 7
1.2
13 2.2
8.6
0.1
0.0
0.0
0.0
0.1
0.1
0.0
0.0
0.0
0.0
0.1
0.2
0.1
0.1
0.0
0.0
0.2
0.1
0 1
0.1
0.7
0.1
0.0
0.1
0.4
3.7
0.1
0.0
0.0
0.0
0.8
0.3
0.1
0.1
4.9
0.1
0.0
0.0
0.0
0.8
0.1
0.0
0.0
3.9
2.4
1.5
0.9
0.7
0.4
0.2
0.1
2.8
1.7
1.5
1.3
1.1
0.7
0.1
0.4
0.2
0.3
0.2
0.1
0.1
0.0
1.2
0.8
1.0
0.7
0.5
0.3
0.1
0.1
0.0
03 0.2
03 0.1
0.4
1.1
0.1
0.0
0.1
0.0
0.2
0.1
0.6
0.1
0.1
0.0
0.5
0.2
0.1
0.1
3.0
0.9
0.3
0.2
0.4
7.8
0.2
0.1
0.1
0.1
1.0
03 0.1
2.3
1.4
0.7
0.5
0.3
0.2
0.0
2.8
1.4
1.1
0.7
0.6
0.3
0.0
Med
icar
e &
Med
icai
dW
ithM
ilita
ryO
nly
Mili
tary
Onl
y(%
)(%
)(%
)
0.3
0.3
0.3
0.2
0.1
0.1
0.0
1.3
0.9
0.7
0.3
0.4
0.2
0.0
0.3
0.3
0.5
0.2
0.3
0.3
0.1
0.9
0.5
0.7
0.9
0.8
0.5
0.3
0.2
0.2
0.4
0.2
0.2
0.2
0.1
0.6
0 4
0.5
0.7
0.6
0.4
0.2
0.1
0.0
0.1
0.1
0.2
0.1
0.1
0.1
0.4
1.0
0.0
0.0
0.1
0.0
0.1
0.1
0.2
0.1
0.3
0.1
0.4
0.6
0.1
0.1
0.2
0.1
0.3
0.4
0.5
0.1
0.3
0.2
0.1
0.0
0.1
0.1
0.4
0.1
0.1
0.0
2.0
0.8
03 0.1
6.5
C.2
0.0
0.0
0.0
2.0
0.1
0.1
0.2
0.2
0.3
0.2
1.0
0.2
0.2
0.4
0.1
0.1
0.2
0.1
0.9
0.2
0.2
0.4
Mili
tary
&Pr
ivat
eO
nly
(%) 0.1
0.0
0.1
0.1
0.2
0.2
0.1
0.5
0.1
0.5
0.4
0.5
0.3
0.2
0.1
0.1
0.1
0.2
0.1
0.2
0.4
0.2
0.1
0.2
0.1
0.2
0.2
0.4
0.1
0.1
0.2
Und
efin
edPl
ans
Not
Onl
yIn
sure
d(%
)(%
)
I
0.2
0.2
0.2
0.1
0.2
0.1
0.0
0.8
0.3
0.5
0.4
0.3
0.2
0.1
2.4
1.5
1.7
1.9
1.1
0.7
0.3
3.2
1.6
2.1
1.5
1.4
1.1
0.2
0.0
0.3
0.1
0.1
0.1
0.0
0.2
0.6
0.7
0.5
0.3
0.4
1.0
1.6
0.3
1.8
0.0
0.3
0.1
0.1
0.1
0.1
0.4
0.4
0.1
0.2
0.3
0.9
0.5
0.5
0.4
4.3
1.6
1.1
1.2
2.2
113

TA
BL
E B
-1. S
tand
ard
Err
ors
of E
stim
ates
of
Typ
e of
Hea
lth I
nsur
ance
Cov
erag
e A
mon
g A
dults
Age
d 18
to 6
4, b
y So
ciod
emog
raph
ic C
hara
cter
istic
s, b
y G
ende
r: U
nite
d St
ates
,198
9
Popu
latio
n(1
,000
s)
With
Priv
a te
(%)
With
Priv
ate
Onl
y(%
)
Priv
ate
insu
ranc
e an
dM
edic
are
and/
or M
edic
aid
Mili
tary
Und
efin
edPl
ans
Not
Onl
yIn
sure
d(%
)(%
)
Med
i-ca
re
Onl
y(%
)
Med
i-ca
idO
nly
(%)
Med
icar
e &
Med
icai
dO
nly
(%)
With
E th
er(%
)
Med
i-ca
reO
nly
(%)
Med
i- M
edic
are
&ca
idM
edic
aid
Onl
yO
nly
(%)
(%)
With
Mili
tary
Mili
tary
Onl
y(%
)(%
)
Mili
tary
&Pr
ivat
eO
nly
(%)
25-4
4 ye
ars
&L
ess
than
12
year
s17
81.
51.
50.
20.
10.
10.
80.
20.
70.
30.
20.
10.
10.
11.
412
yea
rs27
20.
70.
70.
10.
10.
00.
20.
10.
10.
00.
20.
10.
10.
10.
7So
me
colle
ge20
80.
70.
70.
00.
00.
00.
20.
10.
10.
00.
30.
10.
20.
20.
7
Col
lege
gra
duat
e24
70.
50.
50.
1-
0.0
0.1
0.1
0.1
0.1
0.2
0.1
0.1
0.1
0.5
Unk
now
n26
626.
0-
1.0
1.4
4.1
1.7
2.6
1.9
--
-0.
96.
245
-64
year
sL
ess
than
12
year
s13
41.
01.
10.
40.
10.
10.
70.
40.
40.
30.
50.
30.
30.
20.
812
yea
rs19
00.
70.
802
0.1
0.1
0.4
0.2
0.1
0.1
0.6
0.3
0.4
0.1
0.5
Som
e co
llege
940.
91.
20.
30.
10.
10.
40.
20.
10.
10.
90.
60.
60.
20.
7
Col
lege
gra
duat
e14
80.
60.
70.
20.
10.
10.
30.
10.
00.
00.
60.
20.
40.
10.
5U
nkno
wn
235.
75.
71.
2-
-5.
21.
62.
54.
52.
32.
11.
1-
5.1
Mar
ital S
tatu
sM
arri
ed73
90.
40.
40.
10.
00.
00.
20.
00.
10.
00.
20.
10.
10.
00.
3W
idow
ed36
3.3
3.5
0.8
--
2.4
1.2
1.9
0.7
1.4
0.6
1.1
0.5
2.5
Div
orce
d12
81.
313
0.2
0.1
0.0
0.6
030.
40.
20.
60.
40.
40.
31.
1
Sepa
rate
d54
2.2
2.2
0.3
0.1
-1.
10.
41.
00.
20.
80.
60.
50.
42.
2N
ever
mar
ried
444
0.7
0.7
0.1
0.1
0.1
0.3
0.1
0.2
0.1
0.1
0.1
0.1
0.1
0.7
Unk
now
n16
6.8
6.9
2.6
--
3.2
1.6
1.4
-2.
6-
2.6
-6.
5E
mpl
oym
ent S
tatu
sC
urre
ntly
em
ploy
ed92
70.
40.
40.
00.
00.
00.
10.
00.
00.
00.
10.
10.
10.
00.
4
Une
mpl
oyed
101
1.7
1.6
-02
-1.
00.
20.
90.
10.
60.
40.
30.
21.
9N
ot in
labo
r fo
rce
256
1.0
1.2
0.4
0.1
0.1
1.0
030.
60.
40.
50.
303
0.2
0.7
Em
ploy
men
t Sta
tus
& A
geC
urre
ntly
em
ploy
ed &
18-2
4 ye
ars
237
0.9
0.9
0.1
0.1
0.0
0.2
0.1
0.1
-0.
20.
20.
10.
10.
9
25-4
4 ye
ars
553
0.4
0.4
0.0
0.0
0.0
0.1
0.0
0.1
0.0
0.1
0.0
0.1
0.1
0.4
45-6
4 ye
ars
302
0.4
0.5
0.1
0.0
0.0
0.1
0.0
0.0
0.0
0.3
0.2
0.2
0.1
0.4
Une
mpl
oyed
&18
-24
year
s58
3.5
3.5
-0.
7-
130.
41.
00.
30.
50.
3-
0.2
3.4
25-4
4 ye
ars
642.
02.
0-
0.2
-1.
50.
21.
50.
20.
70.
60.
40.
32.
445
-64
year
s36
3.4
3.4
--
-2.
00.
52.
0-
1.7
1.2
1.4
0.5
3.1
Not
in la
bor
forc
e &
18-2
4 ye
ars
156
1.9
1.9
020.
20.
113
0.2
1.1
0.2
0.4
0.3
0.2
0.4
1.7
25-4
4 ye
ars
841.
91.
90.
503
032.
10.
81.
50.
8'.:
.90.
603
0.7
1.8
45-6
4 ye
ars
126
1.1
130.
70.
20.
21.
10.
60.
60.
50.
90.
60.
603
0.8
Fam
ily I
ncom
eU
nder
$5,
000
170
3.4
3.4
020.
1-
1.9
031.
60.
60.
40.
30.
20.
32.
9$5
,000
-$6,
999
812.
42.
402
030.
21.
80.
91.
50.
70.
70.
603
0.8
2.4
$7,0
0049
,999
781.
71.
70.
40.
40.
113
0.7
1.0
0.6
0.6
0.6
0.2
0.3
1.8
$10,
000-
$14,
999
154
1.1
1.1
0.3
0.1
0.1
0.7
0.3
0.4
0.2
0.3
0.2
0.1
0.2
1.2
$15,
0004
19,9
9920
81.
11.
102
0.1
0.1
0.4
0.2
0.2
0.1
0.3
0.3
0.1
0.2
1.0
$20,
000-
524,
999
184
1.0
1.0
020.
10.
10.
40.
10.
20.
10.
40.
30.
20.
10.
9
$25,
000-
$34,
999
336
0.6
0.6
0.1
0.1
0.0
0.2
0.1
0.1
0.0
0.3
0.1
0.2
0.1
0.5
$35,
000-
$49,
999
339
0.4
0.5
0.1
0.0
0.1
0.0
0.0
0.0
0.2
0.1
0.2
0.1
0.4
$50,
000
or m
ore
437
0.4
0.5
0.1
0.0
0.0
0.1
0.0
0.0
0.0
0.2
0.1
0.2
0.1
0.4

TA
BL
E B
-1. S
tand
ard
Err
ors
of E
stim
ates
of T
ype
of H
ealth
Ins
uran
ce C
over
age
Am
ong
Adu
lts A
ged
18 to
64,
by
Soci
odem
ogra
phic
Cha
ract
eris
tics,
by
Gen
der:
Uni
ted
Stat
es, 1
989
Pove
rty
Lev
elU
nder
030
0.50
to u
nder
1.0
01.
00 to
und
er 1
.25
1.25
to u
nder
1.5
013
0 to
und
er 1
.75
1.75
to u
nder
2.0
02.
00 a
nd a
bove
Pove
rty
Lev
el a
nd A
ge18
-24
year
s &
Und
er 0
300.
50 to
und
er 1
.00
1.00
to u
nder
1.2
31.
25 to
und
er 1
.50
1.50
to u
nder
1.7
51.
75 to
und
er 2
.00
2.00
and
abo
ve25
-44
year
s &
Und
er 0
.50
050
to u
nder
1.0
01.
00 to
und
er 1
.25
1.25
to u
nder
1.5
01.
50 to
und
er 1
.75
1.75
to u
nder
2.0
02.
00 a
nd a
bove
45-6
4 ye
ars
&U
nder
0.5
00.
50 ic
o un
der
1.00
1.00
to u
nder
1.2
312
5 to
und
er 1
.50
130
to u
nder
1.7
51.
75 to
und
er 2
.00
2.00
and
abo
ve
All
Wom
en
Age 18
-24
year
s25
-44
year
s45
-64
year
sR
ace W
hite
Bla
ckO
ther
Eth
nici
tyIl
ispa
nkN
on-I
lispa
nic
Popu
latio
n(1
,000
s)
With
Priv
a te
(%)
With
Priv
ate
Onl
y(%
)
Priv
ate
insu
ranc
e an
d
Med
i-ca
re
Onl
y(%
)
Med
i-ca
idO
nly
(%)
Med
icar
e &
Med
icai
dO
nly
(%)
Med
icar
e an
d/or
Med
icai
dM
ilita
ry
With
Eith
er(%
)
Med
i-ca
reO
nly
(%)
Med
i-ca
idO
nl y
(%)
Med
icar
e &
Med
icai
dO
nly
(%)
With
Mili
tary
Mili
tary
Onl
y(%
)(%
)
Mili
tary
&Pr
iva
te
Onl
y(%
)
164
139
111
115
155
218
773
ill 80 52 53 61 80 173 69 79 67 77 107
138
460
31 42 35 41 52 73 304
3.2
1.6
1.8
1.6
12 0.7
0.3
5.2
3.5
3.2
3.5
2.2
1.6
1.0
2.4
1.8
23 23 13 1.0
0.4
3.8
1.9
3.1
2.5
2.4
13 0.4
3.2
1.6
1.9
1.6
1.2
0.8
03
03 03 03 0.2
0.2
0.2
0.1
5.1
033.
602
3.2
3.5
2.2
1.6
1.0
0.103
23 1.7
2.4
2.2
1.4
1.0
0.4
3.6
1.9
3.0
2.5
2.5
1.6
05
0.4
0.2
0.2
0.2
0.1
0.1
1.4
03 13 0.9
0.8
0.6
0.2
0.1
0.2
0.2
0.1
0.1
0.1
0.0
0.4
03 0.2
0.4
0.1
0.1
0.1
0.0
0.4
0.1
0.5
03 02 0.0
0.1
0.1
0.1
0.1
0.0
0.0
0.4
0.0
0.0
0.2
0.2
0.1
0.0
0.0
0.2
0.4
0.4
0.2
0.0
2.1
1.1
0.9
0.7
0.5
03 0.1
2.4 13 0.9
1.0
1.0
02 2.7
1.5
1.2
0.7
0.5
03 0.1
4.6
25 2.7
2.1
1.4
0.9
02
0.3
0.4
0.4
0.4
02 0.1
0.0
03 0.7
0.0
03 0.4
0.5
03 0.2
0.1
0 0
2.5
1.6
1.6
1.4
0.8
0.4
0.1
1.8
1.0
0.6
03 0.2
0.2
0.0
2.4
1.2
0.9
0.8
0.5
0.1
2.7
1.4
0.7
0.4
03 0.2
0.1
3.5
1.8
1.3
0.8
0.6
0.2
0.0
0.5
0.4
0.4
03 0.1
0.1
0.0
0.1
0.3
0.5
0.3
0.2
03 0.6
0.5
03 0.2
0.1
0.0
2.7
13 1.5
0.7
0.4
0.2
0.0
0.5
03 0.4
0.5
0.4
0.3
0.2
0.5
0.4
C 4
0.4
1.1
0.3
0.2
0.3
0.2
0.2
0.4
0.3
0.2
0.1
0.4
0.3
0.3
0.3
1.1
03 0.2
0.7
0.4
0.4
0.3
0.4
030.
30.
20.
40.
20.
30.
20
0.1
1.6
0.9
1.4
1.7
1.4
0.7
0.4
13 0.8
0.8
1.4
1.0
0.5
0.2
0.2
0.1
0.2
0.2
0.2
0.2
0.1
0.2
0.2
0.3
0.3
0.1
0.1
0.2
0.2
0.2
0.3
0.2
0.1
0.6
0.2
0.9
0.5
0.7
0.5
0.3
1,03
70.
40.
40.
00.
00.
00.
20.
002
0.0
0.2
0.1
0.1
301
584
383
966
375
158
266
999
1.0
0.5
0.4
0.4
0.9
1.8
1.0
0.5
0.5
0.4
0.9
1.9
0.0
0.0
0.1
0.1 02 0.1
0.1
0.1
0.1
0.0
0.2
0.2
0.0
0.0
0.0
0.0
0.1
0.1
1.8
1.8
0.2
0.1
0.0
03 03 0.3
02 0.7
13
0.0
0.0
0.1
0.0
0.2
0.1
1.0
0.1
0.5
03 02 0.2
0.7
13 1.0
0.4
0.4
0.0
0.0
0.0
0.2
0.0
0.2
0.1
0.0
0.1
0.0
0.2
0.2
0.4
0.2
0.2
0.2
03 0.7
0.4
0.2
0.1
0.1
0.2
0.4
0.1
0.1
0.2
0.1
0.2
0.4
0.2
0.5
0.3
0.2
0.0
0.2
0.1
0.1
Und
efin
edPl
ans
Not
Onl
yIn
sure
d(%
)(%
)
0.6
0.3
0.3
0.2
0.2
0.1
0.1
1.1
0.5
0.4
0.2
0.4
0.1
0.6
0.3
0.4
0.2
0.3
0.1
0.1
1.7
0.7
0.6
0.5
0.4
0.3
0.1
2.9
1.6
1.8
1.6
1.2
0.7
0.3
3.8
3.2
3.4
3.6
2.3
1.5
1.0
3.0
2.2
2.3
2.3
1.3
0.9
0.4
4.9
2.3
3.1
2.2
2.0
1.2
0.3
0.0
03
0.1
0.0
0.1
0.0
0.1
0.4
0.8
0.4
0.3
0.3
0.7
1.7
0.1
1.7
0.0
03 C

TA
BLE
B-1
. Sta
ndar
d E
rror
s of
Est
imat
es o
f Typ
e of
Hea
lth In
sura
nce
Cov
erag
e A
mon
g A
dults
Age
d 18
to 6
4, b
y S
ocio
dem
ogra
phic
Cha
ract
eris
tics,
by
Gen
der:
Uni
ted
Sta
tes,
198
9
Popu
la ti
on(1
,000
s)
With
Priv
a te
(%)
With
Priv
ate
Onl
y(%
)
Priv
ate
insu
ranc
e an
dM
edic
are
and/
or M
edic
aid
Mili
tary
Und
efin
edPl
ans
Not
Onl
yIn
sure
d(%
)(%
)
Med
i-ca
re
Onl
y(%
)
Med
i-ca
idO
nly
(%)
Med
icar
e &
Med
icai
dO
nl y
(%)
With
Ei t
her
(%)
Med
i-ca
reO
nly
(%)
Med
i-M
edic
are
&ca
idM
edic
aid
Onl
yO
nl y
(%)
(%)
With
Mili
tary
Mili
tary
Onl
y(%
)(%
)
Mili
tary
&Pr
ivat
eO
nly
(%)
Edu
catio
nL
ess
than
12
year
s12
322
0.9
0.9
0.2
0.1
0.1
0.6
0.2
0.6
0.2
0.2
0.2
0.1
0.1
0.9
year
sSo
rne
531
0.5
0.5
0.1
0.1
0.0
030.
10.
20.
00.
20.
20.
10.
10.
4co
llege
Col
lege
365
0.5
0.6
0.1
0.1
0.0
0.2
0.1
0.2
0.1
0.2
0.2
0.1
0.1
0.4
grad
uate
Unk
now
n28
80.
40.
40.
10.
00.
00.
10.
00.
10.
00.
30.
20.
20.
00.
3
Age
& E
duca
tion
274.
85.
20.
932
1.1
4.7
2.5
3.1
1.9
--
--
3.8
18-2
4 ye
ars
&L
ess
than
12
year
s12
931.
81.
8-
0.4
-1.
50.
11.
40.
20.
50.
40.
10.
31.
8ye
ars
Som
e16
913
130.
13.
2-
0.6
0.1
0.6
0.0
0.5
0.5
0.2
0.2
1.1
colle
geC
olle
gedu
a17
21.
21.
20.
10.
1-
0.4
0.0
0.4
0.1
0.6
0.6
0.2
0.2
1.1
gra
teU
nkno
wn
661.
82.
00.
2-
-03
-0.
1-
1.1
0.7
0.9
0.2
1.6
25-4
4 ye
ars
&8
11.4
13.7
-9.
06.
412
.5-
3.1
7.5
--
--
8.7
1..A
...s
than
12
year
s12
185
131.
30.
20.
20.
11.
00.
10.
90.
20.
30.
20.
20.
11.
3ye
ars
Som
e30
20.
70.
70.
10.
10.
00.
40.
10.
30.
10.
20.
20.
10.
10.
6co
llege
Col
lege
219
0.7
0.7
0.0
0.1
0.0
030.
103
0.1
0.3
0.2
0.2
0.0
0.6
grad
ua te
Unk
now
n21
80.
40.
40.
10.
00.
00.
10.
00.
1-
0.3
0.2
0.2
0.1
0.3
45-6
4 ye
ars
216.
46.
81.
65.
41.
463
255.
12.
1-
--
-4.
7
Les
s th
an 1
2 ye
ars
1214
612
1.2
030.
20.
10.
80.
30.
60.
30.
30.
20.
20.
20.
9ye
ars
Som
e21
105
0.6
0.2
0.1
0.0
0.3
0.1
0.2
0.1
0.4
0.2
0.3
0.1
0.4
colle
geC
olle
ge12
50.
70.
90.
30.
20.
10.
502
030.
10.
40.
20.
40.
10.
6gr
adua
teU
nkno
wn
119
0.7
0.8
030.
1-
0.4
020.
20.
00.
50.
30.
40.
10.
6
Mar
ital S
tatu
s15
8.4
8.4
--
-6.
24.
833
3.6
--
--
8.1
Mar
ried
Wid
owed
743
0.4
0.4
0.1
0.0
0.0
020.
00.
10.
00.
30.
20.
10.
00.
3
Div
orce
d94
1.4
I .5
0.5
0.2
0.1
1.0
030.
60.
30.
60.
50.
40.
11.
2
Sepa
rate
d15
40.
90.
90.
10.
20.
10.
702
0.6
0.2
0.1
0.1
0.1
0.1
0.8
Nev
er88
1.6
1.6
030.
40.
11.
602
1.6
0.3
0.4
0.3
0.2
0.3
1.3
mar
ried
Unk
now
n35
10.
80.
90.
10.
20.
00.
60.
10.
50.
10.
10.
10.
10.
10.
6
Em
ploy
men
t Sta
tus
146.
97.
1-
2.2
1.2
4.4
-33
2.2
--
--
7.0
Cur
rent
ly e
mpl
oyed
Une
mpl
oyed
760
030.
40.
00.
00.
00.
10.
00.
10.
00.
10.
10.
10.
00.
3
labo
r82
1.6
1.6
0.0
030.
11.
0-
1.0
0.2
0.7
0.5
0.3
0.2
1.5
Not
info
rce
Em
ploy
men
t Sta
tus
& A
ge38
80.
70.
80.
10.
10.
10.
60.
10.
50.
10.
30.
20.
10.
10.
5
Cur
rent
ly e
mpl
oyed
&18
-24
year
s25
-44
year
s45
-64
year
sU
nem
ploy
ed &
230
462
254
1.0
0.4
0.4
1.0
0.4
0.4
0.1
0.0
0.1
0.1
0.1
0.1
- 0.0
0.0
0.2
0.1
0.1
0.0
0.0
0.0
0.2
0.1
0.1
0.0
0.0
0.1
0.4
0.2
0.2
0.4
0.1
0.1
0.1
0.1
0.2
0.2
0.0
0.1
0.9
0.4
0.4
18-2
4 ye
ars
25-4
4 ye
ars
45-6
4 ye
ars
40 57 27
3.1
2.1
3.8
3.1
2.1
3.9
- 0.1 -
0.8
0.4 -
- 0.2
0.6
2.2
1.6
1.4
- - -2.
1 1.6
1.1
0.2
0.2
0.9
1.2
0.8
1.7
1.1
0.7
1.2
0.4
0.3
1.2
0.7
0.2 -
3.3
2.0
3.5

TA
BL
E B
-1. S
tand
ard
Err
ors
of E
stim
ates
of
Typ
e of
Hea
lth I
nsur
ance
Cov
erag
e A
mon
g A
dults
Age
d 18
to 6
4, b
y So
ciod
emog
raph
ic C
hara
cter
istic
s, b
y G
ende
r: U
nite
d St
ates
, 198
9
Popu
latio
n(1
,000
s)
With
Priv
ate
(%)
With
Priv
ate
Onl
y(%
)
Priv
ate
insu
ranc
e an
dM
edic
are
and/
or M
edic
aid
Mili
tary
Und
efm
edPl
ans
Not
Onl
yIn
sure
d(%
)(%
)
Med
i-ca
reO
nly
(%)
Med
i-ca
id
Onl
y(%
)
Med
icar
e &
Med
icai
dO
nly
(%)
With
Eith
er(%
)
Med
i-ca
reO
nly
(%)
Med
i- M
edic
are
&ca
idM
edic
aid
Onl
yO
nly
()(%
)
With
Mili
tary
Mili
tary
Onl
y(%
)(%
)
Mili
tary
&Pr
ivat
eO
nly
(%)
Not
in la
bor
forc
e &
18-2
4 ye
ars
116
1.7
1.7
0.1
030.
11.
40.
11.
40.
20.
60.
50.
30.
31.
425
-44
year
s22
21.
11.
10.
102
0.1
0.8
0.1
0.8
0.1
0.4
0.4
0.1
0.1
0.7
45-6
4 ye
ars
196
0.8
0.8
0.3
020.
10.
60.
20.
40.
20.
40.
20.
30.
10.
6Fa
mily
Inc
ome
Und
er $
5,00
022
03.
43.
402
0.3
0.1
2.4
0.3
2.2
0.5
0.5
0.4
0.2
0.3
2.0
$5,0
00-$
6,99
992
1.7
1.7
030.
5-
2.0
0.7
2.0
0.6
0.4
0.3
0.2
0.2
1.6
$7,0
00-$
9,99
910
21.
41.
40.
20.
40.
113
0.3
130.
40.
303
0.2
0.2
1.4
$10,
000-
$14,
999
161
1.1
1.1
0.2
020.
10.
702
0.6
0.2
0.5
0.5
0.1
0.1
1.1
$15,
000-
$19,
999
215
0.9
0.9
0.2
0.1
0.1
0.5
0.1
0.3
0.1
0.3
0.3
0.1
0.1
0.8
$20,
000-
$24,
999
186
0.9
1.0
020.
10.
00.
502
0.4
0.1
0.7
0.5
0.3
0.2
0.8
$23,
000-
$34,
999
341
0.5
0.6
0.1
0.1
0.0
020.
10.
10.
00.
30.
20.
20.
10.
5$3
5,00
0-$4
9,99
931
30.
40.
50.
10.
00.
00.
10.
00.
10.
00.
20.
10.
10.
00.
4$5
0,00
0 or
mor
e39
003
0.4
0.1
0.1
0.0
0.1
0.0
0.1
-0.
20.
10.
20.
10.
3Po
vert
y L
evel
Und
er 0
.50
205
2.9
2.8
0.2
0.4
0.1
230.
32.
20.
30.
40.
30.
30.
22.
10.
50 to
und
er 1
.00
172
1313
0.1
030.
113
0313
0.4
0.3
0.2
0.1
0.2
1.2
1.00
to u
nder
1.2
5In
131.
50.
203
0.1
1.0
030.
90.
30.
70.
60.
20.
21.
31.
25 to
und
er 1
.50
111
1.4
1.4
020.
20.
10.
902
0.7
0.2
0.5
0.5
0.2
0.2
1.4
130
to u
nder
1.7
514
61.
11.
20.
20.
20.
10.
60.
10.
40.
10.
40.
40.
20.
11.
01.
75 to
und
er 2
.00
233
0.7
0.7
0.1
020.
003
0.1
0.2
0.1
0.3
0.2
0.2
0.1
0.7
2.00
and
abo
ve73
803
030.
10.
00.
00.
10.
00.
10.
00.
20.
10.
10.
00.
2Po
vert
y L
evel
and
Age
18-2
4 ye
ars
&U
nder
0.5
013
74.
84.
70.
203
-3.
1-
3.1
0.1
0.9
0.6
0.6
0.5
3.2
0.50
to u
nder
1.0
090
3.1
3.1
-0.
2-
2.1
022.
10.
20.
60.
50.
20.
42.
41.
00 to
und
er 1
.25
542.
82.
8-
0.5
-2.
103
2.1
0.2
1.3
1.3
--
2.6
1.25
to u
nder
1.5
049
2.9
2.9
0.2
0.6
-2.
1-
1.9
0.3
1.2
1.2
-0.
62.
61.
50 to
und
er 1
.75
592.
92.
9-
0.3
0.2
13-
1.2
-1.
6'1
.60.
30.
52.
71.
75 to
und
er 2
.00
831.
91.
90.
20.
2-
0.8
0.1
0.7
0.1
0.6
0.5
0.4
0.4
1.8
2.00
and
abo
ve15
60.
91.
00.
10.
2-
030.
00.
20.
10.
50.
40.
20.
20.
825
-44
year
s &
Und
er 0
.50
103
1.8
1.4
0.1
0.8
0.1
230.
623
0.4
0.2
0.2
0.1
0.3
2.2
0.50
to u
nder
1.0
099
1.4
1.4
0.1
0.5
0.1
1.8
031.
80.
40.
40.
30.
10.
21.
61.
00 to
und
er 1
.25
771.
91.
90.
10.
50.
113
0.4
1.1
0.4
0.8
0.7
0.2
0.2
1.7
1.25
to u
nder
l.50
742.
12.
10.
203
0.1
1.0
020.
80.
20.
50.
40.
10.
21.
91.
50 to
und
er 1
.75
981.
31.
40.
30.
20.
10.
6-
0.5
0.1
0.4
0.4
0.2
0.0
1.2
1.75
to u
nder
2.0
013
40.
70.
80.
10.
20.
003
0.1
0.2
0.1
0.3
0.3
0.1
0.1
0.6
2.00
and
abo
ve42
803
0.4
0.0
0.0
0,0
0.1
0.0
0.1
0.0
0.2
0.1
0.1
0.0
0.3
I

TA
BL
E B
-1. S
tand
ard
Err
ors
of E
stim
ates
of
Typ
e of
Hea
lth I
nsur
ance
Cov
erag
e A
mon
g A
dults
Age
d 18
to 6
4,by
Soc
iode
mog
raph
ic C
hara
cter
istic
s, b
y G
ende
n U
nite
d St
ates
, 198
9
45-6
4 ye
ars
&U
nder
0.5
00.
50 to
und
er 1
.00
1.00
to u
nder
1.2
51.
25 to
und
er 1
.50
1.50
to u
nder
1.7
51.
75 to
und
er 2
.00
2.00
and
abo
ve
Popu
la ti
on(1
,000
s)
With
Priv
a te
(%)
With
Priv
a te
Onl
y(%
)
Priv
ate
insu
ranc
e an
d
Med
i-ca
reO
nly
(%)
Med
i-ca
idO
nly
(%)
Med
icar
e &
Med
icai
dO
nly
(%)
Med
icar
e an
d/or
Med
icai
dM
ilita
ry
With
Eith
er(%
)
Med
i-ca
reO
nly
(%)
Med
i-ca
id
Onl
y(%
)
Med
icar
e &
Med
icai
dO
nly
(%)
With
Mili
tary
Mili
tary
Onl
y(%
)(%
)
Mili
tary
&Pr
iva
te
Onl
y(%
)
Und
efin
edPl
ans
Not
Onl
yIn
sure
d(%
)(%
)
362.
32.
20.
90.
9-
3.6
0.7
3.4
1.2
0.8
0.6
0.4
621.
81.
80.
50.
50.
32.
10.
81.
71.
10.
40.
40.
244
2.6
2.6
0.7
0.8
-1.
81.
01.
40.
80.
80.
60.
446
2.4
2.4
0.7
0.3
0.1
1.7
0.7
1.1
0.7
0.8
0.6
0.5
512.
022
0.8
0.6
0.4
1.5
0.5
0.8
0.5
0.5
0.3
0.4
801.
51.
60.
40.
50.
20.
90.
40.
40.
30.
50.
40.
331
90.
30.
40.
20.
10.
00.
20.
10.
10.
00.
30.
10.
2
0.2
0.3
0.7
0.5
0.2
0.2
0.1
3.4
1.9
2.4
1.9
1.7
1.4
0.3
- St
anda
rd e
rror
is e
xact
ly 0
or
is in
dete
rmin
ate
(too
few
Pri
mar
y Sa
mpl
ing
Uni
ts to
cal
cula
te e
rror
).

TA
BL
E B
-2. S
tand
ard
Err
ors
of E
stim
ates
of
Typ
e of
Hea
lth I
nsur
ance
Cov
erag
e A
mon
g A
dults
Age
d '1
8 to
64,
by
Dis
abili
ty a
nd H
ealth
Sta
tus,
by
Gen
der:
Uni
ted
Stat
es, 1
989
Tot
alH
ealth
Sta
tus
Exc
elle
nt
Ver
y go
odG
ood
Fair
Poor
Unk
now
nM
ajor
Act
ivity
Una
ble
to p
erfo
rm m
ajor
act
ivity
Lim
ited
in a
mou
nt/k
ind
of m
ajor
act
ivity
Lim
ited
in o
ther
act
ivity
Not
lim
ited
in a
ctiv
ityW
ork
Act
ivity
Una
ble
to w
ork
Lim
ited
in a
mou
nt/k
ind
of w
ork
Lim
ited
in o
ther
act
ivity
Not
lim
ited
in a
ctiv
ityB
asic
Lif
e A
ctiv
ities
Nee
ds h
elp
in s
elf
care
(A
DL
)N
eeds
hel
p in
rou
tine
activ
ities
(IA
DL
)N
ot li
mite
d in
bas
ic li
fe a
ciiv
i tie
sW
ork
Act
ivity
& B
asic
Lif
e A
ctiv
ities
Una
ble
to w
ork
&N
eeds
hel
p in
sel
f ca
re (
AD
L)
Nee
ds h
elp
in r
outin
e ac
tiviti
es (
IAD
L)
Not
lim
ited
in b
asic
life
act
iviti
esL
imite
d in
am
ount
/kin
d of
wor
k &
Nee
ds h
elp
in s
elf
care
(A
DL
)N
eeds
hel
p in
rou
tine
activ
ities
(IA
DL
)N
ot li
mite
d in
bas
ic li
fe a
ctiv
ities
Lim
ited
in o
ther
act
ivity
&N
eeds
hel
p in
sel
f ca
re (
AD
L)
Nee
ds h
elp
in r
outin
e ac
tiviti
es (
IAD
L)
Not
lim
ited
in b
asic
life
act
iviti
esN
ot li
mite
d in
act
ivity
&N
eeds
hel
p in
sel
f ca
re (
AD
L)
Nee
ds h
elp
in r
outin
e ac
tiviti
es (
IAD
L)
Not
lim
ited
in b
asic
life
act
iviti
es
Popu
latio
nW
ithPr
ivat
e
With
Priv
ate
Onl
y
Priv
ate
insu
ranc
e an
dM
edic
are
and/
or M
edic
aid
Mili
tary
Und
efin
edPl
ans
Onl
yN
otIn
sure
d
Med
i-ca
reO
nly
Med
i-ca
idO
nly
Med
icar
e &
Med
icai
dO
nly
With
Eith
er
Med
i-ca
reO
nly
Med
i-ca
idO
nly
Med
icar
e &
Med
icai
dO
nly
With
Mili
tary
Mili
tary
Onl
y
Mili
tary
&Pr
ivat
eO
nly
(1,0
00s)
(%)
(%)
(%)
(%)
(%)
(%)
(%)
(%)
(%)
(%)
(%)
(%)
(%)
(%)
2,07
30.
40.
40.
00.
00.
00.
20.
00.
10.
00.
10.
10.
10.
00.
3
1,00
70.
40.
40.
00.
00.
00.
10.
00.
10.
00.
10.
10.
10.
00.
469
30.
50.
50.
00.
00.
002
0.0
0.2
0.0
0.2
0.1
0.1
0.1
0.4
591
0.6
0.6
0.1
0.1
0.0
030.
10.
20.
10.
20.
20.
10.
10.
522
20.
90.
903
0.2
0.1
0.6
0.2
0.5
0.2
0.4
0.3
0.2
0.2
0.8
115
1.4
1.3
0.7
0.3
0.3
1.4
0.7
1.1
0.6
0.8
0.5
0.4
0.2
1.0
484.
14.
1-
0.4
-2.
50.
42.
6-
0.6
0.4
0.5
0.4
4.3
177
1.0
1.1
0.5
0.2
0.2
1.0
0.5
0.8
0.5
0.6
0.4
0.2
0.2
0.7
202
0.9
0.9
0.2
0.2
0.1
0.7
0.2
0.5
0.2
0.4
0.2
0.3
0.1
0.8
156
1.0
1.0
0.2
0.1
0.1
0.7
0.3
0.6
0.2
0.4
0.2
0.3
0.1
0.9
1,87
50.
40.
40.
00.
00.
00.
10.
00.
10.
00.
10.
10.
10.
00.
3
197
1.0
1.0
0.5
0.2
020.
90.
50.
70.
40.
50.
30.
30.
20.
620
10.
90.
90.
20.
20.
10.
60.
20.
50.
10.
40.
20.
30.
10.
813
81.
11.
10.
20.
20.
10.
60.
30.
50.
20.
40.
20.
40.
10.
91,
875
0.4
0.4
0.0
0.0
0.0
0.1
0.0
0.1
0.0
0.1
0.1
0.1
0.0
0.3
392.
92.
42.
01.
01.
03.
01.
62.
21.
61.
30.
51.
00.
72.
087
1.8
1.8
0.9
0.6
0.4
1.7
0.9
1.4
1.0
0.7
0.5
0.3
0.1
1.1
2,04
50.
40.
40.
00.
00.
002
0.0
0.1
0.0
0.1
0.1
0.1
0.0
0.3
372.
92.
32.
21.
21.
03.
11.
72.
21.
81.
40.
51.
10.
42.
170
1.8
1.8
1.1
0.6
0.4
1.9
1.0
1.6
1.3
0.8
0.6
0.3
0.2
1.2
161
1212
0.5
0.2
0.2
1.1
0.5
0.8
0.5
0.6
0.4
0.3
0.3
0.8
1411
.512
.75.
4-
3310
.7-
8.7
3.3
4.4
-4.
45.
06.
131
4.0
421.
11.
01.
03.
923
2.7
1.1
1.5
0.9
1.0
-2.
519
30.
91.
00.
20.
20.
10.
60.
20.
50.
10.
40.
20.
30.
10.
9
1011
.011
.63.
6-
4.9
11.2
6.6
93-
5.2
5.2
-5.
16.
823
6.0
6.0
1.7
4.0
1.2
6.0
3.0
4.5
-1.
41.
4-
1.0
4.4
132
1.0
1.1
0.2
0.2
0.1
0.6
0.2
0.5
0.2
0.4
0.2
0.4
0.1
0.9
1-
--
--
--
--
--
--
-4
201
20.1
--
-22
310
316
519
3-
--
-17
.51,
875
0.4
0.4
0.0
0.0
0.0
0.1
0.0
0.1
0.0
0.1
0.1
0.1
0.0
03

TA
BL
E 8
-2. S
tand
ard
Err
ors
of E
stim
ates
of
Ta
e of
Hea
lth I
nsur
ance
Cov
era,
,e A
mon
Adu
lts A
ed
18 to
64,
bD
isab
ilian
d H
ealth
Sta
tus,
b G
ende
r:U
nite
d St
ates
, 198
9
Popu
latio
nW
ithPr
ivat
e
With
Priv
a te
Onl
y
Priv
ate
insu
ranc
e an
dM
edic
are
and/
or M
edic
aid
Mili
tary
Und
efin
edPl
ans
Onl
yN
otIn
sure
d
Med
i-ca
re
Onl
y
Med
i-ca
id
Onl
y
Med
icar
e &
Med
icai
dO
nly
With
Eith
er
Med
i-ca
re
Onl
y
Med
i-ca
idO
nly
Med
icar
e &
Med
icai
dO
nly
With
Mili
tary
Mili
tary
Onl
y
Mili
tary
&Pr
iva
te
Onl
y(1
,000
s)(%
)(%
)(%
)(%
)(%
)(%
)(%
)(%
)(%
)(%
)(%
)(%
)(%
)(%
)
Wor
k A
ctiv
ity &
Hea
lth S
tatu
sU
nabl
e to
wor
k &
Exc
elle
nt31
3.4
331.
71.
11.
24.
01.
62.
01.
81.
10.
70.
80.
53.
3V
ery
good
393.
13.
10.
90.
80.
62.
71.
52.
01.
41.
40.
70.
91.
52.
4G
ood
841.
91.
90.
70.
40.
51.
90.
912
0.8
0.8
0.6
0.5
0.3
1.5
Fair
981.
51.
30.
90.
403
1.6
0.8
1.3
0.8
1.0
0.7
0.5
0.3
1.1
Poor
981.
51.
40.
90.
50.
31.
40.
91.
30.
71.
00.
60.
30.
21.
1U
nkno
wn
Lim
ited
in a
mou
nt/k
ind
of w
ork
&13
10.9
10.9
--
-14
.24.
915
.6-
5.3
5.3
-5.
39.
8
Exc
elle
nt49
2.9
3.1
0.2
0.5
0.5
1.6
0.4
1.2
0.4
1.3
0.6
1.1
0.7
2.3
Ver
y go
od67
1.7
1.7
0.3
0.2
0.2
0.9
0.4
0.7
0.3
0.8
0.5
0.6
0.2
1.4
Goo
d95
1.4
1.5
0.3
030.
10.
90.
40.
70.
20.
70.
40.
60.
21.
2Fa
ir75
1.8
1.9
0.6
0.4
0.2
1203
0.9
0.3
0.7
0.4
0.6
0.3
1.7
Poor
313.
83.
81.
0-
0.7
2.5
0.9
2.0
0.8
2.1
1.3
1.4
-3.
3U
nkno
wn
Lim
ited
in o
ther
act
ivity
&7
15.8
15.6
-8.
7-
8.7
--
--
--
-15
.8
Exc
elle
nt42
2.0
2.2
0.2
030.
20.
80.
30.
6-
1.3
0.8
0.9
0.3
1.8
Ver
y go
od71
1.3
1.6
030.
60.
11.
00.
40.
60.
10.
80.
40.
80.
11.
3G
ood
751.
61.
702
0.2
0.1
0.9
0.4
0.8
0.2
0.6
0.3
0.5
0.2
1.4
Fair
442.
93.
00.
8-
-1.
90.
51.
40.
90.
90.
6G
.60.
52.
7Po
or22
5.3
4.7
1.2
221.
152
2.9
4.4
2.4
1.9
1.2
1.5
-4.
0U
nkno
wn
Not
lim
ited
in a
ctiv
ity &
514
.714
.7-
--
--
--
--
-14
.7
Exc
elle
nt97
90.
40.
40.
00.
00.
00.
10.
00.
10.
00.
10.
10.
10.
00.
4V
ery
good
e;oo
d64
30.
50.
60.
00.
00.
00.
20.
00.
20.
00.
20.
10.
10.
10.
554
40.
60.
60.
10.
10.
00.
30.
00.
20.
00.
20.
20.
10.
10.
5Fa
ir13
61.
31.
30.
20.
10.
00.
60.
10.
60.
20.
50.
30.
30.
31.
1Po
or39
4.1
4.1
0.9
0.6
0.4
3.3
0.5
2.7
0.5
1.4
0.8
1.0
-4.
1U
nkno
wn
424.
64.
7-
--
1.9
-1.
9-
0.5
-0.
5-
4.8
All
Men
I le
alth
Sta
tus
1,09
70.
40.
40.
10.
00.
00.
10.
00.
10.
00.
10.
10.
10.
00.
3
Exc
elle
nt
Ver
y go
odG
ood
Fair
l'oor
Unk
now
nM
ajor
Act
ivity
579
364
309
114 69 24
0.5
0.6
0.7
1.2
2.1
5.4
0.5
0.6
0.7
1.3
1.8
5.5
0.0
0.1
0.1
0.5
1.1 -
0.0
0.0
0.0
0.1
0.5 -
0.0
0.0
0.1
0.1
0.3 -
0.1
0.2
0.3
0.9
1.8
3.1
0.0
0.1
0.1
0.4
1.1 -
0.1
0.1
0.2
0.6
1.5
3.1
0.0
0.0
0.1
0.5
0.7 -
0.1
0.1
0.2
0.1
0.3
0.2
0.7
0.5
1.4
0.8
1.4
1.0
0.1
0.1
0.2
0.4
0.6
1.0
0.1
0.1
0.1
0.3
0.3
1.0
0.4
0.6
0.7
1.0
1.4
6.0
Una
ble
to p
erfo
rm m
ajor
act
ivity
112
1.3
1.3
0.8
0.3
031.
20.
70.
90.
70.
80.
60.
30.
40.
9L
imite
d in
am
ount
/kin
d of
maj
or a
ctiv
ity12
31.
313
0.3
0.2
0.1
0.8
0.3
0.6
0.2
0.7
0.3
0.6
0.2
1.2
Lim
ited
in o
ther
act
ivity
811.
41.
50.
20.
00.
10.
70.
40.
60.
20
70.
30.
60.
11.
2N
ot li
mite
d in
act
ivity
1,00
40
40.
40.
00.
00.
00.
10.
00.
10
00.
10.
10.
10.
00.
4
1:44

TA
BL
E B
-2. S
tand
ard
Err
ors
of E
stim
ates
of
Typ
e of
Hea
lth I
nsur
ance
Cov
erag
e A
mon
g A
dults
Age
d 18
to 6
4, b
y D
isab
ility
and
Hea
lth S
tatu
s, b
y G
ende
r:U
nite
d St
ates
, 198
9
Wor
k A
ctiv
ityU
nabl
e to
wor
kL
imite
d in
am
ount
/kin
d of
wor
kL
imite
d in
oth
er a
ctiv
ityN
ot li
mite
d in
act
ivity
Bas
ic L
ife
Act
iviti
esN
eeds
hel
p in
sel
f ca
re (
AD
L)
Nee
ds h
elp
in r
outin
e ac
tiviti
es (
IAD
L)
Not
lim
ited
in b
asic
life
act
iviti
esW
ork
Act
ivity
& B
asic
Lif
e A
ctiv
ities
Una
ble
to w
ork
&N
eeds
hel
p in
sel
f ca
re (
AD
L)
Nee
ds h
elp
in r
outin
e ac
tiviti
es (
IAD
L)
Not
lim
ited
in b
asic
life
act
iviti
esL
imite
d in
am
ount
/kin
d of
wor
k &
Nee
ds h
elp
in s
elf
care
(A
DL
)N
eeds
hel
p in
rou
tine
activ
ities
(IA
DL
)N
ot li
mite
d in
bas
ic li
fe a
ctiv
ities
Lim
ited
in o
ther
act
ivity
&N
eeds
hel
p in
sel
f ca
re (
AD
L)
Nee
ds h
elp
in r
outin
e ac
tiviti
es (
IAD
L)
Not
lim
ited
in b
asic
life
act
iviti
esN
ot li
mite
d in
act
ivity
&N
eeds
hel
p in
sel
f ca
re (
AD
L)
Nee
ds h
elp
in r
outin
e ac
tiviti
es (
IAD
L)
Not
lim
ited
in b
asic
life
act
iviti
esW
ork
Act
ivity
& H
ealth
Sta
tus
Una
ble
to w
ork
&E
xcel
lent
Ver
y go
odG
ood
Fair
Poor
Unk
now
nL
imite
d in
am
ount
/kin
d of
wor
k &
Exc
elle
nt
Ver
y go
odG
ood
Fair
Poor
Unk
now
n
Popu
la ti
on(1
,000
s)
With
Priv
ate
(%)
With
Priv
ate
Onl
y(%
)
Priv
ate
insu
ranc
e an
dM
edic
are
and/
or M
edic
aid
Mili
tary
Und
efin
edPl
ans
Onl
y(%
)
Not
Insu
red
(%)
Med
i-ca
re
Onl
y(%
)
Med
i-ca
idO
nly
(%)
Med
icar
e &
Med
icai
dO
nly
(%)
With
Eith
er(%
)
Med
i-ca
re
Onl
y(%
)
Med
i-ca
idO
nly
(%)
Med
icar
e &
Med
icai
dO
nly
(%)
With
Mili
tary
Mili
tary
Onl
y(%
)(%
)
Mili
tary
&Pr
ivat
eO
nly
(%)
116
121 83
1,00
4
28 491,
082 28 43 96 8 17 117 5 9 82 1 1
1,00
4 23 30 55 59 61 8 33 44 72 44 21
4
1.3
13 1.3
0.4
4.4
2.6
0.4
4.8
2.9
1.6
18.1 7.7
1.3
22.4
12.4 13 - - 0.4
4.6
4.5
2.7
2.2
2.1
11.8
3.7
2.4
2.4
3.0
5.5
22.9
13 13 1.4
0.4
3.4
2.5
0.4
3.7
2.9
1.4
18.0
7.6 13 20.6
143
1.4 - - 0.4
5.1
4.7
2.9
1.9
1.7
11.8
4.1
2.4
23 3.2
5.9
22.9
0.8
03 02 0.0
3.2
1.7
0.0
3.5
1.8
0.8
8.0
2.9
03 13.5
8.0
0.2 - - 0.0
23 1.2
13 1.5
1.4 - 0.4
0.6
0.4
1.1
1.8 -
03 0.2
0.2
0.0
1.7
0.7
0.0
1.8
0.9
0.2 - 1.8
0.2 - - 02 - - 0.0
1.8
1.2
0.6
03 0.5 - 0.7
03 0.2
0.3 - -
0.3
0.1
0.1
0.0
1.3
0.5
0.0
1.1
0.6
03 8.5
1.7
0.1
17.9 - 0.1 - - 0.0
1.4 - 0.8
0.4
0.4 - 0.8
03 - 0.3
1.0 -
1.2
0.8
0.6
0.1
4.1
2.7
0.1
4.4
3.3 13
15.1 7.9
0.8
22.8
13.9 0.5 - - 0.1 4.9
4.4
2.7
2.1
2.0
15.0
1.9
13 1.4
1.7
3.6 -
0.7
03 03 0.0
2.6
1.9
0.0
2.8
1.7
0.8 - 6.4
0.2 -
11.6
0.3 - - 0.0
2.6
2.1
1.6
1.2
1.4 - 0.6
0.7
0.7
0.5
1.2 -
0.8
0.6
0.4
0.1
2-5
2.1
0.1
2.3
2.3
1.0
10.9 5.1
0.6
18.2 - 0.4 - - 0.1
1.7
3.1
1.6
1.6
1.6
15.0 13 0.8
1.1
0.9
2.6 -
0.7
0.2
0.1
0.0
2.6
1.9
0.0
2.9
2.3
0.7
8.4
2.5
0.2 - - 0.2 - - 0.0
2.7
2.1
1.3
1.4
1.0 - - 0.5
0.3
0.4
1.1 -
0.8
0.6
0.7
0.3
0.8
0.3
0.1
0.1
2.2
1.0
1.6
LI
0.1
0.1
2.3
0.9
1.8
1.3
1.0
0.7
--
3.0
-0.
70.
3
18.8
18.8
6.0
6.0
0.8
0.3
--
--
0.1
0.1
1.9
1.2
2.3
0.9
1.3
Li
1.7
1.4
1.7
1.0
8.4
8.4
2.2
1.0
1.3
0.6
1.2
0.6
1.4
0.7
3.2
2.2
--
0.3
0.6
0.7
0.1
1.5
0.5
0.1
1.7
0.4
0.4 - 2.3
0.6 - - 0.7 - - 0.1
1.4
1.6
0.7
0.7
0.5 - 1.9
1.1
1.0
1.3
2.4 -
0.4
0.2
0.2
0.0
1.1
0.1
0.0
0.9
0.1
0.5
11.1 - 0.2 - - 0.2 - - 0.0
0.9
2.9
0.6
0.5
0.4
8.4
1.1 - 0.2
0.6 - -
0.9
1.2
1.2
0.4
2.3
1.7
0.4
2.5
1.8
1.1
8.5
4.9
1.2 - 6.8
1.2 - 0.4
3.8
3.6
2.1
1.5
1.6
14.4
3.2
2.2
1.9
2.8
4.0
22.9
t

TA
BL
E B
-2. S
tand
ard
Err
ors
of E
stim
ates
of
Typ
e of
Hea
lth I
nsur
ance
Cov
erag
e A
mon
g A
dults
Age
d 18
to 6
4, b
y D
isab
ility
and
Hea
lth S
tatu
s, b
y G
ende
r: U
nite
d St
ates
, 198
9
Popu
latio
nW
ithPr
iva
te
With
Priv
a te
Onl
y
Priv
ate
insu
ranc
e an
dM
edic
are
and/
or M
edic
aid
Mili
tary
Und
erm
edPl
ans
Onl
yN
otIn
sure
d
Med
i-ca
reO
nly
Med
i-ca
idO
nly
Med
icar
e &
Med
icai
dO
nly
With
Eith
er
Med
i-ca
reO
nly
Med
i-ca
idO
nly
Med
icar
e &
Med
icai
dO
nly
With
Mili
tary
Mili
tary
Onl
y
Mili
tary
&Pr
iva
te
Onl
y(1
,000
s)(%
)(%
)(%
)(%
)(%
)(%
)(%
)(%
)(%
)(%
)(%
)(%
)(%
)(%
)
Lim
ited
in o
ther
act
ivity
&E
xcel
lent
362.
42.
7-
-0.
40.
70.
5-
-1.
90.
91.
5-
2.3
Ver
y go
od47
1.9
2.4
0.5
--
0.8
0.5
0.2
-1.
30.
51.
2-
1.8
Goo
d45
2.6
2.7
--
031.
30.
61.
10.
31.
20.
41.
10.
42.
4Fa
ir24
3.8
4.1
0.9
--
1.6
-0.
71.
02.
11.
31.
50.
94.
2Po
or13
8.5
9.3
-7.
5-
8.5
-5.
1-
5.8
4.1
4.2
-6.
9U
nkno
wn
425
.625
.6-
--
--
--
--
--
25.6
Not
lim
ited
in a
ctiv
ity &
Exc
elle
nt56
60.
50.
50.
00.
0-
0.1
0.0
0.1
0.0
0.1
0.1
0.1
0.0
0.4
Ver
y go
od34
10.
60.
70.
10.
00.
00.
10.
00.
10.
00.
20.
10.
10.
10.
6G
ood
286
0.8
0.8
0.1
0.0
0.0
0.2
0.0
0.2
0.0
0.2
0.2
0.2
0.1
0.7
Fair
731.
91.
90.
10.
10.
10.
80.
10.
70.
40.
80.
50.
60.
51.
7Po
or23
5.6
5.5
1.6
0.6
-3.
6-
3.4
-2.
51.
22.
1-
5.4
Unk
now
n22
5.9
6.1
--
-2.
2-
2.2
-1.
2-
1.2
-6.
4
All
Wom
en1,
037
0.4
0.4
0.0
0.0
0.0
0.2
0.0
0.2
0.0
0.2
0.1
0.1
0.0
0.3
Hea
lth S
tatu
sE
xcel
lent
483
0.5
0.5
0.0
0.1
0.0
020.
00.
20.
00.
20.
20.
10.
10.
4V
ery
good
378
0.5
0.5
0.1
0.1
0.0
0.3
0.1
0.2
0.0
0.2
0.2
0.1
0.1
0.4
Goo
d33
20.
60.
60.
10.
10.
00.
40.
10.
30.
10.
30.
20.
10.
10.
5Fa
ir14
11.
11.
10.
403
0.1
0.8
0.2
0.7
0.3
0.3
0.2
0.2
0.2
1.0
Poor
751.
81
80.
80.
60.
41.
80.
81.
40.
80.
70.
40.
50.
21.
6U
nkno
wn
3245
4.5
-0.
7-
2.6
0.8
2.6
--
--
-4.
1M
ajor
Act
ivity
Una
ble
to p
erfo
rm m
ajor
act
ivity
106
1.4
1.4
0.7
0.4
0.4
1.4
0.6
1.2
0.7
0.6
0.3
0.3
0.2
1.2
Lim
ited
in a
mou
nt/k
ind
of m
ajor
act
ivity
117
1.2
1.2
030.
40.
11.
00.
30.
80.
20.
40.
30.
30.
21.
0L
imite
d in
oth
er a
ctiv
ity10
71.
41.
40.
30.
20.
11.
003
0.9
0.3
0.4
0.3
0.3
0.1
1.1
Not
lim
ited
in a
ctiv
ity93
00.
40.
40.
00.
00.
002
0.0
0.2
0.0
0.2
0.1
0.1
0.0
0.3
Wor
k A
ctiv
ityU
nabl
e to
wor
k12
913
130.
60.
403
130.
51.
00.
50.
60.
30.
40.
11.
0L
imite
d in
am
ount
/kin
d of
wor
k11
812
1.3
0.2
030.
10.
70.
20.
70.
20.
40.
30.
30.
21.
0L
imite
d in
oth
er a
ctiv
ity89
1.5
1.4
0.3
0.4
0.1
1.0
0.4
0.8
0.4
0.4
0.3
0.3
0.2
1.1
Not
lim
ited
in a
ctiv
ity93
00.
40.
40.
00.
00.
002
0.0
0.2
0.0
0.2
0.1
0.1
0.0
0.3
Bas
ic L
ife
Act
iviti
esN
eeds
hel
p in
sel
f ca
re (
AD
L)
343.
83.
32.
41.
413
3.9
1.8
3.2
1.5
1.6
0.5
1.3
0.6
3.0
Nee
ds h
elp
in r
outin
e ac
tiviti
es (
IAD
L)
6322
2.2
1.0
0.9
0.5
2.1
0.9
1.6
1.0
0.6
0.4
0.3
0.2
1.5
Not
lim
ited
in b
asic
life
act
iviti
es1,
021
0.4
0.4
0.0
0.0
0.0
020.
002
0.0
0.2
0.1
0.1
0.0
0.3
Wor
k A
ctiv
ity &
Bas
ic L
ife
Act
iviti
esU
nabl
e to
wor
k &
Nee
ds h
elp
in s
elf
care
(A
DL
)30
4.1
3.1
2.8
1.7
1.6
4.2
1.8
3.5
1.7
1.7
0.6
1.4
0.3
3.3
Nee
ds h
elp
in r
outin
e ac
tiviti
es O
AD
L)
512.
423
1.4
0.8
0.6
251.
22.
11.
30.
70.
40.
40.
21.
7N
ot li
mite
d in
bas
ic li
fe a
ctiv
ities
103
1.6
1.7
0.6
0.4
0.2
150.
61.
20.
60.
70.
40.
40.
21.
2L
imite
d in
am
ount
/kin
d of
wor
k &
Nee
ds h
elp
in s
elf
care
(A
DL
)12
15.4
17.3
7.2
--
14.7
-13
3-
7.1
-7.
1-
8.5
Nee
ds h
elp
in r
outin
e ac
tiviti
es (
IAD
L)
264.
14.
20.
81.
31.
23.
60.
93.
01.
11.
61.
40.
9-
3.2
Not
lim
ited
in b
asic
life
act
iviti
es11
11.
313
0.2
030.
10.
80.
20.
70.
20.
40.
30.
30
21.
1L
imite
d in
oth
er a
ctiv
ity &
1'

TA
BL
E B
-2.
Stan
dard
Err
ors
of E
stim
ates
of
Typ
e of
Hea
lth I
nsur
ance
Cov
erag
e A
mon
g A
dults
Age
d 18
to 6
4, b
yD
isab
ility
and
Hea
lth S
tatu
s, b
y C
ende
n U
nite
d St
ates
, 198
9
Nee
ds h
elp
in s
elf
care
(A
DL
)N
eeds
hel
p in
rou
tine
activ
ities
(IA
DL
)N
ot li
mite
d in
bas
ic li
fe a
ctiv
ities
Not
lim
ited
in a
ctiv
ity &
Nee
ds h
elp
in s
elf
care
(A
DL
)N
eeds
hel
p in
rou
tine
activ
ities
(IA
DL
)N
ot li
mite
d in
bas
ic li
fe a
ctiv
ities
Wor
k A
ctiv
ity &
Hea
lth S
tatu
sU
nabl
e to
wor
k &
Exc
elle
ntV
ery
good
Goo
dFa
irPo
orU
nkno
wn
Lim
ited
in a
mou
nt/k
ind
of w
ork
&E
xcel
lent
Ver
y go
odG
ood
Fair
Poor
Unk
now
nL
imite
d in
oth
er a
ctiv
ity &
Exc
elle
ntV
ery
good
Goo
dFa
irPo
orU
nkno
wn
Not
lim
ited
in a
ctiv
ity &
Exc
elle
nt
Ver
y go
odG
ood
Fair
Poor
Unk
now
n
Popu
latio
n(1
,000
s)
With
Priv
a te
(%)
With
Priv
ate
Onl
y(%
)
Priv
ate
insu
ranc
e an
dM
edi-
Med
i- M
edic
are
&ca
reca
idM
edic
aid
Onl
yO
nly
Onl
y(%
)(%
)(%
)
Med
icar
e an
d/or
Med
icai
dM
ilita
ryM
edi-
Med
i- M
edic
are
&W
ithca
reca
idM
edic
aid
Eith
erO
nly
Onl
yO
nly
(%)
(%)
(%)
8 22 85
493
0 20 28 53 63 62 7 32 41 63 51 22 5 27 45 53 34 18
6
469
352
306 92 26 29
14.1 6.7
1.4
22.4 0.4
5.4
4.1
2.2
2.0
2.1
20.7 3.8
2.4
1.8
2.2
5.6
20.8 3.5
2.2
2.2
33 5.7
20.8 03 0.6
0.7
1 4
5.0
5.1
14.1 6.6 13 22.4 0.4
5.6
3.7
23 1.9
1.9
20.7 3.8
2.5
1.9
23 5.5
213
3.6
23 2.1
3.4
53 20.8 0.5
0.6
0.7
1.5
5.1
5.1
1.4
03 0.0
23 1.4
0.8
1.0
Ll
03 0.4
0.6
1.0
0.5
0.4
0.4
1.1
1.6
0.0
0.1
0.1
0.4
0.8
4.7
0.2 - _- 0.0
0.6
1.1
0.7
0.8
0.8
0.8
03 0.5
0.6
15.1 0.7
1.3
0.3
0.4
1.5
0.1 _- - 0.0
1.9
1.1
0.5
0.4
0.5
0.6
0.2
0.1 03 1.1
1.4
0.1
0.0
0.1
0.1
0.2
1.1
0.9
13.3 6.5
0.9
8.6
2.8
03
--
24.5
11.9
020.
0
53 3.1 23 2.1
2.2
18.0 2.6
12 1.1
1.6
33 15.1 1.7
2.0
1.4
2.6
5.9
0.2
03 0.4
0.9
4.4
2.6
1.0
2.1
0.8
0.8
0.9
11.1 0.7
03 03 03 1.5
0.4
0.4
0.8
3.9
0.0
0.0
0.1
0.1
1.1
11.8 5.2
0.8
18.6 02 43 23 1.6
1.8
1.8
21.4 2.1
1.0
0.9
1.4
2.7 13 13 1.3
1.9
5.2
0.2
0.2
0.4
0.8
3.7
2.6
Mili
tary
& U
ndef
ined
With
Mili
tary
Priv
ate
Plan
sN
otM
ilita
ryO
nly
Onl
yO
nly
Insu
red
(%)
(%)
(%)
1.3
1.3
0.4
0.5
0.3
21.9 0.0
0.2
0.1
1.9
-1.
71.
41.
1
1.2
0.9
0.6
0.9
0.7
0.3
1.1
0.9
0.5
0.9
1.0
0.5
0.4
1.1
0.9
0.3
0.7
0.5
0.5
0.3
0.5
1.2
2.1
1.4
1.7
1.4
0.3
0.9
0.6
0.4
0.5
0.5
1.2
0.8
0.6
3.2
1.3
0.0
0.2
0.2
0.0
0.2
0.2
0.0
0.3
0.2
0.2
0.5
0.4
0.9
0.9
0.9
(%)
(%)
(%)
0.3
0.1
0.5
0.7
0.6
0.5
0.9
0.5
0.5
0.4
1.6
0.9
0.6
G.2
0.6
1.3
0.1
0.1
0.1
0.2
6.7
1.2
0.2
0.0
0.3
0.2
0.3
0.3
0.3
0.7
0.3
0.2
0.5
0.1
0.1
0.1
0.2
8.9
5.1
1.2
14.6
0.3
5.7
3.2
2.0
1.5
1.9
10.6 3.0
1.8
1.6
1.8
5.5
20.8
2.9
1.9
1.7
2.9
4.4
20.8
-- S
tand
ard
erro
r is
exa
ctly
0 (
is in
dcto
m in
a te
(to
o fe
w P
rim
ary
Sam
plin
g U
nits
to c
alcu
late
err
or).
0.4
0.4
0.5
1.3
4.9
4.6
N.)

TA
BL
E B
-3. S
tand
ard
Err
ors
of E
stim
ates
of
Typ
e of
Hea
lth I
nsur
ance
Cov
erag
e A
mon
g C
hild
ren
Age
d 0
to 1
7, b
y So
ciod
emog
raph
ic S
tatu
s, b
y G
ende
r: U
n ite
d St
ates
, 198
9
Popu
latio
n(1
,000
s)
Tot
al1,
115
Age 0-
4 ye
ars
400
5-17
yea
rs80
7R
ace W
hite
1,03
3B
lack
431
Oth
er22
6E
thni
city
His
pani
c56
5
Non
-His
pani
c93
5Fa
mily
Inc
ome
Und
er $
5,00
021
1$5
,000
46,9
9916
9$7
,000
-$9,
999
160
510,
000-
514,
999
224
515,
000-
519,
999
228
520,
000-
524,
999
199
525,
000-
S34,
999
367
535,
000-
549,
999
347
$50,
000
or m
ore
390
Pove
rty
Lev
elU
nder
0.5
033
90.
50 to
und
er 1
.00
303
1.00
to u
nder
1.2
521
91.
25 to
und
er 1
.50
208
1.50
to u
nder
1.7
524
81.
75 to
und
er 2
.00
277
2.00
and
abo
ve50
4A
ge a
nd P
over
ty L
evel
0-4
year
s an
dU
nder
0.5
014
40.
50 to
und
er 1
.00
115
1.00
to u
nder
1.2
585
1.25
to u
nder
1.5
073
1.50
to u
nder
1.7
592
1.75
to u
nder
2.0
010
32.
00 a
nd a
bove
191
5-17
yea
rs a
ndU
nder
0.5
021
20.
50 to
und
er 1
.00
222
1.00
to u
nder
1.2
516
51.
25 to
und
er 1
.50
167
1.50
to u
nder
1 7
519
91.
75 to
und
o- 2
00
213
2 01
) an
d ab
ove
380
With
Priv
ate
insu
ranc
e an
dM
edic
are
and/
or M
edic
aid
Mili
tary
Med
i-M
edi-
Med
icar
e &
Med
i-M
edi-
Med
icar
e &
Mili
tary
&W
ithPr
ivat
eca
reca
idM
edic
aid
With
care
caid
Med
icai
dW
ithM
ilita
ryPr
ivat
ePr
ivat
eO
nly
Onl
yO
nly
Onl
yE
ither
Onl
yO
nly
Onl
yM
ilita
ryO
nly
Onl
y'
%%
%%
%%
%%
%%
%%
0.8
0.8
0.0
0.1
0.0
0.5
0.0
0.5
0.0
0.2
0.2
1.0
1.0
0.0
0.1
0.0
0.7
0.1
0.6
0.0
0.4
030.
80.
80.
00.
10.
00.
50.
00.
50.
00.
202
0.9
0.9
0.0
0.1
0.0
0.4
0.0
0.4
0.0
0302
1313
0.0
0.4
0.0
1.3
0.1
1.3
0.1
0.3
0.2
3.1
3.1
0303
-4.
0-
4.0
030.
80.
5
2.7
230.
00.
30.
013
0.1
130.
10.
40.
40.
60.
70.
00.
10.
003
0.0
0.5
0.0
0.2
0.2
1.7
13-
0.7
0.1
3.1
0.1
3.0
0.4
030.
22.
113
-1.
5-
3.6
-33
0.2
0.9
031.
613
-1.
0-
2.2
022.
2-
0.4
0.4
1315
-0.
3-
1.6
0.0
1.5
0.1
0.7
0.6
1.4
,- ..
1.4
1.7
0.1
0.0
03 030.
0 -0.
91.
00.
1
0.2
0.9
0.8
- -0.
60.
90.
50.
90.
90.
90.
00.
10.
00.
30.
103
-0.
40.
40.
70.
70.
00.
1-
030.
10.
30.
00.
302
0.5
030.
10.
1-
020.
00.
1-
0.2
0.1
1.6
1.1
-0.
90.
13.
20.
23.
00.
20.
202
131.
2-
0.4
-2.
10.
02.
20.
00.
303
2.0
2.1
0.1
0.5
-1.
30.
11.
10.
11.
11.
01.
91.
90.
103
-0.
9-
0.9
0.1
0.7
0.7
1.1
1.1
0.1
0.2
0.0
0.6
0.1
0.6
0.0
0.5
0.5
0.7
0.7
0.0
0.1
-02
0.1
0.2
-03
030.
40.
40.
00.
1-
0.1
0.0
0.1
-0.
202
1.4
1.5
-0.
6-
3.9
0.1
3.8
020.
50.
51.
71.
6-
05-
2.8
0.1
2.8
0.0
0.5
0.4
2.6
2.8
030.
7-
2.2
0.2
1.9
-1.
91.
42.
42.
403
0.5
-1.
6-
1.5
-1.
11.
11.
81.
80.
003
0.1
0.9
0.4
0.7
-0.
80.
713
130.
103
-0.
60.
10.
5-
0.6
0.5
0.7
0.8
-0.
2-
030.
00.
2-
0.5
0.4
2.1
1.5
-1.
10.
13.
103
3.0
030.
20.
11.
51.
4-
0.5
-23
0.0
2.1
0.0
0.5
0323
2.2
0.1
0.5
-1.
20.
11.
10.
10.
90.
92.
02.
10.
003
-0.
9-
0.8
0.1
0.7
0.7
131.
20.
10.
20.
00
70.
10.
70.
00.
50.
50.
60.
60.
10
1-
0 2
0.1
0.2
-03
0.3
0.4
0 4
0 0
0 1
-0.
10.
00.
1-
0.3
0.2
0.1
0.1
0.1
0.1
0.2
0.5
0.2
0.1 - 1.0 - 0.1
0.1
0.1
0.1
02 02 - 03 0.2
0.1
0.1
0.1
0.1 - 0.0
0.6 - 0.1
0.2
0.1 - 0.4 - 0.1
0.1
0.1
0.2
Und
efin
edPl
ans
Onl
y%
Not
Insu
red
%
0.1
0.6
0.1
0.8
0.1
0.6
0.1
0.7
0.2
1.0
0.6
2.1
0.1
2.7
0.0
0.4
0.3
330.
42.
903
1.9
0.2
1.7
0313
031.
20.
10.
70.
10.
50.
00.
4
0.3
3.1
0.2
2.0
031.
60.
41.
60.
10.
90.
20.
50.
103
0.6
3.1
0.4
2.(
0.7
2.5
0323
0.2
1.5
0.2
1.0
0.1
0.5
0.2
3.5
0.2
2.1
0.2
1.9
0.5
1.7
0.2
0.9
0.2
0.5
0.1
0.3
N.)

TA
BL
E B
-3. S
tand
ard
Err
ors
of E
stim
ates
of
Typ
e of
Hea
lth I
nsur
ance
Cov
erag
e A
mon
g C
hild
ren
Age
d 0
to 1
7, b
y So
ciod
emog
raph
ic S
tatu
s, b
y G
ende
r: U
nite
d St
ates
,198
9
Popu
latio
n(1
,000
s)
With
Priv
ate
With
Priv
ate
Onl
y
Priv
ate
insu
ranc
e an
dM
edic
are
and/
or M
edic
aid
Mili
tary
Und
efin
edPl
ans
Onl
yN
otIn
sure
d
Med
i-ca
reO
nly
Med
i-ca
idO
nly
Med
icar
e &
Med
icai
dO
nly
With
Eith
er
Med
i-ca
reO
nly
Med
i-ca
idO
nly
Med
icar
e &
Med
icai
dO
nly
With
Mili
tary
Mili
tary
Onl
y
Mili
tary
&Pr
ivat
eO
nly
All
Boy
s58
60.
80.
80.
00.
10.
00.
50.
00.
50.
003
020.
10.
105
Age 0-
4 ye
ars
228
1.1
1.2
0.0
020.
00.
80.
00.
70.
00.
403
0.1
0.2
0.9
5-17
yea
rs43
90.
80.
80.
00.
10.
005
0.0
0.5
0.0
0.3
0.3
0.1
0.1
0.5
Rac
e Whi
te53
60.
80.
80.
00.
10.
00.
40.
00.
40.
00.
30.
30.
10.
10.
6B
lack
212
1.5
1.4
0.0
0.5
0.1
1.5
0.1
1.5
0.1
0.4
0.3
030.
31.
1
Oth
er10
83.
53.
603
0.3
-43
-43
031.
00.
70.
61.
12.
8E
thni
city
His
pani
c24
42.
62.
6-
0.3
0.0
1.2
0.1
130.
10.
50.
40.
202
23N
on-H
ispa
nic
485
0.7
0.7
0.0
0.1
0.0
0.5
0.0
0.5
0.0
0.3
0.2
0.1
0.0
0.4
Fam
ily I
ncom
eU
nder
$5,
000
120
2.0
1.7
-0.
80.
232
0.1
3.1
0.4
0.1
0.1
-0.
533
$5,0
00-$
6,99
975
2.5
1.8
-1.
4-
3.7
-3.
503
1.3
0.4
150.
731
57,0
00-$
9,99
992
1.9
1.6
-1.
2-
2.5
0.1
2.4
-05
0.5
-0.
52.
351
0,00
0-51
4,99
911
51.
71.
7-
0.4
-1.
8-
1.7
0.2
0.8
0.7
0.1
0.2
1.9
$15,
000-
$19,
999
139
1.7
1.6
0.1
030.
11.
10.
11.
1-
050.
50.
10.
41.
5$2
0,00
0-$2
4,99
911
41.
81.
9-
0.4
-0.
90.
10.
9-
1.1
1.1
0.2
0313
525,
000-
534,
999
202
1.1
1.2
0.0
0.1
-0.
40.
00.
4-
030.
402
0.2
0.9
$35,
000-
$49,
999
195
0.8
0.9
0.0
0.2
-0.
40.
003
-0.
403
0202
0.7
$50,
000
or m
ore
220
0.6
0.6
0.0
0.2
-02
0.0
0.2
-03
0.2
020.
005
Pove
rty
Lev
elU
nder
0.5
016
91.
71.
4-
0.8
0.2
3.0
0.1
2.9
030.
10.
1-
0.5
3.0
0.50
to u
nder
1.0
015
21.
61.
5-
05-
2.1
-2.
00.
10.
50.
40.
40.
22.
11.
00 to
und
er 1
.25
124
2.4
2.5
0.1
0.6
-15
0.1
1.4
0.2
1.1
0.9
0203
2.0
1.23
to u
nder
1.5
011
92.
12.
10.
10.
4-
1.1
-1.
10.
10.
70.
7-
0.4
1.8
1.50
to u
nthr
1.7
514
713
130.
103
0.0
0.8
0.1
0.7
-0.
60.
60.
10.
11.
01.
75 to
und
er 2
.00
155
1.0
1.0
0.0
0.2
-03
0.0
02-
0.4
0.4
0203
0.8
2.00
and
abo
ve26
60.
50.
50.
00.
1-
020.
00.
1-
0303
020.
10.
4A
ge a
nd P
over
ty L
evel
0-4
year
s an
dU
nder
0.5
077
1.6
1.6
-0.
64.
102
4.0
0.4
0.2
0.2
-1.
03.
70.
50 to
und
er 1
.00
682.
22.
1-
0.7
-3.
1-
3.1
0.1
050.
5-
0.5
3.0
1.00
to u
nder
1.2
549
3.3
3.5
030.
9-
2.8
0.4
2.7
-22
1.7
0.6
1.1
3.4
1.25
to u
nder
1.5
050
2.9
3.0
030.
8-
2.0
-1.
8-
1.4
1.4
--
2.8
1.50
to u
nder
1.7
560
2.4
2.5
0.1
0.5
021.
10.
21.
0-
1.2
1.2
020.
22.
11.
75 to
und
er 2
.00
711.
81.
90.
10.
4-
0.8
0.1
0.6
-0.
80.
703
0.4
1.4
2.00
and
abo
ve11
61.
01.
1-
03-
0.4
-02
-0.
60.
60.
10.
20.
85-
17 y
ears
and
Und
er 0
.50
105
221.
8-
1.1
033.
102
3.1
02.
0.1
0.1
-0.
43.
20.
50 to
und
er 1
.00
117
1.8
1.7
-0.
72.
1-
2.0
0.1
0.7
0.5
0.6
0.2
2.3
1.00
to u
nder
1.2
596
2.6
2.7
-0.
7-
1.4
-13
0.2
0.8
0.8
-0.
223
1.25
to u
nder
1.5
095
2.2
2.2
-0.
512
-1.
10.
20.
60.
6-
0.6
1.9
1.50
to u
ndo.
1.7
512
113
1.5
0.1
03-
0.9
0.1
0.8
-0.
80.
80.
20.
21.
1
1.75
to u
nder
2.0
011
90.
90.
90.
00.
2-
0.3
-02
-0.
40.
30.
20.
30.
870
0 an
d ab
ove
210
0.5
0.6
0.0
0.1
-02
0.0
0.1
-0.
30.
30.
20.
10.
4

TA
BL
E B
-3. S
tand
ard
Err
ors
of E
stim
ates
of
Typ
e of
Hea
lth I
nsur
ance
Cov
erag
eA
mon
g C
hild
ren
Age
d 0
to 1
7, b
y So
ciod
emog
raph
ic S
tatu
s, b
y G
ende
r U
nite
d St
ates
, 198
9
Popu
latio
n(1
,000
s)
With
Priv
ate
With
Priv
ate
Onl
y
Priv
ate
insu
ranc
e an
dM
edic
are
and/
or M
edic
aid
Mili
tary
Und
efin
edPl
ans
Onl
yN
otIn
sure
d
Med
i-ca
reO
nly
Med
i-ca
idO
nly
Med
icar
e &
Med
icai
dO
nly
With
Eith
er
Med
i-ca
reO
nly
Med
i-ca
idO
nly
Med
icar
e &
Med
icai
dO
nly
With
Mili
tary
Mili
tary
Onl
y
Mili
tary
&Pr
ivat
eO
nly
All
Gir
lsA
ge60
80.
90.
90.
00.
10.
00.
60.
00.
50.
00.
20.
20.
10.
10.
7
0-4
year
s22
31.
11.
10.
00.
2-
0.8
0.1
0.8
-0.
40.
40.
10.
10.
85-
17 y
ears
Rac
e44
10.
90.
90.
00.
20.
00.
50.
00.
50.
00.
20.
20.
10.
10.
8
Whi
te56
5IA
)1.
00.
00.
1-
o.s
0.0
0.4
0.0
0.3
0.3
0.1
0.1
0.9
Bla
ck24
91.
615
-0.
40.
11.
402
1.4
0.0
030.
30.
20.
21.
3O
ther
Eth
nici
ty12
532
3.1
030.
5-
3.9
-4.
00.
40.
70.
30.
60.
52.
1
His
pani
c34
82.
92.
70.
00.
30.
01.
70.
21.
70.
10.
50.
40.
20.
13.
5N
on-H
ispa
nic
Fam
ily I
ncom
e51
60.
70.
70.
00.
10.
00.
60.
00.
50.
00.
20.
20.
10.
00.
4
Und
er 5
5,00
010
32.
11.
9-
0.8
-3.
60.
13.
503
0.6
0.5
-0.
43.
855
,000
-56,
999
106
2.4
1.8
1.9
4.0
-3.
703
0.7
0.5
0.5
0.2
3357
,000
-59,
999
921.
91.
9-
0.9
2.5
0.4
2.5
-0.
60.
6-
0.4
2.2
510,
000-
514,
999
143
1.8
1.7
-0.
4-
1.8
0.1
1.7
0.0
0.6
0.5
0.2
0.3
2.0
515,
000-
519,
999
126
1.7
1.7
-0.
4-
1.0
0.1
1.0
-0.
90.
80.
20.
31.
552
0,00
0-52
4,99
911
62.
02.
10.
00.
4-
1.4
031.
10.
90.
90.
10.
31.
6$2
5,00
0-53
4,99
920
01.
11
10.
00.
10.
00.
40.
103
-0.
50.
50.
10.
11.
053
5.00
0.54
9,99
91%
0.7
0.7
-0.
1-
0.3
0.1
030.
00.
30.
20.
20.
10.
5$5
0,00
0 or
mor
ePo
viT
tyl.e
vel
207
050.
50.
10.
10.
20.
10.
10.
20.
10.
10.
10.
5
Und
er 0
30
184
1.8
131.
1-
3.7
033.
60
30.
40.
3-
0.2
3.6
0 3-
0 to
und
er 1
00
177
1.5
1.4
-0.
523
0.1
2.5
0.4
0.4
0.2
0.3
2.2
1 (k
/ to
unde
r 1
2 5
121
232.
10.
20.
n1.
70.
21.
4-
1.3
1.2
0.2
0.3
1.9
1 2;
to u
nder
1-,
011
62.
42.
40
10.
31.
0-
0.9
0.0
u.ct
0.9
0.2
0.4
2.3
330
to u
nder
1 7
;13
913
130.
00.
20
10.
70
20.
n0.
003
0 ;
0.1
(1.2
1 0
1 7;
to u
nder
2 (
.016
10.
80.
n0
10.
10.
30.
10.
30.
40.
30.
20
10.
72
00 a
nd a
bove
277
0.4
030.
10.
20
00.
2-
0 3
0.2
0.1
0.1
0 4
Ay-
,e a
nd r
o -o
rtN
. 1 e
vel
0 1
year
-, a
n,U
nder
07,
o77
1.9
1 8
-1.
0-
4 6
4.6
1 0
1 0
--0
63.
30
i0 to
und
er I
Ni
711.
81.
8-
0.5
3.2
0.1
3.2
-0.
70
70.
10.
62.
91
00 to
und
er 1
.25
533
I3.
40
31.
1-
3.3
-2.
92.
11.
70
50.
82.
81
2; to
und
er 1
50
423.
73.
60.
30.
92.
22.
11
11.
10.
73.
51
50 to
und
er 1
75
572.
12.
2-
0 5
-1.
20
70.
80.
60.
6-
0.3
1.9
1.75
to u
nder
2 0
064
1.7
1.7
0.1
0.2
0.8
0.1
0.8
0.9
0.8
0.2
0.2
1.4
2 00
and
abo
ve3-
17 v
iol-
, &11
00.
80.
80.
10
40
10.
3-
030.
40.
10.
10.
6
Und
er 0
.50
122
2 5
1.8
-1.
333
0 4
1.7
0 4
0.3
0.1
0.1
430
30 to
und
er 1
.00
134
1.9
1.7
-0.
6-
2.5
0.1
2.6
-0.
50.
40.
20.
32.
41
00 to
und
er 1
.23
912.
72
60.
10.
61.
503
1.3
1.1
1.1
-0.
32.
31
25 to
und
er 1
30
952
72.
70.
10.
31.
0-
1 0
0.1
1.2
1.1
0.3
0.5
2.3
1.50
to u
nder
1.7
511
315
130.
10.
1.0.
10.
80.
10.
80.
00.
60.
60.
10.
21.
11
75 to
und
er 2
00
128
0 8
0.8
0.1
0.2
-0.
40.
103
030.
30
20.
20.
77
00 a
nd a
bove
208
030.
50.
10
20.
20
30
20.
203
0.4
`-ta
ndar
d T
ror
1:ea
ctly
0 o
r is
Ind
eter
min
ate
(too
tew
Pri
mar
y Sa
mpl
ing
Uni
ts to
cal
cula
te e
rror
).
1 L
.1
L.

TA
BL
E B
-4. S
tand
ard
Err
ors
of E
stim
ates
of
Tof
Hea
lth I
nsur
ance
Cov
era
e A
mon
Chi
ldre
n A
ed
0 to
17,
bD
isab
ilian
d H
ealth
Sta
tus,
b G
ende
r:U
nite
d St
ates
, 198
9
Popu
latio
n(1
,000
s)
With
Priv
ate
(%)
With
Priv
ate
Onl
y(%
)
Priv
ate
insu
ranc
e an
dM
edic
are
and/
or M
edic
aid
Mili
tary
Und
efin
edPl
ans
Onl
y(%
)
Not
Insu
red
(%)
Med
i-ca
reO
nly
(%)
Med
i-ca
idO
nly
(%)
Med
icar
e &
Med
icai
dO
nly
(%)
With
Eith
er(%
)
Med
i-ca
reO
nly
(%)
Med
i-ca
idO
nly
(%)
Med
icar
e &
Med
icai
dO
nly
(%)
With
Mili
tary
Mili
tary
Onl
y(%
)(%
)
Mili
tary
&Pr
ivat
eO
nly
(%)
Tot
al1,
115
0.8
0.8
0.0
0.1
0.0
0.5
0.0
0.5
0.0
0.2
0.2
0.1
0.1
0.6
Age 0-
4 ye
ars
400
1.0
1.0
0.0
0.1
0.0
0.7
0.1
0.6
0.0
0.4
030.
10.
10.
85-
17 y
ears
807
0.8
0.8
0.0
0.1
0.0
0.5
0.0
0.5
0.0
0.2
0.2
0.1
0.1
0.6
Hea
lth S
tatu
sE
xcel
lent
609
0.7
0.7
0.0
0.1
-0.
40.
00.
40.
003
0.2
0.1
0.1
0.6
Ver
y go
od40
61.
11.
10.
00.
20.
00.
80.
10.
80.
103
0.3
0.1
0.1
0.7
Goo
d35
01.
41.
30.
003
0.0
1.0
0.1
1.0
0.0
0.3
030.
20.
21.
1Fa
ir82
2.4
2.3
-0.
6-
2.4
0.2
230.
30.
40.
40.
20.
52.
0Po
or22
5.9
5.9
-1.
0-
5.7
-5.
6-
--
--
6.1
Unk
now
n58
4.0
3.9
030.
7-
2.4
-2.
41.
01.
0-
0.2
3.5
Maj
or A
ctiv
ityU
nabl
e to
per
form
maj
or a
ctiv
ity32
4.6
4.3
1.7
4.0
0.6
4.1
1.0
0.6
0.7
3.0
Lim
ited
in a
mou
nt/k
ind
of m
ajor
act
ivity
871.
92.
00.
20.
70.
21.
90.
11.
70.
10.
50.
40.
20.
11.
6L
imite
d in
oth
er a
ctiv
ity58
232.
30.
60.
22.
22.
10.
80.
60.
403
1.6
Not
Lim
itml i
n ac
tivity
1,06
20.
80.
80.
00.
10.
00.
50.
00.
50.
00.
302
0.1
0.1
0.6
Bas
ic L
ife
Act
iviti
esN
eeds
hel
p in
sel
f ca
re (
AD
O-a
ges
5-17
246.
25.
92.
615
6.6
6.6
2.0
2.0
3.5
Not
lim
ited
in b
asic
life
act
iviti
es1,
112
0.8
0.8
0.0
0.1
0.0
0.5
0.0
0.5
0.0
0.2
0.2
0.1
0.1
0.6
Maj
or A
ctiv
ity &
Hea
lth S
tatu
sU
nabl
e to
per
form
maj
or a
ctiv
ity &
Exc
elle
nt11
9.5
9.5
--
--
--
-4.
64.
6-
8.7
Ver
y go
od12
9.6
9.7
-3.
9-
10.0
-95
-4.
09.
6G
ood
147.
97.
8-
5.8
-7.
4-
6.5
-2.
6-
--
5.5
Fair
198.
88.
6-
1.5
-6.
91.
87.
2-
1.8
--
4.5
Poor
911
.010
.54.
411
.5-
11.4
--
--
8.7
Unk
now
nlim
ited
in a
mou
nt/k
ind
of m
ajor
act
ivity
&6
30.0
30.0
--
30.0
30.0
--
Exc
elle
nt34
3.4
3.7
0.4
2.1
-3.
4-
2.6
-1.
31.
20.
4-
2.5
Ver
y go
od37
3.6
3.7
-0.
80.
62.
6-
2.4
0.4
1.0
1.0
-0.
42.
9G
ood
5032
3.2
030.
803
3.3
0.3
3.1
-0.
70.
40.
60.
32.
2Fa
ir27
4.6
4.5
1.4
-4.
2-
4.2
0.5
0.8
0.8
--
3.5
Poor
157.
27
1-
--
10.6
-10
.6-
--
11.1
Unk
now
n5
17.4
18.2
-14
.118
.2-
16.6
--
--
-7.
6L
imite
d in
oth
er a
ctiv
ity &
Exc
elle
nt23
454.
7-
1.3
-3.
3-
3.0
-13
13-
0.8
3.6
Ver
y go
od28
2.6
2.7
-0.
62.
6-
25-
1.0
0.7
0.7
0.9
1.8
Goo
d36
4 4
4.4
-1.
3-
4.4
-4.
4-
0.9
0.7
0.5
-2.
9Fa
ir13
7.5
8.0
-23
-6.
76.
2-
4.4
273.
5-
5.2
Poor
6-
--
--
16.9
-16
.9-
-16
.9U
nkno
wn
3-
--
--
--
--
--
-
Io

TA
BLE
B-4
. Sta
ndar
d E
rror
s of
Est
imat
es o
f Typ
f Hea
lth In
sura
nce
Cov
era
e A
mon
g C
hild
ren
A e
d 0k
17, b
y D
isab
ility
and
Hea
lth S
tatu
s, b
y G
ende
n U
nite
d S
late
s, 1
989
Not
lim
ited
in a
ctiv
ity &
Exc
elle
nt
Ver
y go
odG
ood
Fai
rP
oor
Unk
now
n
All
Boy
sA
ge 0-4
year
s5-
17 y
ears
Hea
lth S
tatu
sE
xcel
lent
Ver
y go
odG
ood
Fai
rP
oor
Unk
now
nM
ajor
Act
ivity
Una
ble
to p
erfo
rm m
ajor
act
ivity
Lim
ited
in a
mou
nt/ld
nd o
f maj
or a
ctiv
itylim
ited
in o
ther
act
ivity
Not
lim
ited
in a
ctiv
ityB
asic
Life
Act
iviti
esN
eeds
hel
p in
sel
f car
e (A
DL)
-age
s 5-
17N
ot li
mite
d in
bas
ic li
fe a
ctiv
ities
Maj
or A
ctiv
ity &
Hea
lth S
tatu
sU
nabl
e to
per
form
maj
or a
ctiv
ity &
Exc
elle
nt
Ver
y go
odG
ood
Fai
rP
oor
Unk
now
nLi
mite
d in
am
ount
/kin
d of
maj
or a
ctiv
ity &
Exc
elle
nt
Ver
y go
odG
ood
Fai
rP
oor
Unk
now
n
Pop
ulat
ion
(L00
0s)
Priv
ate
insu
ranc
e an
dW
ithM
edi-
Med
i- M
edic
are
&W
ithP
rivat
eca
reca
idM
edic
aid
Priv
ate
Onl
yO
nly
Onl
yO
nly
(%)
(%)
(%)
(%)
(%)
Med
icar
e an
d/or
Med
icai
dM
edi-
Med
i- M
edic
are
&W
ithca
read
dM
edic
aid
Eith
erO
nly
Onl
yO
nly
(%)
(%)
(%)
(%)
603
395
321 68 13 56
586
228
439
304
260
202 56 14 37
0.7
0.7
0.0
O.',
1.1
1.2
0.0
0.2
131.
40.
00.
33.
03.
00.
710
.110
.1-
-3.
93.
80.
30.
6
0.8
0.8
0.0
0.1
0.0
0.0
1.1
1.2
0.0
0.2
0.0
0.8
0.8
0.0
0.1
0.0
0.7
0.7
0.0
0.1
1.2
1.3
0.0
0.2
0.0
1.6
1.6
0.1
0.3
0.0
3.1
3.0
0.9
7.4
7.3
2.2
5353
--
255.
75.
6L8
652.
223
030.
90.
142
2.9
2.9
0.8
0354
70.
80.
80.
00.
10.
0
227.
76.
63.
958
40.
80.
80.
00.
1
9 10
9
14
6 6
28 28 39 18 9 4
10.7
12.0
10.6
10.1
15.4
29.1
3.8
4.8
3.9
6.4
8.2
20.2
10.7
12.0
10.4
9.7
13.8
29.1 43
0.5
4.9
4.0
0.8
6.5
3.2
20.2
5.2
2.5
10.6 23 1.0
1.1
2-5
0.4
0.8
1.0
2.9
7.4
1.9
0.0
0.1
0.1
0.1
0.4
0.8
1.9
2.8
7.4
1.9
0.5
0.0
05
Mili
tary
Mili
tary
& U
ndef
ined
With
Mili
tary
Priv
ate
Pla
nsN
otM
ilibr
yO
nly
Onl
yO
nly
insu
red
(%)
(%)
(%)
(%)
(%)
0.0
0.3
0.2
0.1
0.1
0.6
0.1
0.3
030.
10.
10.
70.
00.
40.
40.
20.
21.
20.
40.
60.
6-
0.7
2.5
--
---
-83
-1.
11.
1-
0.2
3.6
0.0
0.3
0.2
0.1
0.1
03
0.8
0.0
0.7
0.0
0.4
0.3
0.1
0.2
0.9
0.5
0.0
0.5
0.3
030.
10.
10.
5
0.5
0.8
1.1
3.2
8.1
3.2
5.1
2.2
2.6
0.5
0.0
0.1
0.1 _- - - 0.0
0.4
0.8 Ll 3.1
8.0
3.2
5.1
1.9
2.5
05
8.1
8.6
0.0
0:1
0.0
02 0.2
0.0
0.0
0.5
0.0
0.5
0.0
0.4
9.6
8.9
85 15.9
29.1 3.7
3.4
4.1
6.0
14.3
22.0
9.6
7.3
9.2
16.6
29.1 2.7
3.2
3.9
5.6
143
72.0
0.7
0.8
0.3
030.
40.
40.
103
030
/0.
80.
80.
2-
1.4
1.4
1.8
1.1
0.6
0.4
031.
00.
80.
603
030.
1
3.0
3.0
0303
0.1
0.9
1.1
1.1
1.4
0.8
0.5
1.1
0.6
0.9
1.4 7_
0.1
0.1
0.2
0.9
1.2
0.1
0.5
0.1
0.5
0.8
1.3
2.9
8.1
4.7
41
1.7
2.0
0.5
4.8
0.1
03
5.9
0.4
9.1
12.9
7.9
52 10.5
3.1
3.8
25 5.4
14.0
13.6

TA
BL
E B
-4. S
tand
ard
Err
ors
of E
stim
ates
of
Typ
e of
Hea
lth I
nsur
ance
Cov
erag
e A
mon
g C
hild
ren
Age
d 0
to 1
7, b
yD
isab
ility
and
Hea
lth S
tatu
s, b
y G
ende
r: U
nite
d St
ates
, 198
9
limite
d in
oth
er a
ctiv
ity &
Exc
elle
ntV
ery
good
Goo
dFa
irPo
orU
nkno
wn
Not
lim
ited
in a
ctiv
ity &
Exc
elle
nt
Ver
y go
odG
ood
Fair
Poor
Unk
now
n
All
Gir
lsA
ge 0-4
year
s5-
17 y
ears
Hea
lth S
tatu
sE
xcel
lent
Ver
y go
odG
ood
Fair
Poor
Unk
now
nM
ajor
Act
ivity
Una
ble
to N
I-fo
rm m
ajor
act
ivity
20L
imite
d in
am
ount
/kin
d of
maj
or a
ctiv
ity46
Lim
ited
in o
ther
act
ivity
32N
ot li
mite
d in
act
ivity
Bas
ic L
ife
Act
iviti
esN
eeds
hel
p in
sel
f ca
re (
AD
L)-
ages
5-1
712
Not
lim
ited
in b
asic
life
act
iviti
es60
7M
ajor
Act
ivity
& H
ealth
Sta
tus
Una
ble
to p
erfo
rm m
ajor
act
ivity
&E
xcel
lent
Ver
y go
odG
ood
Fair
Poor
Unk
now
n
Popu
latio
n(1
,000
s)
Priv
ate
insu
ranc
e an
dW
ithM
edi-
Med
i- M
edic
are
&W
ithPr
ivat
eca
reca
idM
edic
aid
Priv
ate
Onl
yO
nly
Onl
yO
nly
(%)
(%)
(%)
(%)
(%)
Med
icar
e an
d/or
Med
ic-a
idM
edi-
Med
i- M
edic
are
&W
ithca
reca
idM
edic
aid
Eith
erO
nly
Onl
yO
nly
(%)
(%)
(%)
(%)
17 21 26 9 4 2
298
254
183 48 9 36 608
223
441
376
209
178 44 18 33
591 6 6 11 11 7 2
5.8
5.9
1.7
3.8
3.9
5.2
5.1
2/12
.212
.1
0.7
0.7
1.2
131.
71.
73.
713
.55.
1
3.9
133
5.1
0.0
0.0
0.1
0.2
0.4
1.1
0.0
0.9
0.9
0.0
0.1
0.0
1.1
1.1
0.0
0.2
0.9
0.9
0.0
0.2
0.0
0.9 13 15 2.9
8.3
4.2
5.9
2.8
3.2
0.9
0.9
13 1.5
2.8
83 4.1
5.8
2.7
33 0.9
0.0
0.0
0.0
0.6
0.0
0.2
0.2
0.0
03 0.7
1.3
3.4
0.9
0.7
0.1
a_ 0.4
8.9
9.1
4.3
0.9
0.9
0.0
0.1
16.2
15.9
11.9
11.2
15.2
16.2
16.0
12.3
11.2
15.2
11.8
10.8
33 33 5.4
10.7
23.1 05 0.9
1.1
3.9
7.8
2.3
0.0
0.1
0.1
2.9 3/ 10.7
23.1 0.4
0.8
1.1
3.8
7.8
23
Mili
tary
Mili
tary
& U
ndef
ined
With
Mili
tary
Priv
ate
Plan
sN
otM
ilita
ryO
nly
Onl
yO
nly
Insu
red
(%)
(%)
(%)
(%)
(%)
1313
1.1
1.1
151.
20.
96.
75.
54.
1-
--
0.0
0303
0.1
0.1
030.
40.
10.
10.
40.
403
-1.
01.
0-
0.6
0.0
0.5
0.0
0.8
0.1
0,8
050.
00.
50.
0
03 0.9 13 2.7
7.6
2.9
5.7
2.6
2.9
0.6
0.0
0.1
0.1 03 13 03 0.0
0.4
0.9
13 2,8
7.6
2.8
53 2.5
2.8
0.5
8.9
8.6
0.0
0.1
0.5
0.0
0.6
0.0
0.5
0.0
16.0
11.6
9.2
155
15.9
9.6
438.
715
.5
_1
1513
0.2
020.
1
0.4
0.4
0.1
0202
0.1
030.
30.
103
0.3
0.1
0.4
0.4
0.2
0.6
0303
--
0.9
0.9
--
0.8
0.7
1.0
0.8
0.6
0.3
0/0.
1
020.
20.
1 ^1
135.
21.
02.
43.
873 23.1
0.1
050.
10.
802
131.
43.
713
.05.
0
0.1
0.7
0.1
0.8
0.1
0.8
0.1
0.8
0.1
1.0
0.2
120.
22.
28_
503
33 3.4
032.
40.
52.
20.
10.
7
4.0
0.1
0.7
16.2
7.3
5.9
11.8

TA
BL
E B
-4. S
tand
ard
Err
ors
of E
stim
ates
of
Typ
e of
Hea
lth I
nsur
ance
Cov
erag
e A
mon
g C
hild
ren
Age
d 0
to 1
7, b
y D
isab
ility
and
Hea
lth S
tatu
s,by
Gen
der:
Uni
ted
Stat
es, 1
989
Lim
ited
in a
mou
nt/k
ind
of m
ajor
act
ivity
dr
Exc
elle
ntV
ery
good
Goo
dFa
irPo
orU
nkno
wn
Lim
ited
in o
ther
act
ivity
dr
Exc
elle
ntV
ery
good
Goo
dFa
irPo
orU
nkno
wn
Not
lim
ited
in a
ctiv
ity d
rE
xcel
lmt
Ver
y go
odG
ood
Fair
Poor
Unk
now
n
Popu
latio
n(1
,000
s)
With
Priv
ate
(%)
Priv
ate
insu
ranc
e an
dW
ithM
edi-
Med
i-, M
edic
are
&Pr
ivat
eca
reca
idM
edic
aid
Onl
yO
nly
Onl
yO
nly
(%)
(%)
(%)
(%)
Med
icar
e an
d/or
Med
icai
dM
edi-
Med
i- M
edic
are
&W
ithca
reca
idM
edic
aid
Eith
erO
nly
Onl
yO
nly
(%)
(%)
(%)
(%)
185.
96.
0-
3.0
235.
65.
6-
1.5
1.4
264.
74.
6-
1.4
-18
6.4
6.4
--
1211
.111
.1-
-4
-27
.5-
27.5
16 18 19 10 4 2
737.
5-
2.0
3.3
33-
-63
63-
-10
.010
.7-
4.7
--
_-
--
_-
375
0.9
0.9
0.0
0.1
204
1.4
1.3
0.0
0.2
166
1.6
1.5
0.0
0.4
363.
63.
6-
0.9
913
.413
.4-
-32
434.
20.
61.
1
6.4
4.3
4.3
5.3
13.7
27.5 6.1
2.7
5.4
9.3
23.2 0.5
1.0
13 3.3
13.1 3.0
5.7
3.6
0.9
4.3
5.3
13.7
0.0
0.1
0.1
02
5.8
2.7
5.4
8.7
232
0.4
0.9 13 33 13
.1 2.9
0.0
0.1
0.7
Mili
tary
Mili
tary
& U
ndel
med
With
Mili
tary
Priv
ate
Plan
sN
otM
ilita
ry O
nly
Onl
yO
nly
Insu
red
(%)
(%)
(%)
(%)
(%)
3.9
1.1
2.4
1.8
5.7
0.3
03 0.5
0.7
0.9
3.6
1.1
2.4
1.8
03 03 0.4
0.7
0.9
5.7
0.1
0.1
0.2
1.0
0.1
1.6
0.1
0.1 03 0.2
0.4
5.1
4.7
3.2
3.9
15.8
4.4
2.5
43 6.9
23.2
0.8
1.3
3.0 23 3.4
-.St
anda
rd e
rror
is e
xact
ly 0
or
is in
dete
rmin
ate
(too
few
Pri
mar
y Sa
mpl
ing
Uni
ts to
cal
cula
te e
rror
).

TA
BL
E B
-5. S
tand
ard
Err
ors
of E
stim
ates
of
Num
ber
of P
hysi
cian
Con
tact
s Pe
r Pe
rson
Per
Yea
r A
mon
g A
dults
Age
d 18
to 4
4, b
y T
ype
of H
ealth
Insu
ranc
e C
over
age,
Dis
abili
tyan
d H
ealth
Sta
tus,
b G
ende
r :U
nite
d St
ates
,198
9
Typ
e of
Hea
lth I
nsur
ance
Cov
erag
e
All
Pers
ons
Any
Priv
ate
Priv
ate
Onl
yA
nyPu
blic
Publ
icO
nly
Med
icar
e
Num
ber
of p
hysi
cian
vis
its
Med
icai
dM
ilita
ryA
llIn
sure
d
All
Not
Insu
red
Tot
al0.
10.
10.
10.
40.
50.
90.
60.
60.
102
Age 18
-24
year
s0.
202
0.2
0.8
0.9
3.9
1.0
1.0
0.2
0.2
25-4
4 ye
ars
0.1
0.1
0.1
0.5
0.6
1.8
0.6
1.1
0.1
0.3
45-6
4 ye
ars
0.2
020.
20.
61.
01.
01.
50.
80.
20.
4
Hea
lth S
tatu
sE
xcel
lent
Ver
y0.
10.
10.
10.
50.
61.
20.
80.
70.
103
good
0.1
0.1
0.1
050.
61.
40.
80.
60.
10.
2G
ood
0202
0.2
0.6
0.6
0.8
0.6
1.4
0.2
0.3
Fair
0.4
0.6
0.6
1.0
1.2
131.
22.
90.
50.
6Po
or1.
21.
92.
51.
72.
12.
02.
74.
21.
42.
7U
nkno
wn
0.7
0.6
0.6
3.8
4.1
-43
-0.
81.
4
Maj
or A
ctiv
ityU
nabl
e to
per
form
maj
or a
ctiv
ity0.
91.
41.
71.
21.
513
1.9
3.0
1.0
2.5
Lim
ited
in a
mou
nt/k
ind
of m
aior
act
ivity
0.4
0.5
0.5
1.2
1.5
2.0
1.8
2.0
0.4
1.2
Lim
ited
in o
ther
act
ivity
0.4
0.5
0.6
1.2
1.6
1.8
1.8
2.0
0.5
0.8
Not
lim
ited
in a
ctiv
ity0.
10.
10.
10.
30.
40.
80,
40.
60.
10.
1
Wor
k A
ctiv
ityU
nabl
e to
wor
k0.
81.
21.
51.
013
1.1
1.6
2.7
0.8
2.2
Lim
ited
in a
mou
nt/k
ind
of w
ork
0.4
0.5
0.5
1.2
1.3
2.6
1.8
2.1
051.
2L
imite
d in
oth
er a
ctiv
ities
0.5
0.5
0.6
1.8
2.5
5.1
2.9
2.1
0.5
1.0
Not
lim
ited
in w
ork/
othe
r ac
tiviti
es0.
10.
10.
103
0.4
0.8
0.4
0.6
0.1
0.1
Bas
ic L
ife
Act
iviti
esN
eeds
hel
p in
sel
f ca
re (
AD
L)
3.9
5.2
10.3
4.8
7.2
3.3
7.9
10.6
4.4
8.4
Nee
ds h
elp
in r
outin
e ac
tiviti
es (
IAD
L)
1.7
2.3
2.8
1.9
2.0
2.4
256.
71.
67.
8N
ot li
mite
d in
bas
ic li
fe a
ctiv
ities
0.1
0.1
0.1
030.
40.
90.
50.
60.
10.
1
a')

TA
BL
E 8
-5. S
tand
ard
Err
ors
of E
stim
ates
of
Num
ber
of P
hysi
cian
Con
tact
s Pe
r Pe
rson
Per
Yea
r A
mon
g A
dults
Age
d 18
to 6
4, b
y T
ype
of H
ealth
Insu
ranc
e C
over
age,
Dis
abili
tyan
d H
ealth
Sta
tus,
by
Gen
der
:Uni
ted
Stat
es, 1
989
Typ
e of
Hea
lth I
nsur
ance
Cov
erag
e
All
Pers
ons
Any
Priv
ate
Priv
ate
Onl
yA
nyPu
blic
Publ
icO
nly
Med
icar
e
Num
ber
of p
hysi
cian
vis
its
Med
icai
dM
ilita
ry
All
Insu
red
All
Not
Insu
red
All
Men
0.1
0.1
0.1
0.6
0.9
1.2
1.3
0.8
0.1
02
Age 18
-24
year
s25
-44
0.2
0.2
0.2
1.6
1.3
6.9
2.4
1.2
0.2
0.2
year
s45
-64
0.1
0.2
0.2
0.9
1.2
2.7
1.1
1.4
020.
3
year
s0.
20.
20.
20.
91.
51.
22.
90.
90.
20.
6
Hea
lth S
tatu
sE
xcel
lent
Ver
y
0.1
0.1
0.1
1.0
1.3
1.2
3.0
1.1
0.1
0.2
good
0.1
0.2
0.1
0.6
0.7
1.4
1.1
0.8
0202
Goo
dFa
ir0.
20.
303
1.0
0.6
0.8
0.6
2.1
030.
40.
70.
91.
01.
41.
623
2.1
1.5
0.8
0.8
Poor
1.8
2.8
3.8
2.5
3.1
2.6
4.8
5.0
2.1
4.0
Unk
now
n03
0.6
0.6
--
--
-0.
5-
Maj
or A
ctiv
ityU
nabl
e to
per
form
maj
or a
ctiv
ity1.
11.
92.
61.
41.
51.
52.
33.
21.
21.
7L
imite
d in
am
ount
/kin
d of
mai
or a
ctiv
ity0.
60.
60.
61.
62.
31.
733
2-2
0.5
1.5
Lim
ited
in o
ther
act
ivity
limite
d0.
60.
60.
72.
03.
31.
92.
73.
00.
61.
8N
otin
act
ivity
0.1
0.1
0.1
0-5
0.6
1.2
0.8
0.6
0.1
0.2
Wor
k A
ctiv
ityU
nabl
e to
wor
k1.
01.
92.
61.
31.
51.
42.
232
1.2
1.8
Lim
ited
in a
mou
nt/k
ind
of w
ork
0.6
0.6
0.6
1.7
2.5
1.5
3.4
230.
6IS
Lim
ited
in o
the.
act
iviti
es0.
70.
80.
82.
63.
97.
72.
82.
90.
81.
8N
ot li
mite
d in
wor
k/ot
her
activ
ities
0.1
0.1
0.1
0.5
0.6
120.
80.
60.
10.
2
Bas
ic L
ife
Act
iviti
esN
eeds
hel
p in
sel
f ca
re (
AD
L)
6.2
8.1
18.1
6.8
10.5
4.9
13.8
16.8
6.5
17.2
Nee
ds h
elp
in r
outin
e ac
tiviti
es (
IAD
L)
2.0
4.2
5.4
2.1
1.5
3.0
2.0
6.7
223.
0N
ot li
mite
d in
bas
ic li
fe a
ctiv
ities
0.1
0.1
0.1
0.5
0.7
120.
90.
70.
10.
2
1 9
7

TA
BL
E B
-5. S
tand
ard
Err
ors
of E
stim
ates
of
Num
ber
of P
hysi
cian
Con
tact
s Pe
r Pe
rson
Per
Yea
r A
mon
g A
dults
Age
d 18
to 6
4, b
y T
ype
of H
ealth
Insu
ranc
e C
over
age,
Dis
abili
tyan
d H
ealth
Sta
tus,
by
Gen
der
: Uni
ted
Stat
es, 1
989
Typ
e of
Hea
lth I
nsur
ance
Cov
erag
e
All
Any
Pers
ons
Priv
ate
Priv
ate
Onl
yA
nyPu
blic
Publ
icO
nly
Med
icar
eM
edic
aid
Mili
tary
All
Insu
red
All
Not
Insu
red
Num
ber
ofph
ysic
ievs
vis
its
All
Wom
en0.
10.
10.
10.
50.
61.
20.
60.
80.
10.
3
Age 18
-24
year
s0.
20.
30.
30.
91.
023
1.1
1.2
030.
325
-44
year
s0.
10.
20.
20.
70.
82.
40.
71.
80.
203
45-6
4 ye
ars
0.2
0.2
0.2
0.8
1.2
1.3
1.4
1.1
0.2
0.5
Hea
lth S
tatu
sE
xcel
lent
020.
20.
20.
50.
62.
008
0.8
0.2
0.7
Ver
y go
od0.
10.
20.
20.
70.
72.
31.
00.
90.
20.
3G
ood
0203
030.
70.
71.
50.
71.
80.
30.
4Fa
ir0.
60.
70.
81.
41.
71.
813
8.8
0.6
0.8
Poor
1.6
2.8
3.3
2.5
3.1
3.2
3.2
3.8
2.0
3.2
Unk
now
n1.
21.
01.
07.
48.
0-
8.1
-1.
32.
8
Maj
or A
ctiv
ityU
nabl
e to
per
form
maj
or a
ctiv
ity1.
51.
92.
31.
92.
32.
12.
47.
51.
55.
0U
mite
d in
am
ount
/kin
d of
maj
or a
ctiv
ity0.
60.
80.
81.
72.
02.
92.
24.
00.
71.
8L
imite
d in
oth
er a
ctiv
ity0.
60.
80.
91.
61.
82.
22.
02.
50.
80.
7N
ot li
mite
d in
act
ivity
0.1
0.1
0.1
0.4
0.5
120.
50.
90.
10.
2
Wor
k A
ctiv
ityU
nabl
e to
wor
k1.
213
1.9
1.4
1.8
1.5
1.9
5.6
1.1
3.7
Lim
ited
in a
mou
nt/k
ind
of w
ork
0.7
0.8
0.8
1.7
155.
82.
143
0.7
2.0
limite
d in
oth
er a
ctiv
ities
0.7
0.8
0.8
2.4
2.9
6.0
3.3
2.1
0.8
1.3
Not
lim
ited
in w
ork/
othe
r ac
tiviti
es0.
10.
10.
10.
40.
512
0.5
0.9
0.1
0.2
Bas
ic L
ife
Act
iviti
esN
eeds
hel
p in
sel
f ca
re (
AD
L)
3.9
7.1
12.2
4.4
6.0
3.9
5.7
6.8
4.7
9.1
Nee
ds h
elp
in r
outin
e ac
tiviti
es (
IAD
L)
2.6
2.7
3.2
3.0
3.3
3.9
3317
.82.
211
.5N
ot li
mite
d in
bas
ic li
fe a
ctiv
ities
0.1
0.1
0.1
0.4
0.5
1.2
0.5
0.8
0.1
0.2
- St
anda
rd e
rror
is e
xact
ly 0
or
is in
dete
rmin
ate
(too
few
Pri
mar
y Sa
mpl
ing
Uni
ts to
cal
cula
te e
rror
).
(1
8

TA
BL
E B
-6. S
tand
ard
Err
ors
of E
stim
ates
of
Num
ber
of P
hysi
cian
Con
tact
s Pe
r Pe
rson
Per
Yea
r A
mon
g C
hild
ren
Age
d 0
to 1
7, b
y T
ype
of H
ealth
Insu
ranc
e C
over
age,
Dis
abili
ty a
nd H
ealth
Sta
tus,
by
Gen
der
: Uni
ted
Stat
es, 1
989
Typ
e of
Hea
lth I
nsur
ance
Cov
erag
e
All
Any
Pers
ons
Priv
ate
Priv
ate
Onl
yA
nyPu
blic
Publ
icO
nly
Med
icai
dM
ilita
ryA
llIn
sure
d
All
Not
Insu
red
Num
ber
of p
hysi
cian
con
tact
s
Tot
al0.
10.
10.
10.
203
0.3
0.6
0.1
0.2
Age 0-
4 ye
ars
0.2
0.3
0.3
0.4
0.4
0.5
0.9
0.2
0.4
5-17
yea
rski
---O
P0.
10.
10.
10.
30.
30.
30.
70.
10.
2
Hea
lth S
tatu
sE
xcel
lent
0.1
0.1
0.1
0.3
0.3
0.3
0.4
0.1
0.2
Ver
y go
od0.
20.
20.
20.
40.
50.
51.
70.
20.
3
Goo
d0.
30.
40.
40.
60.
60.
61.
90.
30.
6
Fair
1.0
1.7
'1.7
1.5
1.7
1.6
4.2
1.1
2.0
Poor
3.3
6.6
6.9
4.3
4.4
4.3
-4.
55.
5
Unk
now
n0.
81.
01.
02.
22.
32.
4-
0.9
0.6
Maj
or A
ctiv
ityU
nabl
e to
per
form
maj
or a
ctiv
ity3.
45.
45.
83.
13.
53.
2-
3.8
6.6
Lim
ited
in a
mou
nt/k
ind
of m
ajor
act
ivity
0.8
1.1
1.1
1.2
1.2
1.3
6.8
0.9
2.4
Lin
dted
in o
ther
act
ivity
1.3
1.7
1.8
1.9
2.0
2.1
5.0
1.4
3.2
Not
lim
ited
in a
ctiv
ity0.
10.
10.
10.
20.
20.
30.
60.
10.
2
Bas
ic li
fe A
ctiv
ities
Nee
ds h
elp
in s
elf
care
(A
DL
)-ag
es 5
-17
4.9
9.9
11.8
2.7
332.
95.
47.
6
Not
lim
ited
in b
asic
life
act
iviti
es0.
10.
10.
10.
20.
30.
30.
60.
10.
2
2I
2 0

TA
BL
E B
-6. S
tand
ard
Err
ors
of E
stim
ates
of
Num
ber
of P
hysi
cian
Con
tact
s Pe
r Pe
rson
Per
Yea
rA
mon
g C
hild
ren
Age
d 0
to 1
7, b
y T
ype
of H
ealth
Ins
uran
ce C
over
age,
Dis
abili
ty a
nd H
ealth
Sta
tus,
by
Gen
der
:Uni
ted
Stat
es, 1
989
Typ
e of
Hea
lth I
nsur
ance
Cov
erag
e
All
Any
Pers
ons
Priv
ate
Priv
ate
Onl
yA
nyPu
blic
Publ
icO
nly
Med
icai
dM
ilita
ryA
llIn
sure
d
All
Not
Insu
red
Num
ber
of p
hysi
cian
con
tact
s
All
Boy
s0.
10.
20.
20.
30.
40.
41.
00.
10.
3
Age 0-
4 ye
ars
0.3
0.4
0.4
0.6
0.6
0.6
1.5
030.
65-
17 y
ears
0.1
020.
20.
40.
40.
412
0.1
03
Hea
lth S
tatu
sE
xcel
lmt
0.1
0.2
020.
40.
40.
40.
60.
10.
3V
ery
good
030.
303
0.6
0.6
0.6
2.8
030.
5G
ood
0.4
0.6
0.7
0.8
0.8
0.8
3.1
0.5
0.7
Fair
1.6
2.7
2.9
2.5
2.8
2_6
6.8
1.8
3.0
Poor
5.1
123
13.2
5.8
6.2
5.8
-6.
87.
1U
nkno
wn
1.1
1.4
1.4
3.4
3.4
3.8
1.3
-M
ajor
Act
ivity
Una
ble
to p
erfo
rm m
ajor
act
ivity
3.6
4.8
524.
85.
55.
0-
3.7
9.7
Lim
ited
in a
rnou
nt/k
ind
of m
ajor
act
ivity
1.1
1.5
1.6
2.0
2.0
2.1
9.4
132.
8L
imite
d in
oth
er a
ctiv
ity2.
02.
62.
72.
62.
72.
78.
42.
14.
7N
ot li
mite
d in
act
ivity
0.1
0.1
0.1
0.3
0.3
030.
90.
10.
2
Bas
ic L
ife
Act
iviti
esN
eeds
hel
p in
sel
f ca
re (
AD
L)-
ages
5-1
73.
86.
68.
53.
64.
43.
84.
28.
0N
ot li
mite
d in
bas
ic li
fe a
ctiv
ities
0.1
0.2
0.2
030.
30.
41.
00.
103
0

TA
BL
E B
-6. S
tand
ard
Err
ors
of E
stim
ates
of
Num
ber
of P
hysi
cian
Con
tact
s Pe
r Pe
rson
Per
Yea
r A
mon
g C
hild
ren
Age
d 0
to 1
7, b
y T
ype
of H
ealth
Insu
ranc
e C
over
age,
Dis
abili
ty a
nd H
ealth
Sta
tus,
by
Gen
der
: Uni
ted
Stat
es, 1
989
Typ
e of
Hea
lth I
nsur
ance
Cov
erag
e
All
Any
Pers
ons
Priv
ate
Priv
ate
Onl
yA
nyPu
blic
Publ
ic
Onl
yM
edic
aid
Mili
tary
All
Insu
red
All
Not
Insu
red
Num
ber
of p
hysi
cian
con
tact
s
All
Gir
ls0.
10.
202
0.3
0.3
0.4
0.7
0.1
0.3
Age 0-
4 ye
ars
5-17
0.3
0.3
0.3
0.6
0.6
0.6
1.1
030.
6
year
s0.
10.
20.
203
0.3
0.4
0.8
020.
3
Hea
lth S
tatu
sE
xcel
lent
Ver
y
0.2
0.2
0.2
030.
40.
40.
602
0.2
good
Goo
d0.
203
0.3
0.5
0.6
0.6
1.1
0.2
0.4
Fair
0.4
0.4
0.4
0.6
0.7
0.7
230.
40.
8
Poor
1.2
2.0
2.0
131.
41.
4-
132.
2
Ura
mow
n4.
06.
86.
85.
553
5.5
-5.
073
131.
71.
72.
932
32-
131.
4
Maj
or A
ctiv
ityU
nabl
e to
per
form
maj
or a
ctiv
ityL
imite
d6.
810
.911
.95.
05.
85.
2-
7.9
5.5
in a
mou
nt/k
ind
of m
ajor
act
ivity
Lim
ited
1.1
1.4
1.4
1513
1.5
5.8
1.1
35in
oth
er a
ctiv
ityN
ot13
1.6
1.6
2.4
2.6
2-8
6.0
1.4
32lim
ited
in a
ctiv
ity0.
10.
20.
203
0303
0.7
0.1
03
Bas
ic L
ife
Act
iviti
esN
eeds
hel
p in
sel
f ca
re (
AD
L)-
ages
5-1
7N
ot li
mite
d12
.420
.421
5.`
1.9
2.2
1.9
-13
218
3in
bas
ic li
fe a
ctiv
ities
0.1
0.2
0.2
0303
0.4
0.7
0.1
0.3
-- S
tand
ard
erro
r is
exa
ctly
0 o
r is
inde
term
inat
e (t
oo f
ew P
rim
ary
Sam
plin
g U
nits
to c
alcu
late
err
or).
2 '4
ot)

TA
BL
E B
-7. S
tand
ard
Err
ors
of E
stim
ates
of
Hos
pita
l Dis
char
ges
Per
100
Pers
ons
Per
Yea
r an
d A
vera
ge L
engt
h of
Sta
y Pe
r D
isch
arge
Am
ong
Adu
lts A
ged
18 to
44,
by
Typ
e of
Hea
lthIn
sura
nce
Cov
erag
e, D
isab
ility
and
Hea
lth S
tatu
s, b
y G
ende
r: U
nite
d St
ates
, 198
9
All
Pers
ons
Typ
e of
Hea
lth I
nsur
ance
Cov
erag
eA
llN
otIn
sure
dA
nyPr
ivat
ePr
ivat
eO
nly
Any
Publ
icPu
blic
Onl
yM
edic
are
Med
icai
dA
llIn
sure
d
IID
AL
OS
HD
AL
OS
HI)
AL
OS
HD
AL
OS
HD
AL
OS
HD
AL
OS
HD
AL
OS
HD
AL
OS
HD
AL
OS
Tot
al0.
20.
20.
20.
20.
20.
21.
203
130.
62.
81.
01.
90.
802
0.2
0.4
0.6
Age 18
-24
year
s25
-44
year
s45
-64
year
s
0.5
0.2
0.5
05 02 03
0.4
0.2
0.5
0.7
0.3
0.4
0.4
0.2
05
0.7
0.3
0.4
3.2
1.7
2.1
0.7
0.8
0.7
3.7
1.9
2.8
0.8
0.6
1.1
53 6.4
3.8
8.8
1.4
1.2
4.3
2.2
4.4
0.7
1.0
1.4
0.6
0.2
0.5
03 0.3
03
1.0
0.5
1.0
1.2
0.4
1.6
Hea
lth S
tatu
sE
xcel
lent
Ver
y0.
203
020.
402
0.3
1.2
1.7
1.9
0.7
3.8
11.1
2.6
0.9
0.2
030.
50.
7go
odG
ood
030.
203
0.3
os0.
31.
40.
91.
91.
22.
30.
82.
40.
903
0.3
0.6
0.6
Fair
0.5
0303
0.2
0303
1.7
0.5
1.6
0.7
3.9
2.1
2.2
0.6
0302
1.0
1.5
Poor
1.5
0.6
2.0
0.9
1.9
0.8
3.3
1.1
3.6
1.0
6.0
0.8
431.
91.
70.
72.
30.
6
Unk
now
n4.
003
6.5
0.6
7.6
0.6
6.0
0.8
7.1
1.1
7.1
1.6
9.1
1.3
4.7
0.6
4.8
1.6
2.4
6.8
1.7
1.1
1.7
1.1
15.3
0.4
16.4
0.4
17.2
0.4
2.7
0.6
4.9
18.6
Mai
or A
ctiv
ityU
nabl
e to
per
form
maj
or a
ctiv
ityL
imite
d2.
40.
63.
40.
84.
10.
93.
50.
84.
40.
94.
41.
25.
713
2.6
0.6
431.
5in
am
ount
/kin
d of
maj
or a
ctiv
ityL
imite
d1.
40.
51.
80.
51.
80.
54.
41.
24.
81.
683
126.
72.
01.
70.
52.
60.
9in
och
er a
ctiv
ity1.
20.
413
0313
0.5
3.6
1.0
4.4
139.
81.
34.
41.
21.
40.
41.
41.
5N
ot li
mite
d in
act
ivity
0.2
0.2
0202
020.
20.
90.
41.
103
2.3
1.0
1.4
0.4
0.2
020.
40.
7
Wor
k A
ctiv
ityU
nabl
e to
wor
k2.
10.
532
0.6
3.6
0.7
3.1
0.7
3.7
0.8
4.1
1.1
4.8
1.1
2.3
0.5
3.8
1.4
Lim
ited
in a
mou
nt/k
ind
of w
ork
1.3
031.
60.
51.
60.
63.
422
3.7
4.4
5.4
1.8
3.9
5.3
1.4
0.6
2.7
0.7
Lim
ited
in o
ther
act
iviti
es1.
61.
01.
71.
11.
81.
26.
32.
08.
12.
616
22.
693
331.
81.
12.
10.
9N
ot li
mite
d in
wor
k/ot
her
activ
iiies
0.2
0.2
0.2
0.2
0.2
0.2
0.9
0.4
1.1
032.
31.
01.
40.
402
0.2
0.4
0.7
Bas
ic L
ife
Act
iviti
esN
eeds
hel
p in
sel
f ca
re (
AD
L)
8.8
2.1
12.4
3.6
20.2
5.6
10.7
2.4
162
3213
.443
153
3.4
9.4
2.4
25.3
1.4
Nee
ds h
elp
in r
outin
e ac
tiviti
es (
IAD
L)
4.9
0.7
631.
07.
21.
172
0.8
9.4
0.8
6.8
1.5
10.7
0.7
5.5
0.7
7.8
43N
ot li
mite
d in
bas
ic li
fe a
ctiv
ities
0.2
0.2
0.2
0.2
0.2
0.2
1.0
0.5
1.2
0.4
330.
81.
60.
802
0.2
0.4
0.6
2t
-1

TA
BL
E B
-7. S
tand
ard
Err
ors
of E
stim
ates
of
Hos
pita
l Dis
char
ges
Per
100
Pers
ons
Per
Yea
r an
d A
vera
ge L
engt
h of
Sta
y Pe
r D
isch
arge
Am
ong
Adu
lts A
ged
18to
64,
by
Typ
e of
Hea
lthIn
sura
nce
Cov
era
e, D
isab
ilian
d H
ealth
Sta
tus,
b G
ende
r:U
nite
d St
ates
, 198
9
All
Pers
ons
Typ
e of
Hea
lth I
nsur
ance
Cov
erag
eA
llN
otIn
sure
dA
nyPr
ivat
ePr
ivat
eO
nly
Any
Publ
icPu
blic
Onl
yM
edic
are
Med
icai
dA
llIn
sure
d
HD
AL
OS
HD
AL
OS
HD
AL
OS
HD
AL
OS
HD
AL
OS
HD
AL
OS
HD
AL
OS
HD
AL
OS
HD
AID
S
All
Men
030.
40.
30.
40.
30.
42.
10.
82.
613
4.6
153.
71.
703
0.4
0.6
1.0
Age 18
-24
year
s25
-44
year
s45
-64
year
s
0.6
03 0.6
1.1
0.4
0.5
0.6
0.3
0.7
1.4
0.5
0.5
0.6
03 0.7
1.5
0.5
0.6
4.2
3.1
2.9
2.2
0.8 Ll
3.7
3.9
43
3.4
0.9
2.0
9.6
8.8
5.6
8.8
13 1.9
6.1
4.4
7.2
1.9
1.0
2.8
0.6
0.3
0.7
1.2
0.4
0.6
1.5
0.8
1.4
2.2
0.7
2.4
Hea
lth S
tatu
sE
xcel
lent
Ver
y
020.
40.
20.
40.
20.
41.
91.
93.
92.
7-
-4.
25.
00.
20.
40.
60.
8
good
Goo
d0.
40.
40.
40.
50.
40.
51.
92.
219
3.2
2.0
-2.
513
0.5
0.5
0.8
0.9
Fair
0.8
0.6
0.9
0.4
0.9
0.4
331.
33.
52.
16.
033
3.9
130.
90.
41.
62.
8
Poor
221.
03.
01.
53.
21.
84.
813
5.6
2.0
8.6
1.2
6.7
2.7
2_6
1.2
3.9
1.2
Unk
now
n5.
61.
010
.01.
012
.81.
07.
81.
69.
025
9.8
2.7
13.8
2.9
6.7
1.1
8.8
2.1
3.4
15.3
--
--
18.9
0319
.803
--
21.6
033.
303
8.1
333
Maj
or A
ctiv
ityU
nabl
e to
per
form
maj
or a
ctiv
ityL
imite
d3.
00.
84.
91.
05.
91.
44.
01.
04.
61.
56.
01.
663
1.9
3.4
0.8
6.7
1.6
in a
mou
nt/k
ind
of m
ajor
act
ivity
Lim
ited
1.9
0.8
2.4
0.9
2.6
1.0
4.7
3.1
5.4
7.4
6.6
2373
115
2.2
1.0
430.
9
in o
ther
act
ivity
1.8
0.4
2.0
032.
10.
47.
11.
711
.14.
613
.95.
213
.13.
82.
00.
42.
81.
2
Not
lim
ited
in a
ctiv
ity0.
20.
402
030.
20.
41.
413
1.9
1.9
1.8
-2.
322
0.2
030.
61.
5
Wor
k A
ctiv
ityU
nabl
e to
wor
k2.
90.
85.
01.
06.
01.
43,
91.
04.
51.
55.
71.
66.
21.
933
0.8
6.7
15L
imite
d in
am
ount
/kin
d of
wor
k1.
90.
825
0.9
2.6
1.0
5.0
335.
611
.18.
023
7.6
12.6
231.
043
0.9
Lim
ited
in o
ther
act
iviti
es1.
80.
82.
10.
42.
20.
573
3.8
10.1
8.0
19.4
9314
.03.
72.
10.
92.
51.
4
Not
lim
ited
in w
ork
/oth
er a
ctiv
ities
0.2
0.4
0.2
0.3
0.2
0.4
1.4
131.
91.
91.
8-
2.3
2.2
0.2
030.
61.
5
Bas
ic L
ife
Act
iviti
enN
eeds
hel
p in
sel
f ca
re (
AD
L)
14.9
2.9
19.8
4.8
39.2
7.6
16.6
3.5
26.4
5.0
18.8
5.9
28.8
5.2
15.0
3.4
49.5
1.5
Nee
ds h
elp
in r
outin
e ac
tiviti
es (
IAD
L)
631.
510
.222
14.4
2.9
731.
97.
71.
99.
52.
611
.01.
26.
81.
613
.61.
0
Not
lim
ited
in b
asic
life
act
iviti
es0.
203
0303
0303
1.8
0.7
2.3
1.0
4.8
0.9
3.1
1.4
0303
0.6
1.1

TA
BL
E 1
3-7.
Sta
ndar
d E
rror
s of
Est
imat
es o
f H
ospi
tal D
isch
arge
s Pe
r 10
0 Pe
rson
s Pe
r Y
ear
and
Ave
rage
Len
gth
of S
tay
Per
Dis
char
ge A
mon
g A
dults
Age
d 18
to 6
4, b
y T
ype
of H
ealth
Insu
ranc
e C
over
age,
Dis
abili
ty a
nd H
ealth
Sta
tus,
by
Gen
der:
Uni
ted
Stat
es, 1
989
Typ
e of
Hea
lth I
nsur
ance
Cov
erag
e
All
Pers
ono
Any
Priv
ate
Priv
ate
Onl
yM
yPu
blic
Publ
icO
nly
Med
icar
eM
edic
aid
All
Insu
red
All
Not
Insu
red
HD
AL
OS
HD
AL
OS
HD
AL
OS
HD
AL
OS
HD
AL
OS
HD
AL
OS
HD
AL
OS
HD
AL
OS
HD
AL
OS
All
Wom
en0.
30.
20.
30.
30.
302
1.5
0.6
1.8
0.5
4.5
1.0
2.1
0.8
0.3
0.2
0.6
0.7
Age 18
-24
year
s0.
70.
40.
70.
40.
60.
44.
00.
84.
50.
85.
20.
80.
90.
41.
01.
025
-44
year
s0.
30.
30.
30.
30.
30.
32.
11.
22.
20.
99.
82.
42.
51.
40.
40.
30.
70.
445
-64
year
s0.
60.
40.
70.
40.
60.
43.
00.
83.
70.
85.
40.
95.
21.
10.
70.
41.
52.
0
Hea
lth S
tatu
sE
xcel
lent
Ver
y0.
30.
50.
30.
50.
30.
41.
52.
62.
00.
47.
411
.12.
80.
403
0.5
0.8
1.1
good
Goo
d0.
40.
30.
40.
30.
40.
32.
00.
82.
41.
03.
91.
03.
01.
00.
40.
30.
90.
80.
503
0.7
030.
603
2.1
051.
80.
65.
12.
12.
60.
70.
60.
31.
0/ .
8Fa
ir1.
80.
72.
51.
02.
30.
84.
51.
84.
71.
29.
61.
15.
72.
32.
10.
83.
20.
7Po
or5.
70.
58.
20.
69.
20.
89.
50.
711
.40.
811
.61.
411
.80.
86.
60.
55.
22.
0U
nkno
wn
2.9
1.0
2.8
1.1
2.8
1.1
143
15.4
153
3.0
1.4
7.6
Mai
ar A
ctiv
ityU
nabl
e to
per
form
maj
or a
ctiv
ity3.
80.
84.
713
531.
16.
913
8.7
1.0
8.1
1.5
931.
74.
20.
95.
43.
3L
imite
d in
am
ount
/kin
d of
maj
or a
ctiv
ity2.
10.
52.
70,
62.
50.
56.
813
6.3
0.8
12.2
138.
21.
725
0.5
2.5
2.0
Lim
ited
in o
ther
act
ivity
1.6
0.6
1.9
0.7
2.0
0.8
4.4
1.1
5.0
1211
.913
4.7
LI
1.8
0.6
1.7
2.3
Not
lim
ited
in a
ctiv
ity0.
20.
20.
20.
20.
20.
21.
20.
41.
20.
53.
71.
21.
60.
50.
20.
20.
60.
5
Wor
k A
ctiv
ityU
nabl
e to
wor
k3.
00.
64.
10.
94.
30.
55.
41.
06.
30.
77.
01.
27.
013
3.4
0.6
4.0
3.1
Lim
ited
in a
mou
nt/k
ind
of w
ork
1.7
0.5
2.1
0.6
2.1
0.6
4.8
1.1
4.8
1.2
6.4
1.1
4.4
1.6
1.9
0.6
2.6
1.2
Lim
ited
in o
ther
itcd
vItle
a23
1.4
2.7
1.8
2.9
1.8
8.1
2.4
9.7
2.6
20.1
1.4
10.6
3.5
2.8
1.5
3.1
1.1
Not
lim
ited
In w
ork/
othe
r ac
tiviti
es0.
20.
20.
20.
20.
20.
21.
20.
41.
20.
53.
71.
21.
603
0.2
0.2
0.6
0.5
Bas
ic L
ife
Act
iviti
esN
eeds
hel
p in
sel
f ca
re (
AD
L)
9.6
2.7
14.2
5.2
19.9
7.8
12.9
2.6
17.6
3.3
20.1
2.8
14.6
3.6
10.8
3.1
17.4
1.0
Nee
ds h
elp
in r
outin
e ac
tiviti
es (
IAD
L)
6.6
0.8
7.6
0.8
7.7
1.0
11.7
0.7
15.3
0.8
11.1
1315
.10.
97.
40.
69.
46.
7N
ot li
mite
d in
bas
ic li
fe a
ctiv
ities
030.
20.
30.
20.
30.
213
0.8
1303
5.2
131.
71.
003
0.2
0.6
0.4
HD
.Hco
pita
l dis
char
ges
per
100
pers
ons
AL
OS.
Ave
rage
leng
th o
f st
ay p
er h
ospi
tal e
piso
de
- St
anda
rd e
rror
is e
xact
ly 0
or
is in
dete
rmin
ate
(too
few
Pri
mar
y Sa
mpl
ing
Uni
ts to
cal
cula
te e
rror
).
elj
(*)
*
kIL
I

TA
BL
E B
A S
tand
ard
Eff
ort o
f E
stim
ates
of
Hos
pita
l Dis
char
ges
Per
100
Pars
ons
and
Ave
rap
Len
gth
of S
tay
Per
Dis
char
ge P
er Y
ear
Am
ong
Chi
ldre
n A
ged
0-17
,by
Typ
e of
Hea
lth I
nsur
ance
Cov
erae
e, D
isab
ility
and
Hea
lth S
tatu
s, b
y G
ende
r:U
nite
d St
ates
, 198
9
All
Pers
ons
Typ
e of
Hea
lth I
nsur
ance
Cov
erag
e
All
Insu
red
All
Not
Insu
red
Any
Priv
ate
Priv
ate
Onl
yA
nyPu
blic
Publ
icO
nly
Med
icai
dM
ilita
ry
HD
AL
OS
HD
AL
OS
HD
AL
OS
HD
AL
OS
HD
AL
OS
HO
AL
OS
HI)
AL
OS
HD
AL
OS
HD
AL
OS
Tot
al0.
20.
50.
20.
60.
20.
60.
91.
00.
9L
l0.
90.
92.
70.
80.
20.
603
1.6
Ago 0-
4 ye
ars
5-17
0.5
0.7
0.6
1.1
0.6
1.1
2.1
0.5
2.2
0.5
2.2
0.6
6.7
0.6
0.6
0.7
132.
5
year
s0.
20.
80.
30.
80.
30.
80.
63.
20.
73.
60.
62.
91.
81.
70.
20.
90.
50.
7
Hea
lth S
tatu
sE
xcel
lent
Ver
y
0.2
0.8
0.2
0.6
0.2
0.6
1.1
0.8
1.2
0.6
1.1
0.9
3.3
1.3
0.2
0.5
0.5
6.0
good
0.4
1.4
0.5
1.8
0.5
1.8
0.8
1.3
0.9
1.4
0.9
131.
2-
0.4
1.6
0.8
1.1
Goo
dFa
ir0.
70.
60.
90.
80.
90.
81.
61.
11.
81.
11.
71.
26.
50.
50.
80.
613
1.6
3.0
2.3
3.0
3.1
3.2
3.1
5.0
4.7
5.3
4.7
4.8
1.2
41.3
1.8
3.3
2.7
7.4
1.1
Poor
24.5
2.8
42.6
1.0
31.4
1.5
56.3
4.3
51.3
5.2
563
4.3
--
33.2
3.2
18.7
1.1
Unk
now
n1.
51.
21.
71.
01.
71.
06.
12.
36.
62.
35.
62.
120
.4-
1.8
1.2
--
Ma)
or A
ctiv
ityU
nabl
e to
per
form
mal
or a
ctiv
ity14
.02.
319
.51.
317
.81.
534
.64.
435
.55.
135
.61.
310
6.3
-16
.52.
47.
233
Lim
ited
in a
mou
nt/k
ind
of m
ajor
act
ivity
251.
22.
72.
42.
82.
45.
00.
85.
80.
853
0.8
--
2.7
1.4
3.6
0.7
Lim
ited
in o
ther
act
ivity
Not
2.9
5.6
3.1
7.7
3.2
7.7
6.2
14.2
7.0
14.2
5.8
17.8
32.3
0,6
2.8
6.7
12.8
5.5
limite
d in
act
ivity
0.2
0.5
0.2
0.6
0.2
0.6
0.7
0.6
0.8
0.6
0.7
0.8
2.6
0.8
0.2
0.5
0.4
1.9
Bas
ic L
ife
Act
iviti
esN
eeds
hel
p in
sel
f ca
re (
AD
L)-
ages
5-1
712
.43.
822
.56.
627
.16.
611
.92.
214
.22.
212
.42.
2-
13.5
4.0
18.2
-N
ot li
mite
d in
bas
ic li
fe a
ctiv
ities
0.2
0.5
0.2
0.6
0.2
0.6
0.9
1.0
0.9
1.1
0.9
0.9
2.7
0.8
020.
60.
51.
6
t

TA
BL
E 1
1-8.
Sta
ndar
d E
no's
of
Est
imat
es o
f H
ospi
tal D
isch
arge
s Pe
r 10
0 Pe
rson
s an
dA
vera
ge L
engt
h of
Sta
y Pe
r D
isch
arge
Per
Yea
r A
mon
g C
hild
ren
Age
d 0-
17,
by T
ype
of H
ealth
Ins
uran
ce C
over
age,
Dis
abil
ity a
nd H
ealth
Sta
tus,
by
Gen
der:
Uni
ted
Stat
es, 1
989
Typ
e of
Hea
lth I
nsur
ance
Cov
erag
e
All
Pers
ons
Any
Priv
ate
Priv
ate
Onl
yA
nyPu
blic
Publ
icO
nly
Med
icai
dM
ilita
ryA
ilIn
sure
d
All
Not
Insu
red
HD
AL
OS
HD
AL
OS
HD
AL
OS
HD
AL
OS
HD
AL
OS
HD
AL
OS
HD
AL
OS
HD
AL
OS
HD
AL
OS
MI
Bay
s0.
30.
70.
41.
00.
41.
11.
31.
21.
31.
413
1.4
4.1
1.3
0.4
0.8
0.5
1.0
Age 0-
4 ye
ars
0.8
0.9
0.9
1.5
0.9
1.6
3.1
0.5
3.1
0.5
3.1
0.6
10.0
1.0
0.9
1.0
131.
85-
17 y
ears
031.
20.
41.
40.
41.
40.
84.
30.
95.
00.
95.
42.
42.
70.
31.
40.
60.
9
Hea
lth S
tatu
sE
xcel
lent
030.
70.
31.
003
1.0
2.0
0.8
2_2
0.6
1.9
0.6
5.6
1.9
030.
80.
62.
5V
ery
good
0.6
2.1
0.8
2.9
0.9
2.9
1.0
0.5
130.
71.
205
--
O.
2.5
1.2
1.4
Goo
d0.
90.
81.
30.
613
0.5
2.2
2.1
2.5
222.
42.
58.
80.
81.
10.
81.
32.
0Fa
ir3.
21.
93.
66.
13.
86.
16.
60.
87.
10.
86.
90.
852
.8-
3.6
2.2
5.9
0.9
Poor
28.0
7.0
70.1
1.2
18.7
3566
.88.
645
.812
.666
.88.
6-
40.6
7.5
12.4
-U
nkno
wn
2.7
1.5
2.7
0.7
2.7
0.7
12.3
2312
32.
311
.62.
132
-3-
331.
5-
Maj
or A
ctiv
ityU
nabl
e to
per
fonn
maj
or a
ctiv
ity14
.80.
823
50.
815
.21.
039
.91.
131
.01.
441
.21.
110
6.3
18.0
0.8
9.2
-L
imite
d In
am
ount
/kin
d of
maj
or a
ctiv
ity2.
71.
83.
03.
43.
23.
57.
21.
18.
41.
27.
7L
l-
-3.
12.
03.
50.
9L
imite
d in
oth
er a
ctiv
ity3.
68.
94.
312
.04.
512
.09.
116
.210
.516
.283
21.0
52.6
0.6
4.0
9.6
7.2
1.4
Not
lim
ited
in a
ctiv
ity03
0.6
030.
903
0.9
1.1
1.0
131.
01.
012
3.9
1503
0.7
0.5
1.1
Bas
ic L
ife
Act
iviti
esN
eeds
hel
p in
sel
f ca
re (
AD
L)-
ages
5-1
79.
58.
37.
5-
10.1
-14
.923
18.2
2315
.723
--
103
9.4
22.8
-N
ot li
mite
d in
bas
ic li
fe a
ctiv
ities
030.
70.
41.
00.
41.
113
131.
31.
413
1.5
4.1
1.3
0.4
0.8
0.5
1.0
0T

TA
BL
E B
-8. S
tand
ard
Err
ors
of E
stim
ates
of
Hos
pita
l Dis
char
ges
Per
100
Pers
ons
and
Ave
rage
Len
gth
of S
tay
Per
Dis
char
ge P
erY
ear
Am
ong
Chi
ldre
n A
ged
0-17
,by
Typ
e of
Hea
lth I
nsur
ance
Cov
erag
e, D
isab
ility
and
Hea
lth S
tatu
s, b
y G
ende
r: U
nite
d St
ates
, 198
9
All
Pers
ons
Typ
e of
Hea
lth I
nsur
ance
Cov
erag
e
Any
Publ
icPu
blic
Onl
yM
edic
aid
Mili
tary
All
Insu
red
All
Not
Insu
red
Any
Priv
ate
Priv
ate
Onl
y
HD
AL
OS
HD
AL
OS
HD
AL
OS
HD
AL
OS
HD
AL
OS
HI)
AL
OS
HD
AL
OS
HD
AL
OS
HD
AID
S
All
Gir
ls0.
30.
70.
30.
60.
30.
61.
11.
71.
21.
81.
20.
83.
20.
203
0.7
0.8
2.8
Age 0-
4 ye
ars
5-17
yea
rs
0.7
031.
20.
90.
60.
413 0.
40.
60.
41.
50.
42.
70.
91.
04.
72.
90.
91.
053
2.9
0.9
1.1
1.3
7.2
2.4
0.2
0.5
0.8
0.3
0.9
1.0
22 0.7
3.9
1.1
Hea
lth S
tatu
sE
xcel
lent
0.3
1.7
0.3
0.6
0.3
0.6
1.0
1.7
1.0
1.6
1.0
2.3
2.9
0.2
0.3
0.6
0.9
9.1
Vey
goo
d0.
40.
70.
50.
703
0.7
1.1
3.0
1.2
3.0
1.2
3.4
2.7
-0.
50.
80.
90.
5
Goo
d1.
01.
01.
31.
61.
31.
62.
20.
623
0.7
2.2
0.7
9.7
0.4
1.2
1.0
2.1
2.2
Fair
4.8
3.5
4.8
3.6
5.0
3.6
7.6
9.8
8.1
9.8
633.
078
.0-
4.8
4.3
15.0
1.5
Poor
36.2
1.2
q"..7
1.4
51.7
1.4
78.7
1.2
78.7
1278
.712
--
47.9
1.3
38.8
1.2
Unk
now
n1.
6-
2.2
-2.
2-
--
--
--
--
1.8
--
-M
ajor
Act
ivity
Una
ble
to p
erfo
rm m
ajor
act
ivity
26.0
3.7
32.3
2.0
35.1
2.0
60.1
7.7
69.5
7.7
61.6
1.6
--
29.6
3.7
11.6
-L
imite
d in
am
ount
/kin
d of
maj
or a
ctiv
ity4.
01.
65.
03.
25.
23.
263
0.9
7.0
0.9
6.6
0.9
--
4.3
1.8
731.
0
Lim
ited
in o
ther
act
ivity
4.7
3.1
4.5
1.3
4.6
1.3
4.9
-53
-53
--
-3.
713
30.8
6.4
Not
lim
ited
in a
ctiv
ity0.
20.
80.
20.
60.
307
0.9
0.8
0.9
0.8
0.8
1.0
3.2
020.
20.
50.
83.
4
Bas
ic L
ife
Act
iviti
esN
eeds
hel
p in
sel
f ca
re (
AD
L)-
ages
5-1
729
.62.
148
.12.
351
.323
15.2
-16
.9-
15.2
--
-31
22.
1-
-N
ot li
mite
dba
sic
life
activ
ities
0.3
0.8
030.
603
0.6
1.1
1.7
1.2
1.8
120.
83.
202
030.
70.
82.
8
HD
=H
ospi
tal d
isch
arge
s pe
r 10
0 pe
rson
sA
LO
S=A
vera
ge le
ngth
of
stay
per
hos
pita
l epi
sode
- St
anda
rd e
rror
is e
xact
ly 0
or
is in
dete
rmin
ate
(too
few
Pri
mar
y Sa
mpl
ing
Uni
ts to
cal
cula
te e
rror
).
2 I
i;C
)t.

TA
BL
E B
-9. S
tand
ard
Err
ors
of E
stim
ates
of
Sour
ce o
f H
ealth
Ins
uran
ce C
over
a e
Am
on A
dults
A e
d 18
to 6
4, b
Dis
abili
tH
ealth
Sta
tus,
Em
oen
t and
Pov
e, b
Gen
den
Uni
ted
Stat
es, 1
989
Of
Peop
le N
ot in
Pov
erty
, Per
cent
with
Priv
ate
No
Insu
ranc
eIn
sur-
Of
Peop
le in
Pov
erty
, Per
cent
with
Priv
ate
Insu
ranc
eN
oIr
tsur
-Pr
ivat
eFr
oman
cePr
ivat
eFr
oman
cePo
pu-
Perc
ent
Insu
ranc
e E
mpl
oyer
Rec
ent
No
and
Perc
ent
No
and
Insu
ranc
e E
mpl
oyer
Rec
ent
latio
nN
ot I
nPr
ivat
eFr
omIn
Ow
n E
mpl
oy-
Publ
icIn
sur-
Rec
ently
InPr
ivat
eFr
omIn
Ow
n E
mpl
oy-
Publ
icIn
sur-
Rec
ently
(1,0
00s)
Pov
erty
Ins
uran
ce E
mpl
oyer
Nam
em
ent I
nsur
ance
anc
e E
mpl
oyed
Pov
erty
Ins
uran
ce E
mpl
oyer
Nam
em
ent I
nsur
ance
anc
e E
mpl
oyed
Tot
al
Age
2,07
30.
403
030.
30.
20.
202
0.2
0.4
120.
90.
50.
80.
81.
00.
7
18-2
4 ye
ars
25-4
458
11.
00.
70.
70.
60.
50.
30.
60.
51.
02.
51.
90.
61.
41.
11.
813
year
s45
-64
1,13
50.
40.
30.
40.
30.
202
0.3
030.
41.
10.
90.
60.
91.
01.
20.
8ye
ars
Hea
lth S
tatu
s71
003
030.
50.
40.
40.
30.
30.
203
121.
10.
81.
21.
21.
20.
8
Exc
elle
ntV
ery
good
Goo
dFa
ir
1,00
769
359
1
0.3
0.4
0.6
0.4
0.4
0.5
0.4
0.5
0.5
0.4
0.4
0.5
03 03 0.4
0.2
02 0.3
03 0.4
0.4
03 03 03
0.3
0.4
0.6
1.9
2.0
1 1
1.6
1.7
1.2
0.9
0.9
0.7
1.3 12 12
0.9 12 1.1
1.7
1135
1.3
11:1
1
Poor
222
0.9
0.8
0.9
1.0
1.0
0.8
0.7
0.6
0.9
1.4
120.
91.
51.
61.
612
Unk
now
n11
51.
61.
51.
61.
61.
71.
61.
00.
81.
61.
61.
30.
91.
41.
92.
01.
0
Maj
or A
ctiv
ity48
3.4
4.6
5.0
4.3
3.4
1.7
4.8
3.8
3.4
7.0
7.0
338.
99.
892
9.0
Una
ble
to p
erfo
rm m
ak:a
-act
ivity
Lim
ited
177
1.1
1.1
L1
0.9
1.0
1.2
0.7
0.5
1.1
131.
10.
81.
11.
412
0.7
in a
mou
nt/k
ind
of m
ajor
act
ivity
Lim
ited
in20
20.
90.
91.
01.
00.
90.
70.
80.
60.
91.
91.
71.
42.
222
2.2
1.4
othe
r ac
tivity
Not
lim
ited
156
0.9
0.9
1.1
121.
10.
60.
80.
70.
92.
21.
91.
42.
12.
627
1.7
in a
ctiv
ityW
ork
Act
ivity
1,87
50.
403
0.4
0.3
0202
030.
20.
41.
31.
10.
60.
80.
71.
10.
9
Una
ble
to w
ork
Lim
ited
LT
1.0
1.0
1.1
0.9
0.9
1.1
0.7
0.4
1.0
121.
00.
70.
91.
412
0.6
in a
mou
nt/k
ind
of w
ork
Lim
ited
in20
10.
90.
91.
01.
00.
90.
60.
80.
70.
92.
11.
91.
52.
524
231.
7ot
her
activ
ities
Not
lim
ited
in13
80.
91.
012
1.2
1.1
0.7
0.8
0.8
0.9
2.6
2.3
1.7
242.
632
2.0
wor
k/ot
her
activ
ities
Em
ploy
men
t Sta
tus
1,87
50.
40.
30.
40.
302
0.2
0302
0.4
1.3
1.1
0.6
0.8
0.7
1.1
0.9
Cur
rent
ly e
mpl
oyed
Une
mpl
oyed
1,62
70.
30.
303
03-
0.1
0303
031.
312
0.8
-0.
513
13
Not
144
1.4
1.4
1.4
1.2
-0.
81.
4-
1.4
1.8
1.4
0.8
-22
26-
in la
bor
forc
eB
asic
Lif
e A
ctiv
ities
568
0.8
0.5
0.6
0.4
-0.
50.
4-
0.8
1.4
1.1
03-
1.3
1.1
-N
eeds
hel
p in
sel
f ca
re (
AD
L)
Nee
ds h
elp
3922
333.
533
2.7
332.
30.
82.
23.
429
1532
3.8
2.9
13in
rou
tine
activ
ities
(IA
DL
)N
ot li
mite
d87
1.8
2.0
2.0
1.8
2.0
2112
0.9
1.8
2.0
1.8
1.3
1.5
2721
0.9
in b
asic
life
act
ivili
esPo
vert
y L
evel
2,04
50.
40.
303
0302
1.6
0202
0.4
1.2
1.0
0.5
0.8
0.8
1.0
0.7
Und
er 0
.50
0.50
333
--
--
--
--
-26
1.8
0.5
151.
92.
21.
2to
und
er 1
.00
286
--
--
--
--
-1.
21.
10.
61.
11.
11.
21.
01.
00 to
und
er 1
.25
215
--
--
--
--
-1.
51.
50.
91.
00.
813
1.1
1.25
to u
nder
1.5
021
5-
1.3
130.
81.
00.
713
1.0
--
--
--
--
1.50
to u
nder
1.7
528
3-
1.0
1.1
0.6
0.7
0.6
0.9
0.7
--
--
--
--
1.73
to u
nder
2.0
042
8-
0.6
0.7
0.5
0.5
030.
60.
5-
--
--
--
-2.
00 a
nd a
bove
1,48
1-
0303
0.3
0.2
0.2
020.
2-
--
--
--
-

TA
BL
E B
-9. S
tand
ard
Err
ors
of E
stim
ates
of
Sour
ce o
f H
ealth
Ins
uran
ce C
over
age
Am
ong
Adu
lts A
ged
18 to
64,
by
Dis
abili
ty, H
ealth
Sta
tus,
Em
plo
ymen
t and
Pove
rty,
by
Gen
der:
Uni
ted
Stat
es, 1
989
Of
Peop
le N
ot in
Pov
erty
, Per
cent
with
Of
Peop
le in
Pov
erty
, Per
cent
with
Priv
ate
No
Priv
ate
No
Insu
ranc
eIn
sur-
Insu
ranc
eIn
sur-
Priv
ate
From
ance
Priv
ate
From
ance
Popu
- Pe
rcen
tIn
sura
nce
Em
ploy
er R
ecen
tN
oan
dPe
rcen
tIn
sura
nce
Em
ploy
er R
ecen
tN
oan
dla
tion
Not
In
Priv
ate
From
In O
wn
Em
ploy
- Pu
blic
Insu
r- R
ecen
tlyIn
Priv
ate
From
In O
wn
Em
ploy
- Pu
blic
Insu
r- R
ecen
tly(L
000s
) Po
vert
y In
sura
nce
Em
ploy
er N
ame
men
t Ins
uran
ce a
nce
Em
ploy
ed P
over
ty I
nsur
ance
Em
ploy
er N
ame
men
t Ins
uran
ce a
nce
Em
ploy
ed
All
Men
1,09
70.
40.
30.
40.
40.
20.
20.
30.
30.
41.
41.
20.
71.
20.
81.
31.
2A
ge 18-2
4 ye
ars
348
1.1
0.8
0.9
0.9
0.7
0.3
0.7
0.7
1.1
3.0
2.4
1.1
2.2
1.0
2.6
2.2
25-4
4 ye
ars
598
0.3
0.4
0.5
0.6
0.2
0.2
0.4
0.3
031.
31.
21.
113
1.1
1.6
1.4
45-6
4 ye
ars
359
030.
405
0.6
0.5
0.4
0.3
0.3
0.3
1.6
1.5
1.4
1.9
1.7
1.8
1.4
Hea
lth S
tatu
sE
xcel
lent
579
0.4
0.4
0.5
0.6
0.2
0.2
0.4
030.
42.
21.
91.
41.
80.
72.
12.
0V
ery
good
364
0.5
050.
60.
60.
30.
205
0.4
0.5
2.8
2.4
1.8
2.0
1.1
232.
1G
ood
309
0.6
0.7
0.7
0.7
030.
40.
60.
60.
61.
51.
61.
21.
61.
22.
01.
9Fa
ir11
412
131.
41.
513
1.2
1.0
0.9
1.2
2.1
1.8
1.6
2.5
2.4
2.6
2.4
Poor
692.
22.
223
2.2
2.4
2.3
1.4
122.
22.
52.
22.
02.
62.
92.
91.
7U
nkno
wn
244.
26.
77.
36.
55.
63.
46.
76.
342
6.6
6.6
6.6
11.5
11.5
12.1
11.6
Maj
or A
ctiv
ityU
nabl
e to
per
form
maj
or a
ctiv
ity11
21.
31.
41.
413
1.4
1.5
0.9
0.6
1.3
1.5
1.4
1.1
1.4
1.9
1.9
1.0
Lim
ited
in a
rnou
nt/k
ind
of m
ajor
act
ivity
123
1.1
131.
51.
41.
21.
01.
21.
01.
13.
63.
12.
73.
63.
33.
72.
6L
imite
d in
oth
er a
ctiv
ity81
1.0
1.2
1.3
1.6
1.2
0.9
1.1
1.2
1.0
4.8
433.
65.
64.
952
4.3
Not
lim
ited
in a
ctiv
ity1,
004
0.4
0.3
0.4
0.5
0.2
0.1
0303
0.4
1.7
1.4
1.0
1.4
0.7
1.6
1.5
Wor
k A
ctiv
ityU
nabl
e to
wor
k11
613
1.5
1.5
1.4
1.4
1.6
0.9
0.6
1.3
1.5
131.
013
1.8
1.8
0.9
Lim
ited
in a
mou
nt/k
ind
of w
ork
121
1.1
1.3
1.5
1.4
1.2
1.0
121.
11.
13.
63.
12.
83.
73.
43.
62.
7L
imite
d in
oth
er a
ctiv
ities
831.
01.
213
1.6
1.1
0.9
1.1
1.1
1.0
5.1
5.0
4.1
554.
25.
74.
7N
ot li
mite
d in
wor
k/ot
her
activ
ities
1,00
40.
40.
3.0.
40.
50.
20.
10.
30.
30.
41.
71.
41.
01.
40.
71.
61.
5E
mpl
oym
ent S
tatu
sC
urre
ntly
em
ploy
ed92
70.
30.
30.
40.
4-
0.1
0303
0.3
1.5
1.4
1.1
-0.
41.
61.
6U
nem
ploy
ed10
11.
72.
02.
01.
9-
1.0
2.1
-1.
72.
11.
81.
2-
3.0
3.6
-N
ot in
labo
r fo
rce
256
1.2
1.0
1.0
1.0
-1.
00.
8-
1.2
2.5
2.1
0.7
-2.
21.
5B
asic
Lif
e A
ctiv
itis
Nee
ds h
elp
in s
elf
care
(A
DI.
)28
3.3
5.0
4.9
4.7
3.9
4.8
3.2
1.1
335.
65.
53.
44.
95.
42.
21.
1N
eeds
hel
p in
rou
tine
activ
ities
(IA
DI.
)49
2.9
3.2
333.
03.
33.
41.
91.
22.
93.
13.
22.
92.
83.
83.
11.
6N
ot li
mite
d in
bas
ic li
fe a
ctiv
itiec
1,08
20.
40.
30.
40.
40.
20.
203
030.
41.
51.
20.
81.
20.
813
1.2
Pove
rty
Lev
elU
nder
0.5
016
4-
--
--
--
--
3.2
2.3
0.8
2.6
2.1
2.9
2.5
0.50
to u
nder
1.0
013
9-
--
--
--
-1
61.
41.
01.
61.
11.
61.
61.
00 to
und
er l.
2511
1-
--
--
--
--
1.8
1.8
1.5
1.4
0.9
1.8
1.9
1.25
to u
nder
1.5
011
5-
1.6
1.5
131.
20.
81.
61.
5-
--
--
--
-1.
50 to
und
er 1
.75
155
-1.
21.
31.
20.
90.
612
1.0
--
--
--
1.75
to u
nder
2.0
021
8-
0.7
0.8
0.8
0.6
0.4
0.7
0.6
--
--
--
2.00
and
abo
ve77
3-
0.3
0.4
0.4
0.2
0.2
030-
3-
--
--
--
52,
ot

TA
BL
E 8
-9. S
tand
ard
Err
ors
of E
stim
ates
of
Sour
ce o
f H
ealth
Ins
uran
ce C
over
age
Am
ong
Adu
lts A
ged
16 to
64,
by
Dis
abili
ty, H
ealth
Sta
tus,
Em
ploy
men
t and
Pov
erty
, by
Gen
der:
Uni
ted
Stat
es, 1
989
Of
Peop
le N
ot in
Pov
erty
, Per
cent
with
Of
Peop
le in
Pov
erty
, Per
cent
with
Priv
ate
No
Priv
ate
No
Insu
ranc
eIn
cur-
Insu
ranc
eIn
sur-
Priv
ate
From
ance
Priv
ate
From
ance
Popu
- Pe
rcen
tIn
sura
nce
Em
ploy
er R
ecen
tN
oan
dPe
rcen
tIn
sura
nce
Em
ploy
er R
ecen
tN
oan
dla
tion
Not
In
Priv
ate
From
In O
wn
Em
ploy
- Pu
blic
Incu
r- R
ecen
tlyIn
Priv
ate
Fron
tIn
Ow
n E
mpl
oy-
Publ
icIn
cur-
Rec
ently
(1,0
00s)
Pov
erty
Ins
uran
ce E
mpl
oyer
Nam
em
ent I
nsur
ance
anc
e E
mpl
oyed
Pov
erty
Ins
uran
ce E
mpl
oyer
Nam
em
ent I
nsur
ance
anc
e E
mpl
oyed
All
Wom
en1,
037
0.4
030.
40.
40.
30.
20.
30.
20.
41.
31.
00.
50.
91.
01.
00.
6A
ge 18-2
4 ye
ars
301
120.
90.
90.
80.
70.
60.
80.
71.
22.
92.
40.
71.
71.
71.
91.
025
-44
year
s58
40.
40.
40.
40.
50.
40.
20.
40.
30.
41.
20.
90.
71.
31.
212
0.9
45-6
4 ye
ars
383
0.4
0.3
0.5
0.5
0.5
0.3
0.3
0.2
0.4
131.
21.
01.
41.
41.
40.
9H
ealth
Sta
tus
Exc
elle
nt48
30.
40.
40.
50.
60.
50.
20.
40.
30.
42.
11.
91.
21.
61.
41.
81.
2V
ery
good
378
0.5
0.4
0.5
0.5
0.5
0.2
0.4
0.3
0.5
2.0
1.7
1.0
1.5
1.6
1.6
1.1
Goo
d33
20.
70.
50.
60.
70.
60.
40.
50.
40.
71.
51.
20.
81.
41.
41.
41.
0Fa
ir14
11.
21.
01.
11.
31.
40.
90.
90.
71.
21.
61.
41.
11.
71.
91.
91.
2Po
or75
2.0
232.
52.
12.
42.
21.
61.
02.
02.
11.
51.
01.
62.
72.
71.
0U
nkno
wn
324.
14.
14.
85.
34.
11.
643
2.9
4.1
8.5
8.5
2.6
12.4
10.7
10.4
12.2
Maj
or A
ctiv
ityU
nabl
e to
per
form
maj
or a
ctiv
ity10
61.
51.
61.
71.
41.
61.
91.
20.
91.
51.
91.
61.
11.
32.
52.
10.
9L
imite
d in
am
ount
/kin
d of
maj
or a
ctiv
ity11
71.
11.
21.
41.
41.
30.
91.
00.
71.
12.
31.
91.
52.
72.
62.
71.
8L
imite
d in
oth
er a
ctiv
ity10
71.
213
1.6
1.5
1.7
0.9
1.0
0.9
1.2
2.5
2.1
132.
42.
81.
71.
5N
ot li
mite
d in
activ
ity93
00.
40.
30.
40.
403
0.2
0.3
0.2
0.4
1.4
1.2
0.6
1.0
1.0
1.1
0.7
Wor
k A
ctiv
ityU
nabI
e to
wor
k12
91.
31.
41.
41.
113
1.6
1.0
0.6
1313
130.
81.
02.
21.
90.
6L
imite
d in
am
ount
/kin
d of
wor
k11
81.
11.
213
1.5
1.4
0.9
1.0
0.8
1.1
3.0
2.5
2.0
3.2
3.0
3.2
2.5
Lim
ited
in o
ther
act
iviti
es89
1.3
1.4
1.7
1.7
1.7
0.9
1.1
1.0
1.3
3.1
2.5
1.6
2.8
2.9
3.2
1.9
Not
lim
ited
in w
ork/
othe
r ac
tiviti
es93
00.
40.
30.
40.
40.
30.
20.
30.
20.
41.
41.
20.
61.
01.
01.
10.
7E
mpl
oym
ent S
tatu
sC
urre
ntly
em
ploy
ed76
003
0.3
0.4
0.4
-0.
20.
30.
303
1.7
1.5
1.1
-0.
91.
41.
4U
nem
ploy
ed82
1.7
1.9
2.0
1.7
-1.
11.
91.
72.
52.
01.
1-
2.8
2.8
-N
ot in
labo
r fo
rce
388
0.8
0.5
0.6
03-
0.5
0.4
-0.
81.
21.
003
-13
13B
ask
Lif
e A
ctiv
ities
Nee
ds h
elp
in s
elf
care
(A
DL
)34
3.2
4.9
5.2
4.5
3.1
4.8
3.4
1.3
3.2
4.1
2.9
-42
4.9
4.6
2.1
Nee
ds h
elp
in r
outin
e ac
tiviti
es (
1AD
L)
632.
22.
42.
523
2.5
2.6
1.6
1.2
2.2
2.8
2.3
1.4
1.8
3.5
3.0
1.1
Not
lim
ited
in b
asic
life
act
iviti
es1,
021
0.4
030.
40.
403
0.2
030.
20.
41.
31.
00.
50.
91.
01.
00.
6Po
vert
y i,e
vel
Und
er 0
.50
205
--
--
--
--
-2.
92.
1O
S1.
82.
32.
11.
1
0.50
to u
nder
1.0
017
2-
--
--
--
--
131.
10.
71.
313
1.2
0.8
1.00
to u
nder
1.2
512
2-
--
--
--
--
151.
51.
113
1.2
131.
01.
25 to
und
er 1
.50
111
-1.
413
1.0
1.4
1.0
1.4
1.0
--
--
--
--
130
to u
nder
1.7
514
6-
1.1
121.
01.
10.
71.
00.
8-
--
--
1.75
to u
nder
2.0
023
3-
0.7
0.8
0.8
0.8
0.4
0.7
0.6
--
--
-2.
00 a
nd a
bove
738
-03
0.4
0.4
0.3
0.2
0.2
0.2
--
--
-St
anda
rd e
rror
is e
xact
ly 0
or
is in
dete
rmin
ate
(too
few
Pri
mar
y Sa
mpl
ing
Uni
ts to
cal
cula
te e
rror
).

TA
BL
E B
-10.
Sta
ndar
d E
rror
s of
Est
imat
es o
f So
urce
of
Hea
lth I
nsur
ance
Cov
erag
e A
mon
g C
hild
ren
Age
d 0
to 1
7, b
y D
isab
ility
, Hea
lth S
tatu
s, E
mpl
oym
ent a
nd P
over
ty,
by G
ende
r: U
nite
d St
ates
, 198
9
Popu
latio
n(1
,000
s)
Perc
ent
Not
In
Pove
rty
Of
Peop
le N
ot in
Pov
erty
, Per
cent
with
Of
Peop
le in
Pov
erty
, Per
cent
with
Priv
a te
Insu
ranc
eN
oPr
ivat
eFr
omPu
blic
Insu
r-In
sura
nce
Em
ploy
erIn
sura
nce
ance
Priv
a te
Perc
ent
Insu
ranc
eN
oIn
Priv
ate
From
Publ
icIn
stir
-Po
veT
ty I
nsur
ance
Em
ploy
er I
nsur
ance
anc
e
Tot
al
Age
1,11
50.
80.
50.
50.
30.
30.
81.
21.
11.
41.
5
0-4
year
s40
00.
90.
60.
80.
50.
50.
91.
31.
21.
81.
7
4-17
yea
rsH
ealth
Sta
tus
807
0.8
0.5
0.6
0.3
0.4
0.8
1.4
1.2
1.4
1.5
Exc
elle
nt60
90.
70.
40.
60.
30.
30.
71.
71.
61.
82.
0
Ver
y go
od40
61.
00.
80.
90.
50.
71.
02.
01.
82.
11.
6G
ood
350
1.4
0.9
1.1
0.6
0.8
1.4
1.7
1.4
2.0
2.0
Fair
822.
52.
82.
92.
11.
82.
53.
02.
94.
23.
7Po
or22
6.2
9.6
9.6
6.5
8.7
6.2
5.6
4.8
8.0
8.1
Unk
now
n
Maj
or A
ctiv
ity
583.
73.
44.
92.
03.
03.
77.
96.
77.
88.
3
Una
ble
to p
erfo
rm m
ajor
act
ivity
324.
85.
35.
34.
03.
84.
85.
85.
66.
96.
2L
imite
d in
arn
oun
t/kin
d of
maj
or a
ctiv
ity87
1.8
2.1
2.2
1.8
1.6
1.8
2.6
2.1
3.1
3.0
Um
ited
in o
ther
act
ivity
582.
51.
92.
21.
51.
62.
54.
23.
74.
93.
7N
ot li
mite
d in
act
ivity
Bas
ic L
ife
Act
iviti
es1,
062
0.8
0.5
0.5
0.3
0.3
0.8
1.3
1.1
1.4
1.5
Nee
ds h
elp
in s
elf
care
(A
DL
)-ag
es 5
-17
245.
210
.19.
610
.14.
45.
25.
15.
17.
05.
6N
ot li
mite
d in
bas
ic li
fe a
ctiv
ities
Pove
rty
Lev
el1,
112
0.8
0.5
0.5
0.3
0.3
0.8
1.2
1.1
1.4
1.5
uliJ
er 0
50
339
1.6
1.1
3.2
3.1
0 30
to u
nder
1 0
030
31.
31.
32.
22.
01.
00 to
und
er 1
25
219
--
--
2.0
2.2
1.6
1.6
1.25
to u
nder
1.5
020
81.
91.
91.
11.
6-
--
-1.
50 to
und
er 1
.75
248
1.1
1.3
0.8
0.9
1.75
to u
nder
2.0
027
70.
70.
80.
40.
52.
00 a
nd a
bove
504
0.4
0.5
0.3
0.3

TA
BL
E B
-10.
Sta
ndar
d E
rror
s of
Est
imat
es o
f So
urce
of
Hea
lth I
nsur
ance
Cov
erag
e A
mon
g C
hild
ren
Age
d 0
to 1
7, b
y D
isab
ility
, Hea
lth S
tatu
s, E
mpl
oym
ent a
nd P
over
ty,
by G
ende
r U
nite
d St
ates
, 198
9
Popu
latio
n(1
,000
s)
Perc
ent
Not
In
Pove
rty
Of
Peop
le N
ot in
Pov
erty
, Per
mnt
with
Perc
ent
InPo
vert
y
Of
Peop
le in
Pov
erty
, Per
cent
with
Priv
ate
Insu
ranc
eN
oPr
ivat
eFr
omPu
blic
Insu
r-In
sura
nce
Em
ploy
erIn
sura
nce
ancv
Priv
a te
Insu
ranc
eN
oPr
ivat
eFr
omPu
blic
Insu
r-In
sura
nceE
mpl
oyer
Ins
uran
ce a
nce
All
Boy
s58
60.
70.
50.
60.
40.
40.
71.
31.
21.
41.
4
Age 0-
4 ye
ars
228
1.0
0.9
1.1
0.6
0.7
1.0
1.7
1.6
2.1
2.0
4-17
yea
rs43
90.
80.
60.
70.
40.
40.
81.
51.
41.
41.
5
Hea
lth S
tatu
sE
xcel
lent
304
0.7
0.5
0.7
0.4
0.4
0.7
1.9
1.8
1.8
1.9
Ver
y go
od26
01.
21.
01.
20.
70.
81.
22.
12.
02.
11.
9
Goo
d20
21.
71.
21.
30.
91.
01.
72.
01.
72.
02.
4
Fair
563.
13.
53.
72.
82.
93.
14.
03.
95.
65.
0
Poor
147.
313
.513
.511
.810
.47.
37.
45.
210
.010
.0
Unk
now
n37
5.1
4.9
6.5
2.8
4.1
5.1
7.9
7.0
8.6
9.1
Maj
or A
ctiv
ityU
nabl
e to
per
form
maj
or a
ctiv
ity25
5.6
6.9
6.9
5.0
5.0
5.6
6.8
6.2
9.3
8.7
Lim
ited
in a
mou
nt/k
ind
of m
ajor
act
ivity
652.
02.
62.
72.
12.
12.
03.
02.
73.
73.
3
Lim
ited
in o
ther
act
ivity
422.
92.
63.
02.
02.
12.
94.
83.
95.
54.
8
Not
lim
ited
in a
ctiv
ity34
70.
70.
60.
70.
40.
40.
71.
41.
31.
51.
3
Bas
ic L
ife
Act
iviti
esN
eeds
hel
p in
sel
f ca
re (
AD
L)-
ages
5-1
722
7.2
13.7
12.4
13.5
6.5
7.2
4.8
4.8
7.0
7.0
Not
lim
ited
in b
asic
life
act
iviti
es58
40.
70.
50.
60.
40.
40.
71.
31.
21.
41.
4
Pove
rty
Lev
elU
nder
0.5
016
9-
--
--
-1.
71.
33.
03.
0
0.50
to u
nder
1.0
015
2-
--
--
-1.
61.
52.
12.
1
1.00
to u
nder
1.2
512
4-
--
--
-2.
42.
61.
72.
0
1.25
to u
nder
1.5
011
9-
2.1
2.0
1.3
1.8
--
--
-1.
50 to
und
er 1
.75
147
-1.
31.
51.
01.
0-
--
1.75
to u
nder
2.0
015
5-
1.0
1.1
0.5
0.8
--
-2.
00 a
nd a
bove
266
-0.
50.
70.
30.
4-
--
-
1")

TA
BL
E B
-10.
Sta
ndar
d E
rror
s of
Est
imat
es o
f So
urce
of
Hea
lth I
nsur
ance
Cov
erag
e A
mon
g C
hild
ren
Age
d 0
to 1
7, b
y D
isab
ility
, Hea
lth S
tatu
s, E
mpl
oym
ent a
nd P
over
ty,
by G
ende
n U
nite
d St
ates
, 198
9
Popu
latio
n
Perc
ent
Not
In
Of
Peop
le N
ot in
Pov
erty
, Per
cent
with
Perc
ent
In
Of
Peop
le in
Pov
erty
, Per
cent
with
Priv
ate
Insu
ranc
eN
oPr
ivat
eFr
omPu
blic
Insu
r-
Priv
ate
Insu
ranc
eN
oPr
ivat
eFr
omPu
blic
Insu
r-(1
,000
s)Po
vert
yIn
sura
nce
Em
ploy
erIn
sura
nce
ance
Pove
rty
Insu
ranc
eEm
ploy
er I
nsur
ance
ance
All
Gir
lsA
ge
608
0.9
0.6
0.6
0.3
0.4
0.9
1.3
1.1
1.6
1.7
0-4
year
s22
31.
00.
80.
90.
60.
61.
01.
51.
42.
11.
9
4-17
yea
rsH
ealth
Sta
tus
441
0.9
0.6
0.7
030.
50.
913
1.3
1.7
1.9
Exc
elle
nt37
61.
00.
60.
70.
40.
41.
01.
91.
72.
32.
6
Ver
y go
od20
91.
21.
11.
10.
50.
91.
214
2.3
2.5
1.9
Goo
d17
81.
51.
21.
40.
71.
01.
51.
91.
62.
42.
2Fa
ir44
3.2
3.5
3.9
2.7
2.3
3.2
3.8
3.7
4.5
4.1
Poor
188.
713
.113
.17.
512
.68.
77.
37.
312
.112
.6
Unk
now
nM
ajor
Act
ivity
3333
3.8
532.
63.
13.
39.
47.
69.
99.
6
Una
ble
to p
erfo
rm m
ajor
act
ivity
206.
96.
76.
97.
05.
26.
98.
58.
59.
17.
5
Lim
ited
in a
mou
nt/k
ind
of m
ajor
act
ivity
462.
93.
03.
12.
82.
52.
93.
73.
24.
34.
6L
imite
d in
oth
er a
ctiv
ity32
3.5
2.9
3.2
2.1
2.4
3.5
7.1
6.6
7.9
5.4
Not
lim
ited
in -
-_-
tivity
Bas
ic L
ife
Act
iviti
es59
10.
90.
50.
603
0.4
0.9
1.3
1.2
1.6
1.7
Nee
ds h
elp
in s
elf
care
(A
DL
)-ag
es 5
-17
126.
910
.811
.211
34.
46.
915
.415
.416
.48.
5
Not
lim
ited
in b
asic
life
act
iviti
esPo
vert
y L
evel
607
0.9
0.6
0.6
030.
40.
913
1.1
1.6
1.7
Und
er 0
.50
184
--
--
--
1.8
1.2
3.7
3.6
0.50
to u
nder
1.0
017
7-
--
--
-1.
51.
42.
52.
2
1.00
to u
nder
1.2
512
1-
--
--
-2.
32.
52.
01.
9
1.25
to u
nder
l.50
116
-2.
423
132.
3-
--
-1.
50 to
und
er 1
.75
139
-13
1.5
0.9
1.0
--
--
-1.
75 to
und
er 2
.00
161
-0.
80.
90.
50.
7-
--
--
2.00
and
abo
ve27
7-
0.4
0.6
030.
4-
--
--
- St
anda
rd e
rror
is e
xact
ly 0
or
is in
dete
rmin
ate
(too
few
Pri
mar
y Sa
mpl
ing
Uni
ts to
cal
cula
te e
rror
).
tn."

146
APPENDIX CQUESTIONNAIRES
2 3 0
Disability and health insurance

Disability anti health insurance 147
1984 NHIS INSURANCEQUESTIONNAIRES

148 Disability and health insurance
M. HEALTH INSURANCE PAGERead
MedicaremodSnow
to rescandentIstle Social Securtty health immeancePeople by Medicate
program km disabled persona and ter prseew 118 years ekta card that leek. like Mk.ewer. severed bore
cod.
1 a. I.
b. I.anyone 11( Mae terally. that I. ((rod names', mew revered by Medlcare7. ,-.., Yes 0 No 141 3 DIC
- - ittw cerwed7 lb. t -.. Coveted e 0 OK
Ate2a. la
Mart
b. lawhich
tor each person with "Covered" es lb:- - new revered by MS part et Sesta" Smerity
box wo person's Colonel
- - mew revered by *et part ed Medicare- -
Medicare which pays ter Iteetskd We
which pays IM doctor's idle? This fa the Merlicars plan terarmouM each rnooth. Mark box m porton 'a column
2a
b.
i C Yea 3-1i t- No
I 0 Yes s ..... OK
2 ,.., NOet *erne eleacy meet pay a wedeln
Ash tot each person wrfft "'OK- et 2e eAdier k3. May I diem' me Me Social Security Medicare card's) fee - - OM - -lie determine the type et corerage?
Transchbr rh snforinetron horn the card or mire Ithe "Cird N.A." box.3.
I L., nowt&7 0 Medic*1 0 Cud N A
W. me Intereated let ell kink et heaMt keereroce4a. Ileal counting Modica* I. ammo's( Me bray
plan elickh pays my part el beephiel. donee.
b. What I. the name et elve emio "Komi* Tabb
a. la anyone in the Welly mew *rimed by awy eastwhich pays any part el a limphal. Melees (sr
ter
r- - -
piens except them which pay way accidents.weer severed by a healds imatmeocere eurimesee bIll? 0 Yee 0 No (MI1 0 OK IMI)
N.I. ,
bead* InOWINICO plaitemodeed's MN? U Yea (Rusk 4b end el 0 No (SITatou Di.
PLAN I Se. Ow Ws prom pay say pad el lesepleedeepoome?
7.1 0 Coveted IMP:3 0 KM Cowered INP/
7. le - - wowedOdeed. Was
so1
b. I;1
Ode leamot Men ebealred dem*employer ea meleal0 um 1 0 Ns (S/ e 0 DK le/li iw-eZpiayie-ee'ete-
1 0 Yee 2 0 N. II 0 OKb. Dere Mk elm MT orn MA el doclor..01
AM ter
marO.= pawl
IMMiew.deeliirMaele0 Yee 2 0 N. 0 ON
Plistssles emokokla1 0 YIN : 0 of. IP 0 OK
PLAN 3 Om Nees deleplen pay my peel et Neeplealeepereser
7. le - - emendwade OMInevelpient
1.t 0 covetid ININ7 0 Not covered 001
Oa. WasMN
1
b. ca10yse
ilde 1,N=g Mon ellealaed arm.firvirre III widow? 1 0 Vile 2 0 PIO e 0 OK
b. Dem OM pko pay my pod el tlemere etwegemeo We het
0 vs. 2 0 ri. lc . 0 DK rs,lir;rn; Gioia; Medd& ."-m;s4.1..-er-ea-ter;17
70/re il 0 OKeparedenst
t 0 yes 3 0 lie II 0 OK110 PLAN 3 U. Dew Weiler( pay my pem of Seepdal 7. le - - amend 7.
.
pc w.,
spritsb. I.
IC
pd. lewngloimpg aboamel drew*m emedopee es memo?
espeemeal
i 0 Vs* 2 0 lie S 0 OKb. Dem thie elm pay say pert et memor. er
mrpeee'e bIlle Om
soder OatMemel plea?
3014p rs, .0 cm fe,8; "II illi taler-or.Mile;e2-^;"; t'-'1.401
eve 30 we, *Optapeeedema
10Vm 2 ON* .Cloc
M1
---Neva.* 1 sod 7 for each person and determine re "Covered- by either Medium. endlor entwine*. or "Nee covered.
IN 1
AMIle.{Many
Any
b.
for tact+ Denton "Not covered" in Mt . N 'llotpeople de met cane Imelda Imeearomee
Which et Mom atetemerde deeerlbee
covered 05 sod OVIM. Include "or Medicare."fw various reasons. } Nand Card M.
Is met aderwad by say heel* Imaursooe les MellIcand7Cycle M /mono even.
end over." et MI. Oxide "or Medtteve -*Iv am hoc**, hisurlok kr Ilaellikuogn
Ia.
b.
1 2 3 4 S 4 7 8 ,dwhy --
ether readem?
Mori box II only or.* meant II "'Not covered 85Whet la Ms MAIN redeem - - le met severed
Specifyon 0 oar on. meson
1 2 3 4 S 5 7 8(11
SpecifyIOW .06 11$1. *a*
232 REST CET; t:-k7 "15'

Disability and health insurancc 149
M. HEALTH INSURANCE PAGE, ContInuodAsk on/y I f immions uhdw 20 .s, laenoty
a. Dem arras. In this falsity new mesh* issaletancs through the -Aid te forseswith Dependent Children" Program sssetiowe celled "AFDC' ADC'?
0 Yes 0 we 001. Dem - - sew receive AFDC or ADC?
0 DK
16. 1 0 'tot2 0 we
0 OK10s. Deer eaves. be thio foway now nwolvo Ow 'liwoo4 www,3-34 licutity
Incesw" es "SIN" sold-colored cheek?
O Yes6. Dees - - now mewls. this check?
0 No (1 1) 0 OK. . .
106.
-
1 0 Yes2 0 Nos 0 OK
1 I is. nem ie a national program called Medicaid which pays kw health ewefee parsons *need. lin this Stole It I. dos called (swan.
0 No 5121 0 OK
116. 1 0 Yes2 0 No
0 OK
Duthie the part 12 months. hes sayene is this fool, rectoirs4 healthcaws which hee been es will he paid fee by Medicaid (or !nem. 11?
0 Yesb. Nag - - resehted this ears is the part 12 swathe?
12e. Dem anyese in the losly sew have a Medicaid Ow (name/ turd which
0 No 113) 0 DK
126.
.
136.
1 0 Yes2 0 Noli 00K
0 o.4.(6c..4 ca4d .,1 0 Currant II
2 0 E speed3 0 No cud seen
0 Othw cod sew,it
loses Ike this? Show hkockcsd cwO(s).
0 Yes
Ir. Dees - - POW have this sard?
Ask lot *soh pwson wsth ''Yss" in 12b.. Mel I please ese - - (ewd - -I earths)?
Marl ammonite boshIslio porsoe's column.
Specify
I 0 Yes2 0 Nos 0 0K
12e. I. says* is ths fondly 10,11, rovorod by soy ethos***stance preemie that pays for health care/
0 Yes
b. Is - - new serowl?
0 No (Noe1:404)
0 DK
.011111 MI 1 ,101. WU.
233PEST CC; P.:

150 Disability and health insurance
M. HEALTH INSURANCE PAGE, Continulod14e. Does anyone in the temIty now receive military retireenent payments
from ens branch el the Armed Emcee se pension from the VeteransAdministration? Ck rul Include VA elleabldty mempeneetken.
0 Yes 0 No ( I S)
b. Does - - now merely* military retirement et VA pension?
Ask tor each person ssan "Yes- rn IAD4. Whkh dam - - receive - ens Armed Forma mtimenent. the VA pension or both?
Mark Dos to P4,10f1.1coeumn
0 oK
1 db.
0.
/ 73 NoI 0 DK
t 0 Arrneid Forcesi OVA3 CD Both
1 II 4. I. *worse In the family now covered by CHAMP -VA. whkh is mafiosiinsurance toe dependents cv sunrivots 0 disabled veterans?
0 Yes 0 No 06/
b. le - - now commit by CHAMP-VA?
0 OK
lib I 0 Yeti 0 Not 0 OK
Ifl s. le anyone In the ternary now covered by any other program that providesheath care for military dependent**. survivors M military pumas*?
0 Yes 0 No (1.421
b. to - - Row covoweol?
0 DK
iflb I 0 Yes2 0 Not 0 OK
pii2 Astor to "AF" Dos *boys porson's column.i
M ai 0 AF boa marked It 7)3 0 Other (NM
174. Ouse - - have a Oriablity misted le - - seeMee in the Armed Foresee, the United $tates?
b. Dees - - mar mesh.* campanulas fer this aleabety hem the Veterans Adatkietrattea?
tpa,
b.
I 0 Yee2 0 No (HP/
i 0 Yes3 0 No
FOOTNOTES
KAM I I 1 III
234 H 1.; .:'

Disability and health insurance 151
M. HEALTH INSURANCE PAGE, Continuedtes. During
recordtha poet 12 month., tha Is sanc CTZ month_ clot( a yaw ego, hays Vaal mam of
0 OK 11441
0 No
11h.
41.
.
C Lad car lost rob. . .
Trne.
NH nvernbwit le ore..., I low laid Off "MOM Slob or loel /41
0 ves 0 No 11.141
. Who was this?Mark "1.84 off lost job 'Nov ,n parson.* colvem
. - . . . . . .
. Anyone .1,1...?
0 Yta Ill4m. 180 end c1
Ask 18d doxt r to, each par scx, +rah tad orl.lost tob" .r, I ib40. How In4aNy thlwil haa - - boar. taid oil or loot job during 11e bite 1 2 month.?
. In what month was - - laid el se did - - loos Job I:the tart drroathothme before 0.40))?
. _ . . . _ . .I. For ANYTIME during (thatttliola1 fo tarceni) ioblobsiosh did- "1"fril
W..,TP6:011,n4101 Moue bna b.naiNs?
El Trra I
i7 711111.2
Twne 3
, 0 Yii C No
11. Soca...the(tharithosuI
W. WhoMs,*
5. Anyoros
of (names of porton; ,r, Lft.) lob la Wile) orjob Sorsaaa, ald anyone M
0 DK WI 1
_ _ .
0 No
. -
1114. t 0 Lou cove, Km
family loa any h....1th Insurrancro emvesga that had bon earriod throughiob( a I ?
0 yes 0 No 044 )was Ihke?
"Lost corwsga" boa In parson. column. . .
eh*?
0 Ya ALIO IN, 5,4 cl
im 31 Rafe ro 19b sn4 mtri appeocvlate boo\--14kli... 1 0 Lost conuage 1201
1 0 MO not los* coverage 1,1P1
204 Poo ANYTIME during (tharthhose I Yoblyolf41 or jai knees). vim - - withoul anytip* *4 health Insurance Lava ego? (0. not Inohade hoeith awe programs, such SeMedicaid, AFDC, et military benefit programa, se health Murano. eamwegs}
. . _ . . ..... . .It. For how long seas - - withroart Ilonue typo. et ?toad% insurance *mirage?
(How many months le that?)
20e. I 0 Yesi 0 No (NP,
. . .
b. oo 0 L.. It than 1 month
21a. Fro ANYTIM) during Ithwa.....) po.b tarot/Is) or )04 104,4.1. woe - - anorsd layany haat% care wog, am, such se Medic...I, AFDC, or millharry benefit psOlisro,
b. Pot how long sta. - - covred by .orn4 heath care program?
(How Many months I. that?)
21a. , 0 Y..? ...0 NO INPI
-b. ool_. I.... than 1 month
Months
M 4 nor.' ro a ge(s1 *n0 mark app,Opt,atti box
,IYI
I ..-,I t I._ No oeson SS n ...--... 11.04 pg 1
I 0 Ottue iS.opim.,t 0- 1i.,ralcoaa mBs 544 4 I I).
2 3 5

152 Disability and health insurance
1989 NHIS CORE ANDINSURANCE
QUESTIONNAIRES

Disability and health insurance 153
- - - - - -
1^..g. o. . N N .Ni 114 4.N... ..... NO,. ^N N111. NN . ii.rt ...Inn .1 ....,Ny IN .14, Mown. 1 11. ..o 1 a 1*. 1. -
.14 II SC. 1X 10101 har. 11.a. Nen.. a,. 40 02 (, V a. '. 1_
"...HIS I 119691 1. 2 P 0 1 3 SnfIN r CO1.(1..... r
I. rr 14,41.4 ANN.. 1
NATIONAL HEALTH INTERVIEW SURVEY
Book __. of _ hoots4 .5111,1 141,11
'
5 ( ..nt n..n1 rsrsti
Is Wht I. you, ect del.? (Mrkd Noels V. Apl No or 011W-' Idon111, f004.1010 mid ZIP Collo.;
:Stet; :County
It I. thls yew tn.IIing chh7 IMsIt t.o. 0, ape, .14 lii ,ffInokrd rourn, end Dr CM. I
c /1;1 plot, n;r17.;
hi" toe.
n Stone e
CoPli,
LISTINGSIIEF
S.., Mr
17,7
14 ISlanantr.41 011400
lief A(_,).,.. ....... *1..
1*. ..1.
11 IV NV.
Cr;16 lo ...al.........5440410 a401 nt.ena. Ippe rne
AND Bt OCk SE GM( NIS
7 'lATIBUII.t1_1 st1.) Os no, 1
iIi10-11 wa. this slyuctut orlolnify
1.) *An.. ivo esI I An. 4 1 11.0 f(r.nr.4. 11. 1'
I. covEnAct OUESIIONS1 ) net that .
On
II. I I Arthp ny eccuptad or vacant11.1no sort.n bIttIdetyew mm, in this bol4dImet
Y. 11 At., th sny occup141 c ant 01.111 orsartto bett/your men on this
. 11 IS Ihar ny other IwItctine on thhi evereny11 In, OM*. eceoplml or C11
U OR TO* lf
oe ff. f Ode VIk
U 4.4 WM 4*4 0.( 1.1*
..- ...a.1r
l *AN 1t,1 N....
034 1tar.,
Vitt C
.11-10, "11C 1Po( 1.4>Pt(/11313.1W ,Sm-40
I 4. PtS.
owl*
Ie. LAND USE(10111.1, 11I.
II 1511nAl5.1.11 ,....- /1.
wri 4 a* RR 0.1 4.0.
b. Owlet, live peel 1i months ed sells SI clops,11..ttork, and thm Istn, proth.mts fromMI. plots amount Ie 11.000 Of 0400
Pr1.71 (No I
10. ClASSII ICA MN Or t Ivtilo (-men t I Ps Mies Is. ot2 . LOCAIION of lemt IN./USING wet (4411.6 on* Mt Alpv 21
1.1.41 ( bk.,. .111.114 .01I I. sm..0. fte.e 0 f a.... Ntc.dPia. 4 NM *an r ...... r 10. 4 11,1111.1.............410.8441 A
I (141:11 0 In...4.11,4 I IPI ell le. j................00/4.0.1.110 0.04 Atid I.........................
ib At cs o..116.4..... ...me n .4.. ........ ,.........................a. A1.1o... IfOrl fat ILLob. so t ...O. yr -I I I...my. 'Ana .11X on... /111 t. 1var. . 04, *ark ad 1101..1 *r.t.O.4 war. 0 44 11.04 1
or 00..y 540 4040-.«, . s,,,,,,,,.....,....., ........* d 0111r n 11 (44.4 oneFt....... 4.1.0 Ire 1
- _
(pol In... PR) in 144011 31.PA .. I4Merl 411 el10) (Law to...4 4.4 on... ..s 1301....1 au In 4.11 1131151% arAr...114.11.1111.4
0040 4. 1e0100
1 I IIIco.d ol roese.,Or. A1.1 It o
4 NI
I. pa
I 0 N... . .
r ....
-r .- r *
- - .
..
i
lb I. celeve nent, of re. semcellbw ond 1 app 01114ly
14.........4... 0* 1- 1,7...c;_;. 'TS.; ;- O. 1..... 01 s.... sous
. - _.
17. Recall ol 6.6thn0ns1 contort.
00 TO HOUSEHOLD COMPOSITION PAO1
I . What It Mt IIsohons numb., A cothOnver4..hP110. Intltonewm nem* Cod.
12.InttrIove obtvotel10 10n.
b. Isrvgthve of Int eq view.1 It ofo a tsw.....4 a144.I Li stonnt. pOtm.
11. 0. 1., 1 rot*,
O..
.
237 P7Srri,I.11!r1
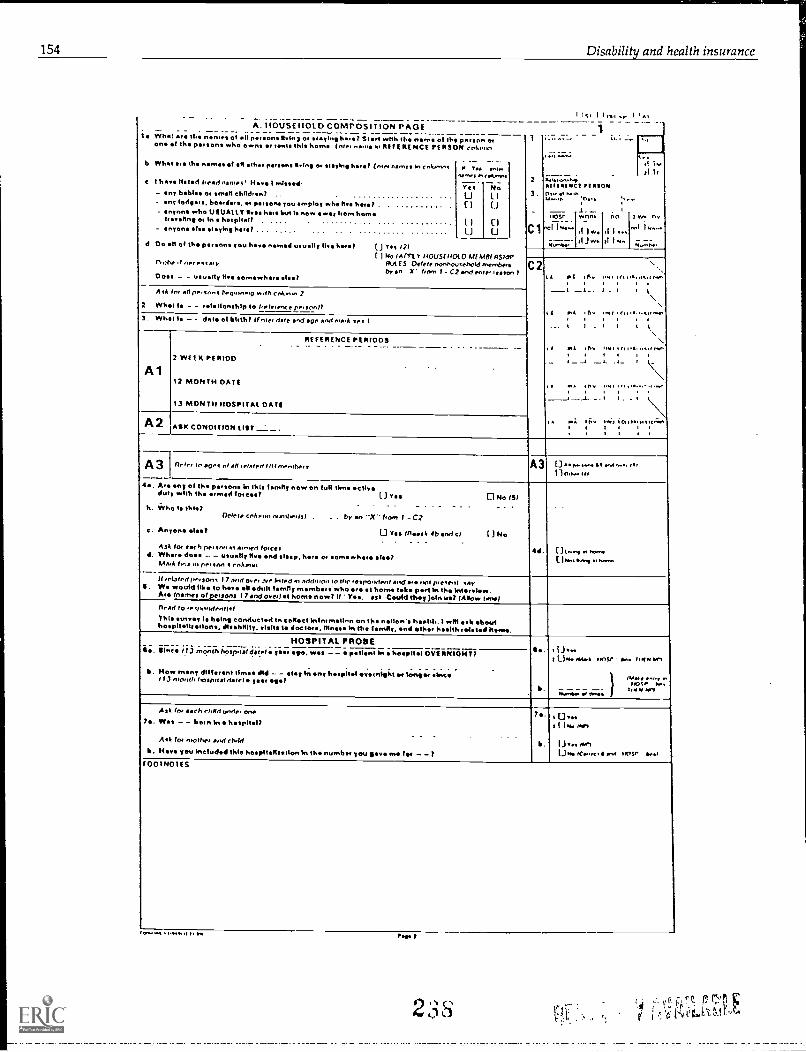
154 Disability and health insurance
I Ito I I ...I I tatA. HOUSEHOLD COMPOSI 1 ION P AGE 1. _ _ _ . __ ._ _ _ _ _ ___ _ ____ .____ _ _____ __ _ . ___ _ ___ ____
1. What Om. 14i nrine. el eh rttons i.in y ot trayInghatt Start whh th niten of the ptoon etOn ett the pront who Own* Of tent this horns Ins.. nam /4,141!f E VIE NCE PE RSON coOntto
_._
-.---2 *e.t.a...
AIIIMOCt3 rt.....
aMiiiiii
_.
b Whitt et,. the ism,. et 01 het pets... %Ong et eteyIng htwItt (num name, In cnkenng
c I hon Ilstcl Pearl nvnes' /4 I tnIted- any babies et smith chfldten? ..
ny lodge,. boattlets, 04 144.1110.4 you employ who 11 /tetra .
- anyone who USUATLY11. here bad le now wt hen, hen.trflng et In betpltalt . .... .
anyon It iltylnehre . .. . .
a yy.._YetUCI
( iU
e,rea.pme-
NoI IU
CIU C-
tosr.
.
111110,1
041
sttnna._
II 1 °y::..
.
an
t....;
li li
2 w. nv
''''.71,..;1 .:-,...:el Do all of the pt tons you hav named usuelty II., toot (3 Yet alri mo (Am. V HOUSE HOlD MEMBERSHIP
Pratte ti f1,0,1110V "Kitt S Deere nonhotrtehokl vermonsby en 5" !tom I - C2 Ignol "MI. 'gator. IDot's - - usuaIty 11. ttenwht ohm?
c 2
II
\t Ail i A., tat, t ....... 'MI CA,
--tt_. s.t t I.\ \104 iriv 'nil iti II...4,44m
\N
I isi4 1 by ioisi teliiiiisier44.
_ I ---1 L .1 I ts\I . _ I k\
_ \IN i IF. tnir i torn.i I 1 I 1 i
1
A 04 lot fill O., foo ISPoitinnig i* all Ce44,4iiin 2
2 Whitt I. - - teftlenehIp te ktIengnc y pe.gonl?3 . Whet Is - - dais el birth/ tE roe. date antl ag, mttl ,...k It'. I
A 1
REFERENCE ERIODS. _ .. _ --- _
2 WEEK PE RIOD.
12 MONTH DATE
13 MONTH HOSPIT Al DATE
ASK CONDITION LIST _._
A 3 nm, In aong n2 .n ,elstee III I tnentbort1 A3 (.3 44,44.44m4 mein.. ,4i1 1 NI.. III
4*. At eny of K. persons In Hat family now en lull Dena actletfuty whit the tanned forces? f.) Y 4 0 N. (sr
- - - - - -K. Who I. Oda/Octet, colt.", nirttbetts1 . , .. . by an "X" front I - C2
e. Anyone trItte? U Yes (need* 40 andel U NO
Ask for each pet nn on alMe fl latces111. Wilco* dee* -. - uluatly Rye and slep. her et oenswhte *lest
/AAA 11,-, HI pet 1121 4 (nrisri55
Id. U loon. 41 IrmoLIM. WA, 404..4,..
If triaged pnegnna 17 ottrI atet MP 01.6 on nthiritoo 10 OW tegnondenI and a. 'mil mtge.! gayI. WO would Mt/ to h all adult frntly tnembre who ar et hon. Ielt part In ths Interview.At* (names of pe,sons 12 and oveilet home nowt If Ys. st Coold they 111444 MI? (A NOW tan*?rt,..d to 1411i1i4l4e.1(41
Thle eutyy. I. heIng conducted In collect InInttnailnn on th motion's health. I wM Itsk *bawlhospltalltsIons, dIsebIllty..1.115 le deem... Mow In the Ittonlly. tend sthet hslth tedeted News.
HOSPITAL PROSES. . u..
t Una tatwt noir eat Ittereart
raw. fon. n144:14. 1.4.4
00.4.1144. 44 444.4
ii. iii";;;; iii;;;;70&01--ici.. ll §.., K. II I OVERNMHT/pin .0.. ygat pe, - - p nt-b. How many dIfferant Owe, Old - - ley In any heophI stretedght et lens.o thee*
(13 nirliveli loof Vital dAtei Vila, eget
Ask ro, ach rhild yet,10. on.
7e. W11 - - betn ht hpltal?. _ .
AM, for ntotheo *oil rt.Itt
0. liana you Included *Me Itepltalltatlen In the number you istv nee fee - - E
1*
It.
t I l owl
lit... ottotUN. tc...,. a **I 11(144. 1...1
EOPINOTES
en ii44. el I. 444 Pew
2 S ;,4 1:ikr1; rr:1 F

Disability and health insurance 155
B. LIMITATION OF ACTIVITIES PAGE
BI Refer to age. B i , 0 re mow2 riolhe (22Pt
1. What was - - doing MOST OF THE PAST 12 MONTHS; working at job or business,keeping house, going to school or something else?Priority if 2 or mole activities reported (1)Spent the most time doing; (2)Considers the most important.
i i 0 Vidkino 121/ 0 Kota., hos 1313 0 Gonng to lichooi 151
0 So.4iNno *Ise IS,2e. Does any Impairmsint or health problem NOW keop - - from working at Job or buainoss?
b. Is - - limited in the kind OR amount of work - - can do because of any impairment or health problem?
2.h.
1 0 Yes in 0 No
10 Yes (71 3 0 No fel
3a. Does any Impairment or heshh problem NOW keep - - from doing any housework at all?
b. Is - - limited In the kind OR amount I housewoth - - can do become* of any Impairmentet health robiem?
3a.
b.
4 0 yet 141 0 No
1 °Yeti 14/ . n No (S1
4a. What (other) condition causes this? .
Ask if injury or operation. When did (the finiuryloccurll- - have the operation?)Ask If operation over 3 months ago For what condition did - - hare the opwation?If Pregnancy/delivery or 0- 3 months Injury or operation -
Reash question 3 where limitation reported. saying Escape for - - (condiri, , , .?OR mask 4b/c.. . . _
b. S.M.. (concRtiOn) le there any other coodition that causes this limitation?
e. le this /Imitation caused by any (other) specific condition?
MarX box of only one conditiond. Which 01 thews conditions would you say le the MAIN cause of this limitation?
4s.
b.
e.
.
ants. co....on at C1 !NEM 41,?
I 0 OW sq. rir"i Cho ror 1,11s
THIN 4s1
0 rim Illeasi Is snail0 No 140
0 Yr. Il(ssl 40 ...4 st0 No
r.10., I
mow conic*
Se. Dolls any impairmont os health probtem k step - - from working alcs job or business?
b. Is - - Smiled in the kind 011 amount of woth could do beca.uss *I any Impakmoni or hulth problem?
bab.
s (114, It1 0 ,,,,1 0..** 111 '3 r I No
B2 Refer to cluestoons 3a and 3bB2 , 0 "Y44 . 34 o. 31, .."
10 Oinot let
S41.111 Knitted in ANY WAY In any actHities bsicause of an Impairment or health problem?.. - . - - _ . - - --------- - ------------
b. In what way is - - Ilmhed? Record limitation, not condition.
lila.
b.
Urw 1 l 3ft. IsiPi--- - -
1...,tisben
7*. WhatAskAskIf pregnancy/delivery
.
b. Resides
e. I.
.Merl,
d. Which
(other) condition this?If injury or operatoon. When did Oho finivryi *town- - iiv the operation?)if operation over 3 months ago For what condition end - - have the ',wallow?
or 0 - 3 months imply or opt, *von -Rusk question 2, 5, or ft wher limitation reported. saying Incept for - - 1Coo4it'on) . . .1OR mask 78/e.
(condition) is there any oilyer condition that this limitation?
7a.
b.
a
41.
ants( cesslassn An CS thl(Fs 710
". b' D rihrrcir..o .°h' '"
0 v.. mows r. 0,4510 No 1741. - .....0 VS ((WO 7s. es.1100 No
DOcxy I condi...
this limitation caused by any lothe-H.P.srelliOcenditIon?
. . . . _ . . . _ . . - -boot if only one condition
of these conditions would you say le the MAIN cause of this limitation?----thw c.a..
..,1149. .3 P. 401
239 r r rL'iCV,

156 Disability and health insurance
B. LIMITATION OF ACTIVITIES PAGE, Continued
g 3 Refer to ap13 3 . c-3 u., s , to, 2 I 118 69 ra,01
inS 17(11r 3(170,4nye, IA I
S. Whet was - - doing MOST OF THE PAST 12 MONTHS; working et job or business, keepinghouse, going to school, or something ales?
Priority if 2 or more activities reported (11 Spent the most tim domg, (21 Considers the most important
8. , n VloAtng
2 iiKt.o.ng houseIn Go...Kt to .chnot4 I I so.y.,,,,.. .,..
Se. Because of any impairment 04 health problem, does - - need the help of other person, withpersonal care needs, touch as eating, bathing, dressing, or getting around this horn.?
. . . . . . . . . - .
b. Became* of any impairment or health peobtem, doos - - need lb. help of other persons in handling- - routine neods, such as everyday household chores, doing necessary business, shopping, orgetting around for other purposes?
llb.
, ,I r its 1131 No1 l I I
2 11 Yes 113i It I No 117/
10a. le - - able to lake part AT ALL In th usual kinds of play activities done by most children - - age?
b. Is - - limited In the kind OR amount of play ctivities - - can do becaus of ny impairmentor health problem?
10s.
b.
r -1,.. Ot INofil
i Dv*. (131 SI No 1121
11 a. Does ny Impairment or health problem NOW keep - - from attending school?
b. Does - - attend special school or special ci because oi sMy impairment or health problem?
t . boos - - need to tiend e special school or special cl hoc sui oi anY linitairment Orhealth problem?
d. I. - - limited in school attndance betuse of - - health?
I i 6.
b.
C.
d
, 13Y. 1131 I I Ho
II !volt (131 i IN,.
3 n y., (IP { 1 No
4 ri,, i ,i, . 1 1,,,,,
12e. Is - - limited In ANY WAY In any activities bec aus of an impairment or health problem?
b. In whet Way I. - - limited? ROCOId limitation, not condition
12a
.
, ,t I !Yes 2 I I No Nr/
_ .1.10,lsi.c.r.
13e. WhatAskArkIf
b. Besides
a. le
Markd. Which
(other) condition causes this?if injury or operetion When did (the (injury( oceur?/- - have the operation?)of operation ovv 3 months ago Fe, what condition dtd - - have the operation?
pregnancyrdefivery or 0 - 3 months olio), or operation -Rask question where limitation reported, saying Except for - - (condigiont. , ?
13s.
b.
(fore (Oothl000 .n C2 rum ijpo
i Dow ale 144,11 CPO doe boaIII( Par IN;
ID yes iilessi Do 5n0 01CiNo (IND
arr. otrort 1 Ja sot, 01ONe
DOAN. 1 rood...,
OR reask I 3b:c
(conditionlla there any other cOnditton that caus'es thiX limitation?
this ilmitation caused by arty (other) specific condition?
- . . . . . .
box if only ono condition-
of thee. condition* would you say Is the MAIN cause of this limitation?
ma., caus
FOOTNOTES
romhe oas oWin a, I.
24 0

Disability and health insurance 157
B. LIMITATION OF ACTIVITIES PAGE, Continued
g 4 Refer to age8 4 . LI Lb. 5 (NM 2 U60 69 5541
t 0 6 - 59 s851 , 0 70 vdo SNP,
g 5 Refer to -Oki sge" and "IA- boxes Mark first appropriate boxg5 o Old ..e.' box ny.f.<1 1141
0 Intl, to LA boa sill0 00.4. INPI
14a. Because of any irnpIrment or heisith problem. does - - need the help of other persons with- - personal care needs, such as atIng, bathing, drssing, or getting around this home?
If under 18. skip to next person. otherwise askb. Because of any impairment or health problem, does - - need the help of other persons In handling
- - routine needs, such as everyday household chores, doing neces eery business, shopping, orgetting around foe other purposes?
14e.
b.
5 0 yet Oft i 1 No
7 i I VP% 1 1 1 N. OW ..
15a. WhatAskAsk11
b. Besides
C.IsLiCisillni28-210n
-Mark
d. Which
(other) condition causes this?if injury or operation When did lute Qaus y) occur // - - have the opertionnif operation over 3 months ago f or whit condition did - - hive the operation?
pregnancy/delivery or 0- 3 months injury or operationReask question 14 where limitation reported. saying Except for - - (c.pridTon/. . ..?on ressk 15b/c. .
Iconditionile there any (dilar condition that cause this ernitstionT
1 5.'
b
4.
d.
am.. condo., .1 C 1 Di( N , km
OV veOld e bo.5 0 INCwH . 0.4.1,150
CI rot ot..1 IS, ....d hl
UN0 lls.d/
Oy. fRO15 IS. ancl DI
0 No
13 only i
c:,;s:d bi ;ni 1-oalri si-,e-cill C'end-itioitt
. _ . . . . - - - - - _ . . _
box if only one condition.of theme CO.,4121ons would you *ay is the MAIN cause of this Battalion?
use. co.,.
FOOTNOTES
poor Ns% .) II. 149. a
241
r1.1.' ST Lk-r it';:AILLL

158 Disability and health insurance
D. RESTRICTED ACTIVITY PAGE PERSON 1Hand calondat.
(Th. next questions refer to the 2 weks °veined in red on that calendar.beginning Monday, (WV end ending this pest Sunday jdats1.1
D2 Refer to 2b and .3b.0 No days 2b 3b 16)0 1 or more days In 2b or 3b (51
D1Rotor to *go.
0 Um:4r 5 PO 0 6 - I 7 (31 0 15 and over If)
5. On how many of the (numberja212 3b/ days missed frombriorichtchool) did - - stay tn bad more then hail of the daybricause of Illness or Injury?
pot: NonaNo al days
. DURING THOSE 2 WEEKS. did - - %VOA at any time at a job orbusinesy not counting work around the house? Unshod* unpaidwork in the tem*, Ilermfbusiness).)
tO Yes Mark -Ws" box, THEN 21 t 0 No
b. Evan though - did not work during those 2 woeke. did - -have a lob or business?
0 Yes Mar& "Wb" box. THEN 21 sONo 141
2a. During those 2 weeks, did - - miss any time from Jobor business becauso of illness Of inlury7
Oyes co I3 No (4 1
0Uring 2-Wei ive-rI4X1,1;o-w Many 4144;1 ;Rd ;tici;;10;-than half of the day from - - lob or business beeuse ofIllness or infury7
co0 None NI1No cited, loss dars I
(4)
Rev to 2b. 3b. and 4b.from work
Se. tlIot counting th day)s) missed from school I.landl In bed
Silas there any IOTHER) time during those 2 weeks that - - cutdown on the things - - usually does because of Mesa or injury?
vs co0 No (03)
missed from worklAgain, not counting the dills) I missed from school 1.
land) kw bed
Owing that period, how many (OTHER) days did - - cut down forsaws than hall t the- day irecaus of illiness or Infure
co0 NoneNo al cut down days
D3Rale to 1-6.
0 No days In 2-6 Mark "No" mR0. THEN WI01 of more days In 2-6 (Mark "Yu" in RD. THEN 7)
3e. During Glos. 2 weeks, did - - mist any dm* from 'thee/ 'ways*of Ninon ar iniury?
Oval oo 0 No (4)
b. During that 2-woek period, how many days c114 - - miss morethan hatf of the day from school because of Illnessor infury?
oo 0 None
No elf/clad loss dove
Refer to Pa, 30, rib, and 66.min work
78. What (other') condition causod - - lei mis. "heel I .24"" thaselot) slay in bird 2 weak.?We) cut dawn
(Enter condition in C2. THEN 761
b. Did any other condition mita *chord during thatwork
tex) stay in ported?lot) cvrt down
Oyes (Rood' 7. and b) tOko
4a. During those 2 weeks. did - - stay In bed loreceuse alarmist or infury7
0 Yes so 0 No Of
b. °tidos that 2-week period, how many days did - - stay In bed movethen haM of tho day bereaves/ of filmes or injury?
col] NorutN. cd bed days
(021
FOOTNOTES
opal., I um,Pop 10
212

Disability and health insurance 159
E. 2WEEK DOCTOR VISITS PROBE PAGERead to re5pondent(s1
These next questions are about hardth care received during the 2 weeks outlinod in red on that c slender.
El Rfer to age. El a Undi 14 l lein14 and Ovet ' I al
1a. During those 2 weeks, how many times did - - see or tatk to a medical doctor? (Include all typesof doctors, such as durnatologists, psychiatrists, and ophthalmologists, as well as generalpractitionms and osteopaths.) (Do not count times while en overnight patient In hospital.).. _ .... . . -
b. During those 2 weeks, how many times did anyone see or talk to a medical doctor about - -?(DO not count times whits an overnight patient In a hospital.)
la.and
I-1,40n.
b. i mp,
tivnbatt nt Itnlos
2a. IllesIdos the Omelet you just told me about) During those 2 weeks, dld anyone in the femily receivehealth car at borne or go to doctor's office, clinic, hospital or somo other placri? Includ crfrom a nurse or anyone working with or for medical doctor. Do not count times while enovernight patient tn a hospital. 0 l'1 0 No 13,1
b. Who reeolved this care? Mark "OR Viso" box rn person's column.
e. Anyono else? 0 Yes f Reask 2b and cl 0 No
Ask fot retch person with "OR Visa" In 2bI. How many times did - - receiv this care during that period?
2 . n .. v....
Nu.,1., at to,.3.. (seeklee the (imels) you eireody told me about) During those 2 'rooks, did anyone In the family
got any medical advics. prescriptions or test results over the PHONE from doctor, nurse, oranyano working with Of /Of medical doctor? 0 Tea 0 No 1(2)
b. Who was the phone call about? Mark 'Phone cal-boa rn parson's column.
. Were there any calls about anyor. else? 0 yes (Nast 3t) and cl 0 No- - - - . . . . ------ -Ask for each person berth "Phone call- ,n3b
d. How many telophone cells were made about - -?
3k.
d.
0 ft.r.ne tai
14,n5, St e...
E2 Add numbers in I. 2d. and 3d for each person Record total numb*. of r.srts end Calls on "2 WK OV' box al ,tem CI
FOOTNOTES
1091te% S11149413 5, II* P.9. Is
243Fr r, rsev

160 Disability and health insurance
F. 2-WEEK DOCTOR VISITS PAGE OR YISIT 1Refer to C1 "2 WK DV' box
PERSON NUMBERF 1 Refer to age
Fl ........,.......,,,,la. On what Whorl dttislal during those 2 wreks dki - - weer talk to s rnedicsi doctor. nur se, or doctat's assistant/b. On whet (other) datalal during tilos* 2 weeks did anyone see or talk to modicel doctor, nurs,or doctor's ssistant about - -?
. . . . . . . . . . . . .Asi i frit /sir Cik i;nu-tiokrnn for th;sinr.sor;C . Wall there any other risks or coifs lot - - during the poriod? Makenecessary correction to 1 Wk DI/ Iv. on CI
1..al:rd 113,01., ,,u;,7, oft {
r Cirri Arro ,s o. a 6.4020% OW 2 e ro uci ',moil2. Whore did - - racists. haalth care on (sisten_11, t doetor's offke, clinic, hospital, somaothw place. of was this telaphona call?
If doctor's officer We thls office In hospital?If hospital Wis ft this outpatient clinic or thoamergncy room?If clinic, V' f s It hospital outpatiant clinic, company clinic, public health clinic, orsome othee kind of clinic?If lab Was this lab In hospital?
Whet we, don* during this visit? (Footnote/
2.
3 is.[andb.C.
4.
andV.
0 L.) 'owe,.Not N frooltat Woortot
oiL] Kr. 04 )(31, clewItoow , .,.......
0.1J cs ore trw, 10 1.3 om.opo
r 0.os 0 am. ;Int t5 Lite.040 tr. " 0 C.st. one,.in0 r Li Co. .loodo - sign oth. 6,,,,re
Ask 3b if under 143a. Did - - actually talk to madical doctor?
b. DGI in-yOn- icluirly talk tO a nia-cliCal doCiOs abcoi - -1.. _c . WilOrt type oi r;3;dic SI parson or ssistant was talitrid to?
. . .el. Does Om (entry in 3c) work with or for ONE doc tor or MORE then one doctor?
, Litu .3, a [...los.io i JO1 ;.-1,44 :.le- IP DCR ro on MIA On
I rst *sr I nt
. I i Coe IP/ 2 [ )1Acot II Irro isi 91 los
10 co at sOSo.c.ni ilei s 0 Os I4,
. .
. iOt ihitt IvIalito all) whct kind of doctor was tits; (*nut- in id working ;rah or f-or---' ger;;isiprsctitionrot apaclatfet?. . . . _I. la tf;at cloctor gener;I prectitionar or. e specialist i
. What kind of spisciallst?
Rird et toomooAO 4b if under 14
4g, f er what condition dkli - - ...Or talk to the (doctor/ (entry rn Jcn ON Wire in II? Mork first appropriate box. - .
- - -S. for what condition did anyone ass or toile to the Woe torl(*ntr_vn 3c/I about - - ortidegiri IRMark first appropriate box.
e. *lei cirnditiOn fOunci as result of the itestisllaser-ninitiOnj?4. SIG: tfiIiliaitfeiainfnitlisnibacius. oi i ipoltie Condition ..- -- hid/ _ _ .
. bisril-n t-ino pais 1 S.viaits wisio - - iiCk Is -acius of her pregnancy?I. Whii stria th en-attar?
. b;tri-wil ii,I; frislikalif Was.th* fcioctOr/tethym Jen taikod io il;ovt atis (cittisa condtt1onh. What was the condition?
4a.andS.
c.d.
f.
IIs.
.DC..4... otesc2 MIN iv7 [)nin.m. at)3U Its... s "...two. tkiU 00. tforr.rti ;
iseiU rn /Su UN.D ... /1A,
. _ Ow, IV. . .
0 ',IS Dr IVCm C2
Coed... 214N so,
0 !" ()No is/0 News-, idol
Poo C/Crd000 tofrt oofMark box if refephone" in 2
SI N. Old - - hays any kind of surgory or op.-anon during this risk, Including bone rattingi and stitches?. - _ .. . . _ .
S. What was this name of the surgery or oparstion? If name of operation not known.describe wnat was done
1 t . WI. there any other eurgary or operation during (his visit?
S.
C.
OL) rtto"ro o 2 tAtett v 1 Ire, 7 I. IN* lelCs ...r,
. . .sti
131
U,r1,..40 SO rd 0 0 MeGo to nest DV if "Horne "rn 2fl. In what city (town), county. end Stte Is the (piece in 21Ioe tiled?
stn. or Co* Iowls., Is Ifs
24 4 nr,'(217

Disability and health insurance 161
G. HEALTH INDICATOR PAGE1. During the 2-week period outlined In red on that calendar, has anyone In the fmily had on Injury
from en accident or other caus that you have not yet told me about? -0Yes 0 No (.2)
b. Who was this? Mark "InIury boy in person's column.
C. What was - - Injury?Enter injurybesl in parson's Column
d. Oki nyone have any other Injuries during that period?
Oyes (Rusk lb. c. and dl 0 No
Ask tor each miury In lc. A. result of the (injur)' in I ci dld [ - - /anyone) s or talk to medical doctor or ssistant
lb.
a.
0 Inpoy
MVO's
0 Tee (Enro, .6..), . cz. fufwf tor roll "WO
0 no I I to/ no. lryto,1[about - -I or eltd - - cut down on - - usual activities for more than hail of a day?
2. During the past 12 months. (that is, since (12thonth dotal a year ago) ABOUT how many days did 2. GOOD Nor.
No of do,"Illness or kqur-s keop - - in bad moss than half of th day? (Include days whil an overnight pathintIn a hospital.)
3a. During the past 12 months, ABOUT how many times did I- - /anyone) sea et talk to medicaldoctor or assistant (about - -I? 1Do not count doctors seen while an overnight patient in ahospital.) [Include tha Inumbor In 2-WK DI/ box) visit(s) you already told me about.)
38
ir.
000 (-km.. 131,1000 LI onr, nfpn ove....VI
swoont in Nasal* rem
b. About how long has it traen since l- - /anyone] last saw or talked to a medical doctor or asistent(Okstritt It Include doctors siren while pedant in hospital.
No el ...we
I pinierwe. "rook ifIsass 36/?pins then 1 of IPM15 3a1301 y. Ws. ihso t VS4 0 2 Vs Mu the., C v.*Opt v*s or ma*CON....
4. Would you say - - health let general Is xerrnent, very good, good, fait. ftt INtOt? 1 014colloof 4E:Ito..IENor goat SOP.*3 0Good
Mara box if under 18Ie. About how tail Is - - without shoes?
b. About how much does - - walg% without shoes?
8 . 0 undo. i s vo'l
Nil Inches--Pounds
FOOTNOTES
Cosika 054II 45 I, 11114
245rtr:'t' 0 U. I,.
rt

162 Disability and health insurance
H. CONDITION LISTS 1 AND 2Re.<1 to respondent(s) end ask hat specified in A2:Now I am going to read a list of medical conditions. Tall me If anyone in the family has hadany of thee. conditions, @won Ifyou have montioned them hew*.
1a. Does anyono In tha family (readIf 'Yes, ask lb and c.
b. Who I. this?U. Dose anyone els. NOW have
Enter condition and tette, in appropriate
memos it NOW HAVE - 2 a . Doos anyone In the family (Bred namely,' NOW HAVE -II 'Nee. ask 2b and c.
b.Who I. this?
Is . Do*. anyone els. NOW have -
Enter condition and hitter In appropriate person's column.
A - I. are conditions effecting VisionSpeech
Conditions M- AA era impairments
-person's column
A. PERMANENT stiffness or any deformity of thefoot, log, fingers, rum or back? (Permanentstiffness - Joints rem not move at efl.)
S. Paralysis of any kind?
14. OUNING THE PAST 12 MONTHS, dld anyone in thelawny have - If 'I es." ash 1. and 1.
. Who was Oils?
f . DURING THE PAST 12 MONTHS, did anyono also have -
Enter condition and letter in appropriate person's column.
C- L sr. conditions a flocting the bons and muscle
M- W are conditrons letting the skin
A. Deafness in ono 04 bOtilars?
I. Any other, troublre bowingwith ono or bod ears?
-C. Tkinitus er ringing In
the caret-
D. Illindnoes kt *now bothsys?
. . . _ . _ . _
E. Cataracts?
F. Glaucoma?. . . _ . _ . .
0. Color bilndneset. . ..... . _ .
H. A detached retina or anyother conciltIon of thorstIns?
-I. Any othee troubie seeing
wed% or* or both amEVEN IONA wee-1nsel ?
J. A CNN pile* or hurrIp?_ . _ . . _ . .....
K. StsmmwIns or nattering?
L. Any other eperrch defect?
M. loss of lasts or smellwhich hes Mond 3months er woes?
- -
N. A missing finger, hand,or arm; tos, loot,or leg?
&ask 2s0 . A missing Writ?
P . A missing breast.kidney, or lung?
. _ ...... . . .
G. Palsy or cerebral palsy?feseetbrall
R.Paralysis of ny kind?. .
S. Curvature of the spin*?
1 .REPEATED troublewith neck, back, Ofspine?
U . Any TROUSLE withfallen *echos or flothret?
V . A clubfoot?
ICA trick knee?
X PERMANENT stifinesor any derformIty of therfoot, leg, or back?(Permtfintnt stiffness -Joints wi?Inot moveat *IL)
Y.PERMANENT stiffnesserr any deformity of thofingers, hand, of arm?
Z . Mental retardation?
AA. Any condition causodby an accident or Injurywhich happened morethan 3 months ago? II
'Yes." ask Whet Is thecondition?
C. Arthritis of any kindsr rherumatism?
0. Gout?
E. Lumbago?
-F. Sciatica?
a. A bone cyst or bon.spur?
- - - - - - - -
H. Any other dice**, oc thebens or cartRess?
. _ . .
I. A anpped orruptured disc?
.1. REPEATED troublo weltrock, bock, or mins?
- - - -K . Itursitts?
L. Any di of themuscles or tendons?
Pessk IdM. A tumor, cyst, er growth
el the skin?- . - - . . . .
N. Skin concert_ _ _ . .
0. Ectomo orPsoriasis?lerit" ea-ma) ortso-rye'uh-siel
P. TROUBLE with dry oritching skin?
Q. TROUBLE with enet
. . . .
N. A skin ulcer?
IL Arty Mad of skin energy?
T. Dermatitis or any otherskin troubie?
U. TROUBLE with inorown*saint or fingernails?
V. TROUSLE with bunions,corns, or calluses?
W. Any dIseso of thhair or scalp?
ref...411 P.9. 2?
2 4 (;

Disability and health insurance 163
H. CONDITION LISTS 3 AND 4Read to respondernts1 and ask hst spec/tied in .42Now I am going to read a list of medical conditions. Tell me If anyone In the family ha had any of thea conditions, ven ifyou have mentioned them before.
Ie. DURING THE PAST 12 MONTHS, did anyone In thefamily (read names) have -If "Yes, ask 3h and c
b. Who was this?. DURING THE PAST 12 MONTHS, did anyone else hews -
Enter condition end letter in eppropnate person's columnMak no entry in nom C2 tor cold, flu. red. sore, or strapthroat, or "virus" even if reported." this hstConditions affecting the digestive systm
A. Gallstones?
S. Any other gallbladdertrouble?
C. Cirrhosis of th
D. Fatty liver?
E. Hepatitis?
F. Yellow Jaundice?_ .
G. Arty other Weer trouble?
H. An ulcer?
I. A hernia or rupture?
.1. Any di of theesophagus?
K. Gstritis?
L. FREQUENT Indigestion?
M .Any other stomachtrouble?
Reask 3a
N. Enteritis?
0. Diverticulitis?(0ye-ver-tic-yoo-iyells1
P. Colitis?
G. A spastic colon?
R. FREQUENTconstipation?
I. Any other boweltrouble?
T. Any tithe,/ intestinaltrouble?
. . . .
U. Cancer of the stomach.Intestines, colon, srrectum?
V. During the past 12months, didanyone Nise) In thefamily hav anyother condition ofthe digestivesystem?
If "Yes."ask Whows this? - Whatwas the condition?Enter in item C2.THEN sk V
4a. DURING THE PAST 12 MONTHS, did anyone In the familytread nar_nell have -It "Yes art th and c
b. Who was this?c. DURING THE PAST 12 MONTHS, did anyone else hav -
Enter condition and teller in appropnate person's columnA - ate conditions at !acting the glandular systemC Is blood colithlion
- 1 are conditions allectuig the nervous systemJ- are conditions affecting the gunito vrinsry Sy stern
A. A goiter or otherthyroid trouble?
S. Diabetes?
C. Anemia of ny kind?-----D. Epilepsy?
E . REPEATED selzurs,convulsions. orblackouts?
F. Multiple sclerosis?
G. Migraine?
N. FREQUENTheadaches?
I. Neuralgia ot neuritis?
J. Nephritis?
K. Kidney stones?
L. REPEATED kidneyInfctions?
M A missing kidny?- - -
As& only et males in lamelyAsili only if females in Nrriels,
Raask 4aN. Any other kidney trouble?
. .
0. Madder trouble?
P. Any di of thegenital organs?
Q. A missing breast?
R. lirast cancer?
S. *Cancer of theprostate?
T. 'Any otherprostate trouble?
U. "Trouble withmenstruation?
V. A hysterectomy?II V. as*
For what condition did- - hese a hysterectomy
W. A tumor, cyst, orgrowth of the uterus04 ovaries?
X. Any other di ofthe uterus or ovaries?
Y . Any other femaletrouble ?
`11 et. P ue 21
247,
ii r "r'L,t LI,

164 Disability and health insurance
H. CONDITION LISTS S AND SRead to resporident(S) and ask hst specified in A2.Now I am going to read list of medical conditions. Tell me If anyone In the family has hd any of these conditions, even Ifyou have mentioned them before.
Sa. Has anyone In the famity (reed names) EVER hod -
if "Mo." ask 5b end C.
b. Who was this?
e. He anyone ells EVER had -
Enter condition and ietter in appropriate person's column.
Cooditions affecting the heel and circulatory system
A. Rheumatic fever?
S. Rheumatic Mart di
C. Hardening of the Wirsee erforlosclerosis?
0. A stroke or ecerebrovascularetccident?iser'e.bro vs* ku-Isd
H. A hemorrhage of thebrain?
D. Congenttal head di
E. Coronary heart di ?
F. Hypertension.sometimes catIodhigh bloodpressure?
I. Angina pectoris?(pklo-rls)
J. A myocardialInfarction?
K. Any other heartattack?
Sel. DURING THE PAST 12 MONTHS, did anyone In thelama, hove -If "Yee, "ask Se and f.
S. Who woe this?
I. DUPING THE PAST 12 MONTHS, did anyone eis hare -Ems, condition and letter vs appropnate person's cokenn
Condrtions fiGrctmg rho heeet end CoCulatOry system
I.. Damaged heart valve.?
M. Tachycardia or rapidheart?
N. A heart murmur?
0. Any other heart trouble?
P. An aneurysm?Ian yoo-rirml
12. Any blood clots?
N. Varicose rains?
S. Hmorrholds Of?
T. Phlebitis orthrombophtsbItis?
U. Any other conditionaffecting bloodcIrcul,Ation?
Be. DURING THE PAST 12 MONTHS, dld anyone la the family(cuO names) have -If "Yee," ask eb and c
b. Who was this?
a. DURING THE PAST 12 MONTHS, dirt anyone else have -Enter condition and letter in appropriate person's COitorin
Make no entry In item C2 kr cold, flu, red, sore, or strepthroat: or "virus" even if reported in this list.Conditions effecting the respiratory syStOnt
A. Bronchitis?
. Asthma?
C. Hey fever?
D. Sinus trouble?
E. A nasal polyp?
F. A deflected or deviatednisei septum?
O. 'Tonsillitis enlargo-meet of the tonstio oradenoids?
H. Laryngitis?
I. A tumor or growth ofths throat. larynx, Oftrachoa?
J. A tumor orgrowth of th.bronchial tub*or lung?
'husk eaK. A mis sins lung?
L Lung cones,?
M.Emphysema?
N. Pleurisy?
0. Tuborculosts?
P. Any other work.relstod respiratorycondition, such asdust on the lungs.silicosis,asbestosis, orpneu-mo-co-ni-o-sia?
0. During the past 12months did anyoneirate) in the family haveany othor respiratory,lung, or pulmonarycondition? if "Yes,"ask Who was this? -What was the 'send,-Hon? Enter in Item C2.rHEN relish 0
'If reported in this het only. ask
1. How many time did - - have (condatonlin the past12 months?
If 2 or more times, enter conddlon n 'tem C2
if orgy I time ask'
2. How long did It last? If I month or longer, enter in otern C2
If lets then 1 month, do not record
if tons,13 or adenords were removed during past months.enter the cond,hon causing removal on rtem C2
P go 24
243 IIn r

Disability and health insurance 165
J. HOSPITAL PAGE HOSPITAL STAY I
1. Refits to C f . "HOSP " hos. 1 . PERSON NUMBER_2 . You said Gael*, that was a patient In the hospital since .11.3./mothhatpitaLdatel a year
ago. On what date did ante, the hospital tithe last time/the time beer* thatfl?
Record fach entry date In separate Hospital Stay column.2.
MerSIN Ott VIM
11
3. How many nights was In the hospital? 2 ocoo0 Nou
Nights
(NW HS)
4 . For what condition dtd antar thit hospital?For delivery ask Fa nawtxxn ask For initial "No conchnon' ask
Was this a normal dollvory? Was eh* baby normal at birth? Why*, anti+ Ow haspitellIf "No." ask If "No." ask For lasts. ask.What was the matter? What was th. matter? What were tha reults at the Nets?
Moo results, askWhy wars the tests partormad?
4. 10 Netrnel111 N.,,,,,,,,I . twth ISI
sl I so co.N.,0 CMOItion ;
j 1 Refit to questions 2. 3. and 2 week raferenc. period.
J1o At Meet onoi nsim . 2 wo,1relvenc. ceed (1....1w Cassia.,w cl. THEN SI
0 Ise memo w 2 ....) Wye.. peon IS)
6a. Did hay any kind of surgery or operation during this stay in the hospital.Including bone settings and stitches?
. . . . _
b. What was the name of the surgery or operation?If name of opelanon not known, describe what was don*
s . Wes titere any oth-r., surgiyio; operretion during this stay?
11.
.b.
.
10 Y*11 I f ) 140 lel
. . _ . ....tit(3)
IS1
0 Try 0.4*Ek so ..-.d 0 0 se
1. What is th memo and *Odra.* of this hospital?r---.2. 'twos
MA** 0.161.901
CM, il COM*/ SW*
FOOTNOTES
lama .1 "1555.01. Pas. 25
249 , ,in,
"

166Disability and health insurance
CONDITION 1 !PERSON NO._I. Nome of condition
Mark "1 wk. ref. pd." box without asking If "DV" or "HS"in C2 as sourco.
2 . Whim did 1- - /anyone) last meow' tat% to a doctor or assistantabout - - lconditionne 0 wend.. week Asa of .21
10 2.wl fel pdsO Ovr 2 wretirs.3m Merl 6 mow3 Os mow. . Is.. then I nosO 1 yt /0.$ 1140 WS
II CI 2 yrs Mos than S yrs
0 $ Vt e. 077 0 at men. o wt7gn
g 0 D got *gen0 Or ..grrer Ion
34. (leafier you toW me &boot - - icondiron2 OW tho doctor is assistanteal the (cOnclition)by a neon technical or spocifis name?
'In N. sOos
Ask 30 If "Ytts" in 3a. othorwiso tranaclitio condition name from(tern I wIthovt asking
b. Whet did Ivo or she cell II?
tO Co). IlenOwets. (MO3D Mame crosemwa-v.)"vseect (8)
(Specify); 0 Ceeer
Ude op. IMOSO 010. 13,1
a. What was the cause of - - (condition In 3bf? (Specify) ;
Mark box If accident or miury sO Accciantfintury (51d. Did ON* (condition in 30) r...A from an accident or ineury?
Yes IP 1014.
Ask 5e tf rhe condition name rri 30 mcludas ony of the foriowmg words
AllewewriAereetwie
OlethrinaAttewlaClod
Cows*.Ceneleekow
et*Nowt
13Iteweedewed.,Stvertia
wwwlew
Ptobewee
ItytildrereAis%mato
Via*.
. What kind of (condition in 3b)le(Specify;
Ask 3f oniy if ariorgy or stroke in 30 -f. Nicer does the leflorgyIetrolte) NOW affect - -? (SPocify/ ;
tor Stroh., he remainder of this condition pogo for rho first presentffoct Enter in Item C2and complete a separate condition page foreach additional plesent effect
I.
Ask 3g if ther is an impairment (refer to Cord CP2.I or any o I thefollowing entries in 30 - f:
Drwalp0Ash* gewgaw how! we er1 Otwrth
feseepi nnweletruall Hemvethap.Mood Mot trtlectiort1411 InflorronittierbConger tilettgatqltromps %Brew4 mgemervell Ns.oNi.Crei P els
Patsy
Peretielw
Ccitt
littavture
Ilgrolnes1
Teruel,
Weer
garleggs goingV/ ggIttn***)
What part of the body is affected?(Specify)
Show the following detailHoed ALA. stab*. tocg oelvegine/verietwa* . , ugeor, reldcgro. legeorSW. loth et 000.4
00 1.not 5. esrte*:127r. tig173..1702.low let r4g+.1, or IggittAn. gAvolder. upper. egbeHre. Ise.. or *Mgt, lett 0014, tr. ItorttNert4 Igglirs Pend et "niers grogy; 1.43, Sght, g. let%lag hip, tappet. be.. 11.510. lett right. or bet%Feel ...dr* feel etch, we toww.313; laSt, flifrA. at broth
Except for eyes, ears, or Internal organs. ask 311 if theta are any of (hitfollowing entrioit in 30 -f:Infect/en Hr. Serene.*
h. What part of the Jean of body in 3g) I. affected by the [infection/eoraltorenoes1 - the skin, muse.. bone. or come other part?
ISpecifyi
Ask If there are any of the foriowing entries An 3b- f .
tweet Cyit erowth
4. la Oita (tumor/cyst/growth] malignant or bonign?I moil. 1 Mt.*, WOO.
. When wee - - (coot:Often in 30(30$ first noticed?
Ib. Whorl did - - (nom* of inlucy in lb)?
1 0 2 voll gt0 0713, 3 o5.e0 to 3 0410104
3 0 Ovot 3 moritO. tot y01K0 0.11* 1 y10 te 6 V.
0.Ask probes as neceesarY:(Wee it on or since (first dohs of 2.wsek ref period)Of wee It isefora that date?)
(Wa it less then 3 months or more then 3 month. ego?)(We* h less than 1 year or more then 1 year ago?)Mas It less than 5 years or more than 5 I ears non
tows. let I itfltI, till.sp. 21I
2 50BUY
..

Disalrility and health insurance
K1
167
&rot toll() end C2t "yes- In "ND" eon AND more Man I cerselions3C2rei
Ousr OC2)
13.
lie. During the 2 weeks outlinod in rod on that calendar, dld - -(.0110) t out down on the things - - usually does?Yoe 0 bro
b. During that period, how many days did - - tut down for morethen half of the day?
000None Clays
Is this (=again 10) the result of the same accident you alreadytold me about?
0 yes GeocoN/ConcIDCAP4174aecrefoni 0.4a Isons first conNiAts4 * MC)
0 N. Foos 540
7. During those 2 weeks. how many days dld - - stay in bed formore than half of the day because of this condition?
000 Nene bey*
Ask if "WaIllitr* box mitiked in C5. Owing those 2 weeks, how many days did Wee mots then
half of the day from - - Job w business botause of this condition?
000 None Oeys
Ask if age 5- I):5. During those 2 weeks. how many days did - - miss more than
half *I the day from school bocauee of this condition?
C30 Nene 0 errs
14. Where did the accident happen?t At Nene tootle house(20 At home 1114...t InsmII30 SUM N'd0 Teem60 inaaetnai Pecs Iria.1481.0 k/u301 pronwsal/0 ^K. at touvallort end spects. 11.C.P1 It0 01/Ne, 13313C.64
-416.
K2 Ceretauon ''CL LTA' in C2 se 10.0C11 IWO
0 CI11.4Wan *see Nes Toys "Cl. LTA- NCI es seLece (KC
10. About how many days since (12 frIOnItt drilla year ego, hes thiscondition kept - - in bed more IMA heif *lithe day? (Include dayswhite an overnight patient In heephal.)
*sop Nom .-- Clays
Mark box if undo: IS. 0 Under 18 (16). Was - - under 14 when the accident happened?
10 di wis Wes - - In the Armed Forces when the accident happened?
30 re. us, ON*s. Was - - et work at - - ob w business when the occident happened?
30 so sO/I14e. Wes car. truck, bus. or other motor vehkle Involved in the accident
In any way?10 Tee 20/4011P
11. Was - - ever hospitalised for - - 'condition 3/1 3bg
Ian's 20Ne
K30 hAeNne itsuernrty or Nom, Welo Other
b. Was mots than ono vehicle Involvea?t0 Yee sON
. Wes litielther onel moving at the time?tO Y. tON
117s. At the Urns of the accident whet pert of the body wee burl?What kind of In}ury was ittAnything else?
12e. Doe* - - still have this condition?tares (c4I 0 Ne
b. I. this condition completely cured or is it under control?
10Cwert s Otru. (Spray? g3 Oltneer corruei OC (141
c . About how long d441 - - have this condition before h was cured?
10 Month.00001.as than I nonlls OA
Numb.,
d. Wes this condition present at any Um* during the past 12 months?ny.. SON.
K400 Not an sccdenthnroy (NOtr. ro at CCKWIVIrIvey to, ltwe pva, I II),fiir.a I .1)
435 eetay Abed 1.43sry
Ask :f box 3, 4. of 5 markod in 0 5b. What pert of the body I. affected now?
How is - - (Qin Of OOdy) ffected?Is - - effected in any other way?
PeNts) .1 body Prosens Neet.
Enter pert of bOdy in same detail as for 3gII multiple present oflects. enter in C2 each one that is not thesame as 3b or C2 and complete a separate condition page lot it
Ivo .3 1, al. Peg. 29
251(77.! r r si
I. 3 rt

168 Disability and health insurance
1. DEMOGRAPHIC BACKGROUND PAGE
Li Refer to age. Ll 0 line., S MP/(.1 S - 12 In13111 And owe 411
Ie. Did - - EVER serve on active duty in the Armed Force
b. When did - - serve?
Mark boa in descending order of priority.Thus. d pe45041 served in Vietnam and in Koreamark VN.
e. VIs -.: - EV-Eik n active; membrer of ilietioi-ial lit;a;d
d. Wee Ali. Of - - active riuty servie reiateri tO isStloiuti
of the United States?
. . . _
Vietnam Ere (Aug. '64 to April '751.
Korean War (June '50 to Jan '55) . ..World War II (Sept '40 to July '47) .World War I (April '17 to Nov. '181Post Vietnam Ihtay '75 to presentl .
Other Service (e other periods) . .
.of Military reserve unit?
- - -Guard Or milftery, t training?
. . VN. KW
. WWII. WWI
PVN. .. OS
_ _
-
la
b.
a.
d.
iara. ikle4k Al bp. 4.4EN !Al70 NO 12;
r F-1 vra sl levr42) law e) los2U ww sl los40 ,...
Uses I n Nn 171 I( 104 ili
rn,.. In. el lot2e. What le the highest grade oe year of regular school - - has weer attended?
-b. 01d -.--- finish the (number in 2a) laradeiyeari?
24.
b.
oon,rove, ottrvId 0.1,441..q..t4N, OM
414." 1 7 3 4
111N 1 10 11
COngo 1 7 3 4
II 1 sir. 2 I INS
5 5 1 5
12
5 6 .
Hand Card fi Ask first alternative for first person, ask secondarternafive for other persons3a 4 What Is the number of the group oe groups which represents - - rectai(What le - - race?
Circle aft that apply1 - Aleut. Eskimo, or American Indian 4 - White2 - Asian or Pacific Islander 5 - Another group not listed - Specify3 - Bleck
.'tilt if mulirpfe entriesb. Which of those groups; that is, lentnes in 3e) would you say REST represents - - race?
_c . Mark observed race of respondentist Only
35.
b.
C.
i 2 3 4 5
1 2 3
---TsOrr.iri
i l ' w 2 ) la II In
Hand Card 04e. Are any of those groups - - national otigin oe ancestry? (Whrt did - - ncestors coma from?)
. . . . . . . _ . . . .. . . .b. Pleas give me the number of the group.
Circle ill ther1 - Puerto Rican 5 - Chicano2 - Cuban 6 Other Latin American3 - hiesican,htesicano 7 - Other Spanish4 - Mexican American
4a.
b.
, (._) r.,
I U No INP1
I 2 1 4 5 6 1
1,141 Ms I $.Pogo 42
f)
252

Disability and health insurance 169
L. DEMOGRAPHIC BACKGROUND PAGE, Continued
12 Fiery to "Age" end "Via/Wb" boxes in Cf. 12OD Undo IS OMio Ws boa rnoksd (881o WI, bps 4no1sd t5.0
31J Noino Po. mnsod (Sno
tia.Earlior you said that - - hs lob or business but did not work last week or thlr week befors.Was - - looking for work or on layoff from slob during those 2 weeks?
b. Earl)er you said that - - didn't hare a job or businses last wools or the week before.Was - - !poking for work or on layoff from a Job during thos 2 weeks?
e . Which, looking tor work or on layoff fty.r.n a job?
5s.
a.
r(..1 Yet iSci
,C.1 Ys
ID look.-. idcl20 Luoll ,IO)
21 IN.
II I No (NPi
'I n 6otr, rem
6a.E artier you said that - - worked last weak or tills worsts brrfore. Ask 6b.
b. For whom did - - work? Enter name of company. business. organization. or other employer_ . _ . _ . . . .
-
. For whom ad -- work at - - lest full-time lob or Znrsinass lasting 2 eonstrctnive weeks or more?Enttf nom. of company, business. organstation, or other employar . or mirk "NEV" or "AF"bor rn person's roturim
_ .
d. What Ittnd of business or Industry le thls? Fa sisample. TV end radio manufscturing.retail shoe store, State Labor Department. fem.
If "At" in 513/c, mark "At.' box rn person's column without asking.Whet land of work was - - doing? For exempt., electrical engineer. stock clerk, typist, farmer
f . What were - - most Important actheftles or duties et that job? For carnpht, typos.keeps eccount books. Mts. sells cars, operates printing press. finishes concrete
Compt. from *mins* in 8b - f lf not clear. ask
An ...PLOY** wi PAIVATS eso1Ounr.lnuknus - 4014ornoLyo4 In OWN bushuss. lonsIuslons1In40.1414441 Isnot, soIsns. ow tunn,41.4. . P soutIcc se losnn)A II OK NAL usurnnunt serspluuo> . .. .... .. I Ask Is du lunkuss Inespoesioi?A STAY/ pussunnent unporso7 . . . . ...... .. II Yu I
No SIA LOCAL peorrnssunt sYnposu? . . ....... .... I.P4.71.4,1:3W4yIOUY.PAY In fun*, Inulruss
- 11111YIR WORPII0 u nous ....Sul 5; hall-OnseOA Wenn" 2 smelts or mons NIS
. .
6b.ndC.
d.
44noloro
1...e,.,r
Occuo..0
. . .Clots o. noAse
43 r2n i20 s40 I.
I 1 Nl v ,6.I: 3 At 61
Li A4 (HP,
1, 11
r' 'Arsr :Nsv
FOO T NO TES
-us 1, sr Pogo 44
253

170 Disability and health insurance
L.DEMOGRAPHIC 11ACKGROUND PAGE, Continued
Mark box if under 14. If "Married- refer to household composition and mark accordingly7. Is - - now married, widowed, dIvorcod, separatod, or has - - never boon Tinged?
u., 14o 17 mi 0 3.44(.6 - WU... f*i2 0 3.4smod - soars. not le NM3 0 Widows()4 0 CHorocedi 0 Stoat...0
0 ,44,4, rnv nod
I II . Was the loud combined FAMILY Income during ths past 12 months - that is. yours furkIngaimordugiagAf Med Forces members hying /I howl more or toss than 20,000? include money from Jobs, social security, 18'
b
t 0 $20 000 0, ma. tHAINICaol 41i nit. than 120 000 Oland Cvd .11
co f 1 A toCIK 701-1uc, 0 a u0i z,11%,otoiC irtirs rrilwoso 0 .30 130 xovOt ton() :spyoti (-3 r ,n, I 1 zHUG ..Lha :el I ztcons %spaosOi lopscop, IsOr
retiromintinterest,
ReadInformationservices
Road
b. Ofduringliving
Intorno, unomploymont payments, public assistance, and so forth. Also include Income horndividends, not Income from busIness, farm, or rant, and any other money Income received.
if necessary Income N Important In analysing the health information we coltect. For example, thishelps us to kern whether persons In ono income group use tertaln types of medical cars
or have certain conditions moo* or Noe often than those in another group.
paientheticel phrase if Armed Forces member living el home or if necessary.
thou Income groups, which letter best reprosents the total corribinod FAMILY Incomethe past 12 months (that Is, yours, (read neme,_ includEigIlirmed Forces members
at hornelf1 Include misses. salaries, er7diRETrlisniii-w-Fu talked about.
Read if necessary Income Is Important tot analyzing tho health Information ws collect. For xrnple,thls Information helps us to learn whether persona In one Incom group us. certain typos ofmedical care services or have certain conditions more or less often then those In another group.
. Mark first appropriate box.
- . - . - -
b. Enter person number of respondent
R .
.
o 0 u,..6.. 1.$, 0 ss...m to. a questo.2 0 P.mni fo. a... tmfalons3 0 Not rposont
Proton nornbrHI of tHpondontIst
L3Enter person number of first parent fisted or mark box1.3
reivri r11,4}1t, of oven1
00 0 No. n housotokl
L4Enter person number of spouse or mark box.1.4
Pogue. rnin+00, of spouse
00 None In NooHhobd
FOOTNOTES
o f now.) I, HI NKr, 4;
254POrC'T07-1

Disability and health insurance 171
L. DEMOGRAPHIC BACKGROUND PAGE, ContInued
L5
....Var sii
....PERSON NUMBER -. .15 Refer to age Complete a seperate column for each nondeleted person goad 18 and over.
Read to respondentIsl- In order to determine how health practices and condition* arerelated to how long people live, we woutd iiit to refer to statisticsirecords maintained by the National Center for Health Statistic*.
16 Enter data of birth from (Nes von 3 on Household Composition page. Le
Oars of WI, II - 11
9a. In what State or country was - - born?
Pont the full name of the State or mark the appropriate box If theperson was not born in the timed States
_. . . . . . . . _ . . . ... _____If born in U S.. ask 9b, tf born in forevn country. ssk 9c
b. Altogether, how many years has - - lived In (State of present residence'?
111,
b.
L7
tl-tass 0 Dr
SI
07 0 Oueri0 ace OS 0 cubs
02 0 V.414. 10,70s OS 01.44$00
03 0 Cow, 1111 OAS orts4.44onle.ss
04 0 Cense._ . Li_e_
1 0 Imb 774o in 4 0 10 4S 44 Mao I $
2 0 in ins thlo,, t { 0 IS r. V ..4.1,3 0 syM .744i 27,44 10 II 0 Or
t I4 -I.S7 0 tem Ow I st 4 0 10 rt Ms, 777;
S
1 0 1,7 14.411444 3 I 0 IS 414 wows3 0 S 44. *I. 11..10 . 0 Os
Lau F71-17"
C. Altogether, how many years has - - lived in the United States?
L7Print full name, including middle intoal, from quesoon 1 on Household Composthon page.'
161.00* 1.-12
VOI I y for meet ask for females10. What I. - - father's L.AST name?
Venly spelling 00 NOT wrrre -Same10.
II.
r0O.44 @LAST own*
_ _
1/1-60______ vs, 1-1 or,Read to responderots1 We also need - - Social Security Number. This Informstion Is
voluntary and collected under the authority of the Public Health ServiceAct. There will be no effect on - - benefits and no information wiN be
ergiven to any oth government Of nongovernment agency.
Read tf necessary The Public Health Service Act I. title 42, United States Cod.,section 2421..
11. What Is - - Social Security Number?
I.-F1 1-1 1 I 1
S44.40 So0440,1444,bor
errs rf41.,,e % 0 p,A.,,,,,, 1
.°''''s 4" --6 1 0 174074414
L8 Mork box to indicate how &xis! Secuoty number was or was not obtained LS
a, 0 SW p.sone: 0 wi 1.04ohono7 0 P044 47440,474 0 P4.14y 14444,0,44
MAU lel sun,, It It II* Peg. CI
255

172 Disability and health insurance
L. DEMOGRAPHIC RACKGROUND PAGE, ConlInudReed to Hhid. respondent: The National Centel los Health Statistics may wish to contact you again to obtain additional health relatedInformatton. Moss* give me the mama, adds.**, and telephon. number ot relativ or friend who would know
where you could be reeehod In ease we here trouble teaching you. (Matte give ma the name of someone whoIe not currontty Wang let eh* household.) Please print items 12- 15,
12. Contact Person name
Lest
[1:14_,_;4-34
First
126 - 44; L-5-4-.L. 14 Ante code/1.1.01one cHjrnber 111?-104
:Middle'Initials
t Li_lt C) None
s 1.3 Refused
40 DK
12.. Address (Number end etteed jet -se I 107
6. City 144-st Stele 155-117 ZIP Is. -.8, IS. Relationship to household respondent 144 - 101
Code
FOOTNOTES
oand. 1,14110.) I, FPIP 494 50
)
(o, ro,,, *mut K +gal
r:

IIf th
es d
uest
ronn
ams
IS fo
r on
E1
EX
TR
A ti
Vt.
ente
r C
ontr
ol N
umbe
rof
ong
initI
&W
WII
tout
If in
AR
EA
also
ont
o.P
rOP
arty
OR
BLO
CK
SE
GM
EN
T,
for
FIR
ST
uni
t fis
ted
ors
US
T1N
G S
HE
ET
She
et n
umbs
(U
na n
umbe
r
1
TA
BLE
XLI
VIN
G Q
UA
RT
ER
S D
ET
ER
MIN
AT
ION
S A
T L
IST
ED
AD
DR
ES
S
AD
DR
ES
S O
F A
DD
ITIO
NA
L LI
VIN
G Q
UA
RT
ER
SLO
CA
TIO
N O
F U
NIT
SE
PA
RA
TE
NE
SS
AN
O F
AC
ILIT
IES
CLA
SS
IFIC
AT
ION
AR
EA
AN
D B
LOC
KS
EG
ME
NT
SP
ER
MIT
SE
GM
EN
TS
If al
read
y lis
ted,
(Ill
Mos
t and
tens
num
cor
bolo
..an
d st
op r
aw. x
Oth
orw
ant.
*mot
Oaa
rc a
ddre
ssA
nd u
rwt a
ddro
ss. e
f any
. OR
des
cnci
tkon
of
loca
tion
1 ,
1 th
is a
uni
t In
a ...
wile
, pla
ce?
121
Do
the
wai
ved*
. tor
Inte
nded
occ
iaan
ts)
of (
addr
ess
en c
olum
n (1
)1
One
s (e
dam
's in
col
, 11)
)N
Inci
udi
quos
tkon
naer
e
HU
OT
Not
was
astr
a un
iton
mos
Sep
syst
m w
ait -
Do
not i
nclu
de o
n M
os
f_i:u
o.m
hp"/
"n. t
e In
:I p
prop
nate
seg
men
tty
po c
otum
n fo
ron
terw
swin
gin
stru
ctio
ns
SI
to th
is u
nit w
ithin
thse
gmnt
bou
ndar
tee?
IS/
I. O
de w
ait w
ithin
tim
esa
me
stru
ctia
na a
s th
eor
igin
al s
osoo
lo w
ot ?
5 75
haw
d&
rect
sco
w*
fron
t Use
out
side
or
thro
ugh
com
mon
hail?
is I
the.
end
ear
t oep
enst
sty
from
eil
othe
r pr
eene
on th
e pr
ropo
rtyl
, 35
She
etU
neI
0 vo
sS
lut)
to c
olum
n(S
I and
mar
k ec
cord
eng
to 1
404
A m
Par
t C o
fm
anua
l
0 N
o
0Y
is., LJ
No
Sao
to c
olum
n15
1 an
d m
ark
N
0 Y
esM
ark
HU
rn
colu
mn
(51
0 N
oM
ark
N in
coito
nn (
51
0 N
Sto
o ro
de X
for
Ow
l Ion
s
0 H
I)F
elt c
oite
nn (
61or
17)
, as
spw
oons
te
0 O
T -
Fe
i l c
olum
n (6
1or
171
. as
apor
oona
te
0 v.
.In
fant
a's
as a
nE
XT
RA
cre
w
0 N
oD
o ho
t Iftt
erV
NIV
e
0Y
eaLi
st o
n fir
stin
ewle
bis
an*
of Ir
sOng
shoo
t. kr
omne
w d
rn
sam
pa.
0N
o -
Do
not i
nenn
ew
I
She
etU
naI
0 T
s* -
Sks
o to
col
umn
(51
and
mar
k ac
cord
ing
to T
idy
A a
l Par
t C o
fm
anua
l
ON
O
0Y
li,-
-, U N
oS
kip
to c
olum
n(5
1 an
d m
ark
N
0 V
asM
ark
HU
en
colu
mn
15)
0 N
oM
ark
N in
coka
w*n
(51
0 N
- S
too
raos
. X fo
rM
rs lo
na
0 H
UF
al c
olum
n ee
ior
al. I
III e
Ppr
opna
te0
OT
- F
ilt c
olum
n (6
1or
al. s
e ap
oroo
nate
0 Y
es -
!man
na*,
is a
nE
XT
RA
mel
d
0 N
oD
o no
t int
anno
w
0 Y
es -
Lar
t On
&S
ter
varlo
bl. i
n* o
f bat
ing
shoo
t. kn
arvr
aw d
al
sam
odo.
0 N
o -
Do
not I
rrte
rvie
w
Une
0Y
ssS
kit,
to C
olum
n(5
1 an
d m
ark
acco
rdin
gto
rbi
. A r
i Par
t C o
fm
anua
l
0 N
o
0 Y
es
0 N
.st
op to
Cou
mn
(51
and
mar
k N
0 yi
psM
ark
HU
en
colu
mn
(5)
0N
oM
ani N
at
colu
mn
IS)
0 N
Sto
p ra
),. X
for
this
Sen
s
0 H
UF
A c
olum
n 16
1or
17)
. as
ad0r
o9(s
ate
0 O
TF
ri co
lum
n (6
1ot
f 7/
. sa
iiPta
dlin
sts
0 ve
nIn
tc,o
w a
s an
EX
TR
A u
na
0N
oO
o no
t int
erve
ne
0 Y
eeLo
a on
firs
tsv
olat
ia k
eno
of k
song
shor
t. in
terv
iew
.4 r
nsa
mpl
e.
0N
oD
o no
t ont
enne
w
NO
TE
: 8. s
ure
to c
oma.
..a w
uenn
ew lo
t onc
enid
cor
al e
ta c
omoI
ebng
Tab
lo X
tor
01 ta
us.
FO
OT
NO
TE
S
oF
-:*1
1'71
c

174 Disability and health insurance
OIAB No 0920 0214 Appuonsi 1.. vies 3 31,90
l.O. HIS- IA 11966)i3 Milli ininii.en
U S IMPARTMENT Or COMMERCE5.iNIAu Or T.4 CINSVS
ACTorG ASCOETTC,wc.Acrst TOR ir.1u S PUIRIC HEA.I.IN SEAVICE
NATIONAL HEALTH INTERVIEWSURVEY
1989 CURRENT HEALTH TOPICS
NOTICI - Inronnahon contoned on this Soon when *outs soon identiliestion ot env ineteidurr NwrabliOvnent het been ccRectod er1Th A ?want" Met A wet be held in lino conTRIenc wet he vied newlot puipose3 stated to. IN, Etim. and 0111 .04 t* 44160S0d ol ieltositd to othot without the content ol the.6.14.411 Or tht I St.tbkiN,t,s1 w eccordence enth Rect.," )041tell ol the Net< Health Snioce Act Ill USC742m1 Pvt>4c lepon.; burden tor this editor" of racer...non n ostenated to yey Rom 20 to 75 minutesper response. vesh an &rope ol 41 mounts on lespente Soorl consnents iitsaidensi tho &ode" estnuiloOT enV 00s4, EAPKT el This C011echon of ntorreetson. no suggestions tor iseveng INS burden. le MT$&pods Clecone, ()Meer ATTN PRA liteeetuey &Aims. Roots 721 H. 700 Indeceodence Aetna), SW,wostvngton. DC 20201. ond to tho Office et Management and Bodge. Reoenniont Reduction NonictI0920 - 02141 Washington. DC 20503
433 7
1 nook of
books
2. R 0 Number l0-10 3 Sample Li t_:113
4. Control numbvPSU is t Segment [17-231455441 12.- 211
6. Beginning woe 1_-_28 2 9 I 30
5 0 * rn
2(1 p mtI I
ADULT FAMILY ROSTER
. Are tilers any nondetrted persons le + seer old In this famNy7 i t 0 Yes (List by age. oldest to youngest/ ...V.r 2 0 No (Sectron It41
SP I 37 133- 34 III- )0 I 37Nam*Line No. Person No. Age Sex
1 1 0 OA 70 F
2 tO N.4 zOF
3 t 0 N.A 20 F
4 0 hi zOF
5 10 hi 20 F
8 %Om 20F
7 IONA 20 F
8 +Om 10 F
9 IONA :OF
Refer to the sample person selection label and circle as applicable. THEN circle Person Number in item 6 and mark the "SP"' box on the HIS 1 for theselected sample person. THEN go to Section M.
7. FINAL STATUS. Household respondent
SaCtlon Mali as appeopnate
111
Complete Interview
l21
Portia! Interview!Explain in notes/
131
NoninterviewRefusal !Explain in notes)
illOther (Explain NI notes!
ist
10 Health Insurance
N Immunization
0 Mental Health...P Dental
_ . .
01. Diabetes Scieening
0 LI No poison 18 in this family
_
.
o [-I No peison 18 e in this family
1 0
i D
1 n1 0
r 1.3
20
zO
, o
20
713
30- - - - -
3 0
, 030
311
31I0 0
Sri
811 1-- 4*--
sE ]
. Household diabeticlil
Section 02 Ipage(Probates Followupl
OD No diabetics7 n 01 Norunterview
Interview
1 0 Completewith diabetes
2 1 3 Paine! interviewell persons,nrerviewedl
Noninterview
30 Refusal ).0 Other
321
interview (all personsi ntetviewedl
(some but notwith diabetes
i( eprain in notes)
_it ',plain in °otos,
e . Sample person
1. Section R (pegs 481 [ i-.47 2. Section S (pegs 501 L._11: ' 3 Section T (page 561 I eetOrolaclel Paint (Chgesth.e Disorders( IDiebetes Rink E ec 10,11
$ 1_1 Not required0 i l No person 18 . in this family 0 ri No person 18 In this familyoil No person 18 in this family
Intei view Interview it 101 Noninterview1 0 Complete interview (all I 0 Complete inteiview tett Interview
appioptiate questions appropriate sectionscompleted) completed) I 0 Complete interview (All
Appropriate questions compieterftsi 1Pertret interview lsome but not 2 0pirliel interview Isome but not 21 1Partial intetnie in I some hut not ail
all appropriate Questions all appropriate sections appropriate questions completed)completed) lt- tplein in notes, completed) (Explain on nofesl (T aplivn in notes)
Noninterviow Nonint el view Nonintet view
31 I Refusel (f oplenn in nAIRST 3 Li Roelof al fr splint en notes, st J Refusal (f.plm,, in netesiA 11 SP temporarily abtent 0 Sr tsropotanly absent 1 1SP temporarily tanents I 1SP menlatly of physic atly escapable s LISP mentally cet physecelly 'eve epoble 513 SP menlolly co physically int apablea (10:her If ep1.0 0 notes) .0 ()thee a aplaus on notes) st] Other (f bpfain in notes)
S. Ending turns S. Interviewer Identification CodeName10em ElF.SOLI1
. _sOo.,Notes
259 r:i 1' i Is
r ;CITIFY I /*I,

Disability and health insurance 175
- .S'Actron Pil - HEAL7 It INSURANCE PINSON I I .1:I.
Mulkau 14 IIclal SuaNIST Isulth Issaw pugs.. las Nublaul 'usu. anal ha pas emu SIunt Nal mai *yes. Pupas 41 by Mulkese bum es 41 Mu lulu like abk. Nus. Aluas ss C1.4
i IL I. 4.4144 losae funds, Wolk (tied 441.040/. 41144c44 In bloaassat .,...,
! -.
U Us 0 No 14/ 0 co I.,
I. le - - 1 8436341311. 1 n Co..3., 34 6 (10K
3 n NG+ coswod
Asa lot oach 'WSW, tilth "COr4441-4/ "DK" in 11
2. ba.? 1 0.404 404 10. 1114141 tusalay IN enk fro ceedisl lu - - taNd - - I le eounsalne 5.4 *spa sa usual,$ nuud As Huh% lasso ana CNN. Ilkambes PnaslAuf the Haalab 14buo444. Claim 111,..h.. I. 44144.1If andciul undwe Om auttooky el tN. P.A.lk 1ea*14 Ilacyle MI Thau will be us 61141 en - - boubst anal neInleuutlus ..111 N. .1.041 14 us uisaa.441401 el 44 * pasunraen4 *soul.
TA* Public Heald. Ilsesk Ac1 la Thl 42. Unkull II tuu C 64e. Sullen 3424
Mr exial.L.4, Own11.15, O. 44.1.conme bo los/
II I C Nuns. Z.Z..1 1
t I I usasusl 1
-,e
3 (1 1..1...431 I C....1N A
Asa lee akh ow sun wall C elJ 14A 6, 23a. Is - - now 4 oseuel by th pui I s.da s.....m, m.ek«...Isk ps las Nopnal b14163
b. I. - - now uusauI lag WAS pars of 114.61. we laNach pap I. Logue. bIaN 3 Tale 4 Nu 9441... pun1. In /4414 - - 44 041 **ant ir 41..11 iliy 1414101 I..1 Ch owM.14.
3.
I
3!, f -1 rd. 110%lila.
I !!I 1 I Y .1. I I 03.it Ill,
41. 134.3 ...line 14313233.1 I. &Aye+. N. Ilia Nulls ebeI seve.84 lay lauhla humus. plus ulak 4 pay 83put *I beopltel. 44.84u. be hada Waal CU NOT U46454. plus INal sus les ONLY ON( issue! 441111.Neck u ...One luau es 54414e81a
0 'Su n ,.... is, n 0. ,,,b. W. Suponons Ube ese 1144 441444140 AM 114 01 sum 14011 133.31341-4 plaw tve4s1 I*Yu COY moue *I ake plan?
Au as u ra,untat-Va-. put.. Oa roe I.. unualsIns ..145 Ilas plu oune en MP
S. Is usu.* le Nu lamas new sslaul bp us OTHIS health laud sus Out Agaak 4. NOT lulanieplena *41 0.1, I«ONLY 0365 suvIa
0 T4 IN 45 enda/ n 1)05..... 34 I.
(New I ow lulu, le 465 *eau qualSou abse Yu plaulal sua Jut NUS nu Maur. I
C.65 J twro door 1461th Ma14li.01.4.1345A44as4.au. ea NIACI'5 usulleue 1436.4 Indl.kbaal PlusasAlatUne. As IPA's. ma pious Imbea Incubus se ruswas NI mots Nals alus luelalt
p.6444645 wawa taut lea du 14140 u IPA AU*. sIreas Me.I ha. te 4.5anala43.1333334 1133 404141 al 1184441 sue uulau
411alajall!:-11
.
I_ 31-
I I c.......)1 1 14.1 tuvoonl 1/41a I I NE
So. 4104 t ...,. , 06.60.443. IN .taassuse0.54aleuluk or140603
. - _ -
b. two. 116 sauMaus* an
useless. IN suf..?
5, la Is aawaauloallaw."). Mk 44104 leeas lulu?
.
0-44
OK
0
0-easo
II
!I
rir
e a , oaa. this 1.a.g..1 riga l *a,pau *I 14441.1144 40.8444*
b. ilsr7u-ohaa paan pal ni put 444314.333.3 ee No 1333134's MIN MeApse414ur
S. lbw %pas Ns us 1331111ursku NU. w65a NIS walrus?
11. o... pay Us us muar10114**tap. Ube. aka* 11. *dubs1114.1 &ram Merkel sus/
...... o43 kp.r (.. ant 10.01.1.1D14.111,. 241.114,11. of Amp
al
'
'
N.
"
2a,
'
1--
I LI
( ii
7 I.,1141*JO
:Me
LIIIIIMall
I I Cau..4a I I No susJ MP,al l 0.
Ia. 11.16.14 P.m./Wu31.051 IllOsmoutuaOeymt.61.4 er141503
IS. "Rs taas $3.3301.141444 140,r.14omploy. 4.1 ?
C . l nan a. I ledIlnuovh on ontpl000r63 313.4.13
341..-'
$1
; 4..
0
I /Co
34
17,r
I !i
ea. Clua ibl n.±Lytplus us usu afpeel *I Susp al puu- - - -
. 13ea 143 . pi. per My put al/6.433'3 333 assipusl 6154 1stop. aWrosi- . .
c. 13e:Sis pas I. US IIIIN1 AL(14.6 11. le.. 041 440.4011
d. oi: k .4 ,.. _ -, ,.....00.,-Amt. 60.4. 43.133.0.38 ululnWould aanbas Isuplial Our
II. ii.;.. 4 pa's I oa ens asonlialhull's. slalo..W. on. es t343,aims. sot33..os?
V!!'
,
Ns
>
,
t.?!
s
t.
1
I ?.!
rif14.
7. 55 - -144audeaAls
plan?
7.
..

176 Disability and health insurance
Sction M HEALTH INSURANCE ContInusid PERSON 1
143-44
7.
1 13
t 0 Covered2 0 Not covered MP)1 0 DK
Sa Is thls Mar* plan aHoek% Ma tononceOrganisation orHMOT
b. Was this planobtained through anomployw or union?
C. Is It now oarriodthrough an employs.'or union?
Yea No DK
4
Fir.
12!1-..
ea. Dogs this (at_yr ) plan pay anypart of hospital sepanats?
b. Doos this pion pay any port ofdoctor's ot surgeon's MIN forapratiOnta
C. Deo. Ft pay for any DENTALwank.. othor then oral surgery?
d. Ports it pay for any prescriptiondrugs other than those admin-tutored during hospital stay?
II. Do** it pay for any montaltwalth, 'alcoholism, ea drugrobust, aortic..?
Yes No DK
niii-'
I 4.'
II0
111
1 g2
.sr is - -coveraduth n ids..
(010110plan?
2 2
Hal
I
a
t riri
it
'
'
t
1
I
2
2
-7
2
1
14 -SS
.
14
1 0 Covered2 0 Not t.overed (NP)
1 0 ox
,
154. Is this frame) planHoshh Meintononc.Organization orHMO?
b. Was this planobtained through anemployor or union?
C. Is 11 now carriedthrough en employeror union?
Yes No OK
rica"'
FIT
rii
8.. Doss this Imam& plan pay anypart of hos-Piril expansse?
b. Doss this pion pay any part ofdoctor's or surgeon'. bails foroperathans?
0 Does It pay for any DENTALowricos othor than oral surgory7
d Do's It pay for any wet criptiondrugs other than those admin.Istwed during a hospital stay?
e(0. »;tic n-pay for any mntalhealth, alcoholism. or drugabuse sonless?
Yes No OK
7. is - -covradunderthis(name)planT
' 2
r 4.774
I
rart
'
l
I
2
1
_K
I
s
II_
1
II
IC2
GS
I IHIA.II:1 t LIMA SS -114
.
7S
, 0 Covered20 Not covered IMP)
0 OK
Vag No OK
fla. Does this frame) plan pay anypart of hosiTh-iii siponsos?
b. boos this pion pay any port ofdoctor's or surgeon's Wits foropsestIons?
c . Does it pay for eny DENTALowykas *lbw than or al surgery?
d. Does it pay for any proscriptiondrugs other than (hose admin-istered during hospital stay?
I. Doss it pay for any montalhealth, alcoholism, or drugabuse sorvical
Vie No OK
70
71
litI 7
74
7 is - -coveredundo,.this(name)pliTif
5a. Is this Icircel plan 4Health MaintanoncOrganization orHMO?
b. Was Oils planobtained through anornoloym or union?
C. lo It now cordedthrough on amployaror union?
-1- Fiat
I
i 47,
ra
riiT
'
'
'
1
'
2
1
I
i
ea. (In addition to the p anis) you Just mentioned) Is nyone in the fmily now cove,rod byon Insurance plan that pays for ONLY ONE typo of hoalth car service, such rso nursinghorns cars, eye cars, or proscriptions?
0 yes 0 No (Chock Item 21 0 OK (Check Item 2)
b. hi - - covered by this typo of plan?8b. , 0 Covered 5 r_l OK
20 Not covered
AaS for each parson -Coatrod" in dbc . What typo of service doss. - - plan pay for?
0. i - - now covered by any OTHER insuranc",' plan that pays for ONLY ONEssrvIso?
C. I 0 Prescnottons/ 0 Eyscore2 0 Cancer treatment. 0 Csisatrophtts 0 Nursrng home csres 0 Aectdentss 0 Dente) core5 0 Other - Spoor). -
i i-- TII
711
110- - -.°1*2---III-. -
_14_
0 Y*1 (Roast dc - dl0 No 1NP with Cove,ed m Elh 1
ogo 4
261
soau .fts 1$ 11 0 ett

Disability and health insurance 17/
out Ho 04200214 &m.o.. ai Enietes 03131190POW HIS-1A 11989) (Addendum)13 14 I* 04.4.6
US 01P441414NT OF COmuf AC(14.44u or tt43td1J5
Ar tow AS CC% tr Ct*Ki AGIN, get IIIU S PUttCW5Al,tItU5VtC.t
NATIONAL HEALTH INTERVIEW SURVEYSECTION M - HEALTH INSURANCE
1Addendurn)
Book of books1
2 . R. 0. Number
3. Semple
4. Control numberPSU Segment
Table WI. (Continuedl
0 No plan listed In Table H.I.
Transcribe each plan name From Table 14.1
12=121=1317 PLAN 4 NAME
NT 47
CHECKITEM
1 37
0 -Yee" In 5c (5d)e 0 Other (5(1
CHECKITEM 1
I 42
I 0 "Yes" in 5c (5ct)s 0 Other 1511
Sd. Does the employer or unionpey for any part of the costfor this Memel plan?
I Se0 Yes (.5e)
2 0 No0001O
t
Se. Does th employer or union 0 Allpay for all or just part of the
2 U Partcost? ODx
30
51. In whose name Is the, _Lamy)plan? Enter person number
40 - 41
Li_jPer sonnumberoo 0 Person not in HH1.0 OK
Sd. Does th employer or unionpay for any part of the coatfor this (name) plan?
I 13Yes (SolNo}
0 DK
115e. Does the employer or unionpay for all or just pert of thecost?
tO All2 0 Parta 0 OK
14
SI. In whose name la the (name)plan? Enter person number.
Iss -se
Personnumber
oo 0 Person not in HHse 0 OK
PLAN 2 NAME PLAN 5 NAME
CHECKITEM I
42
10 "Yes" In Se (SW0 Other 150
CHECKITEM
1
I 0 "Yes" in 5c (5d)s 0 Other (5f)
Id. Doe* the employer or unionpay for any part of the costfor Ws kismet plan?
10 Yes (5e)0 No1
10 Olq (5"
1 43
5e. Does the employer or unionpay foe all or just part of thecost?
ICJ All2 0 PertsODK
44
if. In whose name Is the (name)plan? Enter person nurriTio
PLANZNAME
I 1
411 - 40
Personnumber
oo 0 Person not in HIArsODK
6d. Does the employer or unionpey for any part of the costfor thls (name) plan?
se0 Yes (Ee)0 Nol
Coq (5"
5e. Does the employer or unionpay for all or just part of thecost?
0 All0 Part
tt 0 DK
51. In whose name Is the lnamelplan? Enter person nun-1-577
Personnumber
co 0 Person not in HH81 DK
CHECKITEM 1
1
10 "Yes" in 5c (5di0 Other (V)
47
5d. Does she employer Or unionpay for any part of the costfor thie (name) plan?
lie. Dolts the employer or unionpay foe ill of lust part *I thecoat?
t 0 Yes (5e)20 Not$0 OKI
44
0 Alt20 Pert00 01(
411
5f. In whose name Is the (name(plan? Enter person nurnThTs7.
I to- el
FI-1PersonnumberMO Person not In Ht.{as U OK
Notes
2E12

178 Disability and health insurance
Section M - HEALTH INSURANCE - Continued PERSON 1
CHECKITEM 2
Review lb and 7 for each person end determine If "Covered" by either Mdicare and/orInesirencs, or "Not covered."
CK2
I eg
i 0 covsi.dI 0 Not covered under 6630 Not covered 66 end over INP)
e 0 DK
Ask for each person -Not covered" In Check Item 2.
if "Not covered 85 end over," In Check (tem 2. Include "or Medicare
9s. (Many poodle to not carry hea)th Insurance for rufous n14%60111.) Hand Cord M.Which of thee* Metelnents describes why - - Is not covered by *fly heelth Insurance (of Medkus)?
Any other rtrowrn? Ord, sa reasons given
Mark boa if only one raison.
If "Not covered 85 and over." In Check Item 2, include -or Medicare."
b. Mat Is the MAIN reason - - I. nal wavered by any heetth Insurance tat Minficerel?
91.
b.
1.se - al
1 2 3 4 6 6 7 8 -7et
apecify)es- eslig- IIe2- SI
oo 0 Only one reason
1 2 3 4 5 6 7 8 7
rsp.cify)
Ask only If persons under gg 20 In family: otherwise skip to 11.108. Does anyone In the family now recerfe assIstartee through
the -AI4 to Folmar. with Dependant-Children" program,sometimes caged "AFDC- sr "AOC"? 0 Yes 0 No f i If 0 DK (1 1)
b. Dios - - wow ree*Fre AFDC or ADC? 10b. 10 ya, 0 oK U42 0 No
11. Dom anyone be the I amity now mot,* di* "SupplornentalIleetwfty 11101MOO" Of "SIN" shoat?
1.3 vas ONo (12) 0 OK (12)b. Does moefre this shook?
11 b. 0 T10 yes S OK
20 N o
12s. Thoth Is program *easel Medlesid that pays for hoe?* ewe lerpoems In need. ?let !Ms Station I. idee eaflefljnemp/.1
During the poet 12 menthe, hes anyon In this fans*,twelves, hoot* sere which hos been of will Ire paid for byMedleMd ter (0mplf? 0 Vet 0 No (131 0 Da (131
b. Hee - - nssehei *de sere In the post 12 enentle0..-1
12b. T10 ye. s 0 DK2 0 No
13s. Does anyone In the tomby now hare e MedIceld tor (name!, card?
0 yes 0 No II.41 0 ox (14)
11. am - - wow have tide cord?
Ask for sech person with "Yes" M 130
S. May IMeeth the - - land - -1 card(s)?
54wK sPfrropriste boxfael in person's column
13b.
C.
ves 0 OK 1.10 s
2 0 NoLos
0 Medicaid cvd seen 7i 0 Cwront 1(
2 0 Esti:wad
3 0 No card seene 0 Other card seen -,
(Specify!
145. fe anyone let the firma)} now covered by any ether nubileethIstante proven, that pays foe health owe?
0 Ves 0 No (15) 0 DK 115/
b. 51- - swot **vend? 14b. 10 Yes s 0 DK 1
SO No
II. Is anyone In thle famlly now revered by Melt% carebenefits froth the Armod Fortes or Vetwene'AtIntinfebrden? 0 Yes 0 No (Check hem 3) 0 DK (Check hem 3)
lea. Don anyone In the fentRy now mceive mR1teryrotinsment payment* front any branch of the ArmedFerem or penelon from the Volumene AdmInIstratIon?D. not Include VA disabOty compensation.
0 Yes 0 No I 1 71 0 OK (171
Is . 5... - = wow moire military rennunont of a VA ponsIon?
Mk for each peroon with "Yes" in I eb
S. Which does - - recetve - the Armed FOAM.. retirement the VApereekm, of both?
16b.
e,
_It54vet 0 0-1 I10
3 0 NoID
I 101t 0 Armed Forces20 VA
3 n Both
the I
2.3FORM .01111 .01
BEST LC

Disability and health insurance 179
PIT 417
SsctIon NI HEALTH INSURANCE Contlnu*d PERSON 1 3 -
17s. Is anyono in the family now covseed by cyfAkerus, which is apeer am of medical tato for dopendonts of mRitary Persofelol? 0 Yu 0 No ( 17c) 0 DK 117c1
b. Is - - now covetod ley CHAMPUII?
C. Is anyone in the family now covusd by CHAMP.VA, which I. ouldica(Maurine* for dependents or survivors of disabled valwans? 0 Yos 0 No 1181 0 OK (18)
d. is now coyotes' by CHAMP.VA?
17b.
.
I 0 Tas s 0 DK Li_2 0 NO
t 0 Yes 9 0 OK2 0 No
18s. I. anyone In the family now oevioad by eny other peoviemWert providst Math cote for military dopendents orsurvivors of milker* porpoise? 0 Tot 0 No 1Check Item 31 0 OK (Chick htm 3)
-1b. le - - now groveled?18b. 010 ycl DK
2 0 No
CHECKITEM 3 Rater to "AF" box oboes poison's column In HIS.1. CI(
3, 0 xF bps multed I t 9). 0 Othee (NPI
19s. Deus - - have a disability retatod to - - **Mc* In the Armed Forces at Ms United States?
b. Do.. now rocelve componsation lot this disability from tha Vourrans Administration?
e . Has - - oval applied for a service-connected disability rating from the Veterans' Administration?
a. Was It approved or denlod?
IS..
b.
.
.
I 0 v., 2 0 No lNP1
T io% 0 Yos NM i 0 No .__
Ii 0 Yes t 0 OK (NMs 0 No IMP,
I. 12, a App,oved 3 0 Psrwimg2 0 Ds nod a 0 DK
20s. During the pastMtn ailloti ob;tiy;intx
b. mo wail this?Mork "Lipid off/iost
C. Anyonis eh*?
Ask 10d. o. ondd. How many am*.
in what month
I. For ANYTIMEInsurance leitmotiv'?
12 months, that Is sinc (11.month de111)
20b.
d.
O.
f.
nom: olio:rod HH mombete 180e ovir)ad
job 0 Yes 0 Ho (Section N) 0 DK (Soc.*. N)
job" box in ciettson's column.
0 'rot (Rusk 206 end c/ 0 NoI foe each person with "Lind off/lost job" in 20b.
hae - - been laid off or lost )ob during the past 12 months?
end your was - - laid oil Of did - - toe* Job 11tha last tieprethe tints 'micro thell)?
during (that/those) Job layoff(*) or job los slos). did - - rocitivo unomploymont
i 0 LIAM od/lost lob
--,
I 1
Times-.I
0 i Yr
II01-1 T. 1 U1-18h.. TY t
11°i1 Time 2 rii- 22
1Y Iro
1111_1 Time 3 23 -24
t 0 The o OK LIL_t 0 No
21a. Retains oflassies), didcoverage that
b. Who was this?Mark "lost
C. Anyons *Ise?
Memos of parsons in 20b1 fob istoffiti Or }Ob
21b. 0 Lost covag
anyone lo tho Liwairii-se any health insursocahad boort carried through IthaUthosI kobisi? 0 vs. 0 No (Section N1 0 DK (Section N)
coverage"' bor in person , column
0 vs, 114.sk 2Ib find cl 0 No
CHECKITEM 4 Refer to 11 b and mark appropnare box CK
4
2tI Ghost coverage (12)y 0 Chd no? lose coverage (NP)
22a. Was - - covoredlayoff pis) orModicaid oe
b. Was - - covered
C . Fee how long
by some OTHER health insurence plan at any time during (that/those/Jobjob basalt's)? Do not count military insueance or health programs such asAFDC.
by anothor plan for tha entire tim. (names olkeisons in 20b/ Iwos/wors) off wore?
22a.
b.
c.
i 0 Yes n DK (231 ETil.;10 No (73I
+(Jigs/23r s0OK (2111---112 C 1 N0
co 11 Lett than 'I month
_ _ ___ _ __ Months
woe not covored by any kind of health Insuranc plan?
23. At ANYTIME during Ithat/thosel job layoff(s) or job lossios). was - - covered by a militaryprogram at by hisith program ouch as Medicaid or AFDC?
b. For how long woe - - coverod by this kind of program?
23a.I 14
I 0 yes 11 1 Dr (NP:, 11 No (NP)
-I -1. op t 1 Om than I month ---Montht
age
P.4 r,1_
2 4IQ*MfrøSASl Itea.., to at
* U.S. GOVERNMENT PRINTING OPPICE:1993-359-17M0250

Ms* flay Statistics Retail ItalicaResearch &Training CenterInstitute for Health & Aging, (JCSFBox.0646, Laurel HeightsSan Rancisco, CA 94143-C646
ERIC/ ECCouncil for Exceptional Children1920 Association DriveReston, VA 22091-15898
,r2.65 AYAL,..1