agilent 802.11b wlan signal studio softwarefor the e4438c
TRANSCRIPT

Agilent 802.11b WLAN Signal Studio Software for the E4438CESG Vector Signal Generator
Option 405Product Note
Use Signal Studio to createIEEE 802.11b test signals
Signal Studio 802.11b software is a powerful tool for creating 802.11b baseband I/Q waveforms for use with the Agilent E4438C ESG vector signal generator’s high performance internalbaseband generator.
E4438C ESG vector signal generator Main features• 250 kHz to 6 GHz frequency range• 80 MHz RF bandwidth• 160 Mbytes (32 Msamples) playback
memory• 6 GB storage memory• Hardware digital interpolation filters• Fast microprocessor• LAN connectivity• Differential I/Q outputs
Key features• Modulation: CCK, PBCC, DBPSK, DQPSK • Choose framed or unframed signal• Baseband filtering• Configure payload MAC header and
enable FCS • Select long or short preamble • Scrambling On/Off or preamble only• Configure power ramp type and power
ramp time • Select idle time between bursts• Enable PBCC encoder• Remote control of basic ESG signal
generator functions from software

2
www.agilent.com/find/esg
Introduction . . . . . . . . . . . . . . . . . . . . . . . . . . . . . . . . . . . . . . . . . . . . . . . . . . . . . . . . . . . . . . . . 3Ease of use . . . . . . . . . . . . . . . . . . . . . . . . . . . . . . . . . . . . . . . . . . . . . . . . . . . . . . . . . . . . . . . . .4Signal structure . . . . . . . . . . . . . . . . . . . . . . . . . . . . . . . . . . . . . . . . . . . . . . . . . . . . . . . . . . . . 4
PMD layer . . . . . . . . . . . . . . . . . . . . . . . . . . . . . . . . . . . . . . . . . . . . . . . . . . . . . . . . . . . . . . . 4PPDU frame structure . . . . . . . . . . . . . . . . . . . . . . . . . . . . . . . . . . . . . . . . . . . . . . . . . . . . . . . 5
PPDU frame with long PLCP preamble . . . . . . . . . . . . . . . . . . . . . . . . . . . . . . . . . . . . . . . 5PLCP preamble . . . . . . . . . . . . . . . . . . . . . . . . . . . . . . . . . . . . . . . . . . . . . . . . . . . . . . . . . 5PLCP headers . . . . . . . . . . . . . . . . . . . . . . . . . . . . . . . . . . . . . . . . . . . . . . . . . . . . . . . . . . 5
PPDU frame with short PLCP preamble . . . . . . . . . . . . . . . . . . . . . . . . . . . . . . . . . . . . . . . 6Payload structure . . . . . . . . . . . . . . . . . . . . . . . . . . . . . . . . . . . . . . . . . . . . . . . . . . . . . . . . . 6
Creating signals . . . . . . . . . . . . . . . . . . . . . . . . . . . . . . . . . . . . . . . . . . . . . . . . . . . . . . . . . . . . 7Step 1 – Configure 802.11b signal and MAC header . . . . . . . . . . . . . . . . . . . . . . . . . . . . 7
Signal configuration . . . . . . . . . . . . . . . . . . . . . . . . . . . . . . . . . . . . . . . . . . . . . . . . . . . . 8Step 2 – Setup the signal generation options . . . . . . . . . . . . . . . . . . . . . . . . . . . . . . . . . 10
Signal generation setup . . . . . . . . . . . . . . . . . . . . . . . . . . . . . . . . . . . . . . . . . . . . . . . . 10Oversample ratio . . . . . . . . . . . . . . . . . . . . . . . . . . . . . . . . . . . . . . . . . . . . . . . . . . . . 10Filter type . . . . . . . . . . . . . . . . . . . . . . . . . . . . . . . . . . . . . . . . . . . . . . . . . . . . . . . . . .11Mirror spectrum . . . . . . . . . . . . . . . . . . . . . . . . . . . . . . . . . . . . . . . . . . . . . . . . . . . . . 11
Signal information . . . . . . . . . . . . . . . . . . . . . . . . . . . . . . . . . . . . . . . . . . . . . . . . . . . . . . . 12Step 3 – Configure the ESG . . . . . . . . . . . . . . . . . . . . . . . . . . . . . . . . . . . . . . . . . . . . . . . . 13Step 4 - Calculate & download . . . . . . . . . . . . . . . . . . . . . . . . . . . . . . . . . . . . . . . . . . . . . 15
Step 4a - Calculate . . . . . . . . . . . . . . . . . . . . . . . . . . . . . . . . . . . . . . . . . . . . . . . . . . . . . 16Step 4b - Download . . . . . . . . . . . . . . . . . . . . . . . . . . . . . . . . . . . . . . . . . . . . . . . . . . . . 18
Signal studio configuration and setup . . . . . . . . . . . . . . . . . . . . . . . . . . . . . . . . . . . . . . . . . 18Verify ESG generating waveform . . . . . . . . . . . . . . . . . . . . . . . . . . . . . . . . . . . . . . . 19
Bit error rate tests . . . . . . . . . . . . . . . . . . . . . . . . . . . . . . . . . . . . . . . . . . . . . . . . . . . . . . . . . 20Frame error rate tests . . . . . . . . . . . . . . . . . . . . . . . . . . . . . . . . . . . . . . . . . . . . . . . . . . . . 21Multipacket capability . . . . . . . . . . . . . . . . . . . . . . . . . . . . . . . . . . . . . . . . . . . . . . . . . . . . 21
Transmitter measurements . . . . . . . . . . . . . . . . . . . . . . . . . . . . . . . . . . . . . . . . . . . . . . . . . . 22Transmit spectral mask . . . . . . . . . . . . . . . . . . . . . . . . . . . . . . . . . . . . . . . . . . . . . . . 23EVM measurement . . . . . . . . . . . . . . . . . . . . . . . . . . . . . . . . . . . . . . . . . . . . . . . . . . 24
Data sheet for signal studio-802.11b . . . . . . . . . . . . . . . . . . . . . . . . . . . . . . . . . . . . . . . . . . 28Acronyms and abbreviations . . . . . . . . . . . . . . . . . . . . . . . . . . . . . . . . . . . . . . . . . . . . . . . . . 29Additional literature . . . . . . . . . . . . . . . . . . . . . . . . . . . . . . . . . . . . . . . . . . . . . . . . . . . . . . . . 29Agilent products for 802.11b WLAN web addresses . . . . . . . . . . . . . . . . . . . . . . . . . . . . . 30References . . . . . . . . . . . . . . . . . . . . . . . . . . . . . . . . . . . . . . . . . . . . . . . . . . . . . . . . . . . . . . . 30Ordering information . . . . . . . . . . . . . . . . . . . . . . . . . . . . . . . . . . . . . . . . . . . . . . . . . . . . . . . 30
Upgrade kits . . . . . . . . . . . . . . . . . . . . . . . . . . . . . . . . . . . . . . . . . . . . . . . . . . . . . . . . . . . . 30
Table of Contents
This Product Note is a self-guided tutorial that describes the test signals that can be created with the Signal Studio-802.11b software. This document is not meant to be an802.11b technology tutorial. For additional information on 802.11b technology, refer to the Additional Literature and References section at the end of this document.

3
www.agilent.com/find/esg
Signal Studio 802.11b software is a tool for creating an 802.11b waveform in an intuitiveWindows®-based environment. The software calculates a baseband I/Q waveform filebased on the user-defined 802.11b frame. The waveform file can then be downloaded tothe ESG’s baseband generator (option 001 or 002) for playback through the I/Q modulatorand upconversion to RF. The RF range is from 250 kHz to 6 GHz.
Download Signal Studio from www.agilent.com/find/signalstudio to a PC to evaluatethe signal configuration and plotting capabilities of the software. A license key is required to load the signals created by the software into the ESG. The license key can be ordered through your sales engineer or your local sales office, which can be found athttp://www.agilent.com/find/assist.
In addition to creating waveform files, the software provides basic configuration menusfor signal generator settings, including frequency, amplitude, and marker polarity. The instrument settings, along with the waveform files, are passed to the ESG over the LAN or GPIB interface.
After downloading the waveform file and instrument settings, the ESG automaticallybegins generating the 802.11b RF signal. Local control of the instrument is then re-enabled and signal generator settings, like frequency and amplitude, can be modified from the instrument’s front panel. The waveform files themselves cannot be modified once they have been downloaded to the instrument.
The Signal Studio software configuration can be recalled at any time to re-calculate and download the waveform to the signal generator. The waveform itself cannot be saved on the PC, but waveforms can be re-calculated quickly from stored settings. Once downloaded, the waveform files can be saved on the 6 GB hard drive.
The Signal Studio 802.11b signal can be used to test any portion of the receiver chainduring the design process. Some software engineers may require a baseband signal to perform demodulation and decoding verification on ASIC and DSP chips, see Figure 1.RF designers may want to test components such as amplifiers or the RF chip set.
Introduction
RF to baseband
RF chip set
Demod/Decode
ASIC DSP
HardwareSoftware
WLAN DUTReceiver
ESG w/Option 001or 002 and 410
Analog I & Q and I & Q out (baseband)
RF Out250 kHz to 6 GHz
RF Baseband
Figure 1. Test setup with ESG
4
www.agilent.com/find/esg
Signal Studio 802.11b simplifies the user’s role in creating 802.11b test signals for usewith the ESG. Instead of wasting valuable time writing code to create a proprietary test signal, Signal Studio 802.11b provides the ability to quickly configure a standard-based test signal via an intuitive graphical user interface. Furthermore, the Signal Studio 802.11b frame configuration can easily be modified to create the desired test signal, without re-writing code.
Component test
The performance characteristics of 802.11b components - including preamplifiers, combiners, filters, and amplifiers - is determined using a stimulus that provides statistically correct signals. The Signal Studio 802.11b software meets this need. Signalparameters can be modified to provide adequate stress on the components being tested.
Receiver testIn order to thoroughly test a receiver’s demodulation capabilities, a test signal with full coding is necessary. Full coding allows test engineers to determine if each functionalstage of a receiver is operating correctly. This level of coding enables FER and BER testing on the signal received by the access point. The designer will be able to use this to perform standards-based tests such as receiver minimum input level sensitivity, receiver maximum input level, and receiver adjacent and non-adjacent channel rejectionmeasurements.
Another benefit of using the Signal Studio 802.11b as a test signal is that it allows thedesigner to verify that the receiver correctly decodes an independently generated 802.11btest signal.
PMD layer
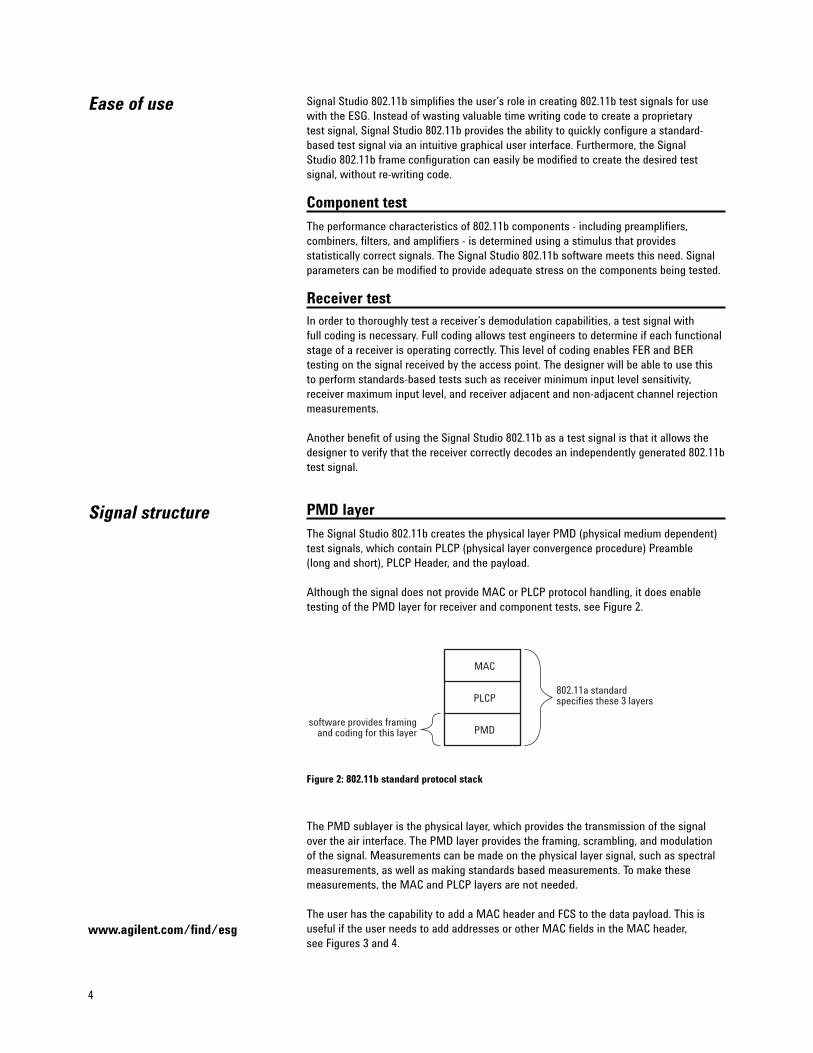
The Signal Studio 802.11b creates the physical layer PMD (physical medium dependent)test signals, which contain PLCP (physical layer convergence procedure) Preamble (long and short), PLCP Header, and the payload.
Although the signal does not provide MAC or PLCP protocol handling, it does enable testing of the PMD layer for receiver and component tests, see Figure 2.
The PMD sublayer is the physical layer, which provides the transmission of the signalover the air interface. The PMD layer provides the framing, scrambling, and modulation of the signal. Measurements can be made on the physical layer signal, such as spectralmeasurements, as well as making standards based measurements. To make these measurements, the MAC and PLCP layers are not needed.
The user has the capability to add a MAC header and FCS to the data payload. This isuseful if the user needs to add addresses or other MAC fields in the MAC header, see Figures 3 and 4.
Ease of use
Signal structure
MAC
PLCP
PMD
802.11a standard specifies these 3 layers
software provides framingand coding for this layer
Figure 2: 802.11b standard protocol stack

5
www.agilent.com/find/esg
In 802.11b systems, information is transmitted in frames. The total frame length is variable. The Signal Studio-802.11b software supports framing for both the long and short preambles, as detailed below in figures 3 and 4.
PPDU frame with long PLCP preamble
PLCP PreamblePreamble: The user can select turn scrambling On, Off, or On for the Preamble only. SFD:The user cannot modify the SFD field.
PLCP headersSignal: The user cannot modify the signal fields.Service: Bits 0,1,4,5,6 are reserved bits as indicated by the 802.11b standard, and cannot be modified by the user.Bit 2 is to indicate to the receiver if the carrier and the symbol clock use the same local oscillator, user settable. Bit 3 is set to zero if CCK is the modulation, and PBCC (Packet binary convolutional coding) is set to one if this is the modulation. This is automatically set by the software,and the user cannot modify this bit. Bit 7 is the length extension bit. If the payload data rate is over 8 Mbps, then this bit will be set to one, by the software. The user cannot modify this bit.Length: the user cannot modify the length fields. CRC: automatically calculated by the software, and cannot be modified by the user.
PPDU (PLCP protocol data units)frame structure
SFD16 bits
SIGNAL8 bits
SERVICE8 bits
LENGTH16 bits
CRC16 bits
SYNC128 bits
PLCP header48 bits
MAC header30 bytes
Long PLCPpreamble
PPDU FRAME
192 µs
Payload Data1 Mbps BARKER/DBPSK2 Mbps BARKER/DQPSK5.5 or 11 Mbps CCK/DQPSK5.5 Mbps PBCC/BPSK11 Mbps PBCC/QPSK
Signal field0Ahex for 1 Mbps data rate14hex for 2 Mbps data rate37hex for 5.5 Mbps data rate6Ehex for 11 Mbps data rate
Payload DataVariable length
0-2312 bytes
FCS4 bytes
Scrambled 1s F3A0hex
Transmitted at1 Mbps DBPSK
Figure 3. PPDU frame with long preamble
6
www.agilent.com/find/esg
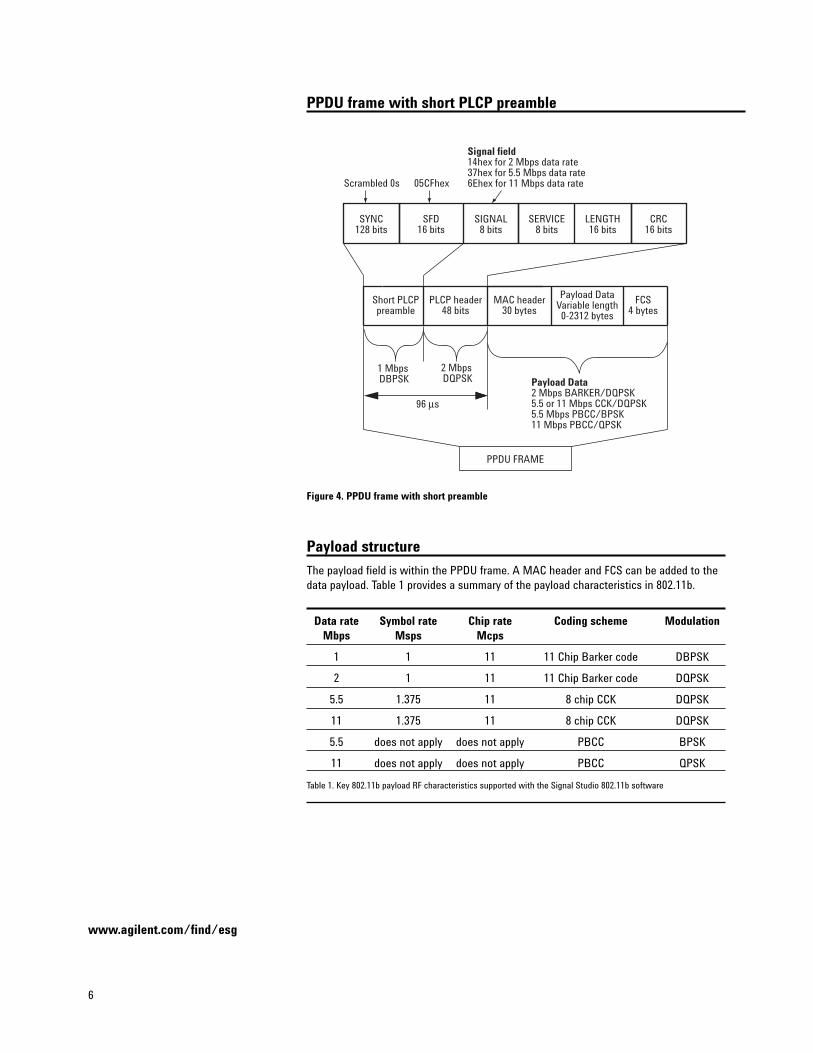
Payload structure
The payload field is within the PPDU frame. A MAC header and FCS can be added to thedata payload. Table 1 provides a summary of the payload characteristics in 802.11b.
Data rate Symbol rate Chip rate Coding scheme ModulationMbps Msps Mcps
1 1 11 11 Chip Barker code DBPSK
2 1 11 11 Chip Barker code DQPSK
5.5 1.375 11 8 chip CCK DQPSK
11 1.375 11 8 chip CCK DQPSK
5.5 does not apply does not apply PBCC BPSK
11 does not apply does not apply PBCC QPSK
Table 1. Key 802.11b payload RF characteristics supported with the Signal Studio 802.11b software
SFD16 bits
SIGNAL8 bits
SERVICE8 bits
LENGTH16 bits
CRC16 bits
SYNC128 bits
PLCP header48 bits
MAC header30 bytes
Short PLCPpreamble
PPDU FRAME
96 µs
Payload Data2 Mbps BARKER/DQPSK5.5 or 11 Mbps CCK/DQPSK5.5 Mbps PBCC/BPSK11 Mbps PBCC/QPSK
Signal field14hex for 2 Mbps data rate37hex for 5.5 Mbps data rate6Ehex for 11 Mbps data rate
Payload DataVariable length
0-2312 bytes
FCS4 bytes
Scrambled 0s 05CFhex
1 Mbps DBPSK
2 Mbps DQPSK
Figure 4. PPDU frame with short preamble
PPDU frame with short PLCP preamble

7
www.agilent.com/find/esg
Figure 6. Signal Studio 802.11b signal configuration menu (boxed)
Duration/ID Address1
Address2
Address3
Framecontrol
SequenceControl
Address4
MAC header
Bytes: 2 2 6 6 6 2 6
Figure 5. MAC header structure
Creating signals An 802.11b waveform can be can be configured and downloaded to the ESG digital series in four easy steps:
Step 1 – Configure the 802.11b signalStep 2 – Setup the signal generation optionsStep 3 – Configure the ESGStep 4 – Calculate & downloadStep 1 – Configure 802.11b signal and MAC header
Step 1 – Configure 802.11a Signal
➮
8
www.agilent.com/find/esg
Signal configuration
This section allows the user to choose specific parameters for framing the signal.
Framed:Toggles between framed and unframed mode. In framed mode the user can generate a test signal to make measurements according to the standard. In unframed mode, the user can perform measurements where continuous modulation of unframed data is desired.
Data rate: Selects the data rate. Four different data rates are available:1 Mbps, 2 Mbps, 5.5 Mbps, and 11 Mbps.
Modulation: For the 1 Mbps and 2 Mbps data rates, the modulation formats are selected automatically and cannot be changed. For 5.5 Mbps and 11 Mbps data rates, the two different modulation formats are available: CCK and PBCC.
Format: Selects the format of the preamble/header sections of the framed signal. This is only relevant for data rates above 1 Mbps.
Scrambler: Selects scramble On/Off or preamble only. If parts of the design don’t have scramblingset-up, the user can vary this selection for the test signal.
Clk locked flag: Toggles the clock locked flag in the physical packet header. This is Bit 2 in the Servicefield of the PPDU frame. This bit is used to indicate to the receiver if the carrier and the symbol clock use the same local oscillator, and the user can set this bit. This is only relevant in framed mode.
PBCC encoder on: Toggles the encoder on. Only relevant for PBCC modulation.
Pwr ramp: Selects shape of the RF burst in framed mode. Selects the power up/down ramp type asnone, linear, or cosine. Cosine ramp gives least amount of out of channel interference.“None” starts transmitting the signal at full power, and is the simplest power ramp toimplement. The linear ramp shapes the burst in a linear fashion. The Pwr Ramp feature is only relevant in framed mode.
Ramp time: Sets the length (in microseconds) of the power up/down ramp. This is only relevant inframed mode.
Idle interval: Sets the length (in microseconds) of the idle time between frames. This is only relevantin framed mode.
Channel: Sets the RF channel. This automatically sets the ESG frequency.
9
www.agilent.com/find/esg
Payload setupThis section allows the user to configure the MAC header and choose to add an FCSadded to the packet. The maximum data length of the payload is 2312 bytes. Notice that the total length of the payload is displayed.
Setup menu:Configures the MAC header.
MAC header:Enables/disables prepending the MAC header to the data payload. The user can fill allthese individual fields with the desired data, or can disable these fields if the data is nolonger desired.
MAC FCS:Enables/disables appending the MAC FCS to the data payload. The FCS (frame checksequence) is automatically calculated by the software if this field is selected. Note:When the MAC header is not selected, then the FCS is just performed on the payload.
Data type: Selects the payload data stream from the following types:
• PN9• PN15• All zeros• All ones• Alternating zeros and ones• Alternating ones and zeros
Data length:Sets the number of data bytes in a frame. This excludes MAC header and FCS.
Total length:Displays the total number of bytes in the payload. This includes the data and MAC header and FCS.
10
www.agilent.com/find/esg
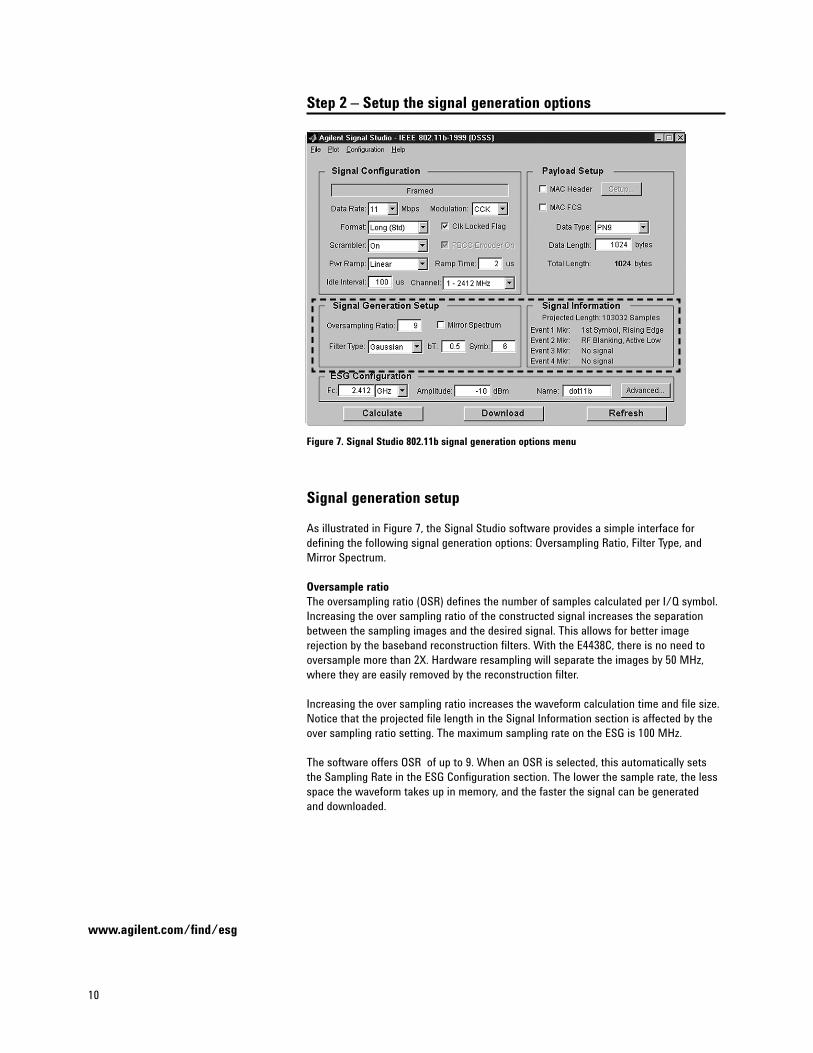
Step 2 – Setup the signal generation options
Signal generation setup
As illustrated in Figure 7, the Signal Studio software provides a simple interface for defining the following signal generation options: Oversampling Ratio, Filter Type, andMirror Spectrum.
Oversample ratioThe oversampling ratio (OSR) defines the number of samples calculated per I/Q symbol.Increasing the over sampling ratio of the constructed signal increases the separation between the sampling images and the desired signal. This allows for better image rejection by the baseband reconstruction filters. With the E4438C, there is no need tooversample more than 2X. Hardware resampling will separate the images by 50 MHz,where they are easily removed by the reconstruction filter.
Increasing the over sampling ratio increases the waveform calculation time and file size.Notice that the projected file length in the Signal Information section is affected by theover sampling ratio setting. The maximum sampling rate on the ESG is 100 MHz.
The software offers OSR of up to 9. When an OSR is selected, this automatically sets the Sampling Rate in the ESG Configuration section. The lower the sample rate, the lessspace the waveform takes up in memory, and the faster the signal can be generated and downloaded.
Figure 7. Signal Studio 802.11b signal generation options menu

11
www.agilent.com/find/esg
Filter typeA baseband filter is applied to reduce the transmitted bandwidth, increasing spectral efficiency. The standard does not specify what type of filter must be used, but the transmitted signal must meet the spectral mask requirements (see Figure 16). Gaussianfiltering with a B*T of .5 was chosen for the measured example. This filter is commonly used in the 802.11b industry. Other filters may also filter the signal enough to fit within the spectral mask.
For signals generated with digital signal processing, baseband filters are often finiteimpulse response (FIR) filters with “taps” that represent the sampled impulse responseof the desired filter. FIR filters are used to limit the bandwidth of the input to the I and Qmodulators.
Three options for baseband filtering can be selected in the Filter Type menu: Rectangle,Gaussian, and Root-Cosine.
The Root-Cosine filter has an impulse response that rings at the data clock rate so nulls appear at all alphas. Alpha gives a direct measure of the occupied bandwidth of the system calculated as Occupied bandwidth = symbol rate x (1 + alpha).
Gaussian filters typically have more intersymbol interference than the Root-Cosine filter,but their adjacent channel power performance is better for constant-amplitude modeslike MSK, where Root-Cosine filtering of I and Q is not possible. The bandwidth bit time(BbT) product (similar to alpha) is the Gaussian filter coefficient.
The rectangular filter is essentially no baseband filtering.
Mirror spectrumThis allows the user to invert the spectrum. If this option is selected, then the Q channelis inverted. This feature may be useful if the user plans to use a mixer to upconvert thesignal.

12
www.agilent.com/find/esg
Signal informationProjected length: The length of the waveform is in samples. The ESG’s baseband generator can playbackwaveforms up to 32 Msamples.
Markers: The signal generator has four markers that can be placed on a waveform segment; markers provide timing signals that are synchronized with a waveform segment. Default settings are explained below. Markers can be set from the software, or from the ESG user interface, see users guide for more details.
Event 1 Mkr: The Event 1 marker can be accessed from the rear panel BNC connector. The event 1marker is set to the 1st symbol of the 802.11b waveform on the rising edge. The signalout the event 1 port can be used as a trigger signal. Default marker polarity is positive.The user can invert the polarity of marker under the Advanced button.
Event 2 Mkr: When the 802.11b signal is framed, RF blanking increases the on/off ratio of the RF bursts. The ESG Event 2 marker is internally routed to provide the RF blanking signal. The default marker 2 polarity is set to positive. If the polarity is inverted, the desired RF signal will be blanked, resulting in no RF output from the ESG.
Event 3 Mkr: Signal Studio-802.11b does not create a marker for Event 3. This can be done from theESG user interface. See users guide for more details.
Event 4 Mkr:Signal Studio-802.11b does not create a marker for Event 4. This can be done from theESG user interface. See users guide for more details.

13
www.agilent.com/find/esg
Step 3 – Configure the ESG
Figure 8. Signal Studio 802.11b configuration ESG menu
➮

14
www.agilent.com/find/esg
Along with the compiled waveform, the Signal Studio software passes instrument settingsto the ESG signal generator. These are defined in the ESG Configuration menu. The followingsettings can be made:
ESG configuration parameters Frequency Defines the frequency at which the ESG will generate the signal.
Amplitude Defines the power level at which the ESG will generate the signal.
Sampling rate Defines the rate at which the waveform I/Q samples are read fromthe dual arbitrary waveform generator memory during playback.
Baseband These reconstruction filters allows the entire desired signal to passreconstruction filter through, while rejecting the images that occur at multiples of the OSR.
The ESG provides one 50 MHz analog reconstruction filter. This filter is sufficient to eliminate any images or aliasing. The user may optionally choose the no filter option (through). These low-pass filters are intended to transmit the baseband signal while rejecting the higher frequency images.
Waveform scaling Scaling maximizes dynamic range into the DAC, while preventing overflow errors. The waveform data is scaled as it passes through the baseband generator and the DAC interpolating filters. Scaling does not alter the original waveform data file. Scaling range is from 1 to 100%.
Modulator attenuation Sets the attenuation level before the signal is sent through the IQ modulator.
RF blanking When the 802.11b signal is framed, RF Blanking improves the on/offratio of the RF bursts. The ESG Event 2 marker is internally routed to provide the RF Blanking signal.
Note: When RF Blanking is enabled, the Marker Polarity is set to positive by default, otherwise the wanted RF signal will be blanked resulting in no RF output from the ESG.
ALC active The default setting is ALC (automatic level control) on. To turn ALCoff, uncheck the box. The RF output power of the signal generator is constantly monitored and controlled by the ALC circuit. Its purpose is to hold output power at its desired level in spite of drift due to temperature and time.
External BBG Sets reference frequency for the ESG dual arbitrary baseband (baseband generator) generator to internal or external. If an external reference is used, reference should be connected to the ESG before the waveform and it
instrument settings are downloaded to the instrument. The default setting is internal. Note that this is not the 10 MHz oscillator frequency reference.
Marker polarity When RF Blanking is enabled, the Marker Polarity is set to positive by default. If this is set to negative the wanted RF signal will be blanked resulting in no RF output from the ESG.
After the waveform and instrument settings have been downloaded to the instrument, theinstrument settings can be modified from the signal generator front panel. The waveformitself cannot be modified, except by re-calculating with new settings in the Signal studiosoftware.
15
www.agilent.com/find/esg
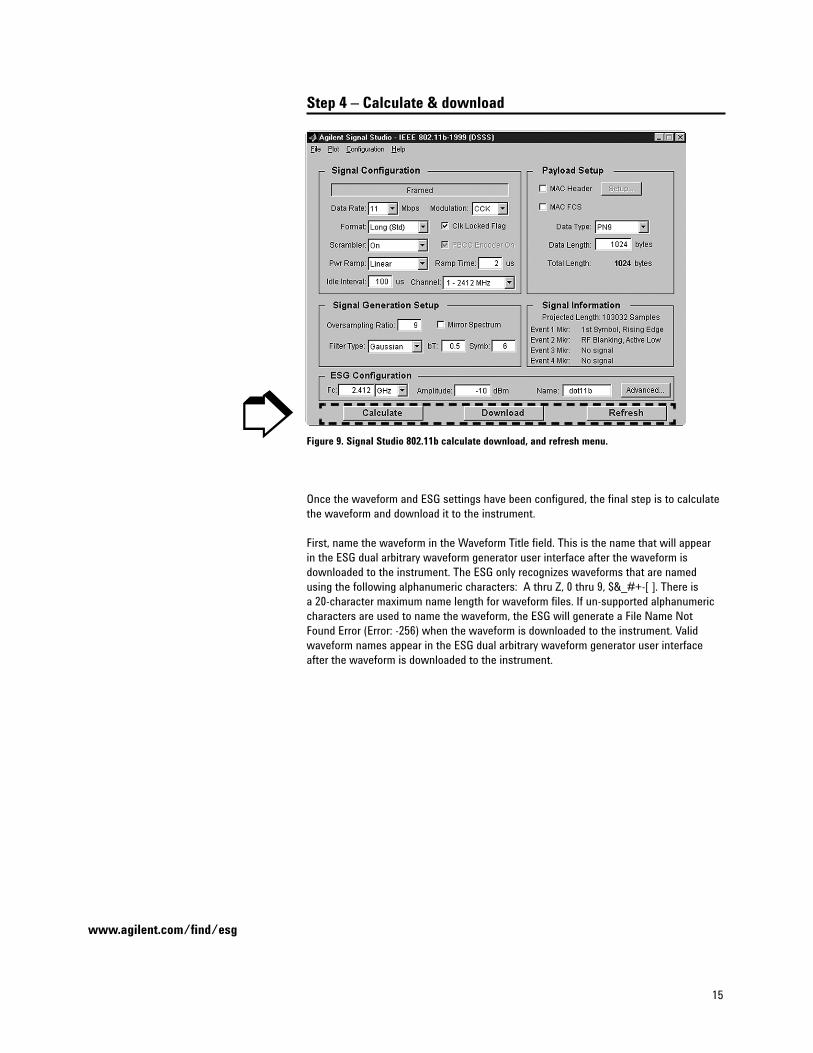
Step 4 – Calculate & download
Once the waveform and ESG settings have been configured, the final step is to calculatethe waveform and download it to the instrument.
First, name the waveform in the Waveform Title field. This is the name that will appear in the ESG dual arbitrary waveform generator user interface after the waveform is downloaded to the instrument. The ESG only recognizes waveforms that are named using the following alphanumeric characters: A thru Z, 0 thru 9, $&_#+-[ ]. There is a 20-character maximum name length for waveform files. If un-supported alphanumericcharacters are used to name the waveform, the ESG will generate a File Name Not Found Error (Error: -256) when the waveform is downloaded to the instrument. Validwaveform names appear in the ESG dual arbitrary waveform generator user interfaceafter the waveform is downloaded to the instrument.
Figure 9. Signal Studio 802.11b calculate download, and refresh menu.➮
16
www.agilent.com/find/esg
Step 4a – Calculate
Once the waveform and ESG settings have been configured, the final step is to calculatethe waveform and download it to the instrument.
Name the waveformFirst name the waveform in the Waveform Title field. This is the name that will appear in the ESG user interface after the waveform is downloaded to the instrument. The ESGonly recognizes waveforms that are named using the following alphanumeric characters:A thru Z, 0 thru 9, $&_#+-[ ]. There is a 20-character maximum name length for wave-form files. If un-supported alphanumeric characters are used to name the waveform, the ESG will generate a File Name Not Found Error (Error: -256) when the waveform isdownloaded to the instrument.
Select the calculate buttonThe software will generate an I/Q waveform file in accordance with Signal Studio settings. Waveform calculation time varies according to the selected data rate, OSR,length of the payload, and the computer’s processing speed.
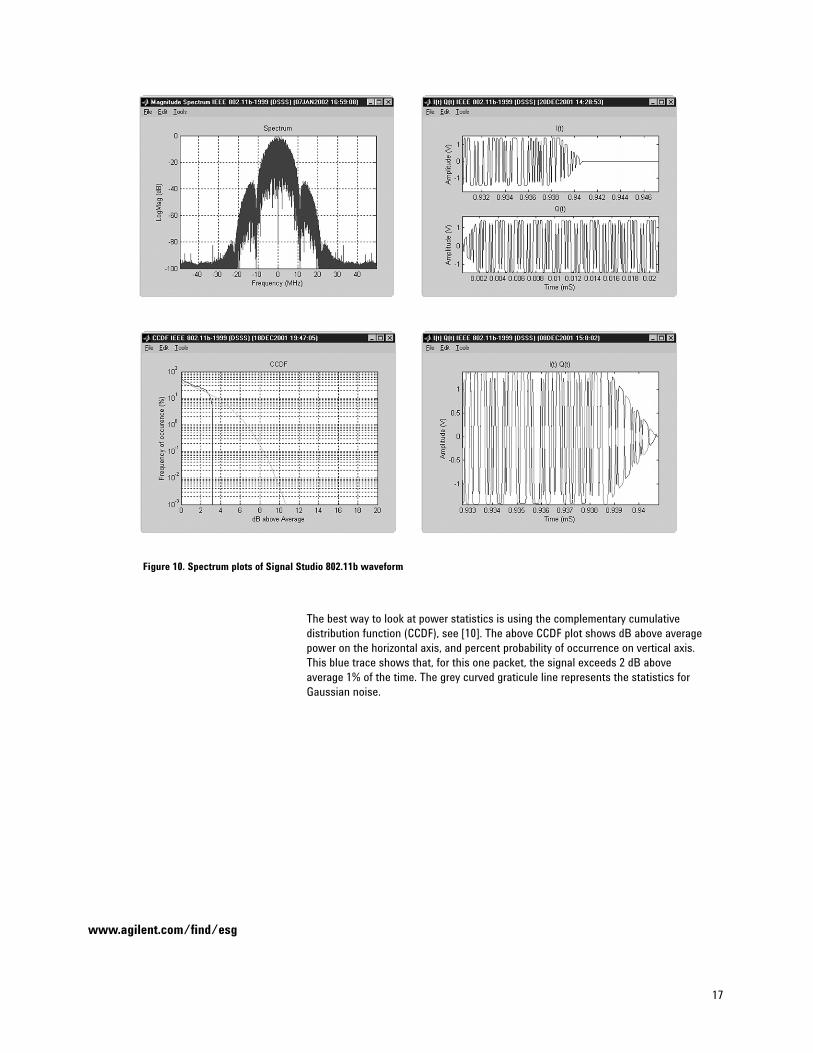
Generate plotsAfter the I/Q waveform has been calculated, the Signal Studio software is capable ofgenerating a plot of the baseband spectrum, I/Q waveforms, and CCDF curves, see Figure 10. To plot the spectrum, choose Plot→ Spectrum from the menu keys at the top of the window. The plot can be magnified using the zoom feature in the Tools pull-downmenu at the top of the plot. Simply select the zoom feature and use the mouse pointer to select the section of the plot to be affected. Plots of the I/Q and CCDF waveforms can be generated in a similar manner.
17
www.agilent.com/find/esg
Figure 10. Spectrum plots of Signal Studio 802.11b waveform
The best way to look at power statistics is using the complementary cumulative distribution function (CCDF), see [10]. The above CCDF plot shows dB above averagepower on the horizontal axis, and percent probability of occurrence on vertical axis. This blue trace shows that, for this one packet, the signal exceeds 2 dB above average 1% of the time. The grey curved graticule line represents the statistics forGaussian noise.

18
www.agilent.com/find/esg
The ESG will be connected to the PC as shown in Figure 11. See the Signal StudioInstallation Guide [1] for more details on connecting the computer to the ESG.
Step 4b – Download
Select download button (See Figure 9) to send the calculated I/Q waveform file representing the 802.11b waveform and the signal generator settings to the instrument. The signal generator automatically begins producing the 802.11b RF signal. Local control of the instrument is then re-enabled, and signal generator settings can be modified from the instrument’s frontpanel. The waveform files themselves cannot be modified once they have been downloadedto the instrument.
The Signal Studio 802.11b software configuration can be saved to the host computer’s localhard drive. The configuration can then be recalled at any time to re-calculate and downloadthe waveform to the signal generator. This is especially useful when complex configurationshave been created in the software. From the menu keys at the top of the window in Figure 9,choose File → Save As, and then name the file and save it in the ESG-B/Dot11b directory.The software configuration can be recalled anytime by choosing the following menu options:File → Open, then the file name.
After the calculated I/Q waveform has been downloaded to the signal generator for playback, it can be saved in the instrument’s non-volatile memory for storage and laterrecall. For more information on saving waveforms to the instrument. The I/Q waveform filescreated by the Signal Studio software cannot be stored outside the instrument.
Signal studio configuration and setup
E4438C ESGwith Option 001 or002 and 405 RF output
Rear panelLAN or GPIB
Figure 11. PC to ESG configuration

19
www.agilent.com/find/esg
The following window, Figure 12, appears after a successful download. This windowmust be closed by clicking OK to access the main menu again.
Refresh buttonThis button refreshes the frequency and amplitude settings on the ESG. This buttonallows the user to modify the frequency and amplitude settings any time during operation, and then pressing the refresh button will refresh the frequency and the amplitude settings.
Verify ESG generating waveformThe signal generator is now generating the 802.11b modulated RF signal. Verify this byviewing the ESG user interface.
ESG instruction Front panel buttons and menu selections
Verify that the 802.11b signal that [Mode Setup]was just created and named dot11b is being generated, Figure 13.
Figure 13. ESG ARB baseband generator user interface
Figure 12. Window to indicate a successful waveform transfer to the ESG

20
www.agilent.com/find/esg
Bit error rate (BER) is not a specified metric in the 802.11b standard, but it is a commonmeasure of signal quality for digital communication systems. BER is the number of corrupted bits received divided by the total number of bits received. The BER analyzer(option UN7) in the ESG can perform this measurement on the payload data.The ESG’sinternal BER analyzer is capable of analyzing framed and unframed continuous PN9 baseband data sequences. The BER analyzer on the ESG requires data and clock signalswhen performing BER on unframed data. Framed data requires three signals to the ESG’s BER analyzer: data, clock, and gate.
The clock signal indicates the data rate of the incoming data sequence. The gate signalenables the BER analyzer when a valid segment of the PN9 baseband data sequence ispresent for analysis in a framed data structure. When performing BER measurements, the gate signal is used to strip off header information and recover the continuous PN(pseudorandom noise)sequence payload data portion of the WLAN packet. The datalength of the payload must be an integer multiple of a PN9 sequence as defined by ITU VO1.53. This allows the BER tester to keep track of a continuous PN9 sequence.Example: Maximum data length for Signal Studio is 2312 bytes and PN9 = 511 bits. An integer multiple of PN9 that would fit in the data payload would be equal to 2044 bytes (4* 511 = 2044).
An example BER measurement setup for a framed 802.11b signal is illustrated in Figure 15. This example shows a RF test signal that consists of a standards compliant802.11b modulated packet with a continuous PN9 sequence.
The WLAN receiver demodulates and decodes the signal transmitted by the ESG and provides access to the WLAN baseband signal at the baseband processor output. This TTL/CMOS signal is routed to the ESG internal BER analyzer data input.
See [8] for more details on performing receiver tests using the ESG and Signal Studio.
Bit error rate tests
Figure 14. BER test set-up to measure a framed 802.11b signal
21
www.agilent.com/find/esg
Frame error rate testsWhile the ESG doesn’t have the capability to perform frame error rate (FER) tests, Signal Studio 802.11b creates standards compliant 802.11b packets. FER is the number of corrupted frames received divided by the total number of frames received. These testsignals have all the framing and coding as defined in the standard, which is important to obtain FER measurements in receiver testing. The framing of the 802.11b includes acyclic redundancy check (CRC), which can be used to determine the FER. The deviceunder test (DUT) will need to demodulate and decode the test signal. The CRC can be used by the DUT to determine how many frames that were sent from the source were lost. The number of sent frames can then be compared to the received frames todetermine the FER.
If it is desired to perform packet error rate (PER), then the MAC FCS can be used to compute the PER. When the MAC header box is selected, the FCS is performed on theMAC header and the payload. Note: When the MAC header is not selected, then the FCS is performed just on the payload.
Multipacket capabilityMultiple 802.11b packets can be created using the waveform sequencer in the ARB menu in the ESG. The ARB sequencer can “play” an ordered series of individual waveforms. Waveforms can be generated using the dual arbitrary waveform generator,renamed as “waveform segments,” and built into user-defined waveform sequences that are modulated to the RF output. Waveform sequencer features include waveformclipping, markers, and triggering useful for synchronizing the output of the signal generator with other devices. For more details on how to create multipacket, refer to the user’s guide [9].

22
www.agilent.com/find/esg
• ESG Configuration• E4438C ESG Vector Signal Generator
• Options 506, frequency range up to 6 GHz• Option UNJ, enhanced phase noise • 001 or 002, Baseband generator• Signal Studio-802.11b, Option 405 License Key
• PSA Configuration• E4440 PSA High Performance Spectrum Analyzer
• VSA Configuration• 89640A: DC to 2.7 GHz Vector Signal Analyzer
• Option AYA, vector modulation analysis
Transmitter measurements
IEEE 1394 interfacePC
89640a softwareand
Signal Studio802.11b software LAN interface
89640A VSAused for EVM measurement
Ch 1 input RF in
RF in
RF in
Ref10 MHz
Ref10 MHz
Trigger in toPSA rear panel
Event 1 from ESG rear panel
PSA seriesspectrum analyzerused for spectral mask measurement
E4438C ESG with options506, UNJ, 001 or 002, 405
Figure 15. Test and measurement equipment set-up
23
www.agilent.com/find/esg
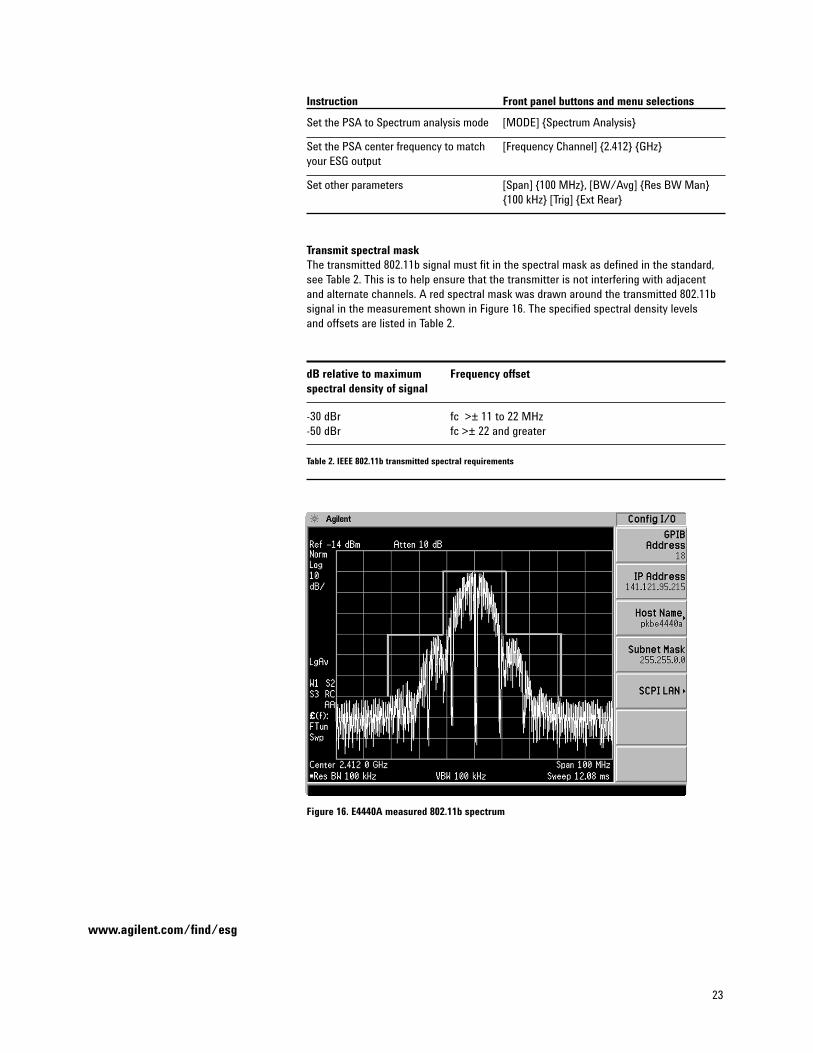
Instruction Front panel buttons and menu selections
Set the PSA to Spectrum analysis mode [MODE] {Spectrum Analysis}
Set the PSA center frequency to match [Frequency Channel] {2.412} {GHz} your ESG output
Set other parameters [Span] {100 MHz}, [BW/Avg] {Res BW Man}{100 kHz} [Trig] {Ext Rear}
Transmit spectral mask The transmitted 802.11b signal must fit in the spectral mask as defined in the standard,see Table 2. This is to help ensure that the transmitter is not interfering with adjacent and alternate channels. A red spectral mask was drawn around the transmitted 802.11bsignal in the measurement shown in Figure 16. The specified spectral density levels and offsets are listed in Table 2.
dB relative to maximum Frequency offsetspectral density of signal
-30 dBr fc >± 11 to 22 MHz -50 dBr fc >± 22 and greater
Table 2. IEEE 802.11b transmitted spectral requirements
Figure 16. E4440A measured 802.11b spectrum
24
www.agilent.com/find/esg
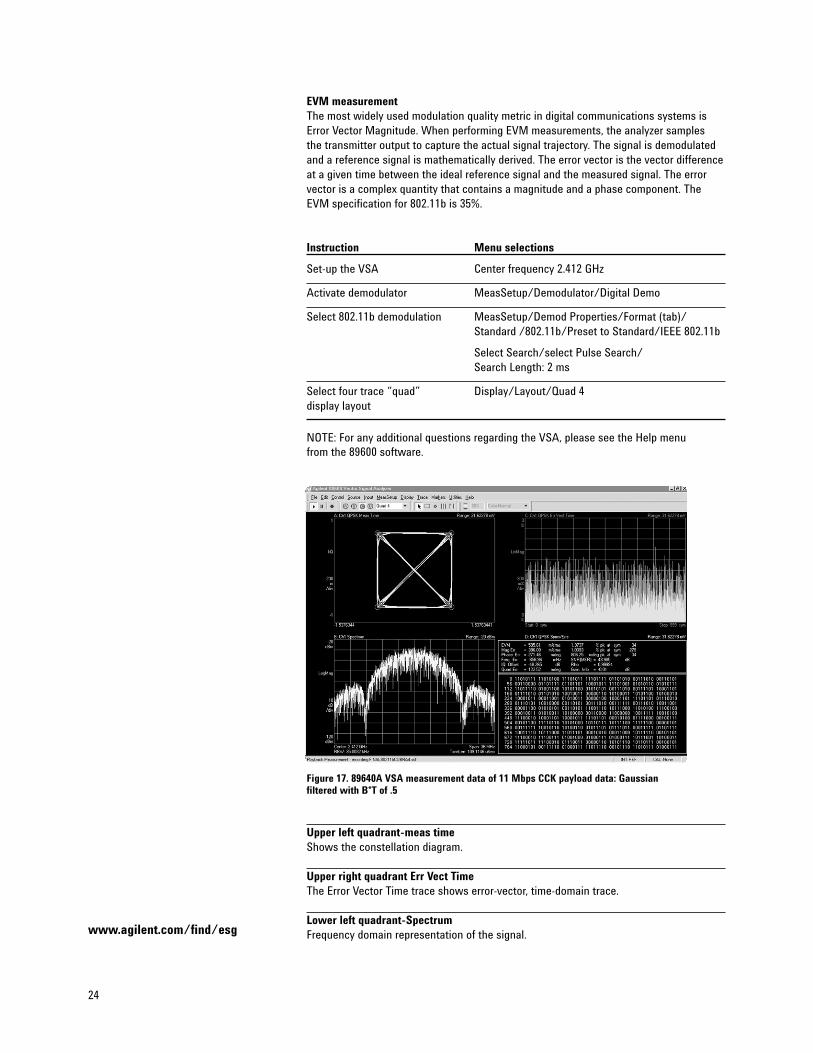
EVM measurementThe most widely used modulation quality metric in digital communications systems isError Vector Magnitude. When performing EVM measurements, the analyzer samples the transmitter output to capture the actual signal trajectory. The signal is demodulatedand a reference signal is mathematically derived. The error vector is the vector differenceat a given time between the ideal reference signal and the measured signal. The errorvector is a complex quantity that contains a magnitude and a phase component. TheEVM specification for 802.11b is 35%.
Instruction Menu selections
Set-up the VSA Center frequency 2.412 GHz
Activate demodulator MeasSetup/Demodulator/Digital Demo
Select 802.11b demodulation MeasSetup/Demod Properties/Format (tab)/Standard /802.11b/Preset to Standard/IEEE 802.11b
Select Search/select Pulse Search/Search Length: 2 ms
Select four trace “quad” Display/Layout/Quad 4display layout
NOTE: For any additional questions regarding the VSA, please see the Help menu from the 89600 software.
Upper left quadrant-meas timeShows the constellation diagram.
Upper right quadrant Err Vect TimeThe Error Vector Time trace shows error-vector, time-domain trace.
Lower left quadrant-SpectrumFrequency domain representation of the signal.
Figure 17. 89640A VSA measurement data of 11 Mbps CCK payload data: Gaussian filtered with B*T of .5
25
www.agilent.com/find/esg
Lower right quadrant-symbol/error tableThe 802.11b symbol/error table provides a wealth of data on an 802.11b WLAN burst.Along with the demodulated data bits, this table provides the following information:
Ch1 QPSK syms/errs
Metric Description
EVM EVM (error vector magnitude) is the Root Mean Square (RMS) of the error vectors computed and expressed as a percentage of the square root of the mean power of the ideal signal. The error vector is the magnitude of the vector, at the detected symbol location,which connects the I/Q reference-signal phasor to the I/Q measured-signal phasor, and is computed as follows: EVM [n] = SQRT(Ierr[n]2 + Qerr[n]2)Where: [n] = measurement at the symbol time Ierr = I Ref - I Meas and Qerr = Q Ref - Q MeasThe symbol table also shows the symbol that has the largest EVM called the Peak EVM.
Mag Err Magnitude error is an indicator of the quality of the amplitude component of the modulated signal. For example: a very high magnitude error might indicate high incidental AM modulation on the signal.
The magnitude error shown in the symbol table is computed only at the symbol times (the instant in time when symbols are detected).The computation does not include points between symbols. Therefore,the value of Points/Symbol has no effect on this parameter. The symbol table also shows the symbol that has the largest magnitudeerror (peak magnitude error).
Phase Err This parameter is the difference, in phase, between the I/Q referencesignal and the I/Q measured signal.
The magnitude of this parameter is an indicator of the quality of thephase component of the modulated signal. For example, a very highphase error might indicate high incidental FM modulation on the signal.
The phase error shown in the symbol table is computed only at thesymbol times (the instant in time when symbols are detected). Thecomputation does not include points between symbols. Therefore, thevalue of Points/Symbol has no effect on this parameter. The symboltable also shows the symbol that has the largest phase error (the peak phase error).
Freq Error This parameter shows the carrier frequency-error relative to the analyzer’s center frequency. This parameter is displayed in Hertz and is the amount of frequency shift, from the analyzer’s center frequency,that the analyzer must perform to achieve carrier lock. SNR(MER) SNR (Digital Demodulation)
26
www.agilent.com/find/esg
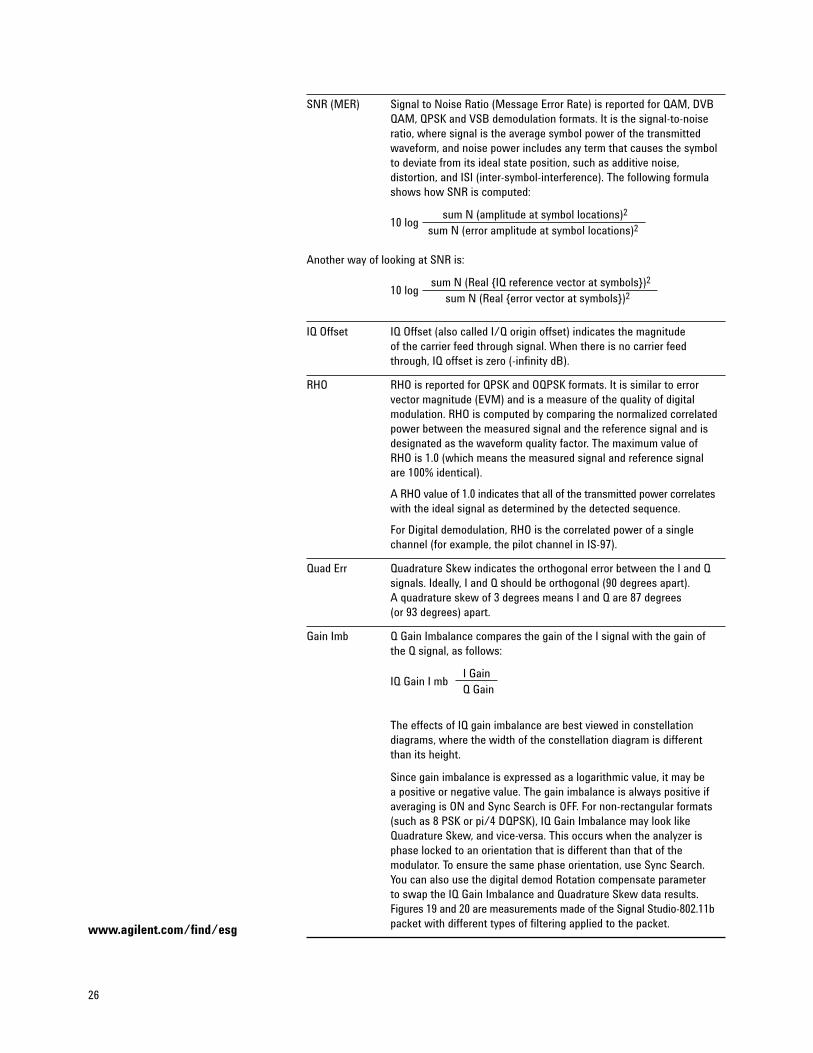
SNR (MER) Signal to Noise Ratio (Message Error Rate) is reported for QAM, DVBQAM, QPSK and VSB demodulation formats. It is the signal-to-noiseratio, where signal is the average symbol power of the transmittedwaveform, and noise power includes any term that causes the symbolto deviate from its ideal state position, such as additive noise, distortion, and ISI (inter-symbol-interference). The following formulashows how SNR is computed:
sum N (amplitude at symbol locations)210 log
sum N (error amplitude at symbol locations)2
Another way of looking at SNR is:
sum N (Real {IQ reference vector at symbols})210 log
sum N (Real {error vector at symbols})2
IQ Offset IQ Offset (also called I/Q origin offset) indicates the magnitude of the carrier feed through signal. When there is no carrier feedthrough, IQ offset is zero (-infinity dB).
RHO RHO is reported for QPSK and OQPSK formats. It is similar to error vector magnitude (EVM) and is a measure of the quality of digital modulation. RHO is computed by comparing the normalized correlatedpower between the measured signal and the reference signal and isdesignated as the waveform quality factor. The maximum value of RHO is 1.0 (which means the measured signal and reference signal are 100% identical).
A RHO value of 1.0 indicates that all of the transmitted power correlateswith the ideal signal as determined by the detected sequence.
For Digital demodulation, RHO is the correlated power of a single channel (for example, the pilot channel in IS-97).
Quad Err Quadrature Skew indicates the orthogonal error between the I and Qsignals. Ideally, I and Q should be orthogonal (90 degrees apart). A quadrature skew of 3 degrees means I and Q are 87 degrees (or 93 degrees) apart.
Gain Imb Q Gain Imbalance compares the gain of the I signal with the gain of the Q signal, as follows:
I GainIQ Gain I mb
Q Gain
The effects of IQ gain imbalance are best viewed in constellation diagrams, where the width of the constellation diagram is different than its height.
Since gain imbalance is expressed as a logarithmic value, it may be a positive or negative value. The gain imbalance is always positive ifaveraging is ON and Sync Search is OFF. For non-rectangular formats(such as 8 PSK or pi/4 DQPSK), IQ Gain Imbalance may look likeQuadrature Skew, and vice-versa. This occurs when the analyzer isphase locked to an orientation that is different than that of the modulator. To ensure the same phase orientation, use Sync Search. You can also use the digital demod Rotation compensate parameter to swap the IQ Gain Imbalance and Quadrature Skew data results. Figures 19 and 20 are measurements made of the Signal Studio-802.11bpacket with different types of filtering applied to the packet.

27
www.agilent.com/find/esg
Figures 18 and 19 are measurements made of the Signal Studio 802.11b packet with different types of filtering applied to the packet.
Figure 18. 89640A VSA measurement data of 11 Mbps CCK payload data: Gaussian filtered with B*T of .3
Figure 19. 89640A VSA measurement data of 11 Mbps CCK payload data: root-cosine filtered with an alpha of .7
28
www.agilent.com/find/esg
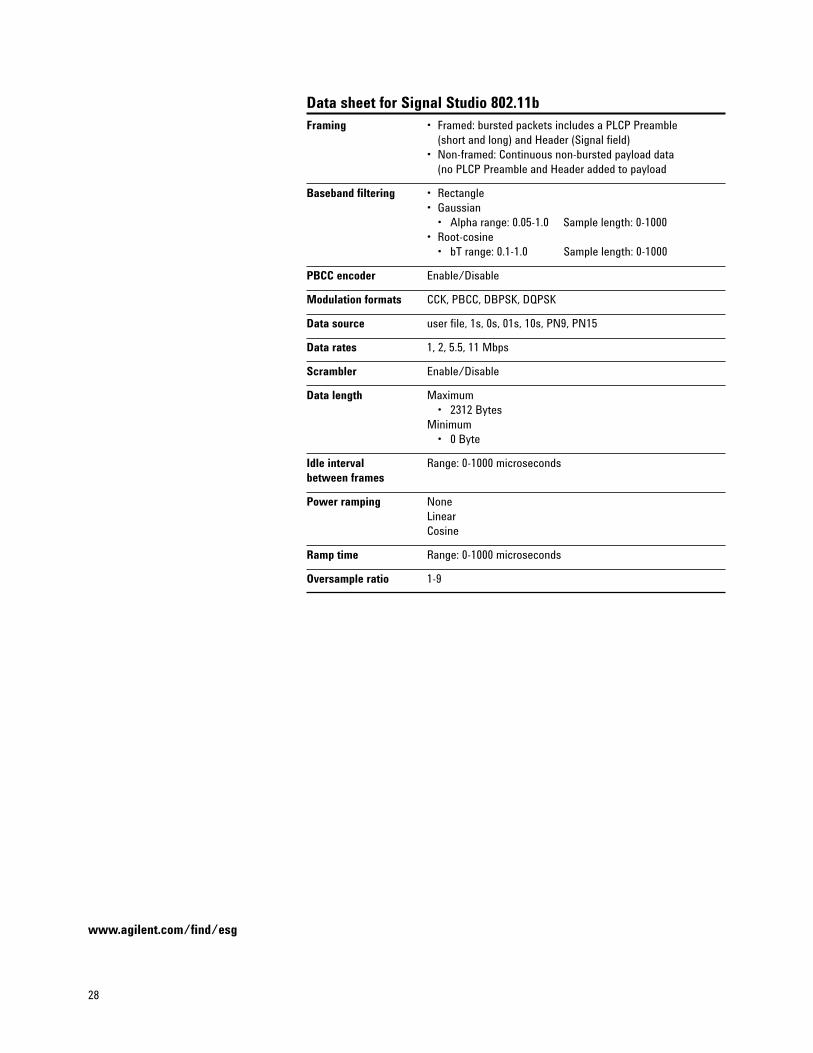
Data sheet for Signal Studio 802.11bFraming • Framed: bursted packets includes a PLCP Preamble
(short and long) and Header (Signal field)• Non-framed: Continuous non-bursted payload data
(no PLCP Preamble and Header added to payload
Baseband filtering • Rectangle• Gaussian
• Alpha range: 0.05-1.0 Sample length: 0-1000• Root-cosine
• bT range: 0.1-1.0 Sample length: 0-1000
PBCC encoder Enable/Disable
Modulation formats CCK, PBCC, DBPSK, DQPSK
Data source user file, 1s, 0s, 01s, 10s, PN9, PN15
Data rates 1, 2, 5.5, 11 Mbps
Scrambler Enable/Disable
Data length Maximum• 2312 Bytes
Minimum• 0 Byte
Idle interval Range: 0-1000 microseconds between frames
Power ramping NoneLinearCosine
Ramp time Range: 0-1000 microseconds
Oversample ratio 1-9
29
www.agilent.com/find/esg
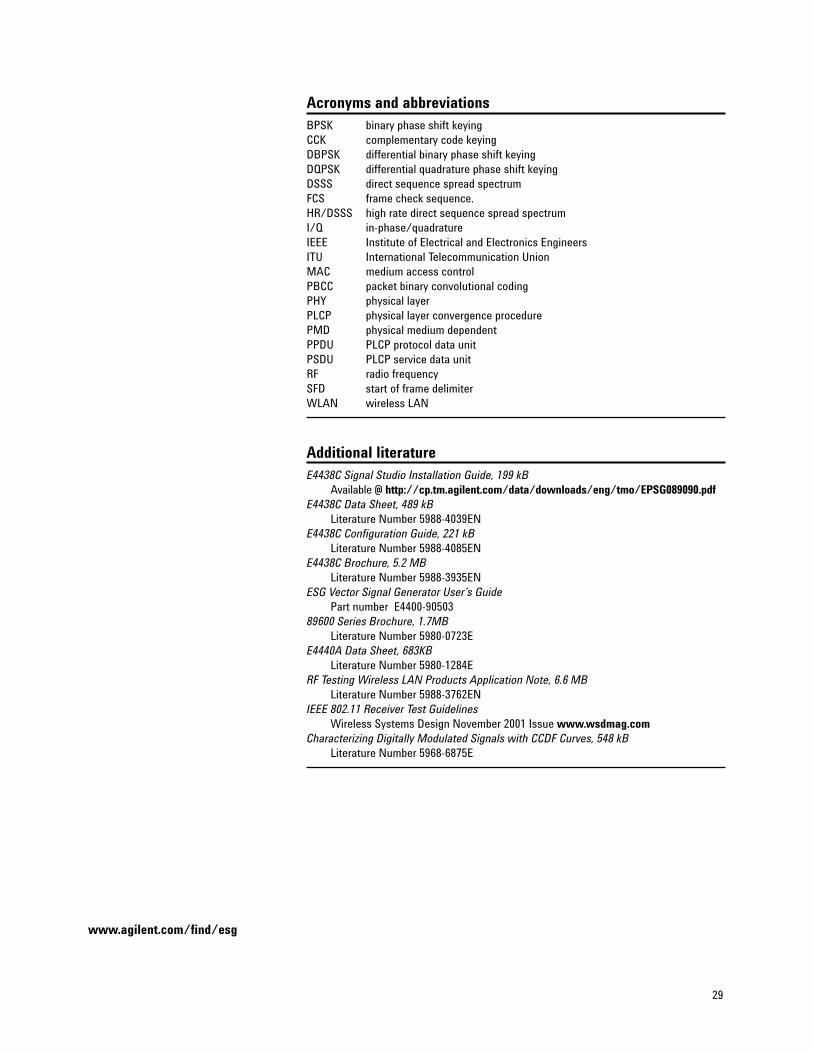
Acronyms and abbreviationsBPSK binary phase shift keyingCCK complementary code keying DBPSK differential binary phase shift keyingDQPSK differential quadrature phase shift keyingDSSS direct sequence spread spectrumFCS frame check sequence.HR/DSSS high rate direct sequence spread spectrumI/Q in-phase/quadratureIEEE Institute of Electrical and Electronics EngineersITU International Telecommunication UnionMAC medium access controlPBCC packet binary convolutional codingPHY physical layerPLCP physical layer convergence procedurePMD physical medium dependentPPDU PLCP protocol data unitPSDU PLCP service data unitRF radio frequencySFD start of frame delimiterWLAN wireless LAN
Additional literatureE4438C Signal Studio Installation Guide, 199 kB
Available @ http://cp.tm.agilent.com/data/downloads/eng/tmo/EPSG089090.pdfE4438C Data Sheet, 489 kB
Literature Number 5988-4039ENE4438C Configuration Guide, 221 kB
Literature Number 5988-4085ENE4438C Brochure, 5.2 MB
Literature Number 5988-3935ENESG Vector Signal Generator User’s Guide
Part number E4400-9050389600 Series Brochure, 1.7MB
Literature Number 5980-0723EE4440A Data Sheet, 683KB
Literature Number 5980-1284ERF Testing Wireless LAN Products Application Note, 6.6 MB
Literature Number 5988-3762ENIEEE 802.11 Receiver Test Guidelines
Wireless Systems Design November 2001 Issue www.wsdmag.comCharacterizing Digitally Modulated Signals with CCDF Curves, 548 kB
Literature Number 5968-6875E
30
www.agilent.com/find/esg
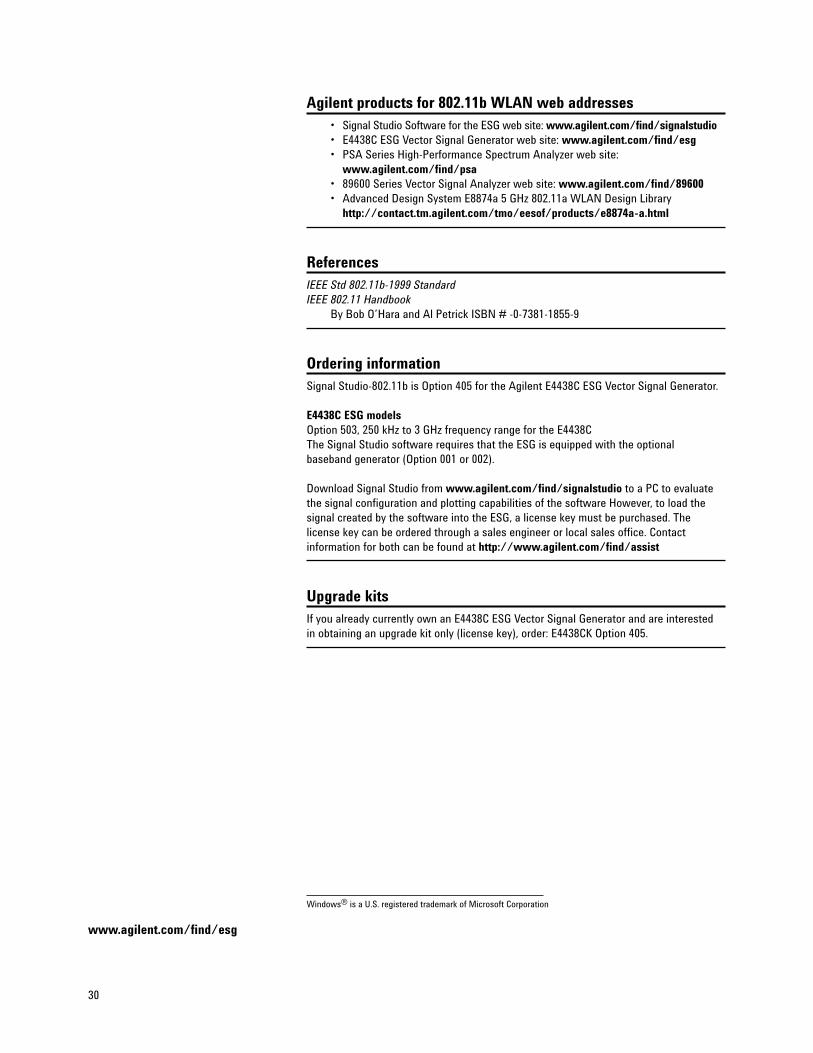
Agilent products for 802.11b WLAN web addresses• Signal Studio Software for the ESG web site: www.agilent.com/find/signalstudio• E4438C ESG Vector Signal Generator web site: www.agilent.com/find/esg• PSA Series High-Performance Spectrum Analyzer web site:
www.agilent.com/find/psa• 89600 Series Vector Signal Analyzer web site: www.agilent.com/find/89600• Advanced Design System E8874a 5 GHz 802.11a WLAN Design Library
http://contact.tm.agilent.com/tmo/eesof/products/e8874a-a.html
ReferencesIEEE Std 802.11b-1999 StandardIEEE 802.11 Handbook
By Bob O’Hara and Al Petrick ISBN # -0-7381-1855-9
Ordering informationSignal Studio-802.11b is Option 405 for the Agilent E4438C ESG Vector Signal Generator.
E4438C ESG modelsOption 503, 250 kHz to 3 GHz frequency range for the E4438CThe Signal Studio software requires that the ESG is equipped with the optional baseband generator (Option 001 or 002).
Download Signal Studio from www.agilent.com/find/signalstudio to a PC to evaluatethe signal configuration and plotting capabilities of the software However, to load the signal created by the software into the ESG, a license key must be purchased. Thelicense key can be ordered through a sales engineer or local sales office. Contact information for both can be found at http://www.agilent.com/find/assist
Upgrade kitsIf you already currently own an E4438C ESG Vector Signal Generator and are interested in obtaining an upgrade kit only (license key), order: E4438CK Option 405.
Windows® is a U.S. registered trademark of Microsoft Corporation

31
www.agilent.com/find/esg

32
www.agilent.com/find/esg
Agilent Technologies’ Test and MeasurementSupport, Services, and AssistanceAgilent Technologies aims to maximize the valueyou receive, while minimizing your risk and problems. We strive to ensure that you get the test and measurement capabilities you paid forand obtain the support you need. Our extensivesupport resources and services can help youchoose the right Agilent products for your applications and apply them successfully. Everyinstrument and system we sell has a global warranty. Support is available for at least fiveyears beyond the production life of the product.Two concepts underlie Agilent’s overall supportpolicy: “Our Promise” and “Your Advantage.”
Our PromiseOur Promise means your Agilent test and measurement equipment will meet its advertisedperformance and functionality. When you arechoosing new equipment, we will help you withproduct information, including realistic performancespecifications and practical recommendations fromexperienced test engineers. When you use Agilentequipment, we can verify that it works properly,help with product operation, and provide basicmeasurement assistance for the use of specifiedcapabilities, at no extra cost upon request. Manyself-help tools are available.
Your AdvantageYour Advantage means that Agilent offers a widerange of additional expert test and measurementservices, which you can purchase according toyour unique technical and business needs. Solveproblems efficiently and gain a competitive edge by contracting with us for calibration, extra-costupgrades, out-of-warranty repairs, and on-site education and training, as well as design, systemintegration, project management, and other professional engineering services. ExperiencedAgilent engineers and technicians worldwide can help you maximize your productivity, optimize thereturn on investment of your Agilent instrumentsand systems, and obtain dependable measurementaccuracy for the life of those products.
By internet, phone, or fax, get assistance withall your test and measurement needs
Online assistance:
www.agilent.com/find/assist
Phone or Fax:
United States:(tel) 1-800-452-4844
Canada:(tel) 1-877- 894-4414(fax) (905) 282-6495
China:(tel) 800-810-0189(fax) 1-0800-650-0121
Europe:(tel) (31 20) 547-2323(fax) (31 20) 547-2390
Japan:(tel) (81) 426-56-7832(fax) (81) 426-56-7840
Korea:(tel) (82 2) 2004-5004(fax) (82 2) 2004-5115
Latin America:(tel) (305) 269-7500(fax) (305) 269-7599
Taiwan:(tel) 080-004-7866(fax) (886 2) 2545-6723
Other Asia Pacific Countries:(tel) (65) 375-8100(fax) (65) 836-0252Email: [email protected]
Product specifications and descriptions in thisdocument subject to change without notice.
© Agilent Technologies, Inc. 2002 Printed in U.S.A., March 15, 20025988-5415EN