agile productivity metricsnyspin.org/mah___nyc_spin_feb_2007.pdf · agile productivity metrics: ......
TRANSCRIPT
2/20/2007 1Copyright QSM Associates, Inc.
Michael MahManaging Partner
QSM Associates, Inc.75 South Church Street
Pittsfield, MA 01201413-499-0988
Fax 413-447-7322e-mail: [email protected]
Website: www.qsma.comBlog: www.optimalfriction.com
Agile Productivity Metrics:“XP and Productivity Measures – What the
Numbers Say”

2/20/2007 2Copyright QSM Associates, Inc.

2/20/2007 3Copyright QSM Associates, Inc.
Manifesto for Agile Software DevelopmentWe are uncovering better ways of developing software by doing it and helping others do it. Through this work we have come to value:
Individuals and interactions over processes and tools working software over comprehensive documentation Customer collaboration over contract negotiation responding to change over following a plan That is, while there is value in the items on the right, we value the items on the left more.
© 2001 Kent Beck, Mike Beedle, Arie van Bennekum, Alistair Cockburn, Ward Cunningham, James Grenning, Jim Highsmith, Andrew Hunt, Ron Jeffries, Jon Kern, Brian Marick, Robert C. Martin, Steve Mellor, Ken Schwaber, Jeff Sutherland, Dave Thomas, Martin Fowler

2/20/2007 4Copyright QSM Associates, Inc.
“Frothy eloquence neither convinces nor satisfies me. I am from Missouri. You have got to show me.”
- Missouri Congressman Willard Duncan Vandiver, 1899

2/20/2007 5Copyright QSM Associates, Inc.
“Without metrics,you’re just another personwith a different opinion.”

2/20/2007 6Copyright QSM Associates, Inc.
QSM Corporate ProfileFounded by Larry Putnam, international expert in software estimation.QSM Software Lifecycle Management Tools (SLIM Suite) used worldwide by Fortune 500 Clients, Federal, and State Agencies to measure, estimate, and control software developmentOffices in Washington DC, New England, London, Paris, Amsterdam, and Tokyo.QSM research findings and the methodology within SLIM are published in 5+ books, over 100+ published papers.

2/20/2007 7Copyright QSM Associates, Inc.

2/20/2007 8Copyright QSM Associates, Inc.
Industry Data from the QSM SLIM-Metrics Database
Spans 20+ yearsLarge, worldwide heterogeneous database contains over 7,300+ projectsRepresents over 685+ million SLOC, 7+ million function points, over 600 languages, from 500+ organizations in 18 countriesAdding 200 – 400 projects/year

2/20/2007 9Copyright QSM Associates, Inc.
Partial List of Clients
British TelecomSAP MicrosoftIntel BellSouth Keane Motorola Verizon WirelessComputer Sciences Corp
Thomson MedstatIBM GlobalMisys HealthcareJPMorganChaseBoeingBank of New YorkDiscover CardSiemens MedicalThe Vanguard Group

2/20/2007 10Copyright QSM Associates, Inc.

2/20/2007 11Copyright QSM Associates, Inc.

2/20/2007 12Copyright QSM Associates, Inc.

2/20/2007 13Copyright QSM Associates, Inc.
SLIM-Metrics
SLIM-Estimate
SLIM-ControlMetrics
Repository& Analysis
Size, Schedule,Cost & Quality
Estimating
“In-Flight”Forecasting
Models Used for this Analysis

2/20/2007 14Copyright QSM Associates, Inc.
3 - DETERMINE PROCESSMETRICS & PROJECT POSITIONING
1 - COLLECT ANDVALIDATE PROJECT DATA
2 - ANALYZE PROJECTS USINGQSM REFERENCE DATABASE
4 - DOCUMENT RESULTS
Overview of Database
Number of Projects vs Division
Division
Desktop Faxes
High End Systems
Mobile Coms
Number of Projects0.0 0.5 1.0 1.5 2.0 2.5 3.0 3.5 4.0 4.5 5.0 5.5
5.0
3.0
3.0
Avg, Min, Max PI Grade vs Division
Division
Desktop Faxes
High End Systems
Mobile Coms
Number of Projects0 5 10 15 20 25 30 35 40
Average Value of Metrics
New Percent SLOC
Modified % SLOC
Unmodified % SLOC
Number of Projects0 5 10 15 20 25 30 35 40 45 50 55 60 65
56
12
35
Life Cycle Effort vs ESLOC
ESLOC (thousands)1 10 100 1000
Life Effort (M
HR
) (thousands)
0.01
0.1
1
10
100
ALL Systems Fax Corp 1997base Avg.
Agile Measurement Approach

15Copyright QSM Associates, Inc.
Agile/XP Client #1Team size
24 Developers7 Testers3 Customers3 Project Leaders
Code Base1,000,000 lines of code7,000 automated unit test10,000 automated acceptance test

16Copyright QSM Associates, Inc.
People ManagementXP Says “XP works in small to medium sized teams”How we evolved or extended this rule
Subteams1 large room is mandatory
Trade-offs Communication between subteams1 room noise level (distractions)Lack of personal space

2/20/2007 17Copyright QSM Associates, Inc.

2/20/2007 18Copyright QSM Associates, Inc.

2/20/2007 19Copyright QSM Associates, Inc.

2/20/2007 20Copyright QSM Associates, Inc.

2/20/2007 21Copyright QSM Associates, Inc.

2/20/2007 22Copyright QSM Associates, Inc.
Input to SLIM
Size
Time
Defects
Effort

2/20/2007 23Copyright QSM Associates, Inc.
SLIM Replica – Destiny 5.0Staffing & Probability Analysis
Avg Staff (people)<Destiny Release 5.0>
1 2 3 4 5 6 7 8 9Oct'03
Nov Dec Jan'04
Feb Mar Apr May Jun Jul Aug Sep
0
5
10
15
20
25
30
Avg Staff (people)
876543 21
STORYBUILD
Milestones 0 - CSR 1 - SRR 2 - HLDR 3 - LLDR 4 - CUT 5 - IC 6 - STC 7 - UAT 8 - FCR 9 - 99R 10 - 99.9R
Milestones 0 - CSR 1 - SRR 2 - HLDR 3 - LLDR 4 - CUT 5 - IC 6 - STC 7 - UAT 8 - FCR 9 - 99R 10 - 99.9R
SOLUTION PANEL - <Destiny Release 5.0>
DurationEffortCost
Peak StaffMTTD
Start Date
BUILD6.5151
1283.523.2
0.6751/5/2004
Life Cycle7.2162
1377.223.2
0.67512/15/2003
MonthsPM$ (K)peopleDays
PI=23.1 MBI=5.6 Eff SLOC=218,531
CONTROL PANEL - <Destiny Release 5.0>
PI 18.5 27.7
23.1
Peak Staff 18.5 27.8
23.2
Eff SLOC (K) 175 262
219

2/20/2007 24Copyright QSM Associates, Inc.
Trendline Assessment –Build Phase StaffingMain Build Peak Staff vs. Size
100 1,000Effective SLOC (thousands)
0.1
1
10
100
1,000
Peak S
taff (FTEs)
Destiny Release 6.0
Destiny Release 6.5
Destiny Release 5.0
Destiny Release 6.0
Destiny Release 6.5
Destiny Release 5.0
Business Sy stems Av ionic Sy stems Command & Control Microcode Sy stems Process Control QSM 2005 BusinessAv g. Line Sty le 1 Sigma Line Sty le
Normal Staffing

2/20/2007 25Copyright QSM Associates, Inc.
Trendline Assessment – Build Phase ScheduleMain Build Phase Duration vs Size
100 1,000Effective SLOC (thousands)
1
10
100Tim
e (Months)Destiny Release 5.0
Destiny Release 6.0
Destiny Release 6.5
Destiny Release 5.0
Destiny Release 6.0
Destiny Release 6.5
Business Sy stems Av ionic Sy stems Command & Control Microcode Sy stems Process Control QSM 2005 BusinessAv g. Line Sty le 1 Sigma Line Sty le
Much Faster Schedules

2/20/2007 26Copyright QSM Associates, Inc.
Trendline Assessment – Defects/QualityDefects During Test
100 1,000Effective SLOC (thousands)
10
100
1,000
10,000
Errors (S
ysInt-Del)
Destiny Release 5.0
Destiny Release 6.0
Destiny Release 6.5
Destiny Release 5.0
Destiny Release 6.0
Destiny Release 6.5
Business Sy stems Av ionic Sy stems Command & Control Microcode Sy stems Process Control QSM 2005 BusinessAv g. Line Sty le 1 Sigma Line Sty le
Far Fewer Defects: >50% Below Industry

27Copyright QSM Associates, Inc.
CustomersXP Says “The customer is always available”
All phases of an XP project require communication with the customer The customer will also be needed to help with functional testing.
How this rule was evolved or extendedCustomers are external end-usersCustomer Proxy role
Customer Advocate
Trade-offsCustomer advocate allows
someone to “always be available”Potential for different interpretation
of need

2/20/2007 28Copyright QSM Associates, Inc.
Industry Average
Current Performance
Improvement
Project Cost $3.5 Million $2.4 Million -$1.1M
Schedule 12.3 months 8.7 months -3.6 mos
CumulativeDefects
2,702 1372 <50%
Staffing 33 33 n/a
* Using average project size of 150,000 lines of new and modified code
Company A vs. Industry Average

2/20/2007 29Copyright QSM Associates, Inc.
Industrial XP Environment – Agile Client #2

2/20/2007 30Copyright QSM Associates, Inc.

2/20/2007 31Copyright QSM Associates, Inc.
Industrial XP Environment

2/20/2007 32Copyright QSM Associates, Inc.
Industrial XP Environment
Photo courtesy of Joshua Kerievsky

2/20/2007 33Copyright QSM Associates, Inc.
Traditional Release 1
Traditional Release – Whiteboard Sketch

2/20/2007 34Copyright QSM Associates, Inc.
Size
Time
Defects
Effort
Input to SLIM

2/20/2007 35Copyright QSM Associates, Inc.
Staffing & Probability Analysis
Avg Staff (people)<Single Goal - MBI 1.1946>
1 2 3 4 5 6 7 8 9 10 11 12 13 14 15 16 17 18 19 20 21 22 23 24 25 26Jul'01
Aug Sep Oct Nov Dec Jan'02
Feb Mar Apr May Jun Jul Aug Sep Oct Nov Dec Jan'03
Feb Mar Apr May Jun Jul Aug Sep
0
5
10
15
20
25Avg Staff (people)
876543 21
R&DC&T
Milestones 0 - CSR 1 - SRR 2 - HLDR 3 - LLDR 4 - CUT 5 - IC 6 - STC 7 - UAT 8 - FCR 9 - 99R 10 - 99.9R
Milestones 0 - CSR 1 - SRR 2 - HLDR 3 - LLDR 4 - CUT 5 - IC 6 - STC 7 - UAT 8 - FCR 9 - 99R 10 - 99.9R
SOLUTION PANEL <Single Goal - MBI 1.1946>
DurationEffortCost
Peak StaffMTTD
Start Date
C&T24.0347
589319.50.3
9/29/2001
Life Cycle27.0397
674119.50.3
7/1/2001
MonthsPM
$ (K)peopleDays
PI=17.0 MBI=1.2 Eff SLOC=376022
CONTROL PANEL <Single Goal - MBI 1.1946>
PI 13.6 20.4
17.0
Peak Staff 15.6 23.4
19.5
Eff SLOC (K) 301 451
376
Project: Condor
Digitized Replica Using SLIM™
2/20/2007 36Copyright QSM Associates, Inc.
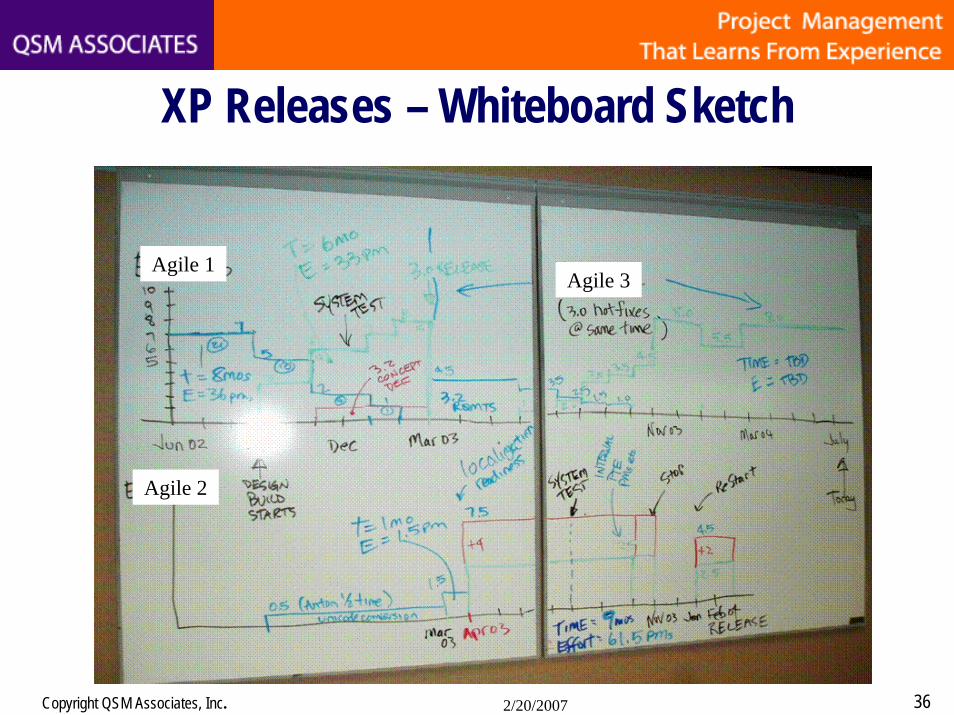
Agile 1
Agile 2
Agile 3
XP Releases – Whiteboard Sketch

2/20/2007 37Copyright QSM Associates, Inc.
Staffing & Probability Analysis
Avg Staff (people)<XP Rel. 3.0>
1 2 3 4 5 6 7 8 9Apr'02
May Jun Jul Aug Sep Oct Nov Dec Jan'03
Feb Mar
0
2
4
6
8
10A
vgS
taff (people)876543 21
R&DC&T
Milestones0 - CSR1 - SRR2 - HLDR3 - LLDR4 - CUT5 - IC6 - STC7 - UAT8 - FCR9 - 99R10 - 99.9R
Milestones0 - CSR1 - SRR2 - HLDR3 - LLDR4 - CUT5 - IC6 - STC7 - UAT8 - FCR9 - 99R10 - 99.9R
SOLUTION PANEL <XP Rel. 3.0>
DurationEffortCost
Peak StaffMTTD
Start Date
C&T6.033
5618.41.8
8/31/2002
Life Cycle9.069
11738.41.8
6/1/2002
MonthsPM
$ (K)peopleDays
PI=20.7 MBI=3.8 Eff SLOC=67023
CONTROL PANEL <XP Rel. 3.0>
PI16.5 24.8
20.7
Peak Staff6.7 10.1
8.4
Eff SLOC (K)54 80
67
Project: Elan 3.0
Digitized Replica Using SLIMtm
2/20/2007 38Copyright QSM Associates, Inc.
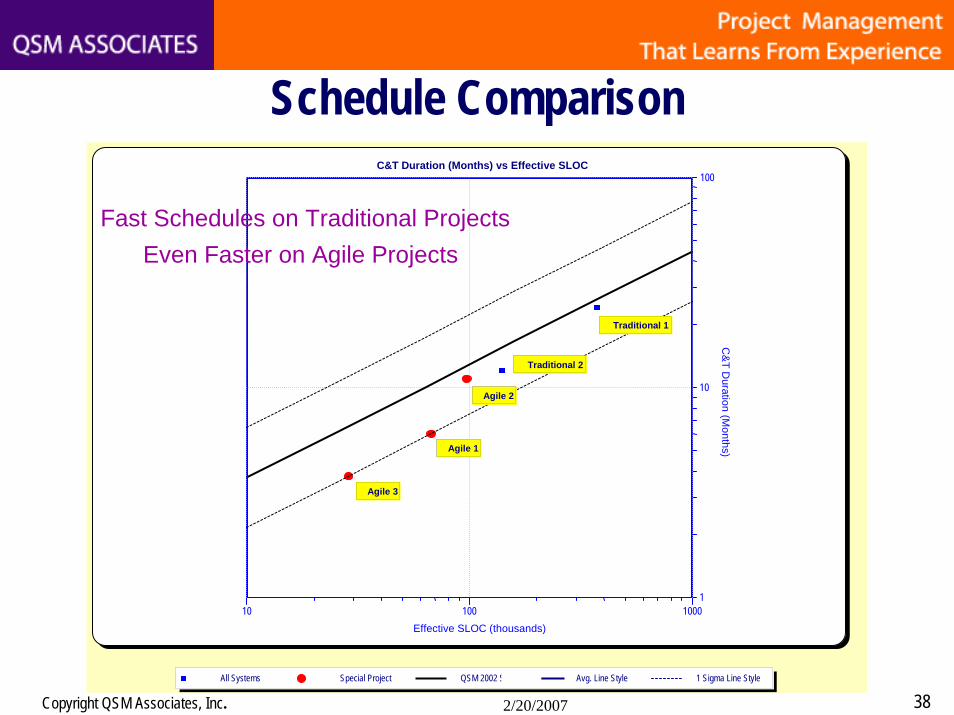
C&T Duration (Months) vs Effective SLOC
10 100 1000Effective SLOC (thousands)
1
10
100
C&
T Duration (M
onths)Agile 1
Agile 3
Agile 2
Traditional 1
Traditional 2
Agile 1
Agile 3
Agile 2
Traditional 1
Traditional 2
All Systems Special Project QSM 2002 Scientific Avg. Line Style 1 Sigma Line Style
Fast Schedules on Traditional ProjectsEven Faster on Agile Projects
Schedule Comparison

2/20/2007 39Copyright QSM Associates, Inc.
Errors SIT-FOC vs Effective SLOC
10 100 1000Effective SLOC (thousands)
1
10
100
1000
10000
Errors S
IT-FOC
Traditional 1
Traditional 2
Agile 1
Agile 2
Agile 3
Traditional 1
Traditional 2
Agile 1
Agile 2
Agile 3
All Sy stems Special Project QSM 2002 Scientific Av g. Line Sty le 1 Sigma Line Sty le
High Defects on Traditional ProjectsLow Defects on Agile Projects
Defect Comparison

2/20/2007 40Copyright QSM Associates, Inc.
Example PI CalculationSize = 376,022 SLOC
Effort = 347 Person-Months
Time = 24 Months*Condor
PI = SIZE
TIME EFFORT= 17

2/20/2007 41Copyright QSM Associates, Inc.
Productivity Index (PI)(industry values by application type)
0 2 4 6 8 10 12 14 16 18 20 22 24
Productivity Index (PI) w/ ±1 Standard Deviation
Avionics
Business
Command and Control
Microcode
Process Control
Real Time
Scientific
System
Telecommunications
Information
Engineering
Real Time

2/20/2007 42Copyright QSM Associates, Inc.
Previous Performance
Current Performance
Percent Improvement
Project Cost $2.8 Million $1.1 Million 61%
Schedule 18 months 13.5 months 24%
CumulativeDefects
2,270 381 83%
Staffing 18 11 39%
* Using average project size of 150,000 lines of new and modified code
Before vs. After Summary

2/20/2007 43Copyright QSM Associates, Inc.
Industry Average
Offshore Average
Difference
Project Cost $3.5 Million $3.2 Million -$0.2M
Schedule 12.3 months 9.6 months -2.7 mos
CumulativeDefects
2,702 7,565 280%
Staffing 33 50 +17
* Using average project size of 150,000 lines of new and modified code
Industry Average vs. Offshore

2/20/2007 44Copyright QSM Associates, Inc.
SLIM-Metrics
SLIM-Estimate
SLIM-ControlMetrics
Repository& Analysis
Size, Schedule,Cost & Quality
Estimating
StatisticalProcess
Control &Adaptive
Forecasting
Metrics Tools Used for this Analysis

2/20/2007 45Copyright QSM Associates, Inc.
Recommended Web Resources
Blogosphere:
www.optimalfriction.com
QSM Associates Web Library/Resource Center:
www.qsma.com

2/20/2007 46Copyright QSM Associates, Inc.
RecommendedReading
“Reassessing XP,” by Tom DeMarco/Cutter Business Technology Council, Business Technology Trends Advisory,Volume 6, No. 8. © Cutter Information Corp.
Mah, Michael, “The Making of the Agile IT Executive”Business IT Strategies Advisory Executive Report Vol 6 Number 10. © 2004 Cutter Information Corp.
Putnam, Lawrence H., and Myers, Ware, “Five Core Metrics,The Intelligence Behind Successful Software Management”© 2003 Dorset House Publishers.

2/20/2007 47Copyright QSM Associates, Inc.
For Additional Information
Contact:
Michael MahManaging PartnerQSM Associates Inc.Clocktower Building75 So. Church St., Suite 600Pittsfield, MA 01201
Email: [email protected] url: www.qsma.com