agi earth science · pdf fileagi earth science week ... introduction 1 electromagnetic...
TRANSCRIPT
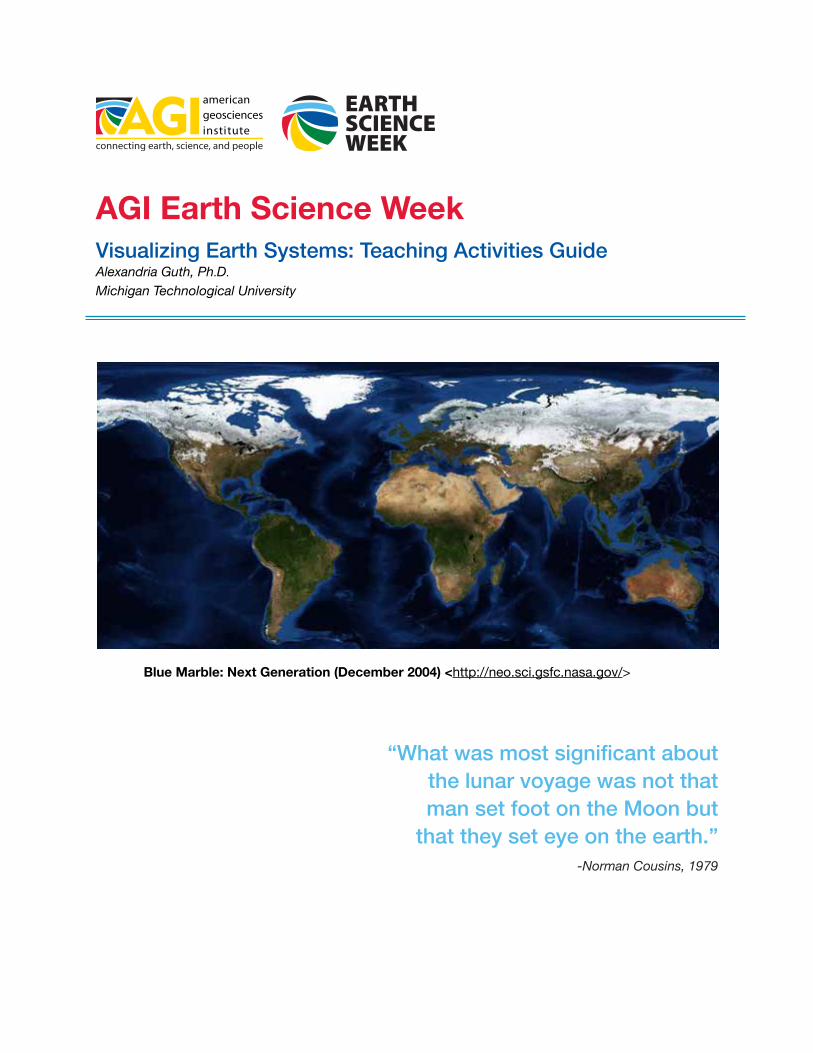
AGI Earth Science Week Visualizing Earth Systems: Teaching Activities Guide Alexandria Guth, Ph.D.Michigan Technological University
Blue Marble: Next Generation (December 2004) <http://neo.sci.gsfc.nasa.gov/>
“What was most significant about the lunar voyage was not that man set foot on the Moon but
that they set eye on the earth.” -Norman Cousins, 1979

AGI Earth Science WeekVisualizing Earth Systems: Teaching Activities Guide
Written by Alexandria Guth, Ph.D.
AGI gratefully acknowledges the contribution of Mara Chen, Ph.D., and Daniel Harris, Ph.D., Salisbury University, Salisbury, MD.
Project Director: Ed Robeck
Published and printed in the United States of America. All rights reserved. No part of this work may be reproduced or transmitted in any form or by any means, electronic or mechanical, record-ing, or any information storage and retrieval system without the expressed written consent of the publisher.
Layout and Design: Alexandria Guth, Ph.D.
Suggested citation:
Guth, A. (2015). Visualizing Earth Systems: Teaching Activities Guide. Alexandria, VA: American Geosciences Institute.
For more information on the American Geosciences Institute and its publications check us out at www.americangeosciences.org/pubs.
© 2015 American Geosciences Institute.

AGI Earth Science Week ii ..........................................................Introduction 1 Electromagnetic Spectrum 2 ......................................................Origins of Light: Blackbody Radiation 4 1. Visible Light 5 .......................................................................
Light Meters: Measuring Intensity 6 ....................................About Composite Images 6 .........................................................
A Bit on Albedo 7 .........................................................................
Light Meter Activities 8 ........................................................Land Surface Reflectance 8 ........................................................
Lux to Albedo 11 ..........................................................................
Practical Concerns: White is Bright 13 .......................................
UFO Balloon 14 .....................................................................Fun with Hot Air 14 ......................................................................
Radiometer 16 ......................................................................Light is Energy 16 .........................................................................
Diffraction Glasses 18 ..........................................................Hidden Rainbows 18 ....................................................................
Earth Science Connections 20 .............................................Studying the Earth 20 ..................................................................
Albedo & Climate 20 ....................................................................
Simple Feedback Loops 21 .........................................................
Volcanoes & Climate Feedback 21 ..............................................
Green Thumbs, Red Lights? 22 ...................................................
Stellar Information 23 ...................................................................
�iii

2. Ultraviolet 24 .........................................................................UV Detection Cards: 25 ........................................................
How Well Am I Protected? 25 ......................................................
UV Beads 27 .........................................................................Bead Scientists 27 .......................................................................
Origins of Light: Non-blackbody examples 29 ....................Phosphorescence = Glow in the Dark Fun 29 ............................
Earth Science Connections 30 .............................................Fluorescence 30 ...........................................................................
Bulbs, Energy, and the Origins of Light 31 ..................................
Elevated Concerns 32 ..................................................................
Albedo Strikes Again! 33 ............................................................
Seeing in UV 33 ............................................................................
How Sunscreen Works: Functional Albedo 35 ...........................
Conclusions 36 ...........................................................................Resources 37 ..............................................................................Appendices 39 ............................................................................
Denver Public Schools Standards 39 ..................................Houston ISD Scope & Sequence Affinities: 40....................
�iv
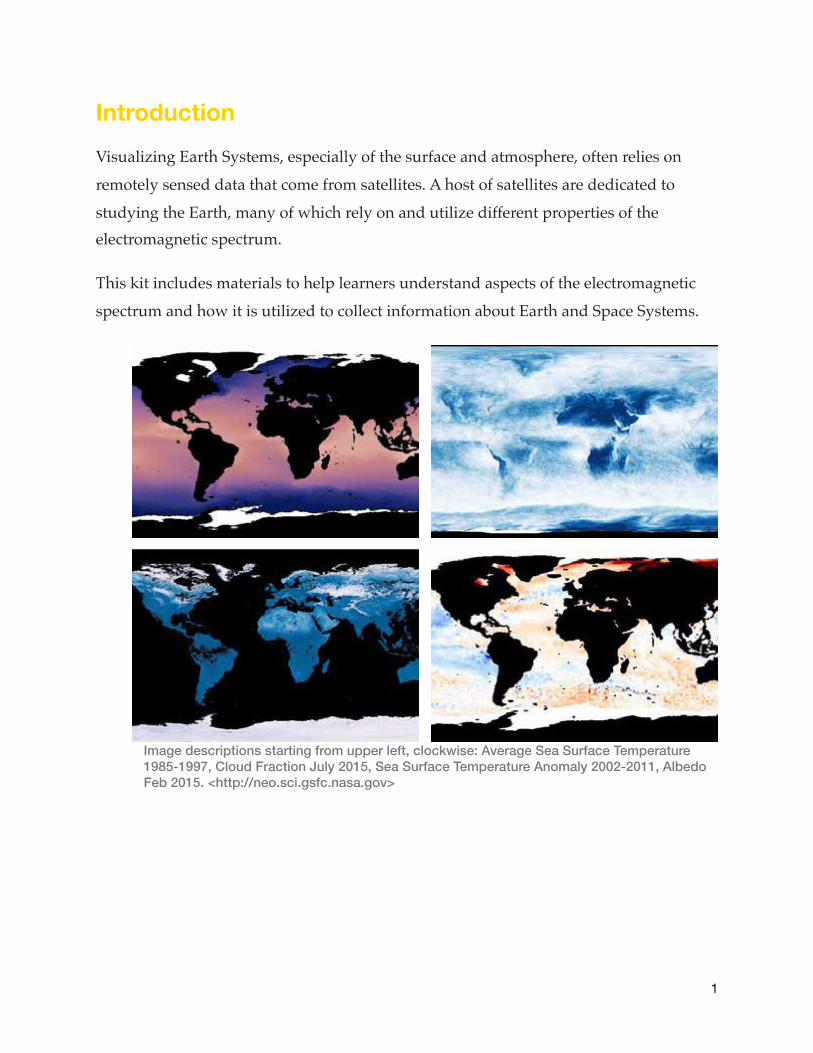
Introduction Visualizing Earth Systems, especially of the surface and atmosphere, often relies on
remotely sensed data that come from satellites. A host of satellites are dedicated to
studying the Earth, many of which rely on and utilize different properties of the electromagnetic spectrum.
This kit includes materials to help learners understand aspects of the electromagnetic
spectrum and how it is utilized to collect information about Earth and Space Systems.
Image descriptions starting from upper left, clockwise: Average Sea Surface Temperature 1985-1997, Cloud Fraction July 2015, Sea Surface Temperature Anomaly 2002-2011, Albedo Feb 2015. <http://neo.sci.gsfc.nasa.gov>
�1

Electromagnetic Spectrum
Most people have heard of radio waves, microwaves, visible light, ultraviolet radiation,
and x-rays, but what they might not realize is that they are all part of a
continuous spectrum of electromagnetic waves.
The main difference is the wavelength - radio waves are long
(at the extreme end they are larger than our planet), x-
rays are very short (about the size of an atom), and
visible light is in-between. Wavelength is
inversely related to energy: the shortest wavelengths have the most energy,
which is why ultraviolet light and x-
rays (and the even more energetic
gamma rays) can harm living organisms.
�2
Electromagnetic waves are so named because they are propagating waves of coupled electric and magnetic fields. As demonstrated in many physics courses, moving magnetic fields induce electric currents, and moving electric currents induce magnetic fields. —NASA: Mission Science
The electromagnetic spectrum showing the wavelength ranges, frequencies, and energies of different named portions of spectrum. Note that each type of light is a range, and some of our common wave names overlap. — Berkeley Lab

The relationship between the energy (E) of a photon and its wavelength (λ) can be calculated using a variant of the Planck-Einstein Relation, where:
h is the Planck constant and c is the
speed of light in a vacuum - the
important part is that as wavelength (λ)
gets smaller, the photon’s energy (E) will get larger!
From radio waves to gamma waves,
these are all forms of light, but our eyes
can only see a small portion of the
spectrum; however, with the appropriate sensors we can “see” these
other wavelengths and generate
pictures to help us study Earth and
Space systems!
�3
Unlike sound and water waves which require a substance to travel through, electromagnetic waves can travel trough a vacuum. Thus, supernova, one of the most violent events known, would be seen but not heard. Image is the debris cloud/supernova remnant SNR 0519-69.0 in visible light - NASA.
E =hcλ
Many of the sensors we use to study the universe are in orbit because the Earth’s atmosphere is a good absorber of much of the electromagnetic spectrum. This is great for us, as many of the most energetic (harmful) wavelengths are completely absorbed. With a nice clear view of radio and visible waves though, there are a number of ground-based radio and optical telescopes studying the universe - NASA.

Origins of Light: Blackbody Radiation
Everything with a temperature above absolute zero (so, everything until the heat death of the universe - to learn more about absolute zero see this NOVA webpage ) emits 1
electromagnetic radiation. For the most part, what our eyes detect is visible light which
is reflected off surfaces, but we do interact with objects that emit visible light on a daily
basis. The largest object is our neighborhood star - the sun. But incandescent lightbulbs , 2
toaster and electric stove elements, gas stove and candle flames, all emit visible light. These objects visibly “glow” because they are hot, but if we could see other
wavelengths such as infrared, they would “glow” in wavelengths we can’t see too.
In terms of studying the earth, some sensors do look at emitted radiation, but the vast
majority of the Earth Observing Satellites look at how the light emitted by the sun
interacts with (what is reflected, what is absorbed) the surface of the Earth.
Blackbody radiation curves for bodies at different temperatures (in Kelvin). Our sun has a peak output in the green wavelengths but emits a range of wavelengths from radio to x-rays (as to why it looks yellow, see this article ). Cooler 3
objects, like the Earth (or most items in your daily life) have a peak output in the infrared. Diagram by Ant Beck - Wikimedia
NOVA, Absolute Zero <http://www.pbs.org/wgbh/nova/zero/>1
this is an important distinction, CFLs and LEDs are examples of luminescence and do not emit due to temperature2
Plait, P. 2008. Discover: Bad Astronomy. “Why are there no green stars?” <http://blogs.discovermagazine.com/3
badastronomy/2008/07/29/why-are-there-no-green-stars/>
�4
definition: A blackbody is defined as an object that absorbs all incoming radiation and emits a range of wavelengths determined by temperature. Many objects can be modeled as a blackbody emitters.
1. Visible Light
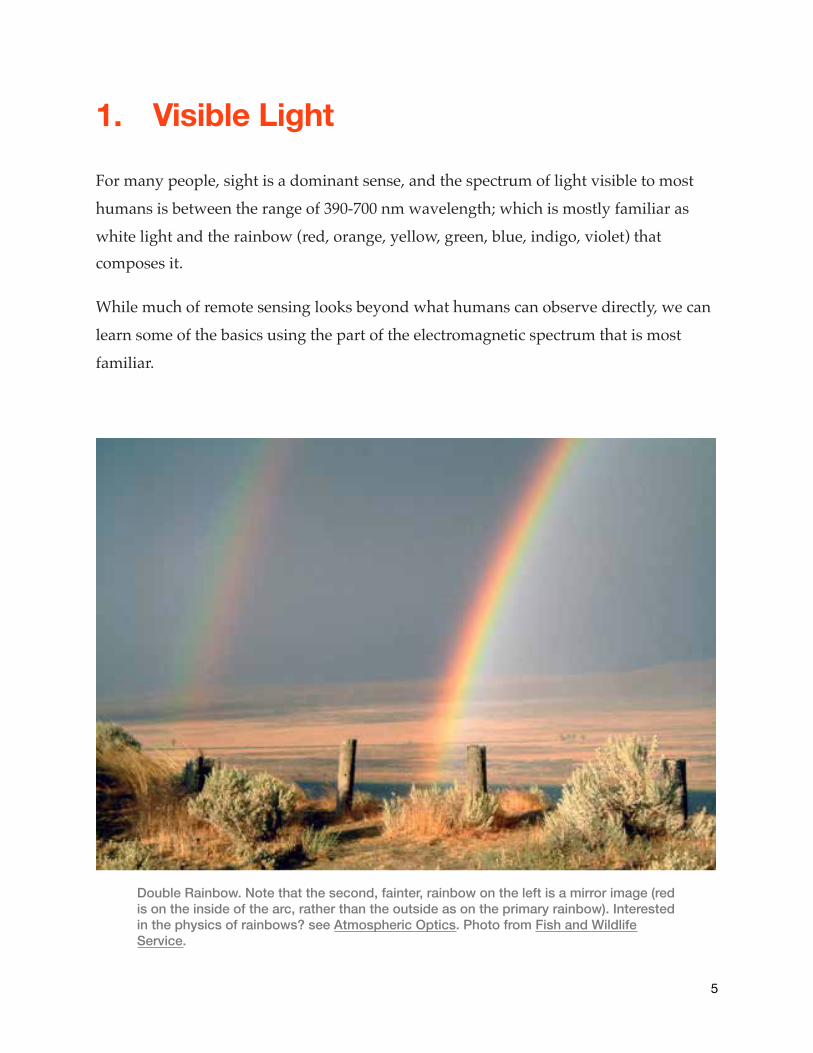
For many people, sight is a dominant sense, and the spectrum of light visible to most
humans is between the range of 390-700 nm wavelength; which is mostly familiar as
white light and the rainbow (red, orange, yellow, green, blue, indigo, violet) that composes it.
While much of remote sensing looks beyond what humans can observe directly, we can
learn some of the basics using the part of the electromagnetic spectrum that is most
familiar.
"
�5
Double Rainbow. Note that the second, fainter, rainbow on the left is a mirror image (red is on the inside of the arc, rather than the outside as on the primary rainbow). Interested in the physics of rainbows? see Atmospheric Optics. Photo from Fish and Wildlife Service.

Light Meters: Measuring Intensity The colors we see are those that are reflected from objects. The light meters included in
this kit measure lux (SI unit of illuminance; equals 1 lumen/square meter), and can be
used to measure the light emitted/reflected from a surface.
In essence, digital cameras and satellite sensors work the same way as the light meter,
but in those cases the light is split or filtered before the intensity of light is recorded
(thus allowing for the intensity of red light to be measured separately from the intensity
of green light, or infrared light, etc…).
About Composite Images
The intensity of the wavelength
recorded by a sensor can be
represented as a greyscale value (often 0-255); this intensity map,
can then be represented as an
intensity in a color we can see and
combined to form a single,
composite, color image.
If you are familiar with RGB (red,
green, blue) color values, this
might make more sense. The image
to the right shows how intensities
measured in the red, green, and blue sections of the visible spectrum can be combined to form a single image.
In the image above, section “A” is bright (near white) in the greyscale image
representing the red wavelength intensity, but dark in the green and blue images (pure
red in in RGB color space would be 255,0,0). The white section B on the other hand is
�6
example of how intensities recorded from different wavelengths can be combined to form a single color image. Note that white areas are bright in all 3 individual greyscale images. Source: Zolt Levay NASA, ESA, and The Hubble Heritage Team (STScI/AURA) via Bad Astronomy.
Red Green Blue
A
A
AB
BB
B B B
B
C
CC
C C C
C

bright in all 3 wavelengths (and RGB white is 255,255,255), and the yellow section C is bright in red and green, but dark in blue (and again, as an RGB value, yellow is
255,255,0).
A Bit on Albedo
Remote sensing works due to the different reflectance (albedo) characteristics of the
various materials of earth’s surface. Albedo is represented as a number from 0-100% (or
0-1), which indicates the fraction of solar energy reflected off Earth’s surface back into
space (or towards your sensor) . A surface with an albedo of 0 would be a perfect
absorber, a black body in physics, while 100 indicates a perfect reflector. Natural surfaces are typically in the range of 4-90%.
Thinking about the electromagnetic spectrum, objects do not absorb and reflect all
wavelengths by the same amount. This can be demonstrated by the fact that objects
have different colors - which indicates different absorption and reflection characteristics
within the visible wavelengths. Material that strongly reflects all visible wavelengths would appear white (for example; clean ice and snow), and material that absorbs all
visible wavelengths would look black (for example, asphalt, coal, basalt).
�7
Mean, annual albedo 2003-2004 of Earth’s surface from CERES-AQUA. Light colors are high albedo (and corresponds to regions with snow/ice) while dark blue is low albedo. What does this image tell you about the oceans? — Giorgiogp2, Wikimedia.

Reflectance occurs at the other wavelengths too, and in fact much of the important data on Earth and Space systems comes from visualizing typically non-visible wavelengths.
For example, in the image below, thermal imagery (left) highlights volcanic activity. A
false-color image (right) maps shortwave infrared (IR), near-IR, and green visible
reflectance values to red, green, and blue respectively, which highlights aspects of the
geology. Both of these add information that is not present solely in the “natural color” image (middle).
"
"
Light Meter Activities
Land Surface Reflectance modified from: “Remote Sensing: Stereoscopic View and Reflectance” activity by Dr. Daniel Harris and Dr. Mara Chen (Department of Geography and Geoscience, Salisbury University).
NGSS Connections:PS4.B: Electromagnetic Radiation: When light shines on an object, it is reflected, absorbed, or transmitted through the object, depending on the object’s material and the frequency (color) of the light. (MS-PS4-2)
Resources Needed• Lux Meter
Chiliques volcano in Chile. From left to right: night time thermal image (ASTER), day time ‘natural color’ image (ASTER), false color image 7-4-2 (Landsat) Source: http://asterweb.jpl.nasa.gov/gallery-detail.asp?name=Andean & USGS Earth Explorer
�8
We can use the light meter to measure the reflectance off different surfaces. To understand what is being recorded, make sure to refer to the user guide for your
particular light meter to determine what wavelengths the sensor is responding to. This
will often be in the visible wavelengths, but sensitivity range may differ.
SafetyParticularly if you have investigators exploring outside, it is important that they be reminded to employ situational awareness and may need explicit warnings (or supervision) regarding specific hazards (traffic, insects, tripping hazards, etc..).
What to do1. Turn on the lux meter. There is likely a cover for the sensor that would need to be
removed, and depending on the overall brightness of the environment, different scales may need to be selected.
2. Use the Lux meter to measure the reflectance of different types of land cover you find on your school grounds or campus.
• Hold the sensor a few inches above the surface you are measuring - avoid shadows cast by your hand or body, and try to avoid collecting measurements in shade in general unless it is an intentional comparison
• The sky is quite bright (as it is the source of the light being reflected), so it helps to hold the sensor facing down above the surface being investigated
• For each material, try to hold the sensor at the same height above the surface• Good choices might include concrete, grass, shrubs/bushes, bare ground, water,
etc. Depending on time, you could explore difference, such as healthy grass vs. dry grass, or different species of plants
3. Measure each type of surface (at least) three times in three different places.• this can be a good opportunity to discuss data collection and math techniques -
why do scientists collect multiple samples? what is an average or standard deviation?
4. Compute the average of the trials for each object examined and examine the reflectance ranking.
5. These data can then be compared with examples like the graph below.
�9

• Note: The Lux meter measures the intensity of light striking the sensor in the visible wavelengths (Bands 1, 2 and 3 in the diagram below)
Reading the graph: The above graph shows the reflectance of three different materials across a range of wavelengths. 1 micrometer (μm) = 1000 nanometers (nm), so the range is 0.4-2.6 μm or 400-2600 nm, which corresponds to violet (400nm) and short-wave infrared (2600 nm). The band numbers along the top correspond to the ranges that were detectable by the Landsat Thematic Mapper sensor (onboard Landsat 4 and 5). Bands 1, 2 & 3 recorded data in the blue, green, and red wavelengths respectively. We can see that in the visible range, water is the least reflective (is a good absorber; refer to image on page 6) while the dry bare soil is the most reflective, but the total range occupied by these materials is only 0-20% reflectance. If we looked at band 4 though, vegetation becomes the most reflective, and the 3 lines are overall more distinguishable, with a significant difference in reflectivity between vegetation and bare soil. Example questions to link data collection with graph:
• Do values recorded for each land cover show as much variation as those on the diagram?
• How might your results be different if the lux meter measured intensity in band 4 instead?
�10
Sample Reflected Lux
white car 21800
concrete 8800
gneiss 6400
bare soil 4610
grass 3320
rhyolite 2450
basalt 2430
black plastic bin 1380
Sample Data: no averaging, full sun

Lux to Albedo
Resources Needed • Lux Meter
In the previous example, lux readings are measured and
compared directly, but this is not
the same as a true albedo (which
is given as 0-1, or 0-100%). A
simple modification to the previous method allows for
albedo to be calculated though!
Albedo (A) values could be
calculated by recording the
incident luminance (I) as well as the reflectance values (R), as: A = R/I
• Point the sensor towards the
sky (not the sun) when you
take a reflectance reading to obtain the incident luminance
(I).
• If this the incident luminance is
recorded along with each reflectance value recorded, this helps control for changing
light conditions (clouds, shade, etc..).
By calculating the albedo, values could be directly compared between your recorded
results to those in the graph above. Tables of values can also be found online (e.g., here
or here).
�11
Top: measuring the reflectance off the surface of a gneiss boulder. Bottom: measuring the incident luminance. Note both readings are at the same scale and displayed values need to be multiplied by 100.
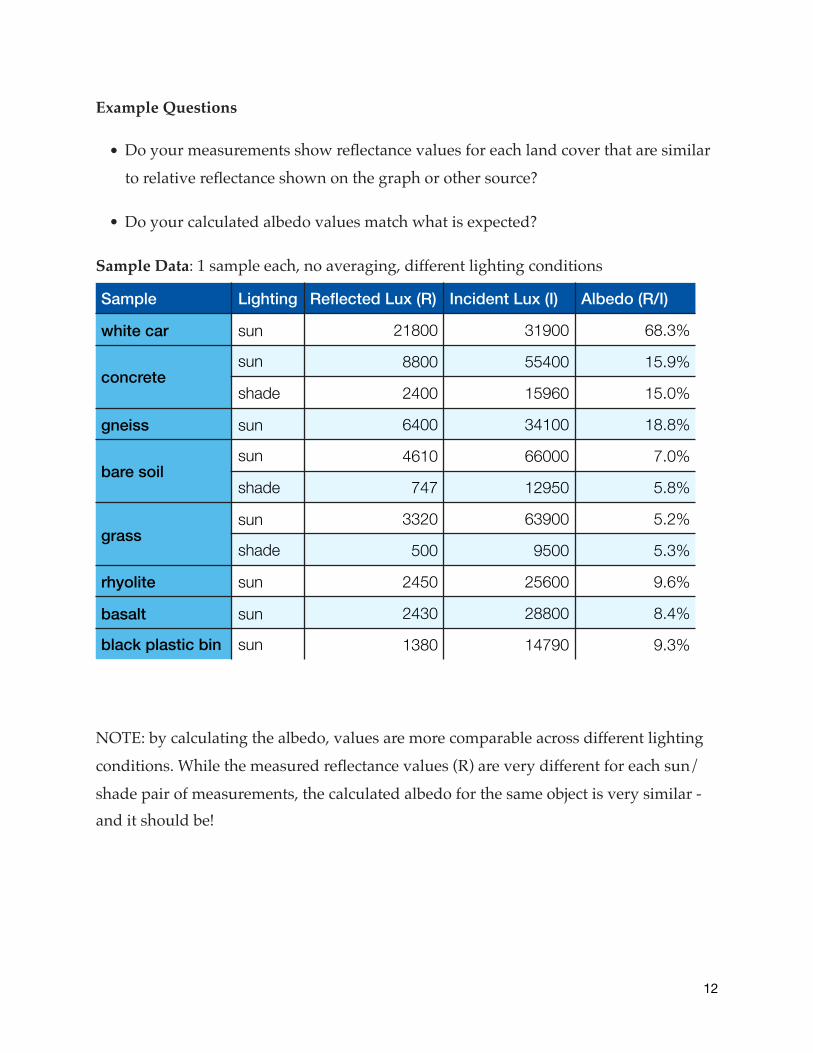
Example Questions
• Do your measurements show reflectance values for each land cover that are similar
to relative reflectance shown on the graph or other source?
• Do your calculated albedo values match what is expected?
Sample Data: 1 sample each, no averaging, different lighting conditions
NOTE: by calculating the albedo, values are more comparable across different lighting
conditions. While the measured reflectance values (R) are very different for each sun/
shade pair of measurements, the calculated albedo for the same object is very similar - and it should be!
Sample Lighting Reflected Lux (R) Incident Lux (I) Albedo (R/I)
white car sun 21800 31900 68.3%
concretesun 8800 55400 15.9%
shade 2400 15960 15.0%
gneiss sun 6400 34100 18.8%
bare soilsun 4610 66000 7.0%
shade 747 12950 5.8%
grasssun 3320 63900 5.2%
shade 500 9500 5.3%
rhyolite sun 2450 25600 9.6%
basalt sun 2430 28800 8.4%
black plastic bin sun 1380 14790 9.3%
�12

Practical Concerns: White is Bright
A very tangible result of albedo is the difference between a white t-shirt or car on a
sunny day and a black one.
While there are many other factors at play when it comes to human choice in buying a product, we can look at popular car colors by city in articles and compare with 4
seasonal averages for the different cities . You could also examine specific climate data 5
for different cities using NOAA data:
• Go to the NOAA Climate Normals for 1981-2010: http://www.ncdc.noaa.gov/cdo-web/datatools/normals
• Select a state and city
to load graphs and
tables that show highs,
lows, and averages for
that specific location.
The previous activities can
be run with cars to further
investigate what most
already intuitively know;
students could calculate the albedo of different car
colors or collect and
compare the direct lux
values to create a relative
ranking and make arguments about what colors would be most appropriate for their climate.
2009. CBSNews “Favorite Car Color? Depends on the City” <www.cbsnews.com/news/favorite-car-color-4
depends-on-the-city/>
The Weather Channel “Average Monthly Temperatures” <www.weather.com/maps/averages/normal-temperature>5
�13
Left: measuring the reflectance off a black plastic bin (1380 lx). Right: measuring reflectance of a white car (21800 lx). Note readings are at different scales and readings need to be multiplied by 10 (left) and 100 (right).

UFO Balloon Light is energy, and energy cannot be created or destroyed - merely transformed. So, when a dark object (low albedo) absorbs light, a major part is transformed into thermal
energy. Essentially, light excites the atoms/molecules in the material, and is converted
into kinetic/vibrational energy. As temperature is the average measure of kinetic energy
of a system, this process increases the temperature of the absorbing object. This should
be relatable to most people as black clothes and black cars heat up more quickly than their white counterparts.
Fun with Hot Air
NGSS Connections:PS3.A: Definitions of Energy: The term “heat” as used in everyday language refers both to thermal energy (the motion of atoms or molecules within a substance) and the transfer of that thermal energy from one object to another. In science, heat is used only for this second meaning; it refers to the energy transferred due to the temperature difference between two objects. (secondary to MS- PS1-4).
Temperature is a measure of the average kinetic energy of particles of matter. The relationship between the temperature and the total energy of a system depends on the types, states, and amounts of matter present. (MS-PS3-3),(MS-PS3-4)
�14
Black plastic is opaque to visible light, but transparent to infrared. The air inside will get warmer, but that is because the air inside cannot easily mix with the rest of the atmosphere, not because the plastic is trapping IR. photo from NASA/IPAC

PS4.B: Electromagnetic Radiation: When light shines on an object, it is reflected, absorbed, or transmitted through the object, depending on the object’s material and the frequency (color) of the light. (MS-PS4-2)
ESS2.D: Weather and Climate: Weather and climate are influenced by interactions involving sunlight, the ocean, the atmosphere, ice, landforms, and living things. These interactions vary with latitude, altitude, and local and regional geography, all of which can affect oceanic and atmospheric flow patterns.
Resources Needed • UFO Balloon
The UFO balloon in this kit is a thin, black, plastic bag. Being black, this plastic will
absorb the incident visible light, converting it to thermal energy. Additionally, it is
trapping a package of air and preventing it from mixing with the rest of the atmosphere,
which will allow this volume of air to warm and expand. As the temperature inside increases the air molecules spread out, causing the density to decrease.
It might be easy to think of the plastic as “trapping” thermal energy, but plastic is
actually transparent to infrared wavelengths, which can be seen in the image above.
The rising balloon is a way to visualize part of the convection process, which is very
important in Earth systems.
Safety
Depending on conditions, these balloons
can attain great heights, which could
cause issue with aircraft and/or lead to
down-wind plastic pollution.
�15
Atmospheric circulation is driven by convection caused by the uneven heating of the surface. The planet’s rotation creates several main circulation cells, which create surface winds. 1) Hadley cell, 2) Ferrel cell, 3) Polar cell. NOAA

Radiometer
The radiometer in this kit is more properly termed a Crookes Radiometer (there are several kinds). Several black and white panels are free to rotate on a metal spindle in a
partial vacuum, and will when exposed to light. Since the bulb protects the vanes from
wind currents, something else must be making them spin. Initial hypotheses suggested
that light pressure made the panels move, but that is not the case — in a total vacuum
the vanes do not move . Instead, a difference in temperature between the two sides of a 6
vane (due to albedo) causes the gas molecules in the bulb to flow around the vane edges
from the cooler (silver) side to the warmer (black) side, causing the vanes to move.
Light is Energy
NGSS Connections:PS2.A: Forces and Motion: For any pair of interacting objects, the force exerted by the first object on the second object is equal in strength to the force that the second object exerts on the first, but in the opposite direction (Newton’s third law).
The motion of an object is determined by the sum of the forces acting on it; if the total force on the object is not zero, its motion will change. The greater the mass of the object, the greater the force needed to achieve the same change in motion. For any given object, a larger force causes a larger change in motion.
PS3.A: Definitions of Energy: Motion energy is properly called kinetic energy; it is proportional to the mass of the moving object and grows with the square of its speed.
PS4.B: Electromagnetic Radiation: When light shines on an object, it is reflected, absorbed, or transmitted through the object, depending on the object’s material and the frequency (color) of the light. (MS-PS4-2)
Applied Science “How a Crookes radiometer works” <https://www.youtube.com/watch?v=r7NEI_C9Yh0>6
�16

Resources Needed• Lux Meter• Radiometer• Watch
Safety
The glass bulb of the radiometer is fragile and
should be handled with care.
What to do
The radiometer and its motion could make for
a puzzling engagement.
Set the radiometer near a window. If time
allows, make observations through the day
using the lux meter to measure the light
intensity. Rotation rate can be measured at
the same time - as lux increases the rotation rate should also increase.
• can measure time for one panel to
complete a full rotation or count the
number of passes in a given time
If enough data are collected, these could be plotted to examine the relationship between
lux and rotation speed.
In addition to variations in lux, different light sources could also be investigated. After
making observations with natural light, try placing the radiometer near a lamp with incandescent, compact fluorescent, LED, or UV bulbs.
�17
Crooke’s Radiometer, which is also sometimes called a “light mill”.
Rota
tions
/sec
0
0.175
0.35
0.525
0.7
Lumens (lux)
0 350 700 1050 1400

Diffraction Glasses
The paper rimmed glasses in this kit contain diffraction grating, which separates white
light into its component spectrum. We can use these to look at the differences between
different types of lights.
Hidden Rainbows
NGSS Connections:(HS) ESS1.A: The Universe and Its Stars: The study of stars’ light spectra and brightness is used to identify compositional elements of stars, their movements, and their distances from Earth.
(HS) PS4.B: Electromagnetic RadiationAtoms of each element emit and absorb characteristic frequencies of light. These characteristics allow identification of the presence of an element, even in microscopic quantities. (secondary)
The lights that surround us typically differ from each other - the lights in your kitchen,
office, street lamps, reading lights, fish tank,
etc., likely represent a range of of bulb
technologies and spectral characteristics.
Resources Needed• Spectral glasses• Digital camera
�18
Two different types of bulbs on the same post. Note that the pattern of bright spots in the spectra are slightly different.

Safety
Never look directly at the sun or at laser light - these glasses do not offer eye protection
What to do
Hold the diffraction grating against a camera lens and take photos of different light
sources through it. The resulting color patterns can then be easily compared later.
Light sources that emit at discrete wavelengths produce a series of colored duplicate images, which can be contrasted with the images of more continuous spectrum sources:
While the lights in these two photos might look similar to the naked eye (round, glowing, similar color), the diffraction grating tells us they use different light technologies. Left: street light with discrete spectra, Right: LED bulbs that utilize a phosphor to create a more continuous spectrum. If data were collected on commonly used lights over several years, the distribution of light types would likely change - this light “revolution” is currently in progress and has various impacts . 7
The diffraction grating
can also be used to
construct a spectroscope for better resolution. For additional ideas the National Optical 8
Astronomy Observatory has a nice document with more background and a 5E lesson . 9
Kendricken, D. Feb 1 2014. No Film School “Why Hollywood Will Never Look the Same Again on Film: LEDs Hit the 7
Streets of LA & NY” <http://nofilmschool.com/2014/02/why-hollywood-will-never-look-the-same-again-on-film-leds-in-la-ny> accessed Sept 29, 2015.
Turricchia , A. and A. Majcher . EU-HOU. “A homemade spectroscope” <http://www.pl.euhou.net/docupload/files/8
Excersises/WorldAroundUs/Spectroscope/spectroscope.pdf> accessed Sept 29, 2015
NOAO “Spectra of Lights” <http://www.noao.edu/education/ads.php> accessed Sept 29, 20159
�19
Earth Science Connections The reflectance of an object in different wavelengths allows for its detection in remotely
sensed images, and ideally, discrimination from other types of objects. Many of the
principles that are important to remote sensing also have important implications for understanding our planet.
Studying the Earth Changes in albedo (e.g., changes in color) can be used to understand changes on the
surface of the Earth. The USGS Earthshots website <http://earthshots.usgs.gov/
earthshots/> has many collections of remotely sensed images that are categorized by
theme
• Many of the image sets show how different events impact the earth’s surface - these data sets can be used to examine impacts of natural hazards and human actions.
Albedo & Climate 10
The polar ice caps are highly reflective - changing ice volumes can feed into positive feedback loops. For example, cooling climates can cause ice sheet advance; the more land surface covered by ice the more incoming solar radiation is reflected and global temperatures drop. Alternatively, global temperatures warm, ice sheets melt and expose more land and water which reflect less/absorb more incoming solar radiation, and temperatures increase.
• There are several albedo data sets that can be examined online to examine the albedo of Earth’s surface over the year. This allows for the examination of how changing seasons impact albedo (e.g., snow cover & leaf cover change seasonally in temperate regions while deserts and ice sheets have high albedo year-round)
NASA Earth Observations has monthly data from 2000 to present <http://neo.sci.gsfc.nasa.gov/view.php?datasetId=MCD43C3_M_BSA&date=2015-07-01>
NASA Earth Observatory. Oct 21, 2014. “Measuring Earth’s Albedo: Image of the Day” <http://10
earthobservatory.nasa.gov/IOTD/view.php?id=84499>
�20

IRI/LDEO Climate Data Library has older data over a single year but has more viewing options, including adjustable color scales and contours <http://iridl.ldeo.columbia.edu/SOURCES/.NASA/.ERBE/>- select “Climatology”, then “clear-sky”, and at the top select the “Views” tab- The “data as colors” will display a map, with surface albedo values
mapped to a color range - buttons near the top of the map will allow for navigating to other months,
which can be used to see seasonal changes
Simple Feedback Loops As described above, feedback loops can play a significant role in the overall climate of the planet. An online, interactive, model for Daisy World 11 12
shows how a living surface cover (daisies) that responds to changing temperature can modulate surface temperature
• Read the introduction• run the model with different conditions to
see how life, albedo, and stellar evolution combine to influence the global climate over time.
• Compare and contrast the living planets with barren planets
Volcanoes & Climate Feedback Large volcanic eruptions are associated with temporary global cooling due to the particulate matter emplaced into the upper atmosphere. These ash particles and aerosols can effectively scatter incoming sunlight, and when injected above the troposphere, these volcanic products cannot be removed by normal weather cycles (e.g., rain). For summaries see: http://www.wunderground.com/climate/volcanoes.asp.
Booth, Ginger. “Daisy Ball” <http://gingerbooth.com/flash/daisyball/> accessed Sep 28, 2015.11
Watson, A.J.; J.E. Lovelock (1983). "Biological homeostasis of the global environment: the parable of Daisyworld". 12
Tellus B (International Meteorological Institute) 35 (4): 286–9.
�21
Examples of Positive and Negative feedback loops. Note that “positive” and “negative” refer to if the cycle is reinforced or weakened, respectively, and do NOT refer to any perceived human benefit. Image Source: NOAA

Green Thumbs, Red Lights?
Plants are (typically) green in
color. The color that we see is
related to the light reflected off
an object, but we also know
that plants absorb light to conduct photosynthesis. If we
look at the absorption
characteristics of chlorophyll,
we can see that it absorbs most
strongly in the violet-blue and orange-red wavelengths.
White light is a combination of
all colors, but when it comes to
lights specific to plant growth,
is it necessary? Some plant lighting focuses specifically on
the wavelengths utilized by
chlorophyll - while perhaps not
as aesthetically pleasing to our
eyes, generating wavelengths that will simply be reflected
could be seen as a waste of
electricity.
�22
LED plant grow lights are often red and blue as these are the wavelengths required by chlorophyll. Image by Sunshine 117 - Wikimedia
Absorption of two common types of chlorophyll found in land plants. Image by M0tty - Wikimedia

Stellar Information Examining the spectra from a distant star can tell us a lot about that star, and the journey the light took to reach us.
Kirchhoff’s three laws of spectroscopy describe the generation of spectra :13
• a hot object produces a continuous spectrum (black body radiation)• a hot tenuous gas viewed against a cold background will produce bright lines
(emission spectra) depending on the atoms present and their energy levels
• a continuous spectrum produced by a black body passing through a relatively cooler
gas will result in dark bands (absorption spectra) - these bands will be at the same
wavelengths as the emission spectra for the same gas
When examining common light sources (again, make sure to reiterate sun safety to students) we are looking at continuous or emission spectra. Absorption spectra play an
important role in categorizing stars; as light generated by a star passes through the
(relatively) cooler stellar atmosphere which absorbs certain wavelengths based on what
elements are present and their ionization state. The resulting spectra tell us the 14
temperature of different stars, as well as lots of other valuable information including motion, density, presence of binary stars, exoplanets, etc. 15
Lake View Museum. 2008. “Spectrum of the Stars” <https://www.youtube.com/watch?v=l4yg4HTm3uk>13
electrons, and their ability to change orbital shells, is the primary cause for absorption/emission lines. At high 14
temperatures, elements can lose electrons and become increasingly ionized - the very hottest stars have ionized Hydrogen, but with only 1 electron to lose, ionized Hydrogen cannot generate spectral lines. see: https://www.noao.edu/education/astrobits/files/Stellar-Spectroscopy-Abits.pdf
Australia Telescope National Facility. “Information from Astronomical Spectra” <http://www.atnf.csiro.au/15
outreach//education/senior/astrophysics/spectra_info.html>
�23
Using absorption spectra to analyze the atmospheric composition of a planet 150 light years away in the Pegasus constellation. Image Credit: A. Field, STScI - on Wikimedia
2. Ultraviolet
Similar to how visible light represents a literal rainbow of colors, ultraviolet light also
represents a range of wavelengths which are classified into different sub-categories.
Being one of the shortest, and most energetic wavelengths we encounter on a daily basis (unless one works in an x-ray lab), these wavelengths best typify the aspect that light is
energy.
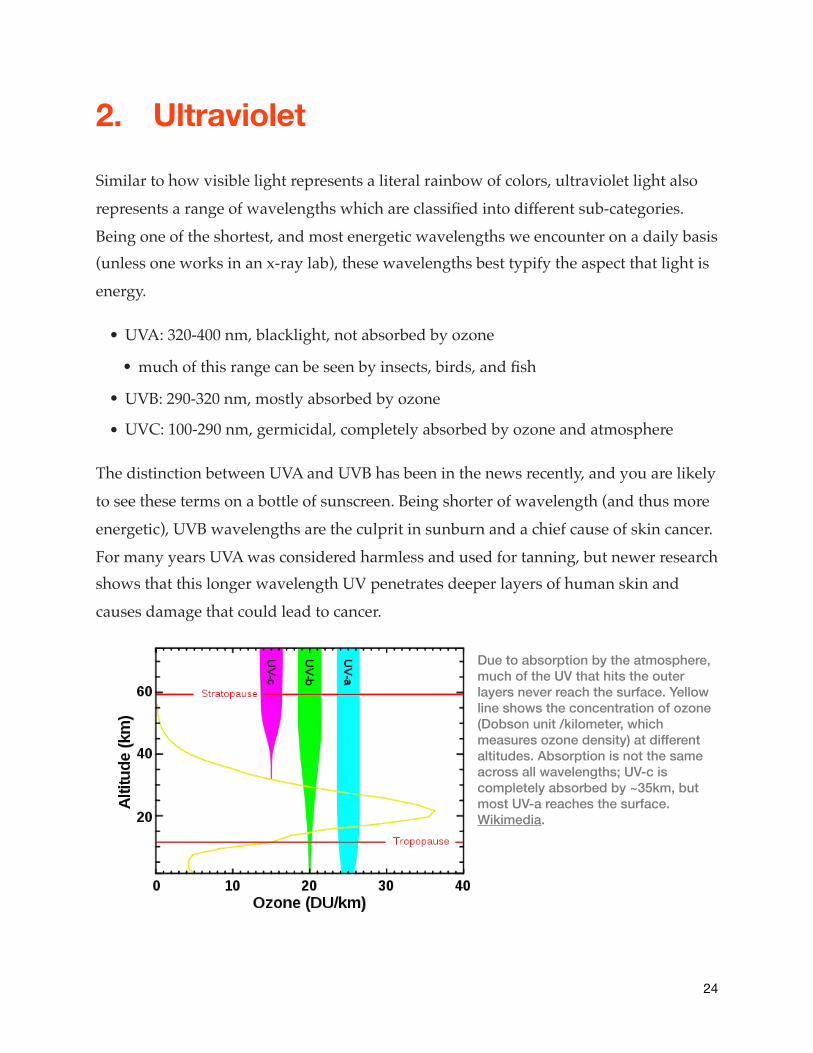
• UVA: 320-400 nm, blacklight, not absorbed by ozone
• much of this range can be seen by insects, birds, and fish
• UVB: 290-320 nm, mostly absorbed by ozone
• UVC: 100-290 nm, germicidal, completely absorbed by ozone and atmosphere
The distinction between UVA and UVB has been in the news recently, and you are likely
to see these terms on a bottle of sunscreen. Being shorter of wavelength (and thus more
energetic), UVB wavelengths are the culprit in sunburn and a chief cause of skin cancer.
For many years UVA was considered harmless and used for tanning, but newer research shows that this longer wavelength UV penetrates deeper layers of human skin and
causes damage that could lead to cancer.
�24
Due to absorption by the atmosphere, much of the UV that hits the outer layers never reach the surface. Yellow line shows the concentration of ozone (Dobson unit /kilometer, which measures ozone density) at different altitudes. Absorption is not the same across all wavelengths; UV-c is completely absorbed by ~35km, but most UV-a reaches the surface. Wikimedia.

UV Detection Cards: These detection cards have a photochromic (photo = light, chroma = color) strip that
undergoes a reversible color transition caused by exposure to ultraviolet wavelengths -
the stronger the color change, the more UV. Transitional sunglasses, that are clear inside and darken when outside, are also reacting to UV light and are a common example of
this kind of color change.
Thermochromatic materials are similar, but change color due to temperature (mood
rings, Hypercolor shirts from the 90’s, aquarium thermometer strips, etc. are all
examples of thermochromism).
One example of a photochromatic material - there are different types materials that undergo different structural changes so the details aren’t terribly important here, but the general concept is that the energy of UV light causes a physical change in a molecule, thus impacting its absorption characteristics and explaining how the UV detection cards & beads in this kit work. Wikimedia.
NOTE: Don’t throw away the clear protective sleeves the cards come in! These can be useful for testing sunscreens (but don’t worry too much - you can always use a baggie).
How Well Am I Protected?
NGSS ConnectionsPS4.B: Electromagnetic Radiation: When light shines on an object, it is reflected, absorbed, or transmitted through the object, depending on the object’s material and the frequency (color) of the light.
�25

Resources Needed• UV detection cards (and clear plastic sleeves OR ziptop bags)
• different types of sunscreen (e.g., sun tan lotion, SPF 5, SPF 30, broad spectrum)• materials to test (e.g., sunglasses, clothing)
UV Test Card in plastic sleeve with SPF 30 “Broad Spectrum” (UVA + UVB) sunscreen on the left section of the sensing strip, with the cards in various locations: A) inside, B) indirect light on a bright porch, light through single pane windows, C) outside in shade, D) outside full sun
What to do• Place/keep the UV detection card in the clear sleeve if testing sunscreens/lotions.
• Partially cover the plastic above the sensing strip area with the test material• Place the card and test material into differently lit environments and examine the
covered versus non-covered sections of the strip
• Repeat the experiment on a cloudy day, in the shade, with light coming through a
window. Do you still need protection on a cloudy day? What about under a tree?
�26

UV Beads These beads are white/clear, but quickly change color when exposed to UV light. These
beads can be used for both experiments as well as art . Like the UV detection cards, the 16
photochromic pigments only respond to UV light, and will not change when exposed to normal, indoor light. One of the manufacturers of these beads provides an
informational document with details about how they work and some activity ideas. 17
The beads respond to UV light in the 300-360 nm wavelengths, which includes parts of
the UVA and UVB spectra.
Bead Scientists
NGSS Connections
PS4.B: Electromagnetic Radiation: When light shines on an object, it is reflected, absorbed, or transmitted through the object, depending on the object’s material and the frequency (color) of the light.
ESS1.A: The Universe and Its Stars: Patterns of the apparent motion of the sun, the moon, and stars in the sky can be observed, described, predicted, and explained with models.
Resources Needed• UV Beads
• Access to different light sources
• Containers of water• Various materials to block/shade beads• optional: stop watch or clock
Isobar Brasil, 2012. “NIVEA sun art” <https://vimeo.com/36033383>16
Educational Innovations Inv. 2015. “Ultraviolet light detecting beads” <http://cdn.teachersource.com/downloads/17
lesson_pdf/UV-AST.pdf>
�27

Stanford University Solar Center and NASA have a UV Bead
Worksheet and that, or something 18
similar, can be used by students to
conduct tests and record
observations on.In addition to checking if the beads
change color, students could record
how long it takes for them to change.
• Take several beads and place them in the test area such that they change color• while inside or in a protected area, place several beads under an opaque cup/
container
• transport beads to the test location, start timing once cover is removed
• record how long it takes for the beads to reach their full color• ideally repeat at different times of day; in morning and evening, light from the sun
travels through more of Earth’s atmosphere, providing more chance for absorption
so the UV intensity changes throughout the day.
Plot showing UV index over the course of a day during different times of year. Values are lower in the mornings and evenings and higher at noon. UV index is also lower overall in the winter and highest in July. Graph by Patrug - Wikimedia.
Scherrer, Deborah, “Experimenting with UV-sensitive Beads” Stanford Solar Center <http://solar-18
center.stanford.edu/activities/UVBeads/UV-Bead-Instructions.pdf>
�28
UV beads in a sunny (but closed) window. Note that the beads shaded by the lenses are uncolored - these glasses provide UV protection.
Origins of Light: Non-blackbody examples Photoluminescence refers to the emission of light by objects caused by the previous
absorption of photons. Unlike blackbody radiation, this is not related to temperature.
Bioluminescence is another type of light generation, separate from
blackbody light generation, that
people might be more familiar with
— fireflies and deep sea fish use
chemical reactions to produce their glow. There are a variety of chemical
reactions that can generate light
(e.g., glow sticks) and
bioluminescence is just one sub-type
of chemiluminescence.
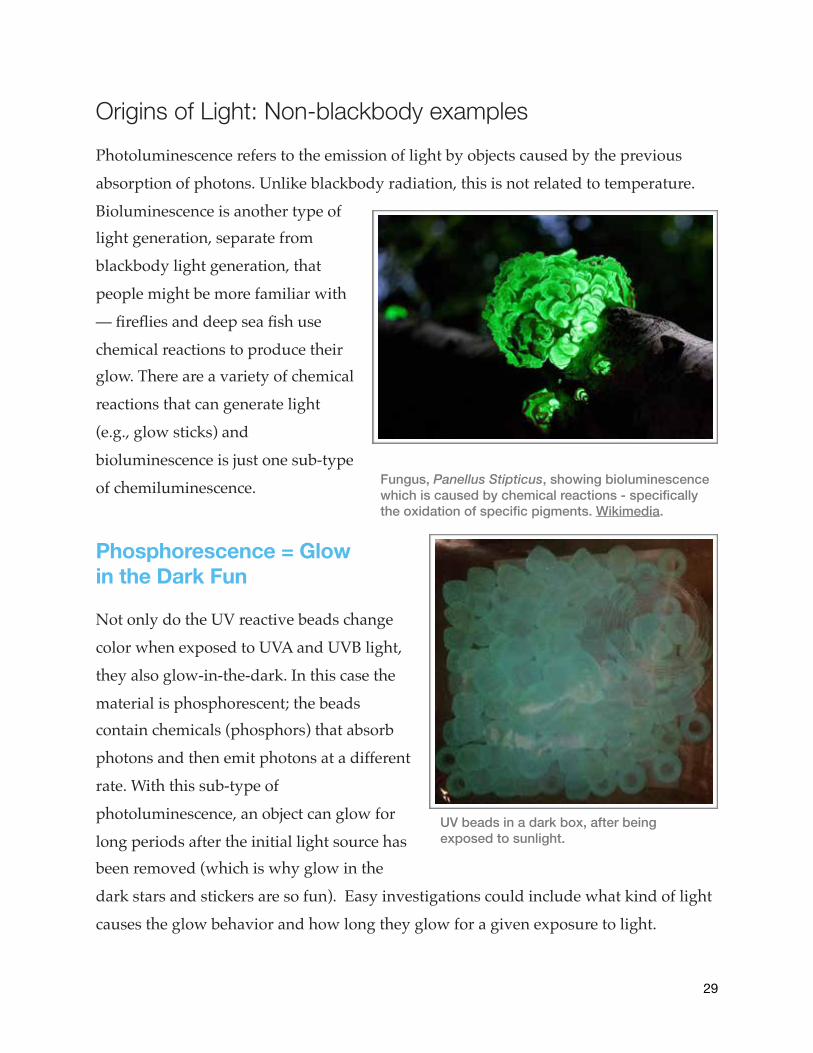
Phosphorescence = Glow in the Dark Fun
Not only do the UV reactive beads change
color when exposed to UVA and UVB light,
they also glow-in-the-dark. In this case the
material is phosphorescent; the beads contain chemicals (phosphors) that absorb
photons and then emit photons at a different
rate. With this sub-type of
photoluminescence, an object can glow for
long periods after the initial light source has been removed (which is why glow in the
dark stars and stickers are so fun). Easy investigations could include what kind of light
causes the glow behavior and how long they glow for a given exposure to light.
�29
UV beads in a dark box, after being exposed to sunlight.
Fungus, Panellus Stipticus, showing bioluminescence which is caused by chemical reactions - specifically the oxidation of specific pigments. Wikimedia.
Earth Science Connections
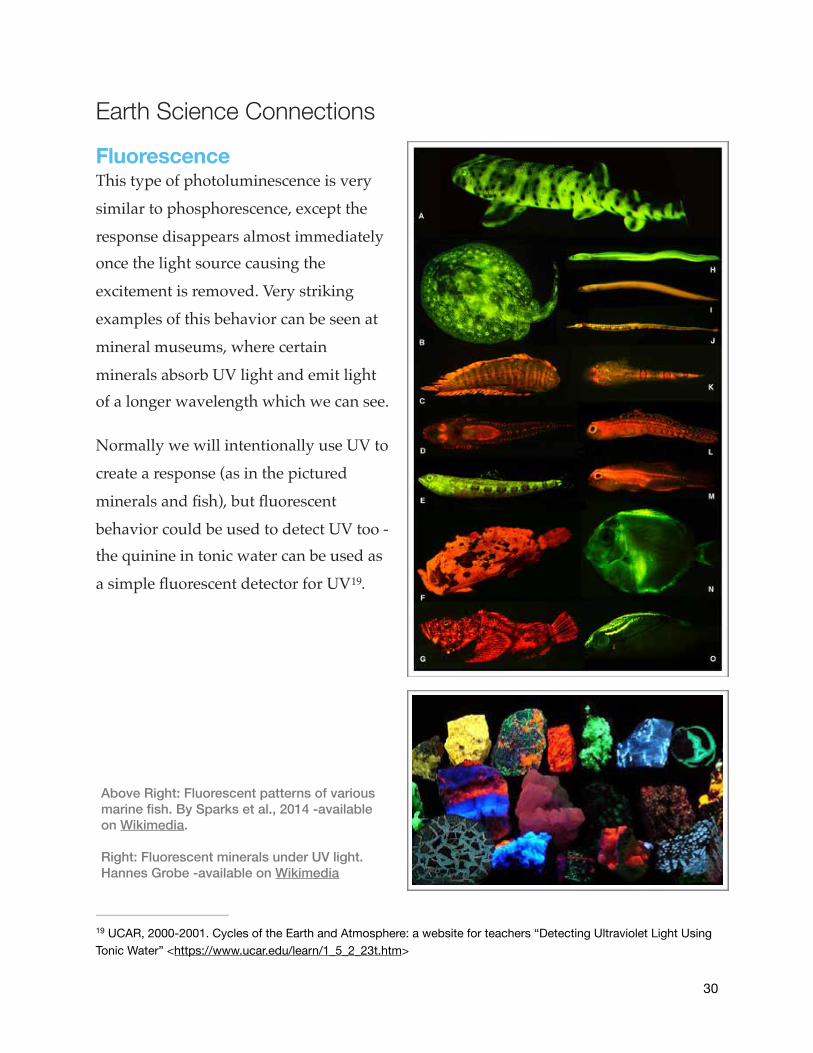
Fluorescence This type of photoluminescence is very
similar to phosphorescence, except the
response disappears almost immediately once the light source causing the
excitement is removed. Very striking
examples of this behavior can be seen at
mineral museums, where certain
minerals absorb UV light and emit light of a longer wavelength which we can see.
Normally we will intentionally use UV to
create a response (as in the pictured
minerals and fish), but fluorescent
behavior could be used to detect UV too - the quinine in tonic water can be used as
a simple fluorescent detector for UV .19
UCAR, 2000-2001. Cycles of the Earth and Atmosphere: a website for teachers “Detecting Ultraviolet Light Using 19
Tonic Water” <https://www.ucar.edu/learn/1_5_2_23t.htm>
�30
Above Right: Fluorescent patterns of various marine fish. By Sparks et al., 2014 -available on Wikimedia.
Right: Fluorescent minerals under UV light. Hannes Grobe -available on Wikimedia
Bulbs, Energy, and the Origins of Light
At the moment, one can go to the store and find at least three types of standard light
bulb: incandescent, compact fluorescent (CFL), and LED (light emitting diode). Many
people have switched away from incandescent bulbs due to cost savings; CFLs and
LEDs can be just as bright (lumens) but use less energy (measured in watts).
Using the lux meter, the light output of different types of bulbs could be measured and compared against
temperature (using a thermometer or making observations
on a low melting-temp solid). With an electricity usage
monitor (e.g., the Kill A Watt is a well known brand) this
could be further compared against energy use. These differences can lead to conversations on energy production,
consumption, and conservation .20
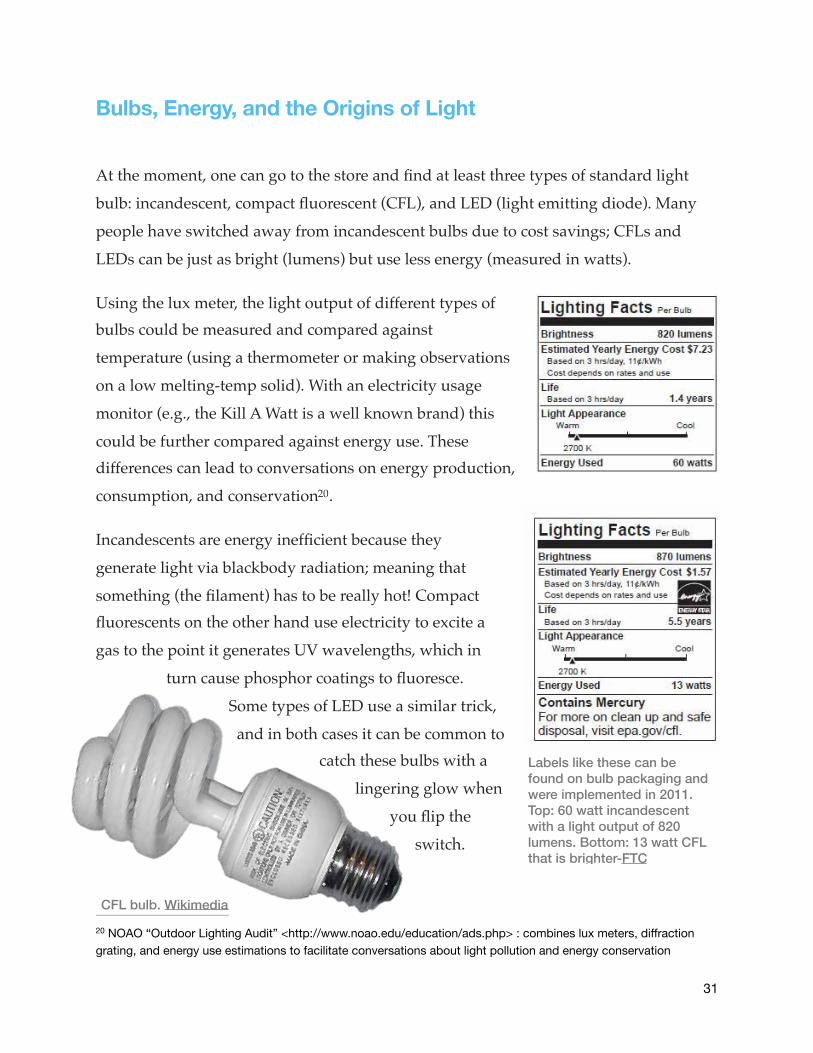
Incandescents are energy inefficient because they
generate light via blackbody radiation; meaning that
something (the filament) has to be really hot! Compact fluorescents on the other hand use electricity to excite a
gas to the point it generates UV wavelengths, which in
turn cause phosphor coatings to fluoresce.
Some types of LED use a similar trick,
and in both cases it can be common to catch these bulbs with a
lingering glow when
you flip the
switch.
NOAO “Outdoor Lighting Audit” <http://www.noao.edu/education/ads.php> : combines lux meters, diffraction 20
grating, and energy use estimations to facilitate conversations about light pollution and energy conservation
�31
Labels like these can be found on bulb packaging and were implemented in 2011. Top: 60 watt incandescent with a light output of 820 lumens. Bottom: 13 watt CFL that is brighter-FTC
CFL bulb. Wikimedia
Elevated Concerns
With the UV beads and detection cards, it is evident that ultraviolet wavelengths
compose a portion of our typical daylight. While the UV index varies across the day and
through the seasons, ultraviolet intensity is also impacted by factors like elevation. 21
• Examine this UV map from the NASA Earth Observations site http://neo.sci.gsfc.nasa.gov/view.php?datasetId=AURA_UVI_CLIM_M
• Several trends should be immediately obvious; distinct latitudinal bands indicate
high UV index near the equator, and low UV indices at the poles. As different months
are selected the band of highest intensity will shift - this is directly related to changes in net radiation across the seasons: http://neo.sci.gsfc.nasa.gov/view.php?datasetId=CERES_NETFLUX_M
• Additionally, there are regions that simply have higher UV indices than the
surrounding areas - the Andes, Rockies, Himalaya, East Africa, etc. all pop out.
Correlating these “anomalous" areas with a topography map should make the relationship pretty clear; areas of higher elevation have higher UV exposure. http://neo.sci.gsfc.nasa.gov/view.php?datasetId=SRTM_RAMP2_TOPO
• Just like the difference in UV intensity in the morning and evening compared to at
noon, this is related to the amount of atmosphere light has to travel through before it
hits the surface. Light hitting a person in Houston has to travel though an extra 1.7 km thickness of atmosphere compared to a person in Denver.
- With every 1000m increase in elevation, the amount of ultraviolet radiation
reaching the surface (or year skin) increases by 10% .22
Similarly, other types of radiation increase with elevation as the protective thickness of the atmosphere lessens. 21
“Cosmic Rays” are actually high energy subatomic particles (not photons), that can cause DNA damage and cataracts like UV exposure. Dr. Tony Philips and his Earth to Sky Calculus students collected radiation data on several flights: <http://spaceweather.com/archive.php?view=1&day=28&month=07&year=2015>
WHO. “UV radiation” <http://www.who.int/uv/faq/whatisuv/en/index3.html>22
�32
Albedo Strikes Again!
Sunburn can be a particular concern for skiers in mountainous regions or people on the
water. As noted above, UV is more intense at higher elevations, but snow and water can
pose additional hazards.
Snow has a high albedo and reflects many wavelengths, including UV light. While
water has a low albedo, it still reflects 6-12% of incident UV and also increases the 23
need to reapply sunscreen (which could be investigated using the UV Beads ). In 24
addition, sand and seafoam are both highly reflective and can also increase UV
exposure.
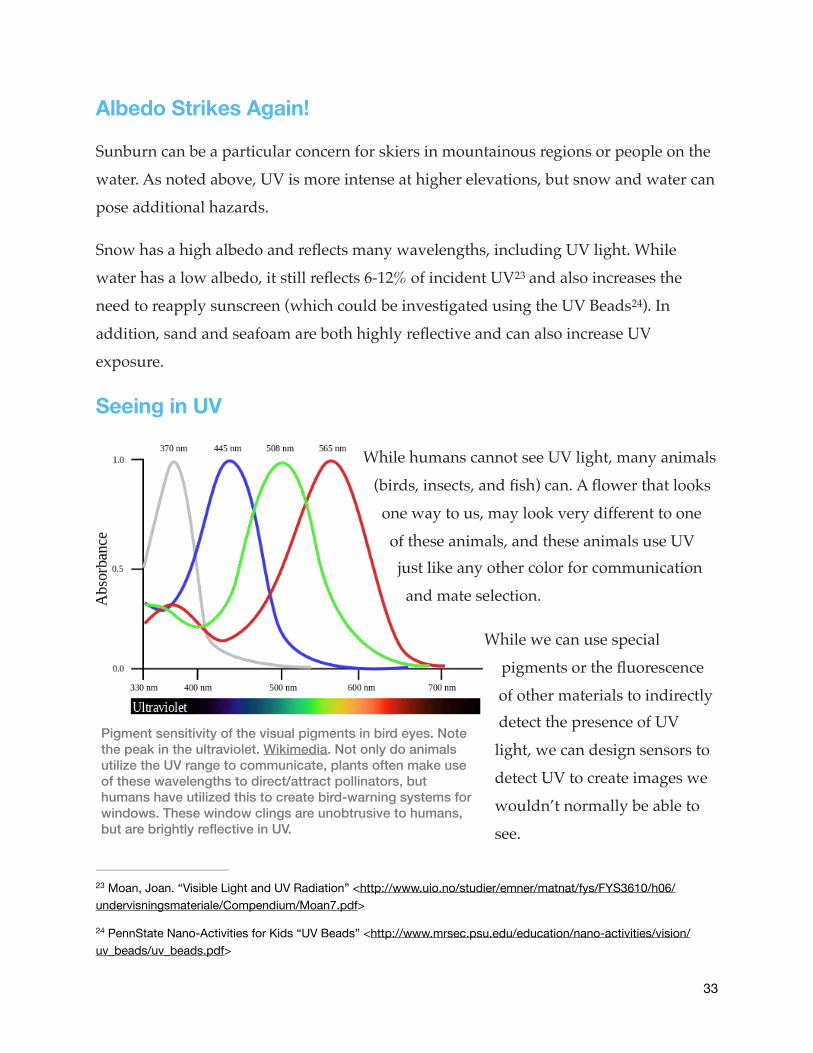
Seeing in UV
While humans cannot see UV light, many animals
(birds, insects, and fish) can. A flower that looks
one way to us, may look very different to one
of these animals, and these animals use UV just like any other color for communication
and mate selection.
While we can use special
pigments or the fluorescence
of other materials to indirectly detect the presence of UV
light, we can design sensors to
detect UV to create images we
wouldn’t normally be able to
see.
Moan, Joan. “Visible Light and UV Radiation” <http://www.uio.no/studier/emner/matnat/fys/FYS3610/h06/23
undervisningsmateriale/Compendium/Moan7.pdf>
PennState Nano-Activities for Kids “UV Beads” <http://www.mrsec.psu.edu/education/nano-activities/vision/24
uv_beads/uv_beads.pdf>
�33
Pigment sensitivity of the visual pigments in bird eyes. Note the peak in the ultraviolet. Wikimedia. Not only do animals utilize the UV range to communicate, plants often make use of these wavelengths to direct/attract pollinators, but humans have utilized this to create bird-warning systems for windows. These window clings are unobtrusive to humans, but are brightly reflective in UV.

This is particularly helpful in studying the very hot objects in the universe - due to the principles of blackbody radiation, only very hot materials emit in the ultraviolet
wavelengths. The fact that the atmosphere absorbs the bulk of the ultraviolet light is a
huge benefit for those of us living on the surface of the planet, but it means that in order
to study objects that emit UV in any detail, instruments need to be in space. Several
space telescopes include UV sensors (e.g., Hubble, and the Chandra X-ray Observatory), which provide information about our universe that simply doesn’t exist in the human-
visible wavelengths.
"
"
Image is the debris cloud/supernova remnant SNR 0519-69.0 in just visible light (left) and in both x-ray and visible light (right). The blue glow represents gas that is millions of degrees and nested within the cooler envelop of dust (red), Due to the very high temperatures, these gases (and many other objects in the universe) emit x-rays - NASA.
�34

How Sunscreen Works: Functional Albedo
By being able to observe the UV wavelengths it becomes more clear how sunscreens
work. Importantly there are two main methods: absorb incoming UV before your skin
can, or reflect incoming UV so it cannot be absorbed. The image below shows UV
absorption - if a sunblock using zinc oxide or titanium dioxide was used instead, the
pattern would be a lighter color, as those ingredients work by reflecting UV.
"
Images taken in normal visible light (left) and UV (right). SPF 30 sunscreen is transparent to visible wavelengths, but is dark in the UV photograph. In this case, the sunscreen is absorbing UV light, which prevents the skin from absorbing them.
�35

Conclusions All of the concepts related to sensing the electromagnetic spectrum introduced here and experienced with your kit materials, can be used to understand how we study the
Earth, the planets in our solar system, our star, and the myriad of other phenomena in
the universe. While our eyes are only sensitive to a very small range of wavelengths, we
can use technology and the behavior of light to extend our natural senses and gain new
windows to the systems around us.
Images of our sun taken in different wavelengths by NASA’s Solar Dynamics Observatory. Wavelengths are given here in angstroms (Å) ; 1 nm = 10 Å. Looking specifically at certain wavelengths, scientists can peer into our local star to study different parts of its atmosphere. The online version of this image provides details on each image. Credit: NASA/SDO/Goddard Space Flight Center
�36
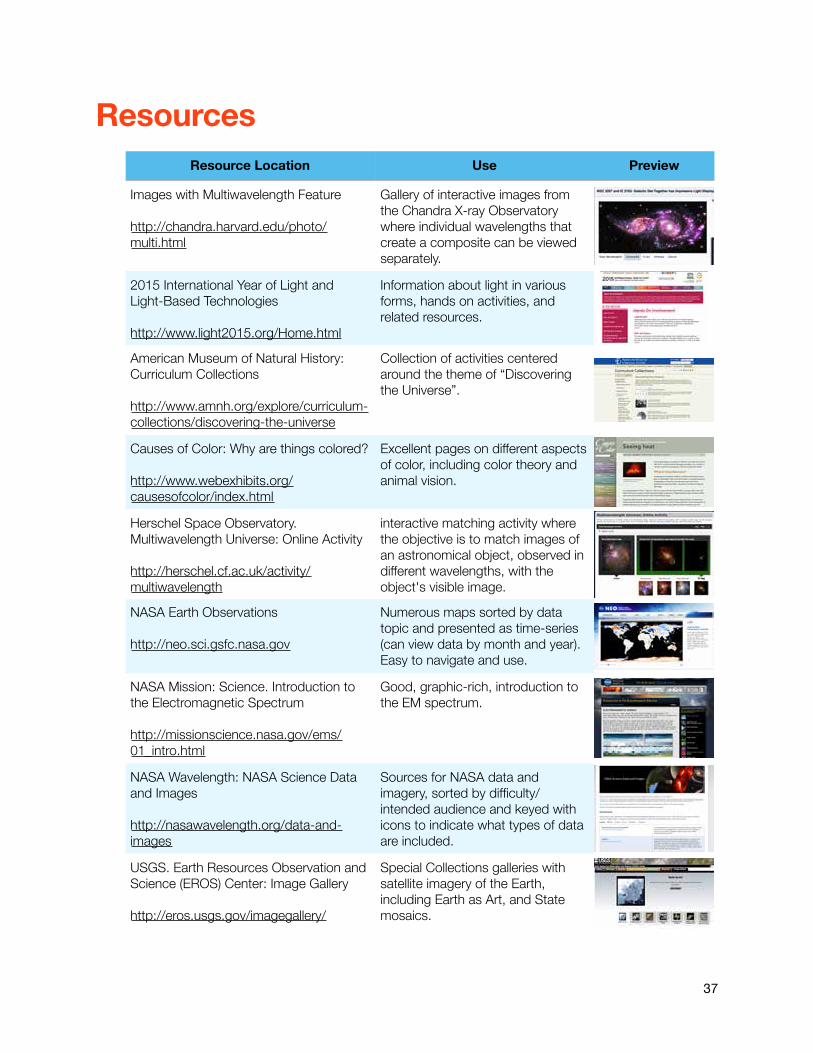
Resources Resource Location Use Preview
Images with Multiwavelength Feature
http://chandra.harvard.edu/photo/multi.html
Gallery of interactive images from the Chandra X-ray Observatory where individual wavelengths that create a composite can be viewed separately.
2015 International Year of Light and Light-Based Technologies
http://www.light2015.org/Home.html
Information about light in various forms, hands on activities, and related resources.
American Museum of Natural History: Curriculum Collections
http://www.amnh.org/explore/curriculum-collections/discovering-the-universe
Collection of activities centered around the theme of “Discovering the Universe”.
Causes of Color: Why are things colored?
http://www.webexhibits.org/causesofcolor/index.html
Excellent pages on different aspects of color, including color theory and animal vision.
Herschel Space Observatory. Multiwavelength Universe: Online Activity
http://herschel.cf.ac.uk/activity/multiwavelength
interactive matching activity where the objective is to match images of an astronomical object, observed in different wavelengths, with the object's visible image.
NASA Earth Observations
http://neo.sci.gsfc.nasa.gov
Numerous maps sorted by data topic and presented as time-series (can view data by month and year). Easy to navigate and use.
NASA Mission: Science. Introduction to the Electromagnetic Spectrum http://missionscience.nasa.gov/ems/01_intro.html
Good, graphic-rich, introduction to the EM spectrum.
NASA Wavelength: NASA Science Data and Images
http://nasawavelength.org/data-and-images
Sources for NASA data and imagery, sorted by difficulty/intended audience and keyed with icons to indicate what types of data are included.
USGS. Earth Resources Observation and Science (EROS) Center: Image Gallery
http://eros.usgs.gov/imagegallery/
Special Collections galleries with satellite imagery of the Earth, including Earth as Art, and State mosaics.
�37

Resource Location Use Preview
Hubble Site: Behind the Pictures
http://hubblesite.org/gallery/behind_the_pictures/meaning_of_color/
Short, well illustrated pages showing how color is used in Hubble images. Some interactives, and description of why some images have odd shapes.
APOD: Astronomy Picture of the Day
http://apod.nasa.gov/apod/astropix.html
New photo/image daily, with explanations that include links to more details.
EarthGuide Online Classroom: Electromagnetic Spectrum
http://earthguide.ucsd.edu/eoc/special_topics/teach/sp_climate_change/p_emspectrum_interactive.html
Slider demonstration with wavelength, frequency, energy scales with simple visualizations and related questions.
The Scale of the Universe
version 1: http://htwins.net/scale/ version 2: http://htwins.net/scale2 -at time of writing this version has ads, but has a smooth slider bar and animations
Interactive graphic that is useful for exploring the concept of scale: goes from sub-atomic to universal.
My NASA Data
http://mynasadata.larc.nasa.gov/using-my-nasa-data/
A variety of tools, tutorials, and lesson plans developed around NASA data.
NASA: Eyes on Earth
http://eyes.jpl.nasa.gov/eyes-on-the-earth.html
NASA Eyes is a downloadable app that displays data on a rotatable globe. Datasets are similar to NASA Earth Observations. Users can also put their “eyes” on the Earth, Solar System, or Exoplanets.
XKCD Radiation Dose Chart
https://xkcd.com/radiation/
graphical representation of ionizing radiation doses people might be exposed to from different sources. Puts radiation exposure from typical medical and plane ride events in perspective. Potential lesson on units & scale.
Cosmos A Spacetime Odyssey
https://www.youtube.com/watch?v=E5GHCYyLv3Q
The new Cosmos series is very informative, and Episode 5 “Hiding in the Light” discusses the scientific framework for the wave theory of light.
�38

Appendices Denver Public Schools Standards 25
Grade Standard Expectation Related Content
Page
HS 1.1 Newton’s laws of motion and gravitation describe the relationships among forces acting on and between objects, their masses, and changes in their motion – but have limitations
Radiometer 16-17
HS 1.2 Matter has definite structure that determines characteristic physical and chemical properties
UV Cards/Beads & Luminescence
25-30
8 1.2 There are different forms of energy, and those forms of energy can be changed from one form to another – but total energy is conserved
UFO Balloon Radiometer Luminescence
14-17, 29-31
8 1.4 Recognize that waves such as electromagnetic, sound, seismic, and water have common characteristics and unique properties
EM Spectrum 2-4
6 1.4 Distinguish among, explain, and apply the relationships among mass, weight, volume, and density
UFO Balloon 14-15
HS 1.6 When energy changes form, it is neither created not destroyed; however, because some is necessarily lost as heat, the amount of energy available to do work decreases
UFO Balloon Radiometer
14-17
HS 2.4 The energy for life primarily derives from the interrelated processes of photosynthesis and cellular respiration. Photosynthesis transforms the sun’s light energy into the chemical energy of molecular bonds. Cellular respiration allows cells to utilize chemical energy when these bonds are broken.
Plants, color, chlorophyl & grow lights
22
HS 3.2 As part of the solar system, Earth interacts with various extraterrestrial forces and energies such as gravity, solar phenomena, electromagnetic radiation, and impact events that influence the planet’s geosphere, atmosphere, and biosphere in a variety of ways
UFO Balloon Feedback Plants UV Light
14-15, 21, 22,
24
HS 3.4 Climate is the result of energy transfer among interactions of the atmosphere, hydrosphere, geosphere, and biosphere
Albedo & Climate
20-21
Colorado Dept. of Education “Science Academic Standards” <https://www.cde.state.co.us/coscience/25
statestandards>, accessed Sept 17. 2015
�39

Houston ISD Scope & Sequence Affinities : 26
Grade Regular Track Accelerated Pre-AP
6 Unit 3: Chemical Change and Density Unit 4: Energy Introduction Unit 5: Thermal Energy Unit 6: Energy Resources Unit 7: Force and Motion Unit 11: Space Science
Unit 3: Maps, Tectonics, Satellite Images Unit 4: Energy Unit 5: Force and Motion Unit 7: Space Science Unit 8: Atmospheric Movement
7 Unit 5: Human Body Sys. – Stimuli and Responses Unit 9: Plants Unit 11: Catastrophic Events and Ecosystems Unit 12: Characteristics of Our Solar System
Unit 6: Plants
8 Unit 3: Force and Motion Basics Unit 4: Laws of Force and Motion Unit 5: Earth, Sun, Moon Unit 6: The Universe Unit 7: Atmospheric Movement Unit 8: Topo Maps, Tectonics, Satellite Images
9-12 IPC Unit 2: Structure and Properties of Matter IPC Unit 8: Force and Motion IPC Unit 10: Energy IPC Unit 11: Heat IPC Unit 12: Electricity and Magnetism IPC Unit 13: Sound and Waves IPC Unit 14: Light BIOL Unit 7: Mutations: Changes in DNA CHEM Unit 8: Behavior of Gases PHYS Unit 4: Forces and Laws of Motion PHYS Unit 8: Work-Energy Theorem and Energy Transformations PHYS Unit 10: Thermodynamics PHYS Unit 11: Wave Properties and Behaviors PHYS Unit 13: Electromagnetic Waves and Applications of Waves PHYS Unit 16: Atomic Physics and Photoelectric Effect ENVS Unit 12: Effects of Human Activities
Houston ISD <http://www.houstonisd.org/Page/69564> accessed Sept 17. 201526
�40


AGI Earth Science Week Introduction to Earth Science Week
http://geocntr.org/
This booklet was prepared as a project of the Cen-ter for Geoscience and Society, which is a division within the American Geosciences Institute. The activities in this book were designed to accompany a set of supplies, known as a “Premium Toolbox”, that was prepared to enhance and extend teach-ing around the 2015 Earth Science Week theme of “Visualizing Earth Systems”. The toolboxes were specifically developed for schools in the Houston and Denver areas, in conjunction with the 2015
“Earth Science Week Stakeholder Receptions” held in those cities.
Earth Science Week, a celebration of the geosci-ences held each October, reaches more than 50 mil-lion people a year worldwide. Since October 1998, the American Geosciences Institute has organized this national and international event to help the public gain a better understanding and appre-ciation for the Earth sciences and to encourage stewardship of the Earth. This year’s Earth Science Week is being held October 11–17.
The American Geosciences Institute is a nonprofit federation of geoscientific and professional associa-tions that represents more than 250,000 geologists, geophysicists, and other Earth scientists. Founded in 1948, AGI provides information services to geo-scientists, serves as a voice of shared interests in the profession, plays a major role in strengthening geoscience education, and strives to increase public awareness of the vital role the geosciences play in society’s use of resources, resiliency to natural haz-ards, and interaction with the environment.
The 2015 “Earth Science Week Stakeholder Recep-tions” were made possible by generous support from these organizations: