aggressive cholesterol management to prevent chd in diabetes aggressive cholesterol management to...
TRANSCRIPT

Aggressive Cholesterol Aggressive Cholesterol Management to Prevent CHD Management to Prevent CHD
in Diabetes in Diabetes
Aggressive Cholesterol Aggressive Cholesterol Management to Prevent CHD Management to Prevent CHD
in Diabetes in Diabetes
Wm. James Howard, M.D.Wm. James Howard, M.D.
Washington Hospital CenterWashington Hospital Center
Washington, D.C.Washington, D.C.
May 11. 2005May 11. 2005

Prevalence of Obesity in the Prevalence of Obesity in the United StatesUnited States

Prevalence of Diabetes in the Prevalence of Diabetes in the United StatesUnited States

Mortality in People With Mortality in People With Diabetes: Causes of DeathDiabetes: Causes of Death

Atherosclerosis in DiabetesAtherosclerosis in DiabetesAbout 80% of all diabetic mortality
(75% from coronary atherosclerosis; 25% from cerebral or peripheral vascular disease)
>75% of all hospitalizations for diabetic complications
>50% of patients with newly diagnosed NIDDM have CHD

1970s
NCEPATP I
Guidelines1988
NCEPATP II
Guidelines1993
NCEPATP III
Guidelines2001
FraminghamMRFITLFC-CPPTCoronary Drug ProjectHelsinki HeartCLAS (anglo)
Angiographic Trials (FATS, POSCH, SCOR, STARS, Omish, MARS)
Meta-Analyses(Holme, Rossouw)
4S, WOSCOPSCARE, LIPID,AFCAPS/TexCAPS,VAHIT, Others
Evolution of the Treatment Evolution of the Treatment ApproachApproach

New Features of ATP IIINew Features of ATP IIICHD Risk Equivalents:1. Type 2 Diabetes Mellitus2. Non-Cardiac Forms of Athero.3. Framingham Projection of 10 yr.Risk >20% (identifies individuals with multiple
risk factors in need of more aggressive lipid lowering)
The Metabolic Syndrome

Diabetes Mellitus As Diabetes Mellitus As CHD Risk EquivalentCHD Risk Equivalent
Increased CHD Risk: Women -- 4-6 fold, Men-- >2 fold
Risk for a person with DM having 1st MI is equal to a non-DM having 2nd MI
DM more likely to die before reaching hospital with 1st MI
DM confers worse prognosis in hospital and during first year after discharge
>50% of DM have CHD at diagnosis

The Metabolic SyndromeThe Metabolic SyndromeAKA:AKA:
Pleuri-Metabolic SyndromeInsulin Resistance SyndromeSyndrome X (Metabolic)Deadly QuartetMultiple Metabolic Syndrome

The Metabolic SyndromeThe Metabolic Syndrome General Features of the Metabolic Syndrome:
Abdominal obesity Atherogenic dyslipidemia
– Elevated triglycerides– Small Dense LDL particles– Low HDL cholesterol
Raised blood pressure Insulin resistance ( glucose intolerance) Proatherosclerotic state Prothrombotic State Proinflammatory State
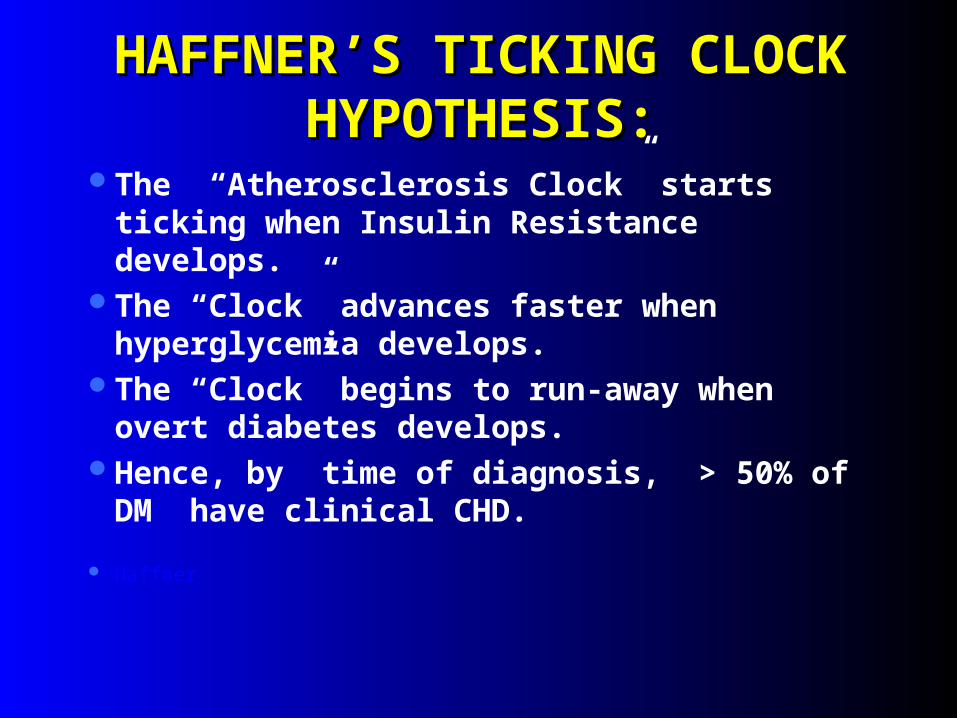
HAFFNER’S TICKING CLOCK HAFFNER’S TICKING CLOCK HYPOTHESIS:HYPOTHESIS:
The “Atherosclerosis Clock” starts ticking when Insulin Resistance develops.
The “Clock” advances faster when hyperglycemia develops.
The “Clock” begins to run-away when overt diabetes develops.
Hence, by time of diagnosis, > 50% of DM have clinical CHD.
Haffner
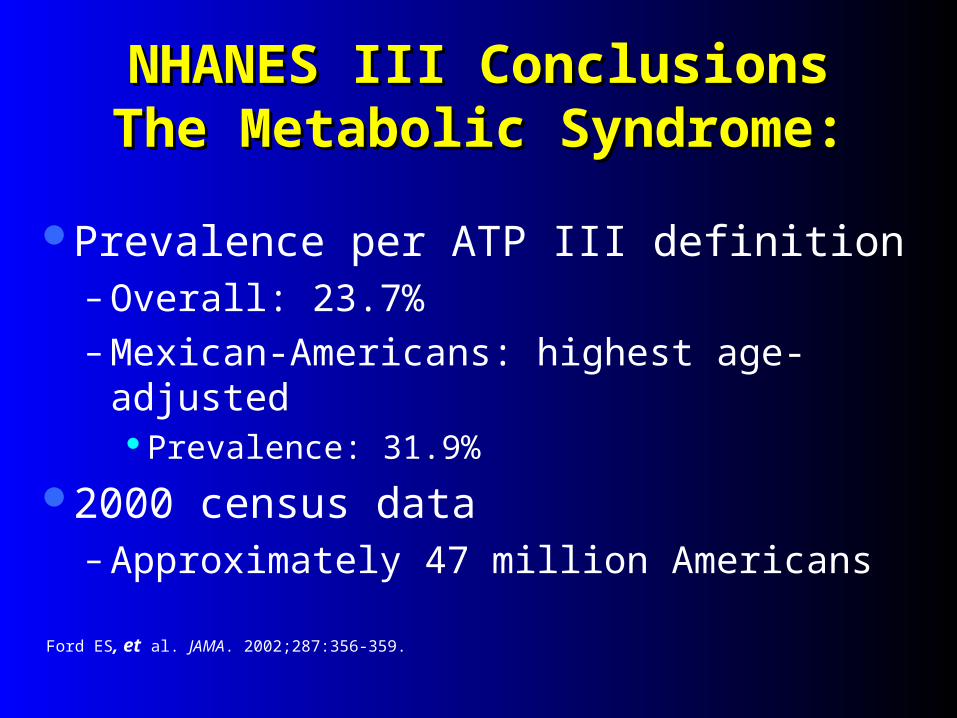
NHANES III ConclusionsNHANES III ConclusionsThe Metabolic Syndrome:The Metabolic Syndrome:
Prevalence per ATP III definition– Overall: 23.7%– Mexican-Americans: highest age-adjusted
Prevalence: 31.9%
2000 census data– Approximately 47 million Americans
Ford ES, et al. JAMA. 2002;287:356-359.


Prevalence of MS among non-diabetic American Indians, by age and gender, the Strong Heart
Study, N=2,407
28.0 26.5 26.0
37.6 39.4
53.2
0
10
20
30
40
50
60
45-54 (n=1277) 55-64 (n=731) 65-74 (n=399)
Pre
vale
nce (
%)
Men Women

Prevalence of DiabetesPrevalence of DiabetesStrong Heart Study, by Gender and Strong Heart Study, by Gender and
CenterCenterWomen Men
%

Non-HDL CholesterolNon-HDL Cholesterol(Non-HDL Chol. = TC - HDL)(Non-HDL Chol. = TC - HDL)
Known predictor of CHD in epidemiologyEquivalent to total apo B-100, and TC/HDL
Represents the sum of LDL, Lp(a), IDL, and VLDL:
All atherogenic apo B containing lipoproteins
Lipid Equivalent of “HbA1C”


Diabetes Prevention ProgramDiabetes Prevention Program(DPP 2)(DPP 2)
Lifestyle changes consisting of diet and exercise reduced the conversion of IGT to Type 2 Diabetes by 58%
NEJM, 346; 393; 2002


HOT TrialHOT TrialEffect of Diastolic Target onEffect of Diastolic Target on
Cardiovascular Events - 4 YearsCardiovascular Events - 4 Years
10
20
30
0Diabetic Patients
n=1, 501, P=0.016
Non-Diabetic Patients
n=18, 790, P=NS
48%Risk
Reduction
10 1010101010
Events/1000Pt-Yrs
24.4
18.6
11.99.9 10.0 9.3

Common Lipoprotein AbnormalitiesCommon Lipoprotein AbnormalitiesDiabetic DyslipidemiaDiabetic Dyslipidemia

CVD Hazard Ratios by Quartile of CVD Hazard Ratios by Quartile of LDL Cholesterol in DiabetesLDL Cholesterol in Diabetes
The Strong Heart StudyThe Strong Heart Study
1.00
1.71
2.46
1.37
0.00
0.50
1.00
1.50
2.00
2.50
70 mg/dL 98 mg/dL 118 mg/dL 151 mg/dL
LDL cholesterol quartiles, mean
Haz
ard
rat
io f
or
CV
D
Howard et al. ATVB 2000;20(3):830


The Pyramid of Recent TrialsThe Pyramid of Recent TrialsRelative Size of the Various Segments of the PopulationRelative Size of the Various Segments of the Population

HMG CoA Reductase HMG CoA Reductase Inhibitors (Statins)Inhibitors (Statins)
Statin Dose Range
Lovastatin 20–80 mgPravastatin 20–40 mgSimvastatin 20–80 mgFluvastatin 20–80 mgAtorvastatin 10–80 mgRosavustatin 5--40mg
Cerivastatin 0.4–0.8 mg

PI=placebo; Rx=treatment
Shepherd J et al. N Engl J Med. 1995;333:1301-1307.4S Study Group. Lancet. 1995;345:1274-1275.Sacks FM et al. N Engl J Med. 1996;335:1001-1009.Downs JR et al. JAMA. 1998;279:1615-1622.Tonkin A. Presented at AHA Scientific Sessions, 1997.
Mean LDL-C level at follow-up (mg/dL)
Relation Between CHD Events and Relation Between CHD Events and LDL-C in Recent Statin TrialsLDL-C in Recent Statin Trials
0
5
10
15
20
25
30
90 110 130 150 170 190 210
% withCHD event CARE-Rx
LIPID-Rx
4S-Rx
CARE-PILIPID-PI
4S-PI
2° Prevention
1° Prevention
WOSCOPS-PI
WOSCOPS-RxAFCAPS/TexCAPS-Rx
AFCAPS/TexCAPS-PI

Non-Statin Lipid Lowering DrugsNon-Statin Lipid Lowering Drugs
Niacin—extended release, OTC immediate Bile Acid Sequestrants—colesevelam Fibric Acids—gemfibrozil, fenofibrate Intestinal acting—ezetimibe Omega 3 fatty acids—fish oil (EPA, DHA) Dietary adjuncts—plant sterol/stanol ester
margerines, viscous fiber supplements

23


Mechanism ofMechanism ofIntestinal-Acting AgentsIntestinal-Acting Agents

Ezetimibe: Inhibition of Ezetimibe: Inhibition of Cholesterol AbsorptionCholesterol Absorption
Liver
Duodenum
Jejunum
Ileum
Colon
CMApo B48CM Remnant
Apo B48
VLDLApo B100
LDLApo B100
(—)(—)EzetimibeInhibitsAbsorption
35Adapted with permission from Carey MC, Duane WC. In: Arias IM et al, eds.The Liver: Biology and Pathobiology. Raven Press; 1994.

*See NCEP ATP III Guidelines.
Dosage and AdministrationDosage and AdministrationPatients should be on a standard cholesterol-
lowering diet*Dosage should be individualized according to
baseline LDL-C, recommended goal of therapy, and patient response*
Dosage range: 10/10 mg/day–10/80 mg/day Usual recommended starting dose: 10/20 mg/day Patients requiring a larger reduction in LDL-C
(>55%) may be started at a dose of 10/40 mg/day; 10/10 mg/day may be considered for patients requiring less aggressive LDL-C reductions
Lipid levels may be analyzed and dosage adjusted 2 or more weeks following initiation or titration of therapy
VYTORIN should be taken once daily in the evening, with or without food
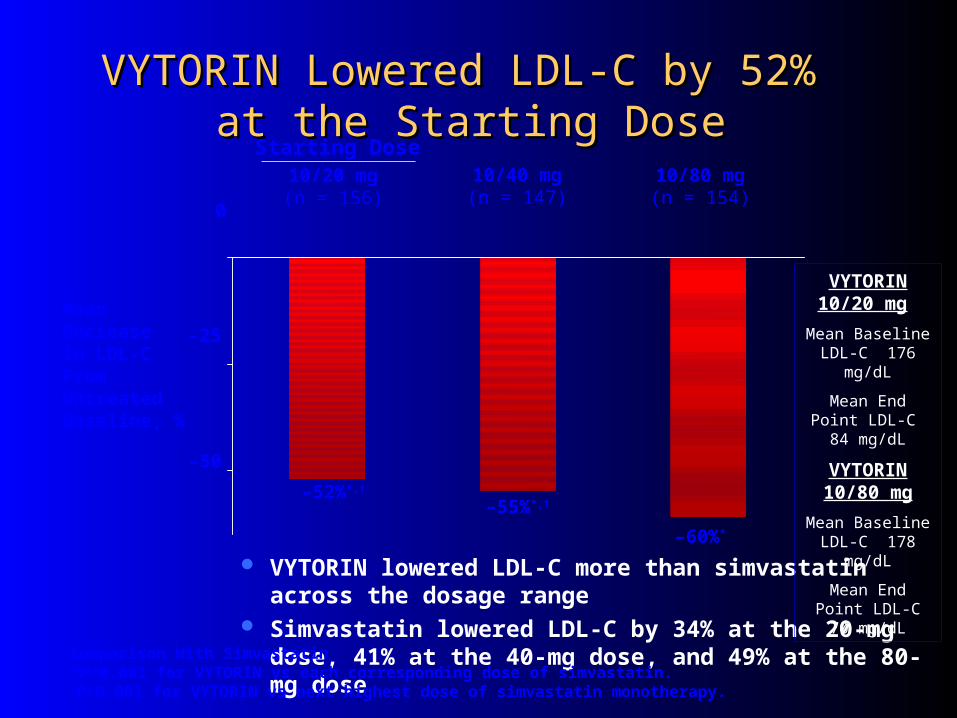
VYTORIN Lowered LDL-C by 52% VYTORIN Lowered LDL-C by 52% at the Starting Doseat the Starting Dose
VYTORIN lowered LDL-C more than simvastatin across the dosage range
Simvastatin lowered LDL-C by 34% at the 20-mg dose, 41% at the 40-mg dose, and 49% at the 80-mg dose
10/20 mg(n = 156)
10/40 mg(n = 147)
10/80 mg(n = 154)
Starting Dose
–55%*,†
–60%*
–52%*,†
Mean Decrease in LDL-CFrom Untreated Baseline, %
Comparison With Simvastatin*P<0.001 for VYTORIN vs each corresponding dose of simvastatin.†P<0.001 for VYTORIN vs next highest dose of simvastatin monotherapy.
–25
0
–50
VYTORIN 10/20 mg
Mean Baseline LDL-C 176
mg/dL
Mean End Point LDL-C 84 mg/dL
VYTORIN 10/80 mg
Mean Baseline LDL-C 178
mg/dL
Mean End Point LDL-C 70 mg/dL

VYTORIN Provided Significantly Greater LDL-C VYTORIN Provided Significantly Greater LDL-C Reductions vs AtorvastatinReductions vs Atorvastatin
10/20(n = 250)
10(n = 262)
20(n = 246)
40 mg(n = 237)
10/40 mg(n = 482)
80 mg(n = 228)
10/80 mg(n = 459)
–44%
Starting Doses (mg)
–37%
–56%†
–59%‡
–53%
–49%–50%*
MeanDecrease in LDL-CFrom Untreated Baseline, %
*P<0.001 for VYTORIN 10/20 vs atorvastatin 10 mg; P≤0.05 for VYTORIN 10/20 vs atorvastatin 20 mg. †P≤0.05 for VYTORIN 10/40 vs atorvastatin 40 mg.‡P<0.001 for VYTORIN 10/80 vs atorvastatin 80 mg.
The clinical significance of comparative lipid effects has not been established.Ballantyne CM et al. Am J Cardiol. 2004;93:1487–1494.
0
–10
–20
–30
–40
–50
–60
–70
VYTORIN 10/20 mg
Mean Baseline LDL-C 179
mg/dL
Mean End Point LDL-C 89 mg/dL
Atorvastatin 10 mg
Mean Baseline LDL-C 181
mg/dL
Mean End Point LDL-C 112 mg/dL
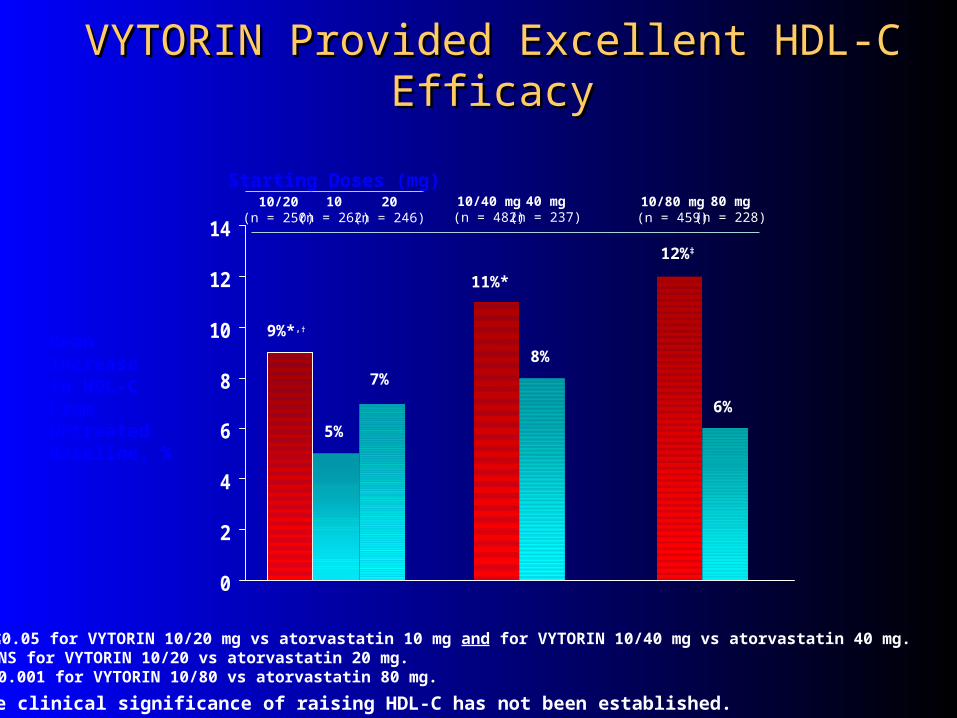
VYTORIN Provided Excellent HDL-C EfficacyVYTORIN Provided Excellent HDL-C Efficacy
0
2
4
6
8
10
12
1410/20
(n = 250)10
(n = 262)20
(n = 246)40 mg
(n = 237)10/40 mg(n = 482)
80 mg(n = 228)
10/80 mg(n = 459)
7%
5%
11%*
12%‡
6%
8%
9%*,†
MeanIncrease in HDL-CFrom Untreated Baseline, %
*P≤0.05 for VYTORIN 10/20 mg vs atorvastatin 10 mg and for VYTORIN 10/40 mg vs atorvastatin 40 mg.†P=NS for VYTORIN 10/20 vs atorvastatin 20 mg.‡P<0.001 for VYTORIN 10/80 vs atorvastatin 80 mg.
The clinical significance of raising HDL-C has not been established.
Starting Doses (mg)

COMPARATIVE COST per COMPARATIVE COST per MonthMonth
Vytorin 10/10,20,40,80 $84.24 Zetia 77.77 Zocor 10 mg. 79.02 20 mg. 137.87 40 mg. 137.87 80 mg. $ 137.87
Medical Letter (9/13/04); 46,73,2004

GREek ek Atorvastatin and torvastatin and Coronary Heart Disease oronary Heart Disease
Evaluation Studyvaluation Study
GREACE TRIALEACE TRIAL
Current Medical Research and Opinions, 2002; 18: 220-227

GREACE TRIALGREACE TRIAL RESULTS: Total Mortality -43%
– CHD Mortality -47%
– non fatal MI -59%
– Revascularization -51%
– CHF -50%
– Stroke -47%
– Women -54%
– Diabetics -58%
– 60-75 yoa -49%

Heart Protection Study (HPS) DesignHeart Protection Study (HPS) Design
Large, multicenter, placebo-controlled, double-blind study Mean duration: 5 years Patients (N=20,536, 97% Caucasian) allocated* to
– Simvastatin 40mg/day (n=10,269)– Placebo (n=10,267)
Mean age 64 years (range 40 to 80 years) Patients were at high risk of a major coronary event
because of– Existing coronary heart disease (CHD) (65%)– Diabetes (type 2, 26%; type 1, 3%)– History of stroke or other cerebrovascular disease (16%)– Peripheral vessel disease (33%)– Hypertension in males aged 65 years and older (6%)
* Patients were allocated to treatment using a covariate adaptive method, which took into account the distribution of 10 important baseline characteristics of patients already enrolled and minimized the imbalance of those characteristics across the groups.

HPS: MCE by Metabolic HistoryHPS: MCE by Metabolic History
BaselineCharacteristics n
Incidence(%)
MCE
Risk Ratio (95% CI)Simvastatin Placebo
Diabetes mellitus 5,963 9.4 12.6
Without CHD 3,982 5.5 8.4
With CHD 1,981 17.4 21.0
Without diabetes mellitus
14,573 8.5 11.5
0.4 0.6 0.8 1.0 1.2
▼
▼
▼
▼
Favors simvastatin Favors placebo

HPS: Primary and Secondary HPS: Primary and Secondary Prevention ImplicationsPrevention Implications
Adapted from Illingworth. Med Clin North Am. 2000;84:23.At: http://www.hpsinfo.org.
50 21070 190170150130110900
5
10
15
20
25
% w
ith
CA
D e
ven
t
WOSCOPS
AFCAPS
CARE
4S
LIPID
HPS(estimated)
HPS(estimated)
LDL-C (mg/dL)

13

New Category: Very High Risk New Category: Very High Risk PatientsPatients
Definite CHD plus additional risk factors, such as diabetes, significant hypertension etc.
LDL goal < 100 mg/dl with optional goal of <70 mg/dl. Initiate drug therapy if LDL > 100 mg/dl with
consideration for drug therapy to reach optional goal of < 70 mg/dl when baseline LDL < 100mg/dl
Lower LDL by at least 30%.
Circulation 2004;110:227-239

CARDSCARDSPrimary Prevention Study: 2838 T2DM
randomized atorva. 10 mg. or placebo. (+ Additional risk factor)
Terminated at 3.9 years—2 years early.End of study LDL: atorva = 78 mg/dl and
placebo = 120 mg/dl.End of Study non-HDL: atorva = 100 mg/dl
and placebo = 155 mg/dl.No excess of adverse events in
atorvastatin group

CARDS RESULTSCARDS RESULTSAll Cause Mortality: - 27 %
CHD Events: - 36 %
Revascularizations: - 31 %
Stroke: - 48 %
Lancet 2004: 364; 685-696

Clinical Trials of Lipid Lowering Clinical Trials of Lipid Lowering to Prevent CHD in Diabetesto Prevent CHD in Diabetes
Trial ResultsTrial Results
HPS ALL HAT ASCOT CARDS
Prevention No Prevention
No Prevention Prevention

SANDSSANDSStop
Atherosclerosis in
Native
Diabetics
Study

What we learned from SHSWhat we learned from SHSMost CVD in SHS communities occurs in
those with diabetesLDL cholesterol is a strong predictor even
though levels are generally low in IndiansBlood pressure is a strong predictor, and it
leads to nephropathy which also causes CVD

Inclusion CriteriaInclusion Criteria
Diabetic Men and Women >40 yrs LDL>100 mg/dlSBP>130 mmAble to measure carotid IMT

Four Clinical CentersFour Clinical Centers
Phoenix area (Charlton Wilson, MD,
Marie Russell, MD, Damon Davis, RN) Oklahoma (Brice Poolaw, MD) South Dakota (Jeffrey Henderson, MD) Chinle (Jim Galloway, MD)
496 Men and Women (124/center)
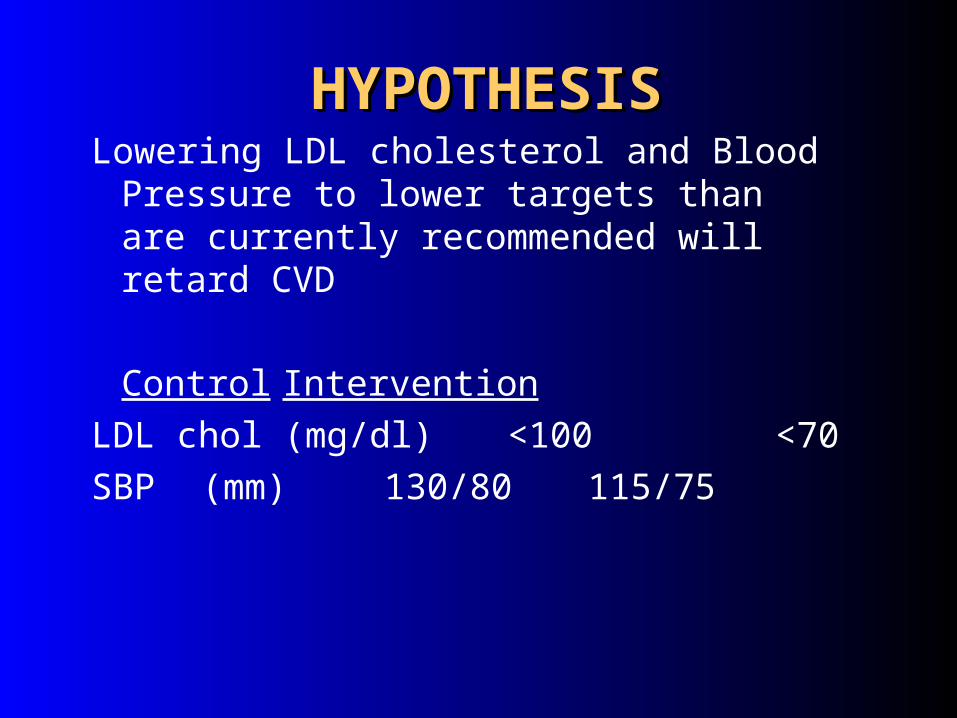
HYPOTHESISHYPOTHESISLowering LDL cholesterol and Blood
Pressure to lower targets than are currently recommended will retard CVD
ControlIntervention
LDL chol (mg/dl) <100 <70
SBP (mm) 130/80 115/75

Men and womenwith diabetes
over 40 yrs old
Usual targets
Lower targets
Measure CVD using carotid and cardiac ECHO at baseline
and after 3 yrs FU
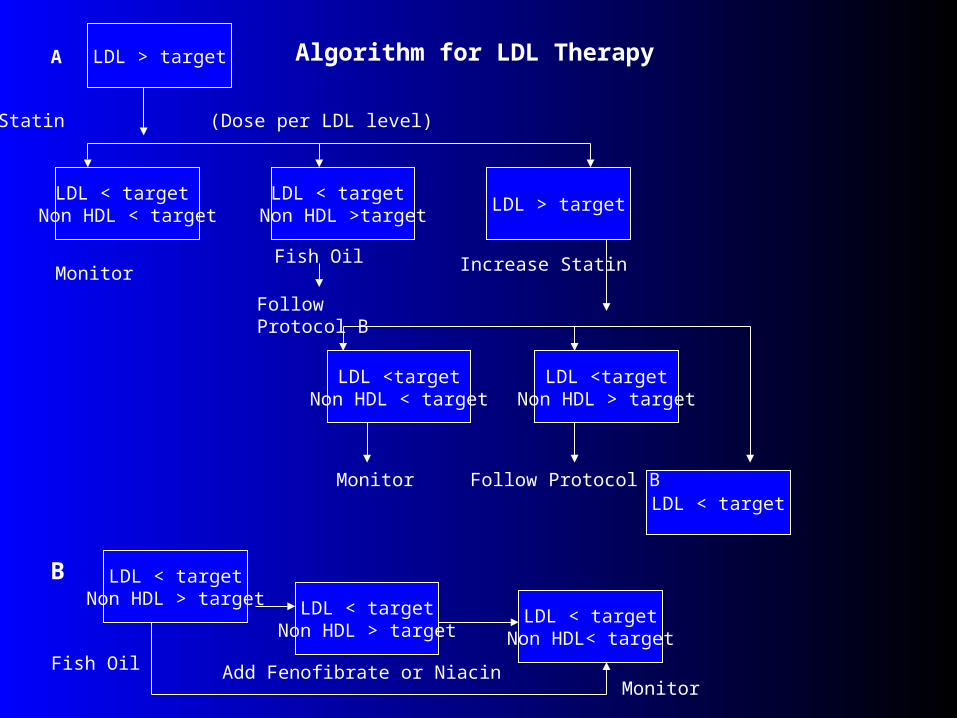
LDL > target
LDL < target Non HDL < target
LDL > target
LDL <targetNon HDL < target
LDL < target
LDL < targetNon HDL > target
Statin
A
(Dose per LDL level)
Algorithm for LDL Therapy
LDL < target Non HDL >target
MonitorFish Oil Increase Statin
Follow Protocol B
LDL <targetNon HDL > target
Monitor Follow Protocol B
B
LDL < targetNon HDL > target
LDL < targetNon HDL< target
Fish Oil Add Fenofibrate or NiacinMonitor

There is a rising tide of CVD in diabetes LDL and blood pressure are strong risk
factors We believe SANDS will validate a strategy
to prevent/retard CVD in diabetes SHS will continue to work to identify future
strategies for therapy or prevention of CVD in diabetes
SUMMARY

Diabetes and an Excess of FatDiabetes and an Excess of Fat
“With an excess of fat diabetes begins
and from an excess of fat diabetics die…”
- EP Joselin, 1927

Insulin Resistance: Inherited Insulin Resistance: Inherited and Acquired Influencesand Acquired Influences

Comprehensive Medical Therapy For Comprehensive Medical Therapy For Patients Patients
with CHD or Other Vascular Diseasewith CHD or Other Vascular Disease
Adapted from the UCLA CHAMP Guidelines 1994Adapted from the UCLA CHAMP Guidelines 1994
Risk Reduction
ASA 20-30%Beta Blockers 20-35%ACE inhibitors 22-25%Statins 25-50% The four medications every atherosclerosis patient should be
treated with, unless contraindications exist and are documented

14.8
6.4
Pre-CHAMP Post-CHAMP02468
1012141618
Death or Recurrent MI %
RR 0.43p<0.01
256 AMI pts discharged in 92/93 pre-CHAMP compared to 302 pts in 94/95 post-CHAMPASA 78% vs 92%; Beta Blocker 12% vs 61%; ACEI 4% vs 56%; Statin 6% vs 86% Fonarow Am J Cardiol 2001;87;819-822
CHAMP ~ Impact on Clinical Outcomes in CHAMP ~ Impact on Clinical Outcomes in the First Year Post Hospital Dischargethe First Year Post Hospital Discharge