aggregate supply chapter 10: “the aggregate supply curve”
TRANSCRIPT
Aggregate Supply
Chapter 10: “The Aggregate Supply Curve”
Aggregate Supply
Tells us how much is produced in goods and services in the country.

Determinants of Aggregate Supply
Prices Wages and prices of raw materials. Stock of capital State of Technology Producer’s expectations

Aggregate Supply
Describes the relationship between the price index and the Quantity of goods and services (Real GDP) supplied
Holding all other determinants of supply constant
The AS line is drawn assuming constant:Wages, prices of inputs, stock of capital, technology and expectations
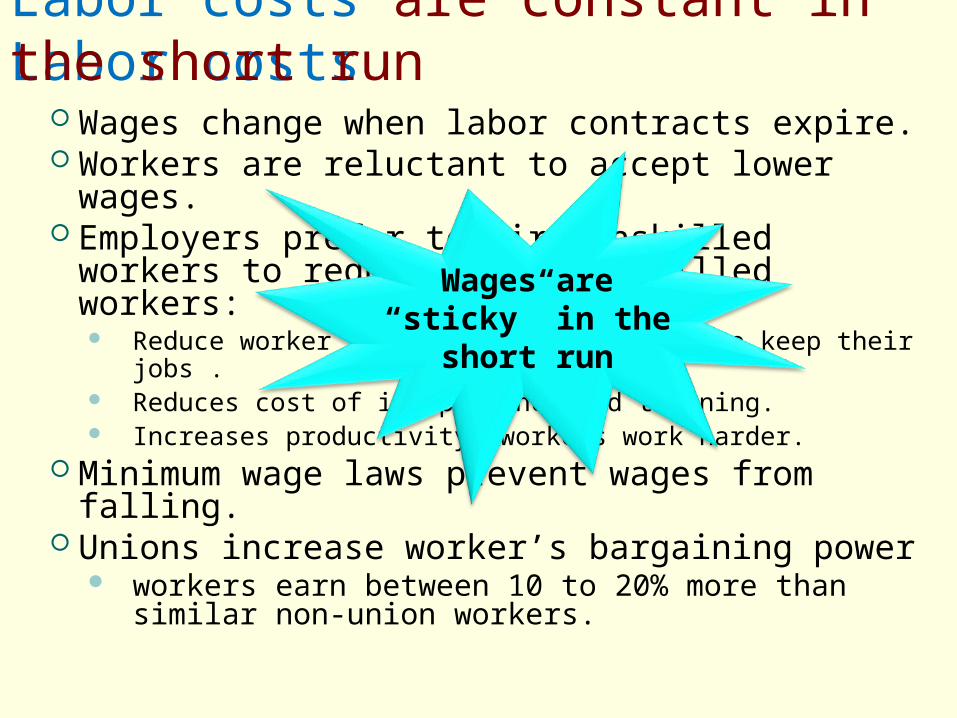
Labor costs Wages change when labor contracts expire. Workers are reluctant to accept lower
wages. Employers prefer to fire unskilled workers
to reduce wages of skilled workers: Reduce worker turnover: workers eager to keep their
jobs . Reduces cost of inexperience and training. Increases productivity: workers work harder.
Minimum wage laws prevent wages from falling.
Unions increase worker’s bargaining power workers earn between 10 to 20% more than
similar non-union workers.
Wages are “sticky” in the
short run
Labor costs are constant in the short run

Important Difference:
Price: what the consumer pays and the producer receives.
Cost: what the producer pays for raw materials, labor and other expenses necessary to produce.

Labor is the largest cost of production
If prices rise while wages remain fixed, production becomes more profitable and
firms produce more.
Firms maximize Profits
Profit = Price - Cost same
Wages are constant in the
short run

Aggregate Supply Curves Slopes Upward
Pri
ce L
evel
Real GDP supplied
AS
Profits increase, if WAGES do not
increase
Firms will produce more when prices increase if profits
increase
Profit = Price - Cost same
AS(Wage0)AS(Wage fixed)CauseCause
EffectEffect
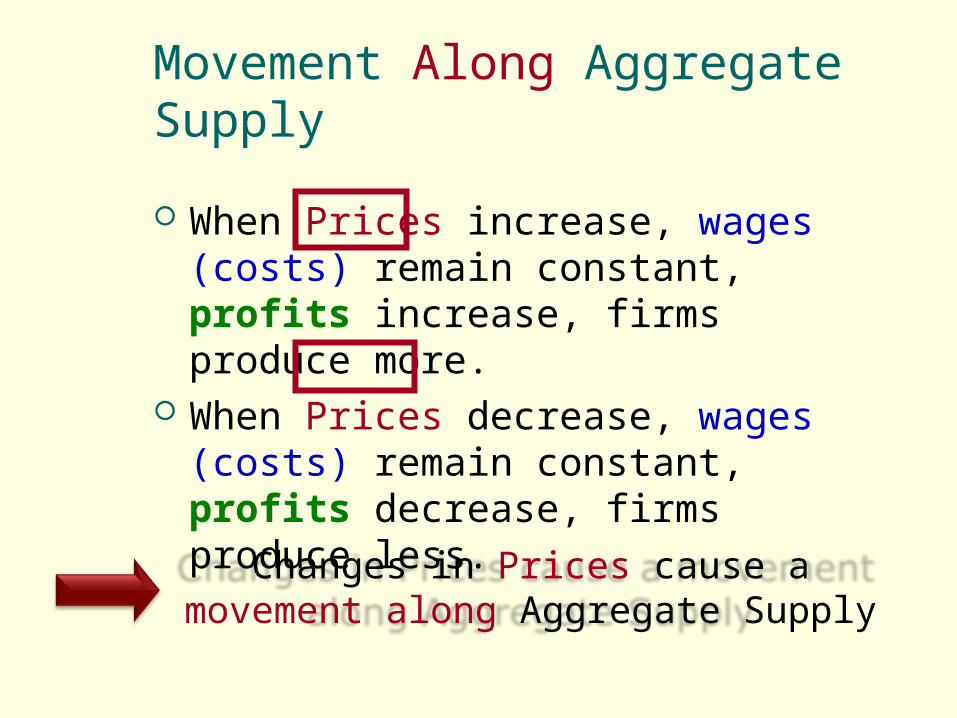
Movement Along Aggregate Supply
When Prices increase, wages (costs) remain constant, profits increase, firms produce more.
When Prices decrease, wages (costs) remain constant, profits decrease, firms produce less.
Changes in Prices cause a movement along Aggregate Supply

Prices Wages and prices of
inputs
Stock of capital and labor force.
Technology/Productivity
Firms produce less when their labor costs increase: AS shifts left
Firms produce more with a larger labor force or a larger stock of physical capital: AS shifts right
Firms produce more with better technology: AS shifts right.
Inverse
Direct
Direct
Factors that affect Supply
Factors that shift Aggregate Supply

An increase in wages shifts AS left
Pri
ce L
evel
Real GDP supplied
Profit = Price - Costsame
AS(Wage0)
AS(Wage1)
P0
Y1 Y0
Firms produce LESS when wages increase
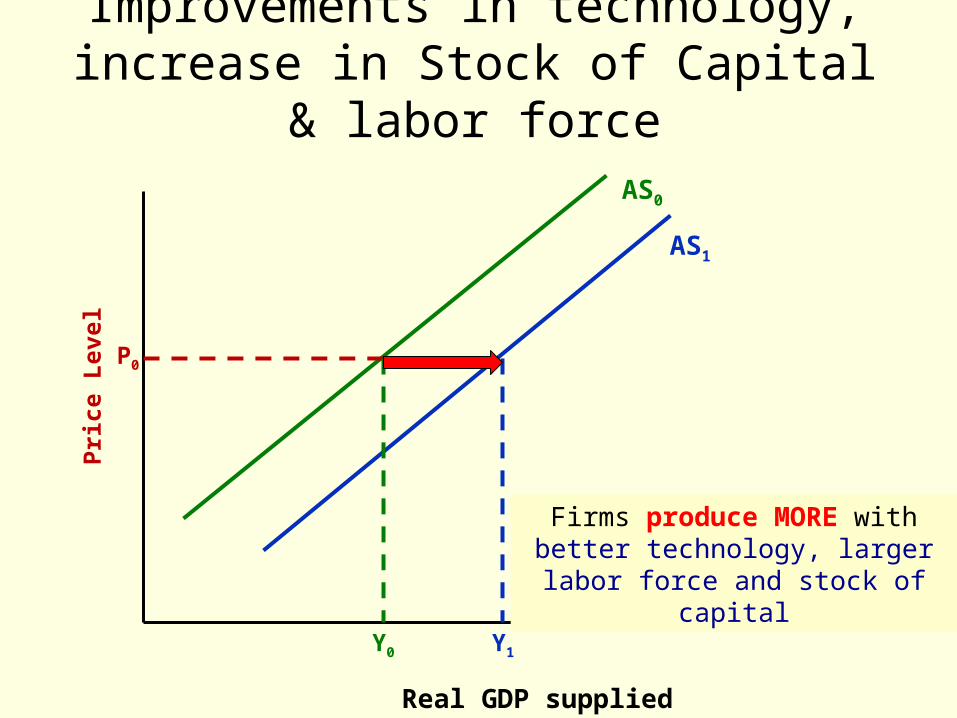
Improvements in technology, increase in Stock of Capital &
labor forceP
rice L
evel
Real GDP supplied
AS0
AS1
P0
Y1Y0
Firms produce MORE with better technology, larger labor
force and stock of capital
13
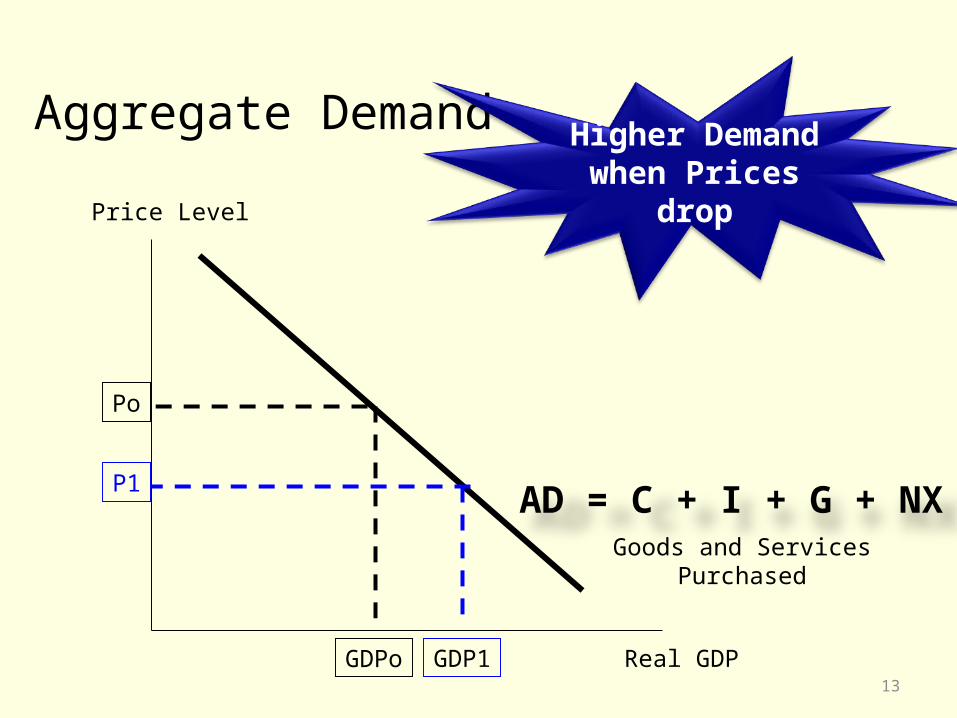
Po
Goods and Services Purchased
AD = C + I + G + NX
GDPo
Aggregate Demand
Price Level
Real GDP
Higher Demand when Prices drop
P1
GDP1

What Causes Inflation/Deflation?
Prices change when Aggregate Demand for goods and services runs ahead or lags behind Production of goods and services (Aggregate Supply)
14
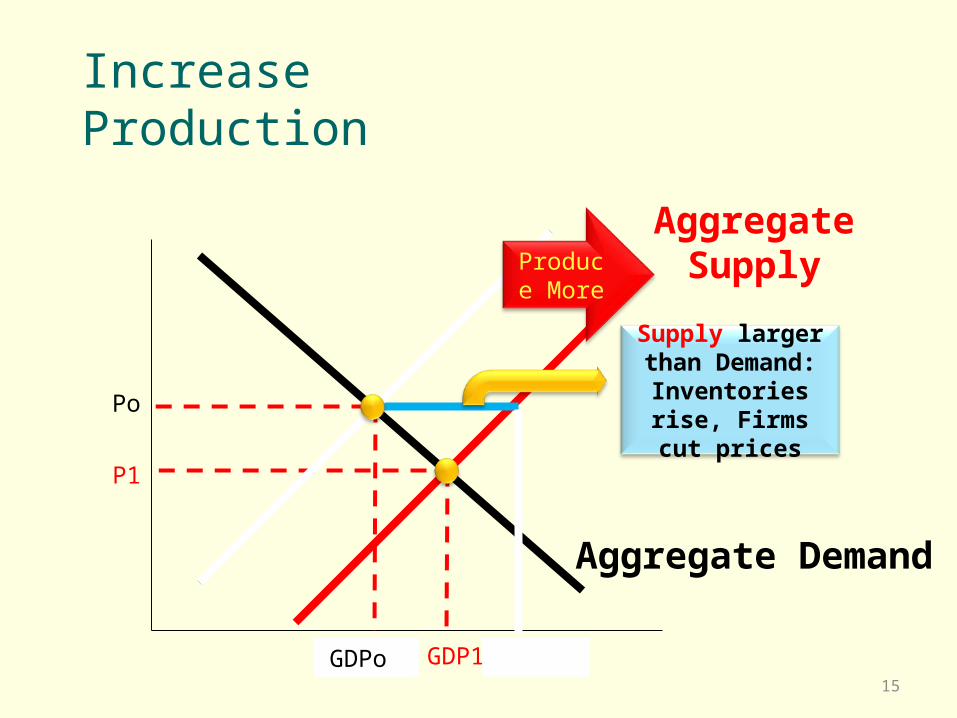
Increase Production
15
Po
GDPo
Aggregate Supply
Aggregate Demand
P1
GDP1
Supply larger than Demand:
Inventories rise, Firms cut
prices
Produce More
Demand SupplyGDPo Supply

Deflation Before 1930 deflation was as likely as inflation. Deflation is harmless even good, if lower prices
increase real incomes and spending power. In the last 30 years of the 19th century, consumer prices
fell by almost half as the expansion of railways and advances in industrial technology brought cheaper ways to make everything.
Annual real GDP GROWTH over the period averaged more than 4%.
16
Deflation is dangerous when it reflects
A sharp drop in DEMAND, Excess CAPACITY and Decrease in GDP As in the Great DEPRESSION of the
early 1930s.
17
18
Po
Goods and Services Produced
Goods and Services PurchasedAggregate Demand
Aggregate Supply
GDPo
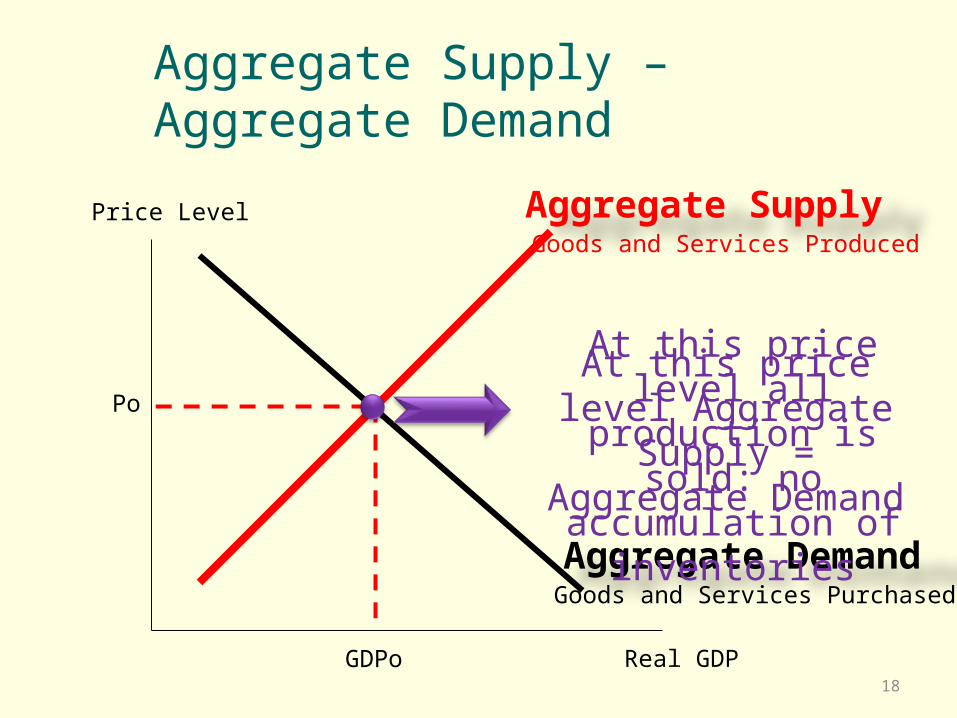
Aggregate Supply – Aggregate Demand
Price Level
Real GDP
At this price level Aggregate Supply = Aggregate Demand
At this price level all production is sold: no accumulation of
inventories
AS
AD
120
130
140
3000 3200 3400
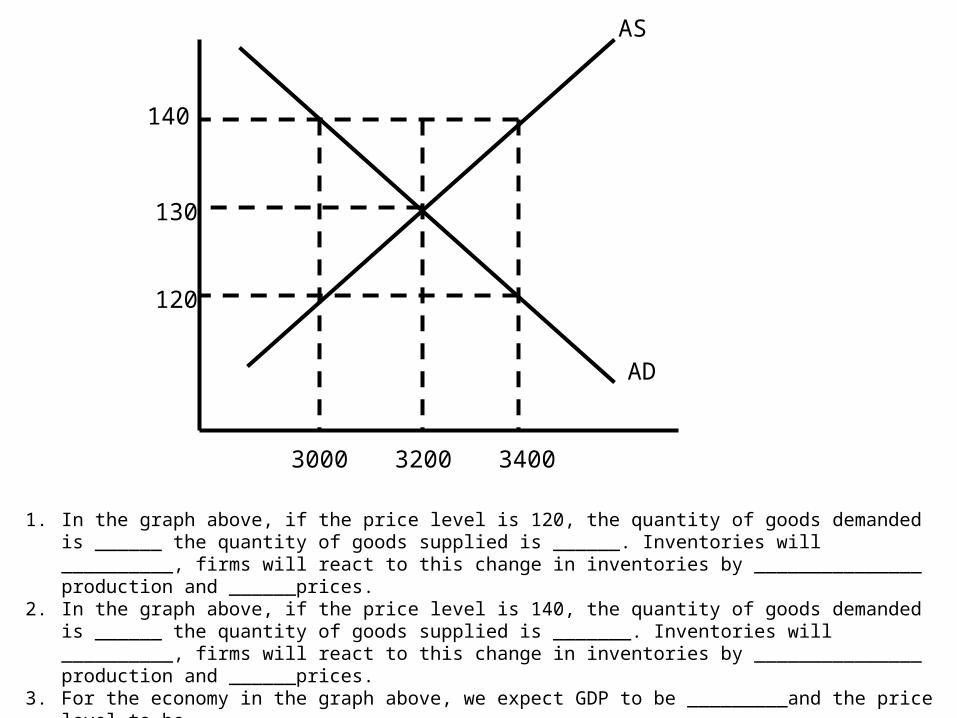
1. In the graph above, if the price level is 120, the quantity of goods demanded is ______ the quantity of goods supplied is ______. Inventories will __________, firms will react to this change in inventories by _______________ production and ______prices.
2. In the graph above, if the price level is 140, the quantity of goods demanded is ______ the quantity of goods supplied is _______. Inventories will __________, firms will react to this change in inventories by _______________ production and ______prices.
3. For the economy in the graph above, we expect GDP to be _________and the price level to be_______________

Cost of Production Wages and prices of inputs (oil)
Size of stock of capital and labor force
Technology
Firms produce less when costs increase AS shifts left
Firms produce more with a larger labor force or a larger stock of physical capital: AS shifts right
Firms produce more with better technology: AS shifts right.
Factors that affect Supply
Increase
Increase
Improvement

22
Po
Goods and Services Purchased
AD = C + I + G + NXGDPo
Factors that affect Demand
Price Level
Real GDP
Demand increases when Prices drop:
Move Along
P1
GDP1
Demand Shifts when C, I, G NX
Increase
AD = C + I + G + NX
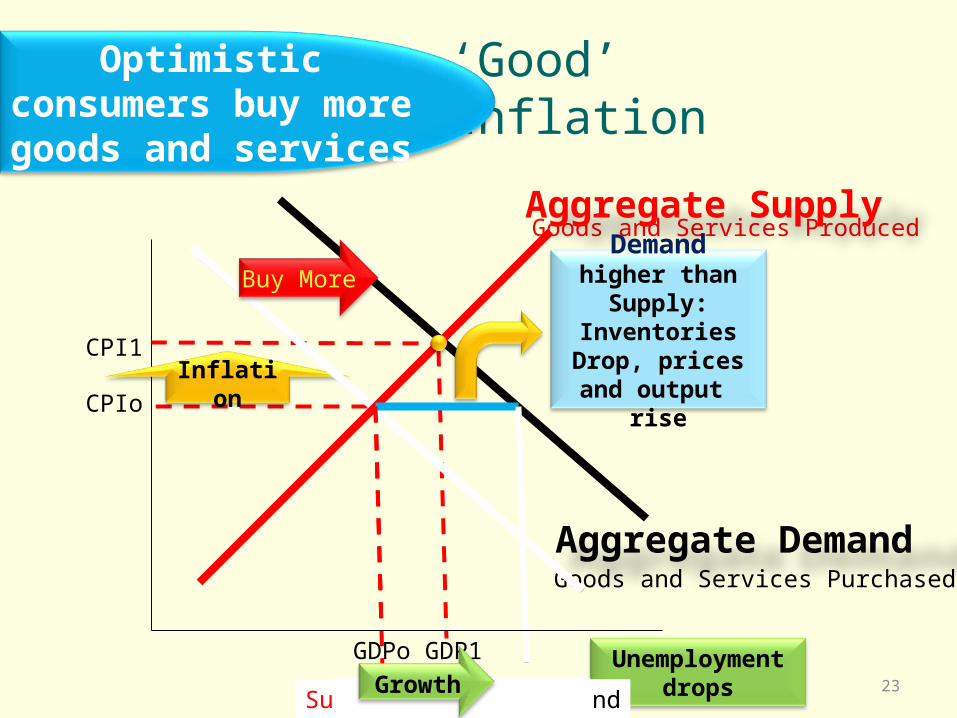
‘Good’ Inflation
23
CPIo
Goods and Services Produced
Goods and Services Purchased
CPI1
Aggregate Demand
Aggregate Supply
Optimistic consumers buy more goods and
services
Inflation
Demand higher than
Supply: Inventories Drop, prices and output
rise
Buy More
Unemployment drops
GDPo GDP1
Supply DemandGrowth
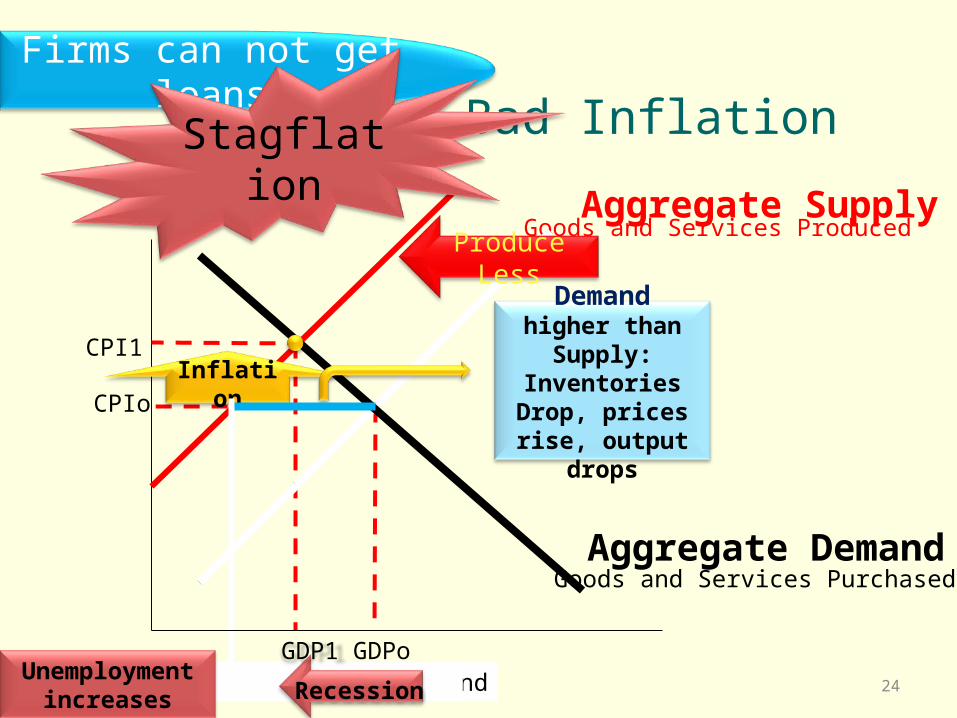
Bad Inflation
24
CPIo
Goods and Services Produced
Goods and Services Purchased
CPI1
Aggregate Demand
Aggregate Supply
Firms can not get loans
Inflation
Demand higher than
Supply: Inventories Drop, prices rise, output
drops
Produce Less
Stagflation
Supply DemandRecessionUnemploymen
t increases
GDPoGDP1
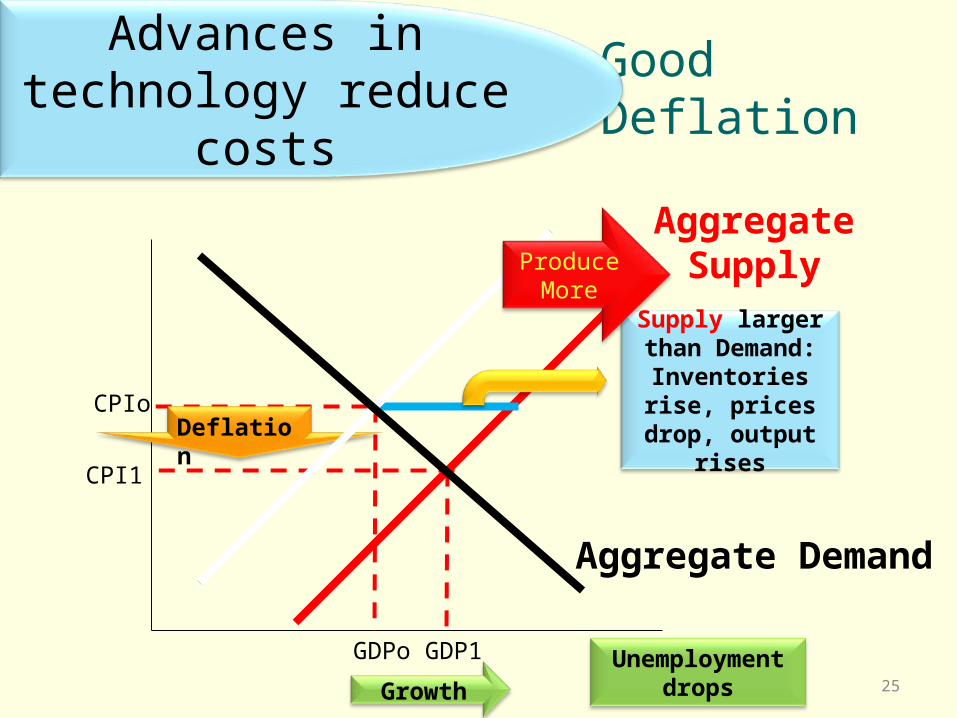
Good Deflation
25
CPIo
GDPo
Aggregate Supply
Aggregate Demand
CPI1
GDP1
Deflation
Growth
Advances in technology reduce
costs
Supply larger than Demand:
Inventories rise, prices
drop, output rises
Unemployment drops
Produce More
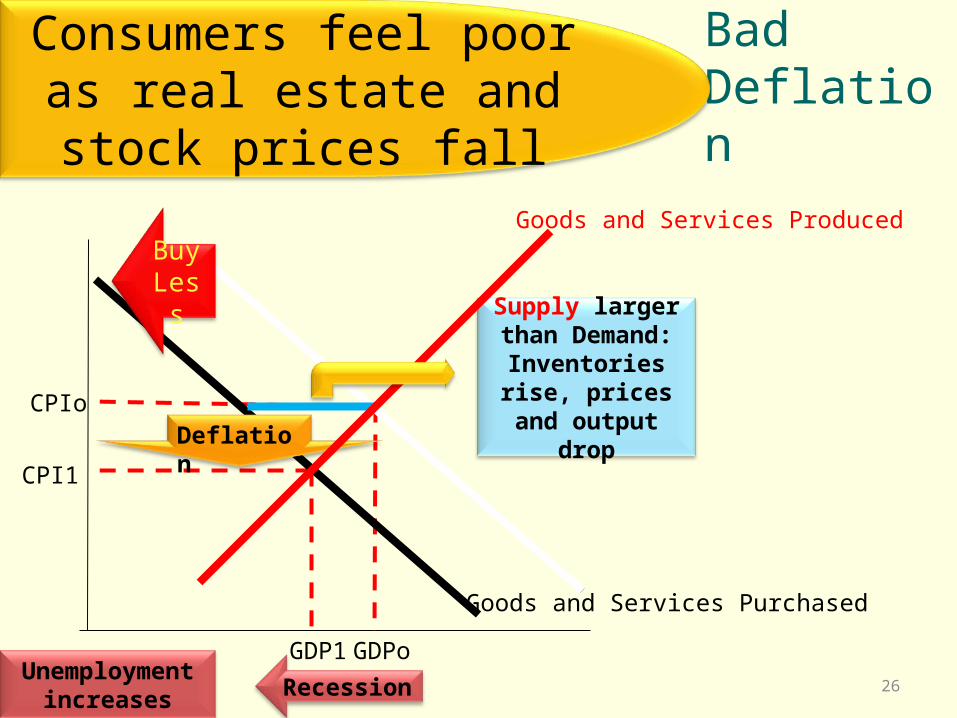
Bad Deflation
26
CPIo
GDPo
Goods and Services Produced
Goods and Services Purchased
CPI1
GDP1
Recession
Consumers feel poor as real estate and stock
prices fall
Supply larger than Demand:
Inventories rise, prices and output
dropDeflation
Unemployment increases
Buy Less

27
Price Level
Real GDP
ASo
AD1ADo
Price Level
Real GDP
ASo AS1
ADo
Price Level
Real GDP
ASoAS1
ADo
Price Level
Real GDP
ASo
AD1ADo
Recession and deflation
12
34
Recession and inflation
Growth and deflationGrowth and inflation
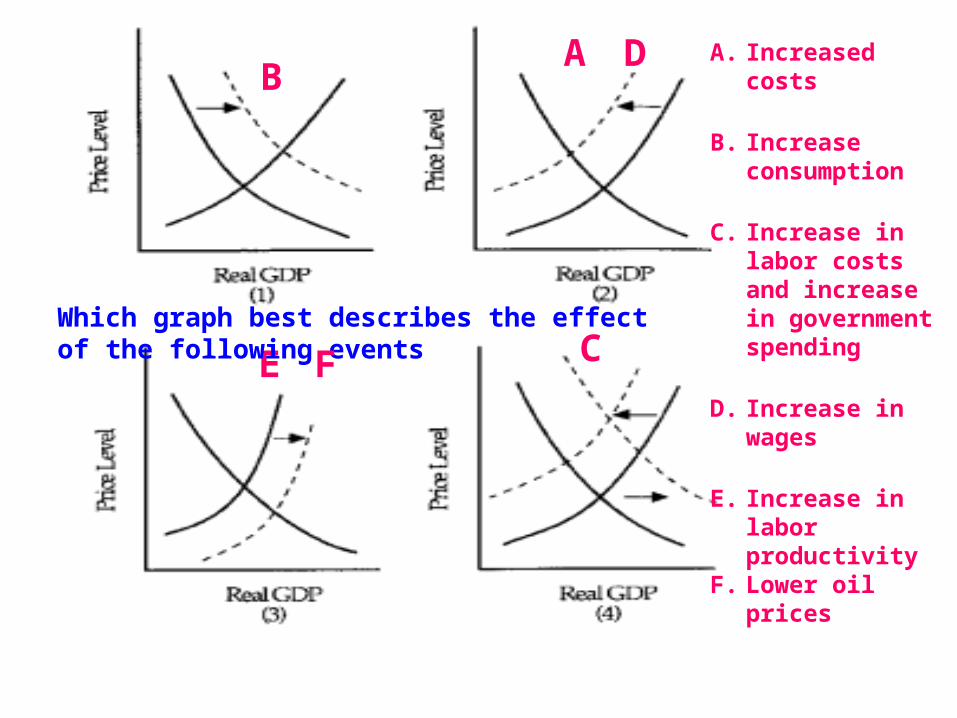
A. Increased costs
B. Increase consumption
C. Increase in labor costs and increase in government spending
D. Increase in wages
E. Increase in labor productivity
F. Lower oil prices
AB
C
D
EWhich graph best describes the effect of the following eventsF
E2
E1S2
S1
D1
D2
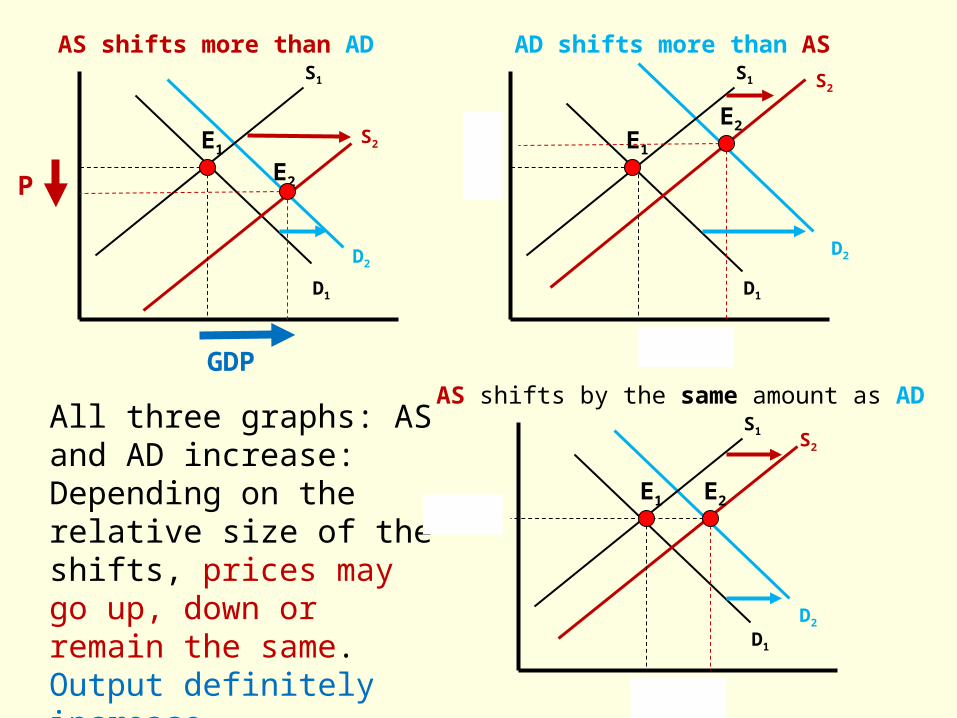
All three graphs: AS and AD increase:Depending on the relative size of the shifts, prices may go up, down or remain the same. Output definitely increase.
AS shifts more than ADS2
S1
D1
D2
AD shifts more than AS
S2
S1
D1
D2
AS shifts by the same amount as AD
P
GDP
E1
E2
E1 E2