aggregate fluctuations and the network structure of
TRANSCRIPT

Aggregate Fluctuations and
The Network Structure of Intersectoral Trade
Vasco M. CarvalhoCREi and Universitat Pompeu Fabra.
Abstract:
This paper analyzes and models the �ow of intermediate inputs across sectors by adopting a
network perspective on sectoral interactions. I apply these tools to show how �uctuations in ag-
gregate economic activity can be obtained from independent shocks to individual sectors. First, by
interpreting data in detailed input-use matrices through this lens, I characterize the structure of
input trade in the U.S.. On the demand side, a typical sector relies on a small number of key inputs
and sectors are homogeneous in this respect. However, in their role as input-suppliers sectors do
di¤er: many specialized input suppliers coexist alongside general purpose sectors that function as
hubs to the economy. The paper then constructs a network model of input-use matrices that can
reproduce these connectivity features in the data. In a standard multisector setup, I then use this
model of input-use matrices to provide analytical expressions linking the variability in aggregates
to the network structure of input trade. I show that the presence of sectoral hubs - by coupling
production decisions across the economy - leads to �uctuations in aggregates. Furthermore, I show
that this network approach provides a common framework for hitherto opposing arguments on how
fast the volatility of aggregates decays with the number of sectoral technologies.
0This version: June, 2009. For comments and contact, mail at [email protected]. The latest version of this
paper can be found at http://www.crei.cat/people/carvalho/papers.html. This paper draws from material in
my University of Chicago dissertation, which was made feasible by �nancial support from the Portuguese Ministry of
Science and Technology, the Gulbenkian Foundation and The University of Chicago which I gratefully acknowledge. I
thank my advisor, Lars Hansen, and my committee members, Robert Lucas and Timothy Conley. For comments and
encouragement I thank Luis Amaral, Xavier Gabaix, Matthew Jackson, Marcin Peski, Hugo Sonnenschein, Randall
Verbrugge and participants at various conferences and seminars. All errors are mine.
1

1. Introduction
Comovement across sectors is a hallmark of cyclical �uctuations. A longstanding line of research
in the business cycle literature asks whether trade in intermediate inputs can link otherwise indepen-
dent technologies and generate such behavior. The intuition behind this hypothesis is clear: factor
demand linkages can provide a source for comovement, as a shock to the production technology of a
general purpose sector - say, petroleum re�neries - is likely to propagate to the rest of the economy.
In this way, cyclical �uctuations in aggregates are obtained as synchronized responses to changes in
the productivity of narrowly de�ned but broadly used technologies.
Though intuitive, this hypothesis is faced with a strong challenge: by a standard diversi�cation
argument, as we disaggregate the economy into many sectors, independent sectoral disturbances will
tend to average out, leaving aggregates unchanged and yielding a weak propagation mechanism; see
the discussion in Lucas (1981) and the irrelevance theorems of Dupor (1999)1.
In this paper, I take on this challenge by adopting a network perspective on sectoral interactions.
From this vantage point, I provide answers to the following questions. First, given the availability of
detailed input use data, can we identify the main features of the structure of linkages across sectors?
Second, can we construct counterfactual models of input-output matrices that are able to mimic this
connectivity structure and are amenable to use in standard multi-sector models? If so, can we use
these models of connectivity to provide analytical results linking the variability of aggregates to the
network structure of input �ows? Finally, under what assumptions on the network structure can we
render ine¤ective the shock diversi�cation argument of the previous paragraph?
The argument linking the answers to these questions is the following: when determining whether
a sectoral shock propagates or not, the number of sectoral connections originating from the source
of the shock is the crucial variable to consider. Furthermore, if the number of connections varies
widely across sectors, some shocks will propagate throughout the economy and persist through time
while others will be short-lived and only propagate locally. As a consequence, economies where
every sector relies heavily on only a few sectoral hubs - general purpose input suppliers - will show
considerable conductance to shocks in those technologies. Conversely, as the structure of the economy
is more diversi�ed, di¤erent sectors will rely on di¤erent technologies and exhibit only loosely coupled
dynamics. The answer to the law of large numbers arguments in Lucas and Dupor thus lies in
1For the most part, the answer to this challenge has been in the empirical vein. Long and Plosser (1983, 1987),
Norrbin and Schlagenhauf (1990) and Horvath and Verbrugge (1996) document comovement of sectoral output growth
series through vector autoregressions. They all add that the explanatory power of a common, aggregate shock is limited
on its own and diminished once sector speci�c shocks are entertained. Shea (2002) and Conley and Dupor (2003) go
further and devise ways of testing - and rejecting- the hypothesis that sectoral comovement is being driven by a common
shock. Both emphasize positive cross-sectional covariance in sectoral productivity growth and show how this can be
explained by the existence of sectors with similar input demand relations. Concurrently, the strategy of using actual
input-output data in large scale multisector models generates aggregates that are quantitatively similar to data and to
one-sector real business cycle models; see Horvath (2000).
2

understanding and modelling this tension between specialization and reliance on general purpose
technologies.
I build on and extend this key notion of sectoral connectivity - �rst put forth in Horvath (1998)
- by analyzing the structure of intersectoral linkages through graph-theoretical concepts and tools.
The starting point for this analysis is to establish that an input-use matrix can be characterized as
a network. That is, given a detailed list of production sectors and information on who trades with
whom, I can map such trade interactions to a network of input trade where sectors become vertices
and input-supply relations are represented by directed arcs. Given that these lists do exist in the
form of input-use matrices, providing data at a fairly disaggregated level, one can ask questions
related to the properties of such networks. In particular, from detailed input use matrices for the
U.S. economy, I characterize heterogeneity across sectors along the input-demand and input-supply
dimensions by exploiting well-de�ned measures of connectivity in a network.
Thus, along the demand side, I characterize sectors by the number of inputs used. This maps
directly into the in-degree sequence of a network, giving for each sector the number of distinct
inputs used in the production of the corresponding good. Re�ecting specialization, narrowly de�ned
production activities are found to rely only on a small number of inputs. Though di¤erent sectors
use a di¤erent set of inputs, sectors can be characterized as homogeneous along the demand side in
that the number of inputs used does not di¤er much across sectors.
This is to be contrasted with extensive heterogeneity across sectors in their role as input suppliers.
In the data, highly specialized input suppliers - say, for example, optical lens manufacturing - coexist
alongside general purpose inputs, such as iron and steel mills or petroleum re�neries. Speci�cally, I
characterize the empirical out-degree distribution of input-supply links - giving the number of sectors
to which any given sector supplies inputs to - as a power law distribution. What makes this power
law parameterization attractive is the following argument: the upshot of fat-tails, characteristic of
power law degree distributions, is that a small, but non-vanishing, number of sectors will emerge as
large input suppliers - or hubs - to the economy. As such, productivity �uctuations in these general
purpose sectors can have a disproportionately larger e¤ect in the aggregate economy.
I then show how to incorporate these network insights in multisector models by constructing
a data generating process for input-use matrices. Informed by the analysis of input trade data, I
show how one can construct and distinguish across models of input-use matrices by specifying three
key parameters: the number of sectors under consideration, the average number of inputs used in
a sector�s production process and a parameter controlling the heterogeneity across sectors in their
input-supply role. This enables me to build counterfactual connectivity structures for intersectoral
trade. In particular, I show how to specify classes of input-use matrices that mimic the homogeneous-
in-demand, heterogeneous-in-supply characterization of U.S. data.
Finally, I employ these models of input-use matrices in standard multisector economies and
characterize analytically how the variability of aggregates is mediated by the network structure of
these matrices. To achieve this I use a version of Long and Plosser�s (1983) multisector setup- used
3

by Horvath (1998) and Dupor (1999)2. I �rst demonstrate that the opposing conclusions reached by
Horvath (1998) and Dupor (1999) can be traced to very particular restrictions on the intersectoral
network structure, namely on its outdegree sequence. Thus, I show that the exact results in Horvath
and Dupor - regarding the decay in the volatility of aggregates as a function of the total number
of sectors - can be shown using known properties of simple network structures: complete regular
networks in the case of Dupor and very particular sparse structures - star networks - in the case of
Horvath.
More generally, I derive analytical expressions linking directly the degree of fat-tailness of the
distribution of input-supply links with the strength of the propagation mechanism in a multisector
economy. Taking the estimates obtained from input-use data as a guide to parameterize this class
of matrices, I argue that the structure of intermediate input trade o¤ers enough conductance of
sectoral shocks to render the diversi�cation argument of second order. In other words, in multisector
economies, the presence of sectoral hubs facilitates the propagation of technological shocks and
postpones the applicability of law of large numbers arguments.
The paper is closest in spirit to the contributions of Bak et al.(1993) and Scheinkman and Wood-
ford (1994) by stressing the importance of the structure of input-supply chains in the transmission
of shocks across sectors and, as a consequence, to aggregates. In comparison with these papers, by
placing sectors on a network of input �ows - rather than on a lattice - I allow for more general, and
arguably more realistic, patterns of connections between sectors. Regarding the characterization of
the decay behavior in the volatility of aggregates as a function of heterogeneity in the underlying
production units, this paper is closely related to the recent analysis in Gabaix (2005). In comparison
to the latter, I use a di¤erent model, a di¤erent aggregate statistic and di¤erent tools to approach the
same problem. More importantly, in contrast to Gabaix (2005), the explanation here rests explicitly
on the dynamic propagation of shocks through a network of technologies, rather than on careful total
factor productivity accounting when some �rms are large.
The idea of characterizing input-use relationships through graph-theoretical tools is not new,
albeit it has merited only limited attention3. In the context of traditional input-output analysis
Solow (1952) is, to the best of my knowledge, the �rst reference recognizing that an input-output
matrix can be mapped into a network. These tools have resurfaced only sporadically in the analysis
of static and dynamic input-output systems; see Rosenblatt (1957), Simon and Ando (1961) or Szydl
2To ensure comparability of results with Horvath (1998) and Dupor (1999) this paper preserves the model and the
aggregate statistic considered therein and focuses on generalizing the set of admissible input-output matrices under
consideration. The model is closely related to the original multisector real business cycle model of Long and Plosser
(1983) and the myriad of extensions and applications since developed in the literature. Other setups have been explored:
Cooper and Haltiwanger (1990), Bak et al (1993) and Scheinkman and Woodford (1994) all stress the role of inventories.
Jovanovic (1987) instead focuses on the role of complementarities among sectors, as does the recent contribution of
Nirei (2005), where this is coupled with indivisibilities in investment. Murphy et al. (1989) focus on aggregate demand
spillovers.3This stands in sharp contrast to the recent but burgeoning use of network tools in microeconomics; see Jackson
(2005) for a comprehensive review or Vega-Redondo (2007) for a book length introduction.
4

(1985). Fisher and Vega-Redondo (2007) o¤er the only recent treatment of input-trade relations as
a network and focus on identifying what are the "central sectors" in the US economy. However they
do not address the implications of this notion for the business cycle literature4.
In terms of tools this paper borrows heavily from recent work on networks and in particular,
random graphs. Newman (2003) and Li et al (2006) o¤er good reviews mapping out recent theoretical
advances and link them to a growing number of applications. Durrett (2006) and Chung and Lu
(2006) provide book-length treatments of the tools used here. In particular, a model of random
graphs with given expected degree sequences, set out in Chung and Lu (2006), forms the basis for
my data-generating process for input-use matrices.
2. Overview in a Static Multisector Economy
Consider the following static multisector economy, a simpli�ed version of the setup presented in
Shea (2002). There is a representative household whose utility is a¤ected by the levels of consumption
of M goods, fCjgMj=1; and total hours of work (L): Assume log preferences over M di¤erent goods,
with weights given by f�jgMj=1, and specify a time endowment of L, to be shared among the Mproduction activities.
U(fCj ; LjgMj=1) =
MXj=1
�j log(Cj)� L; (1)
withPj�j = 1 and �j > 0;8j ; (2)
andPjLj � L (3)
The M productive units, or sectors, each produce a di¤erent good that can either be allocated
to �nal consumption (by the household) or as intermediate goods to be used in the production of
other goods. This is just a static version of the production technologies introduced in Long Plosser
(1983). In particular, assume production functions are of the Cobb-Douglas, decreasing returns to
scale variety:
Yj = ZjL�jj
Yi2 �Sj
M ijij (4)
1 > �j +Xi2 �Sj
ij (5)
Zj = exp("j); "j s N(0; �2j ) (6)
4Rauch (1999) is another recent exception in the macroeconomics literature. He adopts a network view to disag-
gregated world trade �ows.
5

whereMij is the amount of good i used as an intermediate input in the production of sector j. Zjis a Hicks-neutral, log-normal, productivity shock to good j technology, to be drawn independently
across sectors. The �supply-to�set �Sj completes the description of technology in this simple economy.
It gives, for every sector j; the list of goods that are necessary as inputs in the production of good
i. Finally, market clearing implies that:
Yj = Cj +Xi:j2 �Si
Mji, 8j = 1; :::;M (7)
It is a standard exercise to solve for the competitive equilibrium of this economy; see Shea
(2002). Substituting the equilibrium input choices into the production function, simplifying and
taking logarithms yields, in vector notation:
y = �+(I � �)�10" (8)
where � is an M-dimensional vector of constants dependent on model parameters only. The pair
of vectors M-dimensional vectors (y; ") give, respectively, the log of equilibrium output and the log
of the productivity shock for every sector in the economy.
� is a key object for the analysis of this paper. It is an M �M (non-negative) input-use matrix
with typical element ij where (I � �)�10is well de�ned. Note that an entry ij in this matrix will
be zero whenever sector i�s output is not a necessary input for the production of good j, that is
whenever i =2 �Sj : This simply means that there are no substitution possibilities between the inputs
used in sector j�s production and the ith good. Notice also that j =Pi ij , the j
th column sum of
�; gives the degree of returns to scale to intermediate inputs for sector j.
Independent technological shocks at the sectoral level propagate through the input-use matrix
downstream5, a¤ecting the costs of input-using sectors and potentially in�uencing aggregate activity.
The analysis of this paper focuses on the interplay between the structure of intermediate input use
- the structure of the input output matrix, �- and the strength of this propagation mechanism as
evaluated by the volatility of aggregate output. For analyzing the latter, and keeping in line with
the literature (see Horvath, 1998, or Dupor, 1999), I will consider the following aggregate statistic:
�2Y (�) � E
"PMi=1(yi � �i)
M
#2(9)
Note thatPMi=1(yi��i) is the sum of log sectoral output (demeaned), or the log of the geometric
sum of sectoral output. Dividing this by the number of sectors gives a log-linear approximation to
the more obvious aggregate statistic, the log of total output. The di¢ culty with this latter statistic
5 In general, technology shocks also have e¤ects on upstream demand, by changing the demand of inputs necessary
to produce output and changing sectoral output level. In the current setting, due to the Cobb-Douglas assumption on
preferences and technology, these two e¤ects cancel out exactly; see Shea (2002).
6

is that it involves a nonlinear function of the vector of shocks. The average of log sectoral output
can therefore be taken as the log-linearization of this function6. Using this aggregate statistic will
allow me to compare my results directly with those in Horvath (1998) and Dupor (1999).
We are now left with choosing a speci�cation for the pattern of zeros in the input-output matrix
�, or equivalently, announcing the necessary inputs for each of the M production activities (the�Sj lists). Consider the two following abstract, and rather extreme, cases. Fix an M and contrast
an economy where only one sector is a material input supplier to all the other sectors with an
economy where every sector supplies to all the other sectors in the economy. These two polar cases
for the pattern of input-use relationships in an economy map exactly into very standard network
representations, where the vertex set is given by the set of sectors in the economy and a directed arc
from vertex (sector) i to vertex j represents a intermediate input supply link.
1
2
3
4
5
Pajek
5
1
2 3
4
Pajek
Figure 1: Complete (l.h.s.) and Star (r.h.s.) input-supply structures for a 5 sector economy.
Thus an economy where each sector is an input supplier to every other sector in the economy
can be represented by a complete network, where for any two pair of vertices there is a directed arc
from one to the other. Likewise, an economy where there is only one material input supplier maps
directly into a star network, where one vertex acts as a hub with directed arcs from this vertex to all
other vertices. An intermediate case is given by a N�star network, where N out ofM , sectors in the
economy act as material input suppliers to every sector and the remaining ones are solely devoted to
�nal goods production. Figure 1 depicts intersectoral input relations under these two extreme cases
- complete and star - for a �ve sector economy.
Notice also that I can map this connectivity structure thus: specify an M �M binary matrix
A where Aij = 1 if sector i supplies to sector j and Aij = 0 otherwise. In this way the matrix A
corresponding to a complete network will be given by a matrix of all ones (for every pair of sectors,
6This approximation is valid whenever the variances of the "0js are small and the mean of sectoral output does not
di¤er much across sectors (Dupor, 1999).
7

i; j; Aij = 1) and the one corresponding to an N -star network will have N rows of ones and M �Nrows of zeros.
The �nal step is going from the binary nature of network links to the input-output matrix �; giving
cost shares for material inputs. The simplest working assumption is that every sector, regardless of
what its particular input list is, uses its inputs in equal proportions. In short, all necessary inputs
are assumed equally necessary for any given sector. In terms of model parameters this translates to:
Assumption 2.1. For all sectors j = 1; :::;M; ij = kj for all inputs i and k necessary to the
production of output in sector j; that is for all pairs ij ; kj 6= 0.
This assumption will be used throughout the paper. It simpli�es considerably the analysis by
imposing homogeneity along the intensive margin of intersectoral trade - necessary inputs for any
given sector have a symmetric role- while allowing for substantial heterogeneity along the extensive
margin - sector can di¤er in the number of sectors they supply to. Under this assumption the analysis
in Section 4 below, shows that the input-output matrix � conveniently factors into the product of
two square M -dimensional matrices:.
� = A:D (10)
where D is a diagonal matrix with the ith diagonal element given by idiniwhere dini is the number
of inputs sector i uses (i.e. the cardinality of the �Si list or the number of inlinks). A is the binary
connectivity matrix with a typical element aij equal to one if sector i supplies to sector j and zero
otherwise.
With this assumption and the resulting factorization of � in hand, I can derive an analytical
expression for the aggregate volatility statistic, �Y ; and compare the properties resulting from dif-
ferent, hypothetical, intersectoral trade structures. Proposition 1 below gives an expression for this
statistic in complete network structure settings, �2Y (�C); and that resulting of N�star structures,�2Y (�N�star)
Proposition 2.2. Assume that the share of material inputs, j is the same across sectors,
j = ; j = 1; ::;M; and that sectoral volatility �2j = �2 for all sectors j = 1; :::;M: Then, for any
M; a static M�sector economy aggregate volatility of equilibrium output, �2Y is given by:
�2Y (�C) =
�1
1�
�2 �2M
(11)
for any complete intersectoral trade structure on M sectors; and
�2Y (�N�Star) =
�N
M+
2
1�
��2
M+
�
1�
�2 �2N
(12)
for any N star intersectoral trade structure on M sectors.
8

Notice that with the additional assumptions imposed in the proposition, sectoral technologies in
these economies are symmetrical in all respects except, possibly, that some supply to more sectors
than others. This is borne out in the expressions for aggregate volatility: they depend only on the
share of material inputs, ; sectoral volatility,�2, and the number of e¤ective input suppliers in each
case, M or N . The �rst two e¤ects are standard. Thus, the higher the share of material inputs
in production the more aggregate volatility will be a¤ected by disturbances working through the
input-output network7. Similarly, greater sectoral volatility translates mechanically into heightened
volatility in aggregates.
Of interest to this paper is the dependence of aggregate volatility on the number of sectors. Thus,
the expression for complete intersectoral structures of input trade is a particular case of the results
in Dupor (1999). It echoes Lucas�(1981) law of large numbers argument: aggregate volatility scales
with 1=M . To understand how e¤ective the shock diversi�cation argument is in this case notice the
following: holding sectoral productivity variance �xed as I move from a �ve sector economy to a
�ve hundred sector economy, aggregate volatility will be a hundred times smaller. Conversely, to
recover an aggregate �2Y of the order of two percent in a �ve hundred sector economy, would require
stipulating sectoral volatilities, �2; to be �ve hundred times larger, an unreasonable magnitude at
any time scale. From this, Dupor (1999) concludes that the input-output matrix provides a poor
propagation mechanism for independent sectoral shocks.
The result for N�star sectoral networks o¤ers a di¤erent, if somewhat predictable view. If thereare only N sectors acting as intermediate input suppliers, the diversi�cation of shocks argument
underlying law of large number arguments only applies to those sectors8. Thus, in an economy
where the e¤ective number of input suppliers is small, the law of large numbers will be postponed
relative to that of Dupor (1999): aggregate volatility now scales with N , the slowest decaying term in
expression (12). This is Horvath�s (1998) argument: limited sectoral interaction - of a very particular
form - will give rise to greater aggregate volatility from sector speci�c shocks. The di¢ culty with this
result is that the modeller is now left to specify, for each M; what is the number of input suppliers
in an economy; N . From input-output data, Horvath (1998) argues that N - the number sectors
with full rows in input-output matrices - grows slowly with M : Horvath argues for an N of orderpM , which would slow down the rate of convergence. This would now yield a ten fold decrease in
aggregate variability as we move from �ve to �ve hundred sectors.
In this way, two very particular assumptions on the connectivity structure of intersectoral trade
generate predictions on the variability of aggregates that di¤er by an order of magnitude. This means
that �nding a better way to model networks of input trade can not only help solve this controversy
but also has the potential of o¤ering a theory where reasonable magnitudes of sectoral volatility yield
7This multiplier e¤ect of (1=1 � ) on aggregates is a standard feature of multisector economies; see for examplethe discussion in Jones (2007a, 2007b)
8Notice that for any N < M the second term in the expression for N�Star networks dominates the rate ofconvergence (the �rst term converges to zero faster). As it should be, the two expressions in Proposition 2.2. will be
equal for N =M . Finally, if N is �xed for any M the law of large numbers breaks down completely.
9

non-trivial aggregate volatility. Mechanically, we need only a theory of intersectoral connectivity that
yields aggregate volatility decaying with M�; where � is close to zero. The remainder of this paper
does just this by going beyond these two extreme cases and building a model of sectoral interactions
on a network. Figure 2 depicts the starting point of the analysis. It shows a considerably more
intricate network of intersectoral input �ows: that of the U.S. economy in 1997.
1
2
3
456
7
8
9
10 11
12
1314
15
1617
18
19
20
21
22
23
24
2526
27
28
29
30
313233
34
35
36
37
38
39
40
4142
4344
45
46
47
48
49
5051
52
53
54
5556
57
58
596061
626364
65
66
6768
6970
71
72
73
74 75
7677
78 79
80
81
82
83
84
85
86
87
88
89
90
91
92
9394
95
96
97
98
99100
101
102
103104 105
106
107
108
109
110111
112
113114 115116
117
118
119120
121
122123
124
125
126127
128
129130
131
132
133134
135
136
137
138139140141
142
143
144
145
146
147
148
149
150
151
152
153
154
155156
157158
159160
161162
163
164
165
166
167
168169
170
171
172
173174
175
176
177178
179
180
181
182
183
184185186
187
188
189 190
191
192
193
194
195
196
197
198199
200
201
202203
204205
206
207
208
209
210
211
212
213
214215
216
217
218219220
221
222
223
224
225226
227 228
229
230
231
232
233
234235
236
237
238239
240
241
242243
244
245
246
247248
249
250
251
252
253
254
255
256
257
258 259
260
261
262
263
264
265
266
267
268
269270
271
272
273
274
275276
277
278
279
280
281
282
283
284
285
286
287288
289
290
291
292
293
294
295
296
297
298
299
300
301
302
303304
305
306307
308309
310
311312 313
314
315
316
317
318
319
320
321
322
323
324
325
326
327328329
330
331
332
333
334335
336
337
338
339
340
341342
343
344
345
346347
348
349
350
351
352
353
354355
356
357
358
359
360361
362
363
364
365
366
367
368369
370
371
372
373
374
375376
377
378
379
380
381
382
383
384
385
386387388
389
390
391
392
393
394
395
396
397
398
399400401
402403
404 405
406407
408
409410
411
412
413
414
415
416
417
418
419
420
421
422
423
424425 426
427
428429
430
431432
433
434
435
436
437
438439
440
441
442443
444
Figure 2: Intermediate input �ows between sectors in the U.S. economy in 1997. Each vertexcorresponds to a sector in the 1997 benchmark detailed input-use matrix published by the BEA. For
every input transaction above 5% of the total input purchases of the destination sector, a link
between two vertices is drawn.
Each dot - or vertex - corresponds to a sector de�ned at the NAICS 4-6 digit level of disaggregation
in the BEA detailed input use tables, for a total of 471 sectors. Each link in the �gure represents an
input transaction between sector i to sector j, provided sector i supplies more than 5% of sector j
total intermediate input purchases9.
From this vantage point, Section 3 in the paper o¤ers a two-pronged characterization of the
structure of input �ows by taking into consideration the direction in each of these links. Thus from
by considering links from the perspective of the destination vertex I can analyze sectors in their
role as input-demanders. I �nd that sectors are homogeneous along this dimension: the average of
sectoral production technologies relies on a relatively small number of key inputs and sectors do not9 I exclude loops from the network for presentation purposes. Loops correspond to intrasectoral trade and are a well
documented feature of detailed input use-matrices (see for example Jones, 2007b).
10
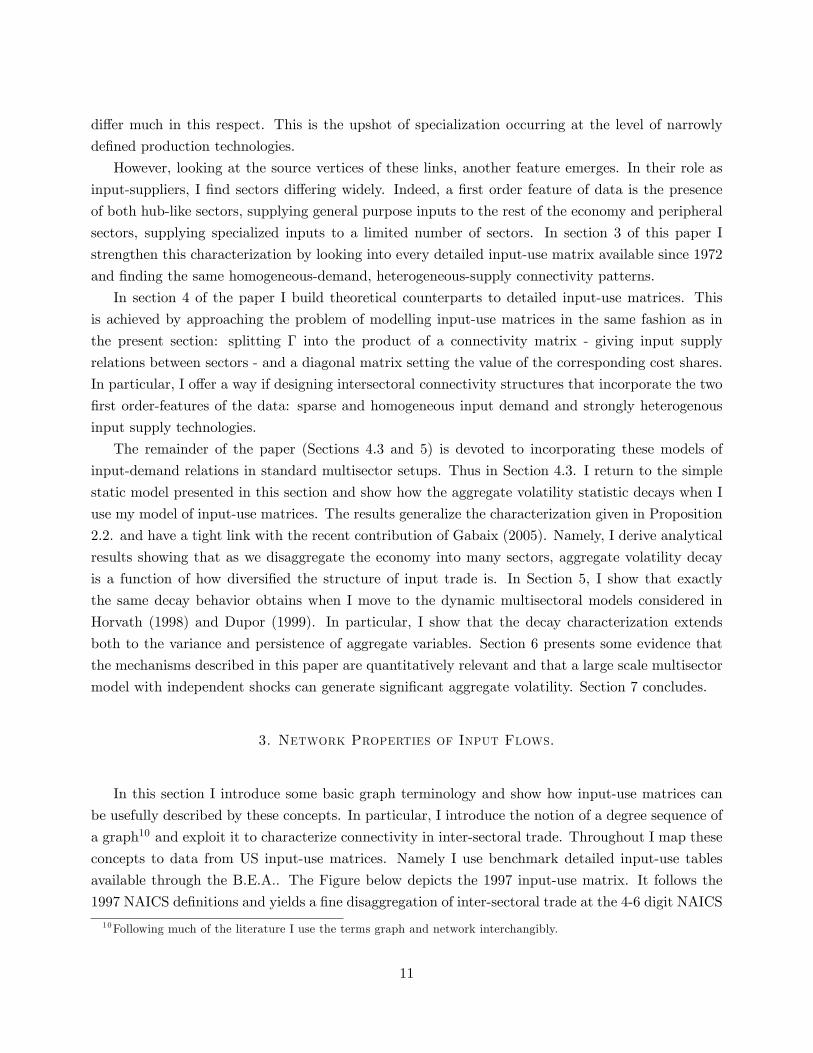
di¤er much in this respect. This is the upshot of specialization occurring at the level of narrowly
de�ned production technologies.
However, looking at the source vertices of these links, another feature emerges. In their role as
input-suppliers, I �nd sectors di¤ering widely. Indeed, a �rst order feature of data is the presence
of both hub-like sectors, supplying general purpose inputs to the rest of the economy and peripheral
sectors, supplying specialized inputs to a limited number of sectors. In section 3 of this paper I
strengthen this characterization by looking into every detailed input-use matrix available since 1972
and �nding the same homogeneous-demand, heterogeneous-supply connectivity patterns.
In section 4 of the paper I build theoretical counterparts to detailed input-use matrices. This
is achieved by approaching the problem of modelling input-use matrices in the same fashion as in
the present section: splitting � into the product of a connectivity matrix - giving input supply
relations between sectors - and a diagonal matrix setting the value of the corresponding cost shares.
In particular, I o¤er a way if designing intersectoral connectivity structures that incorporate the two
�rst order-features of the data: sparse and homogeneous input demand and strongly heterogenous
input supply technologies.
The remainder of the paper (Sections 4.3 and 5) is devoted to incorporating these models of
input-demand relations in standard multisector setups. Thus in Section 4.3. I return to the simple
static model presented in this section and show how the aggregate volatility statistic decays when I
use my model of input-use matrices. The results generalize the characterization given in Proposition
2.2. and have a tight link with the recent contribution of Gabaix (2005). Namely, I derive analytical
results showing that as we disaggregate the economy into many sectors, aggregate volatility decay
is a function of how diversi�ed the structure of input trade is. In Section 5, I show that exactly
the same decay behavior obtains when I move to the dynamic multisectoral models considered in
Horvath (1998) and Dupor (1999). In particular, I show that the decay characterization extends
both to the variance and persistence of aggregate variables. Section 6 presents some evidence that
the mechanisms described in this paper are quantitatively relevant and that a large scale multisector
model with independent shocks can generate signi�cant aggregate volatility. Section 7 concludes.
3. Network Properties of Input Flows.
In this section I introduce some basic graph terminology and show how input-use matrices can
be usefully described by these concepts. In particular, I introduce the notion of a degree sequence of
a graph10 and exploit it to characterize connectivity in inter-sectoral trade. Throughout I map these
concepts to data from US input-use matrices. Namely I use benchmark detailed input-use tables
available through the B.E.A.. The Figure below depicts the 1997 input-use matrix. It follows the
1997 NAICS de�nitions and yields a �ne disaggregation of inter-sectoral trade at the 4-6 digit NAICS
10Following much of the literature I use the terms graph and network interchangibly.
11

de�nition level11. The use table gives the 1997 value (in millions of dollars), at producers�prices,
of each commodity used as an intermediate input in the production each industry. I drop import,
scrap, government industry and government demand, household and inventory valuation data. With
this I get a detailed input-use matrix of dimension 471� 471 sectors12.
Real Estate Subgraph
(NAICS 531000)
Figure 3: On the l.h.s. is the detailed input-use matrix for the US economy in 1997 (Source:BEA). Each dot corresponds to an input transaction from row (supplying) sector i to column
(demanding) sector j. Only transactions above 1% of the total input purchases of a sector are
displayed. On the r.h.s is a graph centered around the row sector Real estate (NAICS code 531000)
where for each dot on the corresponding row of the l.h.s. matrix I draw a directed arc.
On the left hand side of Figure 3 is a snapshot of the 1997 input-use matrix, dots corresponding to
input-supply relations from row-sector i to column-sector j, provided sector i supplies 1% or more of
the total input purchases of sector j. This is a sparse matrix in that the number of non-zero elements
is small relative to the number of possible entries in the input-use matrix (under one tenth). This is
as expected: at very �ne disaggregation levels, most sectoral production processes are highly speci�c
with respect to the intermediate inputs used. Thus, these limited substitution possibilities translate
into sparse columns.
11To strengthen my analysis I also characterize the connectivity structure of every detailed input-use matrix available
from 1972 to 1992. These are available on a 5 year interval and are based on a SIC classi�cation, in contrast to the
NAICS system adopted since 1997. While individual sectors are not immediately comparable between the two systems,
the structure of zeros in these matrices - the object of analysis here - will be shown to be remarkably stable.12 I equate commodities with sectors as in the theoretical model where good i is produced exclusively by sector i.
I am thus implicitly assuming that the make table in the input-output is diagonal. The same assumption is made in
Horvath (1998) and Conley and Dupor (2003).
12

However, there are some full rows corresponding to sectors supplying inputs to many other sectors
in the US economy. The right hand side of Figure 3, displays a graph corresponding to one of these
sectoral-hubs: real estate. Indeed, one can ask what are the sectoral labels corresponding to the full
rows in the input-use matrix above. For 1997, ranking rows by the number of non-zero elements
gives, in descending order: wholesale trade, management of companies, truck transportation, electric
power generation and distribution, real estate, advertising, iron and steel mills, paperboard and
container manufacturing, plastic plumbing and �xtures, petroleum re�ning, telecommunications,
semiconductors and architectural and engineering services. These can be termed general purpose
sectors in that their output serves as a necessary input to production in almost all of the sectors of
a modern economy13. Recalling the discussion in Section 2, the existence of these star-like sectors
will be key in that it opens the possibility of a non-trivial propagation mechanism working through
the hubs of an economy.
I now map this data on inter-sectoral input trade into standard graph theoretical notation. First,
let the set of M sectors in an economy give the set of �xed labels for the vertex set V := fv1; :::; vMg.
Let E be a subset of the collection of all ordered pairs of vertices fvi; vjg; with vi; vj 2 V . De�ne Eby:
f fvi; vjg 2 V 2 : fvi; vjg 2 E if Sector i supplies Sector jg
That is, the edge set E; is given by an adjacency relation, vi ! vj between elements of the set of
all sectors where I allow re�exivity (a sector can be an input supplier of itself). With the collection
V of sectors and input supply relations E; I de�ne sectoral trade linkages as a directed graph G :
De�nition 3.1. G = (V;E). G is a directed graph (digraph for short) with vertex set V and
edge set E where each element of E is a directed arc from element i to j .
A useful representation of a graph is its adjacency matrix, indicating which of the vertices are
linked (adjacent). This will be a key object in the sections below and is de�ned by:
De�nition 3.2. For a digraph G(V;E) de�ne the adjacency matrix A(G) to be an M � M
matrix. If G is a directed graph de�ne the aij element of A(G) to be 1 if there is a directed edge
from sector i to sector j (i.e. if sector i is a material input supplier of j).
Thus, Figure 3 can be simply taken as the adjacency matrix representation of the 1997 intersec-
toral trade network where vertices are given by sectors and edges are given by input supply relations,
the dots in the matrix; blank cells are the zero entries of the adjacency matrix. Notice that the actual
input use tables provide more information than the directed arc structure. In a graph context the
value of individual sector to sector transactions also provide the weights associated with each edge.
Throughout this paper I will not exploit this information.
13See also the recent work in Jones (2007b) for a similar link between full rows of input-use matrices and general
purpose sectors.
13

I focus instead on the extent of heterogeneity across sectors as given by two simple count measures:
the number of di¤erent inputs a sector demands in order to produce- as measured by the columns
sums of the adjacency matrix A(G) - and the number of di¤erent sectors a sector supplies inputs
to - as measured by the row sums of A(G): These count measures can be mapped directly in two
graphical objects, namely the indegree and outdegree sequences of an intersectoral graph G:
De�nition 3.3. The in-degree dini of a vertex vi 2 V is given by the cardinality of the set
fvj : vi ! vjg: The in-degree sequence of a graph G(V;E) is given by fdin1 ; :::; dinMg:.
Figure 4 below, displays the empirical density of sectoral indegrees for every detailed input-use
matrix available since 1972. I de�ne the indegree of a sector i as the number of distinct input-
demand transactions that exceed 1% of the total input purchases of that sector. Though arbitrary,
this counting convention seems necessary as there is no way of distinguishing between, say, an input
transaction from sector i to j in the order 10 million dollars and an input transaction from sector
k to j two orders of magnitude above. Both get counted as one demand link of sector j. By only
counting as links input transactions above 1% of a sector�s total purchases, I am discarding very small
transactions between sectors and focusing on the main components of the bill of goods necessary to
the production of any given sector. Indeed, following this threshold rule, I account for 80% of the
total value of intermediate input trade in the US economy in 1997. A similar number obtains for all
the other years considered.
0 5 10 15 20 25 30 35 40 450
0.01
0.02
0.03
0.04
0.05
0.06
0.07
0.08
Sector Indegree
Empi
rical
Den
sity
0 10 20 30 40 500
0.01
0.02
0.03
0.04
0.05
0.06
0.07
0.08
Sector Indegree
Empi
rical
Den
sity
1997 19721977198219871992
Figure 4: Empirical density of sectoral indegrees. Only input demand transactions above 1% of the
demanding sector�s total input purchases are counted. On the l.h.s. is the indegree density for the
1997 detailed input-use matrix; on the r.h.s. are the empirical densities for the detailed input-use
matrices from 1972 to 1992. Source: B.E.A..
14

The demand side picture that emerges from Figure 4 is the following: the average sector in the US
economy procures a non-trivial amount of inputs from only a small number of sectors (' 20) whenproducing its good and sectors do not di¤er much along this demand margin. In other words, the
average indegree is small relative to the total number of sectors and most sectors have an indegree
that is close to the average indegree. Henceforth I�ll dub this feature as homogeneity along the
extensive margin of sectoral demand. This is to be contrasted with the extreme heterogeneity found
along the supply side to which I now turn.
De�nition 3.4. The out-degree douti
of a vertex vi 2 V is given by the cardinality of the set
fvi : vi ! vjg: The out-degree sequence of a graph G(V;E) is given by fdout1 ; :::; doutM g.
Figure 5 documents the heterogeneity in sectoral supply linkages by plotting the empirical out-
degree distribution in the input-use data where again I use the 1% threshold to de�ne a link. It gives
a log-log rank-size plot constructed as follows: �rst, rank all sectors according to the total number
of sectors they supply inputs to. Now plot the log of the out-degree of each sector (in the x-axis)
against its log rank (in the y-axis). To interpret the plot it is useful to notice the following: if I
rank sectors then, by de�nition, there are i sectors that supply inputs to a number of sectors that
is greater or equal than that of the ith�largest sector. Thus dividing the sector�s rank i by the totalnumber of sectors (M) gives the fraction of sectors larger than i. Figure 5 gives just this: a log-log
plot of the empirical counter-cumulative distribution of the outdegrees, or the probability, P (k); that
a randomly selected sector supplies inputs to k or more sectors.
100 101 102 103103
102
101
100
Sector Outdegree
Empi
rical
CC
DF
103 102 101 100103
102
101
100
Sector Outdegree
Empi
rical
CC
DF
Figure 5: Counter-cumulative outdegree distribution from input-use detailed tables. Only input
demand transactions above 1% of the demanding sector�s total input purchases are counted. On
l.h.s is the 1997 data. The r.h.s. displays 1972, 1977, 1982 and 1992 data where I normalize the
sectoral outdegree douti by the total number of sectors in each year. Source: BEA.
15

Given that every input-use matrix, from 1972 through 1992 di¤ers slightly in its dimension (i.e.
in the number of sectors considered), for each sector and for every year through 1992, I normalize
sectoral outdegrees by the total number of sectors in the input-use matrix. This enables me to
compare features of the distributions across di¤erent input-use matrices by standardizing the x-axis
in the r.h.s of Figure 5.
The apparent linearity in the tail of the outdegree distribution in log scales is usually associated
with a power law distribution. To see this formally, let P (k) =PMk0=k pk0 be the countercumulative
distribution of outdegrees, i.e. the probability that a sector selected at random from the population
supplies to k or more sectors. We say that the number of sectors supplied (i.e. the outdegree),
k, follows a power law distribution if, the p.d.f. pk (giving the frequency of sectors that supply to
exactly k sectors in the economy) is given by:
pk = ck�� for � > 1, and k integer, k � 1
where c is a positive constant (from normalization) and � is the tail index: Well-known properties
of this distribution are that for 2 � � < 3; k has diverging second (and above) moments14 while
for 1 < � < 2; k will have diverging mean as well (see Newman, 2003 and 2005 and Li et. al.,
2006 for useful reviews and references therein). Given this expression for p(k) and taking M to be
large enough so that we can approximate the sum by an integral, the out-degree distribution yields
P (k) = c0k��+1, where c0 is another constant. Now taking logs on both sides gives:
logP (k) = log c0 � (� � 1) log k (13)
yielding a linear relation between the log of the counter-cumulative distribution and the log of a
sector�s out-degree. Further, an estimate on the value of the tail parameter, �, can be obtained by
running a simple least squares regression of the empirical log-CCDF on the log-outdegree sequence
(or its normalized counterpart). Table 1 below shows the OLS estimates b� for the right tail of thedistribution (i.e. using all observations on or above the average degree) obtained for every year
alongside with standard errors and the corresponding R2:
1972 1977 1982 1987 1992 1997b� 2.073 2.118 2.092 2.056 2.110 2.104
s.e. 0.041 0.073 0.039 0.043 0.035 0.049
R2 0.936 0.907 0.947 0.940 0.958 0.931
Table 1: Least squares estimates of b� in equation (13).Only the right tail of thecounter-cumulative distribution of outdegrees in Figure 5 is used for estimation.
14Though in any �nite sample a �nite variance can be computed, what this means is that the variance diverges to
+1 as the total number of sectors grows larger.
16

The straight lines in Figure 5 show the OLS �t implied by b� = 2:1. While the usual caveats andpitfalls associated to OLS tail estimates apply15, the evidence points to an average value of b� ' 2:1that is remarkably stable across years. Notice that from the discussion above, this value of the tail
parameter implies a strong fat tailed behavior where the variance is diverging with the number of
sectors. This can be taken as a parametric characterization of a feature of input-use matrices already
remarked in Horvath (1998) and discussed at the beginning of this section: as we disaggregate into
�ner de�nition of sectoral technologies, large input-supplying sectors do not vanish. In other words,
at the most disaggregated level of sectoral input trade, the distribution of input-suppy links is fat
tailed. The power law case reported for the 1% count rule can be seen as one particularly convenient
parameterization of this heterogeneity16.
4. Representing Intersectoral Input Flows as Networks
According to the analysis of the previous section one can begin to characterize the observed
intersectoral input-trade pattern as a network. This subsection shows how to incorporate these
network features in a model with Cobb-Douglas sectoral production functions. The analysis proceeds
by �rst �nding a way to incorporate the zeros usefully and then, following the characterization data,
imposing homogeneity across sectors while input demanders and focusing on the implications of
heterogeneity of sectors in their role as input suppliers.
4.1. Input-Output Matrices as Networks. In a multi-sector context, explicitly accountingfor �ows of inputs from one sector to another entails specifying both a list of intermediate inputs
needed for the production of any given sector and the intensity of use of each particular intermediate
input in that list. For the modeller this means not only specifying the cost shares of intermediate
inputs for a sectoral production function, but also setting to zero these parameters when a particular
input is not required for the production that good. This is summarized by the input-use matrix
de�ned as:
De�nition 4.1.1. The input-use matrix, �, is an M �M matrix with typical element ij � 0.The jth column sum of � gives the degree of returns to scale in material inputs for sector j:
j =MXi=1
ij
where j < 1, such that the M �M matrix (I � �)�1 is well de�ned.15See, for example, the discussion in Gabaix and Ioannides (2004) or in Embrechts et al (1997). Brock (1999),
Mitzenmacher (2003) and Durlauf (2005) provide further discussion on the di¢ culty of identifying power laws in data.16Sensitivity results for other count rules to be added.
17

This de�nition simply states that the class of multisector models under consideration in this
paper - and in most of the literature - imposes weak restrictions on the class of admissible input use-
matrices. The only restriction is to insist that any sector in a M -sector economy exhibits decreasing
returns to scale in material inputs, which translates to a strict unit bound on the column sums of
the input-use matrix, �. This in turn ensures existence of (I ��)�1, the Leontie¤ inverse17. Notice,in particular, that the modeller can introduce sparseness in � - zeros in a matrix of cost shares - at
will as long as this column-sum condition is met.
The next Lemma is key to the paper in that it introduces a simple factorization of the input-use
matrix � that will be used throughout.
Lemma 4.1.2. De�ne a family of input-use matrices �(G) given by:
�(G) = A(G)D
where A(G) is a binary adjacency matrix representation of the intersectoral trade digraph, G,
and D is a diagonal matrix with a typical element Dkk = kdink, where k < 1 and d
ink is the number
of sectors from which sector i purchases inputs. Then, for any M and any G; the columns sums of
�(G) are given by k < 1:
The proof of the last statement in the Lemma follows immediately by construction of �(G).
This Lemma o¤ers a decomposition of the input-use matrix � into the product of two square
M�dimensional: a binary matrix A(G), giving the structure of connectivity in the economy byde�ning who trades with whom and a diagonal matrix D setting the scale of input transactions
between two sectors by de�ning the level of the cost shares for the non-zero elements of �(G). Notice
that Lemma 4.1.2. introduces a restriction on the class of admissible matrices: all non-zero elements
of a given column of the input-use matrix are the same, as announced in Assumption 2.2..This is
tantamount to imposing a symmetrical role for all the necessary inputs for a given sector, as the
individual cost shares will be the same.
For what follows, this simpli�es considerably the description of a sectoral technology. I need
only to specify two objects: a binary matrix announcing who supplies whom and a vector giving
the returns to scale in material inputs for each sector. The individual cost shares are then given
immediately by Lemma 4.1.2..I now focus on the problem of generating connectivity structures;
A(G); that approximate the homogeneous demand, heterogeneous supply of section 3.
4.2. Designing Families of Inter-Sectoral Trade. In this subsection I will be interested ingenerating connectivity structures that can encode the description of large-scale input-use matrices
put forth in Section 3. To achieve this, I derive a sampling scheme for adjacency matrices A(G)
17 (I � �)�1 exists if every eigenvalue of � is less than one in absolute value. From the Frobenius theory of non-
negative matrices, the maximal eigenvalue of � is bounded above by the largest column sum of �, maxkf kgMk=1; whichis less than one.
18

that will then be used to construct input-use matrices �(A) according to Lemma 4.1.2 above. The
object of analysis is to construct families of random matrices, A; from which individual members -
intersectoral connectivity matrices, A - are drawn. These families of matrices should therefore be
seen as a data generating process for the lists of intermediate inputs necessary for each sector or,
put simply, families of intersectoral trade structures.
Below, I show how to specify these families of intersectoral trade according to three parameters:
a parameter controlling the dimension of the problem - given by the number of sectors M ; a demand
side parameter e; controlling the average connectivity in the economy - given by the number of
inputs an average sector demands - and a supply side parameter �, controlling the heterogeneity
across sectors in their role of input-suppliers.
To construct these families A(M; e; �) I use elements from the theory of random graphs. A
random directed graph consists of family of directed graphs G, indexed by the cardinality of thevertex set (M) and a probability distribution over G. These constructions allow for statements,
under some carefully chosen probability measure, about the probability of some particular property
for anyM�vertex digraph18. In particular, I�ll make use of a particularly simple and useful constructrecently introduced in the theory of random graphs. What follows is a simple digraph extension
of Chung and Lu�s (2002, 2006) model of undirected random graphs with given expected degree
sequences.
Intuitively, I will be considering realizations of input-supply links (edge sets) in the following way:
for a given number of sectors M; associate to the collection of all ordered pairs of sectors/vertices
fvi; vjg; vi; vj 2 V an array of independent, Bernoulli random variables, Xij ; taking values 1 or 0 withprobability pij and 1� pij respectively. Finally, de�ne a realization of the connectivity structure of
intersectoral trade as an edge set E such that fvi; vjg is an element of the edge set E, if Xij = 1. Inthis way, one can compute the expected outdegree of any sector as E(douti ) = E(
Pj Xij): =
Pj pij ,
given independent realizations of each supply-to link. Similarly the expected in-degree of a sector
can be computed as E(dini ) = E(PiXij): =
Pi pij :
For this, for every M; associate a weight sequence e := fe1; :::; eMg to the collection of sectoral
labels, such that ei 2 [0;M ] and the average weight isPMk=1 ekM : Now, for each possible ordered pair
of sectors fvi; vjg 2 V 2 de�ne the probability of having a directed arc from vi �! vj as
pij:=
eiM, 8j 2 V (14)
This encodes: i) a sector with higher weight, ei; will have a higher probability to supply every
sector in the economy and ii) for any given j; the probability of sector i being its input supplier
depends only on the label of sector i and is thus not responsive to the label of j19. These are a
18The classical binomial model of Erdos and Renyi (see Bollobas (2001) for a texbook treatment) is the most
commonly used construction for random graphs but there are many alternatives to this (see Durret, 2006, Newman,
2003, Bollobas and Riordan, 2003, or Chung and Lu, 2006 ).19Chung and Lu�s (2002, 2006) original model for undirected graphs gives pij =
eiejPMk=1
ekso that pij = pji for all i; j.
19

strong assumptions in that describing whether an input trade relationship exists or not, both the
identity of the supplying and that of demanding sector -label j� should matter. E¤ectively this is
reducing the problem of how to build theoretical counterparts to input-output matrices to a simpler
problem of distinguishing sectors by how likely they are to be general purpose suppliers (i.e. sectors
that have an ei close to M). This is achieved at the cost of shutting down (at least in expectation)
heterogeneity in the number of links along the demand side. The following Lemma elucidates further
this construction and its implications:
Lemma 4.2.1. For every M sector economy, associate a weight sequence e := fe1; :::; eMg to the
collection of sectoral labels, such that ei 2 [0;M ] and de�ne a realization of the intersectoral tradegraph G as the realization of independent binary random variables Xij 2 f0; 1g, i; j = 1; :::M where
Pr(Xij = 1) = pij given by [14]. Then,
i) for any M , the expected out-degree of a sector will be given by:
E (douti ) =Xj
pij= ei, i = 1 ; :::;M (15)
ii) for any realization of the intersectoral trade graph G and for any sector i;
if ei > logM , then its actual out-degree douti will almost surely satisfy��douti � ei�� � 2 logM
otherwise if ei � logM , then douti almost surely satis�es
��douti � ei�� � 2pei logM
iii) for any sector i; its E(dini ) expected indegree is given by:
E(dini ) =Xi
pij =
Pi eiM
;8i (16)
Lemma 4.2.1 states that intersectoral connectivity structures drawn from the sampling scheme
above will yield, on average, as much heterogeneity in sectors along their supply dimension as the
modeller feeds it through the weights feigMi=1. Conversely it will generate homogeneity in terms of thenumber of sectors a randomly chosen sector buys inputs from, i.e. it yields sectors that will be alike
in terms of the number of inputs they demand. Part ii) of the Lemma states that actual (sampled)
sequences of sectoral outdegrees will concentrate around its expected value and o¤ers bounds that
are tight for the larger sectors (in term of outdegrees).
When studying inter-sectoral supply links this symmetry is uncalled for: the fact that sector i has a high probability
of supplying to j should not imply the converse.
20

What is left is to understand is how to specify the weight sequence feigMi=1. From the discussion
above notice that I am more likely to link vertices with a high expected degree, i.e. with a higher
relative weight. In the remainder of this subsection, following Chung, Lu and Vu (2003) and Chung
and Lu (2006) I construct weights ei such that the expected outdegree sequence follows an exact
power law sequence, this in order to capture the heterogeneity in sectoral supply linkages documented
in Section 3.
De�nition 4.2.2. For every M sector economy de�ne a realization of the intersectoral trade
graph G as the realization of independent binary random variables Xij 2 f0; 1g, i; j = 1; :::M where
Pr(Xij = 1) = pij given by [14] and the weight sequence is given by
ei = ci� 1��1 for 1 � i �M and � > 2 (17)
and
c =� � 2� � 1eM
1��1 (18)
To see how this parameterization for link probabilities implies a power law sequence for expected
out-degrees, notice that I can use expression (17) to solve for i and get:
i _ E(douti )��+1
(19)
Now suppose I rank sectors according to the expected number of sectors they supply inputs to
E(douti ). The expression in (17) implies that they will be ranked according to i: i = 1 giving the
largest sector, i = 2 the second largest and so forth. Notice also that, by de�nition there are i sectors
that, in expectation, supply to at least the same number of sectors supplied by the ith�largest sector.Thus a sector�s rank i is proportional to the fraction of sectors larger than i. What expression (19)
is stating is that the log of this fraction will scale linearly with the log expected out-degree of sector
i; with parameter � controlling the scaling behavior. Thus, the expected outdegree sequence is an
exact power law sequence20. Combined with result ii) in Lemma 4.2.1., this implies that sampling
intersectoral trade structures with link probabilities formed according to (14), (17) and (18) will
generate actual sectoral out-degrees sequences that concentrate around a power law sequence where
� is the tail parameter21. I now summarize the sampling procedure of intersectoral trade structures
constructed in this section by de�ning the following family of binary matrices:20This is a deterministic sequence with power-law like (or scaling) behavior in that it gives a �nite sequence of real
numbers, E(dout1 ) � E(dout2 ) � ::: � E(doutM ), such that i = c�E(douti )
��'where c is a constant and ' is called the
scaling index. See Li et al (2006) for a useful discussion on scaling sequences vs. power law distributions.21Notice also that the tail parameter � only controls the shape of the outdegree distribution - how skewed the
distribution will be - but not the average degree, which is a free parameter, e. That is, it is possible to show that the
average weight,PMi=1 eiM
' e; under parameterization (17).To see this notice thatPMi eiM
= 1M
��2��1eM
1��1
PMi=1 i
� 1��1 '
1M
��2��1eM
1��1
MZ1
i� 1��1 di = e� o(1)
21

De�nition 4.2.3. Fix a triplet of parameters (M; e; �). Let A(M; e; �) de�ne a family of
intersectoral trade matrices, elements of which are M �M binary matrices A, with entries Aij equal
to 1 with probability pij given by (14), (17) and (18) and zero otherwise.
This is simply the adjacency matrix representation of the intersectoral trade graphs generated
by the sampling scheme of Lemma 4.2.2. To understand what these matrices imply in terms of
the discussion on connectivity properties of Section 3, Figure 6 plots the model-based equivalent of
Figures 4 and 5, the indegree density and the outdegree CCDF for a 500 sector economy.
5 10 15 20 25 30 350
0.02
0.04
0.06
0.08
0.1
0.12
0.14
0.16
Sector Indegree
Em
piri
cal D
ensi
ty
100
101
102
103
103
102
101
100
Sector Outdegree
CCD
F
ζ=2.1 ζ=2.1
Figure 6: Empirical indegree density (l.h.s.) and outdegree CCDF (r.h.s.) for 30 intersectoraltrade structures drawn at random from A(M; e; �) for M = 500, e = 20, � = 2:1:
More speci�cally, Figure 6 presents the sectoral demand-supply side breakdown for thirty A
matrices drawn at random from a family of intersectoral digraphs, A(M; e; �) where I have picked
the following parametrization: M is given by a 500 sector economy, where the average number of
inputs needed per sector, e; is set at 20; and the parameter controlling heterogeneity of sectors
along the supply side, �, is set at 2:1. This parameterization is based on the corresponding objects
computed from the B.E.A. detailed input-use matrices in Section 3.
While individual realizations of A are random objects, thus di¤ering in the exact placement of
zeros, the indegree and outdegree sequences implied by each intersectoral trade structure yield similar
patterns. In other words, row and column sums will not di¤er much across realizations. By design,
and as predicted theoretically by Lemma 4.2.1., each element of the family A(M; e; �); retains the
features noted in Section 3: homogeneity along the demand side - for any member of a family A,sectoral indegrees concentrate along the speci�ed average degree, e - and heterogeneity along the
supply side, where the number of sectors any given sector supplies can di¤er by orders of magnitude.
22

Namely, the outdegree sequences implied by realizations of A display fat-tails in the form of a power
law- as instructed by De�nition 4.2.2.
Notice that according to De�nition 4.2.3. I can model formally the following thought experiment.
Fix a number of sectors,M; and de�ne a typical production technology by setting the average number
of inputs (e) a sector needs, in order to produce its output. Now entertain two di¤erent values of
the tail parameter governing heterogeneity across sectors in their role as input suppliers, �1 and �2such that �1 < �2. What this yields is two economies where sectoral production technologies di¤er
in their degree of diversi�cation. Thus �1 economies will be less diversi�ed in that more mass at the
tail implies that a greater number of sectors rely on the same general purpose inputs. Conversely, �2economies, by having more mass at the center of the distribution of input supply links, will be more
diversi�ed: there will be a smaller number of hub-like sectors connecting all sectors in the economy
and a greater number of specialized input suppliers, each supplying inputs to a smaller fraction of
sectors. This intuition is key to interpret the results in the rest of the paper.
Finally, I de�ne a key matrix for the results that follow: the expected adjacency matrix, E(A)
for a family of random connectivity matrices A(M; e; �).
De�nition 4.2.4. The expected value of the adjacency matrix of a family of intersectoral tradestructures A(M; e; �), denoted E[A(G)], is an M�M matrix whose ij entry is given by E[Aij(G)] =
pij with pij given by (14), (17) and (18):
4.3. Key Results. This subsection uses the objects constructed in the previous two subsectionsto characterize the key object for the class of multi-sectoral models under consideration: the Leontie¤
inverse (IM � �)�1. Once this is derived I show, analytically, how the aggregate volatility statisticcan be expressed as a function of , the degree of returns to scale in material inputs, M , the number
of sectors and �, the tail parameter controlling the heterogeneity of the distribution of input-supply
links for any member of the family connectivity matrices A(M; e; �).
I �rst focus on a simpler exercise: assume A is deterministic and given by the expected adjacency
matrix of a family of intersectoral trade structures E(A). I will then show how the characterization
of the Leontie¤ inverse matrix and the resulting aggregate volatility statistic generalizes to any A
sampled from a family A(M; e; �). Thus, to begin, the next Lemma shows how one can go from this
expected adjacency matrix to an input-use matrix � that meets the column sum requirements of
De�nition 4.1.1..
Lemma 4.3.1. Let the degree of returns to scale in material inputs be equal across sectors, j = < 1; 8j = 1; :::;M . Then the M �M matrix
�(A) � E[(A(G))D ] =
eE(A(G))
satis�es the column sums requirement for admissible input-use matrices in De�nition 4.1.1.
23

The Lemma is trivially proven by noticing that the column sums of E(A(G)) are given byMPi=1
ei=M;
which is the de�nition of e, the expected average degree. Thus D reduced to e :IM . Further � has
all column sums equal to : < 1 and, by the same reasoning of Lemma 4.1.2.,�IM � �
��1is well
de�ned.
Henceforth I will refer to this matrix �, as the expected input-use matrix of a multisector economy.
As the Lemma states it can be seen as an expectation over the families of input-use matrices de�ned
by the decomposition in Lemma 4.1.2. and the construction in Lemma 4.2.3..The attractiveness of
this, admittedly, very particular case resides in the fact that a matrix � thus constructed is a rank
one matrix- all columns are equal. Thus we can decompose it into the product of two vectors. In
particular let � be an M � 1 vector with typical element eiPMi=1 ei
; and let 1M is the unit vector of
dimension M � 1. It then follows that:� = �10M
This fact is useful in that we can derive a simple expression for the key object in multi-sectoral
models:.
Proposition 4.3.2. The Leontie¤ inverse of the expected input use matrix,�IM � �
��1is given
by �IM � �
��1= IM +
1� �10M
where IM is the M �M identity matrix, � is a M � 1 vector with typical element eiPMi=1 ei
and 1Mis the unit vector of dimension M � 1.
The idea of representing the Leontie¤ inverses as an identity plus a rank one matrix is already
present in Horvath (1998) and Dupor (1999). In fact, the class of input-use matrices considered in
Dupor (1999) is given by b�10M and restricting b� =�MM2 ; :::;
MM2
�and the alternative provided by
Horvath (1998) is simply e�10 where e� is an M�dimensional vector where N elements are given
by MMN and the remaining M �N entries are �xed to zero22.Thus, following the discussion in Section
2, Horvath, and Dupor�s settings can be seen as particular subclasses of a general class of input-use
matrices given by �; where the vector � is �xed at ratio of the outdegree of each sector to the volume
of input-supply links in the economy: b� and e� are exactly that object for a very particular bi-regulardigraph in Horvath (1998) and for a complete digraph in Dupor (1998).
The following proposition describes what changes when instead of these simple structures for
intersectoral trade, I posit � to be given by the expected input-use matrix of A(M; e; �).
22Recall that in Horvath (1998) N is the number of sectors supplying inputs to all M sectors and M � N is the
number of sectors dedicated solely to �nal good production. See the proof of Proposition 2.1. for further details.
24

Proposition 4.3.3. Fix a triplet of parameters (M; e; �): Assume that the input-use matrix is
given by the expected input-use matrix � and that sectoral volatility �2j = �2 for all sectors j. Then,
for a static M�sector economy (8) the aggregate volatility of equilibrium output, �2Y (�) is given by:
�2Y (�) =
8<: �1(�)�
1�
�2�2
M + 1M �
2 if � > 3
�2(�)�
1�
�2 �1M
� 2��4��1 �2 + 1
M �2 if � 2 (2; 3)
where the terms �1(�) =(��2)2
(��1)(��3) and �2(�) =(��2)2
(��1)(3��) are positive constants given a �:
In both regions of the tail parameter space; the �rst two terms of the expressions can be taken as
constants given �xed parameters and �. However, the scaling of the aggregate volatility statistic
with M is dependent which region of the parameter space � is set. In particular, Proposition 4.3.3.
states that for an average input-use matrix,�, aggregate volatility will depend on the tail of the size
distribution of input supply links.
Thus, for thin tailed distributions of sectoral outdegrees � > 3, aggregate volatility scales with
the usual term of order O(1=M). This means that the discussion in Section 2 regarding the decay
rate in the special case of complete network structures assumed by Dupor, applies also to the current
context. Intuitively, in economies with a large number of sectors that do not di¤er much in their
role as input suppliers, aggregate volatility will be negligible.
However, once we consider the fat-tailed region for � 2 (2; 3) the decay behavior is altered: theaggregate volatility statistic now decays with M at a rate that is lowered signi�cantly as we consider
average input use matrices from more heterogeneous outdegree economies:Namely, Proposition 4.3.3.
yields an analytical expression where the rate of decay in the volatility of aggregate output depends
negatively on the degree of fat-tailness in the distribution of sectoral input-supply links. To see this
notice that for � 2 (2; 3); the �rst term in the expression decays with M� where � � 2��4��1 2 (0; 1) :
This implies that the �rst term of the expression dictates the rate of convergence to zero. Namely, as
� approaches its lower bound of 2; aggregate volatility, �2Y (�) will converge to zero arbitrarily slower.
Taking, for example, the value of � of 2.1. estimated in Section 3, yields a much slower decay of
order 6pM or �2Y (�) _ �2
6pM. To have an idea of the magnitudes involved, this means that as I move
from, say, a �ve sector economy to a �ve hundred sector economy I expect to �nd only a two-fold
decrease in aggregate volatility. Thus, strong heterogeneity across input-supplying sectors opens
the possibility of generating non-negligible aggregate �uctuations even in large scale multi-sectoral
contexts23.
However, the result in Proposition 4.3.4. is special in that it depends on a very particular input-
use matrix: I am �xing the input-use matrix to be the expected input use matrix generated by a
family A. I now show that it is possible to generalize these �ndings to any matrix �(A) drawn
23Notice also that Horvath (1998) conjecture of apM decay in aggregate volatility is obtained by �xing � at a very
particular point: � = 2:333:
25

from A. First, I show that for any such matrix, the basic result concerning the Leontie¤ inverse
(Proposition 4.3.2) remains true, up to a random matrix with zero column sums. Then, using this
result, I bound the e¤ects that this extra random term might induce on aggregate volatility.
Proposition 4.3.5. Fix a triplet of parameters (M; e; �) and assume thatXi2 �Sj
ij = and that
�2j = �2 for all sectors j = 1; :::;M . For any A(G) sampled from the family of input-use graphs
A(M; e; �); construct the input-use matrix according to Lemma 4.1.2. Then i) for any A(G)
[IM � �(A)]�1= IM+
1� �10M+�
where � is an M �M random matrix with zero column sums. Further, ii) for any A(G) of the
family of input-use graphs A; and � 2 (2; 3) the following is a lower bound for aggregate volatility,�2Y (�); in a static M�sector economy (8) is given by:
�2Y (�) >
8>><>>:��
1�
�2� {
��1(�)
�2
M + 1M �
2 if � > 3�� 1�
�2� {
��2(�)
�1M
� 2��4��1 �2 + 1
M �2 if � 2 (2; 3)
where { is a constant strictly smaller than�
1�
�2and �1(�) and �2(�) are positive constants
given a �.
Part i) of the proposition follows from the observation that one can always decompose any matrix
�(A) as the sum of � + (�(A) � �): The proof of part i) then follows along the same lines as thatof Proposition 4.3.2., by using results on the inverse of the sum of two matrices. The only obstacle
introduced by the random matrix � is that it induces the presence of a term in the expression for
aggregate volatility that can be potentially be negative and dominate the rate of convergence. Part
ii) of the Proposition states that this scenario can be ruled out. At worse the level of volatility in
aggregates will be smaller than that derived in Proposition 4.3.4. but the rate of decay with M will
be preserved. Hence the discussion following Proposition 4.3.4. applies in its entirety for any matrix
A sampled from a family A(M; e; �).
This characterization of the decay in the volatility of aggregates with the number of sectors is
closely related to results in Gabaix (2005, Proposition 2). As in Gabaix (2005), the fact that shocks
do not average out according to standard law of large numbers arguments is due to heterogeneity at
the level of the underlying production units. In contrast to Gabaix however, this is not the result of
some �rms accounting for a non-trivial share of aggregate output and thus, for a non-trivial share
of aggregate volatility. Rather the argument here is based on the shock conductance implied by the
interlocking of technologies in an economy. In other words, the emphasis here is on propagation
rather than aggregation. These two approaches should therefore be seen as a complementary.
26

In short, and recalling the discussion at the end of the previous subsection, the results in Propo-
sitions 4.3.4. and 4.3.5. can be interpreted as follows. As � approaches its lower bound, sectors in
an M sector economy will increasingly rely on the same general purpose inputs. Thus, considering
economies with less diversi�ed sectoral technologies corresponds to considering draws from connec-
tivity structures with a lower value of �. Conversely, connectivity structures generated by higher
values of � will yield greater technological diversi�cation: sectoral technologies are relatively more
reliant on specialized input-suppliers and less so on common, general purpose, inputs. Therefore,
greater diversi�cation in the form of less reliance on common inputs will yield only loosely coupled
technologies and, as a result, lower aggregate volatility. Less diversi�cation induces strongly coupled
technologies and thus a stronger propagation mechanism24. The next section will show that this
intuition carries through when we move to dynamic settings.
5. Dynamic Multi-Sector Economies
This section recalls a basic multi-sectoral production model, as introduced in Horvath (1998)
and Dupor (1999). This is essentially a multi-sector version of a one-sector Brock-Mirman stochastic
economy, where I make the necessary (and strong) assumptions to solve for the planner�s solution
analytically. More general setups exist, such as Horvath (2000) or the closely related forerunner,
Long and Plosser (1983). These are surely necessary for a careful quanti�cation exercise and are
taken up in section 6. However, for the present purposes of analyzing how di¤erent structures of
input-use imply distinct aggregate behavior, the simplicity of this setup is an asset and will allow
me to extend the results of Section 4 while still addressing the results in Horvath (1998) and Dupor
(1999).
5.1. Setup. A representative agent maximizes her expected discounted log utility from in�nite
vector valued sequences of M distinct goods.
E0
1Xt=0
�t
24 MXj=1
log(Cjt)
35 (20)
where � is a time discount parameter in the (0; 1) interval. Expectation is taken at time zero with
respect to the in�nite sequences of productivity levels in each sector, the only source of uncertainty
in the economy. The production technology for each good/sector j = 1; :::;M uses sector-speci�c
capital and intermediate goods, i.e. production inputs bought from other sectors:
Yjt = ZjtK�jjt
MYi=1
M ijijt (21)
24See Simon and Ando (1961) for a distant forerunner in analyzing the implications of loose vs. strong coupling
across units.
27

where Kjt and Zjt are the, time t; sector j; value of sector speci�c capital stock and its (neutral)
productivity level. Mijt gives the amount of good i used in sector j in period t. Further, de�ne
j =MXi=1
ij
with ij denoting the cost-share of input from sector i in the total expenditure on intermediate
inputs for sector j (allowed to take the value of zero). Again I can arrange the cost shares in a
M �M input-use matrix, �.
I will assume productivity levels for sector j evolving stochastically according to an i.i.d. process,
across sectors and across time, that is
ln(Zjt) = "jt s N(0; 1) (22)
Finally, assume that each sector exhibits decreasing returns to scale:
�j + j < 1; 8j and (23)
�j ; j � 0; 8i;j
and that sector speci�c capital depreciates fully in one period. The last two assumptions are
necessary in order to derive an analytical solution to the Planner�s problem in this economy25.
5.2. The Social Planner�s problem: The de�nition of the social planner�s problem is given
by
De�nition 5.2.1. The Social Planner�s problem is to choose sequences of sector speci�c capi-
tal fKjt+1gj;t, intermediate input fMijtgi;j;t and consumption allocationsfCjtgj;t such that, given avector of time zero capital stocks fKj0gj and a sequence of sectoral productivity levels fZjtgt, thefollowing hold true:
i)fCjtgj;t maximizes the representative consumer expected lifetime utility given by (20)ii) the sectoral resource constraint
Yjt = Cjt +Kjt+1 +MXi=1
Mjit (24)
is satis�ed, sector by sector, for all time periods and where Yjt is given by (21).
Horvath and Dupor show that, under the assumption on technologies and preferences made above,
an analytical solution to the Social Planner�s problem is given by a �rst order vector autoregression:
25Assuming constant returns to scale would imply a stationary solution in growth rates. The characterization below
then applies to the variance of growth rates rather than levels.
28

Proposition 5.2.2 (Horvath, 1998) Given an M � 1 vector of initial capital stocks, k0, thevector sequence of sectoral capital given by:
kt+1= h+ (I��)�10�dkt+(I��)�10"t+1 (25)
solves the Social Planner�s problem, where h is a M � 1 vector of constants (function of time-invariant model parameters), �d is a M �M diagonal matrix with the vector � on its diagonal and
I is the M �M identity matrix.
For a proof, see Horvath�s (1998) appendix where Howard�s policy improvement algorithm is
used to solve the recursive version of the Planner�s Problem above. It is also easy to show that
the Planner�solution implies a vector sequence of sectoral output di¤ering from expression (25) for
capital only by a constant. Hence all results below for sectoral and aggregate capital apply for output
as well.
As in the simple static economy of Section 2, it is the Leontie¤ inverse (I��)�1 that mediates thepropagation of independent technology shocks at the sectoral level. In this dynamic multisectoral
model it rules not only the levels of capital and output but also the dynamics of these variables
and hence of their aggregates. Now, in order to characterize the second moment properties of this
economy I study the spectral density function for sectoral capital induced by expression (25) above.
This is possible since, under the assumptions for technology made above, the fktgt sequence (25)is stationary and thus admits an in�nite moving average representation which, in turn, implies a
frequency domain representation.
Proposition 5.2.3. (Horvath, 1998) Under the assumptions above the population spectrumfor sectoral output, ki; for every sector i = 1; :::;M , at frequency ! is given by
Sk(!):= (2�)�1(I � �de�i! � �0)�1(I � �dei! � �)�1 (26)
Furthermore, given an M �1 vector w, of aggregation weights for log-aggregate capital stock, thespectrum for aggregate capital at frequency ! is given by
S(!):=w�Sk(!)w (27)
The spectral density function is a useful object in that it provides a complete characterization
of the autocovariance function for the average log of sectoral capital. Notice that by setting the
elements of w to be equal and given by 1=M , S(!) is gives the dynamic counterpart to the aggregate
statistic of the static model of Section 2; expression (9). In the next subsection I characterize the
decay of the univariate spectral density expression (27) as I increase the level of disaggregation in
these multisector models.
29

5.3. Characterizing the Decay of the Spectral Density. This subsection o¤ers the dynamiccounterpart to the results obtained in Section 4.3. I use the expression for the aggregate spectral
density given in (26) and (27). The steps involved are the same as before: �rst I characterize the
decay behavior of the aggregate spectral density with M for the particular case where � = � and
then show that the resulting characterization extends for any �(A) where A is drawn from the family
of matrices A(M; e; �) and �(A) is formed according to Lemma 4.1.2.:
Thus, letting � be given by the expected input-use matrix, � expression [27] yields:
Proposition 5.3.1. For �xed � and ; aggregation weights w= (1=M)1M and � = �, the
spectral density for aggregate capital at frequency ! is given by:
S(!;�) = S(!;�) =1
2�
a(!)
b(!)
�1
M(b(!)� 2) + 2�1(�)
1
M
�if � > 3
and
S(!;�) =1
2�
a(!)
b(!)
"1
M(b(!)� 2) + 2�2(�)
�1
M
� 2��4��1#
if � 2 (2; 3)
with a(!) = 1(1��ei!� )(1��e�i!� ) , b(!) = (1��e
i!)(1��e�i!)., �1(�) = (��2)2(��1)(��3) and �2(�) =
(��2)2(��1)(3��) .
As in Proposition 4.3.3. the expression for the volatility of aggregates di¤ers according to the
tail parameter governing heterogeneity across sectors in their role as input suppliers. Thus for
� > 3, i.e. thin tail distributions, or diversi�ed economies, the expression again recovers the strong
diversi�cation of shocks argument given in Dupor. Volatility in aggregate variables decays at rateM
as we expand the number of sectors, yielding negligible aggregate volatility for any moderate level of
disaggregation. Conversely, for economies where large input-supplying hubs form the basis for input
trade �ows, this decay rate is slowed down arbitrarily as � approaches its lower bound. The more
every sectoral technology in an economy relies on the same few key technologies the slower the law
of large numbers applies.
More precisely, what the expression in the fat-tailed case is stating is the following. Let f�Mg1M=1
be the sequence of expected input-use matrices given by the construction of Lemma 4.3.1. with
� 2 (2; 3). Then S(!;�) ! 0 at rate M� for all !, where � � 2��4��1 2 (0; 1_). In this way for a � close
to its lower bound, the law of large numbers is postponed.
This generalizes the results in Horvath (1998) and Dupor (1999). It is an easy exercise to show
that results concerning the scaling of the variance withM , the number of sectors, are the same of the
static model presented in section 2. However as the Proposition makes clear, this scaling now extends
to the autocovariance function. Thus exactly the same decay description applies for persistence of
aggregates in dynamic economies.
As in Section 4, I now extend this characterization for any �(A) where A is drawn from the
family of matrices A(M; e; �) and �(A) is formed according to Lemma 4.1.2.
30

Proposition 5.3.2. For �xed � and ; aggregation weights w = (1=M)1M and for any
�(A) where A is drawn from the family of matrices A(M; e; �) and �(A) is formed according to
Lemma 4.1.2., the spectral density for aggregate capital is bounded below by :
S(!;�(A)) >1
2�
a(!)
b(!)
�(b(!)� 2) 1
M+ �1(�)(
2 � {) 1M
�if � > 3
and
S(!;�(A)) >1
2�
a(!)
b(!)
"(b(!)� 2) 1
M+� 2 � {
��2(�)
�1
M
� 2��4��1#if � 2 (2; 3)
with { < 2, a(!) = 1(1��ei!� )(1��e�i!� ) , b(!) = (1 � �ei!)(1 � �e�i!)., �1(�) =
(��2)2(��1)(��3)
and �2(�) =(��2)2
(��1)(3��) .
Proposition 5.3.2. states that as I consider any realization of �(A) from A(M; e; �) - rather than
its expectation, �; the level of the spectral density for aggregate capital is, at worse, lower at every
frequency, but preserves exactly the same decay behavior with M: What this means is that for any
input-use matrix based on connectivity structures given by A(M; e; �), the link between volatility and
persistence of aggregates and the network structure of the economy remains valid. From a network
perspective, common reliance on a few key input-supplying hubs will induce greater conductance
to shocks in those sectors and this in turn generates less subdued and longer lived responses in
aggregates.
6. Quantitative Explorations in a Network Laboratory
6.1. Setup. I extend the model of section 5 to allow for slow capital depreciation and includelabor as a primary input in the production function of each sector. Accordingly, the representative
agent now derives utility from consumption of the M goods and leisure:
E0
1Xt=0
�t
24 MXj=1
log(Cjt)� Ljt
35 (28)
where Ljt is labor devoted to the production of the jth good. The production technology for each
good j = 1; :::;M combines sector-speci�c capital, labor and intermediate goods in a Cobb-Douglas
fashion:
Yjt = ZjtK�jjt L
'jjt
MYi=1
M ijijt (29)
31

where I now assume constant returns to scale at the sectoral level such that
�j + 'j +MXi=1
ij = 1;8j (30)
Sector-speci�c capital depreciates at rate � :
Kjt+1 = Ijt + (1� �)Kjt (31)
where Ijt is the amount of investment in sector j0s capital at time t. Note that due to the
sector-speci�c nature of capital, the sectoral resource constraints are now:
Yjt = Cjt +Kjt+1 � (1� �)Kjt +
MXi=1
Mjit (32)
I further assume that sector speci�c productivity follows a random walk
ln(Zjt) = ln(Zjt�1) + "jt s N(0; �2j ) (33)
where the sectoral innovations are assumed to be i.i.d. both in the cross section and across time.
The de�nition to the Social Planner�s problem follows along the same lines of De�nition 5.2.1.
above, trivially extended to include the choice of fLjtgj;t and less than full depreciation of capital.As a recent contribution by Foerster, Sarte and Watson (2008) shows, the characterization of the
deterministic steady state of this model is still analytically tractable and a log-linearization around
that steady state yields:
�yt+1 = ��yt +�"t+1 + �"t (34)
where �yt+1 is anM�1 vector of percentage deviations around the sectoral steady state, "t+1 isa vector of sectoral productivity shocks and �;� and � are M �M matrices that depend on model
parameters only.
Finally, in all of the exercises below, I use standard parameter values for calibrations at an
annual frequency. I set �, the time discount factor to 0.96, �, the depreciation rate to 0.06 and
= 1: The calibration of the production function parameters and the variance of productivity
shocks are discussed in further detail in the following subsections.
6.2. The Spectral Density and its Decay. The data generating process for input use
matrices developed in this paper o¤ers a way to model the extensive margin - who trades with whom
- of intersectoral trade. In particular, it enables us to generate arti�cial multisector economies with
strong heterogeneity across sectors in their role as input suppliers, while still imposing homogeneity
in the number of inputs required for production in each sector. However, recalling the decomposition
in Lemma 4.1.2., this was achieved at a cost: the model shuts down heterogeneity along the intensive
margin for any given sector, by imposing that all inputs used in that sector have equal cost shares.
32

In contrast, by looking at the detailed input-use data presented in Section 3, we can observe
that this intensive margin does indeed play a role: sectors mix inputs in di¤erent proportions, thus
relying on some more than others in their production activities. A simple way to gauge the strength
of sectoral input specialization is to compute Gini indices for the columns of input use matrices in
their cost share form (i.e. normalizing by column sums of the input-use matrix). Recall that a Gini
coe¢ cient resides in the unit interval and ranges from 0, implying equal share weights, to 1, implying
complete specialization in one input only. Table 2 reports mean Gini coe¢ cients (and their standard
deviation) for the input-use matrices described in Section 3.
The �rst row of Table 2 shows the mean Gini coe¢ cient that obtains when one includes the zero
elements of the input-use matrix in the computations of the sectoral Gini indexes. All years exhibit a
mean value very close to 1. This is a direct implication of the sparsity of the input-use matrices and
is again explained by the specialization of technologies at this detailed level of analysis: on average
sectors rely only on a small number of inputs. This means that, for any given sector, its input-shares
are concentrated in a small fraction of the population of sectoral technologies. The second row of
Table 2 shows the result of computing sectoral Gini indexes only taking into account entries with
strictly positive shares. It measures the dispersion of input shares for inputs actually used in a
typical 4 digit sector. While less extreme than the �rst row, there is also some specialization within
the inputs actually used: sectoral technologies rely on some inputs more than others.
1972 1977 1982 1987 1992 1997
Gini for Columns 0:97(0:02) 0:96(0:03) 0:97(0:02) 0:95(0:04) 0:96(0:03) 0:95(0:03)
Gini for Inputs Used 0:35(0:16) 0:36(0:14) 0:34(0:15) 0:33(0:18) 0:31(0:16) 0:34(0:17)
Table 2: Gini coe¢ cients are computed for each column/sector j of input share matrices, withtypical element ij . For each j, Gj = 1=(2 jM
2)Pi
Pk j ij � kj j where j is the average
intermediate input share in sector j. The �rst line displays the mean of the sectoral Gini
coe¢ cients and its standard deviation using all the column elements (including zeros). The second
line displays the same statistic computed with the non-zero elements of each column.
The fact that the model for input-use matrices cannot generate such heterogeneity in cost shares
might therefore be biasing the results. Notice that a priori it is not clear what the direction of
this bias should be. If all sectors rely relatively more on the same input then aggregate volatility
might well be higher than the one predicted by the model above. Conversely, if di¤erent sectors
rely heavily on di¤erent inputs, the model above should be overpredicting aggregate volatility. It is
therefore important to evaluate whether this strong restriction is biasing the results on the volatility
of aggregates.
To this e¤ect, I simulate the model implied spectral density of aggregate growth rates by gen-
erating input-use matrices according to the construction in Section 4.2.. Thus, I will be drawing
33

connectivity structures from families of matrices A(M; e; �) and then constructing input-use matri-
ces according to Lemma 4.1.2.. Speci�cally, the simulations below trace the spectral density for an
economy with 523 sectors (M = 523) where the average sector demands inputs from twenty other
sectors (e = 21). Given the power law characterization in Section 3, I choose a tail parameter of
� = 2:1 to control heterogeneity across input-supplying sectors. As stated above there are constant
returns to scale for all sectors, and I further assume thatPMi=1 ij = 0:5 and �j = 0:2 for all sectors.
The aggregation vector w is constructed from the model-implied steady state shares of sectoral gross
output. I repeat this procedure 100 times and report 90% con�dence bands for the simulated spectral
density. I then compare with the spectrum obtained by using the 1977 detailed IO data26, on which
the parameters of A are based. Throughout this section I keep the standard deviation of the TFP
innovation equal to 1.
0 0 .5 1 1 .50 .0 1
0 .0 15
0 .0 2
0 .0 25
0 .0 3
0 .0 35
0 .0 4
Frequenc y (w )
Spec
trum
of A
ggre
gate
Gro
wth
Rat
es
Me d ian Simu la tio n95% Er ro r Band5% Erro r Band1977 D a ta
Figure 7: Data and model-implied spectral densities.
Figure 7 displays the resulting spectral densities. Notice that the median spectral density of the
simulated model economy is larger than that induced by data. This indicates that the intensive
margin of trade does give further opportunities for the diversi�cation of sectoral technologies. Thus,
the model seems to be somewhat overstating the possibilities for sizeable aggregate �uctuations.
Notice also that, following the same parameterization, I can compute the model-implied spectral
density for di¤erent levels of aggregation of input-use data. From here, I can then compute what is
the rate of decay of the spectral density with the number of sectors and compare it to the predictions
26To clarify, I take the original 1977 input use matrix and use the actual shares of intermediate inputs, capital and
labor for each of the 523 sectors in the IO data. The aggregation vector is then constructed with the model-implied
steady state shares of sectoral gross output under the parameterization given by the data. I also experimented with
other years. The results do not change.
34

on the rate of decay given in Proposition 5.3.2.. To implement this, I use the input-use data for 1977
available from the BEA at three di¤erent levels of aggregation: 523 sectors (mostly 4 digit SIC), 366
sectors (3 digit SIC) and 77 sectors (2 digit SIC). From the latter, I aggregate manually to construct
a 36 sector input-use matrix according to the de�nitions of Jorgenson et al. (2005).
0 0.5 1 1.50.01
0.02
0.03
0.04
0.05
0.06
0.07
0.08
0.09
Frequency (w)
Spe
ctru
m fo
r Agg
rega
te G
row
th R
ates
36 Sectors77 Sectors366 Sectors523 Sectors
Figure 8: Spectral Densities for the 1977 input use data across di¤erent aggregation levels.
50 100 150 200 250 300 350 400 450 500 5500
0.1
0.2
0.3
0.4
0.5
0.6
0.7
0.8
0.9
1
Dec
ay o
f Sp
ectr
um
N umber of S ec tors
1977
M 0.18
M1
Figure 9: Spectral density decay for di¤erent levels of aggregation of 1977 input-use data at 0.1frequency.
Figure 8 plots the spectral density (27) using the 1977 data at various levels of disaggregation.
Figure 9 plots the rate of decline in the spectrum at a particular frequency, ! = 0:1. The results are
35

identical for all frequencies. Figure 8 clearly shows that the spectrum of aggregate capital declines
with disaggregation. However, Figure 9 reveals that the rate of decrease in the spectrum is slower
than that implied by standard law of large numbers (1=M line in the graph). Figure 9 also depicts
the rate of decay M��, predicted by Proposition 5.3.2.. In particular, I set � = 0:18; obtained by
substituting the baseline estimate of � = 2:1 in the expression � � 2��4��1 . Overall, this predicted rate
of decay seems to approximate well the actual rate of decay in the 1977 data.
6.3. Aggregate Fluctuations and Comovement. I now assess the performance of aggregatesin the multisector i.i.d. setup presented in section 6.1. above and compare it to that implied by a
panel of detailed sectoral data. In particular, I use the NBER-CES manufacturing industry database
to obtain the annual standard deviation of sectoral TFP. Averaging over the 458 4-digit SIC sectors
for the sample period 1958-1996 yields an average standard deviation of 7.5. I also back out the
implied standard deviation of aggregate growth in the manufacturing sector (by aggregating sectoral
growth rates according to the implied real gross output weights) and the average correlation of
sectoral output growth with aggregate growth.
I compare these data moments with those implied by the calibrated model in section 6.1. where
again I draw input-use matrices from families of matrices A(M; e; �) constructed according to Lemma
4.1.2. Speci�cally, I draw input-use matrices with 458 hundred sectors (M = 458) where the average
sector demands inputs from twenty other sectors (e = 20). Given the results linking di¤erent
volatility and persistence in aggregates with di¤erent levels of heterogeneity in input-supply links -
or diversi�cation of sectoral technologies - I consider sampling from two di¤erent families: � = 2:1
and � = 3:1. I maintain the remaining parameters constant across simulations. For each of these
values of � I draw 100 input-use matrices, simulate the economy for 1000 periods and aggregate
according to the model implied steaty state shares to obtain 100 series of annual aggregate growth
rates. Throughout, the standard deviation of the TFP process (33) hitting each of these sectors is
set at the value of 7.5 found in data. Table 3 summarizes the results.
NBER-CES Data Model (� = 2:1) Model (� = 3:1)
Standard Deviation of Sectoral
TFP
7.5 7.5 7.5
Standard Deviation of Aggregate
Growth Rate
4.5 2.9 1.2
Average Correlation of Sectoral
Output Growth with Aggregate
Growth
0.36 0.14(0.01) 0.06(0.01)
Number of Common Factors in
Sectoral Growth Rates
1 1 0
Table 3. Selected Moments from Data and Model Calibrations
36

The second line of the table above shows that a standard multisector i.i.d. economy with a
reasonable variability in sectoral TFP shocks can generate aggregate growth rates that are two
thirds as volatile as those seen in data. Recall that a standard LLN reasoning would imply a
standard deviation of aggregate growth that is one order of magniture lower (7:5=p458 = 0:35), less
than one tenth of the observed standard deviation in data. In fact, as we move to a more diversi�ed
economy (� = 3:1), the implied standard deviation of aggregate growth rates is already 60% lower
than that of the reference model and 75% smaller than what we see in data. The � = 2:1 model
economy is also able to reproduce 40% of the observed average correlation between sectoral output
growth and aggregate growth.
Interestingly, while the implied comovement/cross-sectional correlation is smaller than that found
in data, it would nevertheless be su¢ ciently high to induce an outside observer to entertain a 1
shock representation for the panel of sectoral growth rates. The last line in the table reports the
outcome of Bai and Ng (2002) common factor tests where I have implemented the PC p1 and PC p1estimators both for the NBER panel of sectoral growth rates and for the calibrated multisector
economy. Both the data and the � = 2:1 model economy yield a 1 factor representation of data while
in the counterfactual diversi�ed economy (� = 3:1) the Bai and Ng (2002) tests fail to identify any
common factor.
Finally, the analysis above suggests that a shock to a large input-supplying sector, i.e. to a general
purpose technology, will propagate throughout the economy as a large fraction of other technologies
are dependent on it. This means that the structure of intermediate input trade renders the economy
vulnerable to disturbances in particular sectors. However, one can also proceed to ask a related
question: what is the response of the aggregate economy to an average shock? Here I translate an
average shock as a shock to an average sector in terms of the number of sectors that it supplies
inputs to. Intuition would indicate that the impact of this should be muted by the very fact that the
output of an average sector is specialized and demanded only by a limited number of sectors. This
in turn generates limited conductance to average shocks. This o¤ers an alternative characterization
of the structure of the economy as robust to typical shocks. A simple impulse response analysis of
the model in section 6.1. illustrates these ideas.
Thus, having drawn an input-use matrix, I simulate the growth rate response for each of the four
hundred and �fty eight sectors to a one-standard deviation negative shock in the productivity of the
largest input-supplying sector (i.e. the sector corrresponding to the largest row sum of the sampled
A matrix). I then aggregate to see what this implies for the aggregate growth rate response in these
economies. I then follow the exact same procedure but instead give a minus one standard deviation
pulse to an average sector. That is, for a sampled A matrix, I pick a sector that supplies to twenty
other sectors. If none is found I pick the next largest sector. If more than one is found I shock at
random one of the average degree sectors. Figure 10 below displays the outcome of such experiments
by displaying the median response over 100 such simulations..
37
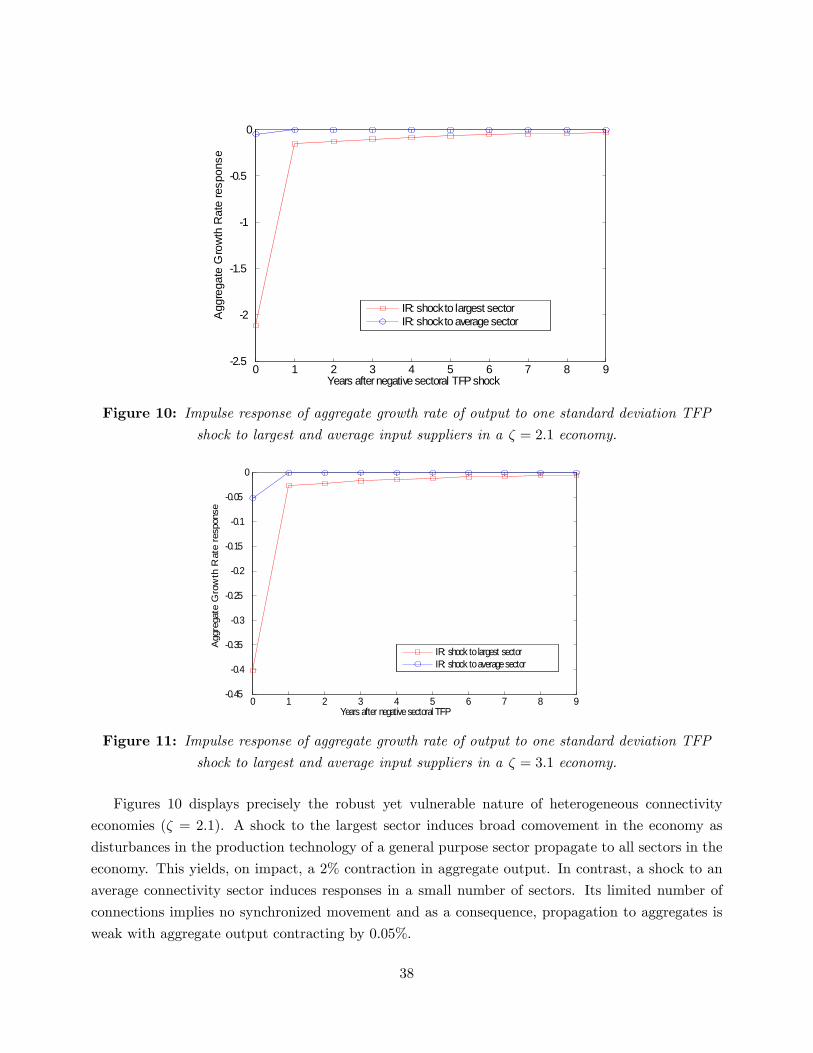
0 1 2 3 4 5 6 7 8 92.5
2
1.5
1
0.5
0
Years after negative sectoral TFP shock
Agg
rega
te G
row
th R
ate
resp
onse
IR: shock to largest sectorIR: shock to average sector
Figure 10: Impulse response of aggregate growth rate of output to one standard deviation TFPshock to largest and average input suppliers in a � = 2:1 economy.
0 1 2 3 4 5 6 7 8 90.45
0.4
0.35
0.3
0.25
0.2
0.15
0.1
0.05
0
Years after negative sectoral TFP
Agg
rega
te G
row
th R
ate
resp
onse
IR: shock to largest sectorIR: shock to average sector
Figure 11: Impulse response of aggregate growth rate of output to one standard deviation TFPshock to largest and average input suppliers in a � = 3:1 economy.
Figures 10 displays precisely the robust yet vulnerable nature of heterogeneous connectivity
economies (� = 2:1). A shock to the largest sector induces broad comovement in the economy as
disturbances in the production technology of a general purpose sector propagate to all sectors in the
economy. This yields, on impact, a 2% contraction in aggregate output. In contrast, a shock to an
average connectivity sector induces responses in a small number of sectors. Its limited number of
connections implies no synchronized movement and as a consequence, propagation to aggregates is
weak with aggregate output contracting by 0.05%.
38

Figure 11 shows what happens when I sample from more diversi�ed economies (� = 3:1). The
upshot of a thiner tail is that the largest sector sampled from a A(458; 20; 3:1) family will supplyto a relatively smaller number of sectors: as such, propagation is weaker and the mean growth rate
response is smaller by one order of magnitude. Interestingly, no such contrast obtains when I consider
a shock to an average sector. This suggests that the di¤erence between more and less diversi�ed
economies lies in their vulnerability to disturbances in large sectors and not in their robustness to
an average shock.
7. Conclusion
Narrowly de�ned, the starting point of this paper was based on the following insight: setting
cost shares to zero for particular intermediate inputs is tantamount to assuming particular network
structures for sectoral linkages. From this, I have shown that it is possible to start characterizing
sparseness in large-scale input-use matrices by using a network approach to data. More importantly,
I have built models of input-use matrices that retain �rst-order connectivity characteristics of data.
With this apparatus in hand, the paper employed these tools to solve a controversial question in the
business cycle literature: can large-scale multisector models with independent productivity shocks
generate non-negligible �uctuations in aggregates?
The answer that emerges from this paper is: yes, provided most sectors resort in large measure
to the same general purpose inputs. In other words, aggregate �uctuations obtain in economies that
are not too diversi�ed in terms of the inputs required by di¤erent technologies. Further, input-use
data seems to con�rm that this is indeed the case, as most sectors rely on key, basic, technologies:
oil, electricity, iron and steel, real estate, truck transportation and telecommunications. Sectors are
therefore interconnected by their joint reliance on a limited number of general purpose technologies
and di¤er only in the mix of remaining inputs each uses to produce its good.
From a network perspective this means that the linkage structure in the economy is dominated by
a few sectoral hubs, supplying inputs to many di¤erent sectors. In this case, productivity �uctuations
in these hub-like sectors propagate through the economy and a¤ect aggregates, much in the same
way as a shutdown at a major airport has a disruptive impact on all scheduled �ights throughout a
country. In either case, there are no close substitutes and every user is a¤ected by disturbances at
the source.
Once one starts to think about the fabric of input-trade in this way, other questions follow suit:
can one characterize diversi�cation in networks of sectoral technologies over time or across countries?
Take, for example, a problem that has generated recent interest among macroeconomists: the decline
in business cycle volatility over the past half century. The conjecture that follows from this paper
is that reliance on traditional hubs must have diminished as more specialized substitutes develop.
The response of the U.S. economy to past and present oil shocks seems to con�rm this view: as
39

alternative energy technologies develop and sectors diversify in their most preferred energy source,
the role of oil as a hub to the economy has diminished. As such, oil shocks would likely have a
smaller impact on aggregates. Concurrently, the I.T. revolution can be seen as having provided a
wealth of alternatives to traditional means of communication and points of sale. The same network
perspective can be taken across countries: do less developed economies rely relatively more on a
limited number of key technologies? In this sense, can their technologies be characterized as less
diversi�ed? If so, the arguments in this paper would predict that less developed economies display
more pronounced movements in aggregate output, as indeed seems to be the case in data.
To go beyond these conjectures necessarily implies more careful measurement of the network
properties of input-use data and, most likely, more disaggregated data. Indeed, the particular network
properties chosen in this paper - tail properties of degree sequences - are both hard to measure and
special in that they pertain only to local features of a network. Other measures of connectivity exist
and can be of use in characterizing properties of intersectoral trade �ows.
At the same time, once one recognizes that network structure is linked to macroeconomic out-
comes a more ambitious question emerges: what determines these structures? This requires devel-
oping a causal mechanism, i.e. a theory where the network of input-�ows - or at least some of its
properties - is the endogenous outcome of a well-speci�ed economic model. Such a theory is surely
necessary if one is to think rigourosly about the dynamic evolution of these complex objects and to
make sense of the data patterns suggested in this paper. This paper falls short of this and makes
the easier point that network structure matters. As such, this paper is a necessary starting point
for a larger research agenda linking macroeconomic outcomes to the networked structure of modern
economies.
40

References
Bak, P., Chen, K., Scheinkman, J. and M. Woodford, 1993, Aggregate Fluctuations for
Independent Sectoral Shocks: Self Organized Criticality in a Model of Production and Inventory
Dynamics, Richerche Economiche, 41, 3-30.
Bollobas, B., 2001, Random Graphs, Second Edition, Cambridge Mathematical Library Series,
Cambridge University Press.
Bollobas, B. and O.M. Riordan, 2003, Mathematical Results on Scale-Free Random Graphs,
in Bornholdt, S. and H.G. Schuster, eds., Handbook of Graphs and Networks, Wiley-VCH.
Brock, W.A., 1999, Scaling in Economics: a Reader�s Guide, Industrial and Corporate Change,
Vol. 8 (3).
Chung, F. and L. Lu, 2002, The Average Distance in Random Graphs with Given Expected
Degrees, Proceedings of the National Academy of Sciences.
Chung, F., Lu, L. and V. Vu, 2003, Eigenvalues of Random Power Law Graphs, Annals of
Combinatorics, 7, 21-33.
Chung, F., and L. Lu, 2006, Complex Graphs and Networks, CBMS, Regional Conference
Series in Mathematics, 107.
Cochrane, J., 1994, Shocks, Carnegie-Rochester Conference Series on Public Policy, Vol. 41,
pp. 295-364.
Conley, T.G. and B. Dupor, 2003, A Spatial Analysis of Sectoral Complementarity, Journal
of Political Economy, 111, 2, 311-351.
Cooper, R. and J. Haltiwanger, 1990, Inventories and the Propagation of Sectoral Shocks,
American Economic Review, 80, 170-90.
Embrechts, P., C. Kluppelberg, T. Mikosch, 1997, Modelling Extremal Events for Insur-
ance and Finance, (Springer, New York).
Diestel, R., 1997, Graph Theory, Graduate Texts in Mathematics�Series #173, Springer-Verlag.
Dupor, B., 1999, Aggregation and Irrelevance in Multi-Sector Models, Journal of Monetary
Economics, 43, 391-409.
Durlauf, S.N., 2005, Complexity and Empirical Economics, Economic Journal, 112, 225-243.
41

Durrett, R. 2006, Random Graph Dynamics, Cambridge University Press.
Fisher, E. and F. Vega-Redondo, 2007, The Linchpins of a Modern Economy, mimeo., paper
presented at the 2007 annual meeting of the American Economic Association.
Gabaix, X., 2005, The Granular Origins of Aggregate Fluctuations, mimeo., NYU-Stern Business
School.
Gabaix, X. and Y. Ioannides, 2004, The Evolution of City Size Distributions, Handbook of
Regional and Urban Economics, volume 4, Chapter 53, V. Henderson and J-F. Thisse eds., North-
Holland.
Golub, G. and C. Van Loan, 1996, Matrix Computations, Third edition, The Johns Hopkins
University Press.
Henderson, H.V. and S.R. Searle, 1981, On Deriving the Inverse of a Sum of Matrices,
SIAM Review, 23, 1, 53-60.
Horvath, M., 1998, Cyclicality and Sectoral Linkages: Aggregate Fluctuations from Independent
Sectoral Shocks, Review of Economic Dynamics, 1, 781-808.
Horvath, M., 2000, Sectoral Shocks and Aggregate Fluctuations, Journal of Monetary Eco-
nomics, 45, 69-106.
Horvath, M. and R. Verbrugge, 1996, Shocks and Sectoral Interactions: an Empirical In-
vestigation, mimeo.
Jackson, M.O., 2005, The Economics of Social Networks, Proceedings of the 9th World Congress
of the Econometric Society, eds. Richard Blundell, Whitney Newey and Torsten Persson, Cambridge
University Press.
Jones, C.I., 2007a, Intermediate Goods and Weak Links: A Theory of Economic Development,
mimeo., University of California - Berkeley.
Jones, C.I., 2007b, Input-Output Multipliers, General Purpose Technologies, and Economic
Development, mimeo., University of California - Berkeley.
Jovanovic, B. 1987, Micro Shocks and Aggregate Risk, Quarterly Journal of Economics, 102,
395-409.
Li, L., Alderson, D., Doyle, J. and W. Willinger, 2006, Towards a Theory of Scale-Free
Graphs: De�nition, Properties and Implications., Internet Mathematics, forthcoming
42

Long Jr., J.B. and C.I. Plosser, 1983, Real Business Cycles, Journal of Political Economy,
91, 1, 39-69.
Long Jr., J.B. and C.I. Plosser, 1987, Sectoral versus Aggregate Shocks, American Economic
Review, 77, 333-36.
Lu, L.L., 2002, Probabilistic Methods in Massive Graphs and Internet Computing, PhD Disser-
tation, University of California, San Diego.
Lucas, R.E., 1981, Understanding Business Cycles, in Studies in Business Cycle Theory. MIT
Press.
Mitzenmacher, M. (2003), A Brief History of Generative Models for Power Law and Log
Normal Distributions, Internet Mathematics, Vol 1(2), 226-251.
Nirei, M., 2005, Threshold Behavior and Aggregate Fluctuations, Journal of Economic Theory,
Newman, M.E.J., 2003, The Structure and Function of Complex Networks, SIAM Review, 45,
2, 167-256.
Newman, M.E.J., 2005, Power Laws, Pareto Distributions and Zipf�s Law, Contemporary
Physics, 46, 323-351
Norrbin, S., and D. Schlagenhauf, 1990, Sources of Output Fluctuations in the United
States during the Inter-War and Post-War Years, Journal of Economic Dynamics and Control, 14,
523-51.
Rauch, J. E., 1999, Networks versus Markets in International Trade, Journal of International
Economics, Vol. 48, 7-35.
Rosenblatt, D., 1957, On Linear Models and the Graphs of Minkowski-Leontief Matrices,
Econometrica, Vol. 25, No. 2.
Scheinkman, J. and M. Woodford, 1994, Self-Organized Criticality and Economic Fluctua-
tions, American Economic Review, Vol. 84, No. 2, Papers and Proceedings, pp. 417-421.
Shea, J., 2002, Complementarities and Comovements, Journal of Money, Credit and Banking,
34, 2, 412-433.
Simon, H. A. and A. Ando, 1961, Aggregation of Variables in Dynamical Systems, Economet-
rica, Vol. 29, No. 2.
43

Solow, R., 1952, On the Structure of Linear Models, Econometrica, Vol. 20, No. 1, 29-46.
Summers, L. H. ,1986, Some Skeptical Observations on Real Business Cycle Theory, Federal
Reserve Bank Minneapolis Quarterly Review, 10, 23�27.
Szydl, D.B., 1985, Conditions for the Existence of a Balance Growth Solution for the Leontief
Dynamic Input-Output Model, Econometrica, Vol. 53, No. 6.
Vega-Redondo, F., 2007, Complex Social Networks, Econometric Society Monographs, Cam-
bridge University Press.
44

A. Appendix
A.1. Some results on the inverse of a sum of two matrices.
Lemma A.1. Let A be a nonsingular M�dimensional matrix and let U , B and V be M �M
matrices. Then,
(A+ UBV )�1 = A�1 � (I +A�1UBV )�1A�1UBV A�1
Proof: See, for example, Henderson and Searle (1981).
A particular case of this is given by the Bartlett inverse
Lemma A.2. (Bartlett Inverse). Let A be a square, invertible, M�dimensional matrix andu and v be M�dimensional vectors. Then:
(A+ uv0)�1 = A�1 � A�1uv0A�1
1 + v0A�1u
A.2. Proofs
Proofs of Section 2
Proposition 2.2. Assume thatXi2 �Sj
ij = and that �2j = �2 for all sectors j = 1. Then
�2Y (�C) =
�1
1�
�2 �2M
for Complete Intersectoral Networks
�2Y (�Star) =
�N
M+ 2
1�
��2
M+
�
1�
�2 �2Nfor N star networks
Proof: First construct vectors u and v such that u is anM�1 vector with each entry ui restricted2 [0;M ] and v an M � 1 vector where each element vi is given by P
i ui. Now let � = uv0 and apply
Lemma A.1. to get
(I � �)�1 = (I � uv0)�1 = I +uv0
1� where the last equality follows from v0u = (by constuction). Notice that for the static multi-
sector economy deviations of sectoral output from its mean are then given, in vector form, by:
y � � = (I+ uv0
1� )0"
Taking the complete case �rst:
45

�C =
�
dGcA(Gc)
�where A(Gc) is the adjacency matrix of a complete regular digraph of sectoral supply linkages and
.dGc is its average out-degreePi dviM :Notice that that the average out-degree of a complete digraph
on M sectors is M . Hence I can rewrite �C as
�C = M1M10M
�1Pi dvi
�Now let u be given by M1M (i.e. the degree sequence of Gc) and v0 = 1
0M
� Pi dvi
�. Using this
with the Bartlett inverse result:
MXi=1
yi � �i =
MXi=1
(1 +Mui
(1� )Pi dvi
)"i
=
MXi=1
(1 +MM
(1� )M2)"i
=MXi=1
1
(1� )"i
Finally given the assumption of i.i.d. sectoral disturbances, �2Y � EhPM
i=1(yi��i)M
i2�2Y (�C) =
�1
1�
�2 �2M
Now for the N � Star case the input-use matrix is given by
�star =
�
dGStarA(GStar)
�where A(GStar) is the binary matrix de�ned in the text and dGStar is its average out-degreeP
i dviM :Without loss of generality, order sectors that the �rst M �N vertices are not input suppliers
and the remaining N sectors supply inputs to every sector in the economy. Then I can write �Staras
�Star = M
"0M�N
1N
#10M
�1Pi dvi
�Where 0M�N is anM�N dimensional vector of zeros and 1N be an N dimensional vector of ones.
Now, take the Bartlett inverse, where u is given by M
"0M�N
1N
#(which is simply the out-degree
sequence of the N � star network) and v0 = 10M�
Pi dvi
�: Then,
46

MXi=1
yi � �i =MX
i=M�N+1(1 +M
ui
(1� )Pi dvi
)"i
=
MXi=M�N+1
(1 +M2
(1� )Pi dvi
)"i
=MX
i=M�N+1(1 +
1� M
N)"i
Then, given the assumption of i.i.d. sectoral disturbances
�2Y (�Star) =
�N
M+ 2
1�
��2
M+
�
1�
�2 �2N
As stated in the proposition. �
Proofs of Section 4
Lemma 4.2.1. For every M sector economy, associate a weight sequence e := fe1; :::; eMg to the
collection of sectoral labels, such that ei 2 (0;M) and de�ne a realization of the intersectoral tradegraph G as the realization of independent binary random variables Xij 2 f0; 1g, i; j = 1; :::M where
Pr(Xij = 1) = pij given by [14]. Then,
i) for any M , the expected out-degree of a sector will be given by:
E (douti ) =Xj
pij= ei, i = 1 ; :::;M (35)
ii) for any realization of the intersectoral trade graph G and for any sector i;
if ei > logM , its actual out-degree douti will almost surely satisfy��douti � ei�� � 2 logM
otherwise if ei � logM , then douti almost surely satis�es
��douti � ei�� � 2pei logM
iii) for any sector i; its E(dini ) expected indegree is given by:
E(dini ) =Xi
pij =
Pi eiM
� e;8i (36)
47

Proof: The proof of parts i) and iii) are given in the Lemma. Part ii) is proven in Chung and Lu
(2006, Lemma 5.7.), resorting to Cherno¤ bounds
Proposition 4.3.3.. The Leontie¤ inverse of the expected input use matrix,�IM � �
��1is given
by �IM � �
��1= IM +
1� �10M
where IM is the M �M identity matix, � is a M � 1 vector with typical element eiPMi=1 ei
and 1M is
the unit vector of dimension M � 1.
Proof: The proof follows along the same lines of the proof in Proposition 2.1., and is simply using
Bartlett�s formula in Lemma A.2. where u = � and v = 1M . and noticing that v0u = necessarily.
Proposition 4.3.4.. Assume that the input-use matrix is given by the expected input-use matrix� and that sectoral volatility �j = � for all sectors j. Then, for a static M�sector economy theaggregate volatility of equilibrium output, �A is given by:
�2Y (�) =
8<:�
1�
�2�1(�)
�2
M + 1M �
2 if � > 3� 1�
�2�2(�)
�1M
� 4�2���1 �2 + 1
M �2 if � 2 (2; 3)
where terms �1(�) =(��2)2
(��1)(��3) and �2(�) =(��2)2
(��1)(3��) are positive and constant given a �:
Proof: Use the result in Proposition 4.3.3. to substitute in (I � �)�10 in expression (8) of thestatic model presented in section 2.
y � � =�I +
1� �10�0"
Thus with 1M as the M-dimensional unit vector:
MXi=1
yi � �i = 10��I +
1� �10�+�
�0"
= 10I"+
1� 10(1�)"
=MPi=1
"i +
1� MMPi=1
�i"i
Thus the aggregate statistic 1M
PMi=1 yi � �i
1
M
MXi=1
yi � �i =1
M
MPi=1
"i +
1� MPi=1
�i"i
48
which has expectation zero given independent technological disturbances "i. Now we�re interested
in E��
1M
PMi=1 yi � �i
�2�
E
24 1
M
MXi=1
yi � �i
!235 = 1
M2
MPi=1
E(("i)2) +
�
1�
�2 MPi=1
�2iE(("i)2)
Now using the assumption E(("i)2) = �2.
�2Y =
�
1�
�2�2
MPi=1
�2i +1
M�2
Finally notice that by de�nition of the vector � given in Proposition 4.3.3.
MPi=1
�2i �"MPi=1
e2i =
�MPi=1
ei
�2#
=1
M
MPi=1
e2i =MPi=1
ei
MPi=1
ei=M
=1
M
eee
Where ee � MPi=1
e2i =MPi=1
ei: Chung and Lu (2006, p.109) show that for largeM and under the power
law weight parameterization given in De�nition 4.2.2., ee is given by:ee =
8<: e (��2)2(��1)(��3) if � > 3
e��2 (��2)��1m3��
(��1)��2(3��) if � 2 (2; 3)
where m is the maximum expected outdegree, e1. Thus, according to De�nition 4.2.2. m =��2��1eM
1��1 : Plugging in these expressions in the expression for �2Y above, I get:
�2Y (�) =
8<:�
1�
�2(��2)2
(��1)(��3)�2
M + 1M �
2 if � > 3� 1�
�2(��2)2
(��1)(3��)�1M
� 2��4��1 �2 + 1
M �2 if � 2 (2; 3)
Letting �1(�) =(��2)2
(��1)(��3) and �2(�) =(��2)2
(��1)(3��) gives the claim. �
Proposition 4.3.5. Fix a triplet of parameters (M; e; �) and assume thatXi2 �Sj
ij = and that
�j = � for all sectors j = 1. For any A(G) sampled from the family of input-use graphs A(M; e; �);
construct the input-use matrix according to Lemma 4.1.2. Then i) for any A(G)
[IM � �(A)]�1= IM+
1� �10M+�
49

where � is an M �M random matrix with zero column sums. Further ii) for any A(G) of the
family of input-use graphs A; and � 2 (2; 3) the following is a lower bound for aggregate volatility
�2A(�(A)) >
8>><>>:��
1�
�2� {
��1(�)
�2
M if � > 3�� 1�
�2� {
��2(�)
�1M
� 2��4��1 �2 if � 2 (2; 3)
where { is a constant strictly smaller than�
1�
�2:
Proof of claim i) in the Proposition: First notice that for any realization of the intersectoral trade
digraph A(G) one can always decompose A(G)D as
A(G)D = E(A(G)D) + [A(G)D � E(A(G)D)]
where E is the expectation operator. Therefore the matrix Z; i.e. the Leontie¤ inverse [I � A(G)D]�1 can be expressed as:
[I � A(G)D]�1 = fI � E(A(G))E(D)� [A(G)D � E(A(G))E(D)]g�1
Now, to apply the formula for the inverse of a sum of matrices in Lemma A.1., let
I � E(A(G))E(D) � C
� [A(G)D � E(A(G))E(D)] � U
to express the problem as an inverse of a sum of matrices:
[I � A(G)D]�1 = [C + IMUIM ]�1
so that the formula for the inverse in A.1. yields
[I � A(G)D]�1 = C�1 � C�1U [I + C�1U ]�1C�1
To calculate C�1 notice that E(A(G))E(D) can be expressed as a rank one matrix:
E(A(G))E(D) = �10M
where � =h
e1PMi=1 ei
; :::; eMPMi=1 ei
iand 10 � [1; :::; 1]: Thus applying Barttlet formula for C�1 yields
[I � �10]�1 = I + �10
1� 10I�
Since 10�= 1 we get for C�1
[I � �10]�1 = I +
1� �10
50

Now to solve for [I + C�1U ]�1 substitute in C�1 to get
[I + C�1U ]�1 =
�I +
�I +
1� �10�U
��1=
�I + U +
1� �10U
��1Notice that for any realization of A(G)D;the matrix U = � [A(G)D�E(A(G))E(D)], will have
zero column sums. This is so since, by construction, A(G)D and E(A(G))E(D) have the same
column sums (and equal to 1 for every column). Hence the di¤erence will yield zero column sums.
Thus 10U = 00 where 0 is an M � 1 vector of zeros and �10U is a M �M matrix of zeros. This
implies that:
[I + C�1U ]�1 = [I + U ]�1
Collecting results
[I � A(G)D]�1 =�I +
1� �10���I +
1� �10�U [I + U ]�1
�I +
1� �10�
This expression can be further simpli�ed by again using the fact that �10U is a matrix of zeros.
Thus:
[I � A(G)D]�1 =�I +
1� �10�� U [I + U ]�1
�I +
1� �10�
or
[I � A(G)D]�1 =�I +
1� �10�+�
with � de�ned as
�� [A(G)D � E(A(G)D)][I � [A(G)D � E(A(G)D)]]�1�I +
1� �10�
Finally, for the zero column sum claim on � I use the following result (see Golub and van Loan,
Lemma 2.3.3.)
if k�k1 < 1 then (I � �)�1
1� 1
1� k�k1where k�k1 is the maximum absolute column sum of �. Notice that by construction for any A(G);
all column sums of � are positive and given by k�(A)k1 = < 1 and therefore (I � �)�1
1�
11� : Now notice that I +
1� �10 is a M � M matrix with all columns sums equal to 1
1� and
thus I +
1� �10 1= 1
1� . This therefore implies that � has all column sums equal to zero.since
otherwise (I � �)�1
1would be greater than 1
1� .
51

Proof of part ii) of the Proposition. Recall � � �U [I + U ]�1hI +
1� �10i. Then the static
multisectoral model gives:
y � � =��I +
1� �10�+�
�0"
Thus with 10 � [1; :::; 1]
MXi=1
yi � �i = 10��I +
1� �10�+�
�0"
= 10I"+
1� 10(1�)"+ 10�0"
=MPi=1
"i +
1� MMPi=1
�i"i +MPj=1
MPi=1
�ij"i
Thus the aggregate statistic 1M
PMi=1 yi � �i
1
M
MXi=1
yi � �i =1
M
MPi=1
"i +
1� MPi=1�i"i +
1
M
MPj=1
MPi=1
�ij"i
which has expectation zero given independent technological disturbances. Now we�re interested
in E��
1M
PMi=1 yi � �i
�2�
E
24 1
M
MXi=1
yi � �i
!235 =1
M2
MPi=1
E(("i)2) +
�
1�
�2 MPi=1
�2iE(("i)2) +
1
M2
MPi=1
MPj=1
�ij
!2E(("i)
2)
+2
M
�
1�
�MPi=1
�iE(("i)2) +
2
M
MPi=1
MPj=1
�ijE(("i)2)
+2
M
�
1�
�MPi=1
�i
MPj=1
�ij
!E(("i)
2)
Notice thatMPi=1
MPj=1
�ij =MPj=1
MPi=1
�ij = 0 (since � is a zero column-sum matrix), thatMPi=1
�i = 1
and that E(("i)2) = �2. Using these facts I can simplify the expression to:
�2A =
�
1�
�2�2
MPi=1
�2i+1
M�2+
2
M�2�
1�
�+2
M�2�
1�
�MPi=1
�i
MPj=1
�ij
!+�2
M2
MPi=1
MPj=1
�ij
!2Now the second to last term in the expression can potentially be negative and/or of higher order
than the �rst term. To show that the latter is never the case, group the �rst and the last two terms
in this formula:
52

�
1�
�2�2
MPi=1
�2i +2
M�2�
1�
�MPi=1
�i
MPj=1
�ij
!+
�2
M2
MPi=1
MPj=1
�ij
!2
= �2MPi=1
"
1� �i +1
M
MPj=1
�ij
#2Thus, since the resulting value of this sum in i has to be non-negative it has to be the case that,
for every M :
�
1�
�2 MPi=1
�2i �
������ 2M�
1�
�MPi=1
�i
MPj=1
�ij
!+
1
M2
MPi=1
MPj=1
�ij
!2������Further, since
MPi=1
MPj=1
�ij = 0; if for some iMPj=1
�ij < 0 then it has to be the case that there
exists at least one index k such thatMPj=1
�kj > 0. Therefore, the inequality above is strict for all M .
In particular, this implies that the right hand side in the inequality cannot have a slower rate of
convergence to zero than the term on the left hand side. Thus I have shown that��
1�
�2� {
�MPi=1
�2i
where { is strictly lower than�
1�
�2and independent of M , is a worst case bound for the i�sum
of these three terms. Therefore
�2A(A) >
"�
1�
�2� {
#�2
MPi=1
�2i +1
M�2 +
2
M�2�
1�
�
>
"�
1�
�2� {
#�2
MPi=1
�2i
for any M: Inserting the expression forMPi=1
�2i derived in the Proposition 4.3.4. yields,
�2A(A) >
8>><>>:��
1�
�2� {
�(��2)2
(��1)(��3)�2
M if � > 3�� 1�
�2� {
�(��2)2
(��1)(3��)�1M
� 2��4��1 �2 if � 2 (2; 3)
Letting �1(�) =(��2)2
(��1)(��3) and �2(�) =(��2)2
(��1)(3��) gives the claimed expression.�
Proofs of Section 5
Proposition 5.3.1. For �xed � and ; aggregation weights w= (1=M)1M and � = � give the
univariate spectral density
53

S(!;�) = S(!;�) =1
2�
a(!)
b(!)
�1
M(b(!)� 2) + 2�1(�)
1
M
�if � > 3
and
S(!;�) =1
2�
a(!)
b(!)
"1
M(b(!)� 2) + 2�2(�)
�1
M
� 2��4��1#
if � 2 (2; 3)
with a(!) = 1(1��ei!� )(1��e�i!� ) , b(!) = (1��e
i!)(1��e�i!)., �1(�) = (��2)2(��1)(��3) and �2(�) =
(��2)2(��1)(3��) .
Proof: Let �(ei!) := (1��ei!)I��.. Following the same reasoning as in the proof of Proposition4.3.2. notice that � = �10M . This
�(ei!) = (1� �ei!)I � �10M
Then using Bartlett formula in Lemma A.2.
�(ei!)�1 = (1� �ei!)�1I + (1� �ei!)�1 �10M1� 1M (1� �ei!)�1I �
(1� �ei!)�1
= (1� �ei!)�1[I + �10M(1� �ei!)� 1M �0
]
= (1� �ei!)�1[I + �10M1� �ei! � ]
Now, recalling the expression for the spectrum for aggregate capital for a given frequency
S(!):= (2�)�1w��(ei!)�10�(ei!)�1w
and w= (1=M)1M where again, 1M is a M � 1 vector of ones. Thus, letting � = 1=(1��ei!� )
S(!) =1
(2�)M 210M�(ei!)�10�(ei!)�11M
=(1� �ei!)�1(1� �e�i!)�1
(2�)M 2 10M(I + �01M�
0)(I + ��10M )1M
=(1� �ei!)�1(1� �e�i!)�1
(2�)M 2 [M + �10M�10M1M + �
010M1M�
01M + �0�10
M1M�
0�10M1M ]
Now, term by term, on the RHS square brackets:
i)�10M�10M1M = �
MXi=1
�iM PMi=1 �i
= (1� �ei! � )M
ii)�010M1M�01M = �0
M PMi=1 �i
MXi=1
�i = (1� �e�i! � )M
54

iii)�0�10M1M�0�10M1M = �0�M (
MXi=1
�2i )M
Thus:
S(!) =(1� �ei!)�1(1� �e�i!)�1
(2�)
1
M+ �
M+ �0
M++�0�
2
M2
MXi=1
�2i
!
=(1� �ei!)�1(1� �e�i!)�1
(2�)(1� �ei! � )(1� �e�i! � )
"1
M[(1� �ei! � )(1� �e�i! � )� 2] + 2
M2
MXi=1
�2i
#
Thus, de�ning a(!) = (1��ei!)�1(1��e�i!)�1(1��ei!� )(1��e�i!� ) and b(!) = (1� �e
i!)(1� �e�i!)
S(!) =1
2�
a(!)
b(!)
"1
M(b(!)� 2) + 2
M2
MXi=1
�2i
#Now for �i =
eiPi ei
I can rewrite this expression in terms of the expected degree, e; and the
second order expected degree ee:S(!) =
1
2�
a(!)
b(!)
�1
M(b(!)� 2) + 2
M
�eee
��Substitution in for the second order expected degree ee and simplifying gives
S(!;�) =1
2�
a(!)
b(!)
"1
M(b(!)� 2) + 2 (� � 2)2
(� � 1)(3� �)
�1
M
� 2��4��1#
if � 2 (2; 3)
and
S(!;�) =1
2�
a(!)
b(!)
�1
M(b(!)� 2) + 2 (� � 2)2
(� � 1)(� � 3)1
M
�if � > 3
Letting �1(�) =(��2)2
(��1)(��3) and �2(�) =(��2)2
(��1)(3��) gives the claim:
�
Proposition 5.3.2. For �xed � and ; aggregation weights w = (1=M)1M and for any
�(A) where A is drawn from the family of matrices A(M; e; �) and �(A) is formed according to
Lemma 4.1.2. the spectral density for aggregate capital is bounded below by:
S(!;�(A)) >1
2�
a(!)
b(!)
�(b(!)� 2) 1
M+ �1(�)(
2 � {) 1M
�if � > 3
and
S(!;�(A)) >1
2�
a(!)
b(!)
"(b(!)� 2) 1
M+� 2 � {
��2(�)
�1
M
� 2��4��1#if � 2 (2; 3)
55

with { < 2, a(!) = 1(1��ei!� )(1��e�i!� ) , b(!) = (1 � �ei!)(1 � �e�i!)., �1(�) =
(��2)2(��1)(��3)
and �2(�) =(��2)2
(��1)(3��) .
Proof: Let � = 1��e�i!. By same argument as in Proposition 4.3.5. one can always decompose
[(1� �ei!)I � �]�1 = [�I � A(G)D]�1 = f�I � E(A(G))E(D)� [A(G)D � E(A(G)(D))]g�1
Now let
�I � E(A(G))E(D) � Ca
� [A(G)D � E(A(G))E(D)] � U
and apply the Sherman-Morrison formulas to get:
[�I � A(G)D]�1 = C�1� � C�1� U [I + C�1� U ]�1C�1�
To solve C�1� through the Barttlet inverse formula
C�1� = ��1I +��1 �10��1
1� ��110�
= ��1�I +
��1 �10
1� ��110�
�= ��1
�I +
�10
�� 10�
�= ��1
�I +
�10
��
�For [I + C�1� U ]�1 substitute in C�1� to get
[I + C�1� U ]�1 =
�I + ��1
�I +
�� �10�U
��1=
�I + ��1U +
�� �10U
��1where again �10U is a M �M matrix of zeros. Thus:
[I + C�1� U ]�1 = I + ��1U
Collecting results
[�I � A(G)D]�1 = C�1� � C�1� U [I + C�1� U ]�1C�1�
= ��1�I +
�� �10�� ��2
�I +
�� �10�U [I + ��1U ]�1
�I +
�� �10�
= ��1�I +
�� �10�� ��2U [I + ��1U ]�1
�I +
�� �10�
56

where the last line uses the fact that �10U is a M �M matrix of zeros.
Again de�ning � de�ning as
�� [A(G)D � E(A(G)D)][I � [A(G)D � E(A(G)D)]]�1�I +
1� �10�
I can rewrite the expression above as
[�I � A(G)D]�1 = ��1�I +
�� �10�+ ��2�
Also, by the exact same argument as in the proof of Proposition 4.3.5. the column sums of �
have to be zero for any realization of A(G):
Now using the formula for the aggregate spectrum I get:
S(!) =1
2�
1
M210[(1� �ei!)I � �]�10[(1� �ei!)I � �]�11
=1
2�
1
M210���1
�I +
�� �10�+ ��2�
�0 ���1
�I +
�� �10�+ ��2�
�1
=1
2�
�0�1��1
M2
2666666410hI +
�� �10i0 h
I + �� �1
0i1
+10��10�0hI +
�� �10i1
+10hI +
�� �10i0��1�1
+10�0�1��1�0�1
37777775Now term by term in the expression in square brackets. First,
10�I +
�� �10�0 �
I +
�� �10�1 = 10
�I +
�0 � 1�0 +
�� �10 +
2
(�� )(�0 � )1�0�10
�1
= M +M
�0 � MPi=1
�i +M
�� MPi=1
�i + 2
(�� )(�0 � )M2MPi=1
�2i
where �0 is the complex conjugate of � and is given by 1� �e�i!:Second
10��10�0�I +
�� �10�1 = ��1010�01+��10
�� 10�0�101
= ��10
�� M10�0�
= ��10
�� MPj
Pi�ij�i
Where �01 is a M � 1 vector of zeros (since the columns of � sum to zero), so the �rst term
disappears.
57

Third, and applying same reasoning,
10�I +
�� �10�0��1�1= 1 0��1�1+��110
�0 � 1�0�1
= ��1
�0 � M�0�1
= ��1
�0 � MPj
Pi�ij�i
Finally,
10�0�1��1�0�1 =�0�1��1Pi
Pj�ij
!2Collecting results:
S(!) =1
2�
�0�1��1
M2
2664 M +M �0� +M
�� +
2
(�� )(�0� )M2MPi=1
�2i
+���10
�� + ��1
�0�
�MPj
Pi �ij�i + �
0�1��1Pi
�Pj �ij
�23775
=1
2��0�1��1
2664�0�� 2
(�� )(�0� )1M + 2
(�� )(�0� )
MPi=1
�2i+�2 �(��10+��1) 2(�� )(�0� )
�1M
Pj
Pi �ij�i +
1M2�
0�1��1Pi
�Pj �ij
�23775
=1
2�
�0�1��1
(�� )(�0 � )
2664 [�0�� 2] 1M + 2MPi=1
�2i+�2 � (��10 + ��1) 2
�1M
Pj
Pi �ij�i +
1M2�
0�1��1(�� )(�0 � )Pi
�Pj �ij
�23775
To establish the lower bound I follow the same strategy as in the proof of Proposition 4.3.4.
Again the situation I am interested in ruling out is one where 1M
Pj
Pi �ij�i is negative and has a
decay rate with M that is slower than that ofMPi=1
�2i . For this not to be the case start by grouping
the last three terms in the expression above thus:
MPi=1
24 2�2i + �2 � (��10 + ��1) 2� 1M Pj�ij�i +
1
M2�0�1��1(�� )(�0 � )
Pj�ij
!235and notice this is simply the i sum of the product of conjugate pairs dexed by i:
MPi=1
" �i +
1
M��1(�� )
Pj�ij
#" �i +
1
M��10(�0 � )
Pj�ij
#
Now we know that the product of conjugate pairs is always real and nonnegative. Hence it must
be the case for all M and each i
58

2�2i �
�������2 � (��10 + ��1) 2� 1M Pj�ij�i +
1
M2�0�1��1(�� )(�0 � )
Pj�ij
!2������which implies that the term on the r.h.s. of the inequality cannot decay at a slower rate than
2�2i . Since this holds for all i and all M :
MPi=1
2�2i �MPi=1
�������2 � (��10 + ��1) 2� 1M Pj�ij�i +
1
M2�0�1��1(�� )(�0 � )
Pj�ij
!2������Thus, at worse, the r.h.s is a term that decays at the same rate as 2�2i but is never larger in
absolute value. Further, by the fact that � is always a zero column sum matrix; we know that at
least for some i;Pj �ij > 0:, which implies that the inequality above is strict. Thus it has to be the
case that there exists a real and positive {, that does not depend on M and is strictly smaller than
2 such that� 2 � {
� MPi=1
�2i is a strict lower bound for the sum of these three terms in i.
Using this in the expression for S(!) it as to be the case that for any M and any frequency !
S(!) >1
2�
�0�1��1
(�� )(�0 � )
�(�0�� 2) 1
M+ ( 2 � {)
MPi=1
�2i
�
Substituting in for � = 1� �e�i! andMPi=1
�2i yields:
S(!;�(A)) >1
2�
a(!)
b(!)
�(b(!)� 2) 1
M+ �1(�)(
2 � {) 1M
�if � > 3
and
S(!;�(A)) >1
2�
a(!)
b(!)
"(b(!)� 2) 1
M+� 2 � {
��2(�)
�1
M
� 2��4��1#if � 2 (2; 3)
where { < 2, a(!) = 1(1��ei!� )(1��e�i!� ) ,b(!) = (1��e
i!)(1��e�i!);.�1(�) = (��2)2(��1)(��3) and
�2(�) =(��2)2
(��1)(3��) as claimed �
59