agent-based modelling and resource network optimisation for the wash sector in gama, ghana
TRANSCRIPT
GAMA Technical GroupWebinar
6th August 2015@resilienceIO

1. Welcome and introductions2. The Trust Global update - Rachael Kemp3. CERSGIS Ghana Geographic data and
tools for urban planning - Foster Mensah4. Agent Based systems modelling - Koen
Van Dam5. Resource Technology modelling - Harry
Triantafyllidis6. resilience.io WASH prototype - Koen &
Harry7. AOB8. Next steps and Close
http://ecosequestrust.org/GAMA
Agenda
● The Trust’s “Smart ways to mobilise more efficient and effective long-term investment in city regions” report was presented at the UN Finance for Development (FfD) meeting in Addis Ababa, see ecosequestrust.org/financeforSDGs.pdf
● resilience.io is gaining increasing presence in the UN family and progress is being made through our core position in the UNISDR R!SE Initiative
Globally
● The Trust, Cities Alliance and Gaiasoft are starting a series of meetings with DfID this week to discuss how to develop the Future Cities Africa programme
● The Trust are keen to engage with AMA, the MLGRD and Cities Alliance Global Community to draft Readiness and Full proposals to the Green Climate Fund
Africa
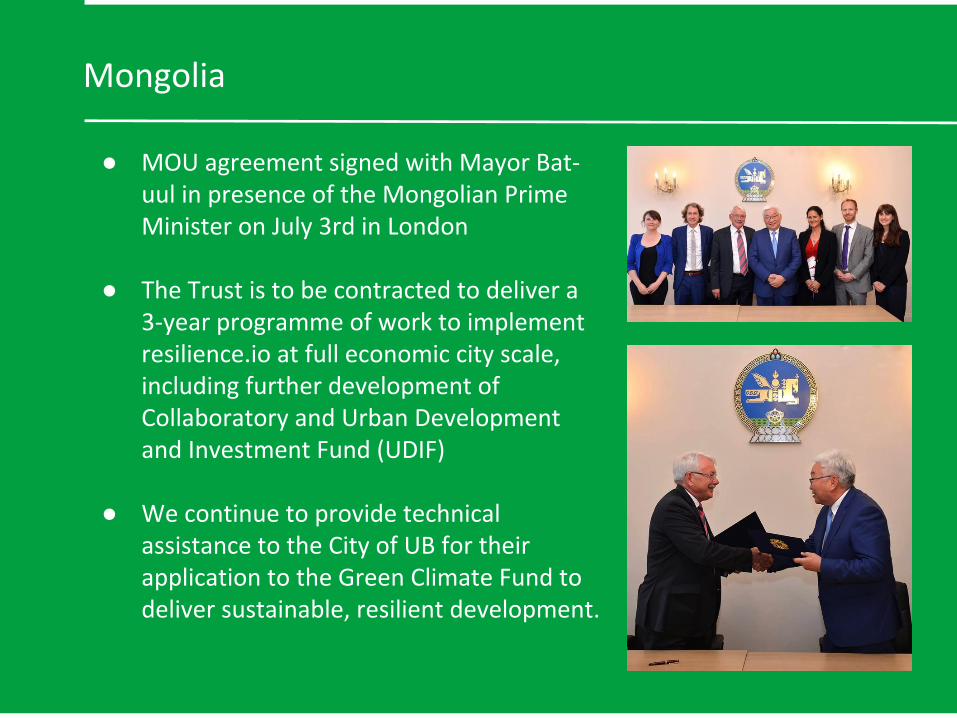
● MOU agreement signed with Mayor Bat-uul in presence of the Mongolian Prime Minister on July 3rd in London
● The Trust is to be contracted to deliver a 3-year programme of work to implement resilience.io at full economic city scale, including further development of Collaboratory and Urban Development and Investment Fund (UDIF)
● We continue to provide technical assistance to the City of UB for their application to the Green Climate Fund to deliver sustainable, resilient development.
Mongolia

● Inaugural workshop and high-level meetings in Scotland on 13th and 14th October to initiate set-up of Collaboratory, Urban Development and Investment Fund (UDIF) and regional resilience.io model. Event to be held at University of Stirling Centre for Sustainable Living.
● Working with Chinese Academy of Sciences and Hua Yan Group to build Chinese version of resilience.io tool to deliver sustainable urban development projects as part of “New Urbanisation” movement.
Scotland and China

INTRODUCTION TO GIS AND URBAN PLANNING MODELS
Foster MensahCentre for Remote Sensing and Geographic Information Services (CERSGIS)
University of Ghana
Finding the pathway to a resilient future for the Greater Accra Metropolitan Area (GAMA)

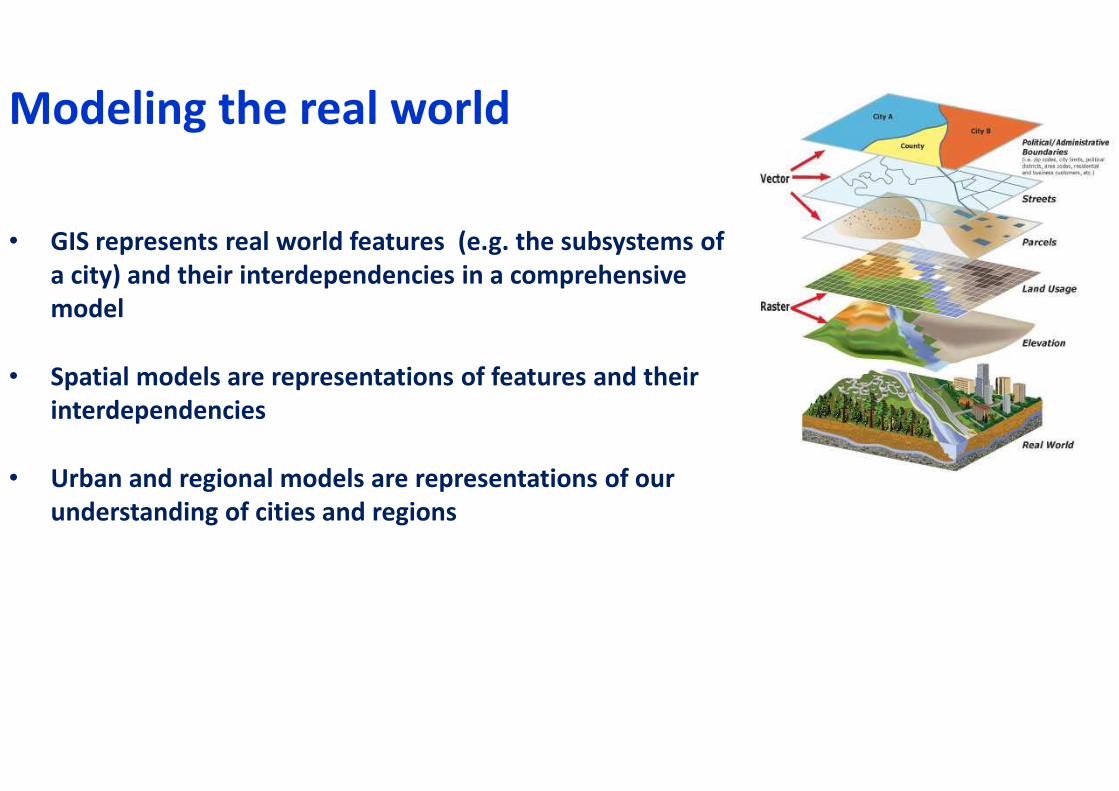
• GIS represents real world features (e.g. the subsystems of
a city) and their interdependencies in a comprehensive
model
• Spatial models are representations of features and their
interdependencies
• Urban and regional models are representations of our
understanding of cities and regions
Modeling the real world


Why GIS for Urban Planning
• Geography is fundamental to Urban planning
• The urban place resides in a “geographic space”
• Making decisions based on geography is basic to urban planning
• Understanding the geography of urban spaces and its relation to people is
therefore necessary for urban planning
• Geographic information system (GIS) is a technological tool for understanding
geography and making intelligent decisions
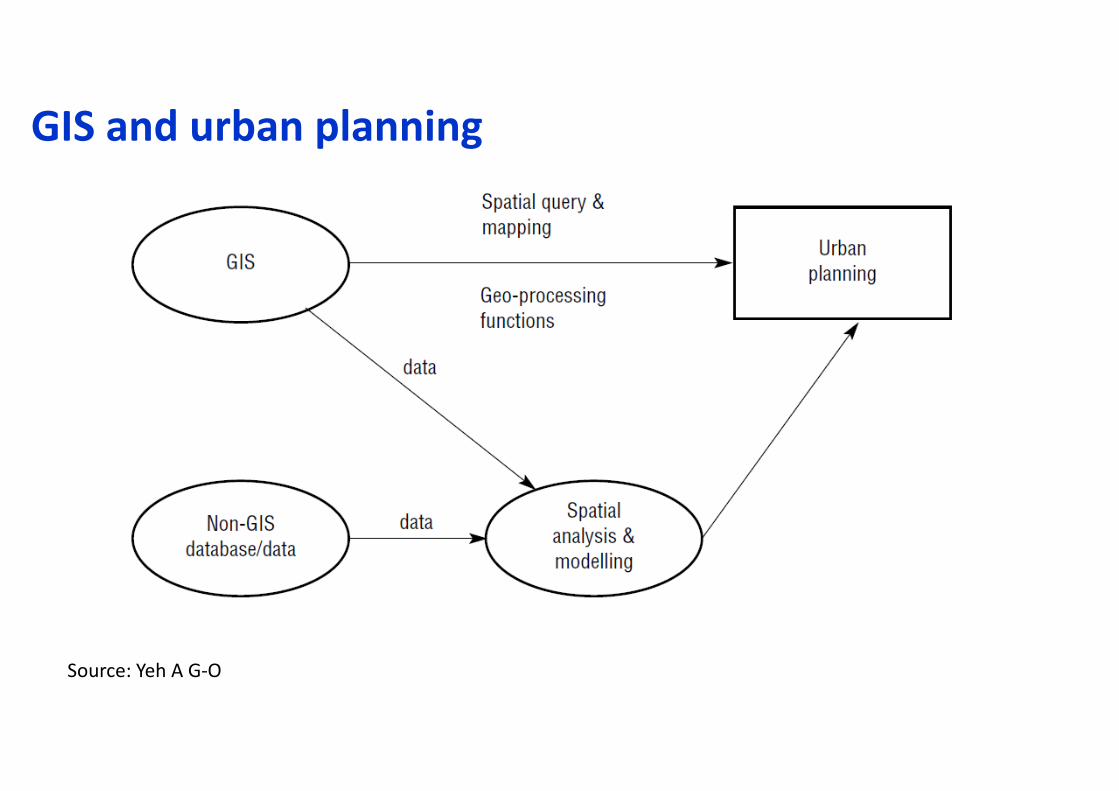
GIS and urban planning
Source: Yeh A G-O

The planning process and geospatial spatial tools
Source: Yeh A G-O
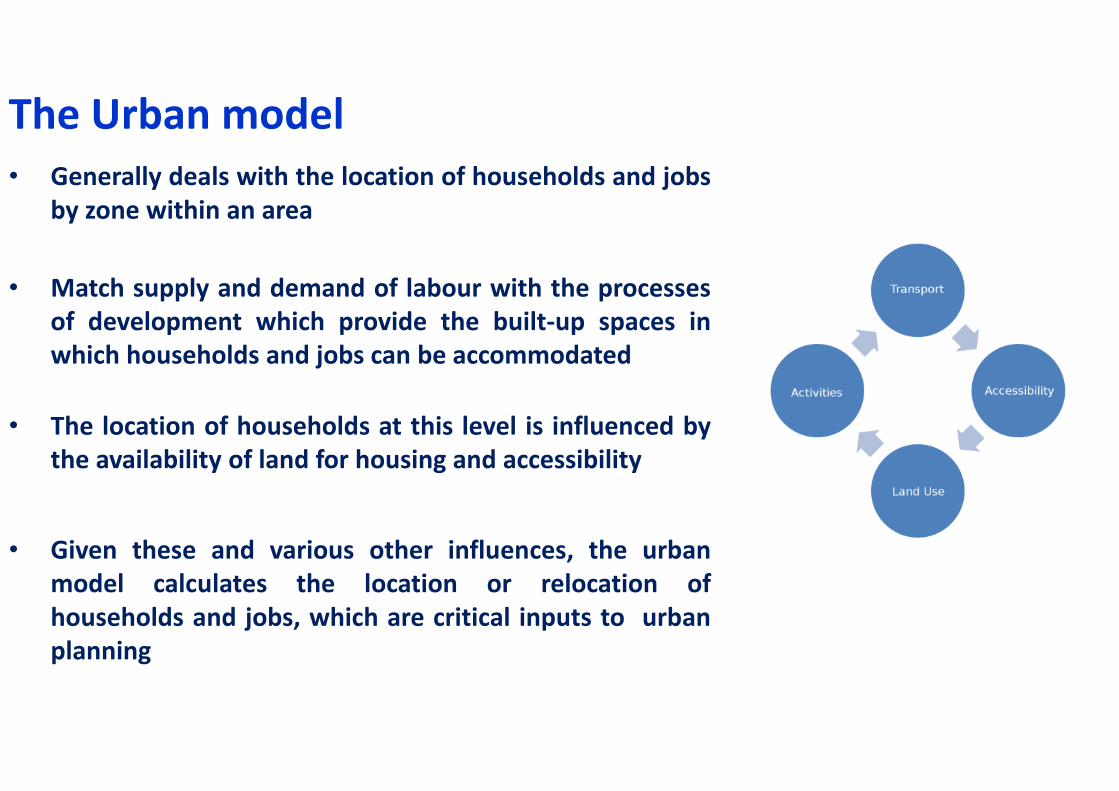
The Urban model
• Generally deals with the location of households and jobs
by zone within an area
• Match supply and demand of labour with the processes
of development which provide the built-up spaces in
which households and jobs can be accommodated
• The location of households at this level is influenced by
the availability of land for housing and accessibility
• Given these and various other influences, the urban
model calculates the location or relocation of
households and jobs, which are critical inputs to urban
planning
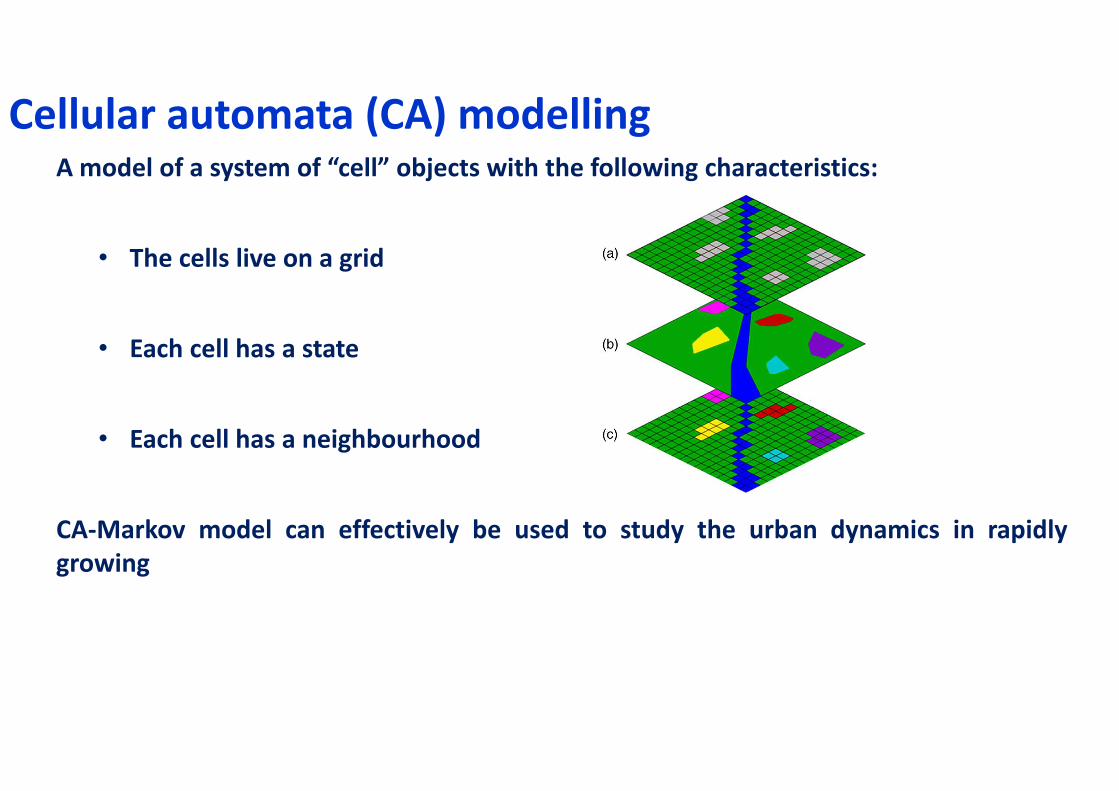
Cellular automata (CA) modellingA model of a system of “cell” objects with the following characteristics:
• The cells live on a grid
• Each cell has a state
• Each cell has a neighbourhood
CA-Markov model can effectively be used to study the urban dynamics in rapidly
growing
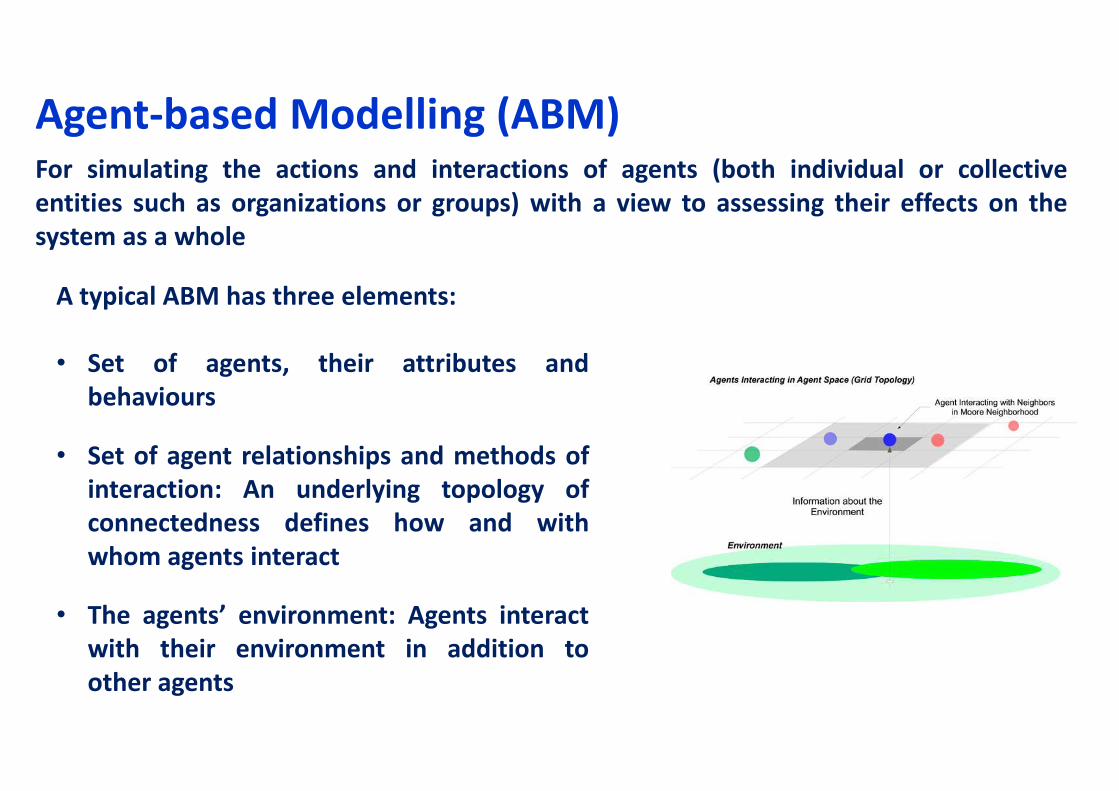
Agent-based Modelling (ABM)For simulating the actions and interactions of agents (both individual or collective
entities such as organizations or groups) with a view to assessing their effects on the
system as a whole
A typical ABM has three elements:
• Set of agents, their attributes and
behaviours
• Set of agent relationships and methods of
interaction: An underlying topology of
connectedness defines how and with
whom agents interact
• The agents’ environment: Agents interact
with their environment in addition to
other agents

Big data and urban planning
• In general, the amount of data being
created by, and about, humans is
increasing exponentially
• Data to understand individual behaviour
are hard to come by
• Individual-level models (e.g. ABM) can
capture these properties
• Essential data input for understanding
urban dynamics and designing 'smart'
cities
• The 'Big Data’ systems might help urban
planning efforts

PEOPLE ARE NOT EVENLY DISTRIBUTED ACROSS AREAL UNITS
Geospatial tools are used to redistribute population
values to inhabited areas enhancing visualization and
accuracy
Dasymetric Mapping
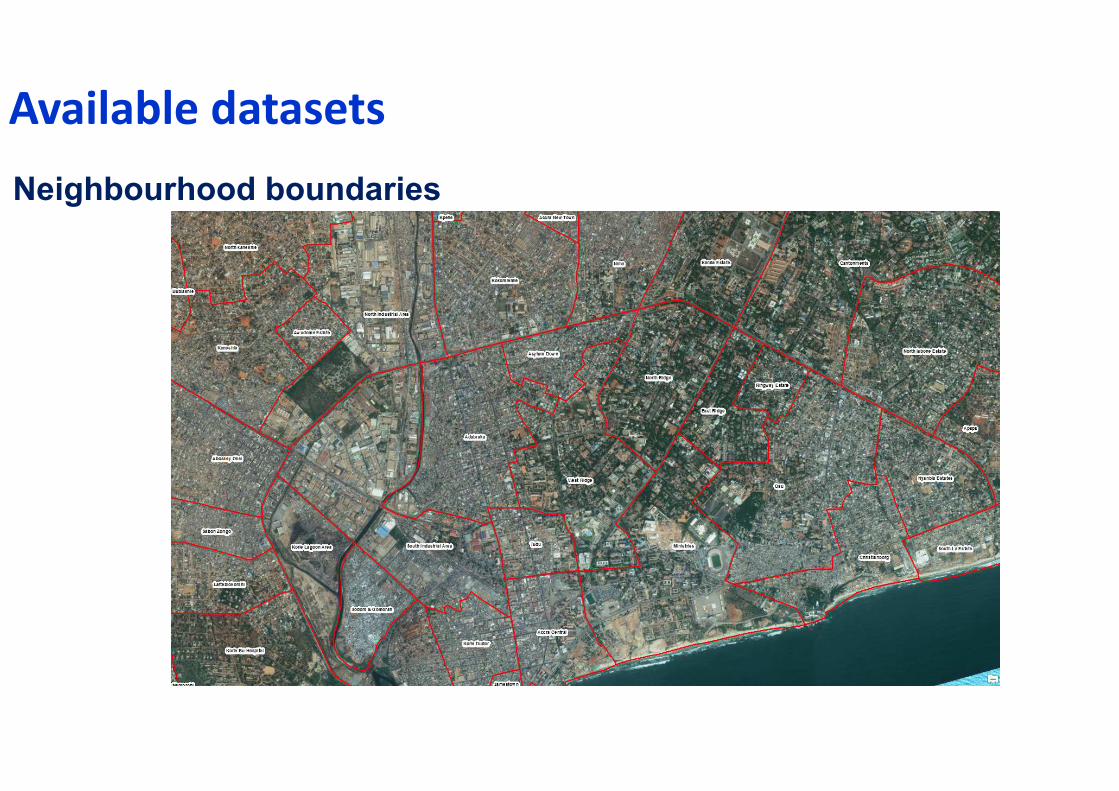
Neighbourhood boundaries
Available datasets

Regional land cover and land use classification

Intra-urban Land Cover and Land Use Classification

Thank [email protected]
Agent-based modelling and resource network optimisation for the WASH sector in GAMA, Ghana
Koen H. van Dam and Harry Triantafyllidis
Department of Chemical Engineering
Imperial College London, UK
6 August 2015
FCA resilience.io Platform:Resource Economic Human Ecosystem Modelling Platform Prototype

Outline
• Introduction• Research context
• Role of modelling and simulation
• Agent-based modelling (Koen H. van Dam)
• What and why
• Applications in energy systems and land-use planning
• Optimisation (Harry Triantafyllidis)
• What and why
• Applications in energy systems
• Towards a model for the WASH sector
• Application of decision-support model in GAMA
• Discussion
Introduction and context
Speaker: Dr Koen H. van Dam
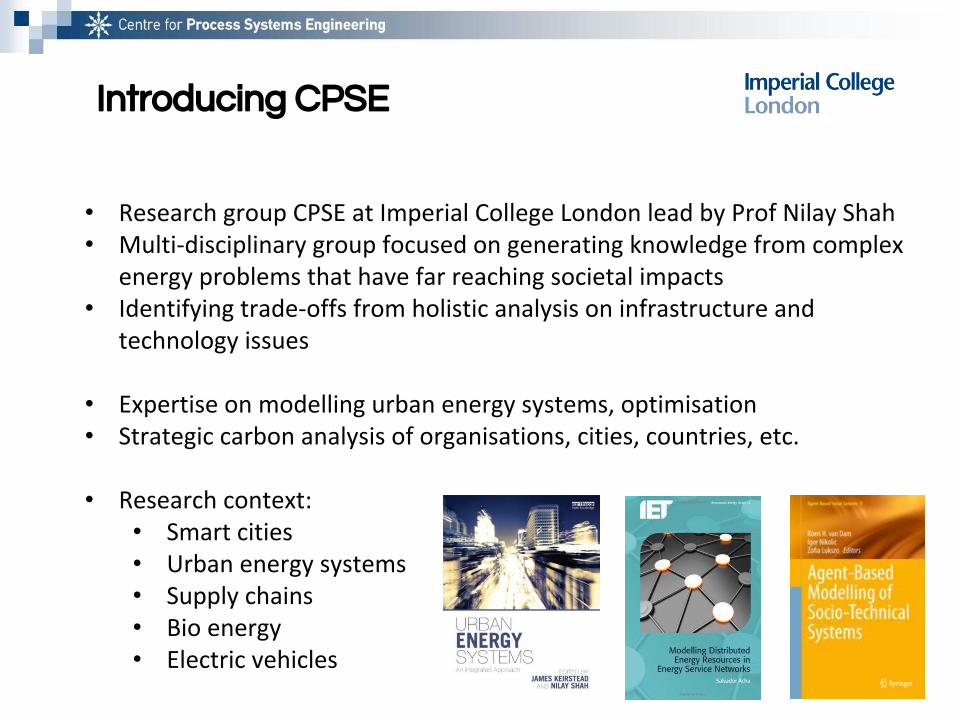
Introducing CPSE
• Research group CPSE at Imperial College London lead by Prof Nilay Shah• Multi-disciplinary group focused on generating knowledge from complex
energy problems that have far reaching societal impacts• Identifying trade-offs from holistic analysis on infrastructure and
technology issues
• Expertise on modelling urban energy systems, optimisation• Strategic carbon analysis of organisations, cities, countries, etc.
• Research context:• Smart cities• Urban energy systems• Supply chains• Bio energy• Electric vehicles

• Spatial and temporal characteristics• Social behaviour (individuals and
organisations)• Combination of resources and
technologies (integrated solution)
“The combined processes of acquiring and using energy to satisfy the energy service demands of a given urban area” (Keirstead et al., 2012)
(Keirstead and Shah, 2013)
Urban Energy Systems
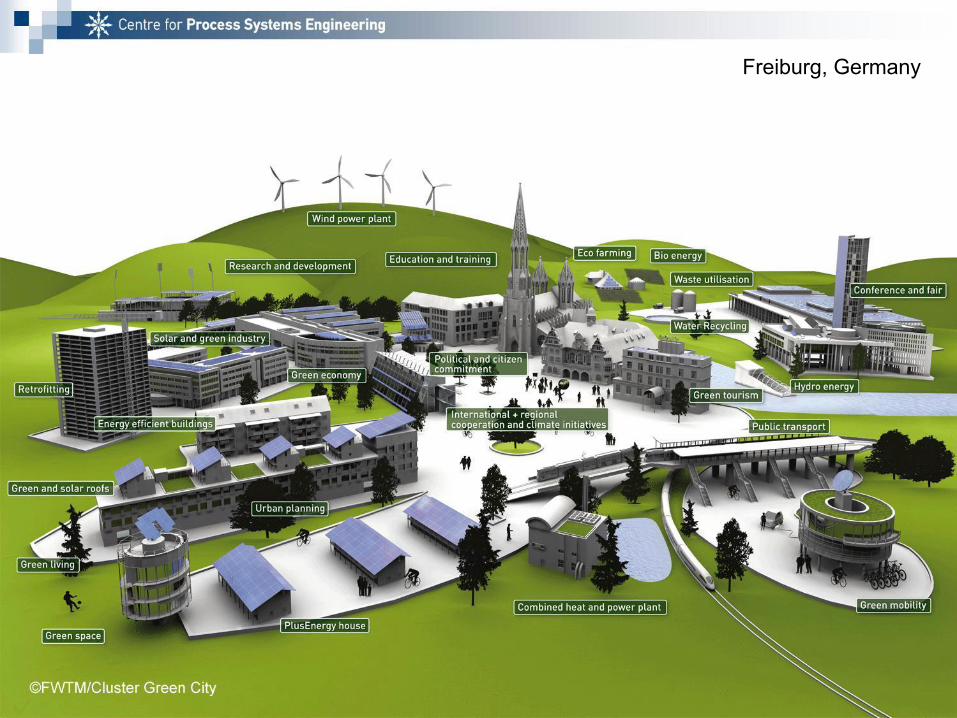
Freiburg, Germany

Source: http://freshspectrum.com/simulation/

Decision support with computational models• Simulation and modelling:
• Describing current or future states of a system and experimenting with possible futures “what if…”
• Optimisation:
• Determining values for parameters that meet a certain objective under given constraints
• Connecting simulation models with optimisation
Agent-based modelling
Speaker: Dr Koen H. van Dam

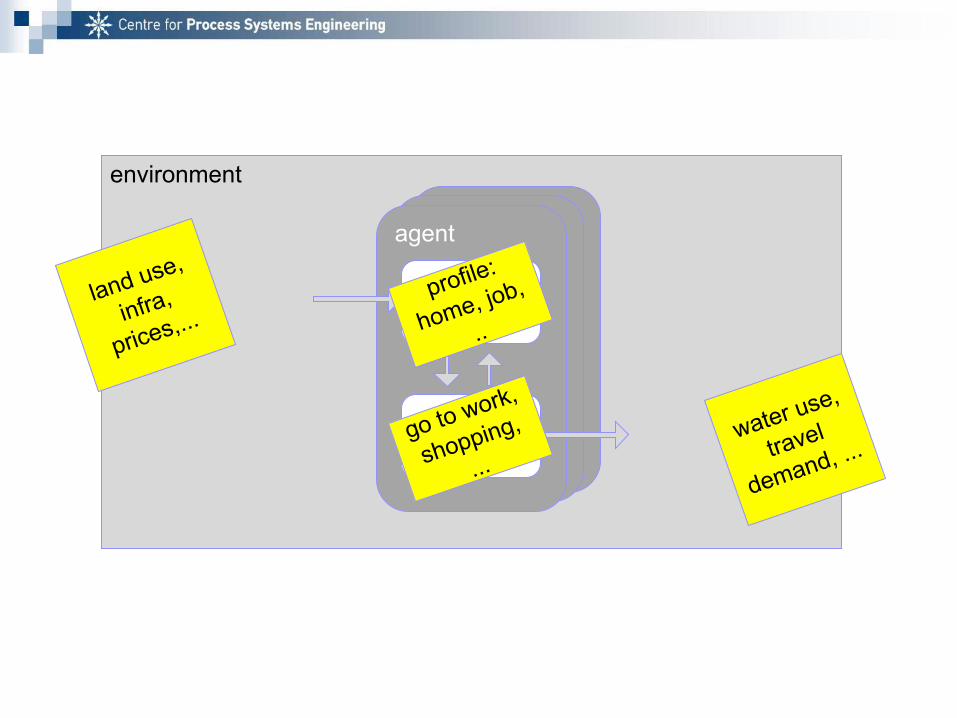
Agent-based modelling is a computational method that enables a researcher to create, analyze, and experiment with models composed of agents that interact within an environment.
(Nigel Gilbert, 2007)
Definition agent-based modelling
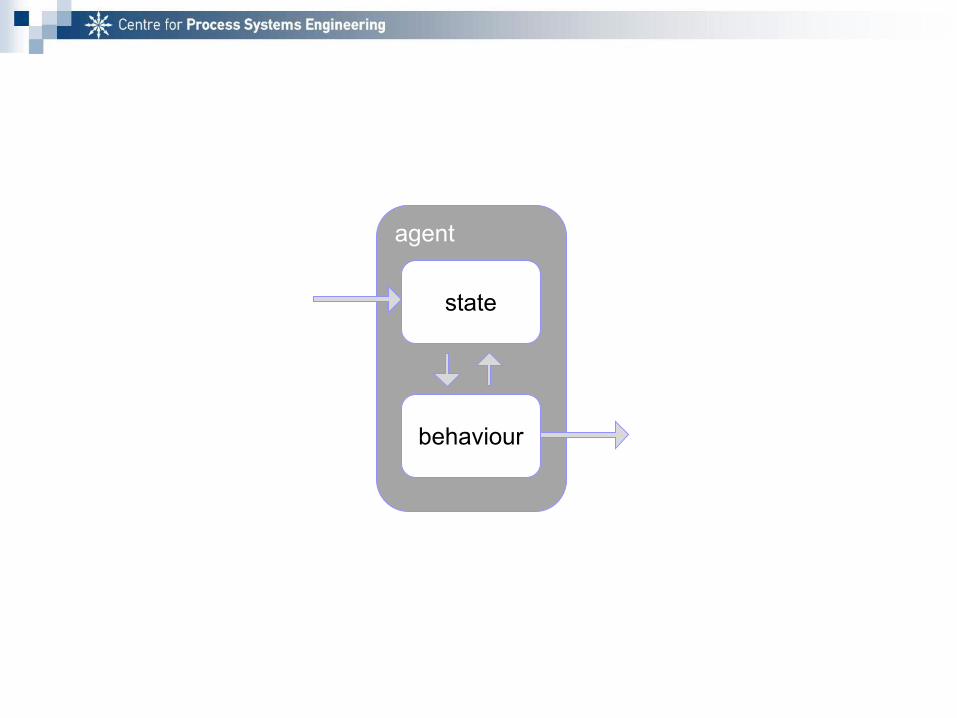
agent
state
behaviour

agentagentagent
state
behaviour

environment
agentagentagent
state
behaviour

environment
agentagentagent
state
behaviour
profile:
home, job,
..
go to work,
shopping,
...
environment
agentagentagent
state
behaviour
profile:
home, job,
..
go to work,
shopping,
...
land use,
infra,
prices,...
water use,
travel
demand, ...
environment
agentagentagent
state
behaviour
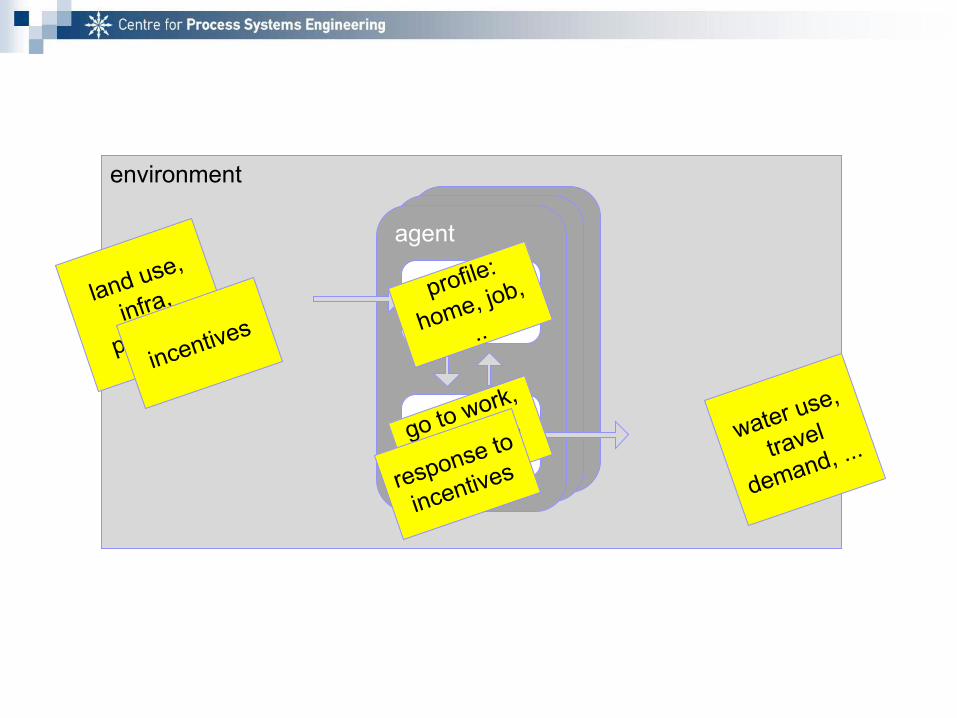
profile:
home, job,
..
go to work,
shopping,
...
land use,
infra,
prices,...
incentives
response to
incentives
water use,
travel
demand, ...

ABM case study 1: electric vehicles
(Bustos-Turu, van Dam, Acha and Shah, 2015)
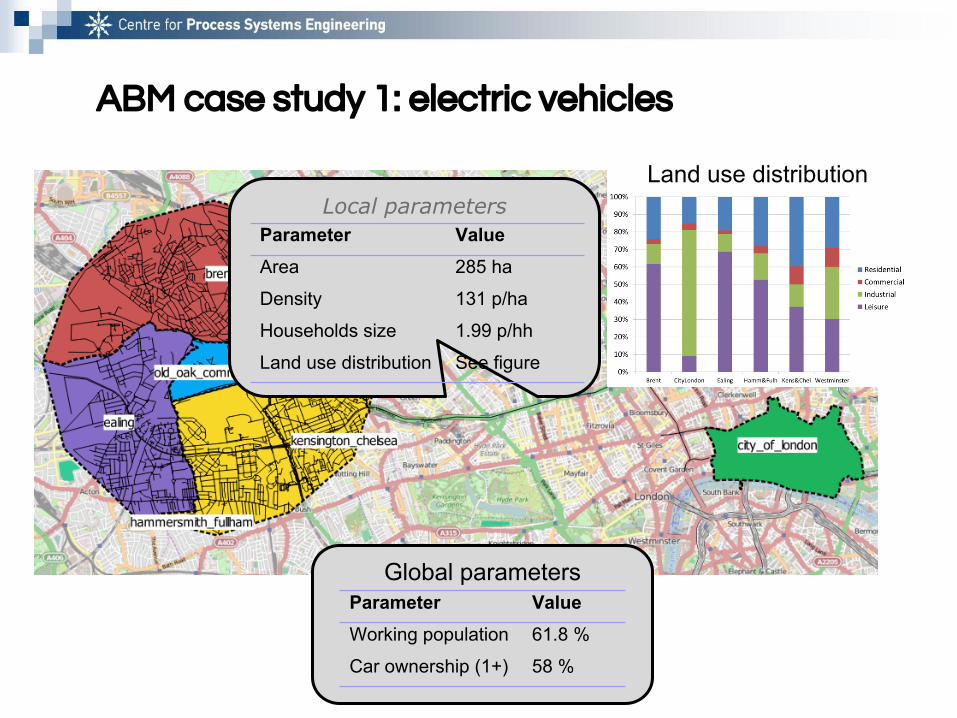
Local parametersParameter ValueArea 285 ha
Density 131 p/ha
Households size 1.99 p/hh
Land use distribution See figure
ABM case study 1: electric vehicles
Global parametersParameter ValueWorking population 61.8 %
Car ownership (1+) 58 %
Land use distribution
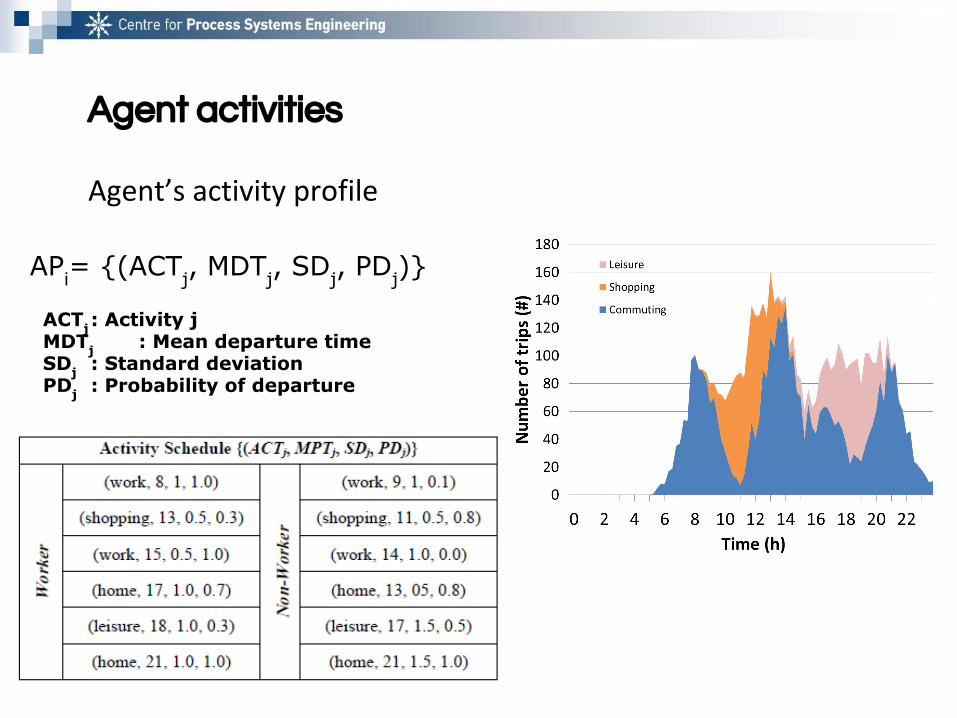
Agent activities
Agent’s activity profile
APi= {(ACTj, MDTj, SDj, PDj)}
ACTj: Activity jMDTj : Mean departure timeSDj : Standard deviationPDj : Probability of departure

Results: Single-objective optimisation
Plug and forget Plug and forget (50%) Network Costs
EV Charging Costs
EV Charging CO2
Network Losses
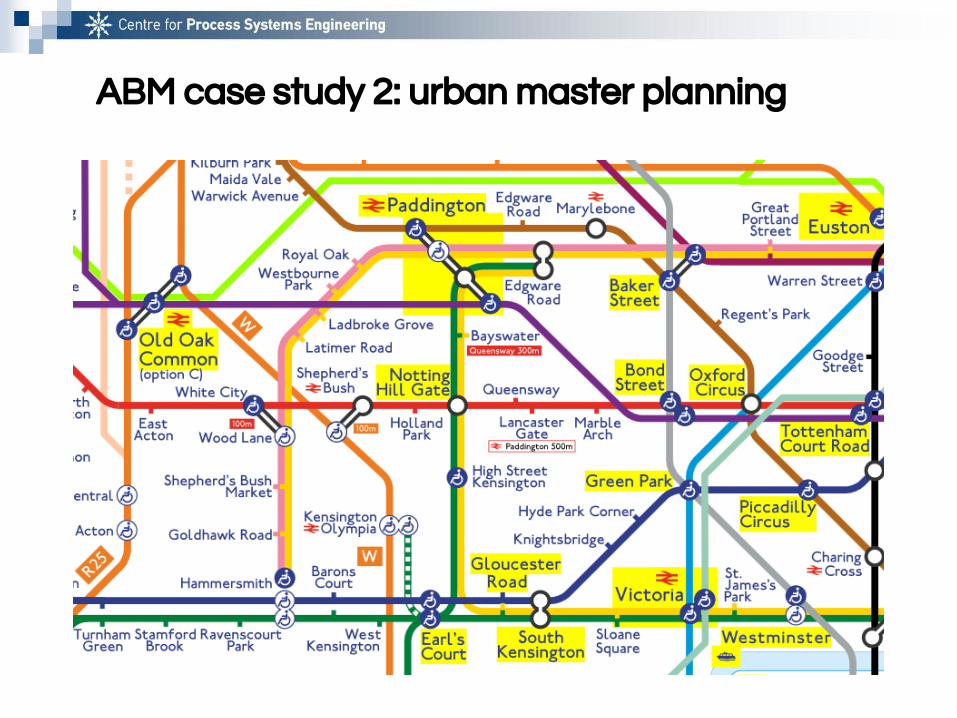
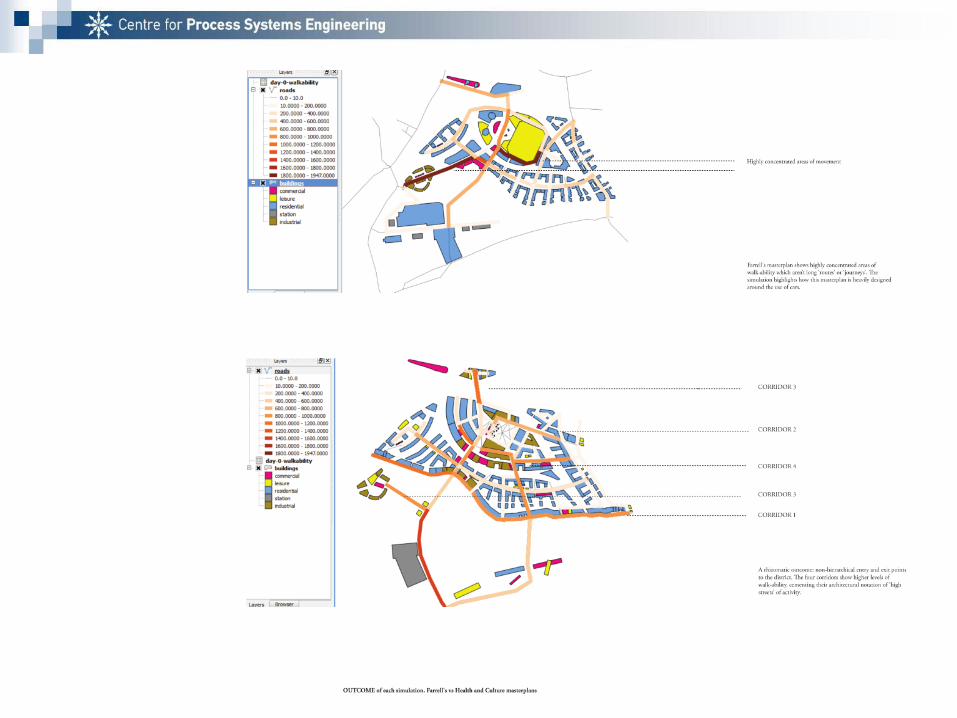
ABM case study 2: urban master planning
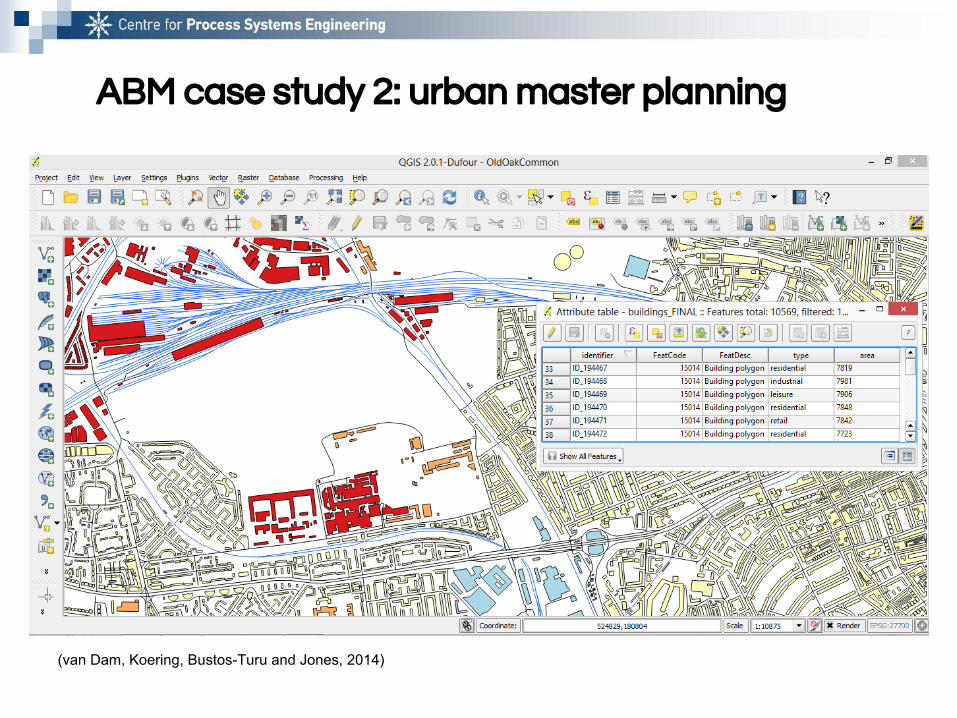
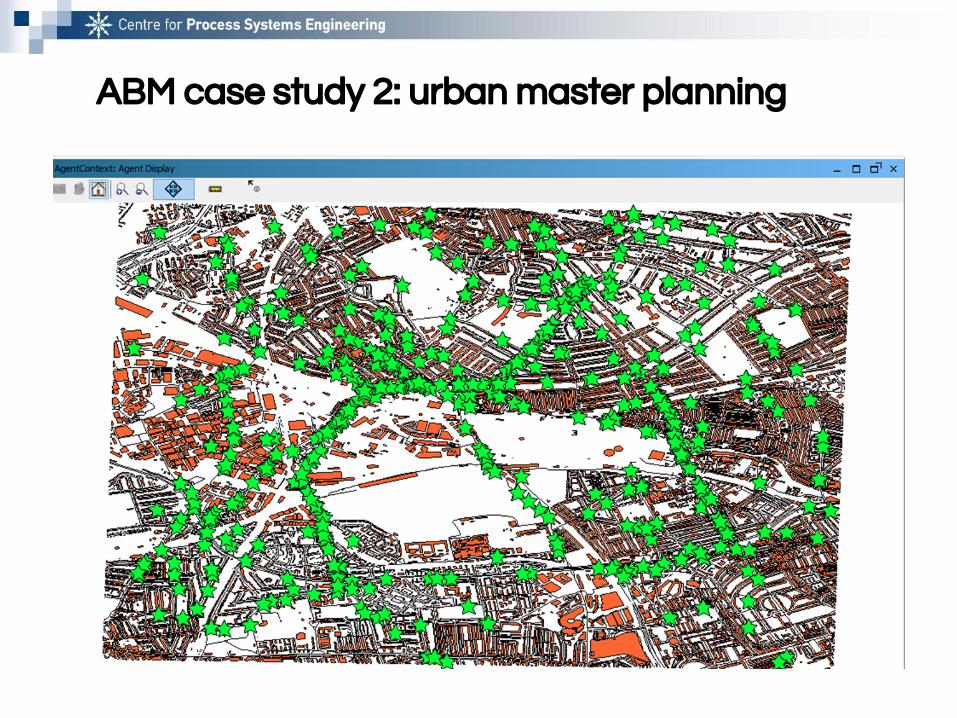
ABM case study 2: urban master planning
(van Dam, Koering, Bustos-Turu and Jones, 2014)
ABM case study 2: urban master planning
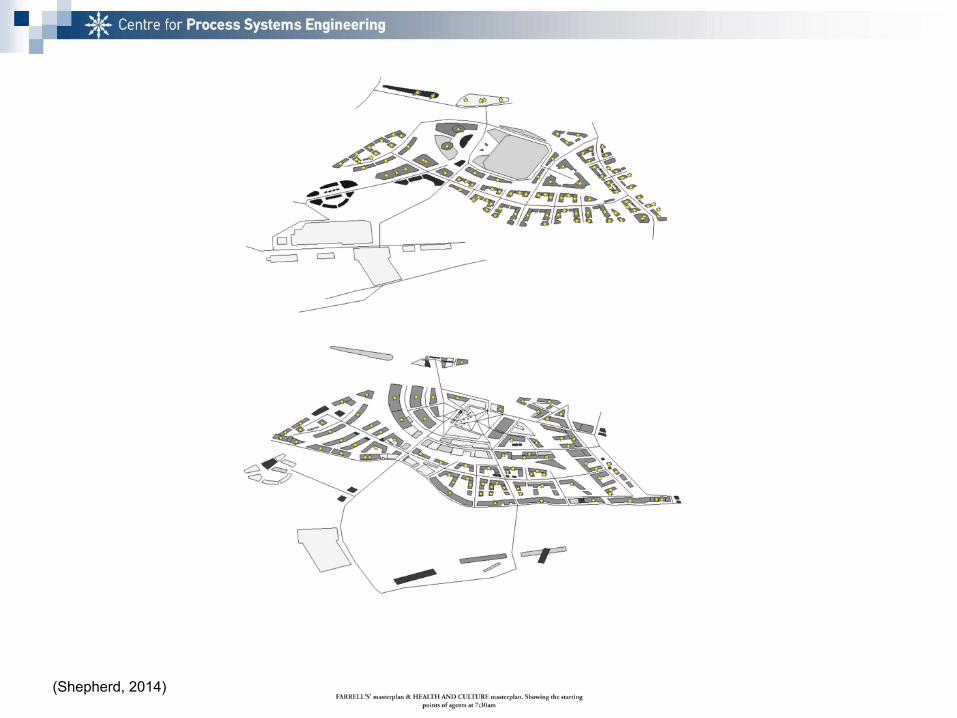
(Shepherd, 2014)
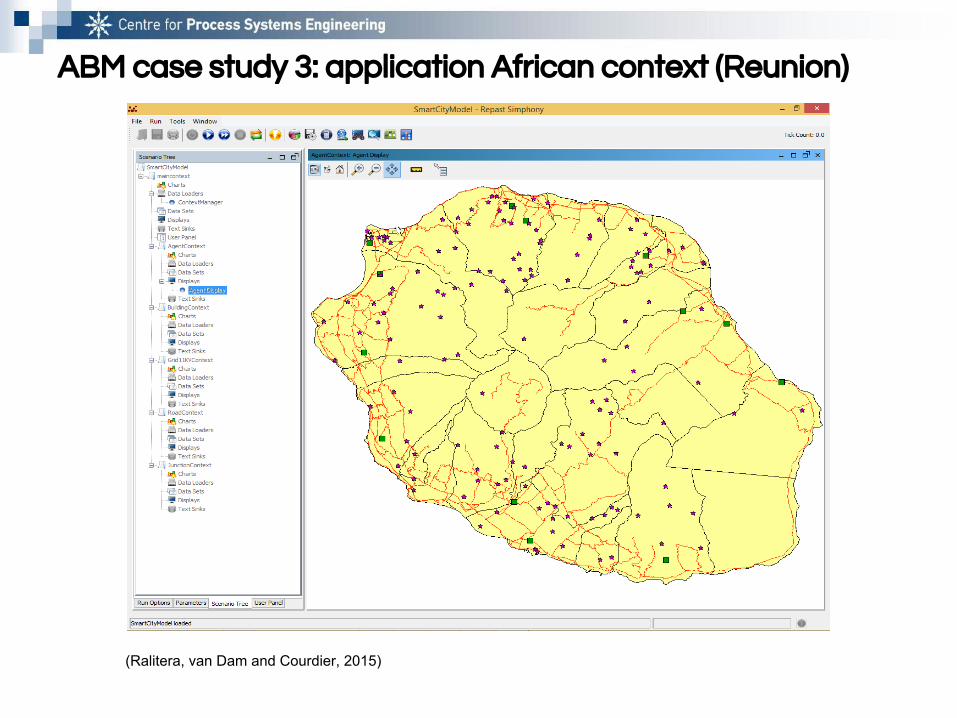
ABM case study 3: application African context (Reunion)
(Ralitera, van Dam and Courdier, 2015)

ABM case study 3: application African context (Reunion)

Resource-Technology Network optimisation
Speaker: Dr Harry Triantafyllidis
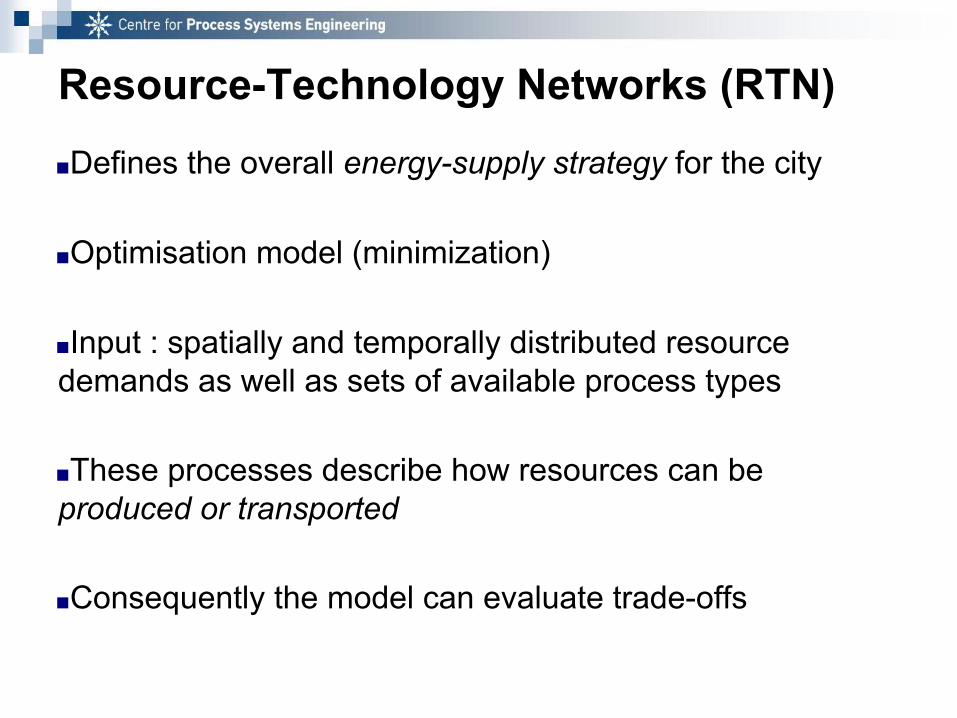
Resource-Technology Networks (RTN)
■Defines the overall energy-supply strategy for the city
■Optimisation model (minimization)
■Input : spatially and temporally distributed resource demands as well as sets of available process types
■These processes describe how resources can be produced or transported
■Consequently the model can evaluate trade-offs
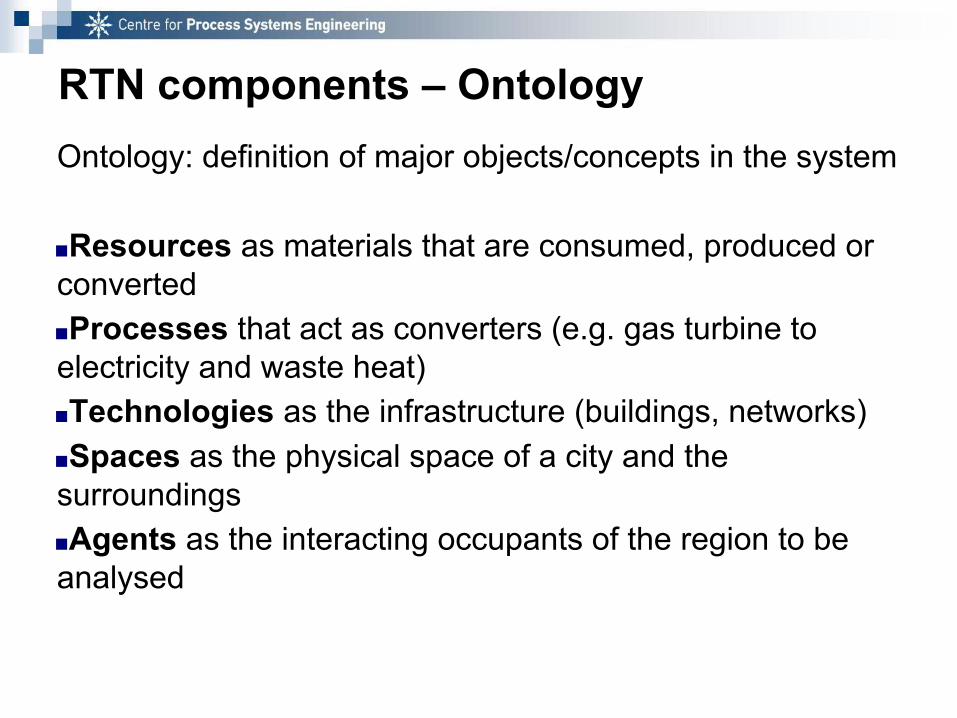
RTN components – OntologyOntology: definition of major objects/concepts in the system
■Resources as materials that are consumed, produced or converted■Processes that act as converters (e.g. gas turbine to electricity and waste heat)■Technologies as the infrastructure (buildings, networks)■Spaces as the physical space of a city and the surroundings■Agents as the interacting occupants of the region to be analysed
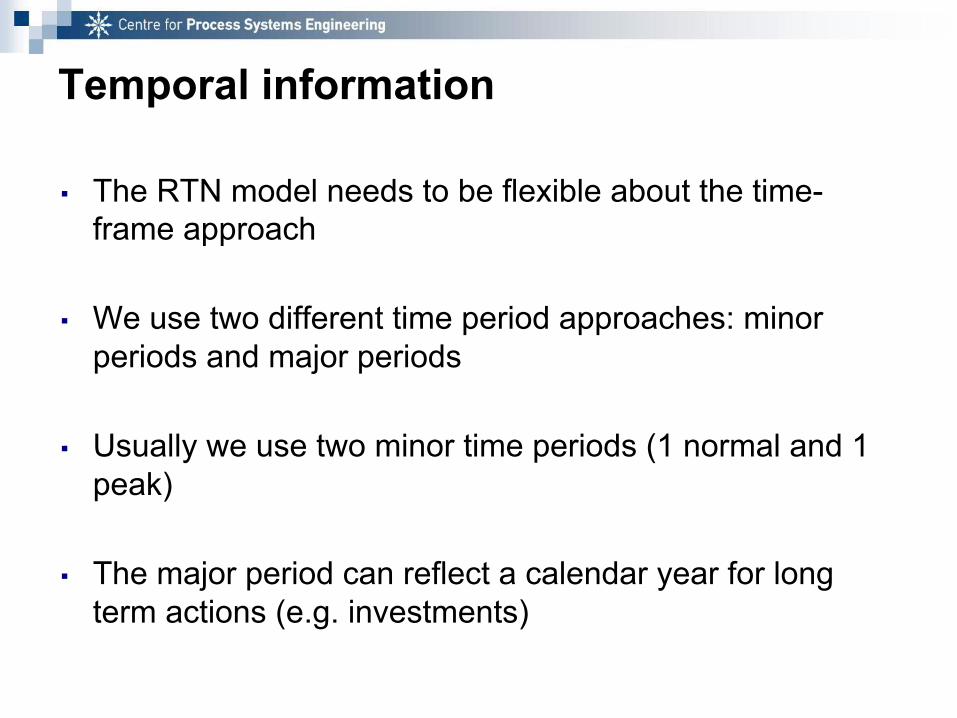
Temporal information
▪ The RTN model needs to be flexible about the time-frame approach
▪ We use two different time period approaches: minor periods and major periods
▪ Usually we use two minor time periods (1 normal and 1 peak)
▪ The major period can reflect a calendar year for long term actions (e.g. investments)

Technology and Urban Resource Network
■ Given: resource demands in time and space■ How to meet these demands?
■ Fulfilment strategies:◻ Import resources from external hinterlands◻ Use available resources within the city◻ Convert one set of resources to those required ◻ Transport resources from one part of city to another◻ Store resources for later use

RTN problem statement■ Given
◻ Spatially and temporally explicit resource demands◻ Coefficients and metrics (e.g. cost, GHG) data, economies of
scale■ Determine
◻ Network construction■ What technologies?■ What scales?■ What interactions?■ Which resources are stored
◻ Network operation■ Over time
◻ Different technologies may be used at different times/seasons■ To optimise some metric of the network
◻ Cost, GHG emissions etc.
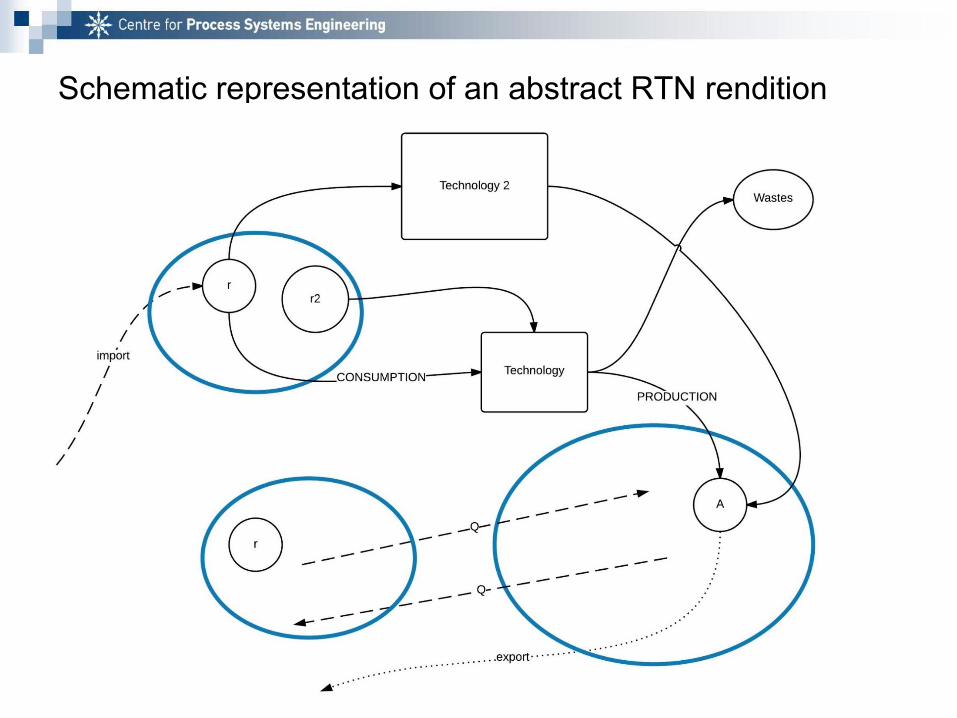
Schematic representation of an abstract RTN rendition
Simplified structure of the RTN model
■ A set that defines the number and the geometrical interconnections of the cells to be simulated
■ A set of variables to be estimated by the model
■ A set of constraints
■ A set of bounds on variables
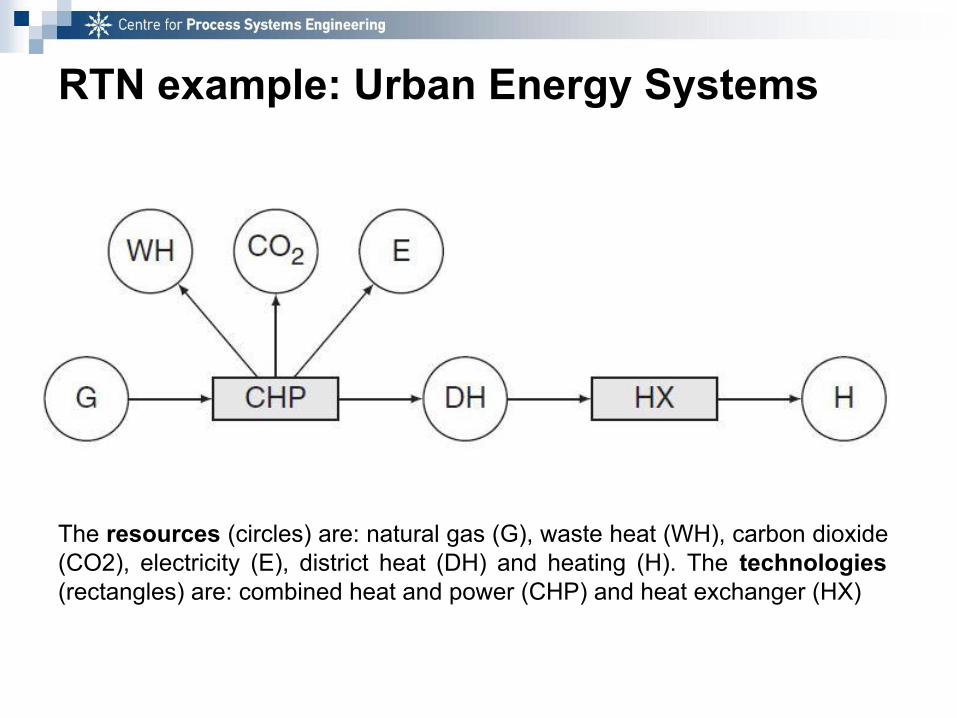
RTN example: Urban Energy Systems
The resources (circles) are: natural gas (G), waste heat (WH), carbon dioxide (CO2), electricity (E), district heat (DH) and heating (H). The technologies (rectangles) are: combined heat and power (CHP) and heat exchanger (HX)

Towards a model for the WASH sector
Speakers: Koen van Dam and Harry Triantafyllidis
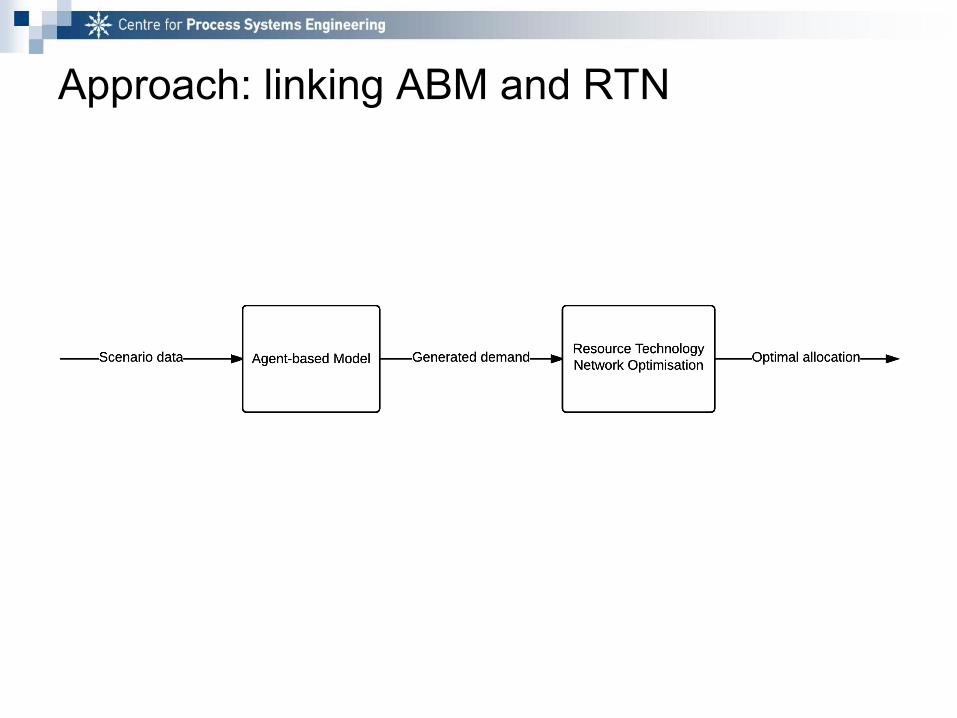
Approach: linking ABM and RTN
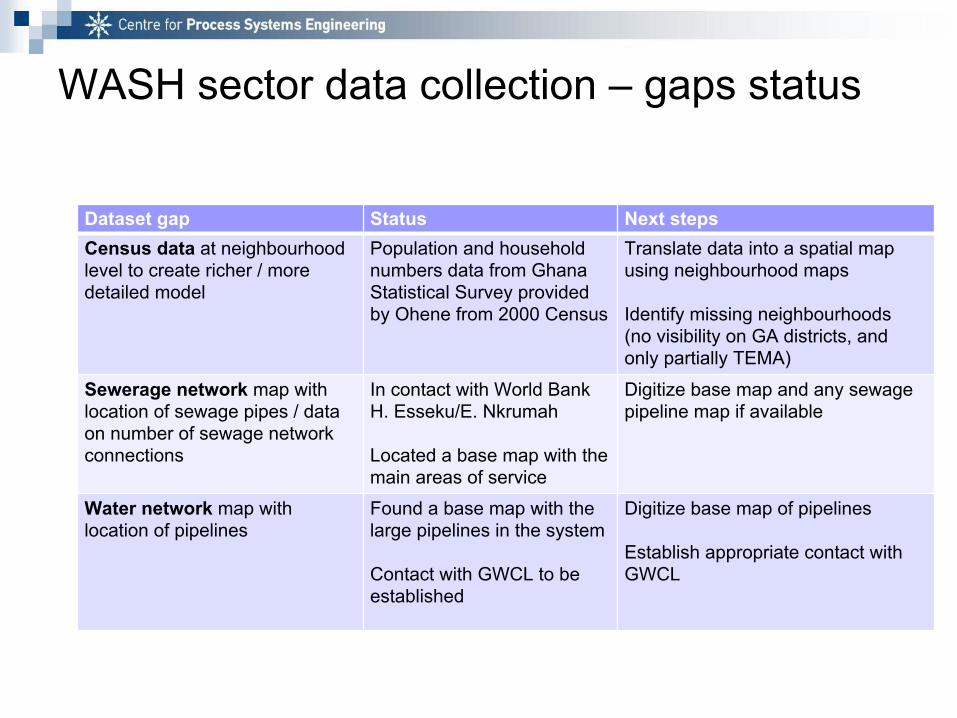
WASH sector data collection – gaps status
Dataset gap Status Next stepsCensus data at neighbourhood level to create richer / more detailed model
Population and household numbers data from Ghana Statistical Survey provided by Ohene from 2000 Census
Translate data into a spatial map using neighbourhood maps
Identify missing neighbourhoods (no visibility on GA districts, and only partially TEMA)
Sewerage network map with location of sewage pipes / data on number of sewage network connections
In contact with World Bank H. Esseku/E. Nkrumah
Located a base map with the main areas of service
Digitize base map and any sewage pipeline map if available
Water network map with location of pipelines
Found a base map with the large pipelines in the system
Contact with GWCL to be established
Digitize base map of pipelines
Establish appropriate contact with GWCL

Adding GAMA road network (OpenStreetMap)
(Background and roads © OpenStreetMap contributors)
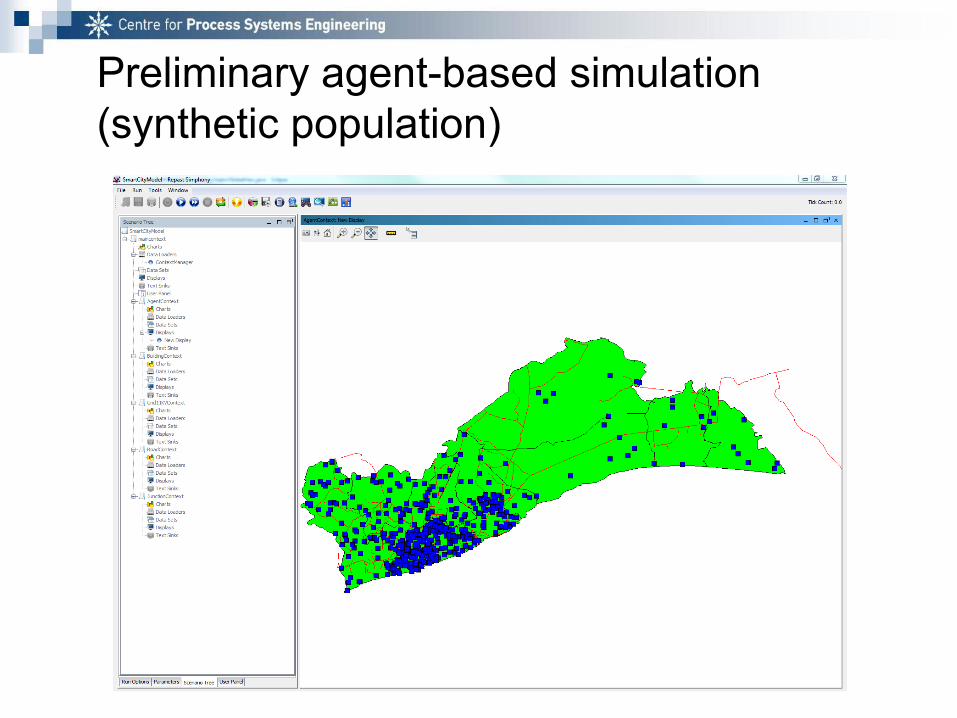
Preliminary agent-based simulation (synthetic population)

Preliminary water demand calculation
Assumption: water demand changes with level of income:◻ Low-medium-high income: 40 – 60 – 110 litres per person*
◻ Calculate 2010 income groups per district (from Ghana Statistical Survey data)
◻ Estimate domestic water demands + commercial/industrial
◻ Create scenarios for population and income over time to see how this affects water demand in the future
Next step: activity based water demands → Cleaning, bathing, toilet use, cooking, washing hands, luxury activities, etc. as outcome of the agent behaviour modelled in the ABM
Adank, M. et al. (2011). Towards integrated urban water management in the Greater Accra Metropolitan Area: Current status and
strategic directions for the future. SWITCH/RCN Ghana
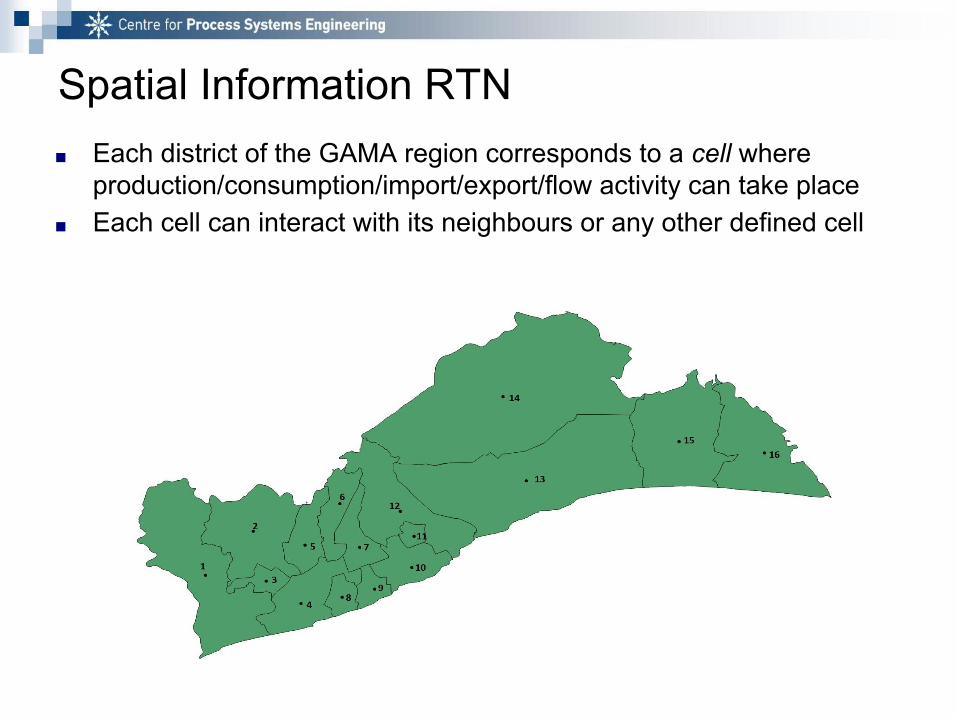
Spatial Information RTN■ Each district of the GAMA region corresponds to a cell where
production/consumption/import/export/flow activity can take place■ Each cell can interact with its neighbours or any other defined cell

Test case input/output data
■ Input demands were calculated via the agent-based modelling and reflect real-world values for GAMA.
The optimal solution :➢ given the input data
➢ given the constraints (meeting the demands etc.)
➢ calculates the variables ALL IN SUCH A WAY SO AS the total CAPEX – OPEX and GHG emissions are minimized → scope of sustainability

Modelling scenario■ Scheme implemented for demonstration:
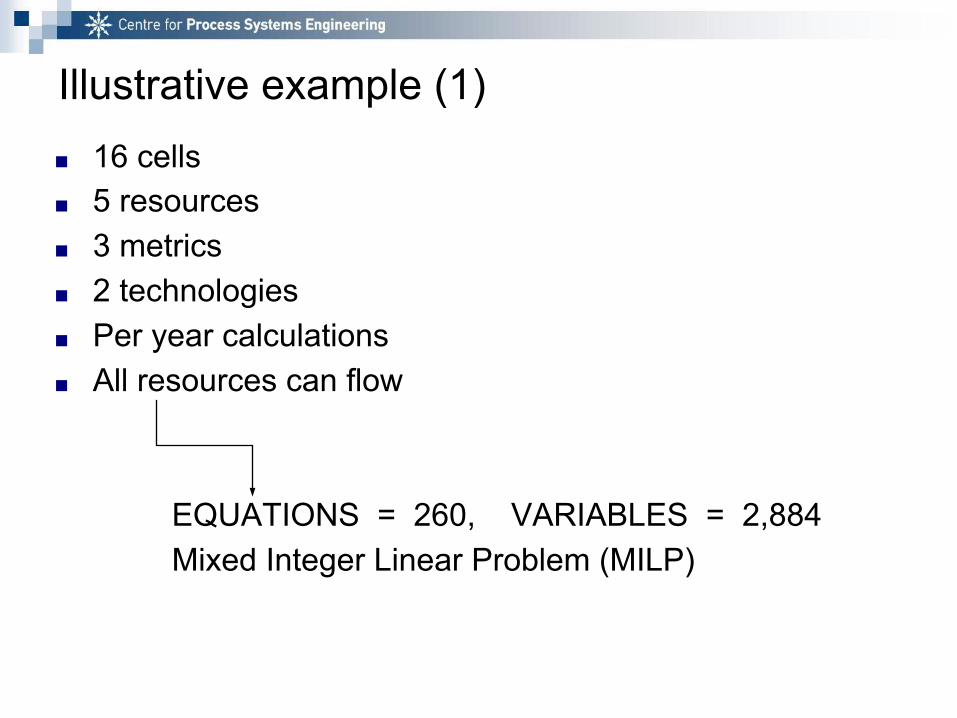
Illustrative example (1)■ 16 cells■ 5 resources■ 3 metrics■ 2 technologies■ Per year calculations■ All resources can flow
EQUATIONS = 260, VARIABLES = 2,884 Mixed Integer Linear Problem (MILP)

Demands:16 districts (m3/day, avg 2010)
1. ADA_EAST = 2,783.94982022903 2. ADA_WEST = 2,817.40968003779 3. ADENTA = 4,584.05651259888 4. ACCRA_METROPOLITAN = 97,198.1363844392 5. ASHAIMAN = 11,156.81417964996. GA_CENTRAL = 5,652.136827135747. GA_SOUTH = 22,146.82239401798. GA_WEST = 8,946.131851447786 9. GA_EAST = 6,448.579750501136
10. KPONE_KATAMANSO = 6,508.647046268657511. LA_DADE_KOTOPON = 11,162.53733545876112. LA_NKWANTANANG_MADINA = 5,536.912201766539513. LEDZOKUKU_KROWOR = 13,280.47788387913214. NINGO_PRAMPRAM = 3,472.343003008136315. SHAI_OSUDOKU = 2,357.73681841173516. TEMA_METROPOLITAN = 17,415.50479511844
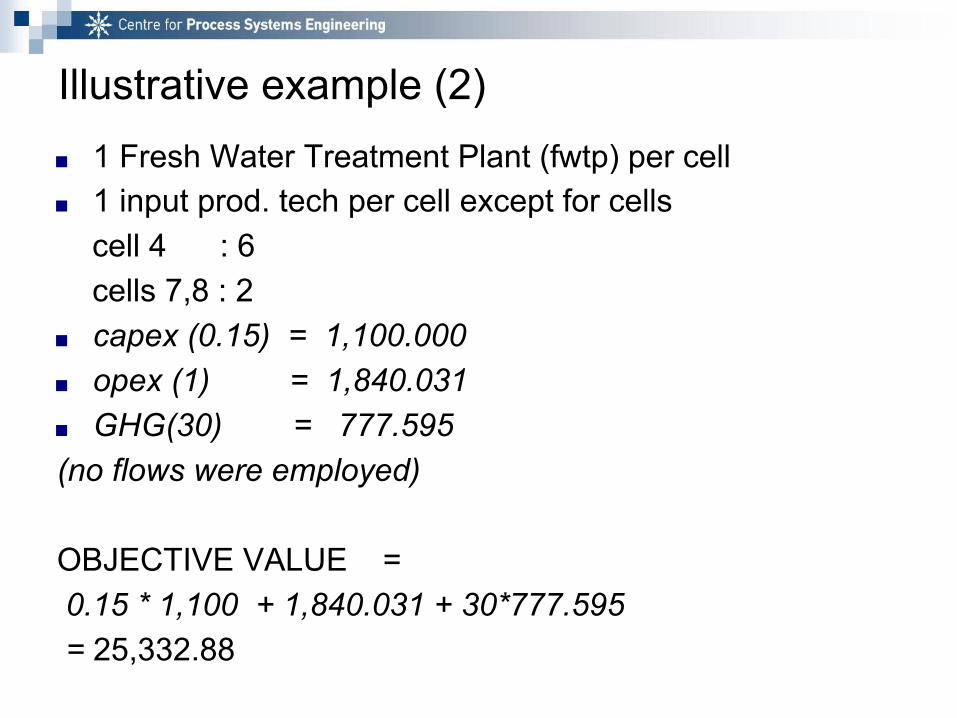
Illustrative example (2)■ 1 Fresh Water Treatment Plant (fwtp) per cell■ 1 input prod. tech per cell except for cells cell 4 : 6 cells 7,8 : 2■ capex (0.15) = 1,100.000 ■ opex (1) = 1,840.031 ■ GHG(30) = 777.595(no flows were employed)
OBJECTIVE VALUE = 0.15 * 1,100 + 1,840.031 + 30*777.595 = 25,332.88

Illustrative example (3)CHANGE : increased CAPEX for techs!■1 fwtp for cells : 4,7,8,13,14,15,16 (7 out of 16)■1 input prod. tech per cell except for cells cell 4 : 6 cell 7 : 3, cell 8 : 2, cells 13-16 : 1■capex (0.15) = 58,000.000 ■opex (1) = 1,840.662 ■GHG(30) = 790.217 FLOWS WERE EMPLOYEDOBJECTIVE VALUE = 0.15*58,000 + 1,840.662 + 30*790.217 = 34,247.1612

Model integration and software interfaces

Future Decision SupportThis is work-in-progress:■Examples shown are for illustration and simplified for the demonstration■This does not limit the potential of the final platform
Iterative expansions include:■Build detailed water use and sewage flow from human activities (modelled)■Include a more complete set of technologies for water and sanitation■Incorporate long-term population and economic scenarios■Expand indicators beyond financial and greenhouse gas emissions

Future Decision Support (cont’d)Model to calculate for decision support:
■Water demand/sewage production maps using scenarios 5-20 years ahead■Technologies that can meet water demand (% water demands met) and sanitation needs (% sewerage coverage)■Financial, environmental, social implications of technology choice■Implications of operational sustainability of policy/cost changes
■September TTG session: use cases

Agent-based modelling and resource network optimisation for the WASH sector in GAMA, Ghana
Koen H. van Dam and Harry [email protected]@imperial.ac.uk c.
[email protected] of Chemical Engineering
Imperial College London, UK
6 August 2015
Thank you for your attention!

Questions
Next meeting - 10th September 10:00-11:30 http://ecosequestrust.org/GAMA