agent-based modeling and simulation of depression … · agent-based modeling and simulation of...
TRANSCRIPT

Paper ID #16861
Agent-Based Modeling and Simulation of Depression and Its Impact on Stu-dent Success and Academic Retention
Sherif Elmeligy Abdelhamid, Virginia Tech
Sherif is a PhD candidate at the Department of Computer Science, Virginia Polytechnic Institute and StateUniversity and is a graduate research assistant at Network Dynamics and Simulations Science Laboratory.Sherif’s research work lies at the intersection of computation, biology and education: in particular, heis interested in designing and building software systems to enable domain experts to easily access andeffectively use high performance computing to perform and share the findings of simulations and largescale data analyses. Other aspects of his research focus on how to use these systems as learning tools forstudents and teachers.
Dr. Chris J. Kuhlman, Virginia Bioinformatics Institute
Chris is a Research Scientist at the Biocomplexity Institute at Virginia Tech. His research interests includediscrete dynamical systems, agent-based modeling and simulation, distributed and high performance com-puting, algorithms, social sciences and modeling, and network science.
Prof. Madhav V. Marathe, Virginia Tech
Madhav Marathe is the director of the Network Dynamics and Simulation Science Laboratory and pro-fessor in the department of computer science, Virginia Tech. His research interests are in computationalepidemiology, network science, design and analysis of algorithms, computational complexity, communi-cation networks and high performance computing. Before coming to Virginia Tech, he was a Team Leaderin the Computer and Computational Sciences division at the Los Alamos National Laboratory (LANL)where he led the basic research programs in foundations of computing and high performance simulationscience for analyzing extremely large socio-technical and critical infrastructure systems. He is a Fellowof the IEEE, ACM and AAAS.
Prof. S. S. Ravi, University at Albany - SUNY
Ravi received his Ph.D. in Computer Science in 1984 and joined the Computer Science faculty at the Uni-versity at Albany – State University of New York. His current title is DIstinguished Teaching Professor.His areas of interest include algorithms, discrete dynamical systems, data mining, network science andwireless networks.
Dr. Kenneth Reid, Virginia Tech
Kenneth Reid is the Assistant Department Head for Undergraduate Programs in Engineering Education atVirginia Tech. He is active in engineering within K-12, serving on the TSA Board of Directors. He andhis coauthors were awarded the William Elgin Wickenden award for 2014, recognizing the best paper inthe Journal of Engineering Education. He was awarded an IEEE-USA Professional Achievement Awardin 2013 for designing the nation’s first BS degree in Engineering Education. He was named NETI Fac-ulty Fellow for 2013-2014, and the Herbert F. Alter Chair of Engineering (Ohio Northern University) in2010. His research interests include success in first-year engineering, engineering in K-12, introducingentrepreneurship into engineering, and international service and engineering. He has written two texts inDigital Electronics, including the text used by Project Lead the Way.
c©American Society for Engineering Education, 2016

Agent-Based Modeling and Simulation of Depression and ItsImpact on Students’ Success and Academic Retention
Abstract
In the U.S., major depressive disorder affects approximately 14.8 million American adults.Furthermore, depression can lead to a several other illnesses and disabilities. Economic burden ofdepression is estimated to be $53 billion annually in the U.S. alone. Depression can reach highlevels that can lead to suicide, the third leading cause of death among the U.S. college-agedpopulation.
Studies show a direct relation between mental health and academic success. In particular,depression is a significant predictor of lower GPA and increased drop out rate. A 15 pointincrease on the depression scale correlates with a 0.17 drop in GPA and corresponds to a 4.7percent increase in probability of dropping out. High dropout rates also adversely impact bothuniversities and society.
In this work, we construct and exercise an agent-based model (ABM) of the evolution ofdepression among a population of roughly 19,000 college students. This model includeswithin-agent interactions among depression symptoms and agent-to-agent interactions defined bya college student social network. We conduct simulation studies to identify (model) parametersand initial conditions that most influence population outcomes. Connectivity among within-agentsymptoms is demonstrated to have a large effect on population levels of depression.
————————————————————
Introduction
Background
Dropout rates of engineering students are high in the United States1,2. Increased dropout rateshave negative impacts on students, institutions and society. From a student’s perspective, quittingschool can lower self-confidence and self-esteem3. From an institutional perspective, studentdropouts represent a loss of talented students and indicate an institution’s lack of attention to theneeds of students4. Dropout rates effect society. The cost to the nation of these dropoutsamounted to $4.5 billion in lost earnings and taxes to state and federal governments in 20125.Factors contributing to students’ dropping out include preparation, ability, motivation,

engagement within the institution, college grade point average, financial aid, age, ethnicity andsocioeconomic status6,7,8,9.
Another important factor in withdrawing from school is side effects resulting from socialinteractions among students including friends, classmates, and roommates10,11,12,13. Depression iscontagious14,15,16,17,18,19,20,21, meaning that it can spread from person to person through differenttypes of social contacts, such as face-to-face interactions and online social media. Studies show adirect relation between mental health and academic success. Students report depression andanxiety among top impediments to academic performance22. Sixty four (64) percent of youngadults who are no longer in college cite a mental health-related reason for not attending23. In thiswork, we use agent-based modeling (ABM) to simulate the evolution of depression within asynthetic social contact network of undergraduate students at a large university.
Motivation for Agent-based Modeling of Depression
ABM of depression is important for several reasons. First, there has been much data gathered andanalyzed since at least the 1970s regarding factors that affect academic retention and attainment.These data can be used to develop and inform social behavior models that can be used insimulations. Second, simulations resolve behaviors in time. This is often critical forunderstanding causality and how local agent behaviors give rise to population-level outcomes.This is fundamentally different from performing statistical analyses using final outcomes24.Third, simulations on appropriately labeled agents that compromise a population (e.g., in the formof social networks) can produce disaggregated results. Validated models can also be used in othersettings (e.g. for different academic institutions), and can be exercised to explore counterfactuals.Finally, results from ABMs can inform experimental studies, including surveys andhuman-subjects testing. This is because ABMs can be exercised to identify which variables havethe most impact on outcomes. These are the variables that are most important to characterizethrough experiments. Hence, there is a feedback loop between experiments and modeling.
Contributions
A summary of our major contributions follows.
1. A synthetic population of 19,000 college undergraduates. A social network of the state ofVirginia was generated using the procedure in25 and used as the starting point for our work. Thesocial network contains synthetic individuals whose traits match in distribution the attributes ofthe actual population. From this network, we extracted college students (those agents in the agerange 18-22 years that have college activities and are located in the vicinity of a major university).Edges in the original social network are retained if the incident vertices are both college students.This produces a social network of 18,866 students (agents) and 119,139 pairwise student dailyinteractions.
2. Agent-based model of depression. We extend a model of within-host depression evolution26
to include the effects of social interactions. Consequently, our model accounts for internal,environmental, and social factors of the evolution of depression, consistent with many research
studies17,18,19. In particular, each agent has an internal network with 14 vertices that representdepressive symptoms. These symptoms can influence each other and we take these interactionsfrom the literature. Each agent is connected to peer students in the social network with whom shecomes in contact. Influence is transmitted through the edges. A student becomes depressed if asufficient number of symptoms becomes activated through within-host and external interactions.A student may transition back and forth between depressive and healthy states.
3. Simulation of depression in a college population. We code the agent-based model in asimulation system and exercise it using various inputs. We show that the number of depressedstudents changes with the strength of influence in the symptom interactions and in the socialnetwork. We explore the effect of initial conditions, and illustrate the interesting result thatwithin-agent symptom connectivity changes the magnitude of the steady state level of depressionwithin the population.
Related Work
Depression is a primary factor for dropping out, and it can spread from person-to-person throughsocial interactions, as stated in the Introduction. Several studies also identify peer influence as amain trigger for dropping out. Peer influence can exist in many forms. Mayer27 found, for highschool students, that the better a student’s peers performed in school, the more likely the studentis to drop out. Gaviria28 also found peer-based effects for dropping out of high school. Crane29
proposes a contagion (i.e., peer influence) approach to understanding social problems (includingschool dropping out), using an epidemic-like approach that is similar in spirit to the firstepidemic-inspired social model30. The model is closely related to segregation models31 andthreshold models32,33,34. A relatively recent overview of contagion-like influence is given in35.Bank36 identified different types of influence on students’ persistence such as peer, faculty, andparental influences. Parents and peers were found to have stronger influences than were thefaculty on the persistence of students.
Pyari37 investigated the effects of anxiety among medical and engineering students. Resultsshowed that medical students exhibited low anxiety in comparison to engineering students.Between 42% and 48% of PhD students in science and engineering at the University of Californiaare depressed38. Vitasaria39 studied the relationship between anxiety and academic performance.Results showed a significant correlation of high level anxiety and low academic performanceamong engineering students.
Students may find difficulty in keeping up with schoolwork; 36 percent of the students reportedfeeling frequently stressed40. No student reported a complete lack of worry about keeping up withschoolwork. Twenty-five percent of students reported frequent inability to pursue non-academicactivities due to lack of time. Ten percent reported feeling most of time that they did not have asocial life, while another 41 percent reported occasionally feeling this way. These life imbalancescan eventually contribute to development of depression. Another study41 revealed relationshipsbetween mental health and year of study, academic program, and gender. Rizwan42 found factorsthat affect the stress level of female engineering students. Results indicate that teachers’discouraging attitudes have the strongest effect on the stress levels of female engineering

students. A study43 by Cornell’s College of Engineering involving 35.5% of the studentpopulation showed that the main sources of stress for engineering students include heavyworkloads in engineering courses, large amount of time needed to finish assignments, not enoughsleep, competition with classmates, and inflexibility of the Engineering curriculum.
Astin44 in the theory of involvement, proposed that the greater the student’s social involvement incollege, the greater the student’s learning and personal development and the less likely she is toleave. In the theory of attrition, Bean45 identified three categories of reasons leading to studentattrition: 1) background, 2) organizational and environmental factors, and 3) attitudinal andbehavioral outcome. Spady46 proposed a theory based on the use of Durkheim’s47 theory ofsuicides to explain freshman attrition. Spady’s theory was the basis of Tinto’s work48. It statesthat when a person shares values with a group, this person is less likely to commit suicide (or byanalogy, drop out of school). Tinto identified in the interactionist theory three reasons for studentdeparture: 1) academic difficulties, 2) inability of students to achieve their goals, and 3) failure toadapt to the institution social environment. Tinto’s model focused more on academic and socialintegration.
Most of the mentioned studies follow an experimental or clinical approach, and may usequantitative, qualitative or mixed-method techniques to study student drop out phenomena andleading causal factors. These studies involve human subjects as well. Other studies take anotherapproach through the use of agent-based modeling to study depression. Aziz49 proposed adynamic agent model of recurrences of depression for an individual. Borkulo26 shows the effectof interactions among different depression symptoms, which is called the causal interactionsnetwork. Both50 proposed another model that has been used to simulate different scenarios inwhich personal characteristics determine the effect of stress on the (long-term) mood of a person.These agent-based models simulate the evolution of depression within a single agent/person. Ourmodel goes beyond this point to simulate the evolution of depression both within a single agentand across agents of a population.
These theories, studies, and experiments indicate that depression is a major contributor todropping out of school. Thus as a first step, we model the evolution of depression within agentsand its transmission across agents. The results from simulations will be useful in follow-on workto forecast the impact on retention.
Data and Methodology
College Social Network
We use a realistic college population over which we study depression dynamics and peerinfluence. We model the undergraduate student body of a large university. A modeling process25
was used to construct this population, which creates anonymous students and endows them withtraits such as age, gender, and sets of activities that result in daily face-to-face interactions withother students. The result of this process is a college social network, where nodes/agentsrepresent students and undirected edges represent interactions between students.
To produce this network, we start with the social contact network of the state of Virginia. We then

extract from this network all people with age between 18 and 22 (inclusive) years that have atleast one edge (i.e., interaction) with another college-age student, and who are geographicallylocated in the vicinity of a particular public university. These agents and their interactions in anormative day form the social network, whose traits are given in Table 1. An agent has roughly 12interactions a day with other students. There are over 200,000 “friend of friend” relationships(i.e., triangles) in the network. The diameter of the network is quite large compared to manysocial networks. Although there are 105 connected components, the network has a giantcomponent that contains 98.7% of all nodes (agents).
Table 1: College network structural characteristics.
Network Property Description ValueNumber of Nodes Total number of students 18866Number of Edges Total number of peer-to-peer interactions 119139Number of Triangles Number of student groups of size three and form
a cycle202318
Average Degree Average number of edges connected to a node 12.63Diameter Longest of all the calculated shortest paths in the
network16
Average Path Length Sum of shortest paths between all pairs of nodesdivided by the total number of pairs
4.785
Density Ratio of the number of edges to the number ofpossible edges
0.001
Modularity Fraction of edges that fall within a group, minusthe expected number of edges within group
0.484
Number of Communi-ties
Number of node groups in the network 151
Average ClusteringCoefficient
Measure of the degree to which the nodes tend tocluster together
0.348
Number of ConnectedComponents
Number of node groups that are mutually reach-able by undirected edges
105
Size of Giant Compo-nent
The fraction of nodes in the largest connectedcomponent
0.987
Contagion (Behavioral) Model
We propose a model that quantifies the diffusion of activated depression symptoms amongstudents. The model accounts for the major factors that affect the dynamics of depression. Westudy two types of dynamics: (i) internal dynamics within a single agent and (ii) externaldynamics between agents. Internal dynamics describe how depression evolves within a student asa result of symptom interactions. Symptoms include depressed mood, loss of interest, weight loss,weight gain, decreased appetite, increased appetite, insomnia, hypersomnia, psychomotoragitation, psychomotor retardation, fatigue, worthlessness or guilt, concentration problems, andsuicidal thoughts26. It is based on the hypothesis that symptoms of mental disorders have direct
causal relations with one another and is called the causal network perspective51,52,53,26. Externaldynamics focus on a student’s peer interactions with her roommates, classmates or friends. Thesocial contact network edges are the external interactions.
Our modeling approach follows graph dynamical systems (GDSs)54. A GDS is composed of fourelements: (i) a network G(V,E) with edge set E and vertex set V where n = |V | and m = |E|;(ii) a set K of vertex states (a vertex is in one of these states at each time t in a simulation); (iii) aset F of vertex functions (one function fi for each vertex/agent i); and (iv) a specification W ofthe order in which vertex functions are executed. Figure 1 shows an illustrative example of asix-agent network, with an internal view of two agents 4 and 6. Within-agent edges represent thecausal relations between symptoms of that agent, while undirected edges across agents are thepeer interactions. In the following discussion, we will refer to the internal symptom network asG1, and to the across agent network as G2.
In Figure 1, there is a single edge between agents 4 and 6. This single edge represents themultiple edges between symptoms of agents 4 and 6. We do not show all of these to reduceclutter. In general, each symptom of agent 4 can be connected to any number of symptoms ofagent 6. In this work we confined ourselves to between-agent edges that connect the samesymptoms, so there are 14 edges between the symptoms of agents 4 and 6.
In our model, the network is described as G(V,E) where G is a composite graph of G1 and G2.G1(V 1, E1) is the undirected graph of depressive symptoms within each student, and is fixed forall students. It represents the causal network of within-host symptom interactions. The set V 1 isthe vertex set of symptoms, n1 = |V 1| = 14. Let v1ki ∈ V 1 be the stress-generating symptom k foragent i. The edge set E1 represents the direct causal relations between two symptoms wheree1kl,i ∈ E1 is the undirected edge between symptoms k and l for agent i and m1=|E1| = 17 (seeFigure 1). The state x1ki of v1ki is either 0 if symptom k is not activated or 1 if it is. The state setK1 = {0, 1}.
Graph G2(V 2, E2) is the network describing the student contacts in the population, where V 2 isthe vertex set of (human) agents and E2 is the edge set of their daily interactions, n2 = |V 2| andm2=|E2|. For this problem, n2 and m2 are given in Table 1. Each element v2i ∈ V 2 is a student ithat can be considered a supernode, that contains a graph G1 describing internal dynamics. Eachedge in E2 represents a set of connections between pairs of symptoms in neighboring agents.Specifically, ek1i,k2j represents an undirected edge between symptom k1 of agent i and symptomk2 of agent j. Throughout this study, to simplify simulations and interpret results, we takek1 = k2. That is, only the same symptoms are connected between two neighboring agents in thesocial network. This choice conforms to research findings55,56,57, which show that homophily indepression symptoms may stem from peer influence.
The set K2 of agent vertex states is defined as K2 = {0, 1}. Student i can be in one of two states,healthy x2i = 0 or depressed x2i = 1. A student is considered depressed if there are eight or moredeveloped/activated symptoms. Thus, an agent can transition back and forth between depressionand no depression depending on its number of activated symptoms. The probability for symptomv1ki to become activated is represented as p1ki.
Two types of vertex functions are presented in the model: The set F 1 of vertex functions f 1ki
determines the state of each stressing symptom v1ki for student v2i at time step t. The set F 2 of

Figure 1: Illustrative example network, showing local interactions between two students labeled4 and 6, who are part of a larger student population of six agents; this is network G2. The colorof symptoms in the two large circles determine the symptom state which can be orange (active)or green (inactive). Each within-agent symptom network is an instance of G1. The total numberof active symptoms determines whether the agent will be in a healthy or a depressed state. Forexample, agent 6 has 8 active symptoms, and as a result, the agent color turns to orange (depressed).The with-in agent network is taken from26.
vertex functions f 2i determines the state of each student v2i at each time step t. (See Table 2.)
The specification W of the order in which every f 1ki and f 2
i is executed, is as follows. At eachtime t, each agent i computes the state x1ki for symptom k, using f 1
ki. Then each agent i executesf 2i to determine the state x2i at time t. An agent i is depressed if x2i = 1 and not depressed ifx2i = 0. As we will see below, because of the forms of f 1
ki and f 2i , each agent can perform these
computations in parallel. The critical number τcrit of activated symptoms causing a person tochange state is τcrit = bn1/2c. That is, at least one-half of a person’s symptoms must be activatedto cause a person to transition to, or remain in, state 1.
Definitions of each variable and constant are provided in Table 2. The values for a1ki and b1ki arebased on the VATSPUD data used in58,59. The variable A1
ki is the total amount of stress onsymptom v1ki. It consists of (i) the individual stress level z1ki, (ii) the amount of external activationc2i (the amount of stress on the symptom network for student v2i ), (iii) the influence of theactivation of neighbors of symptom v1ki, which is denoted by q1ki, and (iv) the student’s peerinfluence on symptom v1ki denoted is by r2ki. The variable q1ki depends on whether or not the
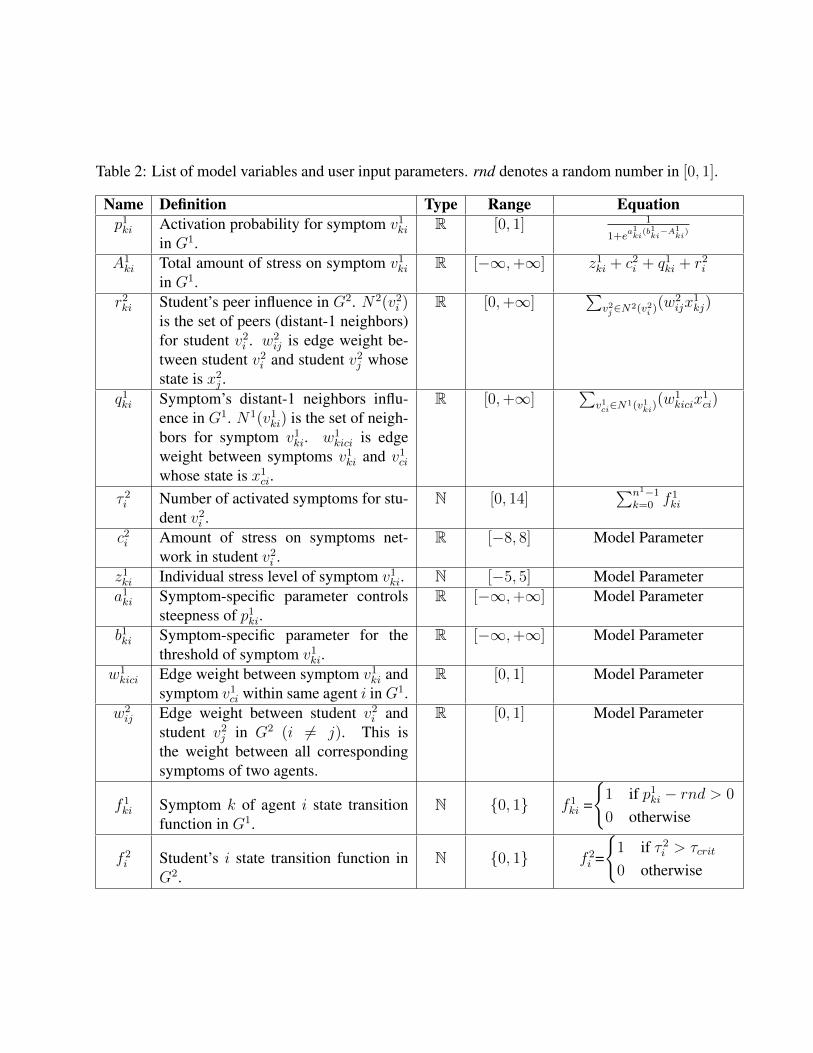
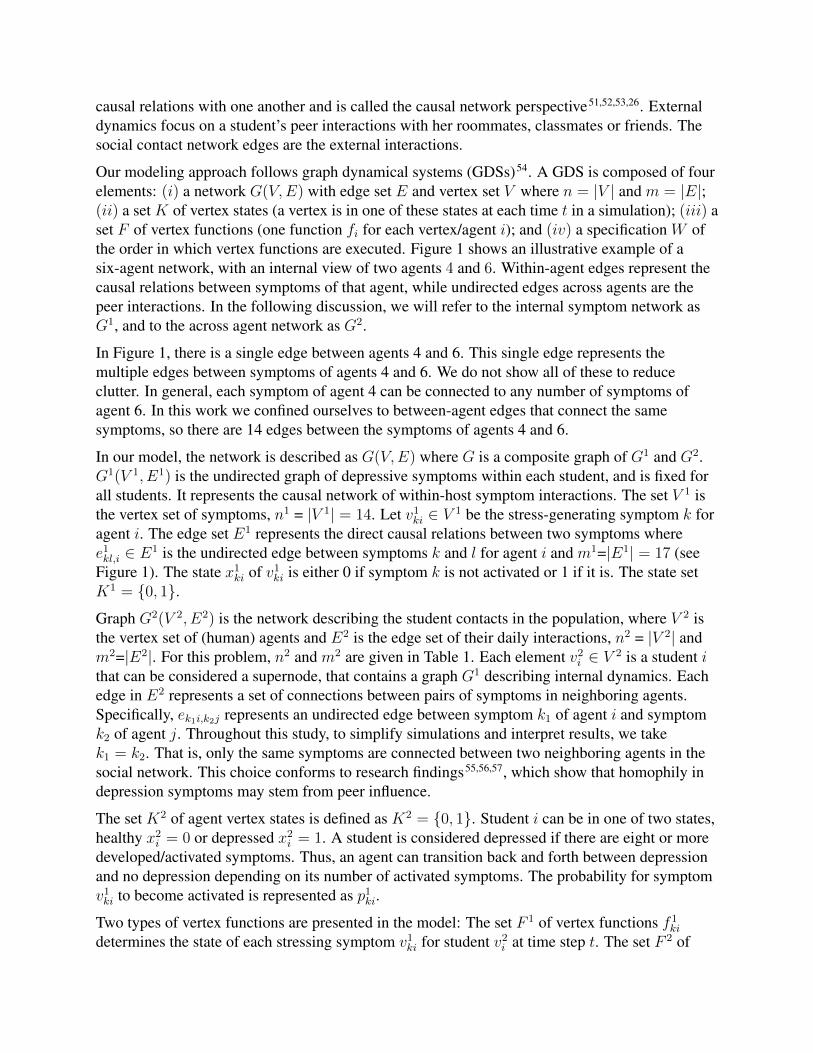
Table 2: List of model variables and user input parameters. rnd denotes a random number in [0, 1].
Name Definition Type Range Equationp1ki Activation probability for symptom v1ki
in G1.R [0, 1] 1
1+ea1ki
(b1ki−A1
ki)
A1ki Total amount of stress on symptom v1ki
in G1.R [−∞,+∞] z1ki + c2i + q1ki + r2i
r2ki Student’s peer influence in G2. N2(v2i )is the set of peers (distant-1 neighbors)for student v2i . w2
ij is edge weight be-tween student v2i and student v2j whosestate is x2j .
R [0,+∞]∑
v2j∈N2(v2i )(w2
ijx1kj)
q1ki Symptom’s distant-1 neighbors influ-ence in G1. N1(v1ki) is the set of neigh-bors for symptom v1ki. w1
kici is edgeweight between symptoms v1ki and v1ciwhose state is x1ci.
R [0,+∞]∑
v1ci∈N1(v1ki)(w1
kicix1ci)
τ 2i Number of activated symptoms for stu-dent v2i .
N [0, 14]∑n1−1
k=0 f 1ki
c2i Amount of stress on symptoms net-work in student v2i .
R [−8, 8] Model Parameter
z1ki Individual stress level of symptom v1ki. N [−5, 5] Model Parametera1ki Symptom-specific parameter controls
steepness of p1ki.R [−∞,+∞] Model Parameter
b1ki Symptom-specific parameter for thethreshold of symptom v1ki.
R [−∞,+∞] Model Parameter
w1kici Edge weight between symptom v1ki and
symptom v1ci within same agent i in G1.R [0, 1] Model Parameter
w2ij Edge weight between student v2i and
student v2j in G2 (i 6= j). This isthe weight between all correspondingsymptoms of two agents.
R [0, 1] Model Parameter
f 1ki Symptom k of agent i state transition
function in G1.N {0, 1} f 1
ki =
{1 if p1ki − rnd > 0
0 otherwise
f 2i Student’s i state transition function in
G2.N {0, 1} f 2
i =
{1 if τ 2i > τcrit
0 otherwise

symptom’s neighbors are activated and on the strength of the connection between the activatedneighbor and symptom v1ki. The variable r2ki quantifies peer influence in G2 and depends onwhether or not the symptom vki of student i’s direct contacts (e.g., roommates, classmates orfriends) are activated and on the strength of the relation between the depressed student and her/hispeer v2j .
We relate particular equations in Table 2 to the GDS model and networks of Figure 1. First, theequation for q1ki captures the interactions among symptoms of the within-agent network G1. Forsymptom k of agent i, N1(v1ki) denotes the neighbors v1ci for symptoms c. The states x1ci of thesedistance-1 neighboring symptoms, along with the edge weights w1
kici between symptoms k and c,contribute to the next state of symptom v1ki through q1ki.
Second, r2ki captures social influence on agent i in G2. For each of the neighbors vj of vi in G2,the symptom vkj influences the symptom vki of vi. Here, we take the strength w2
ij of theinteraction between corresponding symptoms of two agents i and j as the same for allsymptoms k. We further assume that only corresponding symptoms interact. Neither of theseassumptions is limiting and can be relaxed. In this case, then, the general interaction term r2kiwould be r2ki =
∑v2j∈N2(v2i )
(∑n1−1k′=0 (w
2k′jkix
1k′j))
. In this case, w2k′jki is the weight of an edge in
G2, the social network, between symptom k′ in v2j and symptom k in v2i . If no such edge exists,the weight is zero. The outer sum in the last equation is over all neighbors of v2i .
Third, the state of depression of an agent i is computed in a two-step process. At each time t, f 1ki
is computed and symptom k of agent i is activated if f 1ki = 1. Then, f 2
i is evaluated bydetermining whether τ 2i —the number of activated symptoms—is more than one-half of symptomsfor agent i. If so, then the agent i is depressed. Note that in these equations, an agent j may not bedepressed, but if it has activated symptoms, then it can contribute to the depression of itsneighbors. Note also that the depressive state x2i of an agent i is not directly used in thedepression evaluation of its neighbors.
Model Behavior
The model has many parameters. Here we focus on the effects of stress level z1ki, edge weight w2ij ,
and agent’s degree in the social network on the activation probability p1ki of symptoms, sinceactivated symptoms govern depression of agents. We fix all other factors. Figures 2(a) shows theeffect of varying the symptom individual stress z1ki from -5 up to 5 on symptom activationprobability for all 14 symptoms. Other factors c2i , z
1ki and w2 are set to 0, 0 and 0.5 respectively.
We use w2 as the value of w2ij for all i and j, as seen in Table 2. Symptom 0 contributes the most
to the increase in activation probability. Differences in results across symptoms are large for z1kibetween 0 and 3.
In Figure 2(b), we investigate the effect on the activation probability of symptom 0 for each agentof increases in the numbers of depressed friends and changes in edge weights w2. Other factors c2iand z1ki are set to 0. As the number of depressed friends increases, the internal symptom’sactivation probability increases. This effect is more pronounced as w2 increases. This leads to anincrease in the number of active symptoms and hence to an increase in the vulnerability todepression.

We repeated the experiment but now with all of the symptoms. The weights w2 were fixed to 0.05and factors c2i , z
1ki are set to 0. The results are shown in Figure 2(c). We find the same effect of
depressed friends on all symptoms, but the magnitude in activation probability changes acrosssymptoms. These results are expected as symptom 0 is highly connected in the symptom networkof Figure 1.
(a)
(b) (c)
Figure 2: Results for the depression model. (a) The changes in symptom activation probabilitiesfor all symptoms as a function of stress level for each symptom. (b) The changes in symptomactivation probability for symptom 0 as a function of number of depressed neighbors and thestrength of peer influence. (c) The changes in symptom activation probabilities for all symptomsas a function of number of depressed neighbors.
Simulation Description
Simulation starts at time t = 0. At each time step, a symptom v1ki within student v2i has a state x1ki,and its function f 1
ki computes the symptom state change from state x1ki(t) at time t to statex1ki(t+ 1) at time t+ 1. Similarly at each time step, a student v2i has a state x2i , and its function f 2
i
describes how the student changes her depressive state from state x2i (t) at time t to state x2i (t+ 1)at time t+ 1 based on the number of activated symptoms at time t+ 1. Healthy students aresusceptible to depression at any time based on their current state and their peer influence.Students may also develop some symptoms based on external sources, such as experiencing orwatching stressful events.

The main simulation steps are described in Algorithm 1, which is the entry point for thesimulation. It describes how students’ states change over time based on the current number ofactivated symptoms. The process of identifying and counting activate symptoms is described inAlgorithms 2 and 3. We take simDuration = 12 (months) and depressionThreshold = 8.
Algorithm 1: depressionDevelopmentInput: Simulation parameters, including simDuration and depressionThresholdOutput: Students’ depressionStatussimTime = 0;while simTime < simDuration do
foreach v2i ∈ V 2 don←− countActiveSymptoms(i, k, a1ki, b
1ki, z
1ki, c
2i , r
2ki, v
1ki, N
1(v1ki), N2(v2i ), v
2i );
if n >= depressionThreshold thendepressionStatus←− 1;
elsedepressionStatus←− 0;
simTime←− simTime+ 1;
Algorithm 2: countActiveSymptomsInput: i, k, a1ki, b1ki, z1ki, c2i , r2ki, v1ki, N1(v1ki), N
2(v2i ), v2i
Output: countcount = 0;foreach v1ki ∈ V 1 do
p1ki ←− activationProbability(i, k, a1ki, b1ki, z
1ki, c
2i , r
2ki, v
1ki, N
1(v1ki), N2(v2i ), v
2i );
rnd←− uniformRandomNumber();if p1ki − rnd > 0 then
symptomState←− 1;count←− count+ 1;
elsesymptomState←− 0;
return count;
Simulation Results
Effect of strength of peer influence on the number of depressed students
We start by assuming that all agents are depression symptoms free. We evaluate the impact ofpeer influence on the final number of depressed students. We fix the model input parameters c2i ,z1ki and w1
kici to 0.5, 0 and 0.5 respectively. We systematically increase the edge weights w2
between agents from 0.005 to 0.5. We use w2 as the value of w2ij for all i and j. Peer influence r2ki

Algorithm 3: activationProbabilityInput: i, k, a1ki, b
1ki, z
1ki, c
2i , r
2ki, v
1ki, N
1(v1ki), N2(v2i ), v
2i
Output: p1kir2i ←− 0;q1ki ←− 0;foreach v1ci ∈ N1(v1ki) do
q1ki ←− q1ki + w1kicix
1ci;
foreach v2j ∈ N2(v2i ) dor2ki ←− r2ki + w2
ijx1kj;
A1ki ←− c2i + q1ki + r2ki + z1ki;
p1ki ←− 1
1+ea1ki
(b1ki−A1
ki);
return p1ki;
increases as w2 increases, as seen in Table 2. Each curve in the results of Figure 3(a) representsthe average results from 50 simulation runs. Each curve also corresponds to a single value of w2
for all edges in the social network. As w2 increases, the peer influence increases, and the numberof depressed students increases. When w2 increases by 67%, from 0.03 to 0.05, the number ofdepressed students increases by a factor of six, from 400 to 2400. Hence, we see the importanceof modeling between-agent interactions through the social contact network.
Effect of strength of symptom influence on number of depressed students
We study the symptom influence within the same agent. All agents are initially depressionsymptom free. We fix other factors, including the peer influence, to isolate this effect. The fixedvalues for model parameters c1i , z
1i and w2 are 0.5, 0 and 0.05 respectively. The results are shown
in Figure 3(b). We take w1kici = w1, for all symptoms k and c, and all agents i. As w1 increases by
2.5×, from 0.2 to 0.5, the average number of depressed students increases by 16×, from 150 to2400. The fraction of depressed students increases from 0.8% to 12.7%.
Students predisposed to depression
Students may start their college years with symptoms and signs of depression. In previoussimulations we assumed that the entire population is free of depression symptoms. In thisexperiment, we study how pre-existing depression symptoms might affect the speed at whichdepression spreads among students. Model parameters c1ki, z
1ki, w
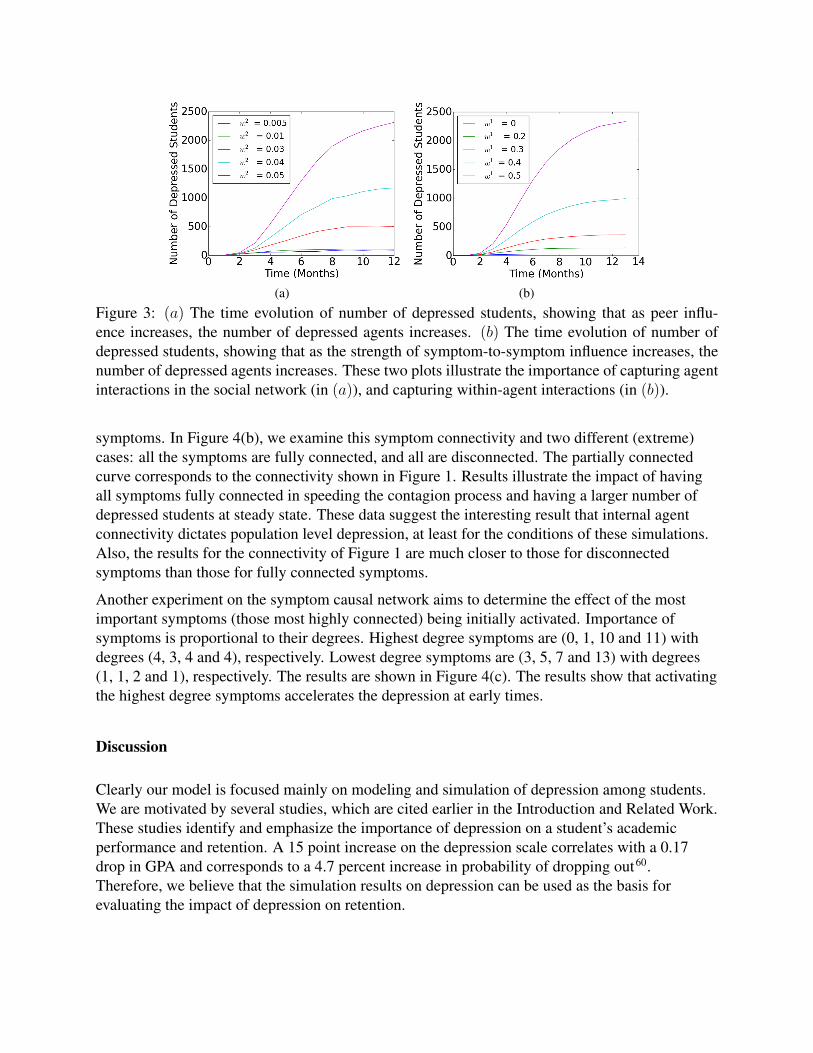
1 and w2 are set to values 0.5, 0,0.5 and 0.05, respectively. We used p and n to represent the probability p of having n activesymptoms at time = 0. Figure 4(a) shows that as n and p increase, the speed of depressioncontagion increases at early time. The final number of depressed students converges overtime.
As mentioned earlier, the 14 symptoms are connected through an internal causal network shownin Figure 1 that has 2 connected components, including a giant component of 12 of the 14
(a) (b)
Figure 3: (a) The time evolution of number of depressed students, showing that as peer influ-ence increases, the number of depressed agents increases. (b) The time evolution of number ofdepressed students, showing that as the strength of symptom-to-symptom influence increases, thenumber of depressed agents increases. These two plots illustrate the importance of capturing agentinteractions in the social network (in (a)), and capturing within-agent interactions (in (b)).
symptoms. In Figure 4(b), we examine this symptom connectivity and two different (extreme)cases: all the symptoms are fully connected, and all are disconnected. The partially connectedcurve corresponds to the connectivity shown in Figure 1. Results illustrate the impact of havingall symptoms fully connected in speeding the contagion process and having a larger number ofdepressed students at steady state. These data suggest the interesting result that internal agentconnectivity dictates population level depression, at least for the conditions of these simulations.Also, the results for the connectivity of Figure 1 are much closer to those for disconnectedsymptoms than those for fully connected symptoms.
Another experiment on the symptom causal network aims to determine the effect of the mostimportant symptoms (those most highly connected) being initially activated. Importance ofsymptoms is proportional to their degrees. Highest degree symptoms are (0, 1, 10 and 11) withdegrees (4, 3, 4 and 4), respectively. Lowest degree symptoms are (3, 5, 7 and 13) with degrees(1, 1, 2 and 1), respectively. The results are shown in Figure 4(c). The results show that activatingthe highest degree symptoms accelerates the depression at early times.
Discussion
Clearly our model is focused mainly on modeling and simulation of depression among students.We are motivated by several studies, which are cited earlier in the Introduction and Related Work.These studies identify and emphasize the importance of depression on a student’s academicperformance and retention. A 15 point increase on the depression scale correlates with a 0.17drop in GPA and corresponds to a 4.7 percent increase in probability of dropping out60.Therefore, we believe that the simulation results on depression can be used as the basis forevaluating the impact of depression on retention.

(a)
(b) (c)
Figure 4: (a) The time evolution of number of depressed students, showing that as p and n increase,the contagious speed of depression increases. (b) The time evolution of number of depressedstudents, showing the impact of having all symptoms fully connected in speeding the contagionprocess and having a larger number of depressed students at steady state. (c) The time evolution ofnumber of depressed students, showing the impacts of having the highest degree and lowest degreesymptoms initially activated.
Implications
In order to decrease the rate of depressed students, both students and universities must fullyunderstand the illness, the causes, and its effects. There is a need for developing programs thatimprove prevention, identification, and treatment of depression. Collected data reveals thataround three percent of first-year students experiencing depressive symptoms seek help andcounseling services61. Another study showed that living off campus was related to lessknowledge of campus mental health services62. Existing programs focus on within-studentdepression symptoms. Considerations should also be given to the contagious aspect of depressionthrough peer influence. Both students and universities need to be able to identify risk factors,external stressors, and signs and symptoms of the disease.
Some work63 suggested that university mental health programs can also benefit from adaptingideas that have already shown promising results in settings outside of college campuses, such asinterventions that have been effective in general populations of adolescents or young adults. Someof Tinto’s recommendations64 to promote retention can be utilized to control depression throughproviding academic, social and personal support, particularly in and before the first year, and

showing students that they are valued. Student led organizations may help lessen majordepression stressors while also providing a secure social network for those who are at high risk ofsuffering from depression65.
Conclusions and Future Work
Conclusions
In this work, we construct and exercise a causal agent-based model (ABM) of the evolution ofdepression among a population of college students. Like other models66,49,50, we model theevolution of depression-related traits within each agent (this is where other studies stop, treatingeach person of a population as an isolated individual). Our within-agent model makes use of themodel in26. Our approach goes beyond this point, and is novel in several respects, which form ourcontributions. First is the generation and use of a synthetic college population over which thesedynamics occur. Second, we extend a model of within-host depression evolution to include theeffects of social interactions. Finally, we code the agent-based model in a simulation system, andconduct simulations to understand population-level results that are produced from local agentinteractions. We explore the effect of initial conditions, and among other findings, illustrate theinteresting result that within agent connectivity changes the magnitude of steady state depressionwithin the population.
Future Work
Our future work includes conducting simulation experiments on students populations of differentuniversities (e.g. teaching vs. research and state vs private). As stated in the Related Work,several factors can affect the student’s academic retention. Therefore depression data can not beused solely to inform a student’s future behavior. We will investigate adding agent domainattributes to the model (e.g. income, marital status and medical history, gender or ethnicity), andexamine how the model will behave.
Acknowledgements
We thank the anonymous reviewers for their useful comments and suggestions. We thank ourexternal collaborators and members of the Network Dynamics and Simulation Science Laboratory(NDSSL). This work was partially supported by DTRA Grant HDTRA1-11-1-0016, DTRACNIMS Contract HDTRA1-11-D-0016-0001, and NSF NetSE Grant CNS-1011769.

References
[1] W. K. LeBold, R. Delauretis, and K. D. Shell. The purdue interest questionnaire: An interest inventory to assistengineer students in planning their career. annual Frontiers in Education Conference, 1977.
[2] John P. Bean. Dropouts and turnover: The synthesis and test of a causal model of student attrition. Research inhigher education, 12(2):155–187, 1980.
[3] James A. Beane and Richard P. Lipka. Self-concept, self-esteem, and the curriculum. Columbia University,Teachers College, 1986.
[4] Malene Rode Larsen, Hanna Bjornoy Sommersel, and Michael Søgaard Larsen. Evidence on DropoutPhenomena at Universities. Danish Clearinghouse for educational research, 2013.
[5] Mark Schneider and Lu Yin. The high cost of low graduation rates: How much does dropping out of collegereally cost? American Institutes for Research, 2011.
[6] B. Zimmerman and D. H. Schunk. Competence and control beliefs: Distinguishing the means and ends.Handbook of educational psychology, pages 349–367, 2006.
[7] Watson S. Swail. The art of student retention: A handbook for practitioners and administrators. In EducationalPolicy Institute. Texas Higher Education Coordinating Board 20th Annual Recruitment and RetentionConference Austin, TX June, volume 21, page 2004, 2004.
[8] Clifford Adelman. Answers in the tool box. academic intensity, attendance patterns, and bachelor’s degreeattainment, 1999.
[9] William K. LeBold. Research in engineering education: An overview. Engineering Education, 70(5):406, 1980.
[10] Jie Lu and Daniel Churchill. The effect of social interaction on learning engagement in a social networkingenvironment. Interactive learning environments, 22(4):401–417, 2014.
[11] Cheryl L. Carmichael, Harry T. Reis, and Paul R. Duberstein. In your 20s it’s quantity, in your 30s it’s quality:The prognostic value of social activity across 30 years of adulthood. Psychology and aging, 30(1):95, 2015.
[12] S. S. Umar, I. O. Shaib, D. N. Aituisi, N. A. Yakubu, and O. Bada. The effect of social factors on students’academic performance in Nigerian tertiary institutions. Library Philosophy and Practice (e-journal), page 334,2010.
[13] Kadian M. Callahan. Academic-centered peer interactions and retention in undergraduate mathematicsprograms. Journal of College Student Retention: Research, Theory & Practice, 10(3):361–389, 2008.
[14] Matthew Boyko, Ruslan Kutz, Julia Grinshpun, Vladislav Zvenigorodsky, Shaun E Gruenbaum, Benjamin FGruenbaum, Evgeni Brotfain, Yoram Shapira, and Alexander Zlotnik. Establishment of an animal model ofdepression contagion. Behavioural brain research, 281:358–363, 2015.
[15] Gerald J. Haeffel and Jennifer L. Hames. Cognitive vulnerability to depression can be contagious. ClinicalPsychological Science, 2(1):75–85, 2014.
[16] Elizabeth A. Stevens and Mitchell J. Prinstein. Peer contagion of depressogenic attributional styles amongadolescents: A longitudinal study. Journal of Abnormal Child Psychology, 33(1):25–37, 2005.
[17] Mitchell J. Prinstein. Moderators of peer contagion: A longitudinal examination of depression socializationbetween adolescents and their best friends. Journal of Clinical Child and Adolescent Psychology, 36(2):159–170, 2007.
[18] Christopher K. Hsee, Elaine Hatfield, and Claude Chemtob. Assessments of the emotional states of others:Conscious judgments versus emotional contagion. Journal of social and clinical psychology, 11(2):119–128,1992.

[19] Munmun De Choudhury, Scott Counts, and Eric Horvitz. Social media as a measurement tool of depression inpopulations. In Proceedings of the 5th Annual ACM Web Science Conference, pages 47–56. ACM, 2013.
[20] Adam D. I. Kramer, Jamie E. Guillory, and Jeffrey T. Hancock. Experimental evidence of massive-scaleemotional contagion through social networks. Proceedings of the National Academy of Sciences, 111(24):8788–8790, 2014.
[21] Bernadette von Dawans. Neuropeptidergic modulation of social behavior in health and social phobia. CuvillierVerlag, 2008.
[22] American College Health Association et al. American college health association national college healthassessment spring 2006 reference group data report (abridged). Journal of American College Health, 55(4):195,2007.
[23] Darcy Gruttadaro and Dana Crudo. College students speak: A survey report on mental health. Survey Report).Arlington, VA: National Alliance on Mental Illness, 2012.
[24] Joshua Epstein. Generative Social Science: Studies in Agent-Based Computational Modeling. PrincetonUniversity Press, 2006.
[25] Christopher L. Barrett, Richard J. Beckman, Maleq Khan, V. S. Anil Kumar, Madhav V. Marathe, Paula E.Stretz, Tridib Dutta, and Bryan Lewis. Generation and analysis of large synthetic social contact networks. InWinter Simulation Conference, pages 1003–1014. Winter Simulation Conference, 2009.
[26] C. D. Van Borkulo, H. L. J. Van der Maas, D. Borsboomm, and A. O. J. Cramer. Netlogovulnerability to depression, 2013. URL http://ccl.northwestern.edu/netlogo/models/community/Vulnerability_to_Depression.
[27] Susan E. Mayer. How much does a high school’s racial and socioeconomic mix affect graduation and teenagefertility rates? In Christopher Jencks and Paul E. Peterson, editors, The Urban Underclass. The BrookingsInstitution, 1991.
[28] Alejandro Gaviria and Steven Raphael. School-based peer effects and juvenile behavior. The Review ofEconomics and Statistics, 83:257–268, 2001.
[29] Jonathan Crane. The epidemic theory of ghettos and neighborhood effects on dropping out and teenagechildbearing. American Journal of Sociology, 96(5):1226–1295, 1991.
[30] F. M. Bass. A new product growth for model consumer durables. Management Science, 15:215–227, 1969.
[31] T. Schelling. Micromotives and Macrobehavior. W. W. Norton and Company, 1978.
[32] Mark Granovetter. Threshold Models of Collective Behavior. American Journal of Sociology, 83(6):1420–1443, 1978.
[33] Mark Granovetter and R. Soong. Threshold models of diffusion and collective behavior. J. MathematicalSociology, 9:169–179, 1983.
[34] D. Watts. A Simple Model of Global Cascades on Random Networks. Proceedings of the Naitonal Academy ofSciences (PNAS), 99(9):5766–5771, 2002.
[35] Duncan Watts and Peter Dodds. Threshold models of social influence. In The Oxford Handbook of AnalyticalSociology, pages 475–497, 2009.
[36] Barbara J. Bank, Ricky L. Slavings, and Bruce J. Biddle. Effects of peer, faculty, and parental influences onstudents’ persistence. Sociology of Education, 63:208–225, 1990.
[37] Dayal Pyari. A comparitive study of depression and anxeity among medical and engineering students.American research thoughts, 1(9):12, 7 2015.

[38] Rachel Bernstein. Depression afflicts almost half of STEM graduate students at UC berkeley. Science, may2015. doi: 10.1126/science.caredit.a1500125.
[39] Prima Vitasari, Muhammad Nubli Abdul Wahab, Ahmad Othman, Tutut Herawan, and Suriya KumarSinnadurai. The relationship between study anxiety and academic performance among engineering students.Procedia-Social and Behavioral Sciences, 8:490–497, 2010.
[40] H. G. Loshbaugh, Tawni Hoeglund, Ruth Streveler, and Kimberley Breaux. Engineering school, life balance,and the student experience. In Proceedings of the American Society for Engineering Education AnnualConference, Chicago, IL, 2006.
[41] Melissa Deziel, Dayo Olawo, Lisa Truchon, and Lukasz Golab. Analyzing the mental health of engineeringstudents using classification and regression. In EDM, pages 228–231, 2013.
[42] Ali Rizwan, Saadia Farooq, M. S. I. Alvi, and Silvet Nawaz. Analysis of factors affecting the stress level offemale engineering students. Global Journal of Human-Social Science Research, 12(10-A), 2012.
[43] Lisa Schneider. Perceived stress among engineering students. In St, Lawrence Section Conference, Toronto,Canada, 2007.
[44] Alexander W. Astin. Student involvement: A developmental theory for higher education. Journal of collegestudent personnel, 25(4):297–308, 1984.
[45] John P. Bean. The synthesis of a theoretical model of student attrition, 1981.
[46] William G. Spady. Dropouts from higher education: An interdisciplinary review and synthesis. Interchange, 1(1):64–85, 1970.
[47] Emile Durkheim. Suicide: A Study In Sociology. Free Press, 1997. ISBN 0684836327.
[48] Vincent Tinto. Research and practice of student retention: what next? Journal of College Student Retention:Research, Theory & Practice, 8(1):1–19, 2006.
[49] Azizi A. Aziz, Michel C. A. Klein, and Jan Treur. An agent model of temporal dynamics in relapse andrecurrence in depression. Next-Generation Applied Intelligence, pages 36–45, 2009.
[50] Fiemke Both, Mark Hoogendoorn, Michel C. A. Klein, and Jan Treur. Modeling the dynamics of mood anddepression, 2008.
[51] Denny Borsboom. Psychometric perspectives on diagnostic systems. Journal of clinical psychology, 64(9):1089–1108, 2008.
[52] Angelique O. J. Cramer, Lourens J. Waldorp, Han L. J. van der Maas, and Denny Borsboom. Comorbidity: anetwork perspective. Behavioral and Brain Sciences, 33(2-3):137–150, 2010.
[53] Verena D. Schmittmann, Angelique O. J. Cramer, Lourens J. Waldorp, Sacha Epskamp, Rogier A. Kievit, andDenny Borsboom. Deconstructing the construct: A network perspective on psychological phenomena. NewIdeas in Psychology, 31(1):43–53, 2013.
[54] Henning Mortveit and Christian Reidys. An introduction to sequential dynamical systems. Springer Science &Business Media, 2007.
[55] James C. Coyne. Depression and the response of others. Journal of abnormal psychology, 85(2):186, 1976.
[56] Aaron Hogue and Laurence Steinberg. Homophily of internalized distress in adolescent peer groups.Developmental psychology, 31(6):897, 1995.
[57] Noona Kiuru, William J. Burk, Brett Laursen, Jari-Erik Nurmi, and Katariina Salmela-Aro. Is depressioncontagious? a test of alternative peer socialization mechanisms of depressive symptoms in adolescent peernetworks. Journal of Adolescent Health, 50(3):250–255, 2012.

[58] Kenneth S. Kendler and Carol A. Prescott. Genes, environment, and psychopathology. New York: Guilford,2006.
[59] Carol A. Prescott, Steven H. Aggen, and Kenneth S. Kendler. Sex-specific genetic influences on thecomorbidity of alcoholism and major depression in a population-based sample of us twins. Archives of GeneralPsychiatry, 57(8):803–811, 2000.
[60] Daniel Eisenberg, Ezra Golberstein, and Justin B Hunt. Mental health and academic success in college. The BEJournal of Economic Analysis & Policy, 9(1), 2009.
[61] Adam Raunic and Sophia Xenos. University counselling service utilisation by local and international studentsand user characteristics: A review. International Journal for the Advancement of Counselling, 30(4):262–267,2008.
[62] Jeremy B. Yorgason, Deanna Linville, and Bryan Zitzman. Mental health among college students: do thosewho need services know about and use them? Journal of American College Health, 57(2):173–182, 2008.
[63] Justin Hunt and Daniel Eisenberg. Mental health problems and help-seeking behavior among college students.Journal of Adolescent Health, 46(1):3–10, 2010.
[64] Vincent Tinto. Taking retention seriously: Rethinking the first year of college. NACADA journal, 19(2):5–9,1999.
[65] Tiana Keith. Depression and its negative effect on college students. Undergraduate Research Journal for theHuman Sciences, 9(1), 2010.
[66] Selver Demic and Sen Cheng. Modeling the dynamics of disease states in depression. PLoS ONE, 9(10):e110358, 10 2014. doi: 10.1371/journal.pone.0110358.