agenda • how can the concept be port whitby sustainable ... · glenn pothier, glpi please...
TRANSCRIPT

Port Whitby Sustainable Community PlanCOMMUNITY CAFE
May 11, 2010
Port Whitby Marina7:00 to 9:00 pm
ARUP | GLPi | Meridian Planning Consultants | planningAlliance
AGENDA
7:00 pm Welcoming Remarks Glenn Pothier, GLPi
What Is The Port Whitby Sustainable Community Plan? Nick McDonald, Meridian Planning Consultants
7:15 pm Presentation: Sustainability Choices for Port Whitby Cameron Thomson, Arup
8:00 pm Discussion: Sustainability Choices for Port Whitby
8:45 pm Sustainability Indicators Cameron Thomson, Arup
8:55 pm Closing Remarks Glenn Pothier, GLPi
Please drop-o� your completed workbook at the front table or send it to:
Port Whitby Sustainable Community Planc/o Planning DepartmentTown of Whitby575 Rossland Road EastWhitby, Ontario L1N 2M8Tel: 905-430-4306Contact: Meaghan Craven (ext. 2344)Fax: 905-668-7812Email: [email protected]
1 POSITIVES
DISCUSSION: SUSTAINABILITY CHOICES FOR PORT WHITBY
ENHANCEMENTS OBJECTIONS REMEDIES WHAT ELSE?2 3 4 5• What do you like about this concept?• What are its strengths?• What’s good about it?• What makes a lot of sense or resonates most strongly with you?
• How can the ‘positives’ be made even better?• How can the concept be improved, re�ned and made stronger?
• What do you dislike about the concept?• What are the weaknesses?• What things don’t make sense to you?• What are the potential problems with the concept?
• How do you think your concerns or objections could be addressed?• How can the weaknesses/disadvantages or �aws be mitigated, reduced or eliminated?
• What other comments, suggestions, ideas or feedback would you like to share?
Scen
ario
1Sc
enar
io 2

CEMETERY
PARKING
PARK/RECREATION/OPEN SPACE
EXISTING VEGETATED AREA
OTHER SITES
TRAIL NETWORK
pA0 100m 300m 500m
HARBOUR DEVELOPMENT AREA (HDA) IN EXISTING WHITBY OFFICIAL PLAN
500 METRE RADIUS - GO STATION
51 jobs
0 jobs
17 jobs151 ppl
60 jobs255 pplHDA 2
HDA 1
HDA 5
HDA 5
0 jobs698 ppl
21 jobs143 ppl
0 jobs0 ppl
HDA 4 HDA 4
0 jobs0 ppl
49 jobs0 ppl
29 jobs204 ppl 0 jobs
134 ppl
0 jobs
0 jobs
197 ppl
HDA 3
113 ppl
0 ppl
Other Sites
208 jobs0 ppl
EXISTING CONDITIONS
435
1,895
435
2,330 2,330
-
-
-
1,895
(NEW) (EXISTING + NEW) (EXISTING)
TOTAL
JOBS
PEOPLE
0 ppl
VICTORIA STREET WEST
Port WhitbyHarbour
Port WhitbyMarina
Lakeridge Health
GO Station
Iroquois Park
Sports Complex
HeydenshorePavillion
StationGallery
Prin
gle
Cree
k
BROC
K ST
REET
SOU
TH
HWY 401
WATSON STREET WEST
HENR
Y ST
REET

CEMETERY
PARKING
PARK/RECREATION/OPEN SPACE
EXISTING VEGETATED AREA
OTHER SITES
TRAIL NETWORK
pA0 100m 300m 500m
HARBOUR DEVELOPMENT AREA (HDA) IN EXISTING WHITBY OFFICIAL PLAN
500 METRE RADIUS - GO STATION
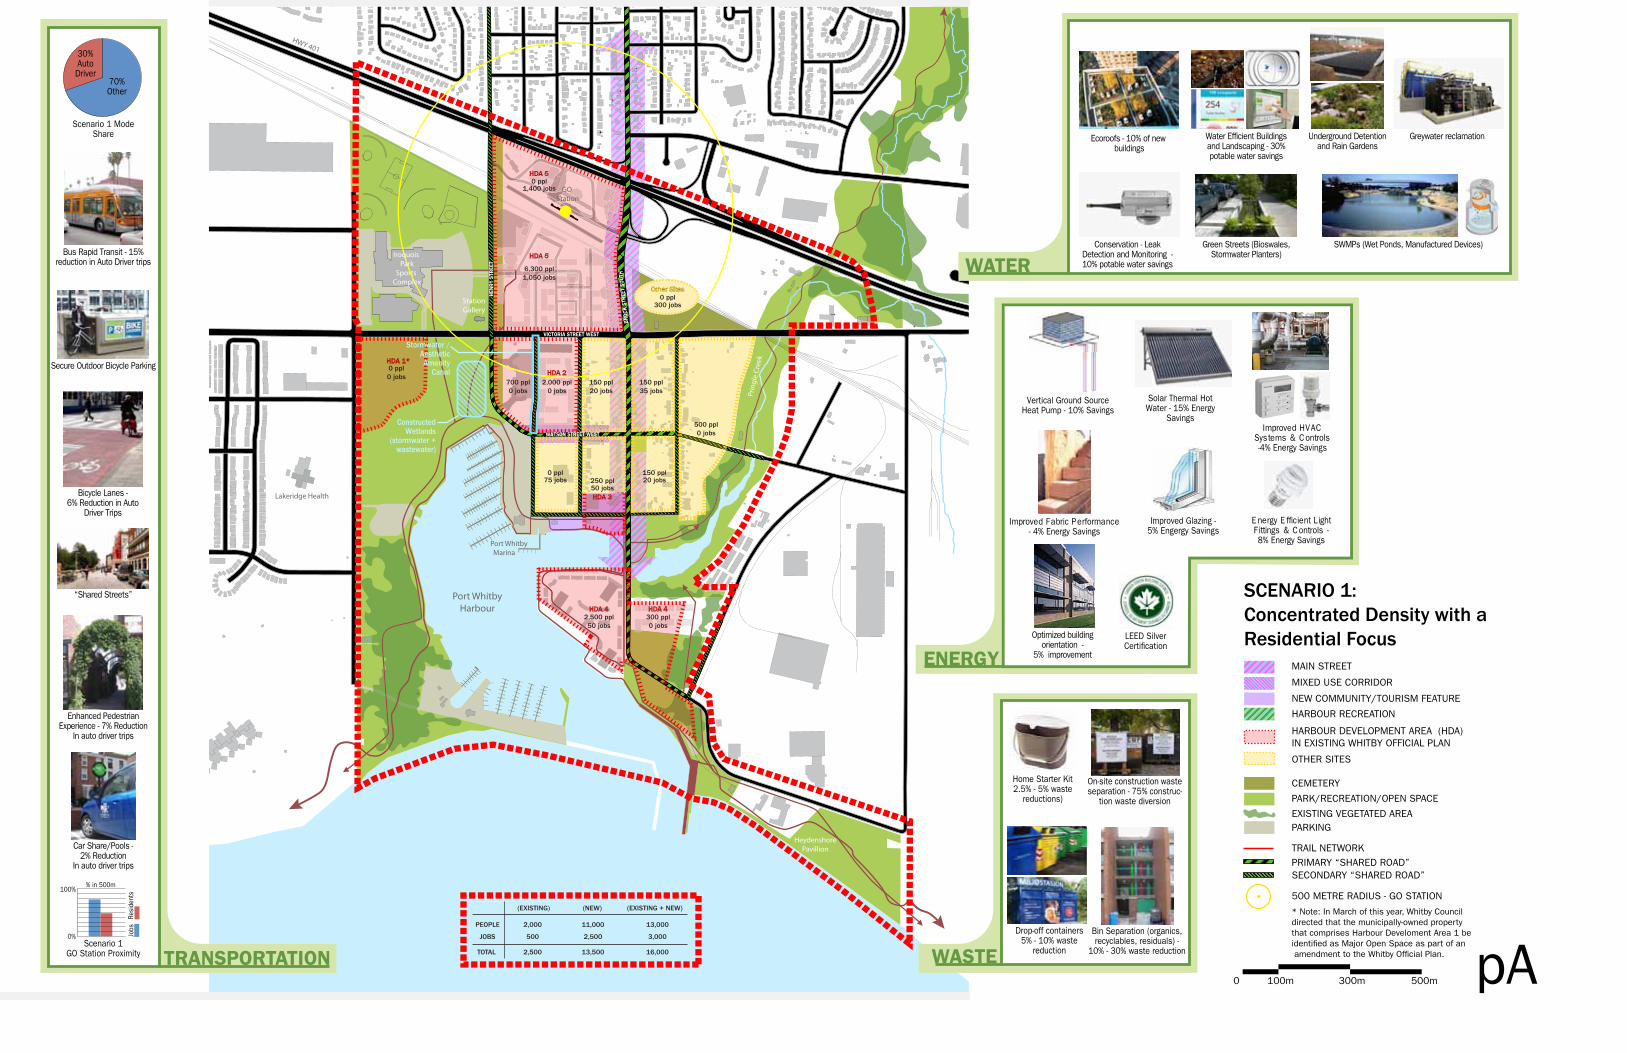
*Note: In March of this year, Whitby Council directed that the municipally-owned property that comprises Harbour Develoment Area 1 be identified as Major Open Space as part of an amendment to the Whitby Official Plan.
1,900 jobs
0 jobs
20 jobs150 ppl
0 jobs900 pplHDA 2
HDA 5
HDA 5
0 jobs700 ppl
20 jobs200 ppl
50 jobs2,500 ppl
HDA 4 HDA 4
0 jobs200 ppl
50 jobs0 ppl
50 jobs420 ppl 0 jobs
135 ppl
0 jobs1,100 ppl
HDA 3
900 ppl
0 ppl
EXISTING PERMISSIONS
Other Sites
250 jobs0 ppl
2,340
7,205
435
2,330 9,545
1,905
5,310
7,215
1,895
(NEW) (EXISTING + NEW) (EXISTING)
TOTAL
JOBS
PEOPLE
HDA 1 *
0 jobs0 ppl
VICTORIA STREET WEST
Port WhitbyHarbour
Port WhitbyMarina
Lakeridge Health
GO Station
Iroquois Park
Sports Complex
HeydenshorePavillion
StationGallery
Prin
gle
Cree
k
BROC
K ST
REET
SOU
TH
HWY 401
WATSON STREET WEST
HENR
Y ST
REET
ENERGY
WATER
WASTETRANSPORTATION
Improved HVAC Systems & Controls -4% Energy Savings
Conservation - Leak Detection and Monitoring - 10% potable water savings
Underground Detention and Rain Gardens
Water Efficient Buildings and Landscaping - 30% potable water savings
SWMPs (Wet Ponds, Manufactured Devices)Green Streets (Bioswales, Stormwater Planters)
Greywater reclamation
Improved Fabric Performance - 4% Energy Savings
Solar Thermal Hot Water - 15% Energy
Savings
On-site construction waste separation - 75% construc-
tion waste diversion
Drop-off containers5% - 10% waste
reduction
Bin Separation (organics, recyclables, residuals) -
10% - 30% waste reduction
Vertical Ground Source Heat Pump - 10% Savings
E nergy E fficient Light F ittings & Controls - 8% Energy Savings
Scenario 1 Mode Share
Scenario 1 GO Station Proximity
30%AutoDriver
70%Other
% in 500m100%
0% Jobs
Resi
dent
s
Car Share/Pools - 2% Reduction
In auto driver trips
Bicycle Lanes - 6% Reduction in Auto
Driver Trips
“Shared Streets”
Secure Outdoor Bicycle Parking
Bus Rapid Transit - 15% reduction in Auto Driver trips
Enhanced Pedestrian Experience - 7% Reduction
In auto driver trips
Improved Glazing - 5% Engergy Savings
Home Starter Kit2.5% - 5% waste
reductions)
LEED Silver Certification
Optimized building orientation -
5% improvement
Ecoroofs - 10% of new buildings
MIXED USE CORRIDOR
MAIN STREET
NEW COMMUNITY/TOURISM FEATURE
HARBOUR RECREATION
CEMETERY
PARKING
PARK/RECREATION/OPEN SPACE
EXISTING VEGETATED AREA
OTHER SITES
TRAIL NETWORKPRIMARY “SHARED ROAD” SECONDARY “SHARED ROAD”
500 METRE RADIUS - GO STATION
* Note: In March of this year, Whitby Council directed that the municipally-owned property that comprises Harbour Develoment Area 1 be identified as Major Open Space as part of an amendment to the Whitby Official Plan. pA0 100m 300m 500m
HARBOUR DEVELOPMENT AREA (HDA) IN EXISTING WHITBY OFFICIAL PLAN
1,400 jobs
1,050 jobs
20 jobs150 ppl
0 jobs2,000 ppl
HDA 2
HDA 5
HDA 5
0 jobs700 ppl
35 jobs150 ppl
50 jobs2,500 ppl
0 jobs300 ppl
HDA 4 HDA 4
Other Sites
300 jobs0 ppl
75 jobs0 ppl
50 jobs250 ppl 20 jobs
150 ppl
0 jobs500 ppl
HDA 3
6,300 ppl
0 ppl
SCENARIO 1: Concentrated Density with a Residential Focus
3,000
13,000
500
2,500 16,000
2,500
11,000
13,500
2,000
(NEW) (EXISTING + NEW) (EXISTING)
TOTAL
JOBS
PEOPLE
HDA 1*
0 jobs0 ppl
Constructed Wetlands
(stormwater + wastewater)
Stormwater / Aesthetic Amenity
Canal
VICTORIA STREET WEST
Port WhitbyHarbour
Port WhitbyMarina
Lakeridge Health
GO Station
Iroquois Park
Sports Complex
HeydenshorePavillion
StationGallery
Prin
gle
Cree
k
BROC
K ST
REET
SOU
TH
HWY 401
WATSON STREET WEST
HENR
Y ST
REET

TRANSPORTATION
ENERGY
Indoor Bicycle Parking
Drop Off Containers for textiles, electronic wastes, batteries (possibly hazardous waste)
Anaerobic Digester: organic waste to biogas
Photovoltaics Solar ThermalHot Water Storageunder park
WATER
WASTE
LEED Platinum Certification
Scenario 2 Mode Share
15%Auto Driver
85%Other
Optimized building orientation -
5% improvement
Improved Glazing - 5% Engergy Savings
Improved HVAC Systems & Controls -4% Energy Savings
Improved Fabric Performance - 4%
Energy Savings
E nergy E fficient Light F ittings & Controls - 8% Energy Savings
District CHP (Combined Heat and Power) with Thermal
S torage
District Biomass Boiler
Automated Waste Collection System - 10% - 30% waste
reduction
Home Starter Kit2.5% -5% waste
reductions)
Scenario 2 GO Station Proximity
“Shared Streets”
Enhanced Pedestrian Experience - 7% Reduction
Bus Rapid Transit - 30% reduction in Auto Driver trips
Van Share/Pools - 6% Reduction
Bicycle Lanes - 6% Reduction in Auto Driver Trips
0%
100% % in 500m
Jobs
Resi
dent
s
Ecoroofs - 25% of new buildings
Water Efficient Buildings and Landscaping - 30% potable water savings
Rainwater Harvesting and Underground Storage - 5%
potable water savings
Blackwater Reclamation and
dual pipe plumbing
Wastewater Resource and Energy Recovery
(offsite)
Conservation - Leak Detection and Monitoring - 20% potable water savings
Green Streets and Pervious Pavements SWMPs (Constructed Wetlands)
MIXED USE CORRIDOR
MAIN STREET
NEW COMMUNITY/TOURISM FEATURE
HARBOUR RECREATION
CEMETERY
PARKING
PARK/RECREATION/OPEN SPACE
EXISTING VEGETATED AREA
OTHER SITES
TRAIL NETWORKPRIMARY “SHARED ROAD” SECONDARY “SHARED ROAD”
500 METRE RADIUS - GO STATION
* Note: In March of this year, Whitby Council directed that the municipally-owned property that comprises Harbour Develoment Area 1 be identified as Major Open Space as part of an amendment to the Whitby Official Plan. pA0 100m 300m 500m
HARBOUR DEVELOPMENT AREA (HDA) IN EXISTING WHITBY OFFICIAL PLAN
1,900 jobs
2,400 jobs
40 jobs500 ppl
0 jobs1,200 ppl
HDA 2
HDA 5
HDA 5
0 jobs700 ppl
45 jobs250 ppl
50 jobs2,500 ppl
HDA 4 HDA 4
0 jobs450 ppl
75 jobs0 ppl
60 jobs350 ppl 30 jobs
175 ppl
0 jobs750 ppl
HDA 3
3,625 ppl
0 ppl
SCENARIO 2: Distributed Density with Enhanced Employment
Other Sites
400 jobs0 ppl
5,500
10,500
500
2,500 16,000
5,000
8,500
13,500
2,000
(NEW) (EXISTING + NEW) (EXISTING)
TOTAL
JOBS
PEOPLE
HDA 1
0 jobs0 ppl
Constructed Wetlands
(stormwater + wastewater)
Stormwater / Aesthetic Amenity
Canal
Stormwater Management Area
VICTORIA STREET WEST
Port WhitbyHarbour
Port WhitbyMarina
Lakeridge Health
GO Station
Iroquois Park
Sports Complex
HeydenshorePavillion
StationGallery
Prin
gle
Cree
k
BROC
K ST
REET
SOU
TH
HWY 401
WATSON STREET WEST
HENR
Y ST
REET

Port Whitby Sustainable Community PlanCOMMUNITY CAFE
May 11, 2010
Port Whitby Marina7:00 to 9:00 pm
ARUP | GLPi | Meridian Planning Consultants | planningAlliance
AGENDA
7:00 pm Welcoming Remarks Glenn Pothier, GLPi
What Is The Port Whitby Sustainable Community Plan? Nick McDonald, Meridian Planning Consultants
7:15 pm Presentation: Sustainability Choices for Port Whitby Cameron Thomson, Arup
8:00 pm Discussion: Sustainability Choices for Port Whitby
8:45 pm Sustainability Indicators Cameron Thomson, Arup
8:55 pm Closing Remarks Glenn Pothier, GLPi
Please drop-o� your completed workbook at the front table or send it to:
Port Whitby Sustainable Community Planc/o Planning DepartmentTown of Whitby575 Rossland Road EastWhitby, Ontario L1N 2M8Tel: 905-430-4306Contact: Meaghan Craven (ext. 2344)Fax: 905-668-7812Email: [email protected]
1PO
SITI
VES
DISCUSSION: SUSTAINABILITY CHOICES FOR PORT WHITBY
ENH
ANCE
MEN
TS
OBJ
ECTI
ON
S
REM
EDIE
S
WH
AT E
LSE?
2 3 4 5•Wha
t do
you
like
abou
t thi
s
conc
ept?
•Wha
t are
its s
tren
gths
?•W
hat’s
goo
d ab
out i
t?•W
hat m
akes
a lo
t of s
ense
or
re
sona
tes m
ost s
tron
gly
with
you
?
•How
can
the
‘pos
itive
s’ be
mad
e ev
en
bett
er?
•How
can
the
conc
ept b
e
impr
oved
, re�
ned
and
mad
e st
rong
er?
•Wha
t do
you
disl
ike
abou
t th
e c
once
pt?
•Wha
t are
the
wea
knes
ses?
•Wha
t thi
ngs d
on’t
mak
e se
nse
to y
ou?
•Wha
t are
the
pote
ntia
l
pr
oble
ms w
ith th
e co
ncep
t?
•How
do
you
thin
k yo
ur
conc
erns
or o
bjec
tions
cou
ld b
e ad
dres
sed?
•How
can
the
wea
knes
ses/
disa
dvan
tage
s or �
aws b
e m
itiga
ted,
re
duce
d or
elim
inat
ed?
•Wha
t oth
er c
omm
ents
,
su
gges
tions
, ide
as o
r fee
dbac
k w
ould
yo
u lik
e to
shar
e?
Scen
ario
1
Conc
entr
ated
Den
sity
+
a Re
side
ntia
l Foc
us
Scen
ario
2
Dis
trib
uted
Den
sity
+En
hanc
ed E
mpl
oym
ent

ECO
NO
MIC
VIT
ALI
TY A
ND
A
FFO
RDA
BILI
TY
FOCUSAREA
GOAL INDICATORPU
BLIC
WEL
LBEI
NG
,SA
FETY
& Q
UA
LITY
OF
LIFE
ACC
ESSI
BILI
TY &
TRA
NSP
ORT
ATI
ON
RESO
URC
E EF
FICI
ENCY
ECO
LOG
YA
DVA
NCE
D
INFO
RMA
TIO
N &
CO
MM
UN
I-CA
TIO
NS
TECH
NO
LOG
Y
Mat
eria
ls &
Solid
Was
teA
ir Q
ualit
yH
abita
t &Bi
odiv
ersi
tyEn
viro
nmen
tW
ater
& W
aste
wat
erEn
ergy
1. Overall employment to population ratio2. % of residential development quali�ed as a�ordable housing3. Area of dedicated space for small/local business4. % of local jobs captured by resident workforce within 3km5. % of local jobs captured by resident workforce within 500m6. % reduction in utility (electricity, gas, water) costs through e�ciency measure7. % of new construction hires that are local to the Town of Whitby
Enhance the competitiveness of the area and foster a vibrant local economy
8. Residential Density (units per hectare), Future Construction, on arterial road9. Residential Density (units per hectare), Future Construction, o� arterial road10. % of “family-friendly” housing units11. Number of buildings (public, commercial, and residential) certi�ed under a green building rating system12. % of heritage properties identi�ed and protected13. % of public buildings accessible under the Ontarians with Disabilites Act (ODA) and Accessibility for Ontarians with Disabilities Act (AODA)14. % of waterfront with active pedestrian access15. % of dwelling units within 500m of at least 10 basic services16. % of dwelling units within 500m of place of employment17. % of dwelling units within 500m and 250m of Recreational or Open Space18. % of housing within walking distance from public space19. % increase in per capita land area dedicated to community gardening20. % of residents who report feeling safe
Create a strong sense of community and provide a healthy and safe neighbourhood with su�cient community facilities, parks, essential services, and public spaces to engender a high quality of life for residents of all ages and abilities
21. % increase in passenger trips to Whitby Station originating within the Port Whitby study area22. % of vehicle trips occuring during peak and o�-peak hours23. % of population within walking distance to GO Bus stops and walking distance to GO Train station24. % reduction in afternoon peak-period automobile trips25. % increase in miles of cycling and pedestrian paths26. % decrease in percentage of Whitby Station passengers arriving by private automobile27. % decrease in average and maximum transit time to the GO Transit Station (and other inter- and intra-city transit)
Signi�cantly improve accessbility to the site for all modes of transportation, and promote transit, walking and cycling as the primary modes of transportation within the development to reduce auto-oriented travel, congestion, and pollution impacts on the surrounding area and improving regional connectivity.
28. % reduction in regulated building energy use (versus code)29. % of electricity supply from on-site renewable sources30. % of natural gas supply from renewable resources
Reduce demand, create sustainable supply and mitigate contribution to climate change.
31. % decrease in per capita/per household annual potable water consumption32. % decrease in average annual and peak total petroleum hydrocarbons (TPH) in stormwater and river sampling33. % decrease in annual number of Combined Sewer Over�ow (CSO) events34. % increase in annual gallons of rainwater harvested and reused35. % decrease in annual average Total Suspended Solids (TSS) rating of stormwater36. % grey-water reclamation and reuse37. % of sewer and stormwater drains using combined infrastructure38. % of Site Area (including buildings and land area) complying with Sustainable Stormwater Management Guidelines39. % area of parking lots with pervious hardscape40. % of wastewater treated on site41. % of river/lake sediment sites that meet Provincial standards for sediment quality
Provide a robust water supply to sustain the community, reduce potable water demand and treat wastewater and stormwater on-site.
42. % decrease in average annual kilograms of waste generated per capita43. % of residential, commercial, industrial, and municipal waste diverted from land�ll44. % of construction and demolition waste diverted from land�ll45. % of organic waste converted into compost and/or biogass46. waste generation rates for residential, commercial, industrial, and municipal users
Make a substantial contribution to the principle of eliminating the “concept of waste” through good design, emphasis on source reduction, reuse, recycling and composting and, installation of appropriate facilities.
47. Composite measure of six di�erent land uses, including education, entertainment, single and multi-family residential, retail and o�ce uses48. % decrease in average annual and peak total petroleum hydrocarbons (TPH) in soils49. Total area of brown�elds that have been remediated50. % of buildings with greenroof, in compliance with greenroof guidelines51. % of streets shaded/sheltered52. % decrease in average annual and peak heavy metals in soils
Design to protect, and wherever possible, enhance parks, soils, water bodies and air quality to improve ecological and human health.
53. % of hard shoreline (e.g bulkhead, sea wall, riprap, or any other built impediment to naturally advancing tidewaters)54. % land protected by conservation easement or public ownership55. % of wetlands/waterbodies protected56. % of �oodplain protected57. % of Provincially Signi�cant Wetlands and Complexes protected from development58. % of wetlands area above DFO compensation minimum59. Per capita area of park and open space
Create valuable landscapes and ecosystems that are restorative, visually appealing, and enhance community character, while being functional, maintainable, biologically diverse and ecologically sound.
Reduce local levels of air pollutants to improve health and reduce pollution impacts on the surrounding area.
Integrate Information and Communications Technology into the development to allow residents to better manage resources, increase local economic activity, improve connectedness and faciltate community activity.
60. % reduction in energy-related carbon footprint61. % decrease in average annual and peak Air Quality Index rating62. % decrease in average annual PM 2.5 level63. % decrease in average annual PPM carbon monoxide (CO) level64. % decrease in average annual PPM nitrogen oxides (NOx) level65. % decrease in total and per capita community-wide carbon dioxide equivalent (CO2e) emissions
66. Residential units with”smart-metering”, building management systems and feedback panels for sub-metered energy and water consumption67. % of residential units with the option to connect to the broad network
SUSTAIN
ABILITY IND
ICATORS