agenda descriptive statistics measures of spread - variability
TRANSCRIPT
• Agenda
• Descriptive Statistics
• Measures of Spread - Variability

Statistics
Descriptive Statistics
Statistics to summarize and describe the data we collected
Inferential Statistics
Statistics to make inferences from samples to the populations

Measures of Dispersion/ Spread/ Variability
• Indicates how cases vary or differ from each other
• Indicates how “central” or representative the center is
• Indicates how homogeneous or heterogeneous the variable is

Types of Measures of Dispersion
• Frequencies / Percentages
• Range / Interquartile Range
• Standard deviation / Variance

Gender Distribution: Group 1
Boy Girl(n=15) Gender
Num
ber o
f Kid
s
MODE = GIRL
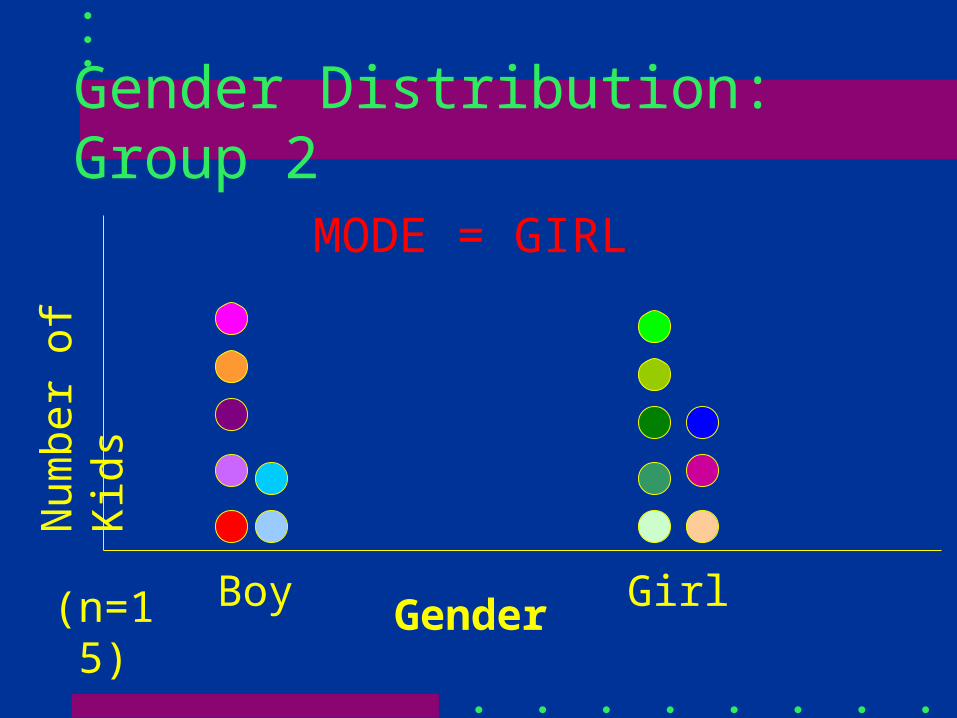
Gender Distribution: Group 2
Boy Girl(n=15) Gender
Num
ber o
f Kid
s
MODE = GIRL
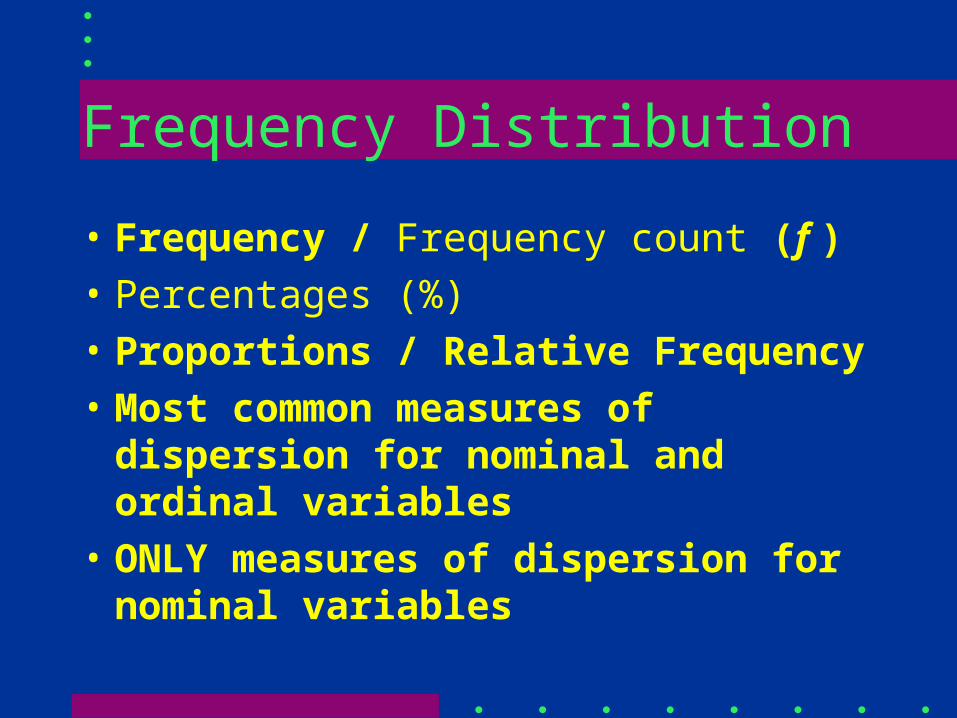
Frequency Distribution
• Frequency / Frequency count (f )• Percentages (%)• Proportions / Relative Frequency• Most common measures of dispersion
for nominal and ordinal variables• ONLY measures of dispersion for
nominal variables

Frequency Distribution
.9393%14Girl
.4747%7Boy
.5353%8Girl
.077%1Boy
ProportionPercentage
(%)Frequency
( f )
1
2
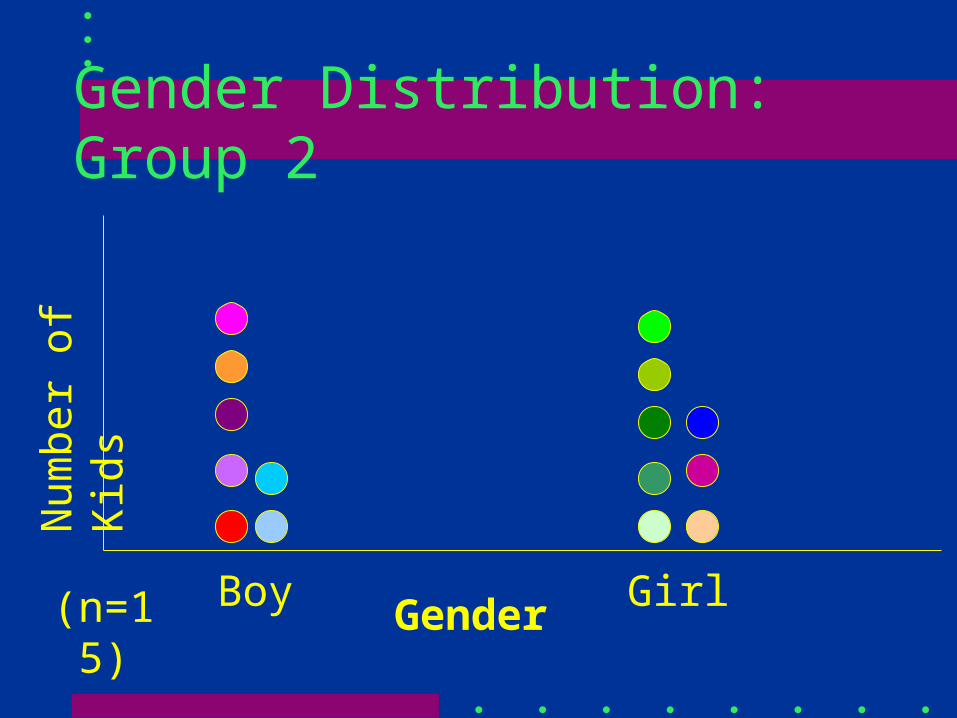
Gender Distribution: Group 2
Boy Girl(n=15) Gender
Num
ber o
f Kid
s
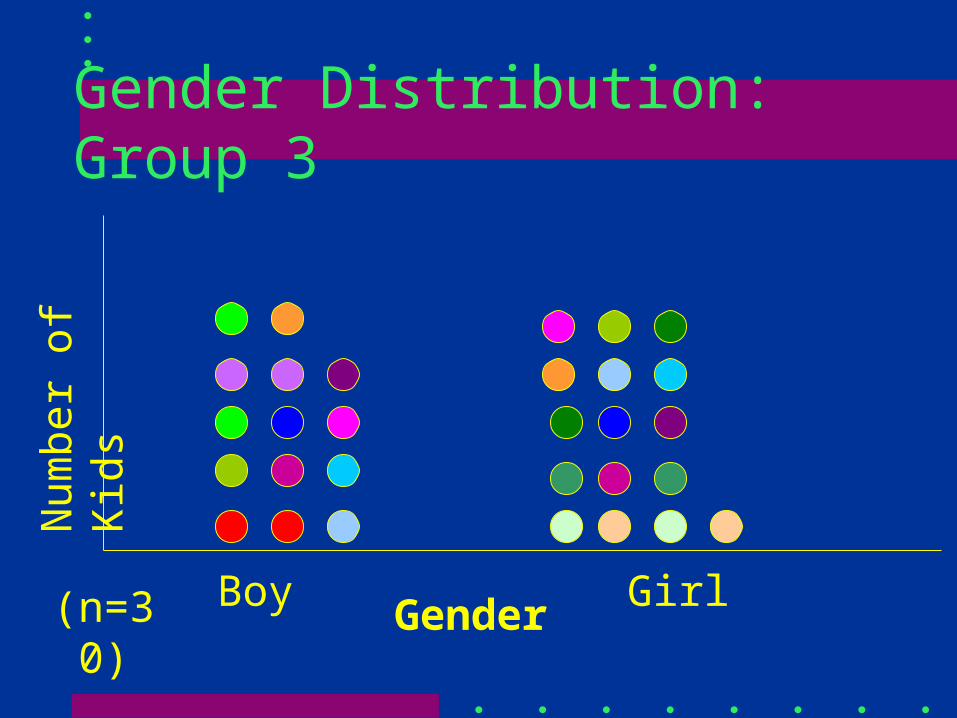
Gender Distribution: Group 3
Boy Girl(n=30) Gender
Num
ber o
f Kid
s

Frequency Distribution
.5353%8Girl
.4747%14Boy
.5353%16Girl
.4747%7Boy
ProportionPercentage
(%)Frequency
( f )
3
2
Range
• The distance between the highest score and the lowest score (highest – lowest)
• Can be used with numeric ordinal and interval/ratio variables
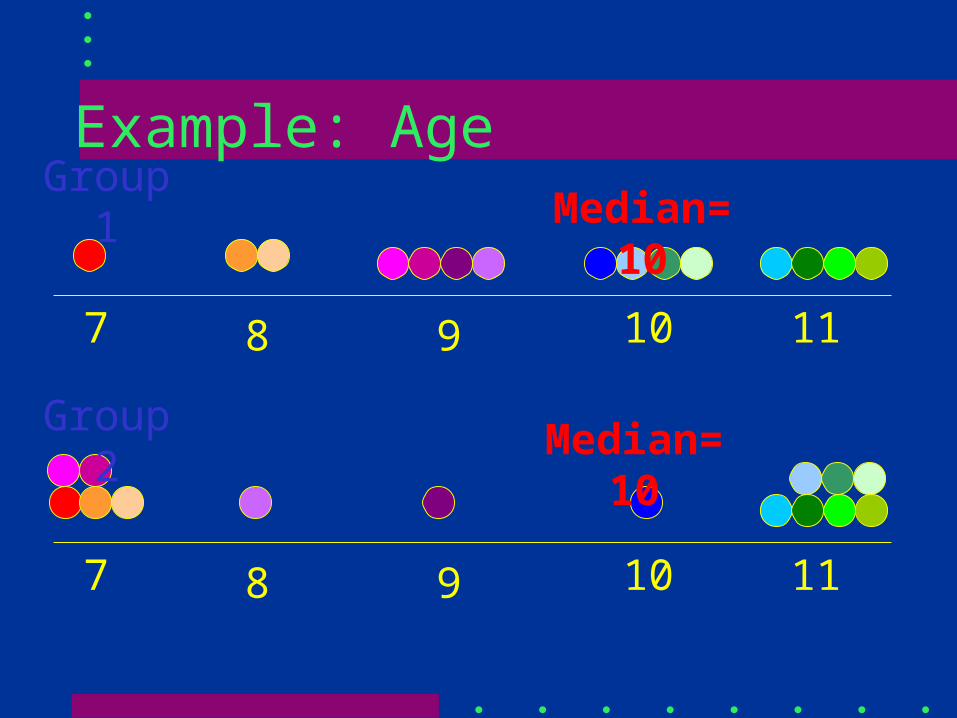
Example: Age
7 8 9 10 11
Group 1
7 8 9 10 11
Group 2 Median=10
Median=10
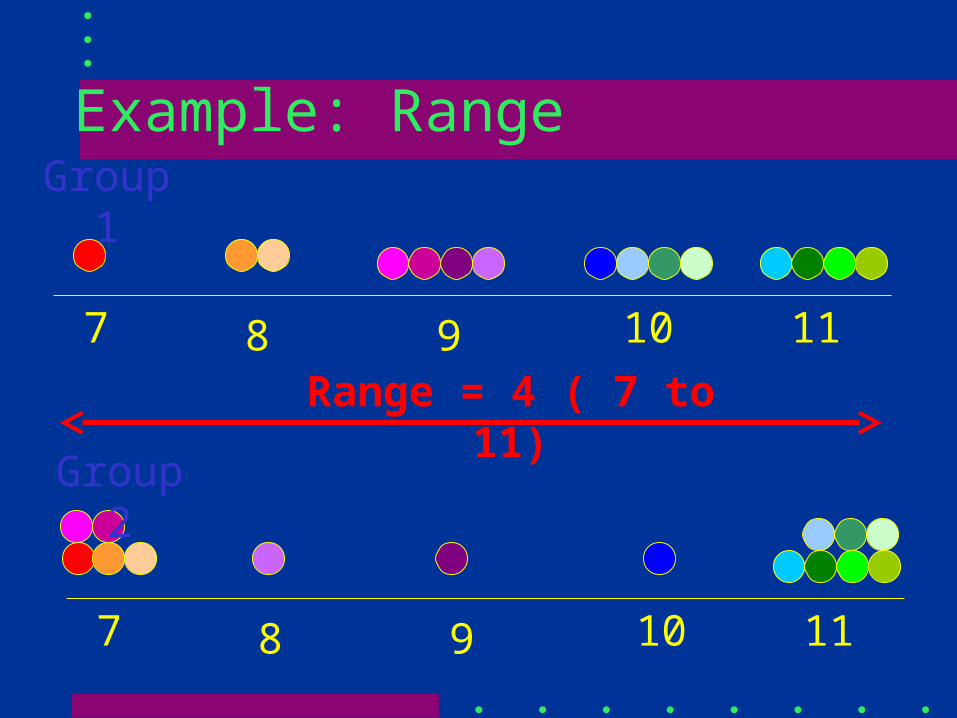
Example: Range
7 8 9 10 11
Group 1
7 8 9 10 11
Group 2
Range = 4 ( 7 to 11)

Measures of Dispersion / Spread
Nominal Ordinal
Frequency, %
Frequency, %
Frequency, %
Range, IQR Range, IQR
StandardDeviatn, Variance
Interval/Ratio

Deviation
• Difference from Standard
• In statistics,
difference from the mean
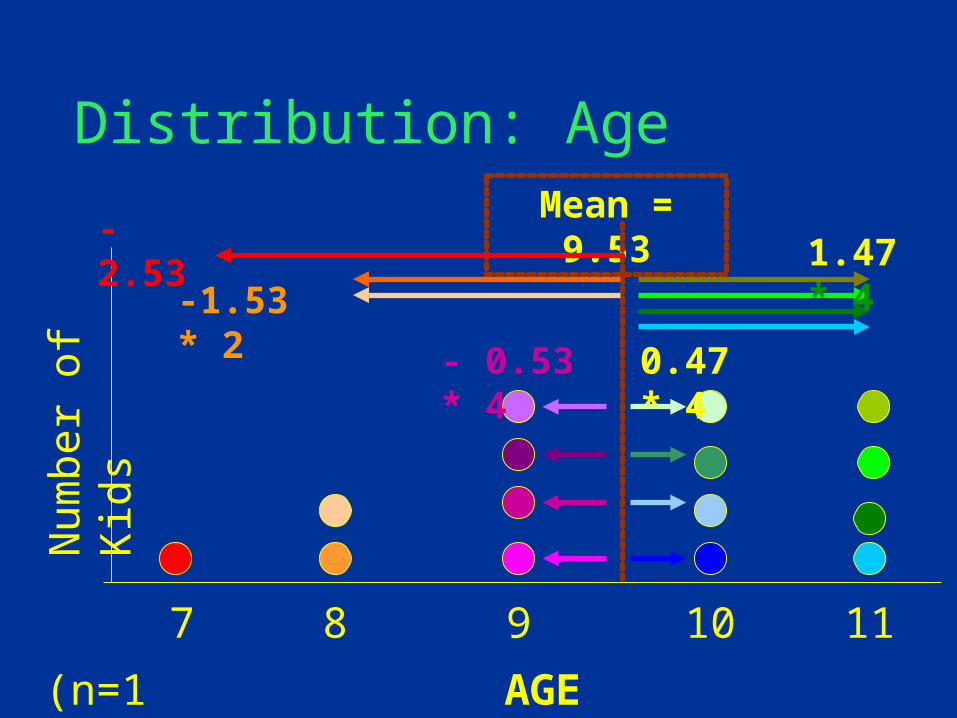
Distribution: Age
AGE(n=15)
7 8 9 10 11
Num
ber o
f Kid
s
Mean = 9.53- 2.53
-1.53 * 2
- 0.53 * 4 0.47 * 4
1.47 * 4
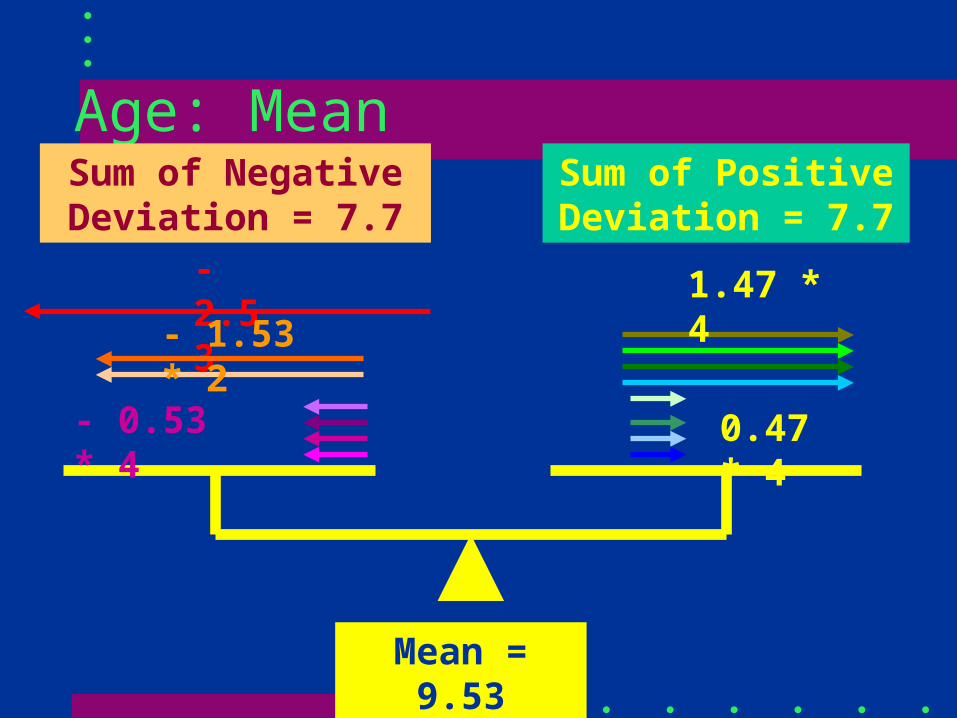
Age: Mean
- 2.53
- 1.53 * 2
- 0.53 * 4
1.47 * 4
0.47 * 4
Mean = 9.53
Sum of Negative Deviation = 7.7
Sum of Positive Deviation = 7.7
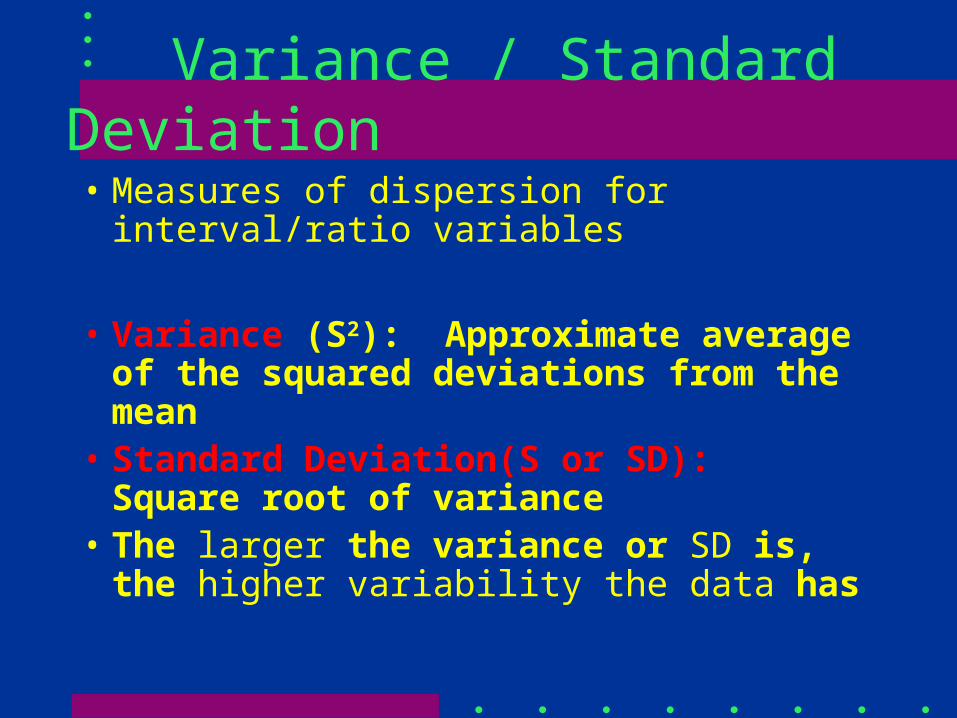
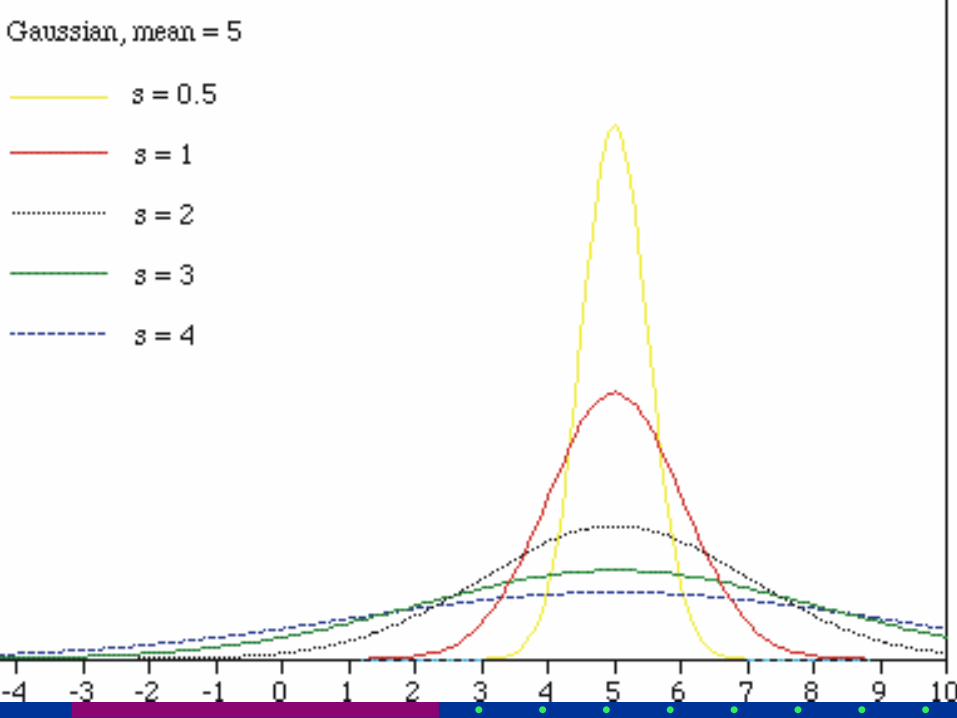
Variance / Standard Deviation
• Measures of dispersion for interval/ratio variables
• Variance (S2): Approximate average of the squared deviations from the mean
• Standard Deviation(S or SD): Square root of variance
• The larger the variance or SD is, the higher variability the data has

Variance
Xi = Value of Each case
X bar = Mean
N = Sample size
S 2 = )( xxi
N - 1
2

Standard Deviation
S =
Xi = Value of Each case
X bar = Mean
N = Sample size
1
)(
N
xXi 2

The Root-Mean-Square-Deviation or Standard Deviation
Root
Mean
Square
Deviation
n-1
( )
X - X
2
(X – X)2
n-1
Mean = X
n
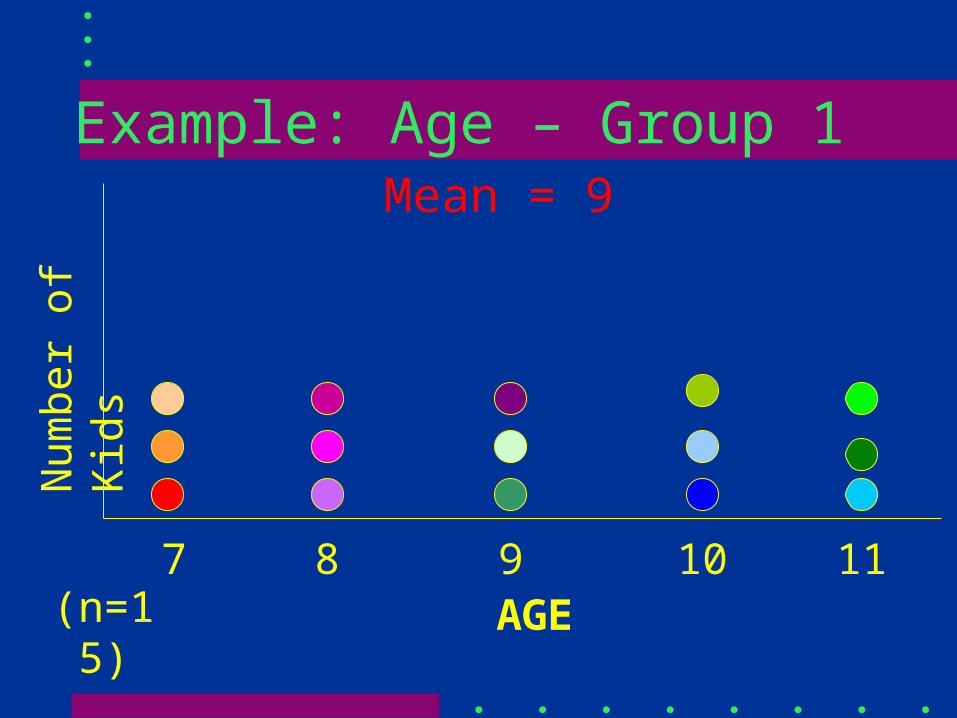
Example: Age – Group 1
7 8 9 10 11AGE
Num
ber o
f Kid
s
(n=15)
Mean = 9

Example: Age – Group 2
7 8 9 10 11AGE
Num
ber o
f Kid
s
(n=15)
Mean = 9

Example: Age – Group 1
7 8 9 10 11AGE
Num
ber o
f Kid
s
(n=15)
Mean = 9

Example: Age – Group 2
7 8 9 10 11AGE
Num
ber o
f Kid
s
(n=15)
Mean = 9
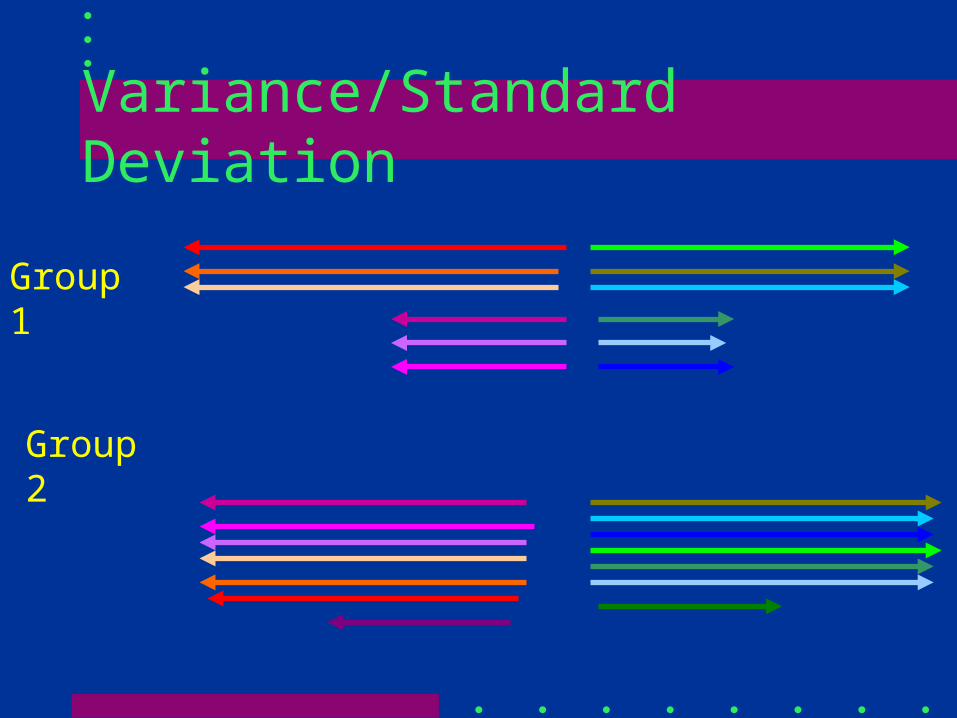
Variance/Standard Deviation
Group 1
Group 2

What are the Mean and Standard deviation for the above distribution?
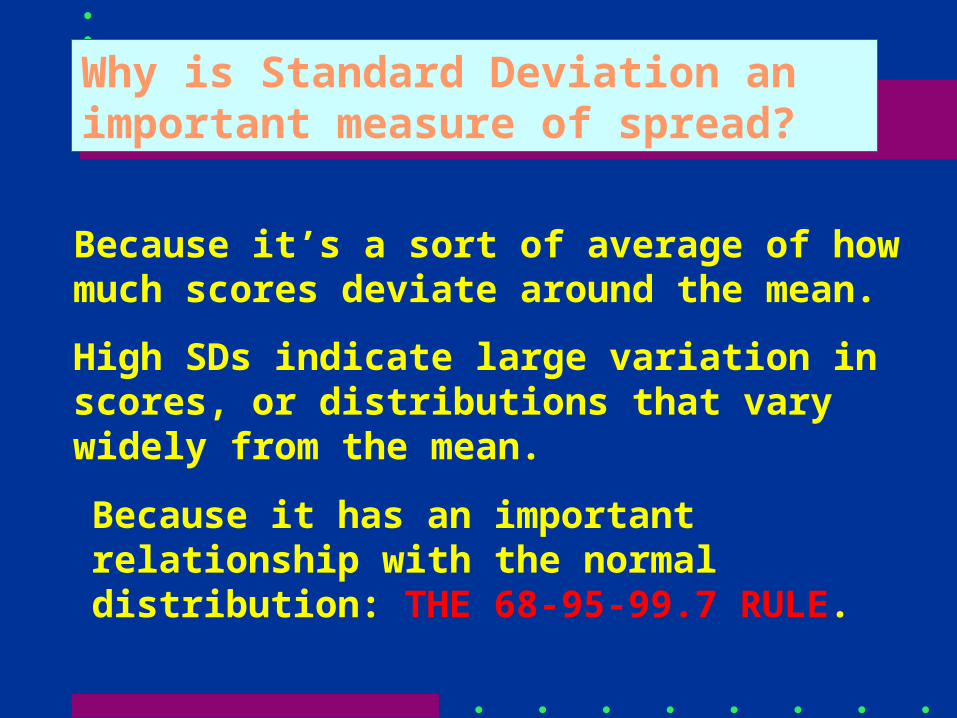
Why is Standard Deviation an important measure of spread?
Because it’s a sort of average of how much scores deviate around the mean.
High SDs indicate large variation in scores, or distributions that vary widely from the mean.
Because it has an important relationship with the normal distribution: THE 68-95-99.7 RULE.

-3s -2s -1s X +1s +2s +3s
Mean +/- 1 s d covers 68% of the population
Mean +/- 2 s d covers 95% of the population
Mean +/- 3 s d covers 99.7% of the population
The 68-95-99.7 Rule
68%
95%
99.7%
50%