agenda cibmtr working committee for …...not for publication or presentation attachment 1 m i n u t...
TRANSCRIPT
Not for publication or presentation
AGENDA CIBMTR WORKING COMMITTEE FOR INTERNATIONAL STUDIES San Diego, California Thursday, February 2, 2012, 2:45 pm – 4:45 pm Co-Chair: Mahmoud Aljurf, MBBS, King Faisal Hospital, Riyadh, Saudi Arabia Phone: 966-1-442-3940; Fax: 966-1-442-3941; E-mail: [email protected] Co-Chair: David Gomez-Almaguer, MD, Hospital Universitario, Monterrey, Mexico Phone: 52-81-83-48-8510; Fax: 52-81-86-75-6717; E-mail: [email protected] Co-Chair: Yoshiko Atsuta, MD, PhD, Nagoya University Grad School of Medicine, Nagoya, Japan, Phone: 81-52-719-1973; Fax: 81-52-719-1973; Email: [email protected] Statisticians: Zhenhuan (Kenny) Hu, MPH, CIBMTR Statistical Center Phone: 414-805-0656, Fax: 414-805-0714, E-mail: [email protected] Sandra Korman, MS, CIBMTR Statistical Center Phone: 414-805-0682, Fax: 414-805-0714, E-mail: [email protected] John Klein, PhD, CIBMTR Statistical Center Phone: 414-456-8379, Fax: 414-456-6530, E-mail: [email protected] Sci Director: Marcelo Pasquini, MD, MS, CIBMTR Statistical Center Phone: 414-805-0700 Fax: 414-805-0714, E-mail: [email protected]
1. Introduction
a. New chair announcement – Dr. Carmem Bonfim (Curitiba, Brazil) b. Minutes of February, 2011 meeting (Attachment 1) c. Instructions for sign-in and voting
2. Accrual Summary (Attachment 2)
3. Presentations, published or submitted papers
a. IS10-02 Sanghee Hong, Chris Barker. Trends in utilization of total body irradiation prior to hematopoietic stem cell transplant worldwide. Poster at BMT Tandem Meeting in San Diego, CA, February 2012
b. IS10-02 Sanghee Hong, Chris Barker. Total body irradiation prior to hematopoietic stem cell transplant – a pattern of care study. Poster at BMT Tandem Meeting in San Diego, CA, February 2012
4. Studies in Progress (Attachment 3)
a. IS08-01 Hematopoietic cell transplantation activity survey in the Americas: WBMT Global Survey (M Pasquini)
Manuscript preparation
b. IS09-04 Hematopoietic stem cell transplantation in children in Latin-America: Development and recent activity (L Rodrigues, C Bonfim, M Eckrich)
Manuscript preparation
1

Not for publication or presentation
c. IS10-02 Total body irradiation prior to hematopoietic stem cell transplant – a pattern of care study. (C Barker)
Manuscript preparation
d. IS09-01/MM08-04 Auto hematopoietic stem cell transplantation for multiple myeloma: a comparison of North and South America (G Milone/B Wirk) (Attachment 4)
Protocol Development
e. IS09-02 Outcome comparison of the effect of HLA-matched sibling donor transplantation for severe aplastic anemia across different regions (R Kumar) (Attachment 5)
Protocol Development
f. IS10-01 Global variation in stem cell transplantation techniques for ALL and AML: a comparative analysis. (W Wood/N Majhail) (Attachment 6)
Protocol Development
5. Future/Proposed Studies
a. Proposal 1111-56 TBI and radiation therapy prior the HCT: a survey for transplant specialists associated with the CIBMTR (C Barker) (Attachment 7)
6. Presentations
a. M Kharfan-Dabaja. Allogeneic matched-sibling hematopoietic cell transplantation (HCT) for acute myeloid leukemia in first complete remission: comparable outcomes between Eastern Mediterranean (EMBMT) and geographically-restricted European (EBMT) participating centers
b. D. Niederwieser. WBMT Workshop on Hematopoietic Cell Transplantation in Emerging Countries (Vietnam, 2011)
c. Helen Baldomero. WBMT Global Survey Update
7. Other Business
2

Not for publication or presentation Attachment 1
M I N U T E S D R A F T CIBMTR WORKING COMMITTEE FOR INTERNATIONAL STUDIES Honolulu, Hawaii Saturday, February 19, 2011, 2:45 – 4:45 pm Co-Chair: Mahmoud Aljurf, MBBS, King Faisal Hospital, Riyadh, Saudi Arabia
Phone: 966-1-442-3940; Fax: 966-1-442-3941; E-mail: [email protected]
Co-Chair: David Gomez-Almaguer, MD, Hospital Universitario, Monterrey, Mexico Phone: 52-81-83-48-8510; Fax: 52-81-86-75-6717; E-mail: [email protected]
Co-Chair: Philip Rowlings, MBBS, MD, Newcastle Mader Hospital, Newcastle, Australia Phone: 61-4186-908-03; Fax: 61-2496-021-36; E-mail: [email protected] Statisticians: John Klein PhD, CIBMTR Statistical Center, Milwaukee, WI
Phone: 414-456-8379; Fax: 414-456-6530 ; E-mail: [email protected] Kathy Sobocinski, MS, CIBMTR Statistical Center, Milwaukee, WI
Phone: 414-805-0682; Fax: 414-805-0714; E-mail: [email protected] Scientific Director: Marcelo Pasquini, MD, MS, CIBMTR Statistical Center, Milwaukee, WI Phone: 414-805-0700; Fax: 414-805-0714; E-mail: [email protected] 1. Introduction
Introduction of Leadership Team and New Co-Chair – Yoshiko Atsuta, MD. Mahmoud Aljurf led the introductions. Phil Rowlings was presented with a gift of appreciation from the CIBMTR as outgoing chair and Yoshiko Atsuta was introduced as incoming chair.
Minutes of February, 2010 meeting Minutes were approved.
2. Accrual summary
KAS noted that the attached accrual summaries are update from the 2010 meeting with an additional year added.
3. Presentations, published or submitted papers
a. David Gomez-Almaguer introduced these talks. Trends of Hematopoietic Cell Transplantation in the Eastern Mediterranean Region, 1984-2007 – Syed Zaidi, MD. Dr. Zaidi reported on the transplant center activity in the EMR over the last 22 years. First reported formally in 2008 for indications of transplant from 9 countries with 15/17 teams responding on ~ 8000 transplants. Transplant activities increased every year. For the 1st indication, the majority of transplants were for acute leukemia. He noted some regional disparities including economic factors, team density/distribution and local factors. He then showed a comparison with EBMT 2007 activity.
3

Not for publication or presentation Attachment 1
b. Global Survey Update – Helen Baldomero. Helen presented data from the 2008 Global Survey of Transplant performed by the EBMT. No outcome data. There is an updated version of the data published in JAMA last year. 70 countries and 1402 teams based on 4 continental regions instead of the 6 WHO regions. This data will be presented in it’s entirety at WBMT meeting on Sunday. The data indicate that there are 3 main factors for transplant rates in different countries: available resources, government support for the health system, and access to the transplant centers. She noted that some countries are missing data and some have underreported. The number of reported transplants has increased since 2006.
4. Studies in Progress
a. IS08-01: Transplant Activity Survey in the Americas (Pasquini): Data Collection Marcelo Pasquini presented results of this survey to date concerning transplants in 2007 and 2008 in the Americas. This study is being performed utilizing the activity survey developed by the EBMT (Gratwohl et al) and is also part of the larger Global Activity project from WBMT, which reports on global transplant activity and trends. The data presented was compiled from data reported to the CIBMTR plus responses from the activity survey from the region. The responses on the survey were disappointing from countries in Latin America, except from Brazil which the transplant society was able to compile data from 80% of transplant performed during the period. The committee suggested presenting the data separately for Latin America since the number of transplants in the US is much larger. Another suggestion from the committee was to present the data separate for pediatrics and adults. This activity report represents center and not individual patient data, and demographic separation cannot be easily done, but this distinction will be able to be done in the IS09-02 study that was also presented later to the committee.
b. IS09-01/MM08-04: Outcome of Autologous Hematopoietic Cell Transplantation (HCT) In
Patients with Multiple Myeloma, Comparison of Patients from North versus South America (Wirk/Milone): This study has the objective of describing transplant practices for treatment of multiple myeloma between Latin America and US. The final protocol still needs to be completed and supplemental data from Latin America is needed, as autologous transplant reporting remains voluntary and it is unclear the proportion of patients captured in the CIBMTR.
c. IS09-02 SAA: An International Comparative Study (Kumar): Dr. Kumar presented the data
collection. This study has the objective of comparing effectiveness of graft source for outcomes of aplastic anemia across different regions in terms of economic status. Patients from high and upper income regions are predominately (> 80%) use BM, while low income countries may utilize peripheral blood progenitor cell graft in order to decrease the incidence of graft failure. The reason for this shift in graft preference is related to high prevalence of overly transfused patients who were exposed to blood products that were not leukodepleted. The major problem with this study has been the underrepresentation of cases from countries in the low and middle income, and the few number of centers in European countries. One idea was to request data from EBMT and the Japanese BMT Society to enrich data from these countries. However this approach may delay this study further. The committee requested that we look at the data currently available and consider ways to move it forward.
4

Not for publication or presentation Attachment 1
d. IS09-03 HCT: The Global Trends in Hematopoietic Stem Cell Transplantation (Eckrich/Rodriguez): Michael Eckrich presented the history of Latin American participation in the registry from 1981 to 2009. He showed the year each country first reported to the CIBMTR and the decades that the countries reported. He presented data for allo and auto transplants by indication also including data on CB transplants. Slides were shown for adults and pediatrics and for transplants reported in the last 5 years by country. Plans include finalizing the dataset, review with writing committee and draft the manuscript.
e. IS10-01: Outcomes of HCT for ALL and AML: An International Comparative Analysis
(Wood): Marcelo Pasquini presented for Dr. Wood. The final protocol is not yet complete. Dr. Wood wanted to look at regional differences in transplants for ALL and AML with main focus on differences in transplant practices for these two major indications and evaluate outcomes according to region. Again the committee suggested reaching out to the EBMT and the Japanese registry to expand the dataset for a more comprehensive study. Next step is to finalize the protocol.
f. IS10-02: TBI prior to HCT: A pattern of care study (Barker): Marcelo Pasquini presented for
Dr. Baker. Activity of TBI by different regions was depicted in the tables in the attachment. We will finalize the protocol by June.
5. Other Business
None.
5

Not for publication or presentation Attachment 2
Accrual Summary for the International Studies Working Committee
Characteristics of recipients of allogeneic transplants by World Health Organization region registered with the CIBMTR between 2005 and 2011
Variable AfricaLatin
Americas US / CanadaEastern
Mediterranean EuropeSoutheastern
AsiaWestern
PacificNumber of patients 86 330 40862 3031 6943 2328 1039Number of centers 4 15 245 7 92 7 16Age, years <10 yrs 5 (6) 60 (18) 5524 (14) 972 (32) 788 (11) 316 (14) 177 (17) 10-19 yrs 11 (13) 55 (17) 4302 (11) 796 (26) 714 (10) 370 (16) 168 (16) 20-29 yrs 12 (14) 64 (19) 3949 (10) 650 (21) 815 (12) 358 (15) 124 (12) 30-39 yrs 16 (19) 69 (21) 4160 (10) 360 (12) 851 (12) 430 (18) 124 (12) 40-49 yrs 23 (27) 43 (13) 6645 (16) 201 (7) 1251 (18) 461 (20) 169 (16) 50-59 yrs 15 (17) 31 (9) 9580 (23) 47 (2) 1453 (21) 302 (13) 203 (20) 60-69 yrs 4 (5) 8 (2) 6193 (15) 3 (<1) 999 (14) 87 (4) 73 (7) >= 70 yrs 0 0 505 (1) 0 72 (1) 4 (<1) 0 Missing 0 0 4 (<1) 2 (<1) 0 0 1 (<1)Sex Male 49 (57) 196 (59) 23576 (58) 1833 (60) 4014 (58) 1369 (59) 598 (58) Female 37 (43) 134 (41) 17263 (42) 1196 (39) 2926 (42) 958 (41) 439 (42) Missing 0 0 23 (<1) 2 (<1) 3 (<1) 1 (<1) 2 (<1)Primary disease Acute myelogenous leukemia 26 (30) 71 (22) 14128 (35) 680 (22) 2524 (36) 864 (37) 361 (35) Acute lymphoblastic leukemia 5 (6) 88 (27) 6716 (16) 555 (18) 1164 (17) 431 (19) 244 (23) Chronic myelogenous leukemia 12 (14) 39 (12) 1896 (5) 262 (9) 431 (6) 89 (4) 50 (5) Myelodysplastic disorders 8 (9) 33 (10) 5625 (14) 115 (4) 1026 (15) 282 (12) 114 (11) Missing 0 0 73 (<1) 0 8 (<1) 2 (<1) 0
6

Not for publication or presentation Attachment 2 Continued.
Variable AfricaLatin
Americas US / CanadaEastern
Mediterranean EuropeSoutheastern
AsiaWestern
Pacific Hodgkin lymphoma 1 (1) 13 (4) 312 (<1) 3 (<1) 54 (<1) 2 (<1) 5 (<1) Multiple myeloma 2 (2) 3 (<1) 361 (<1) 11 (<1) 51 (<1) 3 (<1) 8 (<1)Primary disease continued Other malignancies 4 (5) 3 (<1) 2639 (6) 58 (2) 444 (6) 53 (2) 48 (5) Severe aplastic anemia 14 (16) 47 (14) 1972 (5) 387 (13) 279 (4) 356 (15) 46 (4) Other non-malignancies 5 (6) 19 (6) 3009 (7) 919 (30) 494 (7) 218 (9) 96 (9)Year of transplant 2005 30 (35) 80 (24) 5463 (13) 528 (17) 1760 (25) 308 (13) 200 (19) 2006 22 (26) 88 (27) 5519 (14) 532 (18) 1427 (21) 355 (15) 185 (18) 2007 9 (10) 37 (11) 5766 (14) 463 (15) 992 (14) 329 (14) 177 (17) 2008 6 (7) 42 (13) 6087 (15) 453 (15) 677 (10) 307 (13) 101 (10) 2009 11 (13) 49 (15) 6586 (16) 460 (15) 780 (11) 464 (20) 118 (11) 2010 7 (8) 26 (8) 6762 (17) 452 (15) 794 (11) 446 (19) 165 (16) 2011 1 (1) 8 (2) 4679 (11) 143 (5) 513 (7) 119 (5) 93 (9)Graft type Bone marrow 6 (7) 24 (7) 9679 (24) 1047 (35) 1715 (25) 826 (35) 268 (26) Peripheral blood 77 (90) 276 (84) 25982 (64) 1789 (59) 4816 (69) 1452 (62) 574 (55) Cord blood 3 (3) 26 (8) 4708 (12) 180 (6) 345 (5) 44 (2) 187 (18) Missing 0 4 (1) 493 (1) 15 (<1) 67 (<1) 6 (<1) 10 (<1)Donor type HLA-identical sibling 48 (56) 232 (70) 16145 (40) 2608 (86) 2658 (38) 1324 (57) 454 (44) Twin 1 (1) 9 (3) 289 (<1) 11 (<1) 36 (<1) 6 (<1) 9 (<1) Other relative 2 (2) 45 (14) 2534 (6) 226 (7) 337 (5) 175 (8) 74 (7) Unrelated donor 35 (41) 29 (9) 21277 (52) 178 (6) 3796 (55) 812 (35) 472 (45) Other / missing 0 15 (5) 617 (2) 8 (<1) 116 (2) 11 (<1) 30 (3)
7

Not for publication or presentation Attachment 2
Accrual Summary for the International Studies Working Committee
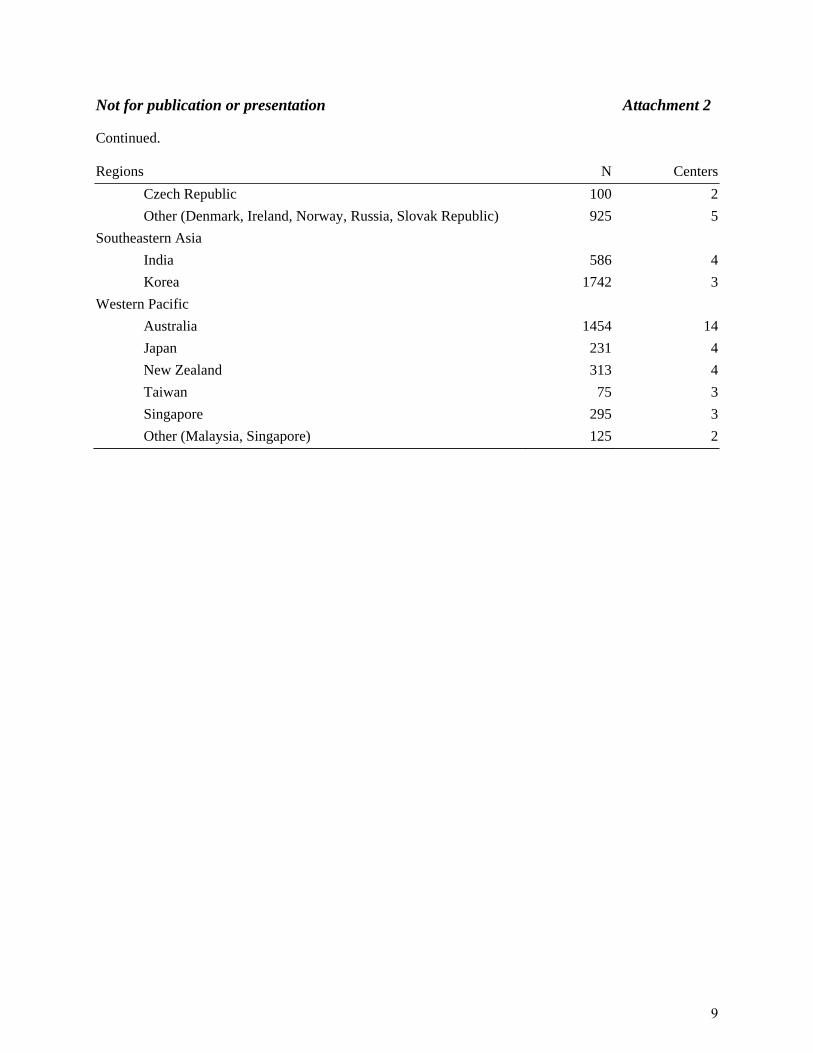
Number of recipients and centers by country registered with the CIBMTR between 2005 and 2011 Regions N Centers
Africa
South Africa 86 4
Americas
USA 34797 183
Argentina 255 8
Brazil 1504 12
Canada 2236 19
Venezuela 87 2
Mexico 121 5
Uruguay 32 4
Other (Chile, Peru, Columbia, Republic of Panama) 90 4
Eastern Mediterranean
Saudi Arabia 1122 2
Pakistan 303 3
Other (Egypt, Iran) 1606 2
Europe
Austria 78 3
Belgium 538 6
UK (England, Northern Ireland, Scotland, Wales) 1089 15
Finland 55 2
France 417 7
Germany 1944 19
Israel 605 5
Italy 206 8
Netherlands 112 4
Poland 127 3
Portugal 70 2
Spain 301 9
Sweden 555 4
Switzerland 259 3
8
Not for publication or presentation Attachment 2 Continued. Regions N Centers
Czech Republic 100 2
Other (Denmark, Ireland, Norway, Russia, Slovak Republic) 925 5
Southeastern Asia
India 586 4
Korea 1742 3
Western Pacific
Australia 1454 14
Japan 231 4
New Zealand 313 4
Taiwan 75 3
Singapore 295 3
Other (Malaysia, Singapore) 125 2
9

Not for publication or presentation Attachment 3
TO: International Studies Working Committee Members FROM: Marcelo Pasquini, Scientific Director for the International Studies Working Committee
RE: Studies in Progress Summary
IS08-01: Hematopoietic Cell Transplantations Activity Survey in the Americas: WBMT Global Survey (W. Bujan/M Pasquini): The objectives of this study are 1) to compile a comprehensive directory of all institutions performing allogeneic, syngeneic or autologous hematopoietic cell transplantation (HCT) in North, Central and South America, and 2) to compile an annual transplant activity survey in all countries on the American continents and combine the data with transplant activity data from other regions for the WBMT World Transplant Activity Survey. The current status is manuscript preparation. IS09-04: Progress of HCT in Latin America (L Rodrigues, C Bonfim, M Eckrich): The main aim of the study is to analyze the development of pediatric HSCT activity, that is, in recipients <18 years of age, in Latin American countries up to the end of 2008. The second aim is to separately analyze the risk factors for transplantation-related mortality for auto- or allo-HSCT, taking into account patient, disease and transplant-related factors and center effect, which are all associated with the outcomes. The current status is manuscript preparation. IS10-02: Total body irradiation prior to hematopoietic stem cell transplantation: a pattern of care study (C Barker): The objective of this study is to summarize the use of total body irradiation (TBI) as part of hematopoietic stem cell transplant (HSCT) over time, for different diseases/disorders and types of HSCT, at different centers, for different aged patients, across the world, at institutions affiliated with the CIBMTR. A secondary objective will be to analyze parameters of the situations when TBI is used, in order to determine when TBI is most commonly used during HSCT. The current status is manuscript preparation. IS09-01: Outcome of autologous hematopoietic cell transplantation (HCT) in patients with multiple Myeloma: a comparison of patients from North versus South America (G Milone/ Wirk): The aim of this study is to describe the outcomes of autologous hematopoietic cell transplantation (AHPCT) in patients with multiple myeloma in North and South America. Data from Latin America are incomplete and will need additional post-transplant information before proceeding to analysis. IS09-02: Outcome comparison of the effect of HLA-matched sibling donor transplantation for severe Aplastic anemia across different regions (R Kumar): The aim of this study is to describe and compare clinical outcomes of transplants for severe aplastic anemia by graft source and region. The biggest hurdle is the lack of representativeness of CIBMTR data from certain countries. Additional data from the EBMT and the Japanese Registry are being requested in order to improve the analysis. Protocol development is underway. IS10-01: Outcomes of stem cell transplantation for ALL and AML: an international comparative analysis (W Wood): This study proposes to determine whether overall survival and non-relapse mortality at 1-year following myeloablative transplantation for AML and ALL varies internationally by country-level health and economic status or by geographic region. A second objective is to describe the timing of myeloablative transplantation for ALL or AML (CR1, CR2 or other) by country-level health and economic status. Protocol development is underway.
10

Not for publication or presentation Attachment 4
CIBMTR IS09-01
OUTCOME OF AUTOLOGOUS HEMATOPOIETIC CELL TRANSPLANTATION (HCT) IN
PATIENTS WITH MULTIPLE MYELOMA, COMPARISON OF PATIENTS FROM NORTH VERSUS SOUTH AMERICA
DRAFT PROTOCOL
Study Chairs: Baldeep M. Wirk, MD
Bone Marrow Transplant Program Shands HealthCare & University of Florida 1600 SW Archer Road P.O. Box 100277 Gainesville, FL 32610 Telephone: 352-273-5100 Fax: 352-392-8530 E-mail: baldeep.wirk@medicine. ufl.edu
Gustavo A. Milone, MD Oncohematology FUNDALEU Jose E Uriburu 1450 Buenos Aires C1114AAN ARGENTINA
Telephone: 54-11-4877-1050 Fax: 54-11-4805-1703 E-mail: [email protected]
Study Statisticians: Zhenhuan (Kenny) Hu, MPH CIBMTR Statistical Center Medical College of Wisconsin 9200 W. Wisconsin Ave., Suite CC5500 Milwaukee, WI 53226 USA Telephone: 414-805-0656 Fax: 414-805-0714 E-mail: [email protected] Sandra Korman, MS CIBMTR Statistical Center Medical College of Wisconsin 9200 W. Wisconsin Ave., Suite CC5500 Milwaukee, WI 53226 USA Telephone: 414-805-0682 Fax: 414-805-0714 E-mail: [email protected]
11

Not for publication or presentation Attachment 4
John P. Klein, PhD CIBMTR Statistical Center Medical College of Wisconsin 9200 W. Wisconsin Ave., Suite C5500 Milwaukee, WI 53226 USA Telephone: 414-955-8379 Fax: 414-955-6530 E-mail: [email protected] Scientific Director: Marcelo C. Pasquini, MD, MS CIBMTR Statistical Center Medical College of Wisconsin 9200 W. Wisconsin Ave., Suite CC5500 Milwaukee, WI 53226 USA Telephone: 414-805-0700 Fax: 414-805-0714 E-mail: [email protected] Working Committee Chairs: Mahmoud Aljurf, MBBS
King Faisal Hospital Riyadh, Saudi Arabia Phone: 966-1-442-3940 Fax: 966-1-442-3941 E-mail: [email protected]
David Gomez-Almaguer, MD Hospital Universitario Monterrey, Mexico Telephone: (52) 81-83-48-8510 Fax: (52) 81-86-75-6717 E-mail: [email protected]
Philip Rowlings, MBBS, MD
Newcastle Mader Hospital Newcastle, Australia
Phone: 61-4186-908-03 Fax: 61-2496-021-36 E-mail: [email protected]
12
Not for publication or presentation Attachment 4
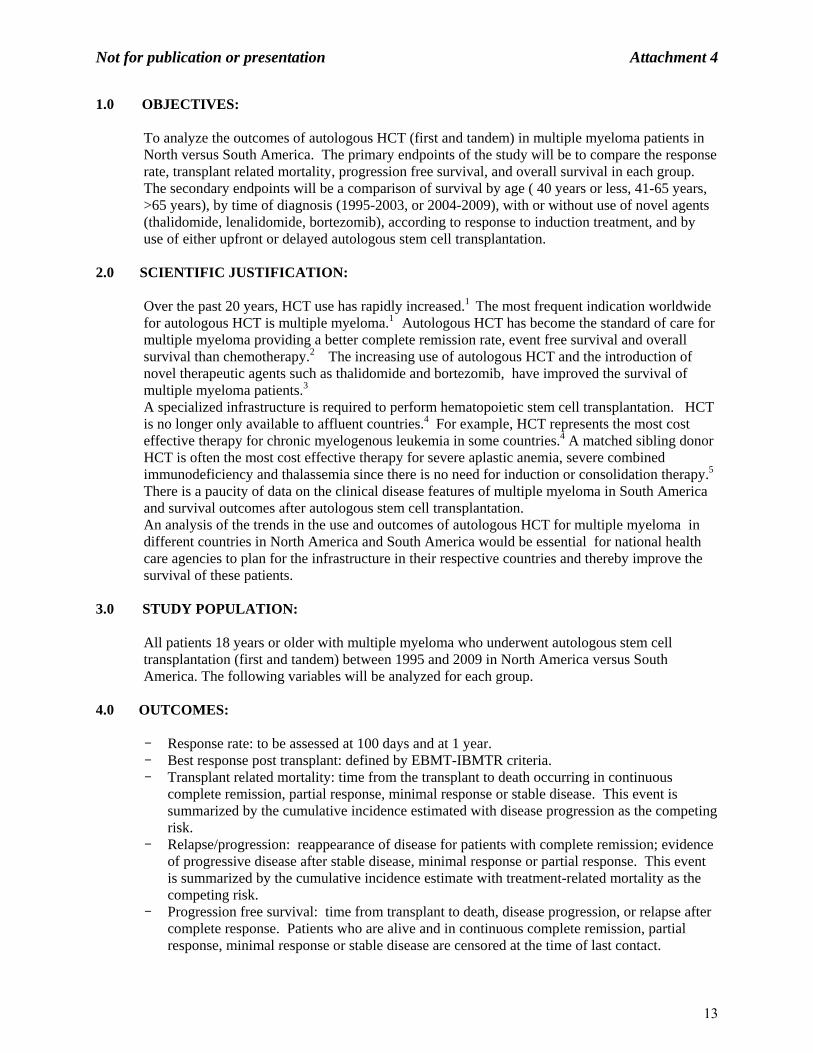
1.0 OBJECTIVES: To analyze the outcomes of autologous HCT (first and tandem) in multiple myeloma patients in North versus South America. The primary endpoints of the study will be to compare the response rate, transplant related mortality, progression free survival, and overall survival in each group. The secondary endpoints will be a comparison of survival by age ( 40 years or less, 41-65 years, >65 years), by time of diagnosis (1995-2003, or 2004-2009), with or without use of novel agents (thalidomide, lenalidomide, bortezomib), according to response to induction treatment, and by use of either upfront or delayed autologous stem cell transplantation.
2.0 SCIENTIFIC JUSTIFICATION:
Over the past 20 years, HCT use has rapidly increased.1 The most frequent indication worldwide for autologous HCT is multiple myeloma.1 Autologous HCT has become the standard of care for multiple myeloma providing a better complete remission rate, event free survival and overall survival than chemotherapy.2 The increasing use of autologous HCT and the introduction of novel therapeutic agents such as thalidomide and bortezomib, have improved the survival of multiple myeloma patients.3 A specialized infrastructure is required to perform hematopoietic stem cell transplantation. HCT is no longer only available to affluent countries.4 For example, HCT represents the most cost effective therapy for chronic myelogenous leukemia in some countries.4 A matched sibling donor HCT is often the most cost effective therapy for severe aplastic anemia, severe combined immunodeficiency and thalassemia since there is no need for induction or consolidation therapy.5 There is a paucity of data on the clinical disease features of multiple myeloma in South America and survival outcomes after autologous stem cell transplantation. An analysis of the trends in the use and outcomes of autologous HCT for multiple myeloma in different countries in North America and South America would be essential for national health care agencies to plan for the infrastructure in their respective countries and thereby improve the survival of these patients.
3.0 STUDY POPULATION:
All patients 18 years or older with multiple myeloma who underwent autologous stem cell transplantation (first and tandem) between 1995 and 2009 in North America versus South America. The following variables will be analyzed for each group.
4.0 OUTCOMES: Response rate: to be assessed at 100 days and at 1 year. Best response post transplant: defined by EBMT-IBMTR criteria. Transplant related mortality: time from the transplant to death occurring in continuous
complete remission, partial response, minimal response or stable disease. This event is summarized by the cumulative incidence estimated with disease progression as the competing risk.
Relapse/progression: reappearance of disease for patients with complete remission; evidence of progressive disease after stable disease, minimal response or partial response. This event is summarized by the cumulative incidence estimate with treatment-related mortality as the competing risk.
Progression free survival: time from transplant to death, disease progression, or relapse after complete response. Patients who are alive and in continuous complete remission, partial response, minimal response or stable disease are censored at the time of last contact.
13
Not for publication or presentation Attachment 4
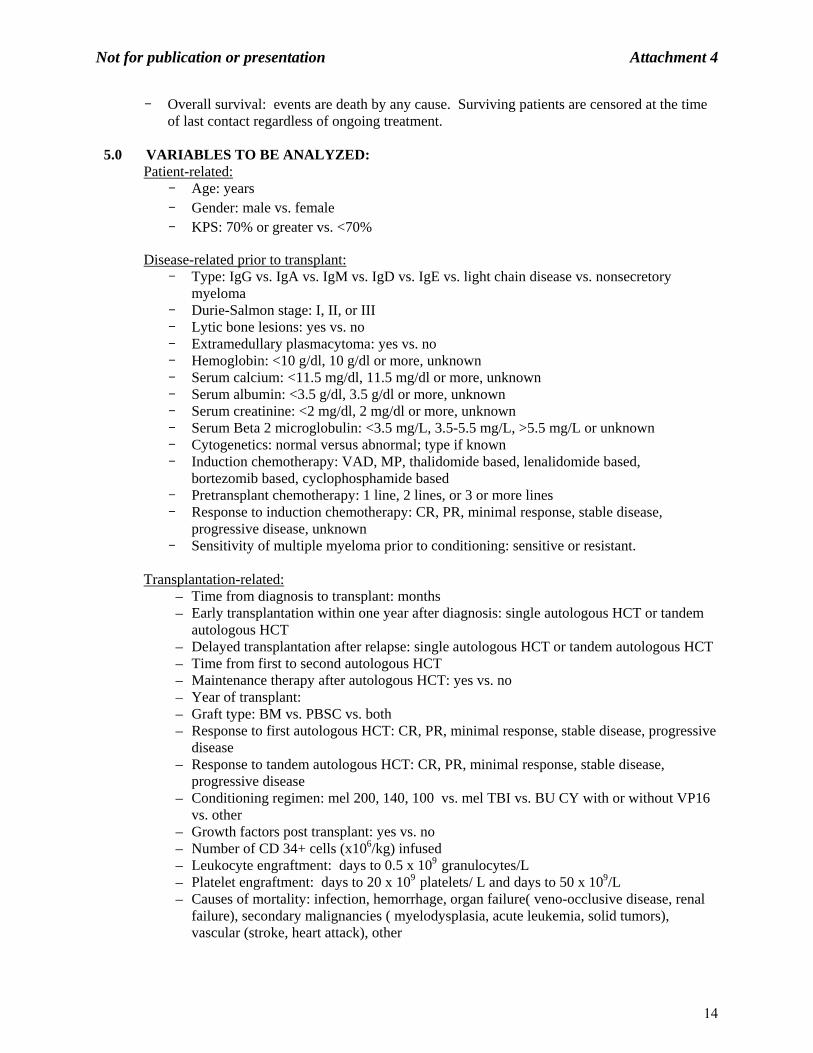
Overall survival: events are death by any cause. Surviving patients are censored at the time of last contact regardless of ongoing treatment.
5.0 VARIABLES TO BE ANALYZED: Patient-related:
Age: years Gender: male vs. female KPS: 70% or greater vs. <70%
Disease-related prior to transplant: Type: IgG vs. IgA vs. IgM vs. IgD vs. IgE vs. light chain disease vs. nonsecretory
myeloma Durie-Salmon stage: I, II, or III Lytic bone lesions: yes vs. no Extramedullary plasmacytoma: yes vs. no Hemoglobin: <10 g/dl, 10 g/dl or more, unknown Serum calcium: <11.5 mg/dl, 11.5 mg/dl or more, unknown Serum albumin: <3.5 g/dl, 3.5 g/dl or more, unknown Serum creatinine: <2 mg/dl, 2 mg/dl or more, unknown Serum Beta 2 microglobulin: <3.5 mg/L, 3.5-5.5 mg/L, >5.5 mg/L or unknown Cytogenetics: normal versus abnormal; type if known Induction chemotherapy: VAD, MP, thalidomide based, lenalidomide based,
bortezomib based, cyclophosphamide based Pretransplant chemotherapy: 1 line, 2 lines, or 3 or more lines Response to induction chemotherapy: CR, PR, minimal response, stable disease,
progressive disease, unknown Sensitivity of multiple myeloma prior to conditioning: sensitive or resistant.
Transplantation-related:
– Time from diagnosis to transplant: months – Early transplantation within one year after diagnosis: single autologous HCT or tandem
autologous HCT – Delayed transplantation after relapse: single autologous HCT or tandem autologous HCT – Time from first to second autologous HCT – Maintenance therapy after autologous HCT: yes vs. no – Year of transplant: – Graft type: BM vs. PBSC vs. both – Response to first autologous HCT: CR, PR, minimal response, stable disease, progressive
disease – Response to tandem autologous HCT: CR, PR, minimal response, stable disease,
progressive disease – Conditioning regimen: mel 200, 140, 100 vs. mel TBI vs. BU CY with or without VP16
vs. other – Growth factors post transplant: yes vs. no – Number of CD 34+ cells (x106/kg) infused – Leukocyte engraftment: days to 0.5 x 10⁹ granulocytes/L – Platelet engraftment: days to 20 x 109 platelets/ L and days to 50 x 109/L – Causes of mortality: infection, hemorrhage, organ failure( veno-occlusive disease, renal
failure), secondary malignancies ( myelodysplasia, acute leukemia, solid tumors), vascular (stroke, heart attack), other
14
Not for publication or presentation Attachment 4
6.0 DATA COLLECTION:
All data requested will be provided by existing data collection forms and no supplemental data will be required. Follow up will be complete by the end of 2010.
7.0 STUDY DESIGN:
Fisher’s exact test will be applied to assess associations between categorical variables. Overall survival will be estimated by the Kaplan-Meier method. A log rank test will be used to compare overall survival. The Cox proportional hazard model will be used for multivariate analysis. Statistical significance will be defined as p< 0.05. For this analysis, patients will be divided into two groups, those from North America and from South America. In each group, patients will be subdivided into those diagnosed between 1995 and 2003 and those diagnosed since 2004 since the use of novel agents such as thalidomide and bortezomib occurred thereafter. In addition patients will be analyzed according to three age strata: 40 years or less, 41-65, or >65 years since this is the upper age limit for autologous stem cell transplant in many South American countries. The cutoff of 40 years will be used to compare the treatment outcomes and disease characteristics of younger patients with multiple myeloma with older patients.
8.0 REFERENCES:
1. Gratwohl A, Baldomero H, Aljurf M et al. Hematopoietic stem cell transplantation: A global perspective. JAMA 2010; 303:1617-24.
2. Attal M, Harousseau JL, Stoppa AM et al. A prospective randomized trial of autologous bone marrow transplantation and chemotherapy in multiple myeloma. Intergroupe Francais du Myelome. N Engl J Med 1996; 335:91-7.
3. Kumar SK, Rajkumar SV, Dispenzieri A et al. Improved survival in multiple myeloma and the impact of novel therapies. Blood 2008; 111:2516-20.
4. Gawjeski JL, Robinson P. Do affluent societies have the only options for the best therapy. Leukemia 2007;21:387-8.
5. Swanson RC, Mosley H, Sanders D et al. Call for global health-systems impact assessments. Lancet 2009; 374:433-5.
15

Not for publication or presentation Attachment 4
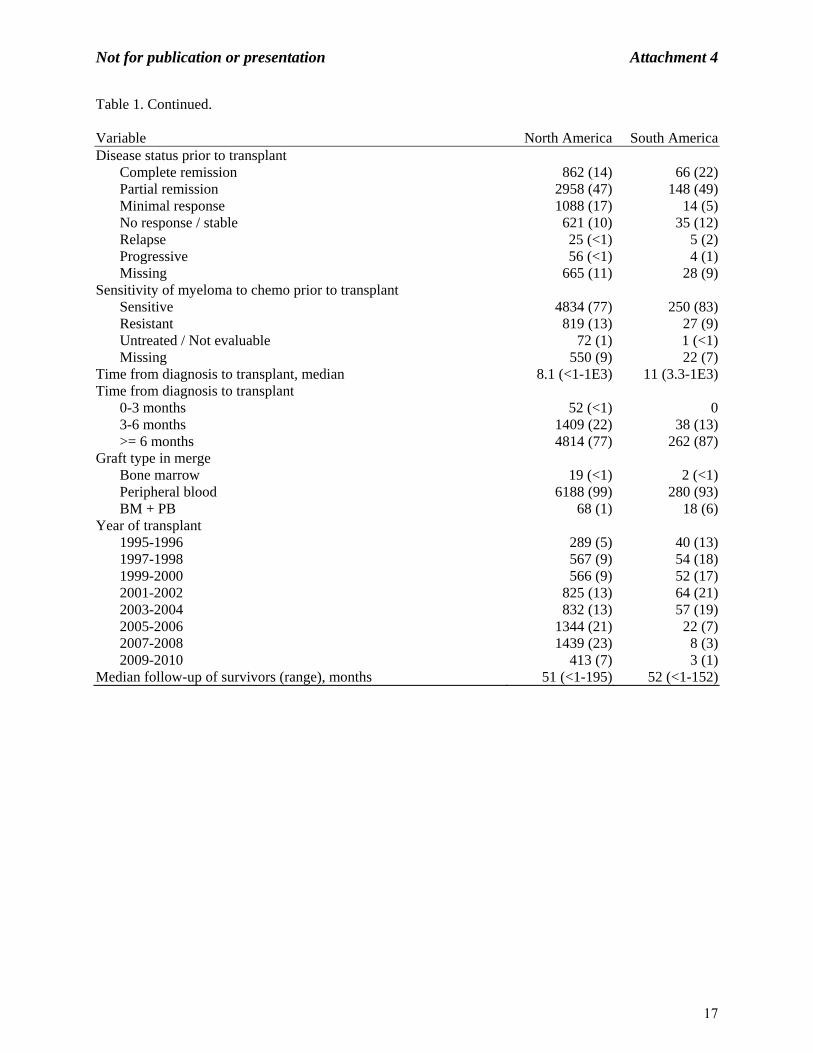
Table 1. Characteristics of patients who underwent auto HST for multiple myeloma reported to the CIBMTR between 1995 and 2010, by region.
Variable North America South AmericaNumber of patients 6275 300Number of centers 189 18Country USA 5852 (93) Canada 423 (7) Argentina 170 (57) Brazil 73 (24) Venezuela 2 (<1) Uruguay 55 (18)Age at transplant, median 58 (22-80) 55 (28-71)Age at transplant 20-29 yrs 19 (<1) 2 (<1) 30-39 yrs 224 (4) 16 (5) 40-49 yrs 1080 (17) 76 (25) 50-59 yrs 2419 (39) 123 (41) >=60 yrs 2533 (40) 83 (28)Gender Male 3740 (60) 160 (53) Female 2535 (40) 140 (47)Karnofsky score 90-100% 3579 (57) 205 (68) <90% 2221 (35) 94 (31) Missing 475 (8) 1 (<1)Durie-Salmon stage at diagnosis Stage I 383 (6) 14 (5) Stage II 1200 (19) 74 (25) Stage III 2581 (41) 177 (59) After 2007 1613 (26) 11 (4) Missing 498 (8) 24 (8)International Staging System stage at diagnosis Stage I 633 (10) 3 (1) Stage II 422 (7) 1 (<1) Stage III 139 (2) 1 (<1) Before 2007 4346 (69) 289 (96)
16
Not for publication or presentation Attachment 4
Table 1. Continued. Variable North America South AmericaDisease status prior to transplant Complete remission 862 (14) 66 (22) Partial remission 2958 (47) 148 (49) Minimal response 1088 (17) 14 (5) No response / stable 621 (10) 35 (12) Relapse 25 (<1) 5 (2) Progressive 56 (<1) 4 (1) Missing 665 (11) 28 (9)Sensitivity of myeloma to chemo prior to transplant Sensitive 4834 (77) 250 (83) Resistant 819 (13) 27 (9) Untreated / Not evaluable 72 (1) 1 (<1) Missing 550 (9) 22 (7)Time from diagnosis to transplant, median 8.1 (<1-1E3) 11 (3.3-1E3)Time from diagnosis to transplant 0-3 months 52 (<1) 0 3-6 months 1409 (22) 38 (13) >= 6 months 4814 (77) 262 (87)Graft type in merge Bone marrow 19 (<1) 2 (<1) Peripheral blood 6188 (99) 280 (93) BM + PB 68 (1) 18 (6)Year of transplant 1995-1996 289 (5) 40 (13) 1997-1998 567 (9) 54 (18) 1999-2000 566 (9) 52 (17) 2001-2002 825 (13) 64 (21) 2003-2004 832 (13) 57 (19) 2005-2006 1344 (21) 22 (7) 2007-2008 1439 (23) 8 (3) 2009-2010 413 (7) 3 (1)Median follow-up of survivors (range), months 51 (<1-195) 52 (<1-152)
17

Not for publication or presentation Attachment 5
CIBMTR IS09-02
OUTCOME COMPARISON OF THE EFFECT OF HLA-MATCHED SIBLING DONOR TRANSPLANTATION FOR SEVERE APLASTIC ANEMIA ACROSS DIFFERENT REGIONS
DRAFT PROTOCOL
Study Chair: Rajat Kumar, MD, FRCP, FRCPC Professor, Department of Internal Medicine Section of Hematology/Oncology Department of Medical Oncology and Hematology CancerCare Manitoba ON-2025 - 675 McDermot Ave Winnipeg, R3E 0V9 CANADA Phone: 1-204-787-8640 Fax: 1-204-786-0196 E-mail: [email protected] Study Statisticians: Zhenhuan Hu, MS CIBMTR Statistical Center Medical College of Wisconsin 9200 W. Wisconsin Ave., Suite C5500 Milwaukee, WI 53226
Phone: 414-805-0656 Fax: 414-805-0714 E-mail: [email protected]
Sandra Korman, MS CIBMTR Statistical Center Medical College of Wisconsin 9200 W. Wisconsin Ave., Suite C5500 Milwaukee, WI 53226
Phone: 414-805-0682 Fax: 414-805-0714
E-mail: [email protected] John Klein, PhD CIBMTR Statistical Center Medical College of Wisconsin 9200 W. Wisconsin Ave., Suite C5500 Milwaukee, WI 53226
Phone: 414-456-8379 Fax: 414-456-6530 E-mail: [email protected]
18

Not for publication or presentation Attachment 5
Scientific Director: Marcelo Pasquini, MD, MS CIBMTR Statistical Center Medical College of Wisconsin 9200 W. Wisconsin Ave., Suite C5500 Milwaukee, Phone: 414-805-0700 Fax: 414-805-0714 E-mail: [email protected] Working Committee Chairs: Mahmoud Aljurf, MD
King Faisal Hospital Riyadh, Saudi Arabia 11211 Phone: 966-1-442-3940 Fax: 966-1-442-3941 E-mail: [email protected] David Gomez-Almaguer, MD Hospital Universitario Monterrey, Mexico Phone: 52-81-83-48-8510 Fax: 52-81-86-75-6717 E-mail: [email protected] Yoshiko Atsuta, MD, PhD Nagoya University Graduate School of Medicine Nagoya, Japan Phone: 81-52-719-1973 Fax: 81-52-719-1973
E-mail: [email protected]
19

Not for publication or presentation Attachment 5
1.0 HYPOTHESES:
Hematopoietic stem cell transplantation (HSCT) is recommended as curative therapy for eligible patients with severe aplastic anemia (SAA). Older studies showed a high risk of graft failure in patients who had received multiple transfusions pre-transplant, with a superior outcome in patients receiving higher marrow dose and buffy coat infusions. More recent data suggests worse outcome and more chronic GVHD in young patients receiving peripheral blood stem cells (PBSC) compared to those receiving bone marrow (BM) as the graft source in HLA-matched sibling transplant. This data is predominantly from North American and European centers. Based on limited studies from Asian and African countries, we hypothesize that these recommendations may not be valid in regions with limited resources where most patients with SAA undergoing HSCT are at high risk of graft failure and early complications of transplantation..
2.0 OBJECTIVES:
To compare the following clinical outcomes between patients undergoing HLA-identical sibling HSCT by economic regions:
Overall Survival (OS) 100-day mortality Acute GVHD Chronic GVHD Primary Graft Failure Secondary Graft Failure
3.0 SCIENTIFIC JUSTIFICATION:
A recent analysis of the outcome of 692 HLA-matched sibling transplants for SAA performed from 1995 to 2003, concluded that use of peripheral blood stem cells (PBSC) resulted in a worse outcome and more chronic GVHD in patients younger than 20 years. (1) In older patients, overall survival was lower with PBSC, though not statistically significant. Earlier series reported that rates of marrow graft rejection were as high as 30%-60% in SAA (2) with associated high mortality. Subsequent studies have shown declining rates of rejection. Graft failure was 11% in 625 patients transplanted from 1978 to 1986. (3) Factors responsible for graft failure include sensitization by previous blood transfusions, low marrow cell dose and T-cell depleted grafts. (2,4) Risk factors associated with decreased survival include 20 or more pretransplant transfusions, infections pre-transplant, and interval between diagnosis and transplant of more than 1 month. (5) To overcome the high rates of graft failure, addition of buffy coat cell infusions to the bone marrow dose reduced rejection and increased survival.(2) The cell dose can also be increased by using G-CSF mobilized PBSC instead of BM. (4) Recent literature suggests that cell dose or co-administration of donor buffy coat cells no longer affected the probability of engraftment or treatment failure. (3,5) This change likely reflects improved supportive care and earlier transplants.
20

Not for publication or presentation Attachment 5
In developing countries, most of the risk factors for poor survival are still present and blood products are often not leucodepleted. (6,7) Although the incidence of aplastic anemia is 2-3 times higher in Asia (8), there are very few publications on the outcomes of HSCT from these countries. In one Centre at Vellore, India, graft source was PBSC in 28 and G-CSF stimulated BM in 7 with a survival of 82.8% at a median follow-up of 22 months.(6) Another centre in Delhi reported 18 transplants in 17 patients, using PBSC in 15 and BM in 3 with an overall survival of 77.7% at a median follow-up of 15 months.(7) In both these centers use of PBSC was not associated with increased risk of GVHD, although long-term survival data is lacking. (6,9). Both centers used a fludarabine based regimen. In Egypt the HSCT program is using PBSC exclusively and in aplastic anemia the disease free survival in 62 cases was 82% with a median follow-up of 2 years using a fludarabine/cyclophosphamide conditioning. (10) Another report from Pakistan showed an overall survival of 78% in aplastic anemia using predominantly PBSC in one center and BM in two centres. Despite use of PBSC at one centre, extensive chronic GVHD was seen in only 4% cases. (11)
The risk of chronic GVHD may vary in populations. In a study of different ethnic populations
undergoing BMT for leukemias, the white Americans, African Americans and Irish cohorts were at significantly higher risk for acute GVHD than the Japanese or Scandinavian cohorts. (12) It is postulated that more homogeneous populations may have smaller repertoires of minor histocompatibility antigens and certain HLA alleles are associated with decreased risk for GVHD. (12)
In developing countries any risk benefit analysis of transplant needs to include the fact that graft
failure usually ends in fatality as resources to support such patients are limited. Also, transfusion support and resources to manage prolonged neutropenia are a greater issue. The rationale for using PBSC over bone marrow are: (a) faster engraftment (b) higher progenitor and T cell dose with lower risk of graft rejection (c) rapid immunologic recovery (d) lower blood component and antimicrobial requirement (e) less hospitalization costs. These advantages seem to outweigh the higher risk of chronic GVHD in certain regions. There may also be differences in severity of GVHD in different ethnic groups.
The majority of HSCT are performed in countries with advanced health facilities. Thus any analysis of pooled data from international registries will predominantly reflect the outcome in advanced countries. It is therefore important to compare the results of BM versus PBSC in transplants performed in the same region. The best analysis would be if regions were classified on basis of both geographic and economic basis as per WHO criteria. If outcome of HSCT with PBSC is not inferior to BM in developing countries, PBSC may be an equivalent or better source of stem cells for HSCT in SAA in countries with limited resources.
4.0 STUDY POPULATION:
This study will include patients who have undergone their first HSCT from HLA-matched sibling for SAA with bone marrow or peripheral blood grafts from 1995-2007. Data fwill be analyzed based on World Bank economic classifications.
21

Not for publication or presentation Attachment 5
5.0 OUTCOMES:
Overall Survival: Time to death from any cause. Patients are censored at last follow-up. 100-day mortality: Death on or before 100 days post transplant. Acute GVHD: Acute GVHD will be coded as absent (none or grade 1) versus present
(grade 2 or greater) based on the CIBMTR grading system. The event is summarized by the cumulative incidence estimate with death or 2nd transplant as a competing risk.
Chronic GVHD: chronic GVHD will be coded as absent (none or limited) versus present (extensive). The event is summarized by the cumulative incidence estimate with death or 2nd transplant as a competing risk.
Primary Graft Failure: failure to achieve an ANC > 0.5 x 10⁹/L for 3 consecutive days. Secondary Graft Failure: sustained decline in ANC after initial engraftment.
6.0 VARIABLES TO BE DESCRIBED: Data will include the following main effect: - World Bank Economic Classification: US and Canada vs All other High Income Countries vs
all Upper Middle, Lower Middle, Low Income Countries
Patient- and- donor related: - Age at transplant: by decades - Gender: male vs. female - Performance score: 90-100 vs. lower than 90 - CMV Status: -/- vs. all others - Country
Disease-related:
- Transfusion Status from diagnosis to start of preparative regimen: - Red cell transfusions between diagnosis to start of preparative regimen: none
vs. 1-10 vs. 11-20 vs. more than 20 vs. unknown - Platelet transfusions between diagnosis to start of preparative regimen: Yes / No - Time from diagnosis to transplant: 0-3 mos vs 3-6 mos vs > 6 mos. - Therapy for SAA before start of preparative regimen:
Any treatment: yes vs. no vs. unknown If treatment given:
Androgens: Yes vs. No Cyclosporine: Yes vs. No Anti-thymocyte or Anti-lymphocyte globulin: Yes vs. No Corticosteroids: Yes vs. No
- Clinically important Infections present or being treated within one week prior to preparative regimen: Yes vs. No vs. Unknown
22

Not for publication or presentation Attachment 5
Transplant-related: - Graft type: BM vs. PBSC - Year of transplant: 1995-1997 vs. 1998-2000 vs. 2001-2003 vs. 2004-2007 or as
dictated by the analysis - Preparative regimen: Cy+ATG±other drugs vs. other - GVHD prophylaxis: CsA or FK506 + MTX vs other
7.0 STUDY DESIGN:
This is a study of allogeneic HSCT in SAA with matched sibling donors, comparing the outcomes across different regions defined by the World Bank according to their economic status. Medians and ranges will be tabulated for continuous demographic variables and percentages for categorical demographic variables.
Acute and chronic GVHD will be described using cumulative incidence estimates with 2nd
transplant or death as the competing risks.
The probability of overall survival will be calculated using the Kaplan-Meier method. Death from any cause will be considered an event and surviving patients will be censored at last follow-up. The 95% confidence interval (CI) will be calculated using log transformation. Cox proportional hazards regression models will be constructed with economic status classification as the main effect. Variables considered will be as shown above.
8.0 REFERENCES
1. Schrezenmeier H, Passweg JR, Marsh JC, et al. Worse outcome and more chronic GVHD
with peripheral blood progenitor cells than bone marrow in HLA-matched sibling donor transplants for young patients with severe acquired aplastic anemia. Blood 2007;110:1397-400.
2. Storb R, Doney KC, Thomas ED, et al. Marrow transplantation with or without donor buffy coat cells for 65 transfused aplastic anemia patients. Blood 1982;59:236-46.
3. Champlin RE, Horowitz MM, van Bekkum DW, et al. Graft failure following bone marrow transplantation for severe aplastic anemia: risk factors and treatment results. Blood 1989;73:606-13.
4. Mattsson J, Ringden O, Storb R. Graft Failure after Allogeneic Hematopoietic Cell Transplantation. Biol Blood Marrow Transplant 2008;14:165-70.
5. Gluckman E, Horowitz MM, Champlin RE, et al. Bone marrow transplantation for severe aplastic anemia: influence of conditioning and graft-versus-host disease prophylaxis regimens on outcome. Blood 1992;79:269-75.
6. George B, Mathews V, Viswabandya A, Kavitha ML, Srivastava A, Chandy M. Fludarabine and cyclophosphamide based reduced intensity conditioning (RIC) regimens reduce rejection and improve outcome in Indian patients undergoing allogeneic stem cell transplantation for severe aplastic anemia. Bone Marrow Transplant 2007;40:13-8.
7. Kumar R, Naithani R, Mishra P, et al. Allogeneic hematopoietic SCT performed in non-HEPA filter rooms: initial experience from a single center in India. Bone Marrow Transplant 2009;43:115-9.
8. Young NS, Kaufman DW. The epidemiology of acquired aplastic anemia. Haematologica 2008;93:489-92.
23

Not for publication or presentation Attachment 5
9. Kumar R, Prem S, Mahapatra M, et al. Fludarabine, cyclophosphamide and horse antithymocyte globulin conditioning regimen for allogeneic peripheral blood stem cell transplantation performed in non-HEPA filter rooms for multiply transfused patients with severe aplastic anemia. Bone Marrow Transplant 2006;37:745-9.
10. Mahmoud H, El-Haddad A, Fahmy O, et al. Hematopoietic stem cell transplantation in Egypt. Bone Marrow Transplant 2008;42 Suppl 1:S76-80.
11. Shamsi T, Hashmi K, Adil S, et al. The stem cell transplant program in Pakistan--the first decade. Bone Marrow Transplant 2008;42 Suppl 1:S114-7.
12. Oh H, Loberiza FR,Jr, Zhang MJ, et al. Comparison of graft-versus-host-disease and survival after HLA-identical sibling bone marrow transplantation in ethnic populations. Blood 2005;105:1408-16.
24

Not for publication or presentation Attachment 5
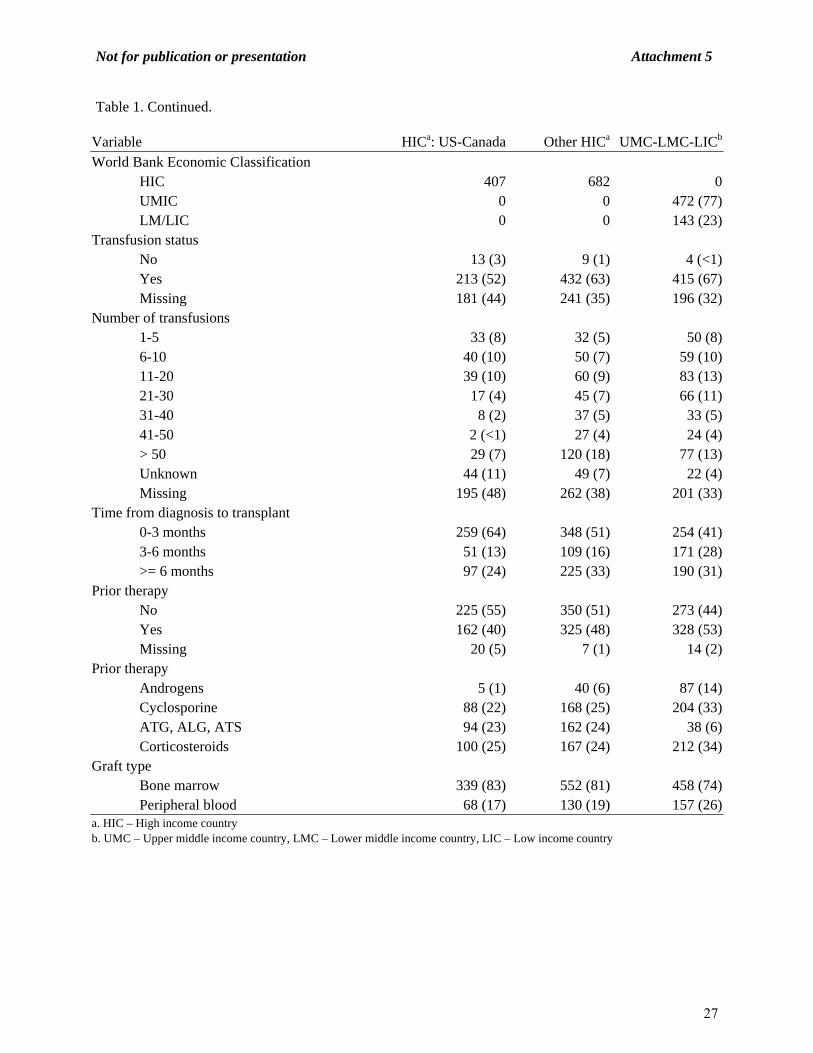
Table 1. Characteristics of recipients of HLA-identical sibling transplants for SAA reported to the CIBMTR from 1995 to 2007 by World Bank Economic Classification.
Variable HICa: US-Canada Other HICa UMC-LMC-LICb
Number of patients 407 682 615Number of centers 92 82 42Age at transplant, median 19 (<1-66) 22 (1.2-66) 19 (<1-63)Age at transplant <10 yrs 83 (20) 86 (13) 93 (15) 10-19 yrs 128 (31) 223 (33) 236 (38) 20-29 yrs 70 (17) 188 (28) 180 (29) 30-39 yrs 51 (13) 106 (16) 78 (13) 40-49 yrs 47 (12) 62 (9) 23 (4) 50-59 yrs 23 (6) 14 (2) 4 (<1) >=60 yrs 5 (1) 3 (<1) 1 (<1)Gender Male 224 (55) 380 (56) 399 (65) Female 183 (45) 302 (44) 216 (35)Karnofsky score 90-100% 245 (60) 455 (67) 329 (53) <90% 142 (35) 216 (32) 282 (46) Missing 20 (5) 11 (2) 4 (<1)CMV status +/+ 126 (31) 355 (52) 389 (63) +/- 30 (7) 33 (5) 22 (4) -/+ 99 (24) 78 (11) 58 (9) -/- 125 (31) 185 (27) 74 (12) Missing 27 (7) 31 (5) 72 (12)Country USA 341 (84) Canada 66 (16) Australia 39 (6) Belgium 16 (2) Denmark 11 (2) UK 50 (7) Finland 3 (<1) France 14 (2) Germany 31 (5) Ireland 18 (3) Israel 14 (2) Italy 5 (<1) Japan 7 (1) a. HIC – High income country b. UMC – Upper middle income country, LMC – Lower middle income country, LIC – Low income country
25

Not for publication or presentation Attachment 5
Table 1. Continued.
Variable HICa: US-Canada Other HICa UMC-LMC-LICb
Country continued Korea 245 (36) Netherlands 2 (<1) New Zealand 18 (3) Portugal 11 (2) Saudi Arabia 118 (17) Spain 23 (3) Sweden 10 (1) Switzerland 3 (<1) Taiwan 5 (<1) Yugoslavia 4 (<1) Hong Kong 11 (2) Greece 1 (<1) Singapore 5 (<1) Czech Republic 10 (1) Slovak Republic 8 (1) Argentina 27 (4) Brazil 309 (50) Chile 1 (<1) China 5 (<1) Hungary 1 (<1) India 34 (6) Malaysia 7 (1) Poland 20 (3) South Africa 29 (5) Russia 11 (2) Venezuela 12 (2) Mexico 22 (4) Turkey 4 (<1) Uruguay 14 (2) Iran 75 (12) Peru 15 (2) Pakistan 29 (5)WHO region Africa 0 0 29 (5) Americas 407 0 400 (65) Eastern Mediterranean 0 118 (17) 104 (17) Europe 0 234 (34) 36 (6) Southeastern Asia 0 245 (36) 34 (6) Western Pacific 0 85 (12) 12 (2)a. HIC – High income country b. UMC – Upper middle income country, LMC – Lower middle income country, LIC – Low income country
26
Not for publication or presentation Attachment 5
Table 1. Continued.
Variable HICa: US-Canada Other HICa UMC-LMC-LICb
World Bank Economic Classification HIC 407 682 0 UMIC 0 0 472 (77) LM/LIC 0 0 143 (23)Transfusion status No 13 (3) 9 (1) 4 (<1) Yes 213 (52) 432 (63) 415 (67) Missing 181 (44) 241 (35) 196 (32)Number of transfusions 1-5 33 (8) 32 (5) 50 (8) 6-10 40 (10) 50 (7) 59 (10) 11-20 39 (10) 60 (9) 83 (13) 21-30 17 (4) 45 (7) 66 (11) 31-40 8 (2) 37 (5) 33 (5) 41-50 2 (<1) 27 (4) 24 (4) > 50 29 (7) 120 (18) 77 (13) Unknown 44 (11) 49 (7) 22 (4) Missing 195 (48) 262 (38) 201 (33)Time from diagnosis to transplant 0-3 months 259 (64) 348 (51) 254 (41) 3-6 months 51 (13) 109 (16) 171 (28) >= 6 months 97 (24) 225 (33) 190 (31)Prior therapy No 225 (55) 350 (51) 273 (44) Yes 162 (40) 325 (48) 328 (53) Missing 20 (5) 7 (1) 14 (2)Prior therapy Androgens 5 (1) 40 (6) 87 (14) Cyclosporine 88 (22) 168 (25) 204 (33) ATG, ALG, ATS 94 (23) 162 (24) 38 (6) Corticosteroids 100 (25) 167 (24) 212 (34)Graft type Bone marrow 339 (83) 552 (81) 458 (74) Peripheral blood 68 (17) 130 (19) 157 (26)a. HIC – High income country b. UMC – Upper middle income country, LMC – Lower middle income country, LIC – Low income country
27

Not for publication or presentation Attachment 5
Table 1. Continued.
Variable HICa: US-Canada Other HICa UMC-LMC-LICb
Year of Transplant 1995-1996 83 (20) 141 (21) 124 (20) 1997-1998 76 (19) 141 (21) 100 (16) 1999-2000 54 (13) 94 (14) 105 (17) 2001-2002 46 (11) 98 (14) 99 (16) 2003-2004 54 (13) 98 (14) 94 (15) 2005-2006 76 (19) 94 (14) 79 (13) 2007-2008 18 (4) 16 (2) 14 (2)Conditioning regimen Cy + ATG ± others 274 (67) 521 (76) 204 (33) Cy + TLI ± others 10 (2) 16 (2) 16 (3) Bu + Cy ± others 3 (<1) 7 (1) 193 (31) Fludarabine ± others 25 (6) 54 (8) 46 (7) TBI ± others 14 (3) 10 (1) 6 (<1) Cy ± others 57 (14) 67 (10) 145 (24) Missing 24 (6) 7 (1) 5 (<1)GVHD prophylaxis Ex vivo T-cell depletion 4 (<1) 6 (<1) 19 (3) CD34 selection 8 (2) 10 (1) 21 (3) Cyclophosphamide + others 6 (1) 34 (5) 14 (2) FK506 + MMF ± others 0 1 (<1) 1 (<1) FK506 + MTX ± others 8 (2) 0 0 FK506 + others 38 (9) 11 (2) 3 (<1) FK506 alone 6 (1) 0 0 CSA + MMF ± others 6 (1) 1 (<1) 0 CSA + MTX ± others 5 (1) 16 (2) 13 (2) CSA + others 264 (65) 512 (75) 482 (78) CSA alone 32 (8) 22 (3) 13 (2) Other GVHD prophylaxis 15 (4) 65 (10) 45 (7)Median follow-up of survivors (range), months 68 (<1-187) 69 (<1-183) 63 (<1-196)
a. HIC – High income country b. UMC – Upper middle income country, LMC – Lower middle income country, LIC – Low income country
28

Not for publication or presentation Attachment 5
Table 2. Completeness index of follow-up for recipients of HLA-identical sibling transplants for SAA reported to the CIBMTR from 1995 to 2007 by World Bank Economic Classification.
US-Canada (N = 407)
Other HICa
(N = 682)UM-LM-LICb
(N = 615) OverallSet date: 12/31/09 67 66 59 641 year 97 97 90 952 years 93 94 83 903 years 90 90 79 865 years 84 84 73 80
a. HIC – High income country b. UMC – Upper middle income country, LMC – Lower middle income country, LIC – Low income country
29

Not for publication or presentation Attachment 5
Table 3. Overall survivals for recipients of HLA-identical sibling transplants for SAA reported to the CIBMTR from 1995 to 2007 by graft type.
Bone marrow (N = 1349) Peripheral blood (N = 355) Variable N Evaluable Survival N Evaluable SurvivalProbability of survival, percent (95% CI) US-Canada 339 68 100-day 93 (90-96) 78 (67-87) 1-year 90 (87-93) 69 (57-79) 3-year 86 (82-90) 62 (49-73) 5-year 85 (80-89) 59 (47-71) Other HIC 552 130 100-day 92 (90-94) 87 (81-92) 1-year 88 (85-90) 82 (75-89) 3-year 85 (82-88) 78 (71-85) 5-year 85 (82-88) 78 (71-85) UM-LM-LIC 458 157 100-day 84 (80-87) 84 (78-90) 1-year 75 (71-79) 69 (61-76) 3-year 69 (65-73) 61 (51-69) 5-year 67 (62-71) 59 (49-68)
30
Not for publication or presentation Attachment 5
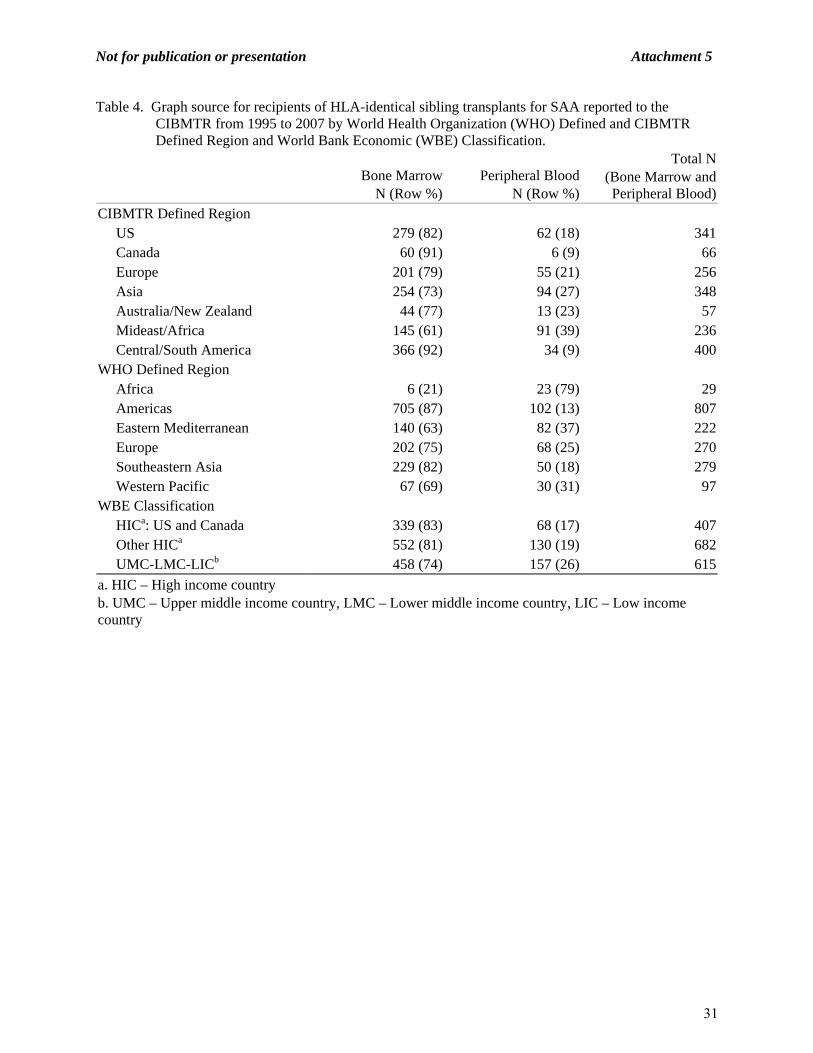
Table 4. Graph source for recipients of HLA-identical sibling transplants for SAA reported to the CIBMTR from 1995 to 2007 by World Health Organization (WHO) Defined and CIBMTR Defined Region and World Bank Economic (WBE) Classification.
Bone Marrow
N (Row %)Peripheral Blood
N (Row %)
Total N (Bone Marrow and Peripheral Blood)
CIBMTR Defined Region US 279 (82) 62 (18) 341 Canada 60 (91) 6 (9) 66 Europe 201 (79) 55 (21) 256 Asia 254 (73) 94 (27) 348 Australia/New Zealand 44 (77) 13 (23) 57 Mideast/Africa 145 (61) 91 (39) 236 Central/South America 366 (92) 34 (9) 400WHO Defined Region Africa 6 (21) 23 (79) 29 Americas 705 (87) 102 (13) 807 Eastern Mediterranean 140 (63) 82 (37) 222 Europe 202 (75) 68 (25) 270 Southeastern Asia 229 (82) 50 (18) 279 Western Pacific 67 (69) 30 (31) 97WBE Classification HICa: US and Canada 339 (83) 68 (17) 407 Other HICa 552 (81) 130 (19) 682 UMC-LMC-LICb 458 (74) 157 (26) 615
a. HIC – High income country b. UMC – Upper middle income country, LMC – Lower middle income country, LIC – Low income country
31

Not for publication or presentation Attachment 5
Table 5. Characteristics of recipients of HLA-identical sibling transplants for SAA reported to the JSHCT from 1995 to 2007
Variable N (%)Number of patients 479Age at transplant, median 21 (<1-65)Age at transplant <10 yrs 64 (13) 10-19 yrs 155 (32) 20-29 yrs 121 (25) 30-39 yrs 68 (14) 40-49 yrs 44 (9) 50-59 yrs 25 (5) >=60 yrs 2 (<1)Gender Male 282 (59) Female 197 (41)Graft type Bone marrow 414 (86) Peripheral blood (+/- bone marrow) 65 (14)Year of Transplant 1995-1996 72 (15) 1997-1998 60 (13) 1999-2000 81 (17) 2003-2004 81 (17) 2003-2004 70 (15) 2005-2006 79 (16) 2007-2008 36 (8)Conditioning regimen CY + ATG +/- others 153 (32) CY + TLI +/- others 175 (37) BU + CY +/- others 5 (1) Fludarabine +/- others 40 (8) TBI +/- others 41 (9) CY +/- others 57 (12) Missing 8 (1)GVHD prophylaxis No GVHD prophylaxis 2 (<1) Ex vivo T-cell depletion 1 (<1) CD34 selection 2 (<1) Cyclophosphamide +/- others 0 (0) FK506 + MMF +/- others 1 (<1) FK506 + MTX +/- others 28 (6) FK506 + others 4 (<1) FK506 alone 2 (<1) CSA + MMF +/- others 0 (0) CSA + MTX +/- others 376 (79) CSA + others 18 (4) CSA alone 31 (6) Other GVHD prophylaxis 10 (2) Missing 4 (<1)Median follow-up of survivors (range), months 77 (<1-186)
32

Not for publication or presentation Attachment 6
CIBMTR IS10-01
GLOBAL VARIATION IN HEMATOPOIETIC CELL TRANSPLANTATION FOR ALL AND AML: A COMPARATIVE ANALYSIS
Study Chairs: William Wood, MD, MPH
The University of North Carolina at Chapel Hill Department of Medicine 170 Manning Drive, 3rd Floor Chapel Hill, NC 27599-7305 Phone: 919-966-7746 Fax: 919-966-7748
Email: [email protected] Thomas Shea, MD
Interim Chair, Division of Hematology and Oncology Director, Bone Marrow and Stem Cell Transplant Program The University of North Carolina at Chapel Hill Department of Medicine 170 Manning Drive, 3rd Floor Chapel Hill, NC 27599-7305 Phone: 919-966-7746 Fax: 919-966-7748 Email: [email protected]
Study Statisticians: Zhenhuan (Kenny) Hu, MPH
CIBMTR Statistical Center Medical College of Wisconsin
9200 West Wisconsin Ave., Suite C5500 Milwaukee, 53226 Phone: (414) 805-0656 Fax: (414) 805-0714 E-mail: [email protected]
Sandra Korman, MS
CIBMTR Statistical Center Medical College of Wisconsin
9200 West Wisconsin Ave., Suite C5500 Milwaukee, 53226 Phone: (414) 805-0682 Fax: (414) 805-0714
E-mail: [email protected]
33

Not for publication or presentation Attachment 6
John P. Klein, PhD CIBMTR Statistical Center Medical College of Wisconsin 8701 Watertown Plank Road Milwaukee, WI 53226 USA Telephone: 414-955-8379 Fax: 414-955-6530
E-mail: [email protected] Scientific Director: Marcelo C. Pasquini, MD, MS CIBMTR Statistical Center Medical College of Wisconsin 9200 W. Wisconsin Ave., Suite CC5500 Milwaukee, WI 53226 USA Telephone: 414-805-0700 Fax: 414-805-0714 E-mail: [email protected] Working Committee Chairs: Mahmoud Aljurf, MBBS
King Faisal Hospital Riyadh, Saudi Arabia Phone: 966-1-442-3940 Fax: 966-1-442-3941 E-mail: [email protected]
David Gomez-Almaguer, MD Hospital Universitario Monterrey, Mexico Telephone: (52) 81-83-48-8510 Fax: (52) 81-86-75-6717 E-mail: [email protected]
Yoshiko Atsuta, MD, PhD Nagoya University Nagoya, Japan Phone/Fax: +81-52-719-1973 Email: [email protected]
34
Not for publication or presentation Attachment 6
1.0. SPECIFIC OBJECTIVES:
Determine the amount of variation in the following patient, disease, and transplant related
characteristics for patients transplanted for AML and ALL, by geographic grouping: Timing of transplantation (time since diagnosis, CR1 vs >CR2 vs relapse) Use of transplantation in physiologically vulnerable patients (reduced intensity /
nonmyeloablative techniques, transplants in age > 60, KPS < 90) Use of newer or greater resource-requiring technologies (BM vs PBSC, auto vs
allo, URD vs MSD, use of UCB or Haploidentical transplantation, GVHD prophylaxis strategies)
Overall survival at 100d, 1, 3, and 5 years. Correlate the amount of the observed variation with the following variables:
Macroeconomic: gross national income per capita, human development index, total health expenditures, government health expenditures
Microeconomic: transplant team experience, transplant team size, pediatric vs adult centers
2.0. SCIENTIFIC JUSTIFICATION:
Allogeneic transplantation has grown in popularity in its application for the possible cure of certain hematologic malignancies in appropriately selected patients. CIBMTR data demonstrates a surge in the global use of allogeneic transplantation in the last two decades, with over 15,000 transplants performed in 2005 (CIBMTR summary slides, 2007). As the use of HCT has increased, the number of centers performing transplants has also increased, extending in reach across the globe to include several in non-high income countries as defined by the World Bank classification system. The results from a comprehensive retrospective survey of global HCT activity (the WBMT survey) were recently published in JAMA (Gratwohl et. al., 2010a). Previous data demonstrates that there may be important differences in the way that transplantation is used in different countries. In 1994, a study using IBMTR data was published in the New England Journal of Medicine, examining the use of allogeneic transplantation for chronic myeloid leukemia in ten industrialized, high-income countries (Silberman G et. al., 1994). The investigators looked at rates of transplantation for CML, the number of months between diagnosis and transplant, and the percentage of transplanted CML patients in chronic phase, and found that country-level economic variables had unpredictable effects on transplantation rates. Some hypothesized that health insurance structures in different countries contributed to these findings. Over the last several years, Gratwohl et. al. have used EBMT and supplementary survey data to explore the predictability of hematopoietic stem cell transplantation rates as a function of country-level economic indicators such as Gross National Income (GNI) and health care expenditures (HCE). These investigators have found an association between the economic strength of individual countries and their associated transplant rates (Gratwohl et. al., 2002), and have also found that higher “team densities” (i.e. number of transplant teams within a defined geographic area) were associated with increased national resources and higher transplant rates (Gratwohl et. al., 2007). More recently, Gratwohl and colleagues have used EBMT data to look at diffusion of medical technology, as relating to stem cell transplantation (Gratwohl et. al., 2010b). In this study, gross national income per capita, World Bank income category, team density, team distribution, team size, and team
35

Not for publication or presentation Attachment 6
innovator status were all significantly associated with changes in the use of transplantation for breast cancer or CML, and the replacement of bone marrow by peripheral blood as the source of stem cells. The CIBMTR data set provides a unique opportunity to perform a relatively detailed investigation of transplantation use and techniques across many regions of the world. At the present time, the CIBMTR is capturing fairly detailed, at least registration or TED-level data, from approximately 450 transplant centers in 48 countries. Transplant survey-based data suggests that transplant physician practice and center practice are likely to vary significantly. Lee et. al. surveyed 526 adult and pediatric HCT physicians internationally, and found significant heterogeneity in the practices of conditioning choice, management of acute and chronic graft versus host disease, and other important clinical transplant issues (Lee et. al. 2008a). In a separately published study, there were also significant differences among centers represented in this sample in the use of myelogenous growth factors, empiric antibiotic therapy, protective isolation procedures, post-transplant monitoring, and environmental and social restrictions (Lee et. al., 2008b). Though underlying economic or health resource-related factors were not specifically included as part of this analysis, it is possible that these types of factors contributed to the observed variation. In this study, we propose to use CIBMTR data to look at international variation in transplantation characteristics for AML and ALL that may be related to access to transplant, or outcome following transplant: these include timing of transplantation (time since diagnosis, disease status at the time of transplant), use of transplantation in less fit patients (use of reduced intensity techniques, transplants in older or lower performance status patients), and adoption of new technologies (PBSC vs BM, use of alternative donor sources, GVHD prophylaxis strategies). We will also look to see the degree to which macroeconomic, microeconomic, or regional variables explain variation in the categories described above. Our ability to draw conclusions on a country by country basis will be limited, as some countries include relatively few centers that contribute data to the CIBMTR. However, we hope that the use of macroeconomic, microeconomic and regional variables will provide explanatory power for the variation that we observe. The implications of such findings would be at least two-fold. First, a demonstration that macroeconomic or microeconomic variables are related to timely transplantation may prompt further investigation into which structural characteristics are conducive to the appropriate use of stem cell transplantation. Similar associations of these variables with the adoption of new technologies, or the extension of reduced intensity techniques to older patient populations, may provide additional insight (analogous to the Gratwohl publications) into characteristics associated with the diffusion of transplant-related technology. Second, if significant variation exists in the uses of transplant and transplant techniques, this may stimulate efforts to enhance comprehensive worldwide data collection efforts so that similar studies can be performed looking at outcomes and toxicities following transplantation. 3.0. ELIGIBILITY CRITERIA: The study cohort will consist of patients with acute leukemia treated with autologous or allogeneic HCT for ALL or AML between 2002 and 2007 and registered with the CIBMTR, 4.0. DATA COLLECTION: Patient, disease and transplant related characteristics will be obtained from registration-level data contributed to the CIBMTR database. Data associated with macroeconomic, microeconomic and regional variables will be obtained from publicly available data sets, as previously described in the two recent Gratwohl papers.
36

Not for publication or presentation Attachment 6
5.0. OUTCOMES:
Amount of variation, by regional geographic grouping, for AML and for ALL, in: - Timing of transplantation (time since diagnosis, CR1 vs >CR2 vs relapse) - Use of transplantation in physiologically vulnerable patients (% of transplants performed
with reduced intensity/nonmyeloablative techniques vs myeloablative, % of transplants in age > 60 vs age <60, % of transplants in KPS < 90 vs KPS>90)
- Use of newer or greater resource-requiring technologies (% of transplants using PBSC vs BM, % of transplants using UCB vs other, % of transplants using Haploidentical donors vs other, % of auto vs allo)
- Overall survival at 100d, 1, 3, and 5 years Association of the following variables with the outcomes above (timing of transplantation, use of transplantation in physiologically vulnerable patients, use of newer or greater resource-requiring technologies, overall survival):
- Macroeconomic: gross national income per capita, human development index, health expenditure per capita, public and private health expenditure, total health expenditure, out of pocket health expenditure
- Microeconomic: transplant team experience, transplant team size 6.0. VARIABLES TO BE ANALYZED:
Country-related variables (WHO Data) ‐ GNI per capita ‐ Human development index ‐ Health expenditure per capita ‐ Health expenditure, public, % of total health expenditure ‐ Health expenditure, private, % of total health expenditure ‐ Health expenditure, total, % of GDP ‐ Out of pocket health expenditure, % of private ‐ Geographic grouping, by region Center-related variables ‐ Transplant center experience (number of years performing transplants and number of
transplants/center) ‐ Number of transplants performed in 2010 Patient-related variables ‐ Age at HCT: pediatric vs. adult (categorical), and continuous ‐ Gender: male vs. female ‐ Karnofsky performance score at HCT: <90 vs. 90-100 ‐ Patient CMV status: negative vs. positive ‐ HLA-matching status: HLA-matched sibling vs. mismatched related donor vs. well-matched
unrelated vs. less than well-matched unrelated vs haplo Disease-related variables ‐ Diagnosis: ALL vs. AML ‐ Time from diagnosis to HCT: <6 vs. 6-12 vs. >12 months ‐ Status at transplantation: Never treated vs. PIF vs. CR (#) vs. Relapse Transplant-related variables ‐ Conditioning regimen: TBI-containing vs. chemotherapy only ‐ Conditioning regimen: myeloablative vs other
37

Not for publication or presentation Attachment 6
‐ Stem cell source: bone marrow vs. peripheral blood stem cells vs. umbilical cord blood ‐ Donor source: related vs. unrelated vs haplo ‐ Auto vs allo
7.0. STUDY DESIGN:
The proposed study design is analogous to the Gratwohl paper published in JAMA (Gratwohl A, Baldomero H, et. al, JAMA 2010; 303(16):1617-1624). This study will add to the published Gratwohl study by incorporating additional outcome variables (including overall survival) and additional macroeconomic variables.
First, countries will be separated into regional geographic groupings (Americas, Asia, Europe, Eastern Mediterranean /Africa). The relative proportions of the first set of outcome variables (timing of transplantation, use of transplantation in physiologically vulnerable patients, use of newer or greater resource-requiring technologies, overall survival) will be compared by these regional geographic groupings, by disease type (AML and ALL).
Second, the association of macroeconomic variables (gross national income per capita, human development index, health expenditure per capita, public and private health expenditure, total health expenditure, out of pocket health expenditure) and microeconomic variables (transplant team experience, transplant team size) with the first set of outcome variables (timing of transplantation, use of transplantation in physiologically vulnerable patients, use of newer or greater resource-requiring technologies, overall survival) will be investigated by regression analyses, with adjustments for patient-related, disease-related and transplant-related variables as above. As in the Gratwohl analysis, the linear relationships between the macroeconomic/microeconomic variables and the outcomes can be reported using the t statistic, with goodness of fit reported using the coefficient of determination (r2).
8.0 REFERENCES:
1. CIBMTR 2007 Summary Slides. 2. Silberman G et. al. Availability and appropriateness of allogeneic bone marrow transplantation
for chronic myeloid leukemia in 10 countries. New England Journal of Medicine 1994; 331:1063-1067.
3. Gratwohl A, Passweg J, et al, for the Accreditation Committee of the European Group for Blood and Marrow Transplantation (EBMT). Economics, health care systems and utilization of hematopoietic stem cell transplants in Europe. British Journal of Haematology 2002; 117:451-468.
4. Gratwohl A et. al. Predictability of hematopoietic stem cell transplantation rates. Haematologica 2007; 92(12):1679-1686.
5. Howard SC et. al. Establishment of a pediatric oncology program and outcomes of childhood acute lymphoblastic leukemia in a resource-poor area. JAMA 2004;291(20):2471-2475.
6. Lee SJ et. al. Individual physician practice variation in hematopoietic cell transplantation. Journal of Clinical Oncology 2008; 26(13):2162-2170.
7. Lee SJ et. al. Variation in supportive care practices in hematopoietic cell transplantation. Biology of Blood and Marrow Transplantation 2008; 14(11):1231-1238.
8. Loberiza FR et. al. Association of transplant center and physician factors on mortality after hematopoietic stem cell transplantation in the United States. Blood 2005; 105(7):2979-2987.
9. Baker KS et. al. Race and socioeconomic status influence outcomes of unrelated donor hematopoietic cell transplantation. Biology of Blood and Marrow Transplantation 2009 (in press).
38

Not for publication or presentation Attachment 6
10. Gratwohl A, Schwendener A, et. al. Changes in the use of hematopoietic stem cell transplantation: a model for diffusion of medical technology. Haematologica 2010; 95(4):637-643.
11. Gratwohl A, Baldomero H, et. al. Hematopoietic Stem Cell Transplantation: a global perspective. JAMA 2010; 303(16):1617-1624.
39

Not for publication or presentation Attachment 6
Table 1a. Characteristics of recipients for AML and ALL reported to the CIBMTR from 2002 to 2007 by WHO regional geographic groupings.
Variable Africa AmericasEastern
Mediterranean EuropeSoutheastern
Asia Western PacificNumber of patients 61 15222 839 5248 984 1146Number of centers 4 256 7 123 7 34Age, median (range) 34 (<1-59) 40 (<1-83) 20 (.75-57) 37 (<1-83) 33 (<1-66) 34 (<1-70)Age, years <10 yrs 5 (8) 1897 (12) 121 (14) 483 (9) 103 (10) 175 (15) 10-19 yrs 6 (10) 1992 (13) 297 (35) 692 (13) 161 (16) 181 (16) 20-29 yrs 8 (13) 1893 (12) 218 (26) 848 (16) 164 (17) 147 (13) 30-39 yrs 15 (25) 1931 (13) 123 (15) 875 (17) 255 (26) 163 (14) 40-49 yrs 15 (25) 2728 (18) 70 (8) 1033 (20) 222 (23) 199 (17) 50-59 yrs 12 (20) 3075 (20) 10 (1) 922 (18) 65 (7) 223 (19) 60-69 yrs 0 1583 (10) 0 374 (7) 14 (1) 58 (5) >= 70 yrs 0 123 (<1) 0 21 (<1) 0 0Adult Age <= 18 6 (10) 3462 (23) 347 (41) 990 (19) 226 (23) 311 (27) Age > 18 55 (90) 11760 (77) 492 (59) 4258 (81) 758 (77) 835 (73)Sex Male 34 (56) 8415 (55) 533 (64) 2888 (55) 540 (55) 623 (54) Female 27 (44) 6807 (45) 306 (36) 2360 (45) 444 (45) 523 (46)Karnofsky score 80-100% 36 (59) 10442 (69) 534 (64) 3728 (71) 309 (31) 709 (62) <80% 5 (8) 938 (6) 4 (<1) 308 (6) 23 (2) 65 (6) Missing 20 (33) 3842 (25) 301 (36) 1212 (23) 652 (66) 372 (32)Primary disease AML 49 (80) 10478 (69) 514 (61) 3423 (65) 668 (68) 704 (61) ALL 12 (20) 4744 (31) 325 (39) 1825 (35) 316 (32) 442 (39)Year of transplant 2002-2003 32 (52) 4464 (29) 244 (29) 2513 (48) 307 (31) 400 (35) 2004-2005 17 (28) 5272 (35) 344 (41) 1924 (37) 330 (34) 418 (36) 2006-2007 12 (20) 5486 (36) 251 (30) 811 (15) 347 (35) 328 (29)
40

Not for publication or presentation Attachment 6
Table 1a. Continued.
Variable Africa AmericasEastern
Mediterranean EuropeSoutheastern
Asia Western Pacific +/+ 0 921 (6) 12 (1) 34 (<1) 8 (<1) 7 (<1) +/- 0 506 (3) 0 18 (<1) 1 (<1) 4 (<1) -/+ 1 (2) 1665 (11) 1 (<1) 41 (<1) 1 (<1) 7 (<1) -/- 0 1298 (9) 0 40 (<1) 1 (<1) 8 (<1) Unknown 53 (87) 9185 (60) 743 (89) 4873 (93) 823 (84) 992 (87) Missing 7 (11) 1647 (11) 83 (10) 242 (5) 150 (15) 128 (11)Primary disease AML 49 (80) 10478 (69) 514 (61) 3423 (65) 668 (68) 704 (61) ALL 12 (20) 4744 (31) 325 (39) 1825 (35) 316 (32) 442 (39)Time from diagnosis to transplant <3 months 2 (3) 1325 (9) 72 (9) 315 (6) 37 (4) 56 (5) 3-6 months 16 (26) 5231 (34) 255 (30) 1957 (37) 545 (55) 336 (29) >6 months 43 (70) 8666 (57) 512 (61) 2976 (57) 402 (41) 754 (66)Disease status at transplant PIF 2 (3) 1247 (8) 11 (1) 376 (7) 29 (3) 98 (9) CR1 41 (67) 6598 (43) 508 (61) 2652 (51) 750 (76) 483 (42) CR2 8 (13) 3869 (25) 195 (23) 1057 (20) 102 (10) 300 (26) >CR2 2 (3) 576 (4) 34 (4) 142 (3) 3 (<1) 25 (2) Relapse 2 (3) 2030 (13) 34 (4) 554 (11) 64 (7) 161 (14) Missing 6 (10) 902 (6) 57 (7) 467 (9) 36 (4) 79 (7)Conditioning regimen TBI containing 25 (41) 7557 (50) 196 (23) 2767 (53) 544 (55) 572 (50) Chemotherapy only 36 (59) 7665 (50) 643 (77) 2481 (47) 440 (45) 574 (50)Conditioning intensity Non-myeloablative 8 (13) 2411 (16) 38 (5) 875 (17) 111 (11) 242 (21) Myeloablative 41 (67) 10329 (68) 785 (94) 3784 (72) 853 (87) 794 (69) Auto recipient 10 (16) 1526 (10) 0 256 (5) 10 (1) 53 (5) Missing 2 (3) 956 (6) 16 (2) 333 (6) 10 (1) 57 (5)
41

Not for publication or presentation Attachment 6
Table 1a. Continued.
Variable Africa Americas
Eastern Mediterranean Europe
Southeastern Asia Western Pacific
Graft type Bone marrow 5 (8) 3762 (25) 220 (26) 1464 (28) 571 (58) 357 (31) Peripheral blood 53 (87) 9931 (65) 594 (71) 3435 (65) 360 (37) 623 (54) Cord blood 0 1401 (9) 23 (3) 201 (4) 41 (4) 139 (12) Missing 3 (5) 128 (<1) 2 (<1) 148 (3) 12 (1) 27 (2)Donor type Autologous HSCT 10 (16) 1692 (11) 1 (<1) 260 (5) 10 (1) 53 (5) HLA-identical sibling 31 (51) 5651 (37) 790 (94) 2342 (45) 606 (62) 518 (45) Twin 1 (2) 72 (<1) 5 (<1) 28 (<1) 1 (<1) 11 (<1) Other relative 3 (5) 876 (6) 21 (3) 324 (6) 25 (3) 84 (7) Unrelated 16 (26) 6615 (43) 20 (2) 2220 (42) 333 (34) 446 (39) Multiple donor 0 177 (1) 2 (<1) 41 (<1) 4 (<1) 20 (2) Not answered 0 139 (<1) 0 33 (<1) 5 (<1) 14 (1)Transplant type Allogeneic 51 (84) 13530 (89) 838 4988 (95) 974 (99) 1093 (95) Autologous 10 (16) 1692 (11) 1 (<1) 260 (5) 10 (1) 53 (5)Median follow-up of survivors (range), months
38 (<1-100) 57 (<1-114) 20 (<1-109) 19 (<1-109) 52 (<1-108) 44 (<1-107)
42

Not for publication or presentation Attachment 6
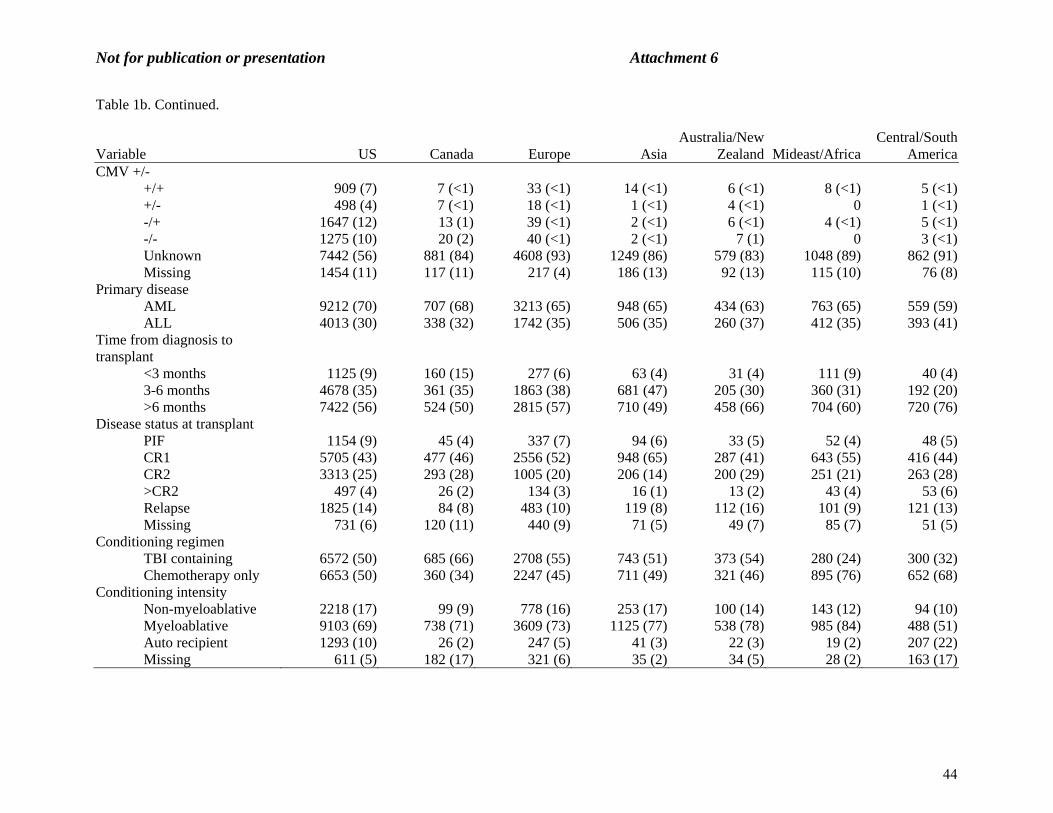
Table 1b. Characteristics of recipients for AML and ALL reported to the CIBMTR from 2002 to 2007 by CIBMTR regional geographic groupings.
Variable US Canada Europe AsiaAustralia/New
Zealand Mideast/AfricaCentral/South
AmericaNumber of patients 13225 1045 4955 1454 694 1175 952Number of centers 195 19 120 24 19 12 42Age, median (range) 41 (<1-83) 39 (.52-71) 37 (.52-83) 34 (<1-70) 31 (<1-68) 23 (<1-75) 22 (<1-71)Age, years <10 yrs 1554 (12) 119 (11) 454 (9) 157 (11) 124 (18) 152 (13) 224 (24) 10-19 yrs 1638 (12) 133 (13) 644 (13) 225 (15) 124 (18) 344 (29) 221 (23) 20-29 yrs 1611 (12) 132 (13) 815 (16) 223 (15) 94 (14) 253 (22) 150 (16) 30-39 yrs 1601 (12) 162 (16) 841 (17) 311 (21) 107 (15) 172 (15) 168 (18) 40-49 yrs 2416 (18) 206 (20) 992 (20) 310 (21) 113 (16) 124 (11) 106 (11) 50-59 yrs 2797 (21) 215 (21) 850 (17) 174 (12) 114 (16) 94 (8) 63 (7) 60-69 yrs 1487 (11) 77 (7) 340 (7) 54 (4) 18 (3) 34 (3) 19 (2) >= 70 yrs 121 (<1) 1 (<1) 19 (<1) 0 0 2 (<1) 1 (<1)Adult Age <= 18 2837 (21) 219 (21) 923 (19) 328 (23) 219 (32) 410 (35) 406 (43) Age > 18 10388 (79) 826 (79) 4032 (81) 1126 (77) 475 (68) 765 (65) 546 (57)Sex Male 7277 (55) 582 (56) 2724 (55) 809 (56) 368 (53) 717 (61) 556 (58) Female 5948 (45) 463 (44) 2231 (45) 645 (44) 326 (47) 458 (39) 396 (42)Karnofsky score 80-100% 9076 (69) 666 (64) 3505 (71) 643 (44) 387 (56) 781 (66) 700 (74) <80% 791 (6) 86 (8) 294 (6) 47 (3) 42 (6) 22 (2) 61 (6) Missing 3358 (25) 293 (28) 1156 (23) 764 (53) 265 (38) 372 (32) 191 (20)Primary disease AML 9212 (70) 707 (68) 3213 (65) 948 (65) 434 (63) 763 (65) 559 (59) ALL 4013 (30) 338 (32) 1742 (35) 506 (35) 260 (37) 412 (35) 393 (41)Year of transplant 2002-2003 3755 (28) 362 (35) 2418 (49) 481 (33) 230 (33) 367 (31) 347 (36) 2004-2005 4572 (35) 370 (35) 1786 (36) 504 (35) 256 (37) 487 (41) 330 (35) 2006-2007 4898 (37) 313 (30) 751 (15) 469 (32) 208 (30) 321 (27) 275 (29)
43
Not for publication or presentation Attachment 6
Table 1b. Continued.
Variable US Canada Europe Asia
Australia/New Zealand Mideast/Africa
Central/South America
CMV +/- +/+ 909 (7) 7 (<1) 33 (<1) 14 (<1) 6 (<1) 8 (<1) 5 (<1) +/- 498 (4) 7 (<1) 18 (<1) 1 (<1) 4 (<1) 0 1 (<1) -/+ 1647 (12) 13 (1) 39 (<1) 2 (<1) 6 (<1) 4 (<1) 5 (<1) -/- 1275 (10) 20 (2) 40 (<1) 2 (<1) 7 (1) 0 3 (<1) Unknown 7442 (56) 881 (84) 4608 (93) 1249 (86) 579 (83) 1048 (89) 862 (91) Missing 1454 (11) 117 (11) 217 (4) 186 (13) 92 (13) 115 (10) 76 (8)Primary disease AML 9212 (70) 707 (68) 3213 (65) 948 (65) 434 (63) 763 (65) 559 (59) ALL 4013 (30) 338 (32) 1742 (35) 506 (35) 260 (37) 412 (35) 393 (41)Time from diagnosis to transplant <3 months 1125 (9) 160 (15) 277 (6) 63 (4) 31 (4) 111 (9) 40 (4) 3-6 months 4678 (35) 361 (35) 1863 (38) 681 (47) 205 (30) 360 (31) 192 (20) >6 months 7422 (56) 524 (50) 2815 (57) 710 (49) 458 (66) 704 (60) 720 (76)Disease status at transplant PIF 1154 (9) 45 (4) 337 (7) 94 (6) 33 (5) 52 (4) 48 (5) CR1 5705 (43) 477 (46) 2556 (52) 948 (65) 287 (41) 643 (55) 416 (44) CR2 3313 (25) 293 (28) 1005 (20) 206 (14) 200 (29) 251 (21) 263 (28) >CR2 497 (4) 26 (2) 134 (3) 16 (1) 13 (2) 43 (4) 53 (6) Relapse 1825 (14) 84 (8) 483 (10) 119 (8) 112 (16) 101 (9) 121 (13) Missing 731 (6) 120 (11) 440 (9) 71 (5) 49 (7) 85 (7) 51 (5)Conditioning regimen TBI containing 6572 (50) 685 (66) 2708 (55) 743 (51) 373 (54) 280 (24) 300 (32) Chemotherapy only 6653 (50) 360 (34) 2247 (45) 711 (49) 321 (46) 895 (76) 652 (68)Conditioning intensity Non-myeloablative 2218 (17) 99 (9) 778 (16) 253 (17) 100 (14) 143 (12) 94 (10) Myeloablative 9103 (69) 738 (71) 3609 (73) 1125 (77) 538 (78) 985 (84) 488 (51) Auto recipient 1293 (10) 26 (2) 247 (5) 41 (3) 22 (3) 19 (2) 207 (22) Missing 611 (5) 182 (17) 321 (6) 35 (2) 34 (5) 28 (2) 163 (17)
44

Not for publication or presentation Attachment 6
Table 1b. Continued.
Variable US Canada Europe Asia
Australia/New Zealand Mideast/Africa
Central/South America
Graft type Bone marrow 3139 (24) 279 (27) 1455 (29) 739 (51) 191 (28) 232 (20) 344 (36) Peripheral blood 8714 (66) 695 (67) 3182 (64) 588 (40) 411 (59) 884 (75) 522 (55) Cord blood 1270 (10) 57 (5) 198 (4) 105 (7) 75 (11) 26 (2) 74 (8) Missing 102 (<1) 14 (1) 120 (2) 22 (2) 17 (2) 33 (3) 12 (1)Donor type Autologous HSCT 1451 (11) 27 (3) 251 (5) 41 (3) 22 (3) 20 (2) 214 (22) HLA-identical sibling 4587 (35) 524 (50) 2193 (44) 804 (55) 338 (49) 952 (81) 540 (57) Twin 56 (<1) 9 (<1) 27 (<1) 4 (<1) 8 (1) 7 (<1) 7 (<1) Other relative 777 (6) 48 (5) 274 (6) 82 (6) 27 (4) 74 (6) 51 (5) Unrelated 6069 (46) 426 (41) 2144 (43) 496 (34) 283 (41) 112 (10) 120 (13) Multiple donor 174 (1) 3 (<1) 36 (<1) 15 (1) 9 (1) 7 (<1) 0 Not answered 111 (<1) 8 (<1) 30 (<1) 12 (<1) 7 (1) 3 (<1) 20 (2)Transplant type Allogeneic 11774 (89) 1018 (97) 4704 (95) 1413 (97) 672 (97) 1155 (98) 738 (78) Autologous 1451 (11) 27 (3) 251 (5) 41 (3) 22 (3) 20 (2) 214 (22)Median follow-up of survivors (range), months
59 (<1-114) 43 (<1-105) 20 (<1-109) 47 (<1-108) 52 (<1-107) 20 (<1-109) 25 (<1-105)
45

Not for publication or presentation Attachment 6
Table 1c. Characteristics of recipients for AML and ALL reported to the CIBMTR from 2002 to 2007 by GNI per capita.
Variable High income Upper median income Lower median / low incomeNumber of patients 21418 1391 685Number of centers 364 56 10Age, median (range) 39 (<1-83) 23 (<1-71) 23 (1.7-64)Age, years <10 yrs 2453 (11) 276 (20) 55 (8) 10-19 yrs 2809 (13) 314 (23) 205 (30) 20-29 yrs 2817 (13) 270 (19) 188 (27) 30-39 yrs 2989 (14) 240 (17) 133 (19) 40-49 yrs 4003 (19) 178 (13) 84 (12) 50-59 yrs 4196 (20) 92 (7) 19 (3) 60-69 yrs 2008 (9) 20 (1) 1 (<1) >= 70 yrs 143 (<1) 1 (<1) 0Adult Age <= 18 4613 (22) 522 (38) 207 (30) Age > 18 16805 (78) 869 (62) 478 (70)Sex Male 11785 (55) 822 (59) 424 (62) Female 9633 (45) 569 (41) 261 (38)Karnofsky score 80-100% 14285 (67) 996 (72) 472 (69) <80% 1231 (6) 99 (7) 13 (2) Missing 5902 (28) 296 (21) 200 (29)Primary disease AML 14538 (68) 831 (60) 466 (68) ALL 6880 (32) 560 (40) 219 (32)Year of transplant 2002-2003 7200 (34) 584 (42) 174 (25) 2004-2005 7539 (35) 458 (33) 307 (45) 2006-2007 6679 (31) 349 (25) 204 (30)
46

Not for publication or presentation Attachment 6
Table 1c. Continued.
Variable High income Upper median income Lower median / low incomeCMV +/- +/+ 972 (5) 5 (<1) 5 (<1) +/- 528 (2) 1 (<1) 0 -/+ 1710 (8) 6 (<1) 0 -/- 1344 (6) 3 (<1) 0 Unknown 14772 (69) 1274 (92) 617 (90) Missing 2092 (10) 102 (7) 63 (9)Primary disease AML 14538 (68) 831 (60) 466 (68) ALL 6880 (32) 560 (40) 219 (32)Time from diagnosis to transplant <3 months 1710 (8) 58 (4) 39 (6) 3-6 months 7890 (37) 263 (19) 186 (27) >6 months 11818 (55) 1070 (77) 460 (67)Disease status at transplant PIF 1659 (8) 77 (6) 27 (4) CR1 9984 (47) 637 (46) 406 (59) CR2 5018 (23) 379 (27) 134 (20) >CR2 698 (3) 62 (4) 21 (3) Relapse 2633 (12) 166 (12) 46 (7) Missing 1426 (7) 70 (5) 51 (7)Conditioning regimen TBI containing 11148 (52) 425 (31) 88 (13) Chemotherapy only 10270 (48) 966 (69) 597 (87)Conditioning intensity Non-myeloablative 3472 (16) 156 (11) 57 (8) Myeloablative 15167 (71) 806 (58) 612 (89) Auto recipient 1606 (7) 245 (18) 0 Missing 1173 (5) 184 (13) 16 (2)
47

Not for publication or presentation Attachment 6
Table 1c. Continued.
Variable High income Upper median income Lower median / low incomeGraft type Bone marrow 5866 (27) 482 (35) 30 (4) Peripheral blood 13545 (63) 797 (57) 649 (95) Cord blood 1715 (8) 86 (6) 4 (<1) Missing 292 (1) 26 (2) 2 (<1)Donor type Autologous HSCT 1769 (8) 252 (18) 1 (<1) HLA-identical sibling 8502 (40) 773 (56) 661 (96) Twin 101 (<1) 10 (<1) 7 (1) Other relative 1245 (6) 75 (5) 13 (2) Unrelated 9397 (44) 251 (18) 2 (<1) Multiple donor 240 (1) 3 (<1) 1 (<1) Not answered 164 (<1) 27 (2) 0Transplant type Allogeneic 19649 (92) 1139 (82) 684 Autologous 1769 (8) 252 (18) 1 (<1)Median follow-up of survivors (range), months
49 (<1-114) 18 (<1-105) 11 (<1-96)
48

Not for publication or presentation Attachment 6
Table 2a. Overall survivals for CR1 recipients of HLA-identical sibling transplants for acute leukemia reported to the CIBMTR from 2002 to 2007, by World Health Organization (WHO) Defined Region.
Age <= 18 (N = 1026) Age > 18 (N = 4317) Variable N Evaluable Survival N Evaluable SurvivalProbability of survival, Percent (95% confidence interval) Africa 0 22 100-day 77 (58-92)% 1-year NE 3-year NE 5-year NE Americas 544 2131 100-day 95 (93-96) 90 (89-92) 1-year 79 (76-83) 67 (65-69) 3-year 66 (62-71) 52 (50-54) 5-year 63 (59-68) 45 (42-47) Eastern Mediterranean 179 303 100-day 93 (88-96) 84 (80-88) 1-year 66 (58-74) 70 (64-76) 3-year 53 (44-62) 57 (49-64) 5-year 51 (41-60) 53 (45-61) Europe 170 1253 100-day 93 (89-97) 93 (92-95) 1-year 79 (72-86) 76 (73-79) 3-year 70 (59-79) 61 (57-65) 5-year NE 58 (54-62) Southeastern Asia 69 401 100-day 94 (87-98) 92 (89-94) 1-year 79 (68-88) 75 (71-80) 3-year 74 (62-84) 60 (55-65) 5-year 69 (57-80) 56 (50-61) Western Pacific 64 207 100-day 94 (87-98) 94 (91-97) 1-year 81 (71-90) 73 (67-80) 3-year 63 (49-75) 58 (50-65) 5-year NE 53 (44-61)
49

Not for publication or presentation Attachment 6
Table 2b. Overall survivals for CR1 recipients of HLA-identical sibling transplants for acute leukemia reported to the CIBMTR from 2002 to 2007, by World Bank Economic (WBE) Classification.
Age <= 18 (N = 1026) Age > 18 (N = 4317) Variable N Evaluable Survival N Evaluable SurvivalProbability of survival, Percent (95% confidence interval) High Income Country 824 3779 100-day 95 (94-97) 92 (92-93) 1-year 80 (77-83) 72 (70-73) 3-year 67 (63-70) 56 (54-58) 5-year 64 (60-68) 50 (48-52) Upper Middle Income Country 96 246 100-day 88 (81-94) 81 (76-86) 1-year 69 (58-79) 62 (55-69) 3-year 58 (45-70) 54 (46-62) 5-year NE NE Lower Middle Income Country/ Low Income Country 106 290 100-day 88 (81-94) 82 (77-86) 1-year 62 (49-75) 66 (59-73) 3-year NE 54 (46-62) 5-year NE NE
50

Not for publication or presentation Attachment 6
Appendix: CIBMTR Participating Countries (centers)
Countries CentersHIC 29 377 (155 without
USA)UMIC 13 58LMIC 4 8LIC 2 7
Country World Bank
Classification # of Centers (CIBMTR) # of total centers
(literature and EBMT activity survey)
Argentina UMIC 11Australia HIC 16Austria HIC 4 121
Belgium HIC 6 202
Brazil UMIC 17Canada HIC 20China LMIC 1 503
Colombia LMIC 4Czechoslovakia HIC 4 94
Denmark HIC 1 45
Egypt LMIC 2 36
England HIC 13 517
Finland HIC 2 78
France HIC 8 729
Germany HIC 16 10610
Greece HIC 1 1111
Hong Kong HIC 2Hungary UMIC 1 612
India LIC 4 613
Iran LMIC 1 214
Ireland HIC 1 515
Israel HIC 5 716
Italy HIC 10 9717
Japan HIC 5Korea HIC 4 3818
Kuwait HIC 1Lebanon UMIC 1 219
Malaysia UMIC 1 820
Mexico UMIC 6Netherlands HIC 2 1421
New Zealand HIC 4Pakistan LIC 3 322
Poland UMIC 4 1723
Portugal HIC 2 624
51

Not for publication or presentation Attachment 6
Appendix. Continued.
Country World Bank Classification
# of Centers (CIBMTR) # of total centers (literature and EBMT
activity survey)Republic of Panama UMIC 1Saudi Arabia HIC 2 325
Scotland HIC 3Singapore HIC 3 526
South Africa UMIC 4 1227
Spain HIC 10 6628
Sweden HIC 2 829
Switzerland HIC 5 930
Taiwan HIC 3Turkey UMIC 6 2831
Uruguay UMIC 3Venezuela UMIC 2USA HIC 222 1 Gratwohl et. al. BMT 2009; 43:275-291. (EBMT activity survey) 2 Gratwohl et. al. BMT 2009 3 Wu T and D-P Lu. BMT 2008; 42:S73-S75. 4 Gratwohl et. al. BMT 2009 5 Gratwohl et. al. BMT 2009 6 Mahmoud HK et. al. BMT 2008; 42:S76-S80. 7 Gratwohl et. al. BMT 2009 8 Gratwohl et. al. BMT 2009 9 Gratwohl et. al. BMT 2009 10 Gratwohl et. al. BMT 2009 11 Gratwohl et. al. BMT 2009 12 Gratwohl et. al. BMT 2009 13 Chandy M. BMT 2008; 42:S81-S64. 14 Abdel-Rahman et. al. BMT 2008; 42:S89-S91. 15 Gratwohl et. al. BMT 2009 16 Gratwohl et. al. BMT 2009 17 Gratwohl et. al. BMT 2009 18 Lee JW and CC Kim. BMT 2008; 42:S92-S95. 19 Bazarbachi A et. al. BMT 2008; 42:S96-S102. 20 Gan GG et. al. BMT 2008; 42:S103-S105. 21 Gratwohl et. al. BMT 2009 22 Shamsi T et. al. BMT 2008; 42:S114-S117. 23 Gratwohl et. al. BMT 2009 24 Gratwohl et. al. BMT 2009 25 Aljurf et. al. BMT 2009; 43:1-12. 26 Koh MBC et. al. BMT 2008; 42:S121-S124. 27 Jacobs P and L Wood. BMT 2008; 42:S125-S132. 28 Gratwohl et. al. 2009 29 Gratwohl et. al. BMT 2009 30 Gratwohl et. al. BMT 2009 31 Gratwohl et. al. BMT 2009
52

Not for publication or presentation Attachment 7
Study Proposal 1111-56 Study Title: Total Body Irradiation and Radiation Therapy Prior to Hematopoietic Cell Transplant: A Survey of Transplant Specialists Associated with the Center for International Bone and Marrow Transplant Research. Christopher A. Barker, MD, Memorial Sloan-Kettering Cancer Center, New York, New York Specific Aims: The aims of the study are to:
To determine why transplant specialists associated with the CIBMTR use total body irradiation (TBI) or other radiation therapy (RT) as part of hematopoietic cell transplant (HCT).
To characterize how TBI is performed at institutions associated with the CIBMTR. Scientific Justification: Recent research suggests that the use of total body irradiation (TBI) and other forms of radiation therapy (RT) prior to hematopoietic cell transplant (HCT) vary widely in centers associated with the Center for International Bona and Marrow Transplant Research (CIBMTR) (Barker, Hong, et al. submitted; Hong, Barker et al, submitted). Use of TBI varies by patient age, geographic location, human development index, cell source, and disease indications. Moreover, TBI appears to be used less frequently in recent years. RT directed at the central nervous system (CNS), gonads, lymphoid tissues, spleen, residual tumor and other tissues has also been observed in patients undergoing HCT. However, reasons for variations in TBI and RT use are unclear.
Since the early years of HCT, a wide variety of TBI techniques have been described (AAPM 1986). The last report describing the techniques of TBI at several centers in North America and England was over 30 years ago, and it is possible that techniques used now are considerably different (Kim, Khan et al. 1980). CIBMTR data does not accurately reflect the salient details of TBI (Pasquini, personal communication), and therefore a detailed assessment of current techniques employed would be valuable. Moreover, variations in TBI technique are clinically relevant; variations in shielding, boosting, fractionation and dose-rate have demonstrated significant differences in outcome in randomized clinical trials (Labar, Bogdanic et al. 1992) (Clift, Buckner et al. 1998) (Ozsahin, Belkacemi et al. 1994) (Deeg, Sullivan et al. 1986) (Girinsky, Benhamou et al. 2000) (Gratwohl, van Biezen et al. 2000).
Given the considerable variation in use of TBI and RT reported to the CIBMTR, and the possible variation in TBI techniques and survey of transplant specialists would be informative to transplant community.
Patient Eligibility Population: Transplant specialists associated with the CIBMTR will be surveyed about the use of TBI and RT at their institution. No patient data will be required.
Data Requirements: Data will be generated using a web-based survey designed and implemented with the help of the Memorial Sloan-Kettering Cancer Center (MSKCC) Web Survey Core: http://www.mskcc.org/research/web-survey-core Eligible participants in the survey will be identified through the CIBMTR and contacted via electronic mail.
53

Not for publication or presentation Attachment 7
Supplemental data: Supplemental data gathering will not be required of the CIBMTR staff. However, analysis of the data with CIBMTR resources would be valuable. Sample Requirements: None Study Design: A web-based survey will be developed with input from transplant specialists in hematologic and radiation oncology. General sections will include respondent information, transplant practice characteristics, transplant strategies, TBI and RT technique details, opinions about TBI and RT.
Surveys will be sent to individuals identified through the CIBMTR by email. Surveys will available on the internet through MSKCC. Non-responders will be contacted again by email every 3 weeks, on 5 occasions, or until a response is received. References:
1. AAPM, T.G.o.R.T.C.o. (1986). The Physical Aspects of Total and Half Body Photon Irradiation. J. V. Dyk. New York, American Institute of Physics: 55.
2. Clift, R. A., C. D. Buckner, et al. (1998). "Long-term follow-up of a randomized trial of two irradiation regimens for patients receiving allogeneic marrow transplants during first remission of acute myeloid leukemia." Blood 92(4): 1455-1456.
3. Deeg, H. J., K. M. Sullivan, et al. (1986). "Marrow Transplantation for Acute Nonlymphoblastic Leukemia in 1st Remission - Toxicity and Long-Term Follow-up of Patients Conditioned with Single Dose or Fractionated Total-Body Irradiation." Bone Marrow Transplantation 1(2): 151-157.
4. Girinsky, T., E. Benhamou, et al. (2000). "Prospective randomized comparison of single-dose versus hyperfractionated total-body irradiation in patients with hematologic malignancies." Journal of Clinical Oncology 18(5): 981-986.
5. Gratwohl, A., A. van Biezen, et al. (2000). "Role of splenic irradiation in patients with chronic myeloid leukemia undergoing allogeneic bone marrow transplantation. Chronic Leukemia Working Party of the European Group for Blood and Marrow Transplantation." Biol Blood Marrow Transplant 6(2A): 211-213.
6. Kim, T. H., F. M. Khan, et al. (1980). "A report of the work party - comparison of total-bodyirradiation techniques for bone-marrow transplantation." International Journal of Radiation Oncology Biology Physics 6(6): 779-784.
7. Labar, B., V. Bogdanic, et al. (1992). "Total-Body Irradiation with or without Lung Shielding for Allogeneic Bone-Marrow Transplantation." Bone Marrow Transplantation 9(5): 343-347.
8. Ozsahin, M., Y. Belkacemi, et al. (1994). "Total-Body Irradiation and Cataract Incidence - a Randomized Comparison of 2 Instantaneous Dose-Rates." International Journal of Radiation Oncology Biology Physics 28(2): 343-347.
54

Not for publication or presentation Attachment 7
Characteristics of recipients in TED database given TBI for the first auto vs. allo transplant between 2000 and 2010
Variable Allogeneic AutologousNumber of patients 36311 3988Number of centers 404 259Age, years <10 yrs 4311 (12) 87 (2) 10-19 yrs 5601 (15) 140 (4) 20-29 yrs 5351 (15) 389 (10) 30-39 yrs 5724 (16) 510 (13) 40-49 yrs 6916 (19) 922 (23) 50-59 yrs 5870 (16) 1298 (33) 60-69 yrs 2335 (6) 589 (15) >= 70 yrs 203 (<1) 53 (1)Sex Male 21465 (59) 2481 (62) Female 14846 (41) 1507 (38)Primary disease Acute myelogenous leukemia 11037 (30) 534 (13) Acute lymphoblastic leukemia 11692 (32) 186 (5) Chronic myelogenous leukemia 3105 (9) 7 (<1) Myelodysplastic disorders 2783 (8) 12 (<1) Non-Hodgkin lymphoma 3218 (9) 2241 (56) Hodgkin lymphoma 181 (<1) 262 (7) Multiple myeloma 457 (1) 431 (11) Other malignancies 2075 (6) 231 (6) Severe aplastic anemia 1067 (3) 0 Other non-malignancies 696 (2) 84 (2)Year of transplant 2000 3994 (11) 835 (21) 2001 3790 (10) 610 (15) 2002 3616 (10) 460 (12) 2003 3232 (9) 324 (8) 2004 3274 (9) 297 (7) 2005 3147 (9) 329 (8) 2006 3101 (9) 255 (6) 2007 2858 (8) 188 (5) 2008 3001 (8) 265 (7) 2009 3120 (9) 211 (5) 2010 3178 (9) 214 (5)WHO region
Africa 122 (<1) 8 (<1)
Americas 23544 (65) 3412 (86)
Eastern Mediterranean 579 (2) 30 (<1)
Europe 8363 (23) 434 (11)
Southeastern Asia 1531 (4) 77 (2)
Western Pacific 2165 (6) 27 (<1)
Missing 7 (<1) 0
55

Not for publication or presentation Attachment 7
Continued.
Variable Allogeneic AutologousGraft type Bone marrow 12567 (35) 186 (5) Peripheral blood 19663 (54) 3747 (94) Cord blood 3792 (10) 1 (<1) Missing 289 (<1) 54 (1)Donor type HLA-identical sibling 14474 (40) 0 Twin 174 (<1) 0 Other relative 2459 (7) 0 Unrelated donor 18571 (51) 0 NA 633 (2) 3988
56

Not for publication or presentation Attachment 7
Characteristics of recipients in CRF database given TBI for the first auto vs. allo transplant between 2000 and 2010
Variable Allogeneic AutologousNumber of patients 15112 567Number of centers 288 90Age, years <10 yrs 2125 (14) 8 (1) 10-19 yrs 2545 (17) 16 (3) 20-29 yrs 2143 (14) 37 (7) 30-39 yrs 2183 (14) 58 (10) 40-49 yrs 2659 (18) 123 (22) 50-59 yrs 2450 (16) 192 (34) 60-69 yrs 917 (6) 124 (22) >= 70 yrs 90 (<1) 9 (2)Sex Male 8932 (59) 350 (62) Female 6180 (41) 217 (38)Primary disease Acute myelogenous leukemia 4711 (31) 54 (10) Acute lymphoblastic leukemia 4621 (31) 27 (5) Chronic myelogenous leukemia 1300 (9) 0 Myelodysplastic disorders 1189 (8) 1 (<1) Non-Hodgkin lymphoma 1204 (8) 313 (55) Hodgkin lymphoma 59 (<1) 33 (6) Multiple myeloma 153 (1) 92 (16) Other malignancies 853 (6) 19 (3) Severe aplastic anemia 602 (4) 0 Other non-malignancies 420 (3) 28 (5)Year of transplant 2000 1558 (10) 111 (20) 2001 1497 (10) 93 (16) 2002 1427 (9) 60 (11) 2003 1364 (9) 27 (5) 2004 1549 (10) 21 (4) 2005 1527 (10) 40 (7) 2006 1556 (10) 38 (7) 2007 1256 (8) 47 (8) 2008 1356 (9) 70 (12) 2009 1211 (8) 37 (7) 2010 811 (5) 23 (4)WHO region
Africa 73 (<1) 1 (<1)
Americas 11792 (78) 564 (99)
Eastern Mediterranean 242 (2) 0
Europe 1807 (12) 0
Southeastern Asia 474 (3) 0
Western Pacific 724 (5) 2 (<1)
57

Not for publication or presentation Attachment 7
Continued.
Variable Allogeneic AutologousGraft type Bone marrow 5324 (35) 9 (2) Peripheral blood 7370 (49) 552 (97) Cord blood 2401 (16) 0 Missing 17 (<1) 6 (1)Donor type HLA-identical sibling 3885 (26) 0 Twin 44 (<1) 0 Other relative 407 (3) 0 Unrelated 10741 (71) 0 NA 35 (<1) 567
58