agenda - aapm.org
TRANSCRIPT
ASTRO2003:High doseTx for LungCa 2007-8-16
L. Marks/jh 1
Functional imaging for RT Functional imaging for RT planning: planning:
Normal tissue and tumorNormal tissue and tumor
Larry Marks, M.D.Larry Marks, M.D.Shiva Das, Ph.D.Shiva Das, Ph.D.
Duke University Medical CenterDuke University Medical Center
Duke UniversityDuke University
AgendaAgendaFunctionalimagingvs. incorporatingfunctional
info into CT-basedplanningNormal tissueand TumorInterpret functional data= f (anatomy
knowledge)Shortcomingsof nuclearmedicineimagesPET (tumor),SPECT(normal tissues),MRI
(both)Functionalimaging:studyRT-inducedregional
injury3D basedplanningvia functionaldataFunctionalimagingchangesDURING Tx?
Helps plan tx?
Duke UniversityDuke University
AnatomyAnatomy FunctionFunction
Duke UniversityDuke University
AnatomyAnatomy FunctionFunction
ASTRO2003:High doseTx for LungCa 2007-8-16
L. Marks/jh 2
Duke UniversityDuke University
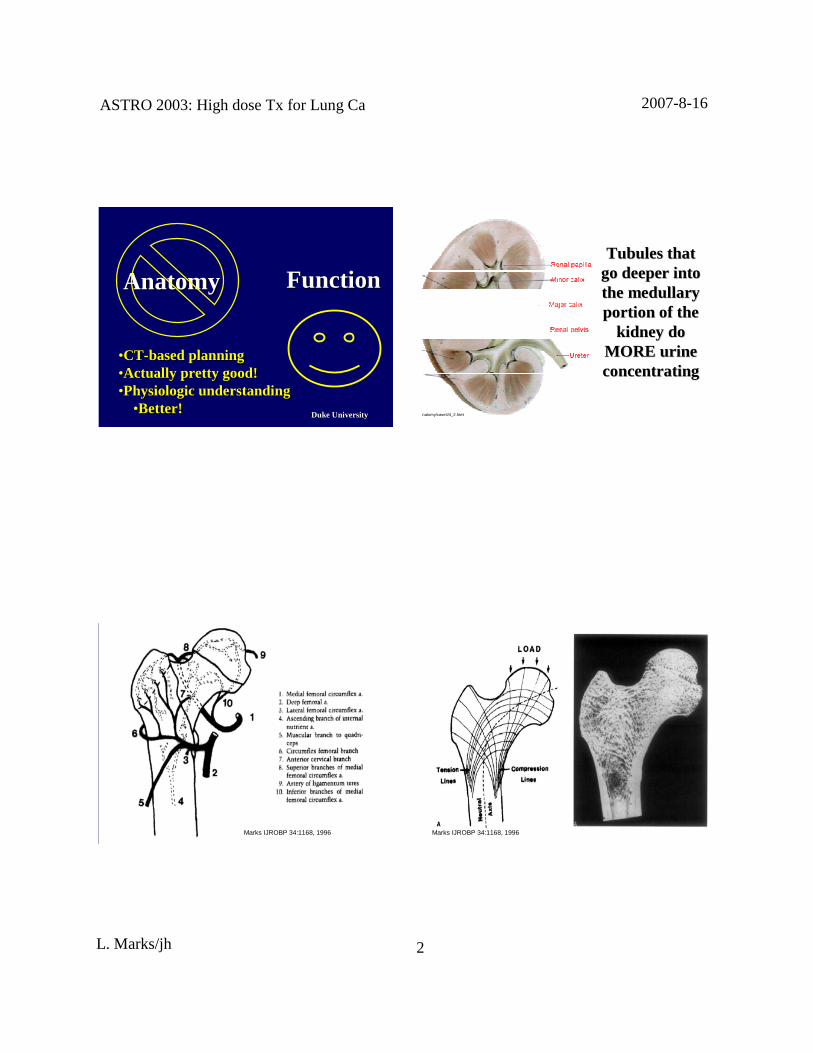
••CTCT--based planningbased planning••Actually pretty good!Actually pretty good!••PhysiologicunderstandingPhysiologic understanding
••Better!Better!
AnatomyAnatomy FunctionFunction
anatomy/case4/4_2.html
TubulesthatTubulesthatgo deeper intogo deeper intothethe medullarymedullaryportion of theportion of the
kidney dokidney doMORE urineMORE uri neconcentratingconcentrat ing
Duke UniversityDuke UniversityMarks IJROBP 34:1168, 1996 Duke UniversityDuke UniversityMarks IJROBP 34:1168, 1996

ASTRO2003:High doseTx for LungCa 2007-8-16
L. Marks/jh 3
Duke UniversityDuke UniversityBurgel U, et al. Neuroimage 1999; 489-499.
OR: optic radiation
AR: acousticradiation
MGB: medial geniculate bodyLGB: lateralgeniculatebody
IOF: inferior occifitofrontal fascicleUF: uncinateuncinatefasciclefascicle
Duke UniversityDuke University
a, c, e: optic radiation
b, d, f: lateral geniculate bodyBurgel U, et al. Neuroimage 1999; 489-499.
Duke UniversityDuke University
Incorpor atingIncorporatinganatomic/functionalanatomic/functional
information to improveinfor mation to improveCTCT--basedplanning:based planning:
EsophagusEsophagus
Duke UniversityDuke University
3D dose3D dosedistr ibutiondistribution OutcomeOutcome
(symptom)(symptom)
DVHDVH

ASTRO2003:High doseTx for LungCa 2007-8-16
L. Marks/jh 4
Duke UniversityDuke University
AnatomyAnatomyPhysiologyPhysiologySpatial informationSpatial information
3D dose3D dosedistributiondistributio n OutcomeOutcome
(symptom)(symptom)
DVHDVH
AnatomicallyAnatomicallyCorrect DVHCorrect DVH
Duke UniversityDuke University
Esophaguscontours:Esophagus contours:variable areavariable area
(volume)(volume)
Duke UniversityDuke University
SuperiorSuperior InferiorInferior
Duke UniversityDuke University
esophagealesophagealcontourscontours 3D metrics3D metrics
OutcomeOutcomeRTOG acuteRTOG acute
& late toxicity& late toxicity
CTCT
““ correctedcorrected””3D metri cs3D metrics
correctioncorrection
Univari ateUnivariate and Multivari ate Analysesand Mul tivariate Analyses

ASTRO2003:High doseTx for LungCa 2007-8-16
L. Marks/jh 5
Duke UniversityDuke University
AcuteAcute≥≥≥≥≥≥≥≥ grade 2grade 2 0.0080.008 0.0050.005
AcuteAcute≥≥≥≥≥≥≥≥ grade 3grade 3 0.050.05 0.0030.003
LateLate≥≥≥≥≥≥≥≥ grade 1grade 1 0.140.14 0.080.08
Toxicity = f (Toxicity = f (DosimetricDosimetr ic Parameters)Parameters)
V 50V 50CorrectedCorrected
Adapted from KahnAdapted from Kahn et al.et al. 2004 (Duke)2004(Duke)
V 50V 50UncorrectedUncorrected
pp--valuesvalues
Duke UniversityDuke University
CT + Anatomy,CT + Anatomy,physiologyphysiology >> CT aloneCT alone
Duke UniversityDuke University
CT isnCT isn’’ t perfect.t perfect.Functional often better.Functional often better.
Duke UniversityDuke University
Functional ImagingFunctional Imaging
•• Lung: SPECT perfusionLung: SPECT perfusion
•• Li mit dose toLi mit doseto ““ goodgood”” lunglung
•• StudyStudy regionalregional normal tissueinjur ynormal tissueinjury
•• Heart: SPECT; normal tissueinj uryHeart: SPECT; normal tissue inju ry
•• Tumor: PETTumor: PET
•• Functional DVH: DF(function)HFunctional DVH: DF(function)H
•• Plan evaluation/rankingPlan evaluation/ranking

ASTRO2003:High doseTx for LungCa 2007-8-16
L. Marks/jh 6
Duke UniversityDuke University
APPAAPPA
APPAAPPAObliquesObliques
ObliquesObliques
Duke UniversityDuke University
Local doseLocal dose→→→→→→→→ local perfusion losslocal perfusion lossSPECT perfusionSPECT perfusion
(micro(micro--emboli)emboli)
∑∑∑∑∑∑∑∑ Local effectsLocal effects →→→→→→→→ global functionalglobal functionalchangeschanges
pulmonary functionpulmonary functiontests,symptomstests,symptoms
UsingfunctionalimagingtoUsingfunctionalimaging tostudynormal tissuetoxicitystudy normaltissuetoxicity
Duke UniversityDuke University Duke UniversityDuke University
Prospective Study of RTProspective Study of RT--InducedLung injuryInducedLung injury
•• >300patients enrolled since1992;87%>300 patients enrolled since1992;87%white, 45% male,white, 45% male, 70% lung pri mary70% lung pri mary
•• PrePre-- andand serialserial postpost--RT evaluationsRT evaluations•• Function: Pulmonary function tests(Function: Pulmonary function tests(PFTsPFTs))•• Imaging: SPECT perfusion scan, CT scanImaging: SPECT perfusion scan,CT scan
•• EndpointsEndpoints•• Symptoms,radiographs,Symptoms,radiographs, PFTsPFTs

ASTRO2003:High doseTx for LungCa 2007-8-16
L. Marks/jh 7
0
20
40
60
80
100
0 20 40 60 80 100
RegionalDose(Regional Dose(GyGy))
0
20
40
60
80
100
0 20 40 60 80 100
%%ReductionReductionRegionalRegionalPerfusionPerfusion -25
0
25
50
75
100
PE
RC
EN
TR
ED
UC
TIO
NIN
PE
RF
USI
ON
0 2000 4000 6000 8000
DOSE(cGy)
12 MONTHS
9 MONTHS
6 MONTHS
3 MONTHS
1.5 MONTHS
Marks 1997Marks 1997
From: Steppenwolde & Lebes que Sem Rad Oncol 11:247, 2001
Duke UniversityDuke University
∑∑∑∑∑∑∑∑VVdd ×××××××× RRdd ==
Sum ofSum ofpredictedpredicted
regional injurie sregional injurie s““ integral injuryintegral injury ””(overall response(overall response
parameter)parameter)
%%reductionreductionperfusionperfusion
regional doseregional doseDD
VVdd
%%lunglung
““ volumevolume””
differentialdifferentialDVHDVH
dosedoseresponseresponse
DDregionaldoseregional dose
RRdd
ddmaxmax
d = 0d = 0

ASTRO2003:High doseTx for LungCa 2007-8-16
L. Marks/jh 8
Duke UniversityDuke University
0 10 20 30 40 50-60
-40
-20
0
20
40
60
Overall Group
R = 0.30,p = 0.005
Predicted Reduction in PFTs (%)
ActualReduction
DLCO(%)
y = x
Duke UniversityDuke University
SurgerySurgery: %: % PerfusedPerfusedLung RemovedLung Removed vsvs..% Declinein Pulmonary Function% Declinein Pulmonary Function
Julius (9)Julius (9) 0.800.80CordinerCordiner (18)(18) 0.820.82Pierce(45)*Pierce(45)* 0.87 0.560.87 0.56BolligerBolliger (22)(22) 0.81 0.740.81 0.74GiordaioGiordaio (41)*(41)* 0.870.87
Correlation CoefficientCorrelation Coefficient
FEVFEV11DLCODLCO
** some%some% ““ segmentssegments”” removedremovedadapted from Fan 2001adapted from Fan 2001
Author (Number pts)Author (Number pts)
Prospective HEART StudyProspectiveHEART Study•• PatientsPatients
•• 19981998--2005;130pts with left2005; 130pts with left--sided breast casided breast ca•• Agerange 26Age range26--82,median 5482, median 54
•• TreatmentTreatment•• Photon tangents46Photon tangents46--5050 GyGy•• Chemotherapy before RT: 64%Chemotherapy before RT: 64%
•• Study designStudy design•• Single photon emissioncomputed tomographySingle photon emission computed tomography
(SPECT) to assessleft ventricular(SPECT) to assessleft ventricular perfusionperfusion•• Pre & serial postPre & serial post--RT SPECT scans comparedRT SPECT scanscompared•• 90 patients90 patients with normal prewith normal pre--RT scans inRT scansin
present analysispresentanalysis
ASTRO2003:High doseTx for LungCa 2007-8-16
L. Marks/jh 9
Duke UniversityDuke University
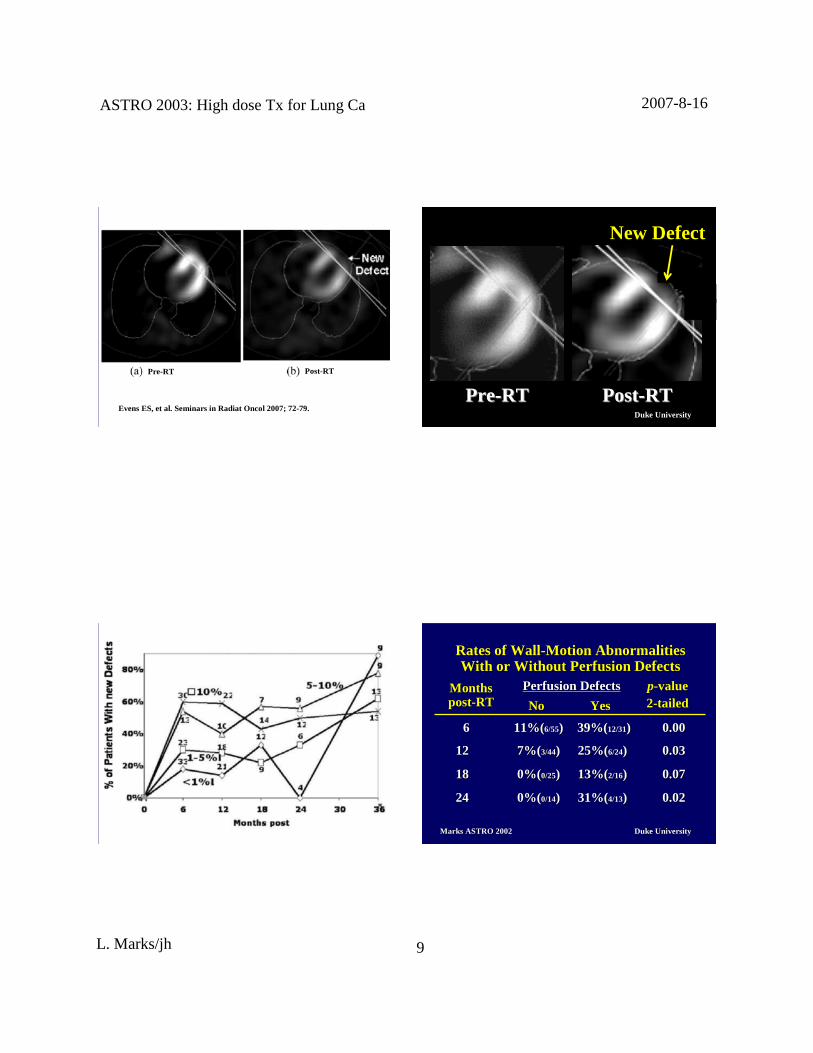
Pre-RT Post-RTPre-RT Post-RT
EvensES,et al. Seminarsin Radiat Oncol 2007;72-79.Duke UniversityDuke University
PrePre--RTRT PostPost--RTRT
New Defect
Duke UniversityDuke University Duke UniversityDuke University
66 11%(11%(6/556/55)) 39%(39%(12/3112/31)) 0.000.00
1212 7%(7%( 3/443/44)) 25%(25%(6/246/24)) 0.030.03
1818 0%(0%( 0/250/25)) 13%(13%(2/162/16)) 0.070.07
2424 0%(0%( 0/140/14)) 31%(31%(4/134/13)) 0.020.02
M onthsM onthspostpost--RTRT
Perfusion DefectsPerf usion Defects
YesYesNoNo
Ratesof WallRatesof Wall--Motion AbnormalitiesMotion Abnormali tiesWith or Wit hout Perfusion DefectsWith or Wit hout Perfusion Defects
pp--valuevalue22--tailedtailed
M arks ASTRO 2002M arks ASTRO 2002

ASTRO2003:High doseTx for LungCa 2007-8-16
L. Marks/jh 10
Duke UniversityDuke University
PerfusionPerfusionchangeschanges
cardiac wallcardiac wallmotionmotionabnormaliti esabnormalities
changesinchangesinejection fraction,ejection fract ion,symptomssymptoms
RTRT
Volume Dependence- set-up accuracy
Duke UniversityDuke University
Functional ImagingFunctional Imaging
•• Target delineationTarget delineation
Duke UniversityDuke University
Rate of PETRate of PET--defined changedefined changein grosstarget for lungin grosstarget for lung
cancercancer
MunleyMunley (1996)*(1996)* 34% (12/25)34% (12/25)KifferKiffer (1998)(1998) 27% (4/15)27% (4/15)Nestle(1999)Nestle (1999) 35% (12/34)35% (12/34)
*Higher now: Availability, Experience,Comfort level,Availability, Experience,Comfort level,AcceptableAcceptable
Duke UniversityDuke University2/14 (14)12/14 (86)14Gondi et al. 2007
7/21 (33)11/21 (52)18/21(86)21Grills et al. 2006
5/19 (26)5/19 (26)10/19(52)19Ashamalla et al. 2005
3/18 (17)7/18 (39)10/18(55)18M essaet al. 2005
11/21(52)3/21 (14)14/21(67)21Van der Wel, et al. 2005
21/92(23)24/92 (26)45/92(49)101Deniaud-Alexandre, et al.2005
3/24 (12)11/24 (46)14/24(58)26Bradley et al. 2004
4/6 (66)1/6 (17)5/6 (83)6Cienik et al. 2003
5/23 (22)5/23(22)30Mah et al. 2002
4/11 (36)7/11 (64)11/11(100)11Erdi et al. 2002
16/102(16)22/102(21)38/102(37)102Mac Manus et al. 2001
29/63(40)16/63 (22)45/73(62)73Vanuyselet al. 2000
9/34 (26)3/34 (9)12/34(35)34Nestleet al. 1999
12/35 (34)12/35(34)35M unley et al. 1996
4/15(27)4/15(27)15K iffer et al. 1998
GTV decrease(%)
GTV increase(%)
Overall changesinGTV (%)
No. of ptsAuthor/year
Rate of FDG-PET -defined changein GTV for NSCLC

ASTRO2003:High doseTx for LungCa 2007-8-16
L. Marks/jh 11
88%reductionin GTV
Atelectasis
Gondi V, et al. IJROBP 2007; 187-195.(University of Wisconsin)Duke UniversityDuke University
M agnitude of changesin CT-basedGTV and PET-CT basedGTVamong observersof headand neckcancerpatients
CT GTV changePET-CT GTV change
PET: lessinter -observer variability vs. CT
AshamallaH, et al. IJROBP2007 ; 388-395. (Cornell University)
Duke UniversityDuke University
CT GTV (overallSD: 1.02) FDG/PET-CT GTV (overallSD: 0.42)
subcarinal LN
blood vessels
PET: lessinter -observervariability vs.CT:Lung cancer GTV delineation
SteenbakkersRJ, etal. IJROBP 2006; 435-448.( The NetherlandsCancer Instisute) Duke UniversityDuke University
Definition of GTV based on differ ent thr esholdsof SUV
SUV-normalized FDG-PET Projected onto planning CT
Hybrid FDG-PET/CT
Gondi V, et al. IJROBP 2007;187-195.

ASTRO2003:High doseTx for LungCa 2007-8-16
L. Marks/jh 12
Duke UniversityDuke UniversitySteering doseby PET via IM RT, Shiva Das2003
Duke UniversityDuke University
Percentile SPECTimages(F50, F90)
Anatomic plan Functional plan
The impact of incorporating functional imaginginto IMRT for NSCLC
ShioyamaY, etal. IJROBP 2007; in press.
Duke UniversityDuke University
4DCT-derivedventilation image
4DCT4DCT
4DCT
Volume-constrainedbaselineplan Ventilation -constrainedplan
Yaremko BP, et al. IJROBP 2007;562-571. Duke UniversityDuke University
Shortcomings of Nuclear Medicine Images
• Path-length of the positron• Challenges of registration• assume "inherently registered to CT”• Approximation
• Resolution• Window & Level: magic• Auto-segmentation of images
• They are typically not gated• Need to know anatomy and patterns
spread. (larynx example)
ASTRO2003:High doseTx for LungCa 2007-8-16
L. Marks/jh 13
Duke UniversityDuke University
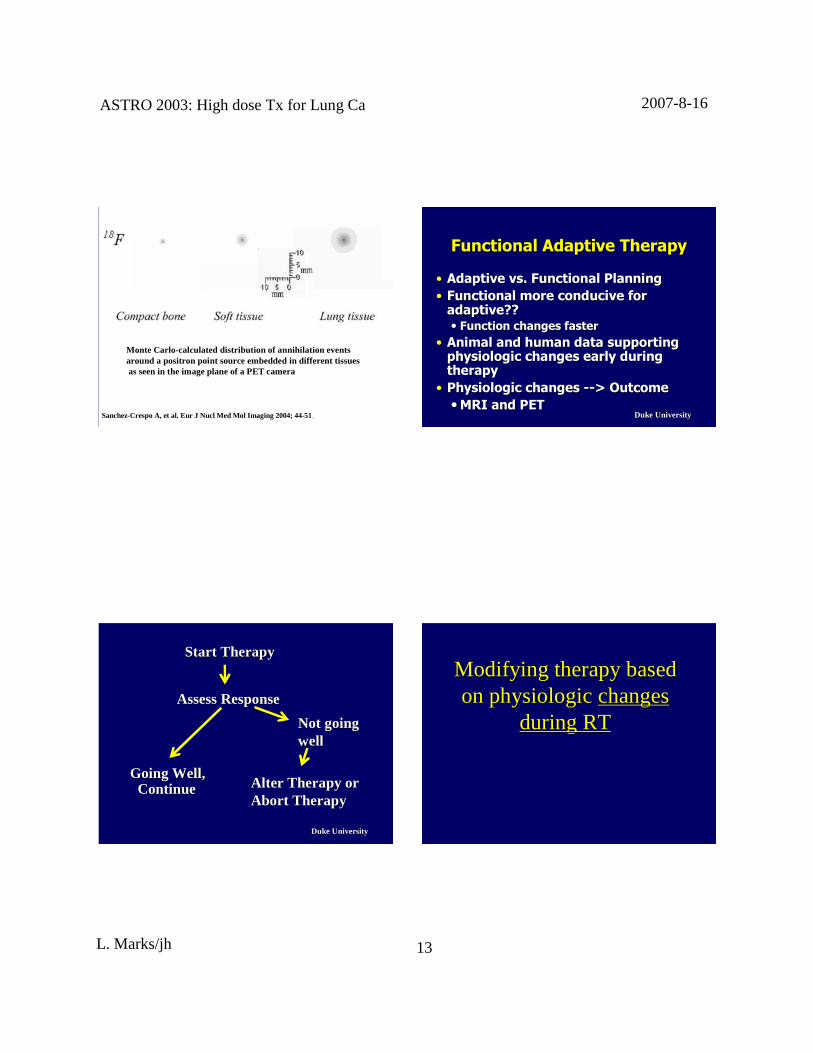
Monte Carlo-calculated distribution of annihilation eventsaround a positron point source embedded in different tissuesas seenin the imageplane of a PET camera
SanchezSanchez--CrespoA, et al. Eur J Nucl Med Mol Imaging 2004;44CrespoA, et al. Eur J Nucl MedMol Imaging 2004;44--5151.. Duke UniversityDuke University
Functional Adaptive TherapyFunctional Adaptive Therapy
•• Adaptive vs. Functional PlanningAdaptive vs. Functional Planning•• Functional more conducive for Functional more conducive for
adaptive?? adaptive?? •• Function changes fasterFunction changes faster
•• Animal and human data supporting Animal and human data supporting physiologic changes early during physiologic changes early during therapytherapy•• Physiologic changes Physiologic changes ----> Outcome> Outcome••MRI and PETMRI and PET
Duke UniversityDuke University
Going Well,Going Well,ContinueContinue
Start TherapyStart Therapy
Alter Therapy orAlter Therapy orAbort TherapyAbort Therapy
Not goingNot goingwellwell
AssessResponseAssessResponse
Modifying therapybasedModifying therapybasedon physiologicon physiologic changeschanges
during RTduring RT
ASTRO2003:High doseTx for LungCa 2007-8-16
L. Marks/jh 14
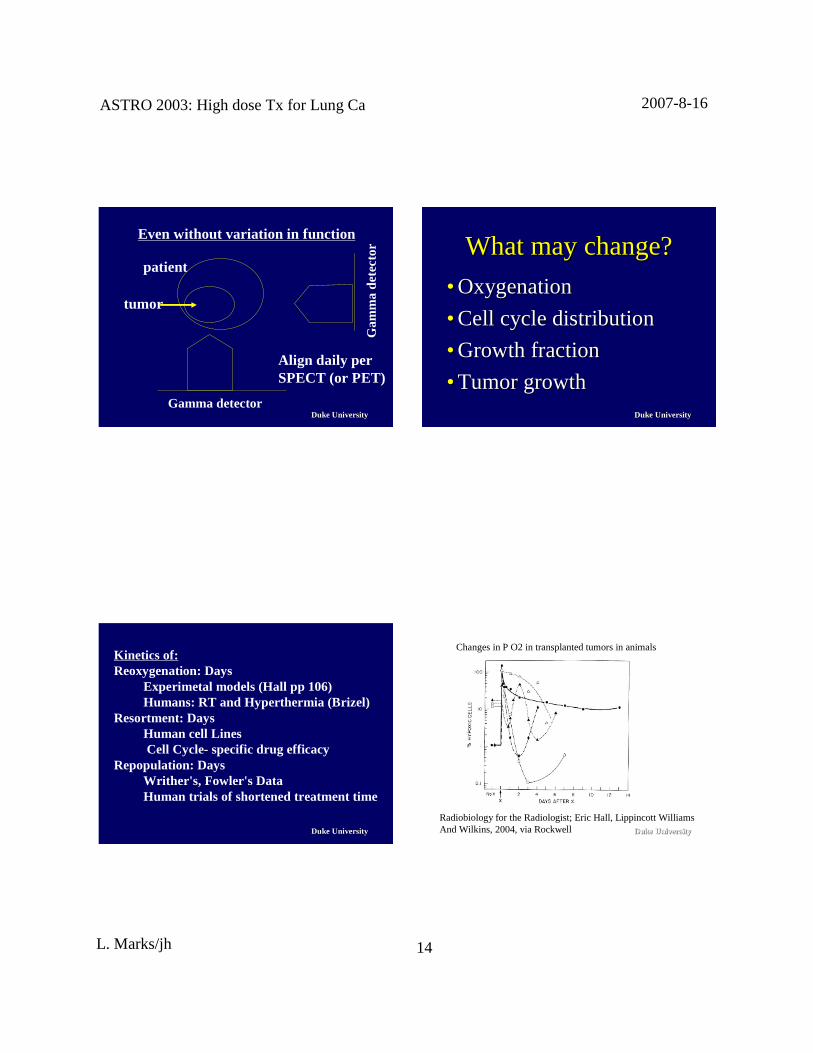
Duke UniversityDuke University
Even without variation in function
patient
tumor
Align daily perSPECT (or PET)
Gamma detector
Gam
ma
dete
ctor
Duke UniversityDuke University
What maychange?Whatmaychange?
•• OxygenationOxygenation
•• Cell cycledistributionCell cycledistribution
•• GrowthfractionGrowth fraction
•• TumorgrowthTumorgrowth
Duke UniversityDuke University
Kin eticsof:Reoxygenation: Days
Experimetal models(Hall pp 106)Humans: RT and Hyperthermia (Brizel)
Resortment: DaysHuman cell LinesCell Cycle- specific drug efficacy
Repopulation: DaysWrither's, Fowler's DataHuman tri als of shortenedtreatment time
Duke UniversityDuke University
Radiobiology for theRadiologist; Eric Hall, Lippincott WilliamsAnd Wilkins, 2004, via Rockwell
Changesin P O2 in transplantedtumors in animals

ASTRO2003:High doseTx for LungCa 2007-8-16
L. Marks/jh 15
Duke UniversityDuke University
Sample of human data supportingSample of human data supportingphysiologic changesdur ing RTphysiologic changesduring RT
•• P O2P O2
•• MRIMRI
•• PETPET
Duke UniversityDuke University
BrizelBrizel et alet al
•• Soft tissuesarcoma(N=21)Soft tissuesarcoma (N=21)•• Serial P O2 measurements(Serial P O2 measurements(EppendorfEppendorf))
•• PrePre--RTRT•• During first wk of RT; preDuring first wk of RT; pre--heatheat•• After FIRSTheat treatmentAfter FIRSTheat treatment
•• RelatedP O2 changesto pathologicRelatedP O2 changesto pathologicresponseresponse
CancerResearch56: 5347, 1996,DukeUniversity
Duke UniversityDuke University
Resection:Assesspathologicresponse
SarcomaDiagnosis
<--- RT --->
Pre-RT
Post-RT
Post-RT/Heat
P O2Brizel, CancerResearch56: 5347,1996, DukeUniversity
<-- Heat -->
M edian 6 4 12
Duke UniversityDuke UniversityBrizel, CancerResearch 56: 5347,1996,Duke University
P O2 post-first heat/pre-tx
Earlychangesin P O2 predictfor laterpathologicresponse
ASTRO2003:High doseTx for LungCa 2007-8-16
L. Marks/jh 16
Duke UniversityDuke University
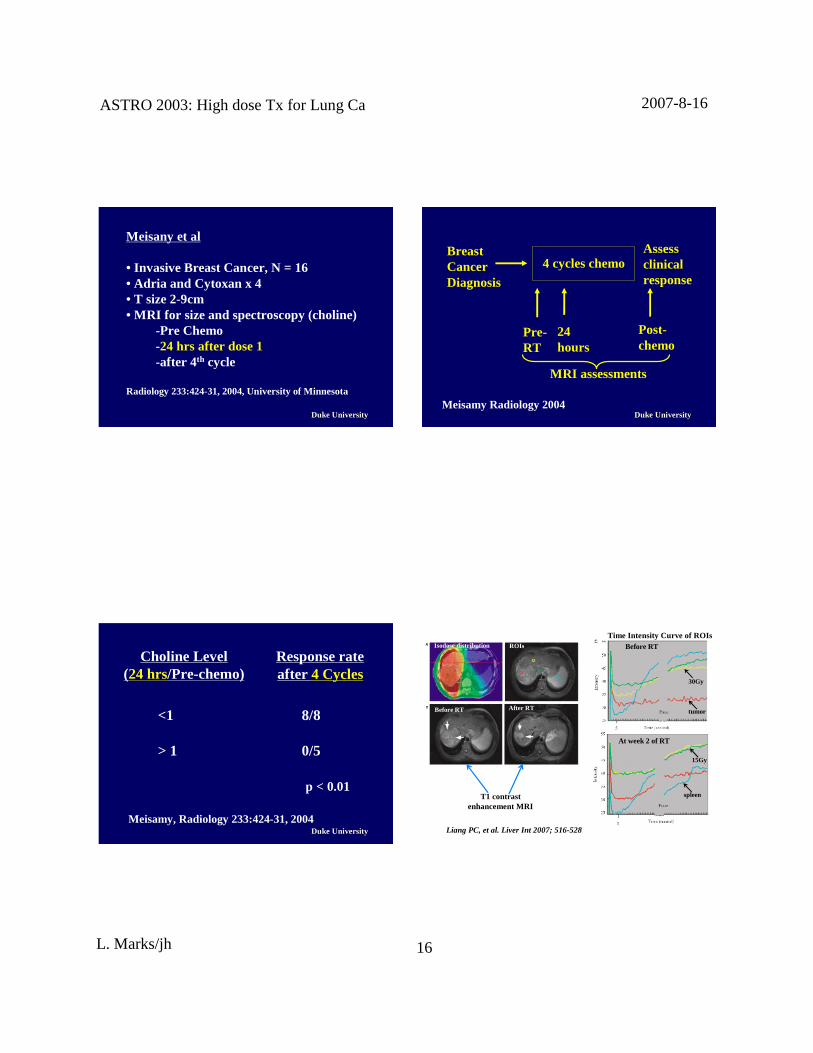
M eisany et al
• Invasive BreastCancer,N = 16• Adria and Cytoxan x 4• T size2-9cm• MRI for sizeand spectroscopy(choline)
-Pre Chemo-24 hrs after dose1-after 4th cycle
Radiology 233:424-31,2004,University of Minnesota
Duke UniversityDuke University
Assessclinicalresponse
BreastCancerDiagnosis
4 cycleschemo
Pre-RT
24hours
Post-chemo
M RI assessments
Meisamy Radiology 2004
Duke UniversityDuke University
<1 8/8
> 1 0/5
p < 0.01
Meisamy, Radiology 233:424-31,2004
Choline Level(24 hrs/Pre-chemo)
Responserateafter 4 Cycles
Duke UniversityDuke University
Before RT After RT
BeforeRT
At week2 of RT
Liang PC,et al. Liver Int 2007; 516-528.
Isodosedistribution ROIs
T1 contrastenhancement MRI
Time Intensity Curve of ROIs
15Gy
tumor
30Gy
spleen
ASTRO2003:High doseTx for LungCa 2007-8-16
L. Marks/jh 17
Duke UniversityDuke University
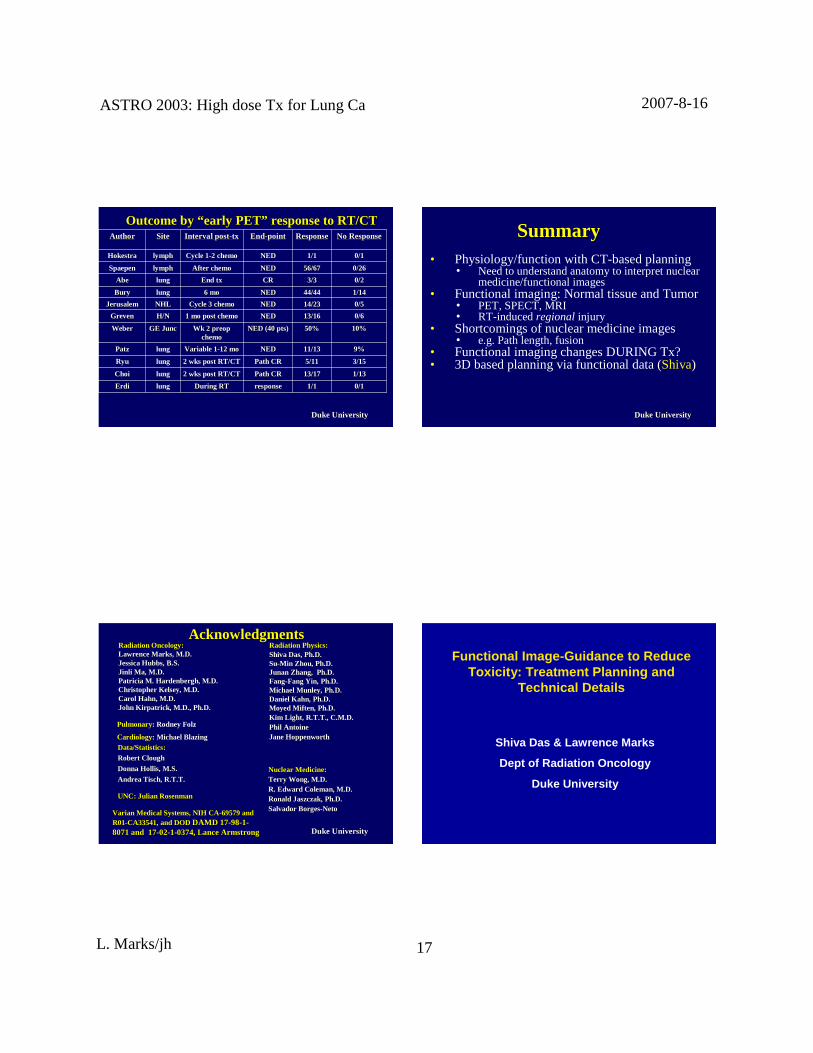
OutcomebyOutcomeby ““ early PETearly PET”” response to RT/CTresponseto RT/CT
0/10/11/11/1responseresponseDuri ng RTDuring RTlunglungErdiErdi
1/131/1313/1713/17Path CRPath CR2 wks post RT/CT2 wks post RT/CTlunglungChoiChoi
3/153/155/115/11Path CRPath CR2 wks post RT/CT2 wks post RT/CTlunglungRyuRyu
9%9%11/1311/13NEDNEDVariable 1Variable 1--12 mo12 molunglungPatzPatz
10%10%50%50%NED (40 pts)NED (40 pts)Wk 2Wk 2 preoppreopchemochemo
GEGE JuncJuncWeberWeber
0/60/613/1613/16NEDNED1 mo post chemo1 mo post chemoH/NH/NGrevenGreven
0/50/514/2314/23NEDNEDCycle3 chemoCycle3 chemoNHLNHLJerusalemJerusalem
1/141/1444/4444/44NEDNED6 mo6 molunglungBuryBury
0/20/23/33/3CRCREndEnd txtxlunglungAbeAbe
0/260/2656/6756/67NEDNEDAfter chemoAfter chemolymphlymphSpaepen
0/10/11/11/1NEDNEDCycle1Cycle1--2 chemo2 chemolymphlymphHokestraHokestra
No ResponseNo ResponseResponseResponseEndEnd--pointpointInterval postInterval post--txtxSiteSiteAuthorAuthor
Duke UniversityDuke University
SummarySummary• Physiology/functionwith CT-basedplanning
• Needto understandanatomyto interpretnuclearmedicine/functional images
• Functional imaging:Normal tissueandTumor• PET, SPECT, MRI• RT-inducedregional injury
• Shortcomingsof nuclearmedicine images• e.g. Pathlength, fusion
• Functional imagingchangesDURING Tx?• 3D basedplanning via functionaldata(Shiva)
Duke UniversityDuke University
Radiation Oncology:Radiation Oncology:LawrenceMarks, M.D.LawrenceMarks, M.D.JessicaJessicaHubbsHubbs, B.S., B.S.Jinl iJinli Ma, M.D.Ma, M.D.Patricia M.Patrici a M. HardenberghHardenbergh, M.D., M.D.Christopher Kelsey, M.D.Christopher Kelsey, M.D.Carol Hahn, M.D.Carol Hahn, M.D.JohnJohn KirpatrickK irpat rick , M.D., Ph.D., M.D., Ph.D.
Radiation Physics:Radiation Physics:ShivaShiva DasDas, Ph.D., Ph.D.SuSu--Min Zhou, Ph.D.Min Zhou, Ph.D.JunanJunan Zhang,Zhang, Ph.D.Ph.D.FangFang--Fang Yin, Ph.D.Fang Yin, Ph.D.MichaelMichael MunleyMunley, Ph.D., Ph.D.Daniel Kahn, Ph.D.Daniel Kahn, Ph.D.MoyedMifte nMoyedMiften , Ph.D., Ph.D.Kim Light, R.T.T., C.M.D.Kim Light, R.T.T., C.M.D.Phil AntoinePhil AntoineJaneJaneHoppenworthHoppenworth
Data/Statistics:Data/Statistics:Robert CloughRobert Clough
Donna Hollis, M.S.Donna Hollis,M.S.
AndreaAndrea TischTisch, R.T.T., R.T.T.
UNC: JulianUNC: Julian RosenmanRosenman
Nuclear Medicine:Nuclear Medicine:Terry Wong, M.D.Terry Wong, M.D.R. Edward Coleman, M.D.R. Edward Coleman,M.D.RonaldRonald JaszczakJaszczak, Ph.D., Ph.D.SalvadorBorgesSalvador Borges--NetoNeto
Varian Medical Systems,NIH CAVarian Medical Systems,NIH CA--69579 and69579andR01R01--CA33541,and DODCA33541, and DOD DAMDDAMD 1717--9898--11--8071 and8071and 1717--0202--11--0374,Lance Arm strong0374,Lance Armstrong
Pulmonary: Rodney Folz
Cardiology: MichaelBlazingMichaelBlazing
AcknowledgmentsAcknowledgments
Functional Image-Guidance to ReduceTox icity: Treatm ent Plann ing and
Technical Details
Shiva Das & Lawren ce Marks
Dept of Radiation Oncol ogy
Duke Univer sity

ASTRO2003:High doseTx for LungCa 2007-8-16
L. Marks/jh 18
Duke University
Asum ption: all areas of normal lung have equal funct ion.
Reality: lung funct ion is spatially heter ogeneo us.
Reduce lung toxicity: reduce dose to higher funct ioningnor mal lung ⇒⇒⇒⇒ better quality of life!
Duke University
Single Photon Emission Comp uted Tomogr aphy
SPECT provides a map of perfusion .
In animal studies : perf usion ∝∝∝∝ function
Duke University
Objectiv es
� Develop a manu al algo rit hmic methodo logy forintegrating SPECT-gui dance into the ECLIPSE treatmen tplanning optimizatio n process.
� Automate the method olog y.
� Apply in clinic!
Duke University
This is all well and good, except that ECLIPSE doesnot accept SPECT imag es …………….
Create a CT look -alike cont ainin g SPECT data
� Register SPECT to plannin g CT outside ECLIPSE� Resample SPECT to match CT slices and resolution� Make a copy of DICOM CT which will be used to
house SPECT data (“ fake” CT)� Modify DICOM header in fake CT; strip out CT Data
and replace with SPECT data� Import fake CT (SPECT data) into ECLIPSE.

ASTRO2003:High doseTx for LungCa 2007-8-16
L. Marks/jh 19
Duke University Duke University
� Initial IMRT plan generated without SPECT-guidance.Dose-volumes obtained in this plan are used in SPECT-guided plan.
� SPECT image is segmented into 4 areas from low to highintensity.
Methodolog y
Duke University
Methodology (cont ’d.)
� Set current SPECT structure under consideration to thelowest intensity structure.
� For all SPECT structures with higher intensity, volumesabove constraint doses are constrained to zero (maximumimportance).
� Optimize PTV dose while keeping all normal structuresother than lung within dose-volume limits.
� If PTV coverage is unsatisfactory, or normal structuresother than lung have exceeded limits, set the SPECTstructure under consideration to the next higher intensitystructure, and repeat.
Duke University
Functional Metrics
VD = volume above D Gy.
FD = function above D Gy (function = volume× SPECTintensity)
DVH: Dose volume histogram.
DFH: Dose function histogram.

ASTRO2003:High doseTx for LungCa 2007-8-16
L. Marks/jh 20
Duke University
Manually implemented this methodology in 5 lung cancerpatients.
� 9 beams oriented at 30° spacing on predominant tumorside.
� Primary tumor to 40 Gy, boost to 66 Gy.
Patients
Duke University
SPECT distribution can bevery spatially heterogeneous
Duke University
Dose Function Histo grams: SPECT Structur es(one patient)
Hig hest inten sity SPECT region DFH 2nd Highest intensity SPECT regionDFH
3rd Hig hest intensity SPECT regionDFH
Lowe st intensity SPECT region DFH
0 20 40 60 800
2
4
6
8
10
Dose (Gy)
%F
unct
ion
Base PlanSPECT Plan
Highest SPECTintensity structure
0 20 40 60 800
5
10
15
20
25
Dose (Gy)
%F
unct
ion
Base PlanSPECT Plan
2nd Highest SPECTintensity structure
0 20 40 60 800
5
10
15
20
25
30
Dose (Gy)
%F
unct
ion
Base PlanSPECT Plan
3rd Highest SPECTintensity structure
0 20 40 60 800
10
20
30
40
Dose (Gy)
%F
unct
ion
Base PlanSPECT Plan
Lowest SPECTintensity structure
Base
SPECT
Duke University
0 20 40 60 800
20
40
60
80
100
Dose (Gy)
%F
unct
ion
Base PlanSPECT Plan
Lung DFH
Lung Dose-Function Histog rams (5 patients)
Base
SPECT
0 20 40 60 800
20
40
60
80
100
Dose (Gy)
%F
unct
ion
Base PlanSPECT Plan
Lung DFH
0 20 40 60 800
20
40
60
80
100
Dose (Gy)
%F
unct
ion
Base PlanSPECT Plan
Lung DFH
0 20 40 60 800
20
40
60
80
100
Dose (Gy)
%F
unct
ion
Base PlanSPECT Plan
Lung DFH
0 20 40 60 800
20
40
60
80
100
Dose (Gy)
%F
unct
ion
Base PlanSPECT Plan
Lung DFH
ASTRO2003:High doseTx for LungCa 2007-8-16
L. Marks/jh 21
Duke University
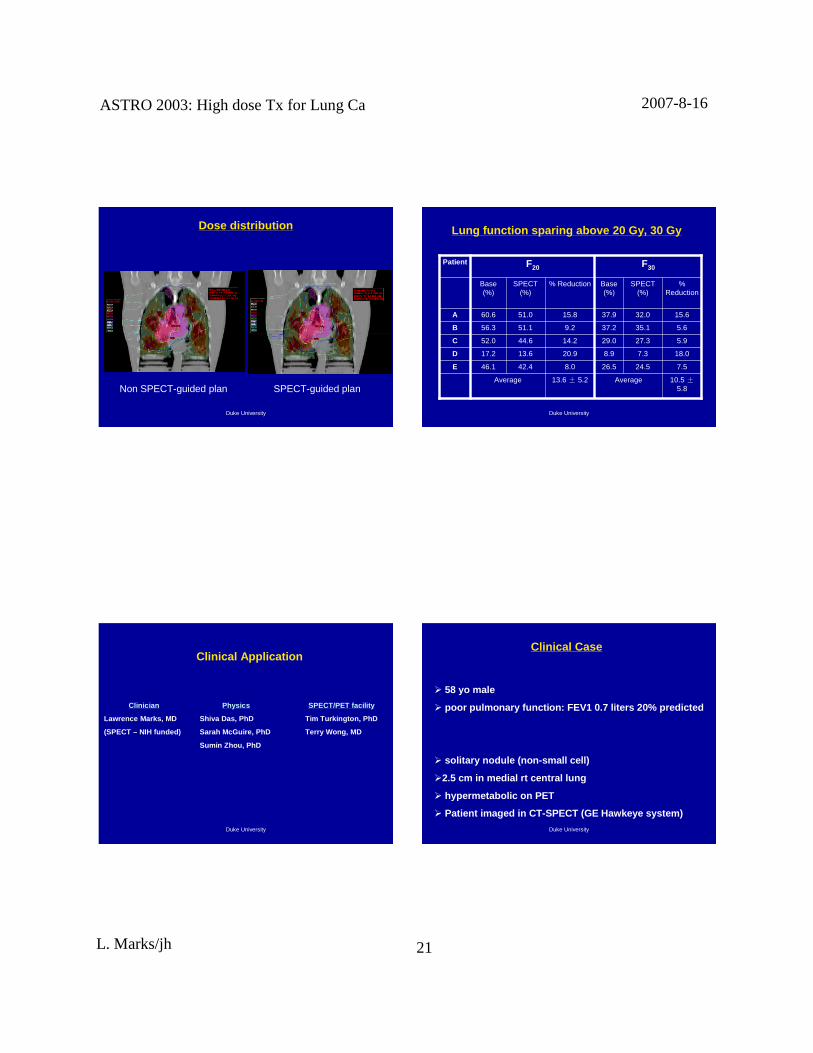
Dose distr ibution
Non SPECT-guided plan SPECT-guided plan
Duke University
Lung function sparing above 20 Gy, 30 Gy
10.5±5.8
Average13.6± 5.2Average
7.524.526.58.042.446.1E
18.07.38.920.913.617.2D
5.927.329.014.244.652.0C
5.635.137.29.251.156.3B
15.632.037.915.851.060.6A
%Reduction
SPECT(%)
Base(%)
% ReductionSPECT(%)
Base(%)
F30F20Patient
Duke University
Clinical Applicati on
Clinician
Lawrenc e Marks, MD
(SPECT – NIH funded)
Physics
Shiva Das, PhD
Sarah McGuire, PhD
Sumin Zhou, PhD
SPECT/PET facility
Tim Turkin gton, PhD
Terry Wong, MD
Duke University
Clinical Case
� 58 yo male
� poor pulmonary fun ctio n: FEV1 0.7 liter s 20% predicted
� soli tary nodule (non -small cell)
�2.5 cm in medial rt cent ral lung
� hypermetaboli c on PET
� Patient imaged in CT-SPECT (GE Hawkeye system)
ASTRO2003:High doseTx for LungCa 2007-8-16
L. Marks/jh 22
Duke University
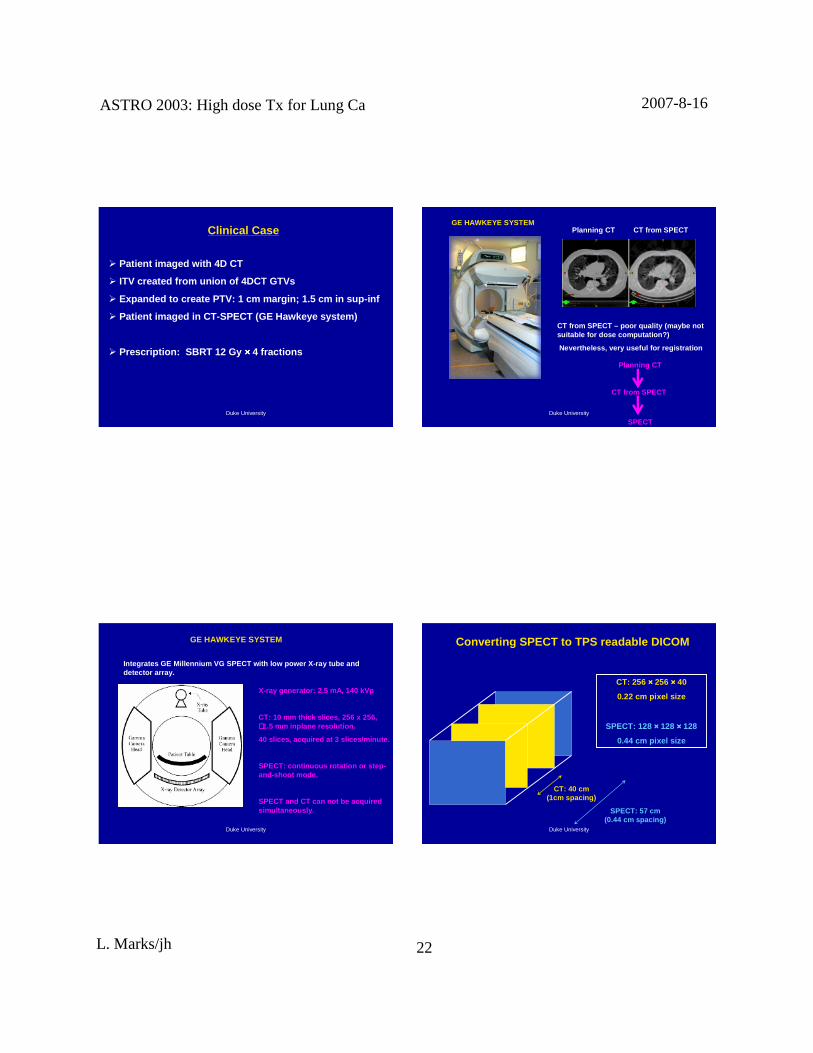
Clinical Case
� Patient imaged with 4D CT
� ITV created from union of 4DCT GTVs
� Expanded to create PTV: 1 cm margin; 1.5 cm in sup -inf
� Patient imaged in CT-SPECT (GE Hawkeye system)
� Prescription: SBRT 12 Gy ×××× 4 frac tions
Duke University
GE HAWKEYE SYSTEMPlanning CT CT from SPECT
CT from SPECT – poor qual ity (maybe notsuitabl e for dose computa tion?)
Nevert heless, very useful for registrat ion
Planning CT
CT from SPECT
SPECT
Duke University
GE HAWK EYE SYSTEM
Integrate s GE Millennium VG SPECT with low pow er X-ray tub e anddetec tor array.
X-ray generator: 2.5 mA, 140 kVp
CT: 10 mm thick slices , 256 x 256,∼∼∼∼ 1.5 mm inp lane resolutio n.
40 slices, acquired at 3 slices /minute.
SPECT: continu ous rotat ion or step-and-shoot mode.
SPECT and CT can not be acquire dsimultaneously.
Duke University
Converting SPECT to TPS readable DICOM
CT: 40 cm(1cm spacing)
SPECT: 57 cm(0.44 cm spacin g)
CT: 256 ×××× 256 ×××× 40
0.22 cm pi xel size
SPECT: 128 ×××× 128 ×××× 128
0.44 cm pi xel size
ASTRO2003:High doseTx for LungCa 2007-8-16
L. Marks/jh 23
Duke University
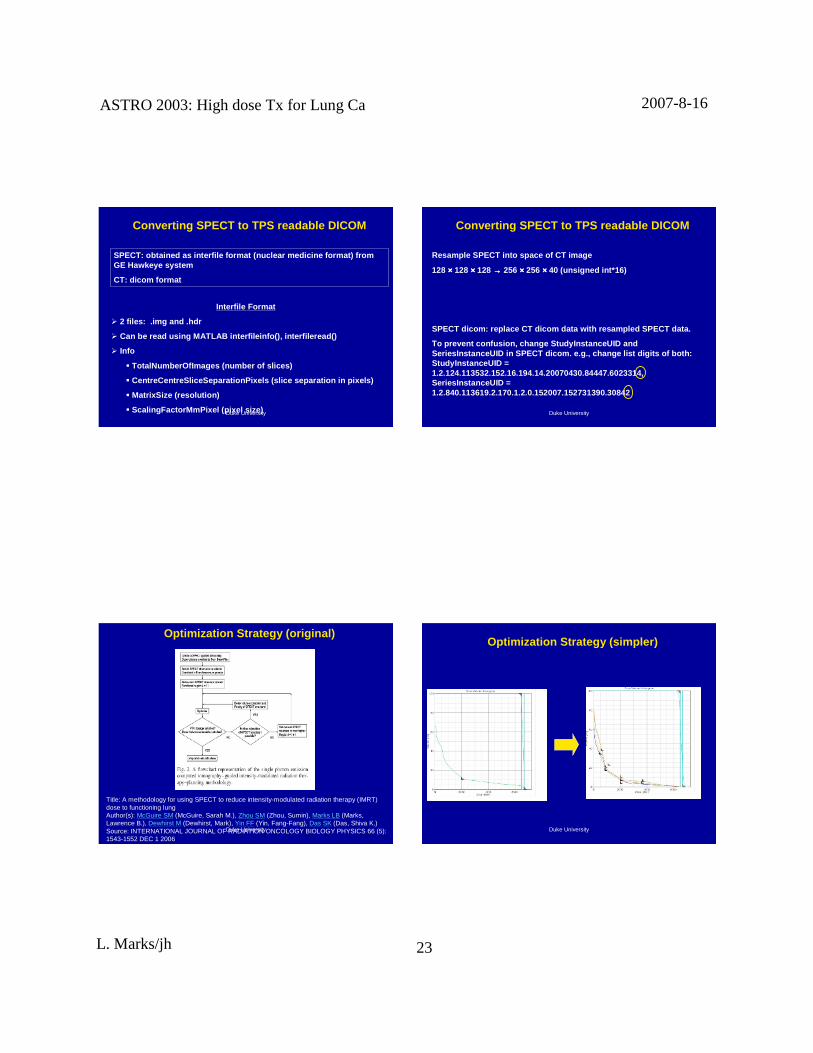
Converting SPECT to TPS readable DICOM
SPECT: obtai ned as interfi le form at (nucle ar medici ne form at) fromGE Hawkeye system
CT: dicom format
Interfile Format
� 2 fil es: .img and .hdr
� Can be read usin g MATLAB interfi lei nfo(), inte rfil eread()
� Info
� TotalNum berOfI mages (number of slic es)
� Centr eCentreSl iceSep arationPixels (sl ice separa tion in pi xels)
� MatrixSize (resolution )
� ScalingFactorMmPix el (pixel size) Duke University
Converting SPECT to TPS readable DICOM
Resample SPECT into sp ace of CT image
128 ×××× 128 ×××× 128 →→→→ 256 ×××× 256 ×××× 40 (unsigned int*16)
SPECT dicom: replac e CT dico m data with resampled SPECT data.
To prevent conf usion , chang e StudyInstan ceUID andSeriesInstanceUID in SPECT dicom. e.g., change list digi ts of both:StudyInstanceUI D =1.2.124.113532.152.16.194.14.20070430.84447.6023314,SeriesInstanceUID =1.2.840.113619.2.170.1.2.0.152007.152731390.30842
Duke University
Optimization Strateg y (orig inal)
Title: A methodology for using SPECT to reduce intensity-modulated radiation therapy (IMRT)dose to functioning lungAuthor(s): McGuire SM (McGuire, Sarah M.), Zhou SM (Zhou, Sumin), Marks LB (Marks,Lawrence B.), Dewhirst M (Dewhirst, Mark), Yin FF (Yin, Fang-Fang), Das SK (Das, Shiva K.)Source: INTERNATIONAL JOURNAL OF RADIATION ONCOLOGY BIOLOGY PHYSICS 66 (5):1543-1552 DEC 1 2006
Duke University
Optimization Strategy (simpl er)

ASTRO2003:High doseTx for LungCa 2007-8-16
L. Marks/jh 24
Duke University
BEAM DIRECTION SELECTION IS IMPORTANT FOR SPECT AVOIDANCE
Duke University
Highest SPECT activ it y region
Duke University
2 Highes t SPECT activity regions
Duke University
3 Highest SPECT activ ity regions
ASTRO2003:High doseTx for LungCa 2007-8-16
L. Marks/jh 25
Duke University
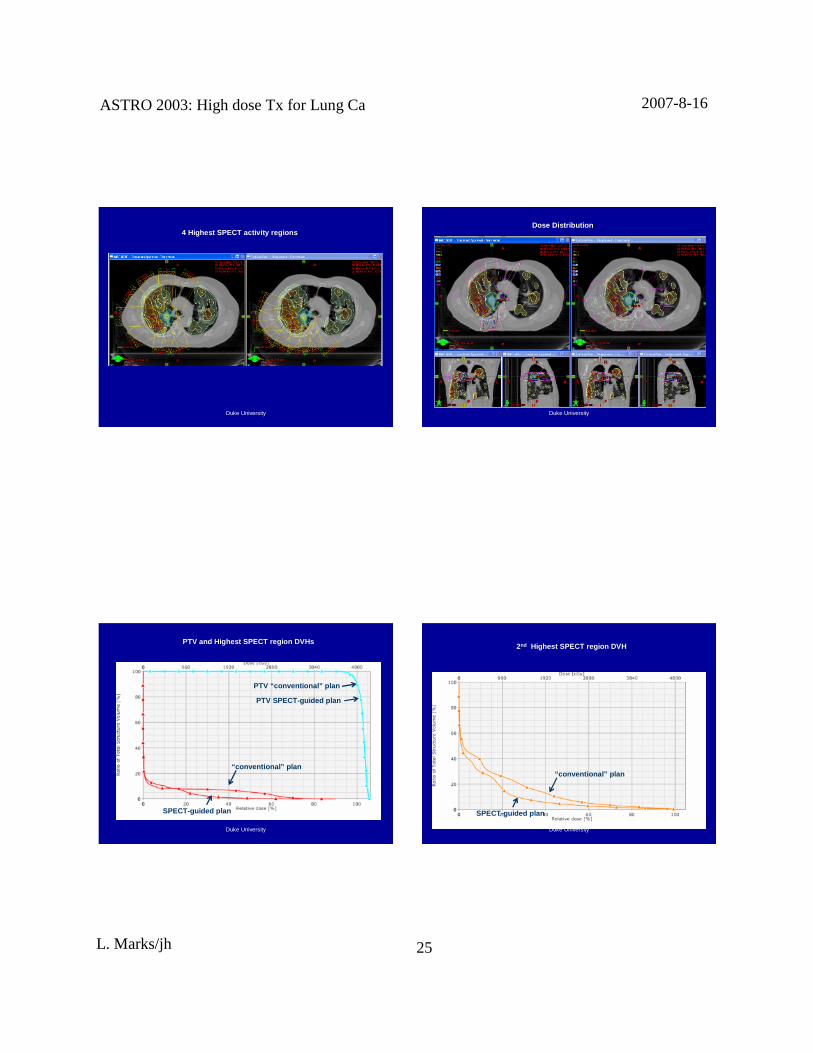
4 Highes t SPECT activity regions
Duke University
Dose Distrib ution
Duke University
PTV and Highe st SPECT region DVHs
“conven tional ” plan
SPECT-guided plan
PTV “ conventional ” plan
PTV SPECT-guided plan
Duke University
2nd Highes t SPECT region DVH
“conven tional ” plan
SPECT-guide d plan

ASTRO2003:High doseTx for LungCa 2007-8-16
L. Marks/jh 26
Duke University
3rd Highest SPECT region DVH
“ conventi onal ” plan
SPECT-guided plan
Duke University
4th Highest SPECT region DVH
“ convention al” plan
SPECT-guide d plan
Duke University
DVH of remaining minim ally perf used lung
“c onventional ” plan
SPECT-guided plan
Duke University
DVH of all lung
“co nventiona l” plan
SPECT-guide d plan
ASTRO2003:High doseTx for LungCa 2007-8-16
L. Marks/jh 27
Duke University
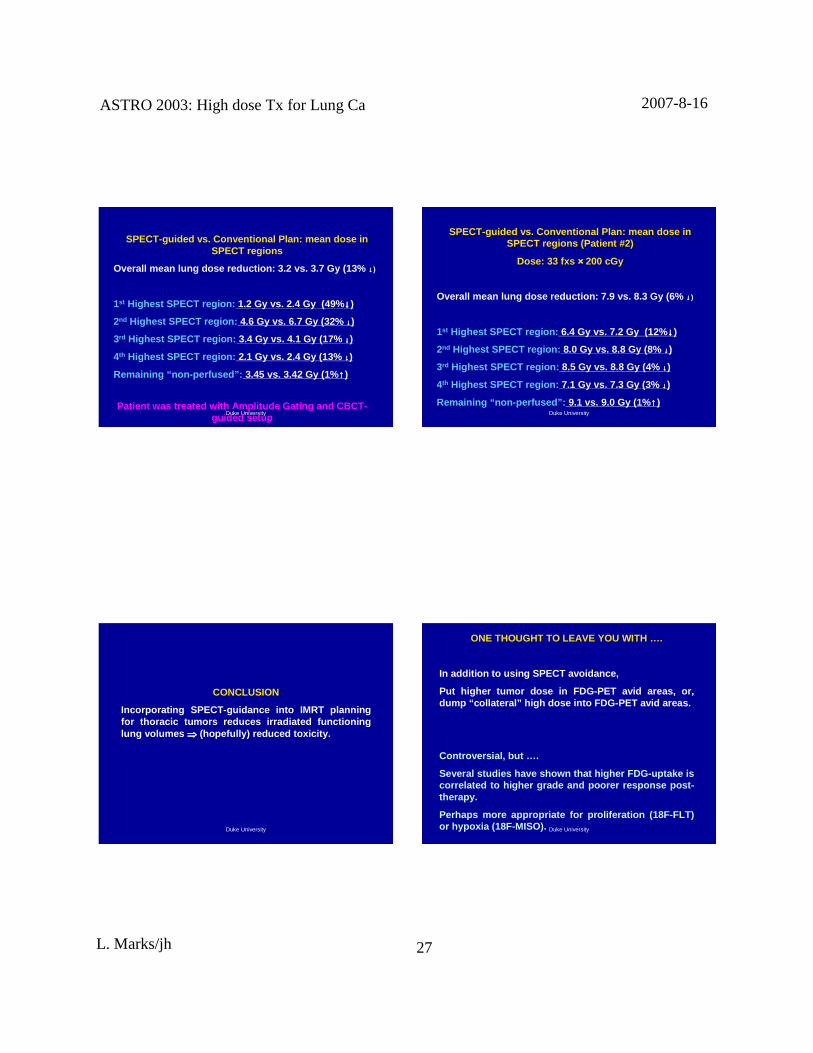
SPECT-guided vs. Convent ion al Plan: mean dose inSPECT regions
Overall mean lung dose redu ct ion: 3.2 vs. 3.7 Gy (13% ↓↓↓↓ )
1st Highest SPECT region: 1.2 Gy vs. 2.4 Gy (49%↓↓↓↓ )
2nd Highest SPECT regio n: 4.6 Gy vs. 6.7 Gy (32% ↓↓↓↓)
3rd Highest SPECT regio n: 3.4 Gy vs. 4.1 Gy (17% ↓↓↓↓)
4th Highest SPECT region : 2.1 Gy vs. 2.4 Gy (13% ↓↓↓↓)
Remaining “non -perfu sed”: 3.45 vs. 3.42 Gy (1%↑↑↑↑ )
Patient was treate d with Amplit ude Gating and CBCT-guided setup
Duke University
SPECT-guided vs. Convent ional Plan: mean dose inSPECT regions (Patient #2)
Dose: 33 fxs ×××× 200 cGy
Overall mean lung dose redu ctio n: 7.9 vs. 8.3 Gy (6% ↓↓↓↓ )
1st Highest SPECT region: 6.4 Gy vs. 7.2 Gy (12%↓↓↓↓ )
2nd Highest SPECT regio n: 8.0 Gy vs. 8.8 Gy (8% ↓↓↓↓)
3rd Highest SPECT regio n: 8.5 Gy vs. 8.8 Gy (4% ↓↓↓↓)
4th Highest SPECT region : 7.1 Gy vs. 7.3 Gy (3% ↓↓↓↓)
Remaining “ non -perfu sed”: 9.1 vs. 9.0 Gy (1%↑↑↑↑ )
Duke University
CONCLUSION
Incorporating SPECT-guid ance into IMRT planningfor thoracic tumors redu ces irradiat ed funct ioninglung volumes ⇒⇒⇒⇒ (hopefully) reduced toxicit y.
Duke University
ONE THOUGHT TO LEAVE YOU WITH ….
In addition to using SPECT avoid ance,
Put high er tumor dose in FDG-PET avid areas, or,dump “ collateral ” hig h dose int o FDG-PET avid areas.
Controversial, but ….
Several studies have shown that hig her FDG-uptake iscorrelated to higher grade and poo rer respo nse post -therapy.
Perhaps more appro priate for proliferatio n (18F-FLT)or hypox ia (18F-MISO).
ASTRO2003:High doseTx for LungCa 2007-8-16
L. Marks/jh 28
Duke University
axial sagittal
corona l
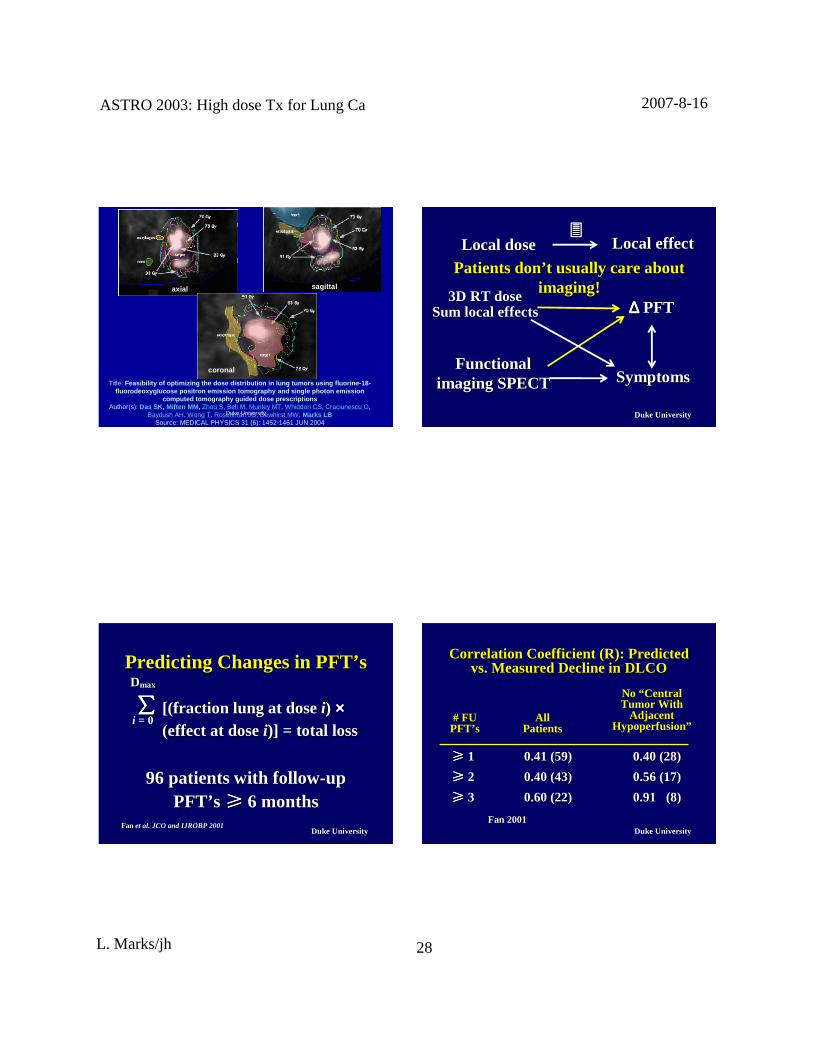
Title: Feasibil ity of opti mizi ng the dose distribution in lung tumors using fluorine -18-fluoro deoxyg luc ose positron emission tomography and single photo n emission
computed tomography guide d dose prescrip tionsAuthor(s): Das SK, Miften MM, Zhou S, Bell M, Munley MT, Whiddon CS, Craciunescu O,
Baydush AH, Wong T, Rosenman JG, Dewhirst MW, Marks LBSource: MEDICAL PHYSICS 31 (6): 1452-1461 JUN 2004
Duke UniversityDuke University
Local doseLocal dose Local effectLocal effect
3D RT dose3D RT doseSum local effectsSum local effects ∆∆∆∆∆∆∆∆ PFTPFT
FunctionalFunctionalimaging SPECTimaging SPECT SymptomsSymptoms
Patients donPatients don’’ t usually care aboutt usually care aboutimaging!imaging!
��������
Duke UniversityDuke University
Predicting ChangesinPredicting Changesin PFTPFT’’ ss
∑∑∑∑∑∑∑∑ [(fracti on lung at dose[(fract ion lung at doseii)) ××××××××(effect at dose(effect at doseii)] = total loss)] = total loss
96 patientswith follow96 patientswith follow--upupPFTPFT’’ ss≥≥≥≥≥≥≥≥ 6 months6 months
FanFan et al. JCO and IJROBP 2001et al. JCO and IJROBP 2001
DDmaxmax
ii = 0= 0
Duke UniversityDuke University
Corr elation Coefficient (R): PredictedCorrelation Coefficient (R): Predictedvsvs. Measured Decline in DLCO. Measured Declinein DLCO
≥≥≥≥≥≥≥≥ 11 0.41 (59)0.41(59) 0.40 (28)0.40 (28)
≥≥≥≥≥≥≥≥ 22 0.40 (43)0.40(43) 0.56 (17)0.56 (17)
≥≥≥≥≥≥≥≥ 33 0.60 (22)0.60(22) 0.91 (8)0.91 (8)
AllAllPatientsPatients
NoNo ““ CentralCentralTumor WithTumor With
AdjacentAdjacentHypoperfusionHypoperfusion””
# FU# FUPFTPFT’’ ss
Fan 2001Fan 2001
ASTRO2003:High doseTx for LungCa 2007-8-16
L. Marks/jh 29
Duke UniversityDuke University Duke UniversityDuke University
Duke UniversityDuke University
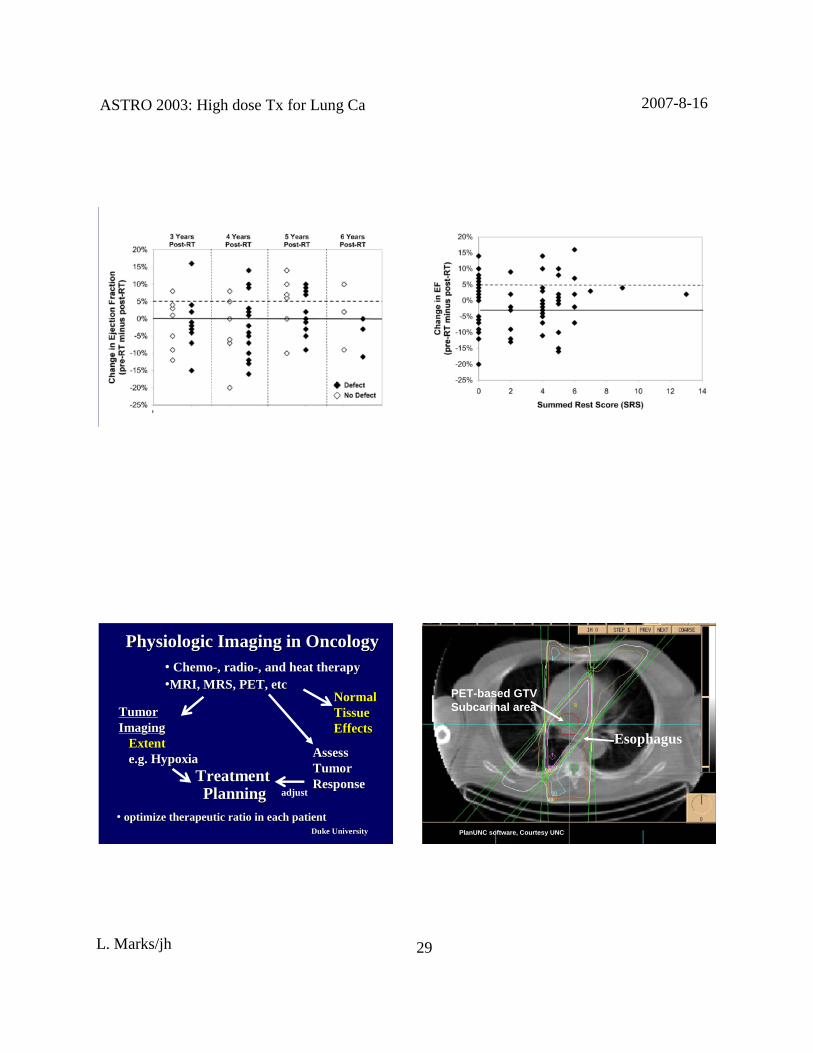
TreatmentTreatmentPlanningPlanning
Physiologic Imaging in OncologyPhysiologic Imaging in Oncology
NormalNormalTissueTissueEffectsEffects
AssessAssessTumorTumorResponseResponse
TumorTumorImagingImaging
ExtentExtente.g. Hypoxiae.g. Hypoxia
•• optimize therapeutic ratio in each patientoptimize therapeutic ratio in each patient
•• ChemoChemo--, radio, radio--, and heat therapy, and heat therapy••M RI, M RS,PET, etcMRI, MRS, PET, etc
adjust
Duke UniversityDuke UniversityPlanUNCPlanUNC software, Cour tesy UNCsoftware, Cour tesy UNC
Esophagus
PET-based GTVSubcarinal area
ASTRO2003:High doseTx for LungCa 2007-8-16
L. Marks/jh 30
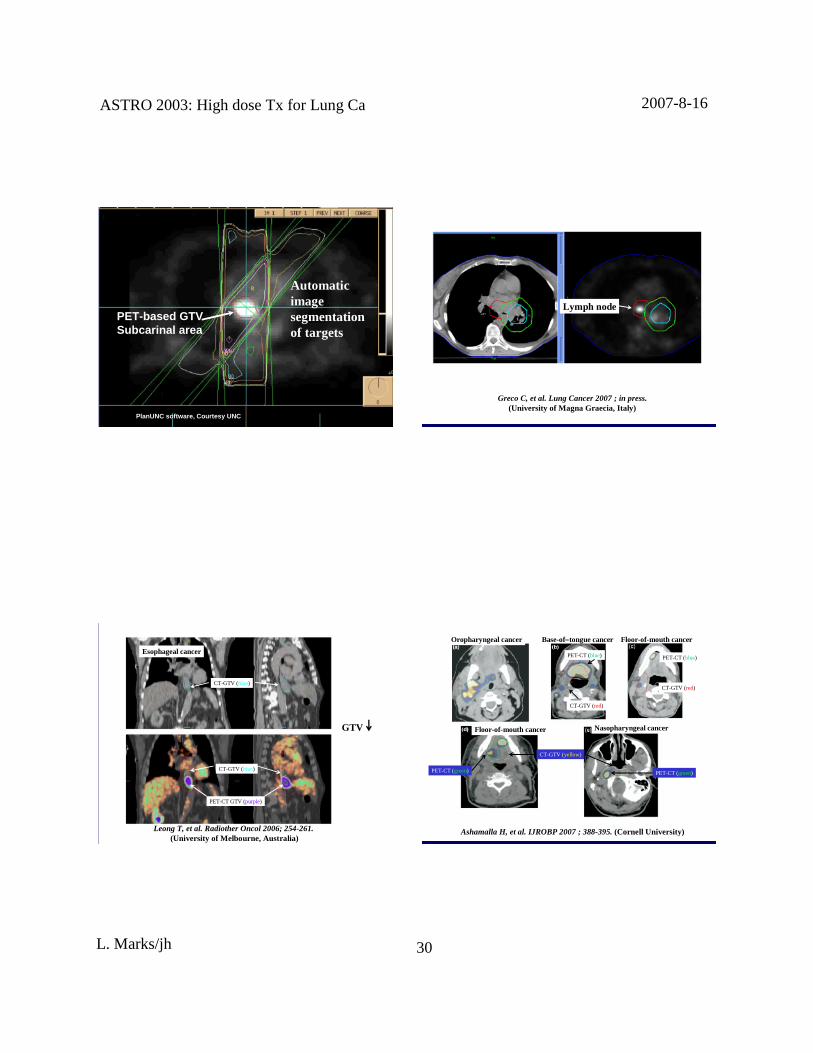
Duke UniversityDuke UniversityPlanUNCPlanUNC soft ware, Courtesy UNCsoftwa re, Courtesy UNC
PET-based GTVSubca rinal area
Automaticimagesegmentationof targets
Duke UniversityDuke University
Lymph node
GrecoC, et al. Lung Cancer 2007 ; in press.(University of Magna Graecia, Italy)
Duke UniversityDuke University
Esophagealcancer
CT-GTV (blue)
PET-CT GTV (purple)
CT-GTV (blue)
GTV
Leong T, et al. Radiother Oncol 2006; 254-261.(University of Melbourne, Australia)
Duke UniversityDuke University
Oropharyngealcancer Base-of–tonguecancer Floor-of-mouth cancer
Floor-of-mouth cancer Nasopharyngealcancer
CT-GTV (red)
PET-CT (blue) PET-CT (blue)
CT-GTV (red)
CT-GTV (yellow)
PET-CT (green) PET-CT (green)
AshamallaH, et al. IJROBP2007 ; 388-395. (Cornell University)

ASTRO2003:High doseTx for LungCa 2007-8-16
L. Marks/jh 31
Duke UniversityDuke UniversityDasSK, et al. Med Phys 2004; 1452-1461.
DasSK, et al. Med Phys 2004; 1452-1461.
(a): transverseslice(b): sagittalslice(c): coronal slice
Isodoselines(Gy) superimposed on sliceplanesthroughFDG-PET
CT vs PET-weightedEUD
Dosepainting- IMRT
Duke UniversityDuke University
Responders
Non-responders
Radiology; Meisamyet al., Nov, 2004Duke UniversityDuke University
Percent change lesiondiameterend of therapy
MRI-basedchangeearlyduringTx
Radiology; Meisamyet al., Nov, 2004
ASTRO2003:High doseTx for LungCa 2007-8-16
L. Marks/jh 32
Duke UniversityDuke University
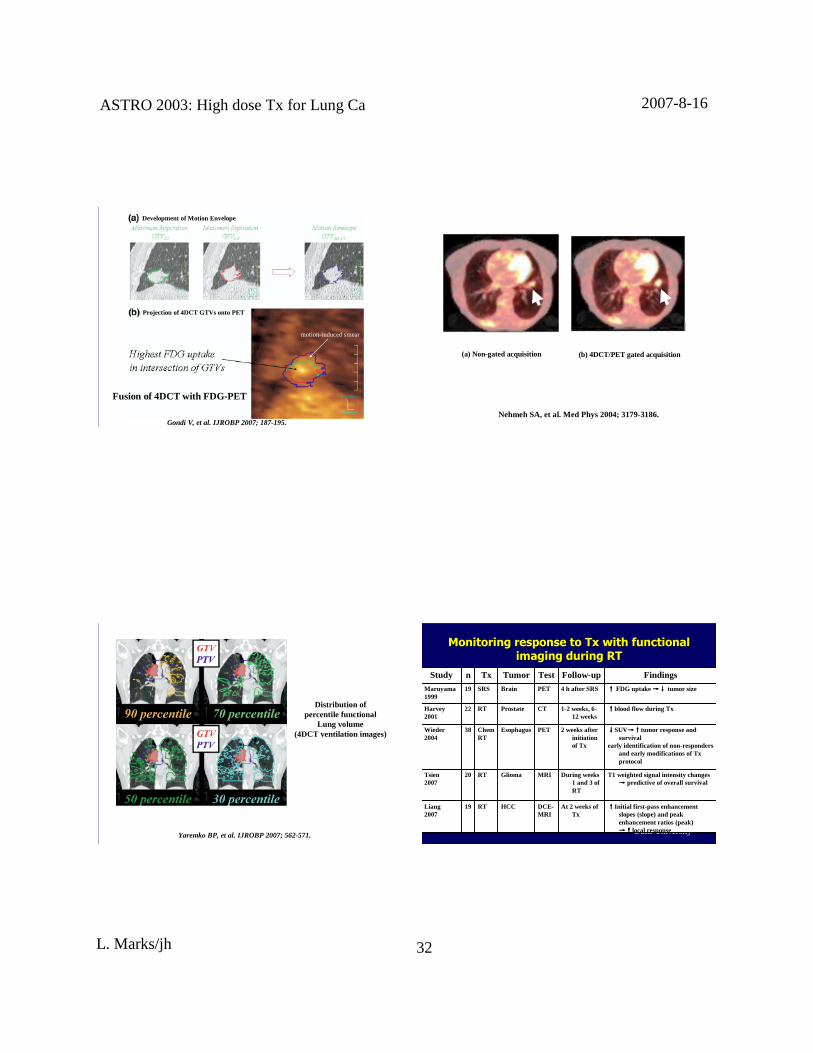
Fusion of 4DCT with FDG-PET
Development of Motion Envelope
Proj ection of 4DCT GTVs onto PET
motion-inducedsmear
Gondi V, et al. IJROBP 2007; 187-195.Duke UniversityDuke University
(a) Non-gatedacquisition (b) 4DCT/PET gatedacquisition
Nehmeh SA, et al. Med Phys 2004; 3179-3186.
Duke UniversityDuke University
Distrib ution ofpercentile functional
Lung volume(4DCT ventilation images)
Yaremko BP, et al. IJROBP 2007;562-571. Duke UniversityDuke University
Monitoring response to Monitoring response to TxTx with functional with functional imaging during RTimaging during RT
T1 weightedsignal intensity changes→→→→ predictive of overall survival
During weeks1 and 3 ofRT
MRIGliomaRT20Tsien2007
↑↑↑↑Initial first -passenhancementslopes (slope) and peakenhancementratios (peak)→↑→↑→↑→↑local response
At 2 weeks ofTx
DCE-MRI
HCCRT19Liang2007
↓↓↓↓SUV→↑→↑→↑→↑tumor responseandsurvival
early identification of non-respondersand early modifications of Txprotocol
2 weeks afterinitiati onof Tx
PETEsophagusChemRT
38Wieder2004
↑↑↑↑blood flow during Tx1-2 weeks,6-12 weeks
CTProstateRT22Harvey2001
↑↑↑↑ FDG uptake→↓→↓→↓→↓ tumor size4 h after SRSPETBrainSRS19Maruyama1999
FindingsFollow-upTestTumorTxnStudy
ASTRO2003:High doseTx for LungCa 2007-8-16
L. Marks/jh 33
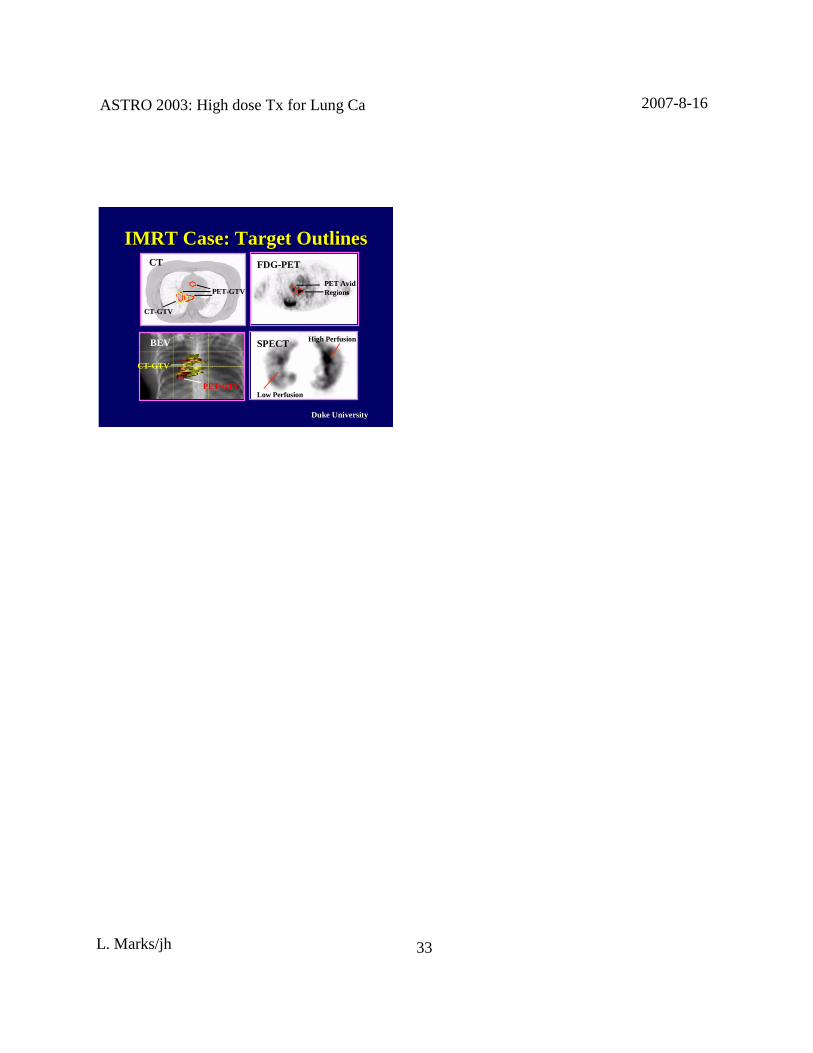
Duke UniversityDuke University
IMRT Case:Target OutlinesIM RT Case:Target Outli nes
BEV
PET-GTV
CT-GTV
High Perfusion
Low Perfusion
SPECT
PET-GTV
CT-GTV
CT
PET AvidRegions
FDG-PET