agency procedures for the derivation of equilibrium ... · derivation of equilibrium partitioning...
TRANSCRIPT
Procedures for the Derivation ofEquilibrium PartitioningSediment Benchmarks (ESBs)for the Protection of BenthicOrganisms: Endrin
United States Office of Research and Development EPA-600-R-02-009Environmental Protection Washington, DC 20460 www.epa.govAgency

EPA/600/R-02/009August 2003
Procedures for the Derivation ofEquilibrium Partitioning Sediment Benchmarks (ESBs)
for the Protection of Benthic Organisms: EndrinWalter J. Berry*
Robert M. Burgess**National Health and Environmental Effects Research Laboratory
Atlantic Ecology DivisionNarragansett, RI
David J. HansenHydroQual, Inc., Mahwah, NJ
Great Lakes Environmental Center, Traverse City, MI (formerly with U.S. EPA)
Dominic M. DiToroManhattan College, Riverdale, NY; HydroQual, Inc.,
Mahwah, NJ
Laurie D. DeRosaHydroQual, Inc., Mahwah, NJ
Heidi E. Bell*Mary C. Reiley
Office of Water, Washington, DC
Frank E. Stancil, Jr.National Exposure Research Laboratory
Ecosystems Research DivisionAthens, GA
Christopher S. ZarbaOffice of Research and Development, Washington, DC
David R. MountRobert L. Spehar
National Health and Environmental Effects Research LaboratoryMid-Continent Ecology Division
Duluth, MN
* Principle U.S. EPA Contacts** Document Editor
U.S. Environmental Protection AgencyOffice of Research and Development
National Health and Environmental Effects Research LaboratoryAtlantic Ecology Division, Narragansett, RI
Mid-Continent Ecology Division, Duluth, MN

Foreword
ii
NoticeThe Office of Research and Development (ORD) has produced this document to provide procedures for thederivation of equilibrium partitioning sediment benchmarks (ESBs) for the insecticide endrin. ESBs may beuseful as a complement to existing sediment assessment tools. This document should be cited as:
U.S. EPA. 2003. Procedures for the Derivation of Equilibrium Partitioning SedimentBenchmarks (ESBs) for the Protection of Benthic Organisms: Endrin. EPA-600-R-02-009.Office of Research and Development. Washington, DC 20460
The information in this document has been funded wholly by the U.S. Environmental Protection Agency. Ithas been subject to the Agency’s peer and administrative review, and it has been approved for publication asan EPA document.
Mention of trade names or commercial products does not constitute endorsement or recommendation for use.
AbstractThis equilibrium partitioning sediment benchmark (ESB) document describes procedures to deriveconcentrations of the insecticide endrin in sediment which are protective of the presence of benthicorganisms. The equilibrium partitioning (EqP) approach was chosen because it accounts for the varyingbiological availability of chemicals in different sediments and allows for the incorporation of the appropriatebiological effects concentration. This provides for the derivation of benchmarks that are causally linked tothe specific chemical, applicable across sediments, and appropriately protective of benthic organisms.
EqP can be used to calculate ESBs for any toxicity endpoint for which there are water-only toxicity data; it isnot limited to any single effect endpoint. For the purposes of this document, the Final Chronic Value (FCV)from the Water Quality Criterion (WQC) for endrin was used as the toxicity benchmark. This value isintended to be the concentration of a chemical in water that is protective of the presence of aquatic life. TheESBWQC is derived by multiplying the FCV by the chemical’s KOC, yielding the concentration in sediment(normalized to organic carbon) that should provide the same level of protection in sediment that the FCVprovides in water. For endrin, this concentration is 5.4 µg endrin/gOC for freshwater sediments and 0.99 µg/gOC for saltwater sediments. Confidence limits of 2.4 to 12 µg/gOC for freshwater sediments and 0.44 to 2.2 µg/gOC for saltwater sediments were calculated using the uncertainty associated with the degree to which toxicitycould be predicted by multiplying the KOC and the water-only effects concentration. The ESBWQCs should beinterpreted as chemical concentrations below which adverse effects are not expected. At concentrationsabove the ESBWQCs, effects may occur with increasing severity as the degree of exceedance increases.
The ESBs do not consider the antagonistic, additive or synergistic effects of other sediment contaminants incombination with endrin or the potential for bioaccumulation and trophic transfer of endrin to aquatic life,wildlife or humans.
Equilibrium Partitioning Sediment Benchmarks (ESBs): Endrin
Equilibrium Partitioning Sediment Benchmarks (ESBs): Endrin
iii
ForewordUnder the Clean Water Act (CWA), the U.S. Environmental Protection Agency (EPA) and theStates develop programs for protecting the chemical, physical, and biological integrity of thenation’s waters. To support the scientific and technical foundations of the programs, EPA’s Officeof Research and Development has conducted efforts to develop and publish equilibriumpartitioning sediment benchmarks (ESBs) for some of the 65 toxic pollutants or toxic pollutantcategories. Toxic contaminants in bottom sediments of the nation’s lakes, rivers, wetlands, andcoastal waters create the potential for continued environmental degradation even where watercolumn contaminant levels meet applicable water quality standards. In addition, contaminatedsediments can lead to water quality impacts, even when direct discharges to the receiving waterhave ceased.
The ESBs and associated methodology presented in this document provide a means to estimate theconcentrations of a substance that may be present in sediment while still protecting benthicorganisms from the effects of that substance. These benchmarks are applicable to a variety offreshwater and marine sediments because they are based on the biologically availableconcentration of the substance in the sediments. These ESBs are intended to provide protection tobenthic organisms from direct toxicity due to this substance. In some cases, the additive toxicityfor specific classes of toxicants (e.g., metal mixtures or polycyclic aromatic hydrocarbonmixtures) is addressed. The ESBs do not consider the antagonistic, additive or synergistic effectsof other sediment contaminants in combination with endrin or the potential for bioaccumulationand trophic transfer of endrin to aquatic life, wildlife or humans.
ESBs may be useful as a complement to existing sediment assessment tools, to help assess theextent of sediment contamination, to help identify chemicals causing toxicity, and to serve astargets for pollutant loading control measures.
This document provides technical information to EPA Regions, States, the regulated community,and the public. It does not substitute for the CWA or EPA’s regulations, nor is it a regulationitself. Thus, it cannot impose legally binding requirements on EPA, States, or the regulatedcommunity. EPA and State decisionmakers retain the discretion to adopt approaches on a case-by-case basis that differ from this technical information where appropriate. EPA may change thistechnical information in the future. This document has been reviewed by EPA’s Office of Researchand Development (Mid-Continent Ecology Division, Duluth, MN; Atlantic Ecology Division,Narragansett, RI), and approved for publication.
Mention of trade names or commercial products does not constitute endorsement orrecommendation of use.
This is contribution AED-02-046 of the Office of Research and Development National Health andEnvironmental Effects Research Laboratory’s Atlantic Ecology Division.
Front cover image provided by Wayne R. Davis and Virginia Lee.

Foreword
iv

Equilibrium Partitioning Sediment Benchmarks (ESBs): Endrin
v
ContentsNotice ............................................................................................. ii
Abstract .......................................................................................... ii
Forward .......................................................................................... iii
Acknowledgments .......................................................................... ix
Executive Summary ....................................................................... xi
Glossary .......................................................................................xiii
Section 1Introduction .................................................................................. 1-11.1 General Information .................................................................................................... 1-11.2 General Information: Endrin ........................................................................................ 1-21.3 Applications of Sediment Benchmarks ....................................................................... 1-31.4 Overview ..................................................................................................................... 1-4
Section 2Partitioning ...................................................................................................................... 2-12.1 Description of EqP Methodology ............................................................................... 2-12.2 Determination of KOW for Endrin ................................................................................ 2-22.3 Derivation of KOC from Adsorption Studies ............................................................... 2-2
2.3.1 KOC from Particle Suspension Studies ......................................................... 2-22.3.2 KOC from Sediment Toxicity Tests ................................................................ 2-3
2.4 Summary of Derivation of KOC for Endrin .................................................................. 2-4
Section 3Toxicity of Endrin in Water Exposures ......................................... 3-13.1 Derivation of Endrin WQC .......................................................................................... 3-13.2 Acute Toxicity in Water Exposures ............................................................................ 3-13.3 Chronic Toxicity in Water Exposures .......................................................................... 3-13.4 Applicability of the WQC as the Effects Concentration
for Derivation of Endrin ESBWQCs. ............................................................................ 3-5
Section 4Actual and Predicted Toxicity of Endrinin Sediment Exposures ................................................................. 4-14.1 Toxicity of Endrin in Sediments ................................................................................... 4-14.2 Correlation Between Organism Response and Interstitial Water Concentration ......... 4-44.3 Tests of the Equilibrium Partitioning Prediction of Sediment Toxicity ......................... 4-6

Contents
vi
Section 5Derivation of Endrin ESBWQCs ........................................................ 5-15.1 Derivation of ESBWQCs. ............................................................................. 5-15.2 Uncertainty Analysis .................................................................................................. 5-25.3 Comparison of Endrin ESBWQCs and Uncertainty Concentrations to Sediment
Concentrations that are Toxic or Predicted to be Chronically Acceptable .................. 5-35.4 Comparison of Endrin ESBWQCs to STORET and Corps of Engineers,
San Francisco Bay Databases for Sediment Endrin ..................................................... 5-65.5 Limitations to the Applicability of ESBWQCs ................................................................ 5-9
Section 6Sediment Benchmark Values: Application and Interpretation ....... 6-16.1 Benchmarks ................................................................................................................ 6.16.2 Considerations in the Application and Interpretation ESB ........................................ 6-1
6.2.1 Relationship of ESBWQC to Expected Effects .................................................... 6-16.2.2 Use of EqP to Develop Alternative Benchmarks .............................................. 6-16.2.3 Influence of Unusual Forms of Sediment Organic Carbon ............................... 6-26.2.4 Relationship to Risks Mediated throughBioaccumulation and Trophic Transfer ...................................................................... 6-26.2.5 Exposures to Chemical Mixtures ....................................................................... 6-26.2.6 Interpreting ESBs in Combinations with Toxicity Tests ................................... 6-2
6.3 Summary ...................................................................................................................... 6-3
Section 7References .................................................................................... 7-1
Appendix A ................................................................................. A-1
Appendix B .................................................................................. B-1
Appendix C .................................................................................. C-1

Equilibrium Partitioning Sediment Benchmarks (ESBs): Endrin
vii
Tables
Table 2-1. Endrin measured and estimated log10KOW values ............................................................................... 2-2
Table 3-1. Test-specific data for chronic sensitivity of freshwater and saltwaterorganisms to endrin ............................................................................................................................. 3-4
Table 3-2. Summary of freshwater and saltwater acute and chronic values, acute–chronic ratios, andderivation of final acute values, final acute–chronic ratios, and final chronic values for endrin ........ 3-5
Table 3-3. Results of approximate randomization (AR) test for the equality of the freshwater and saltwaterFAV distributions for endrin and AR test for the equality of benthic and combined benthicand water column WQC FAV distributions .......................................................................................... 3-6
Table 4-1. Summary of tests with endrin-spiked sediment ................................................................................... 4-2
Table 4-2. Water-only and sediment LC50 values used to test the applicability of the EqP theory for endrin .... 4-7
Table 5-1. Equilibrium partitioning sediment benchmarks (ESBWQCs) for endrin using the WQC FCVas the effect concentration .................................................................................................................. 5-1
Table 5-2. Analysis of variance for derivation of confidence limits of the ESBWQCss for endrin ......................... 5-3
Table 5-3. Confidence limits of the ESBWQCs for endrin ....................................................................................... 5-3
Figures
Figure 1-1. Chemical structure and physical-chemical properties of endrin .......................................................... 1-3
Figure 2-1. Observed versus predicted partition coefficients for nonionic organic chemicalsusing Equation 2-4 ............................................................................................................................... 2-3
Figure 2-2. Organic carbon–normalized sorption isotherm for endrin and probability plotof KOC from sediment toxicity tests ..................................................................................................... 2-4
Figure 3-1. Genus mean acute values from water-only acute toxicity tests using freshwater speciesversus percentage rank of their sensitivity ......................................................................................... 3-2
Figure 3-2. Genus mean acute values from water-only acute toxicity tests using saltwater speciesversus percentage rank of their sensitivity ......................................................................................... 3-3
Figure 3-3. Probability distribution of FAV difference statistics to compare water-only data from freshwaterversus saltwater, benthic versus WQC freshwater, and benthic versusWQC saltwater data ............................................................................................................................. 3-7
Figure 4-1. Percent mortality of amphipods in sediments spiked with acenaphthene or phenanthrene, endrin,or fluoranthene, and midge in sediments spiked with kepone relative to interstitialwater toxic units ................................................................................................................................... 4-5
Figure 4-2. Percent mortality of amphipods in sediments spiked with acenaphthene or phenanthrene,dieldrin, endrin, or fluoranthene, and midge in sediments spiked with dieldrin relativeto predicted sediment toxic units ......................................................................................................... 4-8
Contents
viii
Figure 5-1. Predicted genus mean chronic values (PGMCV) calculated from water-only toxicity valuesusing freshwater species versus percentage rank of their sensitivity ................................................. 5-4
Figure 5-2. Predicted genus mean chronic values (PGMCV) calculated from water-only toxicity valuesusing saltwater species versus percentage rank of their sensitivity ................................................... 5-5
Figure 5-3. Probability distribution of concentrations of endrin in sediments from streams, lakes,and estuaries in the United States from 1986 to 1990 from the STORET database comparedwith the endrin ESBWQCs values ........................................................................................................... 5-7
Figure 5-4. Probability distribution of organic carbon–normalized sediment endrin concentrations fromthe U.S. Army Corps of Engineers (1991) monitoring program of San Francisco Bay ........................ 5-8

Equilibrium Partitioning Sediment Benchmarks (ESBs): Endrin
ix
AcknowledgmentsCoauthors
Walter J. Berry* U.S. EPA, NHEERL, Atlantic Ecology Division,Narragansett, RI
Robert M. Burgess U.S. EPA, NHEERL, Atlantic Ecology Division, Narragansett, RI
David J. Hansen HydroQual, Inc., Mahwah, NJ; Great Lakes EnvironmentalCenter, Traverse City, MI (formerly with U.S. EPA)
Dominic M. Di Toro Manhattan College, Riverdale, NY; HydroQual, Inc.,Mahwah, NJ
Laurie D. De Rosa HydroQual, Inc., Mahwah, NJ
Heidi E. Bell* U.S. EPA, Office of Water, Washington, DC
Mary C. Reiley U.S. EPA, Office of Water, Washington, DC
Frank E. Stancil, Jr. U.S. EPA, NERL, Ecosystems Research Division, Athens, GA
Christopher S. Zarba U.S. EPA, Office of Research and Development, Washington, DC
David R. Mount U.S. EPA, NHEERL, Mid-Continent Ecology Division, Duluth, MN
Robert L. Spehar U.S. EPA, NHEERL, Mid-Continent Ecology Division,Duluth, MN
Significant Contributors to the Development of the Approach and Supporting Science
Herbert E. Allen University of Delaware, Newark, DE
Gerald T. Ankley U.S. EPA, NHEERL, Mid-Continent Ecology Division,Duluth, MN
Christina E. Cowan The Procter & Gamble Co., Cincinnati, OH
Dominic M. Di Toro Manhattan College, Riverdale, NY; HydroQual, Inc.,Mahwah, NJ
David J. Hansen HydroQual, Inc., Mahwah, NJ; Great Lakes EnvironmentalCenter, Traverse City, MI (formerly with U.S. EPA)
Paul R. Paquin HydroQual, Inc., Mahwah, NJ
Spyros P. Pavlou Ebasco Environmental, Bellevue, WA
Richard C. Swartz Environmental consultant (formerly with U.S. EPA)
Nelson A. Thomas U.S. EPA, NHEERL, Mid-Continent Ecology Division,Duluth, MN (retired)
Christopher S. Zarba U.S. EPA, Office of Research and Development, Washington, DC
Technical Support and Document Review
Patricia DeCastro Computer Sciences Corporation, Narragansett, RI
Robert A. Hoke E.I. DuPont deNemours and Company, Newark, DE
Scott D. Ireland U.S. EPA, Office of Water, Washington, DC
Heinz P. Kollig U.S. EPA, NERL, Ecosystems Research Division, Athens, GA
Tyler K. Linton Great Lakes Environmental Center, Columbus, OH
Robert L. Spehar U.S. EPA, NHEERL, Mid-Continent Ecology Division, Duluth, MN
*Principal U.S. EPA contact

Foreword
x

Equilibrium Partitioning Sediment Benchmarks (ESBs): Endrin
xi
Executive SummaryThis equilibrium partitioning sediment benchmark (ESB) document describes procedures to deriveconcentrations of the insecticide endrin in sediment which are protective of the presence ofbenthic organisms. The equilibrium partitioning (EqP) approach was chosen because it accountsfor the varying biological availability of chemicals in different sediments and allows for theincorporation of the appropriate biological effects concentration. This provides for the derivationof benchmarks that are causally linked to the specific chemical, applicable across sediments, andappropriately protective of benthic organisms.
EqP theory holds that a nonionic chemical in sediment partitions between sediment organiccarbon, interstitial (pore) water and benthic organisms. At equilibrium, if the concentration inany one phase is known, then the concentrations in the others can be predicted. The ratio of theconcentration in water to the concentration in organic carbon is termed the organic carbonpartition coefficient (KOC), which is a constant for each chemical. The ESB Technical BasisDocument (U.S. EPA, 2003a) demonstrates that biological responses of benthic organisms tononionic organic chemicals in sediments are different across sediments when the sedimentconcentrations are expressed on a dry weight basis, but similar when expressed on a Fgchemical/g organic carbon basis (Fg/gOC). Similar responses were also observed across sedimentswhen interstitial water concentrations were used to normalize biological availability. TheTechnical Basis Document further demonstrates that if the effect concentration in water is known,the effect concentration in sediments on a Fg/gOC basis can be accurately predicted by multiplyingthe effect concentration in water by the chemical’s KOC.
EqP can be used to calculate ESBs for any toxicity endpoint for which there are water-onlytoxicity data; it is not limited to any single effect endpoint. For the purposes of this document,the Final Chronic Value (FCV) from the Water Quality Criterion (WQC) for endrin was used asthe toxicity benchmark. This value is intended to be the concentration of a chemical in water thatis protective of the presence of aquatic life. If an FCV is not available, a secondary chronic value(SCV) can be substituted. The ESBWQC is derived by multiplying the FCV by the chemical’s KOC,yielding the concentration in sediment (normalized to organic carbon) that should provide thesame level of protection in sediment that the FCV provides in water. Ancillary analysesconducted as part of this derivation suggest that the sensitivity of benthic/epibenthic organisms isnot significantly different from pelagic organisms; for this reason, the FCV and the resultingESBWQC should be fully applicable to benthic organisms. For endrin, this concentration is 5.4 Fgendrin/gOC for freshwater sediments and 0.99 Fg/gOC for saltwater sediments. Confidence limitsof 2.4 to 12 Fg/gOC for freshwater sediments and 0.44 to 2.2 Fg/gOC for saltwater sediments werecalculated using the uncertainty associated with the degree to which toxicity could be predicted bymultiplying the KOC and the water-only effects concentration. The ESBWQCs should be interpretedas chemical concentrations below which adverse effects are not expected. At concentrationsabove the ESBWQCs, effects may occur with increasing severity as the degree of exceedanceincreases. In principle, above the upper confidence limit effects are expected if the chemical isbioavailable as predicted by EqP theory. A sediment-specific site assessment would providefurther information on chemical bioavailability and the expectation of toxicity relative to theESBWQCs and associated uncertainty limits.
As discussed, while this document uses the WQC value, the EqP methodology can be used byenvironmental managers to derive a benchmark with any desired level of protection, so long asthe water-only concentration affording that level of protection is known. Therefore, the resultingbenchmark can be species or site-specific if the corresponding water-only information is available.For example, if a certain water-only effects concentration is known to be protective for an
Contents
xii
economically important benthic species, the organic carbon-normalized sediment concentrationprotective for that benthic species could be derived using the effects concentration and thepartition coefficient. Such a benchmark might be considered as providing “site-specificprotection” for a species or endpoint, if the goal is to derive a benchmark for that particular siteor species. Another way to make an ESB site-specific would be to incorporate information onunusual partitioning, if suspected, at the site (see U.S. EPA 2003b).
The ESBs do not consider the antagonistic, additive or synergistic effects of other sedimentcontaminants in combination with endrin or the potential for bioaccumulation and trophic transferof endrin to aquatic life, wildlife or humans. Consistent with the recommendations of EPA’sScience Advisory Board, publication of these documents does not imply the use of ESBs as stand-alone, pass-fail criteria for all applications; rather, ESB exceedances could be used to trigger thecollection of additional assessment data. ESBs apply only to sediments having $0.2% organiccarbon by dry weight.
Tier 1 and Tier 2 ESB values were developed to reflect differing degrees of data availability anduncertainty. Tier 1 ESBs have been derived for endrin in this document, and for the nonionicorganic insecticide dieldrin, metal mixtures, and polycyclic aromatic hydrocarbon (PAH) mixturesin U.S. EPA (2003c, d, e). Tier 2 ESBs are reported in U.S. EPA (2003f).
Equilibrium Partitioning Sediment Benchmarks (ESBs): Endrin

Equilibrium Partitioning Sediment Benchmarks (ESBs): Endrin
xiii
Glossary of AbbreviationsACR Acute–chronic ratio
ANOVA Analysis of variance
AR Approximate randomization
CFR Code of Federal Regulations
CWA Clean Water Act
DOC Dissolved organic carbon
EC50 Chemical concentration estimated to cause adverse effects to 50% of the testorganisms within a specified time period
EPA United States Environmental Protection Agency
EqP Equilibrium partitioning
ESB Equilibrium partitioning sediment benchmark; for nonionic organics, thisterm usually refers to a value that is organic carbon–normalized (more formallyESBOC) unless otherwise specified
ESBOC Organic carbon–normalized equilibrium partitioning sediment benchmark
ESBWQC Equilibrium partitioning sediment benchmark derived based on the WaterQuality Criteria for a specific chemical
ESBWQCdry wt Dry weight–normalized equilibrium partitioning sediment benchmark derivedbased on the Water Quality Criteria for a specific chemical
ESBWQCOC Organic carbon normalized equilibrium partitioning sediment benchmarkderived based on the Water Quality Ctieria for a specific chemical
F1 First progeny generation
FACR Final acute–chronic ratio
FAV Final acute value
FCV Final chronic value
FDA U.S. Food and Drug Administration
fOC Fraction of organic carbon in sediment
FRV Final residue value
GMAV Genus mean acute value
gOC Gram organic carbon
HECD U.S. EPA, Health and Ecological Criteria Division
HMAV Habitat mean acute value
Glossary
xiv
IUPAC International Union of Pure and Applied Chemistry
IWTU Interstitial water toxic unit
KOC Organic carbon–water partition coefficient
KOW Octanol–water partition coefficient
KP Sediment–water partition coefficient
LC50 The concentration estimated to be lethal to 50% of the test organismswithin a specified time period
LC50S,OC Organic carbon–normalized LC50 from sediment exposure
LC50W LC50 from water-only exposure
NAS National Academy of Sciences
NERL U.S. EPA, National Exposure Research Laboratory
NHEERL U.S. EPA, National Health and Environmental Effects ResearchLaboratory
NOEC No observed effect concentration
NTIS National Technical Information Service
OC Organic carbon
OEC Observed effect concentration
OST U.S. EPA, Office of Science and Technology
PAH Polycyclic aromatic hydrocarbon
PGMCV Predicted genus mean chronic value
PSTU Predicted sediment toxic unit
SCV Secondary chronic value
SE Standard error
SMACR Species mean acute–chronic ratio
STORET EPA’s computerized database for STOrage and RETrieval ofwater-related data
TOC Total organic carbon
TU Toxic unit
WQC Water quality criteria

Equilibrium Partitioning Sediment Benchmarks (ESBs): Endrin
1-1
Section 1
Introduction1.1 General Information
Toxic pollutants in bottom sediments of thenation’s lakes, rivers, wetlands, estuaries, and marinecoastal waters create the potential for continuedenvironmental degradation even where water columnconcentrations comply with established WQC. Inaddition, contaminated sediments can be a significantpollutant source that may cause water qualitydegradation to persist, even when other pollutantsources are stopped. The absence of defensible ESBsmake it difficult to accurately assess the extent of theecological risks of contaminated sediments and toidentify, prioritize, and implement appropriate cleanupactivities and source controls.
As a result of the need for a procedure to assistregulatory agencies in making decisions concerningcontaminated sediment problems, the EPA Office ofScience and Technology, Health and EcologicalCriteria Division (OST/HECD) and Office of Researchand Development National Health and EnvironmentalEffects Research Laboratory (ORD/NHEERL)established a research team to review alternativeapproaches (Chapman, 1987). All of theapproaches reviewed had both strengths andweaknesses, and no single approach was found to beapplicable for the derivation of benchmarks in allsituations (U.S. EPA, 1989a). The EqP approach wasselected for nonionic organic chemicals because itpresented the greatest promise for generatingdefensible, national, numeric chemical-specificbenchmarks applicable across a broad range ofsediment types. The three principal observations thatunderlie the EqP approach to establishing sedimentbenchmarks are as follows:
1. The concentrations of nonionic organic chemicalsin sediments, expressed on an organic carbonbasis, and in interstitial waters correlate toobserved biological effects on sediment-dwellingorganisms across a range of sediments.
2. Partitioning models can relate sedimentconcentrations for nonionic organic chemicals onan organic carbon basis to freely-dissolvedconcentrations in interstitial water.
3. The distribution of sensitivities of benthicorganisms to chemicals is similar to that of watercolumn organisms; thus, the currently establishedWQC FCV or SCV can be used to define theacceptable effects concentration of a chemicalfreely-dissolved in interstitial water.
The EqP approach, therefore, assumes that (1) thepartitioning of the chemical between sediment organiccarbon and interstitial water is at or near equilibrium;(2) the concentration in either phase can be predictedusing appropriate partition coefficients and themeasured concentration in the other phase (assumingthe freely-dissolved interstitial water concentration canbe accurately measured); (3) organisms receiveequivalent exposure from water-only exposures or fromany equilibrated phase: either from interstitial watervia respiration, from sediment via ingestion or othersediment-integument exchange, or from a mixture ofexposure routes; (4) for nonionic chemicals, effectconcentrations in sediments on an organic carbon basiscan be predicted using the organic carbon partitioncoefficient (KOC) and effects concentrations in water;(5) the FCV concentration is an appropriate effectsconcentration for freely-dissolved chemical ininterstitial water; and (6) ESBs derived as the productof the KOC and FCV are protective of benthicorganisms. ESB concentrations presented in thisdocument are expressed as Fg chemical/g sedimentorganic carbon (Fg/gOC) and not on an interstitial waterbasis because (1) interstitial water is difficult to sampleand (2) significant amounts of the dissolved chemicalmay be associated with dissolved organic carbon; thus,total concentrations in interstitial water mayoverestimate exposure.
Sediment benchmarks generated using the EqPapproach are suitable for use in providing technicalinformation to regulatory agencies because they are:

Introduction
1-2
1. Numeric values
2. Chemical specific
3. Applicable to most sediments
4. Predictive of biological effects
5. Protective of benthic organisms
ESBs are derived using the available scientific datato assess the likelihood of significant environmentaleffects to benthic organisms from chemicals insediments in the same way that the WQC are derivedusing the available scientific data to assess thelikelihood of significant environmental effects toorganisms in the water column. As such, ESBs areintended to protect benthic organisms from the effectsof chemicals associated with sediments and, therefore,only apply to sediments permanently inundated withwater, to intertidal sediment, and to sedimentsinundated periodically for durations sufficient to permitdevelopment of benthic assemblages. ESBs should notbe applied to occasionally inundated soils containingterrestrial organisms, nor should they be used toaddress the question of possible contamination of uppertrophic level organisms or the synergistic, additive, orantagonistic effects of multiple chemicals. Theapplication of ESBs under these conditions may resultin values lower or higher than those presented in thisdocument.
ESB values presented herein are the concentrationsof endrin in sediment that will not adversely affectmost benthic organisms. It is recognized that theseESB values may need to be adjusted to account forfuture data. They may also need to be adjusted becauseof site-specific considerations. For example, in spillsituations, where chemical equilibrium between waterand sediments has not yet been reached, sedimentchemical concentrations less than an ESB may poserisks to benthic organisms. This is because for spills,disequilibrium concentrations in interstitial andoverlying water may be proportionally higher relative tosediment concentrations. Research has shown that thesource or “quality” of total organic carbon (TOC) inthe sediment does not affect chemical binding (DeWittet al., 1992). However, the physical form of thechemical in the sediment may have an effect. At somesites, concentrations in excess of an ESB may not poserisks to benthic organisms because the compound maybe a component of a particulate such as coal or soot, orexceed solubility such as undissolved oil or chemical.In these situations, an ESB would be overly protectiveof benthic organisms and should not be used unless
modified using the procedures outlined in “Proceduresfor the Derivation of Site-Specific EquilibriumPartitioning Sediment Benchmarks (ESBs) for theProtection of Benthic Organisms” (U.S. EPA, 2003b).If the organic carbon has a low capacity (e.g., hair,sawdust, hide), an ESB would be underprotective. AnESB may also be underprotective where the toxicity ofother chemicals are additive with an ESB chemical orwhere species of unusual sensitivity occur at the site.
This document presents the theoretical basis andthe supporting data relevant to the derivation of ESBsfor endrin. The data that support the EqP approach forderiving ESBs for nonionic organic chemicals arereviewed by Di Toro et al. (1991) and EPA (U.S. EPA,2003a). Before proceeding through the following text,tables, and calculations, the reader should considerreviewing Stephan et al. (1985), U.S. EPA (1985) andU.S. EPA (2003a).
1.2 General Information: Endrin
Endrin is the common name of a “broad spectrum”organochlorine insecticide/rodenticide. It wasformulated for use as an emulsifiable concentrate, as awettable or dustable powder, or as a granular product.It has been used with a variety of crops includingcotton, tobacco, sugar cane, rice, and ornamentals.One of its major uses in the United States was forcontrol of Lepidoptera larvae on cotton. During the1970’s and early 1980’s its use was increasinglyrestricted until it was banned on October 10, 1984, inpart as a result of its observed toxicity to non-targetorganisms, bioaccumulation potential, and persistence[49 CFR 42792 (October 24, 1984)].
Structurally, endrin is a cyclic hydrocarbon having achlorine substituted methanobridge structure (Figure 1-1). It is similar to dieldrin, an endo-endo stereoisomer,and has similar physicochemical properties, except thatit is more easily degraded in the environment (Wang,1988). Endrin is a colorless crystalline solid at roomtemperature, having a melting point of about 235EC andspecific gravity of 1.7 g/cc at 20EC. It has a vaporpressure of 0.026 mPa (25EC) (Hartley and Kidd, 1987).
Endrin is toxic to non-target aquatic organisms,birds, bees, and mammals (Hartley and Kidd, 1987).The acute toxicity of endrin ranges from genus meanacute values (GMAVs) of 0.15 to 716.88 Fg/L forfreshwater organisms and 0.037 to 790 Fg/L forsaltwater organisms (Appendix A). There is littledifference between the acute and chronic toxicity of

Equilibrium Partitioning Sediment Benchmarks (ESBs): Endrin
1-3
endrin to aquatic species; acute–chronic ratios (ACRs)range from 1.881 to 4.720 for three species (see Table3-2 in Section 3.3). Endrin bioconcentrates in aquaticanimals from 1,450 to 10,000 times the concentration inwater (U.S. EPA, 1980). The WQC for endrin (U.S.EPA, 1980) was derived using a Final Residue Value(FRV) calculated using bioconcentration data and theFood and Drug Administration (FDA) action level toprotect marketability of fish and shellfish; therefore,the WQC is not “effects based.” In contrast, the ESBfor endrin is effects based. It is calculated from theFCV derived in Section 3.
1.3 Applications of Sediment Benchmarks
ESBs are meant to be used with direct toxicitytesting of sediments as a method of evaluationassuming the toxicity testing species is sensitive to thechemical of interest. They provide a chemical-by-chemical specification of what sediment concentrationsare protective of benthic aquatic life. The EqP methodshould be applicable to nonionic organic chemicalswith a KOW above 3.0. Examples of other chemicals towhich this methodology applies include dieldrin, metalmixtures (Cd, Cu, Pb, Ni, Ag, Zn), and polycyclicaromatic hydrocarbon (PAH) mixtures.
Figure 1-1. Chemical structure and physical-chemical properties of endrin (from Hartley and Kidd, 1987).

Introduction
1-4
For the toxic chemicals addressed by the ESBdocuments Tier 1 (U.S. EPA, 2003c, d, e, and thisdocument) and Tier 2 (U.S. EPA, 2003f) values weredeveloped to reflect the differing degrees of dataavailability and uncertainty. Tier 1 ESBs are morescientifically rigorous and data intensive than Tier 2ESBs. The minimum requirements to derive a Tier 1ESB include: (1) Each chemical‘s organic carbon-waterpartition coefficient (KOC) is derived from the octanol-water partition coefficient (KOW) obtained using theSPARC (SPARC Performs Automated Reasoning inChemistry) model (Karickhoff et al., 1991) and the KOW-KOC relationship from DiToro et al. (1991). This KOC
has been demonstrated to predict the toxic sedimentconcentration from the toxic water concentration withless uncertainty than KOC values derived using othermethods. (2) The FCV is updated using the mostrecent toxicological information and is based on theNational WQC Guidelines (Stephan et al., 1985). (3)EqP confirmation tests are conducted to demonstratethe accuracy of the EqP prediction that the KOC
multiplied by the effect concentration from a water-only toxicity test predicts the effect concentrationfrom sediment tests (Swartz, 1991; DeWitt et al., 1992).Using these specifications, Tier 1 ESBs have beenderived for the insecticide endrin in this document, thenonionic organic insecticide dieldrin (U.S. EPA, 2003c),metals mixtures (U.S. EPA, 2003d), and polycyclicaromatic hydrocarbon (PAH) mixtures (U.S. EPA,2003e). In comparison, the minimum requirements for aTier 2 ESB (U.S. EPA, 2003f) are less rigorous: (1) TheKOW for the chemical that is used to derive the KOC canbe from slow-stir, generator column, shake flask,SPARC or other sources. (2) FCVs can be frompublished or draft WQC documents, the Great LakesInitiative or developed from AQUIRE. Secondarychronic values (SCV) from Suter and Mabrey (1994) orother effects concentrations from water-only tests can
be also used. (3) EqP confirmation tests arerecommended, but are not required for the developmentof Tier 2 ESBs. Because of these lesser requirements,there is greater uncertainty in the EqP prediction of thesediment effect concentration from the water-onlyeffect concentration, and in the level of protectionafforded by Tier 2 ESBs. Examples of Tier 2 ESBs fornonionic organic chemicals are found in U.S. EPA(2003f).
1.4 Overview
Section 1 provides a brief review of the EqPmethodology and a summary of the physical-chemicalproperties and aquatic toxicity of endrin. Section 2reviews a variety of methods and data useful in derivingpartition coefficients for endrin and includes the KOCrecommended for use in deriving endrin ESBWQCs.Section 3 reviews aquatic toxicity data contained in theendrin WQC document (U.S. EPA, 1980) and new datathat were used to calculate the FCV used in thisdocument to derive ESBWQC concentrations. Inaddition, the comparative sensitivity of benthic andwater column species is examined, and justification isprovided for use of the FCV for endrin in the derivationof ESBWQCs. Section 4 reviews data on the toxicity ofendrin in sediments, the need for organic carbonnormalization of endrin sediment concentrations, andthe accuracy of the EqP prediction of sediment toxicityusing KOC and an effect concentration in water. Datafrom Sections 2, 3, and 4 were used in Section 5 as thebasis for the derivation of the ESBWQCs for endrin andits uncertainty. ESBWQCs for endrin are then comparedwith two databases on endrin’s environmentaloccurrence in sediments. Section 6 concludes with thesediment benchmarks for endrin and their applicationand interpretation. The references cited in thisdocument are listed in Section 7.

Equilibrium Partitioning Sediment Benchmarks (ESBs): Endrin
2-1
Section 2
Partitioning2.1 Description of EqP Methodology
ESBs are the numeric concentrations of individualchemicals that are intended to be predictive ofbiological effects, protective of the presence of benthicorganisms, and applicable to the range of naturalsediments from lakes, streams, estuaries, and near-coastal marine waters. For nonionic organicchemicals, ESBs are expressed as Fg chemical/gOC andapply to sediments having $0.2% organic carbon by dryweight. A brief overview follows of the concepts thatunderlie the EqP methodology for deriving ESBs. Themethodology is discussed in detail in “Technical Basisfor the Derivation of Equilibrium Partitioning SedimentBenchmarks (ESBs) for the Protection of BenthicOrganisms: Nonionic Organics” (U.S. EPA, 2003a),hereafter referred to as the ESB Technical BasisDocument.
Bioavailability of a chemical at a particularsediment concentration often differs from one sedimenttype to another. Therefore, a method is necessary todetermine ESBs based on the bioavailable chemicalfraction in a sediment. For nonionic organicchemicals, the concentration–response relationship forthe biological effect of concern can most often becorrelated with the interstitial water (i.e., pore water)concentration (Fg chemical/L interstitial water) andnot with the sediment chemical concentration (Fgchemical/g sediment) (Di Toro et al., 1991). From apurely practical point of view, this correlation suggeststhat if it were possible to measure the interstitialwater chemical concentration, or predict it from thetotal sediment concentration and the relevant sedimentproperties, then that concentration could be used toquantify the exposure concentration for an organism.Thus, knowledge of the partitioning of chemicalsbetween the solid and liquid phases in a sediment is anecessary component for establishing ESBs. For thisreason, the methodology described below is called theEqP method. As stated above, an ESB can be derivedusing any given level of protection, in the followingexample the FCV from the endrin WQC is used.
The ESB Technical Basis Document shows thatbenthic species, as a group, have sensitivities similar
to all benthic and water column species tested (taken asa group) to derive the WQC concentration for a widerange of chemicals. The data showing this for endrinare presented in Section 3.4. Thus, an ESB can beestablished using the FCV, calculated based on theWQC Guidelines (Stephan et al., 1985), as theacceptable effect concentration in interstitial oroverlying water (see Section 5). The partitioncoefficient can then be used to relate the interstitialwater concentration (i.e., the calculated FCV) to thesediment concentration via the partitioning equation.This acceptable concentration in sediment is anESBWQC.
An ESB is calculated as follows. Let FCV(Fg/L) be the acceptable concentration in water for thechemical of interest, then compute an ESB using thepartition coefficient, KP (L/kgsediment), between sedimentand water
ESBWQC = KP FCV (2-1)
This is the fundamental equation used to generate anESBWQC. Its utility depends on the existence of amethodology for quantifying KP.
Organic carbon appears to be the dominant sorptionphase for nonionic organic chemicals in naturallyoccurring sediments and, thus, controls thebioavailability of these compounds in sediments.Evidence for this can be found in numerous toxicitytests, bioaccumulation studies, and chemical analysesof interstitial water and sediments (Di Toro etal., 1991). The evidence for endrin is discussed inthis section and in Section 4. The organic carbonbinding of a chemical in sediment is a function ofthat chemical’s KOC and the weight fraction of organiccarbon (fOC) in the sediment. The relationship is asfollows
KP = fOC KOC (2-2)
It follows that
ESBWQCOC = KOC FCV (2-3)

Partitioning
2-2
where ESBWQCOC is an ESBWQC on a sediment organiccarbon basis. For nonionic organics, “ESBWQC” usuallyrefers to a value that is organic carbon–normalized(more formally ESBWQCOC) unless otherwise specified.
KOC is not usually measured directly (although itcan be done; see Section 2.3). Fortunately, KOC isclosely related to the octanol-water partition coefficient(KOW) (Equation 2-5), which has been measured formany compounds and can be measured very accurately.The next section reviews the available information onthe KOW for endrin.
2.2 Determination of KOW for Endrin
Several approaches have been used to determineKOW for the derivation of an ESB, as discussed in theESB Technical Basis Document. In an examination ofthe literature, primary references were found listingmeasured log10KOW values for endrin ranging from 4.40to 5.19 and estimated log10KOW values ranging from 3.54to 5.60 (Table 2-1). Karickhoff and Long (1995, 1996)established a protocol for recommending KOW values foruncharged organic chemicals based on the bestavailable measured, calculated, and estimated data.The recommended log10KOW value of 5.06 for endrinfrom Karickhoff and Long (1995) is used to derive ESBsfor endrin.
2.3 Derivation of KOC from AdsorptionStudies
Two types of experimental measurements of KOCare available. The first type involves experimentsdesigned to measure the partition coefficient in particlesuspensions. The second type is from sediment toxicity
tests in which sediment endrin, sediment organiccarbon (OC) and freely-dissolved endrin in interstitialwater were used to compute KOC; endrin associatedwith dissolved organic carbon (DOC) was not included.
2.3.1 KOC from Particle Suspension Studies
Laboratory studies to characterize sorption aregenerally conducted using particle suspensions. Thehigh concentrations of solids and turbulent conditionsnecessary to keep the mixture in suspension make datainterpretation difficult as a result of the particleinteraction effect. This effect suppresses the partitioncoefficient relative to that observed for undisturbedsediments (Di Toro, 1985; Mackay and Powers, 1987).
Based on analysis of an extensive body ofexperimental data for a wide range of compound typesand experimental conditions, the particle interactionmodel (Di Toro, 1985) yields the following relationshipfor estimating Kp
fOC KOCKP = (2-4)
1 + mfOC KOC /Lx
where m is the particle concentration in the suspension(kg/L) and LX, an empirical constant, is 1.4. The KOCis given by
log10KOC = 0.00028 + 0.983 log10KOW (2-5)
Figure 2-1 compares observed partition coefficientdata for the reversible component with predicted valuesestimated with the particle interaction model(Equations 2-4 and 2-5) for a wide range of compounds
Table 2-1. Endrin measured and estimated log10KOW values
Method Log10KOW Reference
Measured 4.40 Rapaport and Eisenreich, 1984
Measured 4.92 Ellington and Stancil, 1988
Measured 5.01 Eadsforth, 1986
Measured 5.19 De Bruijn et al., 1989
Estimated 3.54 Mabey et al., 1982
Estimated 5.40 Karickhoff et al., 1989
Estimated 5.60 Neeley et al., 1974

Equilibrium Partitioning Sediment Benchmarks (ESBs): Endrin
2-3
(Di Toro, 1985). The observed partition coefficient forendrin using adsorption data (Sharom et al., 1980) ishighlighted on this plot. The observed log10Kp of 2.04reflects significant particle interaction effects. Theobserved partition coefficient is about nine times lowerthan the value expected in the absence of particleeffects (i.e., log10Kp = 2.98 from fOCKOC = 958 L/kg).In the absence of particle effects, KOC is related to KOWvia Equation 2-5. For log10KOW = 5.06 (see Section2.2), this expression results in an estimate of log10KOC= 4.97.
2.3.2 KOC from Sediment Toxicity Tests
Measurements of KOC were available from thesediment toxicity tests using endrin (Nebeker et al.,1989; Schuytema et al., 1989; Stehly, 1992). These testsused different freshwater sediments having a range oforganic carbon contents of 0.07% to 11.2% (see Table4-1; Appendix B). Endrin concentrations weremeasured in the sediment and interstitial waters,providing the data necessary to calculate the partitioncoefficient for an undisturbed bedded sediment. In the
case of the data reported by Schuytema et al. (1989),the concentration of endrin in the overlying water at theend of the 10-day experiment was used. Nebeker et al.(1989) demonstrated in their experiments, which werestatic and run in the same way as those of Schuytema etal. (1989), that overlying water and interstitial waterendrin concentrations were similar. Figure 2-2A is aplot of the organic carbon–normalized sorptionisotherm for endrin, where the sediment endrinconcentration (Fg/gOC) is plotted versus interstitialwater concentration (Fg/L). The data used to make thisplot are included in Appendix B. The line of unityslope corresponding to the log10KOC = 4.97 derivedfrom the endrin log10KOW of 5.06 from Karickhoff andLong (1995) is compared with the data. A probabilityplot of the observed experimental log10KOC values isshown in Figure 2-2B. The log10KOC values wereapproximately normally distributed, with a mean oflog10KOC = 4.67 and a standard error of the mean (SE)of 0.04. This value agrees with the log10 KOC = 4.97,which was computed using the endrin log10KOW of 5.06from Karickhoff and Long (1995) using Equation 2-5.
Figure 2-1. Observed versus predicted partition coefficients for nonionic organic chemicals using Equation 2-4(figure from DiToro, 1985). Endrin datum is highlighted (Sharom et al., 1980).

Partitioning
2-4
2.4 Summary of Derivation of KOC forEndrin
The KOC selected to calculate ESBs for endrinwere based on the regression of log10KOC to log10KOW(Equation 2-5) using the endrin log10KOW of 5.06 fromKarickhoff and Long (1995). This approach, rather thanuse of the KOC from the toxicity tests, was adopted
because the regression equation is based on the mostrobust dataset available that spans a broad range ofchemicals and particle types, thus encompassing a widerange of KOW and fOC values. The regression equationyielded a log10KOC of 4.97. This value is comparable tothe log10KOC of 4.67 measured in the sediment toxicitytests.
Figure 2-2. Organic carbon–normalized sorption isotherm for endrin (A) and probability plot ofKOC (B) from sediment toxicity tests (Nebeker et al., 1989; Schuytema et al., 1989;Stehly, 1992). The solid line represents the relationship predicted with a log10KOCof 4.97.

Equilibrium Partitioning Sediment Benchmarks (ESBs): Endrin
3-1
Section 3
Toxicity of Endrin inWater Exposures3.1 Derivation of Endrin WQC
The example used in Section 2 for the EqP methodfor derivation of ESBWQCs for endrin uses the WQCFCV and KOC to estimate the maximum concentrationof nonionic organic chemical in sediments, expressedon an organic carbon basis, that will not cause adverseeffects to benthic organisms. For this document, life-stages of species classified as benthic are eitherspecies that live in the sediment (infaunal) or on thesediment surface (epibenthic) and obtain their foodfrom either the sediment or water column (U.S. EPA,2003a). In this section, the FCV from the endrin WQCdocument (U.S. EPA, 1980) is revised using newaquatic toxicity test data, and the use of this FCV isjustified as the appropriate effects concentration forthe derivation of endrin ESBWQCs.
3.2 Acute Toxicity in Water Exposures
A total of 104 standard acute toxicity tests withendrin have been conducted on 42 freshwater speciesfrom 34 genera (Figure 3-1; Appendix A). OverallGMAVs ranged from 0.15 to 180 Fg/L. Fishes,stoneflies, caddisflies, dipterans, mayflies, glassshrimp, isopods, ostracods, amphipods, and damselflieswere most sensitive; overall GMAVs for the mostsensitive genera of these taxa range from 0.15 to 4.6Fg/L. This database contains 39 tests on the benthiclife-stages of 25 species from 22 genera (Figure 3-1;Appendix A). Benthic organisms were both among themost sensitive and the most resistant freshwaterspecies to endrin. Of the epibenthic species,stoneflies, caddisflies, fish, mayflies, glass shrimp,damselflies, amphipods, and dipterans were mostsensitive; GMAVs ranged from >0.18 to 12 Fg/L.Infaunal species tested included stoneflies, mayflies,dipterans, a midge, an oligochaete worm, and anostracod; GMAVs ranged from 0.83 Fg/L for themidge, Tanytarsus, to >165 Fg/L for the oligochaete,Lumbriculus.
A total of 37 acute toxicity tests were conductedon 21 saltwater species from 19 genera (Figure 3-2;Appendix A). Overall GMAVs ranged from 0.037 to
790 Fg/L. Fishes and a penaeid shrimp were mostsensitive; however, only 7 of the 21 species tested wereinvertebrates. Results from 25 tests on benthic life-stages of 13 species from 11 genera are contained inthis database (Figure 3-2; Appendix A). Benthicorganisms were among both the most sensitive and mostresistant saltwater genera to endrin. The mostsensitive benthic species was the commerciallyimportant pink shrimp, Penaeus duorarum, with ameasured flow-through 96-hour LC50 of 0.037 Fg/L.The LC50 represents the chemical concentrationsestimated to be lethal to 50% of the test organismswithin a specified time period. Other benthic speciesfor which there are data appeared less sensitive, withGMAVs ranging from 0.094 to 12 Fg/L.
3.3 Chronic Toxicity in Water Exposures
Life-cycle toxicity tests have been conducted withthe freshwater flagfish (Jordanella floridae) and fatheadminnow (Pimephales promelas) and with the saltwatersheepshead minnow (Cyprinodon variegatus) and grassshrimp (Palaemonetes pugio). Each of these species,except for P. promelas, has one or more benthic life-stages.
Two life-cycle toxicity tests have been conductedwith J. floridae (Table 3-1). The concentration–response relationships were almost identical among thetests. Hermanutz (1978) observed an 8% reduction ingrowth (length) and a 79% reduction in number of eggsspawned per female in 0.30 Fg/L endrin relative toresponse of control fish; progeny were unaffected (Table3-1). Neither parental nor progeny (F1) generation J.floridae were significantly affected when exposed toendrin concentrations from 0.051 to 0.22 Fg/L. Thechronic value from this test was 0.2569. Combinedwith the 96-hour companion acute value of 0.85 Fg/L(Hermanutz et al., 1985), the acute-chronic ratio (ACR)for this test is 3.309 (Table 3-2).
In the second life-cycle test, Hermanutz et al.(1985) observed a 51% decrease in reproduction inparental fish exposed to 0.29 Fg/L endrin, and

Toxicity of Endrin in Water Exposures
3-2
reductions of 73% in survival, 18% in (growth) length,and 92% in numbers of eggs per female in 0.39 Fg/L.No significant effects were detected in parental orprogeny generation flagfish in 0.21 Fg/L. The chronicvalue from this test was 0.2468. Combined with the 96-hour companion acute value of 0.85 Fg/L (Hermanutz etal., 1985), the ACR for this test is 3.444. Thegeometric mean of these two ACRs is 3.376.
The effect of endrin on P. promelas in a life-cycletest was only marginally enhanced when exposure wasvia water and diet versus water-only exposures(Jarvinen and Tyo, 1978). Parental fish in 0.25 Fg/L inwater-only exposures exhibited about 60% mortalityrelative to controls. Mortality of F1 progeny was 70%
in 0.14 Fg/L, the lowest concentration tested, and 85%in 0.25 Fg/L. Tissue concentrations increasedmarginally in fish exposed to the water and diettreatment relative to fish in water-only exposures.Effects were observed at all concentrations tested, sothe chronic value for this test is considered to be<0.14 Fg/L. No ACR from this test can be calculatedbecause no acute value from matching dilution water isavailable.
One saltwater invertebrate species, P. pugio, hasbeen exposed to endrin in a partial life-cycle toxicitytest (Tyler-Schroeder, 1979). Mortality of parentalgeneration shrimp generally increased as endrinconcentrations increased from 0.11 to 0.79 Fg/L. Onset
Figure 3-1. Genus mean acute values from water-only acute toxicity tests using freshwater species versuspercentage rank of their sensitivity. Symbols representing benthic species are solid; thoserepresenting water column species are open. Asterisks indicate greater than values. A = adult,J = juvenile, L = larvae, X = unspecified life-stage.

Equilibrium Partitioning Sediment Benchmarks (ESBs): Endrin
3-3
of spawning was delayed, duration of spawning waslengthened, and the number of female P. pugio spawningwas less in all exposure concentrations from 0.03 to0.79 Fg/L. These effects on reproduction may not beimportant because embryo production and hatchingsuccess were apparently not affected. Larval mortalityand time to metamorphosis increased and growth ofjuvenile progeny decreased in endrin concentrations$0.11 Fg/L. The chronic value from this test was0.07416. Combined with the 96-hour companion acutevalue of 0.35 Fg/L (Tyler-Schroeder, 1979), the ACRfor this test is 4.720.
C. variegatus exposed to endrin in a life-cycletoxicity test (Hansen et al., 1977) were affected atendrin concentrations similar to those affecting the twofreshwater fishes described above. Embryos exposed to0.31 and 0.72 Fg/L endrin hatched early, and all fry
exposed to 0.72 Fg/L and about half of those exposed to0.31 Fg/L died. Females died during spawning, fewereggs were fertile, and survival of exposed progenydecreased in 0.31 Fg/L. No significant effects wereobserved on survival, growth, or reproduction in fishexposed to 0.027 to 0.12 Fg/L endrin. The chronicvalue from this test was 0.1929. Combined with the 96-hour companion acute value of 0.3629 Fg/L (Hansen etal., 1977; Schimmel et al., 1975), the ACR for this testis 1.881.
The difference between acute and chronic toxicityof endrin was small (Table 3-2). ACR values were3.309 and 3.444 for J. floridae, 4.720 for P. pugio, and1.881 for C. variegatus. The final ACR (FACR) was3.106 for both freshwater and saltwater species. Long-term exposures, not classed as “chronic” in theNational WQC Guidelines (Stephan et al., 1985), also
Figure 3-2. Genus mean acute values from water-only acute toxicity tests using saltwater species versuspercentage rank of their sensitivity. Symbols representing benthic species are solid; thoserepresenting water column species are open. A = adult, E = embryo, J = juvenile, L = larvae.

Toxicity of Endrin in Water Exposures
3-4
Table 3-1. Test-specific data for chronic sensitivity of freshwater and saltwater organisms to endrin
indicated little difference between acute and chronictoxicity of endrin. These include tests with thecaddisfly, Brachycentrus americanus; stonefly,Pteronarcys dorsata (Anderson and DeFoe, 1980);bluntnose minnow, Pimephales notatus (Mount, 1962);fathead minnow, P. promelas (Jarvinen et al., 1988);brown bullhead, Ictalurus melas (Anderson and DeFoe,1980); largemouth bass, Micropterus salmoides(Fabacher, 1976); spot, Leiostomus xanthurus (Lowe,
1966); and mummichog, Fundulus heteroclitus (Eisler,1970a).
The final acute value (FAV) derived from theoverall GMAVs (Stephan et al., 1985) for freshwaterorganisms was 0.1803 Fg/L. The FAV for saltwaterspecies was 0.03282 Fg/L (Table 3-2). The FCVs wereused as the effect concentrations for calculatingESBWQCs for protection of benthic species. The FCV of
aTest: LC = life-cycle, PLC = partial life-cycle, ELS = early life-stage.bHabitat: I = infauna, E = epibenthic, W = water column. Life-stage: E = embryo, L = larval, J = juvenile, A = adult.cNOECs = no observed effect concentrations; OECs = observed effect concentrations.
CommonName,ScientificName Testa
Habitatb
(life-stage)
Duration(days)
NOECsc
(Fg/L)OECsc
(Fg/L)
ObservedEffects(relative tocontrols)
ChronicValue(Fg/L) Reference
Freshwater Species
Flagfish,Jordanellafloridae
LC E (E,L)W (J,A)
110 0.051-0.22
0.308% reduction ingrowth,79% reductionin reproduction
0.2569 Hermanutz,1978
Flagfish,Jordanellafloridae
LC E (E,L)W (J,A)
140 0.21 0.29,0.39
51-92%reduction inreproduction,73% decrease insurvival,18% reductionin growth
0.2468 Hermanutzet al., 1985
Fatheadminnow,Pimephalespromelas
LC W(E,L,J,A)
300 <0.14 0.14-0.25
60% decrease inadult survival,70-85%decrease inprogenysurvival
<0.14 Jarvinen andTyo, 1978
Saltwater Species
Grass shrimp,Palaemonetespugio
PLC W (L)E,W
(E,J,A)
145 0.03,0.05
0.11-0.79
38-100%decrease inadult survival,26-94%reduction inprogeny growth
0.07416 Tyler-Schroeder,1979
Sheepsheadminnow,Cyprinodonvariegatus
LC E (E)E,W (J,A)
175 0.027-0.12
0.31,0.72
48-100%decrease insurvival;15% reductionin growth and inadultreproduction;87% decrease inprogenysurvival
0.1929 Hansen etal., 1977

Equilibrium Partitioning Sediment Benchmarks (ESBs): Endrin
3-5
0.05805 Fg/L for freshwater organisms is the quotientof the FAV of 0.1803 Fg/L and the FACR of 3.106.Similarly, the FCV for saltwater organisms of 0.01057Fg/L is the quotient of the FAV of 0.03282 Fg/L and theFACR of 3.106.
3.4 Applicability of the WQC as theEffects Concentration for Derivationof Endrin ESBWQCs
Use of the FCV as the effects concentration forcalculation of ESBWQCs assumes that benthic (infaunaland epibenthic) species, as a group, have sensitivitiessimilar to all species tested to derive the WQCconcentration as a group. Di Toro et al. (1991) and theESB Technical Basis Document (U.S. EPA, 2003a)present data supporting the reasonableness of thisassumption, over all chemicals for which there werepublished or draft WQC documents. The conclusion ofsimilar sensitivity was supported by comparisonsbetween (1) acute values for the most sensitive benthicspecies and acute values for the most sensitive watercolumn species for all chemicals, (2) acute values for
all benthic species and acute values for all species inthe WQC documents across all chemicals afterstandardizing the LC50 values, (3) FAVs calculated forbenthic species alone and FAVs calculated for allspecies in the WQC documents, and (4) individualchemical comparisons of benthic species versus allspecies. Only in this last comparison were endrin-specific comparisons of the sensitivity of benthic andall (benthic and water column) species conducted. Thefollowing paragraphs examine the data on the similarityof sensitivity of benthic and all species for endrin usedin this comparison.
For endrin, benthic species account for 22 out of 34genera tested in freshwater and 11 of 19 genera testedin saltwater (Figures 3-1, 3-2). An initial test of thedifference between the freshwater and saltwater FAVsfor all species (water column and benthic) exposed toendrin was performed using the approximaterandomization (AR) method (Noreen, 1989). The ARmethod tests the significance level of a test statisticcompared with a distribution of statistics generatedfrom many random subsamples. The test statistic inthis case was the difference between the freshwater
Table 3-2. Summary of freshwater and saltwater acute and chronic values, acute-chronic ratios, and derivation offinal acute values, final acute-chronic ratios, and final chronic values for endrin
aNot used in calculation of SMACR or FACR because acute value from matching dilution water is not available.bGeometric mean of 96-hour LC50 values from three flow-through measured tests (0.34, 0.37, 0.38 Fg/L) on fry or juvenile fish from Hansen et al. (1977) and Schimmel et al. (1975). These tests were performed in the same dilution water as the chronic test.
Freshwater: Saltwater:Final acute value = 0.1803 Fg/L Final acute value = 0.03282 Fg/LFinal acute-chronic ratio = 3.106 Final acute-chronic ratio = 3.106Final chronic value = 0.05805 Fg/L Final chronic value = 0.01057 Fg/L
Common Name, Scientific Name
Acute Value (Fg/L)
Chronic Value (Fg/L)
Acute-Chronic Ratio (ACR)
Species Mean Acute-Chronic Ratio
(SMACR)
Freshwater Species
Flagfish, Jordanella floridae
0.85
0.2569
3.309
—
Flagfish, Jordanella floridae
0.85
0.2468
3.444
3.376
Fathead minnow, Pimephales promelas
<0.14a
Saltwater Species
Grass shrimp, Palaemonetes pugio
0.35
0.07416
4.720
4.720
Sheepshead minnow, Cyprinodon variegatus
0.3629b
0.1929
1.881
1.881

Toxicity of Endrin in Water Exposures
3-6
FAV, computed from the freshwater (combined watercolumn and benthic) species LC50 values, and thesaltwater FAV, computed from the saltwater (combinedwater column and benthic) species LC50 values (Table3-3). In the AR method, the freshwater LC50 valuesand the saltwater LC50 values (see Appendix A) werecombined into one dataset. The dataset was shuffled,then separated back so that randomly generated“freshwater” and “saltwater” FAVs could be computed.The LC50 values were separated back such that thenumber of LC50 values used to calculate the sampleFAVs was the same as the number used to calculate theoriginal FAVs. These two FAVs were subtracted and thedifference used as the sample statistic. This was donemany times so that the sample statistics formed adistribution representative of the population of FAVdifferences (Figure 3-3A). The test statistic wascompared with this distribution to determine its levelof significance. The null hypothesis was that the LC50values composing the saltwater and freshwaterdatabases were not different. If this were true, thedifference between the actual freshwater and saltwaterFAVs should be common to the majority of randomlygenerated FAV differences. For endrin, the teststatistic occurred at the 99th percentile of thegenerated FAV differences. Because the probabilitywas greater than 95%, the hypothesis of no significantdifference in sensitivity for freshwater and saltwaterspecies was rejected (Table 3-3). Note that greaterthan (>) values for GMAVs (see Appendix A) wereomitted from the AR analyses for both freshwaterversus saltwater and benthic versus combined watercolumn and benthic organisms. This resulted in twoendrin freshwater benthic organisms being omitted.
Because freshwater and saltwater species did notshow similar sensitivity, separate tests were conducted
for freshwater and saltwater benthic species. For thespecies from each water type, a test of difference insensitivity for benthic and all (benthic and watercolumn species combined, hereafter referred to as“WQC”) organisms, was performed using the ARmethod. For this purpose, each life-stage of each testorganism was assigned a habitat (Appendix A) using thecriteria described in U.S. EPA (2003a). The teststatistic in this case was the difference between theWQC FAV, computed from the WQC LC50 values, andthe benthic FAV, computed from the benthic organismLC50 values. This was slightly different from theprevious test for saltwater and freshwater species inthat saltwater and freshwater species represented twoseparate groups. In this test, the benthic organismswere a subset of the WQC organisms set. In the ARmethod for this test, the number of data pointscoinciding with the number of benthic organisms wasselected from the WQC dataset and the “benthic” FAVwas computed. The original WQC FAV and the“benthic” FAV were then used to compute thedifference statistic. This was done many times, and theresulting distribution was representative of thepopulation of FAV difference statistics. The teststatistic was compared with this distribution todetermine its level of significance. The probabilitydistribution of the computed FAV differences is shownin Figures 3-3B and 3-3C. The test statistic for thisanalysis occurred at the 7th percentile for freshwaterorganisms and the 68th percentile for saltwaterorganisms, and the hypothesis of no difference insensitivity was accepted (Table 3-3). This analysissuggests that the FCV for endrin based on data from alltested species was an appropriate effects concentrationfor benthic organisms.
Table 3-3. Results of approximate randomization (AR) test for the equality of the freshwater and saltwater FAVdistributions for endrin and AR test for the equality of benthic and combined benthic and watercolumn WQC FAV distributions
aValues in parentheses are the number of LC50 values used in the comparison.bNote that in both the freshwater vs. saltwater and benthic vs. WQC comparisons, greater than (>) values in Appendix A were omitted. This resulted in two endrin freshwater benthic organisms being omitted from the AR analysis.cAR statistic = FAV difference between original compared groups.dProbability that the theoretical AR statistic # the observed AR statistic, given that the samples came from the same population.
Comparison Habitat or Water Typea,b AR Statisticc Probabilityd
Freshwater vs Saltwater Fresh (32) Salt (19) 0.149 99
Freshwater: Benthic vs WaterColumn + Benthic (WQC) Benthic (21) WQC (32) 0.042 7
Saltwater: Benthic vs WaterColumn + Benthic (WQC) Benthic (11) WQC (19) 0.012 68

Equilibrium Partitioning Sediment Benchmarks (ESBs): Endrin
3-7
Figure 3-3. Probability distribution of FAV difference statistics to compare water-only data from freshwaterversus saltwater (A), benthic versus WQC freshwater (B), and benthic versus WQC saltwater(C) data. The solid lines in the figure correspond to the FAV differences measured for endrin.

Equilibrium Partitioning Sediment Benchmarks (ESBs): Endrin
4-1
Section 4
Actual and Predicted Toxicity ofEndrin in Sediment Exposures4.1 Toxicity of Endrin in Sediments
The toxicity of endrin-spiked sediments was testedwith four freshwater species (two oligochaetes—alumbriculid worm and a tubificid worm—and twoamphipods) and two saltwater species (a polychaete andthe sand shrimp) (Table 4-1). The most commonendpoint measured was mortality; however, impactshave been reported on sublethal endpoints such asgrowth, sediment avoidance, and sediment reworkingrate. All concentrations of endrin in sediments orinterstitial water where effects were observed weregreater than ESBWQC or FCV concentrations reportedin this document. Details about exposure methodologyare provided because sediment testing methodologieshave not been standardized in the way that water-onlytoxicity test methodologies have. Generalizationsacross species or sediments are limited because of thelimited number of experiments.
Keilty et al. (1988a,b) and Keilty and Stehly (1989)studied the effects on oligochaete worms of LakeMichigan sediments spiked with endrin. For all tests,sediments were dried, passed through a 0.25 mm sieve,reconstituted with lake water, spiked with endrindissolved in acetone, and stirred for 24 hours. Thewater (containing the carrier) was aspirated off, newoverlying water added, and sediments placed intoindividual beakers for 72 hours before the worms wereadded.
Keilty et al. (1988a) examined the effects ofendrin-spiked sediment on sediment avoidance andmortality of two species of oligochaete worms inreplicate 4-day exposures (Table 4-1). Four-day LC50values for four tests with Stylodrilus heringianusaveraged 2,110 Fg endrin/g dry weight sediment andranged from 1,050 to 5,400 Fg endrin/g dry weightsediment. Four-day LC50 values for three tests withLimnodrilus hoffmeisteri averaged 3,390 Fg/g dryweight sediment and ranged from 2,050 to 5,600 Fg/gdry weight sediment. Four-day LC50 values from thesetests averaged 194,000 Fg/gOC for L. hoffmeisteri and121,000 Fg/gOC for S. heringianus. Data using this testmethod have demonstrated laboratory variabilities by a
factor of 3 to 5 for the same sediment. Sedimentavoidance was seen at much lower concentrations. Overall tests, burrowing was markedly reduced at $11.5 Fg/gdry weight sediment and possibly at $0.54 Fg/g dryweight sediment. EC50s, based on sediment avoidance,were 59.0 Fg/g dry weight (3,371 Fg/gOC) for L.hoffmeisteri and 15.3 and 19.0 Fg/g dry weight (874 and1,086 Fg/gOC) sediment for two tests using S.heringianus. The EC50 represents the chemicalconcentration estimated to cause effects to 50% of thetest organisms within a specified time period. Keilty etal. (1988b) observed 18% mortality of S. heringianus in11.5 Fg/g dry weight sediment after a 54-day exposureand 26% mortality in 42.0 Fg/g dry weight sediment.The sediment reworking rate was reported to besignificantly different from the control in sedimentscontaining $0.54 Fg/g dry weight sediment. Dryweights of worms in $2.33 Fg/g dry weight sedimentwere reduced after 54 days. Keilty and Stehly (1989)observed no effect of a single, nominal concentration of50 Fg/g dry weight sediment on protein utilization by S.heringianus over a 69-day exposure period. However,dry weights of worms were significantly reduced.
Nebeker et al. (1989) and Schuytema et al. (1989)exposed the amphipod Hyalella azteca to two endrin-spiked sediments, one with a TOC of 11% and the othera TOC of 3%. Nebeker et al. (1989) mixed these twosediments to obtain a third sediment with a TOC of6.1%. Sediments were shaken for 7 days in endrin-coated flasks, and subsequently for 62 days in cleanflasks. The 10-day LC50 values for amphipods in thethree sediments tested by Nebeker et al. (1989) did notdiffer when endrin concentration was on a dry weightbasis. The LC50 values decreased with increase inorganic carbon when the concentration was on anorganic carbon basis (Table 4-1). The authorsconcluded that endrin data do not support equilibriumpartitioning theory. LC50 values normalized to dryweight (4.4 to 6.0 Fg/g) or wet weight (0.9 to 1.0 Fg/g)differed by less than a factor of 1.5 over a 3.7 foldrange of TOC. In contrast, the organic carbon–normalized LC50 values ranged from 53.6 to 147Fg/gOC, a factor of 2.7 (Table 4-1).

Actual and Predicted Toxicity of Endrin in Sediment Exposures
4-2
Table 4-1. Summary of tests with endrin-spiked sediment
Sediment Endrin LC50 InterstitialMethod,a Water
Common Name, TOC Duration Dry wt OC LC50Scientific Name Sediment Source (%) (days) Response (Fg/g) (Fg/g) (Fg/L) Reference
Freshwater Species
Lumbriculid worm, Stylodrilus heringianus
Lake Michigan; 0.25mm sieved
1.75b S,M/4 LC50 1,400 80,000 — Keilty et al., 1988a
Lumbriculid worm, Stylodrilus heringianus
Lake Michigan; 0.25mm sieved
1.75b S,M/4 LC50 1,050 60,000 — Keilty et al., 1988a
Lumbriculid worm, Stylodrilus heringianus
Lake Michigan; 0.25mm sieved
1.75b S,M/4 LC50 2,500 143,000 — Keilty et al., 1988a
Lumbriculid worm, Stylodrilus heringianus
Lake Michigan; 0.25mm sieved
1.75b S,M/4 LC50 5,400 309,000 — Keilty et al., 1988a
Lumbriculid worm, Stylodrilus heringianus
Lake Michigan; 0.25mm sieved
1.75b S,M/4 EC50 sediment avoidance
19.0 1,086 — Keilty et al., 1988a
Lumbriculid worm, Stylodrilus heringianus
Lake Michigan; 0.25mm sieved
1.75b S,M/4 EC50 sediment avoidance
15.3 874 — Keilty et al., 1988a
Lumbriculid worm, Stylodrilus heringianus
Lake Michigan; 0.25mm sieved
1.75b S,M/54 26% mortality
42.0 2,400 — Keilty et al., 1988b
Lumbriculid worm, Stylodrilus heringianus
Lake Michigan; 0.25mm sieved
1.75b S,M/54 18% mortality
11.5 657 — Keilty et al., 1988b
Lumbriculid worm, Stylodrilus heringianus
Lake Michigan; 0.25mm sieved
1.75b S,M/54 Weight loss
2.33 133 — Keilty et al., 1988b
Lumbriculid worm, Stylodrilus heringianus
Lake Michigan; 0.25mm sieved
1.75b S,M/54 Decreased sediment reworking rate
0.54 30.8 — Keilty et al., 1988b
Lumbriculid worm, Stylodrilus heringianus
Lake Michigan; 0.25mm sieved
1.75b S,N/69 Weight loss
50.0 2,860 — Keilty and Stehly, 1989
Tubificid worm, Limnodrilus hoffmeisteri
Lake Michigan; 0.25mm sieved
1.75b S,M/4 LC50 2,050 117,000 — Keilty et al., 1988a
Tubificid worm, Limnodrilus hoffmeisteri
Lake Michigan; 0.25mm sieved
1.75b S,M/4 LC50 3,400 194,000 — Keilty et al., 1988a
Tubificid worm, Limnodrilus hoffmeisteri
Lake Michigan; 0.25mm sieved
1.75b S,M/4 LC50 5,600c 320,000c — Keilty et al., 1988a
Tubificid worm, Limnodrilus hoffmeisteri
Lake Michigan; 0.25mm sieved
1.75b S,M/4 EC50 sediment avoidance
59.0 3,371 — Keilty et al., 1988a

Equilibrium Partitioning Sediment Benchmarks (ESBs): Endrin
4-3
Table 4-1. Summary of tests with endrin-spiked sediment (continued)
aS = static, R = renewal, M = measured, N = nominal.bValue from Landrum (1991).cL. hoffmeisteri and S. heringianus tested together.dClean sediment placed in endrin-coated beakers at beginning of exposure.
Amphipod, Diporeia sp.
Lake Michigan; depth 29m
0.07 S,M/4 LC50 0.012 17.0 1.07 Stehly, 1992
Amphipod, Diporeia sp.
Lake Michigan; depth 45m
0.55 S,M/4 LC50 0.172 31.3 2.2 Stehly, 1992
Amphipod, Diporeia sp.
Lake Michigan; depth 100m
1.75 S,M/4 LC50 0.224 12.8 0.63 Stehly, 1992
Amphipod, Hyalella azteca
Soap Creek Pond No. 7, OR
3.0 S,M/10 LC50 4.4 147 2.1 Nebeker et al., 1989
Amphipod, Hyalella azteca
1:1 mixture of Soap Creek and Mercer Lake, OR
6.1 S,M/10 LC50 4.8 78.7 1.9 Nebeker et al., 1989
Amphipod, Hyalella azteca
Mercer Lake, OR 11.2 S,M/10 LC50 6.0 53.6 1.8 Nebeker et al., 1989
Amphipod, Hyalella azteca
Soap Creek Pond No. 7, OR; refrigerated
3 S,M/10 LC50 5.1 170 — Schuytema et al., 1989
Amphipod, Hyalella azteca
Soap Creek Pond No. 7, OR; frozen
3 S,M/10 LC50 7.7 257 — Schuytema et al., 1989
Amphipod, Hyalella azteca
Mercer Lake, OR; refrigerated
11 S,M/10 LC50 19.6 178 — Schuytema et al., 1989
Amphipod, Hyalella azteca
Mercer Lake, OR; frozen
11 S,M/10 LC50 21.7 197 — Schuytema et al., 1989
Amphipod, Hyalella azteca
Mercer Lake, OR; refrigerated
11 S,M/10 LC50 10.3 93.6 — Schuytema et al., 1989
Amphipod, Hyalella azteca
Mercer Lake, OR; frozen
11 S,M/10 LC50 9.8 89.1 — Schuytema et al., 1989
Saltwater Species
Polychaete worm, Nereis virens
17% sand, 83% silt and clayd
2 R,M/12 2 of 5 worms died
28 1,400 — McLeese et al., 1982
Sand shrimp, Crangon septemspinosa
Sand, wet-sieved between 1-2mm sievesd
0.28 R,M/4 LC50 0.047 16.8 — McLeese and Metcalfe, 1980
Sediment Endrin LC50 InterstitialMethod,a Water
Common Name, TOC Duration Dry wt OC LC50Scientific Name Sediment Source (%) (days) Response (Fg/g) (Fg/g) (Fg/L) Reference

Actual and Predicted Toxicity of Endrin in Sediment Exposures
4-4
Schuytema et al. (1989) stored an aliquot ofsediments dosed by Nebeker et al. (1989) for an averageof 9 months and then froze one-half for 2 weeks; theother half was stored at 4EC for 2 weeks. The toxicityof endrin to H. azteca did not differ in refrigerated andfrozen sediments from Mercer Lake, OR, and differedminimally (LC50 = 5.1 vs 7.7 Fg/g dry weight) insediments from Soap Creek Pond. In contrast to thefindings of Nebeker et al. (1989), Schuytema et al.(1989) used the same test sediments and observedhigher LC50 values in four tests with Mercer Lakesediments (9.8, 10.3, 19.6, and 21.7 Fg/g dry weight),which had a TOC of 11%, than LC50 values from twotests using Soap Creek sediments (5.1 and 7.7 Fg/g dryweight) where TOC was 3%.
The only saltwater experiments that tested endrin-spiked sediments were conducted by McLeese et al.(1982) and McLeese and Metcalfe (1980). These beganwith clean sediments that were added to endrin-coatedbeakers just before addition of test organisms. Thiswas in marked contrast to tests using freshwatersediments spiked with endrin days or weeks before testinitiation (Nebeker et al., 1989; Schuytema et al.,1989). As a result, the endrin concentrations in thesediment and overlying water varied greatly over thecourse of these experiments. In addition, the transfer oftest organisms to freshly prepared beakers every 48hours adds to the uncertainty associated with theexposure conditions and complicates interpretation ofthe results of McLeese et al. (1982).
McLeese et al. (1982) tested the effects of endrinon the polychaete worm, Nereis virens, in sedimentwith 2% TOC (17% sand and 83% silt and clay) in 12-day toxicity tests. Only two of five worms died at thehighest concentration tested, 28 Fg endrin/g dry weightsediment or 1,400 Fg endrin/gOC. McLeese andMetcalfe (1980) tested the effects of endrin in sandwith a TOC content of 0.28% on the sand shrimp,Crangon septemspinosa. The 4-day LC50 was 0.047 Fg/g dry weight sediment or 16.8 Fg/gOC. Concentrationsof endrin in water overlying the sediment weresufficient to explain the observed mortalities of sandshrimp in sediments.
The need for organic carbon normalization of theconcentrations of nonionic organic chemicals insediments is presented in the ESB Technical BasisDocument. For endrin, this need is supported by theresults of the spiked-sediment toxicity tests describedabove. When examined individually, experiments inwhich H. azteca were exposed to the same sediments byboth Nebeker et al. (1989) and Schuytema et al. (1989)
provide contradictory data concerning the need fororganic carbon normalization (Table 4-1). Nebeker etal. (1989) observed no change in toxicity withincreasing TOC when endrin was expressed on a dryweight basis, whereas Schuytema et al. (1989) observeda decrease in toxicity with increasing TOC when endrinwas expressed on a dry weight basis. However, meanLC50 values calculated for individual experiments fromboth studies were similar when concentrations werenormalized by organic carbon content. The mean(geometric) LC50 values were 109 Fg/gOC (5 tests) forsediments from Mercer Lake having a TOC of 11% and186 Fg/gOC (3 tests) for sediments from Soap CreekPond having 3% organic carbon. The lack of consistentevidence supporting organic carbon normalization inthe individual tests reported by Nebeker et al. (1989) isin contrast with evidence supporting normalizationoverall for tests with other nonionic chemicals. Theresults for sediments spiked with endrin were mostlikely observed because organic carbon concentrationsdiffered by less than a factor of four and variabilityinherent in these tests limited the capacity fordiscrimination. Additional tests by Stehly (1992)provide further support for the need to normalize endrinconcentrations in sediments (Table 4-1). The organiccarbon concentrations for these sediments ranged from0.07% to 1.75% (a factor of 25). On a dry weightbasis, 4-day LC50 values for Diporeia sp. ranged from0.012 to 0.224 Fg/g (a factor of 18.7). The organiccarbon–normalized LC50 values were within a factor of2.4 and ranged from 12.8 to 31.3 Fg/gOC.
Although it is important to demonstrate thatorganic carbon normalization is necessary if ESBWQCsare to be derived using the EqP approach, it isfundamentally more important to demonstrate that KOCand water-only effects concentrations can be used topredict the effects concentration for endrin and othernonionic organic chemicals on an organic carbon basisfor a range of sediments. Evidence supporting thisprediction for endrin and other nonionic organicchemicals follows in Section 4.3.
4.2 Correlation Between OrganismResponse and Interstitial WaterConcentration
One corollary of the EqP theory is that freely-dissolved interstitial water LC50 values for a givenorganism should be constant across sediments ofvarying organic carbon contents (U.S. EPA, 2003a).Appropriate interstitial water LC50 values are availablefrom two studies using endrin (Table 4-1). Nebeker etal. (1989) found 10-day LC50 values for endrin, based on

Equilibrium Partitioning Sediment Benchmarks (ESBs): Endrin
4-5
interstitial water concentrations, ranged from 1.8 to 2.1Fg/L for H. azteca exposed to three sediments.Overlying water LC50 values from these static tests(Nebeker et al., 1989) and those conducted using thesame sediments by Schuytema et al. (1989) weresimilar; 1.1 to 3.9 Fg/L. Stehly (1992) found that 4-dayinterstitial water LC50 values for Diporeia sp. rangedfrom 0.63 to 2.2 Fg/L (a factor of 3.5); this isconsiderably less than the range in LC50 valuesexpressed as dry weight, 0.012 to 0.224 Fg/g (a factorof 18.7), for three sediments from Lake Michiganhaving 0.07% to 1.75% organic carbon.
A more detailed evaluation of the degree to whichthe response of benthic organisms can be predictedfrom toxic units (TUs) of substances in interstitialwater can be made utilizing results from toxicity testswith sediments spiked with a variety of nonioniccompounds, including acenaphthene and phenanthrene(Swartz, 1991), endrin (Nebeker et al., 1989;Schuytema et al., 1989), fluoranthene (Swartz et al.,1990; DeWitt et al., 1992), and kepone (Adams et al.,
1985) (Figure 4-1). The endrin data included in thisanalysis were from tests conducted at laboratories orfrom tests that utilized designs at least as rigorous asthose conducted at EPA laboratories. Note thatdieldrin data from Hoke et al. (1995) were not used inthe interstitial water TU plot either because interstitialwater was not measured or because of inconsistenciesin the mortality results that have been attributed toDOC complexing in the interstitial water. This isdiscussed in Hoke et al. (1995) and in the EPA dieldrinESB document (U.S. EPA, 2003c). Tests withacenaphthene and phenanthrene used two saltwateramphipods (Leptocheirus plumulosus and Eohaustoriusestuarius) and saltwater sediments. Tests withfluoranthene used a saltwater amphipod (Rhepoxyniusabronius) and saltwater sediments. Freshwatersediments spiked with endrin were tested using theamphipod H. azteca, and kepone-spiked sediments weretested using the midge, C. tentans.
Figure 4-1 presents the percent mortalities of thebenthic species tested in individual treatments for each
Figure 4-1. Percent mortality of amphipods in sediments spiked with acenaphthene or phenanthrene (Swartz,1991), endrin (Nebeker et al., 1989; Schuytema et al., 1989), or fluoranthene (Swartz et al., 1990;DeWitt et al., 1992), and midge in sediments spiked with kepone (Adams et al., 1985) relative tointerstitial water toxic units.

Actual and Predicted Toxicity of Endrin in Sediment Exposures
4-6
chemical versus interstitial water TUs (IWTUs) for allsediments. IWTUs are the concentration of thechemical in interstitial water (Fg/L) divided by thewater-only LC50 (Fg/L). Theoretically, 50% mortalityshould occur at 1 IWTU. At concentrations below 1IWTU, there should be less than 50% mortality, and atconcentrations above 1 IWTU there should be greaterthan 50% mortality. Figure 4-1 shows that, atconcentrations below 1 IWTU, mortality was generallylow and increased sharply at approximately 1 IWTU.Therefore, this comparison supports the concept thatinterstitial water concentrations can be used to make aprediction that is not sediment-specific of the responseof an organism to a chemical.
4.3 Tests of the Equilibrium PartitioningPrediction of Sediment Toxicity
Sediment benchmarks derived using the EqPapproach utilize partition coefficients and FCVs fromupdated or final WQC documents to derive ESBWQCconcentrations that are protective of benthic organisms.The partition coefficient KOC is used to normalizesediment concentrations and predict biologicallyavailable concentrations across sediment types. Thedata required to test the organic carbon normalizationfor endrin in sediments were available for only onebenthic species. Data from tests with water columnspecies were not included in this analysis. Testing ofthis component of ESBWQC derivation required threeelements: (1) a water-only effects concentration, suchas a 10-day LC50 value, in Fg/L; (2) an identicalsediment effect concentration on an organic carbonbasis, in Fg/gOC; and (3) a partition coefficient for thechemical, KOC, in L/kgOC. This section presentsevidence that the observed effect concentration insediments (2) can be predicted utilizing the water-onlyeffect concentration (1) and the partition coefficient (3).
Predicted sediment 10-day LC50 values fromendrin-spiked sediment tests with H. azteca (Nebekeret al., 1989; Schuytema et al., 1989) were calculated(Table 4-2) using the log10KOC value of 4.97 fromSection 2 of this document and the geometric mean ofthe water-only LC50 value (4.1 Fg/L). Overall, ratiosof actual to predicted sediment LC50 values for endrinaveraged 0.33 (range 0.13 to 0.67) in nine tests withthree sediments.
A more detailed evaluation of the accuracy andprecision of the EqP prediction of the response ofbenthic organisms can be made using the results oftoxicity tests with amphipods exposed to sedimentsspiked with acenaphthene, phenanthrene, dieldrin,
endrin, or fluoranthene. The data included in thisanalysis were from tests conducted at EPA laboratoriesor from tests that utilized designs at least as rigorousas those conducted at EPA laboratories. Data from thekepone experiments were not included because therecommended KOW for kepone obtained from Karickhoffand Long (1995) was evaluated using only onelaboratory measured value, whereas the remainingchemical KOW values are recommended based onseveral laboratory measured values. Swartz (1991)exposed the saltwater amphipods E. estuarius and L.plumulosus to acenaphthene in three marine sedimentshaving organic carbon contents ranging from 0.82% to4.2% and to phenanthrene in three marine sedimentshaving organic carbon contents ranging from 0.82% to3.6%. Swartz et al. (1990) exposed the saltwateramphipod R. abronius to fluoranthene in three marinesediments having 0.18%, 0.31%, and 0.48% organiccarbon. Hoke et al. (1995) exposed the amphipod H.azteca to three dieldrin-spiked freshwater sedimentshaving 1.7%, 2.9%, and 8.7% organic carbon, and alsoexposed the midge C. tentans to two freshwaterdieldrin-spiked sediments having 2.0% and 1.5%organic carbon. Nebeker et al. (1989) and Schuytemaet al. (1989) exposed H. azteca to three endrin-spikedsediments having 3.0%, 6.1%, and 11.2% organiccarbon. Figure 4-2 presents the percent mortalities ofamphipods in individual treatments of each chemicalversus predicted sediment TUs (PSTUs) for eachsediment treatment. PSTUs are the concentration ofthe chemical in sediment (Fg/gOC) divided by thepredicted sediment LC50 (i.e., the product of KOC andthe 10-day water-only LC50 expressed in Fg/gOC). Inthis normalization, 50% mortality should occur at 1PSTU. Figure 4-2 shows that, at concentrations below1 PSTU, mortality was generally low and increasedsharply at 1 PSTU. Therefore, this comparisonsupports the concept that PSTU values also can be usedto make a prediction, that is not sediment-specific, ofthe response of an organism to a chemical. The meansof the LC50 values for these tests, calculated on aPSTU basis, were 1.55 for acenaphthene, 0.73 fordieldrin, 0.33 for endrin, 0.75 for fluoranthene, and1.19 for phenanthrene. The mean value for the fivechemicals was 0.80. The fact that this value is so closeto the theoretical value of 1.0 illustrates that the EqPmethod can account for the effects of different sedimentproperties and properly predict the effectsconcentration in sediments using effects concentrationsfrom water-only exposures.
Data variations in Figure 4-2 reflect inherentvariability in these experiments and phenomena that

Equilibrium Partitioning Sediment Benchmarks (ESBs): Endrin
4-7
have not been accounted for in the EqP model. Theuncertainty of the model is calculated in Section 5.2of this document. There is an uncertainty ofapproximately ±2. The error bars shown in Figure 4-2
Table 4-2. Water-only and sediment LC50 values used to test the applicability of the EqP theory for endrin
aS=static; M=measured.bPredicted LC50 (Fg/gOC) = water-only LC50 (Fg/L) × KOC (L/kgOC) × 1 kgOC/1000 gOC; where KOC = 104.97.cSoluble endrin; samples centrifuged prior to analysis.dMean 10-day water-only LC50 from 3 tests in Nebeker et al. (1989).
are computed as ±1.96 × (ESBWQC uncertainty). Thevalue of 1.96 is the t statistic, which provides a 95%confidence interval around the ESBWQCs .
Endrin SedimentLC50s
CommonName,ScientificName
Method,a
Duration(days)
Water-OnlyLC50(Fg/L)
OverlyingWaterLC50(Fg/L)
InterstitialWaterLC50(Fg/L)
TOC(%)
DryWt.
(Fg/g)OC
(Fg/g)
Predictedb
LC50(Fg/gOC)
Ratio:Actual/
PredictedLC50 Reference
Amphipod, Hyalella azteca
S, M/10 4.2c 1.3c 2.1c 3.0 4.4 147 392 0.38 Nebeker et al., 1989
Amphipod, Hyalella azteca
S, M/10 3.8c 1.1c 1.9c 6.1 4.8 78.7 355 0.22 Nebeker et al., 1989
Amphipod, Hyalella azteca
S, M/10 4.3c 1.2c 1.8c 11.2 6.0 53.6 401 0.13 Nebeker et al., 1989
Amphipod, Hyalella azteca
S, M/10 4.1d 1.8c — 3 5.1 170 383 0.44 Schuytema et al., 1989
Amphipod, Hyalella azteca
S, M/10 4.1d 3.6c — 3 7.7 257 383 0.67 Schuytema et al., 1989
Amphipod, Hyalella azteca
S, M/10 4.1d 3.6c — 11 19.6 178 383 0.46 Schuytema et al., 1989
Amphipod, Hyalella azteca
S, M/10 4.1d 3.9c — 11 21.7 197 383 0.51 Schuytema et al., 1989
Amphipod, Hyalella azteca
S, M/10 4.1d 1.4c — 11 10.3 93.6 383 0.24 Schuytema et al., 1989
Amphipod, Hyalella azteca
S, M/10 4.1d 1.8c — 11 9.8 89.1 383 0.23 Schuytema et al., 1989
Geometric Mean
4.1d 1.9c 1.9c — — 125.8 383 0.33

Actual and Predicted Toxicity of Endrin in Sediment Exposures
4-8
Figure 4-2. Percent mortality of amphipods in sediments spiked with acenaphthene or phenanthrene (Swartz,1991), dieldrin (Hoke et al., 1995), endrin (Nebeker et al., 1989; Schuytema et al., 1989), orfluoranthene (Swartz et al., 1990; DeWitt et al., 1992), and midge in sediments spiked with dieldrin(Hoke et al., 1995) relative to predicted sediment toxic units.


Equilibrium Partitioning Sediment Benchmarks (ESBs): Endrin
6-1
Section 6
Sediment Benchmark Values:Application and Interpretation6.1 Benchmarks
Based on the level of protection provided by WQC,the procedures described in this document indicate thatbenthic organisms should be comparably protected fromadverse effects of endrin where endrin concentrationsin sediment are below the ESBWQC values of 5.4 µgendrin/gOC for freshwater sediments and 0.99 µgendrin/gOC for marine/estuarine sediments, exceptpossibly where a locally important species is verysensitive or sediment organic carbon is <0.2%.
Confidence limits of 2.4 to 12 µg/gOC forfreshwater sediments and 0.44 to 2.2 µg/gOC formarine/estuarine sediments are provided as an estimateof the uncertainty associated with the degree to whichtoxicity can be predicted using the KOC and the water-only effects concentration. Confidence limits do notincorporate uncertainty associated with water qualitycriteria, or unusual, site-specific circumstances. Anunderstanding of the theoretical basis of theequilibrium partitioning methodology, uncertainty, andthe partitioning and toxicity of endrin are required inthe use of ESBs and their confidence limits.
The benchmarks presented in this document arethe concentrations of a substance that may be presentin sediment while still protecting benthic organismsfrom the effects of that substance. These benchmarksare applicable to a variety of freshwater and marinesediments because they are based on the biologicallyavailable concentration of the substance in thosesediments.
These benchmarks do not protect against additive,synergistic, or antagonistic effects of contaminants orbioaccumulative effects to aquatic life, wildlife orhuman health. Consistent with the recommendations ofEPA’s Science Advisory Board, publication of thesedocuments does not imply the use of ESBs as stand-alone, pass-fail criteria for all applications; rather,exceedances of ESBs could trigger collection ofadditional assessment data.
6.2 Considerations in the Application and Interpretation of ESBs (also see Section 5.5)
6.2.1 Relationship of ESBWQC to Expected Effects
The ESBWQC should be interpreted as a chemicalconcentration below which adverse effects are notexpected. In comparison, at concentrations above theESBWQC effects may occur. In principle, above theupper confidence limit effects are expected if thechemical is bioavailable as predicted by EqP theory. Ingeneral terms, the degree of effect expected increaseswith increasing endrin concentration in the sediment.Because the FCV is derived as an estimate of theconcentration causing chronic toxicity to sensitiveorganisms, effects of this type may be expected whensediment concentrations are near the ESBWQC. Assediment concentrations increase beyond the ESBWQC,one can expect chronic effects on less sensitive speciesand/or acute effects on sensitive species.
6.2.2 Use of EqP to Develop Alternative Benchmarks
The FCV is used to define a threshold forunacceptable effects based on its precedence inestablishing unacceptable effects in the development ofWQC. However, the use of EqP to assess sedimentcontamination is not limited to the ESBWQC and theassociated level of protection. By substituting water-only effect values other than the FCV into the ESBequation, other benchmarks may be developed that areuseful in evaluating specific types of biological effects,or that better represent the ecological protection goalsfor specific assessments.
Sediment Benchmark Values: Application and Interpretation
6-2
6.2.3 Influence of Unusual Forms ofSediment Organic Carbon
Partition coefficients used for calculating theseESBs are based on estimated and measured partitioningfrom natural organic carbon in typical field sediments.Some sediments influenced heavily by anthropogenicactivity may contain sources of organic carbon whosepartitioning properties are not similar, such as rubber,animal processing wastes (e.g., hair or hide fragments),or wood processing wastes (bark, wood fiber or chips).Relatively undegraded woody debris or plant matter(e.g., roots, leaves) may also contribute organic carbonthat results in partitioning different from that of typicalorganic carbon. Sediments with large amounts of thesematerials may show higher concentrations of chemicalsin interstitial water than would be predicted usinggeneric KOC values, making the ESBs underprotective.Direct analysis of interstitial water can be used toevaluate this possibility (see U.S. EPA, 2003a,b); ifnecessary, derivation of site-specific KOC values may bewarranted.
6.2.4 Relationship to Risks Mediated through Bioaccumulation and Trophic Transfer
As indicated above, ESBs are designed to addressdirect toxicity to benthic organisms exposed directly tocontaminated sediment. They are not designed toaddress risks that may occur through bioaccumulationand subsequent exposure of pelagic aquatic organisms(e.g., predatory fish), terrestrial or avian wildlife, orhumans. No inference can be drawn betweenattainment of the ESBWQC and the potential for risk viabioaccumulation; the potential for those risks must beaddressed by separate means.
6.2.5 Exposures to Chemical Mixtures
The methodology described in this document can beused to derive ESBWQCs that protect against the specifictoxic effects of endrin; it does not account for potentialantagonistic, additive, or synergistic effects that mayoccur in sediments containing a mixture of endrin andother chemicals. Consideration of this potential mustbe on a site-specific basis. In general terms, it might
be expected that chemicals with toxicological modes ofaction similar to endrin may show additive toxicitywith endrin
6.2.6 Interpreting ESBs in Combination with Toxicity Tests
Sediment toxicity tests provide an importantcomplement to ESBs in interpreting overall risk fromcontaminated sediments. Toxicity tests have differentstrengths and weaknesses compared to chemical-specific guidelines, and the most powerful inferencescan be drawn when both are used together.
Unlike chemical-specific guidelines, toxicity testsare capable of detecting any toxic chemical, if it ispresent in toxic amounts; one does not need to knowwhat the chemicals of concern are to monitor thesediment. Toxicity tests are also useful for detectingthe combined effect of chemical mixtures, if thoseeffects are not considered in the formulation of theapplicable chemical-specific guideline.
On the other hand, toxicity tests have weaknessesalso; they provide information only for the speciestested, and also only for the endpoints measured. Thisis particularly critical given that most sedimenttoxicity tests conducted at the time of this writingprimarily measure short-term lethality; chronic testprocedures have been developed and published for somespecies, but these procedures are more resource-intensive and have not yet seen widespread use. Incontrast, the ESBWQC is intended to protect mostspecies against both acute and chronic effects.
Many assessments may involve comparison ofsediment chemistry (relative to ESBs or other sedimentquality guidelines) and toxicity test results. In caseswhere results using these two methods agree (eitherboth positive or both negative), the interpretation isclear. In cases where the two disagree, theinterpretation is more complex and required furtherevaluation.
Individual ESBs address only the effects of thechemical or group of chemicals for which they arederived. For this reason, if a sediment shows toxicitybut does not exceed the ESBWQC for a chemical ofinterest, it is likely that the cause of toxicity is adifferent chemical or chemicals. This result might

Equilibrium Partitioning Sediment Benchmarks (ESBs): Endrin
6-3
also occur if the partitioning of the chemical in asediment is different from that assumed by the KOCvalue used (see “6.2.3 Influence of Unusual Forms ofSediment Organic Carbon” above).
In other instances, it may be that an ESBWQC isexceeded but the sediment is not toxic. As explainedabove, these findings are not mutually exclusive,because the inherent sensitivity of the two measures isdifferent. The ESBWQC is intended to protect relativelysensitive species against both acute and chronic effects,whereas toxicity tests are run with specific species thatmay or may not be sensitive to chemicals of concern,and often do not encompass the most sensitive endpoints(e.g., growth or reproduction). As such, one would notexpect an endrin concentration near the ESBWQC tocause lethality in a short-term test. It is also possiblefor a sediment above the ESBWQC to be non-toxic ifthere are site-specific conditions that run counter to theequilibrium partitioning model and its assumptions asoutlined in this document.
A good method for evaluating the results of toxicitytests is to calculate effect concentrations in sedimentthat are species and endpoint specific. For speciescontained in the water-only toxicity data for the endrinESBWQCs (Section 3), effect concentrations in sedimentcan be calculated that are specific for that organismusing procedures in Section 5. These values could thenbe used to directly judge whether the absence oftoxicity in the toxicity test would be expected from theconcentration of endrin present.
If the exceedance of an ESB is sufficient that onewould expect effects in a toxicity test but they are notobserved, it is prudent to evaluate the partitioningbehavior of the chemical in the sediment. This isperformed by isolating interstitial water from thesediment and analyzing it for endrin. Predictedconcentrations of endrin in the interstitial water can becalculated from the measured concentrations in thesolid phase (normalized to organic carbon) as follows
µg chemical/L = (µg chemical/gOC) x 103gOC/KgOC ÷ KOC
For chemicals with log KOW greater than 5.5,corrections for DOC binding in the interstitial waterwill be necessary (see Gschwend and Wu 1985;Burkhard 2000). If the measured chemical in theinterstitial water is substantially less (e.g., 2-3 foldlower or more), it suggests that the organic carbon inthat sediment may not partition similarly to moretypical organic carbon, and derivation of site-specificESBs based on interstitial water may be warranted(U.S. EPA 2003b).
6.3 Summary
Based on the level of protection provided by WQC,the procedures described in this document indicate thatbenthic organisms should be comparably protected fromadverse effects of endrin where endrin concentrationsin sediment are below the ESBWQC values of 5.4 µgendrin/gOC for freshwater sediments and 0.99 µgendrin/gOC for marine/estuarine sediments, exceptpossibly where a locally important species is verysensitive or sediment organic carbon is <0.2%.
The ESBs do not consider the antagonistic,additive or synergistic effects of other sedimentcontaminants in combination with endrin or thepotential for bioaccumulation and trophic transfer ofendrin to aquatic life, wildlife or humans. Consistentwith the recommendations of EPA’s Science AdvisoryBoard, publication of these documents does not implythe use of ESBs as stand-alone, pass-fail criteria for allapplications; rather, exceedances of ESBs could triggercollection of additional assessment data.
Equilibrium Partitioning Sediment Benchmarks (ESBs): Endrin
7-1
Section 7
ReferencesAdams WJ, Kimerle RA, Mosher RG. 1985. Aquaticsafety assessment of chemicals sorbed to sediments.In Cardwell RD, Purdy R, Bahner RC, eds, AquaticToxicology and Hazard Assessment: Seventh Symposium.STP 854. American Society for Testing and Materials,Philadelphia, PA, pp 429–453.
Alabaster JS, Lloyd R, eds. 1982. Mixtures oftoxicants. In Water Quality Criteria for FreshwaterFish. Butterworth Scientific, London, UK.
Anderson RL, DeFoe DL. 1980. Toxicity andbioaccumulation of endrin and methoxychlor in aquaticinvertebrates and fish. Environ Pollut (Ser A)22:111–121.
Brooke LT. 1993. Acute and chronic toxicity testing ofseveral pesticides to five species of aquatic organisms.Final Report. Environmental Research Laboratory,U.S. Environmental Protection Agency, Duluth, MN.
Brungs WA, Bailey GW. 1966. Influence of suspendedsolids on the acute toxicity of endrin to fatheadminnows. Proceedings, 21st Annual Purdue IndianaWaste Conference, Part 1. 50:4–12.
Burkhard LP. 2000. Estimating dissolved organiccarbon partition coefficients for nonionic organicchemicals. Environ Sci Technol 34:4663-4668.
Chapman GA. 1987. Establishing sediment criteria forchemicals—Regulatory perspective. In Dickson KL,Maki AW, Brungs WA, eds, Fate and Effects ofSediment-Bound Chemicals in Aquatic Systems.Pergamon Press, New York, NY, pp 355–376.
Davis HC, Hidu H. 1969. Effects of pesticides onembryonic development of clams and oysters and onsurvival and growth of the larvae. Fisheries Bull67:393–404.
De Bruijn J, Busser F, Seinen W, Hermens J. 1989.Determination of octanol/water partition coefficientsfor hydrophobic organic chemicals with the slow-stirring method. Environ Toxicol Chem 8:499–512.
DeWitt TH, Ozretich RJ, Swartz RC, Lamberson JO,Shults DW, Ditsworth GR, Jones JKP, Hoselton L,Smith LM. 1992. The influence of organic matterquality on the toxicity and partitioning of sediment-associated fluoranthene. Environ Toxicol Chem 11:197–208.
Di Toro DM. 1985. A particle interaction model ofreversible organic chemical sorption. Chemosphere14:1503–1538.
Di Toro DM, Zarba CS, Hansen DJ, Berry WJ, SwartzRC, Cowan CE, Pavlou SP, Allen HE, Thomas NA,Paquin PR. 1991. Technical basis for establishingsediment quality criteria for nonionic organicchemicals using equilibrium partitioning. EnvironToxicol Chem 10:1541–1583.
Eadsforth CV. 1986. Application of reverse-phaseHPLC for the determination of partition coefficients.Pest Sci 17:311–325.
Earnest RD, Benville PE Jr. 1972. Acute toxicities offour organo-chlorine insecticides to two species of surfperch. Calif Fish Game 58:127–132.
Eisler R. 1969. Acute toxicities of insecticides tomarine decapod crustaceans. Crustaceana 16:302–310.
Eisler R. 1970a. Factors affecting pesticide-inducedtoxicity in an estuarine fish. Technical Paper 45.Bureau of Sport Fisheries and Wildlife, U.S.Department of the Interior, Washington, DC.
Eisler R. 1970b. Acute toxicities of organochlorine andorganophosphorous insecticides to estuarine fishes.Technical Paper 46. Bureau of Sport Fisheries andWildlife. U.S. Department of the Interior,Washington, DC.
Ellington JJ, Stancil FE Jr. 1988. Octanol/waterpartition coefficients for evaluation of hazardous wasteland disposal: Selected chemicals. EPA/600/M-88/010.Environmental Research Brief. EnvironmentalResearch Laboratory, U.S. Environmental ProtectionAgency, Athens, GA.
References
7-2
El-Shaarawi AH, Dolan DM. 1989. Maximumlikelihood estimation of water quality concentrationsfrom censored data. Can J Fish Aquat Sci 47:1033–1039.
Fabacher DL. 1976. Toxicity of endrin and endrin-methyl parathion formulation to largemouth bassfingerlings. Bull Environ Contam Toxicol 16:376–378.
Grathwohl P. 1990. Influence of organic matter fromsoils and sediments from various origins on the sorptionof some chlorinated aliphatic hydrocarbons:Implications on KOC correlations. Environ Sci Technol24:1687–1693.
Gschwend PM, Wu S-c. 1985. On the constancy ofsediment-water partition coefficients of hydrophobicorganic pollutants. Environ Sci Technol 19:90-96.
Hall RJ, Swineford D. 1980. Toxic effects of endrinand toxaphene on the southern leopard frog, Ranasphenocephala. Environ Pollut (Ser A) 23:53–65.
Hansen DJ, Schimmel SC, Forester J. 1977. Endrin:Effects on the entire life-cycle of a saltwater fish,Cyprinodon variegatus. J Toxicol Environ Health 3:721–733.
Hartley D, Kidd H, eds. 1987. The AgrochemicalsHandbook. 2nd ed. Royal Society of Chemistry,University of Nottingham, England.
Henderson C, Pickering QH, Tarzwell CM. 1959.Relative toxicity of ten chlorinated hydrocarboninsecticides to four species of fish. Trans Am Fish Soc88:23–32.
Hermanutz RO. 1978. Endrin and malathion toxicity toflagfish (Jordanella floridae). Arch Environ ContamToxicol 7:159–168.
Hermanutz RO, Eaton JG, Mueller LH. 1985. Toxicityof endrin and malathion mixtures to flagfish (Jordanellafloridae). Arch Environ Contam Toxicol 14:307–314.
Hoke R, Kosian PA, Ankley GT, Cotter AM,Vandermeiden FM, Phipps GL, Durhan EJ. 1995.Check studies with Hyalella azteca and Chironomoustentans in support of the development of a sedimentquality criterion for dieldrin. Environ Toxicol Chem14:435–443.
Iglesias-Jimenez E, Poveda E, Sanchez-Martin MJ,Sanchez-Camazano M. 1997. Effect of the nature of
exogenous organic matter on pesticide sorption by thesoil. Arch Environ Contam Toxicol 33:117–124.
Jarvinen AW, Tyo RM. 1978. Toxicity to fatheadminnows of endrin in food and water. Arch EnvironContam Toxicol 7:409–421.
Jarvinen AW, Tanner DK, Kline ER. 1988. Toxicity ofchlorpyrifos, endrin or fenvalerate to fathead minnowsfollowing episodic or continuous exposure. EcotoxicolEnviron Saf 15:78–95.
Karickhoff SW, Carreira LA, Melton C, McDanielVK, Vellino AN, Nute DE. 1989. Computer predictionof chemical reactivity—The ultimate SAR. EPA/600/M-89/017. Environmental Research Brief. EnvironmentalResearch Laboratory, U.S. Environmental ProtectionAgency, Athens, GA.
Karickhoff SW, McDaniel VK, Melton C, Vellino AN,Nute DE, Carreira LA. 1991. Predicting chemicalreactivity by computer. Environ Toxicol Chem 10:1405-1416.
Karickhoff SW, Long JM. 1995. Internal report onsummary of measured, calculated, and recommendedlog KOW values. Internal Report. EnvironmentalResearch Laboratory, U.S. Environmental ProtectionAgency, Athens, GA.
Karickhoff SW, Long JM. 1996. Protocol for settingKOW values. Internal Report. Environmental ResearchLaboratory, U.S. Environmental Protection Agency,Athens, GA.
Katz M. 1961. Acute toxicity of some organicinsecticides to three species of salmonids and thethreespine stickleback. Trans Am Fish Soc 90:264–269.
Katz M, Chadwick GG. 1961. Toxicity of endrin tosome Pacific Northwest fishes. Trans Am Fish Soc90:394–397.
Keilty TJ, Stehly GR. 1989. Preliminary investigationof protein utilization by an aquatic earthworm inresponse to sublethal stress. Bull Environ ContamToxicol 43:350–354.
Keilty T, White DS, Landrum PF. 1988a. Short-termlethality and sediment avoidance assays with endrin-contaminated sediments and two oligochaetes fromLake Michigan. Arch Environ Contam Toxicol17:95–101.

Equilibrium Partitioning Sediment Benchmarks (ESBs): Endrin
7-3
Keilty TJ, White DS, Landrum PF. 1988b. Sublethalresponses to endrin in sediment by Stylodrilusheringianus (Lumbriculidae) as measured by a cesiummarker layer technique. Aquat Toxicol 13:251–270.
Korn S, Earnest RD. 1974. Acute toxicity of 20insecticides to striped bass, Morone saxatilis. CalifFish Game 60:128–131
Landrum P. 1991. Memorandum to W. Berry, U.S.Environmental Protection Agency, Narragansett, RI,May 13, 1991. 1 pp.
Lowe JI. 1966. Some effects of endrin on estuarinefishes. Proceedings, 19th Annual Conference S.E.Association Game Fish Commission, Tulsa, OK.October 10-13, 1965.
Mabey WR, Smith JH, Podoll RT, Johnson HL, Mill T,Chou TW, Gates J, Partridge IW, Jaber H, VandenbergD. 1982. Aquatic fate process data for organic prioritypollutants. EPA-440/4-81-041. Final Report. Office ofWater Regulations and Standards, U.S. EnvironmentalProtection Agency, Washington, DC.
Macek KJ, Hutchinson C, Cope OB. 1969. Effects oftemperature on the susceptibility of bluegills andrainbow trout to selected pesticides. Bull EnvironContam Toxicol 4:174–183.
Mackay D, Powers B. 1987. Sorption of hydrophobicchemicals from water: A hypothesis for the mechanismof the particle concentration effect. Chemosphere16:745–757.
Mayer FL, Ellersieck MR. 1986. Manual of acutetoxicity: Interpretation and database for 410 chemicalsand 66 species for freshwater animals. ResourcePublication 160. Fish and Wildlife Service, U.S.Department of the Interior, Washington, DC.
McCorkle FM, Chambers JE, Yarbrough JD. 1977.Acute toxicities of selected herbicides to fingerlingchannel catfish, Ictalurus punctatus. Bull EnvironContam Toxicol 18:267–270.
McLeese DW, Metcalfe CD. 1980. Toxicities of eightorganochlorine compounds in sediment and seawater toCrangon septemspinosa. Bull Environ Contam Toxicol25:921–928.
McLeese DW, Burridge LE, Dinter DJ. 1982.Toxicities of five organochlorine compounds in water
and sediment to Nereis virens. Bull Environ ContamToxicol 28:216–220.
Mount DI. 1962. Chronic effects of endrin on bluntnoseminnows and guppies. Resource Report 58. Fish andWildlife Service, U.S. Department of the Interior,Washington, DC.
National Academy of Sciences (NAS). 1973. WaterQuality Criteria, 1972. EPA-R3-73-033. NationalAcademy of Sciences, U.S. Environmental ProtectionAgency, Washington, DC.
Nebeker AV, Schuytema GS, Griffis WL, Barbitta JA,Carey LA. 1989. Effect of sediment organic carbon onsurvival of Hyalella azteca exposed to DDT and endrin.Environ Toxicol Chem 8:705–718.
Neely WB, Branson DR, Blau GE. 1974. Partitioncoefficient to measure bioconcentration potential oforganic chemicals in fish. Environ Sci Technol 8:1113–1115.
Noreen EW. 1989. Computer Intensive Methods forTesting Hypotheses: An Introduction. John Wiley andSons, New York, NY.
Poirier S, Cox D. 1991. Memorandum to R. Spehar,Environmental Research Laboratory, U.S.Environmental Protection Agency, Duluth, MN, March11, 1991. 7 pp.
Rapaport RA, Eisenreich SJ. 1984. Chromatographicdetermination of octanol-water partition coefficient(KOWs) for 58 polychlorinated biphenyls congeners.Environ Sci Technol 18:163–170.
Sanders HO. 1972. Toxicity of some insecticides to fourspecies of malacostracan crustaceans. Technical Paper66. Bureau of Sport Fisheries and Wildlife, U.S.Department of the Interior, Washington, DC.
Sanders HO, Cope OB. 1966. Toxicities of severalpesticides to two species of cladocerans. Trans Am FishSoc 95:165–169.
Sanders HO, Cope OB. 1968. The relative toxicities ofseveral pesticides to naiads of three species ofstoneflies. Limnol Oceanogr 13:112–117.
Schimmel SC, Parish PR, Hansen DJ, Patrick JM Jr,Forester J. 1975. Endrin: Effects on several estuarineorganisms. Proceedings, 28th Annual Conference S.E.

References
7-4
Association Game Fish Commission. White SulphurSprings, WV, November 17-20, 1974.
Schoettger RA. 1970. Fish-pesticide researchlaboratory, progress in sport fishery research. ResourcePublication 106. Bureau of Sport Fisheries andWildlife, U.S. Department of the Interior,Washington, DC.
Schuytema GA, Nebeker AV, Griffis WL, Miller CE.1989. Effects of freezing on toxicity of sedimentscontaminated with DDT and endrin. Environ ToxicolChem 8:883–891.
Sharom MS, Miles JR, Harris CR, McEwen FL. 1980.Persistence of 12 insecticides in water. Water Res14:1089–1093.
Stehly GR. 1992. Results of toxicity tests with Diporeiasp. exposed to endrin-contaminated sediments.Memorandum to W. Berry. U.S. EnvironmentalProtection Agency, Atlantic Ecology Division,Narragansett, RI, January 8, 1992. 1 p.
Stephan CE, Mount DI, Hansen DJ, Gentile JH,Chapman GA, Brungs WA. 1985. Guidelines forderiving numerical national water quality criteria forthe protection of aquatic organisms and their uses.PB85-227049. National Technical Information Service,Springfield, VA.
Suter SW, Mabrey JM. 1994. Toxicological benchmarksfor screening potential contaminants of concern foreffects on aquatic biota: 1994 revision. ES/ER/TM-96/RI. Oak Ridge National Laboratory, EnvironmentalSciences Division. Oak Ridge, TN.
Swartz RC. 1991. Acenaphthene and phenanthrene files.Memorandum to D. Hansen, HydroQual, Inc., Mahwah,NJ, June 26, 1991. 160 pp.
Swartz RC, Schults DW, DeWitt TH, Ditsworth GR,Lamberson JO. 1990. Toxicity of fluoranthene insediment to marine amphipods: A test of theequilibrium partitioning approach to sediment qualitycriteria. Environ Toxicol Chem 9:1071–1080.
Thurston RV, Gilfoil TA, Meyn EL, Zajdel RK, AokiTI, Veith GD. 1985. Comparative toxicity of tenorganic chemicals to ten common aquatic species.Water Res 19:1145-1155.
Tyler-Schroeder DB. 1979. Use of grass shrimp,Palaemonetes pugio in a life-cycle toxicity test. InMarking LL, Kimerle RA, eds, Aquatic Toxicology andHazard Evaluation: Second Symposium STP 667.American Society for Testing and Materials,Philadelphia, PA, pp 159–170.
U.S. Army Corps of Engineers (COE). 1991.Monitoring Program for San Francisco Bay Sediments.1988 to 1990. Memorandum to D. Di Toro, HydroQual,Inc., Mahwah, NJ, 1991.
U.S. Environmental Protection Agency. 1980. Ambientwater quality criteria for endrin. EPA 440/5-80-047.Office of Water Regulations and Standards,Washington, DC.
U.S. Environmental Protection Agency. 1985. AppendixB—Response to public comments on “Guidelines forderiving numerical national water quality criteria forthe protection of aquatic organisms and their uses.”July 19, 1985. Federal Register 50:30793–30796.
U.S. Environmental Protection Agency. 1987. Qualitycriteria for water, 1986. EPA 440/5-86-001. Office ofWater Regulations and Standards, Washington, DC.
U.S. Environmental Protection Agency. 1989a.Sediment classification methods compendium. PB92-231679. National Technical Information Service,Springfield, VA.
U.S. Environmental Protection Agency. 1989b.Handbook: Water quality control information system,STORET. Office of Water and Hazardous Materials,Washington, DC.
U.S. Environmental Protection Agency. 1999. Nationalrecommended water quality criteria—Correction. EPA-822-2-99-001. April 1999. Washington, DC.
U.S. Environmental Protection Agency. 2000.Comment response document for the proposedequilibrium partitioning sediment guidelines for theprotection of benthic organisms. Office of Water, Officeof Science and Tecnhology, Washington, DC. (draft)
U.S. Environmental Protection Agency. 2003a.Technical basis for the derivation of equilibriumpartitioning sediment benchmarks (ESBs) for theprotection of benthic organisms: Nonionic organics.EPA-600-R-02-014. Office of Research andDevelopment, Washington, DC. (draft)

Equilibrium Partitioning Sediment Benchmarks (ESBs): Endrin
7-5
U.S. Environmental Protection Agency. 2003b.Procedures for the derivation of site-specificequilibrium partitioning sediment benchmarks (ESBs)for the protection of benthic organisms: Nonionicorganics. EPA-600-R-02-012. Office of Research andDevelopment, Washington, DC. (draft)
U.S. Environmental Protection Agency. 2003c.Procedures for the derivation of equilibriumpartitioning sediment benchmarks (ESBs) for theprotection of benthic organisms: Dieldrin. EPA-600-R-02-010. Office of Research and Development,Washington, DC. (draft)
U.S. Environmental Protection Agency. 2003dProcedures for the derivation of equilibrium partitioningsediment benchmarks (ESBs) for the protection ofbenthic organisms: Metal mixtures (cadmium, copper,lead, nickel, silver, and zinc). EPA-600-R-02-011.Office of Research and Development, Washington, DC.(draft)
U.S. Environmental Protection Agency. 2003e.Procedures for the derivation of equilibrium partitioningsediment benchmarks (ESBs) for the protection ofbenthic organisms: PAH mixtures. EPA-600-R-02-013.Office of Research and Development, Washington, DC.(draft)
U.S. Environmental Protection Agency. 2003f.Procedures for the derivation of equilibrium partitioningsediment benchmarks (ESBs) for the protection ofbenthic organisms: Nonionics compendium. EPA-600-R-02-016. Office of Research and Development,Washington, DC. (draft)
Wang YS. 1988. The contamination andbioconcentration of aldrin, dieldrin and endrin in lowerlakes at Rocky Mountain Arsenal. PhD thesis. ColoradoState University, Fort Collins, CO.
Xing B, McGill WB, Dudas MJ. 1994. Cross-correlation of polarity curves to predict partitioncoefficients of nonionic organic contaminants. EnvironSci Technol 28:1929–1933.

Appendix ASummary of Acute Values for Endrin used to
Calculate the WQC FCV forFreshwater and Saltwater Species
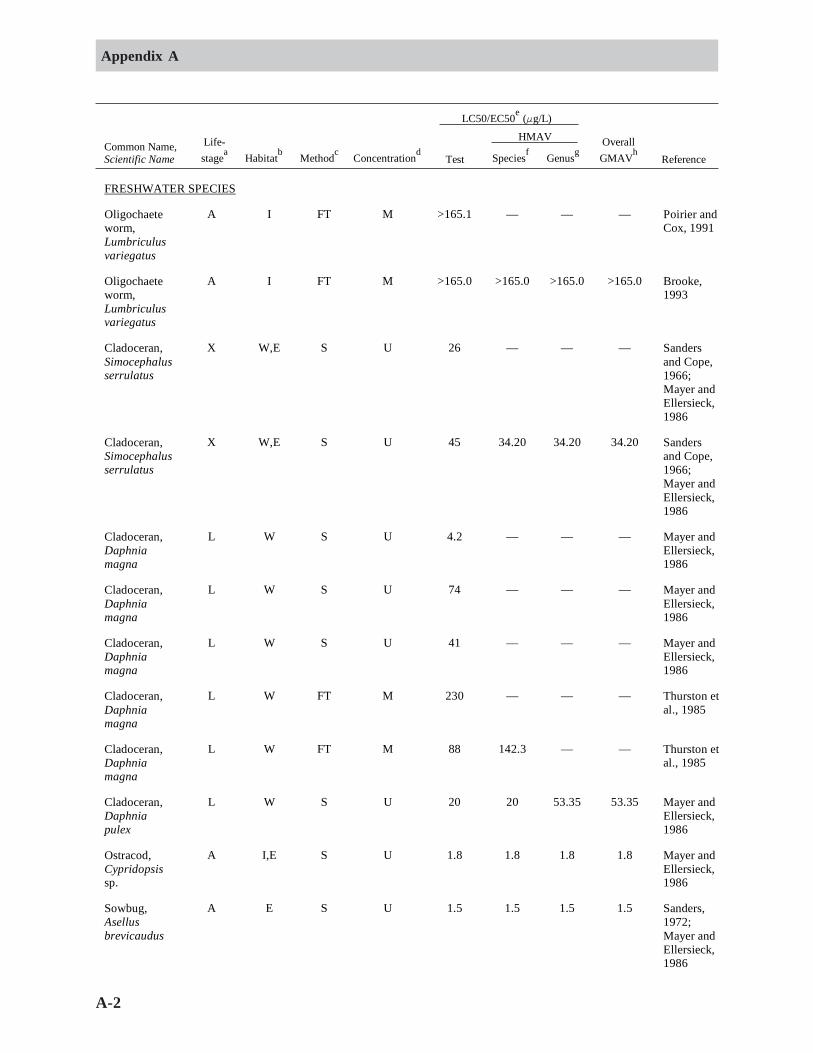
Appendix A
A-2
LC50/EC50e (Fg/L) HMAV
Common Name, Scientific Name
Life-stagea Habitatb Methodc Concentrationd Test Speciesf Genusg
Overall GMAVh Reference
FRESHWATER SPECIES
Oligochaete worm, Lumbriculus variegatus
A I FT M >165.1 — — — Poirier and Cox, 1991
Oligochaete worm, Lumbriculus variegatus
A I FT M >165.0 >165.0 >165.0 >165.0 Brooke, 1993
Cladoceran, Simocephalus serrulatus
X W,E S U 26 — — — Sanders and Cope, 1966; Mayer and Ellersieck, 1986
Cladoceran, Simocephalus serrulatus
X W,E S U 45 34.20 34.20 34.20 Sanders and Cope, 1966; Mayer and Ellersieck, 1986
Cladoceran, Daphnia magna
L W S U 4.2 — — — Mayer and Ellersieck, 1986
Cladoceran, Daphnia magna
L W S U 74 — — — Mayer and Ellersieck, 1986
Cladoceran, Daphnia magna
L W S U 41 — — — Mayer and Ellersieck, 1986
Cladoceran, Daphnia magna
L W FT M 230 — — — Thurston et al., 1985
Cladoceran, Daphnia magna
L W FT M 88 142.3 — — Thurston et al., 1985
Cladoceran, Daphnia pulex
L W S U 20 20 53.35 53.35 Mayer and Ellersieck, 1986
Ostracod, Cypridopsis sp.
A I,E S U 1.8 1.8 1.8 1.8 Mayer and Ellersieck, 1986
Sowbug, Asellus brevicaudus
A E S U 1.5 1.5 1.5 1.5 Sanders, 1972; Mayer and Ellersieck, 1986

Equilibrium Partitioning Sediment Benchmarks (ESBs): Endrin
A-3
LC50/EC50e (Fg/L) HMAV
Common Name, Scientific Name
Life-stagea Habitatb Methodc Concentrationd Test Speciesf Genusg
Overall GMAVh Reference
Scud, Gammarus fasciatus
A E S U 4.3 — — — Sanders, 1972; Mayer and Ellersieck, 1986
Scud, Gammarus fasciatus
X E S U 1.3 — — — Sanders, 1972; Mayer and Ellersieck, 1986
Scud, Gammarus fasciatus
X E FT U 5.5 3.133 — — Sanders, 1972
Scud, Gammarus lacustris
A E S U 3.0 3.0 3.066 3.066 Sanders, 1972; Mayer and Ellersieck, 1986
Glass shrimp, Palaemonetes kadiakensis
A E S U 3.2 — — — Sanders, 1972; Mayer and Ellersieck, 1986
Glass shrimp, Palaemonetes kadiakensis
X E FT U 0.5 1.265 1.265 1.265 Sanders, 1972; Mayer and Ellersieck, 1986
Crayfish, Orconectes immunis
J E FT M >89 >89 — — Thurston et al., 1985
Crayfish, Orconectes nais
X E S U 320 — — — Sanders, 1972; Mayer and Ellersieck, 1986
Crayfish, Orconectes nais
J E S U 3.2 3.2 3.2 16.88 Sanders, 1972; Mayer and Ellersieck, 1986
Mayfly, Baetis sp.
J I S U 0.90 0.90 0.90 0.90 Mayer and Ellersieck, 1986
Mayfly, Hexagenia bilineata
J I S U 62 62.99 62.99 62.99 Mayer and Ellersieck, 1986
Mayfly, Hexagenia bilineata
X I S U 64 — — — Sanders, 1972
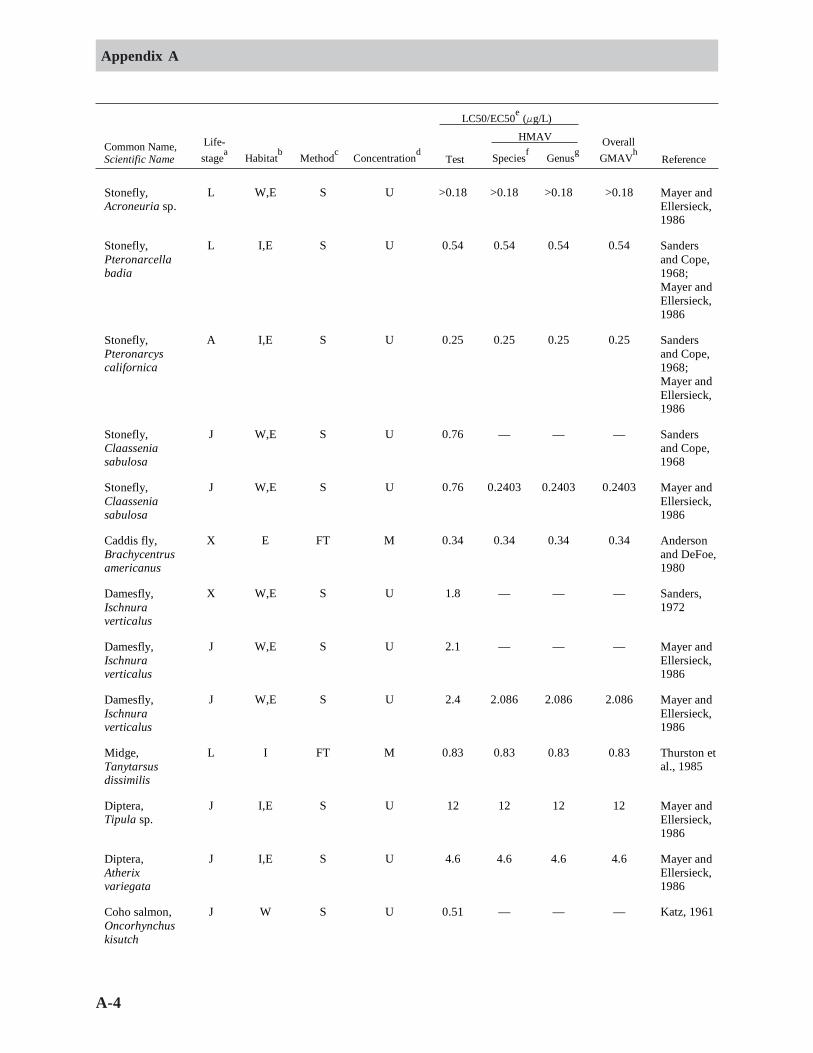
Appendix A
A-4
LC50/EC50e (Fg/L) HMAV
Common Name, Scientific Name
Life-stagea Habitatb Methodc Concentrationd Test Speciesf Genusg
Overall GMAVh Reference
Stonefly, Acroneuria sp.
L W,E S U >0.18 >0.18 >0.18 >0.18 Mayer and Ellersieck, 1986
Stonefly, Pteronarcella badia
L I,E S U 0.54 0.54 0.54 0.54 Sanders and Cope, 1968; Mayer and Ellersieck, 1986
Stonefly, Pteronarcys californica
A I,E S U 0.25 0.25 0.25 0.25 Sanders and Cope, 1968; Mayer and Ellersieck, 1986
Stonefly, Claassenia sabulosa
J W,E S U 0.76 — — — Sanders and Cope, 1968
Stonefly, Claassenia sabulosa
J W,E S U 0.76 0.2403 0.2403 0.2403 Mayer and Ellersieck, 1986
Caddis fly, Brachycentrus americanus
X E FT M 0.34 0.34 0.34 0.34 Anderson and DeFoe, 1980
Damesfly, Ischnura verticalus
X W,E S U 1.8 — — — Sanders, 1972
Damesfly, Ischnura verticalus
J W,E S U 2.1 — — — Mayer and Ellersieck, 1986
Damesfly, Ischnura verticalus
J W,E S U 2.4 2.086 2.086 2.086 Mayer and Ellersieck, 1986
Midge, Tanytarsus dissimilis
L I FT M 0.83 0.83 0.83 0.83 Thurston et al., 1985
Diptera, Tipula sp.
J I,E S U 12 12 12 12 Mayer and Ellersieck, 1986
Diptera, Atherix variegata
J I,E S U 4.6 4.6 4.6 4.6 Mayer and Ellersieck, 1986
Coho salmon, Oncorhynchus kisutch
J W S U 0.51 — — — Katz, 1961

Equilibrium Partitioning Sediment Benchmarks (ESBs): Endrin
A-5
LC50/EC50e (Fg/L) HMAV
Common Name, Scientific Name
Life-stagea Habitatb Methodc Concentrationd Test Speciesf Genusg
Overall GMAVh Reference
Coho salmon, Oncorhynchus kisutch
J W S U 0.089 — — — Mayer and Ellersieck, 1986
Coho salmon, Oncorhynchus kisutch
J W S U 0.27 0.2306 — — Katz and Chadwick, 1961
Cutthroat trout, Oncorhynchus clarki
J W S U >1.0 >1.0 — — Mayer and Ellersieck, 1986
Rainbow trout, Oncorhynchus mykiss
J W S U 0.74 — — — Mayer and Ellersieck, 1986
Rainbow trout, Oncorhynchus mykiss
J W S U 0.75 — — — Mayer and Ellersieck, 1986
Rainbow trout, Oncorhynchus mykiss
J W S U 0.75 — — — Mayer and Ellersieck, 1986
Rainbow trout, Oncorhynchus mykiss
J W S U 2.4 — — — Mayer and Ellersieck, 1986
Rainbow trout, Oncorhynchus mykiss
J W S U 1.4 — — — Mayer and Ellersieck, 1986
Rainbow trout, Oncorhynchus mykiss
J W S U 1.11 — — — Mayer and Ellersieck, 1986
Rainbow trout, Oncorhynchus mykiss
J W S U 1.1 — — — Macek et al., 1969
Rainbow trout, Oncorhynchus mykiss
J W S U 0.58 — — — Katz, 1961
Rainbow trout, Oncorhynchus mykiss
J W S U 0.90 — — — Katz and Chadwick, 1961
Rainbow trout, Oncorhynchus mykiss
J W FT M 0.33 0.33 — — Thurston et al., 1985
Chinook salmon, Oncorhynchus tshawytscha
J W S U 1.2 — — — Katz, 1961

Appendix A
A-6
LC50/EC50e (Fg/L) HMAV
Common Name, Scientific Name
Life-stagea Habitatb Methodc Concentrationd Test Speciesf Genusg
Overall GMAVh Reference
Chinook salmon, Oncorhynchus tshawytscha
J W S U 0.92 1.051 >0.5318 >0.5318 Katz and Chadwick, 1961
Goldfish, Carassius auratus
J W S U 2.1 — — — Henderson et al., 1959
Goldfish, Carassius auratus
J W FT U 0.44 — — — Mayer and Ellersieck, 1986
Goldfish, Carassius auratus
J W FT M 0.95 0.95 0.95 0.95 Thurston et al., 1985
Carp, Cyprinus carpio
J W FT U 0.32 0.32 0.32 0.32 Mayer and Ellersieck, 1986
Fathead minnow, Pimephales promelas
J W S U 1.1 — — — Henderson et al., 1959
Fathead minnow, Pimephales promelas
J W S U 1.4 — — — Henderson et al., 1959
Fathead minnow, Pimephales promelas
L W S U 0.7 — — — Jarvinen et al., 1988
Fathead minnow, Pimephales promelas
J W S U 1.8 — — — Mayer and Ellersieck, 1986
Fathead minnow, Pimephales promelas
J W FT U 0.24 — — — Mayer and Ellersieck, 1986
Fathead minnow, Pimephales promelas
J W FT M 0.50 — — — Brungs and Bailey, 1966
Fathead minnow, Pimephales promelas
U — FT M 0.49 — — — Brungs and Bailey, 1966
Fathead minnow, Pimephales promelas
J W FT M 0.40 — — — Brungs and Bailey, 1966

Equilibrium Partitioning Sediment Benchmarks (ESBs): Endrin
A-7
LC50/EC50e (Fg/L) HMAV
Common Name, Scientific Name
Life-stagea Habitatb Methodc Concentrationd Test Speciesf Genusg
Overall GMAVh Reference
Fathead minnow, Pimephales promelas
J W FT M 0.45 — — — Brungs and Bailey, 1966
Fathead minnow, Pimephales promelas
J W FT M 0.64 0.4899 0.4899 0.4899 Thurston et al., 1985
Black bullhead, Ictalurus melas
J W,E S U 1.13 — — — Mayer and Ellersieck, 1986
Black bullhead, Ictalurus melas
J W,E FT M 0.45 0.45 — — Anderson and DeFoe, 1980
Channel catfish, Ictalurus punctatus
J W,E S U 0.32 — — — Mayer and Ellersieck, 1986
Channel catfish, Ictalurus punctatus
J W,E S U 1.9 — — — Mayer and Ellersieck, 1986
Channel catfish, Ictalurus punctatus
J W,E S U 0.8 — — — McCorkle et al., 1977
Channel catfish, Ictalurus punctatus
J W,E FT M 0.43 — — — Thurston et al., 1985
Channel catfish, Ictalurus punctatus
J W,E FT M 0.41 0.4199 0.4347 0.4347 Thurston et al., 1985
Flagfish, Jordanella floridae
J W FT M 0.85 0.85 0.85 0.85 Hermanutz, 1978; Hermanutz et al., 1985
Mosquitofish, Gambusia affinis
J W S U 1.1 — — — Mayer and Ellersieck, 1986
Mosquitofish, Gambusia affinis
X W S U 0.75 — — — Katz and Chadwick, 1961

Appendix A
A-8
LC50/EC50e (Fg/L) HMAV
Common Name, Scientific Name
Life-stagea Habitatb Methodc Concentrationd Test Speciesf Genusg
Overall GMAVh Reference
Mosquitofish, Gambusia affinis
J W FT M 0.69 0.69 0.69 0.69 Thurston et al., 1985
Guppy, Poecilia reticulata
X W S U 0.90 — — — Katz and Chadwick, 1961
Guppy, Poecilia reticulata
X W S U 1.6 1.200 1.200 1.200 Henderson et al., 1959
Bluegill, Lepomis macrochirus
J W S U 0.60 — — — Katz and Chadwick, 1961
Bluegill, Lepomis macrochirus
J W S U 8.25 — — — Katz and Chadwick, 1961
Bluegill, Lepomis macrochirus
J W S U 5.5 — — — Katz and Chadwick, 1961
Bluegill, Lepomis macrochirus
J W S U 2.4 — — — Katz and Chadwick, 1961
Bluegill, Lepomis macrochirus
J W S U 1.65 — — — Katz and Chadwick, 1961
Bluegill, Lepomis macrochirus
J W S U 0.86 — — — Katz and Chadwick, 1961
Bluegill, Lepomis macrochirus
J W S U 0.33 — — — Katz and Chadwick, 1961
Bluegill, Lepomis macrochirus
J W S U 0.61 — — — Macek et al., 1969; Mayer and Ellersieck, 1986
Bluegill, Lepomis macrochirus
J W S U 0.41 — — — Macek et al., 1969; Mayer and Ellersieck, 1986
Bluegill, Lepomis macrochirus
J W S U 0.37 — — — Macek et al., 1969; Mayer and Ellersieck, 1986

Equilibrium Partitioning Sediment Benchmarks (ESBs): Endrin
A-9
LC50/EC50e (Fg/L) HMAV
Common Name, Scientific Name
Life-stagea Habitatb Methodc Concentrationd Test Speciesf Genusg
Overall GMAVh Reference
Bluegill, Lepomis macrochirus
J W S U 0.53 — — — Mayer and Ellersieck, 1986
Bluegill, Lepomis macrochirus
J W S U 0.73 — — — Mayer and Ellersieck, 1986
Bluegill, Lepomis macrochirus
J W S U 0.68 — — — Mayer and Ellersieck, 1986
Bluegill, Lepomis macrochirus
J W S U 0.19 — — — Mayer and Ellersieck, 1986
Bluegill, Lepomis macrochirus
J W S U 0.66 — — — Henderson et al., 1959
Bluegill, Lepomis macrochirus
U — S U 0.61 — — — Sanders, 1972
Bluegill, Lepomis macrochirus
J W FT M 0.19 — — — Thurston et al., 1985
Bluegill, Lepomis macrochirus
J W FT M 0.23 — — — Thurston et al., 1985
Largemouth bass, Micropterus dolomieu
J W S U 0.31 0.31 0.31 0.31 Mayer and Ellersieck, 1986
Yellow perch, Perca flavescens
J W FT U 0.15 0.15 0.15 0.15 Mayer and Ellersieck, 1986
Tilapia, Tilapia mossambica
J W S U <5.6 <5.6 <5.6 <5.6 Mayer and Ellersieck, 1986
Bullfrog, Rana catesbiana
L E FT M 2.5 2.5 — — Thurston et al., 1985
Southern leopard frog, Rana sphenocephala
E W FT M 25 25 2.5(E) 25(W)
7.906 Hall and Swineford, 1980
Fowler’s toad, Bufo fowleri
L E S U 120 120 120 120 Mayer and Ellersieck, 1986

Appendix A
A-10
LC50/EC50e (Fg/L) HMAV
Common Name, Scientific Name
Life-stagea Habitatb Methodc Concentrationd Test Speciesf Genusg
Overall GMAVh Reference
Western chorus frog, Psuedocris triseriata
L E S U 180 180 180 180 Mayer and Ellersieck, 1986
SALTWATER SPECIES
Eastern oyster, Crassostrea virginica
E,L W S U 790i 790 790 790 Davis and Hidu, 1969
Sand shrimp, Crangon septemspinosa
A E S U 1.7 1.7 1.7 1.7 Eisler, 1969
Hermit crab, Pagurus longicarpus
A E S U 12 12 12 12 Eisler, 1969
Korean shrimp, Palaemon macrodactylus
A W,E S U 4.7 — — — Schoettger, 1970
Korean shrimp, Palaemon macrodactylus
A W,E FT U 0.3 1.187 1.187 1.187 Schoettger, 1970
Grass shrimp, Palaemonetes pugio
L W FT M 1.2 — — — Tyler-Schroeder, 1979
Grass shrimp, Palaemonetes pugio
J W FT M 0.35 — — — Tyler-Schroeder, 1979
Grass shrimp, Palaemonetes pugio
A W,E FT M 0.69 — — — Tyler-Schroeder, 1979
Grass shrimp, Palaemonetes pugio
A W,E FT M 0.63 0.6536 — — Schimmel et al., 1975
Grass shrimp, Palaemonetes vulgaris
A W,E S U 1.8 1.8 1.085 1.085 Eisler, 1969
Pink shrimp, Penaeus duorarum
A I,E FT M 0.037 0.037 0.037 0.037 Schimmel et al., 1975
American eel, Anguilla rostrata
J E S U 0.6 0.6 0.6 0.6 Eisler, 1969

Equilibrium Partitioning Sediment Benchmarks (ESBs): Endrin
A-11
LC50/EC50e (Fg/L) HMAV
Common Name, Scientific Name
Life-stagea Habitatb Methodc Concentrationd Test Speciesf Genusg
Overall GMAVh Reference
Chinook salmon, Oncorhynchus tshawytscha
J W FT U 0.048 0.048 0.048 0.048 Schoettger, 1970
Sheepshead minnow, Cyprinodon variegatus
J W,E FT M 0.37 — — — Hansen et al., 1977
Sheepshead minnow, Cyprinodon variegatus
J W,E FT M 0.34 — — — Hansen et al., 1977
Sheepshead minnow, Cyprinodon variegatus
A W,E FT M 0.36 — — — Hansen et al., 1977
Sheepshead minnow, Cyprinodon variegatus
J W,E FT M 0.38 0.3622 0.3622 0.3622 Schimmel et al., 1975
Mummichog, Fundulus heteroclitus
A W,E S U 0.6 — — — Eisler, 1970b
Mummichog, Fundulus heteroclitus
A W,E S U 1.5 0.9487 — — Eisler, 1970b
Striped killifish, Fundulus majalis
J W,E S U 0.3 0.3 0.5334 0.5334 Eisler, 1970b
Sailfin molly, Poecilia latipinna
A W FT M 0.63 0.63 0.63 0.63 Schimmel et al., 1975
Atlantic silverside, Menidia menidia
J W S U 0.05 0.05 0.05 0.05 Eisler, 1970b
Threespine stickleback, Gasterosteus aculeatus
J W,E S U 1.65 — — — Katz and Chadwick, 1961
Threespine stickleback, Gasterosteus aculeatus
J W,E S U 1.50 — — — Katz and Chadwick, 1961

Appendix A
A-12
LC50/EC50e (Fg/L) HMAV
Common Name, Scientific Name
Life-stagea Habitatb Methodc Concentrationd Test Speciesf Genusg
Overall GMAVh Reference
Threespine stickleback, Gasterosteus aculeatus
J W,E S U 1.20 — — — Katz and Chadwick, 1961
Threespine stickleback, Gasterosteus aculeatus
J W,E S U 1.57 — — — Katz and Chadwick, 1961
Threespine stickleback, Gasterosteus aculeatus
J W,E S U 1.57 — — — Katz and Chadwick, 1961
Threespine stickleback, Gasterosteus aculeatus
J W,E S U 0.44 — — — Katz, 1961
Threespine stickleback, Gasterosteus aculeatus
J W,E S U 0.50 1.070 1.070 1.070 Katz, 1961
Striped bass, Morone saxatilis
J E FT U 0.094 0.094 0.094 0.094 Korn and Earnest, 1974
Shiner perch, Cymatogaster aggregata
J W S U 0.8 — — — Earnest and Benville, 1972
Shiner perch, Cymatogaster aggregata
J W FT U 0.12 0.3098 0.3098 0.3098 Earnest and Benville, 1972
Dwarf perch, Micrometrus minimus
A W S U 0.6 — — — Earnest and Benville, 1972
Dwarf perch, Micrometrus minimus
A W FT U 0.13 0.2793 0.2793 0.2793 Earnest and Benville, 1972
Bluehead, Thalassoma bifasciatum
A W S U 0.1 0.1 0.1 0.1 Eisler, 1970b

Equilibrium Partitioning Sediment Benchmarks (ESBs): Endrin
A-13
LC50/EC50e (Fg/L) HMAV
Common Name, Scientific Name
Life-stagea Habitatb Methodc Concentrationd Test Speciesf Genusg
Overall GMAVh Reference
aLife-stage: A = adult, J = juvenile, L = larvae, E = embryo, U = life-stage and habitat unknown, X = life-stage unknown but habitat known.bHabitat: I = infauna, E = epibenthic, W = water column.cMethod: S = static, R = renewal, FT = flow-through.dConcentration: U = unmeasured (nominal), M = chemical measured.eAcute value: 96-hour LC50 or EC50, except for 48-hour EC50 for cladocera, barnacles, and bivalve molluscs (Stephan et al., 1985).fHMAV species: Habitat Mean Acute Value - Species is the geometric mean of acute values by species by habitat (epibenthic, infaunal, and water column).gHMAV genus: Geometric mean of HMAV for species within a genus.hOverall GMAV: Geometric mean of acute values across species, habitats, and life-stages within the genus.iAbnormal development of oyster larvae.
Striped mullet, Mugil cephalus
A E S U 0.3 0.3 0.3 0.3 Eisler, 1970b
Northern puffer, Sphaeroides maculatus
A W S U 3.1 3.1 3.2 3.1 Eisler, 1970b

Appendix BSummary of Data from Sediment-Spiking
Experiments with Endrin (Data from theseexperiments were used to calculate K
OC values
(Figure 2-2) and to compare mortalities of amphipodswith interstitial water toxic units (Figure 4-1) and
predicted sediment toxic units (Figure 4-2)).
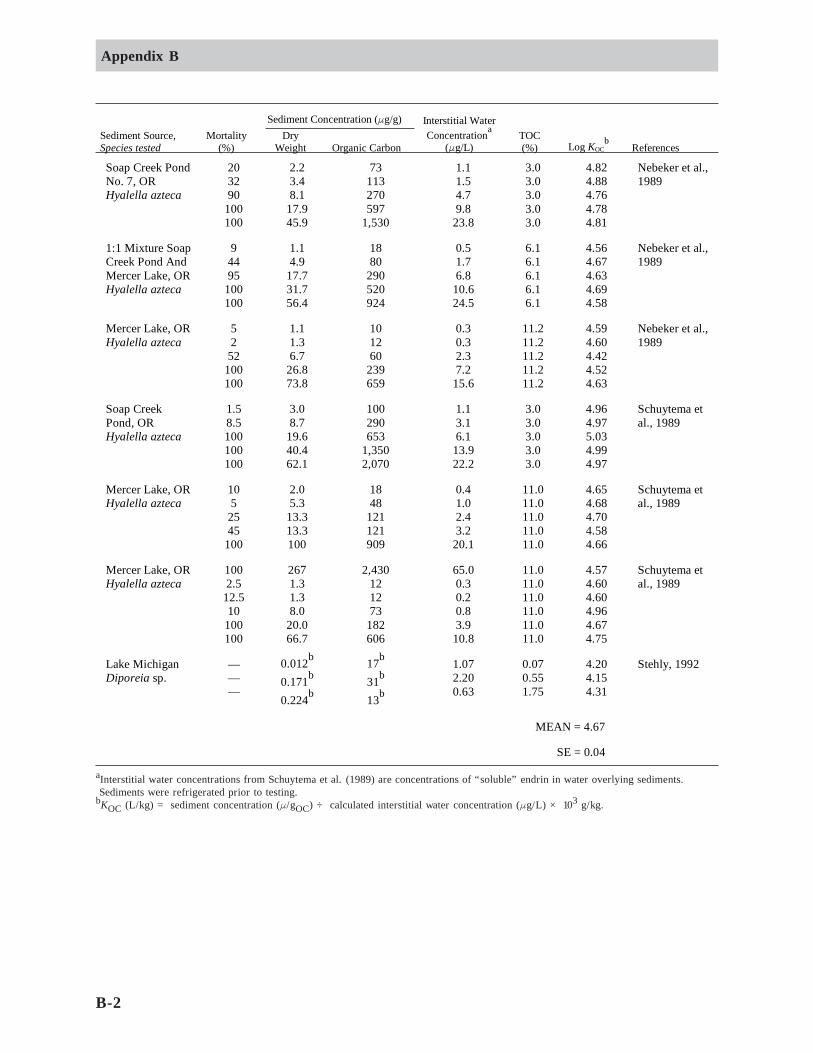
Appendix B
B-2
aInterstitial water concentrations from Schuytema et al. (1989) are concentrations of “soluble” endrin in water overlying sediments. Sediments were refrigerated prior to testing.bKOC (L/kg) = sediment concentration (F/gOC) ÷ calculated interstitial water concentration (Fg/L) × 103 g/kg.
Soap Creek Pond No. 7, OR Hyalella azteca
20 32 90
100 100
2.2 3.4 8.1
17.9 45.9
73 113 270 597
1,530
1.1 1.5 4.7 9.8
23.8
3.0 3.0 3.0 3.0 3.0
4.82 4.88 4.76 4.78 4.81
Nebeker et al., 1989
1:1 Mixture Soap Creek Pond And Mercer Lake, OR Hyalella azteca
9 44 95
100 100
1.1 4.9
17.7 31.7 56.4
18 80
290 520 924
0.5 1.7 6.8
10.6 24.5
6.1 6.1 6.1 6.1 6.1
4.56 4.67 4.63 4.69 4.58
Nebeker et al., 1989
Mercer Lake, OR Hyalella azteca
5 2
52 100 100
1.1 1.3 6.7
26.8 73.8
10 12 60
239 659
0.3 0.3 2.3 7.2
15.6
11.2 11.2 11.2 11.2 11.2
4.59 4.60 4.42 4.52 4.63
Nebeker et al., 1989
Soap Creek Pond, OR Hyalella azteca
1.5 8.5 100 100 100
3.0 8.7
19.6 40.4 62.1
100 290 653
1,350 2,070
1.1 3.1 6.1
13.9 22.2
3.0 3.0 3.0 3.0 3.0
4.96 4.97 5.03 4.99 4.97
Schuytema et al., 1989
Mercer Lake, OR Hyalella azteca
10 5
25 45
100
2.0 5.3
13.3 13.3 100
18 48
121 121 909
0.4 1.0 2.4 3.2
20.1
11.0 11.0 11.0 11.0 11.0
4.65 4.68 4.70 4.58 4.66
Schuytema et al., 1989
Mercer Lake, OR Hyalella azteca
100 2.5
12.5 10
100 100
267 1.3 1.3 8.0
20.0 66.7
2,430 12 12 73
182 606
65.0 0.3 0.2 0.8 3.9
10.8
11.0 11.0 11.0 11.0 11.0 11.0
4.57 4.60 4.60 4.96 4.67 4.75
Schuytema et al., 1989
Lake Michigan Diporeia sp.
— — —
0.012b 0.171b 0.224b
17b 31b 13b
1.07 2.20 0.63
0.07 0.55 1.75
4.20 4.15 4.31
Stehly, 1992
MEAN = 4.67
SE = 0.04
Sediment Concentration (Fg/g) Sediment Source, Species tested
Mortality (%)
Dry Weight Organic Carbon
Interstitial Water Concentrationa
(Fg/L) TOC (%) Log KOC
b References

Appendix CQuality Assurance Summary for the ESB Document:
Procedures for the derivation of equilibriumpartitioning sediment benchmarks (ESBs)
for the protection of benthic organisms: Endrin
C-1

All data were obtained either from the WQC document for endrin (USEPA, 1980) or from acomprehensive literature search completed in 1995.
All data used in the example benchmark calculations were evaluated for acceptability using theprocedures outlined in the Stephan et al. (1985): Guidelines for deriving numerical nationalwater quality criteria for the protection of aquatic organisms and their uses. Data notmeeting the criteria were rejected. All calculations were made using the procedures in Stephanet al. (1985). All calculations were checked by at least one other EPA scientist and then thedocument was distributed for public comment. All data and intermediate values are presented intables in the document, and all original data were made available as part of the public commentprocess. Any errors of omission or calculation discovered during the public comment processwere corrected and included in the revised document and can be found in Comment ResponseDocument for the Proposed Equilibrium Partitioning Sediment Guidelines for the Protectionof Benthic Organisms. Office of Water, Office of Science & Technology, (U.S. EPA, 2000).
Hard copies of all literature cited in this document reside at ORD/NHEERL Atlantic EcologyDivision - Narragansett, Rhode Island.
C-2