agency mbs prepayment model using neural networks
TRANSCRIPT
Machine Learning in Finance Workshop 2020
AGENCY MBS PREPAYMENT MODEL USING NEURAL
NETWORKS Jiawei “David” Zhang
MSCI

-
AGENCY MBS PREPAYMENT MODEL USING NEURAL NETWORKS
Columbia Bloomberg Machine Learning in Finance 2020
David Zhang
MSCI Securitized Products Research
© 2016 MSCI Inc. All rights reserved. Please refer to the disclaimer at the end of this document.
— GENERAL —

Zhang, PhD
ewYork
MANAGING DIRECTOR, HEAD OF
SECURITIZED PRODUCTS RESEARCH
212. 981. 7464
MSCII
Speaker
David Zhang is a Managing Director and Head of Securitized Products Research at MSCI. His
team is responsible for developing models and analytics to support investment analysis, risk
management, and regulatory compliance. Before joining MSCI, Dr Zhang was Managing
Director and head of Securitized Products modeling at Credit Suisse for more than a decade. At
Credit Suisse he was responsible for supporting risk, regulatory and client analytics as well as
sales/trading quantitative strategies. Dr Zhang’s group developed one of the most widely used
MBS models by fixed income institutional investors. Their work was consistently awarded top
ranking by various industry and client surveys, including Institutional Investor All-America
Research Team ranking in Agency prepayment. They also won the award for best paper by the
American Real Estate Society for research on effectiveness of government mortgage programs
The regulatory projects Dr Zhang lead at Credit Suisse included developing models for CCAR
and PPNR (Pre-Provision Net revenue), Dodd-Frank IHC (Intermediate Holding Company) and
related VaR, RWA and RBPL modeling, and FRTB (Fundamental Review of Trading
Book). Prior to Credit Suisse, Dr Zhang worked at FreddieMac, CIBC Oppenheimer, and
University of Chicago. He holds leadership positions at PRMIA (Professional Risk Management
International Association) and GCREC (Global Chinese Real Estate Congress). He is a frequent
speaker at industry and academic conferences, and his research on risk, financial modeling and
real estate has been published in many academic journals. Dr Zhang has a Ph.D. from Princeton
University.
3

SUMMARY: NEURAL NETWORKS AGENCY MBS PREPAYMENT MODEL
Why a machine learning model for Agency MBS? • Prepayment is a highly complex and non-linear process with many idiosyncratic risk factors, among the most
complex financial models
• Recent development in computational software and hardware enable us to make significant advancement in AI prepayment models
• Machine learning models have excelled in many areas, such as image recognition, natural language processing, fraud detection, etc.
What is the model and what have we learned?
• Deep neural network model applied to pool level agency MBS prepayment data, compared with MSCI1 (the
human model)
• Results show the deep learning model is able to capture very complex prepayment patterns and signals with
extremely high computational efficiency
— GENERAL — 4

MACHINE LEARNING IN FINANCE
• Consumer credit risk models via Machine-Learning Algorithms (Dr. Andrew Lo, 2010)
Using machine-learning model for consumer credit default and delinquency
Generalized classification and regression trees
Accurately forecasted credit events 3 to 12 months in advance
• Risk and risk management in credit card industry (Dr. Andrew Lo, 2016)
Analyzed very large dataset consisting of credit card data from six large banks.
Decision trees and random forests model perform better than logistic regression at short time horizon
• Deep learning for mortgage risk (Dr. Kay Giesechke, 2015-2018)
Using deep neural network to model mortgage prepayment, delinquency and foreclosure
Loan level data
Compared NNM with a logit model
— GENERAL — 5

MSCI •-
US Bond Market 2018 (42.4$Tn) Federal Agency
Securities Money Markets 1.05
Mortgage Related 9.66
US Bond Market 2007 (29.5$Tn}
Money Markets 1.79
AgencyMBS 5.80
US BOND MARKET
— GENERAL — 6

MODELING OBJECTIVE
Forecast prepayment rate for agency RMBS pools
SMM : Single Monthly Mortality Rate
CPR: Conditional Prepayment Rate
Agencies report last month’s prepayment speed on the 4th business day of each month.
Prepayment types:
─ Rate refinance
─ House turnover
─ Cash-out
─ Curtailment
─ Buyout
— GENERAL — 7

MORTGAGE PREPAYMENT MODELING: SCIENCE AND CRAFTSMANSHIP
Difficulties with mortgage prepayment modeling
• Large data sets: ~20-2000 G data, Agency MBS covers ~400,000 pools/100+mm loans performance over 20-30 years, pool/loan variables ~30-100
• Multiple, highly non-linear and interactive risk drivers (“layered risk”)
• Loan size vs. prepayment is function of moneyness
• Age vs. prepayment is function of past moneyness history
• Loan purpose (refi vs purchase) vs. prepayment is function of origination year
• ….
• Regime changes
• Mortgage credit and borrower risk appetite cycles, and business practice affect absolute level and risk drivers for prepayment/default
— GENERAL — 8

•
MSCII
• • • • • • •1•• . ,, ...
• • • .. ·- ..
I • • •
• • •
Agency MBS prepayment
• Complex behaviors
– 30–100 risk factors: rates, loan size, GEO, purpose, property, HPA….
– “layered risk”- non-linear interaction (e.g., loan size vs moneyness, purpose vs. origination year, ..)
– Regime changes: behavior, policy
– Statistical noises
• Large data set to model
– 400,000 pools/100m loans, 30yr
• Modelers as craftsman?
– Idiosyncratic modeler risk
Po
ol c
ou
nt
Mo
de
l C
PR
50
40
30
20
10
0
0 10 20 30 40 50 60 70 80
Actual CPR
Model CPR distribution
1,000
800
600
400
200
0
CPR range
90-100bps ITM FNCL 4s pool speeds
9

Architecture* Hidden
Input layer
r1 r .. :!'.1 = mox(A 1K I B,.,0) :!'.'... - mlll:'.(Ani' ,-i + Bn, 0)
Vilhtes ot hirJden lilyers ilrP. generilterJ hy Mtiviltion functions with previous layers as inputs, and weights and
biases as parameters
•Example of a Neural Network archite.cture Q Node
MSCII
Model training 1 Select a set of training data:
inputs togP.thP.r with correct/actual output
2 Pass training Al Model data through the network to obtain predicled output
T wea~ weiqttls tmcl biases using gradient function
Actual Output
3 reedforward pass: compare ilr.t ual Oll tp11t With pred i r.tP.rl output ilnd determinP. cost function based on the error rnlc::u I aterJ
Predicted MeP.ts Output Ctiteria? --~o•Y•••I
4 Backward propagation: oplirniLe weiqhls am.I I.Jiases (p,:H c1meler s) until some stopping condition has been met by passing the error si nal throu h the network usin radient function
AI agency MBS prepayment model
Deep neural network model
• Feed forward neural network – Applied successfully in many other fields
– Layers and nodes, hyper-parameters
– Ensemble techniques, bagging and boosting
• Competing vs. “human” /MSCI production model – Forecast accuracy
– New signals, new discoveries
– x100-1000 Efficiency gains: 3hrs vs. weeks/months
10

MSCII
CP
R
40
20
AI vs. “human” models: higher accuracy
8080
6060
0 0
CP
R
40
20
Au
g-0
3
Ma
r-0
4
Oc
t-0
4
Ma
y-0
5
De
c-0
5
Ju
l-0
6
Fe
b-0
7
Se
p-0
7
Ap
r-0
8
No
v-0
8
Ju
n-0
9
Ja
n-1
0
Au
g-1
0
Ma
r-1
1
Oc
t-1
1
Ma
y-1
2
De
c-1
2
Ju
l-1
3
Fe
b-1
4
Se
p-1
4
Ap
r-1
5
No
v-1
5
Au
g-0
3
Se
p-0
4
Oc
t-0
5
No
v-0
6
De
c-0
7
Ja
n-0
9
Fe
b-1
0
Ma
r-1
1
Ap
r-1
2
Ma
y-1
3
Ju
n-1
4
Ju
l-1
5
Au
g-1
6
Se
p-1
7
De
c-0
3
Ja
n-0
5
Fe
b-0
6
Ma
r-0
7
Ap
r-0
8
Ma
y-0
9
Ju
n-1
0
Ju
l-1
1
Au
g-1
2
Se
p-1
3
Oc
t-1
4
No
v-1
5
De
c-1
6
Ja
n-1
8
CA NY
Actual NNM CPR NNM Hmodel
• Higher modeling accuracy – Across cohorts and multiple dimensions of risk factors
– Highly adaptive to high dimensionality and non-linearity
11

-~-----------------------...
MSCII
...... ..... ......... _ ------
AI vs. “human” models: higher accuracy
FICO SATO
30 Actual
720 740 760 780 720 740 760 780
Pre-2008 Post-2008
0
10
20
30
40
50
60
CP
R
Actual
NNM
-1.5 -1 -0.5 0 0.5 1
CLTV
25 NNM
20
15
10
5
0
CP
R
Current loan size
CP
R
35
30
25
20
30 Actual Actual
25NNM NNM
20
CP
R15
10
5
0
15
10
5
0
50,000 100,000 150,000 200,000 250,000 300,000 350,000 55 65 75 85 95 105
12
-
MSCII
,, , ,,
---------------------_,
,, ,, ,,
,,,'
I , , , , ,, ,
AI vs. “human” models: higher accuracy
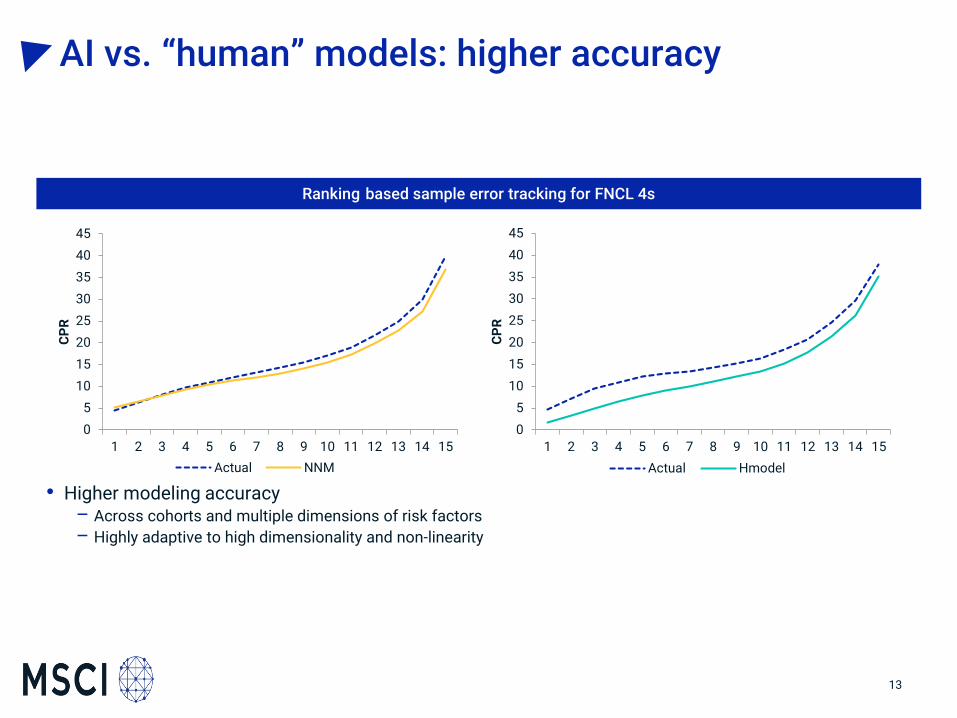
Ranking based sample error tracking for FNCL 4s
4545
4040
3535
3030
CP
R
1 2 3 4 5 6 7 8 9 10 11 12 13 14 15 1 2 3 4 5 6 7 8 9 10 11 12 13 14 15
CP
R 25
20
25
20
15
10
15
10
5 5
0 0
Actual NNM Actual Hmodel
• Higher modeling accuracy – Across cohorts and multiple dimensions of risk factors
– Highly adaptive to high dimensionality and non-linearity
13

MSCII
CP
R
AI vs. “human” models: higher accuracy
25 • “Media effect”
– When rates hit 20 historical low, new & lower coupons ramp
15 up faster
– Highly non-linear behavior and depends 10 on multiple risk factors
5
0
Ju
l-1
2
Se
p-1
2
No
v-1
2
Ja
n-1
3
Ma
r-1
3
Ma
y-1
3
Ju
l-1
3
Se
p-1
3
No
v-1
3
Au
g-1
2
Oc
t-1
2
De
c-1
2
Fe
b-1
3
Ap
r-1
3
Ju
n-1
3
Au
g-1
3
Oc
t-1
3
De
c-1
3
Ju
l-1
2
Se
p-1
2
No
v-1
2
Ja
n-1
3
Ma
r-1
3
Ma
y-1
3
Ju
l-1
3
Se
p-1
3
No
v-1
3
3.5 4 4.5
Actual NNM Hmodel
14

MSCII
AI vs. “human” models: new signals
60 1280
70 50 10
60
40 8 50
30
-10
0
-60
-40
-20
-10 0
10
20
30
40
30 6
0
20 4 8
0
20
10
0
10 2 10
12
0 0 0 0
14
0
16
0
20
0
24
0
CP
R
CP
R
CP
R
40
75k 100k 150k 200k 250k 300k 400k 500k
Incentive (bps)
75k 100k 150k 200k 300k 400k 500k 60 bps(LHS) -60 bps(RHS)
• Accuracy vs overfitting: loan size example – Understand sensitivities of risk drivers and economic rationale
– Apply regularization to penalize overfitting
6
15

MSCII
AI vs. “human” models: new signals
Model speeds for OTM 60bps vs loan size (in thousands) Housing turnover vs loan size and year*
12 0.80%
0.70% 10
0.60% 8
0.50%
6 0.40%
0.30% 4
0.20% 2
0.10%
0 0.00% 50 100 150 200 250 300 350 400 450 500 550
2005Yr 2012Yr <= 75k 76k-150k 151k-250k 251k-350k 351k+
• Is low loan balance still safe investment for extension risk?
– Sensitivity tests for the AI model indicate relationship between loan size and housing turnover has flipped after the recession
– This is verified by Black Knight’s proprietary data
* Source: Black Knight, used with permission 16

CONCLUSION
NN model vs. “Human Model”
• Accurate forecasts and successfully flag prepayment anomalies over the study period
• Accurate model large numbers of risk factors • Accurate model highly non-linear and interactive risk factors • Highly efficient modeling process - hundreds times of
increases in modeling efficiency • Was able to find/flag prepayment signals that eluded human
models
— GENERAL — 17
ACKNOWLEDGEMENT
Joy Zhang:
Executive Director, Securitized Product Research, MSCI
Jan Zhao:
Principal, Advanced Analytics, Ernst & Young
Fei Teng:
Senior Quantitative Analysts, Quantitative Advisory Services , Ernst & Young
Siyu Lin:
Senior Quantitative Analysts, Quantitative Advisory Services , Ernst & Young
Henry Li:
Executive Director, in Quantitative Advisory Services practice, Ernst & Young
— GENERAL — 18

Appendix
19

4: Agency MBS prepayment regimes since 2003
100
2003: historical l'ow
mortgage rates and
, refinancing wave ----FN 30 CPR/ Rate Incentive Bracket (Age= 10-30)
Mid 2004-,Mid 2006: Strong home price Mid 2007-2009: Severe
appreciation, (HPA), fast housing turnovet", high cash - home price depreciation
out refinancing and fast discount prepayment speed (HPD), low housing turnover,
2009: historical low mortgage
rates, but muted refinancing
_response.High premium coupons
prepay ever slower than, lower
premium coupons, because of 80 -----~--------------st------------ no cash out refinancing and
60 ct: Q. 0 40
20
0
Jan-03
MSCI •-
Aug-03 Mar-04
slow rate tet"m refinancing
Nov-04 Jun-05 Jan-06 Sep-06 Apr-07 Nov-07
Month
-(-50,-25) -(75,100) -(150,175)
- much tighter lending standard for
Jul-08 feb-09 Oct-09
MORTGAGE PREPAYMENT MODELING: SCIENCE AND CRAFTSMANSHIP
— GENERAL — 20
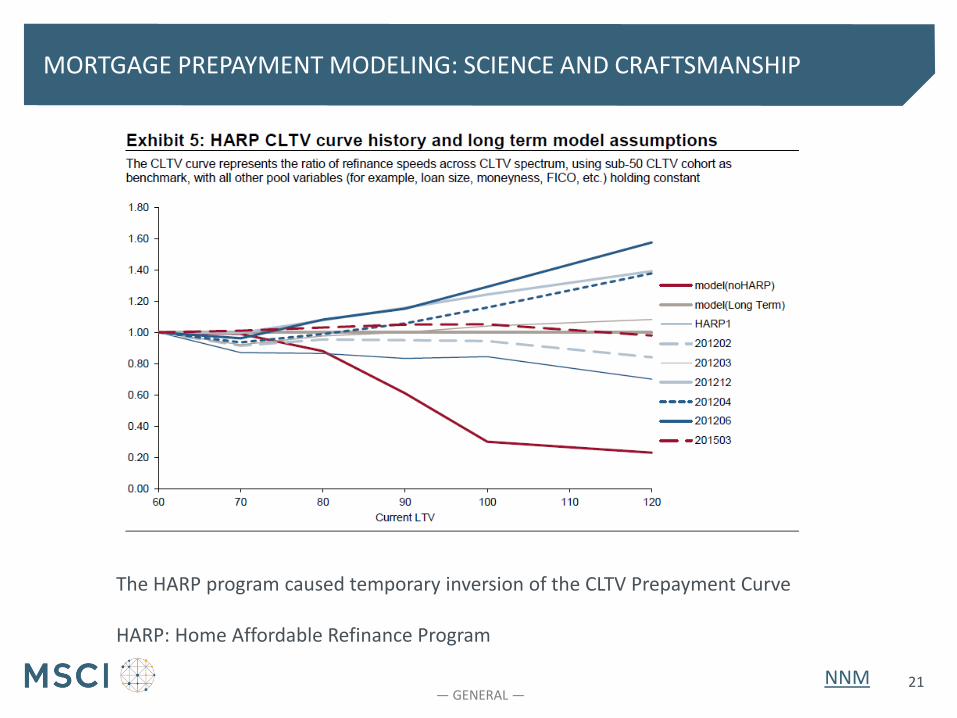
Exhibit 5: HARP CL TV curve history and long term model assumptions The CL TV curve represents the ratio of refinance speeds across CL TV spectrum, using sub-50 CL TV cohort as benchmark, with all other pool variables (for example, loan size, moneyness, FICO, etc.) holding constant
1.80
1.60
1.40
1.20
1.00
0.80
0.60
0.40
0.20
0.00 60
MSCI •-
70 80 90
Current LTV
-model(noHARP)
-model(Long Term)
--HARP1
- -201202
--201203
-201212
---•201204
-201206
~--------- - -201503
100 110 120
MORTGAGE PREPAYMENT MODELING: SCIENCE AND CRAFTSMANSHIP
The HARP program caused temporary inversion of the CLTV Prepayment Curve
HARP: Home Affordable Refinance Program
NNM 21 — GENERAL —

Q. u
100
80
60
40
20
0
40
30
!f 20 u
10
0
MSCI
V2002 Major Premium Coupons At 2003 Refi Wave In 2003 refi wave, nigher coupons prepay raster.
But in 2009 refi wave, higher coupons prepay lower e weake ccediLQi!J:Ual!!!!!J. f,.OQ!f..hd}!li ~rh~e:r..---===t~--'---------.....;::.,.. _________________ _
coupons was not much an issue in 2003's refi, but
rt become a big refi hurdle in 2009's refi.
Jan-03 Feb-03 Mar-03 Apr-03 May-03 Jun-03 Jul-03 Aug-03 Sep-03 Oct-03 Nov-03 Dec-03
Month
-5.5-6-6.5
V2008 Major Premium Coupons At 2009 Refi Wave
In 2003 refi wave,.,bigber cou oos rel'!!',,y.,fa.,,st,,e.,_c..,Be,,ut"-'-"inc,..--2.e.0,.,0..,9,_r._,e.:.,fi..,w"a"v_,.,e ___________________________ _
higher coupons prepay slower. The weaker credrt quality of higher coupons was not much an issue in 2003"s refi. but it become a big refi
hurdle in 2009's refi.
Jan-09 Feb-09 Mar-09 Apr-09 May-09 Jun-09 Jul-09 Aug-09 Sep-09 Oct-09
Month
-5.5-6-6.5
MORTGAGE PREPAYMENT MODELING: SCIENCE AND CRAFTSMANSHIP
— GENERAL — 22

35
30
25
.. C. 20 -u
15
1 0
5
0 "' "' ~ .. 9 0 0 0 a
.!.. I ' I
C: >, a. > Ill Ill (\) :::I
(l) 0 ..., :2i: ~ ...,
(/) z
FN30 6.0 V2004 CPR / Fico, (owner occ clsz=1 G0K-150 K oltv < 80)
■ Seasoned loan's FICO lending environment
■ :FICO beoomes less important after a few years' seasoning
IO I,() co <O <O r-- r-- r-- r-- r-- r- a:> co a 0 0 0 0 ~ 0 0 q 0 a a 0 0 0 0 0 ~ I .!.. I I I I
....!. > I .'.. I I I I ' ,c: >- a. > >- a. C: >- a. > C: (ti Ill Ill :::I (l) 0 (ti Ill :::I (l) 0 (ti (ti Ill :::I
(II 0 (\) (ti ..., :2i: ~ ...,
(/) z :2i: ~ ...,
(/) z ..., :a :!? ...,
(/J z ..., :a Ill 01 ,ti 1
■ Higher FICO prepays faster for new mortgages l--+-680-120 I ----> 720
MSCI •-
OJ a 0 0 0 9 a I I I ..!. ...!. >- a. > >, (ti QI 0 (\) <'O :,
:!? (/J z :i ~ ...,
MORTGAGE PREPAYMENT MODELING: SCIENCE AND CRAFTSMANSHIP
— GENERAL — 23

MORTGAGE PREPAYMENT MODELING: SCIENCE AND CRAFTSMANSHIP
Example of modeling: Assume ppm (pool, time) = f(X1, X2, X3,…. Xn) …
start by assuming separable risk factor: ppm= f1(x1)*f2(x2)…. Until (often) proven incorrect…
estimating f1(x1) by “building cohort”, by bucketing loans/pools for groups of x1, but similar x2, x3….
(this further assumes quasi linear property of x2, x3…. Average(f2(x2) f3(x3)…)= f2(ave(x2))* f3(ave(x3))….
….. Checking overall fit after all Xn are fitted, adding extra variables to deal with non-linear and interactive variables… this often does not lead to convergence …
• Time consuming and non-standard approaches • Experience and step-by-step / regime-by-regime progress are valued
• Can new techniques of AI modeling provide the much needed disruption?
— GENERAL — 24

neural network model
Architecture*
Input layer
!:1 !n !'.1 = mllll(tl.1;! I 8 1,0) :!:'.,, - m111<(A11r·,-1 + 8 11, 0)
Values ot hidden layP.rs are ~enerated hy ar.tivation futtctiu11s with previous layers as inputs, and weights and
biases as parameters
•Exampfe of a Neural Network architecture Q Node
MSCI •-
Mode~ training 1 Select a set of training data:
inputs tog~thP.r with correct/actual output
2 Pass trail'linq Al Model data through the network to obtain predidet.l output
t Tweak weiqt1Ls i:mu Ltiases using gradient function
Actual Output
Predicted Output
F eedforwa rd pass: compare ac:tual outp11t with predicted out rut and dP.termine cost function based on the error calqtlnted
MeP.ts Criteria?
~Ye• ·I 4 Backward propagation: oµlfrnize weiqhls am.I uiases (par c1meter s)
until some stopping condition has been met by passing the error signal through the network using gradien function
FEED FORWARD NEURAL NETWORK
Network architecture:
Layers and nodes
Hyper-parameters Batch size, number of nodes, learning rate, max-norm constraint, dropout rate
Ensemble techniques: Bagging: minimum MSE of different realizations and neural networks Boosting: Fine tune a neural network via changing a few hyper-parameters
— GENERAL —

MSCI
~ C: ro E .g (I) a...
Data Size
Large NN
Med um NN
Sma
Traditional ML algorith Statisbcal Leaming ms I
GENERAL
TRADITIONAL VS.. DEEP MACHINE LEARNING
Identify problems
Set benchmarks
Train models Compare
performance Choose model
Optimize model
Deploy
Traditional learning algorithm Deep Learning
Pros Cons Pros Cons
Works better on smaller data
Hard to scale state-of-the-art for certain domains, such as computer vision and speech recognition.
require large amount of data.
Financially and computationally cheap
Lack of variability Perform very well on image, audio, and textual data, Easily updated with new data
Not suitable for classical machine learning problems.
Algorithms are easier to interpret, have more theories to back them up
Labor intensive model maintenance
Versatile architecture and low overhead maintenance
Computationally intensive to train, and they require much more expertise to tune
— —

X1 W1 y(t) y(l) y(2) y(3)
X2
X3 out w =
wi Wo x(t) x(l) x(2) x(3)
Xo ~ Xi
MSCI •-
NEURAL NETWORKS MODEL
Feed forward neural network (FNN)
the information moves in only forward direction from the input nodes to the output nodes. There are no cycles or loops in the network.;
Deep FNN consists of tens of layers and thousands of nodes; the simplest kind of FNN is logistic model
Feedforward Neural Network Recurrent Neural Network Logistic Model
Recurrent Neural Network (RNN)
A class of neural networks exploit the historical input sequences. Such inputs could be text, speech, time series, and anything else where the occurrence of an input in the sequence is dependent on the inputs that appeared before it
Motivation: Not all problems can be converted into one with fixed length inputs and outputs, such as text translation, speech recognition or time-series; predictions require a system to store and use context information
The input at time t include both the attributes at t and the intermediate values containing history at t-1.
— GENERAL —

BUILDING NEURAL NETWORK MODEL
EDA Feature selection
Build model
Performance Evaluation
1, sanity check 1,information value 1,error tracking 1. link weights 2. data cleansing 2.correlation matrix 2.sensitivity 2. hyper-parameters 3. data transformation 3.domain knowledge 3. transparency tool (deeplift)
Deep neural network fitting
2003-2018 30yr agency MBS data (~25G data)
30+ input variables: pool attributes, macro-economic variables
To reduce complexity, we added incentive, 1 regime indicators, and 1 policy indicator (HARP)
Cost function of RMS error of pool level prepayment
1 round of fitting can be completed in ~ 3 hours on a GPU machine
— GENERAL —

MODEL DRIVERS
WALA Weighted Average Loan Age
WAC Weighted Average Coupon
CLNSZ Current Average Loan Size
OLTV Original Loan to Value
Refi% Percentage of Refinanced Loans by UPB
SecHome% Percentage of Second Home Loans by UPB
MultiFamily% Percentage of Muti Family Loans by UPB
Investor% Percentage of Investor Loans by UPB
TPO% Percentage of Third party origination by UPB
AOL Original Average Loan Size
LNSZ_Q4 Max original loan size
LNSZ_Q3 Max original Loan Size - 3rd Quartile
LNSZ_Q1 Max original Loan Size - 1st Quartile
Geo_CA% Percentage of California Loans by UPB
Geo_FL% Percentage of Florida Loans by UPB
Geo_TX% Percentage of Taxas Loans by UPB
Geo_NY% Percentage of New York Loans by UPB
Geo_NE% Percentage of New England Region Loans by UPB
Geo_NO% Percentage of North Region Loans by UPB
Geo_SO% Percentage of South region Loans by UPB
Geo_PC% Percentage of Pacific region Loans by UPB
Geo_AT% Percentage of Atlantic region Loans by UPB
Geo_NONUS% Percentage of non-US region Loans by UPB
Seasonality Calendar month
Independent variables
Incentive WAC - Mortgage Rate(t)
Rolling Incentive Average Incentive ( 20month)
Loan size dispersion (LNSZ_Q3-LNSZ_Q1)/AOL
SATO Spread-at_origination = WAC - Mortgage Rate(0)
HPA House Price Appreciation ( HPI(t)/HPI(0)-1 )
HARP-able
1: IssueMonth <= Jun. 2009 and factor date between Mar. 2009
and Dec. 2011
2: IssueMonth <= Jun. 2009 and factor date > Dec. 2011
HARP-ed Refi% = 100 and OLTV > 80 and issueMonth > Jun. 2009
Underwritting standard 0: before 2008, 1: after 2008
cBal Current Balance
Prepayment speed Prepayment speed in SMM
Derived Variables
Weight
Dependent Variable
— GENERAL — 29

~ tn n -
• l> ri ,-+ C ~
z z ~
I-' 0 0
Aug-03
Apr-04
Dec-04
Aug-05
Apr-06
Dec-06
Aug-07
Apr-08
Dec-08
Aug-09
Apr-10
Dec-10
Aug-11
Apr-12
Dec-12
Aug-13
Apr-14
Dec-14
Aug-15
CPR I',.) w .i:,. V, 0-, -...J 0 0 0 0 0 0
AG
ENC
Y 30
YR U
NIV
ERSE SP
EEDS ER
RO
R TR
AC
KIN
G
• Train
ing D
ata: 20
03
– 20
15
Dec. R
and
om
samp
le 10
% p
oo
ls. •
Error trackin
g is generated
usin
g ou
t-of-th
e-samp
le po
ols.
— G
ENER
AL —
3
0

MSCI •-
er:: c.. u
---- Actual --NNM ---Hmodel
OUT-OF-SAMPLE FORECASTS
• True out-of-time and out-of-sample test. • Overall fitting is good in out-of-sample test • Missed the refi wave in second half of 2016
— GENERAL — 31

-----------
MSCI •-
MODEL RISK FACTORS C
PR
30
25
20
15
10
5
0
0
10
20
30
40
50
60
CP
R
-1.5 -1 -0.5 0 0.5 1
720 740 760 780 720 740 760 780
Pre-2008 Post-2008
FICO SATO Actual NNM
Actual NNM
30
35 25
30 20
25 C
PR
20
15
15
CP
R
10
5
10
5
0
50000 100000 150000 200000 250000 300000 350000
Current Loan Size
0
55 65 75
CLTV
85 95 105
Actual NNM Actual NNM
— GENERAL — 32

30
25
o::: 20 c.. u 15
10
5
0 0.4
MSCI •-
-~~-~ ... ...... ...... ---~"" ........
0.6 0.8
...... ......
1
...... ...... ..... ..... .... .... ....
-----Actual
--NNM
1.2 1.4
Rolling Incentive
1.6
MODEL BURNOUT
NNM and actual prepayment speeds against average incentive in prior 20 months
— GENERAL — 33

~ tn n -
n )>
n ""Cl ;;o
z z s
I I 3 0 a. (1)
z -<
Jun-09
Apr-10
Feb-11
Dec-11
Oct-12
Aug-13
Jun-14
Apr-15
Feb-16
Dec-16
Oct-17
Oct-0
Aug-0
Jun-OS
Apr-06
Feb-07
Dec-07
Oct-08
Aug-09
Jun-10
Apr-11
Feb-12
Dec-12
Oct-13
Aug-14
Jun-15
Apr-16
Feb-17
Dec-17
CPR ~ N W ~ ~ m ~ 00
0 0 0 0 0 0 0 0 0
MO
DEL P
OO
L VA
RIA
BLES V
S “HU
MA
N”M
OD
EL
NN
M an
d H
mo
del Erro
r Tracking again
st State Variab
les
NN
M accu
rately captu
red state
-level prep
aymen
t beh
aviors
— G
ENER
AL —
3
4
45
40
35
30
a:: 25 Cl. u 20
15
10
5
---- ------,,' _,
, , , ,
I I
I I
I ,
0-+-----~~-~----~~-~----~~-1 2 3 4 5 6 7 8 9 10 11 12 13 14 15
----Actual -NNM
MSCI •-
45
40
35
30
a:: 25 Cl. u 20
15
10
5
0
,, , ,, ----
--..... --------,
------, , , ,
I , I
I I
1 2 3 4 5 6 7 8 9 10 11 12 13 14 15
----Actual -Hmodel
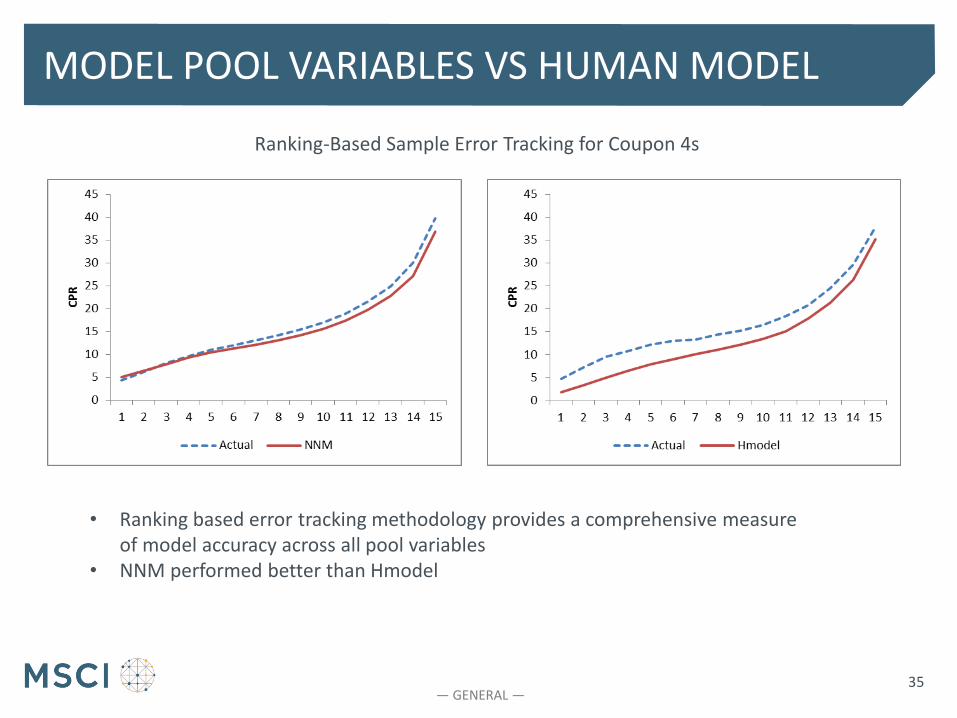
MODEL POOL VARIABLES VS HUMAN MODEL
Ranking-Based Sample Error Tracking for Coupon 4s
• Ranking based error tracking methodology provides a comprehensive measure of model accuracy across all pool variables
• NNM performed better than Hmodel
— GENERAL — 35
MSCI •-
50
40
50
40
o::: 30 Q..
u 20
----Actual -NNM
1 4 7 1013 3 6 9 1215 2 5 8 1114 1 4 7 1013 3 6 9 1215 2 5 8 1114
3.5 4 3.5 4 3.5 4
Jun-13 Jun-16 Mar-18
----Actual -Hmodel
1 4 7 1013 3 6 9 1215 2 5 8 1114 1 4 7 1013 3 6 9 1215 2 5 8 1114
3.5 4 3.5 4 3.5 4
Jun-13 Jun-16 Mar-18
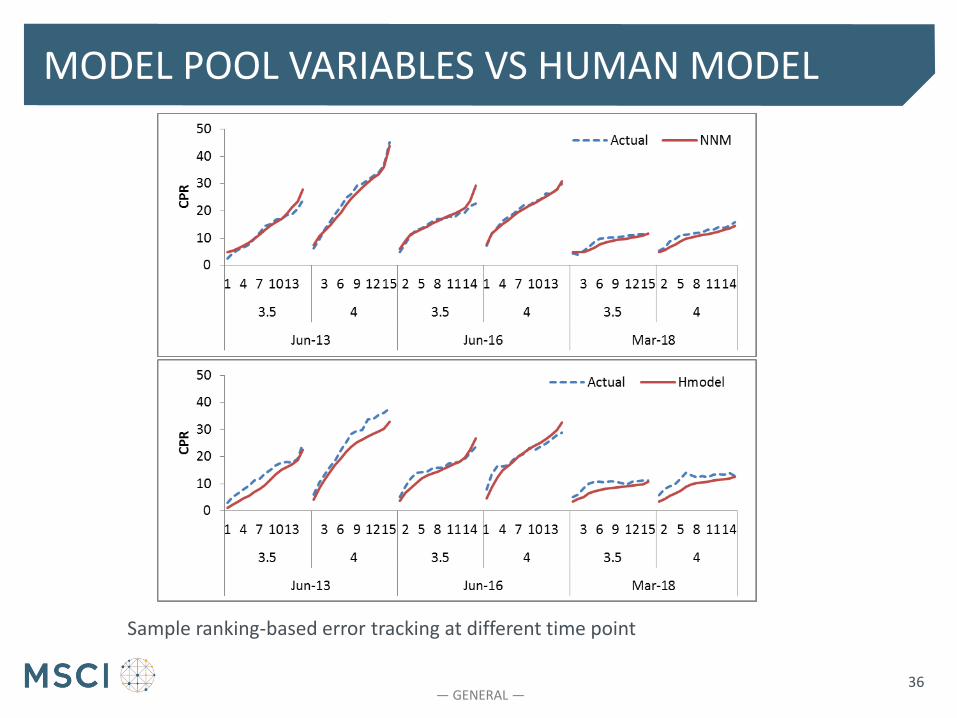
MODEL POOL VARIABLES VS HUMAN MODEL
Sample ranking-based error tracking at different time point
— GENERAL — 36

60
55 ' ' 50 ' '" ... -, 45 ';x:::J ~ ~ c.:: -Q. 40 ,
' u 35
30
25
20
60 80 9010 12 60 80 9010 12 60 80 9010 12
2012Q1 2012Q2 2012Q3 2012Q4
CLTV
----Actual NNM
MSCI •-
MODEL HARP EFFECTIVENESS
Error Tracking against HARP effectiveness across CLTV Cohorts
NNM is able to pick up the general trend of HARP effectiveness but missed the complexity of its revolution
Back 37
— GENERAL —

80
70
60
so f 40 u
30
20
10 l ...... ,.~~~~,,,t.,..... 0 ---t---.----.----.---.--.----.----.~~~~~~~--.----.---~
MSCI •-
-100 -40 -10 10 30 60 100 140 200
Incentive (bps)
~7Sk -100k-a-1SOk~200k
-300k-+-400k-SOOk
60 12
so 10
40 8
f 30 6 a: Cl.
u u
20 4
10 2
0 ---t-----.-~~~~--.---~--.-----+ 0
~ _c-.'4.-~'4.- r;:f- ~'4.- f::)'4.-_c-.'4.-r;:f-"\ ""\)-~ '"1-o '"I-<-, ,,_,o ~\)-~o
-60 bps(LHS} -.--60 bps(RHS}
MODEL SENSITIVITY
Model prepayment sensitivity to loan sizes and refinance Incentives
NNM captured the prepayment behavior for loan size
— GENERAL — 38

~ tn n -
w 0 -< :-, "Tl
X m a.. ~ 0 -, r-t-
C]Q QJ
C]Q m :::0 QJ r-t-m
Jan-10
Jun-10
Nov-10
Apr-11
Sep-11
Feb-12
Jul-12
Dec-12
May-13
Oct-13
Mar-14
Aug-14
Jan-15
Jun-15
Nov-15
Apr-16
Sep-16
Feb-17
Jul-17
Dec-17
May-18
w w .i:,. .i:,. V, V,
0 V, 0 V, 0 V,
w 0 < :"I 'Tl ~-c.. s 0 ""'II ,...
OQ Q)
OQ t1)
::a Q) ,... t1)
“MED
IA EFFEC
T”
Co
hort
Ob
servation R
angeC
PR
WA
LA
SA
TO
CL
TV
CL
NS
ZIncentive
FIC
OA
vg.UP
B(b
n)
FH
3.5
20
11
Jul.12
- Dec. 1
21
6.1
13
-577
212258
52
770
2.9
1
FH
4 2
010
No
v. 11
- Feb
. 12
13.9
15
378
201901
45
767
6.2
6
FH
3.5
20
11
Jul.20
12
- Dec. 1
22
1.9
12
-376
235847
50
770
4.0
4
FH
4 2
010
No
v. 11
- Feb
. 12
16.4
16
378
224734
45
765
8.6
6
FH
3.5
20
11
Jul.12
- Dec. 1
22
9.2
12
-266
216270
54
771
7.3
1
FH
4 2
010
No
v. 11
- Feb
. 12
15.3
15
11
70
208962
52
766
30.8
9
FH
3.5
20
11
Jul.12
- Dec. 1
24
6.1
12
-864
269298
46
773
9.5
8
FH
4 2
010
No
v. 11
- Feb
. 12
26.2
15
269
245496
44
767
23.0
2
Refi/T
PO
FH
20
11
3.5
vs 20
10
4 co
mp
arisons, acro
ss TP
O/R
etail and R
efi/Purchase co
mb
inations
Purchase/R
etail
Purchase/T
PO
Refi/R
etail
20
11
3.5
s and
20
10
4s p
repaym
ent sp
eeds
are com
pared
across lo
an attrib
utes, lo
an
pu
rpo
se and
origin
ation
chan
nel
3.5
s is mu
ch faster th
an 4
s given sim
ilar lo
an attrib
utes an
d in
centive
— G
ENER
AL —
3
9

~ tn n CPR
f-'> f-'> N N - 0 V, 0 V, 0 V,
~h Jul-12
Oct-12
Jan-13
' VJ Apr-13
)> V, ("') Jul-13 -C (l)
Oct-13
Sep-12
z Dec-12 z Mar-13 ~ .i:,.
Jun-13
Sep-13
Dec-13 I
Aug-12 3 0
Nov-12 Q. ~
.i:,. Feb-13 V,
May-13 I ""> "'~ Aug-13
Nov-13
CPR f-'> f-'> N N VJ
0 V, 0 V, 0 V, 0
--1
May-16 Sep-16
VJ Jan-17 ' V, )> May-17
("') - Sep-17 C (l)
Jan-18
Apr-16
z Aug-16
z Dec-16 ~ .i:,. Apr-17
Aug-17 Dec-17 Ai;ir-18
I Mar-16 3 0 Jul-16 Q. ~-, ~ Nov-16 s.
.i:,. V, Mar-17
Jul-17 ~i-Nov-17
Mar-18 ~, -..
MO
DEL “M
EDIA
EFFECT
”
20
12
Vin
tage in 2
01
2 refin
ance w
ave 2
01
5 V
intage in
20
16
refinan
ce wave
— G
ENER
AL —
4
0

~ tn n -
..., ...,.. N Nm ..... rvw.::..v,~" a,
! """" 0 • 0 • 0 • H I ::::f I ff I 11 I H 20160201 3 "' 20040401 3 "
20160301 §: ~ 20040801 §: r;'
20160401 ~ 8 20041201 0 ~ " 20050401 ,l ~
20160501 20050801
20160601 20051201
20160701 20060401 20060801
20160801 20061201
20160901 20070401
20161001 2oo7os01 20071201
20161101 20080401
20161201 20080801
20170101 20081201 20090401
20170201 20090801
20170301 20091201
20170401 20100401 20100801
20170501 20101201
20170601 20110401
20170701 20110801 20111201
20170801 20120401
20170901 20120801
20171001 20121201 20130401
20171101 20130801
20171201 20131201
20180101 20140401
20180201 20140801 20141201
20180301 201S0401
20180401 201S0801 20151201
I ! I I I i ~ ~ s: ► Q. i; Q ~ ;!; ;:; it &. -,:, -o r, n :::0 ;Q "0 "0
:,:, :,:,
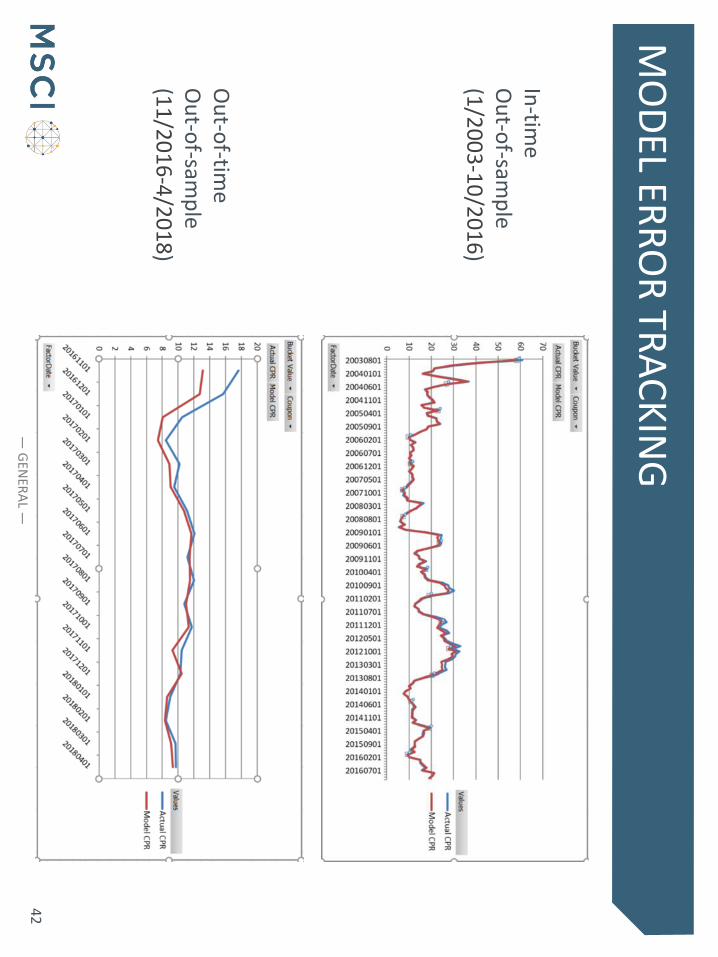
MO
DEL ER
RO
R TR
AC
KIN
G
In-tim
e O
ut-o
f-samp
le (1
/20
03
-12
/20
15
)
1.
All attrib
utes statistics are very
close o
n Ju
ly and
Au
gust 2
01
6
except C
PR
. 2
. R
isk driver is m
issing, i.e., m
edia
effect or regim
e chan
ge
Ou
t-of-tim
e O
ut-o
f-samp
le (1
/20
16
-4/2
01
8)
— G
ENER
AL —
4
1
~ tn n -
;'~O ONAO'!OO
" "'6' -----,v 0,._,,AC"+COO
!!. .. ✓• ~ rl q, ,. o✓•
6''Y, rl q, o.,,_.o
rl :;,~ o.,,..,,
orl rl ~ o.,,
->o.,,. rl ~ o.,,
:..>4. rl ~ o.,,
->a ~ ~ o.,,..,,
rl~ o.,,_.o rl :>~ o.,,..,, ~
rl ~ o.,, .>~
rl v.,, o.,,:.>
rl ,l~ o.,, ~
rl ,l~ o.,,:.>
'Y, rl ~ o✓, d'o ~ :;,~ o✓•
d'orl rl ~ o✓,
d'o.,,. ~ ~ o✓•
d'q,. ~
)
/ vj ~v
j~
\ I
'I
~
f
I I ' ;:: ► ll
~ [ ,.., ,.., .,, .,, :,0 :,0
V /
)
J
~ I IL <
i f I . j f
! oo~~~~E~>
s. 20030801 ~ I I I I I "I I i M 20040101
• 20040601
20041101
20050401
20050901
20060201
20060701
20061201
20070501
20071001
20080301
20080801
20090101
20090601
20091101
20100401
20100901
20110201
20110701
20111201
20120501
20121001
20130301
20130801
20140101
20140601
20141101
20150401
20150901
20160201
20160701
I I f .:: >
i [ ,.., ,.., .,, .,, :,0 :,0
MO
DEL ER
RO
R TR
AC
KIN
G
In-tim
e O
ut-o
f-samp
le (1
/20
03
-10
/20
16
)
Ou
t-of-tim
e O
ut-o
f-samp
le (1
1/2
01
6-4
/20
18
)
— G
ENER
AL —
4
2

~ tn n -
I :::o, °" .. • • " " • • • H I ::::f j . . . j j i H "o,., ~ 20040601 ~ •
"0.t_,0 !i ~ 20041101 1! I~ .,0 "o,., i '§ 20050401 ~ 1'§
..-_,od 20050901 .>0 .,,., 20060201
"'>o.,,0 20060101
<'o " 20061201 .,_, 40 20070501 ~... ~~
d 0-£>,., 20080301 .,,.,_, 20080801
.>0 %,., 20090101
">o_,. 20090601
<'o ".t 20091101 ;,_, ~ 20100401
"o,.,_, " 20100901 d' rn~ ~ ~~
d 'b✓ 20111201 0 .,.,,., 20120501
~~ ~~ "'>,.,.,o 20130301
<'o " 20130801 "e. 0.to 20140101 d ;, ".tc90 20140601
d ?o✓ 20141101
".tc90 20150401 ::,i
~ ~ 2M50901
"d'4; 20160201 0,., 20160701
0 1 • -1,(
I If I I l ;:: l> f l> 2 ll ll &" & & ;:;r, nn -i::i ""Cl "Cl ~ :,:i,::, :,::,;o
MO
DEL ER
RO
R TR
AC
KIN
G
In-tim
e O
ut-o
f-samp
le (1
/20
03
-10
/20
16
)
Wh
en In
crease weigh
ts on
8
/20
16
– 10
/20
16
by 4
0 tim
es in
trainin
g: 1
. B
etter in th
e early stage o
f ou
t-of-tim
e test 2
. Sacrifice o
ther p
eriod
.
Ou
t-of-tim
e O
ut-o
f-samp
le (1
1/2
01
6-4
/20
18
)
— G
ENER
AL —
4
3

MSCI
Budcet Value • Coupon •
Aclllal CPR Model CPR
70 ..-------------------------------------
60 +-------------------------------------50-tt-------------------------------------
40 ------------------------------------------
30 +1-~1----------------,..----':'"'ll,,-r-----------
20 t--'V--bl5H~t::----------l~Ht-r-#--¼-----,1i------¼----,,.----k--
10 -l------¥~'1¥-!!ilic::,l-~+---------...:!l..,.~l!-....::l"'---\,,ey.
0 tt,Tmmmm"lffl'ITTTTTmTTmmmm....,'TfflTTTTTTffl"IT'mmmm'fflTTTTTTTmTTmmmm"lffl'ITTTTTfflTTfflTTmm....,TTTTTTTTTTmmmmmm'fflTTfflffmmm"f
Fac!O<Oale •
Budcet Value • Coupon •
Aclllal CPR Model CPR
12
8
6+-------------------------------------4
0+--------------~-----~------~------~------~ 20171101
Fac!O<Oale •
20171201 20180101 20180201 20180301 20180401
Values
--Actual CPR
-Model CPR
Values
--Actual CPR
-Model CPR
MODEL ERROR TRACKING
In-time Out-of-sample (1/2003-10/2017)
Out-of-time Out-of-sample (10/2017-4/2018)
— GENERAL — 44

MSCII
About MSCI
MSCI is a leading provider of critical decision support tools and services for the
global investment community. With over 45 years of expertise in research, data
and technology, we power better investment decisions by enabling clients to
understand and analyze key drivers of risk and return and confidently build
more effective portfolios. We create industry-leading research-enhanced
solutions that clients use to gain insight into and improve transparency across
the investment process. To learn more, please visit www.msci.com.
45

MSCII
Contact us
AMERICAS EUROPE, MIDDLE EAST ASIA PACIFIC & AFRICA
Americas +1 888 588 4567 * Cape Town + 27 21 673 0100 China North 10800 852 1032 *
Atlanta + 1 404 551 3212 Frankfurt + 49 69 133 859 00 China South 10800 152 1032 *
Boston + 1 617 532 0920 Geneva + 41 22 817 9777 Hong Kong + 852 2844 9333
Chicago + 1 312 675 0545 London + 44 20 7618 2222 Mumbai + 91 22 6784 9160
Monterrey + 52 81 1253 4020 Milan + 39 02 5849 0415 Seoul 00798 8521 3392 *
New York + 1 212 804 3901 Paris 0800 91 59 17 * Singapore 800 852 3749 *
San Francisco + 1 415 836 8800 Sydney + 61 2 9033 9333
São Paulo + 55 11 3706 1360 Taipei 008 0112 7513 *
Toronto + 1 416 628 1007 Thailand 0018 0015 6207 7181 *
Tokyo +81 3 5290 1555
• = toll free
msci.com [email protected]
46

MSCII
Notice & disclaimer
This document and all of the information contained in it, including without limitation all text, data, graphs, charts (collectively, the “Information”) is the property of MSCI Inc. or its subsidiaries (collectively, “MSCI”), or MSCI’s licensors, direct or indirect suppliers or any third party involved in making or compiling any Information (collectively, with MSCI, the “Information Providers”) and is provided for informational purposes only. The Information may not be modified, reverse-engineered, reproduced or redisseminated in whole or in part without prior written permission from MSCI.
The Information may not be used to create derivative works or to verify or correct other data or information. For example (but without limitation), the Information may not be used to create indexes, databases, risk models, analytics, software, or in connection with the issuing, offering, sponsoring, managing or marketing of any securities, portfolios, financial products or other investment vehicles utilizing or based on, linked to, tracking or otherwise derived from the Information or any other MSCI data, information, products or services.
The user of the Information assumes the entire risk of any use it may make or permit to be made of the Information. NONE OF THE INFORMATION PROVIDERS MAKES ANY EXPRESS OR IMPLIED WARRANTIES OR REPRESENTATIONS WITH RESPECT TO THE INFORMATION (OR THE RESULTS TO BE OBTAINED BY THE USE THEREOF), AND TO THE MAXIMUM EXTENT PERMITTED BY APPLICABLE LAW, EACH INFORMATION PROVIDER EXPRESSLY DISCLAIMS ALL IMPLIED WARRANTIES (INCLUDING, WITHOUT LIMITATION, ANY IMPLIED WARRANTIES OF ORIGINALITY, ACCURACY, TIMELINESS, NON-INFRINGEMENT, COMPLETENESS, MERCHANTABILITY AND FITNESS FOR A PARTICULAR PURPOSE) WITH RESPECT TO ANY OF THE INFORMATION.
Without limiting any of the foregoing and to the maximum extent permitted by applicable law, in no event shall any Information Provider have any liability regarding any of the Information for any direct, indirect, special, punitive, consequential (including lost profits) or any other damages even if notified of the possibility of such damages. The foregoing shall not exclude or limit any liability that may not by applicable law be excluded or limited, including without limitation (as applicable), any liability for death or personal injury to the extent that such injury results from the negligence or willful default of itself, its servants, agents or sub-contractors.
Information containing any historical information, data or analysis should not be taken as an indication or guarantee of any future performance, analysis, forecast or prediction. Past performance does not guarantee future results.
The Information should not be relied on and is not a substitute for the skill, judgment and experience of the user, its management, employees, advisors and/or clients when making investment and other business decisions. All Information is impersonal and not tailored to the needs of any person, entity or group of persons.
None of the Information constitutes an offer to sell (or a solicitation of an offer to buy), any security, financial product or other investment vehicle or any trading strategy.
It is not possible to invest directly in an index. Exposure to an asset class or trading strategy or other category represented by an index is only available through third party investable instruments (if any) based on that index. MSCI does not issue, sponsor, endorse, market, offer, review or otherwise express any opinion regarding any fund, ETF, derivative or other security, investment, financial product or trading strategy that is based on, linked to or seeks to provide an investment return related to the performance of any MSCI index (collectively, “Index Linked Investments”). MSCI makes no assurance that any Index Linked Investments will accurately track index performance or provide positive investment returns. MSCI Inc. is not an investment adviser or fiduciary and MSCI makes no representation regarding the advisability of investing in any Index Linked Investments.
Index returns do not represent the results of actual trading of investible assets/securities. MSCI maintains and calculates indexes, but does not manage actual assets. Index returns do not reflect payment of any sales charges or fees an investor may pay to purchase the securities underlying the index or Index Linked Investments. The imposition of these fees and charges would cause the performance of an Index Linked Investment to be different than the MSCI index performance.
The Information may contain back tested data. Back-tested performance is not actual performance, but is hypothetical. There are frequently material differences between back tested performance results and actual results subsequently achieved by any investment strategy.
Constituents of MSCI equity indexes are listed companies, which are included in or excluded from the indexes according to the application of the relevant index methodologies. Accordingly, constituents in MSCI equity indexes may include MSCI Inc., clients of MSCI or suppliers to MSCI. Inclusion of a security within an MSCI index is not a recommendation by MSCI to buy, sell, or hold such security, nor is it considered to be investment advice.
Data and information produced by various affiliates of MSCI Inc., including MSCI ESG Research LLC and Barra LLC, may be used in calculating certain MSCI indexes. More information can be found in the relevant index methodologies on www.msci.com.
MSCI receives compensation in connection with licensing its indexes to third parties. MSCI Inc.’s revenue includes fees based on assets in Index Linked Investments. Information can be found in MSCI Inc.’s company filings on the Investor Relations section of www.msci.com.
MSCI ESG Research LLC is a Registered Investment Adviser under the Investment Advisers Act of 1940 and a subsidiary of MSCI Inc. Except with respect to any applicable products or services from MSCI ESG Research, neither MSCI nor any of its products or services recommends, endorses, approves or otherwise expresses any opinion regarding any issuer, securities, financial products or instruments or trading strategies and MSCI’s products or services are not intended to constitute investment advice or a recommendation to make (or refrain from making) any kind of investment decision and may not be relied on as such. Issuers mentioned or included in any MSCI ESG Research materials may include MSCI Inc., clients of MSCI or suppliers to MSCI, and may also purchase research or other products or services from MSCI ESG Research. MSCI ESG Research materials, including materials utilized in any MSCI ESG Indexes or other products, have not been submitted to, nor received approval from, the United States Securities and Exchange Commission or any other regulatory body.
Any use of or access to products, services or information of MSCI requires a license from MSCI. MSCI, Barra, RiskMetrics, IPD and other MSCI brands and product names are the trademarks, service marks, or registered trademarks of MSCI or its subsidiaries in the United States and other jurisdictions. The Global Industry Classification Standard (GICS) was developed by and is the exclusive property of MSCI and Standard & Poor’s. “Global Industry Classification Standard (GICS)” is a service mark of MSCI and Standard & Poor’s.
47