agency financial report - opm.gov · report (afr) is the first document in a series of reports...
TRANSCRIPT

Agency Financial Report
Fiscal Year 2013
United StateS Office Of PerSOnnel ManageMent
deceMber 2013

The United States Officeof Personnel Management
Fiscal Year 2013Agency Financial Report


T a b l e o f C o n T e n T s
Message from the Director 1 . . . . . . . . . . . . . . . . . . . . . . . . . . . . . . . . . . . . . . . . . . . . . . . . . . . . . . . . . . . . . . . . . .
Management’s Discussion and Analysis – Section 1 5 . . . . . . . . . . . . . . . . . . . . . . . . . . . . . . . . . . . . . . . . . . . . . .
Agency Financial Report Overview 5 . . . . . . . . . . . . . . . . . . . . . . . . . . . . . . . . . . . . . . . . . . . . . . . . . . . . . . . . . .
OPM’s Mission and Strategic Goals 6 . . . . . . . . . . . . . . . . . . . . . . . . . . . . . . . . . . . . . . . . . . . . . . . . . . . . . . . . . . .
Organizational Structure 7 . . . . . . . . . . . . . . . . . . . . . . . . . . . . . . . . . . . . . . . . . . . . . . . . . . . . . . . . . . . . . . . . . . . .
Program Performance Summary 11 . . . . . . . . . . . . . . . . . . . . . . . . . . . . . . . . . . . . . . . . . . . . . . . . . . . . . . . . . . . .
Analysis of OPM’s Financial Statements 15 . . . . . . . . . . . . . . . . . . . . . . . . . . . . . . . . . . . . . . . . . . . . . . . . . . . . .
Analysis of OPM’s Systems, Controls, and Legal Compliance 21 . . . . . . . . . . . . . . . . . . . . . . . . . . . . . . . . . . .
FY 2013 Financial Information – Section 2 29 . . . . . . . . . . . . . . . . . . . . . . . . . . . . . . . . . . . . . . . . . . . . . . . . . . . .
Message from the CFO 29 . . . . . . . . . . . . . . . . . . . . . . . . . . . . . . . . . . . . . . . . . . . . . . . . . . . . . . . . . . . . . . . . . . . .
Transmittal from OPM’s Inspector General 31 . . . . . . . . . . . . . . . . . . . . . . . . . . . . . . . . . . . . . . . . . . . . . . . . . . .
Independent Auditors’ Report 34 . . . . . . . . . . . . . . . . . . . . . . . . . . . . . . . . . . . . . . . . . . . . . . . . . . . . . . . . . . . . . .
Consolidated Financial Statements 40 . . . . . . . . . . . . . . . . . . . . . . . . . . . . . . . . . . . . . . . . . . . . . . . . . . . . . . . . . .
Notes to Consolidated Financial Statements 44 . . . . . . . . . . . . . . . . . . . . . . . . . . . . . . . . . . . . . . . . . . . . . . . . . .
Consolidating Financial Statements 75 . . . . . . . . . . . . . . . . . . . . . . . . . . . . . . . . . . . . . . . . . . . . . . . . . . . . . . . . .
Required Supplementary Information 85 . . . . . . . . . . . . . . . . . . . . . . . . . . . . . . . . . . . . . . . . . . . . . . . . . . . . . . .
Other Information – Section 3 89 . . . . . . . . . . . . . . . . . . . . . . . . . . . . . . . . . . . . . . . . . . . . . . . . . . . . . . . . . . . . . . .
Schedule of Spending 89 . . . . . . . . . . . . . . . . . . . . . . . . . . . . . . . . . . . . . . . . . . . . . . . . . . . . . . . . . . . . . . . . . . . . . .
OIG Management Challenges Report 90 . . . . . . . . . . . . . . . . . . . . . . . . . . . . . . . . . . . . . . . . . . . . . . . . . . . . . . . .
Agency Response to the OIG Management Challenges Report 110 . . . . . . . . . . . . . . . . . . . . . . . . . . . . . . . . .
Summary of Financial Statement and Audit Management Assurances 111 . . . . . . . . . . . . . . . . . . . . . . . . . . . .
Improper Payments Information Act-IPERA Reporting Details 112 . . . . . . . . . . . . . . . . . . . . . . . . . . . . . . . .
Compliance with Other Key Legal and Regulatory Requirements 126 . . . . . . . . . . . . . . . . . . . . . . . . . . . . . .
Compliance with the Debt Collection Improvement Act (DCIA) 126 . . . . . . . . . . . . . . . . . . . . . . . . . . . . . . . .
Appendices 127 . . . . . . . . . . . . . . . . . . . . . . . . . . . . . . . . . . . . . . . . . . . . . . . . . . . . . . . . . . . . . . . . . . . . . . . . . . . . . .
Appendix A - Acronyms and Abbreviations 127 . . . . . . . . . . . . . . . . . . . . . . . . . . . . . . . . . . . . . . . . . . . . . . . . .

OPM Fiscal Year 2013 Agency Financial Report1
M e s s a g e f rom the D i r e c t o r
I am pleased to present the United States Office of Personnel Management’s (OPM) Fiscal Year (FY) 2013 Agency Financial Report (AFR) . This AFR is an alternative to the consolidated Performance and Accountability Report pursuant to Office of Management and Budget (OMB) Circular No . A-136 . It is one in a series of reports used to convey budget, performance, and financial information to our constituents . Under separate cover, OPM will submit its Annual Performance Report (APR), concurrent with the submission of the President’s FY 2015 Budget to Congress and a Summary of Performance and Financial Information . We believe this approach provides a succinct reporting of OPM’s accountability of its resources and improves reporting through more meaningful and transparent information to the public .
Finance
FY 2013 presented unique challenges to OPM, with Continuing Resolutions followed by the Joint Committee sequester . Throughout the fiscal year, OPM took an extremely conservative approach to spending, including the imposition of a hiring freeze . These steps positioned OPM to operate within the budget levels required by sequestration, while avoiding furloughs . Several mandatory authorities were subject to sequestration, requiring cuts within those accounts . Those include: the Federal Erroneous Retirement Coverage Corrections Act (FERCCA); 5 USC 8348 (a)(1)(B); 5 USC 8958 (f)(2)(A) and 8988(f)(2)(A); and 5 USC 9004(f)(B) . To meet the cuts necessary within accounts related to 5 USC 8348 (a)(1)(B), OPM suspended a Retirement Services Call Center Contract and the use of overtime for retirement processing .
In light of these challenges, I am pleased to report OPM earned an unqualified audit opinion on its FY 2013 consolidated financial statements from the independent public accounting (lPA) firm of KPMG LLP . OPM also can provide unqualified assurance for its internal control over financial reporting for FY 2013 . Lastly, OPM received an unqualified audit opinion on the FY 2013 individual financial statements of the Retirement, Health Benefits, and Life Insurance Programs .
Reducing the Retirement Claims Inventory
The Office of Personnel Management is responsible for the administration of the Federal Retirement Program covering more than 2 .7 million active employees, including the United States Postal Service, and 2 .5 million annuitants and survivors . Over the past 20 months, OPM has processed more than 225,000 retirement applications, so that today fewer applications are waiting processing than at any time in nearly four years . As of the end of FY 2013, the claims inventory was 17,719 cases – a 71 % reduction since the peak of 61,108 cases in January 2012 .

OPM Fiscal Year 2013 Agency Financial Report2
M e s s a g e f rom the D i r e c t o r
Continued
OPM’s efforts have successfully improved our process and expand our capacity . The process improvements resulted from a Lean Six-Sigma review, backfilling vacant positions, and the use of overtime to dramatically expanded our capacity . Between January and March of 2013, OPM processed the highest number of cases since the agency implemented the Retirement Services Strategic Plan . OPM is on track to meet the goals set forth in the strategic plan .
There were two primary events beyond OPM’s ability to predict or control that prevented OPM from achieving the steady state of operations with a target processing time of 60 days and July 2013 for the reduction of the inventory . First, Voluntary Early Retirement Authority (VERA) and Voluntary Separation Incentive Program (VSIP) offers by the US Postal Service (USPS) added over 20,000 cases to the workload . Second, sequestration-related cuts meant that OPM stopped all overtime work on retirement processing in April of 2013, reducing our processing capacity . Reduced funding also caused a reduction in call center hours, which has affected customer service .
OPM remains committed to providing accurate and timely processing of retirement claims to Federal retirees . As such, and since tremendous efforts were made in nearly meeting our target, the target date of this goal has been updated to May 2014 .
Improving Access to Healthcare
In addition to handling the Federal government’s retirement process, OPM has been a key contributor to the implementation of The Patient Protection and Affordable Care Act of 2010 (Affordable Care Act or ACA) . The ACA expanded the scope of OPM’s mission to include contracting with health insurance issuers to offer health insurance plans in at least 31 of the state health insurance exchanges by October 1, 2013 . Also under the ACA, OPM has extended insurance benefits for the first time to Native American and Alaska Native tribal employees .
Agency Pr ior ity Goal s
The OPM Agency Priority Goals (APGs) are measurable commitments to deliver specific results for the American people . The APGs were announced in February 2012 and were to be completed by September 30, 2013 . These goals represent near-term, implementation-focused high priorities for both the Administration and OPM that can be accomplished without additional funding or new legislation and relate directly to OPM’s major performance improvement initiatives . A brief look at OPM’s progress in achieving each of our APGs can be found herein .
OPM Fiscal Year 2013 Agency Financial Report3
M e s s a g e f rom the D i r e c t o r
Continued
Diversity and Inclu sion
President Obama previously signed an Executive Order (EO) to promote the federal workplace as a model of diversity and inclusion . The EO required the Director of the U .S . Office of Personnel Management (OPM) and Deputy Director for Management of the Office of Management and Budget (OMB), in coordination with the President’s Management Council (PMC) and the Chair of the Equal Employment Opportunity Commission (EEOC), to establish a government-wide initiative . OPM’s Office of Diversity and Inclusion (ODI) is leading and guiding departments and agencies in the strategic focus on diversity and inclusion as well as providing support for these agencywide efforts . I am committed to building a workforce at all levels of government that reflects the people we serve . OPM will continue to work with agency leaders, managers, employees, and other stakeholders to strengthen diversity and inclusion within our federal workforce from resume to retirement .
Completeness and Reliabil ity of Financial and Per formance Information
The financial and performance information used by OPM in this AFR for FY 2013 is complete and reliable, as defined by OMB Circular No . A-136 and the Government Performance and Results Act . If there are instances where full and complete data for a measure are not available, these instances are noted and final information will be updated in the Annual Performance Report in February 2014 .
Conclu sion
OPM employees are talented, creative, and have the skills needed to produce positive and tangible results for the American people . OPM will continue to implement initiatives throughout the organization to improve the performance of its programs . Only by focusing on results that can be measured can we further our ability to meet the unique human resource challenges of the Federal Government and ensure a world class civilian workforce .
Katherine ArchuletaDirectorDecember 16, 2013


OPM Fiscal Year 2013 Agency Financial Report
Section 1 — ManageMent’S DiScuSSion anD analySiS
5
Se c t i o n 1 — Ma n a g e M e n t’S Di S c u S S i o n a n D an a ly S i S
(Unaudited—See accompanying Independent Auditors’ Report)
Agency Financial Report Overview
The United States (U .S .) Office of Personnel Management (OPM or the “Agency”), is the
central human resources agency for the Federal Government . OPM’s mission is to recruit, retain, and honor a world-class workforce to serve the American people . To perform this mission, OPM ensures executive agencies’ accountability for compliance with merit system principles and with Federal laws and regulations, including veterans’ preference; advising and assisting agencies on strategic human resources management; and works with Congress and other stakeholders on developing effective compensation, work/life, and benefits packages . OPM monitors merit-based human resources practices to ensure all Federal employees operate in a fair and discrimination-free environment, promoting recruitment practices that help agencies draw from the rich diversity of the American workforce, recognizing multi-generational differences, and encouraging practices that provide a welcoming environment in the workplace . OPM also administers retirement and health benefits, long-term care and life insurance, dental and vision and flexible spending account programs for Federal employees, retirees, and their beneficiaries and maintains the integrity of these programs .
OPM operates from its headquarters in the Theodore Roosevelt Federal Office Building at 1900 E Street, NW Washington, D .C ., 20415 . OPM delivers a variety of products and services with the support of approximately 5,000 headquarter employees as well as employees located across
16 locations around the country, including operating centers in Pittsburgh and Boyers, Pennsylvania; Ft . Meade, Maryland; and Macon, Georgia . The Center for Leadership Development is in Charlottesville, Virginia . For more information on OPM, see the agency’s website at www .opm .gov .
About This ReportThe Fiscal Year (FY) 2013 Agency Financial
Report (AFR) is the first document in a series of reports prepared to convey OPM’s budget, performance and financial information in a manner we believe is most useful to our stakeholders and constituents . The AFR provides an overview of OPM’s financial performance and results to help Congress, the President, and the public assess our stewardship over the financial resources entrusted to us . In addition to the AFR, OPM will submit an Annual Performance Report (APR) and a Summary of Performance and Financial Information (SPFI) . The APR and SPFI will be published in February 2014 . The AFR meets a variety of reporting requirements stemming from numerous laws focusing on improved accountability among Federal agencies and guidance described in Office of Management and Budget (OMB) Circulars Number (No .) A-11, A-123, and A-136 . OMB is a component within the Executive Office of the President (EOP) of the United States providing policy and guidance to executive agencies on numerous budgetary and other matters . Moreover, this AFR provides accurate and thorough accounting of OPM’s operational accomplishments during FY 2013 in fulfilling its mission .

OPM Fiscal Year 2013 Agency Financial Report
Section 1 — ManageMent’S DiScuSSion anD analySiS
6
This report is available on OPM’s website at www. opm.gov/gpra/opmgpra . Suggestions for improving this document should be sent to the following address:
Office of Personnel ManagementFinancial Services1900 E Street, NW Room 5478Washington, D .C . 20415
OPM’s Mission and Strategic Goals
The OPM Strategic Plan 2010-2015 is the starting point for performance and
accountability . The strategic plan includes the Agency’s mission statement and also describes OPM’s five strategic goals . The strategic goals are supported by a series of implementation strategies and performance indicators to gauge progress . OPM also reviews its performance measures as part of the annual budget planning process, which ensures that both internal and external stakeholders understand the level of program performance expected for the resources received . The OPM mission is to “Recruit, Retain, and Honor a World-Class Workforce to Serve the American People .” The mission will be accomplished by achieving the following five strategic goals shown in Table 1:
TABLE 1: OPM’s Mission Statement:
OPM’s Mission Statement:Recruit, Retain, and Honor a World-Class Workforce to Serve the American People
Strategic Goal Goal Statement
Hire the Best Recruit and hire the most talented and diverse Federal workforce possible to serve the American people
Respect the WorkforceProvide the training, benefits, and work-life balance necessary for Federal employees to succeed, prosper, and
advance in their careers
Expect the BestEnsure the Federal workforce and its leaders are fully accountable and are fairly appraised while having the tools,
systems, and resources to perform at the highest levels to achieve superior results
Honor ServiceEnsure comparable recognition and reward for exemplary performance of current employees and honor the careers
of Federal retirees
Improve Access to Health
Insurance
Develop and administer programs that provide high quality and affordable health insurance to uninsured Americans
who are seeking health insurance through Affordable Care Act exchanges, uninsured Americans with pre-existing
medical conditions who cannot otherwise purchase coverage, and employees of tribes or tribal organizations
To be successful, OPM’s strategic planning must be a continuous process that maintains close alignment with our evolving mission in support of the Federal government . In February 2012, OPM published an update to its strategic plan to reflect its new responsibilities associated with the implementation of the Patient Protection and Affordable Care Act . This update added the newest strategic goal listed above, “Improve Access to Health Insurance” .
The implementation strategies are the performance drivers behind the OPM Strategic Plan, and include the specific actions OPM undertakes and the deliverables produced to enhance program performance, achieve program outcomes, and enable the Agency to meet its strategic goals and fulfill the mission . OPM’s Strategic Plan can be found at: http://www.opm.gov/about-us/budget-performance/strategic-plans/2010-2015-strategic-plan.pdf .

OPM Fiscal Year 2013 Agency Financial Report
Section 1 — ManageMent’S DiScuSSion anD analySiS
7
Figure 1 — Organizational Chart
Employee Services
Human Resources Solutions
Federal Investigative
Services
Merit SystemAccountability & Compliance
Healthcare & Insurance
Retirement Services
Chief Financial OfficerChief Information Officer
Facilities, Security, & ContractingEqual Employment Opportunity
Diversity & InclusionOffice of the
Inspector General
General CounselCongressional, Legislative & Intergovernmental Affairs
Communications & Public LiaisonPlanning & Policy Analysis
Federal Prevailing Rate Advisory Committee Chief Human
Capital Officer Council
OPM HR(Dep CHCO)
Pay & Leave
Retirement Operations
Recruitment & Hiring
Agency & Veterans Support
Partnership & Labor Relations
Executive Resources
& Employee Development
Quality Assurance
Benefits Officers Training &
Development
Retirement Policy
National Healthcare Operations
Internal Oversight & Compliance
Healthcare Program
Development & Implementation
Federal Employees Insurance
Operations
Voting Rights
Combined Federal
Campaign
Agency & Compliance &
Evaluation
Technical Services
Operations
External Affairs
Administrative Services
Leadership & Talent
Management Solutions
Emerging Solutions/HR
Innovation
Administrative Law Judges
Office of the Director
Organizational Structure
OPM’s organizational structure reflects primary business lines through which OPM carries
out its programs and implements its strategic goals and related implementation strategies . As shown in Figure 1 - Organizational Chart, OPM is comprised of the following components:
Executive Offices• The Office of the Director includes the Director of
OPM, Deputy Director, Chief of Staff, Director of External Affairs, and the Executive Director of the Chief Human Capital Officers Council . This office is charged with keeping the direction of the Agency in line with its mission .

OPM Fiscal Year 2013 Agency Financial Report
Section 1 — ManageMent’S DiScuSSion anD analySiS
8
• Human Capital: The Chief Human Capital Officers Act of 2002, enacted as part of the Homeland Security Act of 2002 (Pub . L . No . 107-296) on November 25, 2002, required the heads of 24 Executive Departments and agencies to appoint or designate Chief Human Capital Officers (CHCOs) . Each CHCO serves as his or her agency’s chief policy advisor on all human resources management issues and is charged with selecting, developing, training, and managing a high-quality, productive workforce .
• Communications and Public Liaison (CPL) is responsible for coordinating a comprehensive effort to inform the public of the President’s and the Director’s goals, plans and activities through various media outlets . CPL is also responsible for planning and coordinating the publication and production of all printed materials that are generated from OPM offices and develops briefing materials for Congress, the Director and other OPM officials for various briefings and events .
• Congressional, Legislative, & Intergovernmental Affairs (CLIA) advocates for the legislative and policy priorities of the Director and the Administration . CLIA is the focal point for all congressional and legislative activities for the OPM . CLIA educates, responds to, interacts with, and advises Congress on Federal human resources management policy . CLIA also counsels and advises the Director and other OPM officials on policy, and congressional and legislative matters . CLIA also serves as OPM’s principal interface with State, local, and tribal governments and ensures that OPM meets requirements for tribal consultation .
• Office of the General Counsel (OGC) provides expert legal advice to the Director and senior OPM officials to ensure that policies, programs, and procedures are consistent with applicable rules, regulations, and statutes affecting civil service personnel law and human resources management . OGC also provides expert legal representation to OPM managers and leaders
in an attempt to mitigate the Agency’s risk of litigation and ensure Agency actions are in compliance with applicable statutes, rules, and regulations, and to ensure that agency actions are not unlawful .
• Equal Employment Opportunity (EEO) provides a fair, legally-correct and expedient EEO complaints process (i .e ., EEO counseling, Alternative Dispute Resolution, and EEO Complaints Intake, Investigation, Adjudication, and Record-Keeping) . EEO designs and implements all required Special Observance and Special Emphasis initiatives, to promote diversity management .
• Diversity and Inclusion (D&I) examines policy options, government-wide data trends, and employee survey findings that affect OPM’s management of HR policy, specifically including diversity and inclusion throughout the Federal government . D&I develops comprehensive strategies to drive and integrate diversity and inclusion practices throughout the Federal government and to help build a diverse and inclusive workforce, respecting individual and organizational cultures, while complying with merit principles and applicable Federal laws .
Program Divisions• Employee Services (ES) provides policy direction
and leadership in designing, developing and promulgating Government-wide human resources systems and programs for recruitment, pay, leave, performance management and recognition, employee development, work/life/wellness programs and labor and employee relations . ES provides technical support to agencies regarding the full range of human resources management policies and practices, to include veterans’ employment as well as the evaluation of their human resource programs . ES manages the operation of OPM’s internal human resources program .
• Retirement Services (RS) is responsible for administering the Civil Service Retirement System (CSRS) and the Federal Employee

OPM Fiscal Year 2013 Agency Financial Report
Section 1 — ManageMent’S DiScuSSion anD analySiS
9
Retirement System (FERS), serving 2 .5 million Federal retirees and survivors who receive monthly annuity payments . Processing retirements of Federal employees is a mission critical OPM program . The processing of retirement claims includes managing the preparation and submission of retirement applications and assisting employees in understanding their retirement options . The process begins with retirement estimates and continues through ensuring the application package is accurate, complete, and timely .
• Healthcare & Insurance (HI) is responsible for Government-wide administration of healthcare and insurance programs for Federal employees, retirees, and their families; facilitating the providing of benefits programs and services that offer choice, value, and quality to help maintain the Government’s position as a competitive employer . HI is responsible for negotiating and administering health benefits contracts for the Federal Government, and administering the Federal Employees’ Group Life Insurance Program (FEGLI) covering employees, retirees and their families . In addition, HI is responsible for administering three voluntary, enrollee-pay-all programs: a long term care insurance program; flexible spending accounts for medical and dependent care expenses; and a group dental and vision insurance program . HI is also responsible for implementing portions of the Patient Protection and Affordable Care Act of 2010 including: 1) contracting with Multi-State health plans being offered on health insurance exchanges; 2) expanding access of the Federal Employees’ Health Benefit Program (FEHBP) and the Federal Employees’ Group Life Insurance Program (FEGLI) to employees of tribes and tribal organizations; and 3) managing a contract with a health insurer to provide health insurance coverage to people with pre-existing conditions .
• Merit System Audit & Compliance (MSAC) ensures through rigorous oversight that Federal agency human resources programs are effective and meet merit system principles and related civil service requirements . The Division carries out this responsibility with a staff of employees
in five field offices across the nation and here in Washington . The three key components of the oversight and compliance programs are (1) Delegated Examining Unit Evaluations, (2) Large Agency Human Resources (HR) Evaluation, and (3) Small Agency HR Evaluations . MSAC has Government-wide oversight of the Combined Federal Campaign (CFC) and the Voting Rights (VR) programs . The mission of the CFC is to promote and support philanthropy through a program that is employee focused, cost-efficient, and effective in providing all federal employees the opportunity to improve the quality of life for all . The Voting Rights Program provides observers to cover political subdivisions (counties, cities, etc . as determined by the Attorney General) to monitor and report on those elections designated by the Attorney General . Finally, MSAC manages OPM’s Office of Internal Oversight and Compliance (IOC) . IOC drives the resolution of audit recommendations, conducts program evaluations, and oversees the review of capital investments to strengthen OPM’s risk management and operational performance .
• Federal Investigative Services (FIS) has a mission to ensure the Federal Government has a suitable workforce that protects National Security and is worthy of their Public Trust . FIS is responsible for providing investigative products and services for over 100 Federal agencies to use as the basis for security clearances or suitability decisions as required by Executive Orders and other rules and regulations . Over 90 percent of the Government’s background investigations are provided by OPM .
• Human Resources Solutions (HRS) provides services that assist agencies within the Federal Government in achieving their missions by partnering with agencies to provide effective human resource solutions that develop leaders, attract and build a high quality public sector workforce, and transform agencies into high performing organizations . HRS also offers services that enhance agencies’ ability to attract and acquire specific talent .
OPM Fiscal Year 2013 Agency Financial Report
Section 1 — ManageMent’S DiScuSSion anD analySiS
10
Common Services• Chief Financial Officer (CFO) manages and
oversees OPM accounting, billing, vendor payments, budget, performance, financial systems, risk management, internal control, and financial policy functions which enable the Agency to achieve its mission . CFO also ensures the completion of timely and accurate financial reports that improve decision-making, comply with Federal requirements, and demonstrate effective management of taxpayer dollars .
• Chief Information Officer (CIO) develops the Information Resource Management Plan and defines the Information Technology (IT) vision and strategy to include IT policy and security for OPM . CIO shapes the application of technology in support of the Strategic Plan including the IT Architecture that outlines the long term Strategic Architecture and Systems Plans for the Agency and includes IT Capital Planning . CIO supports and manages pre- and post-implementation reviews of major IT programs and projects, as well as project tracking at critical review points . CIO provides oversight of major IT acquisitions to ensure they are consistent with the Agency’s architecture and the IT budget, and is responsible for the development of the Agency’s IT security policies . CIO directs the realization of the Agency’s IT Architecture to guarantee architecture integration, design consistency, and compliance with Federal standards . CIO also works with other agencies on Government-wide projects such as e-Government, and develops long range planning for IT Human Resource Strategies .
• Facilities, Security, & Contracting (FSC) is composed of the following seven subcomponents and manages a broad array of OPM’s key day-to-day programs:
1 . Facilities Management manages the Agency’s personal and real property, building operations, space design and layout, realty, safety and occupational health programs .
2 . Emergency Actions directs the operations and oversight of OPM’s preparedness and emergency response programs .
3 . Contracting Management provides centralized contract management that supports the operations and Government-wide mission of OPM . It also manages OPM’s Purchase Card program .
4 . Office of Small and Disadvantaged Business Utilization manages OPM’s small business program in conjunction with public law, Federal regulations, and OPM Contracting policies .
5 . Publications Management establishes and oversees OPM’s nationwide publishing and printing management system for internal/external design and reproduction, its Government Printing Office (GPO)/commercial print ordering program, publications management, and electronic/office publishing systems .
6 . Security Services provides a safe and secure environment for OPM’s information, personnel, and operations .
7 . Personnel Security provides personnel security, suitability, and national security clearance determinations for OPM personnel .
Other Offices
• Planning and Policy Analysis (PPA) examines policy options, legislative changes, and the management of HR policy, including insurance and employee health and wellness benefits for Federal employees, trends in the supply, distribution and characteristics of federal employees, and federal employee engagement and satisfaction . PPA ensures that the benefits provide maximum value and are secure . PPA also conducts actuarial analysis, statistical tests using large data bases and analysis of results from surveys of Federal employees . PPA’s overall mission is to analyze program trends and policy issues that affect OPM and the Federal workforce . PPA also provides
OPM Fiscal Year 2013 Agency Financial Report
Section 1 — ManageMent’S DiScuSSion anD analySiS
11
critical assessments to OPM management on compliance with strategic goals and performance improvement .
OPM’s Performance Improvement Officer (PIO) is also the Director of Planning and Policy Analysis . The Deputy PIO, who is a senior advisor to the OPM Director, supports the PIO in conducting program performance reviews and fostering innovative practice . Staff in the CFO’s Budget and Performance Office helps the PIO monitor Agency performance, report on Agency performance, and conduct performance reviews .
• Federal Prevailing Rate Advisory Committee (FPRAC) studies the prevailing rate system and other matters pertinent to the establishment of prevailing rates under subchapter IV of chapter 53 of Title 5, United States Code, and advises the Director of OPM on the Government-wide administration of the pay system for blue-collar Federal employees .
• Office of the Inspector General (OIG) conducts comprehensive and independent audits, investigations, and evaluations relating to OPM programs and operations . It is responsible for administrative actions against health care providers that commit sanctionable offenses with respect to the FEHBP or other OPM programs . The OIG keeps the Director and Congress fully informed about problems and deficiencies in the administration of Agency programs and operations, and the need for corrective action .
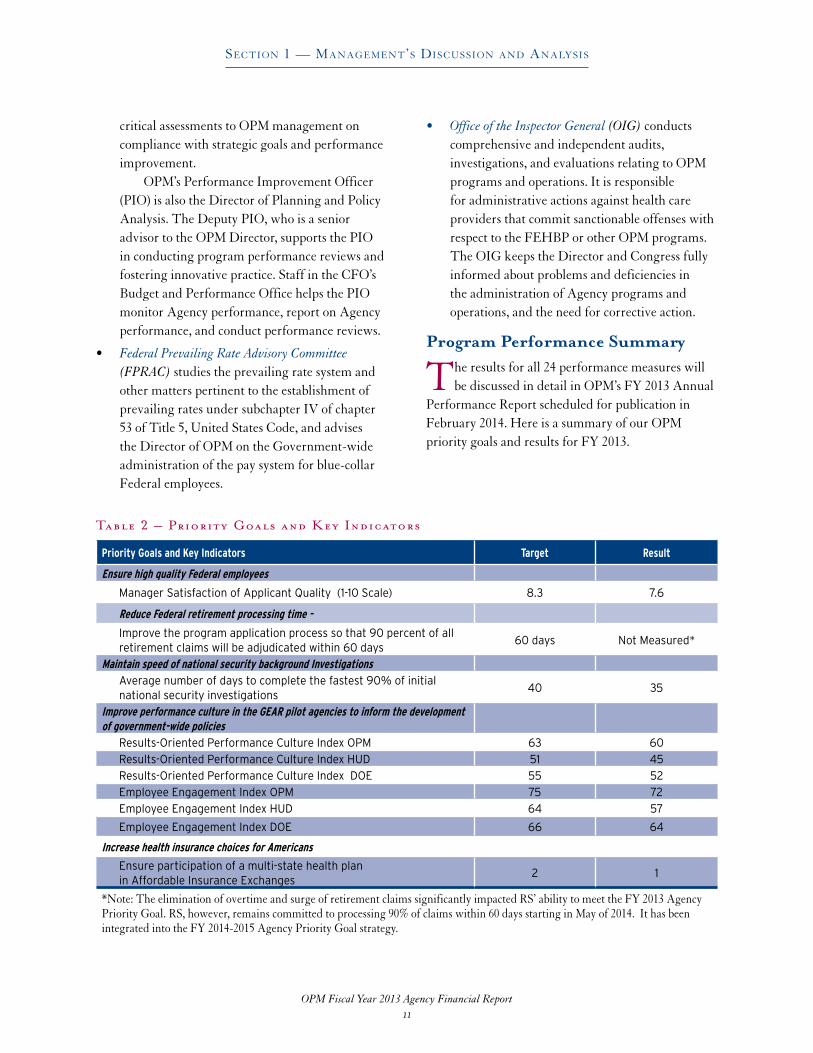
Program Performance Summary
The results for all 24 performance measures will be discussed in detail in OPM’s FY 2013 Annual
Performance Report scheduled for publication in February 2014 . Here is a summary of our OPM priority goals and results for FY 2013 .
Table 2 – Priority Goals and Key Indicators
Priority Goals and Key Indicators Target Result
Ensure high quality Federal employees
Manager Satisfaction of Applicant Quality (1-10 Scale) 8.3 7.6
Reduce Federal retirement processing time -
Improve the program application process so that 90 percent of all retirement claims will be adjudicated within 60 days
60 days Not Measured*
Maintain speed of national security background InvestigationsAverage number of days to complete the fastest 90% of initial national security investigations
40 35
Improve performance culture in the GEAR pilot agencies to inform the development of government-wide policies
Results-Oriented Performance Culture Index OPM 63 60Results-Oriented Performance Culture Index HUD 51 45Results-Oriented Performance Culture Index DOE 55 52Employee Engagement Index OPM 75 72Employee Engagement Index HUD 64 57
Employee Engagement Index DOE 66 64
Increase health insurance choices for Americans
Ensure participation of a multi-state health plan in Affordable Insurance Exchanges
2 1
*Note: The elimination of overtime and surge of retirement claims significantly impacted RS’ ability to meet the FY 2013 Agency Priority Goal . RS, however, remains committed to processing 90% of claims within 60 days starting in May of 2014 . It has been integrated into the FY 2014-2015 Agency Priority Goal strategy .
OPM Fiscal Year 2013 Agency Financial Report
Section 1 — ManageMent’S DiScuSSion anD analySiS
12
Performance Highlights by Strategic Goal Strategic Goal 1 - Hire the Best: Help agencies recruit and hire the most talented and diverse Federal workforce possible to serve the American people
OPM is spearheading a Government-wide initiative to reform recruiting and hiring policies and procedures . The reform effort will encompass sweeping changes to streamline the hiring process . OPM will extend its reach to ensure agencies find and hire the best talent possible for the Federal government .
During FY 2013, OPM continued to assist agencies to reduce the time-to-hire . To help agencies improve the capacity of data systems to more accurately calculate time to hire, a working group of the Chief Human Capital Officers Council partnered with OPM to develop consistent guidelines for calculating time-to-hire results . OPM used these guidelines to validate agency calculations and to help agencies better examine their processes and metrics . Through this improved guidance, agencies have achieved better integrity and validation of the data reported .
OPM is also working with agencies to promote and improve applicant satisfaction with the application process . Applicant satisfaction with the application process is about more than the speed of hiring . It also considers the complexity and length of the application, and whether the application questions are relevant . It considers how well applicants are kept aware of their status during the process . OPM monitors and measures the percent of applicants that respond to the CHCO applicant survey with a positive rating (an 8 or above on a 10 point scale) indicating satisfaction with the job application process .
Strategic Goal 2 - Respect the Workforce: Provide the training, benefits, and work-life balance necessary for Federal employees to succeed, prosper, and advance in their careers
To improve the results of Federal programs and services, the government must invest in its most valuable resource – its employees . Providing training throughout an employee’s career – from entry-level to executive – is critical to mission accomplishment and leadership succession planning . Having a suite of flexible benefits and promoting a healthy work-life balance across the Federal government also contributes to building an engaged workforce, employee well-being and retention . Programs and initiatives, such as alternative work schedules, telework, and employee assistance programs are designed to help employees identify and resolve personal and/or work-related issues that may affect their productivity . Investments in training, benefits, and work-life balance initiatives benefit current employees and help us continue to attract the best and brightest for Federal service .
During FY 2013, OPM implemented the Supervisor and Manager Development Framework . The Framework is designed to streamline all required training that OPM’s supervisors and managers must complete in order to meet statutory and regulatory requirements, and to develop and sustain outstanding leadership and management skills . The five components are:
• SupervisoryCompetencyAssessment• LeadershipDevelopmentPlan• MandatorySupervisoryCourses• SupervisorCohortGroups• OptionalSupervisoryCoursesIn addition to delivering mandatory training
to all supervisors, OPM implemented Supervisor Cohort Groups whose goal is to create a network of support and learning for supervisors in a collaborative, informal setting . Twenty-one of OPM’s Senior Leaders referred to as “Senior Advisors,” have volunteered to lead the cohort groups . The

OPM Fiscal Year 2013 Agency Financial Report
Section 1 — ManageMent’S DiScuSSion anD analySiS
13
Senior Advisors are the organizers of the cohort meetings and bring a community of shared leadership through books, videos, and other mediums to create engaging and valuable conversations in leadership development . One benefit of these cohorts is the opportunity to get to meet and collaborate with supervisors from different organizations and levels, which in turn facilitates building a network that goes beyond a supervisor’s current work unit .
Strategic Goal 3 - Expect the Best: Ensure the Federal workforce and its leaders are fully accountable, fairly appraised, and have the tools, systems, and resources to perform at the highest levels to achieve superior results
OPM assures that agencies across the Federal government hold leaders accountable for results . For agencies to succeed and meet the challenges of the 21st century, OPM must transform the civil service system to be flexible, agile, and responsive enough to adapt to any circumstance . OPM provides human resources management solutions, establishes the standards for continuous improvement, and leads by example to achieve agency results .
During FY 2013, OPM continued to implement the GEAR (Goals-Engagement-Accountability-Results) initiative . GEAR is a government-wide initiative to improve performance management through actionable behavior change among supervisors and employees . OPM is implementing GEAR agency-wide in collaboration with both local American Federation of Government Employees bargaining units in OPM’s Labor Management Forum . The “Report to the National Council on Federal Labor-Management Relations–Getting in G .E .A .R . for Employee Performance Management” makes key recommendations to meet GEAR objectives including:
• Articulatingahigh-performanceculture,• Aligningemployeeperformancemanagement
with organizational performance management,• Implementingaccountabilityatalllevels,• Creatingacultureofengagement,and
• Improvingthedevelopmentandtrainingofsupervisors .
By integrating GEAR training into the Supervisor and Manager Development Framework, OPM is modeling how organizations can make effective performance management part of their “DNA .”
To deliver GEAR training in a streamlined and effective manner, OPM has developed “The Five Conversations: How Leaders release the Potential of People” – a training course that uses leadership dialogue to improve performance through structured conversations and technology-enabled tools . The objectives of this training are to:
• Provideaseniorleadershipforumonperformance culture
• Identifysystemicperformancebarriers• Examinesystemicdriversforenhanced
performance• Updatetheexecutiveroleinleading
performance• UnderstandtheprinciplesoftheFive
Conversations• Brainstormsolutionstoorganizationalbarriers• Fosteraleadershipcommunityofpractice.
Strategic Goal 4 - Honor Service: Ensure recognition and reward for exemplary performance of current employees and honor the careers of Federal retirees
Many of the employees working for the Federal Government share a philosophy to give something to the wider public or community through their work . This work often requires high levels of training and education, and employees are often prepared to work harder for less pay . Therefore, it is incumbent on the Federal Government to establish a performance system that will treat employees fairly, be easy for managers to use, reward those with exemplary service, and be understandable to the public .
During FY 2013, OPM made significant progress towards its goal of eliminating the backlog of retirement claims so that 90 percent of all future claims would be adjudicated within 60 days . OPM was on track to meet this goal by the
OPM Fiscal Year 2013 Agency Financial Report
Section 1 — ManageMent’S DiScuSSion anD analySiS
14
July 31, 2013 deadline, but budget cuts associated with the sequester forced OPM to eliminate overtime for personnel processing retirement claims . As of September fiscal year end 2013, the inventory of retirement claims stands at 17,719, a reduction of nearly 57 percent from the previous year . A monthly report tracking the claims inventory can be found at: http://www.opm.gov/StrategicPlan/pdf/RetirementProcessingStatus.pdf.
In addition to the work accomplished to reduce the claims inventory, OPM has: • ContinuedagencyoutreachwiththeU.S.Postal
Service (USPS) and the Defense Finance and Accounting Service (DFAS), to enhance services delivered to retirees;
• ContinuedtomakeimprovementsthroughtheLean Six Sigma initiative;
• RevampedtheRetirementCallCenter’stollfreenumber’s menu option to emphasize Services On-Line (SOL) and provide a simplified structure . SOL provides retirement services on demand, enabling users to do a wide variety of transactions online such as viewing case status while in interim pay, updating email and/or address information, and other retirement related activities; and,
• Continuedtotrackcompleteretirementsubmissions as a ratio of incomplete cases . Incomplete submissions are a major factor in the delayed processing of retirement claims . As of September 2013, OPM received 92 percent of complete retirement submissions from Federal agencies . OPM conducts audits on all agency retirement packages during the review and development stage of processing . Results are entered into the Agency Audit Tracking System and reports are generated that calculate the government-wide and individual agency accuracy rates . The percentage of CSRS/FERS new claims with errors is reported monthly and can be found at: http://www.opm.gov/about-us/budget-performance/strategic-plans/agency-audit-monthly-update.pdf.
Strategic Goal 5 - Improve Access to Health Insurance: Develop and administer programs that provide high quality and affordable health insurance to uninsured Americans who are seeking health insurance through Affordable Care Act exchanges, uninsured Americans with pre-existing medical conditions who cannot otherwise purchase coverage, and employees of tribes or tribal organizations
OPM will accomplish two tasks under the Patient Protection and Affordable Care Act (ACA) . The first is the implementation and oversight of multi-state health plan options to be offered on affordable health insurance exchanges beginning in 2014 . Multi-state plans (MSPs) will be among health insurance options that small employers and uninsured individuals will be able to choose from, and will ensure that exchanges fulfill their mission of providing a vibrant health care marketplace . In addition, the ACA includes a provision for OPM to enable tribes and tribal organizations to purchase insurance coverage through the Federal Employee Health Benefits Program (FEHBP) and the Federal Employee Group Life Insurance Program (FEGLI) for their employees .
During FY 2013, the Multi-State Plan Program (MSPP) Notice of Proposed Rule Making (NPRM) was published in the Federal Register, and open for public comment, from December 5, 2012, to January 4, 2013 . The NPRM outlined OPM’s approach to implement the MSPP and 358 public comments were submitted on the NPRM . The MSPP final regulation was published in the Federal Register on March 11, 2013 and established standards for MSPP insurance issuers to participate in the program .
The MSPP application was published in FedBizOpps on January 18, 2013 . Insurance providers interested in participating in the MSPP and offering their plan in the marketplace applied using an online application portal .
OPM Fiscal Year 2013 Agency Financial Report
Section 1 — ManageMent’S DiScuSSion anD analySiS
15
In addition, OPM completed the following activities in preparation for the Open Enrollment which began on October 1, 2013:
• CoordinatedwiththeHHS’CenterforConsumer Information and Insurance Oversight (CCIIO)
• WorkedwithStateofficialstoensuretheMSPPOptions are presented on state exchanges .
• Workedwithminorityandsmallbusinessgroupsto help educate people about the Affordable Care Act;
• ConductedcomplexanalysesofFederalandStatehealth insurance laws;
• ConductedbriefingsforCongress;
• Completedcontractrateandbenefitnegotiationswith issuers offering MSPs in 31 States .
Quality of Performance DataIn accordance with the requirements of the
Government Performance and Results Act (GPRA) and the GPRA Modernization Act (GPRAMA), OPM ensures the information in its AFR, as well as APR, accurately reflects its performance and is based on reasonably complete, accurate, and reliable data . OPM program offices document data collection, reporting, and verification procedures for program performance measures, establishing a control environment based on data quality standards established by OPM’s Chief Financial Officer (CFO) . Performance information is validated with data evidence by the Office of the CFO . Additional information on OPM’s performance data quality will be available with the publication of OPM’s FY 2013 APR and Summary of Performance and Financial Information (SPFI), scheduled for publication in February 2014 concurrent with the submission of the President’s FY 2015 Budget to Congress .
Analysis of OPM’s Financial Statements
In accordance with the Chief Financial Officers Act of 1990 and the Government Management Reform
Act of 1994, OPM prepares consolidated financial statements, which include OPM operations, as well as the individual financial statements of the Retirement, Health Benefits, and Life Insurance Programs . These statements are audited by an independent certified public accounting firm, KPMG LLP . For the fourteenth consecutive year, OPM has earned an unqualified audit opinion on its consolidated financial statements and on the individual financial statements of the Retirement, Health Benefits, and Life Insurance Programs, respectively . These consolidated and individual financial statements are the:
• Balance Sheet (consolidated)
• Statement of Net Cost (consolidated)
• Statement of Changes in Net Position (consolidated)
• Statement of Budgetary Resources (combined)
Balance Sheet The Balance Sheet is a representation of OPM’s
financial condition at the end of the fiscal year . It shows the resources OPM holds to meet its statutory requirements (Assets); the amounts it owes that will require payment from these resources (Liabilities); and, the difference between them (Net Position) .
AssetsAt the end of FY 2013, OPM held $987 billion
in assets, an increase of 2 .7 percent from $961 billion at the end of FY 2012 . The majority of OPM’s assets are intragovernmental, representing claims against other Federal entities . The Balance Sheet separately identifies intragovernmental assets from all other assets .

OPM Fiscal Year 2013 Agency Financial Report
Section 1 — ManageMent’S DiScuSSion anD analySiS
16
The largest category of assets is investments at $836 billion, which represents 84 .7 percent of all OPM assets . OPM invests all Retirement, Health Benefits, and Life Insurance Program collections not needed immediately for payment in special securities issued by the U .S . Treasury . As OPM routinely collects more money than it pays out, its investment portfolio and its total assets, in normal years, usually both grow . However, in FY 2013, as a result of the Debt Issuance Suspension Period (DISP) that began on May 20, 2013, and continued until October 17, 2013, the investment portfolio decreased by 11 .4 percent, with the largest decrease for investments occurring in the Retirement Program . See Note 1J in Section 2 of the AFR for further information on the DISP .
In FY 2013, the Total Earned Retirement Program Revenue was less than the applicable cost applied to the Pension Liability by $17 .5 billion . When the net effect is favorable, the Retirement Program has the ability to reinvest interest earnings and apply the excess funds to the U .S . Treasury Transferred-In to subsidize the under funding of the Civil Service Retirement System (CSRS) . The CSRS under funding was a total of more than $33 .0 billion for FY 2013, which combined with the DISP, resulted in a decrease in the investment portfolio of $107 .6 billion for FY 2013 from FY 2012 .
LiabilitiesAt the end of FY 2013, OPM’s total liabilities
were $2,149 billion, an increase of 4 .6 percent from $2,054 billion at the end of FY 2012 . Three line items — the Pension, Post-Retirement Health Benefits, and the Actuarial Life Insurance Liabilities — account for 99 .4 percent of OPM’s liabilities . These liabilities reflect estimates by professional actuaries of the future cost, expressed in today’s dollars, of providing benefits to participants in the future .
To compute these liabilities, the actuaries make many assumptions about the future economy and about the demographics of the future Federal employee and annuitant (retirees and their survivors) populations .
The Pension Liability, which represents an estimate of the future cost to provide CSRS and FERS benefits to current employees and annuitants, is $1,774 billion at the end of FY 2013, an increase of $95 billion, or 5 .7 percent from the end of the previous year . [See discussion of the Net Cost to Provide CSRS and FERS Benefits below] .
The Post-Retirement Health Benefits Liability, which represents the future cost to provide health benefits to active employees after they retire, is $315 billion at the end of FY 2013 . This reflects a decrease of approximately $ .9 billion from the amount at the end of FY 2012, or - .3 percent . [See discussion of the Net Cost to Provide Health Benefits below] .
The Actuarial Life Insurance Liability is different from the Pension and Post-Retirement Health Benefits Liabilities . Whereas the other two are liabilities for “post-retirement” benefits only, the Actuarial Life Insurance Liability is an estimate of the future cost of life insurance benefits for both deceased annuitants and for employees who die in service . The Actuarial Life Insurance Liability increased by approximately $ .3 billion in FY 2013 to $47 billion, or .6 percent from the end of the previous year . [See discussion of the Net Cost to Provide Life Insurance Benefits below] .

OPM Fiscal Year 2013 Agency Financial Report
Section 1 — ManageMent’S DiScuSSion anD analySiS
17
Actuarial Gains and LossesDue to actuarial gains and losses, OPM’s Net Cost to Provide Retirement, Health Benefits, and Life
Insurance Benefits can vary widely from year to year . Actuarial gains decrease OPM’s Net Cost, while actuarial losses increase it . What are actuarial gains and losses?
In computing the Pension, Post-Retirement Health Benefits, and Actuarial Life Insurance Liabilities, OPM’s actuaries must make assumptions about the future . When the actual experience of the Retirement, Health Benefits, and Life Insurance Programs differs from these assumptions, as it generally will, actuarial gains and/or losses will occur . For example, should the COLA increase be less than the actuary assumed, there will be an actuarial experience gain . A decrease in the assumed future rate of inflation would produce a gain due to a revised actuarial assumption .
Net PositionEffective for FY 2013, OPM is no longer required to report its Federal employees’ benefit programs funds as
Earmarked Funds . Statement of Federal Financial Accounting Standard (SFFAS) No . 43, Dedicated Collections: Amending SFFAS No . 27, “Identifying and Reporting Earmarked Funds .” is effective for periods beginning after September 30, 2012 . This Statement among other provisions, adds “an explicit exclusion for any fund established to account for pensions, other retirement benefits (ORB), other postemployment (OPEB), or other benefits provided for federal employees (civilian and military) .” OPM implemented this for its FY2013 Financial Statements, as seen in Section 2 of this report .
OPM’s Net Position is classified into two separate balances . The Cumulative Results of Operations comprises OPM’s net results of operations since its inception . Unexpended Appropriations is the balance of appropriated authority granted to OPM against which no outlays have been made .
OPM’s total liabilities exceeded its total assets at the end of FY 2013 by $1,162 billion, primarily due to the large actuarial liabilities . It is important to note that the Retirement, Health Benefits, and Life Insurance Programs are funded in a manner that ensures there will be sufficient assets available to pay benefits well into the future . Table 3 – Net Assets Available for Benefits – shows that OPM’s net assets available to pay benefits have increased by $25 .7 billion in FY 2013 to $973 .6 billion .
Table 3 — Net Assets Available for Benefits
($ in Billions) FY 2013 FY 2012 Change
Total Assets $ 986.8 $ 961.0 $ 25.8
Less “Non-Actuarial” Liabilities 13.2 13.1 0.1
Net Assets Available to Pay Benefits $ 973.6 $ 947.9 $ 25.7
Statement of Net CostThe Statement of Net Cost (SNC) in the federal government is different from a private-sector income statement
in that the SNC reports expenses first and then subtracts the revenues that financed those expenses to arrive at a net cost .
OPM’s SNC presents its cost of providing four major categories of benefits and services: Civil Service Retirement and Disability Benefits (CSRS and FERS), Health Benefits, and Life Insurance Benefits, as well as Human Resources Services . OPM derives its Net Cost by subtracting the revenues it earned from the gross costs it incurred in providing each of these benefits and services .

OPM Fiscal Year 2013 Agency Financial Report
Section 1 — ManageMent’S DiScuSSion anD analySiS
18
OPM’s total FY 2013 Net Cost of Operations was $113 .0 billion, as compared with a $142 .0 billion net cost in FY 2012 . The primary reasons for the decrease in net cost is due to changes in the actuarial assumptions, which offset the actual COLA and salary increase being lower than anticipated, as further discussed below .
Net Cost to Provide CSRS BenefitsAs presented in Table 4, OPM incurred a Pension Expense for the CSRS Benefits of $85 .6 billion compared
with $153 .3 billion, a decrease of $67 .7 billion from FY 2012 . The actuarial loss of $28 .9 billion for CSRS was primarily due to losses due to changes in economic and demographic assumptions .
There are three prime determinants of OPM’s cost to provide net CSRS benefits: one cost category (the actuarially computed Pension Expense) and two categories of earned revenue: 1) contributions by and for CSRS participants, and 2) earnings on CSRS investments . The Pension Expense for the CSRS is the amount of future benefits earned by participants during the current fiscal year .
Contributions by and for CSRS participants decreased in FY 2013 by $480 million from FY 2012 and OPM’s earnings on CSRS investments declined by approximately $3,160 million from FY 2012 .
Table 4 — Net Cost to Provide CSRS Benefits
($ in Billions) FY 2013 FY 2012 Change
Gross Cost $ 85.6 $ 153.3 $ (67.7)
Associated Revenues 16.9 20.3 (3.4)
Net Cost $ 68.7 $ 133.0 $ (64.3)
Current pension benefits paid are applied to the Pension Liability and, therefore, do not appear on the Statement of Net Cost; however, SFFAS No . 33 requires gains and losses from changes in long term assumptions to be displayed on the statement of net cost separately from other costs . OPM paid CSRS benefits of $68 .7 billion in FY 2013, as compared to the $66 .8 billion in FY 2012 . The increase in benefits paid is primarily due to the effect of the cost-of-living allowance .
Net Cost to Provide FERS BenefitsAs shown in Table 5, the Net Cost to Provide FERS Benefits in FY 2013 increased by $19 .0 billion from
FY 2012 . As with the CSRS, there are three prime determinants of OPM’s net cost to provide FERS benefits: one cost category: the actuarially computed Pension Expense; and two categories of earned revenue: contributions by and for participants, and earnings on FERS investments .
The Pension Expense for FERS is the amount of future benefits earned by participants during the current fiscal year . For FY 2013, OPM incurred a Pension Expense for FERS of $86 .7 billion, as compared with $66 .4 billion in FY 2012 . The primary reason for the increase in FERS pension expense from FY 2012 to FY 2013 was due to changes in actuarial assumptions . There was a total actuarial loss of $20 .1 billion in FY 2012, which was followed by a total actuarial loss of $34 .9 billion in 2013 that contributed to the increase in pension expense of $20 .3 billion from FY 2012 to FY 2013 .
The FY 2012 Pension Expense reflected an experience gain primarily due to a lower than expected FERS employee population . The FERS experience gain in FY 2013 results primarily from the actual general salary increase being lower than assumed as well as a lower than expected 2013 COLA . The actual general salary increase in FY 2013 was 0 .0 percent and the actual FERS COLA was 1 .7 percent; for the prior year’s FY 2012 actuarial valuation, the general salary increase that had been assumed was 2 .6 percent and the assumed FERS COLA was 2 .0 percent .

OPM Fiscal Year 2013 Agency Financial Report
Section 1 — ManageMent’S DiScuSSion anD analySiS
19
The liabilities for current FERS annuitants are much smaller than the liabilities for current CSRS annuitants, therefore the actual first-year COLA is much less significant for FERS than for CSRS . Conversely, the liabilities for current FERS employees are much greater than for current CSRS employees, thus the actual first year general salary increase is relatively more significant for FERS than for CSRS . The FY 2013 experience gain was offset, however, by the loss due to changes to economic and demographic assumptions .
Contributions by and for FERS participants increased by $386 million, or 1 .5 percent from FY 2012, also due to the increasing number of FERS participants .
Table 5 — Net Cost to Provide FERS Benefits
($ in Billions) FY 2013 FY 2012 Change
Gross Cost $ 86.7 $ 66.4 $ 20.3
Associated Revenues 42.7 41.4 1.3
Net Cost $ 44.0 $ 25.0 $ 19.0
Due to accounting standards, current pension benefits paid are applied to the Pension Liability and therefore, do not appear on the Statement of Net Cost . In FY 2013, OPM paid FERS benefits of $8 .4 billion, compared with $7 .3 billion in FY 2012 . The increase is due to the growing number of FERS retirees .
Net Cost to Provide Health BenefitsThe Net Cost to Provide Health Benefits in FY 2013 increased by $17 .8 billion from that in FY 2012 (Table 6) .
There are three prime determinants of OPM’s net cost to provide Health Benefits: two cost categories: the actuarially computed Post-Retirement Health Benefits Expense, and Current Benefits and Premiums, and one earned revenue category: contributions by and for participants .
Table 6 — Net Cost to Provide Health Benefits
($ in Billions) FY 2013 FY 2012 Change
Gross Cost $ 42.8 $ 29.9 $ 12.9
Associated Revenues 42.0 46.9 (4.9)
Net Cost (Net Income) $ .8 ($17.0) $ 17.8
The Postal Service Retiree Health Benefits (PSRHB) Fund is included in the Health Benefits Program . On October 1, 2009, President Obama signed into law, P .L . 111-68, Division B – Continuing Appropriations Resolution 2011 which contained significant changes to the funding requirements and scheduled payments of P .L . 109-435, December 20, 2006, known as the Postal Act . In addition, due to the Continuing Resolutions enacted by Congress, P .L . 112-33 and P .L . 112-36, United States Postal Service’s (USPS) payment schedule was amended . The subsequent funding law, P .L . 112-74, included a provision to extend the deadline to August 1, 2012 for the $5 .5 billion payment that was originally due September 30, 2011 .
As such, there were two payments due from USPS in FY 2012, one for $5 .5 billion by August 1, 2012, and a second payment of $5 .6 billion due by September 30, 2012, a total of $11 .1 billion . Furthermore, for FY 2013, another $5 .6 billion payment was due by September 30, 2013 . As of September 30, 2013, USPS has defaulted on these payments and OPM has recorded receivables for the total amount of $16 .7 billion . At this time, Congress has not taken further action on these payments due from USPS to the PSRHB Fund .

OPM Fiscal Year 2013 Agency Financial Report
Section 1 — ManageMent’S DiScuSSion anD analySiS
20
The Post-Retirement Health Benefits (PRHB) Expense is the amount of future benefits earned by participants during the current fiscal year . For FY 2013, OPM incurred a PRHB expense of $12 .5 billion, as compared with $ .3 billion in FY 2012, due to an actuarial loss from assumptions in FY 2013 as compared to an actuarial gain from assumptions in FY 2012; the actuarial gain from experience also was lower in FY 2013 as compared to FY 2012 .
For the Actuarial gain/loss portion of the PRHB expense, the results were due primarily to population change, lower than expected medical cost increase, updated cost curve assumptions, and changes in the SFFAS No . 33 trend and interest assumptions; the interest assumption is a single equivalent rate of 4 .4 percent .
Current Benefits and Premiums stayed level with FY 2012 . However, the contributions (for and by participants) decreased by $4 .8 billion from FY 2012 to FY 2013 . As discussed above, in FY 2012, a total of $11 .1 billion was due to the PSRHB Fund; for FY 2013, a $5 .6 billion payment was due to the PSRHB Fund .
Due to accounting standards, a portion of the costs to provide health benefits is netted against the PRHB Liability and not fully disclosed on the Statement of Net Cost . The actual costs to provide health benefits are presented in Table 7 .
Table 7 — Disclosed and Applied Costs to Provide Health Benefits
($ in Billions) Disclosed Applied to PRHB Total FY 2013 Total FY 2012
Claims $ 24.5 $ 10.3 $ 34.8 $ 34.0
Premiums 4.4 2.1 6.5 6.6
Administrative and other 1.3 1.0 2.3 2.2
Net Cost to Provide Life Insurance BenefitsAs seen in Table 8, the Net Cost (Net Income) to Provide Life Insurance Benefits decreased from $1 .1 billion
in FY 2012 to a Net Income of $ .9 billion in FY 2013 . Gross cost decreased $2 .3 billion due to the actuarial gain in FY 2013 as compared to FY 2012 . In applying SFFAS No . 33 for calculating the Actuarial Life Insurance Liability (ALIL), OPM’s actuary used salary increase and interest rate yield curve assumptions consistent with those used for computing the CSRS and FERS Pension Liability in FY 2013 and 2012 . This entails determination of a single equivalent interest rate that is specific to the ALIL . Both the interest rate and rate of increases in salary assumptions were lower for FY 2013 as compared to FY 2012 . Associated revenues generally remained at the same level .
Table 8 - Net Cost to Provide Life Insurance Benefits
($ in Billions) FY 2013 FY 2012 Change
Gross Cost $ 3.1 $ 5.4 $ (2.3)
Associated Revenues 4.0 4.3 (.3)
Net Cost (Net Income) $ (.9) $ 1.1 $ (2.0)
StateMent of BuDgetary reSourceS
In accordance with Federal statutes and implementing regulations, OPM may incur obligations and make payments to the extent it has budgetary resources to cover such items . The Statement of Budgetary Resources (SBR) presents the sources of OPM’s budgetary resources, their status at the end of the year, obligated balances, and the relationship between its budgetary resources and the outlays it made against them .
As presented in the SBR, a total of $232 .6 billion in budgetary resources was available to OPM for FY 2013 . OPM’s budgetary resources in FY 2013 included $59 .4 billion (25 .6 percent) carried over from FY 2012, plus three major additional sources:

OPM Fiscal Year 2013 Agency Financial Report
Section 1 — ManageMent’S DiScuSSion anD analySiS
21
• AppropriationsReceived=$44.2billion(19 .0 percent)
• TrustFundreceiptsof$93.4billion,less$15.9billion*notavailable=$77.5billion(33 .3 percent)
• Spendingauthorityfromoffsettingcollections(SAOC)=$51.5billion(22.1percent)
* Total budgetary resources do not include $15 .9 billion of Trust Fund receipts for the Retirement obligations pursuant to public law . In addition, in accordance with P .L . 109-435, contributions for the PSRHB Fund of the Health Benefits Program are precluded from obligations totaling $46 .9 billion and therefore temporarily not available .
Appropriations are funding sources resulting from specified Acts of Congress that authorize Federal agencies to incur obligations and to make payments for specified purposes . OPM’s appropriations partially offset the increase in the Pension Liability in the Retirement Program, and fund contributions for retirees and survivors who participate in the Health Benefits and Life Insurance Programs .
Sources of Budgetary Resources
FY 2013 FY 2012
Trust Fund Receipts 33.3% 33.0%
Balance Brought Forward from Prior Year
25.6% 24.8%
Spending Authority from Offsetting Collections
22.1% 22.7%
Appropriations 19.0% 19.5%
Trust Fund Receipts are Retirement Program contributions and withholdings from participants, and interest on investments . Spending Authority from Offsetting Collections includes contributions made by and for those participating in the Health Benefits and Life Insurance, and revenues in Revolving Fund Programs .
Obligations Incurred by Program
FY 2013 FY 2012
Retirement Benefits 64.9% 64.7%
Health Benefits 32.2% 32.2%
Life Insurance Benefits 1.7% 1.7%
Other 1.2% 1.4%
From the $232 .6 billion in budgetary resources OPM had available during FY 2013, it incurred obligations of $170 .1 billion less the $33 .0 billion transferred from the Treasury’s General Fund (see Note 1G) for benefits for participants in the Retirement, Health Benefits and Life Insurance Programs . The $46 .9 billion in the PSRHB Fund of the Health Benefits Program is precluded from obligations . Most of the excess of budgetary resources OPM had available in FY 2013 over the obligations it incurred against those resources is classified as being “unavailable” for obligation at year-end .
Analysis of OPM’s Systems, Controls, and Legal Compliance
This section provides information on OPM’s compliance with the following legislative
mandates:
• Federal Managers’ Financial Integrity Act (FMFIA) of 1982
• Federal Financial Management Improvement Act (FFMIA) of 1996
• Inspector General Act, as amended
• Federal Information Security Management Act (FISMA) of 2002
• Compliance with Other Key Legal and Regulatory Requirements

OPM Fiscal Year 2013 Agency Financial Report
Section 1 — ManageMent’S DiScuSSion anD analySiS
22
Management AssurancesFMFIA and FFMIA Assurance Statement
The Office of Personnel Management (OPM) is responsible for establishing and maintaining effective internal control and financial management systems that meet the objectives of the Federal Managers’ Financial Integrity Act (FMFIA) . OPM conducted its assessment of internal control over the effectiveness and efficiency of operations and compliance with applicable laws and regulations in accordance with Office of Management and Budget OMB Circular Number (No .) A-123, Management’s Responsibility for Internal Control . Based on the results of this evaluation, OPM can provide qualified assurance that its internal controls under FMFIA Section 2, as of September 30, 2013, were operating effectively . The qualified assurance is based on OIG continuing to report operational material weaknesses concerning the adequacy of OIG’s funding for audits of OPM’s Revolving Fund, and control issues in OPM’s Information Technology (IT) security program .
In addition, OPM has conducted its assessment of the effectiveness of internal control over financial reporting, which includes safeguarding of assets and compliance with applicable laws and regulations, in accordance with the requirements of Appendix A of OMB Circular No . A-123 . OPM can provide unqualified assurance that its internal control over financial reporting, as of June 30, 2013, was operating effectively .
The Federal Financial Management Improvement Act (FFMIA) requires agencies to implement and maintain financial management systems that are in substantial compliance with Federal financial system requirements, Federal accounting standards, and use the United States Standard General Ledger at the transaction level . Based on my review of the auditor’s report and other relevant information, I have determined that for FY 2013, OPM can provide reasonable assurance that its financial systems substantially comply with FFMIA and FMFIA Section 4 requirements .
We have therefore made every effort to ensure our internal control systems meet the requirements of FMFIA and FFMIA .
Katherine ArchuletaDirectorDecember 2013

OPM Fiscal Year 2013 Agency Financial Report
Section 1 — ManageMent’S DiScuSSion anD analySiS
23
Compliance with Federal Financial Management Improvement Act (FFMIA)
Financial Management Systems The The FFMIA requires Federal agencies to
implement and maintain financial management systems that are in substantial compliance with Federal financial system requirements, Federal accounting standards, and the United States Standard Government General Ledger (USSGL) at the transaction level . Based on a review of the auditors’ report and other relevant information, OPM has determined that for FY 2013, OPM substantially complies with all FFMIA requirements regarding financial management systems, financial accounting standards, and application of the USSGL .
As part of the prior year audit of OPM’s FY 2012 financial statements, it was reported that deficiencies continued to exist in the operation of the internal controls over Financial Management and Reporting Processes of OPM Operational Activities and Related Data .
These deficiencies were, in part, attributable to OPM’s Revolving Fund (RF) and Salaries and Expenses Accounts (S&E) business operations and reporting . OPM completed an assessment of its core financial system in FY 2012 against the FFMIA guidelines and policy . The objectives of our assessment were to ensure the financial management systems and practices achieve FFMIA compliance . The results indicated that the CFO was consistent with FFMIA guidelines and OPM’s mission to provide reliable and timely information for agency decision making .
In accordance with the FFMIA’s requirements noted above, OPM’s Consolidated Business Information System (CBIS) has resolved a few deficiencies that resulted in prior substantial noncompliance with regard to the RF and S&E accounts . While OPM has had a long-standing issue with reconciling its RF account with Treasury, corrective action initiated in FY 2011 which included revisions to the work instructions for reconciling the cash balances to the Fund Balance
with Treasury (FBWT) for the RF were made in FY 2012, has resulted in improvement of OPM’s FBWT reconciliation variances . Various upgrades and deployment of new functionality continued throughout FY 2013 and will continue into subsequent years and thereby improve the accuracy and timeliness of S&E and RF reporting in FY 2014 .
FFMIA Remediation ActivitiesOPM’s ability to achieve its mission to “Recruit
and Retain a World-Class Workforce to Serve the American People” depends heavily on the ability of its decision makers and managers to make fact-based and timely decisions using FFMIA compliant systems and processes .
Through the implementation of the Phase 1 release of CBIS, the project continues to remain within acceptable reporting thresholds for OMB’s requirements for cost and schedule performance . OPM CBIS users, under the guidance of the CBIS Project team, have addressed many of the key issues that emerged during the initial deployment . The CBIS project continues to reside on OMB’s list of investments requiring attention since December 2010 . Phase 2 of the CBIS Project is still on an indefinite hold as directed by the CBIS Executive Steering Committee (ESC), comprising OPM senior executives and OMB . Recent efforts have included a subsequent upgrade of the Oracle E-Business Suite and CompuSearch PRISM that occurred in June 2012 . In May 2013, the project began the deployment of new CBIS modules to meet Human Resource Solutions’ (HRS) assisted acquisition business requirements utilizing the Oracle’s Project Management solution . As a top priority, the CBIS Project (under the guidance of the CFO) is addressing a key agency goal by developing an agency-wide Cost Accounting Methodology (CAM) to be implemented by the beginning of FY 2014 . Retirement Services (RS), the Federal Investigative Services (FIS), and HRS will pilot the agency CAM .
While the agency has seen some major improvements, OPM believes it can benefit from additional enhancements . The CBIS program recently completed its support of the agency’s fiscal

OPM Fiscal Year 2013 Agency Financial Report
Section 1 — ManageMent’S DiScuSSion anD analySiS
24
year annual close activities with even greater success than last fiscal year . With demonstrated executive leadership support to ensuring 100 percent success, we continue to pave our way to recognizing business process optimization of the CBIS solution for OPM . OPM’s assessment and analysis confirms that while 90 percent of the CBIS requirements have been met, there is still a variance of 10 percent, as currently configured and implemented . While we have made significant progress in addressing the remaining challenges with CBIS functionality, a few issues remain . Specifically, OPM is looking to optimize functions, process, and service delivery across the following components which include: integration, reporting, transaction processing, and continuous training .
Financial Management Systems and Use of Shared Services
OPM senior management supports CBIS as a top priority for the Agency . The agency has seen major improvements, OPM believes it can benefit from additional improvements to its financial management systems and processes is the use of Shared Services or a combination of “blended approach” to shared services as directed in OMB’s 25-Point Implementation Plan . The CBIS Project will continue to address remaining challenges as long as funding is available . In addition, guidance from OMB and the Department of Treasury Government-wide Accounting (GWA) initiatives allows the CFO to explore alternatives to the current Systems Integrator (SI) that includes the adoption of OMB Memorandum 13-08 to utilize Federal Shared Service Centers (FSSC) for IT Hosting, Development, and Software support . Use of an FSSC would enable OPM to migrate its Financial and Procurement Systems Operations and Maintenance to leverage shared solutions that result in routine and consistent maintenance cycles, and reduced overall support costs . The cost of services is estimated to increase by an estimated 20 percent across the remaining lifecycle of the Project (now thru September 2018) . The reason for the increased cost is based on new initiatives and activities planned under the revised CBIS Vision and Roadmap (dated September 2011) . The vision
requires that CBIS project optimizes the modernized business processes, system controls, effective operational and regulatory reporting, and provides highly improved service delivery that is over the long term cost effective .
Recent Results with Blended Shared Services
In January 2013, OPM completed the interagency agreement activities that transitioned OPM’s Accounts Payable transaction functions and processing to the Department of Transportation’s (DOT) Federal Aviation Administration’s (FAA) Enterprise Services Center (ESC) supporting OMB’s 25 Point Implementation Plan and OMB Memorandum 13-08 requiring Federal agencies to invest in the varied use of Shared Service functions . Resulting efficiency improved by over 25 percent with a Federal Prompt Pay (PPA) rate of 98 .6 percent for FY 2013 making OPM compliant with PPA for the first time in four years . In November 2013, OPM transitioned its Accounts Receivable transaction processing to the FAA ESC, completing another milestone in achieving success in use of Shared Service models .
Compliance with the Federal Managers’ Financial Integrity Act (FMFIA)
FMFIA requires that agencies conduct evaluations of their systems of internal control and provide reasonable assurance annually to the President and the Congress on the adequacy of those systems . Internal control is an integral component of an organization’s management that provides reasonable assurance of effective and efficient operations, reliable financial reporting, and compliance with laws and regulations .
OPM evaluated its systems of internal control to ensure compliance with OMB Circular No . A-123, Management’s Responsibility for Internal Control . OPM conducted an assessment of its internal control over Agency operations and compliance with applicable laws and regulations . As part of the assessment, the CFO required office heads to submit an assurance statement detailing if their internal control systems

OPM Fiscal Year 2013 Agency Financial Report
Section 1 — ManageMent’S DiScuSSion anD analySiS
25
met the requirements of the FMFIA . Office heads also submitted supporting documentation of internal control objectives and control activities in individual units under their purview and how they ensured that those controls were working effectively .
The Office of the Chief Financial Officer’s (OCFO) Policy and Internal Control (PIC) organization reviewed those submissions and also reviewed applicable audit reports to determine if they contained material weaknesses that needed to be reported . Based on the results of these assessments, OPM can provide qualified assurance that its internal control over the effectiveness and efficiency of operations and compliance with laws and regulations as of September 30, 2013, was operating effectively . This qualification is based on an ongoing issue reported by the OIG regarding the adequacy of its resources for audits of the OPM Revolving Fund . Additionally, OIG continues to report an operational material weakness for OPM’s IT security governance program although OPM has made significant progress in resolving it .
Material Weakness on OPM’s Information Security GovernanceIn its FY 2013 overall Federal Information Security Management Act (FISMA) report, the OPM OIG will cite weaknesses related to the IT security environment as a FMFIA material weakness . OPM has taken several actions to address this material weakness in FY 2013 and prior years . The major factor contributing to the material weakness remains the centralization of OPM’s IT security structure as recommended by OIG . In FY 2012 the OPM Director provided the Office of the Chief Information Officer (OCIO) the resources to initiate this new structure; however hiring has been stagnant for FY 2013 due to lack of funding . OCIO expects to increase its IT security staff and mitigate this weakness when funding becomes available . OCFO understands this position and is confident that the new structure will be fully implemented . OCFO and OCIO are hopeful that this material weakness will be reduced in FY 2014 and they look forward to working with OIG to make continued improvements in the IT security program .
Material Weakness on the OIG Funding for Oversight of OPM’s Revolving Fund
For the past three years, OIG has reported a material weakness related to a lack of sufficient resources to adequately conduct that part of its core mission involving oversight of OPM’s Revolving Fund (RF) . Although a bill was recently introduced in the Senate that would provide the OIG with access to the RF for funding of its oversight; the OIG believes it still lacks the necessary resources to provide adequate oversight until this bill is signed into law . OPM management believes this reported weakness has no impact on the Revolving Fund and its own annual assessment of internal controls has uncovered no material weaknesses in the program .
Internal Control over Financial Reporting
In addition to its overall FMFIA assessment, OPM conducted an assessment of the effectiveness of internal control over financial reporting (ICFR) to ensure compliance with OMB Circular No . A-123, Appendix A . Appendix A requires Federal agencies to provide additional assurance of financial controls through testing and evaluation of entity, process and transaction-level controls under the oversight of a senior assessment team .
As in prior years’ assessments, FY 2013 Appendix A planning, testing, evaluation, and reporting for internal control over financial reporting were done under the direction of OPM’s Senior Assessment Board (Board) . The Board is co-chaired by the CFO and the Associate Director, Merit System Accountability and Compliance . The Board includes senior representatives from all major OPM organizations . Testing and evaluation activities were conducted, under the Board’s oversight, by OCFO/PIC . The Board approved unqualified assurance for internal control over financial reporting as of June 30, 2013 . This assessment was based on the results of PIC’s testing and evaluation of financial reporting controls .

OPM Fiscal Year 2013 Agency Financial Report
Section 1 — ManageMent’S DiScuSSion anD analySiS
26
Credit Card ControlsOPM is aware of the requirements to certify that appropriate internal controls exist for the use of travel and
purchase cards . These requirements were specified in Public Law 112-194, the Charge Card Abuse Prevention Act of 2012 (Charge Card Act), signed into law by the President on October 5, 2012 . The Office of Management and Budget (OMB) provided further clarification on implementation of the Charge Card Act in its Memorandum 13-21, issued on September 6, 2013 . Many of the key controls have been contained in OMB Circular No . A-123, Appendix B which was issued on January 15, 2009 .
OPM is currently documenting its assessment of credit card controls, and as required by OMB and the General Services Administration (GSA), we will maintain evidence of the assessment in our files and make it available as necessary to reviewing parties including the OIG . Also, as specified by OMB and GSA, OPM will report a summary of its assessment in the OPM Charge Card Management Plan due to OMB on January 31, 2014 .
Compliance with the Inspector General ActThe Inspector General Act, as amended, requires agencies to report on the final action taken with regard
to audits by its OIG . OPM is reporting on audit follow-up activities for the period October 1, 2012, through September 30, 2013 . Table 9 — Inspector General Audit Findings provides a summary of OIG’s audit findings and actions taken in response by OPM management during this period .
Table 9 — Inspector General Audit Findings
FY 2013 Number of Reports Questioned Costs ($ in Millions)
Reports with no management decision on October 1, 2012 2 $ 0.6
New reports requiring management decisions 231 28.0
Management decisions made during the year 23 30.0
Costs disallowed - 30.0
Costs not disallowed - 0.02
Reports with no management decision on September 30, 2013 2 -1.5
FY 2012 Number of Reports Questioned Costs ($ in Millions)
Reports with no management decision on October 1, 2011 5 $ 9.7
New reports requiring management decisions 271 38.9
Management decisions made during the year 30 48.1
Costs disallowed - 38.4
Costs not disallowed - 9.62
Reports with no management decision on September 30, 2012 2 $ 0.6
1 The number of new reports requiring a management decision represents reports with monetary recommendations. The total number of new reports issued during the fiscal year is 65, of which 42 included only procedural recommendations, or were without any recommendations.
2 Represents the net of allowed cost, which includes overpayments and underpayments to insurance carriers.
Source: Audit Reports and Receivables Tracking System reports: Audit Reports Issued with Questioned Costs for reporting periods October 1, 2012 through September 30, 2013.

OPM Fiscal Year 2013 Agency Financial Report
Section 1 — ManageMent’S DiScuSSion anD analySiS
27
Federal Information Security Management Act (FISMA)
FISMA requires the Chief Information Officer (CIO) to conduct an annual Agency security program review in coordination with Agency program officials . OPM is pleased to provide the detailed results of this review conducted for FY 2013 .
OPM has taken several actions to address the IT security environment material weakness in FY 2013 and prior years . The major factor contributing to the material weakness remains the centralization of OPM’s IT security structure as recommended by OIG .
In FY 2012 the OPM Director provided the Office of the Chief Information Officer (OCIO) the resources to initiate this new structure; however hiring has been stagnant for FY 2013 due to lack of funding . OCIO expects to increase its IT security staff and mitigate this weakness when funding becomes available .
In addition, Security Assessment and Authorization packages completed in FY 2013 were an improvement over Authorizations completed in prior years, and the packages present a more uniform approach to IT security . The OCIO has implemented risk management procedures at a system-specific level, an agency-wide information system configuration management policy and has established configuration baselines for all operating platforms, with the exception of Oracle and SQL databases . Vulnerability scans are routinely conducted of production servers, and a process has been implemented to apply operating system patches on all devices within OPM’s network on a weekly basis .
The OCIO has developed thorough incident response capabilities, and the use of two-factor authentication for remote access is required . OCIO has the ability to detect unauthorized devices connected to the OPM network, and taken steps toward implementing a continuous monitoring program at OPM . IT security controls were adequately tested for 34 of 47 information systems and contingency plans were adequately tested for 40 of 47 information systems . OPM maintains a security capital planning and investment program for information security and is continuing its efforts to reduce the unnecessary use of Social Security Numbers .
Compliance with Other Key Legal and Regulatory Requirements
OPM is required to comply with other legal and regulatory financial requirements, such as the Debt Collection Improvement Act (DCIA) . Information concerning this regulatory requirement can be found in the Other Information, Section 3, of this report .
The Middle Class Tax Relief and Job Creation Job Act of 2013, P .L . 112-96, Section 5001 - Federal Employees Retirement, increased by 2 .3 percent the employee pension contribution for Federal employees entering service after December 31, 2012, who have less than 5 years of creditable civilian service . OPM has implemented this requirement .
Phased retirement under CSRS and FERS has been made possible by P .L . 112-141, the Moving Ahead for Progress in the 21st Century Act (MAP-21), otherwise known as the Transportation Funding bill . In June 2013, OPM published draft regulations, and the Office of the Actuary indicated there would be no impact on 2013 valuation results for financial statement purposes .
Impact of Sequestration: As a result of budget sequestration, which are automatic spending cuts in particular categories of Federal outlays, in 2013, OPM had reduced appropriations as reported in the Statement of Budgetary Resources . In addition, in late April 2013, OPM’s Retirement Services eliminated all overtime for retirement application processing for the remainder of FY 2013, due to funding reductions required by the Joint Committee sequester . However, due to proactive cost-cutting measures taken in other areas, OPM has not had to initiate furloughs of its agency’s employees during 2013 . Furthermore, payments of Federal annuities and benefits have not been impacted by the budget sequestration .
Consistent with Section 3 of the OMB Memorandum-12-12, Promoting Efficient Spending to Support Agency Operations and OMB Management Procedures Memorandum 2013-02, the “Freeze the Footprint” policy implementing guidance, all CFO Act departments and agencies shall not increase the total square footage of their domestic office and warehouse inventory compared to the FY 2012 baseline .

OPM Fiscal Year 2013 Agency Financial Report
Section 1 — ManageMent’S DiScuSSion anD analySiS
28
Beginning in FY 2014, agencies will be required to report cost and square footage information in their PAR or AFR . Pursuant to the requirements in the “Freeze the Footprint” policy implementing guidance, the total square footage will be compared to each agency’s FY 2012 baseline .
On September 20, 2013, OMB released Memorandum 13-23, an Appendix D to Circular No . A-123, Compliance with the Federal Financial Management Improvement Act of l996 . OPM CFO will adhere to the updated requirements in an outcome-based manner .
Goals and Strategies OPM is firmly committed to improving financial
performance and has received an unqualified audit opinion for fourteen consecutive years for OPM’s financial statements . OPM has developed a plan to implement cost-accounting standards across the Agency; routinely provides status of funds and other financial reports to financial and program managers; has integrated financial and performance information; and uses such information to formulate its annual budget requests, as well as for day-to-day management analysis . OPM has instilled management discipline to help ensure accurate, timely, and effective budget formulation and execution .
OPM established and has followed the strategy below to achieve the goals for improved financial-management performance:
• Ensurethatcriticalfinancialperformanceindicators are objective, understandable, meaningful, fair, and fully measurable
• Improveinternalcontrolsoverfinancialreporting through improved systems and processes
• Re-affirmprocesses,controls,andproceduresto ensure that continuing Independent Public Accountant (IPA) unqualified audit opinions will be earned on the annual financial statements
• Continuetoimplementanewintegratedfinancial management system fully compliant with Federal standards providing sound, effective support to all customers
• Strengthenstewardship,accountability,andinternal controls over financial reporting, as stipulated by revised OMB Circular No . A-123
• Reduceimproperpaymentstotargetlevels
Limitations of the Consolidated Financial Statements• The principal financial statements have been
prepared to report OPM’s financial position and results of operations, pursuant to the requirements of 31 United States Code 3515(b) .
• The statements have been prepared from OPM’s books and records in accordance with U .S . generally accepted accounting principles for Federal entities and the formats prescribed by the OMB . They are in addition to the financial reports used to monitor and control OPM’s budgetary resources, which are prepared from the same books and records .
• The statements should be read with the realization that they are for a component of the United States Government, a sovereign entity .

OPM Fiscal Year 2013 Agency Financial Report29
Se c t i o n 2 – fy 2013 fi n a n c i a l in f o r M at i o n
A Message from the Chief Financial Officer
This is the sixth year the United States (U .S .) Office of Personnel Management (OPM) has chosen to produce an Agency Financial Report (AFR), which provides details on relevant financial data within 45 days of the fiscal year end in accordance with Office of Management and Budget (OMB) guidelines . Under a separate cover, OPM will submit the Annual Performance Report in conjunction with its Congressional Budget Justification for submission of the President’s Fiscal Year (FY) 2015 Budget to Congress, and a Summary of Performance and Financial Information which provides a concise briefing of the past year’s outcomes . This approach offers more transparent conveyance to the public with improved quality and utility for management and stakeholders .
For the fourteenth consecutive year, OPM has earned an unqualified audit opinion on its consolidated financial statements from our independent public accountants, KPMG LLP . This opinion assures the financial statements are reported fairly in accordance with U .S . Generally Accepted Accounting Principles (GAAP) and free of material misstatements .
OPM also issued an unqualified assurance statement on internal control over financial reporting in accordance with the requirements of the revised OMB Circular No . A-123, Management’s Responsibility for Internal Control . OPM’s Office of Chief Information Officer (OCIO) has made progress on resolving the information systems general control environment issues noted in prior year audits . Office of the Chief Financial Officer (OCFO) also made significant progress in reconciling its Fund Balance With Treasury for its Revolving Fund (RF) and Salaries and Expenses Fund (S&E), as evidenced by the closing of this finding and recommendation .
Our reviews under the Improper Payments Information Act, as modified by the Improper Payments Elimination and Recovery Act of 2010, and the Improper Payments and Elimination Recovery Improvement Act of 2012, have in the past included payments made under four major programs: Retirement, Health Benefits, Life Insurance, and Background Investigations . OPM’s annual improper payment rates for these programs are less than 1 percent and small when compared to major programs at other Federal agencies . OPM also exceeds OMB’s target recovery rate of 85 percent for these programs . As recognition of OPM’ s success, OPM recommended to and OMB approved the deletion of the Life Insurance and Background Investigations programs from OPM’s Improper Payments reviews . OPM will continue to strive to reduce improper payments even further for the two other major programs, and to recover a greater percentage of improper payments made .

OPM Fiscal Year 2013 Agency Financial Report
Section 2 — FY 2013 Financial inFormation
30
As OPM’s (RF) Programs business continues to playa major part of OPM’ s mission, our accountability over these key resources continues to be our focus . The full budget function including 5-year business plans for each of our lines of business provides for strategic planning and analysis . With the implementation of and improvements to OPMs Consolidated Business Information System (CBIS), OPM has expanded the audit activities over the RF Programs and has integrated these fundamental programs into the budgeting, accounting and accountability functions applied to all OPM activities . Users of the products and services are continuing to gain a more in-depth understanding into the overall accounting for each line of business and the fees charged for those services .
As part of gaining a better understanding into the fees charged by OPM’s programs, cost accounting is being implemented and will add to the analysis performed . Furthermore, the Projects module, an enhancement to the CBIS financial management system, will provide for detailed oversight and review of each delivery order provided for customers . OPM also is improving its financial management by continuing to work with our stakeholders and vendors to modernize the current financial processes and systems . Considerable progress was made in FY 2013 to further enhance capabilities within (CBIS) .
We carry out our responsibilities over the $987 billion in assets in the Federal employees earned benefit trust and other funds with pride . On behalf of Federal employees, retirees, their families, and survivors, we are honored to safeguard these assets against waste, fraud and abuse . It is with great pleasure that I, on behalf of our staff, provide you with the FY 2013 Agency Financial Report documenting OPM’s careful stewardship over Federal employees’ retirement, health, life insurance, and other funds as supported by an unqualified audit opinion .
Sincerely,
Dennis ColemanChief Financial OfficerDecember 16, 2013

OPM Fiscal Year 2013 Agency Financial Report
Section 2 — FY 2013 Financial inFormation
31
OPM Fiscal Year 2013 Agency Financial Report
Section 2 — FY 2013 Financial inFormation
32

OPM Fiscal Year 2013 Agency Financial Report
Section 2 — FY 2013 Financial inFormation
33

OPM Fiscal Year 2013 Agency Financial Report
Section 2 — FY 2013 Financial inFormation
34

OPM Fiscal Year 2013 Agency Financial Report
Section 2 — FY 2013 Financial inFormation
35

OPM Fiscal Year 2013 Agency Financial Report
Section 2 — FY 2013 Financial inFormation
36
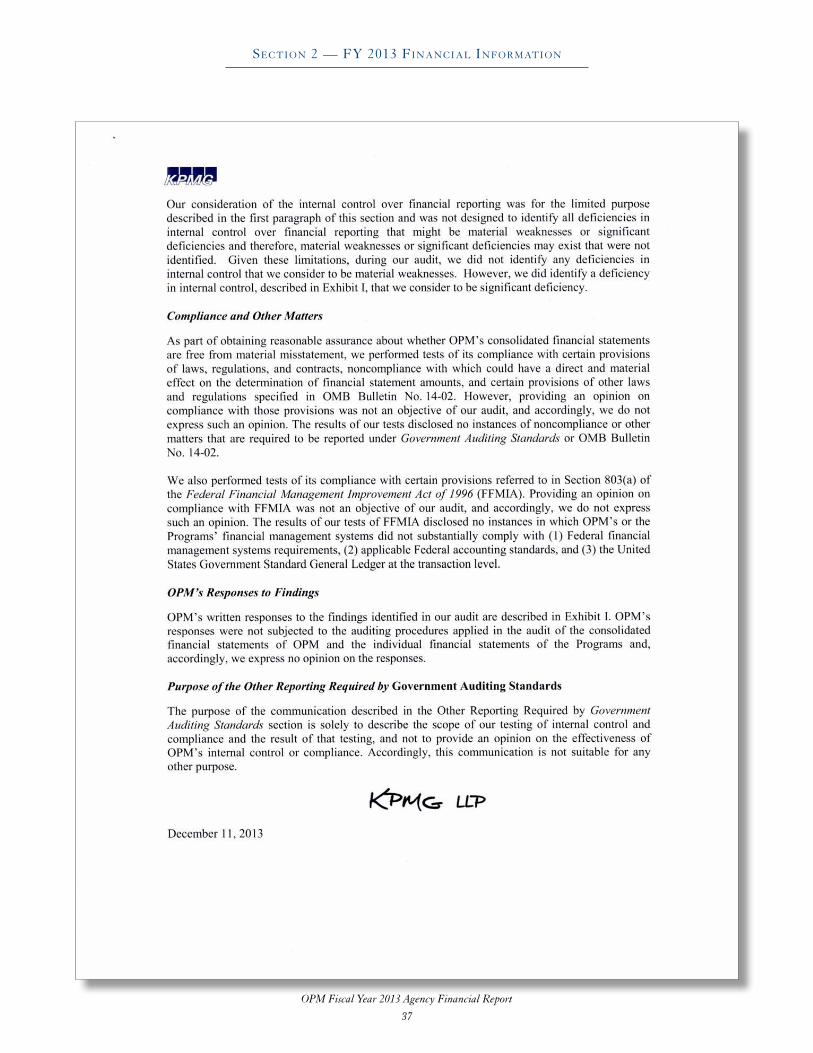
OPM Fiscal Year 2013 Agency Financial Report
Section 2 — FY 2013 Financial inFormation
37

OPM Fiscal Year 2013 Agency Financial Report
Section 2 — FY 2013 Financial inFormation
38

OPM Fiscal Year 2013 Agency Financial Report
Section 2 — FY 2013 Financial inFormation
39
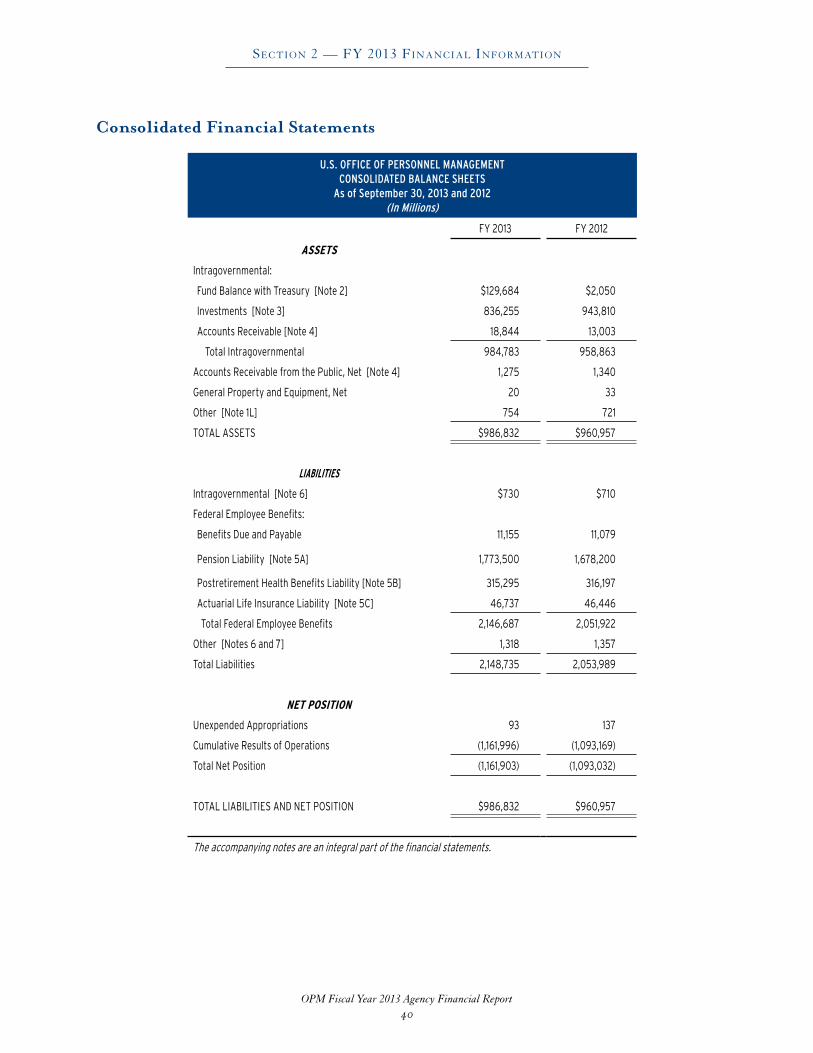
OPM Fiscal Year 2013 Agency Financial Report
Section 2 — FY 2013 Financial inFormation
40
Consolidated Financial Statements
U.S. OFFICE OF PERSONNEL MANAGEMENT CONSOLIDATED BALANCE SHEETS
As of September 30, 2013 and 2012(In Millions)
FY 2013 FY 2012
ASSETS
Intragovernmental:
Fund Balance with Treasury [Note 2] $129,684 $2,050
Investments [Note 3] 836,255 943,810
Accounts Receivable [Note 4] 18,844 13,003
Total Intragovernmental 984,783 958,863
Accounts Receivable from the Public, Net [Note 4] 1,275 1,340
General Property and Equipment, Net 20 33
Other [Note 1L] 754 721
TOTAL ASSETS $986,832 $960,957
LIABILITIES
Intragovernmental [Note 6] $730 $710
Federal Employee Benefits:
Benefits Due and Payable 11,155 11,079
Pension Liability [Note 5A] 1,773,500 1,678,200
Postretirement Health Benefits Liability [Note 5B] 315,295 316,197
Actuarial Life Insurance Liability [Note 5C] 46,737 46,446
Total Federal Employee Benefits 2,146,687 2,051,922
Other [Notes 6 and 7] 1,318 1,357
Total Liabilities 2,148,735 2,053,989
NET POSITION
Unexpended Appropriations 93 137
Cumulative Results of Operations (1,161,996) (1,093,169)
Total Net Position (1,161,903) (1,093,032)
TOTAL LIABILITIES AND NET POSITION $986,832 $960,957
The accompanying notes are an integral part of the financial statements.

OPM Fiscal Year 2013 Agency Financial Report
Section 2 — FY 2013 Financial inFormation
41
U.S. OFFICE OF PERSONNEL MANAGEMENT CONSOLIDATED STATEMENTS OF NET COST
For the Years Ended September 30, 2013 and 2012(In Millions)
FY 2013 FY 2012
ProvideCSRS Benefits
Gross Costs $45,914 $70,405Less: Earned Revenue 16,903 20,325
Net Cost 29,011 50,080(Gain)/Loss on Pension, ORB, or OPEB
Assumption Changes [Note 5A] 39,707 82,866
Net Cost of Operations [Notes 8 and 9] $68,718 $132,946
Provide FERS Benefits
Gross Costs $44,437 $43,199Less: Earned Revenue 42,672 41,439
Net Cost 1,765 1,760(Gain)/Loss on Pension, ORB, or OPEB
Assumption Changes [Note 5A] 42,309 23,201
Net Cost of Operations [Notes 8 and 9] $44,074 $24,961
ProvideHealth Benefits
Gross Costs $42,102 $37,735Less: Earned Revenue 41,999 46,932Net Cost 103 (9,197)(Gain)/Loss on Pension, ORB, or OPEB
Assumption Changes [Note 5B] 722 (7,880)
Net Cost of Operations [Notes 8 and 9] $825 ($17,077)
ProvideLife Insurance
Benefits
Gross Costs $3,968 $4,636Less: Earned Revenue 3,999 4,343Net Cost (31) 293(Gain)/Loss on Pension, ORB, or OPEBAssumption Changes [Note 5C] (858) 745
Net Cost of Operations [Notes 8 and 9] ($889) $1,038
Gross Costs $1,871 $2,012Provide
Human Resource Services
Less: Earned Revenue 1,607 1,896
Net Cost of Operations [Notes 8 and 9] $264 $116
TotalNet Cost
of Operations
Gross Costs $138,292 $157,987Less: Earned Revenue 107,180 114,935
Net Cost 31,112 43,052
(Gain)/Loss on Pension, ORB, or OPEBAssumption Changes [Notes 5A, 5B, and 5C] 81,880 98,932
Net Cost of Operations [Notes 8 and 9] $112,992 $141,984
The accompanying notes are an integral part of the financial statements.
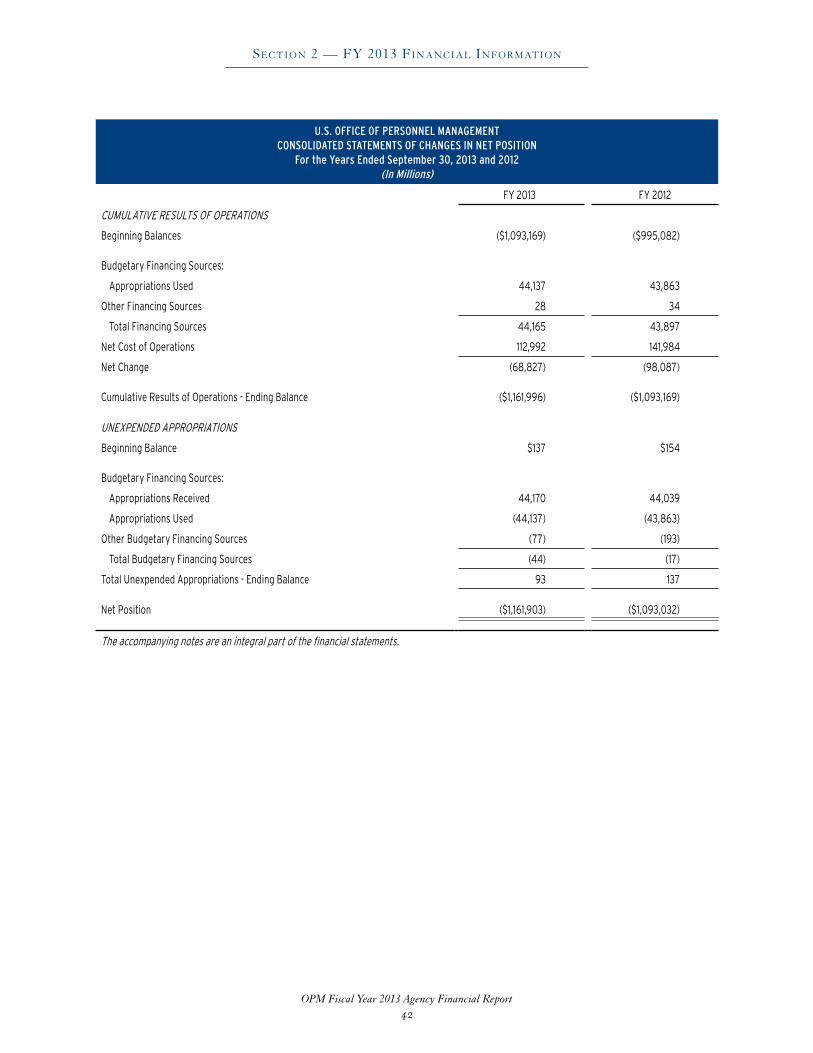
OPM Fiscal Year 2013 Agency Financial Report
Section 2 — FY 2013 Financial inFormation
42
U.S. OFFICE OF PERSONNEL MANAGEMENT CONSOLIDATED STATEMENTS OF CHANGES IN NET POSITION
For the Years Ended September 30, 2013 and 2012(In Millions)
FY 2013 FY 2012
CUMULATIVE RESULTS OF OPERATIONS
Beginning Balances ($1,093,169) ($995,082)
Budgetary Financing Sources:
Appropriations Used 44,137 43,863
Other Financing Sources 28 34
Total Financing Sources 44,165 43,897
Net Cost of Operations 112,992 141,984
Net Change (68,827) (98,087)
Cumulative Results of Operations - Ending Balance ($1,161,996) ($1,093,169)
UNEXPENDED APPROPRIATIONS
Beginning Balance $137 $154
Budgetary Financing Sources:
Appropriations Received 44,170 44,039
Appropriations Used (44,137) (43,863)
Other Budgetary Financing Sources (77) (193)
Total Budgetary Financing Sources (44) (17)
Total Unexpended Appropriations - Ending Balance 93 137
Net Position ($1,161,903) ($1,093,032)
The accompanying notes are an integral part of the financial statements.
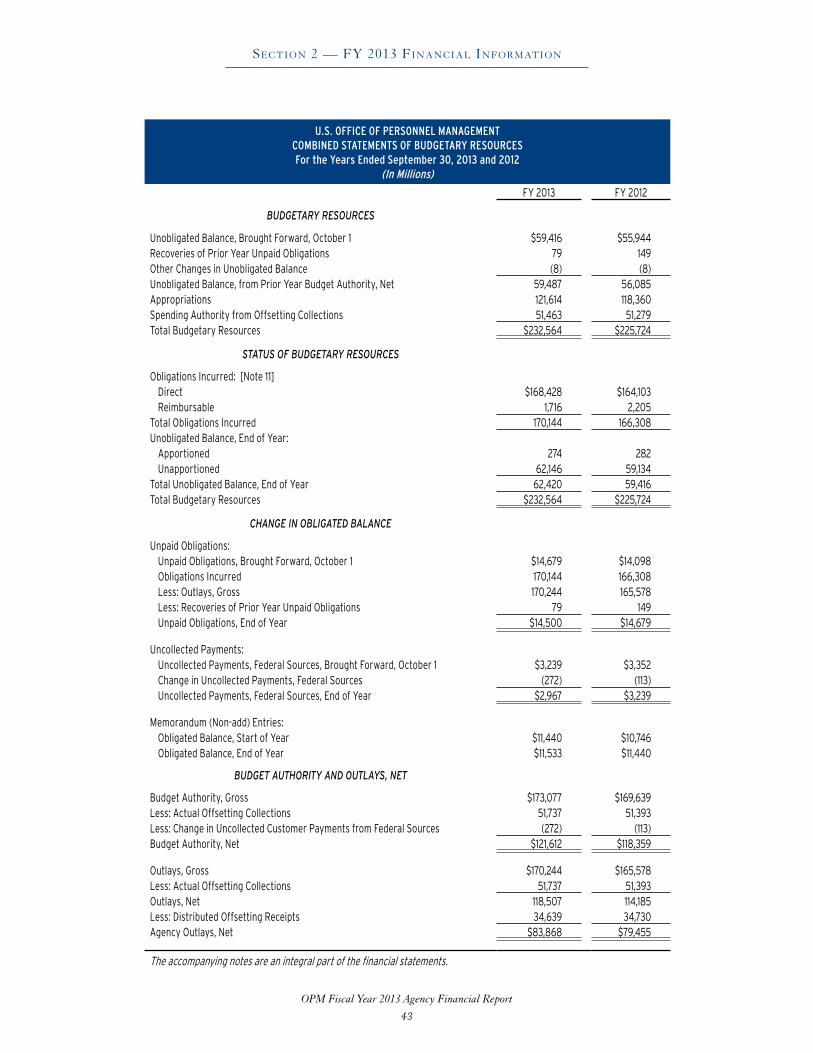
OPM Fiscal Year 2013 Agency Financial Report
Section 2 — FY 2013 Financial inFormation
43
U.S. OFFICE OF PERSONNEL MANAGEMENT COMBINED STATEMENTS OF BUDGETARY RESOURCESFor the Years Ended September 30, 2013 and 2012
(In Millions)
FY 2013 FY 2012
BUDGETARY RESOURCES
Unobligated Balance, Brought Forward, October 1 $59,416 $55,944 Recoveries of Prior Year Unpaid Obligations 79 149 Other Changes in Unobligated Balance (8) (8)Unobligated Balance, from Prior Year Budget Authority, Net 59,487 56,085 Appropriations 121,614 118,360 Spending Authority from Offsetting Collections 51,463 51,279 Total Budgetary Resources $232,564 $225,724
STATUS OF BUDGETARY RESOURCES
Obligations Incurred: [Note 11]Direct $168,428 $164,103 Reimbursable 1,716 2,205
Total Obligations Incurred 170,144 166,308 Unobligated Balance, End of Year:
Apportioned 274 282 Unapportioned 62,146 59,134
Total Unobligated Balance, End of Year 62,420 59,416 Total Budgetary Resources $232,564 $225,724
CHANGE IN OBLIGATED BALANCE
Unpaid Obligations:Unpaid Obligations, Brought Forward, October 1 $14,679 $14,098 Obligations Incurred 170,144 166,308 Less: Outlays, Gross 170,244 165,578 Less: Recoveries of Prior Year Unpaid Obligations 79 149 Unpaid Obligations, End of Year $14,500 $14,679
Uncollected Payments:Uncollected Payments, Federal Sources, Brought Forward, October 1 $3,239 $3,352 Change in Uncollected Payments, Federal Sources (272) (113)Uncollected Payments, Federal Sources, End of Year $2,967 $3,239
Memorandum (Non-add) Entries:Obligated Balance, Start of Year $11,440 $10,746 Obligated Balance, End of Year $11,533 $11,440
BUDGET AUTHORITY AND OUTLAYS, NET
Budget Authority, Gross $173,077 $169,639 Less: Actual Offsetting Collections 51,737 51,393 Less: Change in Uncollected Customer Payments from Federal Sources (272) (113)Budget Authority, Net $121,612 $118,359
Outlays, Gross $170,244 $165,578 Less: Actual Offsetting Collections 51,737 51,393 Outlays, Net 118,507 114,185 Less: Distributed Offsetting Receipts 34,639 34,730 Agency Outlays, Net $83,868 $79,455
The accompanying notes are an integral part of the financial statements.

OPM Fiscal Year 2013 Agency Financial Report
Section 2 — FY 2013 Financial inFormation
44
U.S. OFFICE OF PERSONNEL MANAGEMENTNOTES TO FINANCIAL STATEMENTSSeptember 30, 2013 and 2012[$ in millions]
Note 1 Summary of Significant Accounting Policies
A. Reporting Entity
The United States (U .S .) Office of Personnel Management (OPM) is the Federal Government’s human resources agency . It was created as an independent agency of the Executive Branch of Government on January 1, 1979 . Many of the functions of the former Civil Service Commission were transferred to OPM at that time .
The accompanying financial statements present OPM’s financial position, net cost of operations, change in net position, and status of budgetary resources, as required by the Chief Financial Officers Act of 1990 (CFO Act) and the Government Management Reform Act of 1994 (GMRA) . The financial statements include all accounts — appropriation, trust, trust revolving, special, and revolving funds — under OPM’s control . The financial statements do not include the effect of any centrally administered assets and liabilities related to the Federal Government as a whole, which may, in part, be attributable to OPM .
The financial statements are comprised of the following major programs administered by OPM . The funds related to the operation of the Retirement Program, the Health Benefits Program, and the Life Insurance Program . The statutory authority for OPM’s Federal employees’ benefit programs can be found in Title 5, United States Code; Chapters 83 and 84 provide a complete description of the Civil Service Retirement and Disability Fund’s provisions; Chapter 89 provides a complete description of the Employees Health Benefits Fund and the Retired Employees Health Benefits Fund provisions; and Chapter 87 provides a complete description of the Employees Group Life Insurance Fund provisions . In addition, Sections 802 and 803 of Public Law (P .L .) 109- 435, the Postal Act, amended certain provisions of Chapters 83 and 89 of Title 5 dealing with the Retirement Program and the Health Benefits Program, respectively .
Retirement Program. The Program consists of two defined-benefit pension plans: the Civil Service Retirement System (CSRS) and the Federal Employees’ Retirement System (FERS) . Together, the two plans cover substantially all full-time, permanent civilian Federal employees . The CSRS, implemented in 1921, is a stand-alone plan, providing benefits to most Federal employees hired before 1984 . The FERS uses Social Security as its base and provides an additional defined benefit and a voluntary thrift savings plan to most employees entering the Federal service after 1983 . The FERS was established in 1986 and when it became effective on January 1, 1987, CSRS Interim employees with less than 5 years of creditable civilian service on December 31, 1986, were automatically converted to FERS . Both plans are operated via the Civil Service Retirement and Disability Fund (CSRDF), a trust fund . Title 5, United States Code, Chapters 83 and 84, provide a complete description of the CSRDF’s provisions . OPM does not administer the voluntary Thrift Savings Plan .
Health Benefits Program. The Program provides hospitalization and major medical protection to Federal employees, retirees, former employees, family members, and former spouses . The Program, implemented in 1960, is operated through two trust revolving funds: the Employees Health Benefits Fund and the Retired Employees Health Benefits Fund . Title 5, United States Code, Chapter 89 provides a complete description of the funds’ provisions .

OPM Fiscal Year 2013 Agency Financial Report
Section 2 — FY 2013 Financial inFormation
45
To provide benefits, OPM contracts with two types of health benefits carriers: fee-for-service, whose participants or their health-care providers are reimbursed for the cost of services, and health maintenance organizations (HMO), which provide or arrange for services on a pre-paid basis through designated providers . Most of the contracts with carriers that provide fee-for-service benefits are experience-rated, with the amount contributed by and for participants affected by, among other things, the number and size of claims . Most HMO contracts are community-rated, so that the amount paid by and for participants is essentially the same as that paid by and for participants in similarly-sized subscriber groups .
On December 20, 2006, President Bush signed into law the Postal Accountability and Enhancement Act (the Postal Act), P .L . 109-435 . Title VIII of the Postal Act made significant changes in the laws dealing with CSRS benefits and the funding of retiree health benefits for employees of the U .S . Postal Service (USPS) . The Postal Act required the USPS to make scheduled payments to the Postal Service Retiree Health Benefits (PSRHB) Fund . The PSRHB Fund is included in the Health Benefits Program .
Life Insurance Program. The Program provides group, term-life insurance coverage to Federal employees and retirees . The Program was implemented in 1954 and significantly modified in 1980 . It is operated through the Federal Employees Group Life Insurance Fund, a trust revolving fund, and is administered, virtually in its entirety, by the Metropolitan Life Insurance Company under contract with OPM . Title 5, United States Code, Chapter 87 provides a complete description of the fund’s provisions . The Program provides Basic life insurance (which includes accidental death and dismemberment coverage) and three packages of optional coverage .
Revolving Fund Programs. OPM provides a variety of human resources-related services to other Federal agencies, such as pre-employment testing, security investigations, and employee training . These activities are financed through an intragovernmental revolving fund .
Salaries and Expenses. Salaries and Expenses (S&E) provides the budgetary resources used by OPM for administrative purposes in support of the Agency’s mission and programs . These resources are furnished by annual, multiple-year, and no-year appropriations . Annual appropriations are made for a specified fiscal year and are available for new obligations only during that fiscal year . Multiple-year appropriations are available for a definite period in excess of one fiscal year . No-year appropriations are available for obligation without fiscal year limitation .
B. Basis of Accounting and Presentation
These financial statements have been prepared to report the financial position, net cost, changes in net position, and budgetary resources of OPM as required by the CFO Act and GMRA . These financial statements have been prepared from the books and records of OPM in accordance with Generally Accepted Accounting Principles (GAAP) in the United States of America and OMB Circular No . A-136, “Financial Reporting Requirements .” GAAP for Federal entities are the standards prescribed by the Federal Accounting Standards Advisory Board (FASAB), which is the official standard-setting body for the Federal Government . These financial statements present proprietary and budgetary information . OPM, pursuant to OMB directives, prepares additional financial reports that are used to monitor and control the OPM’s use of budgetary resources .
OPM has presented comparative financial statements for the Consolidated and Consolidating Balance Sheets, Consolidated and Consolidating Statements of Net Cost, Consolidated and Consolidating Statements of Changes in Net Position, and Combined and Combining Statements of Budgetary Resources .

OPM Fiscal Year 2013 Agency Financial Report
Section 2 — FY 2013 Financial inFormation
46
The financial statements should be read with the realization they are for a component of the United States Government, a sovereign entity . One implication of this is that liabilities cannot be liquidated without legislation that provides resources and legal authority to do so .
The accounting structure of Federal agencies is designed to reflect both accrual and budgetary accounting transactions . Under the accrual method of accounting, revenues are recognized when earned, and expenses are recognized when incurred, without regard to receipt or payment of cash . The budgetary accounting principles, on the other hand, are designed to recognize the obligation of funds according to legal requirements, which in many cases is prior to the occurrence of an accrual-based transaction . The recognition of budgetary accounting transactions is essential for compliance with legal constraints and controls over the use of Federal funds .
C. Use of Management’s Estimates
The preparation of financial statements in accordance with GAAP requires management to make certain estimates . These estimates affect the reported amounts of assets and liabilities at the date of the financial statements and the reported amounts of earned revenues and costs during the reporting period . Actual results could differ from those estimates .
D. Financial Statement Classifications
Entity vs. Non-entity Assets. Entity assets are those the reporting entity has the legal authority to use in its operations . Accordingly, all of OPM’s assets are entity assets .
Intragovernmental and Other Balances. Throughout these financial statements, intragovernmental assets, liabilities, revenues, and costs have been classified according to the type of entity with which the transactions are associated . OPM classifies as intragovernmental those transactions with other Federal entities . In accordance with Federal accounting standards, OPM classifies employee contributions to the Retirement, Health Benefits and Life Insurance Programs as exchange revenues “from the public .” OPM’s entire gross cost to provide Retirement, Health, and Life Insurance benefits are classified as costs “with the public” because the recipients of these benefits are Federal employees, retirees, and their survivors and families . As a consequence, on the accompanying consolidated Statements of Net Cost and in other notes to OPM’s financial statements, OPM reports there are no intragovernmental gross costs to provide retirement, health, and life insurance benefits .
Exchange vs. Non-exchange Revenue. Exchange or earned revenue is an inflow of resources to a Government entity that the entity has earned; it arises when each party to a transaction sacrifices value and receives value in return . All of OPM’s revenues are classified as exchange revenues . Federal reporting standards require that earnings on investments be classified in the same manner as the “predominant source of revenue that funds the investments;” OPM, therefore, classifies earnings on investments as earned revenue . Employing agency and participant contributions to the Retirement, Health Benefits, and Life Insurance Programs and the scheduled payment contributions to the PSRHB Fund are classified as exchange revenues, since they represent exchanges of money and services in return for current and future benefits . The consolidated Statements of Net Cost provides users with the ability to ascertain whether OPM’s exchange revenues are sufficient to cover the total cost it has incurred to provide Retirement, Health, and Life Insurance benefits .
Liabilities Covered by Budgetary Resources. OPM has no authority to liquidate a liability, unless budgetary resources have been specifically made available to do so . Where budgetary resources have not been made available, the liability is disclosed as being “not covered by budgetary resources .” Since no budgetary resources have been made available to liquidate the Pension, post-Retirement Health Benefits, and Actuarial Life Insurance Liabilities, they
OPM Fiscal Year 2013 Agency Financial Report
Section 2 — FY 2013 Financial inFormation
47
are disclosed as being “not covered by budgetary resources .” With minor exception, all other OPM liabilities are disclosed as being “covered by budgetary resources .”
Net Position. OPM’s Net Position is classified into two separate balances: the Cumulative Results of Operations comprises OPM’s net results of operations since its inception; Unexpended Appropriations is the balance of appropriated authority granted to OPM against which no outlays have been made .
Obligated vs. Unobligated Balance. OPM’s Combined and Combining Statements of Budgetary Resources present its unobligated and obligated balances as of the end of the fiscal year . The obligated balance reflects the budgetary resources against which OPM has incurred obligations . The unobligated balance is the portion of budgetary resources against which OPM has not yet incurred obligations .
Direct vs. Reimbursable Obligations. A reimbursable obligation reflects the costs incurred to perform services or provide goods that must be paid back by the recipients . OPM classifies all of its incurred obligations as direct, except those of the Revolving Fund Programs, against which only reimbursable obligations may be incurred .
E. Net Cost of Operations
To derive its net cost of operations, OPM deducts the earned revenues associated with its gross cost of providing benefits and services on the accompanying Consolidated Statements of Net Cost .
Gross Cost of Providing Benefits and Services. OPM’s gross cost of providing benefits and services is classified by responsibility segment . All Program costs (including Salaries and Expenses) are directly traced, assigned, or allocated on a reasonable and consistent basis to one of four responsibility segments . The following table associates OPM’s gross cost by Program to its responsibility segments:
Program Responsibility Segment
Retirement ProgramProvide CSRS BenefitsProvide FERS Benefits
Health Benefits Program Provide Health Benefits
Life Insurance Program Provide Life Insurance Benefits
Revolving Fund ProgramsSalaries and Expenses
Provide Human Resources Services
Earned Revenue. OPM has two major sources of earned revenues: Earnings on its investments; and the Contributions to the Retirement, Health Benefits, and Life Insurance Programs by and for participants .
F. Program Funding
Retirement Program. Service-cost represents an estimate of the amount of contributions which, if accumulated and invested over the careers of participants, will be sufficient to fully fund their future CSRS or FERS benefits . OPM’s Office of Actuaries has determined that the service-cost for most or “regular” CSRS participants is 32 .3 percent and 29 .8 percent of basic pay for FY 2013 and FY 2012, respectively . For FERS, the service cost for most or “regular” FERS participants is 14 .2 percent and 13 .7 percent of basic pay for FY 2013 and FY 2012, respectively .
CSRS . Both CSRS participants and their employing agencies, with the exception of USPS, are required by statute to make contributions to CSRS coverage . Regular CSRS participants and their employers each contributed 7 .0 percent of pay in both FY 2013 and 2012 . The combined 14 .0 percent of pay does not cover
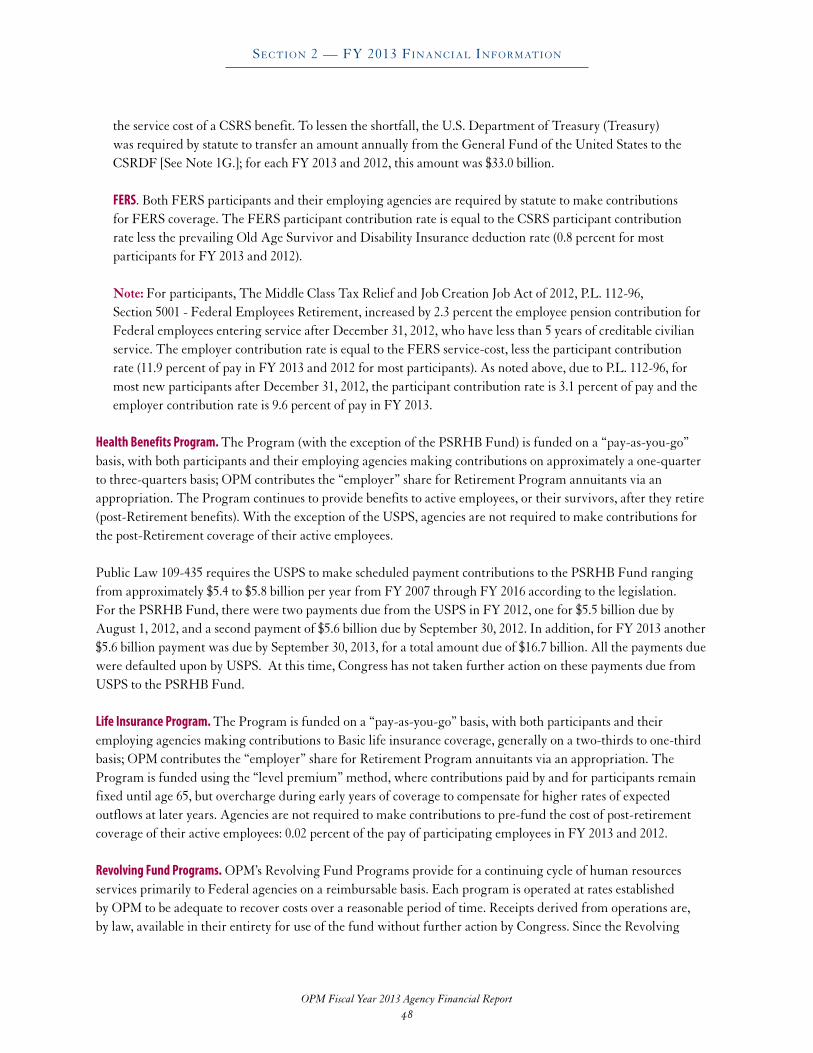
OPM Fiscal Year 2013 Agency Financial Report
Section 2 — FY 2013 Financial inFormation
48
the service cost of a CSRS benefit . To lessen the shortfall, the U .S . Department of Treasury (Treasury) was required by statute to transfer an amount annually from the General Fund of the United States to the CSRDF [See Note 1G .]; for each FY 2013 and 2012, this amount was $33 .0 billion .
FERS . Both FERS participants and their employing agencies are required by statute to make contributions for FERS coverage . The FERS participant contribution rate is equal to the CSRS participant contribution rate less the prevailing Old Age Survivor and Disability Insurance deduction rate (0 .8 percent for most participants for FY 2013 and 2012) .
Note: For participants, The Middle Class Tax Relief and Job Creation Job Act of 2012, P .L . 112-96, Section 5001 - Federal Employees Retirement, increased by 2 .3 percent the employee pension contribution for Federal employees entering service after December 31, 2012, who have less than 5 years of creditable civilian service . The employer contribution rate is equal to the FERS service-cost, less the participant contribution rate (11 .9 percent of pay in FY 2013 and 2012 for most participants) . As noted above, due to P .L . 112-96, for most new participants after December 31, 2012, the participant contribution rate is 3 .1 percent of pay and the employer contribution rate is 9 .6 percent of pay in FY 2013 .
Health Benefits Program. The Program (with the exception of the PSRHB Fund) is funded on a “pay-as-you-go” basis, with both participants and their employing agencies making contributions on approximately a one-quarter to three-quarters basis; OPM contributes the “employer” share for Retirement Program annuitants via an appropriation . The Program continues to provide benefits to active employees, or their survivors, after they retire (post-Retirement benefits) . With the exception of the USPS, agencies are not required to make contributions for the post-Retirement coverage of their active employees .
Public Law 109-435 requires the USPS to make scheduled payment contributions to the PSRHB Fund ranging from approximately $5 .4 to $5 .8 billion per year from FY 2007 through FY 2016 according to the legislation . For the PSRHB Fund, there were two payments due from the USPS in FY 2012, one for $5 .5 billion due by August 1, 2012, and a second payment of $5 .6 billion due by September 30, 2012 . In addition, for FY 2013 another $5 .6 billion payment was due by September 30, 2013, for a total amount due of $16 .7 billion . All the payments due were defaulted upon by USPS . At this time, Congress has not taken further action on these payments due from USPS to the PSRHB Fund .
Life Insurance Program. The Program is funded on a “pay-as-you-go” basis, with both participants and their employing agencies making contributions to Basic life insurance coverage, generally on a two-thirds to one-third basis; OPM contributes the “employer” share for Retirement Program annuitants via an appropriation . The Program is funded using the “level premium” method, where contributions paid by and for participants remain fixed until age 65, but overcharge during early years of coverage to compensate for higher rates of expected outflows at later years . Agencies are not required to make contributions to pre-fund the cost of post-retirement coverage of their active employees: 0 .02 percent of the pay of participating employees in FY 2013 and 2012 .
Revolving Fund Programs. OPM’s Revolving Fund Programs provide for a continuing cycle of human resources services primarily to Federal agencies on a reimbursable basis . Each program is operated at rates established by OPM to be adequate to recover costs over a reasonable period of time . Receipts derived from operations are, by law, available in their entirety for use of the fund without further action by Congress . Since the Revolving

OPM Fiscal Year 2013 Agency Financial Report
Section 2 — FY 2013 Financial inFormation
49
Fund’s Programs charge full cost, customer-agencies do not recognize imputed costs . OPM provides receiving entities of such services with full cost information through billings based on reimbursable agreements for services rendered . Examples of OPM Revolving Fund Programs include Investigative Services, USAJobs, and Human Resource Solutions .
Salaries and Expenses. The S&E account and the Office of Inspector General (OIG) S&E account finance most of OPM’s operating expenses and have three funding sources: salaries and expenses appropriation, transfers from the trust fund accounts, and advances and reimbursements . Funds to administer these programs are transferred from the trust fund accounts to the respective administrative S&E account as costs are incurred .
G. Financing Sources Other Than Earned Revenue
OPM receives inflows of assets from financing sources other than earned revenue . These financing sources are not deducted from OPM’s gross cost of providing benefits and services on the Consolidated Statements of Net Cost, but added to its net position on the Consolidated Statements of Changes in Net Position . OPM’s major financing sources other than earned revenue are:
Transfer-in from the General Fund. The U .S . Treasury is required by law to transfer an amount annually to the Retirement Program from the General Fund of the U .S . to subsidize in part the under-funding of the CSRS . The amount is presented as a transfer-in from the Treasury General Fund, obligation, and disbursement to the CSRDF on the Statement of Budgetary Resources .
Appropriations Used. By an Act of Congress, OPM receives appropriated authority allowing it to incur obligations and make expenditures to cover the operating costs of the Agency (“Salaries and Expenses”) and the Government’s share of the cost of health and life insurance benefits for Retirement Program annuitants . OPM recognizes appropriations as “used” at the time it incurs these obligations against its appropriated authority .
H. Budgetary Resources
Budgetary resources reflect OPM’s authority to incur obligations that will result in the outlay of monies . OPM receives new budgetary resources each fiscal year in the form of appropriations, trust fund receipts, and spending authority from offsetting collections . In addition, OPM normally carries-over a balance of unobligated budgetary resources from the prior fiscal year, which is generally unavailable for obligation, but may be drawn-upon should new budgetary resources be insufficient to cover obligations incurred .
Appropriations . By an act of Congress, OPM receives budgetary resources in the form of appropriations that allow it to incur obligations to pay (1) the Government’s share of the cost of health and life insurance benefits for Retirement Program annuitants and (2) in part, the administrative and operating expenses of OPM . In addition, the U .S . Treasury General Fund transfers an amount annually to the OPM CSRDF to subsidize, in part, the under-funding of the CSRDF . OPM’s appropriations are “definite,” in that the amount of the authority is stated at the time it is granted, and “annual,” in that the authority is available for obligation only during the current fiscal year . At fiscal year-end, any unobligated balances in the appropriations that fund the Government’s share of the cost of health and life insurance benefits are expired .
Trust Fund Receipts. The amounts collected by OPM and credited to the CSRDF generate budgetary resources in the form of trust fund receipts . Trust fund receipts are considered to be immediately appropriated and available to cover the valid obligations of the Retirement Program as they are incurred . At the end of each fiscal year,

OPM Fiscal Year 2013 Agency Financial Report
Section 2 — FY 2013 Financial inFormation
50
the amount by which OPM’s collections have exceeded its incurred obligations are temporarily precluded from obligation and added to OPM’s trust fund balance . The amounts collected by OPM in the PSRHB Fund are precluded from obligation until 2017 when the funds will be available to pay annual premium costs for the USPS post-1971 current annuitants [See Note 10] .
Spending Authority from Offsetting Collections. The amount collected by OPM and credited to the Health Benefits, Life Insurance, and Revolving Fund Programs generates budgetary resources in the form of “spending authority from offsetting collections” (SAOC) . During the fiscal year, the obligations incurred by OPM for these Programs may not exceed their SAOC or the amounts apportioned by OMB, whichever is less . At year-end, the balance of SAOC in excess of obligations incurred is brought forward into the subsequent fiscal year, but is generally unavailable for obligation .
I. Fund Balance with Treasury
Fund Balance with Treasury (FBWT) comprises the aggregate total of OPM’s unexpended, uninvested balances in its appropriation, trust, revolving, and trust revolving accounts . All of OPM’s collections are deposited into and its expenditures paid from one of its FBWT accounts . OPM invests FBWT balances associated with the Retirement, Health Benefits, and Life Insurance Programs that are not immediately needed to cover expenditures .
J. Investments
The Federal Government does not set aside assets to pay future benefits or other expenditures . OPM invests the excess FBWT for the funds associated with the Retirement, Health Benefits, and Life Insurance Programs in securities guaranteed by the United States as to principal and interest . Retirement and the PSRHB Fund portion of the Health Benefits Program monies are invested initially in Certificates of Indebtedness (“Certificates”), which are issued by the Treasury at par value and mature on the following September 30 . The Certificates are routinely redeemed at face value to pay for authorized Program expenditures . Each September 30, all outstanding Certificates are “rolled over” into special Government account series (GAS) securities that are issued by the Treasury at par-value, with a yield equaling the average of all marketable Public Debt securities with four or more years to maturity .
The Retirement Program also carries securities issued by the Federal Financing Bank (FFB) and a small amount of other securities .
Health Benefits and Life Insurance Programs’ monies also are invested, some in “market-based” securities that mirror the terms of marketable Treasury securities; monies that are immediately needed for expenditure are invested in “overnight” market-based securities . These market-based securities have some market value risk .
Investments are stated at original acquisition cost, net of amortized premium and discount . Premium and discount are amortized into interest income over the term of the investment, using the interest method .
Debt Exchange. The Federal Financing Bank Act of 1973 (FFB Act), P .L . 93-224, authorizes the FFB to make commitments to purchase and sell any obligation that is issued, sold, or guaranteed by a federal agency . Under the FFB Act, the FFB has authority to publicly issue up to $15 billion of its own debt securities . Debt issued by the FFB does not count against the debt limit . In addition, FFB debt is an eligible investment for all government trust funds, including the CSRDF . On October 1, 2013, the Secretary of the Treasury (the Secretary) authorized the exchange of the CSRDF’s Treasury Special Investments with the Federal Financing Bank (FFB) 9(a) obligations . See Note 16 – Subsequent Events for more information .

OPM Fiscal Year 2013 Agency Financial Report
Section 2 — FY 2013 Financial inFormation
51
Debt Issuance Suspension Period (DISP). Section 8348 of Title 5, U .S . Code, authorizes the Secretary of the Treasury to suspend additional investments of Treasury securities in the CSRDF if such additional investment could not be made without causing the public debt of the United States to exceed the public debt limit . In addition, the Secretary may sell or redeem securities, obligations, and other invested assets of the CSRDF before maturity in order to prevent the public debt from exceeding the public debt limit . The Secretary may redeem such investments only during a debt issuance suspension period (DISP) and only to the extent necessary to obtain an amount of payments authorized to be made from the CSRDF during such period . Further, the Postal Accountability and Enhancement Act of 2006 requires that investments of the Postal Service Retiree Health Benefits Fund (PSRHBF) be made in the same manner as investments of the CSRDF .
The Secretary of the Treasury determined that a DISP began on May 20, 2013 and continued until October 17, 2013 . During this period, Treasury took extraordinary measures, including those described above, to avoid exceeding the statutory debt limit . In accordance with Section 8348 (j)(4), the U .S . Government was required to pay both the CSRDF and the PSRHBF the amount of the “foregone interest” those funds would have otherwise earned had such extraordinary measures not been taken . The Treasury’s Bureau of Fiscal Service calculated the amount of “foregone interest” owed to the CSRDF and to the PSRHBF from May 20, 2013, through September 30, 2013 to be $304 .2 million and $20 .3 million, respectively . Because these “foregone interest” amounts were owed to these funds as of and for the fiscal year ended September 30, 2013, OPM has recorded accruals for these funds . See Note 16 – Subsequent Events for more information .
K. Accounts Receivable, Net
Accounts receivable consist of amounts owed to OPM by Federal entities (“intragovernmental”) and amounts owed by the public (“from the public”) . The balance of accounts receivable from the public is stated net of an allowance for uncollectible amounts, which is based on past collection experience and an analysis of outstanding amounts . OPM regards its intragovernmental accounts receivable balance as fully collectible .
L. Other Assets
This represents the balance of assets held by the experience-rated carriers participating in the Health Benefits Program and by the Life Insurance Program carrier, pending disposition on behalf of OPM .
M. General Property and Equipment
OPM capitalizes major long-lived software and equipment . Software costing over $500,000 is capitalized at the cost of either purchase or development, and is amortized using a straight-line method over a useful life of five years . Equipment costing over $25,000 is capitalized at purchase cost and depreciated using the straight-line method over five years . The cost of minor purchases, repairs and maintenance is expensed as incurred .
N. Benefits Due and Payable
Benefits due and payable is comprised of two categories of accrued expenses . The first reflects claims filed by participants of the Retirement, Health Benefits, and Life Insurance Programs that are unpaid in the current reporting period and includes an estimate of health benefits and life insurance claims incurred but not yet reported . The second is a liability for premiums payable to community-rated carriers participating in the Health Benefits Program that is unpaid in the current reporting period .

OPM Fiscal Year 2013 Agency Financial Report
Section 2 — FY 2013 Financial inFormation
52
O. Actuarial Liabilities and Associated Expenses
OPM records actuarial liabilities [the Pension Liability, post-Retirement Health Benefits Liability, and the Actuarial Life Insurance Liability] and associated expenses . These liabilities are measured as of the first day of the year, with a “roll-forward,” or projection, to the end of the year . The “roll-forward” considers all major factors that affect the measurement that occurred during the reporting year, including pay raises, cost of living allowances, and material changes in the number of participants .
P. Cumulative Results of Operations
The balance of OPM’s Cumulative Results of Operations is negative because of the recognition of actuarial liabilities that will be liquidated in future periods .
Q. Tax Status
As an agency of the Federal Government, OPM is generally exempt from all income taxes imposed by any governing body, whether it be a Federal, state, commonwealth, local, or foreign Government .
R. Parent-Child Reporting Allocation Transfer
The Office of Personnel Management is a party to an allocation transfer with another federal agency, the Department of Health and Human Services (HHS), which is the parent . OPM is the receiving (child) entity . Allocation transfers are legal delegations by one department of its authority to obligate budget authority and outlay funds to another department . A separate “Health Insurance Reform Implementation Fund,” account 024075X0119, was created in the U .S . Treasury as a subset of the HHS fund account for tracking and reporting purposes . All allocation transfers of balances are credited to this account, and subsequent obligations and outlays incurred by the OPM are charged to this allocation account as OPM executes the delegated activity on behalf of the HHS . The financial activity related to this allocation transfer is reported in the financial statements of the parent entity, HHS, from which the underlying legislative budget authority, appropriations, and apportionments are derived .
S. Presentation Updates
Effective for FY 2013, OPM is no longer required to report its Federal employees’ benefit programs funds as Earmarked Funds . Statement of Federal Financial Accounting Standard (SFFAS) No . 43, Dedicated Collections: Amending SFFAS No . 27, “Identifying and Reporting Earmarked Funds” is effective for periods beginning after September 30, 2012 . This Statement, among other provisions, adds “an explicit exclusion for any fund established to account for pensions, other retirement benefits, other postemployment, or other benefits provided for federal employees (civilian and military) .” OPM has implemented this for FY 2013 reporting . As such, the former Note 8 on Earmarked Funds in the prior FY 2012 Notes is intentionally not presented in accordance with SFFAS No . 43 for the Notes to Financial Statements for FY 2013 . Both FY 2013 and 2012 amounts are presented using current standards .
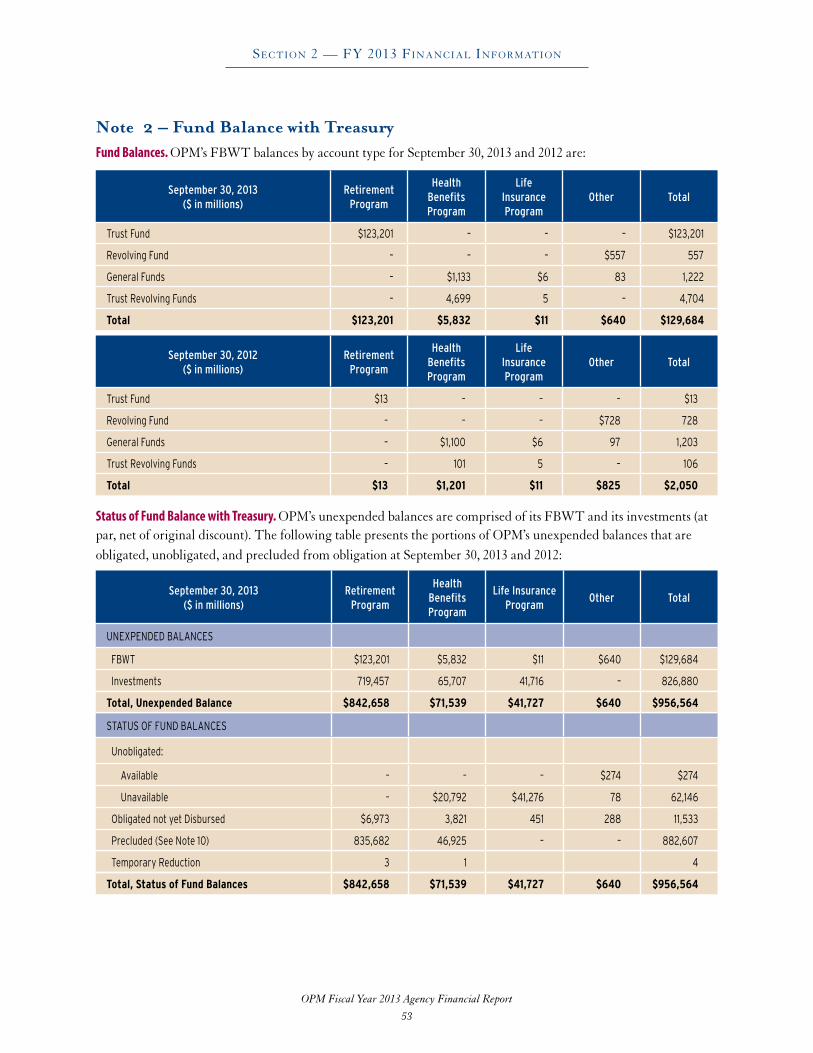
OPM Fiscal Year 2013 Agency Financial Report
Section 2 — FY 2013 Financial inFormation
53
Note 2 – Fund Balance with Treasury Fund Balances. OPM’s FBWT balances by account type for September 30, 2013 and 2012 are:
September 30, 2013($ in millions)
RetirementProgram
Health BenefitsProgram
LifeInsuranceProgram
Other Total
Trust Fund $123,201 – – – $123,201
Revolving Fund – – – $557 557
General Funds – $1,133 $6 83 1,222
Trust Revolving Funds – 4,699 5 – 4,704
Total $123,201 $5,832 $11 $640 $129,684
September 30, 2012 ($ in millions)
RetirementProgram
Health BenefitsProgram
LifeInsuranceProgram
Other Total
Trust Fund $13 – – – $13
Revolving Fund – – – $728 728
General Funds – $1,100 $6 97 1,203
Trust Revolving Funds – 101 5 – 106
Total $13 $1,201 $11 $825 $2,050
Status of Fund Balance with Treasury. OPM’s unexpended balances are comprised of its FBWT and its investments (at par, net of original discount) . The following table presents the portions of OPM’s unexpended balances that are obligated, unobligated, and precluded from obligation at September 30, 2013 and 2012:
September 30, 2013($ in millions)
RetirementProgram
HealthBenefitsProgram
Life InsuranceProgram
Other Total
UNEXPENDED BALANCES
FBWT $123,201 $5,832 $11 $640 $129,684
Investments 719,457 65,707 41,716 – 826,880
Total, Unexpended Balance $842,658 $71,539 $41,727 $640 $956,564
STATUS OF FUND BALANCES
Unobligated:
Available – – – $274 $274
Unavailable – $20,792 $41,276 78 62,146
Obligated not yet Disbursed $6,973 3,821 451 288 11,533
Precluded (See Note 10) 835,682 46,925 – – 882,607
Temporary Reduction 3 1 4
Total, Status of Fund Balances $842,658 $71,539 $41,727 $640 $956,564

OPM Fiscal Year 2013 Agency Financial Report
Section 2 — FY 2013 Financial inFormation
54
September 30, 2012($ in millions)
RetirementProgram
HealthBenefitsProgram
Life InsuranceProgram
Other Total
UNEXPENDED BALANCES
FBWT $13 $1,201 $11 $825 $2,050
Investments 826,555 66,549 40,800 – 933,904
Total, Unexpended Balance $826,568 $67,750 $40,811 $825 $935,954
STATUS OF FUND BALANCES
Unobligated:
Available – – – $282 $282
Unavailable – $18,606 $40,326 202 59,134
Obligated not yet Disbursed $6,817 3,797 485 341 11,440
Precluded (See Note 10) 819,751 45,347 – – 865,098
Total, Status of Fund Balances $826,568 $67,750 $40,811 $825 $935,954
Impact of Debt Issuance Suspension Period (DISP). During the DISP, which began on May 20, 2013, and continued until October 17, 2013, Treasury took extraordinary measures to avoid exceeding the statutory debt limit . Section 8348 of Title 5, U .S . Code, authorizes the Secretary of the Treasury to suspend additional investments of Treasury securities in the CSRDF if such additional investment could not be made without causing the public debt of the United States to exceed the public debt limit . In addition, the Postal Accountability and Enhancement Act of 2006 requires that investments of the PSRHBF be made in the same manner as investments of the CSRDF .
Therefore, during this period, OPM could not invest in government securities; the amount suspended, $123 billion for the CSRDF and $4 .6 billion for the PSRHBF, has been recorded in FBWT instead of Investments in Government Securities . See Note 16 Subsequent Events for further explanation .
Note 3 – InvestmentsAll of OPM investments are in securities issued by other Federal entities and are, therefore, classified as intragovernmental . See Note 1J for further explanation, including the amortization method . All of OPM’s investments are in U .S . Treasury and Federal Financing Bank securities held by trust funds - the Retirement, Health Insurance, and Life Insurance Programs . The Federal Government does not set aside assets to pay future benefits or other expenditures associated with the trust funds .
The cash receipts collected from the public for the trust funds are deposited in the U .S . Treasury, which uses the cash for general Government purposes . Treasury securities are issued to OPM as evidence of its receipts . Treasury securities are an asset to OPM and a liability to the U .S . Treasury . Because OPM and the U .S . Treasury are both parts of the Government, these assets and liabilities offset each other from the standpoint of the Government as a whole . They are eliminated in consolidation for the U .S . Government-wide financial statements .
Treasury securities provide OPM with authority to draw upon the U .S . Treasury to make future benefit payments or other expenditures . When OPM requires redemption of these Treasury securities to make expenditures, the Government finances those expenditures out of accumulated cash balances by raising taxes or other receipts, borrowing from the public or repaying less debt, or curtailing other expenditures . This is the same way the Government finances all other expenditures . When a security is redeemed and not carried to maturity, there is a

OPM Fiscal Year 2013 Agency Financial Report
Section 2 — FY 2013 Financial inFormation
55
risk the fund could receive less value in return for the security it gave up . The Health Benefit and Life Insurance funds had approximately $109 billion invested as of September 30, 2013 . The majority of these securities are market-based and have market value risk .
Debt Issuance Suspension Period (DISP). During the DISP, which began on May 20, 2013, and continued until October 17, 2013, the U .S . Treasury took extraordinary measures to avoid exceeding the statutory debt limit . Section 8348 of Title 5, U .S . Code, authorizes the Secretary of the Treasury to suspend additional investments of Treasury securities in the CSRDF if such additional investment could not be made without causing the public debt of the United States to exceed the public debt limit . In addition, the Postal Accountability and Enhancement Act of 2006 requires that investments of the PSRHBF be made in the same manner as investments of the CSRDF .
Therefore, during this period, OPM could not invest in government securities; the amounts suspended, $123 billion for the CSRDF and $4 .6 billion for the PSRHBF, have been recorded in Fund Balance with Treasury instead of Investments in Government Securities . See Note 16, Subsequent Events, for further explanation .
The following tables summarize OPM’s investments by Program, all trust funds, at the end of September 2013 and 2012 .
As of September 30, 2013($ in millions)
CostAmortizedDiscount/(Premium)
InterestReceivable
Investments,Net
UnamortizedDiscount/(Premium)
Market Value
Intragovernmental:
Retirement Program:
Marketable:
FFB Securities $5,695 – $66 $5,761 – $5,695
Non-Marketable: (PAR)
Par-value GAS securities 713,762 – 7,292 721,054 – 713,762
Certificates of Indebtedness – – – – – –
Total Retirement Program $719,457 – $7,358 $726,815 – $719,457
Health Benefits Program:
Non-Marketable: (Market-based)
Market-Based GAS securities $23,614 ($104) $67 $23,577 $81 $23,610
Non-Marketable: (PAR)
Par-value GAS securities 42,324 – 367 42,691 – 42,324
Certificates of Indebtedness – – – – –
Total Health Benefits Program $65,938 ($104) $434 $66,268 $81 $65,934
Life Insurance Program
Non-Marketable: (Market-based)
Market-Based GAS securities $43,036 $(256) $392 $43,172 $829 $43,283
Total Life Insurance Program $43,036 $(256) $392 $43,172 $829 $43,283
Total Investments $828,431 $(360) $8,184 $836,255 $910 $828,674
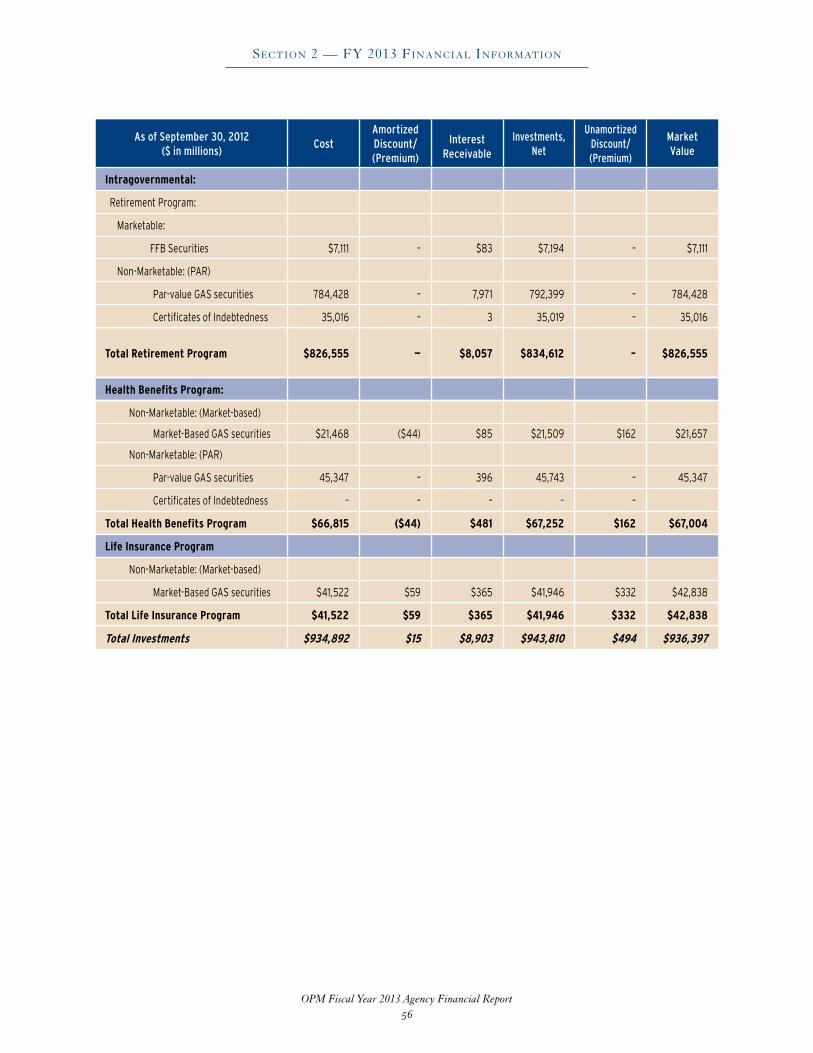
OPM Fiscal Year 2013 Agency Financial Report
Section 2 — FY 2013 Financial inFormation
56
As of September 30, 2012($ in millions)
CostAmortizedDiscount/(Premium)
InterestReceivable
Investments,Net
UnamortizedDiscount/(Premium)
Market Value
Intragovernmental:
Retirement Program:
Marketable:
FFB Securities $7,111 – $83 $7,194 – $7,111
Non-Marketable: (PAR)
Par-value GAS securities 784,428 – 7,971 792,399 – 784,428
Certificates of Indebtedness 35,016 – 3 35,019 – 35,016
Total Retirement Program $826,555 — $8,057 $834,612 – $826,555
Health Benefits Program:
Non-Marketable: (Market-based)
Market-Based GAS securities $21,468 ($44) $85 $21,509 $162 $21,657
Non-Marketable: (PAR)
Par-value GAS securities 45,347 – 396 45,743 – 45,347
Certificates of Indebtedness – – – – –
Total Health Benefits Program $66,815 ($44) $481 $67,252 $162 $67,004
Life Insurance Program
Non-Marketable: (Market-based)
Market-Based GAS securities $41,522 $59 $365 $41,946 $332 $42,838
Total Life Insurance Program $41,522 $59 $365 $41,946 $332 $42,838
Total Investments $934,892 $15 $8,903 $943,810 $494 $936,397
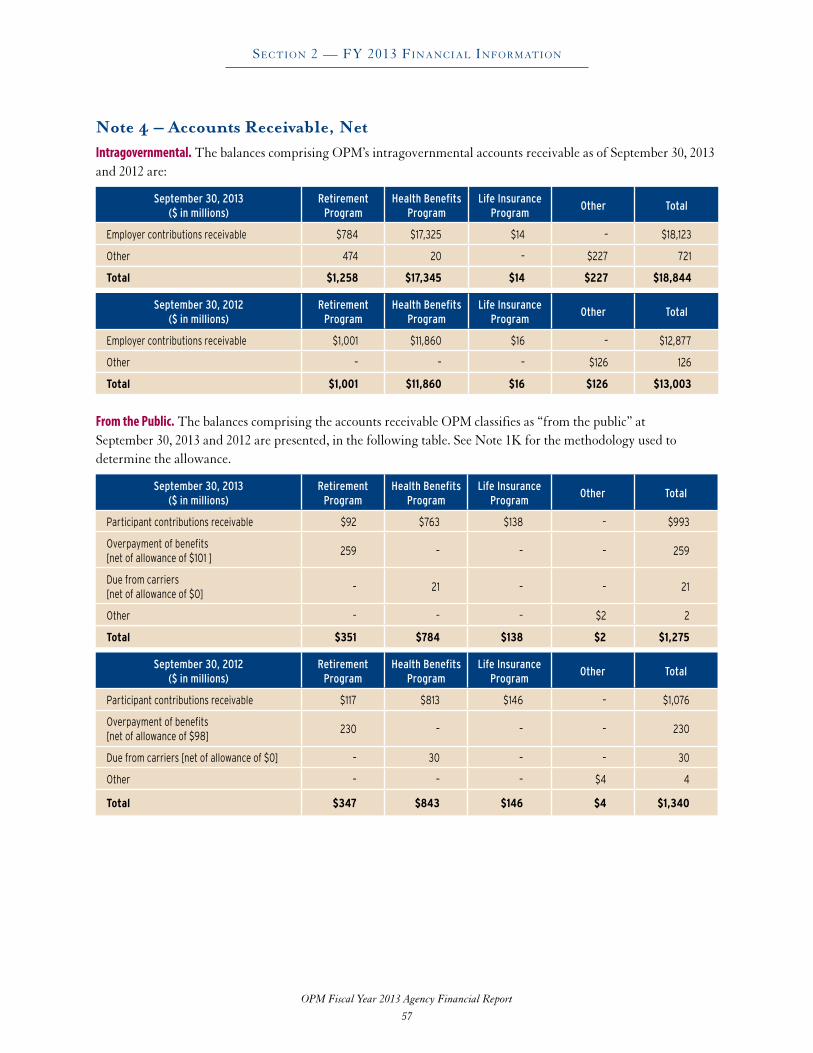
OPM Fiscal Year 2013 Agency Financial Report
Section 2 — FY 2013 Financial inFormation
57
Note 4 – Accounts Receivable, NetIntragovernmental. The balances comprising OPM’s intragovernmental accounts receivable as of September 30, 2013 and 2012 are:
September 30, 2013($ in millions)
RetirementProgram
Health BenefitsProgram
Life InsuranceProgram
Other Total
Employer contributions receivable $784 $17,325 $14 – $18,123
Other 474 20 – $227 721
Total $1,258 $17,345 $14 $227 $18,844
September 30, 2012($ in millions)
RetirementProgram
Health BenefitsProgram
Life InsuranceProgram
Other Total
Employer contributions receivable $1,001 $11,860 $16 – $12,877
Other – – – $126 126
Total $1,001 $11,860 $16 $126 $13,003
From the Public. The balances comprising the accounts receivable OPM classifies as “from the public” at September 30, 2013 and 2012 are presented, in the following table . See Note 1K for the methodology used to determine the allowance .
September 30, 2013($ in millions)
RetirementProgram
Health BenefitsProgram
Life InsuranceProgram
Other Total
Participant contributions receivable $92 $763 $138 – $993
Overpayment of benefits [net of allowance of $101 ]
259 – – – 259
Due from carriers [net of allowance of $0]
– 21 – – 21
Other – – – $2 2
Total $351 $784 $138 $2 $1,275
September 30, 2012($ in millions)
RetirementProgram
Health BenefitsProgram
Life InsuranceProgram
Other Total
Participant contributions receivable $117 $813 $146 – $1,076
Overpayment of benefits [net of allowance of $98]
230 – – – 230
Due from carriers [net of allowance of $0] – 30 – – 30
Other – – – $4 4
Total $347 $843 $146 $4 $1,340

OPM Fiscal Year 2013 Agency Financial Report
Section 2 — FY 2013 Financial inFormation
58
Note 5 – Federal Employee BenefitsA. Pensions
OPM’s Actuary, in computing the Pension Liability and associated Pension Expense, applies economic assumptions to historical cost information to estimate the Government’s future cost to provide CSRS and FERS benefits to current and future retirees . The estimate is adjusted by the time value of money and the probability of having to pay benefits due to assumed decrements for mortality, morbidity, and terminations . Actuarial gains or losses occur to the extent that actual experience differs from these assumptions used to compute the Pension Liability and associated Pension Expense .
Economic Assumptions. The economic assumptions used to calculate the Pension Liability and related Pension Expense under SFFAS No . 33 are based on 10-year historical averages . These economic assumptions differ from those established by OPM under guidance from the CSRS Board of Actuaries for the determination of certain statutory funding payments for CSRS and FERS . The following table presents the significant economic assumptions used under SFFAS No . 33 to compute the Pension Liability in FY 2013 and 2012:
FY 2013 FY 2012
CSRS FERS CSRS FERS
Interest rate 4.1% 4.4% 4.3% 4.7%
Cost of Living Adjustment (COLA)* 2.5% 2.0% 2.5% 2.0%
Rate of increases in salary 2.2% 2.2% 2.6% 2.6%
*Note - The actuarial liability for CSRS and FERS is determined based on an assumed rate of retiree cost of living adjustment factor-COLAs, an assumption that is related to the general rate of inflation .
Pension Expense. The following tables present Pension Expense by cost component for FY 2013 and 2012:
FY 2013($ in millions)
CSRS FERS TOTAL
Service cost $6,697 $28,650 $35,347
Interest cost 50,016 23,236 73,252
Actuarial (gain)/ loss - Experience (10,799) (7,449) (18,248)
Actuarial loss/(gain) - Assumptions 39,707 42,309 82,016
Pension Expense $85,621 $86,746 $172,367
FY 2012($ in millions)
CSRS FERS TOTAL
Service cost $8,255 $25,034 $33,289
Interest cost 49,605 21,269 70,874
Actuarial (gain)/ loss - Experience 12,545 (3,104) 9,441
Actuarial loss/(gain) - Assumptions 82,866 23,201 106,067
Pension Expense $153,271 $66,400 $219,671
OPM Fiscal Year 2013 Agency Financial Report
Section 2 — FY 2013 Financial inFormation
59
Pension Liability. The following tables present the Pension Liability at September 30, 2013 and 2012:
FY 2013($ in millions)
CSRS FERS TOTAL
Pension Liability at October 1, 2012 $1,193,800 $484,400 $1,678,200
Plus: Pension Expense
Normal Cost $6,697 $28,650 $35,347
Interest on the Liability Balance 50,016 23,236 73,252
Actuarial (gain)/loss:
From experience: (10,799) (7,449) (18,248)
From changes in actuarial assumptions: 39,707 42,309 82,016
Net (Gain)/Loss $28,908 $34,860 $63,768
Total Expense: $85,621 $86,746 $172,367
Less: Costs applied to Pension Liability (68,621) (8,446) (77,067)
Pension Liability at September 30, 2013 $1,210,800 $562,700 $1,773,500
FY 2012($ in millions)
CSRS FERS TOTAL
Pension Liability at October 1, 2011 $1,107,300 $425,300 $1,532,600
Plus: Pension Expense
Normal Cost $8,255 $25,034 $33,289
Interest on the Liability Balance 49,605 21,269 70,874
Actuarial (gain)/loss:
From experience: 12,545 (3,104) 9,441
From changes in actuarial assumptions: 82,866 23,201 106,067
Net Loss $95,411 $20,097 $115,508
Total Expense: $153,271 $66,400 $219,671
Less: Costs applied to Pension Liability 66,771 7,300 74,071
Pension Liability at September 30, 2012 $1,193,800 $484,400 $1,678,200
OPM Fiscal Year 2013 Agency Financial Report
Section 2 — FY 2013 Financial inFormation
60
Costs Applied to the Pension Liability. In accordance with Federal accounting standards, the Pension Liability is reduced by the total operating costs of the Retirement Program . The following table presents the costs applied to the Pension Liability in fiscal years 2013 and 2012:
FY 2013($ in millions)
CSRS FERS TOTAL
Annuities $68,197 $8,289 $76,486
Refunds of contributions 319 121 440
Administrative and other expenses 105 36 141
Costs applied to the Pension Liability $68,621 $8,446 $77,067
FY 2012($ in millions)
CSRS FERS TOTAL
Annuities $66,385 $7,133 $73,518
Refunds of contributions 271 109 380
Administrative and other expenses 115 58 173
Costs applied to the Pension Liability $66,771 $7,300 $74,071
B. Post-Retirement Health Benefits
OPM’s actuary, in computing the post-Retirement Health Benefits (PRHB) Liability and associated expense, applies economic assumptions to historical cost information to estimate the Government’s future cost of providing post-Retirement health benefits to current employees and retirees . The estimate is adjusted by the time value of money and the probability of having to pay benefits due to assumed decrements for mortality, morbidity, and terminations . Actuarial gains or losses will occur to the extent that actual experience differs from the assumptions used to compute the PRHB Liability and associated expense .
Economic Assumptions. The following presents the significant economic assumptions used to compute the PRHB Liability and related expense as of the September 30 measurement date:
FY 2013 FY 2012
Interest rate(1) 4.4% 4.7%
Increase in per capita cost of covered benefits(2) 3.0% 3.7%
Ultimate medical trend rate 4.2% 4.4%
(1) The single equivalent annual interest rate for FY 2013 is derived from a yield curve based on the average of the last 40 quarters through March 2013. The single equivalent annual interest rate for FY 2012 was derived from a yield curve based on the average of the last 40 quarters through March 2012.
(2) The increase in per capita cost of covered benefits for FY 2013 represents a variable trend which begins at 3.0%, rising to 5.6% in FY 2017 and then declining to 4.2% in FY 2101. Last year, the increase in per capita cost of covered benefits represented a variable trend that began at 3.7%, increased for a period, and ultimately declined to 4.4%.
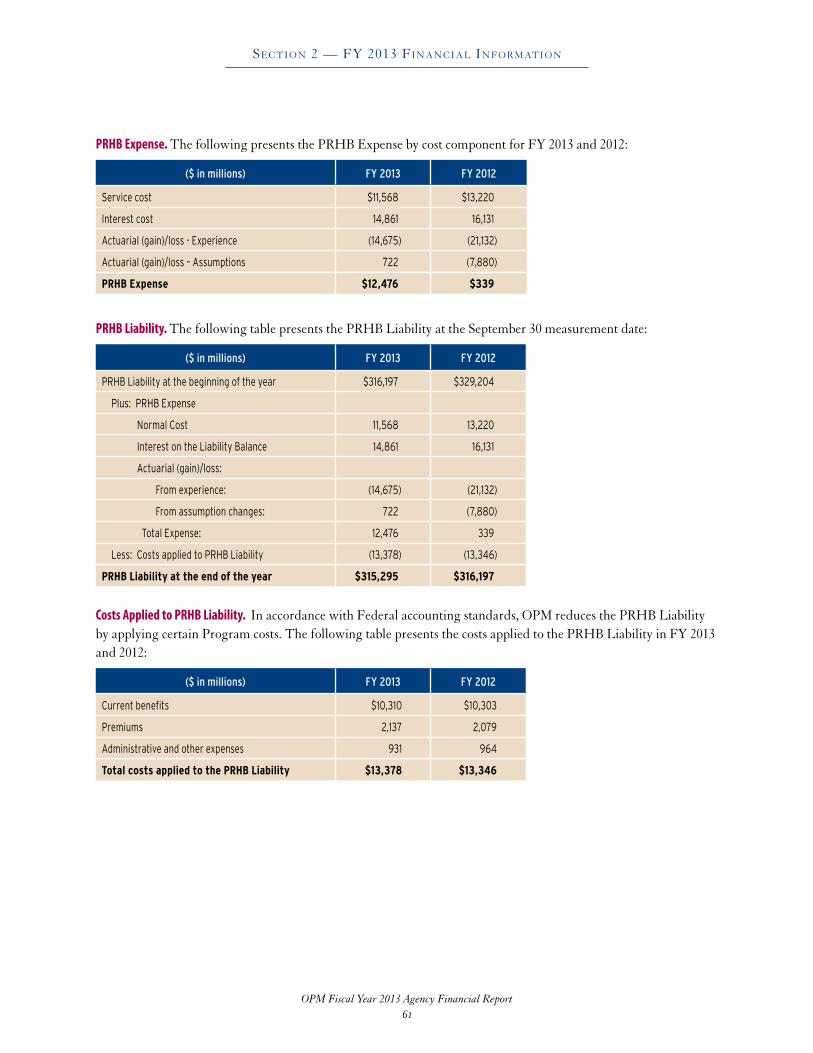
OPM Fiscal Year 2013 Agency Financial Report
Section 2 — FY 2013 Financial inFormation
61
PRHB Expense. The following presents the PRHB Expense by cost component for FY 2013 and 2012:
($ in millions) FY 2013 FY 2012
Service cost $11,568 $13,220
Interest cost 14,861 16,131
Actuarial (gain)/loss - Experience (14,675) (21,132)
Actuarial (gain)/loss – Assumptions 722 (7,880)
PRHB Expense $12,476 $339
PRHB Liability. The following table presents the PRHB Liability at the September 30 measurement date:
($ in millions) FY 2013 FY 2012
PRHB Liability at the beginning of the year $316,197 $329,204
Plus: PRHB Expense
Normal Cost 11,568 13,220
Interest on the Liability Balance 14,861 16,131
Actuarial (gain)/loss:
From experience: (14,675) (21,132)
From assumption changes: 722 (7,880)
Total Expense: 12,476 339
Less: Costs applied to PRHB Liability (13,378) (13,346)
PRHB Liability at the end of the year $315,295 $316,197
Costs Applied to PRHB Liability. In accordance with Federal accounting standards, OPM reduces the PRHB Liability by applying certain Program costs . The following table presents the costs applied to the PRHB Liability in FY 2013 and 2012:
($ in millions) FY 2013 FY 2012
Current benefits $10,310 $10,303
Premiums 2,137 2,079
Administrative and other expenses 931 964
Total costs applied to the PRHB Liability $13,378 $13,346

OPM Fiscal Year 2013 Agency Financial Report
Section 2 — FY 2013 Financial inFormation
62
Effect of Assumptions. The increase in the per capita cost of covered benefits assumed by OPM’s actuaries has a significant effect on the amounts reported as the PRHB Liability and associated expense . A one percentage point change in the per capita cost of covered benefits assumption would have the following effects in fiscal years 2013 and 2012:
($ in millions)
FY 2013 FY 2012
One Percent Increase
One Percent Decrease
One Percent Increase
One Percent Decrease
PRHB Liability $360,837 $277,329 $357,784 $280,491
(In Whole $)
FY 2013 FY 2012
Per Capita Normal Cost at Valuation Date
One Percent Increase
One Percent Decrease
Per Capita Normal Cost at Valuation Date
One Percent Increase
One Percent Decrease
$4,926 $6,280 $3,856 $4,888 $6,188 $3,847
C. Life Insurance Actuarial Life Insurance Liability. The Actuarial Life Insurance Liability (ALIL) is the expected present value (EPV) of future benefits to be paid to, or on behalf of, existing Life Insurance Program participants, less the EPV of future contributions to be collected from those participants . In applying SFFAS No . 33 for calculating the ALIL, OPM’s actuary uses salary increase and interest rate yield curve assumptions that are consistent with those used for computing the CSRS and FERS Pension Liability in FY 2013 and 2012 . This entails the determination of a single equivalent interest rate that is specific to the ALIL .
FY 2013 FY 2012
Interest rate 4.3% 4.5%
Rate of increases in salary 2.2% 2.6%
The following presents the ALIL as of the September 30 measurement date:
Life Insurance Expense. The following presents the Life Insurance Expense by cost component for FY 2013 and 2012:
($ in millions) FY 2013 FY 2012
New Entrant Expense $306 $310
Interest cost 2,085 2,097
Actuarial (gain)/ loss - Experience (710) 37
Actuarial (gain)/ loss - Assumptions (858) 745
Life Insurance Expense $823 $3,189
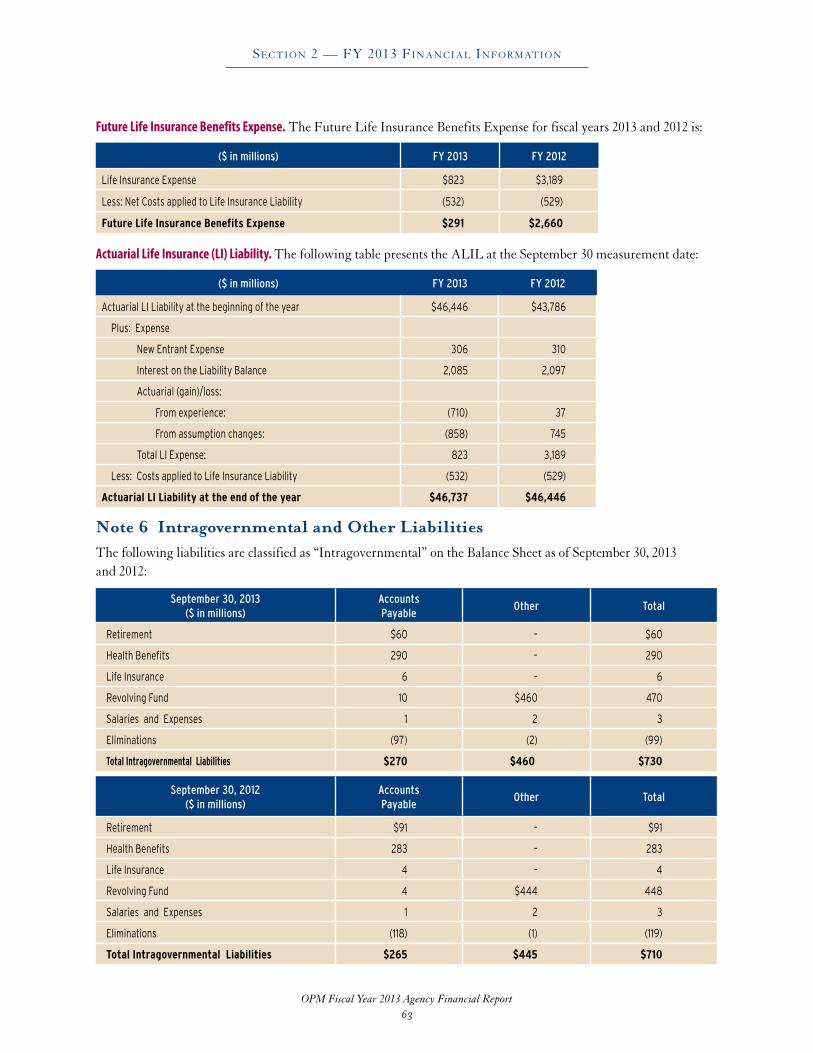
OPM Fiscal Year 2013 Agency Financial Report
Section 2 — FY 2013 Financial inFormation
63
Future Life Insurance Benefits Expense. The Future Life Insurance Benefits Expense for fiscal years 2013 and 2012 is:
($ in millions) FY 2013 FY 2012
Life Insurance Expense $823 $3,189
Less: Net Costs applied to Life Insurance Liability (532) (529)
Future Life Insurance Benefits Expense $291 $2,660
Actuarial Life Insurance (LI) Liability. The following table presents the ALIL at the September 30 measurement date:
($ in millions) FY 2013 FY 2012
Actuarial LI Liability at the beginning of the year $46,446 $43,786
Plus: Expense
New Entrant Expense 306 310
Interest on the Liability Balance 2,085 2,097
Actuarial (gain)/loss:
From experience: (710) 37
From assumption changes: (858) 745
Total LI Expense: 823 3,189
Less: Costs applied to Life Insurance Liability (532) (529)
Actuarial LI Liability at the end of the year $46,737 $46,446
Note 6 Intragovernmental and Other LiabilitiesThe following liabilities are classified as “Intragovernmental” on the Balance Sheet as of September 30, 2013 and 2012:
September 30, 2013($ in millions)
AccountsPayable
Other Total
Retirement $60 – $60
Health Benefits 290 – 290
Life Insurance 6 – 6
Revolving Fund 10 $460 470
Salaries and Expenses 1 2 3
Eliminations (97) (2) (99)
Total Intragovernmental Liabilities $270 $460 $730
September 30, 2012($ in millions)
AccountsPayable
Other Total
Retirement $91 – $91
Health Benefits 283 – 283
Life Insurance 4 – 4
Revolving Fund 4 $444 448
Salaries and Expenses 1 2 3
Eliminations (118) (1) (119)
Total Intragovernmental Liabilities $265 $445 $710

OPM Fiscal Year 2013 Agency Financial Report
Section 2 — FY 2013 Financial inFormation
64
The following liabilities, all current and “with the public,” are classified as “other” on the Balance Sheet as of September 30, 2013 and 2012:
September 30, 2013 ($ in millions)
Withheld from benefits
AccruedCarrier
LiabilitiesOther Than
Benefits
Accrued Administrative
expensesContingencies Total
Retirement Program $871 – – 10 $881
Health Benefits Program – $305 – – 305
Life Insurance Program – 41 – – 41
Revolving Fund Program – – $53 – 53
Salaries and Expenses – – 37 1 38
Total Other Liabilities $871 $346 $90 $11 $1,318
September 30, 2012($ in millions)
Withheld from benefits
AccruedCarrier
LiabilitiesOther Than
Benefits
Accrued Administrative
expensesContingencies Total
Retirement Program $835 – – 10 $845
Health Benefits Program – $328 – – 328
Life Insurance Program – 80 – 12 92
Revolving Fund Program – – $59 - 59
Salaries and Expenses – – 31 2 33
Total Other Liabilities $835 $408 $90 $24 $1,357
Note 7 – ContingenciesHealth Benefits Program. In prior years, OPM was a party to litigation in which certain Health Benefits Program carriers were seeking relief for alleged underpayment of premiums . As a result of one adverse court decision, the Department of Justice, which represented OPM in the litigation, settled most of the remaining cases (one other case was tried and lost) . Judgments/settlements in those cases were paid from the Treasury Judgment Fund (TJF) . However, because any underpayments that may have occurred resulted from inaccuracies in the amount of contributions by or on behalf of employee-participants that were remitted to OPM by the employing agencies (which remittances came from the respective agencies’ appropriations), OPM has neither the legal responsibility nor the legal authority to reimburse the TJF . Nonetheless, the Department of the Treasury continues to assert that OPM is liable to reimburse the TJF for the amount of the judgments/settlements . As such, OPM has accrued $260 million as of September 30, 2013 and September 30, 2012 in Intragovernmental Liabilities due to Treasury .
Other Litigation. OPM is often involved in other legal and administrative proceedings that arise in the ordinary course of business . For FY 2013, OPM has recorded a total liability of $11 .1 million for the estimated amount of losses it will probably incur from litigation . For Salaries and Expenses the estimated amount of probable losses is $0 .7 million, for the Revolving Fund the estimated amount of probable losses is $0 .4 million, and for the Retirement Fund the estimated amount of probable losses is $10 million . There are no contingencies recorded for the Health Benefits Fund and the Life Insurance Fund . For FY 2012, OPM recorded a total liability of $24 .3 million for the estimated amount of losses it will probably incur from litigation . For Salaries and Expenses the estimated amount
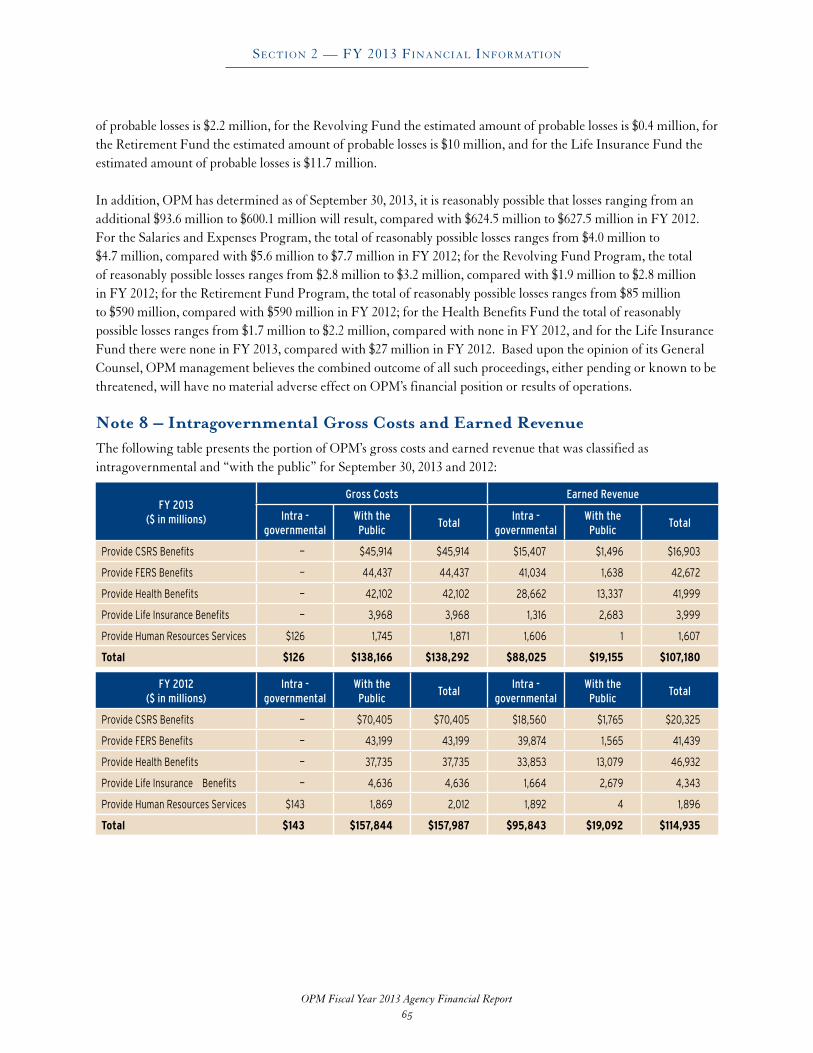
OPM Fiscal Year 2013 Agency Financial Report
Section 2 — FY 2013 Financial inFormation
65
of probable losses is $2 .2 million, for the Revolving Fund the estimated amount of probable losses is $0 .4 million, for the Retirement Fund the estimated amount of probable losses is $10 million, and for the Life Insurance Fund the estimated amount of probable losses is $11 .7 million .
In addition, OPM has determined as of September 30, 2013, it is reasonably possible that losses ranging from an additional $93 .6 million to $600 .1 million will result, compared with $624 .5 million to $627 .5 million in FY 2012 . For the Salaries and Expenses Program, the total of reasonably possible losses ranges from $4 .0 million to $4 .7 million, compared with $5 .6 million to $7 .7 million in FY 2012; for the Revolving Fund Program, the total of reasonably possible losses ranges from $2 .8 million to $3 .2 million, compared with $1 .9 million to $2 .8 million in FY 2012; for the Retirement Fund Program, the total of reasonably possible losses ranges from $85 million to $590 million, compared with $590 million in FY 2012; for the Health Benefits Fund the total of reasonably possible losses ranges from $1 .7 million to $2 .2 million, compared with none in FY 2012, and for the Life Insurance Fund there were none in FY 2013, compared with $27 million in FY 2012 . Based upon the opinion of its General Counsel, OPM management believes the combined outcome of all such proceedings, either pending or known to be threatened, will have no material adverse effect on OPM’s financial position or results of operations .
Note 8 – Intragovernmental Gross Costs and Earned RevenueThe following table presents the portion of OPM’s gross costs and earned revenue that was classified as intragovernmental and “with the public” for September 30, 2013 and 2012:
FY 2013($ in millions)
Gross Costs Earned Revenue
Intra - governmental
With the Public
TotalIntra -
governmental With the Public
Total
Provide CSRS Benefits — $45,914 $45,914 $15,407 $1,496 $16,903
Provide FERS Benefits — 44,437 44,437 41,034 1,638 42,672
Provide Health Benefits — 42,102 42,102 28,662 13,337 41,999
Provide Life Insurance Benefits — 3,968 3,968 1,316 2,683 3,999
Provide Human Resources Services $126 1,745 1,871 1,606 1 1,607
Total $126 $138,166 $138,292 $88,025 $19,155 $107,180
FY 2012($ in millions)
Intra - governmental
With the Public
TotalIntra -
governmental With the Public
Total
Provide CSRS Benefits — $70,405 $70,405 $18,560 $1,765 $20,325
Provide FERS Benefits — 43,199 43,199 39,874 1,565 41,439
Provide Health Benefits — 37,735 37,735 33,853 13,079 46,932
Provide Life Insurance Benefits — 4,636 4,636 1,664 2,679 4,343
Provide Human Resources Services $143 1,869 2,012 1,892 4 1,896
Total $143 $157,844 $157,987 $95,843 $19,092 $114,935

OPM Fiscal Year 2013 Agency Financial Report
Section 2 — FY 2013 Financial inFormation
66
Note 9 – Net Cost by Strategic Goals OPM’s Strategic Plan for 2010 – 2015 features five broad Strategic Goals that define OPM’s direction, and are summarized in the following chart:
Strategic Goal 1Hire the Best - Recruit and hire the most talented and diverse Federal workforce possible to serve the American people
Strategic Goal 2Respect the Workforce – Provide the training, benefits, and work-life balance necessary for Federal employees to succeed, prosper, and advance in their careers
Strategic Goal 3Expect the Best - Ensure the Federal workforce and its leaders are fully accountable and are fairly appraised while having the tools, systems, and resources to perform at the highest levels to achieve superior results
Strategic Goal 4Honor Service – Ensure comparable recognition and reward for exemplary performance of current employees and honor the careers of Federal retirees
Strategic Goal 5
Improve Access to Health Insurance - Develop and administer programs that provide high quality and affordable health insurance to uninsured Americans who are seeking health insurance through Affordable Care Act exchanges, uninsured Americans with pre-existing medical conditions who cannot otherwise purchase coverage, and employees of tribes or tribal organizations.
Strategic Goals2013
($ in millions)
Provide CSRS
Benefits
Provide FERS
Benefits
Provide Health
Benefits
Provide Life Insurance Benefits
Provide Human
Resource Services
Total
Goal 1
Total program cost — — — — $1,071 $1,071
Less earned revenue — — — — 962 962
Net program cost — — — — $109 $109
Goal 2
Total program cost $19,520 $19,777 $9,763 $709 $37 $49,807
Less earned revenue 3,854 9,729 9,575 912 24 24,093
Net program cost $15,667 $10,048 $188 $(203) $13 $25,713
Goal 3
Total program cost — — — — $718 $718
Less earned revenue — — — — 591 591
Net program cost — — — — $127 $127
Goal 4
Total program cost $63,813 $64,652 $31,917 $2,318 $(5) $162,695
Less earned revenue 12,598 31,804 31,302 2,980 (4) 78,680
Net program cost $51,216 $32,848 $615 $(663) $(1) $84,015
Goal 5
Total program cost $2,287 $2,317 $1,144 $83 $50 $5,882
Less earned revenue 452 1,140 1,122 107 34 2,854
Net program cost $1,836 $1,177 $22 $(24) $17 $3,028
Total
Total program cost $85,621 $86,746 $42,824 $3,110 $1,871 $220,172
Less earned revenue 16,903 42,672 41,999 3,999 1,607 107,180
Net program cost $68,718 $44,074 $825 $(889) $264 $112,992
NOTE: The Total program cost includes any loss/gain on Pension, ORB, or OPEB assumption changes (see Notes 5A, 5B, and 5C).

OPM Fiscal Year 2013 Agency Financial Report
Section 2 — FY 2013 Financial inFormation
67
Strategic Goals2012
($ in millions)
Provide CSRS
Benefits
Provide FERS
Benefits
Provide Health
Benefits
Provide Life Insurance Benefits
Provide Human
Resource Services
Total
Goal 1
Total program cost — — — — $975 $975
Less earned revenue — — — — 948 948
Net program cost — — — — $27 $27
Goal 2
Total program cost $33,314 $14,432 $6,489 $1,170 $36 $55,441
Less earned revenue 4,418 9,007 10,201 944 25 24,595
Net program cost $28,896 $5,425 ($3,712) $226 $11 $30,846
Goal 3
Total program cost — — — — $972 $972
Less earned revenue — — — — 903 903
Net program cost — — — — $69 $69
Goal 4
Total program cost $119,957 $51,968 $23,366 $4,211 $29 $199,531
Less earned revenue 15,907 32,432 36,731 3,399 20 88,489
Net program cost $104,050 $19,536 ($13,365) $812 $9 $111,042
Goal 5
Total program cost — — — — — —
Less earned revenue — — — — — —
Net program cost — — — — — —
Total
Total program cost $153,271 $66,400 $29,855 $5,381 $2,012 $256,919
Less earned revenue 20,325 41,439 46,932 4,343 1,896 114,935
Net program cost $132,946 $24,961 ($17,077) $1,038 $116 $141,984
Note 10 – Availability of Unobligated BalancesRetirement Program. Historically, OPM’s trust fund receipts have exceeded the amount needed to cover the Retirement Program’s obligations . The excess of trust fund receipts over incurred obligations is classified as being temporarily precluded from obligation . These receipts, however, remain assets of the CSRDF and will become immediately available, if circumstances dictate, to meet obligations to be incurred in the future .
The following table presents the unobligated balance of the CSRDF that is included in the Retirement Program that is temporarily precluded from obligation as of September 30, 2013 and 2012 (rounding may appear):
September 30($ in millions)
2013 2012
Temporarily precluded from obligation at the beginning of the year $819,751 $797,477
Plus: Trust fund receipts during the year, net of temporary reductions of three million 93,444 96,780
Plus: Appropriations Received 32,995 33,023
Less: Obligations incurred during the year 110,508 107,529
Excess of trust fund receipts over obligations incurred during the year 15,931 22,274
Temporarily Precluded from Obligation at the End of the Year $835,682 $819,751

OPM Fiscal Year 2013 Agency Financial Report
Section 2 — FY 2013 Financial inFormation
68
Health Benefits and Life Insurance Programs. OPM administers the Health Benefits and Life Insurance Programs through three trust revolving funds . A trust revolving fund is a single account that is authorized to be credited with receipts and incur obligations and expenditures in support of a continuing cycle of business-type operations in accordance with the provisions of statute . The unobligated balance in OPM’s trust revolving funds is available for obligation and expenditure, upon apportionment by OMB, without further action by Congress .
For the PSRHBF, there were two payments due from the USPS in FY 2012, one for $5 .5 billion due by August 1, 2012, and a second payment of $5 .6 billion due by September 30, 2012 . In addition, another $5 .6 billion payment was due by September 30, 2013, for a total of $16 .7 billion, which were all defaulted upon by USPS . At this time, Congress has not taken further action on these payments due from USPS to the PSRHBF .
Also, FY 2013 and FY 2012 receipts included interest income . The following table presents the unobligated balance of the PSRHB Fund included in the Health Benefits Program that is temporarily precluded from obligation as of September 30, 2013 and 2012:
September 30 ($ in millions)
2013 2012
Temporarily precluded from obligation at the beginning of the year $45,347 $43,707
Plus: Special Fund receipts during the year 1,578 1,640
Excess of Special Fund receipts over obligations incurred during the year 1,578 1,640
Temporarily Precluded from Obligation at the End of the Year $46,925 $45,347
Revolving Fund Programs. OPM’s Revolving Fund Programs are administered through an intragovernmental revolving fund . An intragovernmental revolving fund is designed to carry-out a cycle of business-type operations with other Federal agencies or separately funded components of the same agency . The unobligated balance in OPM’s intragovernmental revolving fund is available for obligation and expenditure, upon apportionment by OMB, without further action by Congress .
Salaries and Expenses. OPM funds its administrative costs through annual, multiple-year, and “no-year” appropriations . For its annual appropriations, the unobligated balance expires at the end of the applicable fiscal year . For OPM’s multiple-year appropriations, the unobligated balance remains available for obligation and expenditure for a specified period in excess of a fiscal year . For its no-year appropriations, the unobligated balance is carried forward and is available for obligation and expenditure indefinitely until the objectives for which it was intended have been accomplished .

OPM Fiscal Year 2013 Agency Financial Report
Section 2 — FY 2013 Financial inFormation
69
Note 11 – Apportionment Categories of Incurred ObligationsAn apportionment is a distribution by OMB of amounts available for obligation . OMB apportions the Revolving Fund and Salaries and Expense account on a quarterly basis [Category A] . Most other accounts under OPM’s control are apportioned annually [Category B], with the exception being the transfer-in from the U .S . Treasury General Fund to the Retirement Fund, which is not subject to, or exempt from apportionment [Category E] .
The following chart details the direct and reimbursable obligations that have been incurred against each apportionment category during fiscal years 2013 and 2012:
FY 2013Program/Fund($ in millions)
Category Direct Reimbursable Total
Retirement Program B $77,513 — $77,513
Retirement Program E 32,995 — 32,995
Subtotal $110,508 $110,508
Health Benefits Program B 43,756 — 43,756
Health Benefits Program E 10,964 — 10,964
Life Insurance Program B 2,823 — 2,823
Life Insurance Program E 46 — 46
Revolving Fund Program B — $1,655 1,655
Salaries and Expenses A&B 331 61 392
Total $168,428 $1,716 $170,144
FY 2012Program/Fund($ in millions)
Category Direct Reimbursable Total
Retirement Program B $74,506 — $74,506
Retirement Program E 33,023 — 33,023
Subtotal $107,529 $107,529
Health Benefits Program B 53,489 — 53,489
Life Insurance Program B 2,764 — 2,764
Revolving Fund Program B — $2,145 2,145
Salaries and Expenses A&B 321 60 381
Total $164,103 $2,205 $166,308

OPM Fiscal Year 2013 Agency Financial Report
Section 2 — FY 2013 Financial inFormation
70
Note 12 – Comparison of Combined Statements of Budgetary Resources to the President’s BudgetOPM reports information about budgetary resources in the Combined Statements of Budgetary Resources (SBR) and for presentation in the “President’s Budget .” The President’s Budget for FY 2015, which will contain the actual budgetary resources information for FY 2013, will be published in February 2014 and will be available on the OMB website at http://www .whitehouse .gov/omb/ . The President’s Budget for FY 2014, which contains actual budgetary resource information for FY 2012, was released on April 10, 2013 .
There are no material differences between the Statement of Budgetary Resources and the SF-133s - Reports on Budget Execution for each FY 2013 and FY 2012 . Additionally, there are no material differences between the actual amounts for FY 2012 published in the President’s Budget and those reported in the accompanying FY 2012 Combined Statement of Budgetary Resources .
Note 13 – Undelivered Orders at the End of the PeriodThe amounts of budgetary resources obligated for undelivered orders at the end of September 2013 and 2012 are as follows:
Undelivered Orders($ in millions)
RevolvingFund Programs
Salaries &Expenses
Total
FY 2013 $959 $89 $1,048
FY 2012 $1,228 $135 $1,363

OPM Fiscal Year 2013 Agency Financial Report
Section 2 — FY 2013 Financial inFormation
71
Note 14 – Consolidating Reconciliation of Net Cost of Operations to BudgetSFFAS No . 7 requires a reconciliation of proprietary and budgetary information in a way that helps users relate the two . The FY 2013 reconciliation and comparative FY 2012 reconciliation are as follows:
FY 2013($ in millions)
RetirementProgram
HealthBenefitsProgram
LifeInsuranceProgram
RevolvingFund
Programs
Salariesand
Expenses
Total2013
RESOURCES USED TO FINANCE ACTIVITIES
Budgetary Resources Obligated:
Obligations Incurred $110,508 $54,720 $2,869 $1,655 $392 $170,144
Less: Spending Authority from Offsetting Collections and Recoveries, Excluding One Million Temporary Reduction for Health Benefits Program
— 45,943 3,773 1,517 310 51,543
Less: Appropriated Trust Fund Receipts 93,447 1,578 — — — 95,025
Obligations Net of Offsetting Collections and Recoveries
17,061 7,199 (904) 138 82 23,576
Less: Offsetting Receipts 33,051 1,578 — 10 — 34,639
Net Obligations ($15,990) $5,621 ($904) $128 $82 ($11,063)
Other Resources — — — 21 15 36
Total Resources Used to Finance/Generated from Activities
($15,990) $5,621 ($904) $149 $97 ($11,027)
RESOURCES USED TO FINANCE ITEMS NOT PART OF NET COST OF OPERATIONS
Transfer-In from General Fund $32,995 — — — — $32,995
Other 56 $1,667 (273) (37) 54 1,467
Total Resources Used to Finance Items Not Part of the Net Cost of Operations
33,051 1,667 (273) (37) 54 34,462
Total Resources Used to Finance/Generated From the Net Cost of Operations
$17,061 $7,288 ($1,177) $112 $151 $23,435
COMPONENTS OF NET COST OF OPERATIONS THAT DO NOT REQUIRE OR GENERATE RESOURCES IN THE CURRENT PERIOD
Components Requiring or Generating Resources in Future Periods:
Increase in Actuarial Liabilities $95,300 ($902) $291 — — $94,689
Exchange Revenue Not in the Budget 460 (5,570) (3) 1 — (5,112)
Total Components of Net Cost of Operations that Will Require or Generate Resources in Future Periods
95,760 (6,472) 288 1 — 89,577
Components Not Requiring or Generating Resources
Other (29) 9 — 5 (5) (20)
Total Components of Net Cost of Operations that Do Not Require or Generate Resources
(29) 9 — 5 (5) (20)
Total Components of Net Cost of Operations that Do Not Require or Generate Resources in the Current Period
$95,731 ($6,463) $288 $6 $(5) $89,557
NET COST OF OPERATIONS $112,792 $825 ($889) $118 $146 $112,992

OPM Fiscal Year 2013 Agency Financial Report
Section 2 — FY 2013 Financial inFormation
72
FY 2012($ in millions)
RetirementProgram
HealthBenefitsProgram
LifeInsuranceProgram
RevolvingFund
Programs
Salariesand
Expenses
Total2012
RESOURCES USED TO FINANCE ACTIVITIES
Budgetary Resources Obligated:
Obligations Incurred $107,529 $53,489 $2,764 $2,145 $381 $166,308
Less: Spending Authority from Offsetting Collections and Recoveries
— 44,736 4,260 2,137 295 51,428
Less: Appropriated Trust Fund Receipts 96,780 1,640 — — — 98,420
Obligations Net of Offsetting Collections and Recoveries
10,749 7,113 (1,496) 8 86 16,460
Less: Offsetting Receipts 33,080 1,640 — 10 — 34,730
Net Obligations ($22,331) $5,473 ($1,496) ($2) $86 ($18,270)
Other Resources — — — 25 16 41
Total Resources Used to Finance/Generated from Activities
($22,331) $5,473 ($1,496) $23 $102 ($18,229)
RESOURCES USED TO FINANCE ITEMS NOT PART OF NET COST OF OPERATIONS
Transfer-In from General Fund $33,023 — — — — $33,023
Other 57 $1,533 (140) (9) (8) 1,433
Total Resources Used to Finance Items Not Part of the Net Cost of Operations
33,080 1,533 (140) (9) (8) 34,456
Total Resources Used to Finance/Generated From the Net Cost of Operations
$10,749 $7,006 ($1,636) $14 $94 $16,227
COMPONENTS OF NET COST OF OPERATIONS THAT DO NOT REQUIRE OR GENERATE RESOURCES IN THE CURRENT PERIOD
Components Requiring or Generating Resources in Future Periods:
Increase in Actuarial Liabilities $145,600 ($13,007) $2,660 — — $135,253
Exchange Revenue Not in the Budget 1,582 (11,104) 14 1 — (9,507)
Total Components of Net Cost of Operations that Will Require or Generate Resources in Future Periods
147,182 (24,111) 2,674 1 — 125,746
Components Not Requiring or Generating Resources
Other (24) 28 — (13) 20 11
Total Components of Net Cost of Operations that Do Not Require or Generate Resources
(24) 28 — (13) 20 11
Total Components of Net Cost of Operations that Do Not Require or Generate Resources in the Current Period
$147,158 ($24,083) $2,674 ($12) $20 $125,757
NET COST OF OPERATIONS $157,907 ($17,077) $1,038 $2 $114 $141,984
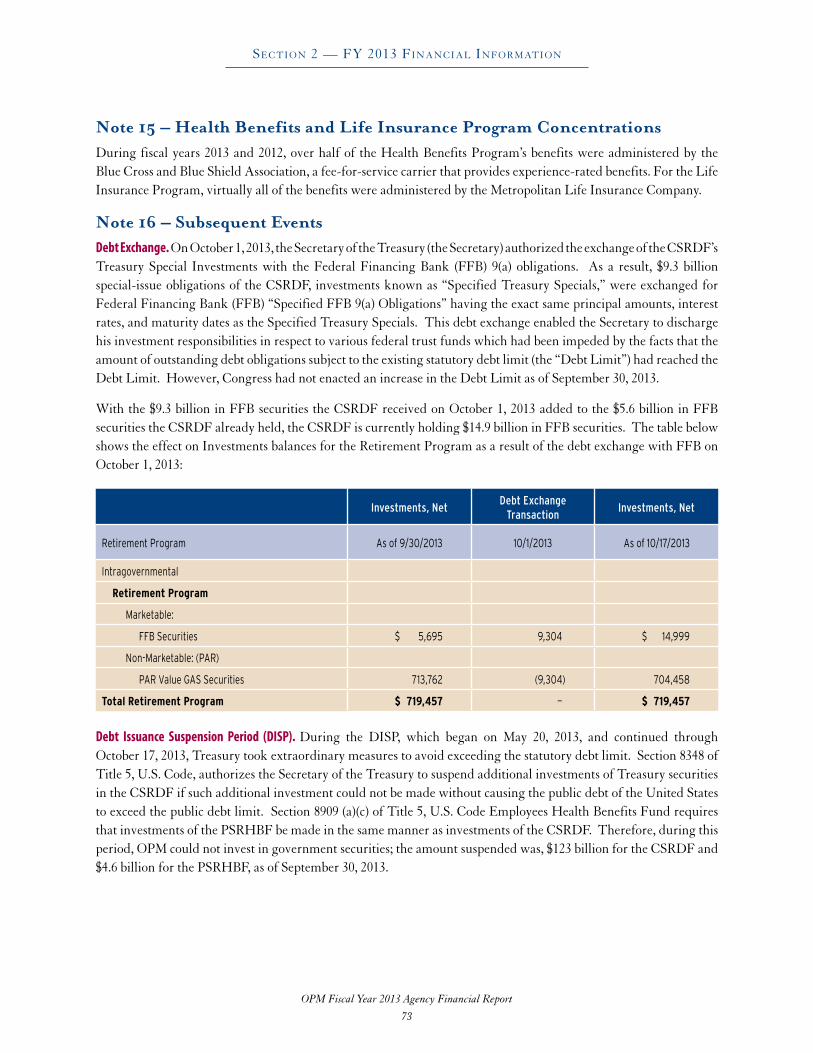
OPM Fiscal Year 2013 Agency Financial Report
Section 2 — FY 2013 Financial inFormation
73
Note 15 – Health Benefits and Life Insurance Program ConcentrationsDuring fiscal years 2013 and 2012, over half of the Health Benefits Program’s benefits were administered by the Blue Cross and Blue Shield Association, a fee-for-service carrier that provides experience-rated benefits . For the Life Insurance Program, virtually all of the benefits were administered by the Metropolitan Life Insurance Company .
Note 16 – Subsequent EventsDebt Exchange. On October 1, 2013, the Secretary of the Treasury (the Secretary) authorized the exchange of the CSRDF’s Treasury Special Investments with the Federal Financing Bank (FFB) 9(a) obligations . As a result, $9 .3 billion special-issue obligations of the CSRDF, investments known as “Specified Treasury Specials,” were exchanged for Federal Financing Bank (FFB) “Specified FFB 9(a) Obligations” having the exact same principal amounts, interest rates, and maturity dates as the Specified Treasury Specials . This debt exchange enabled the Secretary to discharge his investment responsibilities in respect to various federal trust funds which had been impeded by the facts that the amount of outstanding debt obligations subject to the existing statutory debt limit (the “Debt Limit”) had reached the Debt Limit . However, Congress had not enacted an increase in the Debt Limit as of September 30, 2013 .
With the $9 .3 billion in FFB securities the CSRDF received on October 1, 2013 added to the $5 .6 billion in FFB securities the CSRDF already held, the CSRDF is currently holding $14 .9 billion in FFB securities . The table below shows the effect on Investments balances for the Retirement Program as a result of the debt exchange with FFB on October 1, 2013:
Investments, NetDebt Exchange
TransactionInvestments, Net
Retirement Program As of 9/30/2013 10/1/2013 As of 10/17/2013
Intragovernmental
Retirement Program
Marketable:
FFB Securities $ 5,695 9,304 $ 14,999
Non-Marketable: (PAR)
PAR Value GAS Securities 713,762 (9,304) 704,458
Total Retirement Program $ 719,457 — $ 719,457
Debt Issuance Suspension Period (DISP). During the DISP, which began on May 20, 2013, and continued through October 17, 2013, Treasury took extraordinary measures to avoid exceeding the statutory debt limit . Section 8348 of Title 5, U .S . Code, authorizes the Secretary of the Treasury to suspend additional investments of Treasury securities in the CSRDF if such additional investment could not be made without causing the public debt of the United States to exceed the public debt limit . Section 8909 (a)(c) of Title 5, U .S . Code Employees Health Benefits Fund requires that investments of the PSRHBF be made in the same manner as investments of the CSRDF . Therefore, during this period, OPM could not invest in government securities; the amount suspended was, $123 billion for the CSRDF and $4 .6 billion for the PSRHBF, as of September 30, 2013 .
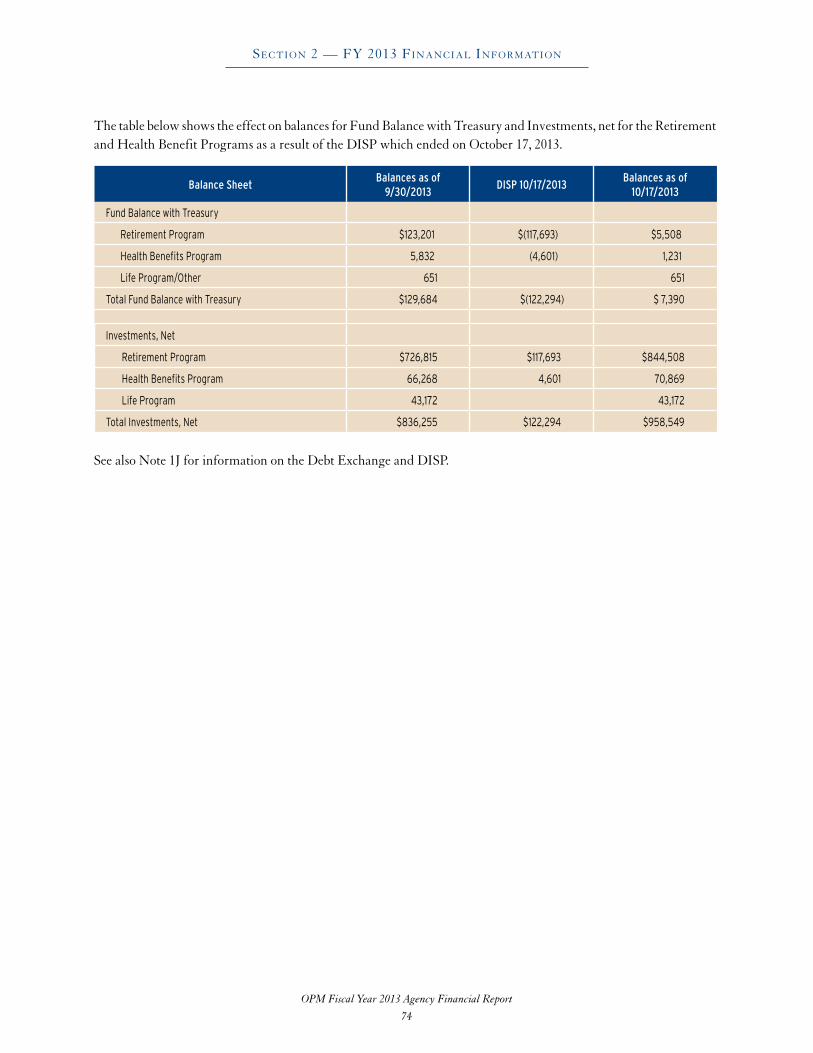
OPM Fiscal Year 2013 Agency Financial Report
Section 2 — FY 2013 Financial inFormation
74
The table below shows the effect on balances for Fund Balance with Treasury and Investments, net for the Retirement and Health Benefit Programs as a result of the DISP which ended on October 17, 2013 .
Balance SheetBalances as of
9/30/2013DISP 10/17/2013
Balances as of 10/17/2013
Fund Balance with Treasury
Retirement Program $123,201 $(117,693) $5,508
Health Benefits Program 5,832 (4,601) 1,231
Life Program/Other 651 651
Total Fund Balance with Treasury $129,684 $(122,294) $ 7,390
Investments, Net
Retirement Program $726,815 $117,693 $844,508
Health Benefits Program 66,268 4,601 70,869
Life Program 43,172 43,172
Total Investments, Net $836,255 $122,294 $958,549
See also Note 1J for information on the Debt Exchange and DISP .
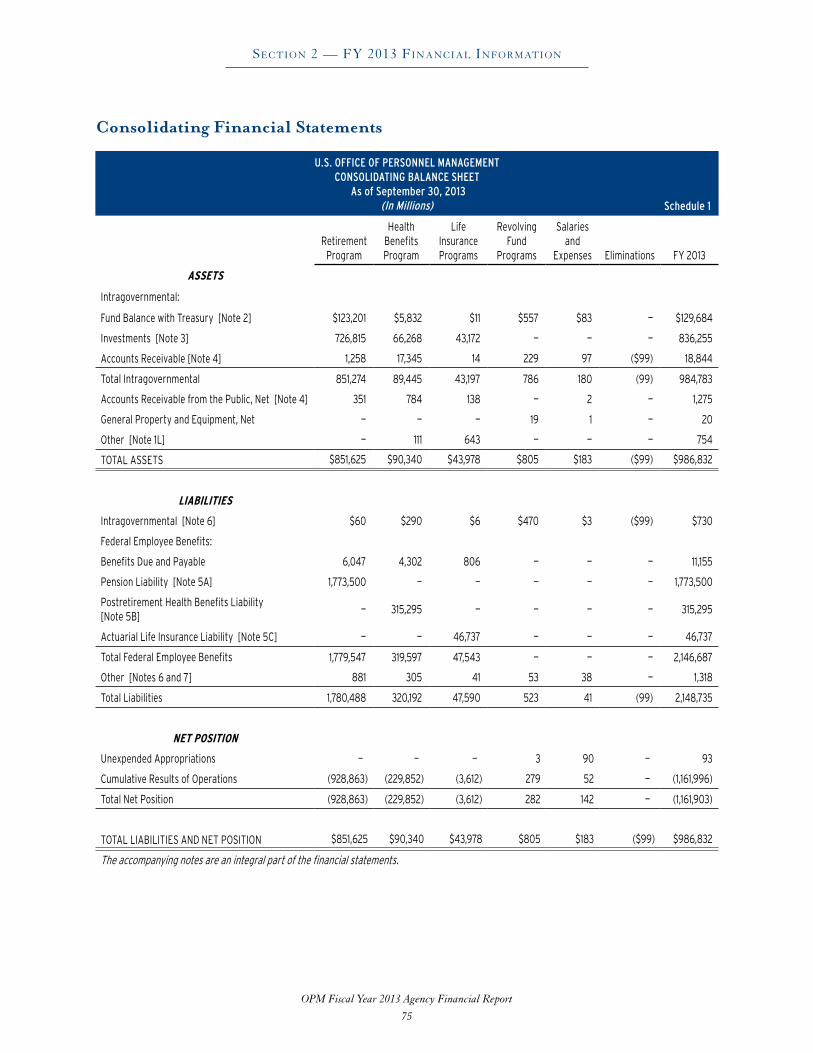
OPM Fiscal Year 2013 Agency Financial Report
Section 2 — FY 2013 Financial inFormation
75
Consolidating Financial Statements
U.S. OFFICE OF PERSONNEL MANAGEMENT CONSOLIDATING BALANCE SHEET
As of September 30, 2013(In Millions) Schedule 1
RetirementProgram
HealthBenefitsProgram
LifeInsurancePrograms
RevolvingFund
Programs
Salariesand
Expenses Eliminations FY 2013
ASSETS
Intragovernmental:
Fund Balance with Treasury [Note 2] $123,201 $5,832 $11 $557 $83 — $129,684
Investments [Note 3] 726,815 66,268 43,172 — — — 836,255
Accounts Receivable [Note 4] 1,258 17,345 14 229 97 ($99) 18,844
Total Intragovernmental 851,274 89,445 43,197 786 180 (99) 984,783
Accounts Receivable from the Public, Net [Note 4] 351 784 138 — 2 — 1,275
General Property and Equipment, Net — — — 19 1 — 20
Other [Note 1L] — 111 643 — — — 754
TOTAL ASSETS $851,625 $90,340 $43,978 $805 $183 ($99) $986,832
LIABILITIES
Intragovernmental [Note 6] $60 $290 $6 $470 $3 ($99) $730
Federal Employee Benefits:
Benefits Due and Payable 6,047 4,302 806 — — — 11,155
Pension Liability [Note 5A] 1,773,500 — — — — — 1,773,500
Postretirement Health Benefits Liability [Note 5B]
— 315,295 — — — — 315,295
Actuarial Life Insurance Liability [Note 5C] — — 46,737 — — — 46,737
Total Federal Employee Benefits 1,779,547 319,597 47,543 — — — 2,146,687
Other [Notes 6 and 7] 881 305 41 53 38 — 1,318
Total Liabilities 1,780,488 320,192 47,590 523 41 (99) 2,148,735
NET POSITION
Unexpended Appropriations — — — 3 90 — 93
Cumulative Results of Operations (928,863) (229,852) (3,612) 279 52 — (1,161,996)
Total Net Position (928,863) (229,852) (3,612) 282 142 — (1,161,903)
TOTAL LIABILITIES AND NET POSITION $851,625 $90,340 $43,978 $805 $183 ($99) $986,832
The accompanying notes are an integral part of the financial statements.

OPM Fiscal Year 2013 Agency Financial Report
Section 2 — FY 2013 Financial inFormation
76
U.S. OFFICE OF PERSONNEL MANAGEMENT CONSOLIDATING BALANCE SHEET
As of September 30, 2012(In Millions) Schedule 1
RetirementProgram
HealthBenefitsProgram
LifeInsurancePrograms
RevolvingFund
Programs
Salariesand
Expenses Eliminations FY 2012
ASSETS
Intragovernmental:
Fund Balance with Treasury [Note 2] $13 $1,201 $11 $728 $97 — $2,050
Investments [Note 3] 834,612 67,252 41,946 — — — 943,810
Accounts Receivable [Note 4] 1,001 11,860 16 127 118 ($119) 13,003
Total Intragovernmental 835,626 80,313 41,973 855 215 (119) 958,863
Accounts Receivable from the Public, Net [Note 4] 347 843 146 — 4 — 1,340
General Property and Equipment, Net — — — 31 2 — 33
Other [Note 1L] — 71 650 — — — 721
TOTAL ASSETS $835,973 $81,227 $42,769 $886 $221 ($119) $960,957
LIABILITIES
Intragovernmental [Note 6] $91 $283 $4 $448 $3 ($119) $710
Federal Employee Benefits:
Benefits Due and Payable 5,895 4,410 774 — — — 11,079
Pension Liability [Note 5A] 1,678,200 — — — — — 1,678,200
Postretirement Health Benefits Liability[Note 5B] — 316,197 — — — — 316,197
Actuarial Life Insurance Liability [Note 5C] — — 46,446 — — — 46,446
Total Federal Employee Benefits 1,684,095 320,607 47,220 — — — 2,051,922
Other [Notes 6 and 7] 845 328 92 59 33 — 1,357
Total Liabilities 1,685,031 321,218 47,316 507 36 (119) 2,053,989
NET POSITION
Unexpended Appropriations — — — 3 134 — 137
Cumulative Results of Operations (849,058) (239,991) (4,547) 376 51 — (1,093,169)
Total Net Position (849,058) (239,991) (4,547) 379 185 — (1,093,032)
TOTAL LIABILITIES AND NET POSITION $835,973 $81,227 $42,769 $886 $221 ($119) $960,957
The accompanying notes are an integral part of the financial statements.

OPM Fiscal Year 2013 Agency Financial Report
Section 2 — FY 2013 Financial inFormation
77
U.S. OFFICE OF PERSONNEL MANAGEMENT CONSOLIDATING STATEMENT OF NET COSTFor the Year Ended September 30, 2013
(In Millions) Schedule 2
Retirement ProgramsHealth
BenefitsProgram
LifeInsuranceProgram
RevolvingFund
Programs
Salariesand
Expenses Eliminations FY 2013CSRS FERS Total
GROSS COSTS
Intragovernmental — — — — — $241 $256 ($371) $126
With the Public:
Pension Expense [Note 5A] $45,914 $44,437 $90,351 — — — — — 90,351
Postretirement Health Benefits [Note 5B] — — — $11,754 — — — — 11,754
Future Life Insurance Benefits [Note 5C] — — — — $1,149 — — — 1,149
Current Benefits and Premiums — — — 29,097 2,802 — — — 31,899
Other — — — 1,251 17 1,564 181 — 3,013
Total Gross Costs with the Public 45,914 44,437 90,351 42,102 3,968 1,564 181 — 138,166
Total Gross Costs [Notes 8 and 9] 45,914 44,437 90,351 42,102 3,968 1,805 437 (371) 138,292
EARNED REVENUE
Intragovernmental:
Employer Contributions 1,184 23,399 24,583 26,924 495 — — — 52,002
Earnings on Investments 14,005 17,379 31,384 1,718 821 — — — 33,923
Other 218 256 474 20 - 1,686 291 (371) 2,100
Total Intragovernmental Earned Revenue 15,407 41,034 56,441 28,662 1,316 1,686 291 (371) 88,025
With the Public:
Participant Contributions 1,496 1,638 3,134 13,333 2,680 — — — 19,147
Other — — — 4 3 1 — — 8
Total Earned Revenue with the Public 1,496 1,638 3,134 13,337 2,683 1 — — 19,155
Total Earned Revenue [Notes 8 and 9] 16,903 42,672 59,575 41,999 3,999 1,687 291 (371) 107,180
Net Cost 29,011 1,765 30,776 103 (31) 118 146 — 31,112
(Gain)/Loss on Pension, ORB, or OPEB Assumption Changes [Note 5A, 5B, and 5C] 39,707 42,309 82,016 722 (858) — — — 81,880
Net Cost of Operations [Notes 8 and 9] $68,718 $44,074 $112,792 $825 ($889) $118 $146 — $112,992
The accompanying notes are an integral part of the financial statements.
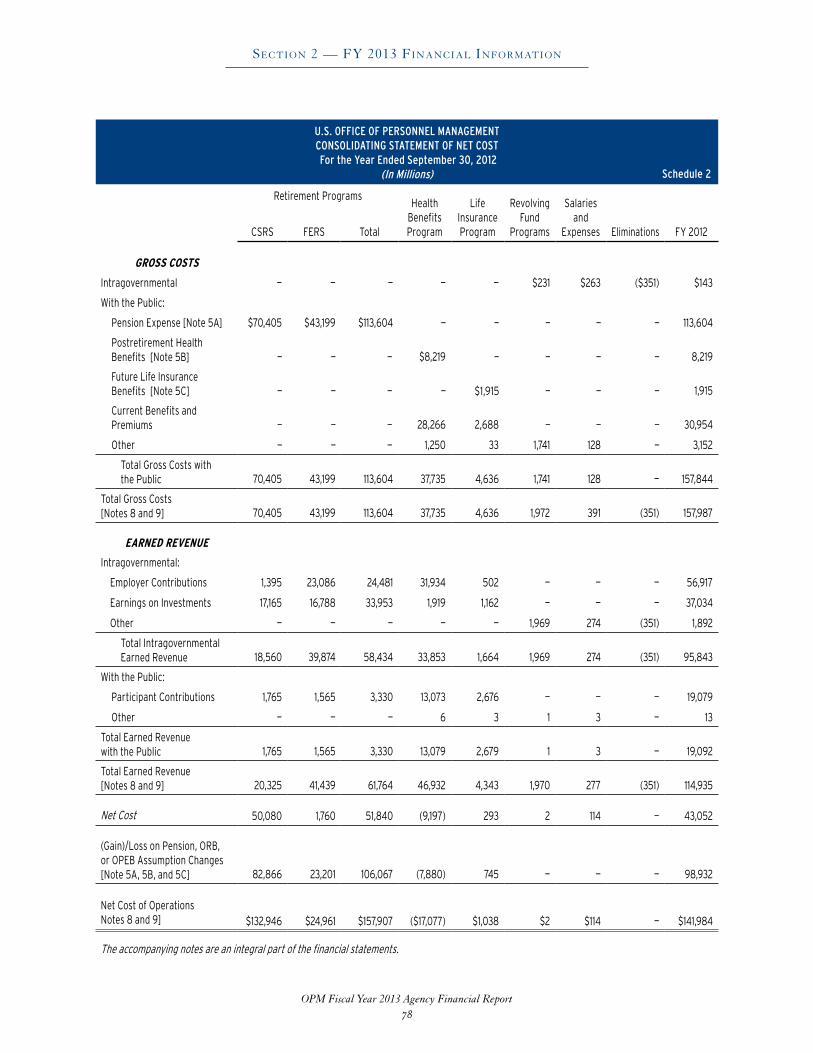
OPM Fiscal Year 2013 Agency Financial Report
Section 2 — FY 2013 Financial inFormation
78
U.S. OFFICE OF PERSONNEL MANAGEMENT CONSOLIDATING STATEMENT OF NET COST For the Year Ended September 30, 2012
(In Millions)
Retirement ProgramsHealth
BenefitsProgram
LifeInsuranceProgram
RevolvingFund
Programs
Salariesand
Expenses Eliminations FY 2012CSRS FERS Total
GROSS COSTS
Intragovernmental — — — — — $231 $263 ($351) $143
With the Public:
Pension Expense [Note 5A] $70,405 $43,199 $113,604 — — — — — 113,604
Postretirement Health Benefits [Note 5B] — — — $8,219 — — — — 8,219
Future Life Insurance Benefits [Note 5C] — — — — $1,915 — — — 1,915
Current Benefits and Premiums — — — 28,266 2,688 — — — 30,954
Other — — — 1,250 33 1,741 128 — 3,152
Total Gross Costs with the Public 70,405 43,199 113,604 37,735 4,636 1,741 128 — 157,844
Total Gross Costs [Notes 8 and 9] 70,405 43,199 113,604 37,735 4,636 1,972 391 (351) 157,987
EARNED REVENUE
Intragovernmental:
Employer Contributions 1,395 23,086 24,481 31,934 502 — — — 56,917
Earnings on Investments 17,165 16,788 33,953 1,919 1,162 — — — 37,034
Other — — — — — 1,969 274 (351) 1,892
Total Intragovernmental Earned Revenue 18,560 39,874 58,434 33,853 1,664 1,969 274 (351) 95,843
With the Public:
Participant Contributions 1,765 1,565 3,330 13,073 2,676 — — — 19,079
Other — — — 6 3 1 3 — 13
Total Earned Revenue with the Public 1,765 1,565 3,330 13,079 2,679 1 3 — 19,092
Total Earned Revenue [Notes 8 and 9] 20,325 41,439 61,764 46,932 4,343 1,970 277 (351) 114,935
Net Cost 50,080 1,760 51,840 (9,197) 293 2 114 — 43,052
(Gain)/Loss on Pension, ORB, or OPEB Assumption Changes [Note 5A, 5B, and 5C] 82,866 23,201
106,067 (7,880) 745 — — — 98,932
Net Cost of Operations Notes 8 and 9] $132,946 $24,961 $157,907 ($17,077) $1,038 $2 $114 — $141,984
The accompanying notes are an integral part of the financial statements.
Schedule 2

OPM Fiscal Year 2013 Agency Financial Report
Section 2 — FY 2013 Financial inFormation
79
U.S. OFFICE OF PERSONNEL MANAGEMENT CONSOLIDATING STATEMENT OF CHANGES IN NET POSITION
For the Year Ended September 30, 2013(In Millions) Schedule 3
RetirementProgram
Health BenefitsProgram
LifeInsuranceProgram
Revolving Fund
Programs
Salariesand
Expenses FY 2013
CUMULATIVE RESULTS OF OPERATIONS
Beginning Balance ($849,058) ($239,991) ($4,547) $376 $51 ($1,093,169)
Budgetary Financing Sources:
Appropriations Used 32,995 10,964 46 - 132 44,137
Other Financing Sources (8) - - 21 15 28
Total Financing Sources 32,987 10,964 46 21 147 44,165
Net Cost of Operations 112,792 825 (889) 118 146 112,992
Net Change (79,805) 10,139 935 (97) 1 (68,827)
Cumulative Results of Operations - Ending Balance ($928,863) ($229,852) ($3,612) $279 $52 ($1,161,996)
UNEXPENDED APPROPRIATIONS
Beginning Balance — — — $3 $134 $137
Budgetary Financing Sources:
Appropriations Received 32,995 $11,027 $47 — 101 44,170
Appropriations Used (32,995) (10,964) (46) — (132) (44,137)
Other Budgetary Financing Sources — (63) (1) — (13) (77)
Total Budgetary Financing Sources — — — — (44) (44)
Total Unexpended Appropriations - Ending Balance — — — 3 90 93
NET POSITION ($928,863) ($229,852) ($3,612) $282 $142 ($1,161,903)
The accompanying notes are an integral part of the financial statements.
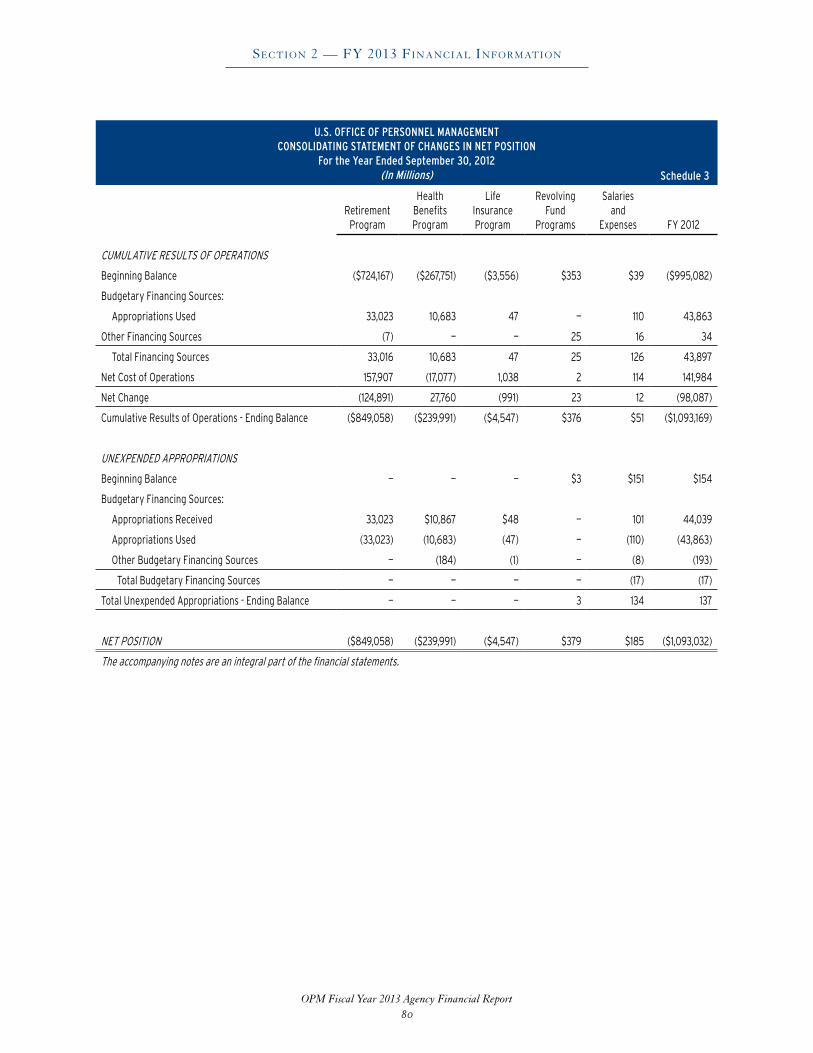
OPM Fiscal Year 2013 Agency Financial Report
Section 2 — FY 2013 Financial inFormation
80
U.S. OFFICE OF PERSONNEL MANAGEMENT CONSOLIDATING STATEMENT OF CHANGES IN NET POSITION
For the Year Ended September 30, 2012(In Millions) Schedule 3
RetirementProgram
Health BenefitsProgram
LifeInsuranceProgram
Revolving Fund
Programs
Salariesand
Expenses FY 2012
CUMULATIVE RESULTS OF OPERATIONS
Beginning Balance ($724,167) ($267,751) ($3,556) $353 $39 ($995,082)
Budgetary Financing Sources:
Appropriations Used 33,023 10,683 47 — 110 43,863
Other Financing Sources (7) — — 25 16 34
Total Financing Sources 33,016 10,683 47 25 126 43,897
Net Cost of Operations 157,907 (17,077) 1,038 2 114 141,984
Net Change (124,891) 27,760 (991) 23 12 (98,087)
Cumulative Results of Operations - Ending Balance ($849,058) ($239,991) ($4,547) $376 $51 ($1,093,169)
UNEXPENDED APPROPRIATIONS
Beginning Balance — — — $3 $151 $154
Budgetary Financing Sources:
Appropriations Received 33,023 $10,867 $48 — 101 44,039
Appropriations Used (33,023) (10,683) (47) — (110) (43,863)
Other Budgetary Financing Sources — (184) (1) — (8) (193)
Total Budgetary Financing Sources — — — — (17) (17)
Total Unexpended Appropriations - Ending Balance — — — 3 134 137
NET POSITION ($849,058) ($239,991) ($4,547) $379 $185 ($1,093,032)
The accompanying notes are an integral part of the financial statements.
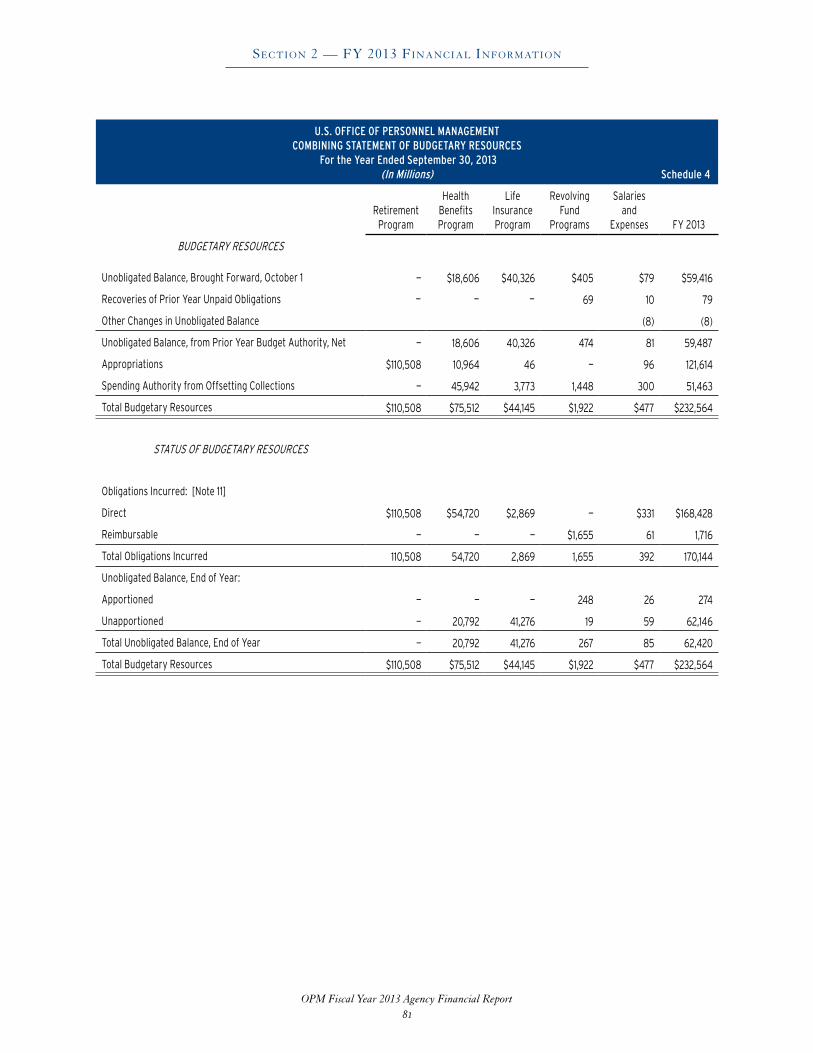
OPM Fiscal Year 2013 Agency Financial Report
Section 2 — FY 2013 Financial inFormation
81
U.S. OFFICE OF PERSONNEL MANAGEMENT COMBINING STATEMENT OF BUDGETARY RESOURCES
For the Year Ended September 30, 2013 (In Millions) Schedule 4
RetirementProgram
HealthBenefitsProgram
LifeInsuranceProgram
RevolvingFund
Programs
Salariesand
Expenses FY 2013
BUDGETARY RESOURCES
Unobligated Balance, Brought Forward, October 1 — $18,606 $40,326 $405 $79 $59,416
Recoveries of Prior Year Unpaid Obligations — — — 69 10 79
Other Changes in Unobligated Balance (8) (8)
Unobligated Balance, from Prior Year Budget Authority, Net — 18,606 40,326 474 81 59,487
Appropriations $110,508 10,964 46 — 96 121,614
Spending Authority from Offsetting Collections — 45,942 3,773 1,448 300 51,463
Total Budgetary Resources $110,508 $75,512 $44,145 $1,922 $477 $232,564
STATUS OF BUDGETARY RESOURCES
Obligations Incurred: [Note 11]
Direct $110,508 $54,720 $2,869 — $331 $168,428
Reimbursable — — — $1,655 61 1,716
Total Obligations Incurred 110,508 54,720 2,869 1,655 392 170,144
Unobligated Balance, End of Year:
Apportioned — — — 248 26 274
Unapportioned — 20,792 41,276 19 59 62,146
Total Unobligated Balance, End of Year — 20,792 41,276 267 85 62,420
Total Budgetary Resources $110,508 $75,512 $44,145 $1,922 $477 $232,564

OPM Fiscal Year 2013 Agency Financial Report
Section 2 — FY 2013 Financial inFormation
82
U.S. OFFICE OF PERSONNEL MANAGEMENT COMBINING STATEMENT OF BUDGETARY RESOURCES
For the Year Ended September 30, 2013 (In Millions) Schedule 4
RetirementProgram
HealthBenefitsProgram
LifeInsuranceProgram
RevolvingFund
Programs
Salariesand
Expenses FY 2013
CHANGE IN OBLIGATED BALANCE
Unpaid Obligations:
Unpaid Obligations, Brought Forward, October 1 $6,817 $5,724 $865 $1,130 $143 $14,679
Obligations Incurred 110,508 54,720 2,869 1,655 392 170,144
Less: Outlays, Gross 110,352 54,802 2,875 1,790 425 170,244
Less: Recoveries of Prior Year Unpaid Obligations — — — 69 10 79
Unpaid Obligations, End of Year $6,973 $5,642 $859 $926 $100 $14,500
Uncollected Payments:
Uncollected Payments, Federal Sources,
Brought Forward, October 1 — $1,927 $380 $807 $125 $3,239
Change in Uncollected Payments, Federal Sources — (106) 28 (171) (23) (272)
Uncollected Payments, Federal Sources, End of Year — $1,821 $408 $636 $102 $2,967
Memorandum (Non-add) Entries:
Obligated Balance, Start of Year $6,817 $3,797 $485 $323 $18 $11,440
Obligated Balance, End of Year $6,973 $3,821 $451 $290 ($2) $11,533
BUDGET AUTHORITY AND OUTLAYS, NET
Budget Authority, Gross $110,508 $56,906 $3,819 $1,448 $396 $173,077
Less: Actual Offsetting Collections — 46,050 3,745 1,619 323 51,737
Less: Change in Uncollected Customer Payments
from Federal Sources — (106) 28 (171) (23) (272)
Budget Authority, Net $110,508 $10,962 $46 — $96 $121,612
Outlays, Gross $110,352 $54,802 $2,875 $1,790 $425 $170,244
Less: Actual Offsetting Collections — 46,050 3,745 1,619 323 51,737
Outlays, Net 110,352 8,752 (870) 171 102 118,507
Less: Distributed Offsetting Receipts 33,051 1,578 — 10 — 34,639
Agency Outlays, Net $77,301 $7,174 ($870) $161 $102 $83,868
The accompanying notes are an integral part of the financial statements.
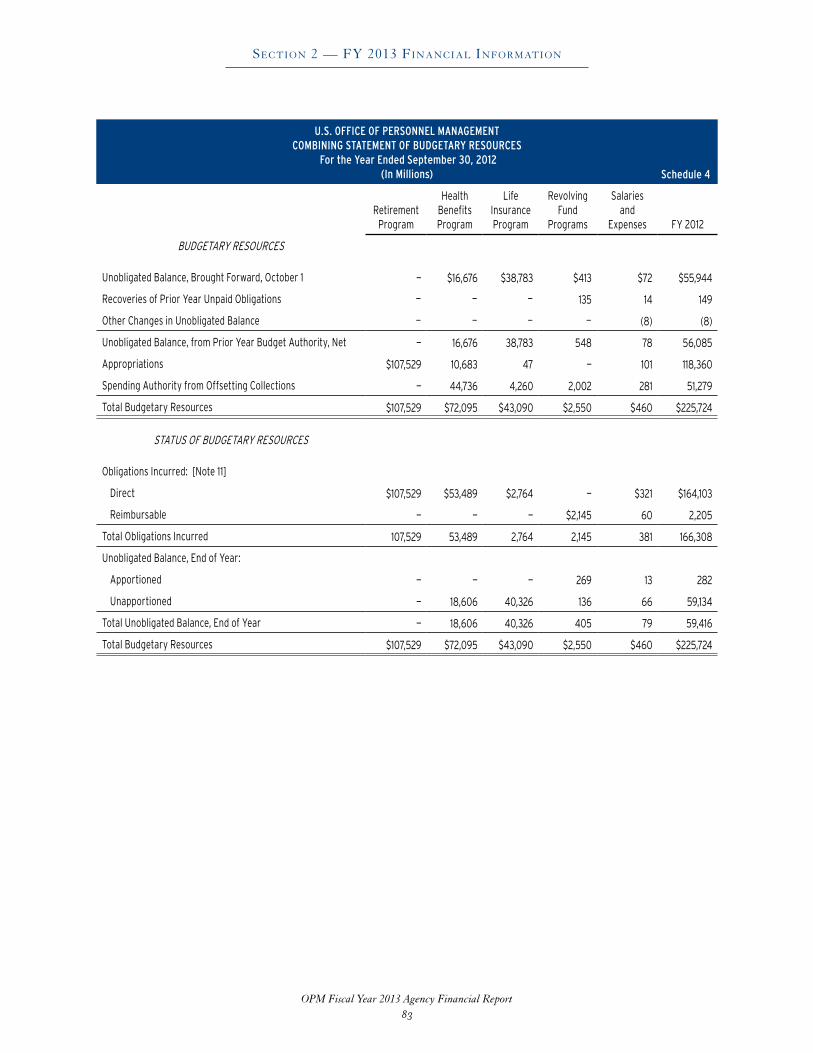
OPM Fiscal Year 2013 Agency Financial Report
Section 2 — FY 2013 Financial inFormation
83
U.S. OFFICE OF PERSONNEL MANAGEMENT COMBINING STATEMENT OF BUDGETARY RESOURCES
For the Year Ended September 30, 2012 (In Millions) Schedule 4
RetirementProgram
HealthBenefitsProgram
LifeInsuranceProgram
RevolvingFund
Programs
Salariesand
Expenses FY 2012
BUDGETARY RESOURCES
Unobligated Balance, Brought Forward, October 1 — $16,676 $38,783 $413 $72 $55,944
Recoveries of Prior Year Unpaid Obligations — — — 135 14 149
Other Changes in Unobligated Balance — — — — (8) (8)
Unobligated Balance, from Prior Year Budget Authority, Net — 16,676 38,783 548 78 56,085
Appropriations $107,529 10,683 47 — 101 118,360
Spending Authority from Offsetting Collections — 44,736 4,260 2,002 281 51,279
Total Budgetary Resources $107,529 $72,095 $43,090 $2,550 $460 $225,724
STATUS OF BUDGETARY RESOURCES
Obligations Incurred: [Note 11]
Direct $107,529 $53,489 $2,764 — $321 $164,103
Reimbursable — — — $2,145 60 2,205
Total Obligations Incurred 107,529 53,489 2,764 2,145 381 166,308
Unobligated Balance, End of Year:
Apportioned — — — 269 13 282
Unapportioned — 18,606 40,326 136 66 59,134
Total Unobligated Balance, End of Year — 18,606 40,326 405 79 59,416
Total Budgetary Resources $107,529 $72,095 $43,090 $2,550 $460 $225,724
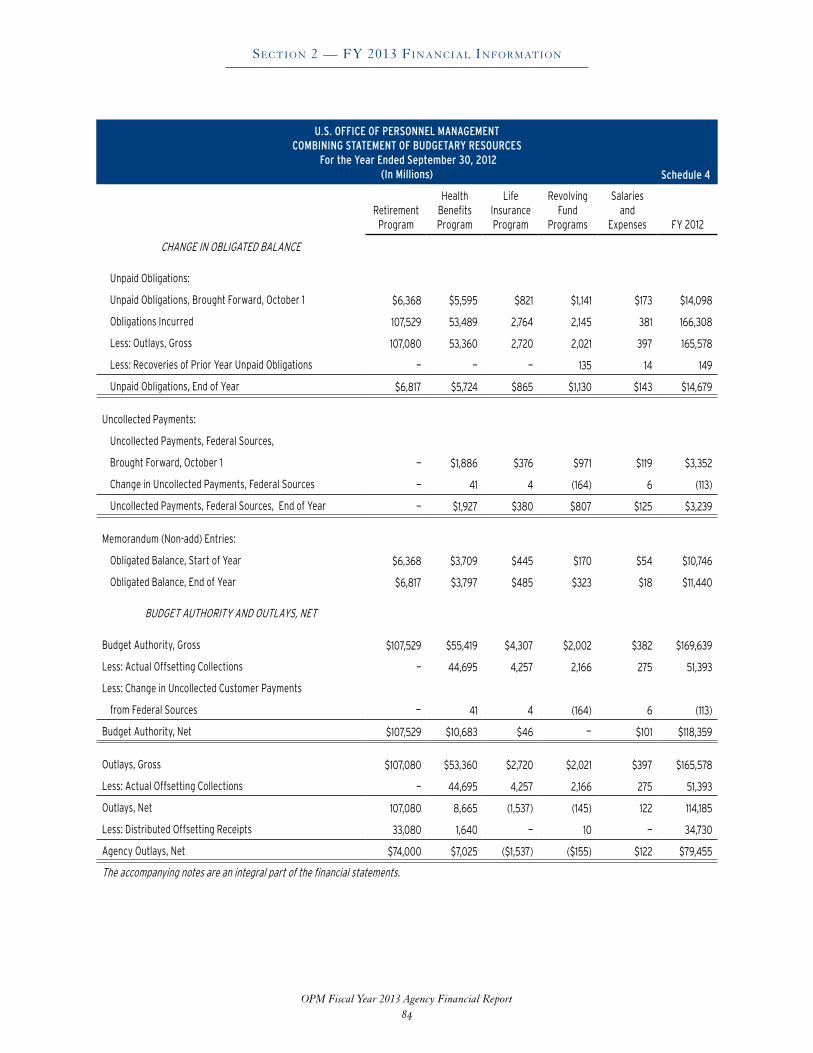
OPM Fiscal Year 2013 Agency Financial Report
Section 2 — FY 2013 Financial inFormation
84
U.S. OFFICE OF PERSONNEL MANAGEMENT COMBINING STATEMENT OF BUDGETARY RESOURCES
For the Year Ended September 30, 2012 (In Millions) Schedule 4
RetirementProgram
HealthBenefitsProgram
LifeInsuranceProgram
RevolvingFund
Programs
Salariesand
Expenses FY 2012
CHANGE IN OBLIGATED BALANCE
Unpaid Obligations:
Unpaid Obligations, Brought Forward, October 1 $6,368 $5,595 $821 $1,141 $173 $14,098
Obligations Incurred 107,529 53,489 2,764 2,145 381 166,308
Less: Outlays, Gross 107,080 53,360 2,720 2,021 397 165,578
Less: Recoveries of Prior Year Unpaid Obligations — — — 135 14 149
Unpaid Obligations, End of Year $6,817 $5,724 $865 $1,130 $143 $14,679
Uncollected Payments:
Uncollected Payments, Federal Sources,
Brought Forward, October 1 — $1,886 $376 $971 $119 $3,352
Change in Uncollected Payments, Federal Sources — 41 4 (164) 6 (113)
Uncollected Payments, Federal Sources, End of Year — $1,927 $380 $807 $125 $3,239
Memorandum (Non-add) Entries:
Obligated Balance, Start of Year $6,368 $3,709 $445 $170 $54 $10,746
Obligated Balance, End of Year $6,817 $3,797 $485 $323 $18 $11,440
BUDGET AUTHORITY AND OUTLAYS, NET
Budget Authority, Gross $107,529 $55,419 $4,307 $2,002 $382 $169,639
Less: Actual Offsetting Collections — 44,695 4,257 2,166 275 51,393
Less: Change in Uncollected Customer Payments
from Federal Sources — 41 4 (164) 6 (113)
Budget Authority, Net $107,529 $10,683 $46 — $101 $118,359
Outlays, Gross $107,080 $53,360 $2,720 $2,021 $397 $165,578
Less: Actual Offsetting Collections — 44,695 4,257 2,166 275 51,393
Outlays, Net 107,080 8,665 (1,537) (145) 122 114,185
Less: Distributed Offsetting Receipts 33,080 1,640 — 10 — 34,730
Agency Outlays, Net $74,000 $7,025 ($1,537) ($155) $122 $79,455
The accompanying notes are an integral part of the financial statements.

OPM Fiscal Year 2013 Agency Financial Report
Section 2 — FY 2013 Financial inFormation
85
Required Supplementary Information
U.S. OFFICE OF PERSONNEL MANAGEMENT SCHEDULE OF BUDGETARY RESOURCES BY MAJOR BUDGETARY ACCOUNT (Unaudited)
For the Year Ended September 30, 2013(In Millions)
CSRDF HBF LIF RF S&E Feeder FY 2013
BUDGETARY RESOURCES
Unobligated Balance, Brought Forward, October 1 — $18,606 $40,326 $405 $79 — $59,416
Recoveries of Prior Year Unpaid Obligations — — — 69 10 — 79
Other Changes in Unobligated Balance — — — (8) — (8)
Unobligated Balance, from Prior Year Budget Authority, Net — 18,606 40,326 474 81 — 59,487
Appropriations $77,513 — — — 96 $44,005 121,614
Spending Authority from Offsetting Collections —
45,942 3,773 1,448 300 — 51,463
Total Budgetary Resources $77,513 $64,548 $44,099 $1,922 $477 $44,005 $232,564
STATUS OF BUDGETARY RESOURCES
Obligations Incurred: [Note 11]
Direct $77,513 $43,756 $2,823 — $331 $44,005 $168,428
Reimbursable — — — $1,655 61 — 1,716
Total Obligations Incurred 77,513 43,756 2,823 1,655 392 44,005 170,144
Unobligated Balance, End of Year:
Apportioned — — — 248 26 — 274
Unapportioned — 20,792 41,276 19 59 — 62,146
Total Unobligated Balance, End of Year—
20,792
41,276 267 85 —
62,420
Total Budgetary Resources $77,513 $64,548 $44,099 $1,922 $477 $44,005 $232,564
LEGEND:
CSRDF Civil Service Retirement and Disability Fund RF Revolving Fund
HBF Employees Health Benefits Fund S&E Salaries and Expenses Account
LIF Employees Group Life Insurance Fund Feeder Trust Fund Feeder Payment Accounts

OPM Fiscal Year 2013 Agency Financial Report
Section 2 — FY 2013 Financial inFormation
86
U.S. OFFICE OF PERSONNEL MANAGEMENT SCHEDULE OF BUDGETARY RESOURCES BY MAJOR BUDGETARY ACCOUNT (Unaudited)
For the Year Ended September 30, 2013(In Millions)
CSRDF HBF LIF RF S&E Feeder FY 2013
CHANGE IN OBLIGATED BALANCE
Unpaid Obligations:
Unpaid Obligations, Brought Forward, October 1 $6,817 $4,623 $859 $1,130 $143 $1,107 $14,679
Obligations Incurred 77,513 43,756 2,823 1,655 392 44,005 170,144
Less: Outlays, Gross 77,358 43,871 2,828 1,790 425 43,972 170,244
Less: Recoveries of Prior Year Unpaid Obligations — — — 69 10 — 79
Unpaid Obligations, End of Year $6,972 $4,508 $854 $926 $100 $1,140 $14,500
Uncollected Payments:
Uncollected Payments, Federal Sources,
Brought Forward, October 1 — $1,927 $380 $807 $125 — 3,239
Change in Uncollected Payments, Federal Sources — (106) 28 (171) (23) — (272)
Uncollected Payments, Federal Sources, End of Year — $1,821 $408 $636 $102 — $2,967
Memorandum (Non-add) Entries:
Obligated Balance, Start of Year $6,817 $2,696 $479 $323 $18 $1,107 $11,440
Obligated Balance, End of Year $6,972 $2,687 $446 $290 ($2) $1,140 $11,533
BUDGET AUTHORITY AND OUTLAYS, NET
Budget Authority, Gross $77,513 $45,942 $3,773 $1,448 $396 $44,005 $173,077
Less: Actual Offsetting Collections — 46,050 3,745 1,619 323 — 51,737
Less: Change in Uncollected Customer Payments
from Federal Sources — (106) 28 (171) (23) — (272)
Budget Authority, Net $77,513 ($2) — — $96 $44,005 $121,612
Outlays, Gross $77,358 $43,871 $2,828 $1,790 $425 $43,972 $170,244
Less: Actual Offsetting Collections —
46,050 3,745 1,619 323 — 51,737
Outlays, Net 77,358 (2,179) (917) 171 102 43,972 118,507
Less: Distributed Offsetting Receipts 33,051 1,578 — 10 — — 34,639
Agency Outlays, Net $44,307 ($3,757) ($917) $161 $102 $43,972 $83,868
LEGEND:
CSRDF Civil Service Retirement and Disability Fund RF Revolving Fund
HBF Employees Health Benefits Fund S&E Salaries and Expenses Account
LIF Employees Group Life Insurance Fund Feeder Trust Fund Feeder Payment Accounts

OPM Fiscal Year 2013 Agency Financial Report
Section 2 — FY 2013 Financial inFormation
87
Required Supplementary Information
U.S. OFFICE OF PERSONNEL MANAGEMENT SCHEDULE OF BUDGETARY RESOURCES BY MAJOR BUDGETARY ACCOUNT (Unaudited)
For the Year Ended September 30, 2012(In Millions)
CSRDF HBF LIF RF S&E Feeder FY2012
BUDGETARY RESOURCES
Unobligated Balance, Brought Forward, October 1 — $16,676 $38,783 $413 $72 — $55,944
Recoveries of Prior Year Unpaid Obligations — — — 135 14 — 149
Other Changes in Unobligated Balance — — — — (8) — (8)
Unobligated Balance, from Prior Year Budget Authority, Net — 16,676 38,783 548 78 — 56,085
Appropriations $74,506 — — — 101 $43,753 118,360
Spending Authority from Offsetting Collections —
44,736
4,260
2,002 281 — 51,279
Total Budgetary Resources $74,506 $61,412 $43,043 $2,550 $460 $43,753 $225,724
STATUS OF BUDGETARY RESOURCES
Obligations Incurred: [Note 11]
Direct $74,506 $42,806 $2,717 — $321 $43,753 $164,103
Reimbursable — — — $2,145 60 — 2,205
Total Obligations Incurred 74,506 42,806 2,717 2,145 381 43,753 166,308
Unobligated Balance, End of Year:
Apportioned — — — 269 13 — 282
Unapportioned — 18,606 40,326 136 66 — 59,134
Total Unobligated Balance, End of Year —
18,606
40,326 405 79 —
59,416
Total Budgetary Resources $74,506 $61,412 $43,043 $2,550 $460 $43,753 $225,724
LEGEND:
CSRDF Civil Service Retirement and Disability Fund RF Revolving Fund
HBF Employees Health Benefits Fund S&E Salaries and Expenses Account
LIF Employees Group Life Insurance Fund Feeder Trust Fund Feeder Payment Accounts

OPM Fiscal Year 2013 Agency Financial Report
Section 2 — FY 2013 Financial inFormation
88
U.S. OFFICE OF PERSONNEL MANAGEMENT SCHEDULE OF BUDGETARY RESOURCES BY MAJOR BUDGETARY ACCOUNT (Unaudited)
For the Year Ended September 30, 2012(In Millions)
CSRDF HBF LIF RF S&E Feeder FY2012
CHANGE IN OBLIGATED BALANCE
Unpaid Obligations:
Unpaid Obligations, Brought Forward, October 1 $6,368 $4,418 $815 $1,141 $173 $1,183 $14,098
Obligations Incurred 74,506 42,806 2,717 2,145 381 43,753 166,308
Less: Outlays, Gross 74,057 42,601 2,673 2,021 397 43,829 165,578
Less: Recoveries of Prior Year Unpaid Obligations — — — 135 14 — 149
Unpaid Obligations, End of Year $6,817 $4,623 $859 $1,130 $143 $1,107 $14,679
Uncollected Payments:
Uncollected Payments, Federal Sources,
Brought Forward, October 1 — $1,886 $376 $971 $119 — $3,352
Change in Uncollected Payments, Federal Sources — 41 4 (164) 6 — (113)
Uncollected Payments, Federal Sources, End of Year — $1,927 $380 $807 $125 — $3,239
Memorandum (Non-add) Entries:
Obligated Balance, Start of Year $6,368 $2,532 $439 $170 $54 $1,183 $10,746
Obligated Balance, End of Year $6,817 $2,696 $479 $323 $18 $1,107 $11,440
BUDGET AUTHORITY AND OUTLAYS, NET
Budget Authority, Gross $74,506 $44,736 $4,260 $2,002 $382 $43,753 $169,639
Less: Actual Offsetting Collections — 44,695 4,257 2,166 275 — 51,393
Less: Change in Uncollected Customer Payments
from Federal Sources — 41 4 (164) 6 — (113)
Budget Authority, Net $74,506 — ($1) — $101 $43,753 $118,359
Outlays, Gross $74,057 $42,601 $2,673 $2,021 $397 $43,829 $165,578
Less: Actual Offsetting Collections -
44,695
4,257 2,166 275 — 51,393
Outlays, Net 74,057 (2,094) (1,584) (145) 122 43,829 114,185
Less: Distributed Offsetting Receipts 33,080 1,640 — 10 — — 34,730
Agency Outlays, Net $40,977 ($3,734) ($1,584) ($155) $122 $43,829 $79,455
LEGEND:
CSRDF Civil Service Retirement and Disability Fund RF Revolving Fund
HBF Employees Health Benefits Fund S&E Salaries and Expenses Account
LIF Employees Group Life Insurance Fund Feeder Trust Fund Feeder Payment Accounts

OPM Fiscal Year 2013 Agency Financial Report89
Se c t i o n 3 – ot h e r in f o r M at i o n
(Unaudited)
The Schedule of Spending (SOS) presents an overview of how and where Office of Personnel Management is spending its money . The SOS is presented on a budgetary basis, the same as the Combined Statement of Budgetary Resources (SBR) . The amounts shown as “Total Amounts Agreed to be Spent” agree with amounts shown as “Obligations Incurred” on the SBR .
U.S. OFFICE OF PERSONNEL MANAGEMENT SCHEDULE OF SPENDING
For the Year Ended September 30, 2013(In Millions)
RetirementProgram
HealthBenefitsProgram
LifeInsuranceProgram
RevolvingFund
Programs
Salariesand
Expenses
FY2013
What Money is Available to Spend?Total Resources $110,508 $75,512 $44,146 $1,922 $477 $232,565 Less: Amount Available but Not Agreed to be Spent — — — 248 26 274 Less: Amount Not Available to be Spent — 20,792 41,277 19 59 62,147
Total Amount Agreed to be Spent $110,508 $54,720 $2,869 $1,655 $392 $170,144
How was the Money Spent/Issued?Personnel Compensation and Benefits $32,995 $10,931 46 343 $260 $44,575 Contractual Services and Supplies — 43,789 2,823 1,312 127 48,051 Acquisition of Capital Assets — - — — 5 5 Grant and Fixed Charges(Insur. Claims, Indemnities) 77,513 — — — — 77,513
Total Amounts Agreed to be Spent 110,508 54,720 2,869 1,655 392 170,144
Who did the Money go to?Federal $33,125 $11,019 $53 $215 36 $44,448 Non-Federal 77,383 43,701 2,816 1,440 356 125,696
Total Amount Agreed to be Spent 110,508 54,720 2,869 1,655 392 170,144
U.S. OFFICE OF PERSONNEL MANAGEMENT SCHEDULE OF SPENDING
For the Year Ended September 30, 2012(In Millions)
RetirementProgram
HealthBenefitsProgram
LifeInsuranceProgram
RevolvingFund
Programs
Salariesand
Expenses
FY2012
What Money is Available to Spend?Total Resources $107,529 $72,095 $43,090 $2,550 $460 $225,724 Less: Amount Available but Not Agreed to be Spent — — — 269 13 282 Less: Amount Not Available to be Spent — 18,606 40,326 136 66 59,134
Total Amount Agreed to be Spent $107,529 $53,489 $2,764 $2,145 $381 $166,308
How was the Money Spent/Issued?Personnel Compensation and Benefits $33,023 $10,683 47 333 $235 $44,321Contractual Services and Supplies — 42,806 2,717 1,795 138 47,456 Acquisition of Capital Assets — — — 17 8 25 Grant and Fixed Charges(Insur. Claims, Indemnities) 74,506 — — — — 74,506
Total Amounts Agreed to be Spent 107,529 53,489 2,764 2,145 381 166,308
Who did the Money go to?Federal $33,166 $10,726 $51 $107 53 $44,103 Non-Federal 74,363 42,763 2,713 2,038 328 122,205
Total Amount Agreed to be Spent $107,529 $53,489 $2,764 $2,145 $381 $166,308
OPM Fiscal Year 2013 Agency Financial Report
Section 3 — other information
90

OPM Fiscal Year 2013 Agency Financial Report
Section 3 — other information
91

OPM Fiscal Year 2013 Agency Financial Report
Section 3 — other information
92
OPM Fiscal Year 2013 Agency Financial Report
Section 3 — other information
93

OPM Fiscal Year 2013 Agency Financial Report
Section 3 — other information
94
OPM Fiscal Year 2013 Agency Financial Report
Section 3 — other information
95
OPM Fiscal Year 2013 Agency Financial Report
Section 3 — other information
96
OPM Fiscal Year 2013 Agency Financial Report
Section 3 — other information
97
OPM Fiscal Year 2013 Agency Financial Report
Section 3 — other information
98
OPM Fiscal Year 2013 Agency Financial Report
Section 3 — other information
99

OPM Fiscal Year 2013 Agency Financial Report
Section 3 — other information
100

OPM Fiscal Year 2013 Agency Financial Report
Section 3 — other information
101

OPM Fiscal Year 2013 Agency Financial Report
Section 3 — other information
102

OPM Fiscal Year 2013 Agency Financial Report
Section 3 — other information
103

OPM Fiscal Year 2013 Agency Financial Report
Section 3 — other information
104
OPM Fiscal Year 2013 Agency Financial Report
Section 3 — other information
105
OPM Fiscal Year 2013 Agency Financial Report
Section 3 — other information
106

OPM Fiscal Year 2013 Agency Financial Report
Section 3 — other information
107
OPM Fiscal Year 2013 Agency Financial Report
Section 3 — other information
108

OPM Fiscal Year 2013 Agency Financial Report
Section 3 — other information
109
OPM Fiscal Year 2013 Agency Financial Report
Section 3 — other information
110

OPM Fiscal Year 2013 Agency Financial Report
Section 3 — other information
111
Summary of Financial Statement and Audit Management Assurances OPM’s Summary of Financial Statement Audit and Management Assurances are shown in Tables 10 and 11,
respectively .
Table 10. Summary of Financial Statement Audit
Financial Statement Audit Opinion
Audit Opinion Unmodified
Restatement No
Material Weaknesses Beginning Balance New Resolved Consolidated Ending Balance
0 0 0 0 0
Total Material Weaknesses 0 0 0 0 0
Table 11. Summary of Management Assurances
Effectiveness of Internal Control Over Financial Reporting (FMFIA § 2)
Statement of Assurance Unqualified
Material Weaknesses Beginning Balance New Resolved Consolidated Reassessed Ending Balance
0 0 0 0 0 0
Total Material Weaknesses 0 0 0 0 0 0
Effectiveness of Internal Control Over Operations (FMFIA § 2)
Statement of Assurance Qualified
Material Weaknesses Beginning Balance New Resolved Consolidated Reassessed Ending Balance
IT Security Program Governance 1 0 0 0 0 1
OIG Oversight of OPM Revolving Fund
1 0 0 0 0 1
Total Material Weaknesses 2 0 0 0 0 2
Conformance with Financial Management System Requirements (FMFIA § 4)
Statement of Assurance Systems Conform
Non-Conformances Beginning Balance New Resolved Consolidated Reassessed Ending Balance
None 0 0 0 0 0 0
Total Non-Conformances 0 0 0 0 0 0
Compliance with Federal Financial Management Improvement Act (FFMIA)
Compliance with Specific Requirements
Agency Auditor
System Requirements No noncompliance noted No noncompliance noted
Accounting Standards No noncompliance noted No noncompliance noted
USSGL at Transaction Level No noncompliance noted No noncompliance noted

OPM Fiscal Year 2013 Agency Financial Report
Section 3 — other information
112
Improper Payments Information Act Reporting Details
An improper payment is any payment that should not have been made or was made in an incorrect
amount under statutory, contractual, administrative, or other legally applicable requirements . Additionally, OMB has specified that improper payments include payments where the agency’s review cannot discern whether a payment was proper as a result of insufficient or lack of documentation . In 2002, Congress enacted the Improper Payments Information Act (IPIA) of 2002 (P .L . 107-300) . The Act requires agencies to review annually all programs and activities to identify those susceptible to significant improper payments; estimate the annual improper payments in the susceptible programs and activities; and report the results of their improper payment reduction plans and activities .
OPM is reporting details on improper payments for FY 2013 in two major programs: Retirement and the Federal Employee Health Benefits Program (FEHBP) . FY 2013 improper payments for those two programs respectively are $278 .3 million and $74 .2 million, for a total of $352 .5 million . IPERA and Appendix C to OMB Circular A-123 define programs as being susceptible to significant improper payments if the program or activity has improper payments that exceed both 2 .5 percent and $10 million of program spending, or $100 million . Susceptible programs must be reported annually . In previous years, OPM reported annual improper payments for the Federal Employees Group Life Insurance (FEGLI) Program and Background Investigations (BI) Program . OPM has removed these two programs from annual reporting because they are under these thresholds . Appendix C also provides criteria for agencies to request removal, with concurrence of their Office of Inspector General (OIG), if programs are under the thresholds for two consecutive years . OPM, with concurrence from OIG, requested removal of FEGLI and BI programs and OMB approved that request . Those programs will go to a cycle of 3-year risk assessments per OMB guidance .
OMB M-12-11, Reducing Improper Payments through the “Do Not Pay (DNP) List”, required agencies to verify eligibility for Federal payments in order to help reduce and eliminate payment errors before they occur . The Improper Payment Elimination and Recovery Improvement Act (IPERIA) of 2012 (P .L . 112-248) strengthened the requirements for agencies to use Do Not Pay (DNP) Initiative . The initiative requires agencies to review pre-payment and pre-award procedures and available databases to determine program or award eligibility and prevent improper payments before releasing any federal funds . Specifically, IPERIA required that agencies review, as appropriate, all payments and awards for their programs through the DNP system by June 1, 2013 . To assist agencies in meeting this deadline, Treasury in May 2013 sent OPM initial matches of OPM payment files against the Master Death File and the Excluded Parties List System, to help prevent future improper payments . OPM formed a team to review the data to assist with establishing OPM’s rules and processes for best utilizing the matches from DNP .
OPM is reporting details on improper payments for FY 2013 in two major programs: Retirement and the Federal Employee Health Benefits Program (FEHBP) . FY 2013 improper payments for those two programs respectively are $278 .3 million and $74 .2 million, for a total of $352 .5 million . IPERA and Appendix C to OMB Circular A-123 define programs as being susceptible to significant improper payments if the program or activity has improper payments that exceed both 2 .5 percent and $10 million of program spending, or $100 million . Susceptible programs must be reported annually . In previous years, OPM reported annual improper payments for the Federal Employees Group Life Insurance (FEGLI) Program and Background Investigations (BI) Program . OPM has removed these two programs from annual reporting because they are under these thresholds . Appendix C also provides criteria for agencies to request removal, with concurrence of their Office of Inspector General (OIG), if programs are under the thresholds for two consecutive years . OPM,
OPM Fiscal Year 2013 Agency Financial Report
Section 3 — other information
113
with concurrence from OIG, requested removal of FEGLI and BI programs and OMB approved that request . Those programs will go to a cycle of 3-year risk assessments per OMB guidance .
In FY 2013, OPM developed a comprehensive improper payments plan . This was responsive to an OIG recommendation and will help OPM meet the requirements of IPIA, IPERA, and IPERIA . OPM views the plan as a living document that will be updated as needed to help focus Agency efforts on reducing and recapturing improper payments . OIG’s March 2013 report on IPERA compliance noted the progress made by OPM in its annual improper payments reporting and found OPM compliant with IPERA .
Program DescriptionsOPM is reporting for FY 2013 improper payments
for its two largest programs: Federal Retirement and FEHBP .
Retirement Program OPM paid $76 .5 billion in defined-benefits to
retirees, survivors, representative payees, and families during FY 2013 under the Civil Service Retirement System (CSRS) and the Federal Employees’ Retirement System (FERS) . Under CSRS and FERS, OPM pays monthly annuities to eligible retired employees and survivors . Eligible retirees and survivors generally receive monthly benefits but in some cases an applicant can also received a lump-sum payment . Eligible employees who leave Federal service before qualifying for retirement under CSRS or FERS may request that their contributions be returned to them in a lump-sum refund payment .
Health Benefits ProgramFEHBP is administered through contracts with
participating carriers that provide hospitalization and major medical protection to Federal employees, retirees, former employees, family members, and former spouses . Two types of carriers participate in the Program: experience-rated carriers (ERCs) and community-rated carriers (CRCs) . ERCs maintain separate accounting for their FEHBP contract and, hence, must disclose their expenses . CRCs, on the
other hand, do not maintain separate accounting and receive a premium based on the average revenue needed to provide benefits to their members . In 2013, ERCs incurred benefit and administrative expenses of over $37 billion on behalf of the FEHBP, and the FEHBP paid over $6 .5 billion in premiums to CRCs .
I. Risk Assessment
OPM has been reporting annual improper payments for Retirement and FEHBP from the inception of IPIA . Therefore, no risk assessment is required under IPERA or the guidance for those two programs which account for about 99 percent of OPM’s funding on its consolidated financial statements . As noted previously, FEGLI and BI programs have been removed from annual reporting and will move to a 3-year risk assessment cycle . OPM will formally review the risk of improper payments in those programs in FY 2016 .
OPM was in the process of updating its risk assessment during FY 2013 for vendor payments under the Revolving Fund (RF), other than BI, and Salaries and Expenses (S&E) programs . Previous risk assessments had indicated that those were not susceptible to improper payments under the OMB definitions . However, during FY 2013 OPM transferred much of its vendor invoice process to the Federal Aviation Administration (FAA) under a shared services agreement . Consequently, OPM will defer its quantitative risk assessment for vendor payments under the RF and S&E programs until FY 2014 when the new payment process with FAA is fully implemented .
II. Statistical Sampling and Other Methodology
Retirement ProgramRetirement Services (RS) has procedures for
identifying and recapturing improper payments, preventing erroneous payments and protecting taxpayer resources . Improper payments can be caused by issues as varied as delays in survivors reporting the death of an annuitant to outright fraud .
The improper payment rate for retirement payments combines both underpayments (monies
OPM Fiscal Year 2013 Agency Financial Report
Section 3 — other information
114
that OPM owes to the annuitant) and overpayments (monies that OPM has paid out to the annuitant erroneously or in excess of entitlement) into one ratio . Improper retirement payments are calculated by dividing the underpayments (determined by statistical sampling) and the overpayments (the actual value) by total outlays . Overpayments for the fiscal year are reported by OPM’s OCFO using the actual overpayments . For underpayments, OPM uses a statistical analysis based on an entire year’s worth of audits of retirement and survivor cases under the two retirement systems to determine the value . The full process for measuring and calculating the improper payment rate is detailed in the OCFO Work Instruction on “Reporting Improper Payments for the Agency Financial Report” dated June 27, 2013 .
Health Benefits ProgramOPM uses the results of historical audits of the
premiums paid by OPM to CRCs and the expenses paid on behalf of the Program by ERCs to estimate FEHBP improper payments . One hundred percent of FEHBP premium payments are subject to audit which exceeds the sample size required by OMB in Appendix C to OMB Circular No . A-123 . These samples are generally judgmental, not random, targeting areas most likely to contain improper payments . The sample also includes plans which have not been audited recently as well as those plans and processes requested by agency management and contracting officers .
OPM’s Healthcare and Insurance (HI) organization assesses OIG audit reports, comments and clarifications from the FEHB plans, the OIG, OPM’s Actuaries and Office of the General Counsel (OGC) . Furthermore, HI makes a preliminary determination on each recommendation concerning whether, and to what extent, it constitutes an improper payment . HI’s determinations are the basis for improper payment amounts routinely reported to OMB although provisional improper payments are known as “questioned amounts”, in the respective OIG audit report . Determined amounts and improper payments can fluctuate based on several factors including: the amounts questioned in OIG audit reports, number of final audits received
by HI for review, audit type and scope, the size of the health plans under examination, the nature of the overpayments, and the disparities between OIG findings and HI determinations .
An FEHB plan’s response to an adverse monetary audit finding may indicate their agreement or disagreement with the finding . A plan’s agreement with a finding does not necessarily mean that monies must, or will, be fully recovered . Plans are contractually required to exercise due diligence in recovering overpayments, and to provide reports on their progress toward remediating audit findings . Factors contributing to timely, successful closure of an audit recommendation include: the age of an overpayment when audited, whether due diligence was demonstrated by the plan, and the ambiguity or interpretation of contract provisions and other subsidiary laws or agreements in place . For example, a plan may agree that an overpayment was made, but after exhausting its recovery efforts declare it to be uncollectible . A plan may also contest the audit’s findings by documenting its position with sound evidence or by asserting differences in the interpretation of contract language . Generally, most findings the plan agrees with result in full or partial recoveries . FEHB improper payments also includes recoveries from OIG’s investigations of reported fraud and abuse . This category of improper payments is subject to wide fluctuations based on factors including the number, size, and timing of legal proceedings and settlements .
III. Causes of Improper Payments and Corrective Actions to Reduce Them
Retirement Program Improper payments remain a marginal percentage
of both the number and value of total retirement benefit payments . OPM is committed to reducing improper payments by implementing internal controls and corrective actions .
OPM has identified the following as the principal causes for improper payments in the retirement program and the corrective actions that RS performs to reduce their occurrence in the Retirement Program:

OPM Fiscal Year 2013 Agency Financial Report
Section 3 — other information
115
1 . Delayed Reporting
IssueThe status of an annuitant periodically changes
and can result in a change to the benefits due . These changes may be due to death or marriage . They also can occur when the annuitant is restored to earning capacity, reemployed or for other reasons . OPM is reliant on annuitants and other sources (such as the Social Security Administration [SSA] Death Master File) to learn of some of these status changes . Delayed reporting of the status changes, or sometimes no reporting by the annuitants and other sources, can result in an improper payment .
Corrective Actions
Matches and Surveys
To identify annuitant status changes and mitigate improper payments, OPM conducts several matches and annual surveys described below . Anomalies identified in these matches and surveys are researched by OPM and, if needed, referred to the OIG .
SSA Death Master File (DMF)
OPM conducts yearly data matches between our annuity roll and the SSA DMF . These matches compare annuitant identifiers with current SSA death records . These matches supplement the weekly Consolidated Death Matches (CDM) and help identify reported deaths that might be missed in the CDMs due to timing differences .
Consolidated Death Match (CDM)
OPM compares the CDM with OPM’s annuity roll weekly to identify annuitants who SSA reports as deceased . The Validated Agency Match System (VAMS) processes the death information for the purpose of terminating Federal benefits and subsequently preventing improper payments . Collection actions are initiated for any overpayments that are discovered .
Marital Survey:
OPM conducts the marital survey annually to determine if surviving spouse is still eligible
for benefits . The survey determines whether the surviving spouse remarried prior to age 55 .
Representative Payee Survey:
OPM conducts the representative payee survey to ensure that the person receiving benefits on behalf of an annuitant is the payee on record and that the payee certifies that he or she is using and managing the annuity in the best interest of the annuitant .
Student Survey:
OPM conducts the student survey to ensure that the surviving child meets basic eligibility requirements and is a full time student at an accredited educational institution for a monthly survivor annuity benefit .
Disability Survey:
OPM conducts the disability survey because there is a limit on the amount certain disabled retirees can earn in the calendar year . In addition, the disability survey is mandated by law . The annuitant cannot exceed the 80 percent earning capacity limit .
FERS Annuity Supplement Survey:
OPM conducts the FERS anuity supplement survey annually . OPM sends the survey to all annuitants who receive the FERS supplement, and whose income has exceeded the minimum level of earning . These annuities must be reduced .
Improved Communications
OPM strives to reduce delayed reporting of status changes by communicating important information on the OPM website and preparing and distributing videos about common life events and their impacts to annuity payments . OPM also makes use of social media to communicate important messages about these important life events . The videos and messages include the following topics:
• DeathofARetiree
• RemarriageAfterRetirement
• DivorceAfterRetirement
• ChangeofAddress

OPM Fiscal Year 2013 Agency Financial Report
Section 3 — other information
116
The RS Associate Director posts articles on the Retirement Information Center portion of OPM’s website . Topics in FY 2013 included tips on safeguarding your annuity from fraudulent activity .
Proof of Life
OPM undertook initiatives with the Department of State and the SSA to reduce improper payments made to annuitants who live overseas and whose deaths are not reported timely . OPM targeted possible improper payments occurring in the Philippines, Japan, India, Thailand, Singapore, Hong Kong, Australia, Greece, Panama, and Costa Rica .
Examples of actions OPM took to confirm that overseas annuitants were still eligible to receive benefits included hosting verification fairs and utilizing U .S . Embassy and Consulate staff to visit the homes of annuitants who did not attend the fair .
OPM’s verification efforts include direct deposit enrollment information and annuitants are highly encouraged to enroll . The banking agreements for these payments make the banks responsible for reporting known deaths .
OPM did not perform proof of life activities during FY 2013 due to fiscal constraints .
Over 90 Project
OPM periodically investigates the status of retirees and survivors over the age of 90 to ensure their monthly annuity benefits are accurate and to identify unreported deaths . OPM initially conducted an “Over 90 Project” in October 2010 in response to the OIG recommendation that (in part) stated, “OPM perform a periodic analysis of all annuitants/survivors on the active annuity roll who are 90 years of age and older to validate whether they are alive or dead… .” RS did not conduct an analysis of the Over 90 annuitant population in FY 2013, but will revisit the issue in FY 2014 .
UpdateRS identified and documented over $56 .7 million
in cost savings this fiscal year through the Disability Earnings Match by terminating annuity payments to annuitants based on earned income information
and through the Death Matches with receipt of death reporting data from the SSA . The Retirement Surveys and Students Branch (RSS) has identified and documented a cost savings of $1 .7 million to OPM this fiscal year in the processing of its Student, Representative Payee, Marital, FERS Annuity Supplement and Disability Earnings Surveys .
2 . Prohibited Dual Benefit Payments
Issue
Unauthorized dual benefits payments are those benefits for which an employee may qualify for one or the other but not both at once or in full . An example of the potential for unauthorized dual benefit payments occurs when individuals apply for FERS disability while applying for SSA disability benefits . Law prohibits payment of full, unreduced FERS disability annuity benefits and SSA disability benefits for the same period of time . Since FERS disability annuity benefits are sometimes approved years before the SSA determines an award, FERS annuitants can receive full, unreduced monthly annuities before SSA approves disability benefits . As a result, the annuitant will often owe OPM the cumulative amount of the SSA benefit that should have been withheld from the FERS annuity . FERS annuitants are notified of the obligation to repay the debt to the government . OPM recovers overpayments through installment deductions from recurring annuities (on-roll collections), or, in certain cases, such as very small recurring annuities, OPM must seek direct payments from debtors through off-roll collection processes .
Another example of a prohibited dual benefit is when an annuitant receives benefits simultaneously from both the U .S . Department of Labor, Office of Workers’ Compensation Program (OWCP) and the Retirement Program . Retirees often have a choice between accepting the benefits of either program, and can make changes in that choice, but cannot receive dual benefits at the same time .
Corrective Actions
OPM conducts data matches to identify accounts that may be receiving improper payments . These

OPM Fiscal Year 2013 Agency Financial Report
Section 3 — other information
117
matches monitor information from annuitants and survivors . OPM conducts the following data matches to reveal unreported deaths and other unreported events:
Disability Earnings Match (DEM)
OPM uses the DEM to audit all individuals under age of 60 who are in receipt of a disability annuity and whose earnings have been identified as near or exceeding the allowable 80 percent limit . This annual match follows a survey of the entire disabled annuitant population under the age of 60 . If a person meets or exceeds the 80 percent earnings limit, earning capacity is considered restored and the disability annuity is terminated .
FERS Annuity Supplement Match
OPM uses the annual FERS Annuity Supplement match to identify annuitants whose income, while receiving the FERS annuity supplement, has exceeded the minimum level of earnings (MLE) set by the SSA . Once earnings reach the MLE, the annuity supplement is reduced $1 for every $2 in earnings exceeding the MLE .
Other Matches with SSA
OPM uses SSA benefit information to recalculate the benefits of certain annuitants and survivors whose computations are based, in part, on military service performed after December 1956 under the CSRS, and of certain annuitants and survivors whose annuity computation under the FERS have a CSRS component .
OPM uses SSA benefit data for the administration of certain programs by OPM’s RS . OPM is legally required to offset specific benefits by a percentage of benefits payable to disability annuitants, children survivor annuitants, and spousal survivor annuitants, under Title II of the Social Security Act . This matching activity will enable OPM to compute benefits at the correct rate and determine eligibility for these benefits .
Office of Workers’ Compensation Program (OWCP) Match
RS is working to renew an agreement with OWCP . The purpose of this agreement will be to
establish the conditions, safeguards and procedures under which OWCP will disclose Federal employee compensation benefit data to OPM . OPM will compare entitlement to payment data and make the necessary adjustments to the annuity to ensure that they are in tandem with each other .
UpdateOver the course of FY 2013, RS ran system
matches on 5,956 military call up cases . Upon notification of a SSA benefit match, RS determined whether the case warranted a benefit reduction . In total, 4,803 cases were reissued with reduced annuities .
In FY 2013, RS implemented FERS 60/40 automation . By law, FERS disability annuitants are entitled to 60 percent of their average salary less 100 percent of their Social Security Benefit for the first year . After the first year, they are entitled to 40 percent of average salary less 60 percent of their Social Security Benefit for subsequent years . If an annuitant is in interim pay after one year while his or her disability case is being adjudicated, the benefit is now automatically reduced to 40 percent of average salary to prevent overpayment . With this tool, OPM reduced overpayments to FERS disability annuitants by 89 percent .
3 . Errors or Omissions by OPM employees, Employing Agency, or Applicant
Issue
OPM’s annuity calculations have automated and manual components . The manual components are subject to human error . Errors can include incorrect effective dates, salary rates, and tours of duty which all impact annuity calculations . These errors may occur because OPM incorrectly entered the information or the annuitant or separating agency provided incorrect information .
Corrective Actions Benefits Officer Training
OPM trains and provides guidance to agency benefits officers to ensure that employees understand all of the benefit options available to them . A

OPM Fiscal Year 2013 Agency Financial Report
Section 3 — other information
118
highly trained cadre of human resource benefits officers assists OPM by producing fully developed retirement cases with accurate information, leading to fewer errors or omissions and thus fewer improper payments .
AuditsRS conducts audits on all Agency retirement
packages during the screening and development stage of processing . Results are entered into the Agency Audit Tracking System and reports are generated that calculate the government wide and individual agency accuracy rates . The percentage of new claims with errors is reported monthly on the OPM web site and a detailed report is provided to the agency headquarters’ benefits officers . Each month, a message is sent to the headquarter benefits officers, transmitting their results and highlighting the most common errors and tips to avoid these errors . RS is currently developing a Benefits Administration Letter that addresses the most frequent error, the failure to document a retiree’s eligibility to continue health insurance coverage, which represents 22 percent of all errors .
Quality Assurance (QA) performs continuous audits of newly adjudicated retiree and survivor claims under both CSRS and FERS to calculate accuracy rates and the corresponding value of improper payments, as well as to identify any training or systemic deficiencies .
QA provides feedback through monthly and formal quarterly reports with recommendations, if applicable . These reports provide specific analysis meant to discover trends that may not be discernible in any given month . The information gained through these audits is used to make informed decisions regarding resources and to ensure compliance with policies and procedures governing the determination and payment of benefits . This activity is also leveraged for testing as part of the annual independent audit of the agency’s consolidated financial statement . As such, these statistically valid audits are a critical component of our internal control activities .
UpdateThe combined weighted average for CSRS
and FERS annuity and survivor claims from October 1, 2012 through August 31, 2013 was 92 .8 percent .
In FY 2013, RS provided regular feedback to agencies on claims deficiencies . When agencies submit incomplete or inaccurate retirement packages, OPM is required to spend additional time and resources developing the claim before it can be processed . Working with agency Chief Human Capital Officers (CHCOs) is fundamental to improving the accuracy and completeness of incoming claims . The agency accuracy rate for retirement application submissions in FY 2013 was 92 .65 percent .
4 . Fraud
IssueAlthough rare, some annuitants, survivors, or
representative payees knowingly receive payments for which they are not entitled . Examples of potential fraud include: unreported deaths, forged documents, disability cases (when reports and tips indicate that the annuitant is found to have been recovered from his/her disability or whose behavior does not indicate the presence or continuation of the disability for which he/she was approved), or representative payees who do not appear to be using money in a specified and appropriate manner when caring for the annuitant or survivor .
Corrective ActionsOPM reviews potential fraud based on statements
from individuals who come forward to provide information to OPM . OPM uses online resources to corroborate the information and build a fraud case . Public records and databases, as well as available medical records, are reviewed and suspected fraud is referred to the OIG for investigation .
UpdateIn FY 2013, OPM discovered an attempted
“phishing” against the annuity roll through the Quickstart enrollment file from the Federal Reserve .

OPM Fiscal Year 2013 Agency Financial Report
Section 3 — other information
119
Annuitant payments were being routed to fraudulent debit cards . After a review of the data, OPM started blocking payments to routing numbers from those banks with frequent fraudulent activity through the Quickstart process .
OPM also started monitoring accounts that receive more than two recurring payments from the agency each month . Any account that receives three or more annuity payments deposited in a single month is investigated for fraudulent activity .
In addition, OPM increased the enrollment rate for electronic funds transfer (EFT) from 97 .8 percent in FY 2012 to 98 .87 percent in FY 2013 . Increasing the percentage of annuitants who receive their annuity payments through EFT helps OPM to monitor accounts, recover payments from deceased annuitants, and prevent fraud .
Other Sources for Identifying and Correcting Improper Payments
Data Mining
RS established the Data Mining Working Group (DMWG) in November 2012 to identify areas in the retirement program where fraud, errors, or delays in reporting could result in RS making improper payments . The goal of the DMWG is to establish a set of regular reviews and comparisons of data sets to identify when a high likelihood of potential fraud, errors, or delays in reporting exist . RS can then further investigate these with a goal of reducing, preventing, or recovering improper payments . The group is comprised of subject matter experts from various operational and staff offices within and outside of RS .
RS established the DMWG in response to an OIG recommendation, Establish a Working Group to Improve Program Integrity, within the OIG report entitled Stopping Improper Payments to Deceased Annuitants .
The DMWG came to closure on its discussions on data mining and released its recommendations to senior RS management, which are currently under consideration .
In FY 2013, RS developed a series of ad-hoc reports that utilize data mining to identify annuity roll inconsistencies and potential improper payments .
For example, RS flags those cases which have been in interim pay status for more than six months and have received more than $75,000 in annuity payments . RS then targets the cases on this report for review to determine the proper payment amount .
OPM Task Force
OPM formed a task force to address issues concerning improper payments to deceased annuitants in response to the OIG report issued on September 14, 2011 . The task force includes the Associate Director of Retirement Services, the Chief Operating Officer, the Chief Financial Officer, and the Associate Director of Merit System Accountability and Compliance . The task force is working with the related program offices to develop plans for reducing improper payments and providing status reports to the Director and OIG .
Under direction from the senior task force, OPM developed and issued its first comprehensive improper payments plan in November 2012 . The plan was updated in January 2013 and contains two measurable goals: one to reduce the rate of improper payments in the Retirement and FEHB programs and one to increase recoveries of improper payments to deceased annuitants . OPM will review progress against those goals in FY14 and develop new goals as appropriate .
Returned 1099Rs
As a pilot program, OPM analyzed undelivered 1099Rs from 2010 that were returned to determine if unreported deaths had occurred .
In FY 2013, RS had ongoing communications with the OIG regarding the 1099R Project . A progress report updating the findings will be prepared by December 31, 2013 .
Monitor Reclamations to Recover Funds
OPM monitors reclamation requests that are more than 60 days old that Treasury did not perform a collection action for the agency . Independent actions were performed to identify debtors and recover improper payments . Specific actions that were performed in FY 2013 include:
OPM Fiscal Year 2013 Agency Financial Report
Section 3 — other information
120
• Designedandimplementedareportthatidentifies the annuity payments Treasury did not perform a collection through the reclamation process .
• Implementedanewlettertorequestlast withdrawer or joint account holder information from the financial institution .
• MetwithTreasurytodiscussneededactions and timeframes to receive collection information for payments that were recovered through the reclamation process .
Health Benefits ProgramOPM recognizes several categories of improper
payments across the FEHBP . FEHBP improper payments are generally administrative in nature . Addressing administrative improper payment’s requires a multi-pronged approach .
Causes of Improper Payments
1 . Defective pricing by community-rated health maintenance organizations (HMOs) (administrative and documentation error)
IssueCommunity-rated carriers develop a premium
price that does not ensure that the FEHBP is receiving “market price” .
Corrective Actions Market price comparisons are performed when
the premiums are negotiated and accepted . However, a FEHBP market price is not confirmed until a rate reconciliation review or audit is completed and/or when a full range audit is performed, including an analysis of the rates paid by other employer groups (e .g . Similarly Sized Subscriber Groups) . In addition, FEHBP is currently incorporating a different rating approach, the Medical Loss Ratio (MLR), for most HMO’s to calculate premiums . MLR requires plans to pay at least 85 percent of premium dollars for medical claims and activities that improve the quality of health care or provide a rebate . FEHBP believes this approach may significantly reduce defective pricing issues .
2 . Enrollment reconciliation between HMO carriers and participating agencies (administrative and documentation error) .
IssueCarriers are not timely notified of enrollment
changes and therefore unnecessarily incur capatation charges yet are not receiving premium for terminated enrollments .
Corrective Actions The Centralized Enrollment Clearinghouse
System (CLER) was created to facilitate reconciliation between the carriers’ and the agencies’ enrollment records . CLER has significantly reduced erroneous payments associated with enrollment descrepencies from fifteen percent to two percent .
3 . Experience-rated carriers’ benefit coordination with Medicare (administrative and documentation error)
IssuePremium rates are negatively impacted when
a carrier does not properly coordinate enrollee Medicare benefits, resulting in the FEHBP paying claims which Medicare should have paid as the primary payor .
Corrective Actions Enhanced carrier efforts along with robust
contract oversight have reduced the negative impact on premium rates . The HI contracting officer and audit resolution (AR) have expanded resources and worked very closely with Blue Cross and Blue Shield and other ERCs to improve the timeliness, quality and responsiveness of submissions for review . Corrective action plans have been updated to address trends in OIG findings and contract language is being reviewed and strengthened to ensure due diligence is taken in Plans’ recovery processes .
Plans have incorporated a variety of efforts aimed at strengthening internal controls through the identification, prevention, reduction and recovery of improper payments in claims processingin general,

OPM Fiscal Year 2013 Agency Financial Report
Section 3 — other information
121
and coordination of benefits (COB) in particular . These efforts include system edits to reject claims or defer them for manual review; 100-percent review at certain claim thresholds; quality assurance training and testing; overpayment prevention; identification and collection protocols; and causal analysis of overpayment trends .
4 . Effectiveness of experience-rated carrier claims processing, financial and cost accounting systems (administrative and documentation error)
IssueDuplicate claim payments and incorrect pricing
of benefit claims for payment negatively impacts premium rates .
Corrective Actions Carriers have initiated a variety of efforts to
strengthen internal controls across the identification, prevention and recovery of improper payments . The OIG continuously conducts audits on both a plan-specific and “global” basis . Plan specific audits cover a broad scope of the plan’s operations (e .g . administrative charges, cash management, fraud and abuse, claims, etc .) while global audits examine one type of finding across all plans in a related network . Plan efforts include activities such as the monitoring of routine and ad hoc reports, retroactive enrollment reports (includes Medicare COB) root cause analysis of all errors on a pre-and post payment basis, internal audit & random reviews, system scans, automatic offsets of future benefit payments where unrecouped overpayments exist and documentation maintenance to support plan actions .
IV. Improper Payments
OPM improper payments for FYs 2012 – 2013 and its targets for 2014 – 2016 are reported in Table 12 .
Retirement Program Overpayments represented 78 .2 percent of total
improper payments in the Retirement Program during FY 2013 . As a percentage of total outlays, the overpayment rate was 0 .28 percent . Overpayments increased from $208 .7 million in FY 2012 to $217 .5 million in FY 2013 . However, overpayments to deceased annuitants decreased from $102 .9 million in FY 2011 to $86 .1 million in FY 2012 to $84 .7 million in FY 2013 .
As a percentage of total overpayments, overpayments to deceased annuitants decreased from 41 .3 percent to 38 .9 percent . Although OPM’s overall improper payments rate for the Retirement program continues to be very low considering its size and complexity (0 .36 percent in FY 2013), RS will continue working towards reducing improper payments in FY 2014 and beyond .
Health Benefits ProgramThe FEHBP improper payments for FY 2013
($74 million) represented a sharp decrease from FY 2012 ($213 million) . This was primarily due to the impact of three large pharmaceutical settlements last year and to comparatively low audit findings in FY 2013 . FEHBP improper payments attributable to health plan audits were approximately $30 .6 million, one of the lowest levels in recent years, and the investigative recoveries tallied $43 .6 million . This year’s decrease also highlights that FEHBP improper payments are subject to wide fluctuation from one year to the next . Additionally, both audit findings and investigative settlements, typically represent an audit scope or investigative activity that may span several years, but are reported in the year in which they are discovered (audit), settled or recovered (investigative) .
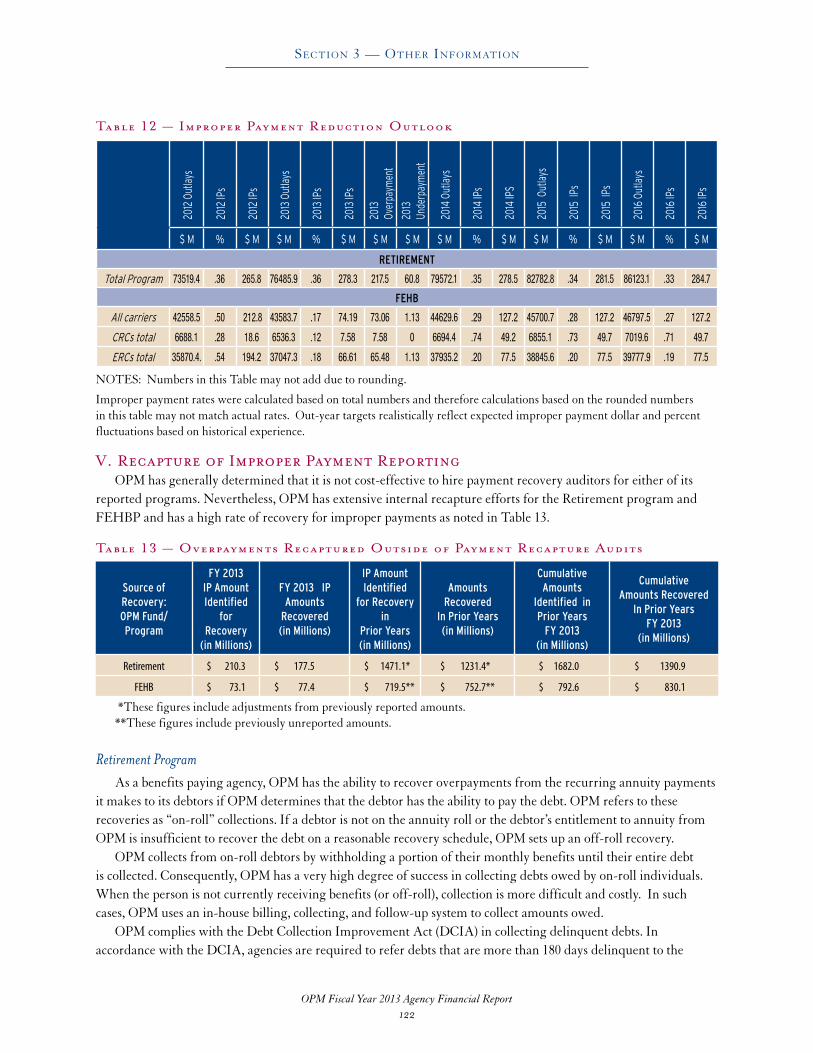
OPM Fiscal Year 2013 Agency Financial Report
Section 3 — other information
122
Table 12 — Improper Payment Reduction Outlook
2012
Out
lays
2012
IPs
2012
IPs
2013
Out
lays
2013
IPs
2013
IPs
2013
Ov
erpa
ymen
t
2013
Un
derp
aym
ent
2014
Out
lays
2014
IPs
2014
IPS
2015
Out
lays
2015
IPs
2015
IPs
2016
Out
lays
2016
IPs
2016
IPs
$ M % $ M $ M % $ M $ M $ M $ M % $ M $ M % $ M $ M % $ M
RETIREMENT
Total Program 73519.4 .36 265.8 76485.9 .36 278.3 217.5 60.8 79572.1 .35 278.5 82782.8 .34 281.5 86123.1 .33 284.7
FEHB
All carriers 42558.5 .50 212.8 43583.7 .17 74.19 73.06 1.13 44629.6 .29 127.2 45700.7 .28 127.2 46797.5 .27 127.2
CRCs total 6688.1 .28 18.6 6536.3 .12 7.58 7.58 0 6694.4 .74 49.2 6855.1 .73 49.7 7019.6 .71 49.7
ERCs total 35870.4. .54 194.2 37047.3 .18 66.61 65.48 1.13 37935.2 .20 77.5 38845.6 .20 77.5 39777.9 .19 77.5
NOTES: Numbers in this Table may not add due to rounding .
Improper payment rates were calculated based on total numbers and therefore calculations based on the rounded numbers in this table may not match actual rates . Out-year targets realistically reflect expected improper payment dollar and percent fluctuations based on historical experience .
V. Recapture of Improper Payment ReportingOPM has generally determined that it is not cost-effective to hire payment recovery auditors for either of its
reported programs . Nevertheless, OPM has extensive internal recapture efforts for the Retirement program and FEHBP and has a high rate of recovery for improper payments as noted in Table 13 .
Table 13 — Overpayments Recaptured Outside of Payment Recapture Audits
Source of Recovery:OPM Fund/Program
FY 2013IP Amount Identified
for Recovery
(in Millions)
FY 2013 IP Amounts
Recovered(in Millions)
IP Amount Identified
for Recovery in
Prior Years(in Millions)
Amounts Recovered
In Prior Years(in Millions)
CumulativeAmounts
Identified in Prior Years
FY 2013(in Millions)
CumulativeAmounts Recovered
In Prior Years FY 2013
(in Millions)
Retirement $ 210.3 $ 177.5 $ 1471.1* $ 1231.4* $ 1682.0 $ 1390.9
FEHB $ 73.1 $ 77.4 $ 719.5** $ 752.7** $ 792.6 $ 830.1
*These figures include adjustments from previously reported amounts .**These figures include previously unreported amounts .
Retirement ProgramAs a benefits paying agency, OPM has the ability to recover overpayments from the recurring annuity payments
it makes to its debtors if OPM determines that the debtor has the ability to pay the debt . OPM refers to these recoveries as “on-roll” collections . If a debtor is not on the annuity roll or the debtor’s entitlement to annuity from OPM is insufficient to recover the debt on a reasonable recovery schedule, OPM sets up an off-roll recovery .
OPM collects from on-roll debtors by withholding a portion of their monthly benefits until their entire debt is collected . Consequently, OPM has a very high degree of success in collecting debts owed by on-roll individuals . When the person is not currently receiving benefits (or off-roll), collection is more difficult and costly . In such cases, OPM uses an in-house billing, collecting, and follow-up system to collect amounts owed .
OPM complies with the Debt Collection Improvement Act (DCIA) in collecting delinquent debts . In accordance with the DCIA, agencies are required to refer debts that are more than 180 days delinquent to the
OPM Fiscal Year 2013 Agency Financial Report
Section 3 — other information
123
Treasury for collection by administrative offset and/or for cross-servicing . Since its implementation, OPM has collected over $8 .8 million via Treasury .
Standard Recapture OPM works on reclamations with the Treasury
and the financial institutions . RS sends a request for reclamation to Treasury . The request must arrive at the financial institution no more than 120 days after the death is discovered and the death notification entry is sent . The financial institution returns available funds . If only part of the funds remain at the financial institution, the financial institution returns the partial funds to Treasury and provides the name and address to OPM to contact the last withdrawer of the funds . When the account does not contain any funds OPM sends a letter to the last withdrawer requesting payment of the full amount within 45 days . If no funds are returned, the off-roll collection is certified . If the financial institution does not return timely information (within 60 days), Treasury debits the account of the financial institution or its correspondent bank at the Federal Reserve Bank and returns the funds to OPM . The financial institution can protest to Treasury if the reclamation request was sent by OPM more than 120 days after learning of the death . When Treasury determines OPM sent the request more than 120 days after learning of the death, the money goes back to the financial institution, if it has already been reclaimed . If Treasury determines that OPM sent the request within 120 days, the recapture process continues .
OIG Referrals Recapture cases with large balances occur from
time to time due to substantial delays in reporting the death of an annuitant and due to untimely entry into the automated clearing house (ACH) . On accounts with large balances due, letters are mailed to the last withdrawer, joint account holder or the estate and the financial institution to collect the balances . If evidence supports a fraud determination the cases are forwarded to the OIG .
In addition, cases are referred to the OIG whenever there may be a significant improper payment and recovery seems unlikely through the
normal recapture process . This occurs when an annuitant’s death is discovered by OPM instead of it being timely reported by someone with knowledge of the annuitant’s death . Evidence and documentation is sent to the OIG for investigative referral . The OIG routinely accepts all fraud referrals from agency program offices and provides a decision on whether or not to further investigate .
Health Benefits ProgramThe OIG, under the amended Inspector General
Act of 1978, administers audits in partnership with the FEHBP . An audit resolution function validates audit findings and, in concert with the Contracting Officer (CO), determines whether questionable charges are allowable under FEHBP regulations . To comply further with the policy, OPM’s OIG continually reviews the agency’s cost effective financial and programmatic controls to identify contractor overpayments . These effective internal controls prevent, detect, and recover overpayments to contractors . All contracts negotiated by OPM are subject to audit and are included in the audit universe with comprehensive audits of the FEHBP carriers conducted to ensure compliance with contract provisions, provide program oversight, and minimize fraud, waste, and abuse . The costs for this program include salary, administrative, and other expenses spread across several organizations . As part of OPM’s day-to-day program administration, corrective action plans are developed and implemented based upon the nature of the audit payment error identified . Corrective action plans are reviewed annually .
A payment recapture audit identifies contractor overpayments by examining agency information supporting payments . The OIG audits of the FEHBP typically rely on judgmental, not random, sampling, which provides a reasonable estimate of improper payments because carriers selected tend to have more payments that are improper . Improper Payment recovery criteria are in the contracts with each of the carriers . In general, improper payments must be identifiable and quantified, to include complete, timely and diligent notification, recovery, offset and reporting information, as appropriate . OPM

OPM Fiscal Year 2013 Agency Financial Report
Section 3 — other information
124
staff reviews supporting documentation to ensure contract compliance . Since the terms and conditions of all OPM’s contracts with HI carriers provide for adjustments to determined amounts (improper payments), which may subsequently be reversed based on evaluation of plan support and CO discretion, OPM has excluded them from the requirement for recovery audits . Additionally, OPM does not pay a fee to OIG based on recoveries . This process overall has proven highly effective in detecting and recovering improper payments for the FEHBP .
OPM’s ability to successfully recover questioned amounts in CRC audits often depends on the finding itself . For example, if the plan can not provide adequate support for its position in response to a questioned amount, our ability to recover the full questioned amount is understandably greater than if a finding is contested based on circumstances or documentation that was not evaluated during the audit . The FEHBP recovery process involves careful review and understanding of the audit finding and criteria, and working with the plan, Office of the Actuary, and Office of the General Counsel . If we can not secure payment we have the option to proceed to Final Decision, which is our intention to pursue reimbursement through legal action .
Recovery of ERC overpayments is largely done at the plan level, with plans recovering overpayments from providers and participants directly . Plan-collected overpayment recoveries are returned to the FEHBP fund via adjustments to the Letter of Credit . Our contracts with ERC’s contain provisions that outline how OPM expects carriers to show due diligence in recovery efforts . If a plan has documented that its recovery efforts have been exhausted, OPM may allow all or a portion of the remaining balance, or may settle with the plan . In general, recovery of overpayments to ERCs has improved in recent years, with plans recovering a higher percentage of overpayments and audit findings being resolved and closed more timely .
VI. Accountability
OPM developed an overall improper payments plan as noted earlier . The overall plan included
specific measurable goals for reducing the improper payments rate for the Retirement program and FEHBP and for recovering increasing percentages of improper payments to deceased annuitants . Inclusion of measurable goals has increased accountability within OPM . At the beginning of FY 2014, OPM will assess its performance against these goals and develop any appropriate new goals for FY 2014 and beyond . OPM notes that its improper payment rates for Retirement and FEHB are well below the OMB threshold of 2 .5 percent and recoveries are also high . Therefore it is difficult to implement cost-effective measures to reduce improper payments further or to increase recoveries significantly .
Retirement ProgramThe Associate Director of RS is held responsible
by the OPM’s Director for reducing improper payments through the performance standards . As noted above, RS is also a major participant in the task force to reduce improper payments to deceased annuitants .
Health Benefits ProgramHI contracting officers and management are
fully dedicated to the effective administration and oversight of the FEHBP, including accountability for improper payments . In FY 2011, FEHBP implemented new audit resolution timelines to expedite and facilitate the audit and resolution processes . In FY 2013, a separate timeline for Information System audits was completed . Performance standards reflect these timelines, which focused on increased participation by contracting staff in their oversight responsibilities through continuous involvement in the entire OIG audit process . It also required Plans to work more closely with the OIG during the draft audit phase to identify and resolve potential findings before the report is final . An effective tool used by HI management is the use of incentive-based service charge agreements, penalty clauses and QA Surveillance Plans . These tools tie plan profits to performance and enable contracting officers (COs) to incentivize or penalize performance .

OPM Fiscal Year 2013 Agency Financial Report
Section 3 — other information
125
FEHBP takes accountability for improper payments earnestly, COs discretion is a key aspect of HI’s oversight of the FEHBP and improper payments are one of several factors considered . Collaborating with all stakeholders, including OIG, CO’s must consider many technical, cost, and performance issues when resolving audit findings and making decisions on the allowability of monetary recommendations, including the closure of audit recommendations . The CO weighs not only the nature and severity of audit findings, but also costs to the program and reasonable timeframes for remediation . Furthermore, the size and reach of a benefit plan and the possible impacts on participants, some of whom reside in areas underrepresented by health care providers and options, must be weighed as well . In this context service availability and pragmatic considerations, may prove pivotal in improper payments determination and recovery .
FEHBP emphasis on more timely resolutions - with greater focus on resolving issues during an audit’s draft phase - is having favorable results, shortening and simplifying the overall resolution process . Significantly, it will allow audit reports to be used as a tool to enhance management’s oversight and carrier’s compliance .
HI works closely with the OIG to ensure and strengthen Plans’ internal controls, and holds our COs accountable to provide effective oversight and administration of the FEHBP .
Chief Financial OfficerOPM has established the Chief Financial Officer
as the Senior Accountable Official for Improper Payments . OCFO chairs an IPWG that includes members from OPM program offices and meets regularly to address improper payments at OPM .
VII. Agency information systems and other infrastructure
OPM generally believes that it has resources in place and can work with current information systems and other infrastructure to reduce improper payments and increase recoveries . Specific instances where OPM
has been increasing or shifting resources or enhancing current systems and processes are described in the corrective actions described earlier in this report .
OPM believes it has strong internal controls in place for its improper payments program and that was evidenced by OIG’s March 2013 report on IPERA compliance . That report noted improvements over the prior year and that OPM was in compliance with IPERA .
VIII. Barriers to Reducing Improper Payments
Retirement ProgramRS continues to experience systemic improper
payments when a FERS disability annuitant is awarded Social Security Disability Insurance benefits .
FERS Disability Offset for Social Security Disability Frequently, OPM begins payment of a FERS
disability before SSA completes processing of the SSA disability claim . In the absence of a decision on the SSA disability claim, OPM commences payment of the FERS disability without any reduction for SSA disability . The SSA disability award is paid retroactively in a lump-sum . As a result, OPM must re-compute the FERS disability annuity retroactively to apply the reduction for the retroactive SSA disability lump-sum award . RS is required to notify the annuitant of the overpayment . These overpayments are sometimes uncollectible by OPM because some debtors are simply financially incapable of repaying OPM, and OPM must terminate collection in accordance with provisions of Title 5 and Title 31, United States Code .
SSA Retroactive Awards SSA issues a retroactive lump sum payment
directly to a newly eligible disabled individual, less any required attorney fees . Social Security does not offset its benefit award by the amount of disability benefits/annuity paid by OPM (and has no legal requirement to do so) . SSA provides OPM with query access to its disability award database, but does not specifically notify OPM that a Federal annuitant has been awarded SSA disability (and has no legal

OPM Fiscal Year 2013 Agency Financial Report
Section 3 — other information
126
requirement to do so) . OPM instructs FERS disability annuitants to immediately notify OPM if SSA awards them a disability, and to set aside the sum total of SSA’s retroactive award in anticipation of recovery by OPM, but OPM only sporadically receives notification from annuitants about retroactive SSA awards . In many cases, the disability annuitants spend the retroactive sum before recovery by OPM .
Overpayment Recovery Currently, after due process, OPM recovers
overpayments through installment deductions directly from annuities (on-roll collections), or, in certain cases, such as very small recurring annuities, OPM must seek direct payments from debtors through its “off-roll” collection processes . Although the FERS disability annuitants are notified of their obligation to repay a FERS overpayment debt to the government, some debtors are simply financially incapable of repaying OPM .
Health Benefits ProgramWhile enhanced FEHB Plan oversight and
implementation of the audit resolution timelines are some of the positive steps HI has taken to strengthen internal controls, there is not always a direct correlation between root causes and remedial actions resulting in lower improper payments . This is largely due to the nature of the audit process . Although the audits are vital and effective as a compliance and oversight tool, they present challenges in meeting IPERA reporting requirements for projecting out-year improper payments, demonstrating mandatory reductions in improper payments, as well as out-year improper payment recovery targets . This may result in annual variances of tens of millions of dollars in improper payments reported from year to year .
Since the audit encompasses a core of large plans, supplemented by rotational audits of different carriers from year to year, amounts questioned can be significantly influenced by different types of audits, an audit’s scope, and improper payments that are recorded but later successfully contested by Plans .
OIG Investigative recoveries also vary widely from year to year based on the number of cases opened, successful prosecution, recovery and FEHB shares
involved . These variables may cause considerable reporting challenges and can result in obscuring or magnifying the effects of corrective actions .
Compliance with Other Key Legal and Regulatory Requirements
OPM is required to comply with other legal and regulatory financial requirements, such as the Debt Collection Improvement Act (DCIA) .
Compliance with the Debt Collection Improvement Act (DCIA)
In response to a steady increase in the amount of delinquent debt owed to the United States, and concern that appropriate actions were not being taken to collect this delinquent debt, Congress passed the DCIA of 1996, P .L . 104-134 . The purpose of the DCIA was to strengthen overall controls over collections due to the Government from private parties, including Federal employees . The DCIA has had a major impact on the way OPM makes its payments and collects the monies owed to it . Table 14 summarizes OPM’s debt management activity for September 2013 and 2012 . OPM complies with the DCIA via the following:
Cross-Servicing Under the DCIA, all Federal agencies must
refer past due, legally enforceable, non-tax debts that are more than 180 days delinquent to Treasury’s Bureau of the Fiscal Service (formerly the Financial Management Service-FMS) for collection through the Treasury Offset Program (TOP) . OPM has established an agreement with Treasury BFS to cross-service its debts, which allows BFS to automatically include the debts in the TOP as part of its collection effort . A debt is legally enforceable if there has been a final agency decision that the debt, in the amount stated, is due and there are no legal bars to collection action . To date, OPM has collected more than $8 .8 million via BFS cross servicing .

OPM Fiscal Year 2013 Agency Financial Report
Section 3 — other information
127
Table 14 — Debt Management Activity
Retirement Program ($ in Millions)
FY 2013 FY 2012
Total receivables at beginning of year $ 328.2 $ 288.3
New receivables and accruals 217.6 208.7
Less collections, adjustments, and amounts written-off 185.7 168.8
Total receivables at end of year $ 360.1 $ 328.2
Total delinquent $ 23.6 $ 71.8
Percent delinquent of total receivables 6.6% 21.9%
Health Benefits Program ($ in Millions)
FY 2013 FY 2012
Total receivables at beginning of year $ 30.2 $ 61.2
New receivables and accruals 68.3 209.8
Less collections, adjustments, and amounts written-off 77.4 240.8
Total receivables at end of year $ 21.1 $ 30.2
Total delinquent 8.4 15.4
Percent delinquent of total receivables 39.8% 51.0%
Travel and Purchase Card Usage OPM measures its effectiveness in travel and purchase card usage by monitoring the percentage of
the total outstanding balances for each that is 61 or more days old. Tables 15 and 16 compare OPM’s percentages that are 61or more days old to Governmentwide rates.
Table 15 — Travel Card Usage
($ in Thousands) FY 2013 FY 2012
Outstanding Balance $ 780.0 $ 487.0
Outstanding more than 61 days $ 0.0 $ 3.5
% outstanding more than 61 days (OPM) 0.00% 0.14%
% outstanding more than 61 days (Government wide) 4.50% 3.89%
Table 16 — Purchase Cards
($ in Thousands) FY 2013 FY 2012
Outstanding Balance $ 1,268.0 $ 2,574.0
Outstanding more than 61 days $ 0.00 $ 0.00
% outstanding more than 61 days (OPM) 0.00% 0.00%
% outstanding more than 61 days (Government wide) .51% .17%
As shown in the above charts, OPM’s percentage of travel and purchase card outstanding balances that are outstanding 61 days or more, are less than the related Governmentwide averages .
OPM Fiscal Year 2013 Agency Financial Report128
ap p e n D i x a ‑ ac r o n y M S a n D aB B r e v i at i o n S
(Unaudited)
Acronym Definition
ACA Affordable Care Act of 2010 (Patient Protection and Affordable Care Act – ACA)
AFGE American Federation of Government Employees
ALIL Actuarial Life Insurance Liability
AFR Agency Financial Report
APGs Agency Priority Goals
APR Annual Performance Report
ARPS Annuity Roll Processing System
BFS Bureau of the Fiscal Service
BPD Bureau of Public Debt
C&A Certification and Accreditation
CBIS Consolidated Business Information System
CFO Chief Financial Officer
CFOC Chief Financial Officer’s Council
CFR Code of Federal Regulations
CHCO Chief Human Capital Officer
CIC Capital Investment Committee
CIO Chief Information Officer
CLA Congressional & Legislative Affairs
CLCS Center for Leadership Capacity Services
CLIA Congressional, Legislative, & Intergovernmental Affairs
COLA Cost of Living Adjustment Factor
COOP Continuity of Operations Plan
COTS Commerical Off-The-Shelf
CPL Communications and Public Liaison
CRC Community-Rated Carrier
CBIS Consolidated Business Information System
Acronym Definition
CSRDF Civil Service Retirement and Disability Fund
CSRS Civil Service and Retirement Disability Fund
CSRS Civil Service Retirement System
CY Calendar Year
D&I Diversity and Inclusion
DAD Deputy Associate Director
DBTS Define Benefit Technology Solution
DCIA Debt Collection Improvement Act
DCCS Document Case Control System
DEU Delegated Examining Unit
DFAS Defense Finance and Accounting Service
DHS Department of Homeland Security
DISP Debt Issuance Suspension Period
DoD Department of Defense
DOT Department of Transportation
DSS Defense Security Service
EBS Employee Benefits System
ECTS Executive Correspondence Tracking System
EEO Equal Employment Opportunity
EEOC Equal Employment Opportunity Commission
EHRI Enterprise Human Resources Integration
eOPF Electronic Official Personnel Folder
EPV Expected Present Value
eQIP Electronic Questionnaire Investigations Processing
EOP Executive Office of the President

OPM Fiscal Year 2013 Agency Financial Report
Appendix A — Acronyms And AbbreviAtions
129
Acronym Definition
ERC Experience-Rated Carrier
ES Employee Services
ESC Executive Steering Committee
ESO Executive Secretariat and Ombudsman
EVMS Earned Value Management System
FAA Federal Aviation Administration
FASAB Federal Accounting Standards Advisory Board
FBWT Fund Balance With Treasury
FCP Federal Ceiling Price
FEDVIP Federal Employee Dental and Vision Insurance Program
FEGLI Federal Employee Group Life Insurance
FEHB Federal Employee Health Benefits
FEHBP Federal Employee Health Benefits Program
FEI Federal Executive Institute
FERCCA Federal Erroneous Retirement Coverage Corrections Act
FERS Federal Employee Retirement System
FFB Act Federal Financing Bank Act of 1973
FFMIA Federal Financial Management Improvement Act
FIS Federal Investigative Services
FISMA Federal Information Security Management Act
FLRA Federal Labor Relations Authority
FLSA Fair Labor Standards Act
FLTCIP Federal Long Term Care Insurance Program
FMFIA Federal Managers’ Financial Integrity Act
Acronym Definition
FMS Financial Management Service
FPRAC Federal Prevailing Rate Advisory Committee
FS Financial Services
FSA Flexible Spending Account
FSC Facilities, Security, & Contracting
FSM Financial Systems Modernization
FSS Federal Supply Schedule
FSSC Federal Shared Service Centers
FTE Full-time Equivalent
FY Fiscal Year
GAAP Generally Accepted Accounting Principles
GAO Government Accountability Office
GAS Government account series
GEAR Goals-engagement-accountability-results
GFIS Government Financial Information System
GFRS Governmentwide Financial Reporting System
GMRA Government Management Reform Act of 1994
GPRA Government Performance and Results Act
GPRAMA Government Performance and Results Act Modernization Act
GS General Schedule
GSA General Services Administration
GWA Government-wide Accounting
HB Health Benefits
HC Human Capital

OPM Fiscal Year 2013 Agency Financial Report
Appendix A — Acronyms And AbbreviAtions
130
Acronym Definition
HCAAF Human Capital Assessment and Accountability Framework
HCDW Health Care Data Warehouse
HCLMSA Human Capital Leadership and Merit Systems Accountability Division
HCO Human Capital Officers
HDHP High Deductible Health Plan
HI Healthcare and Insurance
HIT Health Information Technology
HMO Health Maintenance Organizations
HR Human Resources
HRD Human Resources Development
HR LOB Human Resources Line of Business
HRS Human Resources Solutions
HRSPC Human Resources Service Provider Consortium
HSA Health Savings Account
HUD Department of Housing and Urban Development
ICFR Internal Control over Financial Reporting
IO International Operations
IP Improper Payment
IPA Independent Public Accounting (firm)
IPERA Improper Payments Elimination and Recovery Act of 2010
IPERIA Improper Payment Elimination and Recovery Improvement Act
IPIA Improper Payments Information Act of 2002
IRS Internal Revenue Service
Acronym Definition
ISPP Information Security and Privacy Policy
IT Information Technology
LAIRS Labor Agreement Information Retrieval System
LI Life Insurance
MD&A Management Discussion and Analysis
MDC Management Development Center
MetLife Metropolitan Life Insurance Company
MOU Memorandum of Understanding
MSAC Merit System Audit & Compliance
MSPB Merit Systems Protection Board
N/A Not applicable
NFR Notice of Finding and Recommendation
NPRM Notice of Proposed Rulemaking
NRC Nuclear Regulatory Commission
NSPS National Security Personnel System
OCFO Office of the Chief Financial Officer
OCFO/PIC Office of the Chief Financial Officer/Policy and Internal Control
OCIO Office of the Chief Information Officer
OD Office of the Director
ODI Office of Diversity and Inclusion
OGC Office of the General Counsel
OIG Office of the Inspector General
OMB U . S . Office of Management and Budget
O/P Overpayment
OPEB Other postemployment
OPM Fiscal Year 2013 Agency Financial Report
Appendix A — Acronyms And AbbreviAtions
131
Acronym Definition
OPM U . S . Office of Personnel Management
ORB Other retirement benefits
PAAT Performance Appraisal Assessment Tool
PAR Performance and Accountability Report
PART Program Assessment and Rating Tool
PBM Pharmaceutical Benefits Manager
PIC Policy and Internal Control
PIO Performance and Improvement Officer
PMF Presidential Management Fellows
POA&M Plan of Action & Milestones
PPA Planning and Policy Analysis
PPA Federal Prompt Payment Act
PRHB Postretirement Health Benefits
PSRHB Postal Service Retiree Health Benefits
PSRHBF Postal Service Retiree Health Benefits Fund
PV Present Value
PY Prior Year
QIA Quality and Integrity Assurance
R&B Retirement and Benefits
RF Revolving Fund
RS Retirement Services
RSKMP Risk Management Plan
RSM Retirement Systems Modernization
SAOC Spending Authority from Offsetting Collections
SBR Statement of Budgetary Resources
Acronym Definition
SES Senior Executive Service
S&E Salaries and Expenses
SFFAS Statement of Federal Financial Accounting Standards
SNC Statement of Net Cost
SOL Services On-Line
SPFI Summary of Performance and Financial Information
SSA Social Security Administration
SSC Shared service centers
TBD To Be Determined
TJF Treasury Judgment Fund
TMA Training and Management Assistance
TOP Treasury Offset Program
U/P Underpayment
USC United States Code
USPS United States Postal Service
USSGL United States Standard General Ledger
VA Department of Veterans Affairs


United StateS Office Of PerSOnnel ManageMent
Chief Financial Officer1900 E Street, NW
Washington, DC 20415
OD/CFO