ageing of vanadium in soils and consequences for...
TRANSCRIPT
This is the peer reviewed version of the following article: Baken, S., Larsson, M.A., 1
Gustafsson, J.P., Cubadda, F., Smolders, E. 2012. Ageing of vanadium in soils and 2
consequences for bioavailability. European Journal of Soil Science 63, 839-847, which has 3
been published in final form at http://dx.doi.org/10.1111/j.1365-2389.2012.01491.x. This 4
article may be used for non-commercial purposes in accordance with Wiley Terms and 5
Conditions for self-archiving. 6
7
Vanadium ageing in soils 8
Ageing of vanadium in soils and consequences for bioavailability 9
S. BAKEN a, M. A. LARSSON b, J. P. GUSTAFSSON c, F. CUBADDA d & E. SMOLDERS a 10
a Leuven University, Department of Earth and Environmental Sciences, Kasteelpark 11
Arenberg 20 bus 2459, 3001 Leuven, Belgium, b Swedish University of Agricultural 12
Sciences, Department of Soil and Environment, Box 7014, 750 07 Uppsala, Sweden, c 13
KTH Royal Institute of Technology, Department of Land and Water Resources 14
Engineering, Teknikringen 76, 100 44 Stockholm, Sweden, and d Istituto Superiore di 15
Sanità, Department of Food Safety and Veterinary Public Health, Viale Regina Elena 16
299, 00161 Rome, Italy 17
Correspondence: S. Baken. E-mail: [email protected] 18
19
1

Summary 20
Total vanadium (V) concentrations in soils commonly range from 20 to 120 mg kg-1. 21
Vanadium directly added to soils is more soluble than geogenic V, and can be 22
phytotoxic at doses within this range of background concentrations. However, it is 23
unknown how slow sorption reactions change the fate and effect of added V in soils. 24
This study addresses the changes in V solubility, toxicity, and bioavailability in soils 25
over time. Four soils were amended with pentavalent V in the form of a soluble 26
vanadate salt, and extractable V concentrations were monitored over 100 days. The 27
toxicity to barley and tomato plants was evaluated in freshly spiked soils and in the 28
corresponding aged soils that were equilibrated for up to 330 days after spiking. The 29
V concentrations in 0.01 M CaCl2 soil extracts decreased approximately twofold 30
between 14 and 100 days after soil spiking, and the reaction kinetics were similar for 31
all soils. The phytotoxicity of added V decreased on average twofold between freshly 32
spiked and aged soils. The reduced toxicity was associated with a corresponding 33
decrease of V concentrations in the isolated soil solutions and in the shoots. The V 34
speciation in the soil solution of the aged soils was dominated by V(V); less than 8 % 35
was present as V(IV). Oxalate extractions suggest that the V(V) added to soils is 36
predominantly sorbed onto poorly crystalline oxyhydroxides. It is concluded that the 37
toxicity of V measured in freshly spiked soils may not be representative of soils 38
subject to a long-term V contamination in the field. 39
Introduction 40
The transition metal vanadium (V) is among the 20 most abundant elements in the 41
earth’s crust (Nriagu, 1998a), and therefore naturally occurs in soils. The total V 42
concentrations in European soils, measured in hydrogen fluoride digests, are on 43
2

average 68 mg kg-1 (with a 10th and 90th percentile of 18 and 123 mg kg-1), and the 44
aqua regia extractable V concentrations are about twofold lower (Salminen, 2005). 45
Vanadium in the environment may also be of anthropogenic origin. Anthropogenic 46
sources of V include mining activities, fossil fuel combustion, and the metal industry 47
where V is an important component of alloys. These sources may directly or 48
indirectly cause emissions of V into the environment (Gustafsson & Johnsson, 2004; 49
Panichev et al., 2006). 50
Vanadium in soils generally occurs in two redox forms which have contrasting 51
geochemical properties: V(IV) and V(V). Under oxic conditions, V(V) is the most 52
stable redox form, but it may be reduced to V(IV) by humic substances (Lu et al., 53
1998). Vanadium(IV) mainly occurs as the vanadyl oxocation VO2+, which is strongly 54
bound by different organic ligands including humic substances (Lu et al., 1998; 55
Gustafsson et al., 2007). Vanadium(V) commonly occurs as vanadate anions (HVO42- 56
or H2VO4-) and is strongly bound by iron oxides and hydroxides (Blackmore et al., 57
1996; Peacock & Sherman, 2004). The sorption of added V(V) across different soils 58
increases with increasing clay, organic matter, and poorly crystalline Fe and Al 59
oxyhydroxide contents, but appears unrelated to soil pH in the range between pH 4 60
and 7 (Gäbler et al., 2009). This is in line with the fairly constant affinity of V(V) for 61
goethite across this pH range (Peacock & Sherman, 2004). 62
Elevated V concentrations in the environment may adversely affect biota, 63
including humans, plants, aquatic organisms, and micro-organisms (Nriagu, 1998b; 64
Gustafsson & Johnsson, 2004). At elevated concentrations, V causes reddening of the 65
aerial parts, stunted growth, and death (Cannon, 1963). The phytotoxic effects of 66
V(V) may in part be explained by its capacity to inhibit phosphate-metabolising 67
systems (Seargeant & Stinson, 1979; Perlin & Spanswick, 1981). The reduction of 68
3
V(V) to V(IV) in plant roots has been observed and interpreted as a detoxification 69
mechanism since V(IV) is presumably less toxic to plants than V(V) (Morrell et al., 70
1986). In culture media, phytotoxicity has been observed at dissolved V 71
concentrations of 3 and 6 mg litre-1 (Kaplan et al., 1990a; Kaplan et al., 1990b). In 72
soils, phytotoxic concentrations of added V may be within the range of natural 73
background V concentrations due to the different solubility of both pools, but data are 74
scarce. Toxic effects may occur at added V concentrations as low as 75
30 mg added V kg-1 (Wang & Liu, 1999), whereas in other cases no effects were 76
observed at levels of up to 100 mg added V kg-1 (Kaplan et al., 1990b). 77
Ageing reactions in soils, i.e. the long-term changes in solubility that occur after 78
prolonged reaction times, have been observed for many trace metals (e.g. Barrow, 79
1998). Such ageing reactions may reduce the mobility and bioavailability of 80
chemicals. If ageing reactions are pronounced, toxicity data based on freshly spiked 81
soils have little environmental relevance and may yield limit concentrations below 82
natural background concentrations (Smolders et al., 2009). Therefore, quantitative 83
knowledge of such ageing processes is crucial for setting adequate limit 84
concentrations. Gradual immobilisation reactions of phosphate, an anion structurally 85
similar to vanadate, are well known and have been attributed to diffusion into soil 86
particles (van der Zee & van Riemsdijk, 1988; Barrow, 1991), but ageing of V in soils 87
has rarely been explored. Martin & Kaplan (1998) showed that V concentrations in 88
acid soil extracts of a field plot decreased fivefold over 18 months after spiking with 89
V(IV). No further decrease occurred after 12 additional months. Vangheluwe et al. 90
(2007) noted that 24 weeks after soil spiking with V(V), the V concentrations in the 91
pore waters of incubated soils had decreased by factors between 1.5 and 3.4 compared 92
4
to the V concentrations two weeks after spiking. The limited available data on V 93
ageing in soils, and on the toxicity of V in soils, warrant further studies. 94
The goal of this study was to extend the knowledge on ageing of V in soils, and to 95
evaluate the consequences of such ageing reactions on V solubility, bioavailability 96
and toxicity. Such knowledge is currently lacking, but is crucial for regulators in order 97
to set adequate limit concentrations. The objectives were to determine V sorption 98
kinetics in different soils, to compare V phytotoxicity and plant uptake between 99
freshly spiked and aged soils, and to relate the observed trends to differences in 100
solubility. 101
Materials and methods 102
Soils were sampled from the top 20 cm layer at four European locations. The soil 103
samples were air-dried, sieved (4 mm), and stored in plastic drums. Selected soil 104
properties are summarised in Table 1. The effective cation exchange capacity (eCEC) 105
was determined in a 0.01 M silver thiourea (AgTU) extract (Pleysier, 1980), and 106
oxalate extractable metals were determined in a 0.2 M ammonium oxalate extract at 107
pH 3 (solid:liquid ratio 1 g:50 ml, 2 hours equilibration in darkness) (Schwertmann, 108
1964). The soil pH was measured in a 0.01 M CaCl2 soil extract (2 h end-over-end 109
shaking, solid:liquid ratio 1 g:5 ml). Approximately 200 mg of soil material was 110
digested in aqua regia at 140°C in a hot block for 3 hours, the digests were then 111
diluted to 10 ml, and element concentrations were measured by ICP-OES (Inductively 112
Coupled Plasma – Optical Emission Spectroscopy) using a Perkin Elmer Optima 3300 113
DV. Vanadium was measured at a wavelength of 290.880 nm. The standard reference 114
material NRC Canada LKSD-4 (certified aqua regia-extractable V concentration of 115
32 mg V kg-1, standard deviation 10 mg V kg-1, n = 31, Lynch, 1990) and the soil 116
sample WEPAL 921 from the WEPAL international soil-analytical exchange program 117
5

(consensus value of acid extractable V concentration of 51.2 mg V kg-1, standard 118
deviation 6.6 mg V kg-1, n = 136) were included on a regular basis in the aqua regia 119
digestions. The recovery of V was on average 108 % for LKSD-4 (standard deviation 120
1.4 mg V kg-1, n = 4) and 96 % for WEPAL 921 (standard deviation 2.5 mg V kg-1, 121
n = 3). 122
Experiment 1: Vanadium reaction kinetics 123
Air-dry samples of all four studied soils (about 500 g) were wetted with deionised 124
water, incubated at 20°C in darkness for one week, and then amended with dissolved 125
analytical-grade sodium metavanadate (NaVO3) to nominal concentrations of 32 and 126
100 mg added V kg-1. Metavanadate reacts quickly with water to form orthovanadate 127
(VO43-) (Crans et al., 1995). This salt was preferred to sodium orthovanadate 128
(Na3VO4) because the latter would cause a greater change in both salinity and pH. 129
Soil spiking was performed on the bulk soil sample by spraying a spiking solution 130
(deionised water containing the adequate amount of dissolved NaVO3) over the soil 131
using a pipette. The volume of liquid added to each treatment of a soil was exactly the 132
same. After spiking, the soil samples were thoroughly mixed. The soil V 133
concentrations were measured as described earlier (ICP-OES after aqua regia 134
digestion) and were within 20 % of the nominal values. In preliminary experiments, it 135
was ascertained that this spiking method yielded homogenously spiked soils: the 136
variability in soil V concentrations in different subsamples of about 1 g was not 137
greater than the variability inherent to the digestion and ICP-OES analyses. After 138
spiking, the soil moisture content was increased with deionised water to 139
approximately 75 % of that at pF 2.0, and the soil samples were incubated at 20°C in 140
darkness in plastic pots. 141
6

The soil samples were extracted between 3 and 100 days after soil spiking with 142
0.01 M CaCl2 (solid:liquid ratio 1 g:1 ml, 4 hours end-over-end shaking). The 143
conditions in such extracts are assumed to mimick those in the soil solution (Degryse 144
et al., 2003) and such extracts have previously also been used for the quantification of 145
short-term V mobility (Cappuyns & Slabbinck, 2012). The extractions undertaken 100 146
days after soil spiking were performed in duplicate; at other times only one replicate 147
was extracted. The low replication of the experiment somewhat compromises the 148
reliability of the results. However, the repeatability between the replicate extractions 149
after 100 days was excellent: the coefficients of variation were below 0.03 for all 150
treatments except one. The unspiked and spiked Pustnäs, Säby, and Ter Munck soils 151
were also extracted with 0.2 M ammonium oxalate at pH 3 (solid:liquid ratio 152
1 g:50 ml, 2 hours equilibration in darkness) (Schwertmann, 1964) in an attempt to 153
quantify the V bound to poorly crystalline oxyhydroxides. The V concentrations in the 154
CaCl2 and oxalate extracts were measured by ICP-OES after centrifugation (3000 g, 155
15 min) and filtration of the supernatant (0.45 µm, disposable regenerated cellulose 156
filter). The V concentrations in both extractants and in blank extractions were below 157
the limit of quantification (approximately 3 µg litre-1) and therefore no blank 158
corrections were applied. 159
Soil spiking and pretreatment for toxicity testing 160
The toxicity assays were performed in freshly spiked and aged Pustnäs, Säby, and Ter 161
Munck soils. An unspiked control and seven treatment levels were established with 162
nominal added V concentrations of 3.2, 10, 32, 100, 320, 1000, and 163
3200 mg added V kg-1 dry soil. For the freshly spiked soils, air dry soils were 164
rewetted two weeks before toxicity testing to a moisture content of about 50 % of that 165
at pF 2.0 using deionised water. These soils were then incubated for one week at 20°C 166
7
in darkness. The soil samples were subsequently spiked in the same manner as 167
described above, except that for the 3200 mg V kg-1 treatment, the spiking was 168
performed using a suspension. The moisture content of the soil samples was increased 169
to approximately 75 % of that at pF 2.0 using deionised water. For the plant growth 170
assays, the soils were fertilised with 50 mg P kg-1 as dissolved KH2PO4 and 100 mg 171
N kg-1 as dissolved KNO3. The freshly spiked soils were then equilibrated for one 172
more week at 20°C in darkness prior to toxicity testing. 173
For the aged soils, the spiking was carried out in the same manner and at the same 174
seven doses of NaVO3 as described above. The control and spiked soils were placed 175
in pots (5 kg soil per pot) with free drainage in outdoor conditions. The Ter Munck 176
soil was spiked in April 2010 and aged in Belgium for approximately 150 days. The 177
Pustnäs and Säby soils were spiked in October 2009 and aged in Sweden for 178
approximately 330 days. After that, the aged soils were air-dried, sieved, further air-179
dried, and stored. Two weeks prior to the toxicity tests, the air-dried aged soils were 180
wetted to a moisture content of about 50 % of that at pF 2.0, and thenceforth treated in 181
the same manner as the freshly spiked soils. The V concentrations in the freshly 182
spiked and aged soils were measured with ICP-OES after aqua regia digestion as 183
described above. 184
Experiment 2: Root elongation assay 185
The root elongation assay (ISO 11269-1) evaluates treatment effects on root formation 186
and was performed on summer barley (Hordeum vulgare L.). Three replicate pots per 187
treatment were filled with approximately 500 g of soil. Barley seeds were 188
pregerminated in a wet cloth at 20°C in the dark for 24 hours, and five pregerminated 189
seeds were sown in each pot. The soil surface was covered with a 1 cm layer of inert 190
polyethylene beads to reduce evaporation. The pots were placed in randomised order 191
8

in a growth cabinet under the following conditions: 16—8 hour light-dark regime 192
(light intensity approximately 650 mol photons m-2 s-1), 20—16°C temperature 193
regime, and a constant humidity of 70 %. Moisture loss was replaced daily. After 5 194
days of growth, the longest root of each seedling was measured. For each pot, the 195
average length of the longest root of 5 seedlings was calculated. 196
Experiment 3: Plant growth assay and soil solution analysis 197
The plant growth assay (ISO 11269-2) assesses the toxic effect of V on the early 198
stages of growth of higher plants and was performed on summer barley and tomato 199
(Lycopersicon esculentum Miller). Four replicate pots per treatment were filled with 200
approximately 500 g of soil. Ten pregerminated barley seeds or 20 tomato seeds were 201
uniformly sown in each pot. The soil surface was covered with a 1 cm layer of inert 202
beads. The pots were placed in randomised order in a growth cabinet under the same 203
conditions as described above, and moisture loss was replaced daily. As soon as 70 % 204
of the seeds had emerged in each control pot (i.e. after 3 and 8—11 days for barley 205
and tomato, respectively), seedlings were thinned to yield five evenly spaced 206
representative specimens per pot. After an additional 13—15 days of growth, shoots 207
were cut and dry shoot mass in each pot was recorded after oven drying at 65°C for at 208
least one day. The dried barley plant material was crushed and approximately 200 mg 209
were digested with 3 or 4 ml of 67 % nitric acid at 180°C in a hot block. Digests were 210
diluted to 5 ml and element concentrations were measured by ICP-OES. The tomato 211
leaf sample NIST 1573a (certified total V concentration of 0.835 mg V kg-1, 95 % 212
confidence limits ± 0.010 mg V kg-1) was included in each batch and its recovery was 213
on average 91 % (standard deviation 0.08 mg V kg-1, n = 6). 214
After the plant growth assay, the soils of the control treatment and of at least two 215
treatment levels around the EC50 (added V concentration at which 50 % reduction in 216
9
response variable is observed, see below) of both freshly spiked and aged soils were 217
sampled in duplicate, i.e. from two different replicate pots. Their moisture content 218
was increased to between 80 and 90 % of that at pF 2.0 in order to extract a sufficient 219
amount of soil solution, and the soils were incubated for 3 days. Thereafter, the soil 220
solution was extracted using a direct centrifugation method (Merckx et al., 2001): 221
approximately 50 g of soil sample was centrifuged at approximately 3000 g for 15 222
minutes during which the soil solution drained through a glasswool plug into a 223
collecting vial below. The soil solutions of the freshly spiked soils were extracted 224
between 26 and 33 days after spiking, and those of the aged soils about 190 (Ter 225
Munck) or 370 (Pustnäs, Säby) days after spiking. The soil solution pH was measured 226
and V concentrations were determined with ICP-OES. 227
The V speciation was measured in one treatment level close to the EC50 of each 228
aged soil. The centrifugation method did not yield enough soil solution volume for the 229
V speciation analysis. Therefore, the V speciation was measured in a 0.01 M CaCl2 230
soil extract (4 h end-over-end shaking, solid:liquid ratio 1 g:1 ml, one replicate), and it 231
was assumed that the speciation in such extracts was similar to that in the soil 232
solution. The V(V) and V(IV) concentrations were measured within a week according 233
to the method of Aureli et al. (2008). The V(V) and V(IV) species were stabilised by 234
converting them into V–EDTA complexes and determined by anion exchange liquid 235
chromatography-inductively coupled plasma mass spectrometry (HPLC-ICP-MS), 236
using a Perkin Elmer Series 200 chromatographic system and an Elan DRC II ICP-237
MS. Post-column recovery was evaluated by comparing the sum of the V species 238
determined by HPLC-ICP-MS with total V determined by ICP-MS and was 102 % on 239
average. 240
Statistical analysis 241
10
The sorption kinetics, i.e. the V concentrations in CaCl2 extracts, were fitted using a 242
reversible first order kinetic model: [V] = A · exp(-k · t) + [Veq], where k is a rate 243
constant (the sum of the forward and backward first order rate constants), and [Veq] is 244
the V concentration at equilibrium. The concentration profiles over time (Figure 1; see 245
below) suggest that the V concentration is close to equilibrium in all soils after 100 246
days, and therefore it was assumed that the [Veq] was equal to the V concentration in 247
the extract prepared 100 days after spiking (averaged over two replicate extracts). The 248
linearised form of the above model, log([V] – [Veq]) = log(A) – k · t, was then used to 249
fit the V concentrations in the extracts prepared between 3 and 30 days after spiking 250
with a least-squares algorithm. The assumption of near-equilibrium after 100 days is 251
not backed by longer term data, but is made here only for the purpose of fitting the 252
first order kinetic model using two instead of three parameters ([Veq] is not fitted but 253
fixed). When all three parameters were fitted, unrealistic fits were obtained that did 254
not follow the trend suggested by the data. Since there is no further data available, the 255
results should not be extrapolated beyond 100 days after spiking. 256
A 3-parameter log-logistic dose-response model was fitted to the dose-response 257
plots of toxicity assays (Doelman & Haanstra, 1989): Y = C · [1 + exp(b · (ln X –258
ln EC50))]-1, where Y is the response variable, C the upper limit of the response 259
variable, b the slope parameter, X the dose variable, and EC50 the dose at which a 260
50 % reduction in the response variable was obtained. The soil added V concentration 261
was used as the dose variable since native V in soils is much less soluble than added 262
V (see below). It was calculated as the measured V concentration in aqua regia digests 263
minus the background V concentration. However, for treatments with nominal 264
added V concentrations of 3.2 and 10 mg kg-1, i.e. lower than the background V 265
concentration, the precision of this difference was low, and therefore nominal added 266
11
V concentrations were used. An arbitrary small value of 1 mg added V kg-1 was 267
assigned to the control treatment because the dose is expressed in log units in the 268
empirical model. Model parameters and their standard errors were estimated with the 269
Marquardt method (Marquardt, 1963) using the NLIN procedure of the statistical 270
software SAS. The difference between pairs of EC50 estimates was tested for 271
significance by estimating its variance as the sum of the variance of each separate 272
EC50 value, and by then performing a single sided t-test at P = 0.05. 273
Sorption curves were drawn by plotting the soil added V concentrations (as 274
measured in aqua regia digests) against the V concentrations measured in the isolated 275
soil solutions. These data were fitted with a Freundlich-type sorption model, 276
VS = K · [V]n, where [V] is the V concentration in the soil solution, and VS the sorbed 277
V concentration. The measured soil added V concentration was used here as a 278
surrogate for the sorbed V concentration VS. The NLIN procedure (SAS) was used to 279
calculate parameter estimates and their standard errors with a least squares algorithm. 280
Results and discussion 281
Vanadium reaction kinetics (experiment 1) 282
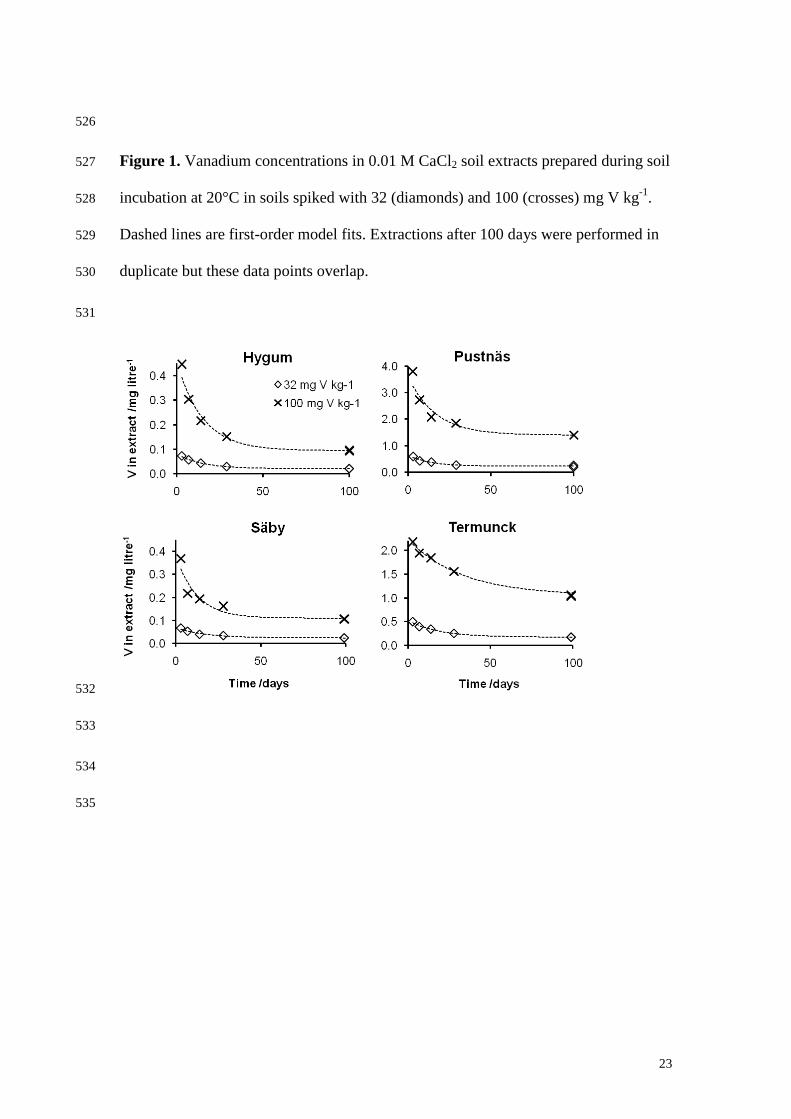
The V concentrations in dilute CaCl2 extracts decreased over time (Figure 1). The 283
fitted rate constants for the sorption of V in soils varied surprisingly little across the 284
four studied soils and were between 0.03 and 0.08 day-1 (Table 2). The fitted curve 285
was used to calculate the soluble V concentration 14 days after spiking, [V14], and this 286
value was compared to the [V100] measured after 100 days. The quotient [V14]:[V100] 287
was calculated, and these ageing factors ranged between 1.6 and 2.5 (average 1.9, 288
standard error 0.1) across all treatments. The replication in this assay was low and 289
therefore reliability is somewhat compromised. However, agreement with other assays 290
12
is excellent (see below), and the ageing factor of about 2 is also in good agreement 291
with earlier work (Vangheluwe et al., 2007). Martin & Kaplan (1998) reported a 292
fivefold solubility difference between freshly spiked and aged soils, but they spiked 293
with a V(IV) salt and at much lower concentrations which may explain the difference. 294
The pH of the soil extracts after 100 days was between 0.1 and 0.5 units lower 295
compared to the corresponding values obtained 7 days after spiking, likely due to 296
microbial activity. This acidification may have affected V sorption, but pH effects on 297
V sorption in soils are generally small between pH 4 and 7 (Gäbler et al., 2009). 298
Therefore, this effect is assumed to be of limited importance. 299
In the oxalate extracts prepared 3 days after soil spiking, the mean V recovery 300
was 98 % of the nominal added V with a standard error of 4 %. Oxalate extractions 301
are routinely used for the quantification of poorly crystalline Fe, Al and Mn 302
oxyhydroxides because oxalate dissolves such oxyhydroxides (Schwertmann, 1964). 303
Therefore, the near complete recovery indicates that added V(V) in these soils was 304
predominantly sorbed onto poorly crystalline oxyhydroxides, either in reversible or in 305
irreversible form. This finding is in line with previous studies on phosphate which is 306
structurally similar to vanadate (van der Zee & van Riemsdijk, 1988). It is also in 307
agreement with the well documented high affinity of V(V) for oxyhydroxides 308
(Blackmore et al., 1996; Peacock & Sherman, 2004), and with Gäbler et al. (2009) 309
who found a strong correlation between V sorption in soils and poorly crystalline 310
oxyhydroxide content. 311
In the unspiked soils, mean recoveries of V in oxalate extracts varied between 13 312
and 35 % of the aqua regia soluble V. The much lower recovery of the background V 313
shows that it reacts in a different way from added V. This agrees with earlier studies 314
(Gustafsson & Johnsson, 2004; Gäbler et al., 2009). We speculate that in the 315
13

environment a large fraction of the naturally present V is essentially unreactive in 316
soils at timescales shorter than the chemical weathering processes of minerals. This 317
view is supported by the fact that average aqua regia extractable V concentrations in 318
soils are twofold lower compared to total (HF extractable) V concentrations 319
(Salminen, 2005). 320
Root elongation and plant growth assays (experiments 2 and 3) 321
The aged soils were assessed for changes in V concentration, V speciation, and pH. 322
Such changes should ideally be minor in order to allow a reliable comparison between 323
freshly spiked and aged treatments. The V concentrations in the aqua regia digests 324
indicate that, during the ageing process outdoors, a large fraction of the added V in the 325
high treatment levels was removed, likely due to leaching. This effect was the most 326
pronounced in the Pustnäs soil: approximately 160 mg added V kg-1 was left in the 327
three highest treatment levels which were initially amended with 320, 1000, and 328
3200 mg V kg-1. However, this does not pose a problem for the comparison of toxicity 329
in freshly spiked and aged treatments: leaching effects are accounted for by using the 330
measured soil added V concentration after ageing as the dose variable. The speciation 331
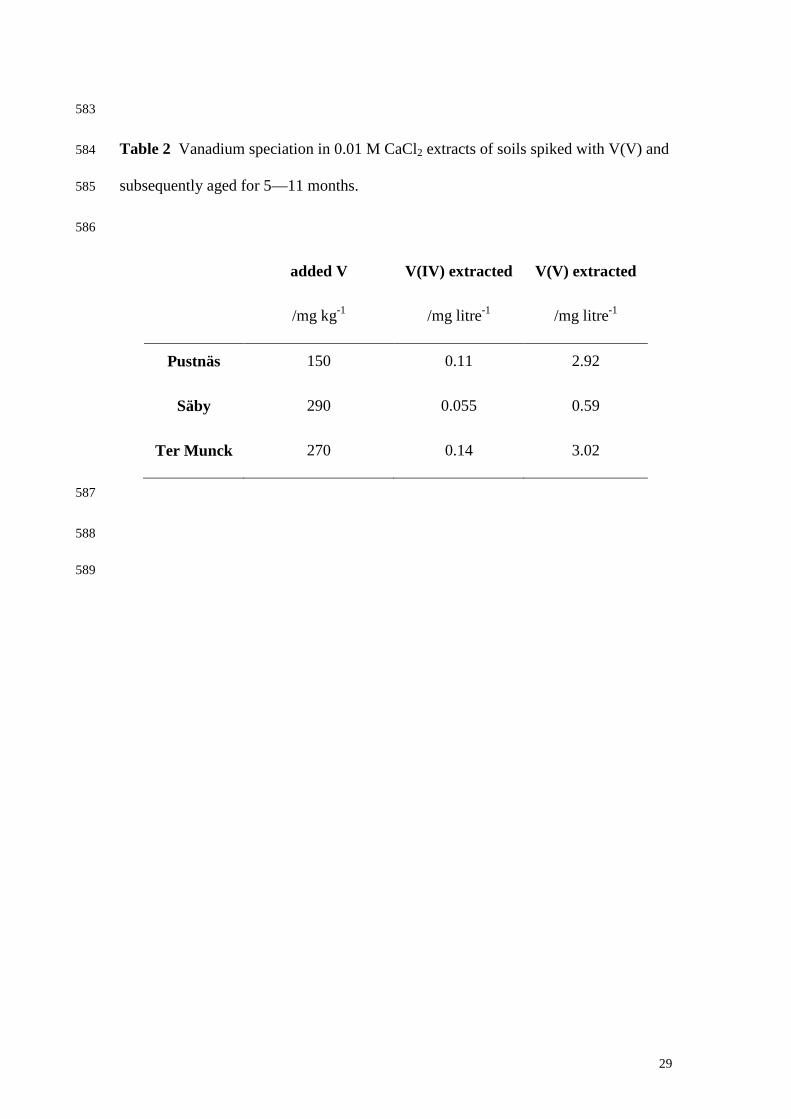
measurements show that only a small amount of the soluble V in aged soils (< 8 %) 332
was present as V(IV), the remainder being present as V(V) (Table 3). The reduction 333
of V(V) to V(IV) may render it less toxic (Morrell et al., 1986), but our results show 334
that even after prolonged ageing periods, this reaction was not important in the 335
studied soils. The pH of the aged soils generally did not differ more than 0.3 units 336
from that of the freshly spiked soils. Overall, no important changes in soil chemical 337
properties were detected that would compromise a reliable comparison between 338
freshly spiked and aged treatments. 339
14
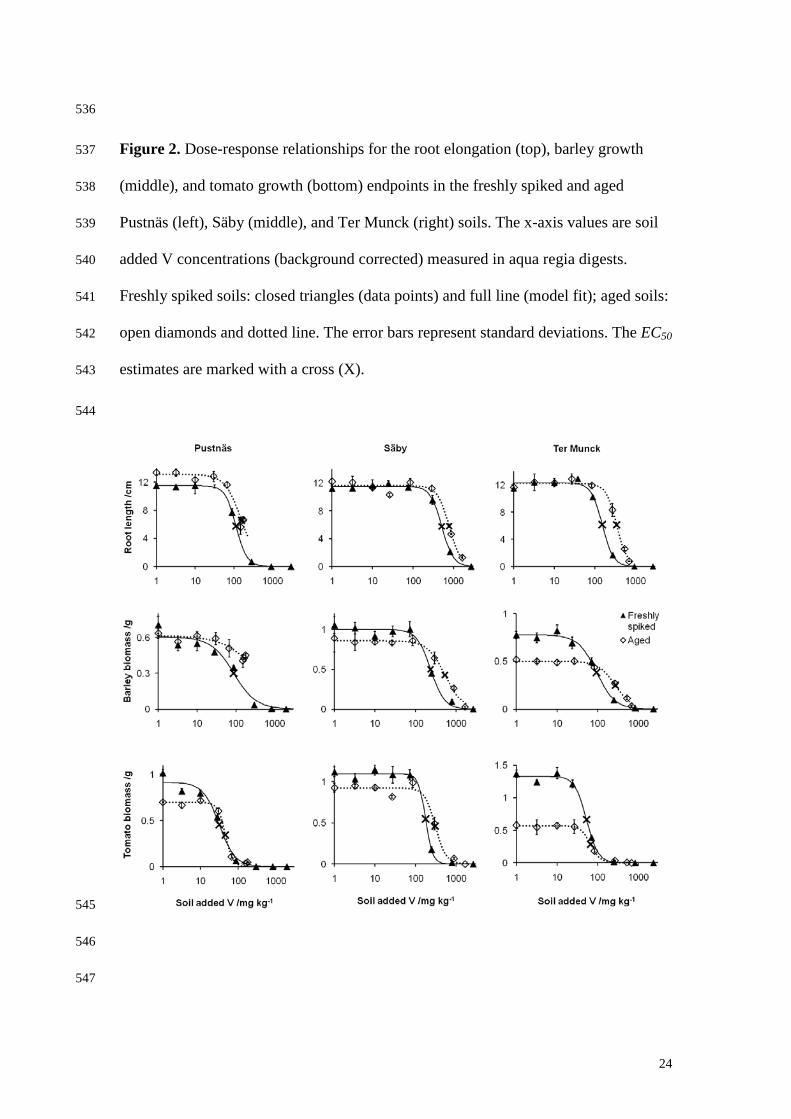
The plant response data and their fitted dose-response curves for freshly spiked 340
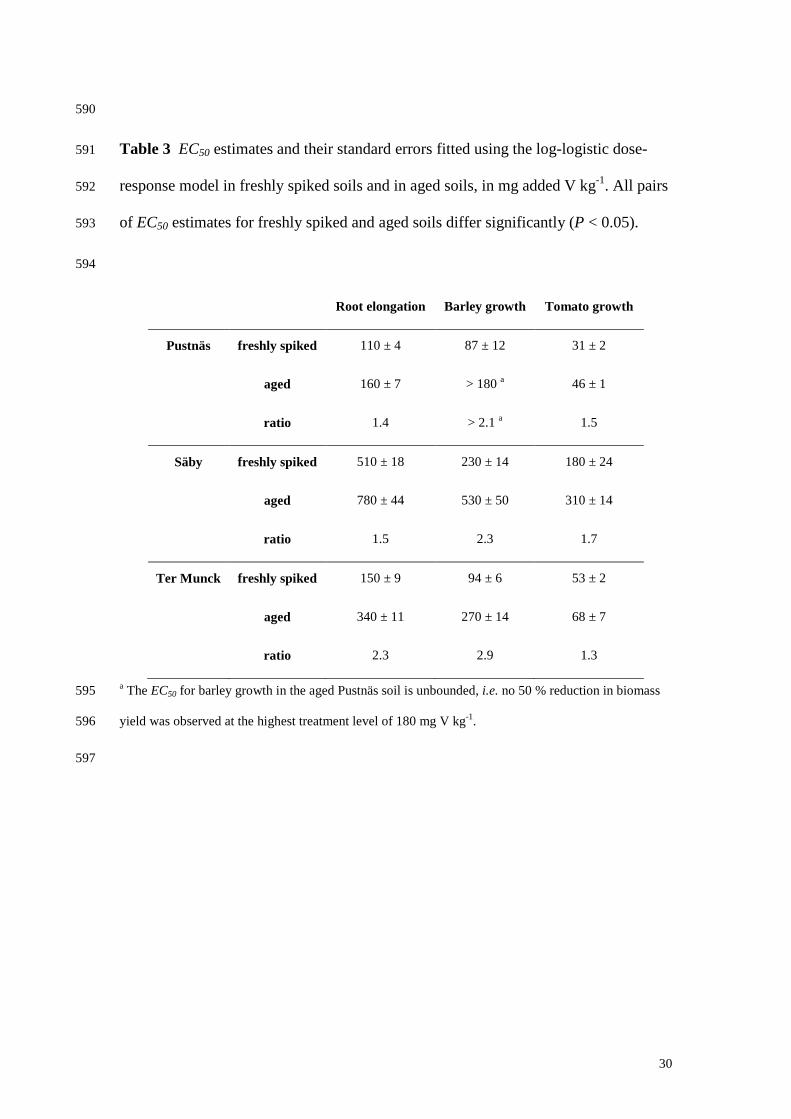
and aged soils are shown in Figure 2. The corresponding fitted EC50 estimates and 341
their standard errors are shown in Table 4. The EC50 estimates are in line with earlier 342
data on V toxicity in soils (Kaplan et al., 1990b; Wang & Liu, 1999). Considerable 343
differences are observed depending on the endpoint and on the soil. Barley root 344
elongation was generally the least sensitive endpoint, followed by barley growth and 345
tomato growth. Vanadium toxicity was generally the least pronounced in the Säby 346
soil, followed by the Ter Munck and the Pustnäs soils. The clay and poorly crystalline 347
Fe contents increased in the order Pustnäs < Ter Munck < Säby, and therefore the 348
toxicity differences between the studied soils are in agreement with the strong 349
correlation between clay content and V sorption, and between poorly crystalline Fe 350
content and V sorption (Gäbler et al., 2009). A comparison of the toxicity data for 351
freshly spiked and aged treatments shows that the EC50 estimates of aged soils 352
exceeded those of freshly spiked soils by factors between 1.3 and 2.9 (average 1.9, 353
standard error 0.2, Table 4). All these pairs of EC50 estimates differed significantly 354
(P < 0.05). In other words, ageing reduced V toxicity approximately twofold. The 355
three studied soils showed no difference in ageing factors, but more rigorous studies 356
are needed before this finding can be extended to other soil types. The above results 357
are in good agreement with the twofold decrease in CaCl2-extractable V 358
concentrations between 14 and 100 days after soil spiking (experiment 1). The 359
extractions at day 14 and day 100 may be considered to represent the situation in 360
freshly spiked soils and aged soils, respectively. It is concluded that measurements of 361
V toxicity in freshly spiked soils may not be representative of long-term contaminated 362
soils in the field. 363
15

The average measured V concentrations in barley shoots are plotted against the 364
soil added V concentrations (Figure 3). Variability between replicate experiments was 365
low: the coefficient of variation between seven treatments performed in duplicate or 366
triplicate was between 0.01 and 0.12. The shoot V concentrations in the control 367
treatments varied little across soils and ranged from 0.2 to 0.3 mg V kg-1 dry plant 368
tissue. This agrees well with the range of 0.18—0.42 mg V kg-1 dry plant tissue 369
reported for common dry weight based V concentrations in grass shoots grown on 370
unpolluted soils (Kabata-Pendias & Pendias, 2001). At low soil added V 371
concentrations, shoot V concentrations were not or marginally increased compared to 372
the control treatment. As soil added V concentrations increase (to about half the EC50 373
value and above), shoot V concentrations increased to values of 1 mg V kg-1 and 374
above. At these elevated added V concentrations, shoot V concentrations in aged 375
treatments were significantly (P < 0.05) lower than those in the corresponding freshly 376
spiked treatments. This confirms that V toxicity is associated with an increased V 377
translocation to the shoot, and that ageing reactions result in a reduced bioavailability 378
and translocation of V. It is concluded that, over time, ageing reactions cause V added 379
to soils to become less bioavailable and toxic. 380
Soil solution analysis (experiment 3) 381
Analysis of the soil solutions of unamended soils isolated after the barley growth 382
assay revealed V concentrations between 0.005 and 0.020 mg litre-1. The partition 383
coefficients of geogenic V in the unamended soils (Kd = VS / [V]) were between 10 384
and 60 times greater than those of freshly added V in the soils spiked with 385
32 mg V kg-1 (a concentration within the range of the geogenic V concentrations of 386
the studied soils). The low solubility of V in soils is in agreement with earlier studies 387
16

(Cappuyns & Slabbinck, 2012). This again highlights the difference between the 388
background V and the V added to soils as also discussed earlier. 389
The added V concentrations are plotted against the V concentrations in isolated 390
soil solutions, and fitted Freundlich-type isotherms are shown (Figure 4). The EC50 391
estimates for barley growth in each freshly spiked soil are indicated with a horizontal 392
line. Freundlich parameters for freshly spiked and aged treatments differed (P < 0.05), 393
showing greater V solubility in the freshly spiked treatments. The difference in 394
solubility between treatments was quantified by evaluating fitted isotherms at VS 395
concentrations equal to the EC50 estimates for barley growth in freshly spiked soils 396
(horizontal line in Figure 4). These VS concentrations were selected because they 397
represent the toxic range of V in soils. The V concentrations in the soil solutions of 398
aged treatments calculated in this manner were 1.7, 2.6, and 2.3 times lower than 399
those in the corresponding freshly spiked treatments of the Pustnäs, Säby, and Ter 400
Munck soils, respectively. These factors are in excellent agreement with and confirm 401
the results discussed earlier. Phytotoxicity in aged soils is approximately twofold 402
lower compared to freshly spiked soils, and this is associated with a twofold lower V 403
solubility. 404
Conclusions 405
Taken together, it has been shown that soluble V concentrations in four different soils 406
decreased approximately twofold between 14 and 100 days after soil spiking with 407
V(V). These results were modelled using a simple reversible first-order model with a 408
kinetic rate constant between 0.03 and 0.08 day-1. After ageing reaction times from 409
150 to 330 days, V phytotoxicity was reduced approximately twofold compared to the 410
corresponding freshly spiked soils. Dissolved V concentrations in the isolated soil 411
solutions of such aged soils were also about twofold lower than those in freshly 412
17
spiked soils. The decreased phytotoxicity in aged soils was accompanied by a 413
decreased V translocation to the shoot. Overall, the effects of V ageing reactions 414
across the four studied soils were surprisingly similar, but more studies are warranted 415
in order to check if this finding can be extrapolated to other soil types. Extractions 416
with oxalate suggest that V(V) added to soils is predominantly bound to poorly 417
crystalline oxyhydroxides, whereas this is only true for a small fraction of the 418
naturally present V in soils. The naturally present V in the investigated soils is much 419
less soluble than the freshly added V. If EC50 values are expressed as added V, they 420
often are within the common range of background V concentrations in soils. Toxicity 421
data measured in freshly spiked soils may not be representative for long-term and well 422
equilibrated soil contaminations in the field. 423
Acknowledgements 424
We thank the Vanadium Consortium for funding this research, and Astrid Voigt and 425
Koen Oorts for coordinating it. The study may not be freely used to comply with 426
regulatory requirements like REACh without the formal agreement of the Vanadium 427
Consortium. We thank Frans Schoovaerts, Kristin Coorevits, Karla Moors, Karlien 428
Cassaert, and Peter Salaets for general and technical assistance, and Marilena 429
D’Amato and Andrea Raggi for carrying out the speciation analysis. We also thank 430
Daniel Kaplan and two reviewers for their comments and suggestions. Stijn Baken 431
thanks the FWO-Research Foundation Flanders for a PhD fellowship. 432
References 433
F. Aureli, S. Ciardullo, M. Pagano, A. Raggi & F. Cubadda. 2008. Speciation of 434
vanadium(IV) and (V) in mineral water by anion exchange liquid chromatography-435
18

inductively coupled plasma mass spectrometry after EDTA complexation. Journal 436
of Analytical Atomic Spectrometry, 23, 1009-1016. 437
N.J. Barrow. 1991. Testing a mechanistic model. XI. The effects of time and of level 438
of application on isotopically exchangeable phosphate. Journal of Soil Science, 42, 439
277-288. 440
N.J. Barrow. 1998. Effects of time and temperature on the sorption of cadmium, zinc, 441
cobalt, and nickel by a soil. Australian Journal of Soil Research, 36, 941-950. 442
D.P.T. Blackmore, J. Ellis & P.J. Riley. 1996. Treatment of a vanadium-containing 443
effluent by adsorption-coprecipitation with iron oxyhydroxide. Water Research, 30, 444
2512-2516. 445
H.L. Cannon. 1963. The biogeochemistry of vanadium. Soil Science, 96, 196-204. 446
V. Cappuyns & E. Slabbinck. 2012. Occurrence of vanadium in Belgian and 447
European alluval soils. Applied and Environmental Soil Science, 2012. 448
D.C. Crans, M. Mahroof-Tahir & A.D. Keramidas. 1995. Vanadium chemistry and 449
biochemistry of relevance for use of vanadium compounds as antidiabetic agents. 450
Molecular and Cellular Biochemistry, 153, 17-24. 451
F. Degryse, K. Broos, E. Smolders & R. Merckx. 2003. Soil solution concentration of 452
Cd and Zn can be predicted with a CaCl2 soil extract. European Journal of Soil 453
Science, 54, 149-157. 454
P. Doelman & L. Haanstra. 1989. Short- and long-term effects of heavy metals on 455
phosphatase activity in soils: an ecological dose response model approach. Biology 456
and Fertility of Soils, 8, 235-241. 457
H.E. Gäbler, K. Gluh, A. Bahr & J. Utermann. 2009. Quantification of vanadium 458
adsorption by German soils. Journal of Geochemical Exploration, 103, 37-44. 459
19

J.P. Gustafsson & L. Johnsson. 2004. Vanadin i Svensk miljö - förekomst och 460
toxicitet (Vanadium in the Swedish environment - occurrence and toxicity). KTH, 461
Stockholm, Available online at 462
http://www2.lwr.kth.se/Publikationer/PDF_Files/LWR_REPORT_3009.pdf. 463
J.P. Gustafsson, I. Persson, D.B. Kleja & J.W.J. Van Schaik. 2007. Binding of 464
iron(III) to organic soils: EXAFS spectroscopy and chemical equilibrium modeling. 465
Environmental Science & Technology, 41, 1232-1237. 466
A. Kabata-Pendias & H. Pendias. 2001. Trace elements in soils and plants, 3rd 467
edition. CRC Press. 468
D.I. Kaplan, D.C. Adriano, C.L. Carlson & K.S. Sajwan. 1990a. Vanadium - Toxicity 469
and accumulation by beans. Water Air and Soil Pollution, 49, 81-91. 470
D.I. Kaplan, K.S. Sajwan, D.C. Adriano & S. Gettier. 1990b. Phytoavailability and 471
toxicity of beryllium and vanadium. Water Air and Soil Pollution, 53, 203-212. 472
X.Q. Lu, W.D. Johnson & J. Hook. 1998. Reaction of vanadate with aquatic humic 473
substances: An ESR and V-51 NMR study. Environmental Science & Technology, 474
32, 2257-2263. 475
J. Lynch. 1990. Provisional elemental values for eight new geochemical lake sediment 476
and stream sediment reference materials LKSD-1, LKSD-2, LKSD-3, LKSD-4, 477
STSD-1, STSD-2, STSD-3 and STSD-4. Geostandards Newsletter, 14, 153-167. 478
D.W. Marquardt. 1963. An algorithm for least-squares estimation of nonlinear 479
parameters. Journal of the Society for Industrial and Applied Mathematics, 11, 431-480
441. 481
20
H.W. Martin & D.I. Kaplan. 1998. Temporal changes in cadmium, thallium, and 482
vanadium mobility in soil and phytoavailability under field conditions. Water Air 483
and Soil Pollution, 101, 399-410. 484
R. Merckx, K. Brans & E. Smolders. 2001. Decomposition of dissolved organic 485
carbon after soil drying and rewetting as an indicator of metal toxicity in soils. Soil 486
Biology and Biochemistry, 33, 235-240. 487
B.G. Morrell, N.W. Lepp & D.A. Phipps. 1986. Vanadium uptake by higher plants - 488
some recent developments. Environmental Geochemistry and Health, 8, 14-18. 489
J.O. Nriagu ed. 1998a. Vanadium in the environment. Part 1: Chemistry and 490
biochemistry. Wiley. 491
J.O. Nriagu ed. 1998b. Vanadium in the environment. Part 2: Health effects. Wiley. 492
N. Panichev, K. Mandiwana, D. Moema, R. Molatlhegi & P. Ngobeni. 2006. 493
Distribution of vanadium(V) species between soil and plants in the vicinity of 494
vanadium mine. Journal of Hazardous Materials, 137, 649-653. 495
C.L. Peacock & D.M. Sherman. 2004. Vanadium(V) adsorption onto goethite (alpha-496
FeOOH) at pH 1.5 to 12: A surface complexation model based on ab initio 497
molecular geometries and EXAFS spectroscopy. Geochimica et Cosmochimica 498
Acta, 68, 1723-1733. 499
D.S. Perlin & R.M. Spanswick. 1981. Characterization of ATPase activity associated 500
with corn leaf plasma-membranes. Plant Physiology, 68, 521-526. 501
J.L. Pleysier. 1980. A single-extraction method using silver-thiourea for measuring 502
exchangeable cations and effective CEC in soils with variable charges. Soil Science, 503
129, 205-211. 504
21
R. Salminen ed. 2005. Geochemical atlas of Europe, part one. Geological Survey of 505
Finland, Espoo, Finland. 506
U. Schwertmann. 1964. Differenzierung der Eisenoxide des Bodens durch Extraktion 507
mit Ammoniumoxalat Lösung. Zeitschrift für Pflanzenernährung, Düngung, 508
Bodenkunde, 105, 194-202. 509
L.E. Seargeant & R.A. Stinson. 1979. Inhibition of human alkaline-phosphatases by 510
vanadate. Biochemical Journal, 181, 247-250. 511
E. Smolders, K. Oorts, P. Van Sprang, I. Schoeters, C.R. Janssen, S.P. McGrath, et al. 512
2009. Toxicity of trace metals in soil as affected by soil type and aging after 513
contamination: using calibrated bioavailability models to set ecological soil 514
standards. Environmental Toxicology and Chemistry, 28, 1633-1642. 515
S.E.A.T.M. van der Zee & W.H. van Riemsdijk. 1988. Model for long-term phosphate 516
reaction kinetics in soil. Journal of Environmental Quality, 17, 35-41. 517
M. Vangheluwe, M. Vandenbroele, P. Van Sprang, E. Smolders, F. Degryse, A. 518
Ruttens, et al. 2007. Evaluatie normstelling bodem en secundaire grondstoffen voor 519
bijkomende metalen (Evaluation of standards for additional metals in soil and 520
secondary raw materials). Report. Arcadis, Katholieke Universiteit Leuven & 521
Limburgs Universitair Centrum. 522
J.F. Wang & Z. Liu. 1999. Effect of vanadium on the growth of soybean seedlings. 523
Plant and Soil, 216, 47-51. 524
525
22
526
Figure 1. Vanadium concentrations in 0.01 M CaCl2 soil extracts prepared during soil 527
incubation at 20°C in soils spiked with 32 (diamonds) and 100 (crosses) mg V kg-1. 528
Dashed lines are first-order model fits. Extractions after 100 days were performed in 529
duplicate but these data points overlap. 530
531
532
533
534
535
23
536
Figure 2. Dose-response relationships for the root elongation (top), barley growth 537
(middle), and tomato growth (bottom) endpoints in the freshly spiked and aged 538
Pustnäs (left), Säby (middle), and Ter Munck (right) soils. The x-axis values are soil 539
added V concentrations (background corrected) measured in aqua regia digests. 540
Freshly spiked soils: closed triangles (data points) and full line (model fit); aged soils: 541
open diamonds and dotted line. The error bars represent standard deviations. The EC50 542
estimates are marked with a cross (X). 543
544
545
546
547
24

548
Figure 3 Average barley shoot V concentrations plotted against soil added V 549
concentrations. Freshly spiked soils: closed triangles connected with full lines; aged 550
soils: open diamonds connected with dashed lines. Coefficients of variation between 551
replicate measurements were between 0.01 and 0.12. 552
553
554
555
556
557
25

558
Figure 4 Sorption isotherms with the soil added V (background corrected) plotted 559
against the V concentration in isolated soil solutions. Freshly spiked soils: closed 560
triangles (data points) + full line (fitted Freundlich isotherm); aged soils: open 561
diamonds + dashed line. The horizontal line indicates the EC50 for barley growth in 562
the freshly spiked soils. 563
564
565
566
567
26
568
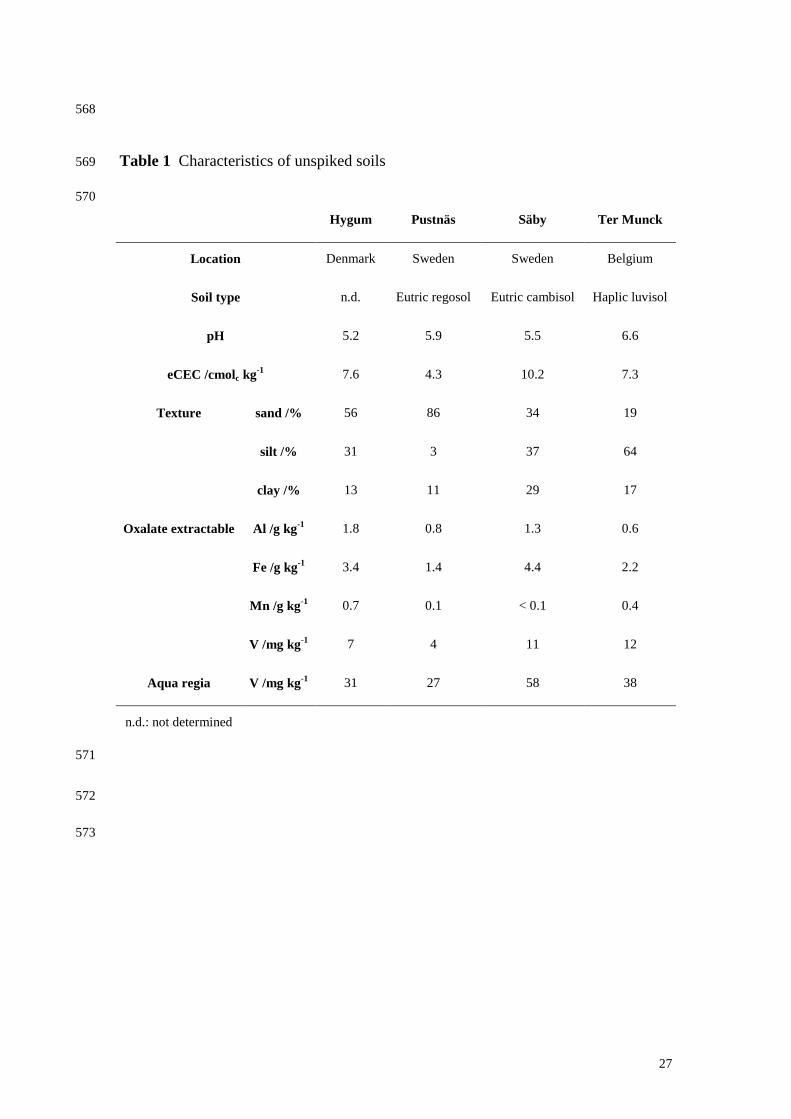
Table 1 Characteristics of unspiked soils 569
570
Hygum Pustnäs Säby Ter Munck
Location Denmark Sweden Sweden Belgium
Soil type n.d. Eutric regosol Eutric cambisol Haplic luvisol
pH 5.2 5.9 5.5 6.6
eCEC /cmolc kg-1 7.6 4.3 10.2 7.3
Texture sand /% 56 86 34 19
silt /% 31 3 37 64
clay /% 13 11 29 17
Oxalate extractable Al /g kg-1 1.8 0.8 1.3 0.6
Fe /g kg-1 3.4 1.4 4.4 2.2
Mn /g kg-1 0.7 0.1 < 0.1 0.4
V /mg kg-1 7 4 11 12
Aqua regia V /mg kg-1 31 27 58 38
n.d.: not determined
571
572
573
27
574
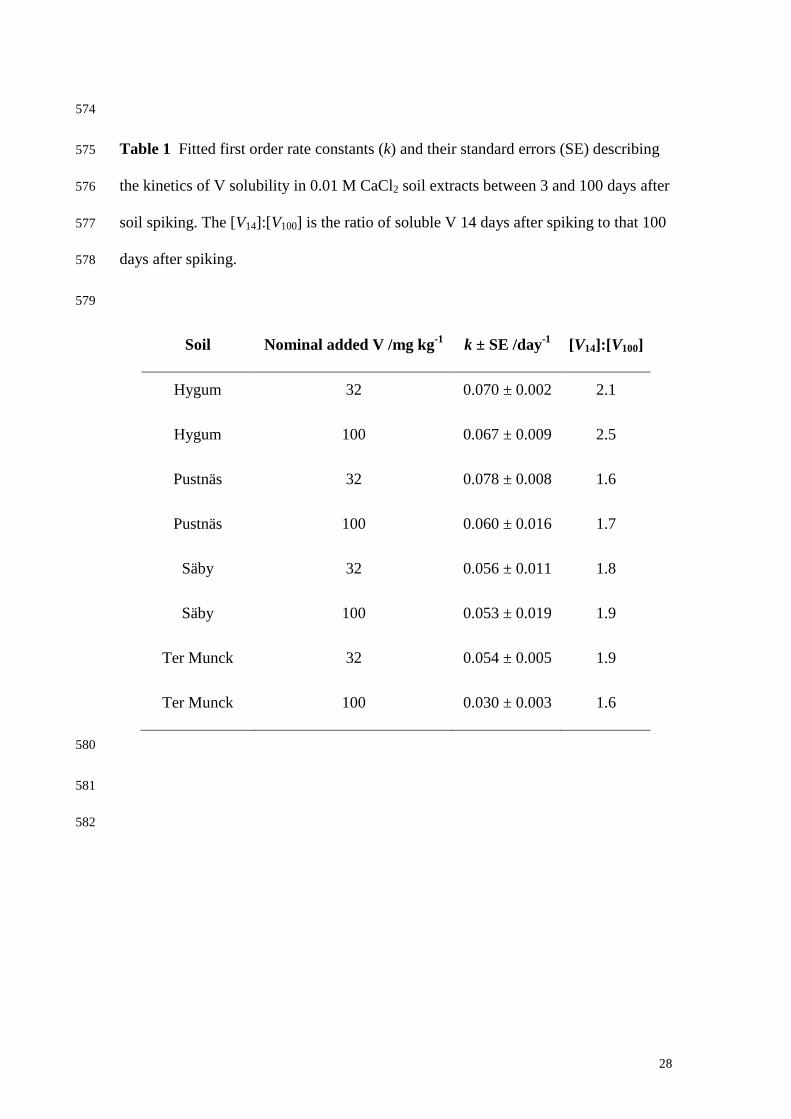
Table 1 Fitted first order rate constants (k) and their standard errors (SE) describing 575
the kinetics of V solubility in 0.01 M CaCl2 soil extracts between 3 and 100 days after 576
soil spiking. The [V14]:[V100] is the ratio of soluble V 14 days after spiking to that 100 577
days after spiking. 578
579
Soil Nominal added V /mg kg-1 k ± SE /day-1 [V14]:[V100]
Hygum 32 0.070 ± 0.002 2.1
Hygum 100 0.067 ± 0.009 2.5
Pustnäs 32 0.078 ± 0.008 1.6
Pustnäs 100 0.060 ± 0.016 1.7
Säby 32 0.056 ± 0.011 1.8
Säby 100 0.053 ± 0.019 1.9
Ter Munck 32 0.054 ± 0.005 1.9
Ter Munck 100 0.030 ± 0.003 1.6
580
581
582
28
583
Table 2 Vanadium speciation in 0.01 M CaCl2 extracts of soils spiked with V(V) and 584
subsequently aged for 5—11 months. 585
586
added V V(IV) extracted V(V) extracted
/mg kg-1 /mg litre-1 /mg litre-1
Pustnäs 150 0.11 2.92
Säby 290 0.055 0.59
Ter Munck 270 0.14 3.02
587
588
589
29
590
Table 3 EC50 estimates and their standard errors fitted using the log-logistic dose-591
response model in freshly spiked soils and in aged soils, in mg added V kg-1. All pairs 592
of EC50 estimates for freshly spiked and aged soils differ significantly (P < 0.05). 593
594
Root elongation Barley growth Tomato growth
Pustnäs freshly spiked 110 ± 4 87 ± 12 31 ± 2
aged 160 ± 7 > 180 a 46 ± 1
ratio 1.4 > 2.1 a 1.5
Säby freshly spiked 510 ± 18 230 ± 14 180 ± 24
aged 780 ± 44 530 ± 50 310 ± 14
ratio 1.5 2.3 1.7
Ter Munck freshly spiked 150 ± 9 94 ± 6 53 ± 2
aged 340 ± 11 270 ± 14 68 ± 7
ratio 2.3 2.9 1.3
a The EC50 for barley growth in the aged Pustnäs soil is unbounded, i.e. no 50 % reduction in biomass 595
yield was observed at the highest treatment level of 180 mg V kg-1. 596
597
30