age, wage and productivity - cesifo working paper
TRANSCRIPT

8/9/2019 Age, wage and productivity - CESifo working paper
http://slidepdf.com/reader/full/age-wage-and-productivity-cesifo-working-paper 1/48
Age, Wage and Productivity
Jan C. van Ours
Lenny Stoeldraijer
CESIFO WORKING PAPER NO. 2965CATEGORY 4: LABOUR MARKETS
FEBRUARY 2010
An electronic version of the paper may be downloaded
• from the SSRN website: www.SSRN.com
• from the RePEc website: www.RePEc.org
• from the CESifo website: Twww.CESifo-group.org/wpT

8/9/2019 Age, wage and productivity - CESifo working paper
http://slidepdf.com/reader/full/age-wage-and-productivity-cesifo-working-paper 2/48
CESifo Working Paper No. 2965
Age, Wage and Productivity
Abstract
Previous empirical studies on the effect of age on productivity and wages find contradictingresults. Some studies find that if workers grow older there is an increasing gap between
productivity and wages, i.e. wages increase with age while productivity does not or does notincrease at the same pace. However, other studies find no evidence of such an age related pay-productivity gap. We perform an analysis of the relationship between age, wage andproductivity using a matched worker-firm panel dataset from Dutch manufacturing coveringthe period 2000-2005. We find little evidence of an age related pay-productivity gap.
JEL-Code: J23, J31.
Keywords: age, wage, productivity.
Jan C. van Ours
CentER
Department of Economics
Tilburg University
P.O. Box 90153
NL – 5000 LE Tilburg
The Netherlands
Lenny Stoeldraijer
Department of Economics
Tilburg University
P.O. Box 90153
NL – 5000 LE Tilburg
The Netherlands
February 18, 2010The authors thank the Dutch Ministry of Social Affairs and Employment for financialsupport; the estimates in this paper are based on own calculations using various micro datasetsmade available through a remote access facility by Statistics Netherlands. A preliminaryversion of the paper was presented in a labor-health seminar at Tilburg University and inseminars at Australian National University (RSSS - Canberra) and University of New SouthWales (School of Economics - Sydney). We thank participant at these seminars as well as Sjef Ederveen, Jos Jansen, Henk Nijboer, Matteo Picchio and Daniel van Vuuren for comments ona previous version of the paper.

8/9/2019 Age, wage and productivity - CESifo working paper
http://slidepdf.com/reader/full/age-wage-and-productivity-cesifo-working-paper 3/48
1 Introduction
In many countries, including the Netherlands, population is aging. Therefore, there is
increasing attention to the labor market position of older workers. The current situation
is that older workers are not very likely to lose their job but once they have lost their
job they need a long time to find a new job. This situation is often attributed to the gap
between wages and productivity, i.e. older workers may have a wage that is higher than
their productivity. At their current employer they are protected by seniority rules and
employment protection legislation. But once older workers become unemployed, employers
are reluctant to hire an older worker because of the pay-productivity gap.
In a perfectly competitive labor market there is no reason for an age-related pay-
productivity gap to occur because firms pay workers according to (marginal) productivity.
If a firm experiences a negative productivity shock and wages do not adjust the least
productive workers are fired until the equality of productivity and wages is restored. If
a firm experiences a positive productivity shock and wages do not adjust new workerswill be hired until again the equality of productivity and wages is restored. With the
existence of labor market institutions, imperfect information and/or costly monitoring
of productivity the direct relationship between age and productivity disappears and an
age-related pay-productivity gap may occur.
The main theoretical framework on the relationship between age and productivity is
based on Lazear (1979). Age-earnings profiles are thought to be upward sloping because
this will discourage workers from shirking. Workers and firms engage in long-term relation-
ships in which the worker is initially underpaid – the wage is lower than the value of the
marginal product – but later on in life the worker is overpaid. Such delayed-compensation
contracts will discourage the worker from shirking, but at the same time require manda-tory retirement to avoid firms paying - averaged over the working life i.e. over the duration
of the contract between workers and firms - more than the value of the marginal product.
The theory of Lazear requires that workers and firms want to be engaged in long-term
relationships and assumes that rising earnings do not fully reflect increased productiv-
ity. There are other explanations for the existence of a potential pay-productivity gap at
higher ages (see Van Vuuren and De Hek (2009) for an overview). Such a gap may also
arise from union bargaining. If unions care more for senior workers – and their preferences
– wages increase according to seniority. Incumbent workers controlling the union exploit
newcomers. Furthermore, employment protection legislation in particular the last-in first-
out rule may protect older workers more than younger workers. Due to this rule firmscannot simply replace high wage older workers for low wage young workers. Finally, the
age related pay-productivity gap may be due to workers preferring increasing wage profiles
over flat or decreasing wage profiles of greater monetary value.
Aging may affect productivity levels for various reasons. On the one hand, older work-
ers are thought to be more reliable and to have better skills than average workers. On
2

8/9/2019 Age, wage and productivity - CESifo working paper
http://slidepdf.com/reader/full/age-wage-and-productivity-cesifo-working-paper 4/48
the other hand, older workers have higher health care costs, lower flexibility in accepting
new assignments and then may be less suitable for training (Barth et al., 1993). Age
alone is found to be a poor predictor of individual performance. There are wide varia-
tions although older workers are generally considered to be more consistent, cautious, andconscientious. Furthermore, older workers have fewer accidents and they are less likely to
quit, thus reducing hiring costs (Garibaldi et al., 2010).
It is difficult to establish how age itself affects labor productivity not only because pro-
ductivity is highly individual and sector-specific but also because of convolution of age,
cohort and selection effects. Individual productivity is complex and multi-dimensional.
Several characteristics that relate to productivity including communication skills, infor-
mation processing speed, strength and endurance, health, self-discipline, flexibility, admin-
istrative and strategic capacities, math proficiency, vocabulary size, education, motivation,
energy and job experience.
A study on the relationship between age and productivity requires data at the level
of the firm because productivity is a firm-level phenomenon. Productivity of individual
workers is hardly ever observed. Nevertheless, if individuals are aggregated to the firm
level, the relationship between productivity and age should still hold. To establish the
relationship between age and productivity preferably matched worker-firm panel data are
needed. There are not many empirical studies based on this type of data and there is no
recent study for the Netherlands.
In this paper we present an empirical analysis of the relationship between age and
productivity using matched worker-firm panel data from Dutch manufacturing. The set-
up of our paper is as follows. In section 2 we provide a general discussion on the relationship
between population aging and productivity. In section 3 we give a systematic overview of
previous studies on age and productivity. In section 4 we describe our matched-worker firmdata. In section 5 we present the set-up of our analysis. Section 6 discusses the parameter
estimates, section 7 concludes. Appendix A provides details on the data we use. Appendix
B gives a range of sensitivity analysis for the manufacturing sector. Appendix C provides
parameter estimates for other industries.1
2 Population aging and productivity
According to Johnson (1993), most employers and probably most employees seem to be-
lieve in a rule of thumb that average labor productivity declines after some age between
40 and 50. This assumption is so common that few attempts have been made to gathersupporting evidence; why bother to prove the obvious? It is not easy to establish the rela-
1Since monitoring of workers’ effort is probably easier in manufacturing than in other service oriented
firms with many high skilled workers an age related wage-productivity gap is less likely to occur in man-
ufacturing firms. Therefore we also investigate the situation in construction, retail trade, wholesale trade
and commercial services.
3

8/9/2019 Age, wage and productivity - CESifo working paper
http://slidepdf.com/reader/full/age-wage-and-productivity-cesifo-working-paper 5/48
tionship between age and productivity for a variety of reasons: productivity is a complex
phenomenon, the age-productivity profile changes over time, is potentially endogenous
and individual profiles are not easily aggregated (Garibaldi et al., 2010).
Productivity is multidimensional with the effects of aging depending on the extent towhich age-induced changes in work experience, physical strength and cognitive abilities are
relevant for work performance. Accumulated experience benefits employees performance
throughout the working life. However, physical strength and health are reduced as workers
grow older. Concerning cognitive abilities the age effect is not uniform. On the basis
of a literature survey, Skirbekk (2003) concludes that job performance decreases after
age 50, in particular for jobs where problem solving, learning and speed are important
and less so for jobs where experience and verbal abilities are important. Some cognitive
abilities such as vocabulary size and verbal ability increase to a relatively late age or
remain stable throughout the working life. Other cognitive abilities such as speed and
memory deteriorate with age. Different types of work require different cognitive abilities
and physical strength. The net effect of the age-specific productivity determinants depend
on how individual skills are used in the work process, how the work is organized and how
the individual interacts with other workers and firm level factors such as technology. The
variation in the type of skill required in the workplace is likely to cause differences in the
age-productivity pattern across occupations.
A further complication in assessing the importance of the age effect on productivity
are calendar time changes in the age-productivity profile. This is due to changes in the
demand for skills as well as changes in individual characteristics across generations. New
technologies and new working techniques imply a decreased need for manual labor and an
increase in the demand for high skilled workers. Physical strength and bodily co-ordination
have become less important in the workplace, while cognitive abilities are increasinglyimportant. Over time, health levels have improved at adult and older ages. Improved
age-specific mental and physical health levels are likely to create a strong positive effect
on the work potential of older workers. In other words, even if it would be possible to
establish the current relationship between age and productivity, drawing conclusions about
the future age-productivity profile is not straightforward.
Another complication is that the age-productivity profile is not exogenous to labor
market institutions. If a worker anticipates early retirement he will be less eager to invest in
training to prevent his productivity from deteriorating. If an employer expects his worker
to retire early he too will not have an incentive to invest in maintaining productivity. One
of the main problems from a policy point of view is that population aging requires changesin labor market institutions and social norms that are opposite to the changes that have
been implemented in the recent past when labor market institutions were adjusted to
facilitate early departure from the labor force.
Finally, there is the issue of aggregation. Aging has an unambiguous effect on the age
structure of the population: the number of old-age individuals increases relative to young
4

8/9/2019 Age, wage and productivity - CESifo working paper
http://slidepdf.com/reader/full/age-wage-and-productivity-cesifo-working-paper 6/48
and prime age individuals. Aging will affect the size and composition of the workforce
but as yet the consequences at aggregate level are unclear. If workers of different ages are
imperfect substitutes in production aging will affect relative wages of younger and older
workers. When young workers become scarcer the relative wage of young workers shouldrise. Whether they actually do also depends on the labor market institutions. Therefore, it
is difficult to draw straightforward conclusions except for the obvious conclusion that even
if at the individual level productivity would decline with age there may be compensating
effects at the aggregate level.
3 Previous matched worker-firm data studies on age and
productivity
Job performance or productivity of workers can be investigated using worker-firm matched
data sets. We first discuss studies based on cross-sectional data. Then we discuss paneldata studies.
3.1 Cross-sectional data
Initially, studies using matched worker-firm data used cross-sectional information (see
Table 1 for a summary overview). Hellerstein et al. (1999) is one of the first studies of this
kind. Plant-level production function and wage equations are estimated simultaneously
to compare productivity and wages for various groups of workers. 2 The results indicate
that prime-age workers are as productive as younger workers. For prime age workers and
older workers productivity and earnings rise at the same rate over the life cycle. The
authors conclude that their evidence is most consistent with models in which wages rise inaccordance with productivity, such as the general human capital model. Hellerstein and
Neumark (2004) use a much larger data set to perform similar estimates. They find that
both wage and productivity profiles are rising but concave; the estimated wage profile
being steeper than the productivity profile, supporting Lazear’s idea that young workers
are underpaid and older workers are overpaid.
Lallemand and Rycx (2009) investigate the effects of the workforce age structure on
the productivity of large Belgian firms in two subsequent cross-sections. They find that
a higher share of young workers within a firm is favorable to firms’ productivity while a
higher share of older workers is harmful.
2For the production function, they use a output specification, which they instrument with lagged
materials because these are likely to be endogenous, and a value-added specification. Also for the wage
equations they use three compensation measures.
5
8/9/2019 Age, wage and productivity - CESifo working paper
http://slidepdf.com/reader/full/age-wage-and-productivity-cesifo-working-paper 7/48
3.2 Panel data
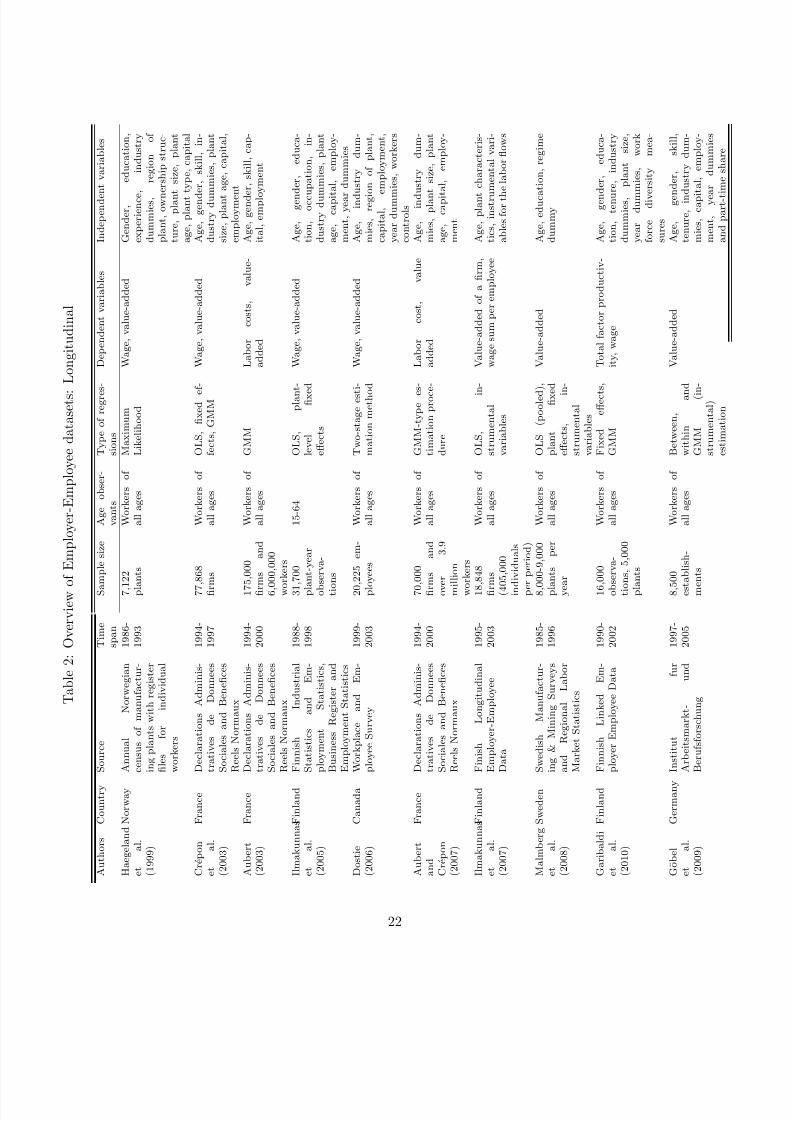
Many longitudinal studies on matched worker-firm data draw on the work of Hellerstein
et al. (1999). The method used by Hellerstein et al. (1999) is expanded by implementing
panel data estimation which tries to remove some of the bias associated to OLS estimationof production functions. An overview of studies using matched worker-firm panel data is
given in Table 2.
One of the first studies which uses matched employer-employee panel data is Haegeland
and Klette (1999) who estimate plant level production functions using Norwegian data for
the period 1986-93. Their results indicate that the higher wages earned by workers with
higher education largely correspond to their higher productivity. Experienced workers are
more productive than inexperienced workers and they also earn higher wages. Crepon et
al. (2003) use French matched worker-firm data providing a new method using costs for the
employer. They find that older workers are relatively overpaid. The age profile of wages
is concave while the age profile of productivity stops rising - and even decreases - aftersome experience level. Crepon et al. (2003) conclude that for workers over 35 increases in
wages are not a reflection of human capital accumulation.3 Aubert (2003) using a large
French data set shows that the endogeneity bias of inputs and unobserved shocks is large.
After correcting for this, the age-productivity profile is increasing and concave, with highly
skilled workers having the steepest age-productivity profile. Furthermore, there seems to
be a decrease of the productivity of unskilled workers after 55. Ilmakunnas and Maliranta
(2005) estimate the usual production functions and wage equations, but also examines
how the results are influenced by using imperfect employment indicators like number of
employees instead of hours of work. The increasing pattern of the wage-productivity gap
by age is among the most robust results, although the productivity effect of age variessomewhat from model to model. They attribute the positive correlation between age and
the wage-productivity gap to strong seniority effects in wage setting. Dostie (2006) uses a
method similar to Hellerstein et al (1999) and Aubert and Crepon (2003), but improves by
controlling for unobserved productivity shocks. On the basis of an analysis of Canadian
linked worker firm data, Dostie (2006) concludes that both wage and productivity profiles
are concave, but productivity is diminishing faster than wages for workers aged 55 and
over.4
Aubert and Crepon (2007) find that productivity, defined as the average contribution
of particular age groups to the productivity of firms, increases with age until age 40 to
3
From this the authors conclude that the early retirement policy in France is consistent with thisevidence and they conclude that a policy of raising the mandatory retirement age may be problematic
because of the po or performance of older workers in the labor market. They do not consider the possibility
that the age-productivity profile may change if the attachment between workers and firm lasts longer.4He indicates that it is only possible to distinguish workers by age, gender and education. An important
missing variable is occupation so it is not possible to distinguish workers in managerial positions from
workers in production positions.
6

8/9/2019 Age, wage and productivity - CESifo working paper
http://slidepdf.com/reader/full/age-wage-and-productivity-cesifo-working-paper 8/48
45 and then remains stable after this age. The results are stable across industries. They
also show that the age-productivity profile is similar to the age-labor cost profile which is
contradicting the overpayment of older workers. The evidence for what happens after 55
remains inconclusive due to data and precision issues. Ilmakunnas and Maliranta (2007)examine the connection of aging work force to firm performance by using information
on the hiring and separation of employees. They show that firm-level labor productivity
change can be decomposed to the effects of the hiring and separation rates of the age groups
and to the effect of productivity growth of those workers in different age groups who are
staying in the firm. The evidence shows that separations of older workers are profitable to
firms, especially in the manufacturing ICT-industries, because there are indeed differences
between the age groups in their relative productivity and wage levels.
Malmberg et al. (2008) aim to answer the empirical question of how labor productivity
at the plant level is related to the age composition of the labor force without imposing any
given theoretical structure. The data comes from the Swedish Manufacturing and Mining
Surveys and Regional Labor Market Statistics and consists of 8,000-9,000 establishments
each year over the period 1985-1996. According to their estimates, an accumulation of
high shares of older adults in manufacturing plant does not seem to have a negative effect
on plant-level productivity. On the contrary, when plant-level effects are controlled for,
high shares of older adults are associated with higher productivity than high shares of
young adults.
Gobel and Zwick (2009) analyzing German data find considerable differences in pa-
rameter estimates depending on the estimation strategy. The results of their preferred
estimates depict an increase in productivity until the age 40-45, but no meaningful decline
until the age of 60. This is different from existing studies that find inverse U-shaped age
productivity profiles. In Garibaldi et al. (2010) a study on Finnish manufacturing is pre-sented which compares the productivity and wage profiles by age using average age (and
its square) as the measure of plant age structure. There is weak evidence that in the early
1990s, the industry-wide age-productivity profile was hump-shaped. On the other hand,
in the late 1990s and early 2000s the profile was declining with age. Irrespective of what is
the shape of the age-productivity profile, wages tend to increase with age or tenure. They
also present results on the role of age diversity in Finnish industrial plants; age diversity
is positively related to productivity.
3.3 Conclusions from previous studies
Studies on the relationship between age and productivity using matched worker-firm data
find varying results. Some studies find evidence of a productivity-wage gap that is increas-
ing with age, while other studies find no evidence for this phenomenon. Cross-sectional
studies are limited also because they cannot take into account that there may be unob-
served differences between firm productivity and firm workforce composition. Longitudinal
7

8/9/2019 Age, wage and productivity - CESifo working paper
http://slidepdf.com/reader/full/age-wage-and-productivity-cesifo-working-paper 9/48
matched-worker firm data provide a rich source of information about potential relation-
ships between age and productivity. But even in this type of studies conclusions are
not clear-cut. Although most studies find that when age increases productivity doesn’t
increase as much as wages do, there are also some studies that find no such an effect.
4 Data
4.1 Combining datasets
We use microdata collected by Statistics Netherlands (CBS) to match information about
individual workers with information about the firm at which they are employed. The
matched dataset combines information from four different sources and six different years.5
Our dataset provides information at the firm level about value-added, employment, wage
costs, firm and industry characteristics and about the composition of the workforce. The
dataset contains firms from manufacturing and covers the period 2000-2005.After cleaning, the dataset consists of 13,941 firms with 44,371 observations. The
composition of the workforce in each firm is computed by using personal information
about age and gender. For each firm eight age groups (less than 25, 25-29, 30-34, 35-
39, 40-44, 45-49, 50-56 and 57 and older) and two gender groups (males and females) are
considered. Employment is measured in two ways: first in full-time equivalents determined
through the number of social insurance days6, and second by the number of workers. In
our baseline estimates we use the number of full-time equivalents, in a sensitivity analysis
we use the number of persons working during the year.
Table 3 presents summary statistics for the final set of plant-level data. The average
value added is equal to e5.9 million. The labor costs are on average e3.5 million and thedepreciation on fixed assets are on average equal to e828,000. The average employment
consists of 97 persons and which is equal to 77 full-time equivalent workers. According to
the middle part of the table, most firms fall in the category 20-49 employees. The lower
part of Table 3 presents the mean and standard deviation of the shares of age groups
on the basis of number of employees and number of full-time equivalent workers. The
youngest category, less than 25 years old, has a larger share in the number of employees
than in the number of full-time equivalent workers, which indicates that younger persons
work a shorter time at a firm compared to the other categories.
Figure 1 gives a graphical representation of the relationship between age, wage and
productivity in our sample. Firm are characterized by the average age of their work force
in a particular year and allocated to one of the eight age categories. Then for every age
5The files from different sources can be combined using unique identifier for each firm and each worker.
Appendix A presents a more detailed description of our data.6The full-time equivalence scale is determined by the number of days a person has social insurance; if
an individual works 50% of the maximal number of days for which an individual can be social insured this
individual counts for 0.5 full-time equivalent.
8

8/9/2019 Age, wage and productivity - CESifo working paper
http://slidepdf.com/reader/full/age-wage-and-productivity-cesifo-working-paper 10/48
category median value added per worker and median labor costs per worker are calculated
and plotted. As shown in figure 1 value added is not much affected by the average age of
the work force. Labor costs increase at lower ages and are roughly constant from age 40
onwards. Apparently, as the average age of the work force increases the difference betweenvalue added and wage costs is smaller. Of course, we cannot derive any causal conclusion
from figure 1 as across age groups different firms are compared. 7
4.2 Some limitations of our data
One weakness of the CBS data is that there is no information on the capital stock. From
previous studies we conclude that including or not including capital stock information
doesn’t seem to affect the parameter estimates of production functions based on firm-level
micro survey data. The estimated effect of capital stock on production in Dostie (2006)
is close to zero in all specifications. Also Aubert and Crepon (2003) and Hellerstein et al.
(1999) report small productivity effects from the capital stocks. In our baseline estimatewe ignore capital input. Nevertheless, to get some idea about the effects of ignoring capital
input we perform a sensitivity analysis in which as a rough indicator for the capital stock
we use depreciation on fixed assets (see Appendix B).
Another weakness of the CBS data is the lack of information on educational attain-
ment of workers. To provide an idea about how this might affect our parameter estimates
we discuss the results of similar studies which did have information about education, skills
or experience of their employees. According to Haegeland and Klette (1999) there is a
positive premium for all education levels for both wage and productivity. Wage returns to
education correspond quite well to productivity differences. Also Ilmakunnas and Mali-
ranta (2005) find that higher education has in general a positive influence on productivitywith a stronger effect for non-technical education than for technical education. However,
the wage and productivity effects of education are not monotonous when education in-
creases, i.e. productivity increases are ‘under-compensated’. Hellerstein and Neumark
(2004) find a similar results that productivity premium for education somewhat exceeds
the wage premium. Dostie (2006) on the other hand finds that older men with a degree
earn higher wages relative to their productivity, while the productivity of workers aged
55 or more without a degree seems to be slightly higher than their wage. For women
with a degree the hypothesis that wages are equal to productivity can not be rejected.
Crepon et al. (2003) and Aubert (2003) include skill categories to distinguish between
different types of workers. According to Crepon et al. (2003) productivity is much higher
for older workers if skill categories are excluded from the analysis. Aubert (2003), with
the same data but over a longer period, shows that skilled workers have the steepest
7Also note that for some age intervals only few observations are available; for the -25 interval there
are 261 observations, for the 50-56 interval there are 189 observations and for the 57+ interval there are
only 9 observations. The highest number of observations is for the 35-39 interval for which we have 19,100
observations.
9

8/9/2019 Age, wage and productivity - CESifo working paper
http://slidepdf.com/reader/full/age-wage-and-productivity-cesifo-working-paper 11/48
age-productivity profile and their productivity increases at all ages. Because we cannot
distinguish between skill categories we might underestimate the age-productivity profile,
though not necessarily the age related productivity-wage gap since by the same line of
reasoning we might also underestimate the age-wage profile. In order to get some ideaabout the importance of educational attainment of workers by way of sensitivity analysis
in addition to manufacturing we also present estimates of other industries; construction,
retail trade, wholesale trade and commercial services (see Appendix C).
5 Set-up of the analysis
5.1 Model
We assume that the production per worker can be specified using the following Cobb-
Douglas production function8
ln(Qit/Lit) = ln(qit) = γ ln(λitLit) + δF it + εit (1)
where Qit defines the production, measured as firm i’s value added in year t. Furthermore,
λ is the productivity of an individual unit of labor and Lit the quantity of labor. Thus,
λitLit denotes the level of productive labor. F it contains workplace characteristics like
industry, age (of the firm) as well as calendar year dummies.9
With the assumption of perfect substitution among workers of different ages, the level
of productive labor λL can be written as
λL = j
λ jL j = λ0L
1 +
j−{0}λ j
λ0
− 1L j
L
(2)
i.e. the sum of productive labor of each category of workers, where λ j is age group j’s
marginal productivity. So, we assume that workers of different age groups are perfect
substitutes but they may have a different marginal productivity. The production function
can now be written as
ln(qit) = γ ln(λ0) + γ ln(Lit) + γ ln
1 +
j−{0}
λ jλ0− 1
L jL
it
+ δF it + εit
8As indicated before, in our baseline estimate we ignore capital input. By way of sensitivity analysis
we include a proxy for capital input; see Appendix B.9Since many of the workplace characteristics are not time varying, in the baseline estimates we restrict
the workplace characteristics to the share of women in the workforce. In all the estimates calendar year
dummies are included as well.
10

8/9/2019 Age, wage and productivity - CESifo working paper
http://slidepdf.com/reader/full/age-wage-and-productivity-cesifo-working-paper 12/48
or, after linearization
ln(qit) ∼= γ ln(λ0) + γ ln(Lit) +
j−{0}
γ
λ jλ0− 1
L jL
it
+ δF it + εit
= α + γ ln(Lit) + j
γ jl j,it + δF it + εit (3)
where α = γ ln(λ0), γ j = γ λj
λ0− 1
, and l j,it =Lj
L
it
. Relative labor costs of categories
of workers can be estimated by applying the same approach as in the case of marginal
productivities. The mean hourly labor cost can be rewritten as
w =
j w jL j j L j
= w0
1 +
j−{0}
w j
w0− 1
L jL
(4)
where we assume constant relative labor costs of groups across firms. To allow for a directcomparison with the parameter estimates of the production equation we introduce firm
size and other workplace characteristics as explanatory variables of wage costs. Thus,
similar to the production function the relative labor costs can be estimated by regressing
the following equation
ln( wit) = γ w ln(w0) + γ w ln(Lit) + ln
1 +
j−{0}
w jw0− 1
L jL
it
+ δwF it + εw,it (5)
or, after linearization
ln( wit) ∼= ln(w0) + γ w ln(Lit) +
j−{0}
w j
w0− 1L j
L
it+ δwF it + εw,it (6)
= αw + γ w ln(Lit) + j
ξ jl j,it + δwF it + εw,it (7)
where αw = ln(w0) and ξ j =wj
w0− 1
. Equality of the age effects on labor cost and
productivity can be tested by comparing the estimated coefficients of ξ j and γ j.
5.2 Methodology
Different methods are used to estimate the equations. First we present pooled cross-section
estimates ignoring firm fixed effects (α = αi and w = wi). If firm fixed effects are notaccounted for the relationship between age composition and productivity is identified on
cross-sectional variation. The interpretation of the between estimation results is that an
age group is estimated to be more productive than another group if a firm with a higher
share of this age group in its labor force on average produces more than a comparable firm
with a lower share for this age group.
11

8/9/2019 Age, wage and productivity - CESifo working paper
http://slidepdf.com/reader/full/age-wage-and-productivity-cesifo-working-paper 13/48
Second, we introduce firm fixed effects. Then, the relationship is identified as an
average over within firm variation. The results from the fixed effects estimation can be
interpreted as follows: a group is estimated to be more productive than another group
if, in comparable firms, production increases more (or less) on average when the share of labor of the group increases more (or less) than the share of the other group. We remove
the fixed effects by estimating the equations in first differences. 10
Although the introduction of firm fixed effect removes potential spurious correlation
between age composition and productivity it does not solve all problems. The problem is
that changes in age composition may not be exogenous to changes in productivity. It could
be that there is a negative productivity shock which induces firm to fire young workers,
causing the average age of the workforce to increase. Then, the negative productivity
shock seems to be due to the increase in average age of the workforce while in fact there is
an exogenous explanation for this correlation. To address the potential endogeneity bias,
we use an instrumental variable approach. It is difficult to find variables that can serve
as valid instruments, i.e. variables that have an effect on the endogenous variable but
do not directly affect productivity. We estimate the production and labor cost functions
in first differences using lagged values of the age structure as instruments for the change
in age structure. The underlying assumption is that shocks occurring between (t − 1)
and t are uncorrelated with levels of inputs earlier than (t − 2). Thus, when accounting
for potential endogeneity of the age structure, the following equation is estimated as our
baseline model:
∆ln(qit) = γ ∆ln(Lit) + j
γ j∆l jit + δ∆F it + ∆εit (8)
where we use l jit−s (s ≥ 2) as instrumental variables for ∆l jit. The wage equation isestimated similarly:
∆ ln( wit) = γ w∆ln(Lit) + j
ξ j∆l jit + δw∆F it + ∆εw,it (9)
To account for the presence of heteroskedasticity we estimate the relevant parameters
of our model using the General Method of Moments (GMM).11 We present two sets of
parameter estimates. First, we instrument the potential endogenous first differenced age
structure variables with the two periods lagged levels of the age structure. Second, we
also use the three periods lagged levels of the age structure as additional instrumental
10
Note that to the extent that F it contains fixed firm effects, these drop out of the equation in firstdifferences.
11Initially we performed 2SLS estimates. However, using the Pagan-Hall statistic we also found evidence
of the presence of heterogeneity. Therefore we use GMM, as in the presence of heteroskedasticity the GMM
estimator is more efficient than an IV estimator. Nevertheless, the differences between the 2SLS and GMM
estimates are very small. Our estimates are based on Stata’s “ivreg2” suite, with the “gmm2” option (see
Baum et al., 2003 and 2007).
12

8/9/2019 Age, wage and productivity - CESifo working paper
http://slidepdf.com/reader/full/age-wage-and-productivity-cesifo-working-paper 14/48
variables. Over the order of the estimation methods the number of observations gets
increasingly smaller. For the pooled time series - cross section estimates we have 44,371
observations, for the first differences estimates there are 28,775 observations. Introducing
lagged instrumental variables reduces the sample size even more, to 24,509 for GMM-1estimates and 16,689 for GMM-2 estimates.
To assess the credibility of our approach we perform a range of diagnostic tests. If the
correlation between the instrumental variables and the endogenous variables is poor, i.e.
if we have “weak” instruments our parameter estimates may be biased. To investigate the
quality of our instruments we use two Kleibergen-Paap statistics, an underidentification
test statistic and a weak instruments test statistic. The first test statistic is deals with the
issue of whether the equation is identified, i.e. the excluded instruments are all relevant.
The second statistic is a generalization of the first stage F -statistic. The null hypothesis
is that the instruments are weak. Rejection of the null hypothesis implies that the instru-
ments pass the weak instruments test, i.e. they are highly correlated with the endogenous
variables.12 To investigate the validity of our instrument we use the Hansen-Sargan test
– also called Hansen’s J test – of overidentifying restrictions. The null hypothesis is that
the instruments are valid instruments, i.e., uncorrelated with the error term, and that the
instruments are correctly excluded from the estimated equation. The null hypothesis of
the test is that the overidentifying restrictions are valid. Under the null, the test statistic
is distributed as chi-squared in the number of overidentifying restrictions. A failure to
reject the null hypothesis implies that the instruments are exogenous.13 In virtually all
our GMM estimates our instruments pass the weak instruments test while in those esti-
mates where we can test overidentifying restrictions we cannot reject the null hypothesis
that these restrictions are valid. Finally, we test whether indeed the age structure is en-
dogenous and we need an instrumental variable approach. For this we use a Hausmantest in which OLS and IV estimates are compared. The test statistic is χ2 distributed
with degrees of freedom equal to the number of regressors tested. The null-hypothesis is
that the specified age structure can actually be treated as exogenous. Rejection of the
null-hypothesis indicates that the age structure is endogenous.
In most of the estimates we find support for the age structure being endogenous, thus
supporting the instrumental variable approach. This all being the case unless there is
a reason to do so we do not comment on the diagnostic tests but focus on the relevant
parameter estimates.
12An exact rejection rule for weak identification is not yet established. Baum et al. (2007) suggest to
use the old “rule of thumb” rule that the F -statistic should be at least 10 for weak identification not tobe considered a problem.
13In the first approach the number of instruments equals the number of potentially endogenous variables
so we cannot test overidentifying restrictions.
13

8/9/2019 Age, wage and productivity - CESifo working paper
http://slidepdf.com/reader/full/age-wage-and-productivity-cesifo-working-paper 15/48

8/9/2019 Age, wage and productivity - CESifo working paper
http://slidepdf.com/reader/full/age-wage-and-productivity-cesifo-working-paper 16/48

8/9/2019 Age, wage and productivity - CESifo working paper
http://slidepdf.com/reader/full/age-wage-and-productivity-cesifo-working-paper 17/48
do this directly by taking first differences of equations (3) and (7) and estimate:
∆ln(qit)−∆ ln( wit) = Gapit = αg + γ g∆ln(Lit) + j
γ g,j∆l jit + δg∆F it + ∆εg,it (10)
where αg = α− αw, γ g = γ − γ w, γ g,j = γ j − ξ j, δg,f = δf − δw,f and εg,it = εit − εw,it.
Table 5 shows the parameter estimates for equation (10). Employment has a negative
effect on the productivity-pay gap, i.e. if employment increases the gap becomes smaller.
If we ignore potential endogeneity of the age shares, a higher share of workers below age
25 increases the gap between productivity and wage costs. None of the other age shares
has a significant effect. If we account for potential endogeneity none of the age shares has
a significant effect either.
For the estimates of the pay-productivity gap we cannot reject the null-hypothesis of
the age structure being exogenous. Apparently, an exogenous productivity shock may
affect both productivity and the age structure causing younger workers to be laid-off
and introducing a spurious negative relation between age and productivity. However, the
negative productivity shock also introduces a spurious negative relation between age and
wage costs as young workers usually have a lower wage. If an exogenous shock affects both
the change in productivity and the change in wage costs, the difference between the two
remains unaffected other than through changes in the age structure.
6.3 Sensitivity analysis
To illustrate the sensitivity of our parameter estimates we did some sensitivity analysis
for manufacturing firms. These estimates are presented and discussed in more detail in
Appendix B. Figure 3 gives a graphical illustration of the relevant parameter estimates.First, we performed a number of sensitivity analyses for the sample of manufacturing firms.
We show parameter estimates based on a balanced sample; we consider how sensitive our
results are with respect to the specification of age, using an approach where the age
structure of the firms’ workforce is represented by the average age only. We also show
the sensitivity of our parameter estimates when we include capital into the production
function. Furthermore, we use a different specification of employment using the number
of workers in stead of the number of full-time equivalent workers. All these additional
parameter estimates are very much in line with the baseline estimates.
Second, we applied our baseline approach to data from other industries, investigating
the age related productivity and wage costs profiles for firms in construction, wholesale
trade, retail trade and commercial services. These estimates are presented and discussed in
more detail in Appendix C. Figure 4 gives a graphical illustration of the relevant parameter
estimates. Although there are differences in parameter estimates between the various
industries the basic conclusion that there doesn’t seem to be an age related productivity-
wage gap also holds for firms in these industries.
16

8/9/2019 Age, wage and productivity - CESifo working paper
http://slidepdf.com/reader/full/age-wage-and-productivity-cesifo-working-paper 18/48
7 Conclusions
Previous empirical studies on the effect of age on productivity and wages find contradicting
results. Some studies find that if workers grow older there is an increasing gap between
productivity and wages. Wages increase with age while productivity does not or does not
increase at the same pace. However, other studies find no evidence of such an age related
pay-productivity gap. We perform an analysis of the relationship between age, wage
and productivity using a matched worker-firm panel dataset from Dutch manufacturing
covering the period 2000-2005.
Although previous studies have their own peculiarities in terms of data, specification
of dependent and independent variables and estimation methods used, we draw some
comparisons of our results with those obtained in other studies. Although some studies
that used matched worker-firm data find evidence of a wage-productivity gap at higher
ages there are also studies which do not find such a gap. In terms of main findings our
study is most closely related to Aubert and Crepon (2007) and Dostie (2006). Aubert andCrepon (2007) observe an age-labor cost profile which is similar to the age-productivity
profile and hence they do not find a wage productivity gap. Dostie (2006) finds that
wage and productivity profiles are concave, at their highest for the 35-55 age group and
diminishing afterwards. He cannot reject the hypothesis that across age categories wages
are equal to productivity.
Many previous studies have their limitations because they are based on cross-sectional
information only or because they do not account for potential endogeneity of the age com-
position of a firms’ workplace. Our study has its limitations too. For example, we only
have a imperfect measure for the capital stock. Furthermore, our data do not contain
information on educational attainment of workers, which complicates the analysis becauseolder cohorts have less formal education than younger cohorts. However, a range of sen-
sitivity analyses indicate the our parameter estimates are quite robust to the inclusion of
capital or the application of our estimation procedures to other industries with a different
skill distribution.
Our method of analysis is focused on firm-level productivity, identifying relationships
on the basis of changes in age composition and changes in firm-level productivity. In
a steady state situation we could never establish the relationship between age and pro-
ductivity because level differences are absorbed by the firm fixed effects. Establishing
a relationship between a composite age variable and an firm aggregate such as average
productivity is very indirect. Nevertheless, except for special situations – piece rate work,homogenous tasks, easy to monitor activities – there is no clear alternative to the approach
used in this paper. Measurement errors may dominate the relationship thus underestimat-
ing the true effect of age on productivity. However, using instrumental variables should
account for at least part of the measurement errors. Indeed in some of our estimates us-
ing instrumental variables turns a flat age-productivity profile into an upward sloping one.
17

8/9/2019 Age, wage and productivity - CESifo working paper
http://slidepdf.com/reader/full/age-wage-and-productivity-cesifo-working-paper 19/48
Still, this upward sloping profile is almost identical for wage costs, so that we cannot reject
the hypothesis that the two profiles are insignificantly different from each-other. There is
also an issue of selective attrition. It could be that the best 50+ workers remain while the
least productive older workers leave the firms and perhaps even the labor force. Althoughthis could be an explanation for the lack of negative productivity effects for older workers,
this selectivity effect would also apply to the wage cost profile in a similar way. Finally,
our data cover a short time period. Within these limitations our findings are clear.
Using a variety of estimation methods we find some evidence of age affecting produc-
tivity. In particular when we perform a pooled cross-section time series estimate we find
that workers between age 30 and 45 have the highest productivity, while the productivity
of younger and older workers is lower. The lowest productivity concerns workers below
age 25. So, there is clear hump-shape relationship between age and productivity. How-
ever, there is also a hump-shape relationship between age and labor costs. Nevertheless
for young workers productivity is higher than labor costs while for older workers it is the
reverse: productivity is lower than labor costs. These clear-cut results disappear when we
introduce firm fixed effects. By doing this we remove spurious correlation between firm
characteristics, productivity and age composition. Then, we relate changes in the age com-
position to changes in productivity and labor costs. Now the age profile of productivity
is rather flat until age 50, after which productivity declines. Wage costs are flat over the
entire age range. Again, this suggests that older workers are relatively overpaid. Finally,
we performed estimates in which we account for potential endogeneity of the change in
the age composition. If for example a firm is hit by an exogenous productivity shock and
due to this shock younger workers are fired, firm productivity goes down while at the
same time the share of older workers goes up. Then, we might wrongly conclude that
the aging workforce was responsible for the drop in productivity while in fact there was just correlation between the drop in productivity and the increase in the share of older
workers. In these final estimates both productivity and wage costs increase with age, but
we cannot reject that age has the same effect on productivity and wage costs. Clearly,
productivity of workers will go down eventually at higher age. However, it is not clear
where the turning point of the age-productivity profile is located. To the extent that there
is a productivity-wage gap at high ages this age effect is bound to be small.
18

8/9/2019 Age, wage and productivity - CESifo working paper
http://slidepdf.com/reader/full/age-wage-and-productivity-cesifo-working-paper 20/48
References
[1] Aubert, P. (2003) Productivity, wage and demand for elder workers; an examination
on French matched employer-employee data, Working Paper INSEE, Paris.
[2] Aubert, P. and B. Crepon (2007) Are older workers less productive? Firm-level
evidence on age-productivity and age-wage profiles, mimeo (French version published
in: Economie et Statistique, 2003,368,95-119).
[3] Barth, M.C., W. McNaught and P. Rizzi (1993) Corporations and the aging workforce,
in: P.H. Mirvis (ed.) Building the Competitive Workforce: Investing in Human Capital
for Corporate Success, John Wiley and Sons.
[4] Baum, C.F., M.E. Schaffer and S. Stillman (2003) Instrumental variables and GMM:
estimation and testing, Stata Journal , 3, 1-31.
[5] Baum, C.F., M.E. Schaffer and S. Stillman (2007) Enhanced routines for instrumental
variables/GMM estimation and testing, Stata Journal , 7, 465-506.
[6] Borsch-Supan, A., I. Duzgun, and M. Weiss (2007) Age and productivity in work
teams: evidence from the assembly line, MEA Discussion Paper , University of
Mannheim.
[7] Crepon B., N. Deniau and S. Prez-Duarte (2003) Wages, productivity, and worker
characteristics: a French perspective, Working Paper CREST-INSEE, Paris.
[8] Dostie, B. (2006) Wages, productivity and aging, Working Paper Institute of Applied
Economics, Montreal.
[9] Garibaldi, P., J. Oliveira Martins and J.C. van Ours (2010) Health, Longevity and
Productivity , Oxford University Press, forthcoming.
[10] Gobel, C. and T. Zwick (2009) Age and Productivity - Evidence from Linked Em-
ployer Employee Data, Working Paper.
[11] Haegeland, T. and T.J. Klette (1999) Do higher wages reflect higher productivity?
Education, gender and experience premiums in a matched plant-worker data set, in:
Haltiwanger, J., J. Lane, J.R. Spletzer, J. Theeuwes and K. Troske (eds.) The creation
and analysis of employer-employee matched data , Amsterdam, North-Holland.
[12] Hellerstein, J.K., N. David and K.R. Troske (1999) Wages, productivity and worker
characteristics: evidence from plant level production function and wage equations,
Journal of Labor Economics, 17, 409-446.
19
8/9/2019 Age, wage and productivity - CESifo working paper
http://slidepdf.com/reader/full/age-wage-and-productivity-cesifo-working-paper 21/48
[13] Hellerstein, J.K. and D. Neumark (2004) Production function and wage equation es-
timation with heterogeneous labor: evidence from a new matched employer-employee
data set, NBER Working Paper Series, 13, 345-371.
[14] Ilmakunnas, P. and M. Maliranta (2005) Technology, worker characteristics, andwage-productivity gaps, Oxford Bulletin of Economics and Statistics, 67, 623-645.
[15] Ilmakunnas, P. and M. Maliranta (2007) Aging, labor turnover and firm performance,
Discussion Paper 1092, The Research Institute of the Finnish Economy.
[16] Johnson, P. (1993) Aging and European economic demography, in: Johnson, P. and
K.F. Zimmermann (eds.) Labor markets in an ageing Europe, Cambridge University
Press, Cambridge.
[17] Lallemand, T. and F. Ryckx (2009) Are older workers harmful for firm productivity?
De Economist , 157, 273-292.
[18] Lazear, E. (1979) Why is there mandatory retirement, Journal of Political Economy ,
87, 1261-1284.
[19] Malmberg, B., T. Lindh and M. Halvarsson (2008) Productivity consequences of
workforce ageing - Stagnation or a Horndal effect?, Population and Development
Review , Supplement to vol. 34, Population Aging, Human Capital, Accumulation
and Productivity Growth, 238-256.
[20] Skirbekk, V. (2003) Age and individual productivity: a literature survey, in: Fe-
ichtinger, G. (eds.) Vienna yearbook of population research 2004, Austrian Academy
of Sciences Press, Vienna, 133-153.
[21] Van Ours, J.C. (2009) Will you still need me – when I’m 64? CentER Discussion
Paper no. 09-51, Tilburg University.
[22] Van Vuuren, D. and P. de Hek (2009) Firms, workers, and life-cycle wage profiles,
in Euwals, R., R. de Mooij and D. van Vuuren (2009) Rethinking Retirement , CPB
Netherlands Bureau for Economic Policy Analysis, The Hague.
20

8/9/2019 Age, wage and productivity - CESifo working paper
http://slidepdf.com/reader/full/age-wage-and-productivity-cesifo-working-paper 22/48
T a b l e 1 : O v e r v i e w o f E m p l o y e r - E m p l o y e e d a t a s e t s :
C r o s s - s e c t i o n a l
A u t h o r s
C o u n t r y
S o u r c e
T i m e
s p a n
S a m p l e s i z e
A g e o b s e r v a n t s
T y p e o f r e g r e s -
s i o n s
D e p e n d e n t v a r i a b l e s
I n d i v i d u a l s v a r i a b l e s
H e l l e r s t e i n
e t
a l .
( 1 9 9 9 )
U n i t e d
S t a t e s
W o r k e r E s t a b l i s h -
m e n t C h a r a c t e r i s -
t i c s D a t a b a s e a n d
t h e
L o n g i t u d i n a l
R e s e a r c h D a t a b a s e
1 9 9 0
1 2 9 , 6 0
6
w o r k e r s
a n d
3 , 1 0 2
p l a n t s
W o r k e r s o f a l l
a g e s
O L S ,
p l a n t -
l e v e l
fi x e
d
e ff e c t s
( o n l y
w a g e
e q u a -
t i o n ) ,
j o i n
t
e s t i m a t i o n
W a g e , l a b o r c o s t , e a r n -
i n g s , v a l u e - a d d e d
A g e ,
g e n d e r ,
e d u c a -
t i o n o c c u p
a t i o n , i n d u s -
t r y d u m m i e s , r e g i o n o f
p l a n t , p l a n
t s i z e , p l a n t
a g e , c a p i t a l , m a t e r i -
a l s , e m p l o y m e n t , w o r k -
e r s c o n t r o l s
H e l l e r s t e i n
e t
a l .
( 2 0 0 4 )
U n i t e d
S t a t e s
D e c e n n i a l
E m p l o y e r -
E m p l o y e e
d a t a
s e t
( m a t c h
b e -
t w e e n
t h e
1 9 9 0
D e c e n n i a l
L o n g
F o r m
o f t h e C e n -
s u s a n d t h e 1 9 9 0
S t a n d a r d
S t a t i s t i -
c a l E s t a b l i s h m e n t
L i s t )
1 9 9 0
2 0 , 0 5 6
p l a n t s
W o r k e r s o f a l l
a g e s
O L S
W a g e , v a l u e - a d d e d
A g e ,
g e n d e r ,
e d u c a -
t i o n , o c c u p a t i o n , i n -
d u s t r y d u
m m i e s ,
r e -
g i o n
o f p l a n t , p l a n t
s i z e , p l a n t
t y p e , c a p i -
t a l , m a t e r i a l s , e m p l o y -
m e n t , w o r k e r s c o n t r o l s
L a l l e m a n d
e t
a l .
( 2 0 0 9 )
B e l g i u m
E m p l o y e r -
E m p l o y e e
d a t a
s e t
1 9 9 5 ,
2 0 0 3
6 9 1 (
1 2 0 4 )
fi r m s
i n
1 9 9 5
( 2 0 0 3 )
W o r k e r s o f a l l
a g e s
O L S
V a l u e a d d e d
E d u c a t i o n ,
w a g e s ,
s h a r e s o f
b l u e c o l l a r
w o r k e r s ,
w o m e n
a n d
p a r t - t i m e
w o r k e r s , fi r m
s i z e , w a g e
b a r g a i n i n g ,
r e g i o n a n
d
fi n a n c i a l
c o n t r o l
21
8/9/2019 Age, wage and productivity - CESifo working paper
http://slidepdf.com/reader/full/age-wage-and-productivity-cesifo-working-paper 23/48
T a b l e 2 : O v e r v i e w
o f E m p l o y e r - E m p l o y e e d a t a s e t s :
L o n g i t u d i n a l
A u t h o r s
C o u n t r y
S o u r c e
T i m e
s p a n
S a
m p l e s i z e
A g e o b s e r -
v a n t s
T y p e o f r e g r e s -
s i o n s
D e p e n d e n t v a r i a b l e s
I n d e p e n d e n t v a r i a b l e s
H a e g e l a n d
e t
a l .
( 1 9 9 9 )
N o r w a y
A n n u a l
N o r w e g i a n
c e n s u s o f m a n u f a c t u r -
i n g p l a n t s w i t h r e g i s t e r
fi l e s
f o r
i n d i v i d u a l
w o r k e r s
1 9 8 6 -
1 9 9 3
7 , 1 2 2
p l a n t s
W o r k e r s o f
a l l a g e s
M a x i m u m
L i k e l i h o o d
W a g e , v a l u e - a d d e d
G e n d e r ,
e d u c a t i o n ,
e x p e r i e n c e
,
i n d u s t r y
d u m m i e s ,
r e g i o n
o f
p l a n t , o w n
e r s h i p s t r u c -
t u r e , p l a n t s i z e , p l a n t
a g e , p l a n t
t y p e , c a p i t a l
C r ´ e p o n
e t
a l .
( 2 0 0 3 )
F r a n c e
D e c l a r a t i o n s A d m i n i s -
t r a t i v e s
d e
D o n n e e s
S o c i a l e s a n d B e n e fi c e s
R e e l s N o r m a u x
1 9 9 4 -
1 9 9 7
7 7
, 8 6 8
fi r
m s
W o r k e r s o f
a l l a g e s
O L S , fi x e d e f -
f e c t s , G M M
W a g e , v a l u e - a d d e d
A g e , g e n d
e r , s k i l l , i n -
d u s t r y d u m m i e s , p l a n t
s i z e , p l a n t
a g e , c a p i t a l ,
e m p l o y m e n t
A u b e r t
( 2 0 0 3 )
F r a n c e
D e c l a r a t i o n s A d m i n i s -
t r a t i v e s
d e
D o n n e e s
S o c i a l e s a n d B e n e fi c e s
R e e l s N o r m a u x
1 9 9 4 -
2 0 0 0
1 7
5 , 0 0 0
fi r
m s
a n d
6 , 0 0 0 , 0 0 0
w o r k e r s
W o r k e r s o f
a l l a g e s
G M M
L a b o r
c o s t s ,
v a l u e -
a d d e d
A g e , g e n d e r , s k i l l , c a p -
i t a l , e m p l o
y m e n t
I l m a k u n n a s
e t
a l .
( 2 0 0 5 )
F i n l a n d
F i n n i s h
I n d u s t r i a l
S t a t i s t i c s
a n d
E m -
p l o y m e n t
S t a t i s t i c s ,
B u s i n e s s R e g i s t e r a n d
E m p l o y m e n t S t a t i s t i c s
1 9 8 8 -
1 9 9 8
3 1
, 7 0 0
p l a n t - y e a r
o b
s e r v a -
t i o n s
1 5 - 6 4
O L S ,
p l a n t -
l e v e l
fi x e
d
e ff e c t s
W a g e , v a l u e - a d d e d
A g e ,
g e n d e r ,
e d u c a -
t i o n , o c c u p a t i o n , i n -
d u s t r y d u m m i e s , p l a n t
a g e , c a p i t a l , e m p l o y -
m e n t , y e a r
d u m m i e s
D o s t i e
( 2 0 0 6 )
C a n a d a
W o r k p l a c e
a n d
E m -
p l o y e e S u r v e y
1 9 9 9 -
2 0 0 3
2 0
, 2 2 5 e m -
p l o y e e s
W o r k e r s o f
a l l a g e s
T w o - s t a g e e s t
i -
m a t i o n m e t h o
d
W a g e , v a l u e - a d d e d
A g e ,
i n d u s t r y
d u m -
m i e s , r e g i o n o f p l a n t ,
c a p i t a l ,
e m p l o y m e n t ,
y e a r d u m m
i e s , w o r k e r s
c o n t r o l s
A u b e r t
a n d C r ´ e p o n
( 2 0 0 7 )
F r a n c e
D e c l a r a t i o n s A d m i n i s -
t r a t i v e s
d e
D o n n e e s
S o c i a l e s a n d B e n e fi c e s
R e e l s N o r m a u x
1 9 9 4 -
2 0 0 0
7 0
, 0 0 0
fi r
m s
a n d
o v
e r
3 . 9
m i l l i o n
w o r k e r s
W o r k e r s o f
a l l a g e s
G M M - t y p e e s -
t i m a t i o n p r o c e -
d u r e
L a b o r
c o s t ,
v a l u e
a d d e d
A g e ,
i n d u s t r y
d u m -
m i e s , p l a n
t s i z e , p l a n t
a g e , c a p i t a l , e m p l o y -
m e n t
I l m a k u n n a s
e t
a l .
( 2 0 0 7 )
F i n l a n d
F i n i s h
L o n g i t u d i n a l
E m p l o y e r - E m p l o y e e
D a t a
1 9 9 5 -
2 0 0 3
1 8
, 8 4 8
fi r
m s
( 4
0 5 , 0 0 0
i n d i v i d u a l s
p e
r p e r i o d )
W o r k e r s o f
a l l a g e s
O L S ,
i n
-
s t r u m e n t a l
v a r i a b l e s
V a l u e - a d d e d o f a fi r m ,
w a g e s u m p e r e m p l o y e e
A g e , p l a n t
c h a r a c t e r i s -
t i c s , i n s t r u
m e n t a l v a r i -
a b l e s f o r t h
e l a b o r fl o w s
M a l m b e r g
e t
a l .
( 2 0 0 8 )
S w e d e n
S w e d i s h
M a n u f a c t u r -
i n g &
M i n i n g S u r v e y s
a n d
R e g i o n a l
L a b o r
M a r k e t S t a t i s t i c s
1 9 8 5 -
1 9 9 6
8 , 0 0 0 - 9 , 0 0 0
p l a n t s
p e r
y e
a r
W o r k e r s o f
a l l a g e s
O L S
( p o o l e d ) ,
p l a n t
fi x e
d
e ff e c t s ,
i n
-
s t r u m e n t a l
v a r i a b l e s
V a l u e - a d d e d
A g e , e d u c a t i o n , r e g i m e
d u m m y
G a r i b a l d i
e t
a l .
( 2 0 1 0 )
F i n l a n d
F i n n i s h
L i n k e d
E m -
p l o y e r E m p l o y e e D a t a
1 9 9 0 -
2 0 0 2
1 6
, 0 0 0
o b
s e r v a -
t i o n s , 5 , 0 0 0
p l a n t s
W o r k e r s o f
a l l a g e s
F i x e d
e ff e c t s ,
G M M
T o t a l f a c t o r p r o d u c t i v -
i t y , w a g e
A g e ,
g e n d e r ,
e d u c a -
t i o n , t e n u
r e , i n d u s t r y
d u m m i e s ,
p l a n t s i z e ,
y e a r
d u m
m i e s ,
w o r k
f o r c e
d i v e r s i t y
m e a -
s u r e s
G ¨ o b e l
e t
a l .
( 2 0 0 9 )
G e r m a n y
I n s t i t u t
f u r
A r b e i t s m a r k t -
u n d
B e r u f s f o r s c h u n g
1 9 9 7 -
2 0 0 5
8 , 5 0 0
e s t a b l i s h -
m e n t s
W o r k e r s o f
a l l a g e s
B e t w e e n ,
w i t h i n
a n
d
G M M
( i n
-
s t r u m e n t a l )
e s t i m a t i o n
V a l u e - a d d e d
A g e ,
g e n d e r ,
s k i l l ,
t e n u r e , i n d u s t r y d u m -
m i e s , c a p i t a l , e m p l o y -
m e n t , y e a r d u m m i e s
a n d p a r t - t i m e s h a r e
22

8/9/2019 Age, wage and productivity - CESifo working paper
http://slidepdf.com/reader/full/age-wage-and-productivity-cesifo-working-paper 24/48
Table 3: Descriptive statistics of the sample
Obs. Mean Std.dev. Min Max
Value added 44371 5909 37574 1 2693205Log value added 44371 7.41 1.37 0 14.81Employment (NR) 44371 97.3 488.9 5 41648Employment (FTE) 44371 77.4 407.4 0.2 34662.9Value added per worker 44371 69.88 442.95 0.10 64530Log(value added/worker) 4 4371 3.93 0.61 -2.33 11.07Total cost of labor 44371 3511 21140 3 1649406Log total cost of labor 44371 7.07 1.33 1.10 14.32Labor costs per worker 44371 46.46 313.02 0.07 47004Log(labor costs/ worker) 44371 3.59 0.48 -2.62 10.76Depreciation 44371 827 6754 1 507895Log depreciation 44371 5.00 1.63 0 13.14
Establishment size (NR) %:5-9 employees 0.08 100-199 employees 0.1210-19 employees 0.14 200-499 employees 0.0720-49 employees 0.36 500+ employees 0.0350-99 employees 0.20 Total 1.00
Age categories: NR SVMean Std.dev. Mean Std.dev.
-25 0.16 0.13 0.12 0.11
25-29 0.11 0.08 0.11 0.0830-34 0.14 0.08 0.15 0.0935-39 0.15 0.08 0.15 0.0840-44 0.13 0.07 0.14 0.0845-49 0.11 0.07 0.12 0.0850-56 0.12 0.08 0.14 0.0957+ 0.07 0.07 0.07 0.07Total 1.00 1.00 1.00 1.00
Proportions female NR SVMean Std.dev. Mean Std.dev.
0.26 0.18 0.24 0.17
Note: Value added, labor costs and depreciation in 1000 e; FTE = full-time equivalents.
23

8/9/2019 Age, wage and productivity - CESifo working paper
http://slidepdf.com/reader/full/age-wage-and-productivity-cesifo-working-paper 25/48
Table 4: Baseline parameter estimates of the production and labor cost function
Pro duction function Lab or cost functionOLS First differences OLS First differences
Employment 0.02 (0.00)*** -0.72 (0.01)*** 0.02 (0.00)*** -0.70 (0.01)***Age share-25 -0.85 (0.04)*** 0.03 (0.05) -0.94 (0.03)*** -0.06 (0.04)25-29 -0.35 (0.05)*** 0.10 (0.06) -0.28 (0.03)*** 0.06 (0.04)30-34 -0.12 (0.05)*** 0.03 (0.05) -0.09 (0.03)*** 0.05 (0.04)35-39 – – – –40-44 -0.09 (0.05)* -0.06 (0.05) -0.02 (0.04) -0.07 (0.04)*45-49 -0.27 (0.05)*** 0.01 (0.06) -0.04 (0.04) -0.05 (0.04)50-56 -0.37 (0.04)*** -0.08 (0.06) 0.04 (0.04) -0.07 (0.04)57+ -0.30 (0.05)*** - 0.07 (0.07) -0.05 (0.04) -0.07 (0.05)Female -0.46 (0.02)*** 0.00 (0.01) -0.54 (0.01)*** -0.04 (0.03)
Observations 44371 28775 44371 28775
GMM-1 GMM-2 GMM-1 GMM-2
Employment -0.72 (0.02)*** -0.72 (0.03)*** -0.68 (0.02)*** -0.68 (0.02)***Age share-25 -0.58 (0.33)* -0.29 (0.38) -0.50 (0.24)** -0.76 (0.28)***25-29 -0.15 (0.25) -0.09 (0.32) -0.02 (0.19) -0.15 (0.25)30-34 -0.10 (0.19) 0.13 (0.22) -0.06 (0.15) 0.12 (0.17)35-39 – – – –40-44 0.16 (0.21) 0.26 (0.23) 0.25 (0.16) 0.17 (0.18)
45-49 0.49 (0.28)* 0.72 (0.32)** 0.40 (0.20)** 0.28 (0.23)50-56 0.60 (0.36)* 0.57 (0.40) 0.46 (0.26)* 0.23 (0.30)57+ 0.09 (0.49) 0.27 (0.52) 0.41 (0.34) -0.18 (0.40)Female -0.01 (0.04) 0.09 (0.06) -0.06 (0.03)* -0.03 (0.05)
Observations 24509 16689 24509 16689Diagnostic testsOveridentification – 2.77 – 3.14Underidentification 162.2*** 144.2*** 162.2*** 144.2***Weak identification 23.6 10.7 23.6 10.7Endogeneity 14.5** 9.7 13.5* 19.2***
All estimates include year dummies. The GMM estimates are in first differences with lagged levels as instruments;GMM-1 has two period lagged levels of variables as instruments; GMM-2 has two and three period lagged levels of
variables as instruments; The following diagnostic tests are presented: overidentification = Hansen-Sargan
statistic; underidentification = Kleibergen-Paap rk LM statistic; weak identification = Kleibergen-Paap Wald Fstatistic; endogeneity = Durbin-Wu-Hausman statistic; in parentheses robust standard errors; *** (**,*) indicates
significance at a 1% (5%, 10%) level.
24

8/9/2019 Age, wage and productivity - CESifo working paper
http://slidepdf.com/reader/full/age-wage-and-productivity-cesifo-working-paper 26/48
Table 5: Parameter estimates of the productivity-wage gap
First differences GMM-1 GMM-2
Employment -0.03 (0.01)*** -0.04 (0.02)** -0.04 (0.02)**Age share-25 0.09 (0.04)** -0.07 (0.26) 0.37 (0.30)25-29 0.04 (0.04) 0.13 (0.20) -0.01 (0.24)30-34 -0.03 (0.04) -0.04 (0.16) -0.00 (0.17)35-39 – – –40-44 0.01 (0.04) -0.09 (0.16) 0.09 (0.17)45-49 0.06 (0.04) 0.09 (0.22) 0.37 (0.24)50-56 -0.00 (0.1) 0.14 (0.27) 0.26 (0.9)57+ 0.00 (0.05) -0.31 (0.37) 0.40 (1.1)Female 0.04 (0.03) 0.05 (0.04) 0.10 (0.04)**
Observations 28775 24509 16689Diagnostic tests
Overidentification – – 5.29Underidentification – 162.2 144.2Weak identification – 23.6 10.7Endogeneity – 5.5 3.8
Note: The productivity-wage gap is defined as ln(qit) − ln(wit); see also footnote Table 4
25

8/9/2019 Age, wage and productivity - CESifo working paper
http://slidepdf.com/reader/full/age-wage-and-productivity-cesifo-working-paper 27/48
Figure 1: Median value-added and median labor costs by age group; log-scale
2.5
3
3.5
4
4.5
-25 25-29 30-34 35-39 40-44 45-49 50-56 57+
Age category
V a l u e
a d d e d
a n d
l a b o r c o s t s
Median value added Median wage costs
Note that this graph is based on observations of the mean age of the workforcein each firm in each year of our dataset.
26

8/9/2019 Age, wage and productivity - CESifo working paper
http://slidepdf.com/reader/full/age-wage-and-productivity-cesifo-working-paper 28/48
Figure 2: Age profiles – baseline parameter estimates Manufacturing
OLS
-1
-0.8
-0.6
-0.4
-0.2
0
0.2
0.4
0.6
0.8
1
-25 25-29 30-34 35-39 40-44 45-49 50-56 57+
Age category
P a r a m e t e r e s t i m a t e s
Value added Wage costs
First differences
-1
-0.8
-0.6
-0.4
-0.2
0
0.2
0.4
0.6
0.8
1
-25 25-29 30-34 35-39 40-44 45-49 50-56 57+
Age category
P a r a m e t e r e s t i m a t e s
Value added Wage costs
GMM-1
-1
-0.8
-0.6
-0.4
-0.2
0
0.2
0.4
0.6
0.81
-25 25-29 30-34 35-39 40-44 45-49 50-56 57+
Age category
P a r a m e t e r e s t i m a t e s
Value added Wage costs
GMM-2
-1
-0.8
-0.6
-0.4
-0.2
0
0.2
0.4
0.6
0.81
-25 25-29 30-34 35-39 40-44 45-49 50-56 57+
Age category
P a r a m e t e r e s t i m a t e s
Value added Wage costs
Note: Parameter estimates from Table 4.
27

8/9/2019 Age, wage and productivity - CESifo working paper
http://slidepdf.com/reader/full/age-wage-and-productivity-cesifo-working-paper 29/48
Figure 3: Age profiles – GMM-1 parameter estimates; sensitivity analysis Man-
ufacturing
Baseline
-1
-0.8
-0.6
-0.4
-0.2
0
0.20.4
0.6
0.8
1
-25 25-29 30-34 35-39 40-44 45-49 50-56 57+
Age category
P a r a m e t e r e s t i m a t e s
Value added Wage costs
Balanced panel
-1
-0.8
-0.6
-0.4
-0.2
0
0.20.4
0.6
0.8
1
-25 25-29 30-34 35-39 40-44 45-49 50-56 57+
Age category
P a r a m e t e r e s t i m a t e s
Value added Wage costs
With capital
-1
-0.8
-0.6
-0.4
-0.2
0
0.2
0.4
0.6
0.8
1
-25 25-29 30-34 35-39 40-44 45-49 50-56 57+
Age category
P a r a m e t e r e s t i m a t e s
Value added Wage costs
With workers
-1
-0.8
-0.6
-0.4
-0.2
0
0.2
0.4
0.6
0.8
1
-25 25-29 30-34 35-39 40-44 45-49 50-56 57+
Age category
P a r a m e t e r e s t i m a t e s
Value added Wage costs
Note: Parameter estimates from Tables 4, ??, 9, 10.
28

8/9/2019 Age, wage and productivity - CESifo working paper
http://slidepdf.com/reader/full/age-wage-and-productivity-cesifo-working-paper 30/48
Figure 4: Age profiles – all industries; preferred estimates
Construction
-1
-0.8
-0.6
-0.4
-0.2
0
0.2
0.4
0.6
0.8
1
-25 25-29 30-34 35-39 40-44 45-49 50-56 57+
Age category
P a r a m e t e r e s t i m a t e s
Value added Wage costs
Wholesale trade
-1
-0.8
-0.6
-0.4
-0.2
0
0.2
0.4
0.6
0.8
1
-25 25-29 30-34 35-39 40-44 45-49 50-56 57+
Age category
P a r a m e t e r e s t i m a t e s
Value added Wage costs
Retail trade
-1
-0.8
-0.6
-0.4
-0.2
0
0.2
0.4
0.6
0.8
1
-25 25-29 30-34 35-39 40-44 45-49 50-56 57+
Age category
P a r a m e t e r e s t i m a t e s
Value added Wage costs
Commercial services
-1
-0.8
-0.6
-0.4
-0.2
0
0.2
0.4
0.6
0.8
1
-25 25-29 30-34 35-39 40-44 45-49 50-56 57+
Age category
P a r a m e t e r e s t i m a t e s
Value added Wage costs
Manufacturing
-1
-0.8
-0.6
-0.4
-0.2
0
0.2
0.4
0.6
0.8
1
-25 25-29 30-34 35-39 40-44 45-49 50-56 57+
Age category
P a r a m
e t e r e s t i m a t e s
Value added Wage costs
Note: Parameter estimates from Tables 12, 13, 14, 15 (first differences) and 4 (GMM-1).
29

8/9/2019 Age, wage and productivity - CESifo working paper
http://slidepdf.com/reader/full/age-wage-and-productivity-cesifo-working-paper 31/48
Appendix A: Details about our data
We combine four micro datasets from Statistics Netherlands using unique identifiers to
match information of individual workers to information about the firm who employs them:
the General Firm Register (ABR), Production Statistics on Manufacturing (PS - Ind),
the Social Statistical Dataset on Jobs (SSB - Banen) and the Municipal Administration
(GBA). All sources cover the period 2000-2005. The General Firm Register contains all
firms in the Netherlands and serves as a sampling frame for the survey of firms. Informa-
tion about the registration date of the firm is coupled to the information in the Production
Statistics of Manufacturing. The Production Statistics on Manufacturing provide infor-
mation to estimate the production and labor cost functions: value-added, employment and
total labor costs. Manufacturing firms are defined as firms whereby mechanical, physical
or chemical processing of materials, substances or components, new products are fabri-
cated. The Production Statistics refer to a sample of firms. In total there are 21,685
different firms over the six years with an observation number of 61,562. Of these, 3,777firms are observed for all years. The Social Statistical Dataset is an exhaustive database
which registers all job-worker relations of a person in a continuous period. The dataset
contains information on the number of working days and fiscal wage. The information
is mainly coming from the Insured Workers Administration (VZA), but has also more
detailed information from surveys. The surveys cover only 30% of all records in the data
set and are therefore not used. Every record is identified by the persons identification
number (based on the social security number), the firm’s identification number and an
identification code. The firm’s identification code makes it possible to link this file to the
information on the firms.
The identification code indicates if the person is present in the Municipal Administra-tion. This data source provides more detailed information on the persons in the Social
Statistical Dataset on Jobs: year of birth, gender, nationality, etc. However, information
on schooling or occupation is lacking. With this information the characteristics of groups
of workers can be easily computed form the aggregation of information on all workers with
similar characteristics. For each firm, eight age categories are considered: less than 25,
25-29, 30-34, 35-39, 40-44, 45-49, 50-56 and 57 and older. The category 35 to 39 years
old is taken as the reference group in our estimates. Labor input can be measured in two
ways: first by the persons worked at the firm during the year and second by the number of
full-time equivalents. It is possible that a person which is present in the Social Statistical
Dataset on Jobs cannot be found in the Municipal Administration. One reason for this isthat the person does not live in the Netherlands. The Municipal Administration gives in-
formation about the gender and year of birth and if this information is lacking, the person
can not be arranged in the corresponding group which is used in the model. About 19% of
the observations of the firms have at least one employee of which the personal information
is lacking. These firms are not only larger, but also the value-added per employee is larger
30

8/9/2019 Age, wage and productivity - CESifo working paper
http://slidepdf.com/reader/full/age-wage-and-productivity-cesifo-working-paper 32/48
compared to firms which have all the information. To solve this problem, only firms with
more than 95% of the employees personal information, are taken into account.
Table 6 presents summary statistics for plant-level data. There are 61,652 observations
of value added and 1,366 of these observations are non positive. There are 2,133 firmswith a negative labor cost. The average employment consists of 88.2 persons equal to 69.9
full-time equivalent workers. The lower part of Table 6 presents the mean and standard
deviation of the shares of age groups on the basis of number of employees and number of
full-time equivalents. The youngest category, less than 25 years old, has a larger share
in the number of employees than in the number of full-time equivalents, which indicates
that younger persons work a shorter time at a firm compared to the other categories. The
group of which there was no information is on average a little less than 1%.
In the cleaning process we lost observations for a variety of reasons. For some firms we
have no information about value added, total labor costs, depreciation of fixed assets or
the number of employees. There are also firms with negative values for value added, total
labor costs or depreciation of fixed assets. And there are firms for which for more than 5%
of the workers information about age or gender is missing. Further cleaning of the dataset
was done because of extreme changes in the number of employees in subsequent years. If
the number of employees grew more than ten times as large or was less than 10% of the
previous year, the firm was excluded from the sample. Also, firms which had a change in
their main industry, based on the ISIC code, were excluded. Finally, we removed firms
with less than 5 employees. The table below shows the transition from the gross sample
to the net sample in more detail:
Observations FirmsGross sample 61,562 21,684
After removingValue added (VA) negative 60,286 21,164Labor costs (LC) negative 58,902 20,225Depreciation (D) negative 56,019 19,368Missing info on VA, LC, D 52,027 17,154Missing info on more than 5% of workers 49,602 16,614Big shifts in employment 48,974 16,435Change of industry code 47,984 16,226Firms with less than 5 workers 44,371 13,941
Note that when we remove firms for which there is no information over each of the years 2000-2005 a balanced
sample of 2944 firms with 17,664 observations remains.
Appendix B: Sensitivity analysis ManufacturingB1 Balanced panel
Our main analysis is based on unbalanced data on all firms in our sample. By way of sensi-
tivity analysis we present the parameter estimates based on balanced panel data, consisting
of firms surveyed in all years. This subset consists of 2944 firms. In the balanced dataset
31

8/9/2019 Age, wage and productivity - CESifo working paper
http://slidepdf.com/reader/full/age-wage-and-productivity-cesifo-working-paper 33/48
Table 6: Descriptive statistics of the complete dataset of manufacturing firms
Obs. Mean Std.dev. Min Max
Value added (e1000) 61562 5082 36455 -1926903 2693205Log value added (e1000) 60286 7.06 1.66 0 14.81Total cost of labor (e1000) 62556 3015 18738 -390 1649406Log total cost of labor (e1000) 59423 6.76 1.60 0 14.32Depreciation (e1000) 61554 729 6654 1 41648Log depreciation (e1000) 57607 4.75 1.81 0 13.14Employment (NR) 55510 88.2 452.8 1 41648Employment (FTE) 55510 69.9 373.5 0.0 34662.9
Establishment size (NR) %:1 employees 0.02 50-99 employees 0.192-4 employees 0.06 100-199 employees 0.115-9 employees 0.08 200-499 employees 0.0610-19 employees 0.13 500+ employees 0.02
20-49 employees 0.34 Total 1.00
Age categories: NR FTEMean Std.dev. Mean Std.dev.
-25 0.16 0.15 0.12 0.1325-29 0.11 0.10 0.11 0.1130-34 0.14 0.10 0.15 0.1135-39 0.15 0.10 0.15 0.1140-44 0.13 0.10 0.14 0.1145-49 0.11 0.09 0.11 0.1050-56 0.12 0.11 0.13 0.1257+ 0.07 0.10 0.08 0.10no information 0.01 0.04 0.01 0.04Total 1.00 1.00 1.00 1.00
Proportions female NR FTE
Mean Std.dev. Mean Std.dev.0.26 0.20 0.24 0.20
on average the firms are larger and the value added, labor costs and depreciation are
higher. The average number of employees per firm is doubled compared to the unbalanced
panel data set. Table 7 presents the parameter estimates based on the balanced panel
showing that the differences with the full dataset are minor. Figure 3 gives a graphical
representation of the GMM-1 parameter estimates. Clearly, whereas in the baseline esti-
mate the differences in the age profiles for productivity and wage costs are small, there
are more substantial in the balanced panel. Nevertheless, due to the imprecision of theestimates in neither case are the age patterns different for productivity and wage costs.
32

8/9/2019 Age, wage and productivity - CESifo working paper
http://slidepdf.com/reader/full/age-wage-and-productivity-cesifo-working-paper 34/48
B2 Using a different age specification
Instead of distinguishing 8 age groups, we present an alternative estimation in which we
use average age of the workforce as explanatory variable. In this case we respecify in
equation (1) λit = exp(λaAit), with A is the average age of the workforce. In this casean additional year of age affects output per worker always in the same proportion. We
estimate
ln(qi,t) = α + γ ln(Li,t) + γ aAi,t + δF i,t + εi,t (11)
with γ a = γλa. The wage cost equation is specified accordingly. Table 8 presents the
parameter estimates. The signs of the estimated coefficients of the mean age are the same
for the production function and the labor cost specification. The results are in line with
the baseline estimates. For the pooled cross-section we find that age has a positive effect
on productivity. Once we introduce firm fixed effects the age effect becomes negative.
Again, in the GMM estimates there is a positive age effect for both productivity and wage
costs, but again, given the imprecision of the estimates they are not significantly different
from each other.
B3 Introducing capital
Some studies include capital input as an explanatory variable in a production equation
while other studies do not. Including capital input is driven by data availability. Our data
set lacks a proper variable about capital, but the depreciation on fixed assets is used as a
rough indicator for capital input. Table 9 presents the estimation results of the production
function when capital is included. For reasons of symmetry we also introduce capital in the
wage costs function. Although there are differences in the magnitude of some parameter
estimates the general pattern of the age effects on productivity and wage costs is very
much the same. This is confirmed in Figure 3 which gives a graphical representation of
the GMM-1 parameter estimates. Indeed, introducing capital doesn’t influence the age
patterns a lot.
B4 Employment: number of workers
In the baseline model, the percentages of the age and gender groups were calculated by
using the number of full-time equivalent workers in the firm, because that gives a better
representation of the actual time a worker worked at the firm. Another possibility is usingthe number of workers the firm employed during the year. This measure is less precise
but often used in other studies. Table 10 presents the parameter estimates. The use of
the number of workers does not change the estimated parameters for the middle groups,
but for the youngest age group they are somewhat larger. This may be caused by the fact
that younger stay at a firm for a shorter period than other workers (see, for instance, the
33

8/9/2019 Age, wage and productivity - CESifo working paper
http://slidepdf.com/reader/full/age-wage-and-productivity-cesifo-working-paper 35/48
proportions of the age groups in the descriptive statistics of Table 3). As before, Figure 3
gives a graphical representation of the GMM-1 parameter estimates, confirming that using
a different specification for employment doesn’t influence the age patterns a lot.
Table 7: Parameter estimates of the production and labor cost functions manufacturingfirms; balanced panel
Pro duction function Lab or cost functionOLS First differences OLS First differences
Employment 0.09 (0.00)*** -0.71 (0.02)*** 0.05 (0.00)*** -0.67 (0.01)***Age share-25 -1.31 (0.07)*** 0.22 (0.09)** -1.17 (0.05)*** 0.08 (0.06)25-29 -0.07 (0.09) 0.26 (0.09)*** -0.18 (0.05)*** 0.17 (0.06)***30-34 0.04 (0.09) 0.12 (0.08) -0.07 (0.06) 0.07 (0.05)35-39 – – – –
40-44 -0.09 (0.09) 0.03 (0.08) -0.08 (0.06) -0.02 (0.05)45-49 -0.23 (0.08)*** -0.01 (0.09) -0.06 (0.06) -0.10 (0.06)50-56 -0.30 (0.08)*** -0.09 (0.09) 0.16 (0.05)*** -0.14 (0.06)**57+ -0.21 (0.09)*** -0.11 (0.11) 0.03 (0.06) -0.15 (0.07)**Female -0.44 (0.03)*** 0.06 (0.06) -0.49 (0.02)*** -0.04 (0.04)
Observations 17664 14720 17664 14772
GMM-1 GMM-2 GMM-1 GMM-2
Employment -0.66 (0.04)*** -0.68 (0.04)*** -0.60 (0.03)*** -0.63 (0.04)***Age share-25 -0.26 (0.44) 0.11 (0.50) -0.75 (0.32)** -0.54 (0.34)25-29 -0.34 (0.39) -0.07 (0.42) -0.56 (0.27)** -0.35 (0.28)
30-34 -0.12 (0.29) 0.01 (0.28) -0.18 (0.20) -0.12 (0.21)35-39 – – – –40-44 0.49 (0.30) 0.21 (0.30) 0.15 (0.20) 0.03 (0.19)45-49 0.50 (0.40) 0.07 (0.41) 0.28 (0.25) 0.18 (0.26)50-56 0.37 (0.50) 0.04 (0.55) 0.02 (0.35) 0.11 (0.35)57+ -0.17 (0.58) -0.48 (0.64) -0.31 (0.41) -0.39 (0.45)Female 0.12 (0.07) 0.17 (0.08)** 0.02 (0.06) 0.06 (0.06)
Observations 11776 8832 11776 8832Diagnostic testsOveridentification - 3.02 - 2.80Underidentification 124.7*** 86.6*** 124.7*** 86.6***Weak identification 19.1 6.6 19.1 6.6Endogeneity 7.9 2.1 16.1** 10.1
Note: see also footnote Table 4
34

8/9/2019 Age, wage and productivity - CESifo working paper
http://slidepdf.com/reader/full/age-wage-and-productivity-cesifo-working-paper 36/48
Table 8: Estimation of the production and labor cost functions – mean age; manufacturingfirms
Pro duction function Lab or cost functionOLS First differences OLS First differences
Employment 0.03 (0.00)*** -0.73 (0.01)*** 0.03 (0.00)*** -0.60 (0.01)***Average age/10 0.10 (0.01)*** -0.07 (0.01)*** 0.20 (0.01)*** -0.02 (0.01)**Female -0.48 (0.02)*** -0.01 (0.04) -0.54 (0.01)*** -0.04 (0.03)**Observations 44371 28775 44371 28775
GMM-1 GMM-2 GMM-1 GMM-2
Employment -0.69 (0.02)*** -0.72 (0.03)*** -0.68 (0.02)*** -0.66 (0.02)***Average age 0.05 (0.02)*** 0.03 (0.02) 0.03 (0.01)*** 0.04 (0.01)***Female 0.03 (0.05) 0.10 (0.06)* -0.04 (0.04) -0.02 (0.04)
Observations 24509 16689 24509 16689Diagnostic testsOveridentification – 0.87 – 1.48Underidentification 154.9*** 121.0*** 154.9*** 121.0***Weak identification 157.8 61.6 157.8 61.6Endogeneity 13.1*** 3.5* 9.0*** 12.0***
Note: see note to Table 4.
35

8/9/2019 Age, wage and productivity - CESifo working paper
http://slidepdf.com/reader/full/age-wage-and-productivity-cesifo-working-paper 37/48
Table 9: Estimation of the production and labor cost functions when capital is included;manufacturing firms
Production function Labor cost functionMethod OLS First differences GMM-1 OLS First differences GMM-1
Employment -0.29 (0.00)*** -0.79 (0.01)*** -0.79 (0.02)*** -0.17 (0.00)*** -0.75 (0.01)*** -0.74 (0.01)***Capital 0.30 (0.00)*** 0.28 (0.00)*** 0.26 (0.01)*** 0.18 (0.00)*** 0.25 (0.00)*** 0.22 (0.00)***Age groupsLess than 25 -0.57 (0.04)*** 0.07 (0.05) -0.43 (0.31) -0.77 (0.03)*** -0.02 (0.04) -0.38 (0.20)*25-29 -0.13 (0.04) 0.08 (0.05) -0.24 (0.23) -0.16 (0.03)*** 0.05 (0.04) -0.09 (0.15)30-34 -0.03 (0.047) 0.01 (0.04) -0.10 (0.17) -0.04 (0.03) 0.04 (0.03) -0.06 (0.12)35-39 – – – – – –40-44 -0.05 (0.04) -0.05 (0.04)* 0.01 (0.18) 0.01 (0.03) -0.06 (0.03)* 0.12 (0.13)45-49 0.06 (0.04) 0.00 (0.05) 0.25 (0.26) 0.20 (0.03)*** -0.05 (0.04) 0.19 (0.18)50-56 -0.07 (0.04)* -0.10 (0.05)* 0.47 (0.32) 0.23 (0.03)*** -0.09 (0.04)** 0.35 (0.23)57+ -0.05 (0.04) -0.04 (0.06) -0.02 (0.43) 0.05 (0.03) -0.05 (0.04) 0.31 (0.30)Female -0.37 (0.01)*** 0.01 (0.04) -0.02 (0.04) -0.49 (0.01)*** -0.05 (0.03)** -0.06 (0.03)***
Observations 44371 28775 24509 44371 28775 24509Diagnostic testsUnderidentification – – 162.4 – – 162.4Weak identification – – 23.6 – – 23.6Endogeneity – – 12.4* – – 9.1
Note: see note to Table 4.
36

8/9/2019 Age, wage and productivity - CESifo working paper
http://slidepdf.com/reader/full/age-wage-and-productivity-cesifo-working-paper 38/48
Table 10: Estimation of the production and labor costs functions with number of employ-ees; manufacturing firms
Production function Labor cost functionMethod OLS First differences GMM-1 OLS First differences GMM-1
Employment 0.04 (0.00)*** -0.77 (0.01)*** -0.66 (0.03)*** 0.04 (0.00)*** -0.74 (0.01)*** -0.66 (0.02)***Age groupsLess than 25 -1.65 (0.07)*** -0.01 (0.05) -1.03 (0.32)*** -1.65 (0.06)*** -0.12 (0.04)*** -0.85 (0.24)***25-29 -0.46 (0.09)*** -0.01 (0.06) -0.30 (0.28) -0.36 (0.07)*** -0.00 (0.04) -0.15 (0.21)30-34 -0.16 (0.09) -0.02 (0.05) -0.23 (0.22) -0.11 (0.07) -0.01 (0.04) -0.27 (0.16)*35-39 – – – – – –40-44 -0.14 (0.10) -0.11 (0.05)** 0.22 (0.23) -0.05 (0.04) -0.09 (0.04)** 0.21 (0.17)45-49 -0.26 (0.09)** -0.04 (0.06) 0.59 (0.32)* 0.00 (0.04) 0.06 (0.05) 0.36 (0.24)50-56 -0.39 (0.09)*** -0.12 (0.06)** 0.56 (0.41) 0.10 (0.04)** -0.07 (0.05) 0.37 (0.30)57+ -0.41 (0.09)*** -0.26 (0.07)*** 0.02 (0.55) -0.13 (0.04)*** -0.17 (0.05)*** 0.29 (0.40)Female -0.81 (0.03)*** -0.03 (0.04) -0.02 (0.05) -0.89 (0.01)*** -0.07 (0.03)** -0.07 (0.03)**
Observations 44371 28775 24509 44371 28775 24509Diagnostic testsUnderidentification – – 133.2 – – 133.2Weak identification – – 19.3 – – 19.3Endogeneity – – 20.5*** – – 17.0***
Note: see note to Table 4.
37

8/9/2019 Age, wage and productivity - CESifo working paper
http://slidepdf.com/reader/full/age-wage-and-productivity-cesifo-working-paper 39/48
Appendix C: Parameter estimates other industries
In this appendix we present parameter estimates for other industries, according to the
baseline specifications of Table 4. Our parameter estimates for other industries will provide
some idea about potential effects of differences in educational attainment. As shown inTable 11 there are substantial differences in educational attainment across industries. At
the low end of the educational distribution, whereas 13.4% of the workers in manufacturing
have basic education this is about 10% in construction and commercial services. At the
high end of the educational distribution, whereas 18.2% of the workers in manufacturing
have a higher vocational or academic degree, this in 4.5% in construction and 31.4% in
commercial services.
The parameter estimates in Table 12 relate to the construction sector, Table 13 shows
the parameter estimates for the wholesale trade sector, Table 14 for the retail sector, and
Table 15 for commercial services. There are clear differences in the age-productivity pat-
terns and the age-wage costs pattern within industries for different estimation proceduresand between industries for the same estimation procedure. An important difference com-
pared to the manufacturing estimates is that for the other industries in many cases we
cannot reject the exogeneity of the age structure. Therefore, for the other industries we
prefer the first difference estimates, which show flat age profiles for productivity and wage
costs. We can only speculate why exogeneity of the age structure cannot be rejected.
Compared to manufacturing the other industries have more small firms, whereas retail
trade and commercial services have a higher share of young workers and higher shares of
female workers. Figure 4 provides a graphical representation of our preferred parameter
estimates. As this figure clearly illustrates, the productivity and wage costs profiles follow
each-other closely, confirming the general results for the manufacturing sector.
38
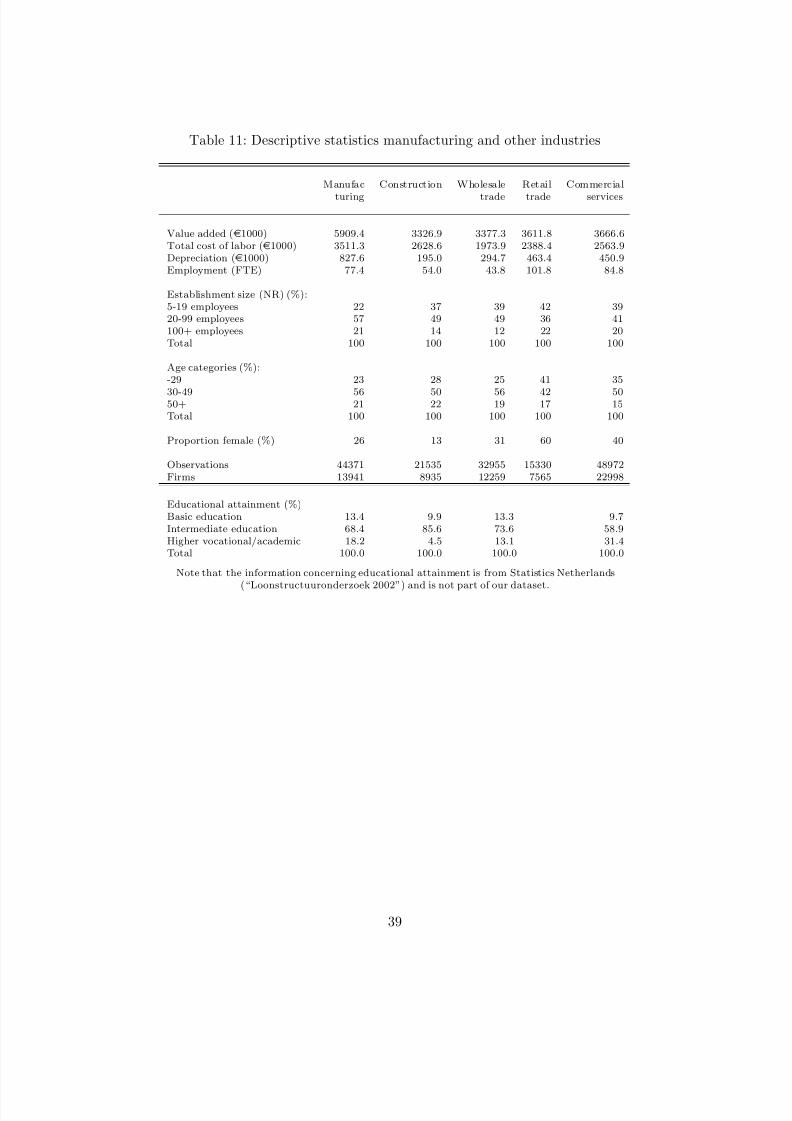
8/9/2019 Age, wage and productivity - CESifo working paper
http://slidepdf.com/reader/full/age-wage-and-productivity-cesifo-working-paper 40/48
Table 11: Descriptive statistics manufacturing and other industries
Manufac Construction Wholesale Retail Commercial
turing trade trade services
Value added (e1000) 5909.4 3326.9 3377.3 3611.8 3666.6Total cost of labor (e1000) 3511.3 2628.6 1973.9 2388.4 2563.9Depreciation (e1000) 827.6 195.0 294.7 463.4 450.9Employment (FTE) 77.4 54.0 43.8 101.8 84.8
Establishment size (NR) (%):5-19 employees 22 37 39 42 3920-99 employees 57 49 49 36 41100+ employees 21 14 12 22 20Total 100 100 100 100 100
Age categories (%):-29 23 28 25 41 35
30-49 56 50 56 42 5050+ 21 22 19 17 15Total 100 100 100 100 100
Proportion female (%) 26 13 31 60 40
Observations 44371 21535 32955 15330 48972Firms 13941 8935 12259 7565 22998
Educational attainment (%)Basic education 13.4 9.9 13.3 9.7Intermediate education 68.4 85.6 73.6 58.9Higher vocational/academic 18.2 4.5 13.1 31.4Total 100.0 100.0 100.0 100.0
Note that the information concerning educational attainment is from Statistics Netherlands
(“Loonstructuuronderzoek 2002”) and is not part of our dataset.
39
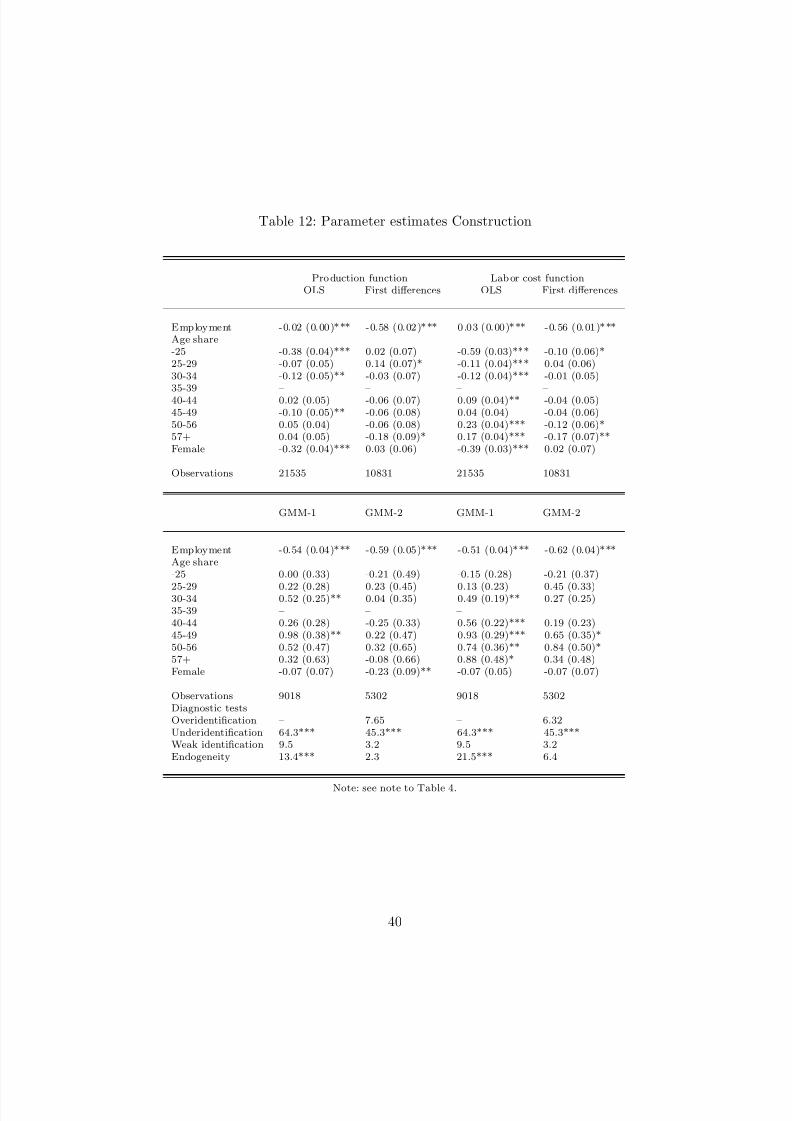
8/9/2019 Age, wage and productivity - CESifo working paper
http://slidepdf.com/reader/full/age-wage-and-productivity-cesifo-working-paper 41/48
Table 12: Parameter estimates Construction
Pro duction function Lab or cost functionOLS First differences OLS First differences
Employment -0.02 (0.00)*** -0.58 (0.02)*** 0.03 (0.00)*** -0.56 (0.01)***Age share-25 -0.38 (0.04)*** 0.02 (0.07) -0.59 (0.03)*** -0.10 (0.06)*25-29 -0.07 (0.05) 0.14 (0.07)* -0.11 (0.04)*** 0.04 (0.06)30-34 -0.12 (0.05)** -0.03 (0.07) -0.12 (0.04)*** -0.01 (0.05)
35-39 – – – –40-44 0.02 (0.05) -0.06 (0.07) 0.09 (0.04)** -0.04 (0.05)45-49 -0.10 (0.05)** -0.06 (0.08) 0.04 (0.04) -0.04 (0.06)50-56 0.05 (0.04) -0.06 (0.08) 0.23 (0.04)*** -0.12 (0.06)*57+ 0.04 (0.05) -0.18 (0.09)* 0.17 (0.04)*** -0.17 (0.07)**Female -0.32 (0.04)*** 0.03 (0.06) -0.39 (0.03)*** 0.02 (0.07)
Observations 21535 10831 21535 10831
GMM-1 GMM-2 GMM-1 GMM-2
Employment -0.54 (0.04)*** -0.59 (0.05)*** -0.51 (0.04)*** -0.62 (0.04)***Age share-25 0.00 (0.33) -0.21 (0.49) -0.15 (0.28) -0.21 (0.37)
25-29 0.22 (0.28) 0.23 (0.45) 0.13 (0.23) 0.45 (0.33)30-34 0.52 (0.25)** 0.04 (0.35) 0.49 (0.19)** 0.27 (0.25)35-39 – – – –40-44 0.26 (0.28) -0.25 (0.33) 0.56 (0.22)*** 0.19 (0.23)45-49 0.98 (0.38)** 0.22 (0.47) 0.93 (0.29)*** 0.65 (0.35)*50-56 0.52 (0.47) 0.32 (0.65) 0.74 (0.36)** 0.84 (0.50)*57+ 0.32 (0.63) -0.08 (0.66) 0.88 (0.48)* 0.34 (0.48)Female -0.07 (0.07) -0.23 (0.09)** -0.07 (0.05) -0.07 (0.07)
Observations 9018 5302 9018 5302Diagnostic testsOveridentification – 7.65 – 6.32Underidentification 64.3*** 45.3*** 64.3*** 45.3***Weak identification 9.5 3.2 9.5 3.2Endogeneity 13.4*** 2.3 21.5*** 6.4
Note: see note to Table 4.
40
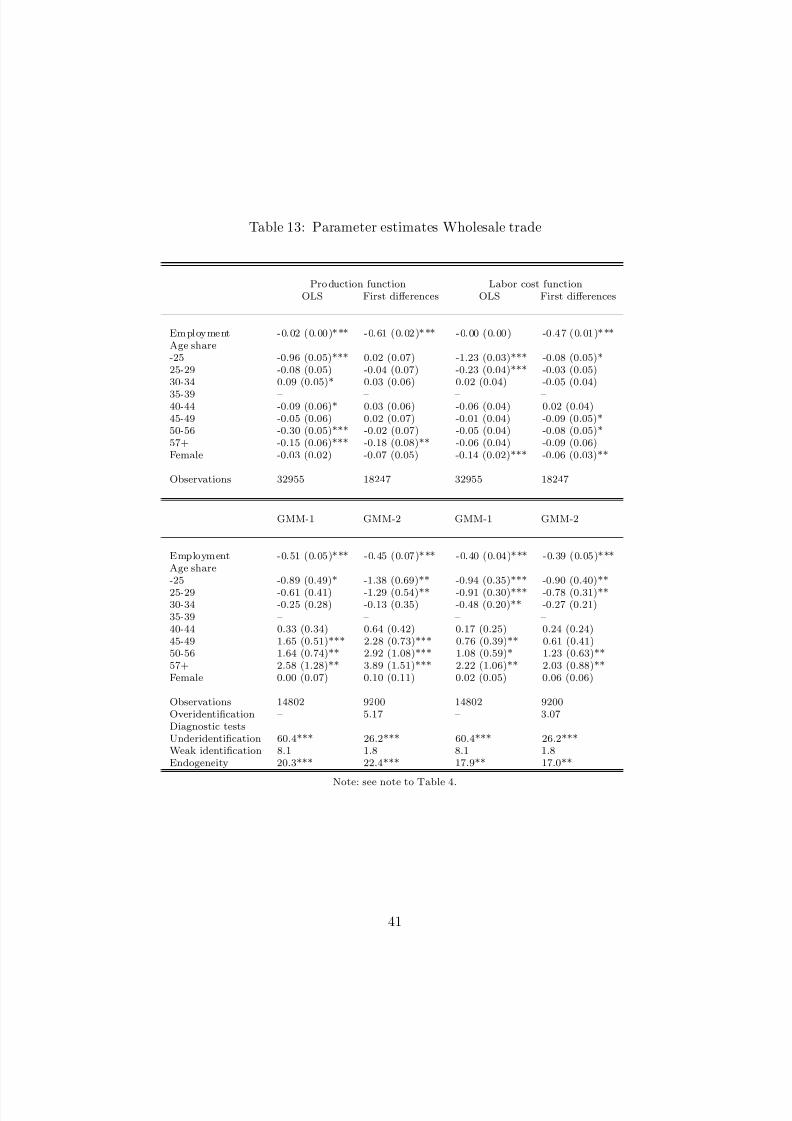
8/9/2019 Age, wage and productivity - CESifo working paper
http://slidepdf.com/reader/full/age-wage-and-productivity-cesifo-working-paper 42/48
Table 13: Parameter estimates Wholesale trade
Pro duction function Labor cost functionOLS First differences OLS First differences
Employment -0.02 (0.00)*** -0.61 (0.02)*** -0.00 (0.00) -0.47 (0.01)***Age share-25 -0.96 (0.05)*** 0.02 (0.07) -1.23 (0.03)*** -0.08 (0.05)*25-29 -0.08 (0.05) -0.04 (0.07) -0.23 (0.04)*** -0.03 (0.05)30-34 0.09 (0.05)* 0.03 (0.06) 0.02 (0.04) -0.05 (0.04)
35-39 – – – –40-44 -0.09 (0.06)* 0.03 (0.06) -0.06 (0.04) 0.02 (0.04)45-49 -0.05 (0.06) 0.02 (0.07) -0.01 (0.04) -0.09 (0.05)*50-56 -0.30 (0.05)*** -0.02 (0.07) -0.05 (0.04) -0.08 (0.05)*57+ -0.15 (0.06)*** -0.18 (0.08)** -0.06 (0.04) -0.09 (0.06)Female -0.03 (0.02) -0.07 (0.05) -0.14 (0.02)*** -0.06 (0.03)**
Observations 32955 18247 32955 18247
GMM-1 GMM-2 GMM-1 GMM-2
Employment -0.51 (0.05)*** -0.45 (0.07)*** -0.40 (0.04)*** -0.39 (0.05)***Age share-25 -0.89 (0.49)* -1.38 (0.69)** -0.94 (0.35)*** -0.90 (0.40)**
25-29 -0.61 (0.41) -1.29 (0.54)** -0.91 (0.30)*** -0.78 (0.31)**30-34 -0.25 (0.28) -0.13 (0.35) -0.48 (0.20)** -0.27 (0.21)35-39 – – – –40-44 0.33 (0.34) 0.64 (0.42) 0.17 (0.25) 0.24 (0.24)45-49 1.65 (0.51)*** 2.28 (0.73)*** 0.76 (0.39)** 0.61 (0.41)50-56 1.64 (0.74)** 2.92 (1.08)*** 1.08 (0.59)* 1.23 (0.63)**57+ 2.58 (1.28)** 3.89 (1.51)*** 2.22 (1.06)** 2.03 (0.88)**Female 0.00 (0.07) 0.10 (0.11) 0.02 (0.05) 0.06 (0.06)
Observations 14802 9200 14802 9200Overidentification – 5.17 – 3.07Diagnostic testsUnderidentification 60.4*** 26.2*** 60.4*** 26.2***Weak identification 8.1 1.8 8.1 1.8Endogeneity 20.3*** 22.4*** 17.9** 17.0**
Note: see note to Table 4.
41

8/9/2019 Age, wage and productivity - CESifo working paper
http://slidepdf.com/reader/full/age-wage-and-productivity-cesifo-working-paper 43/48
Table 14: Parameter estimates Retail trade
Pro duction function Labor cost functionOLS First differences OLS First differences
Employment -0.12 (0.00)*** -0.74 (0.02)*** -0.03 (0.00)*** -0.65 (0.02)***Age share-25 -0.86 (0.06)*** 0.11 (0.08) -1.11 (0.05)*** -0.03 (0.07)25-29 0.32 (0.08)*** 0.08 (0.09) 0.18 (0.07)*** 0.05 (0.07)30-34 0.08 (0.08) 0.02 (0.08) 0.04 (0.07) 0.06 (0.07)
35-39 – – – –40-44 -0.00 (0.09) 0.08 (0.09) -0.09 (0.07) 0.05 (0.07)45-49 -0.20 (0.09) 0.08 (0.10) -0.13 (0.07) 0.09 (0.08)50-56 -0.20 (0.08) -0.18 (0.10)* -0.08 (0.07) -0.15 (0.08)57+ -0.06 (0.09) -0.04 (0.12) 0.05 (0.07) -0.06 (0.08)Female -0.24 (0.02)*** -0.19 (0.07)*** -0.42 (0.02)*** -0.19 (0.05)***
Observations 15330 6796 15330 6796
GMM-1 GMM-2 GMM-1 GMM-2
Employment -0.62 (0.08)*** -0.67 (0.07)*** -0.57 (0.06)*** -0.58 (0.07)***Age share-25 -3.19 (1.60)** -0.99 (0.84) -1.48 (1.15) -0.45 (0.70)
25-29 -1.27 (0.83) 1.24 (0.99) -0.36 (0.53) 1.42 (0.79)*30-34 -0.72 (0.58) 0.77 (0.77) -0.03 (0.39) 1.10 (0.66)*35-39 – – – –40-44 -0.79 (0.68) 0.41 (0.64) -0.09 (0.40) 0.72 (0.52)45-49 -0.04 (0.59) 0.41 (0.84) 0.37 (0.42) 0.93 (0.76)50-56 0.37 (0.88) 0.28 (0.99) 0.56 (0.67) 0.26 (0.87)57+ 1.41 (1.85) -0.59 (1.11) 1.52 (1.48) -0.41 (0.93)Female -0.16 (0.11) -0.08 (0.13) -0.17 (0.07)** -0.05 (0.10)
Observations 5307 2982 5307 2982Diagnostic testsOveridentification – 9.33 – 12.09Underidentification 4.7** 7.7 4.7** 7.7Weak identification 0.8 0.6 0.8 0.6Endogeneity 12.0 9.9 4.5 10.8
Note: see note to Table 4.
42

8/9/2019 Age, wage and productivity - CESifo working paper
http://slidepdf.com/reader/full/age-wage-and-productivity-cesifo-working-paper 44/48
Table 15: Parameter estimates Commercial services
Pro duction function Lab or cost functionOLS First differences OLS First differences
Employment -0.10 (0.00)*** -0.59 (0.01)*** -0.04 (0.00)*** -0.52 (0.01)***Age share-25 -1.48 (0.03)*** -0.01 (0.06) -1.84 (0.03)*** -0.18 (0.05)***25-29 -0.18 (0.04)*** 0.04 (0.05) -0.19 (0.03)*** 0.02 (0.05)30-34 0.14 (0.04)*** 0.10 (0.05)* 0.15 (0.04)*** 0.06 (0.04)
35-39 – – – –40-44 -0.25 (0.05)*** 0.09 (0.06) -0.25 (0.04)*** 0.04 (0.05)45-49 -0.39 (0.05)*** -0.01 (0.06) -0.31 (0.04)*** -0.03 (0.05)50-56 -0.34 (0.05)*** -0.01 (0.07) -0.27 (0.04)*** -0.11 (0.06)**57+ -0.65 (0.05)*** 0.02 (0.08) -0.73 (0.04)*** -0.04 (0.07)Female -0.31 (0.01)*** -0.04 (0.04) -0.49 (0.01)*** -0.05 (0.03)
Observations 48972 22380 48972 22380
GMM-1 GMM-2 GMM-1 GMM-2
Employment -0.64 (0.03)*** -0.61 (0.04)*** -0.56 (0.03)*** -0.54 (0.04)***Age share-25 0.23 (0.45) 0.55 (0.53) -0.25 (0.41) -0.21 (0.48)
25-29 -0.15 (0.31) 0.08 (0.37) -0.28 (0.28) -0.33 (0.31)30-34 0.14 (0.26) 0.42 (0.30) -0.12 (0.21) -0.05 (0.24)35-39 – – – –40-44 0.07 (0.33) 0.37 (0.36) -0.46 (0.27)* -0.15 (0.31)45-49 -0.02 (0.44) -0.01 (0.44) -0.55 (0.38) -0.35 (0.39)50-56 -0.19 (0.68) -0.15 (0.52) -0.56 (0.58) -0.14 (0.44)57+ -1.50 (1.11) -0.36 (0.83) -1.91 (0.96)** -0.76 (0.61)Female -0.07 (0.06) 0.06 (0.07) -0.09 (0.05)* -0.00 (0.06)
Observations 16349 9301 16349 9301Diagnostic testsOveridentification – 3.61 – 8.66Underidentification 50.2*** 42.2*** 50.2*** 42.2***Weak identification 8.0 3.4 8.0 3.4Endogeneity 7.0 3.1 12.4* 5.1
Note: see note to Table 4.
43

8/9/2019 Age, wage and productivity - CESifo working paper
http://slidepdf.com/reader/full/age-wage-and-productivity-cesifo-working-paper 45/48
CESifo Working Paper Series
for full list see Twww.cesifo-group.org/wpT (address: Poschingerstr. 5, 81679 Munich, Germany, [email protected])
___________________________________________________________________________
2901 Donatella Gatti, Christophe Rault and Anne-Gaël Vaubourg, Unemployment andFinance: How do Financial and Labour Market Factors Interact?, December 2009
2902 Arno Riedl, Behavioral and Experimental Economics Can Inform Public Policy: SomeThoughts, December 2009
2903 Wilhelm K. Kohler and Marcel Smolka, Global Sourcing Decisions and FirmProductivity: Evidence from Spain, December 2009
2904 Marcel Gérard and Fernando M. M. Ruiz, Corporate Taxation and the Impact of
Governance, Political and Economic Factors, December 2009
2905 Mikael Priks, The Effect of Surveillance Cameras on Crime: Evidence from theStockholm Subway, December 2009
2906 Xavier Vives, Asset Auctions, Information, and Liquidity, January 2010
2907 Edwin van der Werf, Unilateral Climate Policy, Asymmetric Backstop Adoption, andCarbon Leakage in a Two-Region Hotelling Model, January 2010
2908 Margarita Katsimi and Vassilis Sarantides, Do Elections Affect the Composition of Fiscal Policy?, January 2010
2909 Rolf Golombek, Mads Greaker and Michael Hoel, Climate Policy without Commitment,January 2010
2910 Sascha O. Becker and Ludger Woessmann, The Effect of Protestantism on Educationbefore the Industrialization: Evidence from 1816 Prussia, January 2010
2911 Michael Berlemann, Marco Oestmann and Marcel Thum, Demographic Change andBank Profitability. Empirical Evidence from German Savings Banks, January 2010
2912 Øystein Foros, Hans Jarle Kind and Greg Shaffer, Mergers and Partial Ownership,January 2010
2913 Sean Holly, M. Hashem Pesaran and Takashi Yamagata, Spatial and TemporalDiffusion of House Prices in the UK, January 2010
2914 Christian Keuschnigg and Evelyn Ribi, Profit Taxation and Finance Constraints,January 2010
2915 Hendrik Vrijburg and Ruud A. de Mooij, Enhanced Cooperation in an Asymmetric
Model of Tax Competition, January 2010
8/9/2019 Age, wage and productivity - CESifo working paper
http://slidepdf.com/reader/full/age-wage-and-productivity-cesifo-working-paper 46/48
2916 Volker Meier and Martin Werding, Ageing and the Welfare State: Securing
Sustainability, January 2010
2917 Thushyanthan Baskaran and Zohal Hessami, Globalization, Redistribution, and the
Composition of Public Education Expenditures, January 2010
2918 Angel de la Fuente, Testing, not Modelling, the Impact of Cohesion Support: ATheoretical Framework and some Preliminary Results for the Spanish Regions, January2010
2919 Bruno S. Frey and Paolo Pamini, World Heritage: Where Are We? An EmpiricalAnalysis, January 2010
2920 Susanne Ek and Bertil Holmlund, Family Job Search, Wage Bargaining, and OptimalUnemployment Insurance, January 2010
2921 Mariagiovanna Baccara, Allan Collard-Wexler, Leonardo Felli and Leeat Yariv, Genderand Racial Biases: Evidence from Child Adoption, January 2010
2922 Kurt R. Brekke, Roberto Cellini, Luigi Siciliani and Odd Rune Straume, Competitionand Quality in Regulated Markets with Sluggish Demand, January 2010
2923 Stefan Bauernschuster, Oliver Falck and Niels Große, Can Competition SpoilReciprocity? – A Laboratory Experiment, January 2010
2924 Jerome L. Stein, A Critique of the Literature on the US Financial Debt Crisis, January2010
2925 Erkki Koskela and Jan König, Profit Sharing, Wage Formation and FlexibleOutsourcing under Labor Market Imperfection, January 2010
2926 Gabriella Legrenzi and Costas Milas, Spend-and-Tax Adjustments and theSustainability of the Government’s Intertemporal Budget Constraint, January 2010
2927 Piero Gottardi, Jean Marc Tallon and Paolo Ghirardato, Flexible Contracts, January2010
2928 Gebhard Kirchgässner and Jürgen Wolters, The Role of Monetary Aggregates in thePolicy Analysis of the Swiss National Bank, January 2010
2929 J. Trent Alexander, Michael Davern and Betsey Stevenson, Inaccurate Age and SexData in the Census PUMS Files: Evidence and Implications, January 2010
2930 Stefan Krasa and Mattias K. Polborn, Competition between Specialized Candidates,January 2010
2931 Yin-Wong Cheung and Xingwang Qian, Capital Flight: China’s Experience, January
2010

8/9/2019 Age, wage and productivity - CESifo working paper
http://slidepdf.com/reader/full/age-wage-and-productivity-cesifo-working-paper 47/48
2932 Thomas Hemmelgarn and Gaetan Nicodeme, The 2008 Financial Crisis and Taxation
Policy, January 2010
2933 Marco Faravelli, Oliver Kirchkamp and Helmut Rainer, Social Welfare versus
Inequality Concerns in an Incomplete Contract Experiment, January 2010
2934 Mohamed El Hedi Arouri and Christophe Rault, Oil Prices and Stock Markets: WhatDrives what in the Gulf Corporation Council Countries?, January 2010
2935 Wolfgang Lechthaler, Christian Merkl and Dennis J. Snower, Monetary Persistence andthe Labor Market: A New Perspective, January 2010
2936 Klaus Abberger and Wolfgang Nierhaus, Markov-Switching and the Ifo BusinessClimate: The Ifo Business Cycle Traffic Lights, January 2010
2937 Mark Armstrong and Steffen Huck, Behavioral Economics as Applied to Firms: APrimer, February 2010
2938 Guglielmo Maria Caporale and Alessandro Girardi, Price Formation on the EuroMTSPlatform, February 2010
2939 Hans Gersbach, Democratic Provision of Divisible Public Goods, February 2010
2940 Adam Isen and Betsey Stevenson, Women’s Education and Family Behavior: Trends inMarriage, Divorce and Fertility, February 2010
2941 Peter Debaere, Holger Görg and Horst Raff, Greasing the Wheels of InternationalCommerce: How Services Facilitate Firms’ International Sourcing, February 2010
2942 Emanuele Forlani, Competition in the Service Sector and the Performances of Manufacturing Firms: Does Liberalization Matter?, February 2010
2943 James M. Malcomson, Do Managers with Limited Liability Take More RiskyDecisions? An Information Acquisition Model, February 2010
2944 Florian Englmaier and Steve Leider, Gift Exchange in the Lab – It is not (only) how
much you give …, February 20102945 Andrea Bassanini and Giorgio Brunello, Barriers to Entry, Deregulation and Workplace
Training: A Theoretical Model with Evidence from Europe, February 2010
2946 Jan-Emmanuel De Neve, James H. Fowler and Bruno S. Frey, Genes, Economics, andHappiness, February 2010
2947 Camille Cornand and Frank Heinemann, Measuring Agents’ Reaction to Private andPublic Information in Games with Strategic Complementarities, February 2010
2948 Roel Beetsma and Massimo Giuliodori, Discretionary Fiscal Policy: Review andEstimates for the EU, February 2010
8/9/2019 Age, wage and productivity - CESifo working paper
http://slidepdf.com/reader/full/age-wage-and-productivity-cesifo-working-paper 48/48
2949 Agnieszka Markiewicz, Monetary Policy, Model Uncertainty and Exchange Rate
Volatility, February 2010
2950 Hans Dewachter and Leonardo Iania, An Extended Macro-Finance Model with
Financial Factors, February 2010
2951 Helmuth Cremer, Philippe De Donder and Pierre Pestieau, Education and SocialMobility, February 2010
2952 Zuzana Brixiová and Balázs Égert, Modeling Institutions, Start-Ups and Productivityduring Transition, February 2010
2953 Roland Strausz, The Political Economy of Regulatory Risk, February 2010
2954 Sanjay Jain, Sumon Majumdar and Sharun W. Mukand, Workers without Borders?
Culture, Migration and the Political Limits to Globalization, February 2010
2955 Andreas Irmen, Steady-State Growth and the Elasticity of Substitution, February 2010
2956 Bengt-Arne Wickström, The Optimal Babel – An Economic Framework for theAnalysis of Dynamic Language Rights, February 2010
2957 Stefan Bauernschuster and Helmut Rainer, From Politics to the Family: How Sex-RoleAttitudes Keep on Diverging in Reunified Germany, February 2010
2958 Patricia Funk and Christina Gathmann, How do Electoral Systems Affect Fiscal Policy?Evidence from State and Local Governments, 1890 to 2005, February 2010
2959 Betsey Stevenson, Beyond the Classroom: Using Title IX to Measure the Return toHigh School Sports, February 2010
2960 R. Quentin Grafton, Tom Kompas and Ngo Van Long, Biofuels Subsidies and theGreen Paradox, February 2010
2961 Oliver Falck, Stephan Heblich, Alfred Lameli and Jens Suedekum, Dialects, CulturalIdentity, and Economic Exchange, February 2010
2962 Dimitrios Koumparoulis and Apostolis Philippopoulos, The Current Version of theBank of Greece Econometric Model, February 2010
2963 Frederick van der Ploeg and Cees Withagen, Is There Really a Green Paradox?,February 2010
2964 Ingo Vogelsang, Incentive Regulation, Investments and Technological Change,February 2010