against the odds: a study of low socioeconomic …
TRANSCRIPT

University of Kentucky University of Kentucky
UKnowledge UKnowledge
Theses and Dissertations--Community & Leadership Development Community & Leadership Development
2016
AGAINST THE ODDS: A STUDY OF LOW SOCIOECONOMIC AGAINST THE ODDS: A STUDY OF LOW SOCIOECONOMIC
STATUS STUDENTS’ ENROLLMENT IN HIGHER EDUCATION STATUS STUDENTS’ ENROLLMENT IN HIGHER EDUCATION
Andrea T. Kirby University of Kentucky, [email protected] Digital Object Identifier: http://dx.doi.org/10.13023/ETD.2016.198
Right click to open a feedback form in a new tab to let us know how this document benefits you. Right click to open a feedback form in a new tab to let us know how this document benefits you.
Recommended Citation Recommended Citation Kirby, Andrea T., "AGAINST THE ODDS: A STUDY OF LOW SOCIOECONOMIC STATUS STUDENTS’ ENROLLMENT IN HIGHER EDUCATION" (2016). Theses and Dissertations--Community & Leadership Development. 23. https://uknowledge.uky.edu/cld_etds/23
This Master's Thesis is brought to you for free and open access by the Community & Leadership Development at UKnowledge. It has been accepted for inclusion in Theses and Dissertations--Community & Leadership Development by an authorized administrator of UKnowledge. For more information, please contact [email protected].

STUDENT AGREEMENT: STUDENT AGREEMENT:
I represent that my thesis or dissertation and abstract are my original work. Proper attribution
has been given to all outside sources. I understand that I am solely responsible for obtaining
any needed copyright permissions. I have obtained needed written permission statement(s)
from the owner(s) of each third-party copyrighted matter to be included in my work, allowing
electronic distribution (if such use is not permitted by the fair use doctrine) which will be
submitted to UKnowledge as Additional File.
I hereby grant to The University of Kentucky and its agents the irrevocable, non-exclusive, and
royalty-free license to archive and make accessible my work in whole or in part in all forms of
media, now or hereafter known. I agree that the document mentioned above may be made
available immediately for worldwide access unless an embargo applies.
I retain all other ownership rights to the copyright of my work. I also retain the right to use in
future works (such as articles or books) all or part of my work. I understand that I am free to
register the copyright to my work.
REVIEW, APPROVAL AND ACCEPTANCE REVIEW, APPROVAL AND ACCEPTANCE
The document mentioned above has been reviewed and accepted by the student’s advisor, on
behalf of the advisory committee, and by the Director of Graduate Studies (DGS), on behalf of
the program; we verify that this is the final, approved version of the student’s thesis including all
changes required by the advisory committee. The undersigned agree to abide by the statements
above.
Andrea T. Kirby, Student
Dr. Stacy K. Vincent, Major Professor
Dr. Patricia Dyk, Director of Graduate Studies
AGAINST THE ODDS: A STUDY OF LOW SOCIOECONOMIC STATUS
STUDENTS’ ENROLLMENT IN HIGHER EDUCATION
______________________________
THESIS
______________________________
A thesis submitted in partial fulfillment of the requirements for the degree of Masters of
Science in Community and Leadership Development in the College of Agriculture, Food,
and Environment at the University of Kentucky
By
Andrea Taylor Kirby
Lexington, KY
Committee Chairman: Dr. Stacy K. Vincent, Professor of Agricultural Education
Lexington, KY
2016
Copyright © Andrea Taylor Kirby 2016
ABSTRACT OF THESIS
AGAINST THE ODDS: A STUDY OF LOW SOCIOECONOMIC STATUS
STUDENTS’ ENROLLMENT IN HIGHER EDUCATION
For generations, researchers have been examining attributes that make low
socioeconomic status students resilient. Attributes that help one become resilient are
known as protective factors. The purpose of this study was to describe the protective
factor(s) that contributed to the first-generation, low socioeconomic status students’
enrollment at The University of Kentucky. The population for this study consists of the
University of Kentucky First Scholars participants during the 2015 – 2016 academic year.
The researcher examines the existing literature on low socioeconomic status effects on
post-secondary education. Recommendations were made for the University of
Kentucky’s First Scholars Program on how to further enhance their program and continue
promoting low socioeconomic status students with opportunities in higher education.
KEYWORDS: poverty, protective factors, resilience, risk factors, and socioeconomic
status
Andrea Taylor Kirby
April 15, 2016

AGAINST THE ODDS: A STUDY OF LOW SOCIOECONOMIC STATUS
STUDENTS’ ENROLLMENT IN HIGHER EDUCATION
By:
Andrea Taylor Kirby
Dr. Stacy K. Vincent
Committee Chairman
Dr. Patricia Dyk
Director of Graduate Studies
April 15, 2016
DEDICATION
To my mom and grandmother, Traci and Vickie, and in memory of my grandfather,
Wayne, I dedicate this work.
To Mom – Thank you for pushing me to be the best version of myself and teaching me
giving up is never an option.
To Granny – Thank you for always being my biggest fan. You always whole-heartedly
believe in me.
To Papa – Thank you for being my moral compass and giving me someone to look up to.
Without your love and guidance, I would not be the person I am today.

iii
ACKNOWLEDGEMENTS
There are several people that have provided invaluable encouragement and
support throughout this journey. To those individuals, without you this would not have
become a reality.
First and foremost, thank you to my Lord and Savior, Jesus Christ. If my effort
throughout this thesis had a theme it would have been Philippians 4:13, “I can do all
things through Christ who strengthens me”. Without answered prayers, this thesis would
still be ongoing today.
To my husband and best friend, Joshua, thank you for not only being there, but
also encouraging each of my crazy endeavors. It is your love, support, and
encouragement that have guided me throughout this process. Although we have put many
of our shared dreams and goals on hold for my career, it has always been my top priority
to better this life we share together.
To my family (Mom, Granny, and Catherine) thank you for always being there for
me, even when I am unbearable . You have taught me many instrumental life lessons in
prioritizing what and who are important, hard work, and never giving up on my dreams.
Each of you has impacted who I am today and for that I am eternally grateful. To
Catherine, I have always tried to the best sister that I know how to be. I know I am not
perfect, but I hope my love has always shown through my actions.
To Dr. Stacy Vincent, I consider myself blessed to have a handful of people I can
call a mentor. You are among the top of that list. It is because of a phone call asking me
to fulfill the position of a graduate research assistant that I have had the pleasure of

iv
working with you and embarking upon a journey that would have never been possible.
From our debates to our crazy “hippie” dance parties, it has been a memorable ride. I
hope one day I can repay all of the opportunities you have so graciously given me.
To Dr. Patricia Dyk and Dr. Susie Whittington, thank you both for your
willingness to serve on my graduate committee. I know the time frame was postponed
due to unforeseen circumstances, but both of you were extremely understanding,
graciously patient, and overwhelmingly encouraging. Thank you for not giving up on me!
To Dr. Rebekah Epps, even though you did not serve on my committee you never
turned me away when I sought help. If it weren’t for you teaching me how to use SPSS
(multiple times) then I would still be sorting through data! Thank you for providing an
example of how a strong woman can succeed in our heavily male dominated profession
and always serving as a sounding board for our long talks.
To Martina Martin, thank you distributing and collecting the questionnaires for
this study and to the University of Kentucky’s First Scholars for agreeing to participate.
Without your willingness to help, this study would not have been possible.

v
TABLE OF CONTENTS
ACKNOWLEDGEMENTS ............................................................................................... iii
TABLE OF CONTENTS .....................................................................................................v
LIST OF TABLES ............................................................................................................. ix
LIST OF FIGURES .............................................................................................................x
CHAPTER I
INTRODUCTION ...............................................................................................................1
Background and Setting ...........................................................................................1
Poverty in America ......................................................................................1
The Correlation to Poverty and Higher Education ......................................4
The First Scholars Program .........................................................................5
Theoretical/Conceptual Framework .........................................................................9
Need for the Study ...................................................................................................9
Statement of the Problem .......................................................................................12
Purpose of the Study ..............................................................................................14
Research Objectives/Hypotheses ...........................................................................14
Definitions of Terms ..............................................................................................14
Limitations of the Study.........................................................................................15
Basic Assumptions .................................................................................................16
CHAPTER II
LITERATURE REVIEW ..................................................................................................18
Resilience ..............................................................................................................18
Resilience and Protective Factors ..........................................................................20
Resiliency in Society..............................................................................................27
Resiliency in Post Secondary Education ...............................................................26
Resilience Rate ......................................................................................................30

vi
CHAPTER III
METHODOLOGY ............................................................................................................33
Purpose of the Study ..............................................................................................33
Research Objectives ...............................................................................................33
Research Design.....................................................................................................34
Population and Sample ..........................................................................................35
Instrumentation ......................................................................................................36
Validity and Reliability ..........................................................................................37
Data Collection ......................................................................................................39
Data Analysis .........................................................................................................40
Research Objective 1: Describe the selected characteristics of the first-
generation, low socioeconomic status students. Specifically: gender,
race/ethnicity, home residence, grade level, GPA, and parent/guardian
education level. ..........................................................................................41
Research Objective 2: Describe the protective factors present among the
first-generation, low socioeconomic status students. ................................41
Research Objective 3: Describe the protective factors present among the
first-generation, low socioeconomic status students by grade classification
(sophomore, junior, and senior). ...............................................................42
CHAPTER IV
RESULTS ..........................................................................................................................43
Purpose of the Study ..............................................................................................43
Research Objectives ..............................................................................................43
Findings..................................................................................................................43
Research Objective 1: Describe the selected characteristics of the first-
generation, low socioeconomic status students. Specifically: gender,
race/ethnicity, home residence, grade level, GPA, and parent/guardian
education level. ..........................................................................................44
Research Objective 2: Describe the protective factors present among the
first-generation, low socioeconomic status students. ................................45

vii
Research Objective 3: Describe the protective factors present among the
first-generation, low socioeconomic status students by grade classification
(sophomore, junior, and senior). ...............................................................54
CHAPTER V
SUMMARY, CONCLUSIONS, AND RECOMMENDATIONS.....................................57
Purpose of the Study ..............................................................................................57
Research Objectives ..............................................................................................57
Research Design.....................................................................................................57
Population and Sample ..........................................................................................58
Data Collection ......................................................................................................59
Limitations to the Conclusions ..............................................................................60
Summary of Research Findings with Conclusions and Recommendations...........61
Research Objective 1: Describe the selected characteristics of the first-
generation, low socioeconomic status students. Specifically: gender,
race/ethnicity, home residence, grade level, GPA, and parent/guardian
education level. ..........................................................................................61
Research Objective 2: Describe the protective factors present among the
first-generation, low socioeconomic status students. ................................62
Research Objective 3: Describe the protective factors present among the
first-generation, low socioeconomic status students by grade classification
(sophomore, junior, and senior). ...............................................................66
Researcher to Practice ............................................................................................68
APPENDICES ...................................................................................................................70
Appendix A – IRB Protocol Approval...................................................................70
Appendix B – Waive Requirement for Documentation of Informed Consent .....72
Appendix C – Consent Cover Letter ......................................................................75
Appendix D – Against the Odds: Protective Factors Questionnaire......................77
Appendix E – Email Correspondence with Dr. Emmy E. Werner ........................82
viii
REFERENCES ..................................................................................................................84
VITA ..................................................................................................................................97

ix
LIST OF TABLES
Table Page
1.1 Types of Poverty………………………………………………………………………........2
1.2 University of Kentucky’s First Scholars Program Enrollment…………………........8
1.3 University of Kentucky’s First-Generation Programs……………………………....10
2.1 Werner’s (2000) Protective Factors within the Individual………………………….22
2.2 Werner’s (2000) Protective Factors within the Family and Community……………24
3.1 Assumptions by Statistical Analysis…………..………………………..……………41
4.1 Characteristics of University of Kentucky’s First Scholar Participants (n =
37)…………..………………………..…………………..………………..…….………44
4.2 Protective Factors Present Among University of Kentucky’s First Scholars
Participants…………..………………………..…………………..………………..…...49
4.3 Central Tendencies of Protective Factors Among University of Kentucky’s First
Scholar Participants (n = 37)…………..………………………..…………………..….53
4.4 ANOVA of Protective Factors by University of Kentucky’s First Scholars
(n =37)………………………..…………………..……………………………..……….55
4.5 Central Tendencies of Protective Factors by Grade Level………………………….56

x
LIST OF FIGURES
Figure Page
1.1 First Scholars’ (2014) Steps to Success Framework……………………………...7
2.1 Earnings and Unemployment Rates by Educational Attainment (United States
Department of Labor, 2014)…………………………………………………………..32

1
CHAPTER I
INTRODUCTION
Background and Setting
Poverty in America
In the 1960s, President Lyndon B. Johnson declared war on poverty. In order to
show the severity of this issue, President Johnson scheduled a trip to Martin County,
Kentucky where poverty was at an all time high to showcase the circumstances in which
rural Americans lived (Bello, 2014). According to the United States Census Bureau
(2013), in 1960, 70.12% of this Appalachian county’s population was below the poverty
level. In the late 1950’s, 22.4% of Americans lived in poverty (National Poverty Center,
2014).
Prior to President Johnson’s declaration of war, poverty had to be turned into a
figure in order for the U.S. government to officially collect data. Mollie Orshanky,
government economist, first calculated the poverty line in 1963. The poverty line was
determined by “multiplying the cost of a very minimal diet by three, as a 1955
government study had determined that the typical American family spent one-third of its
income on food. Thus a family whose cash income is lower than three times the cost of a
very minimal diet is considered officially poor” (Barkan, 2012, para. 1). Today, the
United States determines a person lives in poverty by the household’s total income. If the
total income for the household is less than the threshold or allowable income amount set
by the government then everyone in the household is considered to be below the poverty
line (United States Census Bureau, 2012).

2
Although the United States’ government determines poverty by monetary means,
researchers have described different types of poverty (see Table 1.1). These different
types of poverty not only consider a person’s income level, but also examine their family
background and living circumstances.
Table 1.1
Types of Poverty
Type of Poverty Description
Absolute Poverty Chronic lack of basic needs (food, water, housing)
(eSchoolToday, 2010).
Generational Poverty Generations living in poverty without the means to move
out of it (eSchoolToday, 2010).
Relative Poverty Although some have access to basic necessities, they still
cannot afford or meet societal standards such as vacations
(eSchoolToday, 2010).
Rural Poverty Lack of services and conveniences can cause poverty-
engrained situations (USDA, 2015).
Situational Poverty Caused by sudden adversity or crisis like a serious illness
(eSchoolToday, 2010).
Urban Poverty Overcrowding, congestion, unemployment, social problems
(crime and violence) (The World Bank, 2011).
On January 8, 1964, President Johnson addressed the nation, “Very often a lack of
jobs and money is not the cause of poverty, but the symptom. The cause may lie deeper
in our failure to give our fellow citizens a fair chance to develop their own capacities, in a
lack of education and training, in a lack of medical care and housing, in a lack of decent
communities in which to live and bring up their children” (Johnson, 1964, para. 25).
Based upon these beliefs, the “war on poverty” was centered on four parts of legislation:
1. The Economic Opportunity Act (EOA) of 1964 – The EOA established well-
known programs such as Head Start, Job Corps, Volunteers in Service to America
(VISTA), the federal work-study program, and several other initiatives (Johnson,
1964).

3
2. The Elementary and Secondary Education Act (ESEA) – This act was passed into
law in 1965. The ESEA enacted the Title I program in public schools, which
provided funding for disadvantaged students (Matthews, 2014). In 2002, ESEA
was amended and renamed the No Child Left Behind Act (NCLB) (Office of
Superintendent of Public Instruction [OSPI], 2014).
3. The Food Stamp Act of 1964 – The Food Stamp Pilot Program was initiated in
1961 under the leadership of President John F. Kennedy. The purpose of making
the Food Stamp Act permanent was to improve “levels of nutrition among low-
income households” (United States Department of Agriculture [USDA], 2013).
4. The Social Security Amendments of 1965 – These amendments created healthcare
for the elderly (Medicare) and low-income individuals (Medicaid) and increased
Social Security benefits (Matthews, 2014).
Due to President Johnson’s efforts towards the “war on poverty”, the United States’
poverty rate began to steadily decrease in the 1960’s. In 1973, the poverty rate had
decreased to 11.1%. However, by the 1980’s the poverty rate had began to rise again and
by 1983 it had reached 15.2% or 35.3 million individuals (National Poverty Center,
2014). After decades of minimal fluctuation, in 2012, the poverty rate percentage had
decreased to 15.0% or 46.5 million individuals. Kentucky’s poverty rate was slower to
decrease, compared to the national average, with a rate of 17.9% (United States Census
Bureau, 2013). Even though the poverty rate had declined since 1983, the number of
individuals living in poverty in 2012 has increased due to the United States’ increased
population.
4
The Correlation Between Poverty and Higher Education
The widening economic gap among social classes is gaining national attention.
This gap has been associated with the dwindling representation of low socioeconomic
status (SES) students in post-secondary education and the high dropout rates in secondary
education (Thomas & Stockton, 2003). The effect SES has on student achievement has
been a popular field of research since the late 1960’s. Coleman (1966) led the way with
groundbreaking research on low SES students and as a result published Equality of
Educational Opportunity discussing the importance of making education accessible to
everyone regardless of income.
SES research has been combined with several factors to examine student
achievement. Many of these factors have been external, including parental involvement
(Ma, 2009), parental occupation (Leppel, Williams, & Waldauer, 2001), parental
encouragement (Sewell & Shah, 1968), parental education level (Dubow, Boxer, &
Huesmann, 2009), family support, (Seccombe, 2012), and peer associations (Stewart,
2008). Other factors have been internal, including student resilience (Werner, 1990) and
career goals (Calcagno, Bailey, Jenkins, Kienzl, & Leinbach, 2008). Researchers have
also examined the intersection SES and demographic characteristics have on student
achievement. Demographic factors have included race (Thomas & Stockton, 2003),
ethnicity (McWhirter, 1997; Trusty, Robinson, Plata, & Ng, 2000), age (Reason, 2009),
and gender (Astin, 1993). Dubow, Boxer, and Huesmann, (2009) found the most
influential combination of factors when determining a student’s enrollment at a higher
education institution is socioeconomic status and parents’ education level.

5
Parental social class is a significant contributing factor to whether or not the child
will go to college. Children with parents of high SES have greater access to higher
education (Persell, 2010). Social class can determine what type of school the child will be
able to attend, which relates to the quality of teachers, curriculum, and teaching practices
the school embraces (Persell, 2010).
To widen the economic gap even further, research posits that counselors poorly
perceive and expect less from low SES students (Auwarter & Aruguete, 2008). In 2008,
Auwarter and Arguete reported high school counselors view low SES students as having
a less promising future than students from middle and high-income families. The
perception school officials have of students give a negative self-awareness and can affect
the individuals and follow them beyond their school experience (Lubienski, 2002).
Seccombe (2012) identified poverty as having a negative impact on the home
environment. Low-income parents tend to interact with their children less frequently than
high-income parents because of the emotional distress over income. Seccombe reported
this lack of parental encouragement influences children’s goals and whether they see
value in education. If a student does not see meaning and value in continuing their
education then they will not enroll in college (Seccombe, 2012).
The First Scholars Program
In 2008, Eric Suder founded The First Scholars Program in Plano, Texas after
developing an interest in disadvantaged students. Suder identified the less advantaged
students by financial need and first generation college students. Suder discovered that
these less advantaged students received scholarships and/or grants, but lacked the cultural
6
capital (educational preparation, knowledge, and skills) required by the college system to
be successful (First Scholars, 2014).
The First Scholars Program is a comprehensive program that seeks to develop the
students through a four-year process (University of Kentucky, 2014). In Figure 1.1, the
annual themes (connect to campus, optimize the college experience, expand career and
community opportunities, and transition to the future) are outlined according to grade-
level. The students are also provided with specific learning objectives (first-gen, self,
success, and significance) beginning their freshmen year (First Scholars, 2014). The
learning objectives include:
1. First-Gen – Bridging the gaps, transforming challenges, creating opportunities,
and accessing resources.
2. Self – Discovering potential, expanding awareness, utilizing strengths, and
clarifying values and beliefs.
3. Success – Exploring possibilities, developing a personal vision, gaining
experience, and building a skill set.
4. Significance – Giving back, engaging personal passion, developing leadership,
and making a difference (First Scholars, 2014).

7
Figure 1.1
First Scholars’ (2014) Steps To Success Framework (First Scholars, 2014)
The First Scholars Program currently has partnerships with seven universities
across the nation: University of Kentucky, The University of Alabama, Southern Illinois
University Carbondale, The University of Memphis, Washington State University,
Northern Arizona University, and Kansas State University. These institutions were not
randomly selected. Each affiliated institution has to be a four-year public university,
maintain an undergraduate enrollment of 15,000-30,000, possess traditional residence
halls, enroll a significant amount of first-generation students, and have a university-wide
commitment to the success of every student including first-generation (First Scholars,
2014).
The University of Kentucky (UK) was the first institution accepted as an affiliated
university (First Scholars, 2014). The First Scholars Program was established as a pilot
program at UK in 2009 after receiving a $1.1 million grant from The Suder Foundation

8
(Geegan, 2012). After being accepted as an affiliate university, the pilot or first year
consisted of creating and implementing the program (Hahn, 2012). In 2010, the first class
of First Scholars enlisted in the program consisting of ten individuals. Since 2010, the
program has steadily increased in enrollment numbers (see Table 1.1) (First Scholars,
2014). However, the enrollment numbers began to decline in the 2015 – 2016 school year
due to lack of funding.
The Suder Foundation establishes the First Scholars program at the universities to
fund themselves after a period of four years. The Suder Foundation funds each university
by 100% the first year the program becomes an affiliate institution. Due to the University
of Kentucky being the pilot school, it was fully funded for two years. After the first year,
the Suder Foundation decreases funding by 25% each year until the university is
responsible for 100% of the funds. Each year the foundation decreases funding, the
affiliated university funds whatever percentage the foundation does not. Every year the
University of Kentucky has paid the percentage that the Suder Foundation has decreased
until 2015. Due to the lack of funds, a freshmen class was not recruited for the 2015 –
2016 academic year. Unless funding is reinstated to the First Scholars program by UK
then when the current sophomore class graduates the program will cease to exist (M.
Martin, personal communication, September 16, 2015).
Table 1.2
University of Kentucky’s First Scholars Program Enrollment
Year Enrollment
2010 20
2011 40
2012 58
2013
2014
2015
75
72
51

9
Theoretical/Conceptual Framework
Researchers consider first-generation, low socioeconomic status students that
enroll at higher educational institutions as resilient (Dubow, Boxer, & Huesmann, 2009).
The focus of resilience theory has been how people adapt to situations and overcome
adversity (Bradley & Corwyn, 2005). Werner (1995) divided the resilience theory into
three aspects: “good developmental outcomes despite high-risk status, sustained
competence under stress, and recovery from trauma” (p. 81). An example of a “good
developmental outcomes despite high-risk status” is a first-generation, low
socioeconomic status student. A person that sustains “competence under stress” could be
a student that helps take care of a parent with a mental illness. Lastly, a student that
recovers from a traumatic situation could have experienced the death of a parent (Werner,
1995). If a person experiences any one of these situations and succeeds despite the odds
against them, then they are considered resilient (Bradley & Corwyn, 2005). However,
Werner (1995) found people do not overcome any of these three situations by themselves.
A person must have at least one protective factor present to assist in overcoming the
adverse situation. Protective factors are attributes within the individual and/or
environmental influences that enhance “developmentally appropriate outcomes” (Werner,
2000, p. 116). An example of protective factors includes: hobbies/talents, faith, mentors,
supportive family members, etc. (Werner, 2000). Resilience theory and Emmy Werner’s
protective factors provided the theoretical framework for this research study.
Need for the Study
The First Scholars Program is not the only program at the University of Kentucky
that targets first generation college students. Two similar programs exist at UK, the

10
Robinson Scholars Program and Student Support Services (SSS) (University of
Kentucky, 2014). However, the First Scholars Program is the most recently established
and the only program that requires participants to also have a financial need to be eligible
for their benefits and services (Table 1.2).
Table 1.3
University of Kentucky’s First-Generation Programs
Programs Founded Target Population Benefits and/or Services
First Scholars 2009 Students must exhibit the
following factors to qualify for
the First Scholars Program
(2014):
1. First generation (defined by
both parents being limited to no
more than two years of
education past high school) and
2. Financial need.
First Scholars (2014) are
eligible to receive the
following benefits and
services:
1. Academic/ cultural
activities
2. Annual $3,000
scholarship (totaling
$12,000) at an affiliate
university
3. Mentoring program
4. Personal and career
development program
5. Social integration
program.
Robinson Scholars 1991 Every year the Robinson
Scholars Program (2014)
selects one first generation
student from every Eastern
Kentucky county (totaling 29
students/counties), with “the
potential to succeed but who
might encounter economic,
cultural, or institutional
impediments”.
The Robinson Scholars
Program (2014) offers the
following benefits to
Robinson Scholars
college students:
1. College Services
2. Coordinator (secondary
advisory)
3. Full scholarship to the
University of Kentucky
International study abroad
program.
Student Support
Services (SSS)
1993 Students must meet any one
of the following criteria to
qualify for SSS:
1. First generation
2. Low income
3. Documented disability
(SSS, 2014).
SSS (2014) offers the
following services to
assist students enrolled
in their program:
1. Career programs
2. Graduate school
preparation
3. Peer mentoring
program

11
The First Scholars Program was created based upon the following research
factors: student success characteristics, tools to access characteristics, and support
strategies (Moschetti, 2012). Rather than conducting their own studies and repeating
current research experiments, the First Scholars utilized experts in the corresponding field
of study and existing research (First Scholars, 2014).
Student success characteristics refer to the student’s background (geographical
location, parents’ education level, socioeconomic status, race, gender, etc.) and how
likely they are to enroll and succeed at a post-secondary institution. Perna and Titus
(2005) found the most influential factor in determining college enrollment is parents’
education level. However, the most influential combination of factors in determining
college enrollment is parents’ education level and socioeconomic status (Dubow, Boxer,
& Huesmann, 2009).
After a first-generation, low-income student has entered college, they often face
difficulties with academic, cultural, and/or social transitions (Moschetti, 2012). The
parents of these students do not have the knowledge to help their student adjust to a
college environment because they have never experienced college first-hand (Pike &
Kuh, 2005). Due to the realization that college support can be limited, the First Scholars
Program requires each student to develop an Individual Strategic Plan (ISP). The ISP
serves as the primary tool to access student characteristics. The ISP is tailored to each
Table 1.3 (cont.)
4. Social culture
programs
5. Tutoring services.

12
student based on goals. The ISP requires the students to select activities and experiences
that will assist in achieving their goals (Moschetti, 2012).
In an effort to retain and support students, the First Scholars Program utilizes a
mentor program to aid the students with their individual and academic needs (First
Scholars, 2014). Ishiyama (2007) found when first-generation students are paired with
faculty or peers the retention rate increases in the first-generation population of students.
These relationships help the students feel supported in an educational setting (Moschetti
& Hudley, 2008).
The three characteristics (student success characteristics, tools to access
characteristics, and support strategies) and the body of research is what currently drives
the First Scholars Program (Moschetti, 2012). Although the First Scholars Program relies
on researchers (Dubow, Boxer, & Huesmann, 2009; Werner, 2000; Werner & Smith,
1992) that have examined factors influencing post-secondary enrollment, no one has
actually examined the factors that have influenced the participants in the First Scholars
Program. Without this knowledge, this population will continued to be lumped with the
mass.
Statement of the Problem
The First Scholars Program created the Figure 1.1: First Scholars’ (2014) Steps to
Success Framework by developing four learning objectives (first-gen, self, success, and
significance) and four themes (connect to campus, optimize the college experience,
expand career and community opportunities, and transition to the future). Each year the
students focus on one objective and theme depending on what grade they are in (First
Scholars, 2014).

13
During the students’ freshmen year, the focus is “connecting to campus”. This
objective/theme is met by requiring all of the freshmen to reside in the living-learning
community and enroll in a transition course. The sophomores’ theme is to “optimize the
college experience”. They continue to participate in a peer-mentoring program as the
mentee. This allows the students to address any issues that may arise in a safe
environment. The First Scholars also host activities and workshops designed specifically
for each grade level so the students can engage in social and cultural interactions. The
students’ junior year consists of “expanding career and community opportunities”. The
students have the opportunity to become mentors to the younger participants. These
students are also continually participating in workshops tailored to meet their individual
needs. Seniors are focusing on “transitioning to the future”. The final objective/theme is
focused on ensuring the program has completed its intended task, to develop each student
holistically. By the time the students reach this level, the First Scholars should have
gained a self-awareness of their strengths, developed a vision for their future, and
eventually gain a responsibility to give back to the program (First Scholars, 2014).
The First Scholars Program objectives and themes were designed based upon
three factors: student success characteristics, tools to access characteristics, and support
strategies (Moschetti, 2012). These three factors were identified through third-party
research (First Scholars, 2014; Moschetti, 2012). Although there are similar collegiate
programs (Esters, 2007) that have collected research based on their specific program,
these studies and programs differ by requirements, expectations, services, benefits, etc.
Tailoring a study to meet the needs of this specific program could provide more insight to

14
the First Scholar’s population, problems the students face, and allow more diversified
tools and programs to be developed to meet the needs to their students.
Purpose of the Study
The purpose of this study was to describe the protective factor(s) that contributed
to the first-generation, low socioeconomic status students’ enrollment at The University
of Kentucky.
Research Objectives/Hypotheses
The following research objectives and corresponding hypotheses were developed
to be the focus of this study:
1. Describe selected characteristics of the first generation, low socioeconomic status
students. Specifically: gender, race/ethnicity, home residence, grade level, and
GPA.
2. Describe the protective factors present among the first generation, low
socioeconomic status students.
3. Describe the protective factors present among the first generation, low
socioeconomic status students by grade classification (sophomore, junior, and
senior).
HO1: There is no statistically significant difference in the protective factors by
grade classification (sophomore, junior, and senior).
H1: There is a statistically significant difference in the protective factors by grade
classification (sophomore, junior, and senior).
Definition of Terms
15
The following terms are defined to provide clarity and are used operationally in
this study:
1. Poverty – The United States Census Bureau is responsible for determining the
poverty status. If a family’s total household income is less than the threshold or
allowable income amount set by the United States’ government then everyone in
the household is considered to be living in poverty. (United States Census Bureau,
2012).
2. Protective Factors – Attributes within the individual and/or environmental
influences that enhance “developmentally appropriate outcomes” (Werner, 2000,
p. 116).
3. Resilience – People who have adapted to unfavorable situations and overcome
adversity (American Psychological Association, 2014; Bradley & Corwyn, 2005).
4. Risk Factors – Stressful life events that predict negative life outcomes (Werner &
Smith 1992).
5. Social Class – “A group of individuals who occupy a similar position in the
economic system of production” (University of Delaware, n.d., para. 4).
6. Socioeconomic Status – “A combination of education, income, and occupation. It
is commonly conceptualized as the social standing or class of an individual or
group. When viewed through a social class lens, privilege, power, and control are
emphasized” (American Psychological Association, 2014, para. 1).
Limitations of the Study
The researcher recognizes the following limitations to this study:

16
1. The population was limited to first generation, low socioeconomic status students
enrolled at The University of Kentucky as of August 26, 2015.
2. The population was limited to first generation, low socioeconomic status students
enrolled in the First Scholars program as of August 2015.
3. The population enrolled in the First Scholars Program as of August 2015 was
limited to the grade classifications of sophomore, junior, and senior.
Basic Assumptions
In regards to this study, the following can be assumed:
1. In order for students to be eligible for the First Scholars program the following
criteria must be met (First Scholars, 2014):
a. First-time freshmen and admitted to the University of Kentucky
b. Complete the Student Strengths Inventory
c. Demonstrate financial need and complete the Free Application for Federal
Student Aid [FAFSA]
d. US Citizen or qualified non-citizen as defined by federal law
e. Eligible for in-state tuition
f. ACT score between 22-28 and minimum high school GPA of 3.0
g. Neither parent have more than two years of education beyond high school
(does not include siblings or other relatives)
2. Participants of the First Scholars Program must have a financial need in order to
participate in the program. In return the program provides a $3,000
scholarship/year to each participant totaling $12,000.

17
3. The First Scholar Program freshmen live on-campus in a living-learning
community and enroll in a one semester designated course for First Scholars.
4. The First Scholars Program has provided academic, leadership, and social
opportunities to guide each participant to success in their future.
5. Students involved in the First Scholars Program have been exposed to competent
mentors in the required progressive mentoring program.
6. The First Scholars Program expects the upperclassman students enrolled in the
program to transition into serving the leadership roles within the organization.
7. Students enrolled in the First Scholars Program must maintain a minimum 2.5
cumulative Grade Point Average (GPA).
8. Participants of the First Scholar Program are expected to attend and participate in
regular meetings, activities, retreats, service projects, and workshops organized by
the First Scholars Program. The purpose of these activities is to regularly make
contact with the participants to ensure their academic needs are met.
9. The First Scholar Program participants completed the questionnaires honestly and
to the best of their ability.

18
CHAPTER II
LITERATURE REVIEW
Resilience
Malcolm Gladwell (2008) wrote,
People don’t rise from nothing. We do owe something to parentage and
patronage. The people who stand before kings may look like they did it all by
themselves. But in fact they are invariably the beneficiaries of hidden advantages
and extraordinary opportunities and cultural legacies that allow them to learn and
work hard and make sense of the world in ways others cannot. (p. 19)
For decades, psychologists, counselors, and theorists have described people who
acclimate to unfavorable situations and overcome adversity as resilient (Bradley &
Corwyn, 2005). More specifically, the American Psychological Association (2014)
defines resilience as “the process of adapting well in the face of adversity, trauma,
tragedy, threats, or even significant sources of stress – such as family and relationship
problems, serious health problems or workplace and financial stressors” (p. 2). Through
circumstances, resilient individuals have obtained the ability to “bounce back” from life’s
hardships (Association, 2007).
Resilience research emerged over four decades ago (Wright, Masten, & Narayan,
2013). Several key individuals have been crucial in laying the groundwork for the
concept of resiliency. Norman Garmezy, known as the “grandfather of resilience theory”,
was among one of those key individuals (Harlow, 2009). Garmezy first identified
resilience in schizophrenia patients when he recognized certain patients exhibited more
adaptive functioning behaviors than the other patients (Masten & Powell, 2003). The

19
findings from Garmey’s early work sparked an interest to examine the children of
mentally ill patients because of their increased risk to develop the same mental illness
(Masten & Powell, 2003).
Thus, Garmezy continued his research by creating Project Competence. The
primary focus of Project Competence was to pursue studies that examined three key
factors: competence, adversity, and resilience (Garmezy, 1971). Auke Tellegen,
psychologist, and Ann Masten, graduate student, both from the University of Minnesota,
joined the project. Together Garmezy, Tellegen, and Masten conducted numerous studies
including children with congenital heart defects, physical handicaps, and homeless
children. Despite the children’s high-risk status, many of the children were found to be
resilient (Masten & Powell, 2003). The researchers’ results led to an increased effort to
understand individual responses to adversity (Luthar, Cicchetti, & Becker, 2000).
Emmy Werner and Ruth Smith were also among the resiliency pioneers. Werner
and Smith (1992) used the term “resilient” in the 1970’s to describe a cohort of poverty-
stricken children in Kauai, Hawaii. Werner and Smith (1989) expanded resiliency
research with the longitudinal study based in Kauai, Hawaii because of the examination
of the multiple risk factors such as socioeconomic status, family stability, perinatal stress,
etc. Werner and Smith found one out of three children developed into a successful
individual as an adult (1989).
Early resiliency researchers focused on studying the individual and the
individual’s internal risk factors such as autonomy or high self-esteem (Luthar, Cicchetti,
& Becker, 2000), which could be attributed to helping the individual become resilient.
The individual-themed lens researchers used to study resiliency narrowed the field by

20
limiting the investigation of how the individuals were becoming resilient (Hayhurst,
Hunter, Kafka, & Boyes, 2013).
As resiliency began to be explored in more depth, researchers realized external
factors could attribute to an individual becoming resilient as well (Werner & Smith,
1982, 1992). Additional research led to the creation of three factors associated with the
“development of resilience: (1) attributes of the children themselves, (2) aspects of their
families, and (3) characteristics of their wider social environments” (Luthar, Cicchetti, &
Becker, 2000, p. 544). These three factors have been termed “protective factors” (Werner
& Smith, 1992).
Resilience Theory and Protective Factors
Since the founding, literature on resilience has grown to the emergence of a
theory. The resilience theory has grown to the point where it has been divided into three
constructs. Werner (1995) describes the three constructs as the “three kinds of
phenomenon: good developmental outcomes despite high-risk status, sustained
competence under stress, and recovery from trauma” (p. 81). In each of these
phenomena’s, children have a situation that hinders their potential for future success.
The first phenomenon, good developmental outcomes despite high-risk status,
focuses on children, who are at-risk because of poverty, substance abuse, etc. The second
phenomenon, sustained competence under stress, describes children in environments
where coping is necessary. An example of this phenomenon is a child with divorced
parents. Lastly, the third phenomenon, recovery from trauma, describes people who have
successfully overcome a traumatic experience such as war or a child overcoming the
death of a parent (Werner, 1995).

21
Werner (2000) determined in the process to becoming resilient over a situation or
learning how to cope with a situation, there has to be an influence(s) that is buffering the
person from the situation’s negative influences. For example, a student from a low
socioeconomic status family is less likely to go to college than a student from a middle or
high socioeconomic status family (Sewell & Shah, 1967). However, if that same low SES
student receives an athletic scholarship to attend college and follows through with
enrollment then the sport would be considered the influence or buffer.
Werner identified these influences as protective factors. Protective factors are
“moderators of risk and adversity that enhance good, that is, developmentally appropriate
outcomes” (Werner, 2000, p. 116). In the Kauai longitudinal study, Werner and Smith
(1992) identified three sources of protective factors: within the individual, within the
family, and in the community.
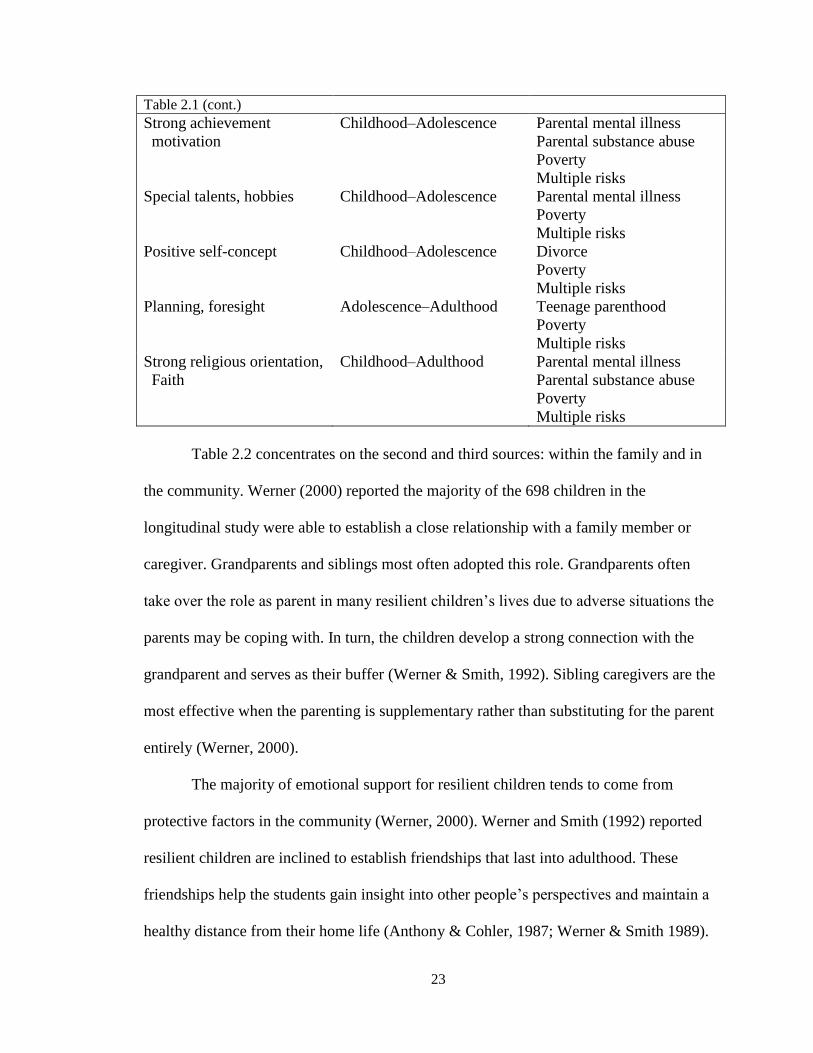
Tables 2.1 and 2.2 display the protective factors Werner (2000) found in the
study. Werner (2000) created these tables based on data collected from 505 individuals
from the prenatal to adulthood developmental periods. The purpose of Werner and
Smith’s (1992) Kauai longitudinal study was to identify resiliency and in the process
learn how to advance positive adult adaptation.
Table 2.1 focuses on the first source of the protective factors: within the
individual. Protective factors within the individual are based solely on the person’s
internal characteristics. An example of a protective factor within the individual is a
positive self-concept. Even though a person’s self-concept can be shaped by outside
influences or factors that is not within one’s self (example: encouraging parents), a

22
person does not rely on another person to have a self-concept. Everybody has a self-
concept whether positive or negative (Werner, 2000).
Werner (2000) found in a longitudinal study observing 698 children, the boys and
girls categorized as resilient possessed several of the same protective factors within the
individual. These characteristics include: self-control, sociability, reflective cognitive
style, and flexible coping strategy.
Table 2.1
Werner’s (2000) Protective Factors within the Individual
TABLE 6.1. Protective Factors within Individuals, Replicated in Two or More
Longitudinal Studies of At-Risk Children First Identified Before the Age of Six
Protective Factors Developmental Period Risk Factors
Low distress/
low emotionality
Infancy–Adulthood Child abuse/neglect
Poverty
Multiple risks
Active; alert;
high vigor; drive
Infancy Poverty
Multiple risks
Sociability Infancy Child abuse/neglect
Parental mental illness
Poverty
Multiple risks
“Easy,” engaging
temperament (affectionate;
cuddly)
Infancy–Childhood Child abuse/neglect
Divorce
Parental substance abuse
Poverty
Multiple risks
Advanced self-help skills Early childhood Poverty
Multiple risks
Average–above average
intelligence (language and
problem-solving skills)
Childhood–Adulthood Child abuse/neglect
Parental mental illness
Parental substance abuse
Poverty
Multiple risks
Ability to distance oneself;
impulse control
Childhood–Adulthood Parental mental illness
Parental substance abuse
Poverty
Multiple risks
Internal locus of control Childhood–Adolescence Parental mental illness
Child abuse/neglect
Poverty
Multiple risks
23
Table 2.1 (cont.)
Strong achievement
motivation
Childhood–Adolescence Parental mental illness
Parental substance abuse
Poverty
Multiple risks
Special talents, hobbies Childhood–Adolescence Parental mental illness
Poverty
Multiple risks
Positive self-concept Childhood–Adolescence Divorce
Poverty
Multiple risks
Planning, foresight Adolescence–Adulthood Teenage parenthood
Poverty
Multiple risks
Strong religious orientation,
Faith
Childhood–Adulthood Parental mental illness
Parental substance abuse
Poverty
Multiple risks
Table 2.2 concentrates on the second and third sources: within the family and in
the community. Werner (2000) reported the majority of the 698 children in the
longitudinal study were able to establish a close relationship with a family member or
caregiver. Grandparents and siblings most often adopted this role. Grandparents often
take over the role as parent in many resilient children’s lives due to adverse situations the
parents may be coping with. In turn, the children develop a strong connection with the
grandparent and serves as their buffer (Werner & Smith, 1992). Sibling caregivers are the
most effective when the parenting is supplementary rather than substituting for the parent
entirely (Werner, 2000).
The majority of emotional support for resilient children tends to come from
protective factors in the community (Werner, 2000). Werner and Smith (1992) reported
resilient children are inclined to establish friendships that last into adulthood. These
friendships help the students gain insight into other people’s perspectives and maintain a
healthy distance from their home life (Anthony & Cohler, 1987; Werner & Smith 1989).

24
Researchers have found resilient children tend to enjoy school because it gives them a
sense of community and stability whereas their households may not. The school
community is also where the students meet the majority of their lifelong friends (Werner
& Smith, 1989).
Table 2.2
Werner’s (2000) Protective Factors within the Family and Community
TABLE 6.2. Protective Factors within the Family and Community Replicated in Two or
More Longitudinal Studies of At-Risk Children First Identified Before the Age of Six
Protective Factors Developmental Period Risk Factors
Small family size
< 4 children
Infancy Teenage motherhood
Poverty
Multiple risks
Mother’s education Infancy–Adulthood Teenage motherhood
Poverty
Multiple risks
Maternal competence Infancy–Adolescence Child abuse/neglect
Poverty
Parental mental illness
Multiple risks
Close bond with primary
caregiver (who need not be
biological parent)
Infancy–Adolescence Child abuse/neglect
Poverty
Parental mental illness
Parental substance abuse
Teenage motherhood
Multiple risks
Supportive grandparents Infancy–Adolescence Child abuse/neglect
Divorce
Parental substance abuse
Teenage motherhood
Poverty
Multiple risks
Supportive siblings Childhood–Adulthood Child abuse/neglect
Divorce
Parental substance abuse
Poverty
Multiple risks
For girls: emphasis on
autonomy with emotional
support from primary
caregiver
Childhood–Adolescence Poverty
Multiple risks
For boys: structure and
rules in household
Childhood–Adolescence Divorce
Poverty
Multiple risks
For both boys and girls:
assigned chores: “required
Childhood–Adolescence
Parental psychopathology
Poverty

25
Table 2.2 (cont.)
helpfulness Multiple risks
Close, competent peer
friends who are confidants
Childhood–Adolescence Divorce
Poverty
Multiple risks
Supportive teachers Preschool–Adulthood
Divorce
Parental mental illness
Parental substance abuse
Poverty
Multiple risks
Successful school
experiences
Preschool–Adulthood Divorce
Parental mental illness
Poverty
Multiple risks
Mentors (elders, peers) Childhood–Adulthood
Poverty
Multiple risks
Since the discovery of protective factors, researchers such as Michael Rutter
(1999) and Suniya Luthar (2003) have steered away from merely identifying protective
factors. Rather researchers have been examining the complete process of how protective
factors help individuals overcome adverse situations (Luthar, Cicchetti, & Becker, 2000).
This aspect of resilience research is essential in the designing and implementation process
of prevention and intervention strategies for at-risk individuals (Luthar, 2003).
Resiliency in Society
Werner and Smith (1982, 1992, 2001) followed 698 children from birth to
adulthood. Every individual in the cohort had at least one or more risk factors (poverty,
parental stress, perinatal stress, etc.) present. When Werner and Smith (1982, 1992, 2001)
met with the individuals at the adolescent stage (18 years old) of their life, two-thirds of
the population was still considered to be “at-risk”. The “at-risk” population experienced
teenage pregnancies, delinquencies, etc. While the one-third resilient population had
found a way to cope or “bounce back” from the risk factors they experienced as a child
(Werner & Smith, 1982, 1992, 2001).

26
When these individuals reached adulthood/midlife (32 and 40 years old), only
one-sixth of the population was still in the “at-risk” category. The rest of the population
had found some kind of coping mechanism or protective factor to help them lead
“normal” lives. These “normal” lives consisted of a stable job, marriage, and/or children.
However, one-sixth of the population was “struggling with chronic financial problems,
domestic conflict, violence, substance abuse, serious mental health problems, and/or low
self-esteem” (Werner & Smith, 2001, p. 37).
Risk factors are a predictor of negative outcomes (WestEd., 2004) Researchers
have found risk factors can only predict 20 – 49% of outcomes for at-risk individuals
(Rutter, 1999; Werner & Smith, 2001). However, protective factors, a predictor of
positive outcomes, can predict the outcomes for at-risk individuals 50 – 80% of the time
(WestEd., 2004). Werner and Smith (1992) suggest, “these buffers [i.e. protective
factors] make a more profound impact on the life course of children who grow up under
adverse conditions than do specific risk factors or stressful life events” (p. 202).
A common misconception and hindrance to society is the misconception people
have an innate resiliency (WestEd., 2004). Masten (2001) suggests resiliency is a quality
any individual can develop. Resiliency should not be thought of, as the individuals
lacking the quality are to blame. Instead the realization that some individuals are
subjected to protective factors or buffers and others are not is how resiliency needs to be
viewed (WestEd., 2004). “What began as a quest to understand the extraordinary has
revealed the power of the ordinary” (Masten, 2001, p. 9).
Even though resiliency is a quality individuals can develop, researchers
recommend we do not simply forget about the youth in high-risk circumstances.

27
Society’s future depends on the youth of America to grow up in healthy, supportive
environments in order to produce healthy, supportive citizens (WestEd., 2004).
Resiliency in Post Secondary Education
Researchers have focused on the effects low SES has on students after high
school by evaluating potential correlating factors such as paternal encouragement,
intelligence, and the students’ college aspirations (Sewell & Shah, 1968). Swell and Shah
(1967) reported low SES students with negative parental encouragement, low
intelligence, and low aspirations of attending college had low retention rates. By
evaluating these factors, researchers have increased understanding of why low SES
students tend to have low enrollment rates in postsecondary institutions and even lower
retention rates. Researchers have found retention rates for low SES students in post
secondary institutions are usually low compared to high-income students and even lower
in graduate school enrollment (Walpole, 2003).
In 2003, Walpole published findings from a nine-year longitudinal study, which
evaluated student enrollment in higher education. The objective of the study was to
examine how SES affects students’ overall college experience and the students’ final
outcome. Key variables in the study were the students’ background (time spent studying,
activities involved in during college, and jobs held during college), parental income, and
the students’ career aspirations. The researcher found that low SES student enrollment
was overall lower than high SES student enrollment. Furthermore, when low SES
students did attend college, they attended institutions with lower standards such as
community colleges (Bailey, Calcagno, Jenkins, Kienzl, & Leinbach, 2008; Walpole,
2003).

28
Sewell and Shah (1967) conducted a study on the effects low SES and low
intelligence have on the attainment of higher education. Overall, the low SES students
scored lower on the intelligence test than the middle and high SES students. The
researchers measured intelligence on the Henmon-Nelson Test of Mental Maturity. This
test was given annually to all Wisconsin high school juniors. Even when intelligence
seemed to be the main factor in determining which students would attend college, SES
still influenced which students would actually graduate (Sewell & Shah, 1967).
Researchers have also found students from low SES backgrounds tend to have
lower achievement scores in math and reading. These low achievement scores have lead
to a lower success rate in college settings. Low SES students that are not successful in
college have had higher dropout rates than middle and high SES students (Lee, Daniels,
Puig, Newgent, & Nam, 2008).
In 2009, Reason reviewed research on student retention in the college setting.
The researcher focused on individual student demographic characteristics (race, ethnicity,
gender, age, and social class). Overall, more women, ethnically diverse students, and
older students are enrolling in higher education. However, the rate of low SES students
attending college has been decreasing. (Reason, 2009).
Thieman, Henry, and Kitchel (2012) examined common themes related to the
stress of ten preservice teachers at the University of Missouri. The researchers found each
preservice teacher dealt with similar stressors when working with high school students.
These stressors ranged from classroom management/discipline, youth organization
concerns, and work/life balance. The researchers found it was imperative for the

29
preservice teachers to have a positive and supportive student teaching experience for the
participants to become resilient.
The majority of low SES research focuses on four-year institutions. Bailey,
Calcagno, Jenkins, Kienzl, and Leinbach (2008) examined the impact institutional
characteristics (tuition rates, location, scheduling, admissions policy, and services for at-
risk students) had on community college students’ success. Low-income and minority
students had higher enrollment rates at community colleges than at four-year institutions.
Bailey et al. hypothesized lower tuition rates, convenient location, flexible scheduling,
open-door admissions policies, and having more services for at-risk students support low
SES students in community colleges.
Astin and Osequera (2004) studied trends that contributed to the retention rates of
low SES students in higher education. The trends studied were: financial aid, affirmative
action, and outreach program. The researchers conducted a longitudinal study spanning
the course of 38 years with over 400,000 college freshmen and more than 700 higher
educational institutions. The researchers’ findings determined low SES students’
financial needs were not being met. Students from upper and middle class families were
being targeted through outreach programs such as recruitment, while no parallel
programming was being conducted for low SES students. Thus, year after year low-
income and low-education families continue to be underrepresented in higher education
(Astin & Osequera, 2004).
The current tuition rate at the University of Kentucky (2014), for an in-state
resident is $9,012. When combined with room and board, the rate increases to $19,340.
In the 2013 – 2014 school year, 51% of students enrolled at UK had a financial need. Of

30
those 51% of UK students with a financial need, 50% of students received some type of
financial aid, including loans. While, less than half of the students (24%) received grants
and need-based scholarships. However, only 8% of those students’ financial needs were
fully met (University of Kentucky, 2014). This leaves the additional 43% of students with
a financial need left searching for a way to afford higher education opportunity.
Even though researchers have examined the impact low SES has on college
enrollment and retention, there have not been any reformation plans created to address
the problem (Tinto, 2006). Tinto suggested the profession move from theory to action in
order to begin creating a reformation plan.
Resilience Rate
In 2012, Fisher reported 11% of low-income students were obtaining a college
degree from a four-year university. However, 79% of high-income students are earning a
degree from these universities (Fisher, 2012). When examining Ivy League institutions,
the gap widens even further. The Ivy League student population is made up of
approximately 60% of high-income students, 5% of low-income students, and the
remaining individuals are considered middle-income (Fisher, 2012).
In order to alleviate the gap between the haves and have not’s in the higher
educational realm, the Basic Educational Opportunity Grant was established in 1980
(Federal Education Budget Project, 2014). Today the Basic Educational Opportunity
Grant is known as the Pell Grant Program. The Pell Grant is a federal grant awarded to
low-income undergraduate students to assist with higher education expenses. In 2014,
approximately $30 billion was awarded to nine million students in the form of a Pell
Grant (Federal Education Budget Project, 2014).

31
The maximum award a student can attain with the Pell Grant is $5,550 (Fisher,
2012). This equates to approximately half the cost of a state university leaving students
and their families responsible for the remaining fees. The Advisory Committee on
Student Financial Assistance (2010) reported for the 2007 – 2008 school year, 48% of a
low-income family’s income would be the remaining cost of attendance for a full-time
dependent student enrolled in a four-year university. This 48% of a low-income family’s
income also includes their student receiving the maximum amount of grant aid allowable
(Advisory Committee on Student Financial Assistance, 2010).
Although the Pell Grant is the largest grant program in the U.S., Mundel and Rice
(2008) reported the impact of these federally funded grant programs have not been
substantial in narrowing the enrollment gap between low- and high-income students.
Although federal grant-based programs provide an opportunity for access to higher
education, barriers still exist (National Association of Student Financial Aid
Administrators [NASFAA], 2012). The barriers the students are facing are a lack of
preparation for college, limited knowledge about college opportunities, and an unmet
financial need (Higher Education Act of 1965, 1965).
Researchers know there is a correlation between education and income (Reason,
2009). In Figure 2.1, the U.S. Department of Labor (2014) reported the majority of the
unemployed population (11%) did not earn a high school diploma. However, 4% of the
unemployed population earned a Bachelor’s degree. When comparing the median weekly
income for all workers ($827) to individuals without a high school diploma ($472), the
individuals without a diploma makes $355 less than the average person. If a person
attended college but did not earn a degree ($727) or earned an Associate’s degree ($777),

32
their median weekly earnings still fell below the average earnings ($827) (U.S.
Department of Labor, 2014).
Figure 2.1
Earnings and Unemployment Rates by Educational Attainment (United States
Department of Labor, 2014)
Figure 2.1 shows the importance of attaining a higher education degree. However,
during 1992 – 2004, the enrollment of low-income students in four-year universities fell
from 54% to 40% (Fisher, 2012). Based on this analysis of previous studies, there is a
need for further research on the enrollment and success of first-generation, low
socioeconomic status students to examine what determining factors persuaded these
individuals to purse a college degree despite the odds stacked against them.

33
CHAPTER III
METHODOLOGY
The primary focus of this chapter was to examine the methodology and
procedures used in the study. The following procedures are provided: research design,
population and sample, instrumentation, validity and reliability, and data collection. After
the development of the questionnaire, but prior to the data collection stage, approval from
the Institutional Review Board [IRB] at the University of Kentucky was sought. After
receiving an “exemption certification” for protocol number 13-0697-X4B (see Appendix
A), data was collected.
Purpose of the Study
The purpose of this study was to describe the protective factor(s) that contributed
to the first-generation, low socioeconomic status students’ enrollment at The University
of Kentucky.
Research Objectives
The following research objectives and corresponding hypotheses were developed
to be the focus of this study:
1. Describe selected characteristics of the first generation, low socioeconomic status
students. Specifically: gender, race/ethnicity, home residence, grade level, and
GPA.
2. Describe the protective factors present among the first generation, low
socioeconomic status students.
3. Describe the protective factors present among the first generation, low
socioeconomic status students by grade classification (sophomore, junior, and

34
senior).
HO1: There is no statistically significant difference in the protective
factors by grade classification (sophomore, junior, and senior).
H1: There is a statistically significant difference in the protective factors
by grade classification (sophomore, junior, and senior).
Research Design
This study was descriptive and correlational by design. Descriptive research is
used when a researcher wants to examine existing conditions (Fraenkel & Wallen, 2006).
Correlational research is collecting data on two or more variables and examining the
relationship between those variables (Houghton Mifflin Harcourt, 2014). In this study,
the researcher examined which protective factor(s) assisted first-generation, low
socioeconomic status students enrolling in a higher educational institution.
The dependent variable investigated was the enrollment of the First Scholars
participants at the University of Kentucky. The independent variables were Werner’s
(2000) protective factors (see Table 2.1). Protective factors refer to attributes within the
individual and/or environmental influences that allow the individual to succeed despite
their circumstances. In this case, the circumstance would be growing up in a low
socioeconomic status environment.
When conducting a descriptive, correlational study, internal and external validity
must be addressed. Internal validity ensures the data collected and analyzed are accurate
(Michael, 2000). In order to protect internal validity, the researcher must minimize
measurement error by ensuring the instrument is valid and reliable (Michael, 2000).
External validity is the degree “to which the results of a study can be generalized to the

35
world at large” (Boyd, n.d.). Random sampling technique and maintaining a low dropout
rate of participants improves external validity (Michael, 2000).
Population and Sample
In this study, the population consisted of first-generation students enrolled at the
University of Kentucky’s First Scholars Program in the 2015 – 2016 academic year (N =
51). At UK, 18% of students are considered first-generation (University of Kentucky,
2014). The purpose requires the identification of a low-socioeconomic status population.
The population was narrowed upon identification of first-generation, low socioeconomic
status students enrolled at the University of Kentucky’s First Scholars Program (N = 51).
The researcher identified the low SES population by the Free Application for Federal
Student Aid [FAFSA].
The frame for this study consisted of the First Scholars program at UK designed
to assist first-generation, low socioeconomic status students to succeed while in college.
The University of Kentucky offers three similar programs (First Scholars, Robinson
Scholars, and Student Support Services) that assist this population. Examining each of the
program’s requirements narrowed the frame (see Table 1.2). The researcher identified
that First Scholars was the only program to require participants to have a financial need
and be considered first-generation (First Scholars, 2014).
Due to the lack of funding in the First Scholars Program, no freshmen cohort
exists for the 2015 – 2016 academic year. The First Scholars Program is currently
partnered with seven universities, including the University of Kentucky; however, UK is
the only university in the Commonwealth to offer this program (First Scholars, 2014).
This provided a convenient sampling technique of the population (n = 37).

36
Convenient sampling is often used in exploratory research. The researcher
generally wants to obtain a “gross estimation” in the most inexpensive way possible
(Jackson, 2011; StatPac, 2014). In order to maximize response rate, face-to-face
instrument distribution was utilized: therefore a convenient sample of those present
during the day of distribution as utilized.
Instrumentation
The instrument used for this study was developed by the researcher and guided by
Werner’s (2000) protective factors. The questionnaire was referred to as, “Against the
Odds: Protective Factors Questionnaire”. The questionnaire was folded in the form of a
booklet and composed on 8-½ inch x 11 inch paper. There were two sections to the
instrument: part I consisted of the protective factors and part II consisted of participant
characteristics.
The 23 protective factors in part I of the questionnaire were developed by Dr.
Emmy E. Werner (2000) and adapted for this study. Dr. Werner was contacted by email
to access the protective factors on July 25, 2012 (see Appendix E). Werner and Smith
(1992) used a questionnaire in the Kauai, Hawaii longitudinal study to determine the
protective factors found in this study.
In the “Against the Odds: Protective Factors” study, the participants are asked to
determine how influential each factor was on their enrollment at the University of
Kentucky. The influence is based on a five-point Likert scale (1-no influence, 2-slightly
influential, 3-moderately influential, 4-influential, and 5-extremely influential).
The second section of the questionnaire sought out the participants’ characteristics
demographically. These questions were closed-ended and convenient because they

37
allowed the participants to answer quickly. The responses were analyzed and coded in
Statistical Package for the Social Sciences® [SPSS] 22.0 for Windows numerically. The
demographic questions contained the following: gender, race/ethnicity, home residence,
grade level, and GPA.
Part II of the questionnaire also allowed the participants to describe which
factor(s) they felt were the least and most important to their enrollment at the University
of Kentucky. Part I did not allow this opportunity because all 23 factors were answered
on the Likert scale. Finally, the last question in part II allowed the participants to provide
any additional comments or concerns in a confidential setting. Although, this is not a
qualitative study open-ended questions can provide useful information.
Validity and Reliability
A panel of experts (n = 3) reviewed the questionnaire for content validity. Part I
sought to measure the saliency of the protective factors within the participants’ choice to
attend the University of Kentucky. Part II collected characteristic and demographic
information.
The panel of experts consisted of three university faculty members representing
Departments of Agricultural Education and Community Leadership and Development at
the University of Kentucky and The Ohio State University. Two of the members were
selected based on their experience in teaching. All three members were selected based on
their research and field knowledge of underserved populations.
In order to establish validity, a systematic process was established through email.
The panel of experts received an email requesting their expertise for content validity. The
questionnaire and a Microsoft Word document containing the research purpose and

38
objectives were attached to the email. The members were asked to specifically examine
clarity, verbiage, and visual appearance. Modifications were made following the panel
members review in order to improve the questionnaire. Sample protective factor
statements were added in place of the protective factors in order to improve the
understanding of the meaning of the protective factors.
Face validity was established through an audience that field-tested the instrument.
The field test was conducted on May 1, 2015 with a University of Kentucky class (n = 8).
The students were asked to complete the survey and to evaluate the statements to make
sure they were easy to understand.
Reliability is the extent an instrument produces accurate results (Phelan & Wren,
2006). The reliability of the questionnaire was established using a field test. Cronbach’s
apha reliability coefficient for the scale was this study’s scale was 0.81 (Santos, 1999).
The Cronbach’s alpha coefficient scale ranges from 0 to 1. The higher the Cronbach
alpha score is indicative of the higher the reliability of a multi-point questionnaire or
scale, while a score of 0.70 or higher is acceptable (Santos, 1999).
The field test participants were selected based upon enrollment at UK and similar
in age to the study sample. The professor was selected based upon research and field
experience with underserved populations. The professor received the questionnaire as 8-
½ x 11 booklets and was asked to send the students’ responses back by postage mail or
fax within a week. The researcher provided the professor steps for properly administering
the questionnaire.
Part II of the questionnaire sought to collect characteristic and demographic
information from the participants. Researchers suggest not calculating and reporting

39
demographic data due to the margin of error being minimal (Glasgow, 2005; Salant &
Dillman, 1994).
Data Collection
The researcher met with the University of Kentucky’s First Scholars coordinator
to discuss protocol for distributing the questionnaires (see Appendix D). The First
Scholars coordinator already had meetings scheduled with the students to discuss
scheduling for the upcoming semester so the coordinator decided to distribute the
questionnaires at the individual meetings. The researcher chose the coordinator to
administer the questionnaires to increase response rate and minimize non-response error.
The researcher provided the coordinator with packets for each participant. Each
packet contained a consent cover letter (see Appendix C) explaining the details of the
study. The consent cover letter provided the research objectives, time frame for the data
collection process, and the researcher’s and IRB’s contact information. The researcher
was approved a waiver of informed consent (see Appendix B) for the participants due to
the study presenting no more than minimal risk and written consent was not required
outside of the research study. After the First Scholars’ coordinator read the consent cover
letter aloud, the participants were given the opportunity to decline participation in the
study. The participants that declined participation in the study were asked to return the
packets back to the coordinator. The remaining participants were instructed to keep the
consent cover letter for their records for future questions or concerns.
The following steps were followed in the data collection process of the willing
participants:

40
1. Before the distribution of materials the participants were instructed to wait to
begin before completing the questionnaire.
2. The First Scholars’ proctor distributed a questionnaire, a manila envelope, and a
pencil to each participant.
3. The First Scholars’ proctor read the instructions in part I and part II of the
questionnaire, explained the Likert scale, brought attention the additional
comments and concerns section, instructed participants to place the questionnaire
in the manila envelope provided at the completion of the questionnaire, answered
participants’ questions, and then instructed them to begin answering the
questionnaire.
4. After the participants completed the questionnaire, the First Scholars’ proctor
collected and stored all questionnaires (n = 37) in a locked filing cabinet until
collected by the researcher. Once the researcher collected the questionnaires, they
were once again stored in a locked filling cabinet only accessible to the
researcher.
After the questionnaires were distributed and collected, the researcher and the
First Scholars coordinator contacted the non-responsive participants by email in order to
solve for non-responsive error. “Non-response error occurs when a significant number of
people in the survey sample do not respond to the questionnaire” (Salant & Dillman,
1994, p. 20). Salant and Dillman (1994) consider a response rate under 60-70 percent as
an indicator of non-response error. The researcher was able to secure a 72% response
rate.
Data Analysis

41
The Statistical Package for the Social Sciences® [SPSS] 22.0 for Windows was
utilized for data analysis. All statistical analyses are subject to assumption; therefore the
statistical analysis was guided by the scale of measurement (nominal, ordinal, interval,
and ratio) of the data. Table 3.3 illustrates the analysis, assumptions, and statistical
methods utilized to examine each assumption. An alpha level of .05 was established.
Table 3.1
Assumptions by Statistical Analysis
Statistical Test Assumption Assumption Examined
Continuous variables Normality PP – plots
Bivariate correlation Linearity Scatter- plots
Outliers
Research Objective 1: Describe selected characteristics of the first generation, low
socioeconomic status students.
For research objective one, descriptive statistics, more specifically frequencies
and percentages were used to report and analyze the characteristics of the first-
generation, low socioeconomic status students. Frequency counts and percentages were
used to describe nominal and ordinal data. Characteristics analyzed included: gender,
race/ethnicity, home residence, grade level, and GPA.
Research Objective 2: Describe the protective factors present among the first
generation, low socioeconomic status students.
Measures of central tendencies were reported to address research objective two.
These measures include mean, median, mode, and range. The researcher analyzed each
protective factor mean score to determine which factors were salient among the
participants.

42
Research Objective 3: Describe the protective factors present among the first
generation, low socioeconomic status students by grade classification (sophomore,
junior, and senior).
Measures of central tendency, including mean, standard deviation, and a
minimum and maximum range, were reported to address research objective three.
HO1: There is no statistically significant difference in the protective factors by
grade classification (sophomore, junior, and senior).
H1: There is a statistically significant difference in the protective factors by grade
classification (sophomore, junior, and senior).
In order to determine whether a difference does exist among the protective
factors, an Analysis of Variance (ANOVA) was utilized. ANOVA test determines the
difference between vectors of means between two or more groups (Stats, n.d.). The
classification of the students (sophomore, junior, and senior) was evaluated as
multichotomous variables. To complete research objective three, an univariate linear 2–
way ANOVA model was conducted to determine the differences in the existing
protective factors identified. A Levene’s test reveals that an equal variance was assumed
in the protective factors. Hochberg’s GT2, post hoc, pair–wise comparison was utilized
due to the unequal sample size between the grade classifications (sophomore, junior, and
senior). Type I error is addressed by the Hochberg’s GT2 because it provides a
calculation for the honest significant difference (Field, 2000).

43
CHAPTER IV
RESULTS
Purpose of the Study
The purpose of this study was to describe the protective factor(s) that contributed
to the first-generation, low socioeconomic status students’ enrollment at The University
of Kentucky.
Research Objectives
The following research objectives and corresponding hypotheses were developed
to be the focus of this study:
1. Describe selected characteristics of the first generation, low socioeconomic status
students. Specifically: gender, race/ethnicity, home residence, grade level, and
GPA.
2. Describe the protective factors present among the first generation, low
socioeconomic status students.
3. Describe the protective factors present among the first generation, low
socioeconomic status students by grade classification (sophomore, junior, and
senior).
HO1: There is no statistically significant difference in the protective
factors by grade classification (sophomore, junior, and senior).
H1: There is a statistically significant difference in the protective factors
by grade classification (sophomore, junior, and senior).
Findings

44
Research Objective 1: Describe selected characteristics of the first generation, low
socioeconomic status students.
Research objective one sought to describe the characteristics (gender,
race/ethnicity, home residence, grade level, and GPA) of the first generation, low
socioeconomic status students enrolled in the First Scholars program at the University of
Kentucky. In Table 4.1, the majority of the First Scholar participants were found to be
females (f = 21; 56.8%), while sixteen were found to be males (43.2%). Of the
participants, 73.0% (f = 27) identified as White/Caucasian, followed by other (f = 5;
13.5%), then Black/African-American (f = 3; 8.1%), and lastly Hispanic/Latino (f = 2;
5.4%). The majority of First Scholar participants (f = 20; 54.1%) considered their home
residence to be in a suburban setting, while 37.8% (f = 14) identified their residence as
rural, and 8.1% (f = 3) lived in an urban residence. Out of the n = 37 participants, the
majority were sophomores (f = 13; 35.1%), while juniors (f = 12; 32.4%) and seniors (f =
12; 32.4%) had the same number of participants. The majority of the participants (f = 10;
27.0%) fell in the GPA range of 3.26-3.5; while 21.6% (f = 8) of the students GPA were
in the 3.75-4.0 range, followed by a GPA of 3.51-3.74 (f = 7; 18.9%) and 2.0-3.0 (f = 7;
18.9%), four students (f = 10.8) identified their GPA between 2.0-3.0, one student (f =
2.7%) responded with above 4.0 GPA, and no students (f = 0; 0%) had a GPA below 2.0.
Table 4.1
Characteristics of University of Kentucky’s First Scholar Participants (n = 37)
Characteristic Frequency Percentage
Gender
Male 16 43.2
Female 21 56.8
Race/Ethnicity
White/Caucasian 27 73.0
Black/African-American 3 8.1

45
Table 4.1 (cont.)
Characteristic Frequency Percentage
Hispanic/Latino 2 5.4
Other 5 13.5
Home Residence
Rural (Less than 2,500) 14 37.8
Suburban (2,499-49,999) 20 54.1
Urban (50,000 or more) 3 8.1
Grade Level
Sophomore 13 35.1
Junior 12 32.4
Senior 12 32.4
GPA
Above 4.0 1 2.7
3.75-4.0 8 21.6
3.51-3.74 7 18.9
3.26-3.5 10 27.0
3.01-3.25 4 10.8
2.0-3.0 7 18.9
Below 2.0 0 0
Research Objective 2: Describe the protective factors present among the first
generation, low socioeconomic status students.
In research objective two, the participants were asked to identify which protective
factors (N = 23) were influential in their decision to attend the University of Kentucky.
The participants ranked the influence of each protective factor on a Likert scale (1 = no
influence, 2 = slightly influential, 3 = moderately influential, 4 = influential, and 5 =
extremely influential).
In Table 4.2, the majority of participants (f = 11; 29.7%) found high school
activities to be slightly influential in their enrollment at UK, followed by moderately
influential (f = 8; 21.6%). While 18.9% (f = 7) of individuals, reported high school
activities were considered extremely influential. Six individuals (16.2%) responded
influential to high school activities and five participants (13.5%) stated high school
activities had no influence.

46
Thirteen participants (35.1%) identified personality as extremely influential,
followed by moderately influential (f = 11; 28.7%), and third was influential (f = 9;
24.3%). 8.1% (f = 2) of the First Scholars indicated personality was slightly influential.
Lastly, 2.7% (f = 1) listed personality as having no influence on their decision to enroll at
the University of Kentucky.
Of the First Scholar participants, 45.9% (f = 17) reported the ability to be a self-
starter was extremely influential in attending college; while nine participants (24.3%)
stated it was influential. Seven students (18.9%) recorded being a self-starter was
moderately influential, whereas, 8.1% (f = 3) of students found this factor to be slightly
influential. One participant (2.7%) stated this factor had no influence.
Of the First Scholar participants, 37.8% (f = 14) said intelligence was influential,
however twelve students (32.4%) described intelligence as extremely influential. Of the
participants, 27% (f = 10) reported intelligence as a moderately influential factor,
followed by slightly influential (f = 1; 2.7%) and no influence (f = 0; 0%).
The students reported the ability to physically distance oneself tied between
moderately influential (f = 9; 24.3%) and influential (f = 9; 24.3%). No influence (f = 7;
18.9% and extremely influential (f = 7; 18.9%) followed. Lastly, 13.5% of students (f =
5) reported the factor as slightly influential.
The majority of the participants (f = 18; 48.6%) responded influential to the
ability to focus on one’s education, whereas 43.2% (f =16) students reported the factor
was extremely influential. Two students (5.4%) stated the factor was moderately
influential and 2.7% (f = 1) said the factor was slightly influential. Of the students, o% (f
= 0) felt the ability to focus on education had no influence on their enrollment at UK.

47
Over three-quarters of the participants (f = 29; 78.4%) described the ability to
achieve their goals as extremely influential, followed by influential (f = 6; 16.2%) and
moderately influential (f = 2; 5.4%). None of the students (f = 0; 0%) reported this factor
as slightly influential or no influence.
Of the students, 29% (f = 11) responded moderately influential to hobbies and/or
special talents affecting their college enrollment, however nine students (24.3%) felt this
factor was slightly influential. Approximately 21.6% (f = 8) reported no influence,
followed by influential (f = 6; 16.2%), and extremely influential (f = 3; 8.1%).
The majority of the participants (f = 13; 35.1%) stated positive self-concept was
moderately influential, trialed by influential (f = 12; 32.4%), and extremely influential (f
= 9; 24.3%). Two participants (5.4%) rated the factor as slightly influential and one
student (2.7%) said it had no influence.
Over half of the participants (f = 22; 59.5%), found the ability to plan for their
future as extremely influential, followed by influential (f = 9; 24.3%), and moderately
influential (f = 4; 10.8%). Approximately 5.4% (f = 2) reported this factor as slightly
influential and 0% of the students (f = 0) reported no influence.
The First Scholar participants (f = 16; 43.2) reported their upbringing/how they
were raised as extremely influential, moderately influential (f = 9; 24.3%), and influential
(f = 8; 21.6%). 5.4% (f = 2) reported upbringing as have no influence and slightly
influential (f = 2; 5.4%) on their college decision.
Approximately 21.6% of the students described their parents’ education as
extremely influential (f = 8), influential (f = 8), and moderately influential (f = 8). 18.9%
(f = 7) felt it had no influence, while 16.2% (f = 6) stated it was slightly influential.

48
Ten students (27.0%) stated a relationship with a caregiver was extremely
influential, while eight students (21.6%) stated a caregiver had no influence on their
decision. 18.9% of the students (f = 7) responded as slightly and moderately influential,
and 13.5% (f = 5) felt a caregiver was influential.
The majority (f = 13; 35.1%) described their grandparents as slightly influential,
then moderately influential (f = 8; 21.6%), followed by extremely influential (f = 6;
16.2%) and no influence (f = 6; 16.2%). Lastly, five participants (13.5%) responded as
influential.
A third of the participants (f = 13; 35.1%) stated siblings had no influence, while
24.3% (f = 9) reported siblings as being moderately influential. Seven students (18.9%)
described this factor as influential, followed by extremely influential (f = 5; 13.5%), and
slightly influential (f = 2; 5.4%).
Over half of the students (f = 19; 51.4%), found being independent was extremely
influential, then influential (f = 10; 27.0%), followed by moderately influential (f = 7;
18.9%). Of the students, 2.7% (f = 1) described independence as slightly influential and
none of the students (f = 0; 0%) felt the factor had no influence.
The majority of the participants (f = 13; 35.1%) reported structure and rules in
their household was considered extremely influential, second was moderately influential
(f = 7; 18.9%). The participants reported influential (f = 6; 16.2%) and slightly influential
(f = 6; 16.2%) as the same on the Likert scale. 13.5% (f = 5) of the participants felt this
factor had no influence.
Seventeen participants (45.9%) responded to responsibilities as extremely
influential, while twelve participants (32.4%) answered influential. 13.5% (f = 5) of the

49
scholars replied moderately influential, then slightly influential (f = 2; 5.4%), and no
influence (f = 1; 2.7%).
Nearly a third of the First Scholars (f = 12; 32.4%) found close friends to be
extremely influential, while 24.3% (f = 9) responded influential. Seven individuals (f =
18.9%) scored close friends as moderately influential, then no influence (f = 5; 13.5%),
and slightly influential (f = 4; 10.4%).
Of the protective factor of teacher(s), nine students described it as extremely
influential (24.3%) and moderately influential (24.3%). 21.6% found teacher(s) to be
influential, followed by no influence (f = 7; 18.9), and slightly influential (f = 4; 10.8%).
Approximately 29.7% of the students reported school experiences as extremely
influential (f = 11) and influential (f = 11). Secondly was moderately influential (f = 9;
24.3%), followed by slightly influential (f = 3; 8.1%) and no influence (f = 3; 8.1%).
Of scholars, 29.7% stated high school mentor(s) had no influence (f = 11) and was
moderately influential (f = 11). 18.9% of scholars (f = 7) described high school mentor(s)
as slightly influential, while 10.8% felt this factor was influential (f = 4) and extremely
influential (f = 4).
Table 4.2
Protective Factors Present Among University of Kentucky’s First Scholars Participants
(n = 37)
Protective Factor f %
High School Activities
No Influence 5 13.5
Slightly Influential 11 29.7
Moderately Influential 8 21.6
Influential 6 16.2
Extremely Influential 7 18.9
Personality
No Influence 1 2.7
Slightly Influential 2 8.1
Moderately Influential 11 28.7
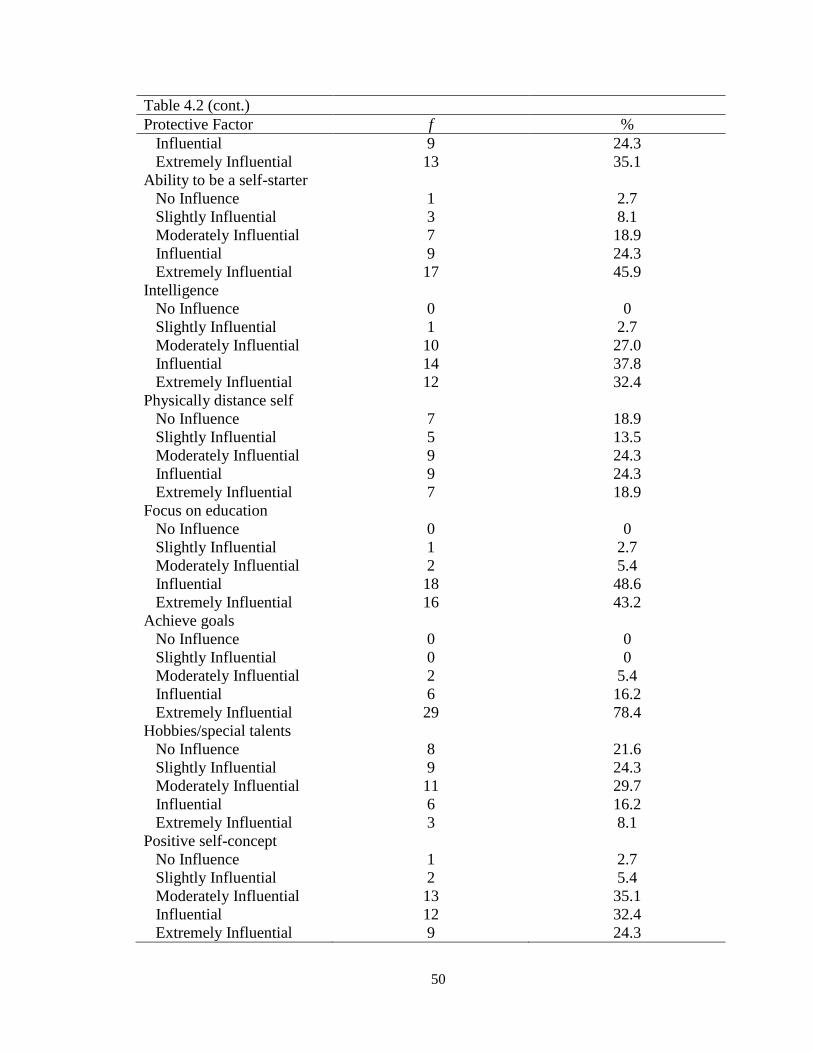
50
Table 4.2 (cont.)
Protective Factor f %
Influential 9 24.3
Extremely Influential 13 35.1
Ability to be a self-starter
No Influence 1 2.7
Slightly Influential 3 8.1
Moderately Influential 7 18.9
Influential 9 24.3
Extremely Influential 17 45.9
Intelligence
No Influence 0 0
Slightly Influential 1 2.7
Moderately Influential 10 27.0
Influential 14 37.8
Extremely Influential 12 32.4
Physically distance self
No Influence 7 18.9
Slightly Influential 5 13.5
Moderately Influential 9 24.3
Influential 9 24.3
Extremely Influential 7 18.9
Focus on education
No Influence 0 0
Slightly Influential 1 2.7
Moderately Influential 2 5.4
Influential 18 48.6
Extremely Influential 16 43.2
Achieve goals
No Influence 0 0
Slightly Influential 0 0
Moderately Influential 2 5.4
Influential 6 16.2
Extremely Influential 29 78.4
Hobbies/special talents
No Influence 8 21.6
Slightly Influential 9 24.3
Moderately Influential 11 29.7
Influential 6 16.2
Extremely Influential 3 8.1
Positive self-concept
No Influence 1 2.7
Slightly Influential 2 5.4
Moderately Influential 13 35.1
Influential 12 32.4
Extremely Influential 9 24.3

51
Table 4.2 (cont.)
Protective Factor f %
Ability to plan for future
No Influence 0 0
Slightly Influential 2 5.4
Moderately Influential 4 10.8
Influential 9 24.3
Extremely Influential 22 59.5
Faith
No Influence 10 27.0
Slightly Influential 7 18.9
Moderately Influential 2 5.4
Influential 5 13.5
Extremely Influential 13 35.1
Upbringing
No Influence 2 5.4
Slightly Influential 2 5.4
Moderately Influential 9 24.3
Influential 8 21.6
Extremely Influential 16 43.2
Parents’ education
No Influence 7 18.9
Slightly Influential 6 16.2
Moderately Influential 8 21.6
Influential 8 21.6
Extremely Influential 8 21.6
Caregiver relationship
No Influence 8 21.6
Slightly Influential 7 18.9
Moderately Influential 7 18.9
Influential 5 13.5
Extremely Influential 10 27.0
Grandparents
No Influence 6 16.2
Slightly Influential 13 35.1
Moderately Influential 8 21.6
Influential 4 10.8
Extremely Influential 6 16.2
Siblings
No Influence 13 35.1
Slightly Influential 2 8.1
Moderately Influential 9 24.3
Influential 7 18.9
Extremely Influential 5 13.5
Being independent
No Influence 1 2.7

52
Table 4.2 (cont.)
Protective Factor f %
Slightly Influential 0 0
Moderately Influential 7 18.9
Influential 10 27.0
Extremely Influential 19 51.4
Structure and rules
No Influence 5 13.5
Slightly Influential 6 16.2
Moderately Influential 7 18.9
Influential 6 16.2
Extremely Influential 13 35.1
Responsibilities
No Influence 1 2.7
Slightly Influential 2 5.4
Moderately Influential 5 13.5
Influential 12 32.4
Extremely Influential 17 45.9
Close friends
No Influence 5 13.5
Slightly Influential 4 10.8
Moderately Influential 7 18.9
Influential 9 24.3
Extremely Influential 12 32.4
Teacher(s)
No Influence 7 18.9
Slightly Influential 4 10.8
Moderately Influential 9 24.3
Influential 8 21.6
Extremely Influential 9 24.3
School experiences
No Influence 3 8.1
Slightly Influential 3 8.1
Moderately Influential 9 24.3
Influential 11 29.7
Extremely Influential 11 29.7
High school mentor(s)
No Influence 11 29.7
Slightly Influential 7 18.9
Moderately Influential 11 29.7
Influential 4 10.8
Extremely Influential 4 10.8
In research objective two, the researcher reported the measures of central
tendencies for the protective factors (n = 23) in Table 4.3. The First Scholar participants

53
scored the protective factor of achieving goals (M = 4.73) higher than the other twenty-
two protective factors. The ability to plan for one’s future (M = 4.38) followed. The
ability to focus on one’s education had a mean score of 4.32, followed by the protective
factor of being independent (M = 4.24) and then responsibilities (M = 4.14). The First
Scholar participants scored the ability to be a self-starter with a mean of 4.14 and
intelligence with a mean of 4.00. The protective factor of the participants’ upbringing
received a mean score of 3.92, while personality received a mean score of 3.81. The next
highest mean score of the protective factors is positive self-concept (M = 3.70), then
school experiences (M = 3.65), close friends (M = 3.51), structure and rules (M = 3.43),
and teacher(s) (M = 3.22). The ability to physically distance oneself, faith, and parents’
education all had a mean score of 3.11. The protective factor caregiver relationship mean
score was 3.05, followed by high school activities (M = 2.97) and grandparents (M =
2.76). The scholars scored siblings next (M = 2.68), then hobbies/special talents (M =
2.65) and lastly, high school mentor(s) (M = 2.54).
Table 4.3
Central Tendencies of Protective Factors Among University of Kentucky’s First Scholar
Participants (n = 37)
Protective Factor Mean Median Mode Range
Achieve goals 4.73 5.00 5.00 3.00-5.00
Ability to plan for future 4.38 5.00 5.00 2.00-5.00
Focus on education 4.32 4.00 4.00 2.00-5.00
Being independent 4.24 5.00 5.00 1.00-5.00
Responsibilities 4.14 4.00 5.00 1.00-5.00
Ability to be a self-starter 4.03 4.00 5.00 1.00-5.00
Intelligence 4.00 4.00 4.00 2.00-5.00
Upbringing 3.92 4.00 5.00 1.00-5.00
Personality 3.81 4.00 5.00 1.00-5.00
Positive self-concept 3.70 4.00 3.00 1.00-5.00
School experiences 3.65 4.00 4.00 1.00-5.00
Close friends 3.51 4.00 5.00 1.00-5.00
Structure and rules 3.43 4.00 5.00 1.00-5.00
Teacher(s) 3.22 3.00 3.00 1.00-5.00

54
Table 4.3 (cont.)
Protective Factor Mean Median Mode Range
Physically distance self 3.11 3.00 3.00 1.00-5.00
Faith 3.11 3.00 5.00 1.00-5.00
Parents’ education 3.11 3.00 3.00 1.00-5.00
Caregiver relationship 3.05 3.00 5.00 1.00-5.00
High School Activities 2.97 3.00 2.00 1.00-5.00
Grandparents 2.76 2.00 2.00 1.00-5.00
Siblings 2.68 3.00 1.00 1.00-5.00
Hobbies/Special talents 2.65 3.00 3.00 1.00-5.00
High school mentor(s) 2.54 4.00 4.00 1.00-5.00
Scale based on: 1 = No Influence, 2 = Slightly Influential, 3 = Moderately Influential, 4
= Influential, and 5 = Extremely Influential
Research Objective 3: Describe the protective factors present among the first
generation, low socioeconomic status students by grade classification (sophomore,
junior, and senior).
The researcher conducted an ANOVA test on the protective factors utilizing SPSS
22.0 for Windows. Out of the twenty-three protective factors, teacher(s) (F = 3.15; p =
.05) was the only factor found to be significant. The other twenty-two protective factors
received a significant value greater than .05. Grandparents had a value of .06 (F = 3.01),
followed by close friends (F = 2.72; p = .08), and high school mentor(s) (F = 2.56; p =
.09). The First Scholar participants scored intelligence (F = 2.22) with a significant value
of .12, and then being independent with a significant value of .14 (F = 2.07), followed by
positive self-concept (F = 1.46; p = .25). The significant value of the ability to physically
distance oneself (F = 2.39; p = .26) was next, followed by high school activities (F = .94;
p = .40), and then achieves goals (F = 1.18; p = .32). The protective factors, parents’
education (F = .77) and grandparents (F = .78) both earned a significant value of .47. The
personality (F = .62) protective factor trailed with a significant factor of .55, while
hobbies/special talents (F = .57) scored .57, then the participants’ school experiences (F

55
= .49; p = .62). The next protective factor was siblings (F = .42; p = .66), the ability to
plan for one’s future (F = .29; p = .75), upbringing (F = .21; p = .81), and faith (F = .18;
p = .84). The students scored structure and rules (F = 1.52) with a significant factor of .86
and then the ability to be a self-starter (F = .15; p = .87). The protective factor of the
ability to focus on one’s education (F = .108; p = .90) trailed and lastly, was
responsibilities (F = .02; p = .98).
Table 4.4
ANOVA of Protective Factors by University of Kentucky’s First Scholars (n = 37)
Protective Factor F p
High School Activities .94 .40
Personality .62 .55
Ability to be a self-starter .15 .87
Intelligence 2.22 .12
Physically distance self 1.39 .26
Focus on education .108 .90
Achieve goals 1.18 .32
Hobbies/Special talents .57 .57
Positive self-concept 1.46 .25
Ability to plan for future .29 .75
Faith .18 .84
Upbringing .21 .81
Parents’ education .77 .47
Caregiver relationship .78 .47
Grandparents 3.01 .06
Siblings .42 .66
Being independent 2.07 .14
Structure and rules 1.52 .86
Responsibilities .02 .98
Close friends 2.72 .08
Teacher(s) 3.15 .05*
School experiences .49 .62
High school mentor(s) 2.56 .09
p > 0.05
The researcher described the protective factors by grade classification
(sophomore, junior, and senior) in Table 4.5. Mean and standard deviation were used to
56
describe the question. For each of the twenty-three protective factors, thirteen
sophomores, twelve juniors, and twelve seniors responded.

57
Table 4.5
Central Tendencies of Protective Factors by Grade Level
Sophomore Junior Senior
Protective Factor n M SD n M SD n M SD
High School Activities 13 3.00 1.41 12 2.58 1.38 12 3.33 1.23
Personality 13 3.54 1.33 12 3.92 .79 12 4.00 1.13
Ability to be a self-starter 13 3.92 1.19 12 4.00 1.04 12 4.17 1.19
Intelligence 13 3.62 .87 12 4.17 .83 12 4.25 .75
Physically distance self 13 2.62 1.19 12 3.25 1.48 12 3.50 1.44
Focus on education 13 4.38 .65 12 4.25 .87 12 4.33 .65
Achieve goals 13 4.54 .78 12 4.83 .39 12 4.83 .39
Hobbies/Special talents 13 2.38 1.33 12 2.67 1.07 12 2.92 1.31
Positive self-concept 13 3.62 1.12 12 3.42 1.00 12 4.08 .79
Ability to plan for future 13 4.23 .83 12 4.50 .90 12 4.42 1.00
Faith 13 2.92 1.93 12 3.08 1.62 12 3.33 1.61
Upbringing 13 3.77 1.30 12 3.92 1.38 12 4.08 .90
Parents’ education 13 3.46 1.39 12 2.75 1.48 12 3.08 1.44
Caregiver relationship 13 2.77 1.69 12 2.92 1.68 12 3.50 1.17
Grandparents 13 2.69 1.25 12 2.17 1.28 12 3.42 1.24
Siblings 13 2.54 1.61 12 3.00 1.48 12 2.50 1.38
Being independent 13 3.92 1.19 12 4.67 .65 12 4.17 .83
Structure and rules 13 3.46 1.51 12 3.25 1.66 12 3.58 1.31
Responsibilities 13 4.15 .80 12 4.17 1.19 12 4.08 1.16
Close friends 13 3.08 1.50 12 3.25 1.54 12 4.25 .87
Teacher(s) 13 3.00 1.41 12 2.67 1.54 12 4.00 1.04
School experiences 13 3.62 1.12 12 3.42 1.38 12 3.92 1.24
High school mentor(s) 13 2.62 1.26 12 1.92 1.08 12 3.08 1.44

58
CHAPTER V
SUMMARY, CONCLUSIONS, AND RECOMMENDATIONS
Purpose of the Study
The purpose of this study was to describe the protective factor(s) that contributed
to the first-generation, low socioeconomic status students’ enrollment at The University
of Kentucky.
Research Objectives
The following research objectives and corresponding hypotheses were developed
to be the focus of this study:
1. Describe selected characteristics of the first generation, low socioeconomic status
students. Specifically: gender, race/ethnicity, home residence, grade level, and
GPA.
2. Describe the protective factors present among the first generation, low
socioeconomic status students.
3. Describe the protective factors present among the first generation, low
socioeconomic status students by grade classification (sophomore, junior, and
senior).
HO1: There is no statistically significant difference in the protective
factors by grade classification (sophomore, junior, and senior).
H1: There is a statistically significant difference in the protective factors
by grade classification (sophomore, junior, and senior).
Research Design

59
This study was descriptive and correlational by design. Descriptive research is
used when a researcher wants to examine existing conditions (Fraenkel & Wallen, 2006).
Correlational research is collecting data on two or more variables and examining the
relationship between those variables (Houghton Mifflin Harcourt, 2014). In this study,
the researcher examined which protective factor(s) assisted first-generation, low
socioeconomic status students enrolling in a higher educational institution.
The dependent variable investigated was the effects of low socioeconomic status,
as reported by the First Scholars at the University of Kentucky. The independent
variables were Werner’s (2000) protective factors (see Table 2.1). Protective factors refer
to attributes within the individual and/or environmental influences that allow the
individual to succeed despite their circumstances. In this case, the circumstance would be
growing up in a low socioeconomic status environment.
When conducting a description, correlational study, internal and external validity
must be addressed. Internal validity ensures the data collected and analyzed is accurate
(Michael, 2000). In order to protect internal validity, the researcher must minimize
measurement error by ensuring the instrument is valid and reliable (Michael, 2000).
External validity is the degree “to which the results of a study can be generalized to the
world at large” (Boyd, n.d.). Random sampling technique and maintaining a low dropout
rate of participants improves external validity (Michael, 2000).
Population and Sample
In this study, the population consisted of first-generation, low socioeconomic
status students enrolled at the University of Kentucky’s First Scholars Program in the
2015 – 2016 academic year (N = 51; n = 37). The researcher selected the First Scholars

60
Program because the participants were required to have a financial need and be
considered first-generation (First Scholars, 2014). This qualification helped determine the
participants enrolled in the First Scholars program would also be the sample for this study
(n = 37). However, only three classes (sophomores, juniors, and seniors) were
represented in this study due to lack of funding. There was not a freshmen class recruited
for the 2015 – 2016 school year.
The researcher utilized a convenient sampling method. This method is often used
in exploratory research when a researcher wants to obtain a “gross estimation” in the
most inexpensive way possible (Jackson, 2011; StatPac, 2014). The researcher
determined that face-to-face delivery of the instrument was best in order to maximize
response rate therefore a convenient sample was used. A two-part sampling technique
was used in this study. A cluster sampling technique was used in the data collection
process. Cluster sampling is when the researcher randomly selects “clusters” of the
population that will be in the same place at the same time (StatTrek, 2015). The First
Scholars Program requires participants to attend a monthly meeting in order to receive
benefits, which includes the students’ scholarship (First Scholars, 2014). The researcher
was able to utilize a convenient cluster sampling technique by attending this monthly
meeting to collect data due to the high volume of the sample.
Data Collection
The researcher met with the University of Kentucky’s First Scholars coordinator
to discuss protocol for distributing the questionnaires (see Appendix D). The researcher
and the First Scholars coordinator chose to allow the coordinator to administer the
questionnaires to maximize participation and increase response return time.

61
The researcher provided the coordinator with packets for each participant. Each
packet contained a consent cover letter (see Appendix C) explaining the details of the
study, the “Against the Odds: Protective Factors Questionnaire” (see Appendix D), and
manila envelopes for the questionnaire. The researcher was approved a waiver of
informed consent (see Appendix B) for the participants due to the study presenting no
more than minimal risk and written consent was not required outside of the research
study. After the First Scholars’ coordinator read the consent cover letter aloud, the
participants were given the opportunity to decline participation in the study. The
participants that declined participation in the study were asked to return the packets back
to the coordinator. The remaining participants were instructed to keep the consent cover
letter for their records for future questions or concerns.
Limitations to the Conclusions
This study was limited to the University of Kentucky’s First Scholars Program.
Therefore, the conclusions and recommendations can only be made for UK’s First
Scholar Program. The sample size (n = 37) of this study was minimal due to the lack of
funding and phasing out of this program. If this study was repeated, it is recommended to
examine all seven of the First Scholars Programs at the corresponding universities in
order to maximize response rate and provide conclusions and recommendations about the
First Scholars Program as a whole.
Summary of Research Findings with Conclusions, Recommendations, and
Implications
Research Objective 1: Describe selected characteristics of the first generation, low
socioeconomic status students.

62
The majority of the First Scholar participants identified as White/Caucasian (f =
27; 73.0%). Based upon these findings, it is concluded the majority of the First Scholar
participants are White/Caucasian. Researchers have reported students that are exposed to
ethnical diversity tend to thrive in educational settings (nprEd, 2015). Therefore, it is
recommended the University of Kentucky’s First Scholars Program continue to recruit
ethnically diverse individuals. The implications for recruiting ethnically diverse students
would be exposing the participants to different backgrounds among their peers. The
majority of the participants were female (f = 21; 56.8%). Of the 37 participants, over half
(f = 20; 54.1%) identified their home residence as suburban. Each grade level
(sophomores, juniors, and seniors), excluding freshmen, among the First Scholars was
well represented. Another conclusion is students reported a GPA in the 3.26-3.5 range.
Researchers found students enrolled in collegiate programs/activities perform better
academically than students not enrolled in extra curricular activities (Calcagno, Bailey,
Jenkins, Kienzl, & Leinbach, 2008). Therefore, by continuing programs such as the First
Scholars Program it helps students to stay focused academically. The implication of this
recommendation would be the high-risk students identified in these programs would
continue to stay focused on their studies and have a higher success rate at the collegiate
level.
Research Objective 2: Describe the protective factors present among the first
generation, low socioeconomic status students.
The First Scholar participants evaluated twenty-three protective factors. The
students used a Likert scale (1 = no influence, 2 = slightly influential, 3 = moderately

63
influential, 4 = influential, and 5 = extremely influential) to rank how influential each
factor was on their decision to attend the University of Kentucky.
The First Scholar participants’ results concerning the protective factors were
diverse when it came to how influential each factor was considered. Researchers have
attributed this finding to the diversity among the students’ backgrounds and experiences
(Werner, 1990).
Twenty-nine First Scholars scored achieving goals (78.4%) as extremely
influential. Researchers reported first generation students that enroll in collegiate first-
generation programs stay focused on achieving career goals (Engle, Bermeo, & O’Brien,
2006). It is recommended the First Scholars program continue targeting first-generation
students in order to help them continue achieving their goals. If the First Scholars
program continues targeting first-generation students, then these students will be more
likely to stay focused on their academic goals than their counterparts. The implications
for this recommendation is more first-generation students will be able to earn a college
degree.
Of the participants, 59.5% (f = 22) found the protective factor; the ability to plan
for one’s future, extremely influential. Researchers found students that regularly set goals
for career preparation stay focused on studies more than their counterparts (Massey,
2015). Since the students find value in goal setting, it is recommended the University of
Kentucky’s First Scholars program help the students stay focused on their career
aspirations by performing goal-setting workshops and providing academic advisors. High
school educators can also assist with this recommendation by teaching students the value
of setting goals and how to follow through with their goals. If high school educators offer

64
goal setting workshops to their students, then the students are more prepared when they
reach the collegiate level. The implication of this recommendation is having more well-
prepared, first-generation students entering into college. This will also help programs
such as the First Scholars because the students will already be familiar will how to set
and manage their goals.
Approximately 70.2% of the participants found the protective factor, intelligence,
to be extremely influential or moderately influential in their decision to attend the
University of Kentucky. Researchers have found students with a higher intelligence level
hold themselves to higher standards and expectations when it comes to evaluating college
and career success. These students also tend to have the higher grade point averages in
school as well (Nickerson, Diener, & Scharwz, 2010). Since the majority of First
Scholars participants value education, it is recommended to have educational
opportunities (tutoring, support services, etc.) readily available to them. If the participants
have access to these services, then they will be able to focus and maintain their studies
more easily. The implications of this recommendation are these students focusing on their
grade point averages and remaining competitive with their counterparts in the academic
realm.
Over half of the First Scholars participants (f = 19; 51.4%), found the protective
factor, being independent, extremely influential. This protective factor could potentially
benefit programs like the First Scholars program and their coordinators in the recruitment
of students. If programs such as the First Scholars program, recruit independent students
then the programs will be able to save time and resources motivating these students
because they are already self-motivated. Students that identify as being independent will

65
benefit from these programs because they offer mentoring, tutoring, and workshops that
allow them to continue developing skills such as independence that will help them in the
future.
Approximately 78% of the participants (f = 29) responded to the protective factor
of having responsibilities within their household as influential to their successful
enrollment in college. Researchers have found students’ responsibilities such as
household chores can lead to educational success (Bowen, 2015). It is recommended for
the University of Kentucky to consider evaluating potential students on admission and
scholarship applications based on this attribute. The implication of this recommendation
would be narrowing the gap between the low-socioeconomic status students and their
high-socioeconomic status counterparts. Often low SES students do not have the same
opportunities as the other students due to income. If admission and scholarship
committees begin examining factors such as household responsibilities this would narrow
the gap in enrollment in reference to SES.
Of the thirty-seven First Scholar participants, twenty-six individuals ranked
teachers as being influential in their decision to attend college. Schexnider (2013) found
teachers have more of an impact on students than other factors. It is recommended
teachers serve as club sponsors or mentorship roles in order to continue making
connections with students. If these educators continue serving as a mentor to these
students, then these students will continue to be motivated and inspired to further their
education after high school. This will also help increase the percentage of first-generation
students receiving a college degree.

66
When examining the protective factor faith, approximately half of the students
found it to have no influence or slightly influential (f = 17; 45.9%). However the other
half of the students (f = 18; 48.6%) found faith as extremely or moderately influential in
their decision to attend the University of Kentucky. Researchers have found this to be
consistent when determining if faith contributes to college choice (Kinzie et al., 2004).
This finding could have been for several reasons. Since UK is not a religious based
university, but instead offers many religious organizations for students to explore or not
explore this could have been a recruiting factor for the participants. Also the students
could have a religious friend that helped influence their decision to attend UK. Based on
this finding, it is recommended the First Scholars Program offer faith-based training to
help students explore all faiths and build tolerance. Whether these students are interested
in faith or religion, by exposing them to the different religions will allow them to build
more tolerance to their peers.
Research Objective 3: Describe the protective factors present among the first
generation, low socioeconomic status students by grade classification (sophomore,
junior, and senior)
In research objective three, the researcher sought to describe the protective factors
by grade classification (sophomore, junior, and senior). The researcher reported the
significance of each of the twenty-three protective factors. If the protective factor was
greater than or equal to .05, the factor was considered significant.
Out of the twenty-three protective factors, the only factor that was found to be
significant with a score of .05 was teacher(s). The seniors scored this protective factor the
highest with a mean score of 4.00 (SD = 1.04), followed by the sophomores (M = 3.00;

67
SD = 1.41), and then the juniors (M = 2.67; SD = 1.54). Based upon these findings, it is
concluded the First Scholars found their former teacher(s) to be significant in their
decision to enroll in a postsecondary institution. The ANOVA revealed the seniors’ score
was considered significant. Researchers have concluded the impact teachers have on
students throughout their school years is considered influential (Schexnider, 2013). Due
to this finding, it is recommended teachers continue serving as mentors for students in
and out of the classroom. If the teachers continue to serve in this capacity, the implication
means more high-risk status students will continue to excel after high school because
they had a mentor nurturing them and encouraging them to further their education beyond
high school.
It is also concluded, that the other twenty-two factors were not significant for
several reasons. These reasons include, but are not limited to, the students’ diverse
backgrounds and circumstances they have faced throughout their lifetime (Lotkowski,
Robbins, & Noeth, 2004). It is evident from the findings in objective one that the students
did not grow up with the same background. It is recommended further research be
conducted using a larger sample size to examine the protective factors further. If a larger
sample size was used in a future study, then a researcher could group students by
characteristics and examine if any protective factors were recurring. The implications to
this recommendation would allow researchers and educators to better understand their
students’ backgrounds and what motivates them to excel. If educators had this
information, they would be able to help more low socioeconomic status students achieve
their goals.

68
Lastly, a recommendation is made to the University of Kentucky’s First Scholars
program to diversify opportunities for their clientele. If all first generation programs offer
the same opportunities and require the same criteria for their program then they cannot
service as many students as possible. Although all the students in this study were
considered low socioeconomic status, they did have the same experiences or the same
background (see Table 4.1). By offering different opportunities for these individuals, the
implications would allow more students to benefit academically and socially. The
students would be able to experience the opportunities the programs have to offer. High
school educators would also benefit from these diverse programs because when they are
mentoring low SES students, they would have a support system to recommend their
students seek after high school.
Researcher to Practice
When conducting this study, I never considered the possibility that I would work
in a school system where 100% of the student population received free and/or reduced
lunch. However, this is becoming the reality of more and more school systems today.
This study has opened my eyes to the actual struggles that students face. Often times,
educators get self-involved with how important content and test scores are that we forget
we are dealing with people that have real problems outside of the safe haven we call
school.
One of the main components this study has helped me understand is students’
actions and behaviors. There are so many students that only get a decent meal or have the
luxury of heating and cooling when they come to school. Most of the time we think that
students get attitudes or attempt to sleep in class because they do not care about their

69
studies. However that is not always the case. If there is one lesson I have learned, it is to
always be kind and compassionate because you never know what a person is going
through.
After conducting this study, I have become more aware of what students actually
value and consider influential in their educational achievement. Although not every
student will attend college or even earn a college degree, my goal is to help all students
find a career or learn a trade that they can be proud of and make a decent living at. By
examining protective factors, I am more able to identify what motivates students.
Knowing what motivates someone is half of the struggle of helping him or her succeed.
Once I have made that connection with my students I can help them determine what they
want to do with their future.
This study has opened my eyes to how effective teaching and mentoring can
affect a student’s outcome. I will never again underestimate the influence a teacher has
on a student’s life. I know that I can be that difference if I take the time to reach out and
make a connection. It is that connection that could be all the difference to one student. As
an educator, I now realize how powerful of a profession teaching can be.

70
APPENDIX A:
IRB PROTOCOL APPROVAL
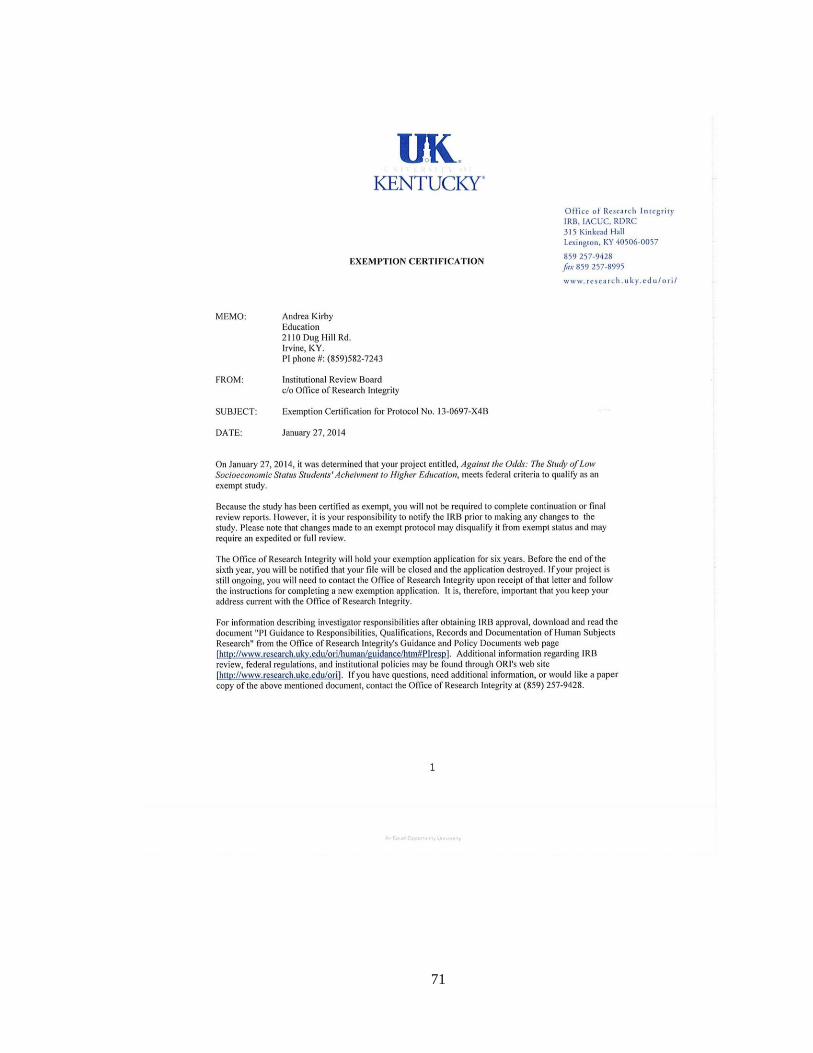
71

72
APPENDIX B:
WAIVE REQUIRMENT FOR DOCUMENTATION OF INFORMED CONSENT

73
Form F
Include in IRB Application to
Waive Requirement for Documentation of Informed Consent
If you are requesting IRB approval for waiver of the requirement for documentation of informed
consent (i.e. telephone survey or mailed survey, internet research, or certain international
research), your research activities must fit into one of two regulatory options:
1) The only record linking the participant and the research would be the consent document, and the principal risk would be potential harm resulting from a breach of confidentiality (i.e., a study that involves participants who use illegal drugs).
2) The research presents no more than minimal risk to the participant and involves no procedures for which written consent is normally required outside of the research context (i.e. a cover letter on a survey, or a phone script).
Check the box next to the option below that best fits your study, and explain in the space
provided how your study meets the criteria for the selected regulatory option.
Note: The IRB cannot waive the requirement for documentation or alter the consent form for
FDA-regulated research unless it meets Option #2 below. FDA does not accept Option #1.
Note: Even if a waiver of the requirement for documentation is approved by the IRB, participants
must still be provided oral or written (e.g., cover letter) information including all required and
appropriate elements of consent.
Option 1
a) The only record linking the participant and the research would be the consent document.
b) The principal risk would be potential harm resulting from a breach of confidentiality (i.e., a study that involves participants who use illegal drugs).
Under these conditions, each participant must be asked whether (s)he wants to sign a consent
form; if the participant agrees to sign a consent form, only an IRB approved version should be
used.

74
Option 2
a) The research presents no more than minimal risk to the participant.
The questionnaire does not contain private or sensitive questions and will be confidential.
b) The research involves no procedures for which written consent is normally required outside
of the research context (i.e. a cover letter on a survey, or a phone script).
A written cover letter including all required and appropriate elements of consent to the
participants.

75
APPENDIX C:
CONSENT COVER LETTER

76
September 15, 2015
First Scholars Program
University of Kentucky
Dear Participants,
I am a Master’s candidate in the agricultural education program at the University of Kentucky.
Dr. Stacy K. Vincent from the Community and Leadership Development Department serves as
my faculty advisor. As a partial fulfillment to complete my degree, I am conducting a study
entitled, “Against the Odds: The Study of Low Socioeconomic Status Students’ Achievement to
Higher Education”. My research objectives are to identify the factors that influenced you to enroll
at the University of Kentucky. I will also be examining the saliency of each of these factors. I
would like your expertise as participants in the First Scholars Program. I am asking for your
cooperation to complete a questionnaire. The questionnaires should take approximately 15-20
minutes to complete. All responses will remain confidential.
Participation in this study is completely voluntary and you will not be penalized in any way for
not participating. If you choose to participate, you may discontinue or skip questions at any time.
There are no known risks to participating in this study.
I appreciate your cooperation with this study and look forward to working with you. If you have
any questions about the study, please contact the lead investigator, Andrea Taylor Kirby by email
at [email protected] or at 859-582-7243.
If you have complaints, suggestions, or questions about your rights as a researcher volunteer,
contact the staff in the University of Kentucky Office of Research Integrity at 859-257-9428 or
toll-free at 1-866-400-9428. Please keep this letter for your records, incase you need to contact
the University of Kentucky Office of Research Integrity or myself.
Thank you,
Andrea Taylor Kirby, GRA
Agricultural Education
University of Kentucky
(859) 582-7243

77
APPENDIX D:
AGAINST THE ODDS: PROTECTIVE FACTORS QUESTIONNAIRE

78
Factors Contributing to the Enrollment at the
University of Kentucky
Part I
Directions: Please use the scale from 1 to 5, (1-no influence, 2-slighly influential, 3-
moderately influential, 4-influential, 5-extremely influential) concerning the influence
each factor had on your enrollment at the University of Kentucky [UK].
How have each of the following factors
(1–23) contributed to your enrollment
at UK?
No I
nfl
uen
ce
Sli
gh
tly
Infl
uen
tial
Mod
erate
ly
Infl
uen
tia
l
Infl
uen
tial
Extr
emel
y
Infl
uen
tial
1. High school activities 1 2 3 4 5
2. Personality 1 2 3 4 5
3. Ability to be a self-starter 1 2 3 4 5
4. Intelligence
1 2 3 4 5
5. Ability to physically distance myself
from others 1 2 3 4 5
6. Ability to focus on my education 1 2 3 4 5
7. Determination to achieve my goals
1 2 3 4 5
8. Hobbies/special talents 1 2 3 4 5
9. Positive self-concept 1 2 3 4 5
10. Ability to plan for my future 1 2 3 4 5
11. Faith 1 2 3 4 5

79
Factor
No I
nfl
uen
ce
Sli
gh
tly I
nfl
uen
tial
Mod
erate
ly
Infl
uen
tial
Infl
uen
tial
Extr
emel
y
Infl
uen
tial
12. Upbringing 1 2 3 4 5
13. Parents’ education 1 2 3 4 5
14. A close relationship with a caregiver
(does not have to be biological) 1 2 3 4 5
15. Grandparents 1 2 3 4 5
16. Siblings 1 2 3 4 5
17. Being independent 1 2 3 4 5
18. Structure and rules in my household 1 2 3 4 5
19. Responsibilities 1 2 3 4 5
20. Close friends 1 2 3 4 5
21. Teacher(s) 1 2 3 4 5
22. School experiences 1 2 3 4 5
23. High school mentor(s) 1 2 3 4 5
Part II
Directions: Please complete the following demographic characteristics about yourself.
24. What is your gender?
Male Female
25. What is your grade level?
Freshmen Junior
Sophomore Senior

80
26. What is your estimated GPA?
Above 4.00 3.26-3.5 Below 2.0
3.75-4.00 3.01-3.25
3.51-3.74 2.0-3.0
27. What is your race/ethnicity?
White/Caucasian
Black/African-American
Hispanic/Latino
Other, Please Specify
28. Which best describes your home residence?
Rural (less than 2,500)
Suburban (2,501 – 49,999)
Urban (50,000 or more)
29. Out of the 23 factors listed on the previous page, which do you feel influenced your
enrollment at the University of Kentucky the most?
Answer:
30. Out of the 23 factors listed on the previous page, which do you feel influenced your
enrollment at the University of Kentucky the least?
Answer:
31. Please utilize the space below to provide any additional comments/concerns that you
may have in regards to this study:

81
Thank you for participating!
Any questions concerning this questionnaire may be directed to:
Andrea Taylor Kirby
(859) 582-7243

82
APPENDIX E:
EMAIL CORRESPONDENCE WITH DR. EMMY E. WERNER

83
From: Emmy Werner [[email protected]] Sent: Wednesday, July 25, 2012 4:38 PM To: Taylor, Andrea L Subject: RE: Research Project Question Dear Andrea, The instruments we used are in the Appendices of our last three books. Sincerely, Emmy Werner Good afternoon! My name is Andrea Kirby and I am currently a graduate research assistant at the University of Kentucky, under the guidance of Dr. Stacy Vincent. I am in the beginning stages of my thesis and I have immersed myself in your research. I too am passionate about at-risk students; more specifically, students of low socioeconomic statuses and the adversities these students face is my research area of interest. I am interested in how these students overcome obstacles and obtain success by attending college. Your resilience/protective factors theory is currently serving as my guiding theory. I was wondering if there would be anyway to get a copy of the questionnaire you used in your protective factors research? Also, if you have any advice for a young researcher I would be more than glad to hear it! I realize that time is irreplaceable for you. However, I do appreciate you taking the time to read and consider my request. If you have any concerns or questions, you can contact me via email or phone. Good luck in your future endeavors! Best, Andrea Taylor Kirby Graduate Assistant University of Kentucky Dept. of Community & Leadership Development 307 Garrigus Building Lexington, KY 40546 (859) 582-7243 [email protected]<mailto:[email protected]>

84
REFERENCES
Advisory Committee on Student Financial Assistance. (2010). The rising price of
inequality: How inadequate grant aid limits college access and persistence.
Retrieved from http://chronicle.com/items/biz/pdf/acsfa_rpi.pdf
American Psychological Association. (2014). Education and socioeconomic status.
Retrieved from https://www.apa.org/pi/ses/resources/publications/factsheet-
education.aspx
American Psychological Association. (2014). The road to resilience. Psychology Help
Center (pp. 1-9). Retrieved from http://www.apa.org/helpcenter/road-
resilience.aspx
Anthony, E. J., & Cohler, B. J. (1987). The invulnerable child. New York, NY: Guilford
Press.
Association, A. (2007). What is Resilience?. Psych Central. Retrieved on January 25,
2014, from http://psychcentral.com/lib/what-is-resilience/0001145
Astin, A. W. (1993). What matters in college? Liberal Education, 79(4), 1-12.
Astin, A. W., & Osequera, L. (2004). The declining “equity” of American higher
education. The Review of Higher Education, 27, 321-341.
doi:10.1353/rhe.2004.0001
Auwarter, A. E., & Aruguete, M. S. (2008). Counselors perceptions of students who vary
in gender and socioeconomic status. Social Psychology of Education, 11, 389-
395. doi:10.1007/s11218-008-9056-0
Bailey, T., Calcagno, J. C., Jenkins, D., Kienzl, G., & Leinbach T. (2008). Community
college student success: What institutional characteristics make a difference?

85
Economics of Education Review, 27, 632-645.
doi:10.1016/j.econedurev.2007.07.003
Barkan, S. E. (2012). The measurement and extent of poverty. Retrieved from
http://catalog.flatworldknowledge.com/bookhub/reader/3064?e=barkansoc_1.0-
ch10_s01#barkansoc_1.0-ch02_s01
Bello, M. (2014). No victory in war on poverty in eastern Kentucky. USA Today.
Retrieved from http://www.usatoday.com/story/news/nation/2014/01/25/war-on-
poverty-50th-anniversary/4326109/
Bowen, V. (2015). Children doing chores can lead to future successes. Arkansas
Catholic. Retrieved from http://www.arkansas-
catholic.org/news/article/4214/Children-doing-chores-can-lead-to-future-
successes
Boyd, N. (n.d.). What is external validity in research? – Definition & examples.
Retrieved from http://education-portal.com/academy/lesson/what-is-external-
validity-in-research-definition-examples.html
Bradley, R. H., & Corwyn, R. F. (2005). Caring for children around the world: A view
from HOME. International Journal of Behavioral Development 6, 468-478.
Calcagno, J. C., Bailey, T., Jenkins, D., Kienzl, G., & Leinbach, T. (2008). Community
college student success: what institutional characteristics make a difference?
Economics of Education Review, 27(6), 632-645.
Coleman, J. S. (1966). Equality of educational opportunity (Report No. OE-3800).
Washington, DC: National Center for Educational Statistics.

86
Dubow, E. F., Boxer, P., & Huesmann, L. R. (2009). Long-term effects of parents’
education on children’s educational and occupational success: Mediation by
family interactions, child aggression, and teenage aspirations. Merrill Palmer Q
(Wayne State University Press), 55(3), 224-249. doi: 10.1353/mpq.0.0030
eSchool Today. (2010). Types of poverty. Retrieved from
http://www.eschooltoday.com/poverty-in-the-world/types-of-poverty.html
Engle, J., Bermeo, A., & O’Brien, C. (2006). Straight from the source: What works for
first-generation college students. The Pell Institute for the Study of Opportunity in
Higher Education. Retrieved from https://www.tgslc.org/pdf/files-
sfts_what_works.pdf
Esters, L. T. (2007). Career indecision of students enrolled in a college of agriculture and
life sciences. Journal of Agricultural Education, 48(4), 130-141. doi:
10.5032/jae.2007.04130
Federal Education Budget Project. (2014). Pell Grant program overview. Retrieved from
http://febp.newamerica.net/background-analysis/federal-pell-grant-program
Fisher, D. (2012). Poor students are the real victims of college discrimination. Retrieved
from http://www.forbes.com/sites/danielfisher/2012/05/02/poor-students-are-the-
real-victims-of-college-discrimination/
Field, A. (2000). Discovering statistics using SPSS for Windows: Advanced techniques of
the beginning user. London, England: Sage.
First Scholars. (2014). First Scholars at University of Kentucky. Retrieved from
https://jfe.qualtrics.com/form/SV_bEM7AY1EsO3g5vv
Fraenkel, J., & Wallen, N. (2006). How to design and evaluate research in education (6th
ed.). New York, NY: McGraw-Hill.

87
Garmezy, N. (1971). Vulnerability research and the issues of primary prevention.
American Journal of Orthopsychiatry, 41, 101-116.
Geegan, S. (2012). UK first scholars meet with benefactors, Eric and Deb Suder.
UKNOW. Retrieved from http://uknow.uky.edu/content/uk-first-scholars-meet-
benefactors-eric-and-deb-suder
Gladwell, M. (2008). Outliers: The story of success. New York, NY: Little, Brown and
Company.
Glasow, P. A. (2005). Fundamentals of survey research methodology. Retrieved from
http://www.uky.edu/~kdbrad2/EPE619/Handouts/SurveyResearchReading.pdf
Hahn, A. (2012). ‘First scholars” program benefactors visits students. Southern Illinois
University Foundation. Retrieved from https://www.siuf.org/2012/11/07/first-
scholars-program-benefactors-visit-students-2/
Hahns-Vaughn, D. (2004). The impact of parents’ education on college students: An
analysis using the beginning postsecondary students longitudinal study. Journal of
College Student Development, 45(5), 483-500. Retrieved from
http://eric.ed.gov/?id=EJ743860
Harlow, T. (2009). Norman Garmezy, resilience theory pioneer. Star Tribune. Retrieved
from http://www.startribune.com/obituaries/74195507.html
Hayhurst, J., Hunter, J. A., Kafka, S., & Boyes, M. (2013). Enhancing resilience in youth
through a 10-day developmental voyage. Journal of Adventure Education and
Outdoor Learning, 15(1), 40-52.
Higher Education Act of 1965. (1965). Amended, U.S.C. 400(a).
Houghton Mifflin Harcourt. (2014). Descriptive/correlation research. Retrieved from

88
http://www.cliffsnotes.com/sciences/psychology/psychology/research-methods-
in-psychology/descriptivecorrelational-research
Ishiyama, J. (2007). Expectations and perceptions of undergraduate research mentoring:
Comparing first-generation, low income white/Caucasian and African American
students. College Student Journal, 41, 540-549.
Jackson, S. L. (2011). Research method and statistics: A critical approach. 4th Edition
Cengage Learning.
Johnson, L. B. (1964). First state of the union address. Retrieved from
http://www.americanrhetoric.com/speeches/lbj1964stateoftheunion.htm
Johnson, L. B. (1964). "Remarks Upon Signing the Economic Opportunity Act." August
20, 1964. Online by Gerhard Peters and John T. Woolley, The American
Presidency Project. http://www.presidency.ucsb.edu/ws/?pid=26452.
Kinzie, J., Palmer, M., Hayek, J., Hossler, D., Jacob, S. A., & Cummings, H. (2004).
Fifty years of college choice: Social, political, and institutional influences on the
decision-making process. Lumina Foundation for Education, 5(3), 1-66.
Retrieved from https://www.luminafoundation.org/files/publications/Hossler.pdf
Lee, S. M., Daniels, M. H., Newgent, R. A., & Nam, S. K. (2008). A data-based model to
predict postsecondary educational attainment of low-socioeconomic-status
students. Professional School Counseling, 11, 306-316. doi:10.5330/PSC.n.2010-
11.306
Leppel, K., Williams, M. L., & Waldauer, C. (2001). The impact of parental occupation
and socioeconomic status on choice of college major. Journal of Family and
Economic Issues, 22, 373-394. Retrieved from The impact of parental occupation

89
and socioeconomic status on choice of college major
Lotkowski, V. A., Robbins, S. B., & Noeth, R. J. (2004). The role of academic and non-
academic factors in improving college retention. ACT Policy Report. Retrieved
from https://www.act.org/research/policymakers/pdf/college_retention.pdf
Lubienski, S. T. (2002). Good intentions were not enough: Lower SES students’ struggles
to learn mathematics through problem solving. Lessons Learned from Research.
(August 2002). 171-178.
Luthar, S. S. (2003). Resilience and vulnerability: Adaptation in the contest of childhood
adversities. New York: Cambridge University Press.
Luthar SS, Cicchetti D, Becker B. (2000). The construct of resilience: a critical
evaluation and guidelines for future work. Child Dev., 13(3), 543–562. doi:
10.1111/1467-8624.00164.
Ma, Y. (2009). Family socioeconomic status, parental involvement, and college major
choices-gender, race/ethnic, and nativity patterns. Sociological Perspectives, 52,
211-234. doi:10.1525/sop.2009.52.2.211
Martin, M. (personal communication, September 16, 2015).
Massey, T. (2015). Motivating college students: Do students do all they can to succeed?
Cengage Learning: Engagement and Motivation. Retrieved from
http://blog.cengage.com/motivating-college-students-do-students-do-all-they-can-
to-succeed/
Masten, A. S. (2001). Ordinary magic: Resilience processes in development. American
Psychologist, 56(3), 227-238. doi: 10.1037/0003-066X.56.3.227
Masten, A. S., & Powell, J. L. (2003). A resilience framework for research, policy, and

90
practice. In S. S. Luthar (Ed), Resilience and vulnerability: Adaptation in the
context of childhood adversities (pp. 1-25). Cambridge: Cambridge University
Press.
Matthews, D. (2014). Everything you need to know about the war on poverty. Retrieved
from http://www.washingtonpost.com/blogs/wonkblog/wp/2014/01/08/
everything- you-need-to-know-about-the-war-on-poverty/
McWhirter, E. H. (1997). Perceived barriers to education and career: Ethnic and gender
differences. Journal of Vocational Behavior, 50, 124-140. Retrieved from
http://www.wallnetwork.ca/inequity/mcwhirter.pdf
Michael, R. S. (2000). Threats to internal & external validity. Retrieved from
http://www.indiana.edu/~educy520/sec5982/week_9/520in_ex_validity.pdf
Moschetti, R. (2012). First Scholars supporting research. The Suder Foundation.
Retrieved from http://firstscholars.org/wp-
content/uploads/2013/03/First_Scholars_Supporting_Research_2012-08-21.pdf
Moschetti, R., & Hudley, C. (2008). Measuring social capital among first-generation and
non-first-generation, working-class, white, males. Journal of College Admissions:
25-30. Retrieved from http://files.eric.ed.gov/fulltext/EJ829418.pdf
Mundel, D., & L. D. Rice. (2008). The impact of increases in Pell Grant awards on
college-going among lower income youth. Retrieved from
http://www.brookings.edu/research/papers/2008/11/12-pell-grants-rice
nprEd. (2015). The evidence that white children benefit from integrated schools.
Retrieved from http://www.npr.org/sections/ed/2015/10/19/446085513/the-
evidence-that-white-children-benefit-from-integrated-schools

91
National Association of Student Financial Aid Administrators [NASFAA]. (2012). Issue
brief: The role of Pell Grants in access, persistence & completion.
National Poverty Center. (2014). Poverty facts. Retrieved from
http://www.npc.umich.edu/poverty/
Nickerson, C., Diener, E., & Schwarz, N. (2010). Positive affect and college success. J
Happiness Studies. doi: 10.1007/s10902-010-9224-8
Office of Superintendent of Public Instruction. (2014). Elementary and Secondary
Education Act (ESEA). Retrieved from http://www.k12.wa.us/Esea/default.aspx
Perna, L. W., & Titus, M. A. (2005). The relationship between parental involvement as
social capital and college enrollment: An examination of racial/ethnic group
differences. Retrieved from http://repository.upenn.edu/gse_pubs/14
Persell, C. H. (2010). Social class and educational equality. In. J. A. Banks & C. A. M.
Banks (7th Ed.), Multicultural education issues and perspectives (pp. 84-106).
Hoboken, NJ: John Wiley & Sons.
Phelan, C. & Wren, J. (2006). Exploring reliability in academic assessment. Retrieved
from https://www.uni.edu/chfasoa/reliabilityandvalidity.htm
Pike, G. R., & Kuh, G. D. (2005). A typology of student engagement for American
colleges and universities. Research in Higher Education, 46(2), 185-209. doi:
10.1007/s 11162-004-1599-0
Reason, R. D. (2009). Student variables that predict retention: Recent research and new
developments. NASPA Journal, 46, 482-501. Retrieved from
http://journals.naspa.org/cgi/viewcontent.cgi?article=5022
Rutter, M. (1999). Resilience concepts and findings: Implications for family therapy.

92
Journal of Family Therapy 21: 119-144.
Salant, P. & Dillman, D. (1994). How to conduct your own survey. NY: John Wiley &
Sons, Inc.
Santos, J. R. A. (1999). Cronbach’s alpha: A tool for assessing the reliability of scales.
Journal of Extension [On-line], 37(2) Article 2TOT3. Retrieved from
http://www.joe.org/joe/1999/april/tt3.php
Schexnider, M. (2013). Measuring teacher quality: Do teachers impact students’ adult
outcomes? Chicago Policy Review. Retrieved from
http://chicagopolicyreview.org/2013/10/22/measuring-teacher-quality-do-
teachers-impact-students-adult-outcomes-2/
Seccombe, K. (2012). Families and their social worlds. Boston, MA: Pearson Education,
Inc.
Stats. (n.d.). Stats: Two-way anova. Retrieved from
https://people.richland.edu/james/lecture/m170/ch13-2wy.html
StatPac. (2014). Survey sampling methods. Retrieved from
https://www.statpac.com/surveys/sampling.htm
StatTrek. (2015). Teach yourself statistics. Retrieved from http://stattrek.com/survey-
research/cluster-sampling.aspx
Statwing. (2015). T-Test (independent samples) Retrieved from
http://docs.statwing.com/examples-and-definitions/t-test/
Stewart, E. B. (2008). School structural characteristics, student effort, peer associations,
93
and parental involvement: The influence of school – and individual-level factors
on academic achievement. Education and Urban Society 40(2), 179-204. doi:
10.1177/0013124507304167
Student Support Services [SSS]. (2014). Diversity: Student support services TRiO.
Retrieved from http://www.uky.edu/Diversity/SSS/
Swell, W. H., & Shah, V. P. (1967). Socioeconomic status, intelligence, and the
attainment of higher education. American Journal of Sociology, 40, 1-23.
Retrieved from http://jstor.org/stable/2112184
Swell, W. H., & Shah, V. P. (1968). Social class, parental encouragement, and
educational aspirations. American Journal of Sociology, 73, 559-572. Retrieved
from http://www.jstor.org/stable/2775558
The World Bank. (2011). Urban poverty and slum upgrading. Urban Poverty: An
Overview. Retrieved from
http://web.worldbank.org/WBSITE/EXTERNAL/TOPICS/EXTURBANDEVEL
OPMENT/EXTURBANPOVERTY/0,,contentMDK:20227679~menuPK:717370
4~pagePK:148956~piPK:216618~theSitePK:341325,00.html
Thieman, E. B., Marx, A. A., & Kitchel, T. (2012). Resilient agricultural educators:
Taking stress to the next level. Journal of Agricultural Education 53(1), 81-94.
doi: 10.5032/jae.2012.01081
Thomas, J., & Stockton, C. (2003). Socioeconomic status, race, gender, & retention:
Impact on student achievement. Essays in Education, 7. Retrieved from
http://www.usca.edu/essays/vol72003/stockton.pdf
Tinto, V. (2006). Research and practice of student retention: What next? Journal of

94
College Student Retention, 8(1), 1-19. Retrieved from
http://faculty.soe.syr.edu/vtinto/Files/Student%20Retention-What%20Next_.pdf
Trochim, W. M. K. (2006). Types of reliability. Retrieved from
http://www.socialresearchmethods.net/kb/reltypes.php
Trusty, J., Robinson, C. R., Plata, M., & Ng, K. (2000). Effects of gender, socioeconomic
status, and early academic performance on postsecondary educational choice.
Journal of Counseling & Development, 78, 463-472. Retrieved from
United States Census Bureau. (2012). How the Census Bureau measures poverty.
Retrieved from http://www.census.gov/hhes/www/poverty/about/overview/
measure.html
United States Census Bureau. (2013). Poverty: 1960, 1970, 1980, and 1990 Censuses.
Retrieved from http://www.census.gov/hhes/www/poverty/data/census/1960/
United States Department of Agriculture. (2013). Supplemental Nutrition Assistance
Program (SNAP). Retrieved from http://www.fns.usda.gov/snap/short-history-
snap
United States Department of Agriculture. (2015). Economic Research Service. Retrieved
from http://www.ers.usda.gov/topics/rural-economy-population/rural-poverty-
well-being.aspx
United States Department of Labor. (2014). Employment projections. Retrieved from
http://www.bls.gov/emp/ep_chart_001.htm
University of Delaware. (n.d.). What is social class? Retrieved from
http://udel.edu/~cmarks/What%20is%20social%20class.htm
University of Kentucky. (2014). I’m first. Retrieved from

95
http://www.imfirst.org/university-of-kentucky/#.VEjdHb5YW-_
Walpole, M. (2003). Socioeconomic status and college: How SES affects college
experiences and outcomes. The Review of Higher Education, 27, 45-73.
doi:10.1353/rhe.2003.0044
Werner, E. E. (1990). Protective factors and individual resilience. Handbook for early
childhood intervention (pp. 115-132). Retrieved from
http://www.healthychild.ucla.edu/wp/pdf/Werner.pdf
Werner, E. E. (1995). Resilience in development. Current Directions in Psychological
Science, 4(3), 81-85. Retrieved from http://www.jstor.org/stable/20182335
Werner, E. E. (2000). Protective factors and individual resilience. In S. J. Meisels & J. P.
Shonkoff (Eds.), Handbook of Early Childhood Interventions (115-132).
Werner, E. E., & Smith, R. S. (1982). Vulnerable but invincible: A study of resilient
children. New York: McGraw-Hill.
Werner, E. E., & Smith, R. S. (1989). Vulnerable but invincible: A longitudinal study of
resilient children and youth. New York: Adams Bannister Cox.
Werner, E. E., & Smith, R. S. (1992). Overcoming the odds: High risk children from
birth to adulthood. Ithaca, NY: Cornell University Press.
Werner, E. E., & Smith, R. S. (2001). Journeys from childhood to midlife: Risk,
resilience and recovery. Ithaca, NY: Cornell University Press.
WestEd. (2004). Resilience: A universal capacity. What we have learned (pp. 7-10).
Wright, M. O., Masten, A. S, & Narayan, A. J. (2013). Resilience processes in
96
development: Four waves of research on positive adaption in the context of
adversity. Handbook of Resilience in Children, 15-37. doi: 10.1007/978-1-4614-
3661-4_2

97
VITA
Name: Andrea Taylor Kirby
Educational institutions attended: University of Kentucky, May 8, 2011
Bachelors of Science in Career and Technical Education – Agricultural Education and
Minor in Animal Sciences
Leadership Certification – Turner Leadership Academy
Publications:
Vincent, S. K., Kirby, A. T., Deeds, J. P., & Faulkner, P. E. (2014). The evaluation of
multicultural teaching concerns among pre-service teachers in the South.
Journal of Agricultural Education, 55(1), 152-166. doi: 10.5032/jae.2014.01152
Vincent, S. K. & Kirby, A. T. (2015). Words speak louder than actions: A mixed-
methods case study. Journal of Agricultural Education, 56(1), 32-42. doi:
10.5032/jae.2015.01032