agagliate, jacopo and lefering, ina and mckee, david (2018
TRANSCRIPT
Agagliate, Jacopo and Lefering, Ina and McKee, David (2018) Forward
modeling of inherent optical properties from flow cytometry estimates of
particle size and refractive index. Applied Optics, 57 (8). pp. 1777-1788.
ISSN 1559-128X , http://dx.doi.org/10.1364/AO.57.001777
This version is available at https://strathprints.strath.ac.uk/63430/
Strathprints is designed to allow users to access the research output of the University of
Strathclyde. Unless otherwise explicitly stated on the manuscript, Copyright © and Moral Rights
for the papers on this site are retained by the individual authors and/or other copyright owners.
Please check the manuscript for details of any other licences that may have been applied. You
may not engage in further distribution of the material for any profitmaking activities or any
commercial gain. You may freely distribute both the url (https://strathprints.strath.ac.uk/) and the
content of this paper for research or private study, educational, or not-for-profit purposes without
prior permission or charge.
Any correspondence concerning this service should be sent to the Strathprints administrator:
The Strathprints institutional repository (https://strathprints.strath.ac.uk) is a digital archive of University of Strathclyde research
outputs. It has been developed to disseminate open access research outputs, expose data about those outputs, and enable the
management and persistent access to Strathclyde's intellectual output.
CORE Metadata, citation and similar papers at core.ac.uk
Provided by University of Strathclyde Institutional Repository

Fラヴ┘;ヴS マラSWノノキミェ ラa キミエWヴWミデ ラヮデキI;ノ ヮヴラヮWヴデキWゲ aヴラマ aノラ┘ I┞デラマWデヴ┞ Wゲデキマ;デWゲ ラa ヮ;ヴデキIノW ゲキ┣W ;ミS ヴWaヴ;Iデキ┗W キミSW┝ JACOPO AGAGLIATE,
1 INA LEFERING,
1 DAVID MCKEE
1,*
1 Department of Physics, University of Strathclyde, 107 Rottenrow, Glasgow, G4 0NG, Scotland
*Corresponding author: [email protected]
Received XX Month XXXX; revised XX Month, XXXX; accepted XX Month XXXX; posted XX Month XXXX (Doc. ID XXXXX); published XX Month XXXX
A Mie-based forward modelling procedure was developed to reconstruct bulk inherent optical properties (IOPs)
from particle size distributions (PSDs) and real refractive index distributions (PRIDs) obtained using a previously
developed flow cytometric (FC) method [1]. Given the available PSDs, extrapolations for the particle fraction
outside the detection limits of the method and a complex refractive index input (with real part nr directly estimated
and imaginary part ni adapted from literature separately for organic and inorganic components), the model
produces volume scattering functions which are integrated to produce scattering and backscattering coefficients,
and absorption efficiencies which are used to calculate absorption coefficients. The procedure was applied to PSDs
and PRIDs derived from natural samples retrieved in UK coastal waters and analysed using a CytoSense flow
cytometer (CytoBuoy b.v., Netherlands). Optical closure analysis was carried out between reconstructed IOPs and
in situ IOPs measured using an ac-9 spectrophotometer and a BB9 backscattering meter (WET Labs Inc., OR) in the
same waters. The procedure is shown to achieve broad agreement with particulate scattering (bp) and
backscattering (bbp) (RMS%E: 35.3% and 44.5% respectively) and to a lesser degree with backscattering ratio (෩)
(RMS%E: 77%). The procedure however generally overestimated particulate absorption (ap) (RMS%E: 202.3%).
This degree of closure was dependent on applying recently developed scattering error corrections to both
absorption and attenuation in situ measurements. Not only do these results indirectly validate the FC method as a
useful tool for PSD and PRID determination in natural particle populations, they also suggest that Mie theory may
be a sufficient model for bulk IOP determination, with previously reported difficulties potentially being caused by
inadequately corrected IOP measurements. Finally, in a feature unique to the FC method, the concurrent size and
refractive index retrieval enabled assessment of the relative contributions that organic vs. inorganic, fluorescent
vs. non-fluorescent fractions of the particle populations had on the IOPs, and identified which size classes had the
largest influence on each of these properties. © 2017 Optical Society of America
OCIS codes: (010.1030) Absorption; (010.4450) Oceanic optics; (120.4640) Optical instruments; (290.4020) Mie theory; (290.5850) Scattering,
particles; (350.4990) Particles.
http://dx.doi.org/10.1364/AO.99.099999
1. INTRODUCTION
The optically significant constituents of seawater are often
characterized using a small number of proxy material types e.g.
phytoplankton, detritus and coloured dissolved organic material. In
reality, each of these proxies contains sub-populations that would
potentially be of great interest if it were possible to separate their
contributions to bulk optical signals. In practice there is limited scope
to experimentally partition inherent optical properties (IOPs) to e.g.
species level. For example, chemical processing of filter pad absorption
enables partitioning of particulate absorption into components
associated with pigments and a remainder that is typically associated
with detritus [2,3]. It is currently not feasible to achieve even this level
of partitioning experimentally for scattering and backscattering data.
In contrast, flow cytometry (FC) provides very rapid analysis of
individual particles and ability to characterize concentrations of sub-
populations within mixed natural samples. In ocean science, the focus
has traditionally been on using this technology to examine biological
particles, primarily algal populations, with fluorescence signals used to
trigger data collection and particle sizing limited at the low end by laser
beam width. Ackleson & Spinrad and Green et al. [4,5] pioneered an
approach to extract additional size and refractive index information for
small particles using a Mie inversion scheme. This approach has
seldom been adopted since, potentially because it has been difficult to
scale up to bulk observations such as IOPs and remote sensing signals.
More recently, Davies et al. [6] have shown that the size class (sub-
micron to ~10 µm) that the Ackleson & Spinrad approach provides is
also responsible for the bulk of scattering and backscattering under
typical oceanic conditions where the particle size is well characterized
by a Junge distribution. At roughly the same time, there have been
significant improvements in correction methods for in situ IOP
measurements, with McKee et al. [7] providing a means to correct both
absorption and attenuation measurements for scattering collection
angle errors. These have been shown to be particularly significant for
attenuation signals and subsequently for estimates of scattering
coefficient, with corrected values being as much as a factor of two
greater than original, uncorrected data.
This level of potential error in measured scattering data raises the
intriguing possibility that previous attempts to relate particle size
distributions to bulk optical signals using Mie theory may have failed at
least in part due to limitations in the quality of the scattering data used
to test the quality of modelled values.
The Ackleson-Green Mie-inversion approach to flow cytometry has
recently been revisited by Duforêt-Gaurier et al. and Moutier et al. [8,9],
with significant success in determining forward, sideward and
backward scattering cross sections in the case of polystyrene standard
beads and of two morphologically different phytoplankton species,
respectively. In addition, Agagliate et al. [1] have presented a new
interpretation of the technique, and demonstrated successful closure
between estimated and expected size and refractive indices in various
suspensions of polystyrene standard beads and oil droplets (within the
sub-micron to ~10 µm operational range), and between flow
cytometry-derived and independent particle size distribution (PSD)
estimates using in situ LISST instruments (Sequoia Scientific Inc.) for a
set of natural seawater samples, at least in terms of PSD slope and
other major features.
Building on these recent successes, the aim of this study is to assess
the extent to which the PSDs and particle real refractive index
distributions (PRIDs) produced by the FC approach can be used to
reconstruct bulk IOPs using Mie forward modeling. For this to be
successful, several key factors would have to come together: 1. PSDs
and PRIDs from the FC approach (with suitable extrapolation) need to
reflect optically relevant characteristics of natural particle populations;
2. The IOPs used to assess the performance of the modelling need to be
both sufficient and consistent with the modelling approach i.e. take
account of angular collection limitations of the sensors and correct
appropriately; and 3. Mie theory has to adequately capture the
scattering characteristics of randomly oriented, geometrically complex
natural particle populations. As well as potentially revealing
fundamentally important understanding of the mutual consistency of
several measurement and modelling approaches, success here would
validate the PSDs and PRIDs derived from flow cytometry.
Furthermore, this would potentially open a new route to establish the
contribution of sub-populations of particles to bulk IOPs, including
scattering signals; indeed, only very few alternatives are currently
available for this, e.g. Zhang et al. [10]. The knowledge of bulk IOPs is
important to understand the marine environment, as they inform
radiative transfer models, primary production models and ocean
colour remote sensing algorithms. The ability to partition these bulk
values into individual contributions would further this understanding,
and may eventually be scaled up to relate remote sensing signals to
specific particle classes.
Two IOPs are fundamental in the sense that all others can be
derived from them: the spectral absorption coefficient, a, and the
spectral volume scattering function (VSF), が. The spectral absorption
coefficient a represents the wavelength-dependent fraction of light
absorbed within a unit volume per unit of distance travelled in the
medium, where ぢ is the wavelength. The spectral volume scattering
function が represents the wavelength-dependent polar angular
distribution of scattered intensity per unit of incident irradiance per
unit volume, i.e. how much light is scattered into each angle, in bulk, by the water┸ with the angle ranging from zero to ぱ radians ゅwhere zero is the direction of the incident light). The most important physical
properties of the particle population to affect particulate IOPs are the
size and complex refractive index of the particles. These are however
also difficult to accurately determine over the entire range of optically
relevant sizes.
The complex refractive index (n) is at the core of scattering and
absorption. Light is scattered at the interface between mediums with
differing real parts of the refractive index (nr), while absorption of light
is determined by the imaginary part of the refractive index (ni) of a
medium. At the same time, the complex refractive index of particles is
difficult to determine in the case of mixed populations: in most cases
experimental results produce bulk values for a whole assemblage of
particles, and most literature values are given for monotypic particle
suspensions or provide an average for a whole population. Relevant
examples of the methods used in literature for real refractive index
retrieval include techniques such as immersion of particles in various
media until scattering disappears [11,12]; bulk derivation from volume
scattering functions and size distributions [13,14]; and bulk derivation
from attenuation and absorption efficiencies [15-17]. Further bulk
methods include the algorithm developed by Twardowski et al. [18]
and the anomalous diffraction method [19,20] which has also the
advantage of calculating a value for the imaginary part of the refractive
index. Values for the imaginary part of the refractive index are
otherwise quite sparse in literature, e.g. [21,22].
Information about the size of the particles present in a suspension is
conveyed as a particle size distribution. PSDs represent the
concentration of particles within each size class of the particle
population. These classes are somewhat arbitrary subdivisions based on a definition of ╉size╊┸ which can be variably represented through
volume, equivalent area or relevant length of each particle. The choice
is most often guided by either the context of the study, the shape of the
particles or the nature of available measurements. PSDs are difficult to
determine completely due to the wide range of optically relevant sizes,
spanning from tens of nanometres to a few millimetres [6,23]. Most
studies rely on some parametrization of the PSD, of which the most
common form in the case of natural waters is the power law or Jungian
distribution [24], adopted following studies which found small
particles far outnumber large particles in the sea [25-27]. A power law
distribution is an open-ended, logarithmically linear spectrum, with ill-
defined average size and average concentration always close to that of
the smallest size considered. Other techniques involve the
reconstruction of PSDs, either via inversion of the volume scattering
function, e.g. using laser diffractometers such as the LISST series of
instruments [28-30] which use Mie theory to calculate the scattering
kernel relating energy received by the detectors to the number density
of particles, or by iterative reconstruction of the measured VSF via
modelled contribution of log-normal particle populations [10]. Overall,
availability and reliability of PSD and RI determinations are still largely
open to improvement, despite their fundamental influence on optical
properties.
In recent work carried out on natural water samples obtained
during a research cruise in UK coastal waters (UKCW dataset), a flow
cytometric method based on the original approach by Ackleson &
Spinrad [4] was developed to provide particle by particle estimation of
size and real refractive index, allowing for the determination of organic,
inorganic, and fluorescent fractions within the total particle population
and the assessment of the relative prevalence of particle sizes within
each [1]. By simulating scattering within the flow cytometer through
Mie theory and establishing a correspondence between real and
simulated particles through standards of known size and refractive
index, this FC method converts flow cytometric forward scattering
(FWS) and side scattering (SWS) values into particle diameters and
real refractive indices, providing PSDs retrieved by direct assessment
of particle size and, uniquely, particle refractive index distributions.
Similarly to what PSDs do with particle size, these PRIDs represent the
concentration of particles within each real refractive index class of the
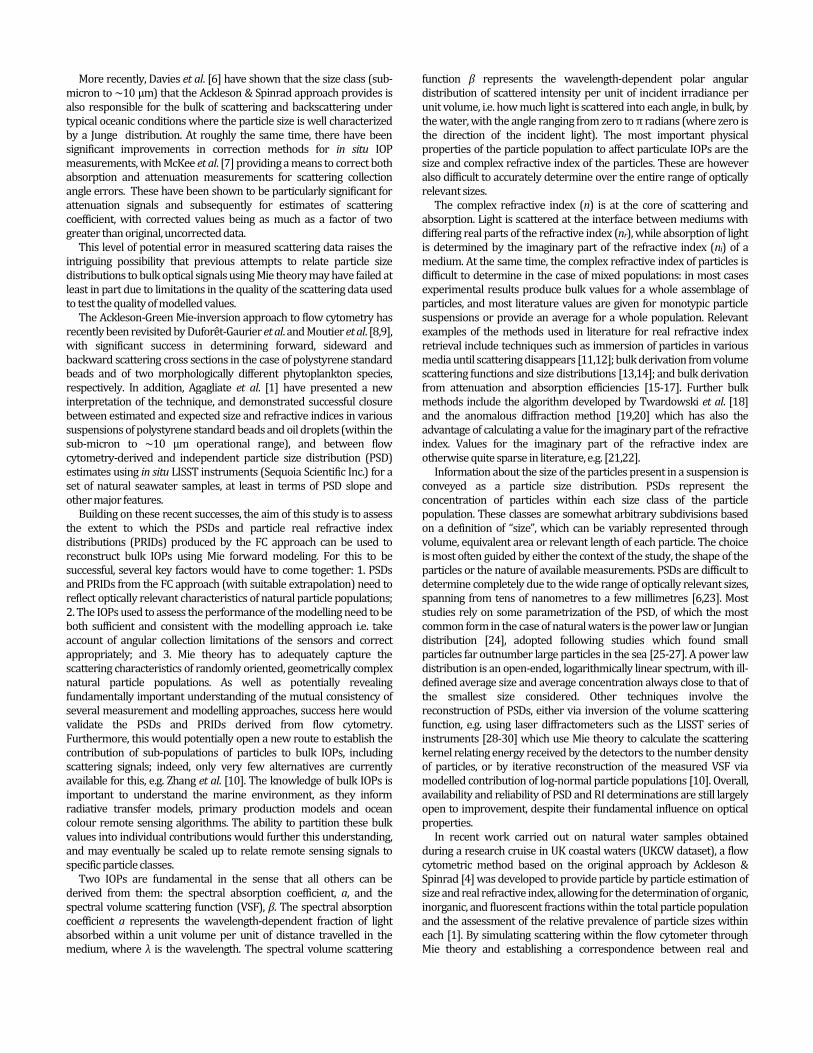
particle population. The research cruise (HE442) took place between
the 4th and 21st of April 2015 on board the RV Heincke, and consisted
of sixty-two stations sampled across a variety of Case 1 and Case 2
waters around the coast of the UK (Fig. 1). This resulted in a total of 50
natural water samples with complete sets of FC data and matching
data from other instruments. This included backscattering, attenuation
and absorption values retrieved using an ac-9 absorption and
attenuation meter and a BB9 backscattering meter.
Fig. 1. Track of the HE442 research cruise, which took place in April
2015 in UK coastal waters aboard RV Heincke. Out of the 62
measurement stations visited a total of 50 complete sets of data were
retrieved, matching flow cytometric data and ancillary measurements
(light grey circles). Dark grey circles denote stations where two
samples were taken. The dataset was divided into area groupings to
highlight regional behaviour in the metadata and the measured IOPs.
In clockwise order: Bristol Channel (BC), Irish Sea (IS), Loch Fyne and
Firth of Clyde (Fy), Hebrides and Skye (Heb), North Atlantic - Orkneys
(Or) and North Sea (NS).
In this study, optical models of scattering were coupled to the UKCW
dataset, making the reconstruction of bulk IOP estimates and, more
importantly, of the fractional contribution of each particle
subpopulation to total IOPs possible. Since the FC-determined PSDs
only cover part of the optically relevant diameter range (0.05-2000 づm) [6], extrapolations were needed to account for the particle fraction
outside the detection limits of the FC method. Complex refractive
indices were then formed by combining the directly estimated PRIDs
with imaginary refractive indices adapted from literature for both
organic and inorganic components [22]. Once the appropriate PSDs
and complex refractive indices were established for the entire optically
relevant particle population, a Mie forward model produced volume
scattering functions which were integrated to produce scattering and
backscattering coefficients, and absorption efficiencies which were
used to calculate an absorption coefficient.
These modelled IOPs were validated against independent
absorption, scattering and backscattering measurements, providing
insight into the effects of the particle population composition on the
optical properties of water. Mutual consistency would also represent a
step towards optical closure, i.e. the successful agreement of modelled
and/or measured parameters between independent measuring
techniques. Ultimately this could extend to prediction and
interpretation of remote sensing signals, with all parts founded on
well-established physical principles.
2. THEORY
The foundation of Mie forward modelling rests on the additive
nature of the inherent optical properties: all IOPs are the result of the
sum of the single contributions from each of the individual constituents
of a water volume. The axially symmetrical total particulate VSF in
particular is expressed as
,),('),(),( , dDdnnDNnDp (1)
where ߚǡሺߠǡ ሻ is the VSF contribution of a single particle ofߣ
diameter D and complex refractive index n and ܰԢሺܦǡ ݊ሻ is the
corresponding value of the density function of the number
concentration of particles. The PSDs and PRIDs determined by the FC
method exist however not as density functions but as discrete
collections of bins, each containing a number of particles
corresponding to specific D and nr values. Therefore, eq. (1) is more
properly expressed as
nD
nDp nDN,
, ),,(),(),( (2)
where ܰǡ is the total number concentration of particles within the
PSD × PRID matrix bin corresponding to diameter D and complex
refractive index n (once an imaginary component ni is associated to nr
as will be described in the Methods section). By way of the results of
Mie theory [31,32] eq. (2) can then be ultimately rewritten as
nD
nD
nDnD
p Nk
ii
,
,2
,;2,;1,
))()((
2
1),(
(3)
where k = 2ぱ/ぢ is the wave number and i1(ず) and i2(ず) are scattering
amplitude functions. The latter are the core quantities to be
determined in any Mie scattering problem, and are fundamentally
dependent on the diameter and refractive index of each particle [31].
The i1(ず) and i2(ず) functions are thus calculated for each D and n pair,
then multiplied by the corresponding ܰǡ value, and ultimately
summed over all D and n combinations following Eq. (3) to obtain the
total particulate VSF. Finally, total particulate scattering (bp) and
backscattering (bbp) coefficients are calculated by integrating the total
particulate VSF over the appropriate angle ranges, i.e. 0°-180° for the
former and 90°-180° for the latter (where ず = 0° indicates the forward
direction). The total particulate backscattering ratio ( ෨ܾ) is given
simply as the ratio of bp and bbp.
Mie theory can be also used to calculate the efficiency factors for
attenuation and scattering, which in turn define the absorption
efficiency factor through simple subtraction. The absorption efficiency
factor can be then used to define the spectral absorption coefficient of a
single spherical particle as
),(4
)( ,
2
ia
i
i QD
a
(4)

where Di is the diameter of the particle and ܳǡሺߣሻ the absorption
efficiency of the particle. Analogously to eq. (2), the total particulate
absorption (ap) is now simply defined as the sum of contributions from
all particles,
,)(4
)()( ,
,
,
,
2
,
,
, nD
nD
nD
ia
i
nD
nD
nDp NQD
Naa
(5)
where ܽǡሺߠǡ ሻ is the absorption contribution of a single particle ofߣ
diameter D and complex refractive index n and ܰǡ is the total
number concentration of particles within the corresponding PSD ×
PRID matrix bin.
All Mie forward modelling calculations were handled using an
independently developed MATLAB script, building upon the FASTMie
code developed by Slade [33] to calculate the scattering amplitude
functions ݅ ଵሺߠሻ and ݅ ଶሺߠሻ. 3. METHODS
Mie-based forward optical modelling was applied to the PSDs and
PRIDs determined by the FC method for the UKCW dataset of natural
seawater samples, which can be found described in detail in [1]. A
description of the dataset and of the measurement protocols
(particularly those relative to absorption, attenuation and
backscattering measurements) is summarised below. IOPs obtained by
forward modelling from FC data were compared with corresponding
absorption, scattering and backscattering coefficients determined by
ac-9 and BB9 instruments (WET Labs Inc., OR). In all cases, 532 nm
was used as the wavelength of choice for IOP calculations, as it is a
green wavelength near the centre of the visible spectrum and one
shared by both ac-9 and BB9 instruments without any need for
interpolation. Resulting IOPs were then further separated into
individual contributions from fluorescent/organic/inorganic fractions
and from different size classes.
A. Depth profiling
Depth profiling was performed using an instrument frame equipped
with Niskin bottles for sample retrieval and with both ac-9 and BB9
sensors. The frame was lowered into water at each of the stations to
measure a profile, and was then kept near surface for water sampling.
At a few stations, additional samples from deeper waters were taken.
BB9 and ac-9 instruments logged data throughout the procedure. The
samples were taken from the Niskin bottles on the frame as quickly as
possible after the frame was back on deck and filled into 10-liter plastic
containers. In waters with high turbidity the Niskin bottles were
flushed twice to avoid settling out of particulate matter. 48 out of the
50 samples of the UKCW dataset are surface samples (max. depth: 7
m), with further two samples taken from bottom depths instead.
B. Flow cytometry measurement protocol
All samples were analysed using a CytoSense flow cytometer
(CytoBuoy b.v., Netherlands) once for each of four sensitivity settings of
the side scattering photomultiplier tube (PMT), for 6 minutes and at a
flow rate of 0.5 µL/s. The end of each measurement was triggered after
a set time rather than after the collection of a certain number of
particles. The number of collected particles (typically ranging between
orders of magnitude 103 and 105 depending on local population
density and PMT setting used) thus varied from sample to sample as
the instrument was left counting until the end of the allotted time. Side
scattering was used as the trigger channel in all cases. Additional
measurements of standard polymer beads were taken daily across the
whole sampling period, and were used to calibrate the FC method by
relating the resulting FWS and SWS values to the known diameters and
refractive index of the standard particles. Once such relationship is
established, a look-up table can be calculated to reconstruct (D, n) pairs
from each (FWS, SWS) combination, thus collectively providing a PSD
and a PRID for each sample. A detailed description of the FC method
and of the procedure followed to reconstruct PSDs and PRIDs can be
found in [1], where the application of the method to the UKCW dataset
is also discussed specifically.
C. UKCW PSDs and PRIDs
The PSDs retrieved by the FC method for the UKCW dataset broadly
follow power law distributions, with the main difference between
stations being the overall concentration of the particle population (Fig.
2a).
Fig. 2. Collective view of (a) all 50 UKCW PSDs and (b) UKCW PRIDs
produced by the FC method. Note that real refractive index values
above 1.15 (dotted line) are not precise, but still indicate high refractive
indices.
Two obvious outliers are present, corresponding to samples from
the turbid waters of the Bristol Channel; close inspection reveals
structures that may be closer in nature to models such as the double gamma distribution proposed by Risović [34], and that indeed may be
identified to a lesser degree in the other samples as well. Nonetheless,
the power law approach remains a reasonable approximation for a
large majority of the dataset, and was used when extrapolating the
concentration of particles outside the size range of the FC method.
PRIDs retrieved by the FC method for the UKCW dataset are fairly
homogeneous in shape across all samples (Fig. 2b), with distribution
peaks found between 1.05-1.15 and within expectations for the nr
values of the most common components of marine particle
populations [18,35]. A tail of particles with nr > 1.15 is observed in all
samples, with median concentrations 5 to 10 times lower than peak
ones. Due to the difficulty of unambiguously retrieving high nr values
[1], real refractive index values above 1.15 are not to be interpreted as
precise, but still positively indicate high refractive indices.
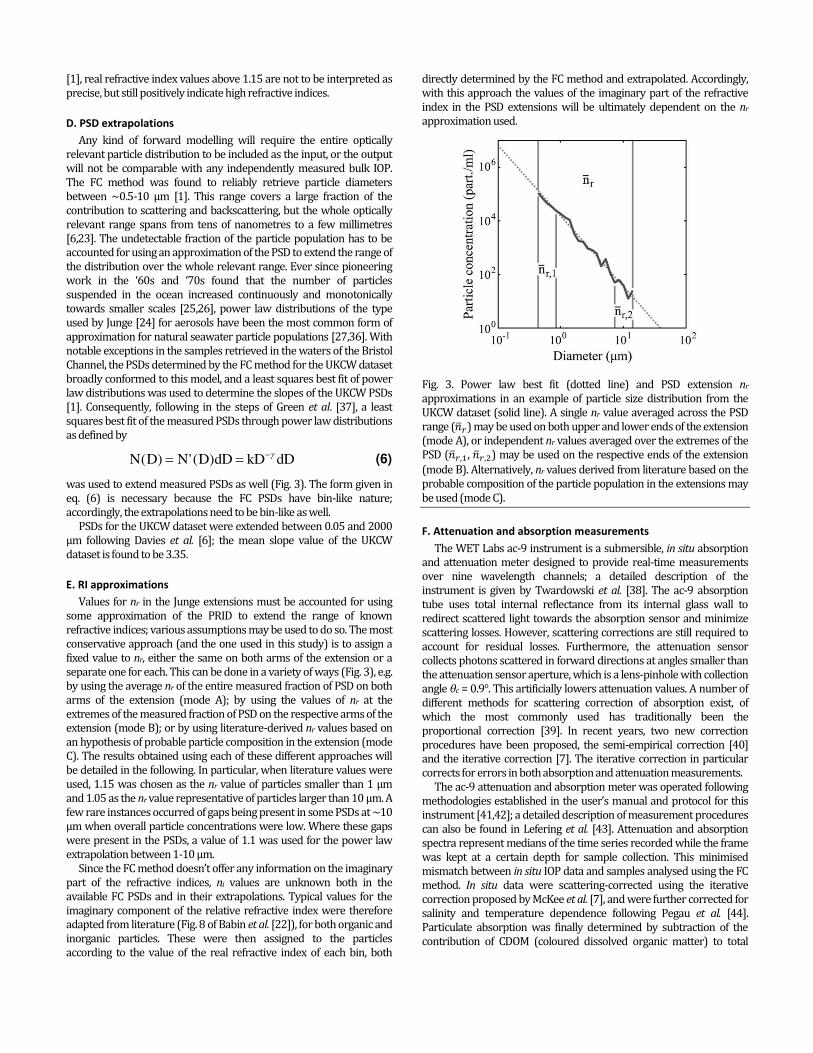
D. PSD extrapolations
Any kind of forward modelling will require the entire optically
relevant particle distribution to be included as the input, or the output
will not be comparable with any independently measured bulk IOP.
The FC method was found to reliably retrieve particle diameters
between ~0.5-10 µm [1]. This range covers a large fraction of the
contribution to scattering and backscattering, but the whole optically
relevant range spans from tens of nanometres to a few millimetres
[6,23]. The undetectable fraction of the particle population has to be
accounted for using an approximation of the PSD to extend the range of
the distribution over the whole relevant range. Ever since pioneering work in the ╅はどs and ╅ばどs found that the number of particles suspended in the ocean increased continuously and monotonically
towards smaller scales [25,26], power law distributions of the type
used by Junge [24] for aerosols have been the most common form of
approximation for natural seawater particle populations [27,36]. With
notable exceptions in the samples retrieved in the waters of the Bristol
Channel, the PSDs determined by the FC method for the UKCW dataset
broadly conformed to this model, and a least squares best fit of power
law distributions was used to determine the slopes of the UKCW PSDs
[1]. Consequently, following in the steps of Green et al. [37], a least
squares best fit of the measured PSDs through power law distributions
as defined by
dDkDdDDNDN )(')( (6)
was used to extend measured PSDs as well (Fig. 3). The form given in
eq. (6) is necessary because the FC PSDs have bin-like nature;
accordingly, the extrapolations need to be bin-like as well.
PSDs for the UKCW dataset were extended between 0.05 and 2000
µm following Davies et al. [6]; the mean slope value of the UKCW
dataset is found to be 3.35.
E. RI approximations
Values for nr in the Junge extensions must be accounted for using
some approximation of the PRID to extend the range of known
refractive indices; various assumptions may be used to do so. The most
conservative approach (and the one used in this study) is to assign a
fixed value to nr, either the same on both arms of the extension or a
separate one for each. This can be done in a variety of ways (Fig. 3), e.g.
by using the average nr of the entire measured fraction of PSD on both
arms of the extension (mode A); by using the values of nr at the
extremes of the measured fraction of PSD on the respective arms of the
extension (mode B); or by using literature-derived nr values based on
an hypothesis of probable particle composition in the extension (mode
C). The results obtained using each of these different approaches will
be detailed in the following. In particular, when literature values were
used, 1.15 was chosen as the nr value of particles smaller than 1 µm
and 1.05 as the nr value representative of particles larger than 10 µm. A
few rare instances occurred of gaps being present in some PSDs at ~10
µm when overall particle concentrations were low. Where these gaps
were present in the PSDs, a value of 1.1 was used for the power law
extrapolation between 1-10 µm. Since the FC method doesn╆t offer any information on the imaginary part of the refractive indices, ni values are unknown both in the
available FC PSDs and in their extrapolations. Typical values for the
imaginary component of the relative refractive index were therefore
adapted from literature (Fig. 8 of Babin et al. [22]), for both organic and
inorganic particles. These were then assigned to the particles
according to the value of the real refractive index of each bin, both
directly determined by the FC method and extrapolated. Accordingly,
with this approach the values of the imaginary part of the refractive
index in the PSD extensions will be ultimately dependent on the nr
approximation used.
Fig. 3. Power law best fit (dotted line) and PSD extension nr
approximations in an example of particle size distribution from the
UKCW dataset (solid line). A single nr value averaged across the PSD
range ( ത݊) may be used on both upper and lower ends of the extension
(mode A), or independent nr values averaged over the extremes of the
PSD ( ത݊ǡଵ, ത݊ǡଶ) may be used on the respective ends of the extension
(mode B). Alternatively, nr values derived from literature based on the
probable composition of the particle population in the extensions may
be used (mode C).
F. Attenuation and absorption measurements
The WET Labs ac-9 instrument is a submersible, in situ absorption
and attenuation meter designed to provide real-time measurements
over nine wavelength channels; a detailed description of the
instrument is given by Twardowski et al. [38]. The ac-9 absorption
tube uses total internal reflectance from its internal glass wall to
redirect scattered light towards the absorption sensor and minimize
scattering losses. However, scattering corrections are still required to
account for residual losses. Furthermore, the attenuation sensor
collects photons scattered in forward directions at angles smaller than
the attenuation sensor aperture, which is a lens-pinhole with collection
angle ずc = 0.9°. This artificially lowers attenuation values. A number of
different methods for scattering correction of absorption exist, of
which the most commonly used has traditionally been the
proportional correction [39]. In recent years, two new correction
procedures have been proposed, the semi-empirical correction [40]
and the iterative correction [7]. The iterative correction in particular
corrects for errors in both absorption and attenuation measurements.
The ac-9 attenuation and absorption meter was operated following methodologies established in the user╆s manual and protocol for this instrument [41,42]; a detailed description of measurement procedures
can also be found in Lefering et al. [43]. Attenuation and absorption
spectra represent medians of the time series recorded while the frame
was kept at a certain depth for sample collection. This minimised
mismatch between in situ IOP data and samples analysed using the FC
method. In situ data were scattering-corrected using the iterative
correction proposed by McKee et al. [7], and were further corrected for
salinity and temperature dependence following Pegau et al. [44].
Particulate absorption was finally determined by subtraction of the
contribution of CDOM (coloured dissolved organic matter) to total

absorption, as determined using the long path-length liquid waveguide
capillary cell technique (LWCC) [45].
G. Backscattering measurements
The WET Labs BB9 instrument is a submersible, in situ
backscattering sensor which similarly to the ac-9 is designed to
provide real-time measurements over nine wavelength channels. A
thorough review and description of the principles behind
backscattering measurements can be found in Sullivan et al. [46]. In
essence, modern backscattering sensors like the BB9 are VSF meters.
They take advantage of a peculiarity of scattering phase functions,
which are observed to have low variability in their shape at backwards
angles [47], leading to the determination of conversion factors capable
of providing estimates of backscattering bb values from single measurements of the VSF at backward angles┸ known as ぽ factors [48,49]. BB9 backscattering measurements need to be corrected for
absorption over the pathlength of the beam used to illuminate the
sample. This makes concurrent ac-9/BB9 measurements important.
As with the ac-9, the BB9 was operated following procedures established in the user╆s manual for the instrument [50].
Backscattering data was corrected for pathlength absorption using ac-
9 absorption data, itself scattering-corrected using the proportional
correction [39] and averaged over the measurement period. In turn,
the BB9 backscattering data was used to inform the iterative
correction procedure used for ac-9 absorption and attenuation, which
explains why pathlength absorption was corrected using ac-9 data
corrected with the proportional rather than the iterative method.
4. RESULTS
Tab. 1 presents the results of the comparison between IOPs as
determined by Mie forward modelling for the UKCW dataset and IOP
values measured by ac-9 and BB9 instruments. Mode B (independent
nr values averaged over the extremes of the PSD ) was found to provide
the best overall retrieval of IOPs among the three modes of nr
approximation in the PSD extensions, and corresponding results are
shown in Fig. 4; all further results presented in the following
correspond to this nr approximation as well. The quality of the
agreement was evaluated as the root mean square percentage error
(RMS%E) calculated over the differences between modelled and
measured values (i.e. compared to the 1:1 line). Retrieval of IOPs was
found to be variable, with trends to either underestimate or
overestimate the values retrieved by ac-9 and BB9. Nonetheless,
overall agreement is good for particulate scattering and backscattering
(RMS%E: 35.3% and 44.5% respectively), with the particulate
backscattering ratio demonstrating lower agreement as expected due
to the negative impact of compounding errors by taking ratios
(RMS%E: 77%). Modelled absorption values generally overestimated
ac-9 particulate absorption (RMS%E: 202.3%): while the agreement
here is poor, absorption was expected to be the least successful among
the 4 reconstructed IOPs due to its reliance on crude approximations
for ni values. Varying agreement of FC and in situ IOPs can to some
extent be attributed to uncertainties in the in situ determinations.
Recent work by Lefering et al. [43], however, demonstrates the high
quality of IOP measurements by the largely successful reconstruction
of photosynthetically available radiation (PAR) and remote sensing
reflectance (Rrs) values through radiative transfer models informed by
ac-9 and BB9 values.
When considering the sample-by-sample ratio of modelled FC IOPs
vs. measured IOPs, different behaviours were observed for each of the
IOPs. FC absorption displayed large variance across the entire dataset
(Fig. 5a), while FC scattering was generally lower than ac-9 scattering,
with disagreement progressively increasing in later samples (Fig. 5b).
This could represent a breakdown in the performance of the ac-9
iterative correction used to correct ac-9 data under algal bloom
conditions, possibly as a consequence of deviations from the Fournier-
Forand phase function that underpins the method [7].
RMS%E
IOP Mode A Mode B Mode C
Absorption 199.5 202.3 209.7
Scattering 34.3 35.3 35
Backscattering 60.1 44.5 48.9
Backscattering ratio 112.7 77 94.3
Tab. 1. Agreement between modelled and measured IOPs for the
UKCW dataset for each of the three modes of nr approximation (see
section 3.E), expressed as root mean square percentage errors
(RMS%E) given relative to the 1:1 line. Mode A: a single nr value
averaged across the PSD range ( ത݊) is applied to both upper and lower
ends of the power law extrapolation. Mode B: independent nr values
averaged over the extremes of the PSD ( ത݊ǡଵ, ത݊ǡଶ) are applied to the
respective ends of the power law extrapolation. Mode C: nr values
derived from literature and based on the probable composition of the
particle population a e applied to the power law extrapolation.

Fig. 4. Optical closure analysis of the UKCW dataset for Mode B of nr approximation in the Junge extensions for (a) absorption, (b) scattering, (c)
backscattering and (d) backscattering ratio.
Fig. 5. FC vs. in situ IOP ratios for (a) the particulate absorption coefficient, (b) the particulate scattering coefficient, (c) the particulate backscattering
coefficient and (d) the particulate backscattering ratio. The vertical lines reflect the regional groupings presented in Fig. 1. Note that the first two data
points for BB9 backscattering and in situ backscattering ratio are missing because of saturation in the BB9 backscattering meter.

Fig. 6. (a) Relative abundance of the inorganic and organic (fluorescent and non-fluorescent) fractions of the total particle populations, and
contribution of each of these population fractions to (b) total absorption, (c) scattering and (d) backscattering coefficients. The vertical lines reflect
the regional groupings presented in Fig. 1.
FC backscattering was generally lower than BB9 backscattering,
with larger disagreement in the Irish Sea, Orkneys and North Sea
samples (Fig. 5c). FC backscattering ratios (Fig. 5d) generally replicated
the pattern displayed by the backscattering data (Fig. 5c). For bp, bbp
and ෨ܾ samples from the Firth of Clyde and the Hebrides were seen to
produce results which were consistently closer to the validation IOPs.
The capability of the FC method to determine the size and real
refractive index of each particle, combined with the ability to detect
fluorescence, enabled analysis of the individual contribution of
fluorescent and non-fluorescent organic and inorganic fractions of the
particle population to the IOPs, although limited to the effective size
detection range of the method. Across the 50 samples in the UKCW
dataset, inorganic particles were seen to account for particle
population fractions ranging from 16.6% to 62.2% of the total, with an
average value of 43% (Fig. 6a). Samples from the Bristol Channel and
the Irish Sea displayed the largest inorganic content, while later
samples collected west of Orkney and from the North Sea were
generally dominated by organic particles. Fluorescent organic particles
were found to account for a small fraction of the particle population
(0.1-15.6%), lower than 5% in most samples. The organic fraction was
seen to have a strong influence on both absorption and scattering, with
fraction contributions between 18.9-93.7% and 23-82.6% of the total
respectively across the UKCW dataset (Fig. 6b-c). Lowest organic
contributions came from the Irish Sea and (particularly) from the
Bristol Channel. Fluorescent organic content was also observed to have
significant impact on ap and bp despite its small population fraction,
with contribution values as high as 73.9% and 53.8% respectively and
generally higher than 20% in a large number of samples. Once again,
the Irish Sea and Bristol Channel samples (where the fluorescent
content was found to be numerically negligible) displayed the lowest
fluorescent fraction contribution to both IOPs. In contrast,
backscattering was found to be largely dominated by the inorganic
fraction of the particle population, with values ranging from 63.3% to
93.1% of the contribution (Fig. 6d).
The reason behind the different observed fractional IOP
contributions rests in the different response that the IOPs have to
particles of the same size, as demonstrated when the individual IOP
contribution of the measured FC fraction of the PSD is compared to
those induced by the upper and lower PSD extensions (i.e. large and
small particles respectively). Particulate absorption (Fig. 7a) was found
to be dominated by large particles above ~ 10 m (27.1-98.1%), with
only minor contribution from particles smaller than ~0.5 m (0.1-
12.1%). Particulate scattering (Fig. 7b) was found to be
overwhelmingly influenced by particles larger than ~0.5 m (92.1-
99.9% of the contribution), with a non-negligible contribution from
particles larger than ~10 m (3.3-80.6%). Finally, backscattering bb
(Fig. 7c) was found to be largely influenced by particles smaller than
~10 m (53.4-99.4% of the contribution), with a sizeable influence
from particles smaller than ~0.5 m (1.4-49.9%). Considering these results, the large inorganic contribution to the
total backscattering shown in Fig. 6d may be interpreted to suggest
that small particles in the UKCW dataset were mostly of inorganic
nature; it should be noted however that the lower diameter detection
limit of the FC method is slightly higher for organic particles than it is
for inorganic particles, because given equal diameters a higher
refractive index produces a higher side scattering signal [1]. Therefore,
organic number densities fall off slightly earlier than inorganic as
diameters approach the detection limit. Although all care was taken to
minimise this spurious effect, it is likely that some part of the bbp
fraction of Fig. 6d was caused by it.
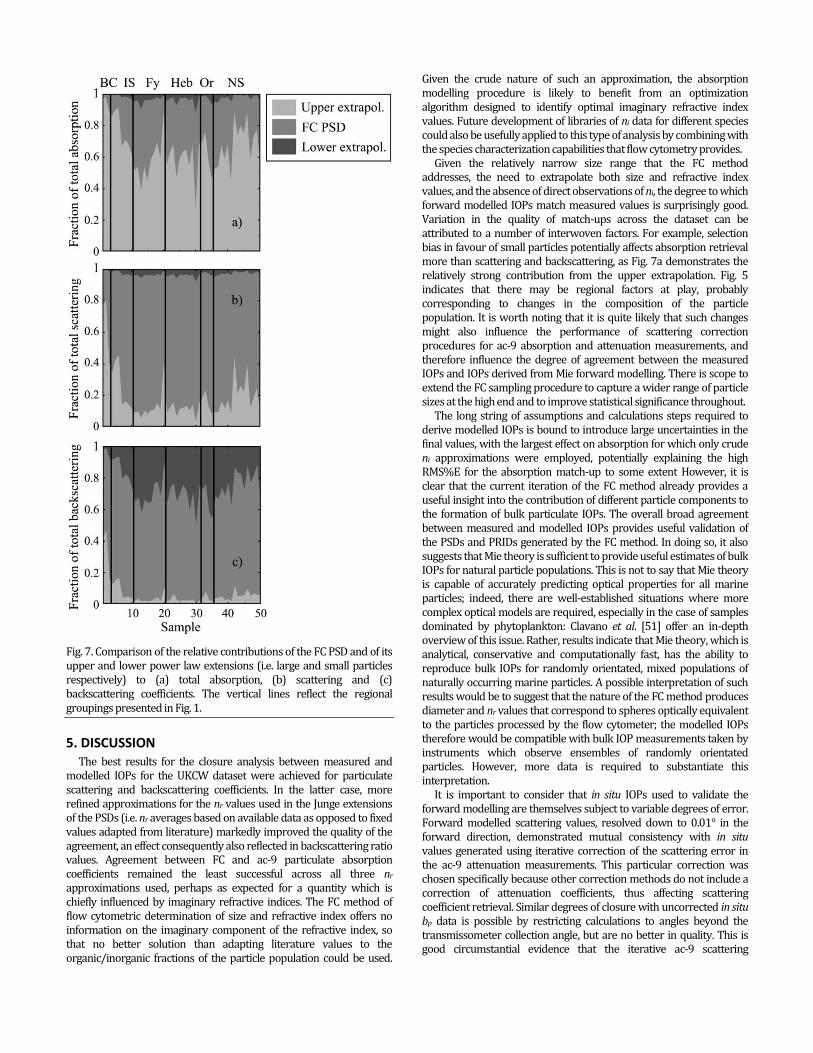
Fig. 7. Comparison of the relative contributions of the FC PSD and of its
upper and lower power law extensions (i.e. large and small particles
respectively) to (a) total absorption, (b) scattering and (c)
backscattering coefficients. The vertical lines reflect the regional
groupings presented in Fig. 1.
5. DISCUSSION
The best results for the closure analysis between measured and
modelled IOPs for the UKCW dataset were achieved for particulate
scattering and backscattering coefficients. In the latter case, more
refined approximations for the nr values used in the Junge extensions
of the PSDs (i.e. nr averages based on available data as opposed to fixed
values adapted from literature) markedly improved the quality of the
agreement, an effect consequently also reflected in backscattering ratio
values. Agreement between FC and ac-9 particulate absorption
coefficients remained the least successful across all three nr
approximations used, perhaps as expected for a quantity which is
chiefly influenced by imaginary refractive indices. The FC method of
flow cytometric determination of size and refractive index offers no
information on the imaginary component of the refractive index, so
that no better solution than adapting literature values to the
organic/inorganic fractions of the particle population could be used.
Given the crude nature of such an approximation, the absorption
modelling procedure is likely to benefit from an optimization
algorithm designed to identify optimal imaginary refractive index
values. Future development of libraries of ni data for different species
could also be usefully applied to this type of analysis by combining with
the species characterization capabilities that flow cytometry provides.
Given the relatively narrow size range that the FC method
addresses, the need to extrapolate both size and refractive index
values, and the absence of direct observations of ni, the degree to which
forward modelled IOPs match measured values is surprisingly good.
Variation in the quality of match-ups across the dataset can be
attributed to a number of interwoven factors. For example, selection
bias in favour of small particles potentially affects absorption retrieval
more than scattering and backscattering, as Fig. 7a demonstrates the
relatively strong contribution from the upper extrapolation. Fig. 5
indicates that there may be regional factors at play, probably
corresponding to changes in the composition of the particle
population. It is worth noting that it is quite likely that such changes
might also influence the performance of scattering correction
procedures for ac-9 absorption and attenuation measurements, and
therefore influence the degree of agreement between the measured
IOPs and IOPs derived from Mie forward modelling. There is scope to
extend the FC sampling procedure to capture a wider range of particle
sizes at the high end and to improve statistical significance throughout.
The long string of assumptions and calculations steps required to
derive modelled IOPs is bound to introduce large uncertainties in the
final values, with the largest effect on absorption for which only crude
ni approximations were employed, potentially explaining the high
RMS%E for the absorption match-up to some extent However, it is
clear that the current iteration of the FC method already provides a
useful insight into the contribution of different particle components to
the formation of bulk particulate IOPs. The overall broad agreement
between measured and modelled IOPs provides useful validation of
the PSDs and PRIDs generated by the FC method. In doing so, it also
suggests that Mie theory is sufficient to provide useful estimates of bulk
IOPs for natural particle populations. This is not to say that Mie theory
is capable of accurately predicting optical properties for all marine
particles; indeed, there are well-established situations where more
complex optical models are required, especially in the case of samples
dominated by phytoplankton: Clavano et al. [51] offer an in-depth
overview of this issue. Rather, results indicate that Mie theory, which is
analytical, conservative and computationally fast, has the ability to
reproduce bulk IOPs for randomly orientated, mixed populations of
naturally occurring marine particles. A possible interpretation of such
results would be to suggest that the nature of the FC method produces
diameter and nr values that correspond to spheres optically equivalent
to the particles processed by the flow cytometer; the modelled IOPs
therefore would be compatible with bulk IOP measurements taken by
instruments which observe ensembles of randomly orientated
particles. However, more data is required to substantiate this
interpretation.
It is important to consider that in situ IOPs used to validate the
forward modelling are themselves subject to variable degrees of error.
Forward modelled scattering values, resolved down to 0.01° in the
forward direction, demonstrated mutual consistency with in situ
values generated using iterative correction of the scattering error in
the ac-9 attenuation measurements. This particular correction was
chosen specifically because other correction methods do not include a
correction of attenuation coefficients, thus affecting scattering
coefficient retrieval. Similar degrees of closure with uncorrected in situ
bp data is possible by restricting calculations to angles beyond the
transmissometer collection angle, but are no better in quality. This is
good circumstantial evidence that the iterative ac-9 scattering
correction is a useful development. On the other hand, as mentioned
previously, the iterative correction relies on selection of appropriate
scattering phase functions and there is evidence (Fig. 5b) that there is
possibly some degree of breakdown in performance as waters become
increasingly dominated by large phytoplankton [43].
Finally, it is important to stress that the FC method and the IOP
forward modelling based on its results are not proposed as techniques
capable of replacing any of the already established techniques for IOP
measurements, but rather as tools to assist and complement those
other techniques. Furthermore they are presented as a viable method
for the estimation of the individual contributions from different
particle size classes and particle types to the total particulate IOPs. The
ability to partition bulk IOPs by size and/or particle type demonstrated
in Fig. 6-7 offers a unique capability to explore the contribution of sub-
populations of particles to optical signals in the ocean. Ultimately this
could be scaled up to understanding the relative contribution of sub-
populations to ocean colour remote sensing signals and the long
cherished concept of relating satellite data to individual particle
observations could become a reality.
6. CONCLUSION
PSDs and PRIDs determined using the FC method for natural
seawater samples were used as inputs to Mie forward optical
modelling. With the selection of appropriate PSD extrapolations and nr
approximations, which accounted for undetected particles, the
calculations produced IOP values which were then compared with
corresponding measured IOPs. UKCW dataset IOP match-up results
were found to be variable, reflecting geographic variability and
possibly limitations in the quality of in situ IOPs used for validation.
However, given the relatively narrow FC method size detection range,
the need to extrapolate PSDs and approximate nr values to account for
undetected particles, and an inherent lack of direct ni measurements,
the degree of agreement between modelled and measured IOPs is
surprisingly good. These results validate the PSDs and PRIDs produced
by the FC method, suggest a reassessment of the value of Mie theory in
the context of predicting bulk IOPs for natural particle populations and
underline the requirement to consider the role of measurement
uncertainties, particularly systematic errors, when using in situ IOPs
for validation of forward optical modelling.
Finally, PSDs and PRIDs as determined by the FC method offered the
chance to gain useful insight into the individual contributions of
different particle subpopulations to the bulk IOPs of seawater samples.
By further associating models of particle density and of organic carbon
and chlorophyll content to the PSDs and PRIDs provided by the FC
method, future work may find the potential to similarly explore the
biogeochemistry of natural mixed particle populations, perhaps
providing the means to bridge the divide between optical and
biogeochemical properties of natural particles.
Funding Information. The HE442 cruise with RV Heincke was
conducted under the grant number AWI-HE442. Lefering and
Agagliate received funding from the MASTS pooling initiative (The
Marine Alliance for Science and Technology for Scotland). MASTS is
funded by the Scottish Funding Council (grant reference HR09011)
and contributing institutions.
Acknowledgment. The authors wish to thank the captain and the
crew of RV Heincke for their support and help during the HE442
research cruise. Mike Twardowski and Rüdiger Röttgers are thanked
for very helpful conversations about this data set. MASTS funding
support is gratefully acknowledged.
References
1. J. Agagliate, R. Röttgers, M. S. T┘;ヴSラ┘ゲニキが ;ミS Dく MIKWWが さE┗;ノ┌;デキラミ ラa ; flow cytometry method to determine size and real refractive index
SキゲデヴキH┌デキラミゲ キミ ミ;デ┌ヴ;ノ マ;ヴキミW ヮ;ヴデキIノW ヮラヮ┌ノ;デキラミゲがざ “┌HマキデデWS ヮ;ヮWヴ (2017).
2. Aく dヴキI;┌S ;ミS Dく “デヴ;マゲニキが さ“ヮWIデヴ;ノ ;Hゲラヴヮデキラミ IラWaaキIキWミデゲ ラa ノキ┗キミェ phytoplankton and nonalgal biogenous matter: a comparison between
the Peru upwelling area and the Sargasゲラ “W;がざ Lキマミラノく OIW;ミラェヴく 35(3),
562に582 (1990).
3. I. Lefering, R. Röttgers, R. Weeks, D. Connor, C. Utschig, K. Heymann, and
D. McKee, "Improved determination of particulate absorption from
combined filter pad and PSICAM measurements," Opt. Express 24, 24805-
24823 (2016).
4. S. G. Ackleson and R. W. Spinrad, "Size and refractive index of individual
marine particulates: a flow cytometric approach," Applied Optics 27, 1270
(1988).
5. R. E. Green, H. M. Sosik, R. J. Olson and M. D. DuRand, "Flow cytometric
determination of size and complex refractive index for marine particles:
comparison with independent and bulk estimates," Applied Optics 42,
526 (2003).
6. E. J. Davies, D. McKee, D. Bowers, G. W. Graham and W. A. M. Nimmo-
Smith, "Optically significant particle sizes in seawater," Applied Optics 53,
1067 (2014).
7. D. McKee, J. Piskozub, R. Röttgers and R. A. Reynolds, "Evaluation and
Improvement of an Iterative Scattering Correction Scheme for in situ
Absorption and Attenuation Measurements," Journal of Atmospheric and
Oceanic Technology 30, 1527-1541 (2013).
8. L. Duforêt-Gaurier, W. Moutier, N. Guiselin, M. Thyssen, G. Dubelaar, X.
MWヴキ;┌┝が Lく Cラ┌ヴIラデが Dく DWゲゲ;キノノ┞が ;ミS Hく LラキゲWノが さDWデWヴマキミ;デキラミ ラa backscattering cross-section of individual particles from cytometric
measurements: a new methodology,ざ Oヮデく E┝ヮヴWゲゲ ヲンが ヮヮく ンヱヵヱヰ-31533
(2015).
9. W. Moutier, L. Duforêt-Gaurier, M. Thyssen, H. Loisel, X. Mériaux, L.
Courcot, D. Dessailly, and S. Alvain, "Scattering of individual particles from
cytometry: tests on phytoplankton cultures," Opt. Express 24, pp. 24188-
24212 (2016).
10. X. Zhang, M. Twardowski and M. Lewis, "Retrieving composition and sizes
of oceanic particle subpopulations from the volume scattering function,"
Applied Optics 50, 1240 (2011).
11. W.C McCrone, R.G. Draftz, and J. G. Delly, The Particles Atlas (Ann Arbor
Science Publ., 1967).
12. F. D. Bryant, B. A. Seiber and P. Latimer, "Absolute optical cross sections
of cells and chloroplasts," Archives of Biochemistry and Biophysics 135,
97-108 (1969).
13. H. R. Gordon and O. B. Brown, "A theoretical model of light scattering by
sargasso sea particulates," Limnology and Oceanography 17, 826-832
(1972).
14. J. R. V. Zaneveld, D. M. Roach and H. Pak, "The determination of the index
of refraction distribution of oceanic particulates," Journal of Geophysical
Research 79, 4091-4095 (1974).
15. A. Bricaud, A.-L. Bédhomme and A. Morel, "Optical properties of diverse
phytoplanktonic species: experimental results and theoretical
interpretation," Journal of Plankton Research 10, 851-873 (1988).
16. Dく “デヴ;マゲニキ ;ミS Dく Aく KキWaWヴが さOヮデキI;ノ ヮヴラヮWヴデキWゲ ラa マ;ヴキミW H;IデWヴキ;くざ Iミ Rく W. Spinrad. (ed.), Ocean Optics X. Proceedings 16-18 April, Orlando,
Florida (SPIE, 1990) 1302, 250-268.
17. D. Stramski and A. Morel, "Optical properties of photosynthetic
picoplankton in different physiological states as affected by growth
irradiance," Deep Sea Research Part A. Oceanographic Research Papers
37, 245-266 (1990).
18. M. S. Twardowski, E. Boss, J. B. Macdonald, W. S. Pegau, A. H. Barnard
and J. R. V. Zaneveld, "A model for estimating bulk refractive index from
the optical backscattering ratio and the implications for understanding

particle composition in case I and case II waters," Journal of Geophysical
Research: Oceans 106, 14129-14142 (2001).
19. A. Bricaud and A. Morel, "Light attenuation and scattering by
phytoplanktonic cells: a theoretical modeling," Applied Optics 25, 571
(1986).
20. D. Stramski and C. D. Mobley, "Effects of microbial particles on oceanic
optics: A database of single-particle optical properties," Limnology and
Oceanography 42, 538-549 (1997).
21. Y.-H. Ahn, A. Bricaud and A. Morel, "Light backscattering efficiency and
related properties of some phytoplankters," Deep Sea Research Part A.
Oceanographic Research Papers 39, 1835-1855 (1992).
22. M. Babin, A. Morel, V. Fournier-Sicre, F. Fell and D. Stramski, "Light
scattering properties of marine particles in coastal and open ocean waters
as related to the particle mass concentration," Limnology and
Oceanography 48, 843-859 (2003).
23. R. A. Reynolds, D. Stramski, V. M. Wright and S. B. Wラ┤ミキ;ニが "Measurements and characterization of particle size distributions in
coastal waters," Journal of Geophysical Research 115, (2010).
24. C. E. Junge, Air Chemistry and Radioactivity (Academic Press, 1963).
25. H. Bader, "The hyperbolic distribution of particle sizes," Journal of
Geophysical Research 75, 2822-2830 (1970).
26. R. W. Sheldon, A. Prakash and W. H. Sutcliffe Jr., "The size distribution of
particles in the ocean," Limnology and Oceanography 17, 327-340 (1972).
27. O. Ulloa, S. Sathyendranath and T. Platt, "Effect of the particle-size
distribution on the backscattering ratio in seawater," Applied Optics 33,
7070 (1994).
28. Y. C. Agrawal and H. C. Pottsmith, "Laser diffraction particle sizing in
STRESS," Continental Shelf Research 14, 1101-1121 (1994).
29. P. Traykovski, R. Latter and J. D. Irish, "A laboratory evaluation of the laser
in situ scattering and transmissometery instrument using natural
sediments," Marine Geology 159, 355-367 (1999).
30. Y. C. Agrawal and H. C. Pottsmith, "Instruments for particle size and
settling velocity observations in sediment transport," Marine Geology
168, 89-114 (2000).
31. H. C. van de Hulst, Light Scattering By Small Particles (Dover Publications,
2012).
32. C. F. Bohren and D. R. Huffman, Absorption And Scattering Of Light By
Small Particles (Wiley, 2013).
33. W. H. Slade, "FASTMIE,"
http://www.scattport.org/www.scattport.org/index.php/light-scattering-
software/mie-type-codes/list/264-fastmie.html. (2006)
34. Dく Rキゲラ┗キJが ゎT┘ラ-component model of sea particle size distribution," Deep
Sea Research Part I: Oceanographic Research Papers 40, 1459-1473
(1993).
35. E. Aas, "Refractive index of phytoplankton derived from its metabolite
composition," Journal of Plankton Research 18, 2223-2249 (1996)
36. D. Stramski and D. A. Kiefer, "Light scattering by microorganisms in the
open ocean," Progress in Oceanography 28, 343-383 (1991).
37. R. E. Green, H. M. Sosik and R. J. Olson, "Contributions of phytoplankton
and other particles to inherent optical properties in New England
continental shelf waters," Limnology and Oceanography 48, 2377-2391
(2003).
38. M. S. Twardowski, J. M. Sullivan, P. L. Donaghay and J. R. V. Zaneveld,
"Microscale Quantification of the Absorption by Dissolved and Particulate
Material in Coastal Waters with an ac-9," Journal of Atmospheric and
Oceanic Technology 16, 691-707 (1999).
39. Jく Rく Vく );ミW┗WノSが Jく Cく KキデIエWミが ;ミS Cく MララヴWが さTエW ゲI;デデWヴキミェ Wヴヴラヴ correction of reflecting-デ┌HW ;Hゲラヴヮデキラミ マWデWヴゲがざ OIW;ミ OヮデキIゲ XIIが J┌ミW 13-15 1994, Bergen, Norway, SPIE, 44-55.
40. R. Röttgers, D. McKee and S. B. Wラ┤ミキ;ニが ゎE┗;ノ┌;デキラミ ラa ゲI;デデWヴ corrections for ac-9 absorption measurements in coastal waters,"
Methods in Oceanography 7, 21-39 (2013).
41. WET Labs Inc., Absorption and attenuation meter, ac-9が UゲWヴげゲ G┌キSW (Revision Q) (2008)
42. WET Labs Inc., ac Meter, Protocol Document (Revision Q) (2011)
43. I. Lefering, F. Bengil, C. Trees, R. Röttgers, D. Bowers, A. Nimmo-Smith, J.
Schwarz and D. McKee, "Optical closure in marine waters from in situ
inherent optical property measurements," Optics Express 24, 14036
(2016).
44. W. S. Pegau, D. Gray and J. R. V. Zaneveld, "Absorption and attenuation of
visible and near-infrared light in water: dependence on temperature and
salinity," Applied Optics 36, 6035 (1997).
45. I. Lefering, R. Röttgers, C. Utschig, and D. McKee, "Uncertainty budgets
for liquid waveguide CDOM absorption measurements," Appl. Opt. 56,
6357-6366 (2017).
46. J. M. Sullivan and M. S. Twardowski, "Angular shape of the oceanic
particulate volume scattering function in the backward direction," Applied
Optics 48, 6811 (2009).
47. J. M. Sullivan, M. S. Twardowski, J. Ronald, V. Zaneveld, and C. C. Moore,
さMW;ゲ┌ヴキミェ ラヮデキI;ノ H;IニゲI;デデWヴキミェ キミ ┘;デWヴがざ キミぎ Light Scattering Reviews
7, edited by: A. A. Kokhanovsky, 189に224 (Springer Berlin Heidelberg,
2013).
48. T. Oishi, "Significant relationship between the backward scattering
coefficient of sea water and the scatterance at 120°," Applied Optics 29,
4658 (1990).
49. E. Boss and W. S. Pegau, "Relationship of light scattering at an angle in the
backward direction to the backscattering coefficient," Applied Optics 40,
5503 (2001).
50. WET Labs Inc., Scattering meter, ECO BB9が UゲWヴげゲ G┌キSW ふRW┗キゲキラミ Kぶ (2010).
51. W. R. Clavano, E. Boss, and L. Karp-dラゲゲが さIミエWヴWミデ ラヮデキI;ノ ヮヴラヮWヴデキWゲ ラa non-spherical marine-like particlesねfヴラマ デエWラヴ┞ デラ ラHゲWヴ┗;デキラミゲがざ キミ Oceanography and Marine Biology: An Annual Review, R. N. Gibson, R. J.
M. Atkinson, and J. D.M. Gordon, eds. (CRC, 2007), Vol. 45, pp. 1に38.