afrpl graphite perform1.nce prediction program · t temperature (or, ok) ei emissivity velocity...
TRANSCRIPT

AFRPL-TR-76-70
AFRPL GRAPHITE PERFORM1.NCE PREDICTION PROGRAM
FINAL REPORT
0 IMPROVED CAPABILITY FOR THE DESIGN AND ABLATION PERFORMANCE
PREDICTION OF ADVANCED AIR FORCE SOLID PROPELLANT ROCKET NOZZLES
Acurex Corporation/Aerotherm Division485 Clyde AvenueMountain View, California 94042
Authors: H. TongG. J. HartmanE. K. ChuA. J. Murphy
December 1976
Approved for public release; distribution unlimited.
DDCDDCD _. , L-JA
Prepared for I
Air Force Rocket Propulsion Laboratory DDirector of Science and TechnologyAir Force Systems CommandEdwards AFB, California 93523

AFROP -7-
GRAHIT 4CTIO PR GRAMa IN 4 NGAO
vS.~FOMAC PRED~uI@ ITTMN May *. Rpw
Aprv"raPbic yfrleas gn U~tinimited
I~ ~a.c Prediction@ STTMN of hfeg.v~ne.E DIr Foc h*I NUMBERbrn
RoplItcket ozzl aera s T:7-6(,,3
Carbton-carbon 'maE KTh A.2. 1-7--2
improved procedures forthpreDinsh baion pefracofgpht
Arprnae ofthe ropso a rioyA ofa ozedeign whchwold6gdrahi materiase hatfrernatv ofte3urntsae2f3te
DO ~ 473 EITIO 0? NV55 SOSUNCLASNCLASFFIE
SEUq Y
257I AIO
A E(3~ iDE.llfd

N~ UN'TASSIFIEDUN, L SS I F I
ECUOITY CLASSIFICATION OF THIS PAGE fflh "*e nrf.)-
New kinetic response correlation functions were developed for G-90 and ATJbulk graphites, 15% silicon carbide modified pyrolytic graphite, c planepyrolytic graphite, and Pyrocarb 901 carbon-carbon. These functions wereincluded into the Aerotherm GASKET code along with several modifications toimprove on thermochemical modeling accuracy. This modified code, GASKET2,includes a number of new chemical species, improved generalized input require-ments, and kinetically controlled carbon sublimation models. The GASKET2code was used in a number of performance studies to predict the performanceof a number of rocket nozzles to be tested in other Air Force programs.
The rocket nozzle ablation performance prediction procedures for severalrocket motor fabricators were mutually compared to determine the probableranges of predicted variables. These ranges were used in an ablation ratesensitivity study to defina the most critical parameters. The mass transfercoefficient and the kinetic rate constants were shown to be the most criticalparameters to be accurately known.
DOre 1473 EITIOOF ov,, i 00IS~OLETEDO) ,M 173 OUNCLASSIFIED
SIECUITY CLASSIFICATIO N OF THIS PAGE (11%ha Date HAtefed)

ACKNOWLEDGEMENT
The authors are indebted to Mr. Jay Baetz of the Aerospace Corporation, El Segundo, for per-
forming most of the materials microstructural chara:terizations. The authors also acknowledge the
support of the Aerotherm staff, in particular, Messrs. Gurdev Singh, Jerry Dodson, and Alex Boyd,
for their valuable contribution to this program.
WIu se-los1011 SKl4
, ';LiTY CODE3
F '
N EB 11

TABLE OF CONTENTS
Section ae
1 SUMMARY .. .. .... ..... ..... ..... ...... ..... ....
2 INTRODUCTION. .. .... ..... ...... ..... ..... ..... .... 3
3 PROCEDURE FOR MATERIAL CHARACTERIZATION. .. .. ...... ..... ......... 7
3.1 Experimental Apparatus .. .. .... ..... ...... ..... ...... 9
3.1.1 Arc Plasma Generator .. .. .... ..... ..... ..... ....... 93.1.2 Test Nozzle Configurations. .. ... ..... ..... .......... 123.1.3 Fume Collection System .. .. .... ..... ..... ..... ...... 123.1.4 Instrumentation .. ... ..... ..... ..... . .... ...... 18
3.2 Test Gases and Test Conditions. .. .. ...... ..... ..... .... 20
3.2.1 Test Gas Selection Criteria .. ... ..... ...... ..... .... 203.2.2 Test Gas Selection. .. .. ...... ..... ..... ..... .... 25
3.3 Carbon Matpriels Surface Kinetics Correlation Procedure. .. .... ..... 34
4 ANALYSIS OF APG TEST RESULTS. .. ..... ..... ..... ..... ...... 39
4.1 Carbon Consumption Rate ..... ....... ... ... ........ 34.2 Boundary Layer Edge Solutions .. ... ..... ...... ..... .... 544.3 Evaluation of Heat and Mass Transfer Coefficients .. ... ..... ...... 544.4 Open System Surface State Solutions. .. ..... ..... ..... .... 58
5 ROCKET MOTOR TEST RESULTS. .. .. ..... ..... ...... ..... .... 59
6 EVALUATION OF KINETIC CONSUMPTION RATES .. .. .... ..... ..... ...... 63
6.1 Results of Full Characterization Studies. .. .. ...... ..... .... 636.2 Results of Limited Characterization Studies. .. ..... ..... ...... 78
7 PREDICTED ROCKET NOZZLE PERFORMANCE. .. .. ...... ..... ..... .... 95
7.1 Analysis Procedure. .. .. ...... ..... ..... ..... ...... 957.2 Correlation Studies. .. ..... ..... ..... ..... ....... 1017.3 Performance Studies. .. ..... ..... ..... ..... ....... 102
8 CONCLUSIONS AND RECOMMENDATIONS. .. .. ...... ..... ..... ...... 129
REFERENCES .. ... ..... ..... .......... ..... ...... 133
APPENDIX A - MICROSTRUCTURAL EXAMINATIONS. .. .. . ... ...... ...... 135
APPENDIX B - GRAPHITIC MATERIALS THERMOPHYSICAL PROPERFIES. .. .... ...... 201

LIST OF ILLUSTRATIONS
FPage
1 Aerotherm l-MW Constrictor Arc Heater ........ ...................... 10
2 Aerotherm I-MW Constrictor Arc Heater ........ ...................... 11
3 Axisymmetric Nozzle Assembly ...... .... ........................ 13
4 Nominal Test Section Insert Configuration ....... .................... 14
5 Calorimeter Nozzle Assembly ......... ........................... 15
6 Axisymmetric Test Section, Calorimeter Installed ...... ................ 16
7 Fume Collection System ....... ... ............................. 17
8 Typical Surface Gas Composition at Throat for c Plane PG ..... ............ 22
9 Statistical Evaluation of Test Gases, Layer Pyrolytic Graphite .... ......... 31
10 Statistical Evaluation of Test Gases, ATJ Bulk Graphite ..... ............. 32
11 Statistical Evaluation of Test Gases, Pyrocarb 901 Carbon/Carbon Composition . . 33
12 Typical Surface Response Prediction for Motor Firing ..... .............. 60
13 Supertemp PG, c Plane Surface Kinetics ....... ..................... 65
14 Results of 15% SiC/PG Kinetic Correlation ....... .................... 66
15 Results of ATJ Gtraphite Kinetic Correlation ...... ................... 67
16 Results of G-90 Kinetic Correlation ........ ....................... 68
17 Results of Pyrocarb 901 Kinetic Correlation ...... ................... 69
18 Reaction Rate Coefficients for Supertemp Edge Pyrolytic Graphite .... ........ 73
19 Reaction Rate Coefficients for ATJ Graphite ...... ................... 74
20 Reaction Rate Coefficients for G-90 Graphite ....... .................. 75
21 Reaction Rate Coefficients for 15% SiC/PG ....... .................... 76
22 Reaction Rate Coefficients fnr Pyrocarb 901 Carbon/Carbon ..... ............ 77
23 Reaction Rate Coeffi-ien-s for Carbitex 700 Carbon/Carbon ..... ............ 79
24 Reaction Rate Coefficients for Atlantic Research Corporation Layer PyrolyticGraphite ....... .. ... .................................... 80
25 Carbon/Carbons, APG Test Gas - H.2 . . . . . . . . . . . . . . . . . . . . . . . . 82
26 Carbon/Carbons, APG Test Gas -H2 . . . . . . . . . . . . . . . . . . . . . . . . 83
27 Measured Ablation Rates in a Hydrogen Environment ...... ................ 85
28 Data for Construction of Figure 27 ........ ....................... 86
29 Ablation Data, Pyrolytic Graphites, APG Test Gas - H2 . . . . . . . . . . . . . . 87
30 Ablation Data, Modified Pyrolytic Graphites, APG Test Gas - H2 8. . . . . . . . . . 8

LIST OF ILLUSTRATIONS (Concluded)
FigurePaae
31 Ablation Data, Bulk Graphites, APG Test Gas - H2 . . . . . . . . . . . . . . . . . 89
32 Ablation Data, Carbon/Carbons, APG Test Gas - H2/02 9. . . . . . . . . . . . . . . 90
33 Ablation Data, Pyrolytic Graphites, APG Test Gas H2/02 9. . . . . . . . . . . . . . 91
34 Ablation Data, Modified Pyrolytic Graphites, APG Test Gas H2/02 9. . . . . . . . . 92
35 Ablation Data, Bulk Graphites, APG Test Gas - H2/02 . . . . . . . . . . . . . . . 93
36 Major Areas of Analysis in Prediction Procedure ...... ................. 96
37 Thermal Analysis Flow Chart ....... .. ........................... 97
38 Comparison of Measures and Predicted Ablation for Correlation Studies ... ...... 103
39 Chamber Pressure History ......... ............................. 106
40 Nozzle Geometry, Hercules Test Nozzle ........ ...................... 107
41 Predicted Nozzle Respoise to HTPB Propellant, 60.0 Seconds .... ............ 108
42 Nozzle Geometry, Rocketdyne Condor Nozzle ....... .................... 110
43 Surface Recession History, Rocketdyne Condor Nozzle ..... ............... ill
44 Predicted Nozzle Response to HTPB Propellant, 60 Seconds ... ............. .113
45 Nozzle Geometry, Study 4 ......... ............................. )16
46 Predicted Average Recession Rates, Study 4 ...... .................... 119
47 Nozzle Geometry, Study 5 ......... ............................. 121
48 Predicted Average Recession Rates ........ ........................ 124
49 BATES High Pressure Motor ....... .. ............................ 126

LIST OF TABLES
Table Page
1 Carbon Materials Characterized ........ .......................... 8
2 Representative Composition and Flame Temperature of Advanced MX Propellants . , 21
3 Propellant Gas Composition (AX203 Removed) ....... ................... 21
4 Potential APG-Material Characterization Test Gases ...... ................ 26
5 Surface Reactions ....... ... ................................ 27
6 Recommended Material Characterization Test Gases ...... ................. 29
7 Recommended Test Gases for Limited Characterization Studies .... ........... 35
8 Arc Plasma Generator Data for Full Characterization Materials .... .......... 40
9 Reduced Arc Plasma Generator Data for Full Characterization Material ... ....... 44
10 Arc Plasma Generator Data for Limited Characterization Material (Carbon/Carbons) ......... ..................................... 49
11 Arc Plasma Generator Data for Limited Characterization Material (BulkGraphites) ........ ... .................................... 51
12 Arc Plasma Generator Data for Limited Characterization Material (PyrolyticGraphites) ........ ... .................................... 52
13 Calibration Data Summary - Planar Configuration ...... ................. 55
14 Calibration Data Summary - Axisymmetric Configuration ..... .............. 56
15 Summary of Correlation Data Obtained from Motor Firings ..... ............. 62
16 Carbon Kinetics Coefficients for Full Characterization Materials .... ......... 70
17 Ranking of Carbon/Carbons Based on Mass Consumptio,, Performance .... ......... 81
18 Propellant Data ....... ... ................................. 105
19 Recession Rate Summary, Hercules 3rd Stage MX Nozzle .... ............... 114
20 Propellant Data, Study 4 ........ ............................. 115
21 Material Response Summary, Study 4 ........ ........................ 118
22 Material Response Summary ...... ... ............................ 123

LIST OF SYMBOLS
A c calorimeter area
AI pre-exponential factor
B' normalized mass rate
CM mass transfer Stanton number
CH Stanton number
D diameter (in.)
E arc voltage
Ei activation energy
h enthalpy (Btu/lbm)
I arc current
Ki mass fraction of ith chemical species
Kp equilibrium constant
Le Lewis number
mmass flowrate (lbm/sec)
n aluminum loading
ni temperature exponent
P pressure (atm)
Pr Prandtl number
q heat flux (Btu/ft2sec)
R mass ratio of plenum injected to arc heated gases, gas constant
s surface recession (mils)
S surface recession rate (Wils/sic)

LIST OF SYMBOLS (Concluded)
T temperature (OR, °K)
emissivity
velocity (ft/sec)
inhibition coefficient
p density (lbm/ft 3)
a statistical standard deviation, Stefan-Boltzman constant
o time (sec)
Subscripts
amb ambient condition
ave average condition
B Bartz
c coolant, carbon
diff diffusion limited
e boundary layer edge
hw hot wall
0 chamber conditions
ref reference enthalpy condition
s stream
w wall

LIST OF SYMBOLS (Concluded)
T temperature (OR, OK)
ei emissivity
velocity (ft/sec)
inhibition coefficient
P density (lbm/ft3)
o statistical standard deviation, Stefan-Boltzman constant
0 time (sec)
Subscripts
amb ambient condition
ave average condition
B Bartz
c coolant, carbon
diff diffusi'n limited
e boundary layer edge
hw hot wall
o chamber conditions
ref reference enthalpy condition
s stream
w wall

SECTION 1
SUMMARY
A combined experimental and analytic program was conducted to obtain required data and develop
improved procedures for predicting the ablation performance of graphitic materials in rocket nozzles.
Particular emphasis was placed on conditions representative of the throat region of an MX nozzle with
graphitic materials which are representative of the current state of materials development. Signifi-
cant results of this program are:
* The acquisition of a large body of full characterizati3n ablation data using an arc plasma
generator which simulates rocket nozzle environments
e The harmonizing of this data with available rot"et motor data to obtain kineti( correla-
tion functions which may be used to predicc ablation response. Correlation functions were
obtained for
- G-90 and ATJ bulk graphite
- 15% silicon carbide modified pyrolytic graphite
- c plane pyrolytic graphite
- Pyrocarb 901 (p -1.83 gm/cc)
* The development of the GASKET2 code. This code is a modification of the GASKET code to
include the new correlation functions, new JANNAF species data, improved generalized in-
put requirements, and kinetically-controlled carbon sublimation models.
* An evaluatiun of rocket nozzle thermal performance procedures currently used by rocket
motor designers to predict the thermal performance of a solid propellant rocket nozzle.
A significant conclusion of this evaluation is that errors in the mass transfer coeffi-
cient have a direct and significant influence on the predicted ablation rate. With the
exception of the kinetic model, all other variables were shown to have a small effect on
the mass loss rate in the throat region of a typical MX nozzle. Thus, future efforts
should concentrate on accurate predictions of the mass transfer coefficient and accurate
kinetic models.

9 An analytic evaluation of the relative performance of different graphitic materials in
the MX throat and nose cap environments
* Pretest predictions of the ablation performance of several AFRPL advanced technology rocket
nozzles
s The acquisition of limited characterization ablation data for comparing the relative
ablation performance of materials in given generic classes. These classes and the limited
characterization materials were
- Bulk graphites - P03
- ATJS
- Pyrolytic graphites - Hitco a-b plane
- Pfizer c plane
5% SiC/PG
- 23% SiC/PG
- 65% HfC/PG
- Carbon/carbons - Pyrocarb 903 (p - 1.83 gm/cc)
- Pyrocarb 903 HD (p - 1.90 gm/cc)
- HRX 5125 (p - 1.50 gm/cc)
- HRX 5875 (p - 1.80 gm/cc)
- MDAC 3D(p - 2.00 gm/cc)
2

SECTION 2
INTRODUCTION
The rate at which graphite nozzle components are consumed by hot propellant gases depends upon
the composition of these gases. In addition, however, it is known that different generic classes
. oulk graphites or pyrolytic graphites) respond differently to the same environments. Although
higher density materials often have lower ablation rates, the contrasting ablation performance of
a-b oriented pyrolytic graphite compared with c oriented pyrolytic graphite clearly demonstrates that
density is not the only important factor. Past experience (References 1-5) has shown that surface
reaction kinetics have an important, if not dominant, role in controlling car on consumption rates.
With current technology it is not possible to write elementary chemical reactions which will
define the carbon consumption process. Yet, some basic analytic expressions or procedures are re-
quired for design and performance analyses of rocket motors. The Air Force Rocket Propulsion Labora-
tory recognized this need and initiated a program (Reference 6) to develop a semiemperical procedure
to predict ablation response. At that time a-b oriented pyrolytic graphite was considered to be a
viable rocket nozzle material. Thus Reference 6 concentrated on the development of a general analytic
model and its validation using a-b oriented pyrolytic graphite data.
The analytic model was, by necessity, based on an engineering approximation of the overall
ablation reaction. The ablation data used for determining the correlation coefficient, in this model
were obtained by exposing a large number of models to simulated hot propellant environments. The
resultant analytic model and the correlations for pyrolytic graphite were assembled into the GASKET
code (Reference 7). The GASKET code was then integrated into an overall rocket nozzle ablation per-
formance prediction procedure.
Since the completion of the abcve work, thermostructural problems associated with a-b oriented
pyrolytic graphite have cast doubt on their use as rocket nozzle liner material. Other muterials
considered and applied to rocket nozzles include bulk graphites, carbon/carbons, c oriented pyrolytic
graphites and carbide codeposited pyrolytic graphites. A need therefore existed to generate corre-
lation coefficients for these other materials. Because of the many varieties of materials in each
of these generic classes, it is not economically practical to kinetically characterize all possible
graphitic materials.
3

To satisfy the requirement for predicting ablation response of other graphitic materials, the
program described in this report was conducted. The program included full characterization of select
materials from each generic class and limited characterization of a larger number of materials. The
behavior of the limited characterization materials was deduced by comparing their ablation response
to that of fully characterized materials in the same generic class. Appropriate data was obtained
from controlled ablation tests using an arc plasma generator and analyses of available rocket motor
data. The data analysis procedure was very similar to that described in Reference 8.
Data for full characterizations were obtained for:
e ATJ bulk graphite
e G-90 bulk graphite
a 15% SiC codeposited pyrolytic graphite
* Pyrocarb 901 carbon/carbon (p = 1.83 lbm/ft3)
Data for limited characterizations were obtained for:
* Pyrocarb 903 carbon/carbon (p = 1.82)
# High Density Pyrocarb 903 carbon/carbot, (p 1.90)
* HRX 5125 carbon/carbon (p = 1.50)
* HRX 5875 carbon/carbon (p = 1.86)
* MDAC 3-D carbon/carbon (p = 2.02)
* ATJ-S bulk graphite
* 5% SiC codeposited pyrolytic graphite
* 23% SIC codepositied pyrolytic graphite
* 65% HfC codeposited pyrolytic graphite
s c oriented pyrolytic graphite (Pfizer)
* a-b oriented pyrolytic grapkiLt (Hitco)
Full characterization data was analyzed to obtain appropriate correlation coefficients which were
compatible with the GASKET code. The GASKET code was modified to include this new data base and des-
ignated as GASKET2 (Reference 9). The validity or accuracy of the GASKET2 code was then assessed by
Lmparing predicted and post-test measured responses of rocket motors.
4

Each of the test materials were examined for pre- and post-test microstructural and chemical
characteristics. Characterization data included photomicrographs, scanning electron microscopy,
porosity, chemadsorption, thermal expansion coefficients, and lattice parameters. These data were
examined and where possible, the ablation performance was related to the observed characteristics.
The GASKET2 code was also used in a series of performance calculations (References 10-14) to
predict the response of various graphitic materials in propellant environments similar to those ex-
pected for an MX rocket motor. These analyses were
1. Third stage Hercules MX nozzle analysis (Reference 10)
2. Rocketdyne Condor test nozzle analysis (Reference 11)
3. Third stage Hercules MX nozzle analysis using Pyrocarb 901 kinetics (Reference 12)
4. Material/propellant sensitivity study for the throat location of the standard 7-inch
test nozzle (Reference 13)
5. Material sensitivity study for the nose cap of the standard 7 inch test nozzle
(Reference 14).
In addition to the above thermal ablation studies, a thermostructural analysis was perforied
on the BATES motor to identify probable causes for nozzle failures. The results of this study are
presented in Reference 15.
5/6

SECTION 3
PROCEDURE FOR MATERIAL CHARACTERIZATION
The surface recession of carbon rocket nozzles due to chemical erosion by propellant gases
is a complex phenomenon. It includes events such as: diffusion of the reactive species to the
carbon surface, adsorption and desorption of the reactive species and reaction products at the sur-
face, heterogeneous reactions, and diffusion of the reaction products into the bulk stream. With
the present state of the art, an exact analytical model describing these events is not attainable.
Hence, an engineering approximation representing the overall observed phenomenon is used as an
alternative.
Under U.S. Air Force Contract F04611-69-C-0081 (Reference 6), a combined analytical and
empirical procedure was developed to correlate the ablation rate of pyrolytic graphite. This pro-
cedure included ablation tests under simulated environments in the arc plasma generator, detenlina-
tion of the correlation function, and identification of the kinetically controlled redctlons. This
procedure was applied to the consumption rate of a-b plane oriented pyrolytic graphite. The result-
ing correlation has been applied extensively in designing rocket nozzles, and satisfactoiy predic-
tions have been obtained.
Under the current U.S. Air Force Contract F04611-74-C-0023, carbon materials were (hardcter-
ized using two procedures. The first procedure used a full characterization procedure similar to
Reference 6. Five commonly used carbon materials were selected from generic types of pyrolytic
graphite, modified pyrolytic graphite, bulk graphite, and carbon/carbon. These underwent the full
procedure to determine correlations of their ablation rates. The second procedure, which only de-
termined the relative ablative performances, was called limited characterization. Con idvrdbly
fewer APG data were taken for this type of characterization since the determination of the empirical
correlation was not required. The carbon materials which were characterized are shown in Table 1.
This section will describe the experimental apparatus of the Aerotherm 1-megawatt arc plasma
generator, its application to the material characterization procedure, the selection of the APG
test gases and test conditions, and the correlation procedure. Additional details are available in
Reference 16.
7

TABLE 1. CARBON MATERIALS CHARACTERIZED
Testa NumberManufacturer Material - ofSource F S Models
ARC 15% SiC/PG X 33
HITCO Pyrocarb 901 X 28
UC ATJ X 28
Carborandum G-90 X 28
ARC 5% SiC/PG X 3
ARC 23% SiC/PG X 10
Raytheon HfC/PG X 10
Hitco A-B PG X 10
Super Temp PG Plate X 10
Pfizer PG Plate X 10
Hitco Pyrocarb 903 X 10
Haveg HRX-5125 X 10
Haveg HRX-5875 X 5
McDac 3-D C/C X 6
UC ATJ-S X 10
Pure Carbon P03 X 10
Hitco High DensityPyrocarb 903 X 5
aF - full characterization
S - limited characterization
8

3.1 EXPERIMENTAL APPARATUS
The experimental apparatus consisted of the arc plasma generator used to produce the high
te- yerature reactive environments, the test nozzles which were exposed to these environments, the
fume collection, cooling and scrubbing system used to remove the test gases from the facility, and
the instrumentation used to characterize the test conditions and model response. The arc plasma
generator and support equipment are discussed in Section 3.1.1. The test nozzles are described in
Section 3.1.2. The fume collection system is described in Section 3.1.3 and the instrumentation
is presented in Section 3.1.4.
3.1.1 Arc Plasma Generator
The Aerotherm 1-megawatt constricted arc plasma generator (APG) is shown schematically in
Figure I and physically in Figure 2. The APG is a constant mass flowrate device with a flowrate
controlled by throttling at the gas injection ports. The APG uses a segmented constrictor arc with
a tungsten cathode and a water-coled copper anode to transfer energy to the primary test gas.
This test gas i! injected tangentially between the cathode and the first constrictor segment to pro-
vide a stable, high voltage operation. Additional gases to simulate propellant gases are injected
downstream of the anode and mixed with the primary arc-heated gas in a plenum chamber. Thermo-
chemical equilibrium is achieved in this plenum and the resulting simulation gases are expanded
through a choked converging-diverging nozzle. The test section is the throat region of this nozzle.
The arc unit is water-cooled with ambient temperature, high pressure deionized water. The
APG input power is supplied by a 600 kW continuous rated, saturable core reactor, dc rectifier
power supply. A maximum overload power level of 1.2 MW is achievable for 5 minutes. The power
supply has 1000, 2000, or 4000 volts open circuit voltage modes to match APG operating character-
istics for various test gases, flowrates, and pressures. Arc starting is accomplished by imposing
power supply open circuit voltages across the APG electrodes while an argon flow is maintained.
Then a momentary RF discharge in the APG column provides an initial ionization path for the arc.
Once the arc is started, test gases are immediately introduced as necessary to provide the required
test gas composition.
The arc unit exhibits very low contamination levels. Based on the results of Reteren(e 17,
total gas stream contamination should not exceed 200 parts per million (0.02 percent). The major
sources of this contamination are the tungsten cathode and copper anode. A third potential source
of contamination is the boron nitride insulators of the constrictor section; however, their contri-
Dution to the above figure is felt to be very small.
9

CopperTungstenanodecatodeSecondary injection: hyrogen!
Anode modtle mixing chamberCatnode module Constrictor modules
A x isyriie Itest noz.' I
Al ternate secondaryinjection: carbon
monoxide or hydrogen
Figure 1. Aerotherm 1-MW constrictor arc heater.
10

C~i
1 1/12

3.1.2 Test Nozzle Configurations
The nominal test configuration was an axisymmetric nozzle as shown in Figure 3. The test
section iilscrts formed the throat region of the nozzle. The PG washer immediately upstream of the
test section insert insured a smooth transition into the insert and held the boundary layer trip.
This trip, a thin Grafoil disk, was employed to promote turbulent flow, and therefore high transfer
cnefficients, in the throat. The test section insert was retained by a crushable high temperature
insulator and could expand thermally without suffering excessive compressive stresses. The test
section insert configuration is shown in Figure 4. This s the nominal-dimension configuration;
the details of the actual test insert depend on the particular requirements of the test material,
e.g., backwall insulation in the throat region.
An appropriate ablation sample or a water-cooled, steady state calorimeter was placed in the
test section. The calorimeter and test sample both have the nominal interior dimensions shown in
Figure 4, so that the test conditions during an ablation test could be inferred from a correspond-
ing calorimeter test. The calorimeter installation is shown in Figure 5 and a view of the assembly
is shown in Figure 6.
3.1.3 Fume Collection System
The APG for these tests was run on the atmospheric test stand with the test gases exiting
directly into the test bay. A fume collection system was employed to collect, cool, clean, and ex-
haust the gases outside the test area. The system is shown schematically in Figure 7.
The first component of the system is the heat exchanger section. The high temperature of
the test gases as they left the APG required a "cooldown" to less than 250'F before they entered
the remainder of the system. This section is constructed of a high temperature alloy, Hastelloy
Alloy C-276, and provided a set of spray nozzles which "quench" or cool the gases with a water
spray. Also included in this section are two view ports to allow pyrometer viewing of the test
section.
The gases were then ducted to the fume scrubber mounted outside the test bay. Tis scrubber
is of the packed tower type and is designed to remove all toxic fumes (HCZ, [IF) from the qds stredii
before they are exhausted to the atmosphere. The scrubbing fluid was water used in the once-through
mode.
The final component of the system is the exhaust fan, mounted on the roof of the test bay.
This provides the positive draft required to draw the gases through the heat exchanger section and
13

Nozzle housing
G-90 graphite
High tempinsulator
insert
Boundary layer'
trip)
PG washer
Mlounting flange
F'res',ure tdp
Figure 3. Axisyrmietric nozzle issembly.

1.250
.690 .350
20 Ref - -L
1.998 Di 852 .350 Dia .503 DiaDi a
.4~~ ~ ~4 __________________ 20 Ref
Figure 4. Nominal test section insert configuration.
15

THERMOCOUPLE
SUPBRSONI
BOUNDARY
0.35" OR0.45"
MOUNTIiNGFLANGE
PRESSURE TAP
Figure 5. Calorimeter nozzle assem~bly.

20
4-)
C)C
on, C)
0
43u
4J
4-)
17/18
thI

Exhaust
fan
Test bay
Fume 7scrubber
APG
Duct
Pyrometer
port /pr Heat exchanger
Figure 7. Fume collection system.
19

the scrubber. The fan has been sized to provide a slightly negative pressure in the system when it
is used in the blanked-off mode. This is necessary when hazardous or toxic test gases are used as
it prevents the release of such gases into the test bay and insures personal safety.
Due to the corrosive nature of certain of the test gases (HCk or HF), the fan, scrubber and
all ducting exclusive of the heat exchanger section are constructed of Rigedon 4837-AT-HF. This is
a fire-retardant, fiberglass-reinforced polyester plastic resistant to corrosive attack by both
acids and alkali and, in addition, is provided with a special Dynel veil for protection against
fluoride attack.
3.1.4 Instrumentation
The measurements to characterize the test conditions and material response were:
* Test Condition
- Gas Total Enthalpy, h0
- Chamber Pressure, P0
- Cold Wall Heat Flux, qc.w.
- Reactive Gas Composition, Ki
# Material Response
- Surface Temperature History, Tw and 0experimental
- Surface Recession, S
- Qualitative Surface Condition
Tne gas total enthalpy was defined by an energy balance on the arc heater including the
plenum chaner, i.e.,
- h Ah Power In-Cooling Water Losses (1)0o "amb =harc = Total Gas Flowrate
0.948 x 10 -3 El - ATc Cp
mgas
where ham is the enthalpy of the test gases at room temperature. Voltage E and current I were re-
corded continuously on a digital data recording system; measurements from panel meters were alsu
taken as a check. The cooling water flowrate, mc' was measured continuously during each test with
20

a sharp-edged orifice and differential pressure transducer and its temperature rise, ATc , was mea-
sured continuously with a differential thermopile. The total gas flow rate, mgas' was the sum of
all gas flowrates delivered to the APG. All gas flowrates were measured with ASME sharp-edged
orifices and differential pressure gauges, except hydrogen-chloride which was measured with a
rotameter with a magnetic float follower.
The chamber pressure was measured continuously with strain gauge pressure transducers. The
pressure taps are located at the downstream end of the plenum-mixing chamber (Figure 3). The cham-
ber temperature was determined from the calibrated net enthalpy addition due to arc heating, the
measured chamber pressure, the test gas composition, and an ACE computer code computation of chamber
conditions.
Cold wall heat flux was measured at the throat of the twater-cooled copper calibration nozzle
with a steady state, waLer-cooled calorimeter section. The coolant water temperature rise ATc was
measured with a single-pair, copper-constantan differential thermopile, the output of which was re-
corded continuously. The calorimeter water flow, mc, was measured with a standard glass tube
rotameter and the heat flux then calculated from the equation:
c rc()qcw cA c (2)
where Ac is the calorimeter heated area.
Surface temperature history was measured with a Thermodot TD-9CH optical pyrometer which is
calibrated with a high temperature source. For each nozzle ablation test, this pyrometer, which
has a sensing wavelength of 0.8 microns, viewed the nozzle throat at an angle of approximately 400
from the APG centerline. Output data was recorded both visually from the instrument meter and in
digital form from the data acquisition system. In some tests, a second pyrometer was used as a
check on the primary unit. This secondary unit was a Thermodot TD-9FH optical pyrometer similar to
the primary instrument except calibrated in degrees Fahrenhe, .
The test sample surface recession was obtained from pre- and post-test measurements of the
throat diameter. Measurements were made at three axial stations in the throat region, namely, the
entrance, center, and exit. In addition, at each station, the diameters were determined at two
angular positions 90° apart. The measurement accuracy is approximately ±0.0005 inch.
21

3.2 TEST GASES AND TEST CONDITIONS
3.2.1 Test Gas Selection Criteria
The selection of gases for APG testing is very important since, ideally, one would like to
minimize the extent to which experimental results must be extrapolated in order to predict actual
conditions. Three questions must therefore be addressed in selecting appropriate gases.
1. What rocket motor environments are anticipated?
2. What are the important surface reactions?
3. What are the operating limitations of the APG?
Test gases must be defined for two different kinds of tests. First, a comprehensive set of
gas mixtures must be defined to allow a full kinetic characterization of the test material. Sec-
ond, a gas mixture or a set of gas mixtures must be defined for experimental screening or ranking
of materials similar to those which have received the full characterization treatment. Although
it is likely but not necessary, the screening gases and their test conditions will be a subset of
the full characterization test matrix.
3.2.1.1 Rocket Motor Environments
Rocket motor environments were based on three advanced MX propellants, namely,
* XLDB
* HTPB
* PEG/FEFO
Representative elemental compositions and flame temperatures are given in Table 2. For the
purpose of studying surface kinetics only, the elemental composition of the propellant gL needs to
be considered. The solid At 203 does not enter into the surface kinetics problem although it prob-
ably contributes to surface erosion rates. Table 3 gives representative compositions of the propel-
lant gases with all the At and an appropriate amount of oxygen removed as AZ2 03 . The ACE/GASKET pro-
gram was used to determine the concentration of gas species which would exist at the carbon surface
for three conditions: (1) surface equilibrium, (2) very small surface ablation, and (3) a nonreact-
ing surface at typical surface temperatures (22000K to 33000K). Those species with siqnificant con-
centrations would then be candidates for reactants and/or poisons. A typical distribUion of sur-
face species as a function of temperature for an HTPB propellant is shown in Figure 8. This solution
represents the kinetically controlled ablation of edge-oriented pyrolytic graphite at a thruot

TABLE 2, REPRESENTATIVE COMPOSITION AND FLAMETEMPERATURE OF ADVANCED MX PROPELLANTS
Propellant XLDB HTPB PEG/FEFOFlame Temperatures (0K) 3880 3690 3787
(0F) 6524 6182 6360
Mass Fraction
H 2.5 4.0 2.6
C 13.5 8.4 12.5
N 24.0 9.0 23.0
0 39.5 40.0 37.9
F - - 1.5
AL 18.5 17.6 18.5
Ct 2.0 21.0 4.0
TABLE 3. PROPELLANT GAS COMPOSITION(At2 03 REMOVED)
Propellant XLDB 11TPB PEG/FEFO
Mass Fraction
IH 3.8 6.1 4.0
C 20.8 12.7 19.2
N 36.9 13.6 35.4
0 35.5 35.2 32.9
F - - 2.3
C, 3.0 32.4 6.2
23

Co9
i- H2
10-2
COCO2
CO4

pressure of 39.4 atm from the ACE/GASKET calculations. Those species considered as possibly signif-
icant reactants (molar concentrations greater than 0.1 percent) are:
* CO
* H20
* H2
* N2
* CO2
* HC
* HF (HF not a specie for the HTPB solution)
It should be noted that other species, such as C9, and H, appear in representative amount and
may also be important. Still other species, such as 0 and OH, though present only in small quanti-
ties, may have very fast reaction rates. The concentrations of these latter species decrease
rapidly as the surface temperature increases. In fact, at typical rocket motor temperatures, these
concentrations are too low to cause any significant amount of carbon removal. Atomic hydrogen has
been shown, at least in one case,* to react slower than H2 and since the concentrations of H2 are
an order of magnitude greater than that of H, ablation due to the latter will probably be insignif-
icant. C1, a halogen, is a potential poison; however, there is no firm evidence for this behavior.
Thus, the species of interest are those previously listed.
3.2.1.2 Important Surface Reactions
The most probable surface reactions can be identified by considering the available species,
the possible reactions with carbon, and the equilibrium constant for each reaction. (The equilib-
rium rate serves as an upper limit to the surface kinetic rate.) Of the reactions considered, only
the following have sufficiently large equilibrium constants in the temperature range of interest:
C* + H20 + CO + H2
C* + CO2 2CO
2C* + H 2 - C2 H2t
Personal communication. Professor D. Rosner, Yale University.tAlthough C2H2 does not appear in the list of gas species, the reactions should not be ruled out.Hydrogen is present in large concentrations (approximately 25 percent by mole) and the C2H2 comingoff the surface may be eliminated by gas phase reactions.
25

The reactions of carbon with CO, N2, HCU, and HF are not considered significant since the equilib-
rium formation rates are too small. However, they may have inhibitor properties.
The mechanism of poisoning, or inhibition of surface reactions, is basically one of active
site competition. That is, a poison specie may occupy an active lattice site and thus prevent a
reactant from occupying that site. Of the seven species listed as possible poisons, only N2 will
not be considered because it appears to be inert as far as surface kinetics are concerned.* Al-
though H20 and CO2 readily react with the carbon surface they also occupy lattice sites and thus,
in that sense, are poisons for each other.
3.2.1.3 Arc Plasma Generator Limitations
The design and operation of the arc plasma generator imposes restrictions on the choice and
the use of certain test gases. There are two basic areas of concern; first, the effect of a partic-
ular gas on the vital components of the APG (cathode, anode, constrictor segments, etc.) arid second,
the stability of the arc when operating with a particular gas or combination of gases. The situa-
tion is further complicated by the desire to produce a test gas at the highest possible temperature.
This generally requires arc heating of the largest possible portion of the total test gas flow to
the maximum temperature achievable, i.e., maximum energy input, while minimizing the energy losses
to the cooled walls of the APG.
With the design of the APG currently being used, it is necessary to avoid injecting any
oxidizing species into the arc heater as the primary gas. This is due to the tungsten material
used in the cathode, which when rapidly removed through oxidation processes can both limit APG run
times to the order to seconds and cause catastrophic failure of the arc heater. The normal solu-
tion employed is the injection of such gases several constrictor duct diameters downstream of the
cathode. This has been highly successful when the required test gas is simulated air, using in-
dividually injected nitrogen and oxygen. However, in the case of propellant simulation, there is
an additional problem. The reactive nature of the base species, hydrogen, which for reasons of arc
efficiency and maximum power input is the arc heated gas, requires the injection of oxidizing spe-
cies downstream of the arc heater portion of the APG, in the plenum section (see Figure 1). rhils
is primarily due to the combustion induced turbulence which adversely affects the stability of the
arc, resulting in failure of the constrictor segments. Therefore, the primary or arc-heated gases
must be either inert or nonoxidizing; the remainder of the test gases required to make up the
Kinetic rate data in Reference 6 substantiates the inert behavior of N2.
26

propellant simulation are injected in the plenum section. This results in lower overall AG effi-
ciencies due to the portion of the test gas which is not directly arc heated and the losses to the
plenum section from both the arc heated primary gases and the exothermic reactions which take place
in the plenum. The net effect is lower test gas temperature and hence lower test sample surface
temperature.
The "normal" APG limits of pressure, current and power input must also be considered. These,
in general, are less severe than those discussed above and typically can be accommodated through
arc heater and power supply configuration changes. It should be noted that this is especially true
with hydrogen, which is very sensitive to the gas injection configuration and arc heater constric-
tor length. The penalty for use of an improper configuration is usually very unstable arc opera-
tion.
3.2.1.4 Potential Test Gases
As described in Section 3.2.1.2, the potentially important reactants are H2, H20, and CO2.
In an APG, various concentrations of these gases can be mixed and reacted to form the test stream.
By judicious selection, various reactants and poisons could be isolated in a systematic manner so
that appropriate reaction rate constants could be determined. Possible test gas mixtures are shown
in Table 4. These gasas are separated into three groups, reactions which include H2, H20, CO2 '
and CO, reactions with these gases and HCZ, and reactions with HF in lieu of HCO The surface redc-
tion designations are shown in Table 5. The number of test gases to be used in a material charac-
terization test matrix would be selected as a subset of the gases tested in Table 4. This selection
will be based upon a trade-off between the degree to which a particular reactant (or poison) can be
isolated and the operating limitations of the APG. Note that the exhaust gas composition is only
representative and that all gases that contain CO will also have CO2 ii small quantities. At high
temperatures, it is not possible to have large concentrations of CO2 in the presence of H2 since
the preferred species would be H20 and CO.
3.2.2 Test Gas Selection
The gases shown in Table 4 that contain HCZ and H1F require special toxic gas handling sys-
tems. The current Aerothenn APG facility is equipped to handle HCZ, although a number of nontrivial
additions are required before HF can be used. For this reason, test gases that contained HF were
eliminated during the test gas selection.
27

v n w' n-
V, o- 4) - -
ccW4 v - N:V,
41W, -wF-
orota r--r C! L C) a Ci L ,L
4-.
w 0 4t ~ ~ N ,-NN N N~~'O ~ u
0 L 0
wm 00C
______________ 4
00
-28 - - )

TABLE 5. SURFACE REACTIONS
4 co inhibition
5 HCZ Inhibition
6 HF Inhibition
29

3.2.2.1 Test Gas Evaluation
Test gases 1 through 8 have been evaluated under a wide variety of APG conditions using both
water-cooled calorimeters and carbon test sections. These tests clearly show that test gases 2 and
4 resulted in anomalous heating conditions. The orobable cause can be defined by considering the
schematic of the APG shown in Figure 1. In normal operations, H2 or an inert gas such N2, Ar, or
He is used as the arc heated column and all other gases are injected between the arc column and the
plenum chamber. If we consider test gas 2 as an example, the ratio of injection gas (02) to arc
column gas (H2) is 4/9. However, mixing of the two gases will be dependent upon their relative mass
rates. A simple conversion shows that the relative mass of injection gas to arc column gas is ap-
proximately 7/1. It was originally anticipated that combustion induced turbulence could result in
adequate mixing in the plenum, however, measured data suggested a high concentration of low enchalpy
injection gases near the walls of the test section. This rather poor mixing of arc heateu and in-
jection gases made the test data impossible to adequately analyze. Subsequent trial and error exper-
imentation showed that ratios of injected gas to arc heated gas of less than 5 (by mass) would re-
sult in adequate plenum chamber mixing.* Thus test gas number 5 wis also eliminated.
Experimentation with test gases 4 and 10 revealed a second difficulty. The kinetic reaction
rates of CO2 with H2 are much slower than those of H2 with 02. In fact, some simple kinetic calcu-
lations revealed that the,.e was insufficient residence time in the plenum chamber to attain thermo-
chemical equilibrium. Thus, all gases which would normally inject CO2 would be replarpi by an equi-
valent combination of CO and 02.
Fromi the above discussion, HC test gases 12 and 13 can be eliminated outright, however, UdS
number 11 can be made acceptable by reducing the relative moles of HCX from 8 to 2.
3.2.2.2 Recommended Test Gases for Full Characterization Studies
Based upon the discussion in Section 3.2.2.1, the test gases for material characterization
studies were reduced to the subset shown in Table 6. Note that CO2 was not used as an injection
gas and that it was replaced by an equivalent quantity of 02 and CO. Note also that HF gases were
not included since the advisability of testing with HF has not yet been assessed.
It is assumed that at least one of the injected gases will be 02 so that there will be :ombustioninduced turbulence.
30

TABLE 6. RECOMMENDED MATERIAL CHARACTERIZATION TEST GASES
I APG Input Gases Equilibrium Exhaust Gases Surface
No. Relative Moles Relative Moles racRt Reactions
102 Tr t - -(see Table 5)H2 02 CO Ar HC H2 H20 CO Ar HCU
I 1 0 1
2 2 1 4 0.2 2 4 2,4
3 8 1 2 6 2 1,2,4
4 8 1 1 4 6 2 1 1,2,3,4
5 2 1 2 4 0.5 2 2 4 2,4
6 10 1 1 10 1 1,5
7 8 1 1 3 6 2 1 1,2,3
8 8 1 1 1 5 6 2 1 1 1,2,3,4,5
9 1 0 1 Inert Ga
Arc heated gas
Mass ratio of plenum injected to arc heated gases (approximate)
31

With the exception of the HF inhibitor, all other surface reactants are represented by this
set of reactions. It is clearly not possible to isolate reactions other than H2 since oxygen-
bearing species (C02, H20) will react with solid carbon to form CO and in gas phase equilibrium, a
small quantity of CO2 will also be present. The reactions shown in Table 6 represent a good com-
promise between the desire to isolate reactants and still stay within the operating limitations of
the APG. An inert gas was also included in Table 6 to test for shear removal affects. Inert gas
tests were run at the highest heating conditions compatible with APG limitations. With 3 tests for
5 react'.ig gas mixtures, 2 tests for 3 mixtures, and 1 for the inert gas test, a minimum of 22
tests were required. Six additional tests were planned as contingency or repeat tests and were per-
formed as required. Thus, a total of 28 tests were planned for each characterization material.
3.2.2.3 Selection of Test Gases for Limited Characterization Studies
Since fewer samples were to be used for the limited characterization materials than the fully
characterized materials, more st,'ingent criteria were imposed on the selection of these test gases.
Test gases should satisfy the following thermal performances, without exceeding the performance
limitations of the arc plasma generator:
* High condition - qc.w. = 1600 Btu/ft 2sec, run time = 80 sec
* Medium condition - qc.w. = 1200 Btu/ft 2sec, run time = 100 sec
* Low condition - q, 1000 Btu/ft 2sec, run time = 120 sec
Furthermore, these test gases should also be able to characterize the surface reactions as shown in
Table 5.
The test gases were selected statistically from the results of the full characterization
studies. The probable error for each test gas with respect to the least square curve fit for all
test gases was determined ic the process of correlating kinetic data. The test gas with the least
probable error was considered to be the potential candidate for limited characterization Atudies.
The results of the statistical evaluation of test gases for each generic material are shown in
Figures g through 11.
rurther analyses are required to reach the final set of test gases for limited characteriza-
tion studies. The reason is that test gases which were selected statistically may serve a s1mu11
purpose in characterizing surface reacticns. Such redundancy should be avoided if tte number uf
data to be taken are limited. For example, in determining test gases for carbon/cdrbon mdterioi1,
32

0.15
C)C
t.4
0L
0 0 04
°11
-- r
00-- N -
Figure 9. Statistical evaluation of test gases, layerpyrolytic graphite.
33

0.15,
0.10
0
.05
L
L) 00
00
rest gases
Figure 10. Statistical evaluation of test gases, ATJ bulk graphite.
34

0.15
0.10
00
I.
0.050CD
(D X
(\j X
00\, CO
I0
0 0 ,
S3 4I 6 1
lest oda'es
Figure 11. Statistical evaluation of test gases,Pyrocarb 901 carbon/carbon composite.
35

from a minimum error standpoint, test gases 2, 3, and 4 (see Figure 11) should be selected. However,
they do not provide enough isolation of specific reaction to be a good screening gas set. To arrive
at the final screening gas set, gas 2, which is similar to gas 3, was replaced by gas I in order to
get an isolation of H2 reactior. Similarly, gas 4 was replaced by gas 7 in order to assess HCZ in-
hibition. As for CO inhibition, a test gas with an arbitrary amount of CO is not required for all
gas systems with 02. Thus, the final test gases selected for limited characterization of carbon/
carbon are 1, 3, and 7. Similar arguments were used for other generic materials. The resultant
sets of limited characterizetion test gases are shown in Table 7.
3.3 CARBON MATERIALS SURFACE KINETICS CORRELATION PROCEDURE
The ability to achieve a successful empirical formula which describes the reactivity of a
carbon surface with propellant gases depends strongly on the selection of the correlation function
and the kinetically-controlled reactions. Based on previous Aerotherm experience (Reference 2),
the surface kinetics of pyrolytic graphite were correlated by applying the Langmuir-Hinshelwood
model and assuming that the following reactions were kinetically controlled:
C* + H20 H2 + CO
C* + CO2 2C0
2C* - H2 C2H2
These kinetically controlled reactions can be inhibitea by H20, CO2, CO, H2, HCZ, and hF.
Since it is logical to conclude that all carbon materials have similar kinetil heg'*vior, the
same kinetic model was adopted to correlate all the fully characterized materials. In addition,
the mass consumption rate due to sublimation is included when surface temperatures exceeding 6000°F
are expected.
Carbon surface kinetics based on the Langmuir-Hinshelwood model is given by:
ni -Ei/RTw j1iw e wi K i prod i
I +/ (3)
where the subscript i denotes each of the reactants, H20, CO2' and H2. The numerator of Equation
(3) describes the surface reaction with gas phase species, and the denominator describes the
36

TABLE 7. RECOMMENDED TEST GASES FOR LIMITED CHARACTERIZATION STUDIES
Test Gas Modified Bulk Carbon/ Surface ReactionsNo. Pyrolytic Graphite Graphite Carbon (See Table 5)
1 1I-______
3_ _________ 1, 2,34
8 j _____ _______ 1, 2,3,4, 5
37

surface coverage by gas phase species. As can be seen, the surface reaction can be retarded if the
surface is either desorption controlled or is poisoned by species such HCZ or HF.
The correlation function requires further manipulation before applying an Aerotherm least
squares fitting program to determine the coefficients. Usually, the following assumptions are made
to simplify the correlation function: the reverse rate is negligible compared to the forward rate,
and H20 and CO2 surface reactions have the same activation energy and the same inhibiting effect by
the gas phase species. These two assumptions can be easily removed if sufficient kinetic data are
available. With these two assumptions, Equation (3) can be rewritten as:
MC = "EI/RTw - mc (4)
MC= Ble =n 2 -Ez/IRw,(4
PH2 +B2T e PH2 O + B3'C02)
Dl D2
where
0- [I + (AP)H20 + (AP)co2 (AP)co + (AP)H2] H2 (5)
D2 + (AP)H20 + (AP)co2 + (AP)co + (AP)H2]H O 2 (6)
The coefficients which must be determined from the data analysis are A, B, n, and E.
The data required to correlate carbon material surface kinetics were obtained from arc plasma
generator (APG) and motor firing tests. The APG data provides information on total surface reces-
sion, surface temperature, experimental time, and reactive gas chamber conditions. These data have
a relatively low surface temperature (3000'R - 55GOR) and edge pressure (2 - 7 atm) range, but can
be utilized to characterize H20 and CO2 surface reactions. The motor firing data provides similar
information except that the surface temperature is unknown. However, this surface temperature can
be estimated with a semi-infinite slab analytical solution. The motor data generally have higher
surface temperatures (5500*R - 6000'R) and edge pressures (30 - 100 atm) than the APG, and can be
used to characterize the H2 surface reaction.
These raw data required further reduction before use to determine the kinetic coefficients.
This data reduction procedure is described in the next section. The reduced data contains informa-
tion on mc' Tw, Pe' and surface composition.
38

Given a sufficient number of data points with mc' Tw' Pe' and surface composition known, the
coefficients in Equations (4), (5), and (6) can be determined using an Aerotherm least squares fit-
ting program. In principle, the coefficients are adjusted systematically to minimize the residual
of the least squares curve fit through a plot of log (MCi) versus Twi. The systematic adjustments
of the coefficients are based upon the method of steepest descent in the vector space of R(Ai, Bi,
El). Because of the large number of coefficients and the fact that there is no assurance that the
residual R is unimodal, there may be several local minimums. Whether or not the true minimum is
"discovered" by the optimization search depends largely upon the initial prescribed values of the
coefficients.
Because the current data presumes no advance knowledge of the reaction kinetics of the fully
characterized graphite materials, the starting point of the optimization search was arbitrarily
started with the coefficients determined for c plane oriented pyrolytic graphite (see Reference 6).
Since the surface temperatures for the motor firings were approximated with a best guess
solution, it was necessary to analyze the data in the following steps to arrive at the final kinetic
coefficients.
1. A correlation of the APG data and the motor firing data (based on approximate surface
temperatures) was obtained using the least squares optimum seeking code.
2. The coefficients were input into GASKET for each motor firing data point.
3. CMA solutions were obtained using the GASKET generated surface thermochemistry tables.
This yielded a predicted surface response for the fully characterized graphite material.
4. The CMA results were used to update the motor firing data points. An arbitrary choice
was made to use tne data at the halfway point of the firing duration.
5. A second correlation was obtained from the APG data and the updated motor firing data.
39/40

SECTION 4
ANALYSIS OF APG TEST RESULTS
Arc plasma generator test data are shown in Table 8 for the full characterization materials.
These data are not in a form compatible with the surface kinetics correlation procedure; hence, fur-
ther data reduction was required. A procedure was set up to reduce the APG test results (P , H0, K.,
Tw, AS, experimental) for these kinetic correlations. This procedure is as follows:
* Determine the boundary layer edge condition
* Evaluate the heat and mass transfer coefficients
s Determine the open system surface state chemical equilibrium solution using measured
carbon consumption rate and surface temperature
The net effect is a relationship between carbon consumption rate, surface temperature and partial
pressures of gases adjacent to the ablating surface. The reduced data before correlation, for all
the full characterization carbon materials, are presentea in Table 9.
APG test data for the limited characterized materials are shown in Tables 10 through 12.
Because no correlations were attempted, no further reduction of this data was required.
4.1 CARBON CONSUMPTION RATE
The carbon consumption rate can be calculated from the expression:
mc = 12 p (7)
where p is the carbon density, As is the total measured recession (in.), and 0 is the iLtuil reaction
time. However, the determination of rc is not straightforward because u is nknown withuut a prior
knowledge of the surface kinetics.
One way to estimate the reaction time is to assume the tested carbon material has ' kinetic
response similar to edge PG. Substitution of the measured surface temperature history into the
edge PG surface kinetics expression allows a recession rate history to be obtained. The reaction
time is approximately the time interval between the final time and the time where the recession rate
suddenly increases.
41

TABLE 8. ARC PLASMA GENERATOR DATA FOR FULL CHARACTERIZATION MATERIALS
Test Model Test I P H 0 Tw AS expNumber Number IGas (atm) (Btu/lbm) (lb/ft2 sec) (mils) (sec)
2809-1 178 C 1 3.25 35,700 4300 0.0007788 1.58 39.0
2810-1 169 C 1 3.48 46,230 5000 0.002214 7.30 59.0
2811-1 177 C 1 3.55 55,500 5358 0.002370 11.80 52.0
2813-1 196 C 3 5.20 8,470 4150 0.009755 56.40 62.0
2814-1 176 C 3 5.18 10,930 4400 0.01214 35.10 32.0
2815-1 168 C 3 4.825 14,630 4899 0.01126 59.40 39.5
2817-1 167 C 4 5.13 6,300 4300 0.008424 28.20 49.0
2818-2 194 C 4 5.10 6,970 4850 0.009599 48.20 55.0
2820-2 195 C 2 5.00 2,590 4800 0.007652 39.20 -56.0
2821-2 187 C 2 4.95 2,060 4750 0.009083 41.00 59.0
2823-3 163 C 5 6.25 1,440 4800 0.01046 40.30 59.0
2823-5 172 C 5 6.25 980 4350 0.007058 31.50 59.0
2826-2 186 C 6 5.60 14,950 5200 0.004946 14.80 42.5
2828-1 171 C 6 5.70 12,750 4900 0.003918 15.70 58.0
2829-2 185 C 6 5.40 10,210 4350 0.0007746 2.75 56.5
2831-2 162 C 7 4.32 12,880 4850 0.005305 26.10 59.5
2832-2 170 C 7 3.98 12,480 4850 0.004878 24.00 61.5
2833-2 161 C 7 4.00 10,260 4600 0.006103 19.50 41.5 1
2836-2 190 C 8 5.30 12,340 5000 0.004929 23.50 56.5
2838-2 184 C 8 5.05 12,140 4800 0.004667 21.30 59.0
ATJ
2585-1 003 C 1 4.48 64,000 4900 0.000999 6.71 61.0
2589-2 004 C 3 5.50 8,190 3860 0.00770 33.90 40.0
2591-1 005 C 3 5.50 13,700 4500 0.0110 47.80 39.5
2592-1 006 C 3 5.70 16,700 4750 0.0117 52.80 41.0
2593-1 007 C 1 4.20 55,130 4900 0.00102 4.38 39.0
2594-1 009 C 3 5.00 9,520 4100 0.00908 53.00 52.0
2597-1 010 C 4 5.85 9,300 4600 0.00830 44.30 48.5
2607-1 008 C 2 7.70 911 3720 0.0166 89.00 48.5
2609-1 011 C 2 4.80 4,030 3980 0.01903 84.80 40.5
42

TABLE 8. Continued
Test 1 Mdel Test Po Ho Tw m As aNumber Number Gas 00Wexp
(atm) (Btu/lbm) (°R) (lb/ft2sec) (mils) (sec)
ATJ (Concluded)
2617-1 013 C 2 5.35 2,930 3860 0.00810 39.20 38.0
2619-1 014 C 5 5.40 1,800 4000 0.00733 34.70 44.5
2619-2 015 C 5 6.40 1,660 4200 0.00896 43.40 43.0
2620-2 016 C 5 7.15 1,460 3580 0.00395 10.00 24.0
262G-3 017 C 5 6.45 905 3720 0.00540 26.40 44.5
2815-3 019 C 3 5.10 14,700 4950 0.01325 52.50 40.0
2817-3 028 C 4 5.30 5,560 4500 0.01998 82.50 48.0
2818-1 029 C 4 5.00 6,430 4450 0.010991 48.40 45.0
2818-4 030 C 4 5.25 7,000 4800 0.00903 50.70 54.0
2820-1 0?7 C 2 5.00 2,550 4900 0.01075 50.30 55.0
2823-1 020 C 5 5.45 1,470 4750 0.008819 53.40 59.0
2826-1 021 C 6 5.70 14,710 5300 0.004192 15.00 37.0
2827-1 022 C 6 5.63 13,250 5050 0.003292 14.50 57.0
2829-3 023 C 6 5.16 [10,280] 4600 0.0008054 2.66
2831-3 024 C 7 4.30 13,280 4850 0.004814 26.50 59.0
2832-3 025 C 7 4.30 11,810 4850 0.004723 27.30 60.0
2834-1 031 C 7 4.05 9,290 4500 0.004704 24.60 38.5
2837-1 018 C 8 4.85 12,940 5000 0.004872 20.25 48.5
2838-3 026 C 8 4.95 12,640 4850 0.005450 30.00 63.0
15% SiC PG
2668-1 104 C 41 6.60 11,780 4850 0.01014 26.00 32.0
2669-1 105 C 4' 6.20 6,209 400n 0.00369 9.45 31.0
2672-1 106 C 1 3.35 36,590 4250 -0.0002645 -0 52 33.0
2674-1 107 C 1 3.15 31,370 4050 0.0000272 (j.05 34.0
2676-1 108 C 2 6.08 2,650 3720 0.002111 2 67 32.0
2678-1 109 C 3 5.62 8,550 4150 0.004179 11.25 34.0
2679-1 110 C 3 5.50 11,880 4775 0.01493 31.90 31.0
2680-1 111 C 3 5.65 15,470 4900 0.01525 40.40 32.0
2705-1 114 C 7 4.32 9,890 3760 0.0002457 1.05 58.0 j

TABLE 8. Continued
Test Mdel Test PO Ho0 Tw AS s OeilNumber Number Gas (atm) (Btu/Ibm) (R) (lb/ft~sec) (f I s) (sec)
15% SiC PG (Concluded)
2707-1 115 C 7 4.58 12,180 3900 0.001577 5.73 55.5
2709-1 116 C 7 4.60 14,140 4350 0.005113 23.60 59.0
2711-1 117 C 7' 5.13 7,860 3960 0.008093 16.60 30.0
2712-1 118 C 7' 5.53 8,430 4000 0.006700 27.20 57.5
2715-1 119 C 8 4.80 10,040 4200 0.004235 20.45 60.0
2716-1 120 C 8 4.48 10,190 4150 0.003978 27.20 90.0
2719-1 121 C 3 5.28 11,680 4300 0.01086 39.90 44.0
2721-1 122 C 3 5.40 9,730 3920 0.007406 31.65 55.0
2723-1 123 C 1 3.30 31,580 4400 0.001009 4.40 57,0
2725-1 124 C 1 4.00 45,450 5050 0.004020 13.40 I 42.5
2727-1 125 C 4' 5.85 7,180 3780 0.002808 9.00 50.5
Pyrocarb 901
2809-2 140 C 1 3.25 36,630 4350 0.0005241 3.08 55.0
2810-2 142 C 1 3.55 49,320 5000 0.001997 16.75 52.5
2811-2 158 C 1 3.50 55,430 5358 0.005077 21.70 59.0
2813-2 149 C 3 5.00 8,880 4150 0.009770 42.80 36.5
2814-2 150 C 3 5.00 10,300 4700 0.01116 44.70 37.5
2815-2 159 C 3 5.00 14,200 5100 0.01147 51.50 39.5
2817-2 151 C 4 5.00 6,140 4700 0.009489 58.80 56.0
2818-3 160 C 4 5.00 7,060 5100 0.01329 63.90 45.0
?820-3 137 C 2 5.00 2,540 5200 0.008035 49.80 58.0
2821-1 146 C 2 4.90 ?,020 4950 0.009405 59.30 59.0
2823-2 138 C 5 6.20 1,530 5000 0.02257 72.30 60.0
2823-4 147 C 5 5.90 950 4700 0.01856 58.50 59.0
2825-1 139 C 6 4.35 14,850 5750 0.01402 47.20 38.0
2826-3 156 C 6 5.50 15,910 5500 0.006820 26.60 50.0
2828-2 157 C 6 5.65 13,250 5500 0.005640 22.60 50.0
2829-1 152 C 6 5.50 10,420 4800 0.0006405 1.54 42.0
44

TABLE 8. Concluded
Test Mfi de1 Test P 0 Hom T weASNumber Number (atm) (Btu/lbm) (OR) (lb/ft2sec) (mils) (sec)
Pyrocarb 901 (Concluded)
2831-1 143 C 7 4.75 14,010 4900 0.008084 40.60 58 5
2832-1 134 C 7 4.15 12,940 3000 0.008564 33.40 45.0
2833-1 153 C 7 3.82 '9,820 4950 0.007745 24.00 48.0
2836-1 144 C 8 5.30 11,600 5000 0.009186 37.30 55.0
2838-1 154 C 8 5.00 12,170 5050 0.007721 39.60 60.5
45

L~2l
--- _ _ _ o c d
8 R
- --- -2 2- - .. .... .
46

.o .o. .. .. .. .
4 40
0 0 0 0 0 0 0 0 o e o 0 0 0 0 0 0
- -- !
o o oo o o
-J I
' I
007

*8
PCd
~~~~ 0 0
;z ;
0 ~ ~ ~ ~ ~ ~ ~~g 0x
84

o~~~~~~~ Z)0 0 0 C C
492

rp 0 0 0 0 0 0
$ ~* C, C C) . C, 0 'S
A a a
' C,
I K ~I ~ a ~ a a a a a a a a
0a~I
I -- 0
~ ,~ ;~
l'~
~
Co
w
~
I- !'C*I ~ a a
A
t -1 -
a a C
K o~.~~~0CCC
A
C C~~*~C0
0C)~CC~ ~ C.
50

TABLE 10. ARC PLASMA GENrRATOR DATA FOR LIMITED CHARACTERIZATION MATERIAL (CARBON/CARBONS)
Test Nodel Test P0 Ho Tw mAs 0Number Number Gas (atm) (Btu/lbm) ('R) (1b/ft'sec) (mils) (sec)
903 Pyrocarb
2851-1 218 S 1 3.60 55,470 5500 0.003259 16.875 49.0
2855-5 216 S 1 3.50 46,630 5300 0.002393 22.00 87.0
2860-4 219 S 1 3.33 36,820 4800 0.00046 4.76 98.0
2863-1 220 S 3 5.15 13,100 5250 0.00975 44.30 43.0
2867-6 214 S 3 4.93 7,480 4550 0.00825 40.54 46.5
2869-1 223 S 7 4.05 12,490 4800 0.00467 32.78 66.5
2872-5 217 S 7 4.10 9,710 4750 0.00454 35.55 74.0
903 HO
2854-1 250 S 1 3.40 34,700 4700 0.000303 2.9C 99.0
2856-3 243 S 1 3.48 44,280 5200 0.001258 10.90 82.0
2858-2 247 S 1 3.48 53,980 5600 0.00309 17.00 57.0
2864-5 244 S 3 5.10 11,740 5050 0.01171 50.90 45.0
2865-3 246 S 3 5.00 6,200 4200 0.00604 36.80 63.0
2871-2 248 S 7 4.50 12,660 5100 0.00533 32.40 63.0
2874-1 249 S 7 4.60 12,840 4750 0.000802 33.32 43.0
2876-3 245 S 7 4.18 9,280 4800 0.00398 30.78 80.0
HRX-5125
2852-1 229 S 1 3.50 40,460 4950 0.001064 13.38 100.0
2856-1 232 S 1 3.45 44,900 5250 0,001683 18.40 87.0
2859-2 228 S 1 3.65 54,630 5600 0.001684 12.38 58.5
2860-3 231 S 1 3.60 54,030 5650 0.001751 12.98 59.0
2863-2 230 S 3 4.80 12,930 5400 0.01156 52.30 36.0
2870-1 225 S 7 4.12 12,080 4950 0.00525 37.60 57.0
2875-1 226 S 7 4.35 9,760 4850 0.00391 29.70 60.5
hRX-5875
2857-3 239 S 1 3.50 50,270 5250 0.002934 17.89 59.0
2858-1 238 S 1 3.48 50,880 5450 0.003903 23.80 59.0
2864-3 241 S 3 5.0 11,740 5150 0.004624 16.25 34.0
2870-2 240 S 7 4.08 11,830 5000 0.00420 25.60 59.0
51

TABLE 10. Concluded
NTest Model Test P 0 HOTw AsNumber jNumber Gas (atm) (Btu/lbm) (*R) (lb/ft'sec) (mils) (sec)
MOAC 3-D C/C
2854-2 199 S 1 3.40 34,120 4300 0.0001004 0.958 99.0
2861-1 198 S 1 3.68 53,470 5450 0.0007621 4.625 58.0
2864-4 200 S 3 5.15 11,520 5050 0.01255 53.71 44.5
2866-1 202 S 3 5.12 6,100 4300 0.002574 14.85 60.0
2870-3 197 S 7 4.35 11,910 5100 0.00469 26.62 59.0
52

TABLE 11. ARC PLASMA GENERATOR DATA FOR LIMITED CHARACTERIZATION MATERIAL (BULK GRAPHITES)
Test Model Test P H T m As 0Number Number Gas (atm) (Btu/Ib) (°R) (lb/ft2sec) (mils) (sec)
PO 3
2584-2 034 S 1 3.68 41,900 4450 0.0002138 1.33 59.0
2585-2 035 S 1 4.55 61,900 3200 0.002931 13.60 44.0
2585-3 036 S 1 4.60 62,200 - 0.001810 9.54 50.0
2589-1 037 S 3 5.35 7,950 3700 0.00946 46.90 47.0
2592-e 038 S 3 5.95 16,350 5000 0.01027 39.20 36.2
2596-1 039 S 4 5.55 6,570 4100 0.00763 37.80 47.0
2617-2 068 S 2 5.40 2,680 4200 0.00808 39.20 46.0
2855-3 070 S 1 3.53 45,520 5150 0.05900 7.64 83.0
2878-2 071 S 8 4.95 10,740 4800 0.00241 17.16 67.5
2878-4 069 S 8 4.75 8,630 4150 0.00258 21.77 80.0
ATJ-S
2617-4 076 S 2 5.70 2,520 3800 0.00582 1.864 46.0
2853-1 084 S 1 3.38 37,520 4800 0.00057 5.88 98.0
2855-2 077 S 1 3.53 44,960 5000 0.0008184 6.375 74.0
2855-4 085 S 1 3.70 55,100 5350 0.016198 10.06 59.0
2861-3 082 S 1 3.48 54,040 5500 0.001685 10.64 60.0
2863-3 078 S 3 5.15 12,130 5150 0.009112 46.04 48.0
2867-3 081 S 3 4.92 7,560 4250 0.00562 35.50 60.0
2878-1 079 S 8 5.30 10,080 4600 0.00269 17.29 61.0
2878-3 080 S 8 4.75 8,330 4100 0.00244 20.81 81.0
53

TABLE 12. ARC PLASMA GENERATOR DATA FOR LIMITED CHARACTERIZATION MATERIAL (PYROLYTIC GRAPHITES)
Test Model Test P H T m AS 0Number Number Gas (atm) (Btu/Ib) (OR) (lb/ft2sec) (mils) (sec)
HITCO a-b PG
2853-2 094 S 1 2.88 38,980 4800 .000883 7.525 98.0
2857-2 093 S 1 3.20 44,780 5100 .00111 8.58 &9.0
2859-4 099 S 1 2.88 56,260 5250 .001503 7.71 59.0
2861-2 098 S 3.25 54,780 5500 .001755 8.85 58.0
2865-1 100 S 3 4.73 11,640 5000 .005377 17.30 37.0
2867-2 096 S 3 5.60 7,660 4500 .0006469 3.38 60.0
2872-2 092 S 7 4.23 12,680 5000 .00309 16.25 60.5
2872-4 097 S 7 4.00 13,710 4850 .003069 15.48 58.0
2874-2 091 S 7 4.00 9,940 4600 .00104 7.35 81.0
Supertemp.PG
2584-1 040 S 1 3.75 44,200 4550 .000647 3.35 59.5
2586-1 041 S 1 4.28 65,400 5050 .00342 16.79 56.5
2592-3 043 S 3 6.10 16,500 4700 .01292 40.10 35.7
2596-2 044 S 4 5.25 7,260 4650 .01888 46.80 28.5
2597-3 051 S 4 6.45 8,930 4750 .00557 23.50 48.5
2617-5 072 S 2 6.20 2,630 4500 .00477 18.67 45.0
2854-4 074 S 1 3.45 34,850 4750 .0002218 1.89 98.0
2867-1 073 S 3 3.30 9,560 4100 .000104 0.542 60.0
2870-4 075 S 7 4.62 11,940 5050 .00295 15.50 60.5
Pfizer PG
2584-4 045 S 1 3.80 42,400 4450 .0001278 0.667 60.0
2586-2 046 S 1 4.30 64,600 4450 .000341 13.80 I 46.5
2590-1 047 S 3 6.12 9,130 3650 .00636 16.60 30.0
2592-4 048 S 3 5.78 16,600 4800 .01624 60.00 42.5
2596-3 049 S 4 6.45 6,770 4550 .01095 55.70 58.5
2597-2 050 S 4 5.90 9,242 5000 .01126 48.00 49.0
2584-5 087 S 1 3.38 34,330 4250 .000170 1.45 98.0
2860-1 086 S 1 3.75 54,900 5600 .003127 15.50 57.0
54

TABLE 12. Concluded
Test Model Test Po Ho T m AS 0Number Number Gas (atm) (Btu/lb) ('R) (lb/ft2sec) (mils) (sec)
Pfizer PG (Concluded)
2872-1 089 S 7 4.52 12,611 5350 .00939 50.60 62.0
2876-2 388 S 7 4.62 9,123 5150 .00657 45.72 80.0
5% SiC PG
2860-2 235 S 1 3.73 54,730 5550 .00287 14.58 59.0
2864-1 234 S 3 5.45 11,980 5000 .01013 38.00 43.5
2867-4 233 S 3 5.25 7,920 4250 .00447 23.92 62.0
23% SiC PG
2617-3 052 S 2 6.20 2,540 3600 .0000179 .0667 45.0
2854-3 053 S 1 3.28 33,270 4850 .001057 8.68 99.0
2856-4 065 S 1 3.22 45.620 5250 .00680 38.3 68.0
2859-3 060 S 1 3.40 55,080 5450 .010575 34.8 53.0
2864-2 059 S 3 5.25 12,400 5100 .0,231 51.8 28.0
2867-5 055 S 3 4.90 7,500 4550 .01163 53.0 55.0
2872-3 066 S 7 4.18 12,810 4900 .00924 49.0 64.0
2876-1 062 S 7 3.92 9,850 4600 .00503 32.11 77.0
HCF PG
2853-3 203 S 1 3.20 38,820 4850 .001689 3.5 97.0
2865-2 208 S 3 5.50 11,050 5250 .02915 25.54 41.0
2867-7 209 S 3 5.45 6,960 4500 .00117 13.75 55.0
2871-I 206 S 7 4.50 13,280 4850 .01674 .l11 59.0
2874-3 210 S 7 4.50 9,080 4950 .00203 3.04 70.0
55

4.2 BOUNDARY LAYER EDGE SOLUTIONS
The free stream conditions at various locations within the nozzle were calculated based on
the assumption of one-dimensional isentropic flow. This calculation can be easily performed with
the isentropic expansion option in the GASKET program. In order to determine the entropy for the
isentropic expansion calculations, the thermodynamic state of the plenum chember was first cal-
culated based on the measured or evaluated parameters (P , h0, Ki).
4.3 EVALUATION OF HEAT AND MASS TRANSFER COEFFICIENTS
The heat transfer coefficient (PeUeCH) was evaluated directly from experimental measurements
through the following relationship:
Sqcw(e eH cw h o0 - h cw (8)
Where qcw is the cold wall heat flux measured from a calibration run prior to each ablation test,
h is the total enthalpy which is known from the APG operating conditions, and h is the cold wall
enthalpy whicn is merely the sum of the heat of formation multiplied by the mole fraction of each
species in the test gas.
In order to account for hot wall effects, the Bartz equation was used as a scaling function.
For a given geometry, the Bartz equation has the form:
0.8 (. 2 "0.6
(PeueC P)B (Prefue) 1 ref Pr (9)
Thus, the hot wall heat transfer coefficient can be determined from
PeueCH (PeueC l)B,cw X (PeueCH)cw
Through the Reynold's analogy, the mass tr,-nsfer coefficient can also be determined. ThL correlation
frequently employed is (Refer'nce 18).
CM Le"/ = Scre (11)C H Sc ref
For the above computations, all properties are determined from the GASKET prog,-am. The subscript
ref denotes the values at the reference enthalpy state, defined as:
href = 0.36 he + 0.19 h0 + 0.45 hw (12)
The calibration results and the evaluated transfer coefficients are shown in Tables 13 and 14.
So

r q G
IT
LL -
o ; I . l o
coi
o I.. ,
'- •
S Ii
__ _.. ___1;
57

I-
gig f E
C
4--4
cr
I-
M
J *
coo
58

.,o o o
i
i t : ::88 .8
~S9

4.4 OPEN SYSTEM SURFACE STATE SOLUTIONS
The final step of the data reduction procedure is to calculate the mole fraction of reactive
species at the carbon surface. By specifying the edge gas thermodynamic state, Tw, and B', the sur-
face state solution can be determined using the Aerotherm Chemical Equilibrium (ACE) computer pro-
gram. B' is the nondimensional ablation variable and is defined as
B' c (c3B1 u c C(13)PeUeCm
The results of this calculatedi data were presented in Table 9.
60

SECTION 5
ROCKET MOTOR TEST RESULTS
Previous sections have described how botn arc plasma generator and motor firing data were in-
corporated isico the kinetics model. The basic data used was in the form of mass renoval rate, wall
temperature, and wall partial pressures. This data is readily available from arc plasma generator
tests but not from nozzle test firings. For a typical test firing of a full or subscale nozzle,
only the pressure history and final total recession are reported. To deduce the appropriate data,
an iterative procedure for correlating the data was adopted. This was described in a five-step
process at the end of Section 3.3. This section will summarize the nozzle test data and how it was
derived for the five steps. Step I of the correlating procedure requires approximate values of sur-
face recession rate, surface temperature, and species partial pressures at the wall. These were ob-
tained by performing a complete in-depth conduction solution at the nozzle location of interest
using the standard Aerotherm procedure (to be described in Section 7). Since the kinetics constants
needed for GASKET are unknown at this time, a best guess is used. Previously developed constants
for materials roughly similar to the material of interest are typically used. Figure 12 illustrates
a typical surface response predictior. A complete history of surface temperature, surface recession
rate, and cumulative surface recession is obtained from the CMA computer code. Notice thait the data
needed for the correlation varies with time. To deduce only one data point per firing, it was as-
surned that the cunduction prediction procedure accurately predicted the relative time variation of
surface temperature and recession rate. New kinetics constants were felt to improve the accuracy
of the total surface recession only. For this reason, the point in time used for data in all cases
was chosen to be the midpoint of the firing. Surface mass removal rate was deduced froi, the surface
recession rate as follows:
m - (14)
where m : mass removal rate
surface recession rate
p material density
With this data for one or more motor firings, Step I of the correlation procedure could be completed.
61

CC
o
a) 0CA0
)
C
0)0.
IA
CD 0 0C) 0 0 CCD 0 C))
C~U
co CI!-C CD C
C))
CL
C)Ot LopC
o C) C)62

A second prediction was then run with the resulting kinetics model. First, a GASKET predic-
tion was made (Step 2) and then a new CMA prediction was run (Step 3). This second prediction was
identical to the first except for the more refined kinetics constants. Depending on the accuracy
of the first guess, the total predicted recession may or may not match the measured recession. If
not, the newly predicted surface temperature and a modified surface recession rate was used to up-
date the data used in the correlation (Step 4). The modified surface recession rate was defined as:
Smeasured (15)Modified predicted* Spredicted
With this information the final kinetics correlation model was dptermined (Step 5). The final motor
firing data used for all of the kinetics models are summarized in Table 15.
A final complete prediction was maae for each motor firing to verify the kinetics model. In
most cases the model was verified by predicting the measured total surface recession within 25 per-
cent. These verification predictions are referred to as cor'elation studies and are presented
briefly in Section 7 and in full detail in a second final report (AFRPL-TR-76-71).
63

CM CO
0 0 0 (Y
0- CM mc toA L O O C ') C M
to to 0w .t. to m w to 0l I0 0 LAj c t0 n 0 c CM LA C) r- I) to) CD o C) Lc) )C.. "A LC to * LA CO ) cc CO -Iz 0l r.- all Cu ' to 00 01 L~ 0 0 0 - n 0 0 C' A C) to M~ C4
- -- C CM CMi - - --
0 n 0 0 0 o kn n) - t- C 0 - C14 00 c)O) 0) 0 0 C 0a 0 0 Ci 0D Cl) CMj C) C
S-ea 0 01 C) ) 0 1 0 0 C 0 0 rCM C CD
CL'o cc C)w . CS CA~ 0 Ln I,, U) N- LA) LO N- 00 r, qr
U~. C: CL9a -: -.(0 M 0 0D o) m- o" m) C') 0A C A C4)
'- C r-. 'a Ln Ch to M cc m' 0 t- wc -Ch U) to o) %-D M' m' N- r 0 co m' CCr LA
oCM1 LO 0h 0) Ch m~ CM c '-r m' w LA nA CM LA - CMj CC3 M C N ) - L ' '
C') CM4 c; C) L ' 0 ) C C6 m~ CM
co -c -m . r to to CM 0 -
oCMi m' 0 It CC w) c 0 0 m) C to to C, C)Cl0 0 C) cM - CO <r) m- C A C' )
- C) 0 0 0 C c N 0 C) cc C 0 C
L)
to CM, C, 0 C) C) N-i N- LA C C O
LU - C". CM CD) LA 00 t-) C' T C') CM CM1 C Ln- ~ ~ CJ ,C) <r 0n C) o) (7% a% C) 0n M
o.) 0 C) C) Cr) C) m) 0 ) 0u) a)- ie
CD m O NM C) C) C)1 I~ 1 I 0 ) C) :;; cc M-LA -~ C)~ C ) 0) -l "A mC 0) N- N -
-. CM C4 C LA ko 0 0)0 ) ON C) N-i m
CL
OL A
5--
li
co 4-) ucu*C. 0
m~
L) a
64

SECTION 6
EVALUATION OF KINETIC CONSUMPTION RATES
Two procedures were applied to evaluate kinetic consumption rates of carbon materials. The
first procedure, namely full characterization studies, correlated the carbon consumption rate data
from both APG and motor firing testings as a function of the following parameters:
e Surface temperature
e Boundary layer edge pressure
* The chemical composition of the propellant gas
The correlation function used was based on the Langmuir-Hinshelwood model. This model takes into
account such detailed mechanisms as chemadsorption, desorption, and heterogeneous reactions. Thus,
not only is the obvious ablation performance evaluated, but significant physical insights may be
obtained on the competition of active sites by reactive species and poisoning effects by halogen
species This correlation procedure was described in Sections 3 and 4.
The second procedure, namely limited characterization studies, used the APG to evaluate thu
relative ablation performance of the screening carbon materials. This procedure included the fl-
lowing items:
* Selection of test gases that characterized the actual motor firing surface kinetics
* Extrapolation of the APG results to determine the relative ablation performance at
actual motor-firing conditions (Tw = 5500-R - 6000R)
Fully characterized materials were used as a baseline material for the screening materiols fur the
same generic class in order to determine their relative ablation performance.
6.1 RESULTS OF FULL CHARACTERIZATION STUDIES
Kinetic constants and inhibition coefficients of the following materials were determined fromh
the APG and motor firing data using an Aerotherm least squares data optimization program:
* Supertemp Edge PP
s 15% SiC/PG
65

a ATJ Bulk Graphite
* G-90 Bulk Graphite
* Pyrocarb 901 Carbon/Carbon
Carbitex 700 data was available from previous work and its correlation functions were reassessed in
this study. The quality of the data optimization are shown in Figures 13 through 17 and numerical
results are presented in Table 16.
The maximum standard deviation obtained in these correlations is o = 0.16. From a statistical
point of view, these correlations are considered to be satisfactory. The accuracy of these correla-
tions, however, must be further tested by comparing predictions with the motor firing data. The
results of these comparisons will be discussed in Section 7.
The following conclusions were reached from the full characterization studies:
a The H2 - C* reaction has a high activation energy and a relatively large number of active
sites. This kinetic reaction becomes significant at surface temperatures above 5500OR and
is a major contributor to carbon surface recession at motor firing conditions.
The H20 and CO2 - C* reactions have relatively low activation energies and relatively
small numbers of active sites compared with the H2 - C* reaction. These reactions Play
a dominant role in carbon surface recession at temperatures between 4000°R and 55000R.
Their effects, however, diminish due to the dissociation ef H20 and CO2 as the surface
temperature increases.
* HC1 retards the CO2 and H20 - C* reactions, but has no effect on the H2 - C* reaction.
* G-90 graphite is slightly more active with respect to reactants of H20 and CO2 than the
other three full characterization materials,
a Carbon sublimation results in a nonnegligible rate of carbon consumption at anticipated
rocket motor temperatures. The significance of sublimation becomes increasingly im-
portant as propellant and surface temperature increase, especially for materidis with
low carbon ablation rates.
Because of the complexity of the kinetic formulations, it is not possible to make general
comments about the magnitudes of each reaction for a given material. However, one can compare the
reaction rate coefficients, as presented in Table 16, as a function of temperature. These compari-
sons are shown in Figures 18 through 22 for the materials characterized in this study. In addition,
results from earlier studies for Carbitex 700 and Atlantic Research Corporation layer PG are shown
66

1.o
0
Z3n
0 o- 16-
0 0
o .16
E) 112 APG ddta
O it 2' H 20, C02 ' CO AVG datLa
11 I2' 11 20, CO2 . CO, HU~ AIPG dd tdMotor firing data
No ot APG ddtd: 11UDah of correlation: 1/16/75
1F I III II I I
24
l/T x lO (K')
Figure 13. Supertemp PG, c plane surface kinetic3.
67

cy = 0.16SMotor firing data
11H2 AO '-a fa
0 if If 0, GO, CO APG dIdtu
if 11 2 0 , CO . HU~, 06( (dat
2.0No. of APG data =15
Date of correlation 6/75
1.
E
LL
0.
E
4V)
0
0L
-2-
2 34
Figure 14. Results of 15% SiC/PG kinetic correlation.
68

o =O.13 I
-2 E3 Motor fi ri no djto
-E- 112 APG datdj9 Ii2 , itCv, APG datd
E) 12, 1120, CO2 , CO AI, dati
6 112, H20, GO, IC AI'(, dl',
No of APG datd - 21
Date of correlation 1,//
-3
-J
4)
e,,
. -60.
1/T w x 10"-' ° -l
Figure 15. Results of ATJ graphite kinetic correlation.
69

o = 0.07Motor firing data
112 APG datar H2 , HC9 APG data
H2 , H20, CO2 , CO APG (1at,
H2 , H20, CO2, CO, IC; APG datd-1 - _____________
No. of APG data = 18
Date of Correlation 1;1/,'1)
00
-4-
-2 -
4 5
I/I x I)' ( K-')
Figure 16. Results of G-90 kinetic correlation.
70

o 0.09
Motor flring (ataO H2 APG data
H' HC APG data
H F2, H20, C02, CO At) (,db]
If?, 12 0, CO2 , CO, Kc APG d( td
No of APG data - I/- Date of correlation 12//5
o -2
)4-J
0
-' -3- _ __ _ _ __ _
-54 5
Figure 17. Results of Pyrocarb 901 kinetic correlation.
471,

LL C- -- - 7 7
0 00
* c.i ci eJ 0
04 c"
-- to k-
< U
t04. (3 l)
<) -A (% C
C> Cl) m C)-~ 0 C\j 0 '
L.
-D.C 0 0 a CL C')
LU
LUI a) - (ILO 0' 0 0 C)
U)LUCD ~ 0 0(-) 0) 07
u_ - -r CDUK LLU to U Ii
re 4J 4- -6.
U U
CD a
-j)
0000 CsJ 0 cJ- 1 .
u\ 0l (".1 U - C\J 0 C.jI
72

LL. 0 C (. 0 0 >X C) C>J
-Z In 0C>NJ C) C 0L
10 10
C 0 0 0l 0o 0
M 0
o, oI A c ~C.,2 I Cu 0 : ~~a: tn Ln I
4J C a.
cz. C)C
.~U- - -; c k o c
49 El.0
uC
C) a3

LA-
cci cci
00
*-j
w N4N
0 C) 0
m. cl D 0 0 (-
0) 0I- +c U U
+ +A +
00 ,- N
0)0
4J
0) U
74

I X -_ __N
0 2
H 0
- - Edge PG
Figure 18. Reaction rate coefficients forSupertemp edge pyrolytic graphite.
75

-- -- _ -, CO2JOo -"--___ __ __ _
- -\ 2H02
0 "CU
IIII
10 6' 1 --- 1 T
3 R1/1 w j (K I
Figure 19. Reaction rate coefficients for ATJ graphite.
76

-t 0
G-90
10-
Figure 20. Reaction rate coefficients for G-90 graphite.
77

no-
02
N
10,,,
- 10-1 '
1 CO?
oH
tN.
3
0 "
U\
%. ... 15% SiC/PG
x (0K')
Figure 21. Reaction rate coefficients for 15% SiC/PG.
78

V -,
\H0 2
Pyracerb 901
\ 4
10iII (0r-1)
Figure 22. Reaction rate coefficients forPyrocarb 901 carbon/carbon.
79

in Figures 23 and 24. For the Carbitex 700 material, data from Reference 19 (Thiokol) were re-
correlated to be consistent with first-order kinetics. For layer PG, the results were taken directly
from Reference 6 (Schaefer).
Before the reader draws any conclusions from these figures, he is cautioned to qualitatively
account for the facts that:
1. Figures 18 through 24 do not include the effects of inhibitors and poisons
2. The actual carbon consumption rate is the product of the reaction rate coefficient
(modified by inhibitor terms) and the local partial pressure of the reactant at the
reacting surface
Because of these two constraints, valid comparisons of the reaction rates can only be made for
specific propellants. Conclusions based only on Figures 18 through 24 can be very misleading. For
instance, the edge PG results of Figure 18 indicate that the reaction rate for H20 at 6000OR
(l/Tw = 3 x l0-'K"I) is about two orders of magnitude greater than that for H2. However, GASKET
code calculations show that the mole fraction of H20 is about four orders of magnitude less than
that of H2 (Figure 8). Hence the carbon consumption rate for the H20 - C* reaction will about two
orders of magnitude less than that for the H2 - C* reaction.
6.2 RESULTS OF LIMITED CHARACTERIZATION STUDIES
H2 Test Gas
From the results of the full characterization stidies, it was concluded that H2 is the major
contributor for carbon consumption in the temperature range corresponding to typical motor firing
conditions. H20 and CO2 are somewhat less reactive in this same temperature range. In fact, their
significance diminishes due to the disappearance of both species by dissociation. These findings
suggest that H2 is the most appropriate test gas for material screening in the APG.
An H2 test gas simplifies the interpretation of data. The reason is that the H2 - C* reac-
tion is not strongly inhibited by other gas species, halogens included. Thus, the kinetic rate of
this reaction closely obeys the Arrhenius expression, i.e.,:
A e- E/RTwc = H2
By plotting log (mc /P ) verstus I/T with the APG data, a straight line should be obtained. This
straight line can t;oi, be eAtrapolated to the motor firing temperature range to estimate the ab-
lation performance of the screening materials. Some engineering judgment must then be used to in-
clude the effect of H20 and CO2 reaction.

I j" 0
1 \ 1
C
\°
\\2
. 10- 2 . .
Carbitex 700
10-1
I/1w x W0 ('K-')
Figure 23. Reaction rate coefficients for Carbitex
700 carbon/carbon.
81

JO)
\HC
0 -
Layer PG
Figure 24. Reaction rate coefficients for AtlanticResearch Corporation layer pyrolytic graphite.
82

Figures 25 and 26 show the relative ablation performance of the following carbon/carbon
materials in the APG.
* HRX 5125
* HRX 5875
* MDAC 3-D C/C
* Pyrocarb 903
e Pyrocarb 903 HD
These are compared to the full characterization material, Pyrocarb 901. Based on these results,
the ranking of ablation performance at motor firing conditions was determined and is presented in
Table 17.
TABLE 17. RANKING OF CARBON/CARBONS BASEDON MASS CONSUMPTION PERFORMANCE
Material MeasuredRanking Designation Source Density Reinforcement Precursor
(gm/cc)
I 3-D C/C MDAC 2.0 Rayon yarn 3D orthogonal weave
2 HRX 5125 Haveg 1.55 Rayon fabric 0o-22o-45* ply orientation
3 Pyrocarb 903 HD Hitco 1.90 PAN fabric 0o-450-900 ply orientation
3 Pyrocarb 903 Hitco 1.84 Same as Pyrocarb 903 HD
4 HRX 5875 Haveg 1.82 PAN fabric 0°-22o-45 ° ply orientation
5 Pyrocarb 901 Hitco 1.65 Rayon fabric 0o-45-90* ply orientation
From the carbon/carbon data, an attempt was made to relate the measured relative performance
to the construction of the composite. In particular, the relative orientation of the adjacent plies,
the reinforcement precursor and the composite density were considered. No ply orientation relation-
ship was observed; however, some general relatonships were found for the reinforcement precursor and
the cofoosite density.
Generally, it was found that:
e Rayon precursor composites are superior to PAN precursor composites of equal density
* Within classes of materials that have the same precursors, high density materials per-
form betLer than low density materials
83

1o-2
-- Pyrocarb 901HRX 5125
0 HRX 5875
IMDAC 3-D c/c
jO
EI Il
I I t
S4 1,
i/Tw x 104 (0K-)
Figure 25. Carbon/carbons, APG test gas - H2.

ITg
Pyrocarb 901o Pyrocarb 903
13 Pyrocarb 903 HD
10-s
4
4-1
U '-1
4 6
Figure 26. Carbon/carbons, APG test gas - H 2.
85

These conclusions were made based on the results presented in Table 17 and Figure 27. Figure 27
was constructed from the results of Figures 25 and 26 by extrapolation of a mean line through the
APG data. For reference, these lines are shown in Figure 28.
Figure 29 shows the performance variations of pyrolytic graphite materials in a hydrogen
environment. These materials were fabricated by:
* Hitco and Atlantic Research Corp. (ARC) for a-b plane
e Supertemp and Pfizer for c plane
The ARC and Supertemp mater-als were used as references and are shown in Figure 29 as lines. It is
apparent from this figure that the material source is not important for the ablation performance of
pyrolytic graphites.
The relative performance of modified pyrolytic graphite materials in a hydrogen environment
are shown in Figure 30. These materials included:
# 5, 15 and 23 percent (by weight) silicon carbide codeposited pyrolytic graphite
* 65 percent (by weight) hafnium carbide codeposited pyrolytic graphite
Although it is presumptuous to reach any conclusions from the limited amount of APG data, it appears
that:
* 23 percent SiC/PG performs similarly to edge oriented PG
* 5 percent SiC/PG performs marginally better than 15 percent SiC/PG, which performs
noticeably better than 23 percent SiC/PG. It should be noted that the 23 percent SiC/PG
was highly nonuniform so the 23 percent is merely a nominal indication of the SiC content.
9 65 percent HFC/PG material performs similarly to edge-oriented PG; however, when the mass
loss is transformed to surface recession, the performance of this material is quite good
since it has a density of about 9 gm/cc compared to 2.2 gm/cc for PG
Figure 31 shows the relative ablation performance of P03 and ATJ-S graphite relative to the
full characterization material, G-90 Iraphite. The ablation performance of these three materials is
in the order ATJ-S, P03, and G-90, although the differences between these materials is not signifi-
cant.
H2 - 02 Test Gas
APG results for H2 - 02 gas mixtures are presented without further discussions in Figures
32 through 35.

Tw 6000OR
I0"" 4,
Tw, : 5500'PR
o Tw =5000°RO --R\
10-
TI" 5000OR 5500OR 6000OR
90 (0
0
w
6nAC 0 2
700 > b5125 K P P903 HD 0 0
5875 "
10 " I I I . ... .I ,I
1.4 1.5 1.6 1.7 1.8 1.9 2.0 2.1
p(gm/cm 3)
Figure 27. Measured ablation rates in a hydrogen environment.
87

10-2
0 Pyro 9036000'R E 903 HD
0 HRX 58755500'R E( HRX 5125
5000"R £6 HDAC 3-D c/cx Carb 700
y Pyro 901
10-1 0
512
03 1
E
90
0
10-4
lIT x110
'/ X14 (0K-1)
Figure 28. Data for construction of Figure 27.

? d 10-2
0 Edge PG (Pfizer)
I I QI Layer PG (Hitco)
10-3
El.
4)
oI IIj
10- U.
I I
10-0
3 4 6
I/Tw x 104 (0K-')
Figure 29. Ablation data, pyrolytic graphites, APG test gas - H 2*
89

10-2 Ic'U'
- 15% SiC/Pu3
A 5% SiC/PG
10 E 23% SiC/Pt,
0 65% HfC/PG
10-1
':UI
Cl.
'cu~4,,
0
10-S.
I I/T wX 104 (OK-1)J
Figure 30. Ablation data, modified pyrolytic graphites, APG test gas -H2*
90

10-2 - I
- G- 90
APO-3Q ATJ-S
10-1
02
0
10-1
L/ 04(K1
Fiur 31 baindt,'ukgahts AGts a 2
291

10-
0 MDAC 3-D0 Pyro 901
0 Pyro 903Pyro 903HD
o HRX 5875
0
0 1
0 0
..
I -
o 0
10--
3 4 51/T w X 104 (1/°K)
Figure 32. Ablation data, carbon/carbons, APG test gas - H2/0 2.
92

100 NJ_ -- [!
N .
4-
UI
VTwX 104 (1/0K)
Figure 33. Ablation data, pyrolytic graphites,APG test gas H2/02.
93

0 0 0
10- 0 -S-IC/ilk,______-
0 23% SiC/PG015% SiC/1%
66 Hf(G/P'k
4--4

CI102 - i . ....
V
VV
V ATJ- G-90.,! ]ATJ-S
~p '03
0
44
0
o> 0
13 4T1/T w x 10' (II°K)
Figure 35. Ablation data, buIe graphites, APG test gas - 2/2 .
95/96

SECTION
PREDICTED ROCKET NOZZLE PERFORMANCE
The GASKET2 code (Reference 9), which includes the kinetic models presented in Table 16, was
used to predict many actual motor firings. Specifically, 15 correlation studies and 6 performance
studies were performed. The purpose of the correlation studies was to provide basic motor firing
data to be incorporated in the kinetics correlation. Once this data was provided, the correlation
studies were used to verify the resulting model. These verification calculations, along with per-
formance studies in support of AFRPL technology programs, have been performed and will be summarized
in this section.
7.1 ANALYSIS PROCEDURE
The analysis procedure used to predict motor firings is described in this section. The events
which occur near the internal surface of an ablative rocket nozzle are illustrated in Figure 36. An
inviscid flow field comprises the bulk of the flow of propellant gases through the nozzle. Typically,
the propellant contains less than 21 percent (by weight) of aluminum, which forms liquid alumina
particles that flow qith the other products of combustion through the nozzle. Near the surface,
the flow field is represented by a boundary layer in which alumina particles are not considered to
be present. Chemically reactive species diffuse through this boundary layer and cause surface ab-
lation. The nozzle thermal protection material must respond to three sources of energy transfer
the convection and diffusion of energy across the boundary layer and the radiation or energy from
high temperature alumina particles in the inviscid case flow. All of these energy events result in
a given amount of energy being conducted into the material to cause internal component heating.
The procedure used for ablation predictions treats the inviscid flow field, the boundary
layer and the radiant energy transfer separately. Although the analyses are separate, the final
solution is properly coupled as illustrated in Figure 37. Each area will be discussed individually
in the following paragraphs.
Flow Field
The flow field was analyzed with the "Aerotherm Chemical Equilibrium (ACE)" computer code
(Reference 20). This is a chemical equilibrium code which is used to compute the local therriodynamiL
97

SURFACET II.R;',OCfILMI STRY
FLto14• FLOW
Figure 36. Major areas of analysis in prediction procedure.
98

Io9zL-v
< <LV () -or
LL. LJJ UJI 0.
SC
V)w z V)
w I O : - =:- >- = -
-- I C) F- C
cA;:
TLL ffi L
0D
4.-
LL)~~~U <-j L L
Cf tn
CL W. U < C-
w LA
uw-.
99

state throughout the nozzle. The primary variables of concern are the local pressures, temperatures
and chemical species. These are determined by performing many isentropic closed-system equilibrium
solutions throughout the nozzle. The ACE code can handle any arbitrary real gas by knowing the
chamber state (temperature and pressure) and the propellant elemental composition. Both gaseous
and liquid phases are computed, but no thermal or velocity lags are accounted for. The closed sys-
tem solutions are associated with given positions in the nozzle by assuming one-dimensional flow
and using conservation of mass relations.
Boundary Layer
The analysis of the boundary layer is performed by using the "Aerotherm Real Gas Energy
Integrl Boundary Layer (ARGEIBL)" computer code (Reference 21). This is an energy integral tech-
nique which can handle any arbitrary real gas with the input of general Mollier-type tables gener-
ated by the ACE computer code. Since no alumina particles are in the boundary layer, these proper-
ties are for the gas phase only. Other input consists of edge state variables (Pe and Te) generated
by the flow field analysis. Arbitrary wall temperr.tures are also handled by this code. Since these
are not predicted until a conduction analysis is performed, an estimation of the wall temperature is
required. If this estimation proves to be far in error, an iteration back through the boundary layer
analysis is necessary.
Turbulent flow is assumed and the boundary layer is started (with zero energy thickness) at
the nnse of submerged nozzles and at the base of the aft closure for conventional nozzles. The
nos, of a submerged nozzle is defined as that point furthest axially upstream of the throat and the
base of an aft closure is considered as the point where the nozzle insulation mates to the insula-
tion in the propellant case.
To compute the heat transfer coefficient for ablating surfaces, a blowing correction is made
to the ARGEIBL results. This is a multiplying factor which is a function of the mass injected into
the boundary layer. The correction is made internal to the CMA code and a detaiied iiscuss;on can
be found in Reference 22.
Previous experience has shown that the heat transfer coefficient predicted by the ARGEIBL
code is high and should be multiplied by 0.75; that is:
PeUeCH = 0,75 (PeueCH)ARGEIBL (16)
where (peueCH)ARGEIBL ;s the convective heat transfet coefficient predicted by the ARGEIBL code.
This factor has been included in all of the predictions reported. For the transient in-depth thrmal
100

analysis presented in subsequent sections, Equation (16) is modified further to account for the ac-
tual chamber pressure history by using the relationship:
PeUeCH = 0.75 (p__ _O)o. (OeUeCH)ARGEIBL (17)
aave
where Po0 is the instantaneous measured (or predicted) chamber pressure and Po0ave is the average
chamber pressure assumed for the flow field analysis.
S,jrface Thermochemistry
The surface thermochemistry analysis is performed by using the Aerotherm "Graphite Surface
Kinetics (GASKET2)" computer code (Reference 9). It computes the surface state (complete wall gas
thermodynamic and chemical make-up) of many graphitic materials exposed to a corrosive rocket nozzle
environment. The reactions which occur between the graphite material and the propellant gases are
considered kinetically-controlled and are modeled by Arrhenius-Langmuir type reaction rate equations.
This code can handle arbitrary propellant gases and arbitrary surface reaction kinetic constants.
Kinetics constancs used for the predictions discussed ir, this section are currently included in the
GASKET2 code for the following graphitic materials:
a a-b plane PG
* c plane PG
* 15% SiC/PG
a Pyrocarb 901 carbon/carbon
* Carbitex 700 carbon/carbon
* ATJ bulk graphite
* G-90 bulk graphite
As input, the GASKET2 code requires the local thermodynamic edve state (Pe and T e) and the
elemental composition of the gas, which are obtained directly from the ACE generated flow field
analysis. The mass transfer coefficient is also required and is obtained directly from the heat
transfer coefficient computed by ARGEIBL from the following relationship:
( Pr)2/ 3puC Pr Sc/ u (18)e eCM \ -) PeUeCH
where
Pr = Prandtl number
Sc = Schmidt number
101

The Prandtl and Schmidt numbers are both obtained from the ACE generated Mollier input to the
ARGEIBL code. For nozzles whose pressure traces are far from constant throughout a firing, Equation
(17) shows that the heat transfer coefficient (and thus mass transfer coefficient) will vary with
time. For these cases, up to three surface thermochemistry analyses are performed for a given firing.
The conduction solution procedure then interpolates between these solutions to obtain instantaneous
firing and boundary conditions.
To model the radiative boundary conditions during nozzle firings, a parallel plate model was
used. This model applies to aluminized propellants and assumes that the particle laden stream of
conustion products is optically thick and that it exchanges radiant energy with the surface as if
the stream and wall were parallel plates. In this way, multiple reflections between the wall and
stream were taken into account. In addition, the assumption was made that both the stream and wall
behave as gray bodies and that they emit and reflect radiant energy diffusely. Based on the above
assumptions, the net radiant heat flux relation is given as
inet rad ef (oTs - oT4) (19)
whereI
Leff - Effective emissivity = I/ew + i/Cs -l"
Cw - Wall material emissivity
cs - Particle laden stream emissivity
o - Stefan-Boltzmann constant
Ts - Free stream (edge) temperature
Tw - Wall temperature
To determine tne effective emissivity using Equation (19), the stream emissivity was defined as
= I - exp (_C n pD) (20)
where
C - Empirical constant (0.808)
n - Percentage of aluminum loading
p - local density of propellant combustion species (lb/ft3)
D - Local beam length, usually taken as the diameter (in.)
102

In-Depth Conduction
Both the Aerotherm "Axisymmetric Transient Heating and Material Ablation (ASTHMA)" (Reference
23) and the Aerotherm "Charring Material Ablation (CMA)" (Reference 22) computer codes were used for
the in.depth conduction analyses. Bascially, the ASTHMA code is two-dimensional and CMA is one-
dimensional. Both have the capability of handling temperature dependent material properties. CMA
also has the capability of modeling materials which internally decompose. This capability was not
exercised in the motor firing predictions since only graphitic surface materials were considered.
Figure 37 shows that the flow field (Hr), boundary layer (peueCH), surface thermochemistry
(B' map), and radiation (net radiation flux) analyses are all used as input to CMA and ASTHMA. Also
shown as input are the component geometry and material properties. Material properties are re-
ferenced for each nozzle firing analyzed, but a majority of the properties were obtained from the
"Aerotherm Graphitic Material Handbook of Thermophysical Properties" (Appendix B).
7.2 CORRELATION STUDIES
This section summarizes the 15 correlation studies which were performed. The following five
kinetics models were verified by these studies:
e c plane PG
* 15% SiC/PG
a G-90 bulk graphite
e ATJ bulk graphite
* Pyrocarb 901 carbon/carbon
Predictions were made for test nozzles fired by several companies, using various propellants.
The firings were both fullscale and subscale, with both submerged and conventional nozzles. Those
chosen in most cases were typical of advanced ICBM conditions.
The motors used for the 15 correlation studies are as follows:
C Plane PG
1. TCC, MMIII, HTPB Demo
2. CSD, C-4, 3rd Stage Demo
3. ASPC, C-4, Ist Stage Demo
4. TCC, C-4, 1st Stage Demo (FST-002)
103

5. ASPC, Nimrod 14, Subscale
6. ASPC, Nimrod 15, Subscale
7. CSD, MX, Lower Stage, Subscale
8. TCC, C-4, 30-inch Material Evaluation (3SF-24)
15% SiC/PG
9. ARC, 7-inch
10. ARC, 3.5-inch
11. ASPC, Nimrod 6, Subscale
G-90
12. Rocketdyne Condor
13. CSD, FW-5
ATJ
14. Hercules, X259 Antares II
Pyrocarb 907
15. TCC, C-4, 30-inch Material Evaluation (3SF-24)
Complete details of all of the predictions are given in a second final report (AFRPL-TR-76-71).
Since much of the work is classified, only a brief summary of the results will be presented here.
Figure 38 shows that 12 of the studies predicted total surface recession within 25 percent.
The three that fell beyond the ±25 percent band were studies 1, 5, and 6. The second final report
discusses in detail the comparisons between the predictions and the data.
7.3 PERFORMANCE STUDIES
As mentioned previously, the performance studies were done in suppert of AFRPL technology
programs. A total of six were performed and are summarized as follows:
1. Hercules 3rd Stage MX (Carbitex 700) (Reference 10)
2. Rocketdyne Condor (Reference 11)
3. Hercules 3rd Stage MX (Pyrocarb 901) (Reference 12)
q. Standdrd 7-inch Nozzle (Throat Sensitivity) (Reference 13)
104

I03 w .... '~~It , Iw I 4
I .(, , -4
A /_/Nimirod 14 r ii<),1/
ARC I"
CCD, MX -- 1 tCC. 30"Nimrod 6 ---
0,
O ,ARC,3.5
/CDB CTPB PBAN XLDB PEG HTPB MaterialFEFO ___
? 0 0 Pyrolytic graphite
Ef 15% SiC/PG
G-90"'5 ATJ
L 90110
I)( I I1 I ll
11i(, ,i',r ed (iili
Figure 38. Comparison of measured and predicted ablationior correlation studies.
105

5. Standard 7-inch Nozzle (Nosecap Sensitivity) (Reference 14)
6. BATES Motor (Thermostructural) (Reference 15)
Each study was reported in detail as individual nozzle bulletins published under this contract. In
the following paragraphs a brief overview is given of each study.
Study 1 - Hercules 3rd Stage MX (Carbitex 700) (Reference 10)
The purpose of this study was to compare the predicted performance of a Hercules 3rd Stage
MX test nozzle fired in an HTPB propellant environment (AFRPL, January 1976) versus the original
design environment of an 18.5 percent Al XLDB propellant. The results of the Aerotherm performance
study were used to select a firing time for the nozzle test.
A complete two-dimensional thermal analysis, including surface recession, was performed for
two carbon/carbon components upstream and downstream of the throat and five pyrolytic graphite
washers which formed the throat pack. Another complete thermal analysis was performed assuming a
21 percent At, 90 percent solids HTPB propellant. The chemical compositions and ideal chamber con-
ditions for the propellants are listed in Table 18. The chamber pressure history used is presented
in Figure 39. The nozzle geometry, obtained from Hercules, is presented in Figure 40.
Typical internal temperatures predicted by the ASTHMA code are shown in Figure 41. This par-
ticular prediction is for the HTPB propellant after 60 seconds. Conclusions reached from this study
were that the HTPB propellant was more corrosive than the XLDB propellant and that the nozzle was ex-
pected to withstand a 60-second firing in the HTPB environment. Figure 41 shows that approximately
50 percent of the leading PG washer has receded by 60 seconds. Although it was felt that this nozzle
could sustain a 60-second firing, it was recommended that it be fired in the HTP8 propellant for 40
seconds.
This test occurred in March 1976 and was successful. A detailed comparison of measured and
predicted recession has not been performed to date.
Study 2 - Rocketdyne Condor (Reference 11)
For this performance study, a one-dimensional ablation analysis of the threat was used to
compare the accuracy of the newly developed edge PG kinetics model to Condor firing data. This
motor was chosen to demonstrate the applicability of the kinetics modeling to conditions other than
that of typical ICBM type motors. The Condor firing durations were on the order of 200 seconds in
a low aluminum, low flame temperature propellant. The nozzle is a blast tube type with a throat
diameter of 1.1 inches. The ICBM type test motors (which were primarily used for developing the
current kinetics model) typically have firing durations of less than 60 seconds in high performance
106

TABLE 18. PROPELLANT DATA
Designation - XLDB (18.5% Al)
Formulation -- Element Gm Atoms/QO0 Gms
Hydrogen 2.3475
Carbon 1.2745
Nitrogen 1.8271
Oxygen 2.3897
Aluminum 0.6857
Ideal Chamber Conditions - Pressure = 800 psia
Temperature = 6700OR
Designation - HTPB (21% Al, 90% solids)
Formulation - Element Gm Atoms/lO0 Gms
Hydrogen 3.4864
Carbon 0.6933
Nitrogen 0.5933
Oxygen 2.3766
Aluminum 0.7784
Chlorine 0.5873
Ideal Chamber Conditions - Pressure = 800 psia
Temperature = 6649°R
107

~'600 ____
S400
0
1) 20 40 60 80 100 120 140 160Time (seconds)
Figure 39. Chamber pressure history.
108

C/
47"r 2.8" AraofAnalysis
Figure 40. Nozzle geometry, Hercules test nozzle.
1 09

(x -4 IxI
cr ~ 0 C
%D -. -t M- .. -
Ix + El __
cJ. T --
TiTtE) +
CD 0
E 4 + x xU
00 Cl
a 0 4 4. x t , a S
UD - -o7-
Eii cuI-...............+ x*. 0a) Il
I74.4 0 Jj +
CO x .LS..
LLL
LO L%r C nm)I
0 4:U -- ues~ -ep
11

propellants (18 - 21 percent aluminum and 6000'R - 6900°R flame temperatures). These motors are
usually submerged and have throat diameters from 4 to 15 inches.
The firing data used was obtained from Rocketdyne Solid Rocket Division in MacGregor, Texas.
A series of seven firings wpre given, each of which differed mainly in the prefire temperature of
the motor. The resulting throat erosion rate was more than an order of magnitude less than that
exhibited by typical ICBM type motors and varied considerably amonU the seven firings. Both the
propellant and firing data are confidential and are not included in this report. The geometry is
given in Figure 42.
Figure 43 shows the predicted surface recession as a function of time. The predictions were
found to be approximately 80 percent higher than the average measured recession. This is an accept-
able prediction for the following reasons:
* Firing data indicates that alumina condensed out on PG washers
o Data scatter was large
* Measured recession was very small (making a percentage comparison invalid as an indica-
tion of accuracy)
Study 3 - Hercules 3rd Stage MX (.Pyrocarb 901) (Reference 12)
This performance study is almost identical to Study 1. Recall that Study 1 incorporated PG
washers in the throat and carbon/carbon components up and downstream of the washers. The carbon/
carbon material has a specific gravity of 1.60 and was made by Kaiser. At the time of the predic-
tion, the only carbon/carbon kinetics model available was one developed by Aerotherm for Thiokol
Corporation (P.O. 414011). This kinetic model was specifically developed for Carbitex 700 (S.G.
1.5) and was used for this prediction by adjusting the material to a 1.6 specific gravity.
After Study I was performed a kinetics model for Pyrocarb 901 (S.G. = 1.83) was developed
under this contract. Preliminary indications showed that the kinetics model was markedly different
from that developed for Carbitex 700. With the indication that some carbon/carbon materials behave
differently from others, it was of interest to rerun the prediction of Study I with the newly devel-
oped Pyrocarb 901 model (S.G. = 1.83).
As in performance Study 1, two complete ASTHMA analyses were performed for the carbon/carbon
components and PG washers in the region of the throat. One was for an 18.5 percent At XLDB propel-
lant and the other was for a 21 percent At, 90 percent solids HTPB propellant.
111

C
I4)
0.0
0) at
'4- N
000
)
C'a)
0)
CC")
.0.
112

;, t i - i _________--__*
" --' -
°NN
S.0
*0
- 0U
4-
r t
6 0
11+

Figure 44 shows the predicted isothermal profiles after 60 seconds of exposure to the HTPB
environment. As expected from the kinetics data, the predictions indicated more recession for the
Pyrocarb 901 than the Carbitex 700. This can be seen by a comparison between Figures 41 and 44.
This study showed that the Pyrocarb 901 could not sustain a 60-second firing without severe under-
cuttipg of the PG washers.
Table 19 is included as a further comparison of Studies 1 and 3. Basically, this shows that
the XLDB propellant is not as severe as the HTPB and that predicted recession for Pyrocarb 901 is
more than Carbitex 700 for comparable conditions.
Study 4 - Standard 7-Inch Nozzle (Throat Sensitivity} (Reference 13)
The purpose of this study was to compare the predicted performance of four possible throat
materials in the standard 7-inch test nozzle configuration, namely:
* Pyrocarb 901 carbon/carbon (density = 1.83 g/cc)
* c plane pyrolytic graphite (edge)
* a-b plane pyrolytic graphite (layer)
* 15% SiC/PG
For each material, three propellant environments were considered.
* HTPB
e XLDB
s PEG/FEFO
For each propellant/material combination, a complete one-dimensional thermal analysis including sur-
face recession was carried out at the throat. A total of 12 nozzle analyses' were performed.
The chemical composition and actual chamber conditions for the propellants considered are
summarzed in Table 20. The firing duration was 60 seconds at a cnamber pressure of 1000 psia. The
nozzle geometry is shown in Figure 45(a). Figures 45(b) and 45(c) show the geometries of thE throat
insert depending on whether a coated or sclid component is used.
Of most interest in this study is a comparison of the predicted surface recession for all of
the material/propellant combinations. The predicted total recessions and average recession rates
are tabulated in Table 21. The average recession rates are illustrated in Figure 46. This shows
that the Pyrocarb 901 recedes at least a factor of two or more than the other materials in a given
114

w CC w -tWA 0 0 0 0 0 0
CD. 0 0 0 0 0) 0-. -
( n t o tI -d ~ ) 4 i
x' +
Cd L)
X)(1r0
C~ 0
_ K -
41 x 0
+1It!S
lLri xnIIia
I I U
uLD-"-
-<Vt-t
11
J ~ :115

TABLE 19. RECESSION RATE SUMMARY, HERCULES 3RD STAGE MX NOZZLE
Average RecessionLocation Propellant Material Rate @ 60 secs
(mils/sec)
Upstream Throat XLDB Carbitex 700 6.6
" Pyrocarb 901 8.9
HTPB Carbitex 700 9.5
IPyrocarb 901 12.2
Throat XLDB PG Washers 3.8
" P 'PB " 5.9
Downstream Throat XLDB Carbitex 700 2.1
" " Pyrocarb 901 3.3
" HTPB Carbitex 700 1.8
I Pyrocarb 901 5.5
116

J
TABLE 20. PROPELLANT DATA, STUDY 4
XLDB (21%PBA, PEG/FEFOPropellant (19% Al) 90% Solids) (20% Al)
(GMATOMS,
Hydrogen lOOMS 2.3885 3.4864 2.5416
Carbon 1.2348 0.6933 1.0967
Nitrogen 1.6779 0.5933 1.5528
Oxygen 2.4224 2.3766 2.2753
Fluorine - - 0.0750
Aluminum 0.7042 0.7784 0.7417
Chlorine 0.0423 0.5873 0.1320
Pressure (psia) 1000. 1000. 1000.
Temperature (0R) 6808. 6699. 6772.
117

00
5--
1180

Steel 0.41
MX4926 0.77
Laye PG r Si /PG (b) Layered throat insert
Steel 0.41'1
MX4926 r !. 77-1
Pvrocarb 901or edge PG (c) Solid throi-t isert
Figure 45. Concluded.
119

TABLE 21. MATERIAL RESPONSE SUMMARY, STUDY 4
Throat Total AveragePropellant Mtria Recessiona Recession RateMaterial (in) (mils/sec)
XLDB C/C 901 0.444 7.4
Edge PG 0.203 3.4
Layer PG 0.119 2.0
15% SiC PG 0.145 2.4
HTPB C/C 901 0.588 9.8
Edge PG 0.289 4.8
Layer PG 0.104 1.7
15% SiC PG 0.325b 5.4
PEG/FEFO C/C 901 0.383 6.4
Edge PG 0,156 2.6
Layer PG 0.112 1.9
15% SiC PG 0.095 1.6
a 60-second firing
bExtrapolated (coating burned through at 59 secs.)
120

10.0
9.0
8.0
7.0
6. 0
4J
.0-
2 .0
L
t901 EDGE LAYER S~C 0 DELYRSC 01 DcLYRSC
0
HTP8-10 - XIOB -H f-PEG/FEF0-*~4
Figure 46. Predicted average recession rates, Stuc'y 4.
121

propellant group. It is also evident that HTPB, XLDB, and PEG/FEFO, respectively decrease in cor-
rosivity for all materials except layer PG.
Study 5 - Standard 7-Inch ':zzle (Nosecap Sensitivity) (Reference 14)
The purpose of this study was to compare the predicted performance of five possible nosecap
materials in the standard 7-inch test nozzle. The five materials are:
# ATJ graphite
* G-90 graphite
e Pyrocarb 901 carbon/carbon (density = 1.83 gr/cc)
e Carbitex 700 carbon/carbon (density = 1.50 gr/cc)
* 15% SiC/PG
A one-dimensional thermal analysis including surface recession was performed for each mate-
rial in an HTPB propellant environment. This propellant is identical to the HTPB used in Study 4,
as are the firing duratio, (60 seconds) and average chamber pressure (1000 psia). The nozzle geom-
etry is shown in Figure 47.
Table 22 summarizes the predicted total recession and average recession rate for the five
materials. A more graphic presentation of the average recession rates is given in Figure 48. This
shows that the materials can be ranked by their resistance to ablation as follows:
1. 15% SiC/PG
2. Carbitex 700 carbon/carbon
3. G-90 bulk graphite
4. Pyrocarb 901 carbon/carbon
5. ATJ bulk graphite
Study 6 - BATES Nozzle (Reference 15)
Previous studies were to predict tne ablation performance of rocket nozzle materials. Since
the Air Force Rocket Propulsion Laboratory (AFRPL) has experienced numerous failures of the one
piece graphite nozzle utilized in various versions of the BATES rocket motor, the purpose of this
study was to perform a preliminary structural analysis of the BATES nozzle to understand the reasons
for failure and to recommend solutions to the problem.
122

00
'a 4-, 4.
123Cl

SiC/PG
(4Layered nose cap
Pyrocarb 901Carbitex 700 18
(c) Solid nose cap
Figure 47. Concluded.
124

TABLE 22. MATERIAL RESPONSE SUMMARY
ToalRcesina AveragePropellant Material Total Recession R Rate(mils/sec)
HTPB ATJ O.64S 10.8
I G-90 0.505 8.4
Pyrocarb 901 0.568 9.5
Carbitex 700 0.456 7.6
15% SiC/PG 0.309 5.2
a60-second firing
125

9.0
8.0
4w 6.0
C0
S5.0UCD
S..
S4.0
3.0
.0
1.0
Figure 48. Predicted average recession rates.
126
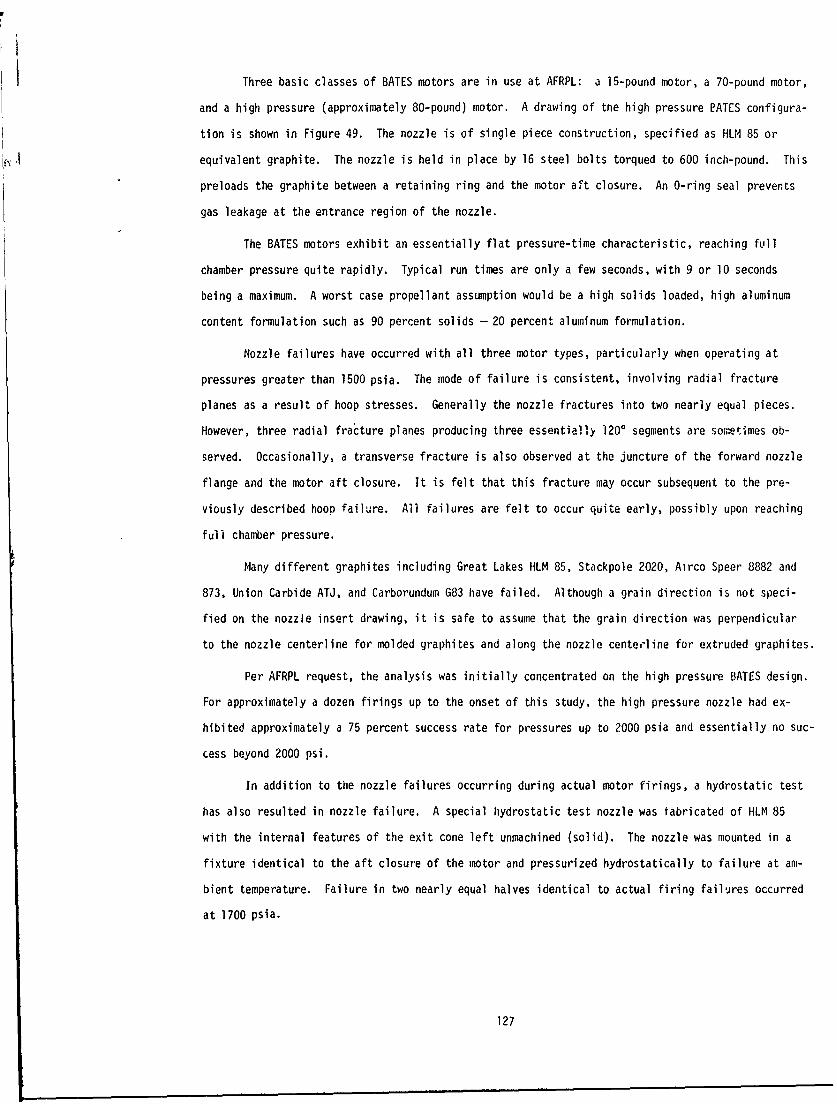
Three basic classes of BATES motors are in use at AFRPL: a 15-pound motor, a 70-pound motor,
and a high pressure (approximately 80-pound) motor. A drawing of tne high pressure PATES configura-
tion is shown in Figure 49. The nozzle is of single piece construction, specified as HLM 85 or
equivalent graphite. The nozzle is held in place by 16 steel bolts torqued to 600 inch-pound. This
preloads the graphite between a retaining ring and the motor aft closure. An O-ring seal prevents
gas leakage at the entrance region of the nozzle.
The BATES motors exhibit an essentially flat pressure-time characteristic, reaching full
chamber pressure quite rapidly. Typical run times are only a few seconds, with 9 or 10 seconds
being a maximum. A worst case propellant assumption would be a high solids loaded, high aluminum
content formulation such as 90 percent solids - 20 percent aluminum formulation.
Nozzle failures have occurred with all three motor types, particularly when operating at
pressures greater than 1500 psia. The mode of failure is consistent, involving radial fracture
planes as a result of hoop stresses. Generally the nozzle fractures into two nearly equal pieces.
However, three radial fracture planes producing three essentially 1200 segments are sometimes ob-
served. Occasionally, a transverse fracture is also observed at the juncture of the forward nozzle
flange and the motor aft closure. It is felt that this fracture may occur subsequent to the pre-
viously described hoop failure. All failures are felt to occur quite early, possibly upon reaching
full chamber pressure.
Many different graphites including Great Lakes HLM 85, Stackpole 2020, Airco Speer 8882 and
873, Union Carbide ATJ, and Carborundum G83 have failed. Although a grain direction is not speci-
fied on the nozzle insert drawing, it is safe to assume that the grain direction was perpendicular
to the nozzle centerline for molded graphites and along the nozzle centerline for extruded graphites.
Per AFRPL request, the analysis was initially concentrated on the high pressure BATES design.
For approximately a dozen firings up to the onset of this study, the high pressure nozzle had ex-
hibited approximately a 75 percent success rate for pressures up to 2000 psia and essentially no suc-
cess beyond 2000 psi.
In addition to the nozzle failures occurring during actual motor firings, a hydrostatic test
has also resulted in nozzle failure. A special hydrostatic test nozzle was tabricated of HLM 85
with the internal features of the exit cone left unmachined (solid). The nozzle was mounted in a
fixture identical to the aft closure of the motor and pressurized hydrostatically to failure at am-
bient temperature. Failure in two nearly equal halves identical to actual firing failures occurred
at 1700 psia.
127

A-134-491/2" bolt_____________________(16 each)
Retaining ring
Figure 49. BATES high pressure motor.
128

The general approach to the problem consisted of first conducting a structural analysis of
the existing BATES high pressure configuration in both the nydrostatic test and motor firing modes
to see if the observed failures could be correlated. Once a correlation was established, these
same analytical techniques were used to examine various potential fixes. The DOASIS finite element
computer code was used (Reference 24) to solve the displacements, strains and stresses in the nozzle
using orthotropic properties ard axisymmetric pressure and thermal loading. All motor calculations
were performed for a chamber pressure of 2000 psia, which appears to be the threshold level for re-
latively consistent nozzle failure.
As a result of the finite element calculations, it was concluded that the failure of the
BATES nozzle probably occurs as a result of circumferential tensile stresses in a region just for-
ward of the nozzle throat. It was further concluded that the failure occurs very early in the burn
and is almost solely the result of pressure loading on the inner contour at a time when the inter-
face leading to the O-ring is essentially sealed.
Assuming the above failure mode is indeed correct, the most promising fix to the problem in-
volves intentional design features to assure that chamber pressure reaches the O-ring rapidly. In
this way the nozzle is in effect "self-healing". A reduction in maximum hoop tensile stress of
greater than a factor of two is realized from this change alone.
Another fix with the potential of increasing nozzle capability by more than a factor of two
is the use of ATJ or eiuivalent strength graphite rather than HLM 85 quality graphite. Several cf
the qraphites that have failed in the BATES testinq are quite inferior to ATJ.
A slip-fit sleeve does not appear promising as a fix to the problem for two reasons. First,
the radial expansion of the baseline design with no sleeve is only about 2 mils, which is proiably
the same order-of-magnitude as the gaps present in a slip-fit sleeve of this large diameter. Sec-
ond, the calculations for a zero gap indicate only about a 30 percent reduction in hoop tensile
stress due to the sleeve.
Pressurization of the nozzle OD appears to be quite beneficial in reducing hoop tensile
stresses. The benefits are nearly as great in the region of major interest, the entrance/throat
region, if pressurization is applied only to the forward portion of the OD.
There appears to be a tendency for the couple produced by the offset action lines of the
net pressure force and the reaction force at the aft end of the nozzle to splay the aft end, pro-
ducing hoop tensile stresses. Although the failures are not felt to originate in this region,
I,29

angling the aft end of the nozzle somewhat will alleviate tnis situation. Although it was not ex-
amined, it might be possible to design the forward end of the nozzle in a similar fashion so that
the bolting force would produce a compressive hoop prestress in the entrance region.
All of these conclusions were presented to AFRPL as recommendations for solving the failure
problems of the high pressure BATES nozzle. Further recommendations were also made to solve similar
problems on the lower pressure BATES mo-,ors.

SECTION 8
CONCLUSIONS AND RECOMMENDATIONS
Kinetic expressions for ATJ, G-90, c oriented PG, 15% SiC/PG, and Pyrocarb 901 were obtained
from correlations of APG data and rocket motor firing data. These expressions, along with expres-
sions from previous results for a-b oriented PG and a recorrelation of previous Carbitex 700 data,
were incorporated into the former GASKET code for thermochemical ablation analysis. The new code,
GASKE12, also includes an improved accounting of sublimation kinetics, additional gas phase species
(Duff-Bauer), and a gpneralized procedure for specification of kinetic reactions.
Using the GASKET2 code and the Aerotherm rocket nozzle prediction procedure, the ablation
performance of 15 motor firings was predicted. All but three of these predictions were within ±25
percent of measured results. From these predictions, which included a wide range of propellants
and nozzle designs, it was concluded that the kinetic expressions were acceptably accurate. How-
ever, additional verifications are required since in several cases only one motor tiring was used
to validate the kinetic expressions for a particular material.
In addition to the data used for kinetic correlations, ablation data for 13 other materials
were obtained in the Aerotherm APG. These data were compared within a generic class of materials
to determine qualitotive performances. Data obtained to date show that some materials are sensitive
to manufacturing source and others are not.
Significant conclusions from this investigation, including discussions from the appendix,
are:
1. The GASKET2 code and the Aerotherm rocket nozzle prediction procedure can accurately pre-
dict the ablation performance of a rocket nozzle which uses materials that have been
characterized.
2. If propellant temperatures increase beyona current values of about 68000R, carbon sub-
limation kinetics will become important. in anticipation of this, the new GASKET2 code
includes appropriate sublimation terms.
131

I I
3. At surface temperatures representative of MX nozzles, the H2 - C* reaction is the domi-
nant carbon removal mechanism. Although the reaction rate constants are large for H20
and CO2, their reaction rates at motor temperatures are usually small because of low re-
actant partial pressures.
4. Pyrolytic graphite ablation rates are not sensitive to the material suppliers.
5. Butk graphite and carbon/carbon composite ablation rates are sensitive to the material
suppliers. In general, density alone is not a performance scaling parameter; however,
for carbon/carbon composites it was observed that a nonlinear density dependence could
exist, if the material is separated according to the reinforcement precursor. That is,
rayon precursor composites and PAN precursor composites each exhibit a density dependence.
It is highly pobable that the matrix precursor should also oe a correlating parameter.
6. For equal densities, rayon precursor composites performed better in the APG than PAN
precursor composites. As shown in Appendix A, PAN precursor composites show evidence of
fiber cleavage whereas rayon precursor composites do not.
7. At very high temperatures all materials seem to approach an asymptotic mass removal rate.
8. No correlations of ablation performance were observed for material porosity.
9. Chemadsorption measurements slow no surface adsorption of reaction species, namely,
CO29 H2 0, and H 2.
10. Significantly more data and data dnalysis will be required to relate ablation performance
to processing or material microstructure.
The following are recommended in order to improve rocket nozzle ablation performance predil-
tions and to obtain an understanding of the relationship between ablation performance and material
processing.
1. APG data should be obtained for additional carbon/carbon composites which include a wide
range of processing variables. Ideally, the composites should be processed with a sys-
tematic variation in these variables.
2. The microstructure of each material should be carefully examined and recorded. This ex-
amination should include, as a minimum, metallographs. SEM's, porosity, and chemoadsorp-
tion.
132

3. Thermophysical properties should also be measured and include, as a minimum, local
density, thermal expansion coefficients and thermal conductivity.
4. Additional motor firings should be examined and predicted to improve the prediction ac-
curacy of the GASKET2 code.
5. Alternate procedures should be examined for obtaining accurate high temperature kinetic
ablation data.
133/134

REFERENCES
1. Khitrin, L. N. and Golovina, E. S., "Interaction Between Graphite and Various Chemically ActiveGases at High Temperature," Proceedings of an International Symposium on High Temperature Tech-nology, September 1963.
2. Lewis, J. C., Floyd, 1. J., and Cowlard, F. C., "A Comparative Study of the Gaseous Oxidationof Vitreous Carbon and Various Graphites at 1500 - 30000 K," Allen Clark Research Centre,Plessey Co. Ltd., England, and Beckwith Carbon Corporation, Van Nuys, California.
3. Maahs, Howard G., "Oxidation of Carbon at High Temperatures: Reaction-Rate Control or Trans-post Control," NASA Technical Note D-6310, June 1971.
4. Thackray, R. W., "A Survey of Carbon/Gas Reaction Rates Applicable to Rocket Nozzles," RocketPropulsion Establishment Westcott Technical Memorandum No. 600, June 1972.
5. "Principles Governing the Behavior of Solid Materials in Severe High Temperature Environments,"Union Carbide Research Institute Final Report UCRl-388, My 31, 1966.
6. Wool, M. R., Schaefer, J. W., Murphy, A. J., Clark, K. J., and Reese, Jr., J. J., "Kinetic Re-sponse of Pyrolytic Graphite to Combustion Product Environments," Aerotherm Final Report 72-48,April 1972.
7. "User's Manual, Aerotherm Graphite Surface Kinetics Computer Program, Volume I - Program De-scription and Sample Problems," Aerotherm User's Manual UM-72-25, January 1972.
8. Murphy, A. J., Chu, E. K., and Kesselring, J. P., "Interim Report - AFRPL Graphite PerformancePrediction Program, Vol. 1, Reconmmendations for a Standardized Analytic Procedure for MXNozzle Throat Recession Calculations," Aerotherm Report 75-143, May 1975.
9. Chu, E. and Tong, H., "Aerotherm Graphite Surface Kinetics Computer Program (GASKET2),"Aerotherm Report TR-76-13, May 1976.
10. Murphy A. and Kwong, K., "Nozzl6 Pcrformance Bulletin #1, Performance Study #1: - 3rd StageHercules MX Nozzle Analysis," Aerotherm Report TM-75-86, November 1975.
11. Murphy, A., and Kwong, K., "Nozzle Performance Bulletin #2, Performance Study 2: RocketdyneCondor Test Nozzle Analysis," Aerotherm Report TM-76-197, April 1976.
12. Murphy, A., Kwong, K., "Nozzle Performance Bulletin #3: 3rd Stage Hercules MX Nozzle AnalysisUsing Pyrocarb 901 Kinetics," Aerotherm Report TM-76-117, April 1976.
13. Murphy, A. and Kwong, K., "Nozzle Performance Bulletin #4, Performance Study #4: Material/Propellant Sensitivity Stua for the Throat Location of the Standard 7" Test Nozzle,"Aerotherm Report TM-76-121, May 1976.
14. Murphy, A. and Kwong, K., "Nozzle Performance Bulletin #5, Performance Study #5: MaterialSensitivity Study for the Nose Cap of the Standard 7" Test Nozzle," Aerotherm Report TM-76-122,May 1976.
15. Kulkarni, V. S. and McClellan, R. E., "Structural Analysis of BATES Nozzle," Aerothern ReportTM-76-98, February 1976.
16. Tong, H., Hartman, J. C., and Chu, E. K., "Ioterim Report - AFRPL Graphite Performance Predic-tion Program, Volume 2, Arc Plasma Generator Evaluation of Graphite Reaction Kinetics inRocket Propellant Environments," Aerotherm Report 75-143, May 1975.
135

17. Unpublished data for Aerotherm APG obtained by Lockheed Missile and Space Division.
18. Dorrance, W. H., Viscous Hypersonic Flow, McGraw-Hill Book Co., Inc., New York, New York,1962, p. 226.
19. Tong, H., Hartman, G. J., Chu, E. K., and Keyes, K. A., "Kinetic Mass Consumption Rate for C-4Trident Nozzle Material - Carbitex 700," Aerotherm Final Report 74-126, November 1974.
20. "User's Manual, Aerotherm Chemical Equilibrium (ACE) Computer Program," Aerotherm Corporation,Mountain View, California, May 1969.
21. "User's Manual, Aerotherm Real Gas Energy Integral Boundary Layer Program (ARGEIBL)," AerothermUser's Manual, UM-75-69, December 1975.
22. "User's Manual, Aerotherm Charring Material Thermal Response and Ablation Program, Version 3,"Aerotherm Corporation, Mountain View, California, Report UM-70-14, April 1970.
23. "User's Manual - Aerotherm Axi-Symmetric Transient Heating and Material Ablation Computer Pro-gram (ASTHMA3), AFRPL-TR-72-24, Aerotherm Report UM-72-26, January 1972.
24. "DOASIS - A Computer Code for the Deformation Plastic, Orthotropic, Axisymmetric (and Plane)Solution of Inelastic Solids," Volumes I, I, and III, Weiler Research, Inc., Air Force Mate-rials Laboratory Technical Report AFML-TR-75-37, October 1975.
136

APPENDIX A
MICROSTRUCTURAL EXAMINATIONS
A.l INTRODUCTION
Surface kinetic constants depend on the microstructure of the material. This was shown by
the large difference in measured ablation rates of a-b plane and c plane pyrolytic graphite. Be-
cause of this, parameters such as relative fiber/matrix content, composite density and porosity,
and the degree of graphitization are potentially important variables. In addition, the orientation
of carbon platelets, which depend on the precursor materials and their processing, is important.
For 'nstance, PAN and rayon precursors yield fibers with platelet orientations as shown in Figure
A-l. For ablation along the cylindrical face, PAN fibers appear like layered PG and rayon fibers
appear like random carbon edges. Thus the ablation kinetics will also depend on the relative fabric
orientation and the orientation of the fabric relative to the ablation surface.
Processing of carbon/carbon rocket nozzle materials is quite proprietary; hence, only general
information is available. Some of the information for materials used in this investigation is de-
scribed in Section A.2. However, greater details are required before a meaningful relationship cdn
be established between materials processing and ablative performance. Figure A-2 shows the inter-
dependence between:
a Fabrication and processing
s Pretest; microstructure
s Ablation performance
# Post-test microstructure
The ideal situation is to be able to obtain a desired ablation performance by prescribiing faorica-
tion and processing variables. Unfortunately, the current state-of-knowledge is only sufficient
to provide simple guidelines which may have many qualifiers or exceptions.
With the current engineering approach to determining reaction kinetics, it is not possible
to define the fundamental mechanisms for carbon consumption. Thus, it would not be unexpeLted for
137

PAN base Rayon base
Figure A-i, Schematic of observed carbon fiber structures.
138

Abatensiresltos
Pretes Fab y otie reationsh
which can be varied
~ Links to be determined formaterial qu'dance
Figure A-2. Relationship between ablation and fabrication.
139

each form of carbon (e.g., bulk graphite, pyrolytic graphite, etc.) to be represented by a different
reaction rate expression. This behaqior has in fact been verified by this investigation. For in-
stance Figure A-3 is a theoretical prediction based on the empirical correlations described in Sec-
tion 6. This figure shows that the mass removal rate is dependent upon the type of carbon under
consideration. It also implies that preferential attack will occur in carbon composites which are
heterogeneous mixtures of different carbons. This implication has been verified by t;.e ablation
tests described in Section 4. Figure A.4 shows the results of some of these measurements for
carbon/carbon materials in a hydrogen envi.'onment. Different precursor materials are apparently
attacked more or less vigorously by hot hydrogen gases. Preferential ablation can also be seen in
SEM's of post-test surfaces. For example, Figures A-5 and A-6, respectively, show the ablated sur-
faces of rayon and PAN precursor composites. Rayon is apparently attached preferentially, leaving
a visible surface which is virtually all matrix material. PAN composites, however, show surfaces
which are mixtures of fibers and matrix. Significant micromechanical breakage of fibers is observed
and apparently enhances the ablation rates. This fiber cleavage is more evident in Figure A-7.
Two tentative conclusions can be reached from a preliminary examination of the carbon/carbon
pre- and post-tr.4'microstructures. First, for a resin (or pitch) impregnated c/c at a given dens-
ity, the recession rate performance of rayon precursor reinforcements is superior to that of PAN
precursor reinforcements (Figure A-4). Second, post-test SEM's show that the reinforcement in a
rayon precursor c/c recedes below the surface of the matrix (Figure A-5). This second conclusion
suggests that the matrix is a better ablator than the rayon reirforcement. Thus, a potentially good
material would use a low volume content of rayon precursor reinforcement and a high density graph-
itized matrix.
It is recognized that continuous filament rayon material will soon be unavailable so that a
first impression would be to avoid the use of rayon. However, there is a mountinq effort to deveiop
low density PAN and pitch precursor reinforcements with physical properties similar to that of rayon.
Hence, basic information obtained with rayon precursor c/c materials will be valuable for p~oviding
ablation and microstructure relationships to guide material development.
Fiber volumes for two-dimensional c/c materie2s are typically 45 to 55 percent. Fiber volumes
for 3-0 materials are around 30 to 35 percent. Thus, 3-D materials offer two advantages. First,
they are structurally better than 2-D materials and second, they have inherently lower fiber volumes.
The disadvantage of 3-0 materials is their higher fabrication cost and potentially greater scale-up
problems. If 3-D materials prove to be ablation-wise superior, then these disadvantages can be
tolerated.
140

MX Baseline - PEG/FEFO propellant
0.6 Gasket built-in kineticsEqual diffusionTw = 6000'RErosion rate vs. mass transfer coefficient
0.5 graphite(surface equilibrium)
-' bulk graphite
0.4 - -
°EE
0,2, - - Edge PGG
j Layer PG( 0)
~0.0
0.0 1.0 2.0 3.0
IeU eCm (Ibm/ft~sec)
Figure A-3. Relationship between mass transfer coefficient and ablationrate for various carbon materials.
141

i1
20 PAN precursors
9010
to 0700 5875
8 03 HD
-" 6 x . 250 51
4 Rayon precursors
3-D
2 . I ,
1.0 1.2 1.4 1.6 1.8 2.0 2.2 2.4
Density (gm/cc)
Figure A-4. Measured ablation rates in hydrogen environment, Tw 55000R.
142

4-)
0)0.a0
4-)
4-)
E
C) )
C) 0
4.-
143/14

xS- Q
CL
E0
5-
IV5-
CDC
'V
C-x-
LU
14b/ 146

i4.40 40
Ak.
000
W .W
0
E
0)
4-
(a a)
CDC
147/148

As part of this investigation, pre- and post-test microstructural characteristics were ex-
amined for two purposes. First, it was hoped that some obvious relationships would be observed to
relate microstructure to ablation performance and material fabrication. Believing, however, that
there would not be sufficient data to establish firm relationships, the second purpose was to col-
lect this microstructure data as a "data bank" for future reference. As additional data is added
to this data bank, the relationships between fabrication and ablation performance should become
more obvious. Eventually, the kinetic behavior of a graphitic material can be determined by a de-
tailed knowledge of its fabrication or by examination of its pretest microstructure. Thils, of
course, is a very ambitious objective and may take a decade to realize.
The microstructural characterization measurements performed in this study are tabulated in
Table A-1. All characterizations, with the exception of ordinary photography and scanning electron
microscopy, were performed by Mr. Jay Baetz of the Aerospace Corporation, El Segundo, California.
A.2 MICROSTRUCTURAL EXAMINATION
Microstructural examination was conducted to characterize both virgin and tested material
conditions. The primary areas of interest in this examination included in-depth assessment of un-
tested material structure and the surfaces resulting from exposure to arc test conditiois. The
principal microstructural features of interest for tested specimens included response of reinforce-
ments ano matrices to the iwposed test conditions.
Selected specimens were examined by photomicrographic and scanning electron iicroscopy (SLM)
techniques. Representative selected materials were examined in toe tested and untested states by
both techniques. However, primary emphasis in tne photomicrographic studies wais directed toward
untested material examination. This emphasis was maintained so that high resolution definition oi
polished material samples would be obtained. The SEM was primarily used for arc tested mateial
analysis, which permitted utilization of the SEM large depth of focus to assess tested surfaces
without surface modifications.
Material, Sumarv
Three classes of riaterials were examined. These classes included carbon/carbon composites,
bulk graphites, and vapor-deposited carbons. Within the carbon/carbons both two- and three-
dimensionally reinforced materials were analyzed. The bulk graphites included aerospace grade,
fine grained systems and coninprcial grade graphites. Vapor deposited carbon mater'al systems ex-
amined included conventional pyrolytic graphites, a-b oriented graphites and graphites codeposited
with metal carbides. A sunary of the materials examined is provided in Table A-2.
149

TABLE A-1. MICROSTRUCTURAL CHARACTERIZATION MEASUREMENTS
1Pretest Post-Test
c c:Material .. -
0~ 042 . *0 - W V
0 E 'U0 E
_ _ _u z ( 0 w 0a es. 0G-90 X X X X X XX X
ATJ x X X X X
ATJ-S X X X X X
PO-3 x X x
Hitco a-bPG X X X X X
Pfizer cPG x X X X X X X
Supertep c PG X X X X X X X X
ARC 23% SIC/PG X X X
ARC15% SiC/PG X X X X X X
ARC 5% SiC/PG X X X
Raytheon 65% HfC/PG X X X
Pyrocarh 901 X X X X X X X x X
Pyrocarb 903 X X X X X X X X
Pyrocarb 903HD X X X X x x
MDAC 3-U c/c X X X X X X X
Haveg 5125c/c X X X X X X
Haveg 5875 c/c X X X X X X
150

TABLE A-2. SUMMARY OF MATERIALS EXAMINED
Material Class Manufacturer Identity
Carbon/carbon Hitco/Defense Products Division Pyrocarb 901
Hitco/Defense Products Division Pyrocarb 903
Haveg HRX 5125
Haveg MRX 5875
MQDonnell-Douglas MDAC 3-D c/c
Carborundum Carbitex 700
Bulk Graphite Union Carbide ATJ
Pure Carbon PO-3
Carborundum G-90
Union Carbide ATJ-S
Vapor Deposited Carbons Pfizer Standard pyrolytic graphite
Supertemp Pyrolytic graphite (101-B)
Hitco/Defense Products Division a-b oriented pyrolytic graphite
Atlantic Research Corporation 5% SiC/pyrolytic graphite
Atlantic Research Corporation 15% SiC/pyrolytic giaphite
Atlantic Research Corporation 23% SiC/pyrolytic graphite
Raytheon HfC coated pyrolytic graphite
151

IThese materials constitute a representative cross-section of all classes of materials cur-
rently considered for nozzle application. Within each materials class, a number of constituents or
processing techniques are considered proprietary by the respective manaufacturers. A summary of
each material examined is provided within the above cited proprietary restrictions as follows.
Pyrocarb 901
Pyrocarb is a two-dimensional reinforced composite with a rayon precursor square weave carbon
fabric. The laminate is initially formed by fabric impregnation with a phenolic resin. Individual
plys are rotated within the billet plane as specified by the customer. Details of processing and
densification are considered proprietary by the manufacturer.
Pyrocarb 903
This material is also a two-dimensional reinforced carbon/cirbon. The reinforcement is an
eight harness satin weave with a PAN precursor. Laminates are fabricated with the fabric impregnated
with a phenolic matrix. Multiple density levels are available depending upon the customer require-
ments. In this program two density levels were tested. Ply rotation is as specified by the customer.
HRX 5125
HRX 5125 is a two-dimensional carbon/carbon fabricated from a rayon precursor fabric such as
WCA. The initial densification is accomplished with H-resin. This matrix is carbonized at 800C.
Redensification is accomplished with the H-resin for an unspecified number of cycles. Subsequent
densification is accomplished with Allied Chemical's new coal tar pitch. The final processing step
performed is at 2800*C graphitization. Adjacent plys are rotated to obtain quasi-isotropic, in-plane
properties.
HRX 5875
HRX 5875 is a two-dimensional reinforced carbon/carbon composite. The reinforcement consists
of a PAN precursor carbon fabric with an eight harness satin construction. A typicdl yarn used is
Thorne] 300. Prior to use in laminates, the fabric is heat treated to the qraphitization tempera-
ture. H-resin is used as the initial impregnating matrix and is carbonized at 8000C. At the mid-
point of densification processing, tne laminate is graphitized. Continued densification is accom-
plished with 15 V coal tar pitch. The final processing step is graphitization at 2800'C. Ply rota-
tion is performed.
152

Carbitex 700
Carbitex 700 is a two-dimensional reinforced carbon/carbon. The reinforcement is a square
weave rayon precursor graphitized in fabric form. The matrix utilizes a -psin precursor. Graphiti-
zation is conducted at a minimum temperature of 2700*C.
MDAC 3-0 C/C
The single three-dimensionally reinforced material was MDAC 3-D c/c. Tiiis composite utilized
orthogonal reinforcements of Thornel 50 yarns. Weave construction was 224. The preform was woven
by FMI and carried the identity of 173B. Densification was accomplished with 15 V pitch and a
thennosetting resin. Graphitization between densification cycles was conducted at 2800'C. The
final thermal treatment was a 10000C pyrolysis. No definition of the pitch/resin impregnating se-
quence is available.
ATJ-S
ATJ-S was the initial bulk graphite considered. This product, the best characterized of
the aerospace grade graphites, is fine grained (0.006 inch maximum) with a density of 1.83 gm/cm 3
and an ash level of 193 ppm.
ATJ
ATJ is a molded graphite with a grain size equivalent to an ATJ-S. However, its density
(1.74 gm/cm3) is somewhat lower and its ash level (1200 ppm) is somewaht higher than ATJ-S. The
specific material utilized in this program was obtained from the center of a 15-inch diameter billet.
PO-3
PO-3 is a commercial grade molded graphite, stated by the manufacturer to be somewhat porous.
Specific information regarding manufacturing processes has not been obtained. A nuiober of grades
are produced including some with carbide additions.
G-90
G-90 is an aerospace grade graphite. It has a 1.9 gm/cm3 minimum density and is manufactured
as an extruded product. Ash content is 0.06 percent. The maximum grain size is 0.037 inch.
153

Supertemp PG
Pyrolytic graphite was obtained from Supertemp in accordance with their specification 101-B.
No information as to source gases, deposition temperatures, or other processing conditions were
available.
HfC/PG
This product consists of pyrolytic graphite codeposited with hafnium carbide. Codeposition
• formed at approximately 10 Torr pressure and a temperature between 1800% to 1850'C. The re-
sulting deposition rate is approximately 10 mils/hour on a graphite mandrel substance. The result-
ing product is characterized as reasonably fine grain renucleated.
A-B PG
This product was obtained by deposition of pyrolytic graphite on premachined ATJ substrates.
The material was not machined prior to testing so that the initial ablation surface was the as-
deposited surface.
Pfizer PG
Pfizer pyrolytic graphite is deposited as pure carbon to obtain a continuously nucleated
structure. Further details are not known.
5, 15, and 23 Percent SiC PG
Silicon carbide is codeposited with graphite to obtain this product. Fabrication information
is contained in Reference A-I.
A.2.1 Metallographs
Representative samples of pre- and post-test materials were photographed using a metallograph.
These metallographs yielded qualitative information on the structure and uniformity of each material.
Select post-test samples were also photographed to reveal the roughness of the ablation surface.
Magnifications of 40 to IOOX were used although the preponderance of photoyraphs were for magnifica-
tions less than 200. A list of the materials and magnification levels is shown in Table A-3.
No noticeable changes were observed for the in-depth microstructure between pre- and post-
test states. Soeie differences were noted, however, in the characteristic surface roughness of dif-
ferent materials. Since surface roughness metallographs also show the in-depth structure, there
154

TABLE A-3. PRE- AND POST-TEST METALLOGRAPHS
Pretest Magnifications Post-Test MagnificationsMaterial
20- 100- 200- 300- 500- 2000- 40- 100- 200- 300-90 190 290 490 1000 4000 90 190 290 490
G-90 4 2 2
ATJ 1 1 2 2
ATJ-S 2 2
PO-3 1 1 2
Hitco a-b PG 5
Pfizer c PG 2 2 3
Supertemp c PG 5 2
UK PG 20
23% SiC/PG 7 2 2 3
15% SiC/PG 1 1 2 2
5% SiC/PG 2 2
65% HfC/PG 2 2 2
Pyrocarb 901 1 1 2 1 2 2
Pyrocarb 903 2 1 2
Pyrocarb 903 HO0 4 2 1
MDAC 2-D 2 2 1 8 2
Haveg 5125 11 2
Haveg 5825 6 2 1
155

would be little value in showing pretest microstructures. Thus, only representative post-test
metallographs will be shown.
Metallographs for the bulk graphites, PO-3 and G-90 are shown in Figures A-8 and A-9, re-
spectively. These photographs show the effect of grain sizc on the texture or roughness of the
ablated surface. PO-3, being a very fine grain material, has a virtually smooth ablation surface,
while G-9n, which has a large grain size, has a rough surface.
ATJ and ATJ-S have grain sizes between PO-3 and G-90 and although not shown have an ablation
surfdce with a roughness between that of PO-3 and G-90.
Metallographs for Pyrocarb 903 and HRX 5875 are shown in Figures A-iO and A-ll, respectively.
These are both PAN precursor reinforcements; however, there are some obvious differences in fabrica-
tion. The HRX 5875 apparently uses a heavier carbon yarn or is processed at lower pressures. This
is evidenced by the uniformity of the plys compared with those of Pyrocarb 903. The latter shows
significantly more yarn distortion. Surface roughness of these two materials are about the same
with roughness heights of about 3 to 5 mils.
Figures A-12 and A-13 show the microstructure of Pyrocarb 901 and HRX 5125, respectively.
The differences in ablation surface roughness ar3 apparent although both are fabricated from rayon
precursor fabric. The "evenness" of the Pyrocarb 901 surface is unusual when compared with the
other carbon/carbon composites.
A metallograph for the 3-D carbon/carbon is shown in Figure A-14. The carbon yarns are
clearly thicker than those of 2-D composites and because of the orthogonal weave, there are distinct
and systematic matrix pockets.
A.2.2 SEM Analysis
As stated above, primary emphasis in the SEM studies was placed on post-test examination of
the eroded nozzle surfaces. Sections were removed from the tested models and viewed as shown in
Figure A-15. In all SEM photos of testLd models taken, the entrance of the throat is to the left
of the picture. All specimens were examined without surface preparation. A number uf fligniflcatiun
levels were taken; however, only 50 and 500 magnification levels will be shown. As with the metallu-
graphs, only representative SEM photographs will be shown.
A sumumary of the models and test conditions for which SEM analysis was conducted is provided
in Table A-4.
156

Figue A8. ost-estrncophoogrphsfor 03 O00
157D

1~~~ w~0 P)~t-tet i C rpooqarst ,t-9 O
I CD

I ~IS

flur Ai. os-es rl~~h~O(YdpSYo
ITT~1~1 O
NZ6

A. S
Si 4
Figure A-12. Post-test microphotographs for Pyrocarb901 ibOX.
161

I ilure A -13. fPo.) t~ m.,- ro 1 t(k pdfl s

Figure A-14. Post-test microphotographs for MDAC3-D - 50X.
163

Throat Ix it
F~ntr~ne ..- iewing direction
Sectionremoved -for examination
Figure A-15. SEM sample orientation.
164

(D C) Cz
C) CD 0D 0 0 0D 0 C0
T m 0.) 0 .0 .0 .0 0 .0 .0 0 .0m ~ 0) S.. S-. S. L S.. S.. S
cu~' (1) rOj -4 r0 O (55 (55 M 5 (55 (ma) tn (7 co 0 0 0 0N 0A* 0l 0o 0 0 0o
4- U) co 0% to C ~O CY, CD 0.t 0. -* 0. - 0. 0.m 0 0 0.
S - W V)40 S O l CAi LO 0 coi N N A N ( O70 N - 't(55(fl.4)) w LA CO 0 (0 Co - OS(Ji C! I: CA CO O>Ur cfl c; N ; LA O N. 0- ND J O A C 0 ,. CDAC
f1 a ' O - C A O~ A C C".
CD Cj
CA 0I CD M C n w - )
HIL Je Ch - . No ND Q. No -It C) N c w. N' \) N -13"
=). 41 =10D
LAA d) 0 s 0 0 M (0 C4A -C ~ oN r
a 1 - -6 -c No -c -h N;2 ,-0 - -:I N; ; z o O V
A'
cO 4J0 cOi -~ 0 CV en Ms M N en CI C\O M MA M CAJ (0j LAJ CA
ECa
4.)
COO
0. C~ to (0 c). CA N... " (0 N' 0. 0 0 L> C:) U) to- 0o CI- N
U-)4 r.- Lc) 0n LO - 0r r 0 LA (0 m Lr 0- 0n N3 Os C'.
COCO0 -y
0 CD LA CDL 0 0 cm LAi Osi CAi LA 0 - . - 0

0 0 u. u 0 t CD CO0 CD 0. 0.S.- 4-)0 0 1-. -- CL 0. CL CL CL . -.
0. C C. 0. CD (D 0 .LO V) to V) Ln x x 00 o E E E o-0 s d 'C\l CN f*. r- I-. 4) w I I wi 12) wi.
.u. C. C..) w) cu w N N Q uX( X< X( X< S. <- a M M. 0. . i- - 4-' 4-' C) .
Cec: w k rT) MT m = :3 :3 4- 4- Cc Cu C.) V) V) CL 0. < r~ ~ .
Cj- to ow) a) 2 O 0b 0) Nl - t C 9 9 l o
>~ .C0-) 0 0 0 0 0> 0D 0 0 0D 0 0, 0
(A C
C) c-0- 0. -
C) N N N ) C
00
a . 0 O)N C a% ) Ln CCT m r to r to M' 0 00 C-. N~ C14
S,: 0 - o 1-t - N - t -. -- to - -:r N~ 0) - tn tn4n (a4J LO M 0 0 m C ') m ' C0 -. 0D - 0 in m) in tcn U*
Lii0 co 0- N CO Nz 0\) C\; - C- ' 'i t .; - N -c C~ ___M__ __M_______M_____
0
4-' So0 o r t 0 t z 00 0 00 o F-- N~ 00 r, Cl 0
0 a m U') m) C -c t in to- - ON to In to 0) m - in
4-'
O) W o 0 - C') 0- M NC O 0) t -- C to 0 to Ln
to '0- .o ( I - C) .: _: r-. - o . t CO in tC.0 4J -% to 0M m' ) C O -Mt C O 00 ) M - t to CO
a 4-' N\ N~ N C- N N C' C') N I N " Cl) N\ N C\J N~ Cm
, to C'. tn in) to Lo tn -~ N NO C') M) N ) - r- -aE~t 4- Nn tn N o - o - - ' N C -. r o 0M CM4- 0 to L 0 Nq N~ 0m -tr - - C 0 to m' C 0 ,- oto L n U n LO LO n -T- in to an lzr Ln to ) to n :T an Ln n
(D f. to It Kr m' to to C') 'iT m C') (11 ti C') 'i t to m'0N .
ND CA ) 0 0 0 C 0 0; M- C. C. CO m) zr 0 C') C'NM N N N N 0 Nm 0 0, 0 00 0 0 r - ND m
166

4-)
41 a) (n ) Vl) C
(Ir t n cv) 0D CD CD
U) L.) L).) U) CU u.c:: w~ c o 4- 4- 4-
M.-
Uo( a ) CO) Cl) 0 tD CD
S- + 1 0 1*t Ul) V) (v" LOU)) 0 m C') co ko 0 N~
>C-)
-1 1 aw- c- C'.;~
04Jtn 4J N~ N1
0) .1; 0 0 0I-i I . - N~ Nl N
Q) 0."0 CE
0
0 -(->
0 a 0 , 0(\I) CDi
CDr4-~ N~ LO 0 %D 00 ItI- c - - t.. N\ N ~ N W
4JJ
z 00
E~ 0 )Eu0) ) CD C'0 -. 0 m
M) E . O t - t m r4- o) m
xDJ Z S- N) tn. D -. - ))- T' C') N * Ln LI
LJ 0O 0 0 C ci Y ')
00 'A to C) m CD T
U) )03 I wD U;. C-. 0) C
U) ) V) V) (n (n
U) ':t ON C) Cl) NO UhU) s )- C
10.

Vapor Deposited Carbons
SEM photographs of Supertemp pyrolytic graphite specimens tested in hydrogen, hydrogen/
oxygen, and hydrogen/oxygen/hydrogen chloride mixtures dre shown in Figures A-16, A-17, and A-18.
The low magnification hydrogen tested model exhibited three primary features. These features in-
cluded the formation of cavities, microcracks perpendicular to the throat axis and apparent waviness
of structure as shown in Figure A-16(a). The waviness is also evident at higher magnification
"Figure A-16(b)) as is the presence of a nodular structure on the cavity walls.
Exposure of Supertemp pyrolytic graphite to the hydrogen/oxygen test gas at somewhat lower
temperatures resulted in the grainy, near fibril appearance shown in Figure A-17(a). At high
magnification, these features are plainly shown. As indicated in Table A-4, a lower recession rate
was found with the hydrogen/oxygen mixture than the pure hydrogen environment. This apparently
anomalous condition may be related to the lower test temperatures employed in the hydrogen/oxygen
environment.
The structure resulting from hydrogen, oxygen, and hydrogen chloride closely represents the
more severe recession conditions normally seen in oxygen-containing environments on other materials.
This is shown in Figure A-18. It should bc noted that the temperature employed in this test approx-
imated that used on other oxygen-containing environments. Small cracks are again evident in a
generally scalloped macrostructure. At higher magnification, the generally layered structure is
evident outside the crack region.
The a-b pyrolytic graphite in a hydrogen environment exhibited the presence of partially de-
laminated layers parallel to the throat and the presence of a nodular structure at low magnifica-
tions. This is shown in Figure 19(a). At higher magnification, the detail nodular structure is
apparent. Some alignment of the nodule peaks parallel to the test gas flow is also observed in
Figure A-19(b).
Compared to the Supertemp material, the Pfizer pyrolytic graphite material exhibited a
similar but more extreme case of cavity formation in hydrogen environments. Surface pitting and
a-b plane delaminations were also more severe.
The codeposited pyrolytic graphites are typified by SiC/PG. Figures A-20 and A-21 illustrate
the structures observed for the 23% and 5% silicon carbide materials. A definite nodular structure
is evident at the low magnification in both the 23% and 5% SiC specimens tested in hydrogen (Figure
A-20(a) and A-21(a)). Additionally, these figures show the cavity structure observed on other pyrol-
ytic graphite. A higher magnifications, small cracks at the base of the nodules are evident in the
168

'I 500X
Figure A-16. SEM of Supertemp PG testedin H 2, = 4733-R.
1 69

AA
Figure A-17. SEM of Supertemp PG tested inH 2/0 2 3 Tw 4112"R.
17q)

50X
500X
Figure A-18. SEM of Supertemp PG testedin I2 /0O2/HCk Tw 50950R.
171

50 X
' 40
Figure A-19. SEM of a-b pyrolytic graphite,tested in H2' Tw = 4851 0R.
172

Figure 20. SEM of hkSiL/PG Lested in
H 2) Tw 54780R.
173

50X
Figure A-21. SEM of 5% SiC/PG in H2VT 56240R.
114

23% silicon carbide material (Figure A-20(b)). In both the 5% and 23% SiC materials, the high
magnification shows the nodules to have a fine grained appearance (Figures A-20(b) and A-21(b)).
For both the 5% and 23% SiC specimens, introduction of oxygen produced a significantly dif-
ferent appearance. At low magnification, the 23% silicon carbide model formed a white coating
(probably Sl02) interrupted by holes. At high magnification, this coating is observed to consist
of ceramic type globules. The 5% SiC model exhibited a similar coated nodular structure; however,
coating density was less complete. Although tested at almost identical temperatures, high magnifi-
cation views of the 5% silicon carbide coating showed a fiberous, needle-like structure compared to
the globular structure for the 23% material.
Hafnium carbide pyrolytic graphite tested in hydrogen gas showed a relatively dense uniform
coating. Presence of Hafnium in this coating is indicated by darkened areas whicn changed while in
the SEM unit. At high magnification, minor evidence of a substrate structure was evident below the
coating cracks.
Bulk Graphites
ATJ-S is representative of the bulk graphites considered in the SEM analysis. Introduction
of oxygen in the test gas results in progression of the microstructure from a comparatively smooth,
fine-grained appearance to a roughened, coarse structure. This is shown in Figures A-22 nd A-23.
Roughening corresponded to a large recession rate increase as indicated in Table A-4. This change
was not due to temperature differences used in the test. This is )ased upon the increased erosion
rate and coarsened 50X microstructure which was obtained at the approximately 600°R lower H2/O 2
temperature. The coarsened microstructure is retained i,1 the H2/02 test environment with an increase
of 1000*R but with less recession rate inurease than the change in test gas from H2 to H2/02. No
significant change in 50OX microstructure is evident with introduction of oxygen into the environ-
ment as shown comparing Figures A-22 and A-23. No significant changes occurrel either in macro or
microstructure with CO/HCZ introduction.
The effect of oxygen was also observed in somewhat larger grain-sized graphites. For example,
ATJ progressed from an essentially uniform, relatively smooth macrostrtocture to the coarse, rough
structure with the introduction of oxygen. Again, no significant change in 500X microstructure was
observed.
The PO-3 graphite presented a uniqje feature among the molded or extruded graphites. This
feature was the formation of macro level cavities within the hydregen environment. However, at 50OX
no significant difference in macrostructure is noted compared to the ATJ-S on ATJ systems.
175

II gpFigu~~~~re -2.X stMo T- etai 2
n 14%R
176e

Figure A-23. SEM of ATJ-S in 1205Tw 42580R.
1 177

Carbon/Carbons
The progressive microstructure change in carbon/carbons from untested material through expo-
4 sures in typical environments was demonstrated by Pyrocarb 903. This progression is shown in
Figures A-24 through A-27 for Pyrocarb 903. Progression from untested material to a hydrogen ex-
posed material results in a moderate amount of recession. This recession is evidenced by the initial
observation of peaks and valleys around the PAN based yarns parallel to the film plane (Figures
A-24(a) aid A-25(a)). At higher magnifications, the structure changes from thoroughly intermixed
fibers and matrix to exposure of some filaments with a majority of the matrix retained.
Introduction of oxygen results in much higher yarn definition as shown in Figure A-26. This
oefinition resulted from the approximately threefold increase in ablation rate (see Table A-4). It
should be noted that this change with H2/02 introduction occurred at a slightly lower temperature
than H2 only. The ply rotation ciaracteristics of this material is shown by filaments approximately
perpendicular to the film plane both in the low and high magnifications of Figure A-26. As observed
in Figure A-26(a), introduction of oxygen resultea in removal of significant amounts of matrix from
the filament groups.
, RX 5125 was examined as another representative two-dimensionally reinforced carbon/carbon.
This rayon precursor reinforced, H-resin/15 V pitch densified material exhibited the same dependence
on oxygen presence in appearance as did the preceding material. All of the features previously cited
including fiber exposure, ply rotation, and matrix loss with oxygen, were observed to some degree.
HRX 5785 presented an anomaly to the above cited microstructure trend. Although tested at
similar or lower temperatures, the specimen exposed to hydrogen showed an apparently more severe
loss in both low and high magnifications.
The single three-dimensionally reinforced material examined was MDAC 3-D c/c. This material
was examined at three locations for the specimen tested in hydrogen. Two of these positions were
orthogonal while the third was at 450 to the previous two. No relationship to the throat circum-
ferential position was noted. In all cases, the surface exhibited distinct fiber exposure and re-
tained matrix in the low and high magnifications. Progressive fiber exposure and smoothness were
evident in the H2/02 specimen.
Although tested at approximately the same temperature as the H2/02 environment, introduction
of CO and HCZ resulted in better retention of the fibers parallel to the film plane. This is ac-
counted for by the CO and HCU producing a less severe environment than |;2/02 and was confirmed by
the reported recession rates.
l7

Figure A-24. SEll of Pyrocarb 903, asmachi ned.
179

Figure A-25. SEM of pyr'ocdrb 903 tested
in H,,~ T~Iw

Figure A-26. SEM of Pyrocarb 903 testedin H /0~, T, 53090R.
28

Figure A-27. SEM of Pyrocarb 903
tested in ll2/O,)/HC ,,
T1 8~

From the standpoint of microstructure, changes in density for the same material (over the
density levels tested) provide no significant alterations. This is determined by comparing Pyrocarb
903 HD (himgh density) with the Pyrocarb 903 previously discussed. Both were tested in H2/02 environ-
merits at similar temperatures. At low magnifications the same roughened, exposed fiber appearance
is evident. At high magnifications loss of matrix around filaments is evident for both materials.
Somewhat more matrix retention may be present in the "H" version, and this may be when measured
recession rates for the HD version were slightly lower than the standard Pyrocarb 903 version.
The roughened surface, fiber exposure, ply rotations, and matrix removal features were re-
tained with the introduction of HCZ into the H2/02 test gas. It should be noted that the depth of
recession between yarns is somewhat less for this case than for H2/02 only, which is in accordance
with the lower recession rate reported.
Pyrocarb 901 showed the same general trends. The reported recession rates in all test en-
vironments were higher for this material than for Pyrocarb 903. It should be noted, however, for
Pyrocarb 901, definite fiber exposure and ply exposure was observed in the hydrogen test environment.
Introduction of oxygen resulted in severe removal of the exposed yarns. T~1is removal is evidenced
by a "smoothing" of the rayon based yarns.
Examination of the high magnification views of Pyrocarb 901 in both H2 and 112/02 is somewhat
less informative. Here, matrix was retained intermixed with the fibers in both environments.
A.2.3 Thermal Expansion Coefficients
Materials and specimens on which thermal expansion coefficients were determined are sumnlar-
ized in Table A-5. The specimens have been divided into the following three material classes:
e Carbon/carbon (c/c)
* Pyrolytic graphite (PG)
a Bulk graphite
Except as noted below, all the specimens listed in Table A-5 were machined out of discs of
approximately 2-1/4-inch diameter and 1/4 inch thickness. The blackened portion of sketches drawn
in Column 7 of Table A-5 shows the location of specimen within the disc and the specimen shape as
it was submitted for testing. Specimen L-l was machined out of a G-90 billet and its location in
the billet is shown in Figure A-28.
In the following discussion, c direction refers to the cross-ply direction and a-b to the
with-ply direction.
183

TABLE A-5. TEST MATERIALS
Material Specimen SpecimenNo. Sample Class Density Made Lozation
ID No. Name (g/c/c) From andDShape
R-1 26 HRX 5125 c/c 1.86 Disc
(Haveg)
2 L-2 34 MDAC 3-D c/c Disc
3 L-3 26 HRX 5875 c/c 1.86 Disc
4 D-8 28 Pyrocarb 901 c/c 1.80 Disc(Hitco)
5 D-9 28 Pyrocarb 903 c/c 1.84 Disc
6 D-10 26 HRX 5125 c/c Disc
(Haveg)
7 D-3 12 Supertemp PG PG Disc
8 J-7 28 Hitco PG PG Disc
9 L-l 41 G-90 Bulk Graphite Billet G-90(Figure 1)
184

0.
1 \ -j LO
02
o A I 0
185<

Carbon/Carbon Materials
Thermal expansion data as a function of temperature for two-dimensionally reinforced carbon/
carbon materials tested is summarized in Figure A-29. Thermal expansion is lower in the a-b direc-
tion, which is a result of carbon fibers not expanding as much as the matrix material. In the c-
direction at a temperature of 1800'F, the highest value of thermal expansion is 9.4 x lO- inch/inch
for the Pyrocarb 903 material. The corresponding lowest value is 7.1 x 1O-3 inch/inch for HRX 5125.
In the a-b direction at a temperature of 18000F, the highest value is 3.2 x l0- 3 inch/inch
for HRX 5125 and the correspondirg lowest value is 0.02 x l0-1 inch/inch for HRX 5875. The increase
in the thermal expansion values is approximately linear with temperatures over the temperature
range shown.
Thermal expansion data for the single 3-D c/c material is shown in Figure A-30. As expected,
the velues of thermal expansion in the z-direction are considerably lower than those in the x- or
y-direction since the z-direction has a higher volume of c/c fibers. There is a nonlinear relation-
ship between the thermal expansion and temperature at higher temperatures for this material.
Vapor Deposited Carbons
For pyrolytic graphite, the thermal expansion values re much higher in the c direction than
in the a-b direction. This is shown in Figure A-31. Both specimens (Hitco a-b PG and Supertemp PG)
exhibit sin.ilar thermal expansion characteristics in their respective c and a-b directions. However,
the increase in the thermal expansion values with temperature in the c direction is much greater
than that in the a-b direction. The increase in the a-b direction expansion values becomes nonlinear
with temperatures above about 36000F.
Bulk Graphites
The only thermal expansion measurements of bulk graphites were for G-90. These results are
shown in Figure A-32. Some anisotropy in this material is reflected in the two different curves.
This is a result of the preferential grain orientation induced by processing forces.
A.2.4 Ion Microprobe Mass Analysis (IMMA)
IMMA data was obtained for representative materials in pre-test and post-test states. Post-
test samples were selected on a basis of the measured surface temperature and exposure qds. IdeaIly
these conditions would be representative of those found in rocket nozzles, however, these .onditiuns
186

0 MC.,
C',
LC)
-a'a
coo
,4-) S..
OD 0
.0
LA CL0
CMj
C) I--
4.' C~oo #a R
cli I-
00 /V 'l)tU d j t l0 i
018

x
0
0.u
C)
0
.2) 0
'V rou
0
e).
a))
CC)
CC)
III I5V 'UOtSUPdXJ tetO.Aii41

C
0E
4-)1
44,4-
0 4.)
c
0
LI 4,0
____ ____ ____0 SE
oP 't[x Z-V U~sey Lw~
1895

Figure A-26. SEM of Pyrocarb 903 tested4n H2/02, 1< = 53090R.
1 3L

0
0)4-)
0
0
LAL0
0
43 C
190)

could not be duplicated in the APG. The IMMA post-test samples were therefore selected as a compro-
mise between test gas and high surface temperatures. Identification information on the selected
IMMA samples is shown in Table A-6.
IMMA scans were made for both positive and negative ions. Typical surface scans are shown
in Figures A-33 and A-34. Since only the molecular weight of molecules are shown, it is not always
possible to unequivically identify the molecule. For instance, a molecular weight at 28 may be a
molecule of N2, CO, or Si. In addition, the concentration of each surface species can not be de-
termined from the IMMA data. Thus, the scans are largely qualitative.
Rather than presenting all of the IMMA scans, the dominant lines from each scan were identi-
fied and are presented in tabular form in Table A-7. Also shown in this table are possible chemical
species that could be represented by each molecular weight. Only molecular weights up to 50 are
shown.
Two samples of one of the materials, namely Pyrocarb 901, were scanned to gain an apprecia-
tion of the repeatability of the material. These samples were at slightly different reported densi-
ties but were presumably otherwise identical. The positive ion scans showed a noticeable difference,
which may be attributed to impurities from handling or to material processing. The former appears
more likely since most of the differences are from elements of salts which are contained in human
perspiration.
Comparisons of post-test surface scans with (1) pre-test scans and (2) post-test subsurface
scans show that the surface may contain a large number of hydrocarbon species. These would be
natural by-products of the reaction between APG gases and the surface. A known poison species,
HCZ, is observed only in one case, whereas CZ is observed in almost all materials. This again
may possibly be attributed to sample handling.
From the amount and quality of data taken, no firm conclusions can be reached aboit the value
of the IMMA scans, either in terms of guidance for material development or as aids in interpreting
kinetic reaction rates. However, it can be concluded that future samples must be handled much more
carefully and the IMMA scans should be conducted very shortly after testing. New procedures should
also be used to identify adsorbed species. In addition, future samples should be scanned at a num-
ber of positions to reduce the uncertainties of local impurities or contamination.
A.2 5 Porosity
A mercury porosimetry was used to determine pore size, pore size distrioution and density
jf selected materials. Data obtained by the mercury peretration technique includes pore size and
191

TABLE A-6. IMMA SAMPLES
Exposure ConditionsM Pre- Density Post- - _ _ _
Material Identification test gm/cc test Tw Gas Time Recession
(OR) (sec) (in.)
Pyrocarb 901 (J2) Hitco 919946-2 X 1.72
Pyrocarb 901 (Ji) Hltco 919950-6 X 1.84
Pyrocarb 901 (PA4) Hitco 919951-1 1.83 X 5000 7 36.5 0.0334
Pyrocarb 903 (PA4) Hitco 919957-3 X 1.84Aerotherm 7113-134
MDAC 3-D (C2) X 2.02
G-90 Aerotherm 41 XLayer 3, 540/1080
SG-90 Aerotherm 7113-170 X 4850 7 48.5 0.024
15% SiC/PG ARC 8328-10003-23
15% SiC/PG Aerotherm 7113-116 X 4350 1 54.0 0.024
192

000
4J
'4-)
0
4-0
4-)
040
1-34J
1 cli LL
193U

CI
0
4 J
00.
a;
CD)
U
0
.
0
194J

0xC)
× × × ..
X x X x OLS '03
X X X
X XX X XNX N3
X< X>> HCOXx IO ×HIZx X X"3H
u', x~ ~ :,<4 J
X X =< S 'ZO
m ON
X X X
E
0U' " < >< x3
o 0H
I--
X X X x X x XuX
Z x
. X X X X X x X X X HoX--J
>< >x ' < xi< ,
I'mx x X X X X ><x X X x X X X X
I--
. ,- U -L U. w U. UL LL - w L AL . U. ,, Li- w o L L L LL
V) (n t t V V V)( ( (n U tA A V) ( n L V L (nA( (AA(( ( A (nU)(
0u + I + a + I + + I + I + I + + I + I + + I + I +VA
.
5U U Uw1 CDU U 00 0 ---m--C3C3
01 ON 0) al 0) m) C) (3 a% b4:2: ( ~ D
M' to) f U C o M2 a) 0 C\j M' Ul) to f- 00 (A 0 - C~iC' j- - - - -. - .- .- C'.j 0'4 ('4 ( C\1
1 95

volume. Density is calculted from the results obtained. These data are determined by measuring
the quantity of mercury which Lan be forced into the pores of the test material at various increas-
ing pressures. Evidence of pore shape is obtained by determining the amount of mercury expelled
from the pores at various decreasing pressures.
The theoretical basis for the mercury penetration method is negative capillary action: this
effect results from the nonwetting nature of mercury. Since mercury exhibits a contact angle of
greater than 900 with most materials, it will not penetrate pore openings in a material unless
forced by an applied pressure. Mercury will then penetrate the pores in accordance with the force
applied and the size o" the openings.
The relationship describing penetration of mercury into circular openings under pressure is:
PD = -4o ccs 0 (A-l)
where:
P = applied pressure
D = diameter of smallest pore, filled at pressure P
o = surface tension of mercury
0 = contact angle or wetting angle
Reported measurements of contact angle between mercury and a large number of materials ran(qe
from about 1120 to 1420, with a contact angle of 1300 as the most frequent value. Accordingly,
taking 0 = 1300 and surface tensin of mercury o = 474 dynes/cm (vacuum, 25°C), the following rela-
tionship is obtained for cy indrical pores:
PD = 177 (A-2)
where pressure P is in psia and diameter D is in microns.
As the pressure is increased, the amount of liquid mercury forced into the pores increases.
From Equation (A-2), the diameter of the pore is obtained for that pav'ticular pressure. The volume
of mercury forced into a pore is a direct function of the volume of the pore. Thusi a penetration-
volume versus applied-pressure curve can be dr-wn and analyzed for particle size. Material density
can be calculated with pores larger than any limiting size exclIUdd.
196

Table A-8 lists the measured physical properties of different materials by material state,
i.e., virgin, backface or fired. The virgin state refers to the as-received material, the fired
state refers to the fired surface, and the backface state refers to the material a small Jistance
below the fired surface. Within a state, the materials are divided into three groups by material
class. These three groups are:
1. Bulk graphite
2. Carbon/carbon (c/c)
3. Pyrolytic graphite (PG)
In order to make a comparison between different material classes at various material states,
average material properties are plotted in Figures A-35 through A-37.
In preparing these figures, only those materials for which data was available in all three
states were utilized.
Density values of the virgin state are greater than those at the fired state as seen in
Figure A-35. As expected, the porosity values show just the reverse behavior as seen in Figure
A-36. As observed in Figure A-2, while the total porosity of c/c materials is greater than the
others, its open porosity is smaller than that for bulk graphite.
Figure A-37 presents the average specific open pore volume by material class for various
materials conditions. The shapes of the curves are similar to those of the open porosity curves.
Data for pyrolytic graphite is insufficient to draw any convincinq conclusions regarding the pro-
perties behavior.
Figures A-38 through A-40 show typical pore size spectrums for selected materials. There
was no consistent pore size occurrence within a given material class for a given material state.
For example, the pore size distribution for G-90 shows that about 22 percent of the pores fall in
the diameter range from 0.069 to 0.035 microns. The remaining porosity is scattered around it from
3.43 to 0.013 microns. On the other hand, for ATJ-S about 15 percent of the pores range from 4.66
to 3.42 microns in diameter, aboux 13 percent range from 0.023 to 0.018 micron in diameter and
others are scattered around these intervals from 17.0 to 0.013 microns in diameter.
Except for a few exceptions, it ca.i be said that the majority of the pores lie in the range
of about 17 to 0.013 microns in diameter regardless of material class or state. A shift, however,
towards smaller pore diameters with progression from virgin to backface/fired conditions was observed.
197

c In % - M u O0 to ODCO O iO C 0t to CO'D' C r, t'o inOl m. 4_ r U)tn- o t 00 r-. M- to- P) m '. 0 CO 0, 0, O to c D C03 0 C0 00 000 000 00 0D 000 -. 0 0 0 0D
4- u 9 9999)-40 t"0 000 00aCD 0 0 00 00C1)C C D 0 0 00 0 0 00 00 0 0C
4S-
rA~- (As- u - It nt C.)r toC ,C . 'LC) %M 0 r-.in. ci (D )N - l t0.LL) 0.- 00 4D ' M o NCi O*)
j C.)C ) ) n IT~ in U LO m (1)t) m ~ rt LO L L0'I f-C. f'.'.0C. - - -. -
04-)
M to ' 07 j l 1* M~L O Lr C).t)00mO% '.O Oii '.ONYC\J kso M' CC)C. toCi)0 ,) C.) C N.C6 V ,:C 6s~ -00 r CN -L i C.- Nr r. 4u CO 6 ocl) 0-0 C. J N N 0- M- Nn M- NJ C.%.)J) C~.j N* i- - - N~ - -~ -
a. 43 - C%
0
wx
Vi).'J 4
U'14Oc m t C.) to.'0 ! -LAO ) C ON 000 ) C) C - N al fOOMLLt) Kr- m 1. 0, m1'
r, 0'. . 0 01 i O l C- LS 0 001. 0) f-CODC 000D .- - - - cm 0).-CO to P.C- fl. Ir-C 0 C0f- M 0) JU-
ci) (1) - - - - - - - - - 0p0 aCL.
0 0.0. 0
C6
w-i au VT" ;T O CN - CO C.- LA r,- Ol NO C 00 NJ- MO NM un) M~ -I C' q% .0 M..j T CA ,t a -co () 0 C .NO Oin' k CO r h -.- 400 0 M r O-z- toOC N) r,'. 0 I. f-~ o'CA o CO N~
I- 0
x
in0 r - LA -- C..t OC 000C NN to -l COCO0 f I co N-i co co 00CC N mO COJ CoC -i C c rO CC < C', Z
u wM LID) (A0 CL '/ 0- V)a. . ) a. . a.. a. j -j 0. 0. 0.0. 0L M. .J .0L ~ 0
(0 4- 'a 4 140 ' )
c '0 ?.4c - ? . S-- 0 4)ol .1) V S-0 0) u 0 v(a r_ u-0 c C tu. 0-Q( - m .- .- I-.- '0 .- 0 -' (0 0
C)- 4- 'D .- -. 4- -0 (a- ro-- CO L. COLA. >- > 0 U-A. (0 0 ) .- '. )I- 0 a~0) 0)A Cl CLA.4 C.V cu -
a) rO-- v. SU*- I J4 ~- n'
(LI tu IL I I u CI5.. 0 0- 0. c>< to-~ 'x 0a LL. co 0n 0) 5- CD(0co
I .1. 00 E-o c o U
198

r-n
2.2
D PG(C) PG (16" 1i( Planar)
2.0
.6
S1.4Virginul (Jraphiteir
1.499

iA
24 Carbon/carbon Total
Bulk graphite
20
16
2 6 Btlk graphite
Open
o 1 2 -
' Carbon/carbon
8
D PG(C), total
4
Q.j PG(C), open PG (16 SiC, planar),open
Virgin Backface Fired
Material state
Figure A-36. Averaof) open and total porosity by material classa different material states.
203

.lOO.10
.08 Bulk graphite
" > 06 Carbon/carbon
L
0
C
0 04
o .04
Virgin Backface Fired
Material state
Figure A-37. Average specific opcn pore volume by ma terialclass at different material states.
201

3wfllof 3bOd 1N33N3d 3flhvfllnfo
00 Cm V f N
0
000U- 0
.14
W c 03 a a....s% \'.L
w .0
(n
OD
202~

3JflOf 3?jQd ±N3383d 3A I J.1flMn
M CD tnV N - M
wmtotacomoo C; c
~N~a)-
-
W 0
w~ a 9lzJ ow
Ei C.t (.) COf
1-- 0
C)-J4Ow
ac
w
4.)
0~c 0a. CL
a 0 0
Fs -in
203)

301CM~f 3bd IN303d 3flhjVOlNfl.
C!0
C!I
art
S-A ~.n t
V
- 5- - at
C!
204J

Limited data was developed for vapor deposited carbons, but it was observed that the pore
structure was radically different compared to bulk graphites or carbon/carbons.
REFERENCE FOR APPENDIX A
A-1. Hughes, M. C., et al., "Codeposited PG/SiC Nozzle Liners for Advanced ICBM Systems Vol. IDeposition Process Development," AFRPL-TR-74-15, April 1974.
205/206

APPENDIX B
GRAPHITIC MATERIALS THERMOPHYSICAL PROPERTIES
B.1 INTRODUCTION
There are many graphitic type materials typically used in the construction of solid propel-
lant rocket motor nozzles. It is important that the thermal properties of these various materials
be adequately established and generally accepted for meaningful and consistent predictions of ther-
mal response of rocket motor nozzles. The purpose of this appendix is to provide a collection or
recommended property values for selected types of graphitic materials. The properties collected
are those that are relevant to the prediction of thermal response, i.e., specific heat, thermal con-
ductivity, density, heat of formation and emissivity. For each type of material the following in-
formation is provided.
e List of manufacturers
* Manufacturers suggested property values
0 Uncertainties in property values
s Sensitivity of thermdl response to uncertainties in property values
o Recommended property values
This appendix is organized so that additional types of materials or new materials within an already
included type may be easily added.
The recommended property values result from a consideration of the sensitivity of the ther-
mal response to an assumed uncertainty in material properties. This sensitivity analysis was per-
formed for the nozzle throat insert of an MX nozzle using ablation rate as the principal criteria.
Since flow conditions in other regions of the nozzle are significantly different, the conclusions on
throat response sensitivity do not necessarily apply elsewhere.
Material property uncertainties may arise from:
a Lack of property data
20/

* Errors in property measurements
o Process variations (billet to billet)
* Within-billet variation
The thermal response is characterized by the time variation of:
o Surface temperature
* Surface recession
a Backwall temperature
For the purposes of the sensitivity analysis the environmental conditions were assumed to be:
* HTPB propellant ( 1 100 psia, T. a 66420R)
* M = l
* PeueCH = 0.7 - 14 Ibm/ft2sec
* CMCH = 0.6 - 0.8
The propellant gas properties and B' versus T maps were calculated by the GASKET code (Reference B-1)
using the most appropriate surface kinetic model included in the GASKET code. The thermal response
was calculated by the CMA code (Reference B-2) for the conditions given below.
e Material thickness equal to 2 inches (unless otherwise noted)
e Insulated backwall
a 40-second exposure
Only the principal results of the sensitivity study are presented in each Section to illustrate the
sensitivity of the thermal response to the various properties. General conclusions regarding the
thermal response are:
s The thermal response is insensitive to surface emissivity and heat of formation of the
particular graphitic material
* The surface temperature is insensitive to values for the specific heat, thermal conduc-
tivity and density
o For surface temperatures less than approximately 65000R*
This requirement arises from limitation of the slope of the B' versus T curve. In the region oflarge slope, near the sublimation region, the conclusions may not be valid.
208

- The mass loss rate and surface recession are insensitive to specific heat and thermal
conductivity variations
- The surface recession is directly proportional to density variation
* The backwall temperature is sensitive to variations in specific heat and thermal con-
ductivity
These conclusions are valid for the types of graphitic materials examined and for typical MX nozzle
throat conditions. They are not dependent upon the particular surface kinetic model or propellant
(for XLDB, PEG/FEFO or HTPB).
Properties to be presented are categorized into four generic classes, namely:
s Bulk graphite
e Carbon/carbon
* Pyrolytic graphite
* Modified pyrolytic graphite
B.2 BULK GRAPHITES
Bulk graphites are in widespread use in nozzle thermal protection systems which operate at
high temperatures and pressures. Presented herein are a brief description of the manufacturing pro-
cess, a list of manufacturers of aerospace grades of bulk graphite, representative thermal proper-
ties, and the results of the analysis of the sensitivity of the thermal response to property varia-
tion.
B,2.1 Manufacturing Sunary
Manufactured graphite, in aerospace grades, is produced in a similar fashion by all manufac-
turers. A filler, usually petroleum coke, and a binder, coal tar pitch, are mixed and then formed
to a shape. This is baked to form amorphous carbon which is graphitized at temperatures ranging
from 40O°F to 5500°F. Variations in each step have a significant effect on the properties of the
finished product and contribute to the differences observed among the various commercial grades pro-
duced. In addition to these standard processes, certain grades of graphite are further densit.,ed,
either by hot-working finished billets or by multipitch impregnations and regraphitization of the
finished billets. These processes produce a material that is quite anisotropic with respect to ther-
mal and structural properties. The highest degree of anisotropy results from extrusion of a coarse
grain material; wherease, an isostatically mol.ded, fine grain material can be practically isotropic.
209

B.2.2 Materials Summary
Manufacturers and materials for which thermal property data are available are shown in Table
L-|. Detailed values for theral conductivity and specific heat are presented in Table B-2 through
Table B-Il. Figures B-1 through B-3 show these same thermal properties in graphical form. It
should be noted that, in many cases, material properties are obtained from tests conducted by in-
dependent organizations, such as SoRI, ARC, LMSC, GE, and Aerotherm, rather than the material manu-
facturer.
The heat of formation for the various bulk graphites is assumed to be zero (the value for
elemental carbon). The surface emissivity (total hemispherical) is initially a function of the
surface finish; however, once the surface starts ablating all the graphites have essentially the
same value, approximately 0.90.
For all the materials investigated it was necessary to estimate probable thermal property
variations within one grade (billet to billet variations) and probable variations of properties
v'thin one billet of material. There is general agreement that these variations do exist and that
they may have an impact on design considerations. No large body of data was found treating this
area; however, References B-10 and B-l offer some insight to the problem. Reference B-ll is a
study of ATJ-S graphite and its property variations and is used as i source for the magnitude of
variations. Variations in thermal conductivity of ±14 percent with respect to the nominal values
are reported for billet to billet variations; variationf of specific heat, density, and emissivity
were found to be negligible. This referenca also considered within-billet variations and found
that they do exist, but, from a thermal p,-operty standpoint, these were negligible.
B.2.3 Sensitivity Analysis and Recommended Values
The results of the sensitivity analysis for bulk graphite are shown in Table B-12 and are
consistent with the general conclusions given in Section B.l. Nominal property values for this sen-
sitivity study were taken as those of ATJ-S. The variations in surface emissivity and specific heat
wert: arbitrarily selected to determine their impact on the thermal response. The variation in den-
sity covered the range of values for all the bulk graphites about a nominal value of 1.83 g/cc.
The thermal conductivity was allowed to vary by t14 percent to reflect the reported billet to billet
variations. (The error for measurement of thermal conductivity was reported as ±7 percent in Refer-
ence B-15.) The nominal values of TBW, TS5 and recession for the with-grain case are shown in Table
B-12. The results for the sensitivity, i.e., the percent fluctuation in TBW, TS, and recession,
210

TABLE B-i. BULK GRAPHITE MANUFACTURERS
Product (s)Manufacturer (Density, G/CC)
Carborundum Co. G-90 (1.90), Graphitite-G (1.88)
Great Lakes Carbon Corp. H-205-85 (1 .81)
Poco Graphite, Inc. AXF-5Q (1.81)
Pure Carbon P-03 (1.83)
Speer Carbon 8882-E (1.76)
Union Carbide ATJ (1.73), ATJ-S (1.83),
AGSR (1.55), CS (1.72)
211

TABLE B-2. THERMAL PROPERTIES ATJ (Reference B-12)
Thermal ConductivityTemperature Specific Heat Btu/ft-sec-cR x l0-'
OR Btu/lbm-°RW/G A/G
460 0.283 20.52 15.6
960 .340 16.08 11.761460 .390 12.36 9.37
1960 .430 9.67 7.96
2460 .462 7.86 6.29
3450 .505 6.46 5.09
4460 .521 5.78 4.74
5460 .525 5.39 4.56
6460 .525 5.32 4.44
Density = 107.6 ibm/ft 3 1.73 g/cc
212

TABLE B-3. THERMAL PROPERTIES ATJ-S (Reference B-11)
Thermal Conductivity
Temperature Specific Heat B10f-3c-ROR Btu/lbm-0R __________________x
1W;G A/G
460 0.283 26.80 19.56
960 .340 18.72 14.88
1460 .390 14.64 11.55
1960 .430 11.74 9.16
2460 .462 9.70 7.43
3460 .505 7.32 5.00
4460 .521 6.34 4.66
5460 .526 5.3b 4.42
6460 .526 5.44 4.16
Density 114.2 lbm/ft3 1.83 g/cc
213

TABLE B-4. THERMAL PROPERTIES AXF-5 ISOTROPIC (Reference B-12)
Thermal ConductivityTemperature Specific Heat -3
OR Btu/lbm-OR Btuft-sec-°R x 10
460 0.283 19.4
960 .340 15.0
1460 .390 12.48
1960 .430 10.19
2460 .462 8.57
3460 .505 6.59
4460 .521 5.95
5460 .525 5.56
6460 .525 5.56
Density = 113.2 Ibm/ft 3 = 1.81 g/cc
214

TABLE B-5. THERMAL PROPERTIES AGSR (Reference B-12)
Temperature Specific Heat Thermal Conductivity
OR Btu/Ibm R Btu/ft-sec-0 R x 10 3
WIG A/G
460 0.283 24.48 19.44
960 .340 18.72 15.001460 .390 14.28 11.34
1960 .430 11.27 8.90
2460 .462 9.26 7.36
3460 .505 6.95 5.51
4460 .521 6.25 4.86
5460 .525 6.20 4.86
6460 .525 6.20 4,86
Density 96.77 Ibm/ft3 = 1.55 g/cc
215

TABLE B-6. THERMAL PROPERTIES CS (Reference B-12)
Temperature Specific Heat Thermal Conductivity
OR Btu/ibmR Btu/ft-sec-0R x 10-3
W/, A/G
460 0.283 25.68 20.40
960 .340 20.88 16.32
1460 .390 16.68 12.96
1960 .430 13.56 10.66
2460 .462 11.17 8.80
3460 .505 8.80 6.94
4460 .521 7.82 6.13
5460 .525 7.40 5.78
6460 .525 7,30 5.78
Density 107.5 lbm/ft 3 = 1.72 g/cc
216

TABLE B-7. THERIAL PROPERTIES G-90 (Reference B-12)
Thermal ConductivityTemperature Specific Heat Btu/ft-sec-0R x 10- 3
OR Btu/lbm-°R
W/G A/G
460 0.283 30.60 21.00
960 .340 22.68 16.92
1460 .390 16.68 13.44
1960 .430 12.96 10.76
2460 .462 10.88 9.14
3460 .505 8.10 7.16
4460 .521 7.16 6.36
5460 .525 6.95 6.13
6460 .525 6.95 6.13
Density 118.5 ibm/ft 3 = 1.9 9/cc
217

I
TABLE B-8. THERMAL PROPERTIES GRAPHITE "G" (Reference B-13)
Thermal ConductivityTemperature Speqific Heat Btu/ft-sec-R x 10 3
OR Btu/lbm--R
W/G A/G
460 0.283 27.72 20.04
960 .340 19.44 13.921460 .390 13.32 8.62
1960 .430 9.72 6.11
2460 .462 8.05 5.14
3460 .5n5 5.54 3.32
4460 .521 4.86 2.774960 .523 4.86 2,77
Density 117.5 lbm/ft3 1.88 9/cc
21

TABLE B-9. THERMAL PROPERTIES H-205-85 (Reference B-13)
Thermal Conductivity
Temperature Specific Heat Btu/ft-sec-R x 10 3
OR Btj/lbm-uR
W/G A/G
460. 0.283 25.44 24.36
960. .340 22.56 20.04
1460. .390 18.24 15.00
1960. .430 13.56 12.24
2460. .462 11.33 11.05
2960. ---- 9.84 10.68
3460. .505 9,22 10.55
3960. ---- 8.75 10.19
4460. .521 8.56 9.72
Density 113.2 lbm/ft 3 = 1.81 9/cc
219

B-10. THERMAL PROPERTIES P-03-ISOTROPIC (Reference B-13)
Temperature Specific Heat Thermal Conduc-tivitORBtu/lbm-*R Btu/ft-sec-0R x 10 IY
1110 0.350 27.7681460 .390 21.6721936 .428 14.580
2460 .462 10.692
3460 .505 7.9084460 .521 7.2245460 .525 6.948
Density 114 ibm/ft 3 =1.83 g/cc
220

B-il. THERML PROPERTIES SPEER 8882-E (Reference B-14)
Thermal ConductivitTemperature Specific Heat Btu/ft-sec-*R X 104
OR Btu/Ibm-0RW/G A/G
460 0.340 53.16 44.041460 .390 36.96 25.441960 .430 21.00 14.042460 .462 12.96 9.803460 .505 10.50 9.064460 .521 10.50 9.066460 .525 10.50 9.06
Density =109.9 ibm/ft3 =1.76 9/cc
221

50
Speer4~5 8582 - -
40 _____
0
30
4-I'
25
4J G-90:3 %S20 ATJ- S\o\
o I)'oI0
0l.0 2.0 3.0 4.0 5.0 6.0Temperature 1 0R x i03
Figure B-I. Thermal conductivity of bulk graphites against grain direction(P-03 is isotropic).
222

6882
5.0 __
4.5 P-03
4.0 \
x 3.5
0
U
G-90
. 3.0
00
ATJ-S> 2.5
ATJ- '
0UCARu 2.0
.-
1.50 _____
0.5 1---
0--0 1.0 2.0 3.0 4.0 5.0 6.0
Temperature, *R x 10
Figure B-2. Thermal conductivity of bulk graphites with grain direction.
223

0.55
0.50-
0.45
0.40
.~0.35
4
co 0.30-- _ _
0.2
TeprtU 0.x200
F(ueD3 pcfcheto ukgahts
22

TABLE B-12. EFFECT OF PROPERTY VARIATION ON THERMALRESPONSE FOR BULK GRAPHITES
TBW Ts RecessiontProperty Variation* (2320R) (5490R) (.47 in)
+30% +4% +0.5% +2%
p +10% +10%
k +14% +7% T0.1% ;2%
C p +10% +6% ;2% ;1%
Worst combination +16% +2% +3%of C and k
ATJ-S selected for nominal values; with-grain results shown inparenthesis above.
SEvaluated at end of 40 seconds.
225

were the same for both the with grain and against grain values of k. Also, a severe change in the
surface kinetic model (from the bull, graphite model to the layer PG model) had very little effect
on the sensitivity to property variations. (The sensitivity to the kinetic model itself was not con-
sidered in this investigation.)
From the results of the sensitivity analysis and the availability and scatter of materials
properties, the following property values are recommended:
e = =0.9
h = 0.0 Btu/Ibm
* C - see Figure B-3
* k,p = a. Use manufacturers recommended values
b. Use values for G-90 or ATJ-S as representative values
B.3 CARBON/CARBON COMPOSITES
This section contains a brief description of the manufacturing process, a list of carbon/
carbon manufacturers and thermal properties of their products, and the results of a sensitivity
study of the thermal response to possible property variations for carbon/carbon cnmposite materials.
B.3.1 Manufacturing Summary
The class of materials known as carbon/carbon composites is a very broad category and there
are many variations in material processing. Also, the precise details of these processes are pro-
prietary; so, only a brief and very general description can be given for the processing of carbon
composites. (See Reference B-30 for more details on the processing of carbon composites.)
A typical 2-0 carbon/carbon c3mposite starts out as a carbon or graphite phenolic, which is
densified through a combination of liquid phase impregnation and/or gas phase (Carbon Vapor Deposi-
tion, CVD) densification. This material is then carbonized and graphitized or annealed at tempera-
tures in excess of 50000R. It is not unusual for the carbon composite materials to go through sev-
eral impregnation or CVD cycles with graphitization or annealing at the appropriate time. The inanu-
facture of 3-D composites is somewhat different, as data from AVCO shows. A preform is first con-
structed consisting of graphite fabrics pierced with graphite fibers. This preform is impregnated
with a phenolic resin; carbonized at -2460OR and then graphitized at -54600R. The great diversity
among the carbon composites results from all the possible variations of process cycles and condi-
tions that are possible.
226

B.3.2 Materials Survey
Table B-13 lists the companies and the products for which thermal properties were made avail-
able. Valurs for the density, specific heat, and thermal conductivity are given in Tables B-14
through B-19 for these materials. This same information is presented graphically in Figures B-4
through B-6 where the differences in thermal conductivity are apparent. The heat of formation can
be assumed to be zero and the surface emissivity can be taken as 0.90. It should be noted that
these composite materials are not as well characterized &s the bulk graphites and that the proper-
ties are strongly dependent on the particular processing. The density may even vary significantly
for the same material specification, for example, Pyrocarb 901 is given here with p = 1.6 g/cm3
whereas a sample of Pyrocarb 901 tested by Aerotherm had p = 1.8 g/em.
Billet to billet and within billet variations of properties are discussed in Reference B-31
and B-32. The density both within a billet and between billets was found to vary as much as ±5 per-
cent. Thermal conductivity variations can be expected to be 7 percent due to material variations
and experimental error (Reference B-31). The specific heat is not always reported and in some cases
must be approximated from values for other carbon/carbon materials.
8.3.3 Sensitivity Analysis and Recommended Values
The significant results of the sensitivity study for the carbon/carbon composites are given
in Table B-20. The sensitivity to emissivity aad heat of formation are not shown since thermal re-
sponse was found to be insensitive to either. The property values for Haveg SP8040 were used as
nominal values. Variations in Cp and k for this sensitivity study were larger than those used in
the graphite studies. This was done for two reasons:
e Property values vary widely for the various materials classed as carbon/carbon composites
* Qualitative results for small variations were evaluated in the bulk graphite section
(Section B.2)
The bulk graphite surface kinetic model in GASKET was used since at the time of these studies there
were no models for carbon/carbon materials. This is acceptable since the results of the bulk graph-
ite sensitivity study showed that the sensitivity to property variations was not dependent on the
surface kinetic model. The results shown in Table B-20 support the general conclusion of Section B.I.
For detailed calculations the manufacturers recommended values should be used. The MOD 3 ma-
terial is a three-dimensional weave and should not be used as representative of two-dimensional ma-
terials. If property values are not known, the SP8040 values can be used as representative. For
227

TABLE B-13. CARBON/CARBON COMPOSITE MANUFACTURERS
ManufaturerProductsManufaturer(Density, g/cc)
AVCO Corp. MOD-3 (1.61)
Carborundun Co. Carbltex 700 (1.5)
Haveg Industries, Inc. FM-5228 (1.51), SP-8040 (1.4)
HITCO PC-901 (1.6), PC-502-1 (1.2)
228

TABLE B-14. THERMAL PROPERTIES MOD 3 (Reference B-31)
Thermal ConductivityBtu/ft/sec-°R x 10-3
Temperature Specific Heat
OR Btu/lbm-°R W/Pt A/P
x y z
960 .31 12.0 13.92 8.323
1460 .37 1O.19 11.11 6.95
1960 .43 8.10 9.14 5.90
2460 .46 6.83 7.4 5.09
2960 .51 6.02 6.3 4.61
3460 .53 5.38 5.724 4.16
4460 4.56 J.74 3.82
5460 .53 4.28 4.28 3.72Density= 100.51 ibm/ft 3
= 1.61 g/cc
*Estimated
t The thermal conductivity in the 450 x-y direction was also reported
in Reference B-30 and is different from the above values.
229

TABLE B-15. THERMAL PROPERTIES PYROCARB 901 (Reference B-32)
Thermal ConductivityTemperature Specific Heat*
OR Btu/lbm-*R Btu/ft-sec-°R x
W/P A/P
460 0.18 7.22 1.92
640 0.21 8.75 2.56
960 0.31 7.75 2.21
1460 0.37 6.25 1.85
1960 0.43 5.48 1.64
2960 0.46 4.81 1.52
3960 0.51 4.76 1.55
4960 0.53 5.03 1.74
5460 0.53 5.33 1.94
Density = 100.51 ibm/ft 3 1.6 g/cc
*Estimated
230

TABLE B-16. THERMAL PROPERTIES C/C 700 (Reference B-30)
Thermal Conductivity
Temperature Specific Heat Btu/ft-sec OR x 10-3
OR Btu/lbmW/P A/P
530 0.18 15.0 5.62
960 0.31 9.5 3.70
1960 0.43 5.9 2.67
2460 0.46 5.66 2.08
2960 0.48 5.55 1.86
3460 0.49 5.7b 1.97
3960 0.51 5.75 2.92
4460 0.51 6.50 2.77
5460 0.53 7.30 3.54
5960 0.53 7.85 3.85
Density = 93.5 ibm/ft3 = 1.5 g/cc
231

TABLE B-17. THERMAL PROPERTIES SP-8040 (Reference B-32)
Thermal ConductivityTemperature Specific Heat
ORBtu/lbm-OR Btu/ft-sec-.R x 10W/P A/P
530 0.245 5.30 2.50
800 0.260 5.75 2.95
1100 0.335 6.30 3.20
1500 0.450 7.60 3.40
2000 0.570 7.95 3.20
2500 0.580 7.85 2.80
3000 0.580 7.60 2.60
3500 0.580 7.40 2.70
4000 0.580 7.40 2.90
4500 0.580 7.70 3.3G
5500 0.580 j 9.30 4.90
Density =87.0 ibm/ft 3 =1.4 g/cc
232

TABLE B-18. THERMAL PROPERTIES PYROCARB 502-1 (Reference B-32)
Thermal Conductivity
Temperature Specific Heat Btu/ftsec 8R x io-OR Btu/ibm.OR Buf-e-RxI "
W/P A/P
530 0.240 3.1O 1.50
800 0.275 3.70 1.52
1100 0.340 4.30 1.55
1500 0.415 6.10 1.90
2000 0.540 6.35 2,20
2500 0.54C 5.75 2.00
3000 0.540 4.90 1.90
3500 0.540 5.40 2.40
4000 0.540 6.30 3.00
4500 0.540 7.35 4.15
5500 0.540 9.75 7.60
Density 74.5 Ibm/ft3 = 1.2 g/cc
233

F
TABLE B-19. THERMAL PROPERTIES FM-5228 (Reference B-32)
Thermal ConductivityTemperature Specific Heat Btu/ft-sec R x 10-
OR Btu/lbmO-R Bt_/ft-se_ ___x___u-
W/P A/P
530 0.215 4.15 3.0
800 0.240 4.70 3.5
1100 0.315 5.35 3.8
1500 0.,'55 8.30 4.0
2000 0.590 8.80 3.9
2500 0.600 8.70 3.6
3000 0.600 8.20 3.4
3500 0.600 8.10 3.9
4000 0.600 8.15 5.0
4500 0.600 8.50 6.0
5500 0.600 9.60 8.0
Density = 94 ibm/ft 3 1.5 g/cc
234

12
10
0
x FM 5228
0 8 8U
P C 502-1
4-1
6
4-)U
' 8040
02 0 1.0 2.0 3.0 4.0 5.0 6.0
Temperature ' 0R x 10
Figure B-4. Thermal conductivities of carbon composites, against ply.
235

161
14_________
12
6
x FM 522801 10 PC 502-1/ /~
V)I SP 8040
8
4
0
0 1.0 2.0 3.0 4.0 5.0 6.0
Temperature, OR x 103
Figure B-5. Thermal conductivities of carbon composites, with ply.
236

0.70
0.60 _ _. ..._ _ iFM 5228
I SP 8040 I
i PC 502-1
0.50 --
c/c 700- MOD-3
PC 901
0.40
_0.30
0.20 -
0.10
1 L
Temperature, 'R x 103
Figure B-6. Specific heat vs temperature for six carbon composites.
237

TABLE B-20. EFFECTS OF PROPERTY VARIATION ON THERMALRESPONSE FOR CARBON-CARBON COMPOSITES
Property Variation* TjW TSt Recession
(2370R) (5460°R) (0.625 in)
p +10% .... +10%
k +50% +40% T1% T7%
C . +25% +25% +1% ;2%
*Haveq, SP-8040 used for nominal values, with ply resultsshown in parenthesis above,
tBulk Graphite kinetic model used in GASKET.
Effect of property variations on resultsare the same for with-ply and against-plyvalues..
238

simplicity, constant values of k, both with and against ply, and Cp could be used. Although there
are larger differences at low temperatures (T < 2500°R) these can usually be neglected since the
carbon/carbon materials would probably be used in high temperature applications and the low tempera-
ture transient response would not greatly effect the results. However, when tailored properly pro-
perty carbon/carbon materials are developed to the point where they are used as insulators as well
as flame surfaces, then low temperature properties become significant.
B.4 PYROLYTIC GRAPHITE
Pyrolytic graphite is a polycrystalline, highly anisotropic form of graphite produced by the
thermal decomposition of a hydrocarbon gas. PG plates (c plane) have been established as state-of-
the-art, however, a-b plane coatings have yet to be successfully developed for ICBM size rocket
nozzle throat inserts. A brief description of the manufacturing process, the reported thermal pro-
perties and the results of a sensitivity analysis are presented in this section.
B.4.1 Manufacturing Summary
Pyrolytic graphite is formed by the vapor deposition of a hydrocarbon gas, typically methane;
however, other hydrocarbons such as acetylene or propane are often used either by themselves or
mixed with methane. The deposition takes place on a preformed graphitic substate in an induction
furnace operating at temperatures between 3500OR and 45000R.
B.4.2 Material Survey
Table B-21 lists some pyrolytic graphite manufacturers. Thermal conductivity Ond specific
heat values used by the rocket motor companies are shown in Figures B-7 through B-9.
The density of pyrolytic graphite is 2.2 gr/cc. The heat of formation is assumed to be zero
(the value for elemental carbon). The surface emisivity (total hemispherical) is initially a
function of the surface fininsh, however, once the surface starts ablating, all of the graphites
have essentially the same value, approximately 0.90.
B.4.3 Sensitivity Analysis
Table B-22 shows only the results of the sensitivity analysis for variations in thermal con-
ductivity. All other results are consistent with those reported in Section B.I. The large varia-
tions in thermal conductivity were arbitrarily selected to show the influence of very large property
variations.
239

TABLE B-21. PYROLYTIC GRAPHITE MANUFACTURERS
MANUFACTURER PRODUCT(S)
Atlantic Research .orporation PURE PG
General Atomic Company ISOTROPIC CARBON
General Electric Company PURE PG
Hitco Inc. PURE PG
Materials Technology Corporation PURE PG
Pfizer Corporation PURE PG
Raytheon Corporation PURE PG
Rocket Propulsion Establishment PURE PG
Super Temp. Corporation PURE PG
Union Carbide Corporation PURE PG
240

6.5
* 6.0
5.5
5.0
I 4.5
o 4.0U
4- 3.54-,
*I 3.0
U
2.5
2.0
Aerojet,1.5 -- -- Aerotherm (E
Hercules (Supertemp)
Thiokol,
0.5 (Pfizer)
0 JL I __ .. I0 1.0 2.0 3.0 4.0 5.0 6.0 7.0 8.0
Temperature, °R x 10'
Figure B-7. Thermal conductivity, a-b plane.
241

6.0
5.0
4.5
4.0
0'
U H Hercules3.5 (Superteoup)
4-
CO3.0 14-)
u: 2.5 -
Aerojet,1) Aerotherm (GE)
- 2.0
1.0
0.5 ____Thiokol
UTC(Pfizer)
0 1.0 2.0 3.0 4.0 5.0 6,0 7.0 8.0
Temperature, °R x 101
Figure B-8. Thermal conductivity, c direction.
242

II
|4
1.0
0.8
LL.0
oo0.6
S0.4U
4-'F-
v' 0.2
0
1000 2000 3000 4000 5000
Temperature *F
Figure B-9. Pyrolytic graphite specific heat.
243

TABLE B-22. THERMAL RESPONSE FOR LAYER PG FORVARIATIONS IN THERMAL CONDUCTIVITY
Varlationt TBW T *Recession
(860'R) (62000R) (007 in
-80% -38% +1% +7%
-50% -17% +1% +A%
+50% +13% -1% -3%+500% +55% -3% -17%
Layer PG kinetic model used in GASKET.thArotherm PG property values taken as nominal.100 mil PG on 2-inch ATJ substrate.
244

B.5 MODIFIED PYROLYTIC GRAPHITES
B.5.1 Codeposited Silicon Carbide/Pyrolytic Graphite
Codeposited SiC/PG is a relatively new material for rocket nozzle inserts. The primary manu-
facturer is Atlantic Research Corporation. A brief description of the manufacturing process, the
reported thermal properties, and the results of the sensitivity analysis for SiC/PG are presented
in this section.
B.5.1.1 Manufacturing Summary
Silicon carbide codeposited pyrolytic graphite (Si(,/PG) is formed by the vapor deposition of
a silikon and carbon carrying gas (e.g., 2 percent methane, 25 percent methyl trichlorosilane in
nitrogen) on a preformed graphite substrate. The deposition process takes place in an induction
furnace operating at temperatures between 3500°R and 4500°R. After being coated the material is
annealed in a nitrogen environment at temperatures of 4200OR to 47000R.
B.5.1.2 Material Survey
The only information collected on the thermal properties of SiC/PG is that provided by
Atlantic Research Corporation and Southern Research Institute (References B-50 to B-52). The mate-
rial tested was cut from one billet of SiC/PG which was nominally 20 percent SiC (by weight) with
density of 2.29 g/cc. The actual SiC content varied from 16 to 24 percent. Reference B-52 indi-
cates that the a-b plane thermal co,'ouctivlty is only slightly affected by minor variations in SiC
content; however, the c di, 'Jion values r,ay be altered by as much as 50 percent for a 5 percent
change in SiC content. In addition to these variations the measured values of c direction thermal
conductivity from two SoRI programs and the values calculated from TRW thermal stress tests are
greatly different (Figure B-10). Figure B-H1 shows the values of thermal conductivity and Figure
B-12 shows the specific heat.* All of these are for a nominal 20 percent SiC content.
B.5.1.3 Sensitivity Analysis and Recommended Values
The recommended values for thermal conductivity (Reference B-50) and specific heat are given
in Table B-23.
The heat of formation of SiC/PG can be calculated from:
Ho = -7.86 PSiC
Values supplied b, Atlantic Research Corporation.
245

4
*~b New --- I data (Rfrec B.-50)---
24

5.0
4.5 _ _
4.0
1.5
0
U
' 3.0
'k x 10', c-direction
5k x 10', a-b plane2.5
.51
U
C
I-l
i.- ___ __5_ - 11.0
0.5 !
0 .0 2.0 3.0 4.0 5.0 6,0
Temperature, 'R x 101
Figure B-11. Thermal conductivity of 20% SiC/PG.
247

0.5 -
4 J
4.)
-C
0. 1 _ _ _ _ _ _ _ _ _
02345 6Temperature, *R x10
Figure B-12. Specific heat of SIC/PG.
248

iE
TABLE B-23. THERMAL PROPERTIES SiC/PG ATLANTICRESEARCH - 20% SiC (References B-50TO B-52
Thermal ConductivityTmraueSpecific Heat 0Temp~rature Btu/ibm.oR Btu/ft-sec R x 10-1
a-b plane c-direction
525 0.17 33.6
960 0.31 28.8 4.5
1460 0.37 24.0 3.46
2460 0.43 15.6 1,80
2960 0.45 13.2 1.23
3460 u.467 11.3 1.26
4460 0.475 9.0 1.45
4960 0.480 9.0 1.58
5460 0.480 9.0
density 142.96 Ibm/ft3 = 2.29 g/cc
249

where Psic is the weight percent of SiC and Ho is given in Btu/lbm. It should be noted that the
thermal response is very insensitive to the heat of formation.
The emissivity can be taken as 0.85.* Sample results of the sensitivity analysis are given
in Table 8-24.
Values supplied by Atlantic Research Corporation.
250

TABLE B-24. EFFECTS OF PROPERTY VARIATION ONTHERMAL RESPONSE FOR SiC/PG (20PERCENT BY WEIGHT SiC)
Property Variation TBW T a* Recession
(25600R) (54000 R) (0.33 in)t
p +10% +10%
k +50% +50% +2% +2%
Cp +25% +10% +1% +1%
Bulk graphite kinetic model used in GASKET.ta-b plane results shown in parenthesis.
Effect of property variations on results samefor a-b plane and c direction values.
26 1

REFERENCES FOR APPENDIX B
B-1. User's Manual, "Aerotherm Graphite Surface Kinetics Computer Program," Volumes 1 and 2,Acurex Corporation/Aerotherm Division, Mountain View, California, Aerotherm Report No.UM-72-25, AFRPL-TR-72-23, January 1972.
B-2. User's Manual, "'erotherm Charring Material Thermal Response and Ablation Program, Version 3",Acurex Corporation/Aerotherm Division, Mountain View, California, Aerotherm Report No. UM-70-14,AFRPL-TR-70-92, April 1970.
B-3 - Reserved for future use.B-9.
B-10. Forney, Jr., D. M., ed., "Graphitic Materials for Advanced Reentry Systems - Part I," AirForce Mterials Laboratory Report AFML-TR-70-133, Air Force Systems Command, Wright-PattersonAir Force Base, Ohio, August 1970.
B-il. Starrett, H. S., Pears, C. D., "Probable and Average Properties of ATJ-S(WS) Graphite,"Southern Research Report, Southern Research Institute, Birmingham, Alabama, November 1972.
B-12. Pears, C. D., Starret, H. S., "Polygraphites Subjected to Temperature Stress Loadings,"Southern Research Technical Report AFML-TR-73-59, Southern Research Institute, Birmingham,Alabama, March 1973.
B-13. The Aerospace Corporation, Reentry Materials Handbook, Aerospace Report TOR-lOOl(52855-20)-3,El Segundo, California, December 1968.
B-14. Baker, D. L., Bonnett, W. S., Davis, J. E., "Cooldown and Motor Firing ThermostructuralAnalysis of a 7.0 Inch Diameter Pyrolytic Graphite Insert," Aerotherm Report 73-74, AcurexCorporation/Aerotherm Division, Mountain View, Califorria, July 1973.
B-15. Mann, W. H., Jr. and Pears, C. D., "A Radial Heat Flow Method for the Measurement of ThermalConductivity to 5000 0F," presented at the Conference on Thermal Conductivity Methods, BattelleMemorial Institute, October 26-28, 1961.
B-16 - Reserved for future use.B-29.
B-30. "Properties of Carbon/Carbon Composites - Carbitex 700," Report TWR-7451, Thiokol ChemicalCorporation.
B-31. Legg, J. K., Starrett, H. S., Sanders, H. G., and Pears, C. D., "Mechanical and Thermal Pro-perties of MOD 3," Southern Research Institute, Technical Report. No. AFML-TR-73-14, VolumeIV, September 1973.
B-32. "The Thermal Properties of Pyrocarb 901," Final report to Hitco, Inc. by Southern ResearchInstitute, SoRI-EAS-74-032, January 1974.
B-33. Baker, D. L., Schaefer, J. W., and Wool, M. R., "Thermal Property and Ablative ResponseCharacterization of Pyrolized Materials," Aerotherm Corporation, Final Report 69-47,January 1969.
B-34 - Reserved for future 'ise.B-49.
252

B-50. Hughes, M. C. and Singleton, R. H., "Codeposited PG/SiC Nozzle Liners for Advanced ICBMSystems, Vol. II Coating Characteristics," AFRPL-TR-74-15, Atlantic Research Corporation,Alexandria, Virgina, August 1974.
B-51. Singleton, R. H. Bielawski, C., and Undercoffer, K. E., "Development and Evaluation of PG/SiCCodeposited Coatings for Rocket Nozzle Inserts, Volume I: Insert Test and Evaluation in HighPerformance Propellant Environments," AFRPL-TR-73-107, Atlantic Research Corporation,Alexandria, Virginia, February 1974.
B-52. Singleton, R. H., "Development and Evaluation of PG/SiC Codeposited Coatings for Rocket NozzleInserts, Volume 1: Thermal and Mechanical Properties of PG/SiC Codeposit," AFRPL-TR-73-70,Atlantic Research Corporation, Alexandria, Virginia, 1973.
253