afrox investor & analyst presentation half-year results 2016
TRANSCRIPT


2
1. Performance Summary
2. Performance Drivers
3. Afrox Financial Results Analysed
4. Turnaround Update
5. Key Project Update & Outlook
6. Appendices
Presentation Outline
3
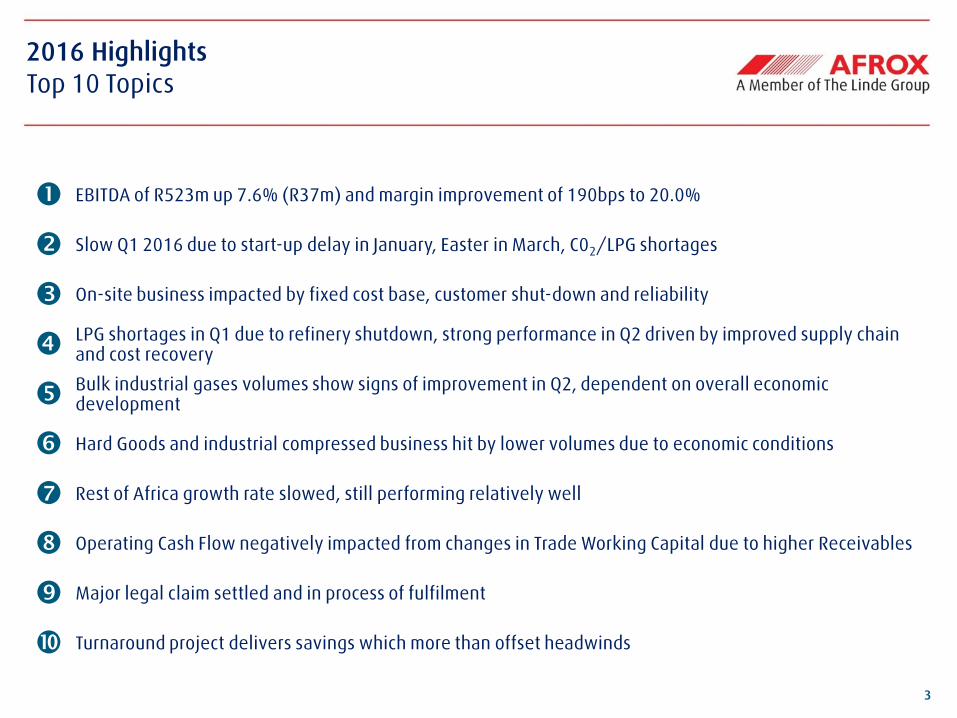
2016 Highlights
Top 10 Topics
EBITDA of R523m up 7.6% (R37m) and margin improvement of 190bps to 20.0%
Slow Q1 2016 due to start-up delay in January, Easter in March, C02/LPG shortages
On-site business impacted by fixed cost base, customer shut-down and reliability
LPG shortages in Q1 due to refinery shutdown, strong performance in Q2 driven by improved supply chain and cost recovery
Bulk industrial gases volumes show signs of improvement in Q2, dependent on overall economic development
Hard Goods and industrial compressed business hit by lower volumes due to economic conditions
Rest of Africa growth rate slowed, still performing relatively well
Operating Cash Flow negatively impacted from changes in Trade Working Capital due to higher Receivables
Major legal claim settled and in process of fulfilment
Turnaround project delivers savings which more than offset headwinds

4
31
25
28
22
8
6
8 8
2009 2010 2011 2012 2013 2014 2015 2016
SHEQ Performance
Significant MIR Reduction since 2009
¹ A MIR is an incident with a major outcome and consequences which represents a significant
non-compliance with Afrox's Safety, Security, Health, Environment and Quality (SHEQ) Policy
MIR Trend Comments
- MIRs¹ decreased by over 70% between
2013-2016 compared to the period 2009-2012
- Over 60% of the MIRs in 2016 are related to
security incidents
- Lost Time Injury (LTI) increased from 9 in 2015 to
11 in 2016 (YTD)
- 45% of the LTIs in 2016 are related to manual
handling
- Truck Severity level 1 and 2 decreased from 6 in
2015 to 2 in 2016 (YTD)
- Our SHEQ programmes are continuously
monitored and adapted to focus on improvement
in safe driving, manual handling and security
H1 2016

Performance Drivers

6
Progress Against Strategic Topics
By Business Segment
Prev. Latest
Atmospheric Gases Increase EBITDA from restructure
New CO2 sources
Increase asset utilisation and reliability
Go-to-market strategy
Growth in new applications
Price recovery 100% of cost inflation
LPG Leading margin management
Security of supply
Return on investment in cylinders
Go-to-market model relative to industrial gases
Ongoing focus on controlling illegal fillers and risk
Rest of Africa Reduce supply chain costs and increase customer supply security
Infrastructure in place for growth
Ensure critical mass per country and improvement in governance
Sales capability development
Hard Goods Optimise inventory
Right size fixed costs to throughput
Grow and defend volumes
Not started Work in progress Complete

7
Security of LPG Supply
¹ Bidvest Tanker Terminals (BTT), Richards Bay
- BTT¹ import commitment of 24 000 tons p/a with
ability to increase to 64 000 tons p/a according to
demand
- Additional investment in LPG bulk storage and
cylinders
- Logistics capability, vehicle and filling
infrastructure optimised
- Ability to support SA and Rest of Africa growth
- Management of import premium, resulting in full
cost recovery

8
Afrox Financial Results Analysed

9
Performance 30 June 2016
Highlights
¹ w/o positive effect from LPG market prices underlying revenue declined by –3%
ZARm H1 2015 H1 2016 YoY
Revenue 2 679 2 616 -2.3%¹
EBITDA 486 523 +7.6%
EBITDA margin 18.1% 20.0% +190bps
Operating cash flow 285 17 -94.0%
Headline EPS (cents) 37.4 76.5 +104.5%
Reported EPS (cents) 35.0 77.8 +122.3%
ROCE 16.6% 18.6% +200bps
- Market conditions and supply constraints impacted revenue development
- EBITDA growth in difficult trading conditions reflects benefits from restructuring initiatives
- Positive EBITDA margin development from restructuring
- Cash Flow reflects higher dividend, tax payments and increased Trade Working Capital
- ROCE improvement driven by higher profits and balance sheet optimisation

10
Business Performance
Lower revenues and reduction in GPADE due to volume decline
¹ Numbers shown on an adjusted basis with segments adjusted to align with how businesses are managed, & allocation of costs between businesses have been updated to better reflect
the split of operational costs | 2 GPADE is gross profit after distribution expenses
* Excluding change in market LPG prices
Atmospheric Gases LPG Hard Goods Rest of Africa
GPADE1,2
% Margin
Revenue1
2015 2016
1,050 1,044 862 852
2015 2016
400
336
2015 2016
367 384
2015 2016
366 335
2015 2016
163 185
2015 2016
148
114
2015 2016
163 162
2015 2016
-1% -1% -16% +5%
-8% +13%
-23% -1%
-3%*
34.8% 32.1% 18.8% 21.7% 37.1% 33.9% 44.4% 42.1%
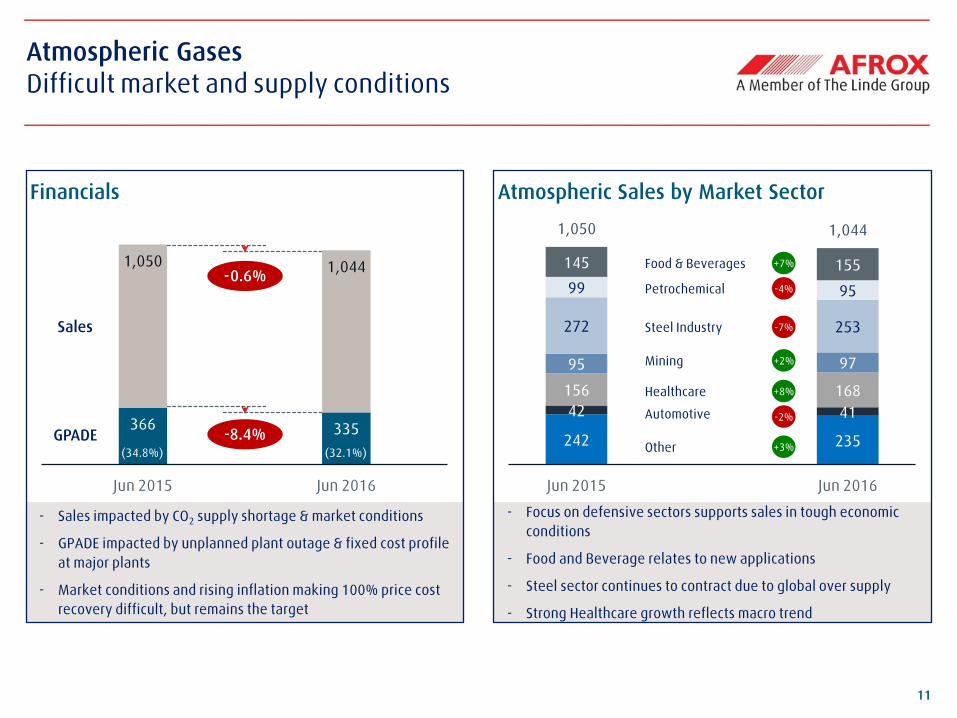
11
- Focus on defensive sectors supports sales in tough economic
conditions
- Food and Beverage relates to new applications
- Steel sector continues to contract due to global over supply
- Strong Healthcare growth reflects macro trend
Atmospheric Sales by Market Sector
242 235
42 41
156 168
95 97
272 253
99 95
145 155
1,050 1,044
Jun 2015 Column1 Jun 2016
366 335
1,050 1,044
Jun 2015 Jun 2016
- Sales impacted by CO2 supply shortage & market conditions
- GPADE impacted by unplanned plant outage & fixed cost profile
at major plants
- Market conditions and rising inflation making 100% price cost
recovery difficult, but remains the target
Atmospheric Gases
Difficult market and supply conditions
Financials
Sales
GPADE -8.4% (34.8%) (32.1%)
-0.6%
Automotive
Other
Healthcare
Mining
Steel Industry
Petrochemical
Food & Beverages +7%
-4%
-7%
+2%
-2%
+3%
+8%

12
163 185
862 852
Jun 2015 Jun 2016
23 25 25
39 37 36
62 62 60
Jun 2014 Jun 2015 Jun 2016
- Q1 saw supply shortages impact volume and increase supply
chain costs
- Q2 new supply contract and better PCR, and well position for H2
2016
- GPADE growth reflects supply chain cost savings and good price
cost recovery
Financials
Sales
GPADE
+13.6%
(18.8%) (21.7%)
-1.2%
LPG
Higher margin due to improved supply chain
* Excluding change in market LPG prices
Volume (KT) development 2014-2016
-3.0%*
Cylinder
Bulk
+0.5% -2.8%*
6
8
10
12
14
16
18 Margin per ton development Jan-13 to Jun-16

13
148
114
400
336
Jun 2015 Jun 2016
Hard Goods
Impacted by slowdown in mining industry
Financials Performance
- Volumes continue to be impacted by lower
demand in manufacturing and from strong
downturn in mining
- Shedding low margin business and rationalising
SKUs
- Pricing under pressure as some markets contract
while costs impacted by ZAR declines
- Outsourcing gas equipment manufacturing has
supported margins in this lower volume
environment
Sales
GPADE
-15.9%
-23.2%
(37.1%) (33.9%)

14
163 162
367 384
Jun 2015 Jun 2016
- Reported financials impacted by effects of Angola exit, LPG pass
through, currency translation effects and changes in stock
provisions
- Underlying Sales up 6.0% & GPADE down 2.8%
Rest of Africa
Performance impacted by portfolio change and LPG shortages
*Underlying financials excluding the impact of LPG pass through, currency translation, exit from Angola and stock provision changes
Financials Underlying performance
- Volumes holding up despite economic headwinds
- Margins declined due to very high inflation in
Zambia
- CO2 shortage in SA impacted margins into Zambia
and Malawi which are now resolved
- Currencies getting more volatile leading to high
imported inflation and frequent price increases
- Underlying Financials excluding the impact of LPG
pass through, currency translation, exit from
Angola and stock provision changes
Sales
GPADE
+4.6%
-0.8%
(44.4%) (42.1%)
+5.9%*
-2.8%*

15
555
458
Jun 2015¹ Jun 2016
Dec 2014 Jun 2015 Dec 2015 Jun 2016
- FTE reductions in line with turnaround plan
- Consolidation of head office implemented
- New procurement polices in place
- Outsourced fleet and implemented shared service centre
FTE development Other operating expenses
Other Operating Expenses & FTE development
Effects of turnaround materialised
-17.0%
(37.1%) (33.9%)
1 June 2015 excl. cost for restructure
-24%

16
Financial Performance H1: Key Indicators
Financial position remaining strong
Cash flow H1 2015 vs. H1 2016 June financial KPIs
- Free cash flow impacted by higher taxes, dividend payments and change in W/C
- Net debt ratio continues to improve relative to EBITDA
- Strong balance sheet with undrawn facilities
- ROCE improvement from higher profits
ZARm 2015 2016 ∆ in %
Operating cash flow 285 17 -94.0%
Investments (136) (112) 17.6%
Free cash flow 149 (95)
Cash at the end
of the period
646
757
16.3 14.4 12.9
16.6 18.6
2012 2013 2014 2015 2016
ROCE
0.8 0.7
0.6 0.63
0.3 Net debt/
EBITDA

17
Turnaround Update

18
Get healthy
- Introduce leaner organisation
- Rightsize operations*
- Better utilise assets*
- Outsource non-core operations
- More effective procurement
processes*
- Best commercial practice (BCP)
pricing composition
Turnaround Plan
Balanced channels and business portfolio
1
Completed
Get strong
- New customer centric operating
model
- Increase effectiveness &
efficiency of traditional
channels
- Introduction of eCommerce &
EDI
- Portfolio management
- BCP price cost recovery
2
In progress
Get business
- Grow Rest of Africa
- Grow LPG
- Grow Healthcare
- Grow Special Gases
3
19
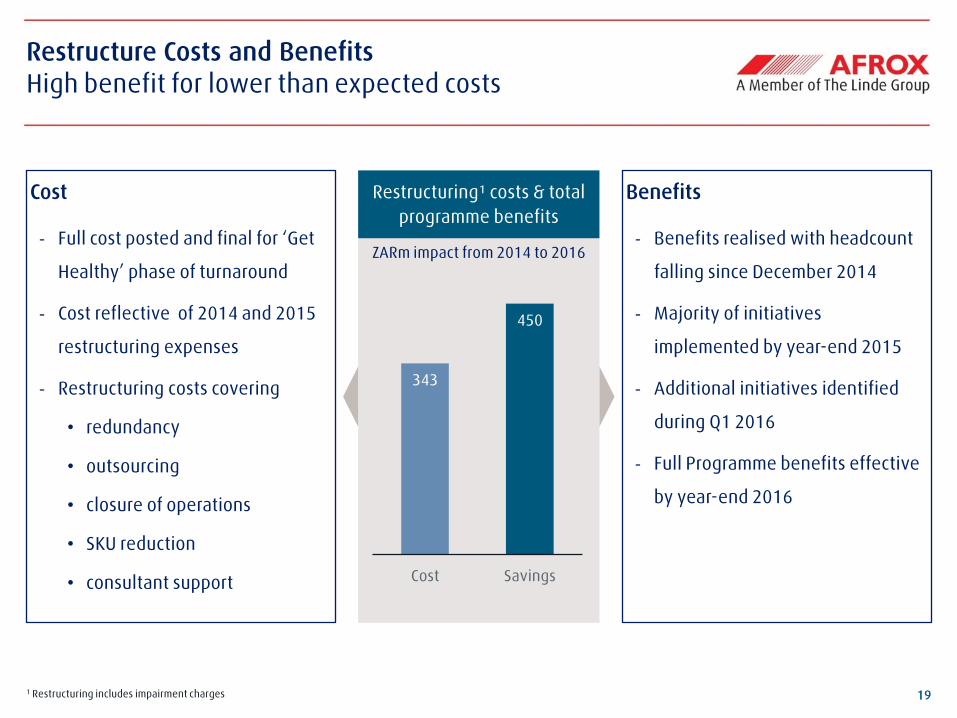
Restructure Costs and Benefits
High benefit for lower than expected costs
1 Restructuring includes impairment charges
Cost
- Full cost posted and final for ‘Get
Healthy’ phase of turnaround
- Cost reflective of 2014 and 2015
restructuring expenses
- Restructuring costs covering
• redundancy
• outsourcing
• closure of operations
• SKU reduction
• consultant support
Benefits
- Benefits realised with headcount
falling since December 2014
- Majority of initiatives
implemented by year-end 2015
- Additional initiatives identified
during Q1 2016
- Full Programme benefits effective
by year-end 2016
ZARm impact from 2014 to 2016
Restructuring¹ costs & total
programme benefits
343
450
Cost Savings

20
Key Project Update & Outlook

21
Key Project Update
1. Port Elizabeth ASU
- Successfully commissioned in April 2015, continues production since June 2015
- On-target performance to business case
2. New Durban Filling Plant, Riverhorse Valley
- New filling plant and equipment commissioned Q2 2016
- Project on-time and within budget
- External launch during H2 2016
3. Sale of Cornubia Land: 103 000m²
- Portion 79 was sold for R30m; 78 was sold for R24m
- Final portion, 77 sold in Q2 2016 for R66m
4. LPG Imports and Storage
- Bidvest Tanker Terminals (BTT) commissioned and operational since May 2016
- Improved security of LPG supply, ability to grow SA and Rest of Africa volumes

22
5. eCommerce Platform Update
- 11% of all delivered orders via eCommerce platforms
- 6 824 legal entities registered for eCommerce YTD
- 225 000 self-service transactions resulted in 18 000 man-hours saved
6.Helium Project
- Media release in Q2 2016
- Linde Engineering/Tetra 4 early engineering agreement in place
- Expected commercialisation 2018/19
Key Project Update Continued

23
- Ensure value of turnaround reflected in 2016 financials
- Implement ASU optimisation project
- Focus on price cost recovery (PCR)
- Improve asset utilisation
- Grow Special Gases, CO2, Healthcare, LPG, Rest of Africa
- Target ROCE of 20%+ in medium-term
Outlook

Thank You

25
Definition of Key Financial Figures
Appendix. III
GPADE
Gross Profit after Distribution Expenses
SG&A
Selling and marketing & general
administration costs
EBITDA
EBIT before non-recurring items adjusted
for amortisation of intangible assets and
depreciation of tangible assets
Return on Capital Employed (ROCE)
EBIT
before non-recurring items
Headline Earnings per Share (HEPS)
before non-recurring items
Profit for the period
before non-trading items
attributable to Afrox shareholders
Earnings per Share
(EPS)
Profit for the period
attributable to Afrox shareholders
Average Capital Employed
Equity (incl. non-controlling interests)
+ financial debt
+ liabilities from finance leases
- cash, cash equivalents & securities
- receivables from finance leases
Number of
weighted average
outstanding shares
Number of
weighted average
outstanding shares

26
AGM 26 May 2016
Interim Results Released 07 September 2016
Interim Investor and Analyst Presentation 08 September 2016
Contact
Phone: +27 11 490 0400
Email: [email protected]
Website: www.afrox.co.za
Investor Calendar 2016