afrl-afosr-jp-tr-2017-0001 the physics of · pdf filebalaji srinivasan indian institute of...
TRANSCRIPT

AFRL-AFOSR-JP-TR-2017-0001
The physics of transverse mode instability-induced nonlinear phase distortions in large areaoptical fiber amplifiers and their mitigation with applications in scaling of pulsed and continuous-wave high-energy lasers
Balaji SrinivasanINDIAN INSTITUTE OF TECHNOLOGY MADRAS
Final Report12/13/2016
DISTRIBUTION A: Distribution approved for public release.
AF Office Of Scientific Research (AFOSR)/ IOAArlington, Virginia 22203
Air Force Research Laboratory
Air Force Materiel Command

a. REPORT
Unclassified
b. ABSTRACT
Unclassified
c. THIS PAGE
Unclassified
REPORT DOCUMENTATION PAGE Form ApprovedOMB No. 0704-0188
The public reporting burden for this collection of information is estimated to average 1 hour per response, including the time for reviewing instructions, searching existing data sources, gathering and maintaining the data needed, and completing and reviewing the collection of information. Send comments regarding this burden estimate or any other aspect of this collection of information, including suggestions for reducing the burden, to Department of Defense, Executive Services, Directorate (0704-0188). Respondents should be aware that notwithstanding any other provision of law, no person shall be subject to any penalty for failing to comply with a collection of information if it does not display a currently valid OMB control number.PLEASE DO NOT RETURN YOUR FORM TO THE ABOVE ORGANIZATION.1. REPORT DATE (DD-MM-YYYY) 03-01-2017
2. REPORT TYPEFinal
3. DATES COVERED (From - To)24 Sep 2015 to 23 Sep 2016
4. TITLE AND SUBTITLEThe physics of transverse mode instability-induced nonlinear phase distortions in large area optical fiber amplifiers and their mitigation with applications in scaling of pulsed and continuous-wave high-energy lasers
5a. CONTRACT NUMBER
5b. GRANT NUMBERFA2386-15-1-5044
5c. PROGRAM ELEMENT NUMBER61102F
6. AUTHOR(S)Balaji Srinivasan
5d. PROJECT NUMBER
5e. TASK NUMBER
5f. WORK UNIT NUMBER
7. PERFORMING ORGANIZATION NAME(S) AND ADDRESS(ES)INDIAN INSTITUTE OF TECHNOLOGY MADRASSARDAR PATEL ROADChennai, 600036 IN
8. PERFORMING ORGANIZATIONREPORT NUMBER
9. SPONSORING/MONITORING AGENCY NAME(S) AND ADDRESS(ES)AOARDUNIT 45002APO AP 96338-5002
10. SPONSOR/MONITOR'S ACRONYM(S)AFRL/AFOSR IOA
11. SPONSOR/MONITOR'S REPORTNUMBER(S)
AFRL-AFOSR-JP-TR-2017-0001 12. DISTRIBUTION/AVAILABILITY STATEMENTA DISTRIBUTION UNLIMITED: PB Public Release
13. SUPPLEMENTARY NOTES
14. ABSTRACTDuring the reporting period, the PI investigated the use of vortex beams to mitigate thermal mode instability in high energy fiber amplifiers. The investigation is carried out through (1) the development of a comprehensive model to study and mitigate the onset of thermal mode instability in large mode area fiber amplifiers, and (2) the development of a testbed at IIT Madras to experimentally validate the above results as well as to explore the generation of vortex modes through a spiral phase plate and novel all-fiber fused coupler. Such work has laid the platform to demonstrate the mitigation of thermal mode instability through vortex beam amplification in high energy fiber amplifiers. Work is ongoing under a new grant FA2386-16-1-4077.
15. SUBJECT TERMSEOARD, coherently combined phased-array, high-energy laser phase distortions, vortex modes
16. SECURITY CLASSIFICATION OF: 17. LIMITATION OFABSTRACT
SAR
18. NUMBEROFPAGES
29
19a. NAME OF RESPONSIBLE PERSONROBERTSON, SCOTT
19b. TELEPHONE NUMBER (Include area code)+81-042-511-7008
Standard Form 298 (Rev. 8/98)Prescribed by ANSI Std. Z39.18
Page 1 of 1FORM SF 298
1/3/2017https://livelink.ebs.afrl.af.mil/livelink/llisapi.dll

Final Report for AOARD Grant # FA2386-15-1-5044
The physics of transverse mode instability-induced nonlinear phase distortions in large area optical fiber amplifiers and their mitigation with applications in scaling of pulsed and continuous-wave high-energy lasers
December 12, 2016
Name of Principal Investigators (PI and Co-PIs): Balaji Srinivasan, [email protected] Indian Institute of Technology Madras Rm 334A Electrical Sciences Building, IIT Madras, Adyar, Chennai 600 036. India. Phone: +91-44-2257 4426, Fax: +91-44-2257 0120
Deepa Venkitesh, [email protected] Indian Institute of Technology Madras Rm 336 Electrical Sciences Building, IIT Madras, Adyar, Chennai 600 036. India. Phone: +91-44-2257 4466, Fax: +91-44-2257 0120
Anil Prabhakar, [email protected] Indian Institute of Technology Madras Rm 246 Electrical Sciences Building, IIT Madras, Adyar, Chennai 600 036. India. Phone: +91-44-2257 4425, Fax: +91-44-2257 0120
Period of Performance: 09/24/2015 – 09/26/2016
Abstract: During the above reporting period, we investigated the use of vortex beams to mitigate thermal mode instability in high energy fiber amplifiers. The investigation is carried out through (1) the development of a comprehensive model to study and mitigate the onset of thermal mode instability in large mode area fiber amplifiers, and (2) the development of a testbed at IIT Madras to experimentally validate the above results as well as to explore the generation of vortex modes through a spiral phase plate and novel all-fiber fused coupler. Such work has laid the platform to demonstrate the mitigation of thermal mode instability through vortex beam amplification in high energy fiber amplifiers.
Introduction: See attached
Experiment: See attached
Results and Discussion: See attached
List of Publications and Significant Collaborations that resulted from your AOARD supported project: See attached
Attachments: See attached.
DD882: See attached.
DISTRIBUTION A. Approved for public release: distribution unlimited.

Executive Summary
The phase of an optical signal is of fundamental importance for mature applications such as chirped pulse amplification as well as for emerging applications such as coherent combination in phased-array lasers for high-energy lasers. Fiber amplifiers are preferred for these systems, but they are limited by transverse mode shifting effects including thermal mode instabilities, which can make it impossible to achieve required phase control. In order to address the above limitations, we proposed to study the thermal mode instabilities experimentally and theoretically, and investigate strategies in fiber design or operation (e.g., vortex modes) to mitigate the instabilities as well as the resulting phase distortion. As such, the specific objectives of the project are:
• Build a comprehensive model to study thermal mode instability (TMI) in high power fiberamplifiers and investigate its mitigation through the use of vortex modes.
• Construct a high power fiber amplifier test-bed at IITM to experimentally validate theabove results as well as to study the possible use of vortex modes for amplification.
Work done:
With respect to the modeling of TMI and its mitigation, we have implemented a scalar model with weakly guiding approximation to solve the wave equation in the fiber amplifier. The second order partial derivative is discretised using finite difference methods and results are stored in a sparse matrix to solve for the eigenmodes. The rate equations are subsequently solved over finite sections of the amplifier, and the thermal mode instability is introduced through the steady state thermal diffusion equation. The simulation results have been verified to be consistent with those reported previously in the literature. We have also explored the use of parallel processing to solve the rate equations across the transverse cross-section of the fiber amplifier, which has yielded promising results (50x improvement).
We have constructed a multi-stage Yb-doped high power fiber amplifier testbed at IITM with the help of ORC. A key feature of this testbed is the capability to vary the thermal load in the final stage through modulation of the master oscillator at different duty cycles. The testbed has been carefully designed and characterized up to the final amplifier stage. Our experimental results are found to be consistent with simulations. Concurrently, we have investigated the generation of vortex modes through spiral phase plates and novel all-fiber fused couplers. We have demonstrated the excitation of a vortex mode with charge 1 through a fused coupler consisting of a standard single mode fiber and a custom air-core fiber designed to support vortex modes.
Ongoing work
Ongoing work is focused on extension of the high power fiber amplifier model to a fully vectorized model so that it accommodates vortex beam propagation. Similarly on the experimental side, our efforts are focused on scaling the output power levels from the final amplifier stage so that the thermal mode instability effects may be studied in a detailed manner.
DISTRIBUTION A. Approved for public release: distribution unlimited.

Introduction
High power fiber lasers and amplifiers utilizing ytterbium(Yb)-doped fibers have been extensively studied in the past few decades and a phenomenal increase in the peak as well as average power levels have been demonstrated [1, 2]. The primary reasons for such widespread interest are the inherent advantages of a fiber-based medium such as excellent beam quality, relative ease of thermal management as well as small footprint. Owing to the low quantum defect of Yb-doped in silica, the gain medium utilizing the Yb-ion is invariably the choice for applications which require high intensity and high-power sources. However, the power scaling of such fiber lasers are challenged by several factors including fiber nonlinearities, self-pulsing and thermal mode instability. The nonlinearity issue is typically addressed by increasing the mode effective area in large-mode area (LMA) fibers and reducing the length of the active fiber in a master-oscillator power amplifier configuration (MOPA) [3]. Similarly, self-pulsing and pulse distortion due to gain saturation may be avoided by amplifying the signal using multiple stages.
The large-mode area (LMA) double-clad fibers facilitate high-power multimode diode pumping and single-mode (or few-mode) operation, the latter being achieved by reduction in the numerical aperture (NA) of the core [4, 5]. However, the LMA fibers have been reported to exhibit an instability in the transverse modes of the fiber beyond a certain threshold average power, which has been attributed to thermal effects [6, 7]. In some cases, an initially single mode fiber has been said to exhibit guidance of the first higher order mode after a certain threshold of signal power is achieved [8]. From literature, it is known that this instability threshold depends on the average power and not on the peak power of the signal [9] and the instability is caused due to the exchange in power among the transverse modes. One of the recently emerging, viable solutions to the challenge of further amplification is considered to be the principle of beam combining [10]. Specifically, coherent beam combining has been demonstrated as an attractive choice for high-power lasers [11, 12]. However, matching the phase of the individual beams has been an extremely challenging task. Active phasing provides a robust way for in-phase mode coherent beam combining. However, coherent beam combining with active phase control is achieved through complicated algorithimic techniques [11, 12]. We expect that the use of the orbital angular momentum (OAM) modes for coherent beam combining could increase the output power further. In addition, matching the phase between these combining modes, which is essesntial for coherent beam combining, is expected to be relatively simpler as these beams have a specified non-destructive phase structure (in appropriate fibers). The unique properties and one of the all-fiber generation techniques of OAM beams are given below.
Optical beams with helical wavefronts consist of a Poynting vector component in the azimuthal direction which results in orbital angular momentum of ± 𝑙𝑙 ℎ
2𝜋𝜋 per photon in the
direction of beam propagation, 𝑙𝑙 being the intrinsic charge of the OAM beam. The pitch and handedness of the helix determines the intrinsic charge type (positive/negative) of the OAM beam [13]. Such wavefront manipulated beams are known to have wavefront dislocations such as screw dislocation, edge dislocation and mixed screw edge dislocation [14]. A screw dislocation is characterized by helical wavefront with a null in the center of the intensity structure while an edge dislocation is characterized by zero intensity line across the beam (because of phase difference of π along the line). Mixed screw edge dislocation has zero intensity line from the periphery to the center (because of phase difference of π along the line till center) [15, 16]. Some of the ways of generating these beams are by manipulation of
DISTRIBUTION A. Approved for public release: distribution unlimited.

Gouy phase with cylindrical lens [17], diffraction techniques using fork gratings [17] and spiral phase plate (SPP) [18, 19]. SPP is a device consisting of a transparent polymer layer whose thickness is azimuthally varied resulting in an azimuthally varying phase. The transparent polymer layer of SPP should give a phase difference of integral multiples of 2π to generate a screw dislocated OAM beam [19]. SPP with non-integral phase delay results in mixed screw edge dislocated wavefront beams, which are also called fractional OAM beams. OAM generation has been widely studied in free space, silicon chips, and to a limited extent, in fiber. While a few of these devices offer ability to multiplex many OAM modes with low loss, none of them are directly fiber compatible. Hence, alternative all-fiber based techniques which offer the potential for direct integration with existing telecom infrastructures, and yet are mode-scalable are highly desirable. The all-fiber fused coupler for generating OAM beams is expected to be suitable for integrating with coherent beam combining.
The key objectives of this work are:
• Build a comprehensive model to study thermal mode instability (TMI) in high power fiber amplifiers and investigate its mitigation through the use of vortex modes.
• Construct a high power fiber amplifier test-bed at IITM to experimentally validate the above results as well as to study the possible use of vortex modes for amplification.
The work done during the past one year on the above tasks are outlined below. The effect of TMI has been studied through a numerical model along with performance study of parallel programming to ease the computation time. Design and study of an experimental testbed to achieve hundreds of Watts of power is described in this report along with the limiting effects in further scaling. Vortex beams generation using SPP and technique of OAM beam generation using all-fiber fused couplers has been described in the report. Another practical solution to push up the threshold of thermal mode instability is the method of tandem pumping. This has also been briefly addressed in the appendix of this report.
I-A. Simulation of thermal mode instability in high power fiber amplifiers
As mentioned above, one of the key objectives of this project is to simulate the power evolution in high power fiber amplifiers and specifically to study the onset of thermal mode instability in such amplifiers. It is well known that the large mode area fiber designs used to circumvent nonlinear interactions in the amplifier allow the LP11 mode to co-propagate with the fundamental LP01 mode. When Pout>Pth, the output intensity profile has been observed to fluctuate at millisecond timescale. Such degradation is attributed to a refractive index grating caused by spatio-temporal temperature variation through the thermo-optic effect we well as the Kramer-Kronig relation. The algorithm used to capture the above effects is outlined below.
ALGORITHM
1. The refractive index profile n(x,y) and ion concentration profile Nion (x, y) of the Yb-doped large mode area (LMA) fiber is initialized.
2. Input signal power of Pmode1 and P mode2 in the fundamental and higher order modes are chosen.
DISTRIBUTION A. Approved for public release: distribution unlimited.

3. The output of the scalar wave equation e1(x,y) , eR21(x,y) and eR22(x,y) the electric fields (normalized to respective intensity) corresponding to the fundamental mode and first two excited modes respectively are obtained.
4. The steady state rate calculations are done for a dzgain space step. 5. The quantum defect is calculated and is used in the steady state thermal equations as
the heat source. 6. The temperature difference is calculated and used in thermo-optic equation to
calculate the updated refractive index profile dzthermal space steps. 7. Steps 3 to 6 are repeated along the length of the fiber.
The specific computations performed as part of the simulations are outlined below. Although the final objective of our effort is to develop a fell-vectorized model that captures the amplification of the vortex beam in the large mode area fiber, we solve the scalar wave equation initially with the aim of capturing the thermo-optic effects and establish the origin of thermal mode instability.
[∇t2 + n2(x, y)k02 − β2]E(x, y) = 0 (1)
After discretizing, at a given z
E(x+∆x, y)+E(x-∆x, y)+E(x, y+∆y)+E(x, y-∆y)-4E(x, y)(∆x)2 + n(x, y)2k02E(x, y)
= β2E(x, y) (2)
Clearly, the scalar model means that polarization changes due to birefringence are neglected. Minimal refractive index difference between the core and the cladding is assumed (weakly guiding approximation) so as to find analytical solutions for the equation. In such a case, the smaller numerical aperture results in smaller critical angle and thus paraxial approximation is also valid. The second order partial derivative is discretised using FDM and results are stored in a sparse matrix and the eigen solutions are determined. Eigen solutions of this equation gives eR1(x,y) , eR21(x,y), eR22(x,y) and β21and β22 corresponding to fundamental mode and first two excited modes (degenerate) respectively. Steps for iteration 1:
Pmode1 = 9.5 W (3)
Pmode21 = 0.25 W , Pmode22 = 0.25 W (4)
Ip(x, y) =Ppump
Areainner cladd (5)
• Overlap factor for the signal is calculated as
Γsi =∬ |ei(x, y)|2 dx dyrcore−rcore
∬ |ei(x, y)|2α−α dx dy
(6)
DISTRIBUTION A. Approved for public release: distribution unlimited.

After re-normalizing the above equation with respect to the total power,
12Ɛ0c C0 |𝑒𝑒1xi, yj|2 = Pmode1
NY
j=1
NX
i=1
(7)
C0 = Pmode1
12Ɛ0c∑ ∑ |𝑒𝑒1xi, yj|2NY
j=1NXi=1
(8)
Ps1(x, y) = 12Ɛ0c C0 |𝑒𝑒1(x, y)|2 (9)
Thus,
Ps1(x, y) = Pmode1
∑ ∑ 𝑒𝑒1xi, yj2NY
j=1NXi=1
|𝑒𝑒1(x, y)|2 (10)
Similarly,
Ps21(x, y) = Pmode21
∑ ∑ 𝑒𝑒21xi, yj2NY
j=1NXi=1
|𝑒𝑒2(x, y)|2 (11)
Rate Equation Calculations
Substituting pump and signal power, absorption and emission cross sections σ in rate equations result in gain g(x,y,z) and heating due to quantum defect neglecting contribution due to spontaneous emission Q(x,y,z).
• Power profiles are used in Laser rate calculation equations, (17)-(19).
• Intensity profile is calculated from power in each mode Pmode1 (x, y), Pmode21 (x, y) and Pmode22 (x, y)
I𝑠𝑠(x, y) = Pmode1e−iβ1z 𝑒𝑒1(x, y) + Pmode21 e−iβ2z 𝑒𝑒21(x, y)
+ Pmode22 e−iβ2z 𝑒𝑒22(x, y)
2
(12)
• For steady state, ion concentration in excited state,
N2(x, y) = Nion (x, y) ∗Is(x,y)σasτ
h𝑣𝑣𝑠𝑠+Ip(x,y)σapτ
h𝑣𝑣𝑝𝑝
1+Is(x,y)(σes+σas)τ
h𝑣𝑣𝑠𝑠+Ip(x,y)(σep+σap)τ
h𝑣𝑣𝑝𝑝 (13)
Ion concentration in ground state,
N1(x, y)= Nion(x, y) − N2(x, y) (14)
• Gain coefficient for signal g and pump depletion rate gp are computed as,
DISTRIBUTION A. Approved for public release: distribution unlimited.

g(x, y) = σesN2(x, y) − σasN1(x, y) (15)
gp(x, y) = σepN2(x, y) − σapN1(x, y) (16)
Updating power profiles for dz space step,
Ps1(x, y) = Ps1(x, y)1 + dz g(x, y) (17)
Ps21(x, y) = Ps21(x, y)(1 + dz g(x, y)) (18)
Ps22(x, y) = Ps22(x, y)(1 + dz g(x, y)) (19)
Ppump(z) = sum(Ip(x, y)1 + dz gp(x, y) ∗ dA) (20)
Pmode1 = Ps1(x, y)NY
j=1
NX
i=1
(21)
Pmode21 = Ps21(x, y)NY
j=1
(22)NX
i=1
Pmode22 = Ps22(x, y)NY
j=1
(23)NX
i=1
Equations Eq.12 to Eq.23 is repeated (100 times) before next thermal calculation and refractive index updation, for dz = 100 μm.
• Quantum defect Q(x,y) is calculated as,
Q(x, y) = 𝑣𝑣𝑝𝑝vs− 1 g(x, y)Is(x, y) , (24)
which is used as input as heat load to heat equation. Intensity profile obtained from Eq.12 is used in Eq.24 to calculate the quantum heat.
Thermal Calculations The time-dependent heat equation is given by,
∂T(r, φ, z, t)∂t
=KρC∇2T(r, φ, z, t) +
1ρC
Q(r, φ, z, t), (25a)
where K – Thermal conductivity, ρ – Mass density, C – Heat capacity within the fiber.
Assuming steady state,
U(r′) = Ur′+∆r′+Ur′−∆r′
2+ ∆r′
4r′[U(r′ + ∆r′) − U(r′ − ∆r′)] + Ω(r′) ∆r
′2
2 (25b)
DISTRIBUTION A. Approved for public release: distribution unlimited.

Newton’s law of cooling assumed at the cladding boundary,
U(r′) = Ur′−∆r′1+B∆r′ , (26)
where B is the Biots number. ∆T(x, y) = U(r′)Tbkd, (27)
using interpolation. The thermo – optic effect is represented by,
∆Ɛ(x, y) = 2Ɛ(x, y, z) 𝑑𝑑𝑑𝑑𝑑𝑑𝑑𝑑∆T(x, y) (28a)
where 𝑑𝑑𝑑𝑑
𝑑𝑑𝑑𝑑 is the thermo-optic coefficient. The permittivity matrix is updated through the
following relation, 𝑛𝑛2(𝑥𝑥,𝑦𝑦, 𝑧𝑧 + ∆z) = 𝑛𝑛2(𝑥𝑥,𝑦𝑦, 𝑧𝑧) + 2𝑛𝑛(𝑥𝑥,𝑦𝑦, 𝑧𝑧) 𝑑𝑑𝑑𝑑
𝑑𝑑𝑑𝑑 ∆T(x, y, z) (28b)
Although the refractive index changes with thermo-optic effect, dependence on the gain through Kramer-Kronig relation is neglected. Cold condition for initial thermal profile and for outer cladding is assumed. The updated permittivity matrix is used again to calculate the mode profile for the propagation. Furthermore, no material loss or bend loss is included in the model. Lossless and perfectly reflecting boundary conditions as well as uniform doping are assumed.
Steps from iteration 2
• Electric fields are stored as :
e1,pr(x, y) = e1(x, y)and e21,pr(x, y) = e21(x, y) ,e22,pr(x, y) = e22(x, y)
• After thermal calculation, refractive profile is modified, modified electric fields are calculated and renormalization of modal electric fields is repeated:
• Eigen solutions of this equation gives e1(x,y) ,eR21(x,y) and eR22(x,y) andβ21and β22 corresponding to fundamental mode and first two excited modes respectively.
• Overlap integrals:
Γi,j =|∬ ei(x, y) ej,pr(x, y) dxdy| 2
∬ |ei(x, y)|2dxdy∬ |ej,pr(x, y)|2dxdy (29)
• Total power in each mode after rate equation calculation,
P1tot = Ps1(x, y) dxdy (30)
P21tot = Ps21(x, y)dxdy P22tot = Ps22(x, y) dxdy (31)
• From the total power in modified mode in the next iteration, the signal power is calculated as
Pmode1 = Γ1,1 P1tot + Γ1,21 P21tot + Γ1,22 P22tot (32) Pmode2 = Γ2,1 P1tot + Γ2,21 P21tot + Γ2,22 P22tot (33)
• Renormalization is performed as in Eq.(10) and Eq.(11)
DISTRIBUTION A. Approved for public release: distribution unlimited.

Fiber Parameters used in simulations:
Radius of core 37 μm Input signal power 10 W Radius of cladding 85 μm Input pump power 300 W Radius of outer clad 200 μm Length of fiber 1.63 m dzgain, space step 100 μm Excited state lifetime 850 μs Yb2+ Ion conc. 3.5x 1025 m-3
• 5% of input signal power assumed to propagating through higher order modes.
• 384x384 larger grid mapping the fiber cross-section and 95x95 truncated matrix used for mode calculation.
Rate equation calculation and thermal equation calculation are done for z+dz space step using Eq. 12 to Eq. 28. Using the above equations, the intensity at the central grid as well as an offset grid is as shown in the figure below:
Fig. 1 Intensity variation along the length at the central grid (left) and offset location (right)
At central grid the signal variation is observed to be relatively smooth (Fig. 1(left)), whereas the offset grid showed signal variations at the beat length, which is ~ 24 mm (Fig. 1(right)). The heat load in every thermal step along the length of the fiber is shown in Fig. 2 below which shows that the thermal load peaks near about 60 cm length of the fiber from the input.
DISTRIBUTION A. Approved for public release: distribution unlimited.

Fig. 2 The quantum defect computed along the length of the Yb-doped fiber.
The flow chart representing the different steps involved in our simulations is provided below. Note that the highlighted steps below are computed through parallel programming in a GPU cluster, as described in the next section.
DISTRIBUTION A. Approved for public release: distribution unlimited.

I-B. Parallel Programming
Threaded shared memory programming and message passing programming can be considered complimentary programming approaches and can be seen occasionally together in
DISTRIBUTION A. Approved for public release: distribution unlimited.

applications. Parallel programming is a useful approach to program computationally heavy simulations. Accelerated computing use both CPU and GPU (Graphics processing Unit) to run the work. In such programs, CPUs act as the host and call GPU to run heavily loaded part of the code. CPUs are optimized for latency and GPUs are throughput optimized. GPUs can be used best for parallel computing of independent and countable steps. Performance of the program can be increased using accelerate libraries, further by high level parallel programming directives like OpenACC or by low level, less portable languages like CUDA or combinations of them. The steps of parallelization include identifying and expressing parallelism, expressing data movements and optimizing loop performance are shown in the flow chart below. PyOpenCL is used for the implementation of the algorithm for thermal mode instability using GPU for improved performance.
The table shows improvement in computing time for different sets of rate calculation iterated on GPU. Transferring of variables from CPU to GPU will have an overhead, but operations in GPU are much faster as operations are done in parallel using threads. So with increase in number of iterations gives better performance. The table is for rate calculations for a 95 x 95 matrices for powers and intensities of signal and pump using (95, 95) threads for dz = 100 μm space steps. The duration for CPU and GPU computation for 10, 100, 1000 and 10000 iterations and performance improvement using GPU is tabulated.
II.A. Experimental investigation of TMI in high power fiber amplifiers
0
10
20
30
40
50
60
1 10 100 1000 10000
Perf
orm
ance
No.of iterations
Performance Improvement using GPUNo. of rate calculations
Time on CPU (sec)
Time on GPU (sec)
Improvement
10 0.0096 0.00337 2.84x
100 0.0946 0.0036 26.27x
1000 0.947 0.0183 51.74x
10000 9.352 0.183 51.1x
DISTRIBUTION A. Approved for public release: distribution unlimited.

The experimental design to study TMI as mention in (a) is that of a multi-stage MOPA with a high average power to achieve power levels at which the thermal mode instability threshold have been reported before. Upon completion of the experimental design, the effect of TMI will be studied in future by modulating the seed laser radiation with different duty cycles, thereby varying the thermal load in the final amplifier. An acousto-optic modulator (AOM) can be used to externally modulate the seed for this purpose which gives more stable output and freedom for a larger range of pulse-widths and repetition rates as compared to direct modulation of the seed. The design of the high power amplifier is presented which includes four amplification stages where the parameters at each stage is optimised using RP-Fiber Power software such that the output of the final stage is >500W. Based on this design, the experimental results are also presented here and these results are compared with that expected from the design.
1. RP Simulation design for 500W MOPA
The multi-stage MOPA design constitutes of a seed source followed by four amplification stages as shown in Fig. 3. An acousto-optic modulator after the seed source is for facilitating external modulation which can thus vary the heat load. The operation of the MOPA in continuous-wave mode as well as pulsed mode has been studied. The simulations have been done so as to obtain sufficient gain at each stage, with the target of achieving an average power >500 W at the final stage output.
Fig. 3. Multi-stage amplifier design; FA: Fiber amplifier, AOM: acousto-optic modulator, CPS: cladding-pump stripper
FA1 stage:The input signal power of 35 mW and pump power of 250 mW (at 976 nm) are used to optimise the FA1 stage active fiber length (6/125 µm Yb-doped single-clad fiber). For 1.5 m length of the active fiber, the ASE at 1030 nm is suppressed and the output signal power is estimated to be 218 mW at the output of the doped-fiber. The variation of the pump, signal, forward and backward ASE powers are as shown in Fig. 4(a). The gain expected at this stage is 7.9 dB.
DISTRIBUTION A. Approved for public release: distribution unlimited.

Fig. 4. Simulation results for pump, signal, forward ASE and backward ASE power as a function of active length for (a) FA1 (ii) FA2 (iii) FA3 and (iv) FA4 amplification stage FA2 stage:The insertion loss of the components (such as the combiners, isolators and cladding pump strippers) are incorporated from the specification sheets of the components to be used in the experiments in the calculation of input pump/signal powers at every stage. After incorporating the insertion loss of isolator and the combiner at the signal wavelength, the input power at 10/130 µm Yb-doped double-clad fiber (DCF) is estimated to be 116 mW. A laser diode operating at 915 nm is used for pumping the doped fiber in this stage. For a pump power of 6W, the active fiber length for the optimum output was 5 m from the simulation. The pump, signal and ASE power variations are shown in Fig. 4(b) variation with length. For this length, the output signal power obtained from simulation is 3.42 W and the gain is 14.7 dB.
FA3 stage:The signal power input to the active fiber at this stage (15/130µm LMA Yb-doped DCF) is estimated to be ~ 2.08 W after accounting for the insertion losses of the components in between. The total pump power that can be launched is about 80W, targeting ~ 15dB gain from this stage. For an optimum length of 3.3m, at the maximum pump power, the output signal power obtained from the simulation is ~ 72 W . The power variations are shown in Fig. 4(c).
FA4 stage: The signal input to the active fiber at this stage (25/250µm LMA Yb-doped DCF) is estimated to be ~ 30 W incorporating the insertion losses. The active fiber at this stage is a LMA few-mode fiber which is chosen to lower the threshold of TMI in the experiments, thus facilitating its study. The total pump power to be launched at this stage is about 680 W. For an active fiber length of 4 m, the output signal power obtained from the simulation is ~ 640 W with a gain of about 13.3 dB. The power variations are shown in Fig. 4(d).
These simulations provided the estimate of lengths and pump powers necessary at each stage. The experiments have then been carried out with parameters close to these estimates.
DISTRIBUTION A. Approved for public release: distribution unlimited.

2. Experimental results for 500 W MOPA
The results from the experiments carried out till now have been presented here and compared with simulation results from RP-fiber power with the same input parameters as obtained experimentally at each stage. A total pump power of 256 mW at 976 nm is available at the FA1 stage. The signal power fed into the 1.5 m FA1 active fiber (single-clad, absorption at 976 nm: 250 dB/m) is ~ 36 mW. The variation of the output signal power with the pump power is as shown in Fig. 5(a).
Fig. 5 Experimental results for output signal power variation with pump for (a) FA1 (ii) FA2 and (iii) FA3 stage
The maximum signal output obtained at this stage is 184 mW which is less than that expected from simulation as shown in the same figure. Thus, a gain of 7.04 dB is obtained from the first amplification stage. From the design plan, the gain expected from this stage was 7.90 dB. An isolator is spliced at the output of this stage.The available signal power at the input of the 5 m length of FA2 active fiber (double-clad, pump absorption at 915 nm: 1.1 dB/m) is ~ 90 mW. The laser diode (915 nm) is used to launch pump power of 6.9W into the inner cladding of the Yd-doped DCF. The output signal power with increasing pump power is as shown in Fig. 3(b) with a maximum signal output power of 3.22 W. A gain of 15.5 dB is obtained from this stage. The available pump power was more than that considered in the design plan and thus the gain obtained from this stage is also higher. With the matched input parameters at this stage, the simulation result is also observed to be close to the experimental values as shown in 5(b). The input signal power to FA3 was about 2.28 W and for a pump power of 31W at 975 nm and active fiber length 3.3 m, signal power of 26W could be achieved at the output. Up to these pump power values, the output has not deviated considerably from the design plan as seen in Fig. 5(c). Experiments for further scaling the signal in this stage are ongoing but require more caution due to effects like self-pulsing [20, 21] as well as possible thermal issues.
Beyond the pump power of 31 W, the effects of self-pulsing have been observed primarily in the backward direction of the FA3 stage. This phenomenon was also observed at the FA2 stage, but the threshold was close to the the maximum available pump power for that stage and thus the power was fixed lower than the threshold in this case. As the pump power of the FA3 stage is increased, after a threshold power the time-domain of the backward propagating power (monitored at the output tap of the isolator before the FA3 stage) show the occurence of intermittent pulses. Some instances of the time domain traces are as shown in Fig. 6 for a fixed pump current of 3.5A. The frequency of these intermittent pulses are observed to lie in the range 200kHz – a few tens of MHz. The output power in the forward direction does indicate these fluctuations as observed in the backward direction, at least up to the values of input pump powers we studied. Due to the risk that might be involved in the amplification of
DISTRIBUTION A. Approved for public release: distribution unlimited.
these pulses, the current was not increased to much higher values than the threshold, as the amplitude of fluctuations increase with further increase of pump power.
Fig. 6. Multiple instances captured at a fixed pump current of 3.5A showing intermittent pulsing;
Captures with time scale (a)500 ns/div, (b)500 ns/div and 1µs/div
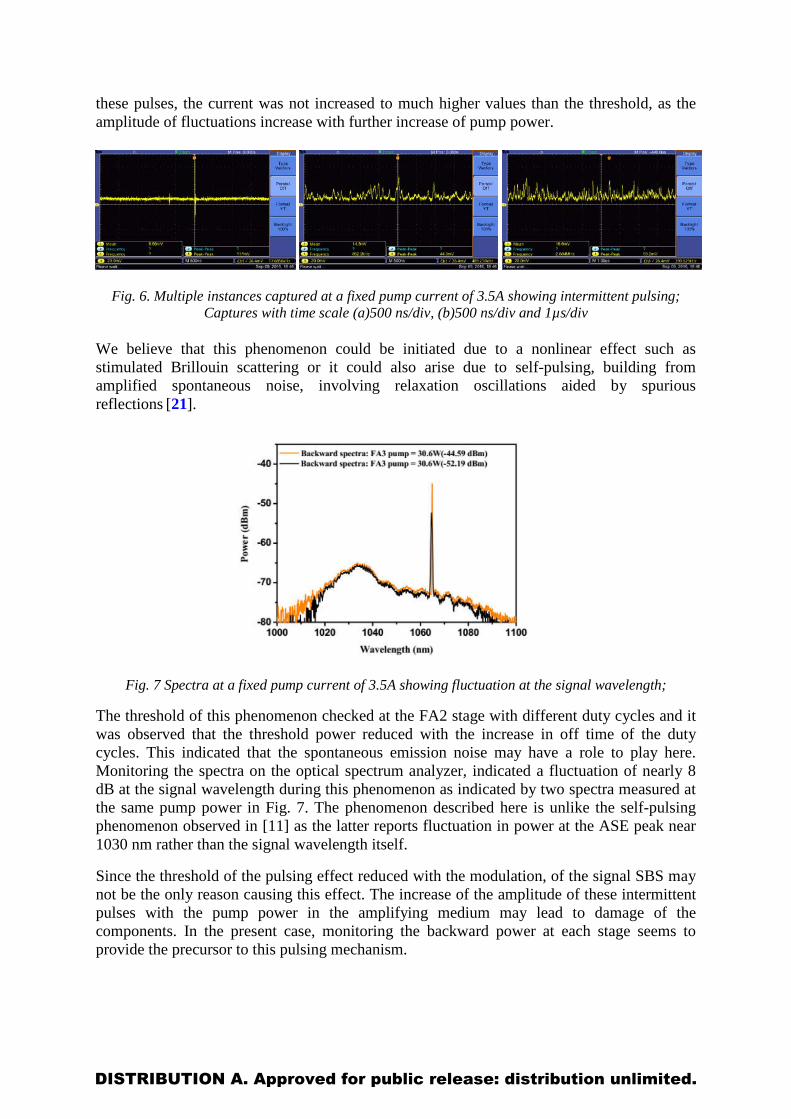
We believe that this phenomenon could be initiated due to a nonlinear effect such as stimulated Brillouin scattering or it could also arise due to self-pulsing, building from amplified spontaneous noise, involving relaxation oscillations aided by spurious reflections [21].
Fig. 7 Spectra at a fixed pump current of 3.5A showing fluctuation at the signal wavelength;
The threshold of this phenomenon checked at the FA2 stage with different duty cycles and it was observed that the threshold power reduced with the increase in off time of the duty cycles. This indicated that the spontaneous emission noise may have a role to play here. Monitoring the spectra on the optical spectrum analyzer, indicated a fluctuation of nearly 8 dB at the signal wavelength during this phenomenon as indicated by two spectra measured at the same pump power in Fig. 7. The phenomenon described here is unlike the self-pulsing phenomenon observed in [11] as the latter reports fluctuation in power at the ASE peak near 1030 nm rather than the signal wavelength itself.
Since the threshold of the pulsing effect reduced with the modulation, of the signal SBS may not be the only reason causing this effect. The increase of the amplitude of these intermittent pulses with the pump power in the amplifying medium may lead to damage of the components. In the present case, monitoring the backward power at each stage seems to provide the precursor to this pulsing mechanism.
DISTRIBUTION A. Approved for public release: distribution unlimited.

Pulsed mode The acousto-optic modulator (AOM) after the seed laser is used for the external modulation of the signal. As the mode instability is primarily attributed to the thermal effects, this modulation has been done for keeping a provision for variation of heat load for the final amplifier stage. Since the previous studies indicate that the instability threshold depends on the average power of the system rather than peak power, the modulation for the present study has been done at a high repetition rate and as well as longer on time of the pulses. The pulse width at the input is decided such that along with the above conditions, the pulse distortion can be minimum during the multi-stage amplification. The lower limit of the pulse width is decided by the AOM characteristics (rise and fall time) whereas the upper limit is within the range to ensure the pulse is not distorted significantly by the gain saturation at the power amplification stages. With the above considerations the repetition rate was kept fixed at 10 MHz and the duty cycles studied are 80%, 60% and 40%, corresponding to 80 ns, 60 ns and 40 ns pulses.
For the lengths and input pump powers meantioned for each stage in the CW mode, the simulations are repeated for the pulsed mode considering a super-Gaussian pulse. As we have tap ports up to the FA2 stage to monitor the time domain, the powers measured up to this stage are compared in the table below with that obtained from RP Fiber Power. (The values from the simulation are indicated in blue.)
Table I Power
measured/ estimated at
Duty cycle: 80% Duty cycle: 60% Duty cycle: 40% Ppeak (W)
Pavg (W)
Gain (dB)
Ppeak (W)
Pavg (W)
Gain (dB)
Ppeak (W)
Pavg (W)
Gain (dB)
Input to FA1
0.036
0.029
-- 0.036
0.022
-- 0.036
0.014
--
Output of FA1
0.250 0.257
0.200 0.207
8.4 8.5
0.302 0.319
0.181 0.195
9.2 9.7
0.430 0.460
0.172 0.179
10.8 11.1
Input to FA2
0.110
0.089
--
0.136
0.083
--
0.180
0.073
--
Output of FA2
3.84 4.77
3.08 3.86
15.4 16.4
5.18 6.31
3.11 3.85
15.7 16.7
7.70 9.45
3.08 3.83
16.2 17.2
After FA2
2.50
2.00
---
3.37
2.02
--
5.00
2.00
---
As the input to the preamplifier stage (FA1) is after external modulation of the seed laser, the peak powers are equal at this point for all the three duty cycles. The powers obtained experimentally after pulse amplification in the FA1 stage, which uses a single clad Yb-doped fiber, shows good agreement with the simulation results. As expected, the the lower duty cycles experience more gain due to stored energy in the inverted population during the off-time of the pulse. After the FA2 stage, the average powers in the case of all the three duty cylces is found to be nearly the same. The power was measured at the output of the isolator and the power at the output of FA2 was estimated using the insertion loss of the isolator.
DISTRIBUTION A. Approved for public release: distribution unlimited.

Fig. 8 Pulsed outputs after AOM (a, b, c) , after FA1 (d, e, f) and after the FA2 output isolator(g, h, i) for the three duty cycles of (i) 80%, (ii) 60% and 40% respectively
This experimental value is compared with that obtained from the simulations and the gain in the case of each duty cycle is observed to be a dB less than that expected using the simulation. This discrepancy may be due to the differences in insertion loss, cladding absorption and/or splice loss considered for the estimations. Some typical pulsed outputs after AOM, after FA1 and after the FA2 output isolator are shown in Fig. 8. The maintenance of the pulse shape up to the FA2 stage are evident from these plots.
II-B. Investigation of Vortex Beam Generation We have investigated the generation of vortex beams through a couple of different mechanisms viz. (1) Spiral Phase Plate (SPP), and (2) All-fiber fused couplers. The details of such investigation is presented below.
Spiral phase plate-based excitation of OAM beam: A laser beam from He-Ne (λ=632.8nm and coherence length ~0.5m) is passed through a commercial SPP (RPC Photonics-model VPP-1c), which is designed to generate OAM beams with intrinsic charge +1 at various wavelengths slots as shown in the table 1.We first obtained the phase step (orders of 2π) of SPP for each slot at 632.8 nm by following the below mentioned procedure. Phase step refers to the maximum phase delay that each slot of SPP can produce. The maximum thickness (t) of the each polymer device/slot on SPP is calculated using the formula 𝜆𝜆
𝑑𝑑𝜆𝜆−1, where λ is specified slot wavelength and 𝑛𝑛𝜆𝜆 denotes
refractive index of the polymer at that particular wavelength. The phase stepfor each slot at 632.8nm is calculated using the formula(𝑑𝑑632.8𝑛𝑛𝑛𝑛−1)
632.8∗10−9𝑡𝑡.Refractive index of polymer at ~25oC is
DISTRIBUTION A. Approved for public release: distribution unlimited.

equal to 1.5375 +8290.45𝜆𝜆2
- 2.11046𝜆𝜆4
. Phase step of SPP is equivalent to intrinsic charge of OAM beam and the charge corresponding to each slot is shown in Table 1. Table 1: SPP designed for generating charge +1 OAM beams at various wavelengths (left) and charge map at only 632.8nm wavelength (right).
1515 1471 1504 1515 1471 1455
2.46 2.39 2.44 2.46 2.39 2.36
1531 980 854 606 1520 1466
2.49 1.57 1.37 0.95 2.47 2.38
1563 490 395 388 474 1542
2.54 0.75 0.59 0.58 0.73 2.5
1542 534 455 411 607 1536
2.5 0.83 0.69 0.62 0.95 2.49
1520 1081 779 7221 885 1515
2.47 1.74 1.24 1.14 1.42 2.46
1509 1477 1498 1515 1520 1525
2.45 2.4 2.43 2.46 2.47 2.48
The experimental setup for characterizing the fractional OAM beams (0.58 to 2.5) is shown in the Fig. 9. Here, we used Mach Zender interferometer technique to study the dislocation behaviour of generated fractional OAM beams. The reference beam (arm 1) is aligned at an elevation angle with respect to OAM beam in the arm 2 thereby giving an interference fringe pattern. Intensity and interference pattern for each charge is captured in a CCD camera by passing input beam through different slots of SPP. To avoid saturation of CCD, a neutral density filter is used to control the intensity of beam from the laser source.
Figure 9. Experimental setup to characterize vortex phase plate (a): NDF-neutral density filter, BS-beam splitter, M- mirror, SPP- spiral phase plate, CCD – charge coupled device. Far field intensity patterns of OAM beams of charge 0.58; (b) and 0.95; (c).
The far field intensity patterns for OAM beams of charge 0.58 and 0.95 are shown in the Fig 9 (b) and (c). As discussed above, it can be seen in Fig. 9(b) that OAM beam of charge 0.58 characterized by the mixed screw and edge dislocated wavefront has a zero intensity line in vertical direction from the center. The curved fringes on top portion of interference pattern Fig. 10(a) and discontinued fringes at the bottom indicates the presence of screw dislocation and edge dislocation, respectively, in the same beam. The experimentally obtained fringe
(b) (c) (a)
DISTRIBUTION A. Approved for public release: distribution unlimited.

pattern is verified through simulations (Fig. 10(b)) by beating the beam obtained from phase plate with a vertically tilted plane wave beam. OAM beam of charge 0.95 which gives a donut intensity pattern (Fig 9 (c)) has a screw dislocation that is evident from curved fringes formed on top and bottom portions of the interferogram as shown in Fig. 10(c).
(a) (b) (c) (d)
Figure 10. Experimental and simulated interferograms of OAM beams for charges 0.58; 2 (a&b) and 0.95; 2(c&d)
OAM beam of charges1.57 and 2.5 also possess mixed screw edge dislocated wavefrontswith null regions distributed in the far field intensity patterns as shown in Fig 11. The mathematical treatment for free space evolution of mixed screw-edge dislocation beams reveals that these beams split into single charge optical vortices in the far field, which concludes that fractional charges are not stable on propagation [15]. Interferograms of these charges show the presence of two and three distributed screw dislocations for the two cases respectively.
(a) (b) (c) (d)
Figure 11. Far field intensity and interferograms patterns for OAM beams of charge 1.57;9(a&b) and 2.5;9(c&d). The fork patterns have been encircled.
To understand the optical properties of dislocated wavefront beams further we performed modal analysis to represent each of the output beam from SPP as a sum of eigen modes [19]. In general LG beams and Hermite Gaussian (HG) forms the basic eigen mode set for OAM beams. Here we have chosen LG beams and the field amplitude of LG in cylindrical co-ordinate system (𝜌𝜌,∅, 𝑧𝑧)is represented by
𝑒𝑒(𝜌𝜌,∅, 𝑧𝑧)𝑑𝑑,𝑚𝑚𝐿𝐿𝐿𝐿 = 𝐶𝐶𝑑𝑑,𝑚𝑚
𝐿𝐿𝐿𝐿 1𝑤𝑤
exp−𝜌𝜌2
𝑤𝑤2√2𝜌𝜌𝑤𝑤
|𝑑𝑑−𝑚𝑚|
𝐿𝐿𝐿𝐿min(𝑑𝑑,𝑚𝑚)|𝑑𝑑−𝑚𝑚|
2𝜌𝜌2
𝑤𝑤2
× exp(−𝑖𝑖(𝑛𝑛 −𝑚𝑚)∅) exp − 𝑖𝑖𝑖𝑖𝜌𝜌2
2𝑅𝑅 exp(−𝑖𝑖(𝑛𝑛 + 𝑚𝑚 + 1)𝜑𝜑) (−1)min (𝑑𝑑,𝑚𝑚) (34)
DISTRIBUTION A. Approved for public release: distribution unlimited.

𝐶𝐶𝑑𝑑,𝑚𝑚𝐿𝐿𝐿𝐿 = 2
𝜋𝜋𝑑𝑑!𝑚𝑚!12 min(𝑛𝑛,𝑚𝑚) ! is a normalization constant, 𝑧𝑧𝑅𝑅 is Rayleigh range, 𝜑𝜑(𝑧𝑧) =
𝑡𝑡𝑡𝑡𝑛𝑛−1(𝑧𝑧/𝑧𝑧𝑅𝑅) represents Gouy phase, 12𝑘𝑘𝑤𝑤(𝑧𝑧)2 = (𝑧𝑧𝑅𝑅2 + 𝑧𝑧2) 𝑧𝑧𝑅𝑅⁄ gives beam waist, 𝑅𝑅(𝑧𝑧) =
(𝑧𝑧𝑅𝑅2 + 𝑧𝑧2) 𝑧𝑧⁄ gives wavefront radius, 𝐿𝐿𝐿𝐿min(𝑑𝑑,𝑚𝑚)|𝑑𝑑−𝑚𝑚| (2𝜌𝜌2 𝑤𝑤2⁄ ) is generalized Laguerre
polynomial and 𝑘𝑘 = 2𝜋𝜋 𝜆𝜆⁄ is phase constant.In the magnitude part of the equation 1 the factor
√2𝜌𝜌𝑤𝑤
|𝑑𝑑−𝑚𝑚| decides the radius of null region for an OAM beam. 𝐿𝐿𝐿𝐿min (𝑑𝑑,𝑚𝑚)
|𝑑𝑑−𝑚𝑚| 2𝜌𝜌2
𝑤𝑤2 determines the beam structure. In the phase part, the term exp(−𝑖𝑖(𝑛𝑛 −𝑚𝑚)∅) denotes the azimuthal phase variation and (n-m) denotes the charge of the LG beam.
For a beam 𝑒(𝜌𝜌,∅, 𝑧𝑧) incident on a slot of SPP, the output 𝑒′ directly after the plate can be written as𝑒′ = 𝑒 𝑒𝑒𝑥𝑥𝑒𝑒(−𝑖𝑖ℎ∅),where h denotes the phase step of the slot. Here the operation affects only phase of the incoming beam, which is true for a paraxial regime. Since the input beam is collimated this approximation holds good. The mode decomposition of a mode 𝑒𝑑𝑑,𝑚𝑚
𝐿𝐿𝐿𝐿 whose phase structure is modified by a phase platewithphase step h is described by mode weights
𝑡𝑡𝑑𝑑𝑚𝑚,𝑠𝑠𝑠𝑠 = ∬𝑒𝑑𝑑,𝑚𝑚𝐿𝐿𝐿𝐿 𝑒𝑒𝑥𝑥𝑒𝑒(−𝑖𝑖ℎ∅)𝑒𝑠𝑠,𝑠𝑠
∗𝐿𝐿𝐿𝐿 𝑑𝑑𝑑𝑑𝑑𝑑∅. (35)
Equation 35 essentially finds the field overlap between the output of SPP and the reference LG beam over the beam cross section. Intensity weights of each mode is calculated using𝐼𝐼𝑑𝑑𝑚𝑚,𝑠𝑠𝑠𝑠 = 𝑡𝑡𝑑𝑑𝑚𝑚,𝑠𝑠𝑠𝑠
2. The input parameters for the simulations are 𝜆𝜆 = 632.8 𝑛𝑛𝑚𝑚, beam
waist𝑤𝑤0 = 1𝑚𝑚𝑚𝑚, Rayleigh range = 1e+16. To differentiate the intrinsic charge generated by SPP from theintrinsic charges obtained from modal decomposition, we consideredphase step instead of intrinsic charge.
Table 2: OAM of fractional charges 0.58 (left), 0.95(middle) and 1.57 (right) are decomposed into LG modes.
(s,t) 0 1 2 3 (s,t) 0 1 2 3 (s,t) 0 1 2 3
0 27.5 2.92 0.7 0.21 0 0.27 0.05 0.01 0 0 3.9 1.14 0.37 0.13
1 42.9 0 0.36 0.23 1 77.9 0 0.01 0 1 23.3 0 0.13 0.13
2 2.35 5.29 0 0.13 2 0.11 9.73 0 0 2 26.1 2.9 0 0.05
3 0.47 0.78 2.01 0 3 0.01 0.04 3.65 0 3 1.4 8.7 1.1 0
4 0.13 0.26 0.39 1.04 4 0 0 0 1.92 4 0.27 0.78 4.3 0.57
5 - - - - 5 - - - - 5 - - - 2.6
Modal decomposition for OAM beam generated from SPP for phase steps 0.58 and 0.95 are shown in table 2. In the table, (s-t) denotes the charge of the LG beam. For phase step 0.58, 52% of total power is associated with charge +1 of which 43% is associated to 𝑒𝑒1,0
𝐿𝐿𝐿𝐿 mode with donut intensity pattern and the remaining 9% to thehigher order modes 𝑒𝑒2,1
𝐿𝐿𝐿𝐿, 𝑒𝑒3,2𝐿𝐿𝐿𝐿, 𝑒𝑒4,3
𝐿𝐿𝐿𝐿 which have increasing number of rings in their intensity patterns. Similarly for phase step 0.95, 93% of the total power is associated to charge +1 and 78% to the donut mode. Even though the phase step approaches to unity, the total power of input Gaussian mode is not
DISTRIBUTION A. Approved for public release: distribution unlimited.

converted to donut mode because the SPP changes only the phase structure. In order to get a pure donut mode, intensity structure also needs to be modified.
The power decomposition to a particular charge (s-t) is maximum if it satisfies the phase matching conditioni.e. 𝑠𝑠 − 𝑡𝑡 = 𝑛𝑛 −𝑚𝑚 + ℎ . For phase step of 1.57 most of the power is decomposed to charges +1 and +2 since the phase step lies in between +1 and +2. In general fractional charge beams (non-integral phase steps) can be decomposed to infinite LG modes and in all the three cases higher order zero helicity modes are forbidden by symmetry.
(a) (b) (c)
Figure 12. Intensity patterns of simulated OAM beams for charges0.58;10(a),0.95; 10(b) and 1.57; 10(c).
Intensity patterns for phase steps 0.58, 0.95, 1.57 in Fig. 12 are obtained by combining the decomposed modes. Here we combined modes of significant weights, which are highlighted in Table 2 which amounts to 84%, 93% and 76% of total power for phase steps 0.58, 0.95 and 1.57 respectively. The resulting intensity patterns are found to be similar to their far field intensity patterns.
Fused fiber coupler-based excitation of OAM beam: In general, modes in the air-core fibers propagate with different effective indices (neff) than LP01 in SMF, due to the different fiber refractive index profiles. The neff or propagation constants of the selected modes must be matched in order to achieve coupling from LP01 in SMF to any HOM in the air-core fiber. As HOMs are associated with lower neff, the diameter of the SMF is reduced, by pre-tapering, to phase match LP01 with that of a selected HOM in the air-core fiber.
Figure 13: Simulation results: (a): Index profile of OAM air-core fiber, (b): Effective index (neff) of different modes in SMF (LP01) and air-core fiber (TM01, OAM |l|=1, TE01) fiber as a function of radius of fiber; phase matching points are indicated.
DISTRIBUTION A. Approved for public release: distribution unlimited.

Fig 13. (b), shows neff for the LP01 mode in SMF and the OAM |l|=1 mode in the air-core fiber are mapped as a function of fiber radius in order to calculate fiber diameter ratio to achieve phase matching. When phase matching is achieved, the superposition of excited OAM |l|=1 modes is tuned by controlling input polarization, with each circular polarization exciting one specific OAM mode in its 2-mode degenerate subspace. Experimental details, results and discussion Conventional telecom-grade SMF is pre-tapered to ~75.8µm (with less than 0.1dB loss) according to the diameter ratio calculated from simulation studies (Fig. 11. (b)). The pre-tapered SMF is longitudinally aligned with the un-tapered air-core fiber without any twist, and fixed with a UV-curable adhesive glue. The coupler is fabricated by fusing both the fibers at ~1400ºC using a ceramic micro heater (NTT-AT, Japan) and by pulling them using a commercial fiber tapering rig. After a certain length of pulling, the fibers weakly fuse and the LP01 mode in the SMF couples into the OAM mode of the air-core fiber to which it is phase matched.
Figure 14: (a): Experimental setup to characterize the generated OAM beam-solid lines are propagation path of light through fiber, dashed lines are that of light through free space, L-collimating lens, BS-free space beam splitter. (b): Far field image of the generated OAM beam. (c) & (d): Fork and spiral interference patterns of OAM beam and Gaussian reference, respectively.
Fig. 14(a) depicts the schematic for device characterization: light from a 1550-nm laser source is split into two arms using a 3dB coupler. The interference setup is constructed with fabricated coupler in one of the arms as shown in Fig. 14(a). The field patterns are imaged using a CCD camera. The absence of LP11 mode like patterns and an uniform azimuthal intensity distribution (Fig. 14(b)), qualitatively suggests that phase matched coupling to the OAM modes was achieved without substantial coupling to the neighboring HE11, TE01 or TM01 modes. A polarization measurement performed using a polarizer and quarter wave plate combination reveals that this beam is uniformly circularly polarized, further suggesting that these beams are OAM eigenmodes of the air-core fiber. With the reference arm un-blocked but incident on the camera at a slight angle with respect to the beam from the air-core fiber, the input polarization is adjusted until the characteristic fork interference pattern is observed (Fig. 14(c)). With the beam from the reference arm co-aligned with that from the air-core fiber, we observe the characteristic spiral interference between an OAM and an expanded Gaussian beam (Fig. 14(d)). These observations are consistent with the fact that the beam exiting the air-core fiber is substantially a pure OAM mode. The demonstrated coupleris expected to be useful for coherent beam combining with OAM beams.
DISTRIBUTION A. Approved for public release: distribution unlimited.

Appendix - Tandem Pumping
As discussed earlier, the main reason seen behind mode instability at higher power levels in the LMA fiber is due to thermal effects. As shown in Fig. 1b, the thermal load in fiber can reduce if we can reduce the quantum defect (QD), which is defined as energy difference between the pump and the signal photon that is converted into heat [25]. In tandem pumping, the pumping is done at wavelength close to signal wavelength using fiber laser or amplifier as opposed to conventional diode pumping technique. Fiber lasers can provide nearly a single mode pumping source which can be used in single clad fiber amplifier. Use of a single clad fiber in an amplifier can provide better pump overlap factor which can further reduce the quantum defect. A 10 kW fiber laser has been demonstrated by IPG photonics using tandem pumping scheme scheme as opposed to conventional multimode diode pumping scheme. Moreover, better overlap factor provided by tandem pumping approach reduces the gain in the outer region of the core and hence can reduce the chances of higher order modes getting amplified as a result of higher gain available in the outer core region [25].
One of the key parameter in tandem pumping is to choose the optimum pumping wavelength for particular signal wavelength based on optimum gain. The absorption and emission cross-section of a typical Yb-doped fiber provides a wide range of pumping wavelengths Yb-doped fiber can provide. Based on simulations Codemard et. al . [26] have shown various optimum pumping wavelength which can provide maximum gain for various signal wavelengths. One of the key objective of our work is to validate this characteristics by experiments. Therefore we plan to tune the wavelength of pump and signal over a wide range of wavelengths by using two separate tunable ring lasers as shown in Figure 6a. As shown in [26] the maximum gain for wavelength around 1060 nm can be obtained by pumping at around 1030 nm. In our initial experiments when we trying to build a 200 W tandem pump fiber laser setup we fix out signal at 1060 nm and pumping wavelength as 1030 nm.
As shown in Figure 6a our tandem pumping setup consists of a two tunable fiber ring laser initially set at 1030 nm and 1060 nm at input. The idea is to obtain maximum power for 1030 nm (tandem pump wavelength) by passing it through two amplifier stages FA1 and FA2 while obtaining very good extinction (~10-15 dB) between 1030 nm and 1060 nm. Then by splicing an additional length of DCF at the output of FA2 amplification is achieved at 1060 nm, where 1030 nm is used as tandem pump.
Yb-doped DCF with core/clad diameter of 10/130 μm is used in ring laser setup which is pumped using a 975 nm multimode pump laser diode. A tunable bandpass filter was present in the ring lasers to set the lasing wavelength. Signal from both ring lasers were combined using a WDM. The output from the ring lasers were limited here by the power handling capability of WDM. The combined signal of 200 mW and 10 mW at 1030 nm and 1064 nm is amplified further using Fiber Amplifier 1 (FA1). The achieved output power at the output of FA1 is ~2W at 1030 nm and ~0.5W at 1064 nm. It can be noted that the gain achieved at longer wavelength is much larger than the gain at 1030 nm. The aim of using FA1 and FA2 is to acheive a maximum gain for 1030 nm while providing a better extinction with 1064 nm at the output, as 1030 nm is to be used as pump in the tandem pumping section of the setup. The FA2 setup consist of about 4 m of DCF-25/250 um. The output power of FA2 was limited by burning of the splice joint between pump combiner and Yb-DCF (due to heat generated by pump loss at the splice point ) and fiber fuse occurrence (possible due to peaking of inversion near input end) in the Yb-DCF. The maximum achievable power from the setup is about 120
DISTRIBUTION A. Approved for public release: distribution unlimited.

W as plotted in Figure 6b. The extinction obtained between 1030 nm and 1060nm at output of FA2 at this power levels is about 12 dB.
To perform tandem pumping experiments the idea is to further splice an additional length of same YB-DCF at the output of FA4. The experiments for this is yet to be performed. However we suspect there are many challenges to overcome as a result of splicing of this additional length for tandem pumping such as self pulsing. The self pulsing can result in the setup as a result of longer Yb DCF at the output of FA4. The self pulsing can easily occur if proper length is not chosen in tandem pumped section based on signal and pump wavelength,
as there is no isolation between FA2 and tandem pump section. Isolators at such high power levels are not available to the best of our knowledge.
DISTRIBUTION A. Approved for public release: distribution unlimited.

References
1. C. Jauregui, J. Limpert, and A. Tünnermann, Nature Photon. 7, 861 (2013) 2. D. J. Richardson, J. Nilsson, and W. A. Clarkson, J. Opt. Soc. Am. B 27, B63 (2010) 3. Y. Jeong, J. Nilsson, J. K. Sahu, D. N. Payne, R. Horley, L. M. B. Hickey, and P. W. Turner,
IEEE Sel. Top. Quantum Electron. 13, 546 (2007) 4. M. N. Zervas and C. A. Codemard, IEEE Sel. Top. Quantum Electron. 20, 219 (2014) 5. N. G. R. Broderick, H. L. Offerhaus, D. J. Richardson, R. A. Sammut, J. Caplen, and L.
Dong, Opt. Fiber Technol. 5, 185 (1999) 6. A. V. Smith and J. J. Smith, Opt. Express 19, 10180 (2011) 7. B. G. Ward, Opt. Express 21, 12053 (2013) 8. S. Hädrich, T. Schreiber, T. Pertsch, J. Limpert, T. Peschel, R. Eberhardt, and A.
Tünnermann, Opt. Express 14, 6091 (2006) 9. B. Ward, C. Robin, and I. Dajani, Opt. Express 20, 11407 (2012) 10. J. Hecht, "Photonic Frontiers: beam combining - Combining beams can boost total
power," Laser Focus World, 44, 7 (July 2008) 11. X. Wang, P. Zhou, H. Zhao, Y. Ma, X. Xu and Y. Zhao, “Coherent beam combining of high-
order-mode fiber lasers with active phase control,” J. Opt. 13, (2010) 12. V. Eckhouse, M. Fridman, N. Davidson, and A.A. Friesem, “Phase locking and coherent
combining of high-order-mode fiber lasers,” Opt. Lett. 33, 2134 (2008) 13. Padgett, M.J.,“The Poynting vector in Laguerre-Gaussian laser modes” Optics
Communications 121, 1995. 14. Nye, J.F., “Dislocations in wave trains” Proceedings of Royal society of London A.336, 1974. 15. Vasnetsov, M.V., “Free space evolution of monochromatic mixed screw –edge wavefront
dislocations” SPIE Vol 3847. 16. Basistiy, I.V., “Optics of light beams with screw dislocations” Optics Communications 1993. 17. Oemrasingh,S. S. R., “Intrinsic orbital angular momentum of paraxial beams with off-axis
imprinted vortices” Journal of Optics, Vol 21, 2004 18. Oemrasingh, S. S. R., “Production and characterization of spiral phase plates for optical
wavelengths” APPLIES OPTICS / Vol. 43, No. 3 / 20 January 2004 19. Beijersbergen, M.W., “Helical-wavefront beams produced with spiral phase plate” Optics
Communications 112, 1994. 20. J. M. Sousa, J. Nilsson, C. C. Renaud, J. A. Alvarez-Chavez, A. B. Grudinin, and J. D.
Minelly, IEEE Photon. Technol.Lett.11, 39 (1999) 21. Y. Panbiharwala, C. S. Kumar, D. Venkitesh, and B. Srinivasan in International Conference
on Fibre Optics and Photonics, OSA Technical Digest, paper TPo.15. (2012) 22. M.W. Beijersbergen, “Helical-wavefront beams produced with spiral phaseplate” Optics
Communications 112 (1994) 23. J. M. Sousa, J. Nilsson, C. C. Renaud, J. A. Alvarez-Chavez, A. B. Grudinin, and J. D.
Minelly, IEEE Photon. Technol.Lett.11, 39 (1999) 24. Y. Panbiharwala, C. S. Kumar, D. Venkitesh, and B. Srinivasan in International Conference
on Fibre Optics and Photonics, OSA Technical Digest, paper TPo.15. (2012) 25. T. Yao, J. Ji, and J. Nilsson, “Ultra-low quantum-defect heating in ytterbium-doped
aluminosilicate fibers,” Journal of Lightwave Technology, 32, 429 (2014) 26. C. A. Codemard, J. K. Sahu, and J. Nilsson, “Tandem cladding-pumping for control of excess
gain in ytterbium-doped fiber amplifiers,” IEEE J. Quantum Electron., 46, 1860 (2010)
DISTRIBUTION A. Approved for public release: distribution unlimited.

List of Publications and Significant Collaborations that resulted from your AOARD supported project: a) papers published in peer-reviewed journals,
P. Shankar, B. Srinivasan, G. Brambilla, All-Fiber Fused Coupler for Stable Generation of Radially and Azimuthally Polarized Beams, IEEE J. Photon. Technol. Lett., accepted for publication (2016)
b) papers published in peer-reviewed conference proceedings,
P. Shankar, M.I.M. Abdul Khudus, P. Gregg, S. Ramachandran, B. Srinivasan, G. Brambilla, OAM beam generation using all-fiber fused couplers, Proceedings of CLEO (2016)
P. Srinivas, P. Shankar, B. Srinivasan, Investigation of Fractional Charge OAM Beam Generation and Its Decomposition, Proceedings of PIERS, Shanghai (2016)
Y. Panbiharwala, P. Yang, J. Nilsson, B. Srinivasan, Design and Demonstration of an All-Fiber Tandem Pumped Master Oscillator Power Amplifier, Proceedings of the International Conference on Fiber Optics and Photonics, Kanpur (2016) A. Ghosh, Y. Panbiharwala, D. Venkitesh, A. Prabhakar, B. Srinivasan, Design and Development of an Experimental Testbed for the Study of Thermal Mode Instability in High-Power Fiber Lasers, to be presented at National Laser Symposium, Bhubaneswar (2016)
c) papers published in non-peer-reviewed journals and conference proceedings: none d) conference presentations without papers,
P. Shankar, B. Srinivasan, and G. Brambilla, All-fiber fused coupler for vortex beam generation in fibers, Directed Energy Annual Symposium, Albuquerque (2016)
e) manuscripts submitted but not yet published: none f) provide a list any interactions with industry or with Air Force Research Laboratory
scientists or significant collaborations that resulted from this work. As part of the project, IITM investigators had the opportunity to work closely with Prof Johan Nilsson’s group at ORC, Southampton, as well as Prof Siddharth Ramachandran’s group at Boston University. P. Shankar’s visit to both ORC and Boston University were partly funded by the AOARD project, and resulted in several of the publications listed above. Similarly, Y. Panbiharwala spent three and half months at ORC and gained significant knowledge in building high power fiber amplifiers, which has been very useful in building a similar setup at IIT Madras.
Similarly, Balaji was provided a Window on Science award to travel to the Directed Energy Annual Symposium held at Albuquerque during March, 2016. During this travel, he had the opportunity to visit the Kirtland Air Force Base and interact with Dr Leanne Henry as well as Dr Iyad Dajani to discuss possible collaborative work on high power fiber amplifiers.
DISTRIBUTION A. Approved for public release: distribution unlimited.