african successes, volume iii: modernization and development · stephen mwaura, benno ndulu,...
TRANSCRIPT
This PDF is a selection from a published volume from the National Bureau of Economic Research
Volume Title: African Successes, Volume III: Modernization and Development
Volume Author/Editor: Sebastian Edwards, Simon Johnson, and David N. Weil, editors
Volume Publisher: University of Chicago Press
Volume ISBNs: 978-0-226-31572-0 (cloth)
Volume URL: http://www.nber.org/books/afri14-3
Conference Dates: December 11–12, 2009; July 18–20, 2010; August 3–5, 2011
Publication Date: September 2016
Chapter Title: Mobile Banking: The Impact of M-Pesa in Kenya
Chapter Author(s): Isaac Mbiti, David N. Weil
Chapter URL: http://www.nber.org/chapters/c13367
Chapter pages in book: (p. 247 – 293)

247
7Mobile BankingThe Impact of M- Pesa in Kenya
Isaac Mbiti and David N. Weil
7.1 Introduction
M- Pesa is a money transfer system operated by Safaricom, Kenya’s largest cellular phone provider. M- Pesa allows users to exchange cash for “e- float” on their phones, to send e-float to other cellular phone users, and to exchange e-float back into cash. The story of the growth of mobile telephones in Africa is one of a tectonic and unexpected change in communications tech-nology. From virtually unconnected in the 1990s, over 60 percent of Afri-cans now have mobile phone coverage, and there are now over ten times as many mobile phones as landline phones in use (Aker and Mbiti 2010). Even with the story of mobile phones’ growth as a background, the growth of M- Pesa is startling. Within eight months of its inception in March 2007, over 1.1 million Kenyans had registered to use M- Pesa, and over US$87 mil-lion had been transferred over the system (Safaricom 2007). By September 2009, over 8.5 million Kenyans had registered to use the service and US$3.7 billion (equivalent to 10 percent of Kenya’s gross domestic product [GDP]) had been transferred over the system since inception (Safaricom 2009). This
Isaac Mbiti is assistant professor of public policy and economics at the University of Vir-ginia. David N. Weil is the James and Merryl Tisch Professor of Economics at Brown University and a research associate of the National Bureau of Economic Research.
We are grateful to Taryn Dinkelman, John Driscoll, Frederik Eijkman, James Habyarimana, Stephen Mwaura, Benno Ndulu, Pauline Vaughn, Dean Yang, and seminar participants at Tulane University and the NBER Africa Success conference for helpful comments and sug-gestions. Emilio Depetris Chauvin, Federico Droller, Richard Amwayi Namolo, Angeline Nguyen, Scott Weiner, and Jingjing Ye provided superb research assistance. We are grateful to the Financial Sector Deepening (FSD) Trust of Kenya and Pep Intermedius for providing us with data. Financial support for this research was graciously provided by the NBER Africa Suc-cess Project. For acknowledgments, sources of research support, and disclosure of the authors’ material financial relationships, if any, please see http:// www .nber .org/ chapters/ c13367.ack.

248 Isaac Mbiti and David N. Weil
explosive growth was also mirrored in the growth of M- Pesa agents (or ser-vice locations), which grew to over 18,000 locations by April 2010, from a base of approximately 450 in mid- 2007 (Safaricom 2009; Vaughan 2007). By contrast, Kenya has only 491 bank branches, 500 postbank branches, and 352 ATMs (Mas and Ng’weno 2009). While the mobile telephone is within sight of becoming a mature business, e-money services like M- Pesa are still in their early days and are continually evolving in response to competitive pressures and customer needs. Despite all the attention M- Pesa has received, there is little quantitative evidence on its economic and social impacts.
The combination of widespread cellular communication and the ability to transfer money instantly, securely, and inexpensively are together leading to enormous changes in the organization of economic activity, family rela-tions, and risk management and mitigation, among other things. A decade ago, family members in different parts of Kenya had a very limited scope of communicating with relatives in distant parts of the country, and they faced even greater difficulties in sending or receiving remittances. Now, in many cases, appeals for assistance and the availability of resources can be com-municated, and money can be transferred almost instantaneously. Among the changes observers have noted are changes in the the nature, pattern, and impact of remittances. Morawczynski and Pickens (2009) observe that M- Pesa users sent smaller but more frequent remittances, which resulted in overall larger remittances to rural areas. They also observe that urban migrants using M- Pesa visited their rural homes less frequently, potentially weakening the social ties between migrants and their home communities. Researchers have also noted the potential of M- Pesa to affect savings. Morawczynski and Pickens (2009) observe that users often keep a balance on their M- Pesa accounts, thereby using the system as a rudimentary bank account despite the fact that the system does not provide interest. In addi-tion, Vaughn (2007) notes that some individuals stored money in M- Pesa due to safety considerations, especially when traveling across the country. Using ethnographic methods in three communities, Plyler, Hass, and Naga-rajan (2010) argue that M- Pesa has enabled small businesses to expand and grow and has also increased the circulation of money in these com-munities.
The explosive growth of M- Pesa has inevitably inspired a great deal of discussion about what the system really is and what it could grow to be. Is it simply a low- cost money transfer system competing with (or replacing) modalities such as cheques and Western Union? Is it a nascent form of elec-tronic money that will someday largely displace cash? Can it be used as a sav-ings account? Is it a means by which financial services can be provided to the unbanked? Jack and Suri (2011) report that three out of four M- Pesa users indicate that they use it to save money. Recently, the potential for M- Pesa to be a savings vehicle has received even more attention, as Safaricom and
Mobile Banking 249
Equity Bank have introduced M- Kesho, an interest- bearing savings account that is directly linked to M- Pesa.
In this chapter we examine how M- Pesa is being used in Kenya. We com-bine data from a number of sources including microlevel survey data (the FinAccess surveys), transaction data from M- Pesa agents, price data from money transfer companies, and aggregate data from Safaricom and the Cen-tral Bank of Kenya. We pay particular attention to the question of whether M- Pesa is solely a low- value money transfer system or a nascent form of a means of saving, providing broader financial access for people who are unbanked.
The rest of this chapter is organized as follows. In section 7.2, we briefly discuss the structure of M- Pesa. In section 7.3, we examine M- Pesa’s role as a money transfer service. We also examine the characteristics of users, explore data on the distribution of withdrawal and deposit sizes, and analyze the effect of M- Pesa on alternative money transfer modalities. In section 7.4, we examine microeconomic evidence of how M- Pesa affects outcomes such as the propensity of individuals to use financial institutions, as well as to accu-mulate savings. In section 7.5, we explore the monetary aspects of M- Pesa, including the velocity of e-money circulation. Section 7.6 addresses the question of why people do not store much value in their M- Pesa accounts. Section 7.7 concludes.
7.2 M- Pesa Structure
7.2.1 Basic Structure
There are three basic transactions that customers conduct with M- Pesa.
• A customer may deposit money at an M- Pesa outlet in return for e-float (called a “cash- in” transaction). The customer is required to show a valid identification document, and his identity and the amount of the deposit are logged in a book kept at the outlet. Upon receipt of the money, the M- Pesa agent enters the customer’s telephone number and deposit information into his/ her cell phone, and the customer waits at the outlet window until he/ she receives a confirmation text message that e-float has been deposited. Unless the system is running slowly (which happens occasionally), the whole transaction takes about a min-ute or less.
• A customer may exchange e-float for cash at an M- Pesa outlet (called a “cash- out” transaction.) Again, the customer must show a valid iden-tification document, and the transaction is logged. The customer tells the the shop clerk how much cash he/ she wants, then chooses “withdraw cash” on the M- Pesa menu on his phone, enters the amount to be with-

250 Isaac Mbiti and David N. Weil
drawn (plus the relevant fee), and enters the agent number. The agent then receives a text indicating that the transaction is complete, and the agent then gives the appropriate amount of cash to the customer. This whole transaction takes about one minute.
• Finally, a user may transfer e-float from his/ her phone to another phone. Our study refers to such a transfer as a “person- to-person transfer,” even though one or both of the parties may be an institution or firm. The user enters the phone number of the recipient and the amount to be transferred on his/ her cellphone. The sender and recipient each receive a text message stating that money has been transferred.
These three basic transactions can be combined in a number of ways. For example, a user may deposit cash and send the full amount deposited to another user, who can then withdraw the full amount transferred. We refer to this use as “deposit- transfer- withdraw.” Alternatively, a user who receives a transfer from one person may transfer the e-float to some other user instead of withdrawing cash. E-float could circulate in this manner indefinitely, like conventional cash. A third usage possibility is where a user deposits cash and then later withdraws it him/ herself without having transferred it. Anecdot-ally, it is said that people do this for safety when they are traveling (Vaughan 2007; Morawczynski 2009).
The usage patterns described above can be mixed in varying ways. For example, a user may receive a transfer and withdraw some of the value while transferring some of the remaining amount elsewhere and leaving some e-float in his account for future transactions. Of particular interest to us is a pattern in which a user might receive a transfer and not withdraw it right away for several reasons: to economize on transaction fees, to economize on the effort of going to an M- Pesa outlet, or to benefit from the safety of storing value on a phone rather than in cash. M- Pesa is safer than cash because a personal identification number (PIN) is required to perform any transaction. If a phone is stolen or lost, the M- Pesa funds are safe unless the PIN has been compromised. If the PIN is compromised and funds are transferred to another account, the legitimate account holder can recover his/ her funds if they have not been withdrawn by the fraudulent recipient by initiating a transfer reversal through the customer service department.
One of our goals is to better understand such patterns of use. One ques-tion in particular is how much of the use of M- Pesa is of the deposit- transfer- withdraw type. To the extent that it is used just this way, M- Pesa is primarily a simple money transfer service (which is hardly to say that it is not economically important). By contrast, other uses of M- Pesa suggest other functions. To the extent that e-money circulates among several users between an initial cash-in transaction and a final cash- out transaction, it can be seen as an evolving alternative to currency. Similarly, to the extent that people hold e-float balances on their phones for significant periods of time,

Mobile Banking 251
M- Pesa can be seen as having aspects of banking (as will be seen below, one can even view it as paying interest.)1
All M- Pesa e-float is backed 100 percent by deposits held at three commer-cial banks in Kenya. Interest earned on these deposits is donated to a charity, which allows Safaricom to avoid being regulated as a bank. An extensive description of the arrangements between Safaricom and the network of agents who service M- Pesa users can be found in Eijkman, Kendall, and Mas (2010) and Jack and Suri (2011).
7.2.2 Pricing
Table 7.1 shows the basic pricing scheme for M- Pesa. To deposit money, a user must register with M- Pesa at an agent location. This is a relatively short process and only requires a valid identification document such as a national ID or passport. Recipients of M- Pesa need not be registered. There is a higher fee for sending money to nonregistered users, but they are not charged any fees to withdraw money and are unable to send the money onward since they are unregistered. The overall transaction fee is far lower for sending to a registered user than to a nonregistered user. In practice 70 percent of users are registered, and approximately 90 percent of transactions are conducted by registered users.2
The pricing structure of M- Pesa is simple and intuitive. However, the pricing structure has a number of “notches” in the terminology of Slemrod (2010). These are points at which incremental changes in customer behavior cause discrete jumps in costs. The incentives around notches are far stronger than those observed at “kinks” in price schedules, such as points where the marginal tax rate changes. For example, in the M- Pesa tariff schedule, the fee for withdrawing up to 2,500 KSh is 25 KSh, while the fee for withdrawing 2,501– 5,000 KSh is 45 KSh. Thus, a person who withdraws 2,600 KSh will be paying a marginal fee of 20 KSh (20 percent) on the last 100 KSh with-
1. As mentioned above, Safaricom and Equity Bank are now introducing a new service called M- Kesho that allows for mobile phone access to a low- cost bank account. There is no charge for opening the account, no periodic fees, and no minimum or maximum balance (M- Pesa has a maximum balance of 50,000 KSh). Balances from 1– 2,000 KSh (approximately 0.13– 25 USD) receive 0.5 percent interest per year; from 2,001– 5,000 KSh, 1 percent per year; from 5,001– 10,000 KSh, 2 percent per year; and above 10,000 KSh ($125), 3 percent per year. Funds can be transferred without a fee from M- Pesa to M- Kesho, although transfer back to M- Pesa costs 30 KSh. M- Kesho also offers microcredit and insurance services. Microloans can be requested for 100– 5000 KSh, with a 10 percent application fee. Loans are approved or rejected based on a credit score determined by looking at M- Pesa, M- Kesho, and Equity Bank account activity in the last six months, and must be paid back within thirty days (a penalty of 3 percent of one’s outstanding balance is charged for every day after this thirty- day period). Insurance can be obtained for 530 KSh for a year if paid all at once, 830 KSh for the year if paid on a monthly basis, or 1,030 KSh for a year if paid on a weekly basis. For the first year, this insurance is limited to personal accident- related expenses (though this is fairly broadly defined), but after a year it is upgraded to full life insurance (150,000 KSh death or permanent disability benefit plus 20,000 KSh funeral expenses).
2. Refer to the data appendix for details on the computation of this variable.

252 Isaac Mbiti and David N. Weil
drawn compared to a fee of 1 percent on the first 2,500 KSh withdrawn. The response of users to the price notches in the M- Pesa tariff schedule should be informative about the optimization problems faced by users. Below, we explore this issue by looking at data on the distribution of withdrawal sizes.
7.3 Uses and Economic Impacts of M- Pesa
7.3.1 M- Pesa as a Money Transfer System
Survey Results
How Money was Sent in 2006 and 2009. Prior to the introduction of M- Pesa, individuals used a mixture of informal and formal channels to transfer money. Larger bus companies such as Akamba Bus Company or Scandinavia Bus Company offered formal money or parcel transfer services, where recipients would collect the funds at a designated bus terminal. How-
Table 7.1 M- Pesa fee schedule
Transaction range (KShs) Customer
charge (KShs)Transaction type Minimum Maximum
Deposit cash 100 35,000 0
Send money to a registered M- Pesa user 100 35,000 30
Send money to a non- registered M- Pesa user 100 2,500 752,501 5,000 1005,001 10,000 175
10,001 20,000 350 20,001 35,000 400
Withdraw cash by a registered M- Pesa user at an M- Pesa agent outlet
100 2,500 252,501 5,000 455,001 10,000 75
10,001 20,000 145 20,001 35,000 170
Withdraw cash by registered M- Pesa user at PesaPoint ATM
200 2,500 302,501 5,000 605,001 10,000 100
10,001 20,000 175
Withdraw cash by a nonregistered M- Pesa user 100 35,000 0Buy airtime (for self or other) 20 10,000 0Pay bill transactions — — 0–30
Source: Safaricom Price Schedule (2010).

Mobile Banking 253
ever, smaller bus companies or independent minibus operators (matatus) would perform these transactions informally, and in some cases the bus driver would carry the funds with the promise to deliver them. In other cases, individuals would disguise money transfers as packages and place them on the bus for delivery to the designated terminal (Kabbucho, Sander, and Mukwana 2003; Morawczynski 2009). The post office offered a vari-ety of different money transfer products including instant money transfer (postapay) and money orders, which would be delivered to the post office closest to the recipient (Kabbucho, Sander, and Mukwana 2003). Banks and money transfer companies such as Western Union or Moneygram also offered transfer services, although their outlet or branch networks were not as extensive as the post office’s.
Figures 7.1 and 7.2 show the change in sending and receiving methods between 2006 and 2009. The figures show that the most common methods to send or receive money were through friends, bus companies, or the post office in 2006. Over 50 percent of people sent money using friends, while close to 50 percent received money via this medium. Approximately 20 per-cent sent money using the post office, while close to 30 percent received funds this way. Other formal methods such as sending money through banks or money transfer companies like Western Union were less common with less than 10 percent using these methods to send or receive funds.
Fig. 7.1 Sending methods: 2006 and 2009

254 Isaac Mbiti and David N. Weil
The inception of M- Pesa in 2007 dramatically changed the money trans-fer market. In less than two years from its inception, M- Pesa was the leading money transfer method with over 50 percent sending money via M- Pesa and over 65 percent receiving funds through the system in 2009 (figures 7.1 and 7.2). The emergence of M- Pesa as the dominant money transfer mechanism virtually eliminated the use of post office products, bus companies, and for-mal channels such as Western Union and banks, where between 3.5 percent and 0.4 percent of individuals now use these methods to send or receive money (figures 7.1 and 7.2). However, sending and receiving funds through friends remains a popular means of money transfer, where 33 percent of individuals send money via a friend and 22 percent receive funds through a friend in 2009 (figures 7.1 and 7.2).
Uses of M- Pesa. Figure 7.3 summarizes the data on M- Pesa use from the 2009 Finacess Survey in descending order of frequency. Close to 42 per-cent of M- Pesa users reported using the system to purchase mobile phone airtime. Approximately 26 percent of users reported using M- Pesa to save money. While this is a relatively high proportion, it is much lower than the 75 percent saving rate reported in Jack and Suri (2011). Close to 20 percent of users also report using M- Pesa while traveling, presumably for safety con-cerns as discussed in Vaughan (2007) and Morawczynski (2009). Approxi-mately 6 percent of users made donations via M- Pesa, and our experience
Fig. 7.2 Receiving methods: 2006 and 2009

Mobile Banking 255
in the field suggests this has grown as currently the majority of calls for donations now include an M- Pesa option. Only 6 percent claim to receive payments on M- Pesa, while only 2 percent claim to receive salaries or wages by M- Pesa. Despite these low levels, 50 percent of M- Pesa users report that they would like to receive their main income by M- Pesa, mainly due to speed and accessibility. The main reported reasons for not wanting to use M- Pesa for the receipt of income was a strong cash preference (30 percent) and a fear of losing their phone (25 percent). Surprisingly, 17 percent of those who did not want to receive their income on M- Pesa were worried they could access the money too easily and thus spend it right away, while another 14 percent claimed their salary would not fit in M- Pesa. Almost 4 percent used an ATM to withdraw cash from their M- Pesa account and 3 percent used M- Pesa to buy goods or pay bills. While the bill- paying prevalence was low in 2009, we expect this to grow as Safaricom has initiated a number of strategic partnerships where customers may now pay for goods and services using M- Pesa. For example, several hospitals, insurance companies, schools, and grocery stores now accept M- Pesa payments. As argued in Aker and Mbiti (2010), these partnerships are part of M- Pesa’s evolution from a pure money transfer system into a payment platform and a formal (regulated) financial service.
Fig. 7.3 Uses of M-Pesa
256 Isaac Mbiti and David N. Weil
Distribution of Withdrawals and Deposits
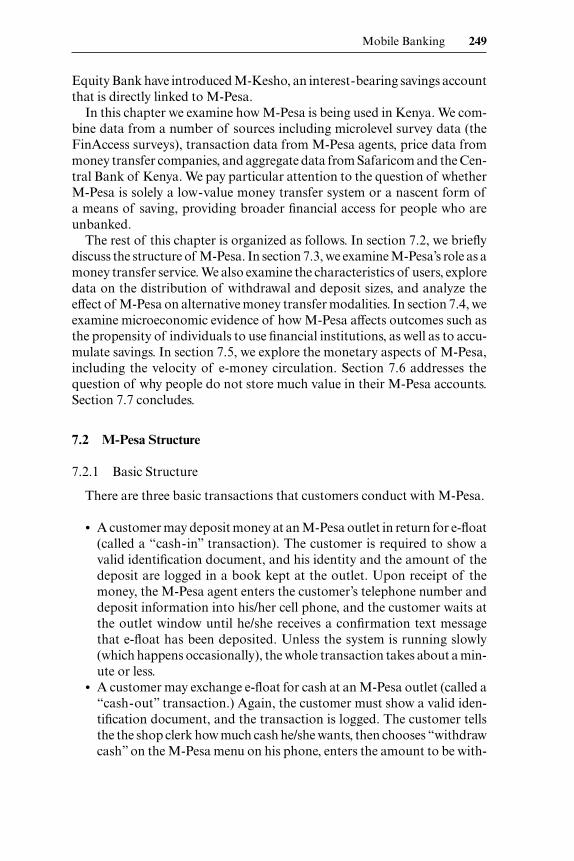
Our data comes from three M- Pesa outlets. As described in Eijkman, Kendall, and Mas (2010), Cyber Center is an urban outlet in the city of Kisumu, which has a population of 350,000. The outlet is located near one of the city’s markets. Katito is small town with a population of roughly five thousand, located in a rural area about a one- hour trip from Kisumu. It also services surrounding rural areas. Homa Bay is classified as a “district” outlet, meaning that it is in a provincial market town with a population of roughly 20,000 on a main highway.
Table 7.2 shows data on the distribution of withdrawal and deposit amounts at the three outlets. Figure 7.4 show the histograms of the distri-bution of withdrawals from each outlet. The most striking finding in this data is the extent to which a large part of the distribution is composed of very small withdrawals. This is most visible in Katito, the rural outlet, where the median withdrawal is only 900 KSh (about US$13). The 10th percentile of the distibution of withdrawals in Katito is 250 KSh, which implies that one- tenth of users pay a commission of 10 percent or more.3
We can also use figure 7.4 to address the issue of whether there is a large response to the price notches in the M- Pesa tariff discussed above. Although we do not perform a formal test, in most applicable cases we see remarkably little evidence of any response to these notches at all. In the case of Katito, for example, the only price notch that is in the range of an appreciable part of the data is at 2,500 KSh. Although there is indeed a point of mass at this level, it is not out of line with what one would expect given the similar masses at round numbers (500, 1,000, 1,500, etc.). Indeed, there were many fewer
Table 7.2 Summary statistics of transactions at M- Pesa agents
Withdrawals Deposits
Cyber Center Katito Homa Bay Cyber Center Katito Homa Bay
N 3,477 6,401 2,787 3,544 2,524 3,716Mean 2,757 1,402 5,762 3,773 3,425 5,240Std. dev. 4,799 1,854 8,671 5,949 6,598 6,790Skewness 4.03 5.27 2.17 3.07 3.21 2.2910th 300 250 390 300 200 50025th 500 475 700 578 390 1,000Median 1,000 900 1,970 1,500 1,000 2,50075th 2,850 1,680 6,500 4,000 3,000 6,47590th 6,370 3,000 18,500 10,001 10,000 14,000
3. Although we do not have data that links withdrawals to transfers, it is likely that in most cases, someone who withdraws 250 KSh has just received this as a transfer, which cost the sender 30 KSh. Thus the overall cost of receiving 225 KSh after fees was 280 KSh, a loss of 19.6 percent.

Fig. 7.4 Frequency of M-Pesa withdrawals by site: A, Homa Bay; B, Cyber; C, KatitoNote: Dotted lines represent price notches.
B
A
C

258 Isaac Mbiti and David N. Weil
withdrawals at 2,500 KSh than at 3,000 KSh. We see this for the other outlets as well. It is true that in Homa Bay, which has the largest withdrawals, there are large spikes in the distribution at 10,000 and 20,000 KSh, both of which are price notches. Similarly, there is a spike at 10,000 at Cyber Center. This is consistent with users reacting to the incentives of the price notches, but it is also possible that these large spikes are just due to these figures being round numbers.
As another test of whether users of M- Pesa change their behavior in response to characteristics of the pricing structure, we examined data on deposit sizes. Specifically, we are interested in the extent to which people transferring money take into account the fees paid by those who withdraw money (and also the transfer fees that they pay themselves). If such depos-its are made as part of a deposit- transfer- withdraw transaction, then the total fees of the transaction will be 55 KSh (that is, 30 KSh for the transfer plus 25 KSh for the withdrawal). A depositor who wanted the recipient to end up with, say, 1,000 KSh would have to deposit 1,055 KSh. We think of small deposits in amounts ending with 55 KSh as being “fee aware.” To the extent that we see deposits of such amounts, it suggests to us that there is a confluence of three factors: first, the depositor intends to transfer the full amount of his/ her deposit (minus the transfer fee); second, that he/ she expects the recipient to withdraw the amount of the transfer received; and third, that the sender wants the recipient to have access to a round- number amount of money.
Table 7.3 shows data on the deposits pooled from the three outlets described above. We consider only deposit amounts below 2,600 KSh, because the withdrawal fee rises after 2,500 KSh.4 Our sample is 6,036 deposits. We tabu-late deposits based on the last two digits of the deposit size. The table shows that, not surprisingly, the biggest masses of the distribution are at 00, 50, and 25, which are simply round numbers. However, the fourth largest mass in the distribution (6.8 percent) is indeed at 55, which clearly corresponds to awareness of fees. Further, the fifth largest mass in the distribution is at 30 (4.0 percent), suggesting that some depositors are taking into account transfer fees but not withdrawal fees. Nonetheless, our interpretation of this data is that fee- aware deposits are relatively rare. Of course it is not clear which of the three factors described above is failing in most cases.
The Impact of M- Pesa on Money Transfer Companies
A number of papers have documented the impacts of mobile phones causing reduced price variation in markets. Jensen (2007) and Aker (2010) find that the introduction of mobile phones reduced price dispersion in fish markets in India and grain markets in Niger, respectively. In these instances
4. The withdrawal fee itself is not counted toward the price of a withdrawal. Thus a customer with a balance of KSh 2,525 in her account could receive KSh 2,500 in cash.

Mobile Banking 259
the mobile phone technology has increased information flows, which has resulted in price reductions. In contrast, the development and introduction of M- Pesa can be viewed as a “disruptive technology” (Bower and Chris-tensen 1995) or an example of “creative destruction” (Schumpeter 1942; Aghion and Howitt 1992), where M- Pesa revolutionized the money transfer industry. As figures 7.1 and 7.2 show, M- Pesa became the dominant money transfer mechanism within two years of its inception. Ethnographic work by Morawczynski (2009) suggests that M- Pesa’s popularity has been driven by its speed, safety, reliability, extensive network of outlets, and its price relative to the alternatives. Prior to the introduction of M- Pesa, Kabbucho, Sander, and Mukwana (2003) document that the cost of instantly sending US$100 through formal channels ranged between US$12 (MoneyGram) and US$20 (bank wire transfer), while the cost of slower formal channels ranged from US$3 (bus companies) to US$6 (postal money order). Com-pared to these alternatives M- Pesa offered a significantly cheaper method of instantly transferring funds, where the cost of sending US$100 to a non-registered user by M- Pesa was approximately US$2.50 in early 2008, while the cost of sending to a registered user was even less.
The dominance of M- Pesa can also be observed in the the financial state-ments of the competitors. Gikunju (2009) examines the financial statements
Table 7.3 Distribution of final two digits of deposit amounts
Final digits Percentage
00 58.605 0.310 0.415 0.120 1.125 9.530 4.035 0.140 0.345 0.150 11.755 6.860 2.665 0.170 2.275 1.280 0.485 0.190 0.195 0.0
other 0.2
Note: M- Pesa deposit data from an agent in Kisumu. Deposits smaller than KSh 2,600. N = 6,036.

260 Isaac Mbiti and David N. Weil
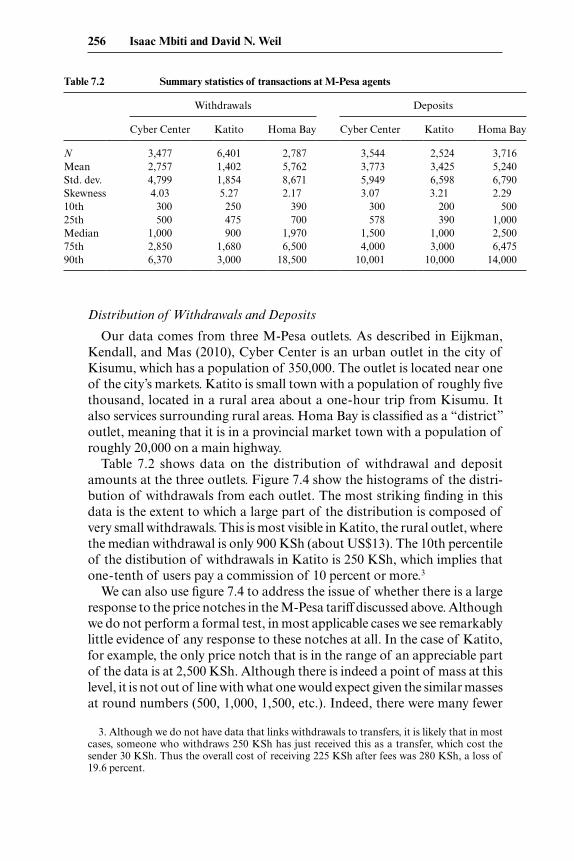
of the Postal Corporation of Kenya and finds that revenues and profits for its PostaPay money transfer service declined rapidly after the introduction of M- Pesa and suggests that Western Union’s and MoneyGram’s profits have also declined over the same period. Faced with obsolescence, money trans-fer companies such as Western Union and MoneyGram have responded by cutting prices, even though they are still unable to match M- Pesa’s superior convenience (Gikunju 2009). Figure 7.5 shows the changes in the money transfer price schedule for Western Union and MoneyGram from the pre– M- Pesa period to the post– M- Pesa period. Overall, these figures show a dramatic reduction in the transaction prices of money transfers. On average, the commission (defined as price to send money divided by the amount sent) charged for money transfers fell from approximately 7 percent in 2003 to 3 percent in 2010. However, we cannot entirely attribute this decline to the competitive pressures induced by the M- Pesa revolution, as other factors such as general technological change could reduce transaction costs and thus reduce prices. Therefore, simple before- and- after comparisons of the price changes will not be sufficient to identify the competitive impact of M- Pesa on the prices of competitors.
We employ a difference- in-difference estimation strategy in order to iden-tify the impact of M- Pesa on competitors prices. We construct a database of prices for the main formal competitors in Kenya: MoneyGram and West-ern Union.5 We obtained the pre– M- Pesa price schedules from Kabbucho, Sander, and Mukwana (2003) and the current price schedules from each provider’s website. As each firm uses different price brackets, we created consistent and comparable price schedules by examining the commissions (price/ send amount) for send amounts in 100 KShs intervals ranging from each company’s minimum send amount to each company’s maximum send amount. Our empirical strategy exploits the differences in maximum trans-action limits between M- Pesa and its competitors. Central Bank regulations place a maximum transaction limit of 35,000 KShs on M- Pesa, while the transaction limits of MoneyGram and Western Union transactions exceed 500,000 KShs. Given these transaction limits, we would expect to see greater competitive pressures due to M- Pesa on transactions below the M- Pesa threshold of 35,000 KShs compared to transactions above that thresh-old. Figure 7.5 provides some suggestive evidence of this effect. Focusing on Moneygram, we see that the prices for smaller transactions decreased dramatically, while those for large transactions remained more static. A simple comparison of means above and below the 35,000 KShs threshold and across time is shown in table 7.4. This table shows that there were larger reductions in the prices of transfers below 35,000 KShs compared to those
5. The Postal Corporation of Kenya also has an instant money transfer product called Post-aPay. However, we were unable to collect pre– M- Pesa prices. We did have early 2008 prices and we do observe the same patterns as we show in our regressions.
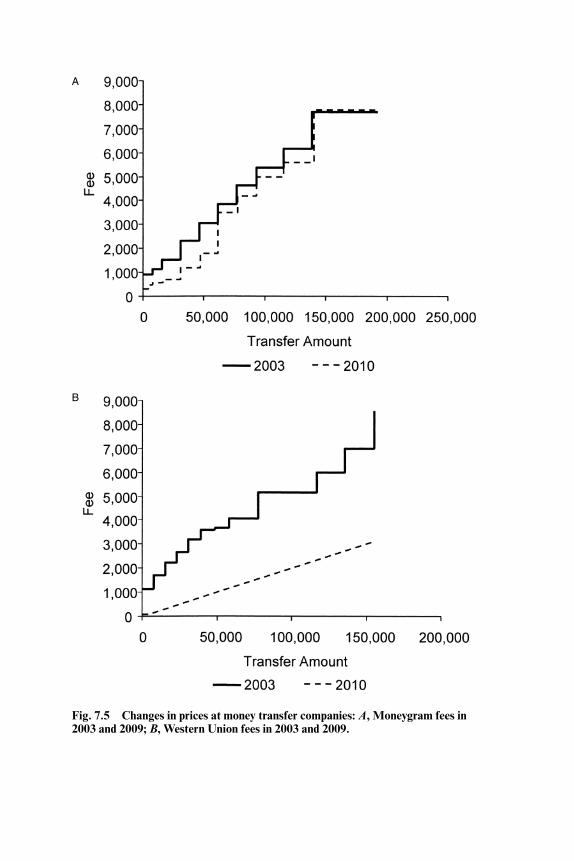
Fig. 7.5 Changes in prices at money transfer companies: A, Moneygram fees in 2003 and 2009; B, Western Union fees in 2003 and 2009.
B
A

262 Isaac Mbiti and David N. Weil
above. We can formally examine this assertion using the following empirical specification:
(1) pjkt = d0 + d1under35 j + d2postt + d3under35 j �×postt
+l j + gk + ´ jkt
where pjkt is the commission, defined as price of sending j shillings, under35 is a dummy variable that indicates whether the transaction amount j is less than 35,000 shillings, post is an indicator variable for the post– M- Pesa period (i.e., 2010), λ is a transaction amount fixed effect, and γ is a com-pany fixed effect. The coefficient of interest is δ3, which captures the impact of M- Pesa on prices. The estimates from equation (1) are shown in table 7.5. These results show that the prices of transactions below 35,000 shillings fell by 6 percentage points, which is approximately a 43 percent reduction in the prices of transactions under 35,000 shillings from 2003. Overall, prices in this segment fell from approximately 14 percent to 4 percent; thus, our esti-mates imply that competitive pressure from M- Pesa accounts for approxi-mately 60 percent of the decline in prices from 2003 to 2010.
A potential concern with our estimation strategy is that we could be simply capturing falling trends in prices. Since we only have two periods of data, we cannot include company specific trends in our analysis. However, we can perform some falsification tests to ensure that our results are not spurious. We create a series of false (and arbitrary) thresholds of 100,000, 125,000, and 150,000 KShs and estimate equation (1) using these fake thresholds and restrict the sample to transactions over 35,000 shillings to avoid M- Pesa effects. Table 7.6 shows the results of this falsification exercise. We do not find negative effects of these false thresholds, but we do find small
Table 7.4 Average prices of transfers as a percent of transfer amount
Transfer amount
Less than or equal to
35,000 Greater than
35,000 Difference
Pre–M- Pesa 0.1401 0.0468 –0.0934***(0.0047) (0.0001)
Post–M- Pesa 0.0431 0.0112 –0.0319***(0.0023) (0.0002)
Difference –0.097*** –0.0356*** –0.0703***
Notes: Standard errors in parentheses. Western Union and Moneygram prices only. Transac-tions where fees exceed transfer amount are excluded. The P values of the T- test for the differ-ence of means:***Significant at the 1 percent level.**Significant at the 5 percent level.*Significant at the 10 percent level.

Table 7.5 Impact of M- Pesa on prices of competitors
Transfer fees (as % of transfer amount)
(1) (2) (3)
Transfer ≤ 35,000 0.0863*** 0.0715***(0.0063) (0.0062)
Postdummy –0.0356*** –0.0356*** –0.0356***(0.0001) (0.0001) (0.0002)
(Transfer ≤ 35,000) × post –0.0614*** –0.0615*** –0.0687***(0.0057) (0.0057) (0.0071)
Constant 0.0626*** 0.0723*** 0.0582***(0.0005) (0.0004) (0.0008)
Additional controls:Company FE Yes Yes YesControl for transfer amount and transfer amount squared No Yes NoTransfer amount FE No No YesObservations 18,694 18,694 18,694R- squared 0.494 0.533 0.818
Source: Data from Kabbucho, Sander, and Mukwana (2003), Western Union, and Moneygram.Notes: Preperiod is 2003 and postperiod is 2010. The M- Pesa transfer limit is 35,000 KShs. Robust stan-dard errors in parentheses.***Significant at the 1 percent level.**Significant at the 5 percent level.*Significant at the 10 percent level.
Table 7.6 Falsification test on the impact of M- Pesa on prices of competitors
Transfer fees (as % of transfer amount)
(1) (2) (3)
Postdummy –0.0366*** –0.0379*** –0.0382***(0.0002) (0.0001) (0.0001)
Fake threshold × post 0.00699*** 0.0114*** 0.0116***(0.0006) (0.0005) (0.0004)
Constant 0.0543*** 0.0543*** 0.0543***(0.0003) (0.0003) (0.0003)
Fake threshold 100,000 125,000 150,000
Additional controls:Company FE Yes Yes YesTransfer amount FE Yes Yes YesObservations 17,318 17,318 17,318R- squared 0.912 0.92 0.922
Source: Data from Kabbucho, Sander, and Mukwana (2003), Western Union, and Money-gram.Notes: Preperiod is 2003 and postperiod is 2010. The real M- Pesa transfer limit is 35,000 KShs. Robust standard errors in parentheses.***Significant at the 1 percent level.**Significant at the 5 percent level.*Significant at the 10 percent level.

264 Isaac Mbiti and David N. Weil
but positive and significant impacts of this threshold suggesting that trends are not driving our results discussed above.
While M- Pesa has forced money transfer companies to lower prices, M- Pesa has also induced these firms and other financial firms to improve their products and services. In some cases, firms have partnered with M- Pesa to offer an integrated service. For example, Western Union recently part-nered with M- Pesa to offer international money transfers in which migrants in the diaspora can now send remittances to their friends and family via M- Pesa with Western Union serving as an intermediary. PesaPoint, an inde-pendent network of ATMs, allows M- Pesa users to withdraw cash using its large network of ATMs. Commercial banks in Kenya were initially opposed to M- Pesa and lobbied the government to regulate M- Pesa and other mobile money platforms under the commercial banking regulations (Njiraini and Anyanzwa 2008). After these efforts failed banks partnered with M- Pesa to offer better services to customers, and in some cases became M- Pesa agents. There is also suggestive evidence that M- Pesa has increased the efficiency of the banking system. According to a 2009 newspaper article, the advent of M- Pesa has caused commercial banks to work toward speeding up the check- clearing process, which took a minimum of three days.6
7.3.2 Characteristics of Users
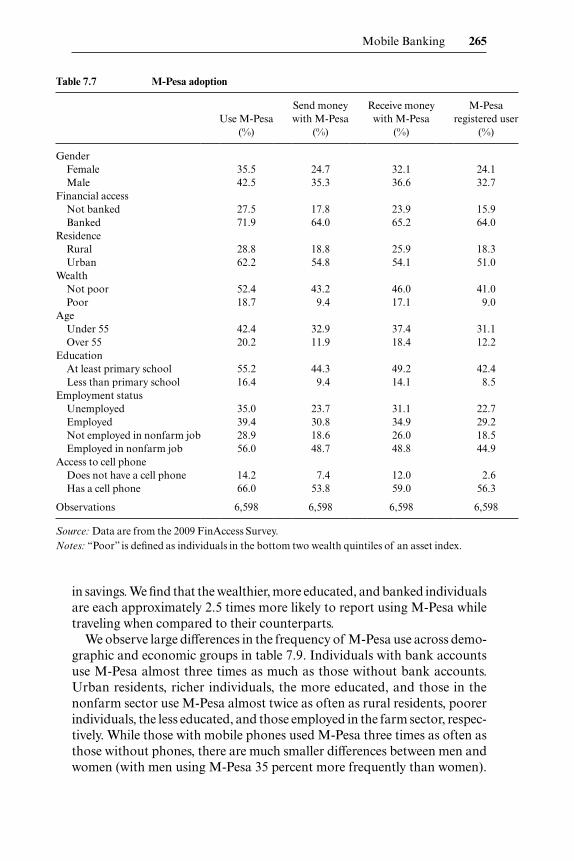
We use data from the 2009 FinAccess survey to examine basic charac-teristics of M- Pesa users and their usage patterns. Overall, our data show that approximately 40 percent of Kenyans have used M- Pesa, with close to 30 percent formally registered with Safaricom. As discussed in Aker and Mbiti (2010), M- Pesa users are more likely to be younger, wealthier, better educated, banked, employed in nonfarm sectors, to own cell phones, and to reside in urban areas (table 7.7).
We examine cross- tabulations of M- Pesa use by individual characteristics in table 7.8. Males, urban residents, banked individuals, the wealthy, the bet-ter educated, and those employed in the nonfarm sector were more likely to use M- Pesa. Higher socioeconomic status individuals are more likely to use M- Pesa to purchase airtime, save and store money while traveling, and use M- Pesa to pay wages than their respective counterparts. Focusing on saving patterns, table 7.8 shows that 35 percent of banked individuals used M- Pesa to save, while only 19 percent of unbanked individuals used M- Pesa to save. Similarly, 30 percent of wealthy individuals report using M- Pesa to save, while only 15 percent of poor individuals report doing so. Similar gaps are also observed between the more educated and less educated individuals. When we examine the characteristics of users who use M- Pesa as a safekeep-ing mechanism while traveling, we find very similar patterns to those found
6. “Why central bank position on mobile banking attracts wrath,” 2/ 6/ 2009, The Standard http:// www .standardmedia.co.ke/ InsidePage .php?id=1144015709&cid=457&.
Mobile Banking 265
in savings. We find that the wealthier, more educated, and banked individuals are each approximately 2.5 times more likely to report using M- Pesa while traveling when compared to their counterparts.
We observe large differences in the frequency of M- Pesa use across demo-graphic and economic groups in table 7.9. Individuals with bank accounts use M- Pesa almost three times as much as those without bank accounts. Urban residents, richer individuals, the more educated, and those in the nonfarm sector use M- Pesa almost twice as often as rural residents, poorer individuals, the less educated, and those employed in the farm sector, respec-tively. While those with mobile phones used M- Pesa three times as often as those without phones, there are much smaller differences between men and women (with men using M- Pesa 35 percent more frequently than women).
Table 7.7 M- Pesa adoption
Use M- Pesa
(%)
Send money with M- Pesa
(%)
Receive money with M- Pesa
(%)
M- Pesa registered user
(%)
GenderFemale 35.5 24.7 32.1 24.1Male 42.5 35.3 36.6 32.7
Financial accessNot banked 27.5 17.8 23.9 15.9Banked 71.9 64.0 65.2 64.0
ResidenceRural 28.8 18.8 25.9 18.3Urban 62.2 54.8 54.1 51.0
WealthNot poor 52.4 43.2 46.0 41.0Poor 18.7 9.4 17.1 9.0
AgeUnder 55 42.4 32.9 37.4 31.1Over 55 20.2 11.9 18.4 12.2
EducationAt least primary school 55.2 44.3 49.2 42.4Less than primary school 16.4 9.4 14.1 8.5
Employment statusUnemployed 35.0 23.7 31.1 22.7Employed 39.4 30.8 34.9 29.2Not employed in nonfarm job 28.9 18.6 26.0 18.5Employed in nonfarm job 56.0 48.7 48.8 44.9
Access to cell phoneDoes not have a cell phone 14.2 7.4 12.0 2.6Has a cell phone 66.0 53.8 59.0 56.3
Observations 6,598 6,598 6,598 6,598
Source: Data are from the 2009 FinAccess Survey.Notes: “Poor” is defined as individuals in the bottom two wealth quintiles of an asset index.

Tab
le 7
.8
M- P
esa
use
by u
ser
char
acte
rist
ics
Use
M-P
esa
to b
uy
airt
ime
(%)
Use
M-P
esa
to s
ave
mon
ey
(%)
Use
M-P
esa
whe
n tr
avel
ing
(%)
Use
M-P
esa
to m
ake
dona
tion
s (%
)
Use
M-P
esa
to r
ecei
ve
paym
ents
(%
)
Use
M-P
esa
to w
ithd
raw
fr
om A
TM
(%
)
Use
M-P
esa
to b
uy g
oods
/ se
rvic
es
(%)
Use
M-P
esa
to p
ay b
ills
(%)
Use
M-P
esa
to r
ecei
ve
wag
es
(%)
Use
M-P
esa
to p
ay w
ages
(%
)
Gen
der
Fem
ale
36.6
23.6
16.7
4.8
4.7
3.0
2.1
2.1
1.2
1.2
Mal
e48
.5
30.0
20
.2
8.4
6.9
4.7
4.7
3.4
2.6
2.5
Fin
anci
al a
cces
sN
ot b
anke
d26
.819
.410
.91.
92.
6 0.
3 1.
2 0.
7 1.
5 0.
6B
anke
d 60
.2
34.9
27
.1
12.0
9.
4 7.
9 5.
7 5.
0 2.
2 3.
1R
esid
ence
Rur
al
30.4
21
.0
14.1
4.
3 4.
4 1.
6 2.
3 1.
5 1.
8 1.
4U
rban
55.4
32.9
23
.1
9.0
7.2
6.3
4.4
4.0
1.9
2.2
Wea
lth
Not
poo
r48
.2
29.5
20
.7
7.8
6.6
4.6
3.6
3.3
2.0
2.1
Poor
17
.6
14.7
8
.9
1.2
2.3
0.6
1.7
0.4
1.2
0.4
Age U
nder
55
44.4
27
.9
18.8
6.
7 5.
9 3.
9 3.
3 2.
7 1.
8 1.
9O
ver
5518
.913
.5
13.5
4.
5 4.
1 2.
9 2.
5 2.
0 2.
0 0.
8E
duca
tion
At
leas
t pr
imar
y sc
hool
48
.1
29.2
20
.5
7.7
6.2
4.5
3.7
3.0
2.0
2.0
Les
s th
an p
rim
ary
scho
ol15
.3
14.5
8
.8
1.1
3.4
0.6
1.5
1.1
1.1
0.8
Em
ploy
men
t st
atus
Une
mpl
oyed
36
.1
21.9
14
.2
5.4
3.2
3.2
2.3
2.0
1.4
0.9
Em
ploy
ed43
.6
27.8
19
.4
6.8
6.4
3.9
3.5
2.9
2.0
2.0
Not
em
ploy
ed i
n no
nfar
m j
ob29
.8
20.1
12
.4
4.1
3.8
2.1
1.8
1.7
1.7
1.0
Em
ploy
ed i
n no
nfar
m j
ob
53.8
32
.7
24.0
8.
7 7.
5 5.
4 4.
6 3.
6 2.
0 2.
5A
cces
s to
cel
l pho
neD
oes
not
have
a c
ell p
hone
10.4
7
.1 2
.80.
82.
90.
40.
4 0.
41.
40.
8H
as a
cel
l pho
ne49
.931
.322
.27.
96.
44.
64.
03.
22.
02.
0
Obs
erva
tion
s
6,59
8
6,59
8
6,59
8
6,59
8
6,59
8
6,59
8
6,59
8
6,59
8
6,59
8
6,59
8
Sou
rce:
Dat
a ar
e fr
om t
he 2
009
Fin
Acc
ess
Surv
ey.
Not
es:
“Poo
r” i
s de
fined
as
indi
vidu
als
in t
he b
otto
m t
wo
wea
lth
quin
tile
s of
an
asse
t in
dex.

Mobile Banking 267
As columns (2) to (5) suggest, these disparities are mainly driven by differ-ences in daily and weekly use, in which the banked are almost three times as likely to use M- Pesa daily or weekly as the unbanked, and urban residents are almost twice as likely to use M- Pesa daily or weekly compared to rural residents. While daily and weekly users are generally more affluent, edu-cated, and urban, they only account for 1.6 and 14.4 percent of all users, respectively, while 32.7 percent of users are monthly users, and 51.3 percent are irregular users. However, using our annualized measure of M- Pesa usage, we find that daily users (1.6 percent of users) account for 32 percent of transactions, weekly users account for 41 percent of transactions, monthly users account for approximately 21 percent of transactions, and irregular users account for only 6 percent of transactions.
Table 7.9 Cross- tabulations of frequency of M- Pesa use
Frequency of use
(annual)
Use M-Pesa
daily (%)
Use M-Pesa weekly
(%)
Use M-Pesa monthly
(%)
Use M-Pesa
irregularly (%)
GenderFemale 15.7 1.2 12.5 32.4 53.9Male 21.4 2.2 16.6 33.1 48.1
Financial accessNot banked 10.4 0.4 8.1 30.3 61.2 Banked 27.8 3.1 21.9 35.6 39.3
ResidenceRural 13.5 0.9 10.3 31.3 57.5Urban 23.9 2.5 19.1 34.4 44.0
WealthNot poor 20.4 1.9 16.4 33.9 47.8 Poor 10.2 0.6 6.6 28.2 64.7
AgeUnder 55 18.8 1.6 15.1 32.9 50.3 Over 55 13.4 1.2 7.8 30.7 60.2
EducationAt least primary school 20.2 1.9 16.0 33.3 48.8Less than primary school 10.3 0.4 7.6 30.0 62.0
Employment statusUnemployed 15.1 1.1 11.7 33.4 53.9Employed 19.2 1.8 15.2 32.5 50.5Not employed in nonfarm job 12.9 0.8 9.8 31.5 57.9 Employed in nonfarm job 23.5 2.4 18.9 34.0 44.8
Access to cell phoneDoes not have a cell phone 6.2 0.0 2.9 26.9 70.1Has a cell phone 21.3 2.0 17.3 34.2 46.5
Observations 6,598 6,598 6,598 6,598 6,598
Source: Data are from the 2009 FinAccess Survey.Notes: “Poor” is defined as individuals in the bottom two wealth quintiles of an asset index.
268 Isaac Mbiti and David N. Weil
Overall, these simple cross- tabulations of the intensity of M- Pesa use and the main uses of M- Pesa by individual characteristics reveal that the most intense users generally have higher socioeconomic status. Moreover, theses higher SES individuals are also more likely to use M- Pesa in ways that could reap large economic gains, such as savings. Taken together, these patterns perhaps suggest that more affluent members of society are among the big-gest beneficiaries of M- Pesa. This, of course, does not preclude poorer and more vulnerable members of society from reaping significant economic and social benefits from M- Pesa. More research will be needed to examine the extent to which M- Pesa benefits are distributed across socioeconomic strata.
7.4 Economic Impacts of M- Pesa: Microlevel Evidence
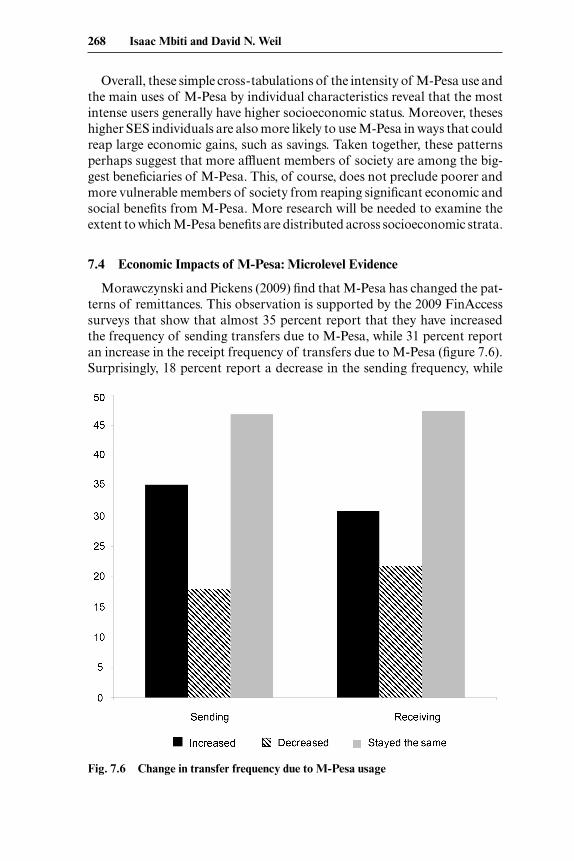
Morawczynski and Pickens (2009) find that M- Pesa has changed the pat-terns of remittances. This observation is supported by the 2009 FinAccess surveys that show that almost 35 percent report that they have increased the frequency of sending transfers due to M- Pesa, while 31 percent report an increase in the receipt frequency of transfers due to M- Pesa (figure 7.6). Surprisingly, 18 percent report a decrease in the sending frequency, while
Fig. 7.6 Change in transfer frequency due to M-Pesa usage
Mobile Banking 269
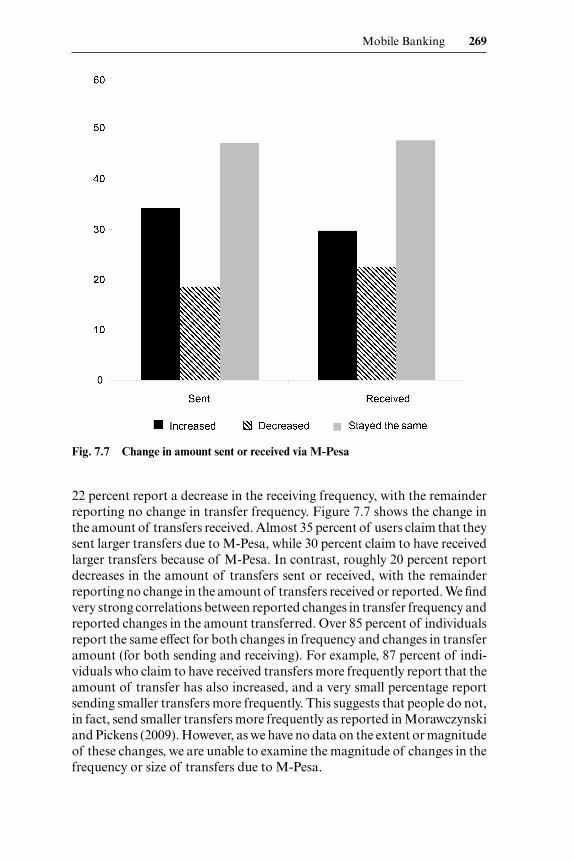
22 percent report a decrease in the receiving frequency, with the remainder reporting no change in transfer frequency. Figure 7.7 shows the change in the amount of transfers received. Almost 35 percent of users claim that they sent larger transfers due to M- Pesa, while 30 percent claim to have received larger transfers because of M- Pesa. In contrast, roughly 20 percent report decreases in the amount of transfers sent or received, with the remainder reporting no change in the amount of transfers received or reported. We find very strong correlations between reported changes in transfer frequency and reported changes in the amount transferred. Over 85 percent of individuals report the same effect for both changes in frequency and changes in transfer amount (for both sending and receiving). For example, 87 percent of indi-viduals who claim to have received transfers more frequently report that the amount of transfer has also increased, and a very small percentage report sending smaller transfers more frequently. This suggests that people do not, in fact, send smaller transfers more frequently as reported in Morawczynski and Pickens (2009). However, as we have no data on the extent or magnitude of these changes, we are unable to examine the magnitude of changes in the frequency or size of transfers due to M- Pesa.
Fig. 7.7 Change in amount sent or received via M-Pesa

270 Isaac Mbiti and David N. Weil
The qualititative studies on M- Pesa such as Morawczynski and Pickens (2009) have suggested that M- Pesa serves as a partial substitute for the for-mal banking system. Prior to the introduction of M- Pesa, most Africans were excluded from modern financial services. Using data ranging between 2001 and 2005, Beck, Demirgüç- Kunt, and Peria (2007) show that African countries lagged in financial access. During this period they show that Ghana had 1.6 branches per 100,000 and Kenya had 1.3 branches per 100,000, while Uganda and Tanzania both had less than 0.6 branches per 100,000. The ATM penetration of these countries was even lower—ranging from 1 per 100,000 in Kenya to less than 0.20 per 100,000 in Tanzania. In contrast, the United States had thirty- one bank branches and 120 ATMs per 100,000 people during that period. Perhaps partly as a result of the small banking networks in many African countries, a low proportion of individuals have a bank account. On average the FinScope surveys show that 30 percent of East and Southern African adults have a formal bank account (FinMark Trust 2008). These proportions range from a high of 63 percent in South Africa to low of 9 percent in Tanzania. With the low levels of financial development in many African countries, many observers have identified the potential for systems such as M- Pesa to expand the reach of the financial system and provide a platform to deliver financial services to the poor and excluded. Burgess and Pande (2005) show that the expansion of rural bank-ing in India significantly reduced rural poverty rates. While this was mainly driven by increased access to credit, mobile systems such as M- Pesa could facilitate the expansion of branchless banking, in which banks increase the financial reach using agents as intermediaries to provide services to clients in rural and remote areas where the fixed costs of opening a branch would be prohibitive (Pickens, Porteous, and Rotman 2009). This possibility, how-ever, is contingent upon banks’ willingness to serve poorer clients and upon government regulations that promote or hinder branchless banking.
A number of qualitative studies such as Morawczynski and Pickens (2009) and Mas and Morawczynski (2009) have explored the economic and social impacts of M- Pesa in Kenya. For instance, Morawczynski and Pickens (2009) find ethnographic evidence that M- Pesa has changed savings behavior and the pattern of remittances, and has increased rural livelihoods. While these studies provide suggestive evidence of the impacts of M- Pesa, they are generally unable to quantify the effects of the system and are limited by their small sample sizes. An exception is Jack and Suri’s (2010) empirical study that shows that M- Pesa improves the ability of households to smooth risks. We contribute to the literature by providing quantitative estimates of the impact of M- Pesa in Kenya on a variety of economic and social out-comes including financial access and usage. We combine the 2006 and 2009 FinAccess surveys and create a balanced panel of the 190 sublocations that were surveyed in both rounds in order to examine the economic impact of M- Pesa on various outcomes pertaining to remittances, financial access, and
Mobile Banking 271
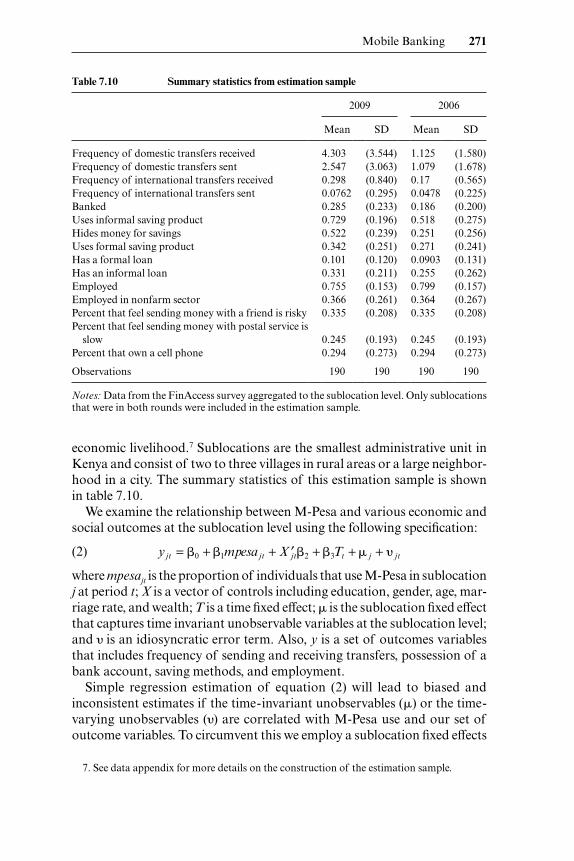
economic livelihood.7 Sublocations are the smallest administrative unit in Kenya and consist of two to three villages in rural areas or a large neighbor-hood in a city. The summary statistics of this estimation sample is shown in table 7.10.
We examine the relationship between M- Pesa and various economic and social outcomes at the sublocation level using the following specification:
(2) yjt = b0 +b1mpesa jt + ′X jtb2 +b3Tt +m j + y jt
where mpesajt is the proportion of individuals that use M- Pesa in sublocation j at period t; X is a vector of controls including education, gender, age, mar-riage rate, and wealth; T is a time fixed effect; μ is the sublocation fixed effect that captures time invariant unobservable variables at the sublocation level; and υ is an idiosyncratic error term. Also, y is a set of outcomes variables that includes frequency of sending and receiving transfers, possession of a bank account, saving methods, and employment.
Simple regression estimation of equation (2) will lead to biased and inconsistent estimates if the time- invariant unobservables (μ) or the time- varying unobservables (υ) are correlated with M- Pesa use and our set of outcome variables. To circumvent this we employ a sublocation fixed effects
Table 7.10 Summary statistics from estimation sample
2009 2006
Mean SD Mean SD
Frequency of domestic transfers received 4.303 (3.544) 1.125 (1.580)Frequency of domestic transfers sent 2.547 (3.063) 1.079 (1.678)Frequency of international transfers received 0.298 (0.840) 0.17 (0.565)Frequency of international transfers sent 0.0762 (0.295) 0.0478 (0.225)Banked 0.285 (0.233) 0.186 (0.200)Uses informal saving product 0.729 (0.196) 0.518 (0.275)Hides money for savings 0.522 (0.239) 0.251 (0.256)Uses formal saving product 0.342 (0.251) 0.271 (0.241)Has a formal loan 0.101 (0.120) 0.0903 (0.131)Has an informal loan 0.331 (0.211) 0.255 (0.262)Employed 0.755 (0.153) 0.799 (0.157)Employed in nonfarm sector 0.366 (0.261) 0.364 (0.267)Percent that feel sending money with a friend is risky 0.335 (0.208) 0.335 (0.208)Percent that feel sending money with postal service is
slow 0.245 (0.193) 0.245 (0.193)Percent that own a cell phone 0.294 (0.273) 0.294 (0.273)
Observations 190 190 190 190
Notes: Data from the FinAccess survey aggregated to the sublocation level. Only sublocations that were in both rounds were included in the estimation sample.
7. See data appendix for more details on the construction of the estimation sample.

272 Isaac Mbiti and David N. Weil
instrumental variable (FE- IV) procedure to eliminate the time- invariant heterogeneity and biases due to endogenous M- Pesa adoption. Specifying Δ as the sublocation first- difference operator, we can estimate the following fixed effect regression:
(3) Dyjt = b0 +b1Dmpesa jt + D ′X jtb2 + Dy jt.
While biases due to time- invariant unobservables are eliminated in equa-tion (3), the estimates will still be biased and inconsistent if Δ is correlated with Δmpesa. We need an instrument (or a set of instruments) that predicts M- Pesa use but does not directly impact our set of outcomes. Both rounds of the data contain perceptions of the most common money transfer methods; however, we focus solely upon the 2006 perception data as the 2009 percep-tions would be influenced by M- Pesa. Respondents are asked to identify the riskiest, slowest, and costliest money transfer method. We focus on the proportion of residents that identify sending money with a friend as the riskiest method, the proportion of residents that identify the post office as the slowest, and the proportion that identify money transfer companies as the most expensive. If more respondents in a sublocation feel that their alter-native means of transferring money are inefficient, they would be more likely to adopt M- Pesa. Moreover, conditional on the sublocation fixed effect, this 2006 perception should have no direct impact on outcomes (or the change in outcomes). The identification assumption is conditional on the vector of controls (such as wealth and education) and the sublocation fixed effect, the perceptions of the alternative methods will only indirectly affect the set of outcomes (such as banking) through M- Pesa adoption.
We can specify the set of estimating equations for the FE- IV regression as:
(4) Dyjt = b0 +b1Dmpesa jt + D ′X jtb2 + Dy jt
(5) Dmpesa jt = a0 + ′Z j 0a1 + D ′X jta2 + Dn
where Z is the set of instruments: the proportion that rank friends as the riskiest method to transfer money in 2006, the proportion that rank the post office as the slowest method in 2006, and the proportion that rank money transfer companies as the most expensive option in 2006.
The extent to which transferring funds through friends is risky will be mostly determined by social capital and crime. In terms of financial access, the most plausible concern is that banks are less likely to locate in these areas due to security concerns. Since these areas are more likely to adopt M- Pesa, then this would lead to an underestimate of the impact of M- Pesa adoption on financial access. There are a number of factors that could deter-mine efficiency of money transfers via the post office. First, these could reflect the motivation of post office employees. Employee motivation could be driven by the quality of supervision. If better supervisors were located in faster growing areas (which were more likely to see expansions of finan-cial services), then this would also lead to underestimates of the impact of

Mobile Banking 273
M- Pesa adoption. Alternatively, the speed of the post office could reflect the quality of transportation links or local infrastructure (e.g., electricity, telephone links). If financial institutions were less likely to expand to these more “isolated” areas, then this would again lead to an underestimate of the impact of M- Pesa adoption. However, if these institutions were more likely to expand in these areas, then our methodology would overestimate the impact of M- Pesa adoption. However, we feel that the costs of operat-ing in isolated areas may be prohibitive for banks and thus we feel that they are unlikely to expand in these areas. Since the price schedule for money transfer companies does not vary within Kenya, the perceptions of cost are likely driven by marketing and word of mouth. If these companies target their marketing in faster growing areas (which were more likely to see expan-sions of financial services), then this would also lead to underestimates of the impact of M- Pesa adoption.
The results from equations (2) and (3) are shown in table 7.11. The esti-mates from the random effects specifications show a positive relationship
Table 7.11 Impact of M- Pesa on transfers, employment, and financial access
M- Pesa use
Random effects Fixed effects(1) (2)
Dependent variable Coefficient Standard
error Coefficient Standard
error
(1) Percent receive a transfer 0.286*** (0.064) 0.176*** (0.061) (2) Percent sent a transfer 0.374*** (0.053) 0.262*** (0.064) (3) Frequency of transfers received 1.03 (1.069) 0.956 (1.184) (4) Frequency of transfers sent 3.386*** (0.669) 3.553*** (0.670) (5) Banked 0.179*** (0.040) 0.189*** (0.044) (6) Belong to group 0.209*** (0.069) 0.161** (0.080) (7) Informal saving –0.0785 (0.080) –0.277*** (0.094) (8) Hide money for savings+ –0.187** (0.083) –0.357*** (0.105) (9) Formal savings 0.152*** (0.043) 0.152*** (0.045)(10) Formal loan –0.011 (0.033) 0.00334 (0.035)(11) Informal loan –0.00328 (0.069) –0.0892 (0.089)(12) Employed 0.115** (0.053) 0.133** (0.061)(13) Employed in nonfarm job 0.0841 (0.054) 0.084 (0.062)
Notes: Each row is the coefficient on M- Pesa use from separate regressions. Data from the FinAccess survey aggregated to the sublocation level. Only sublocations that were in both rounds were included in the estimation sample. Sublocation fixed effects and sublocation ran-dom effects estimates. + hide money for savings is a subset of informal savings, and frequency of transfers only in-cludes domestic transfers. Additional controls: male, married, education, age, wealth, and year. There are 380 observations in each regression specification.***Significant at the 1 percent level.**Significant at the 5 percent level.*Significant at the 10 percent level.

274 Isaac Mbiti and David N. Weil
between M- Pesa adoption and frequency of sending and receiving transfers, although only the estimate of sending transfers is statistically significant. The estimates also show a strong positive association between M- Pesa adoption and bank use, formal savings, and employment. In addition, the estimates show a negative and statistically significant relationship between M- Pesa adoption and saving money using secret hiding places. Similar patterns are observed in fixed effect specifications. The point estimates on sending remit-tances, bank use, formal savings, and employment are very similar when compared to the random effects specifications. However, we do observe the larger negative correlations between M- Pesa and informal savings and using a secret hiding place to save money.
We estimate equations (4) and (5) in order to obtain causal estimates of the impacts of M- Pesa. Table 7.12 shows first- stage relationship between our set of instruments and the endogenous variables. The estimates show that M- Pesa adoption was positively correlated with greater proportions of individuals who rank using friends as the riskiest money transfer method. Similarly, perceived slowness of transferring funds using the post office in period 0 and the perceived cost of money transfer companies have positive and significant effects on M- Pesa adoption. This set of instruments is highly significant, with a joint F-test of 26, which is well above the weak instrument thresholds.
Table 7.12 First- stage relationship
M- Pesa adoption (1)
Percent that rate sending money with a friend is riskiest 0.169**(0.0838)
Percent that rate sending money with post office is slowest 0.298***(0.0988)
Percent that rate sending money with MTC is costliest 0.589***(0.0873)
Constant 0.111***(0.0430)
Observations 190R- squared 0.351
First- stage F 26.09
Notes: Data from the FinAccess surveys aggregated to the sublocation level. Only sublocations that were in both rounds were included in the estimation sample. First difference/ fixed effect estimates. Robust standard errors clustered at sublocation level in parentheses. There are 190 observations rather than 380 as the data is first differenced. Additional controls: male, married, education, age, wealth, and year; MTC is a money transfer company such as Western Union or MoneyGram.***Significant at the 1 percent level.**Significant at the 5 percent level.*Significant at the 10 percent level.
Mobile Banking 275
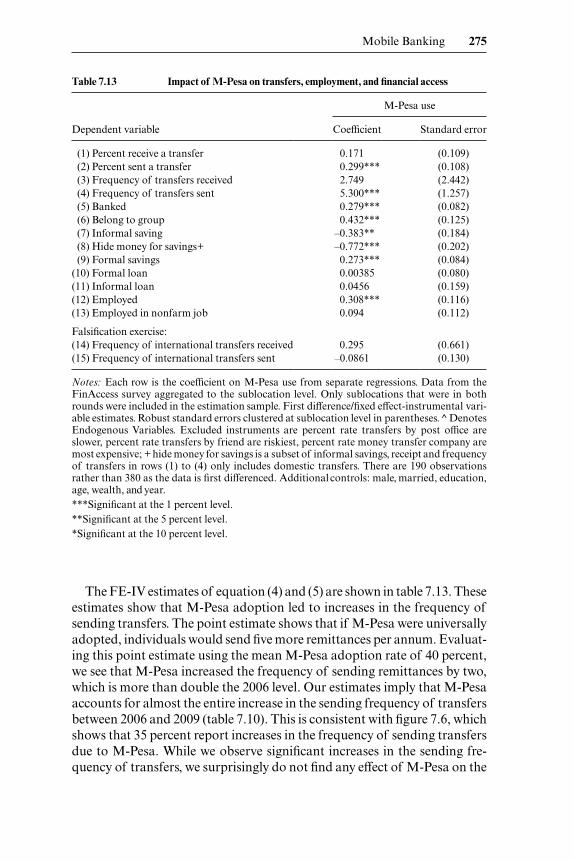
The FE- IV estimates of equation (4) and (5) are shown in table 7.13. These estimates show that M- Pesa adoption led to increases in the frequency of sending transfers. The point estimate shows that if M- Pesa were universally adopted, individuals would send five more remittances per annum. Evaluat-ing this point estimate using the mean M- Pesa adoption rate of 40 percent, we see that M- Pesa increased the frequency of sending remittances by two, which is more than double the 2006 level. Our estimates imply that M- Pesa accounts for almost the entire increase in the sending frequency of transfers between 2006 and 2009 (table 7.10). This is consistent with figure 7.6, which shows that 35 percent report increases in the frequency of sending transfers due to M- Pesa. While we observe significant increases in the sending fre-quency of transfers, we surprisingly do not find any effect of M- Pesa on the
Table 7.13 Impact of M- Pesa on transfers, employment, and financial access
M- Pesa use
Dependent variable Coefficient Standard error
(1) Percent receive a transfer 0.171 (0.109) (2) Percent sent a transfer 0.299*** (0.108) (3) Frequency of transfers received 2.749 (2.442) (4) Frequency of transfers sent 5.300*** (1.257) (5) Banked 0.279*** (0.082) (6) Belong to group 0.432*** (0.125) (7) Informal saving –0.383** (0.184) (8) Hide money for savings+ –0.772*** (0.202) (9) Formal savings 0.273*** (0.084)(10) Formal loan 0.00385 (0.080)(11) Informal loan 0.0456 (0.159)(12) Employed 0.308*** (0.116)(13) Employed in nonfarm job 0.094 (0.112)
Falsification exercise:(14) Frequency of international transfers received 0.295 (0.661)(15) Frequency of international transfers sent –0.0861 (0.130)
Notes: Each row is the coefficient on M- Pesa use from separate regressions. Data from the FinAccess survey aggregated to the sublocation level. Only sublocations that were in both rounds were included in the estimation sample. First difference/fixed effect- instrumental vari-able estimates. Robust standard errors clustered at sublocation level in parentheses. ̂ Denotes Endogenous Variables. Excluded instruments are percent rate transfers by post office are slower, percent rate transfers by friend are riskiest, percent rate money transfer company are most expensive; + hide money for savings is a subset of informal savings, receipt and frequency of transfers in rows (1) to (4) only includes domestic transfers. There are 190 observations rather than 380 as the data is first differenced. Additional controls: male, married, education, age, wealth, and year.***Significant at the 1 percent level.**Significant at the 5 percent level.*Significant at the 10 percent level.

276 Isaac Mbiti and David N. Weil
frequency of receiving transfers, even though 30 percent report increases in frequency of receiving transfers due to M- Pesa.
While M- Pesa has been touted for banking the “unbanked,” there are no estimates of the direct impact of M- Pesa on people adopting bank ac- counts. Row 5 of table 7.13 provides this evidence. These estimates show that increased M- Pesa adoption leads to greater bank use. The point estimates imply that universal adoption of M- Pesa would increase the proportion banked by 28 percentage points. Evaluated at the mean adoption rate of 40 percent, we see that M- Pesa has increased the proportion banked by al- most 11 percentage points, which represents a 58 percent increase over the 2006 banking level. As the data was collected prior to the integration of M- Pesa with banks, this result could be driven by increases in money (or cash) by users. It could also be driven by the complementarity between M- Pesa and banks. If M- Pesa were more valuable or useful in combination with a bank (or vice versa), then increases in demand for M- Pesa would also increase the demand for banking. This evidence provides some evidence that M- Pesa does not entirely serve as a substitute for the formal banking system, but, rather, is viewed (or used) as a complementary tool by individuals.
Qualitative evidence from Morawczynski and Pickens (2009) suggests that M- Pesa is used as a saving instrument. This notion is supported by the 2009 round of the Finaccess survey in which over 25 percent of individuals report using M- Pesa as a saving device. While we do not have data on the amount saved, we do have information on the methods used to save and can therefore examine the impact of M- Pesa on savings methods. Row 7 of table 7.13 shows the impact of M- Pesa on the use of informal saving mechanisms. Informal saving mechanisms include rotating saving and credit associations (ROSCA), saving with a group of friends, savings given to a family or friend for safekeeping, and saving by storing funds in a secret place. While the summary statistics show that the proportion of individuals using informal methods to save has increased from 52 percent to 72 percent, our estimates show that M- Pesa decreases the use of informal saving mechanisms. Evalu-ated at the mean M- Pesa adoption rate, M- Pesa would reduce the preva-lence of informal saving by 15 percentage points, approximately a 30 percent reduction from the 2006 level. We observe similar effects for the use of secret hiding places to save money. Row 8 of table 7.13 shows that for the average adoption rate, M- Pesa would reduce the proportion of people saving money in secret places by 30 percentage points, which is slightly greater in magni-tude than the 2006 level. Since we do not observe any changes in the use of formal savings methods (which do not include M- Pesa), these results suggest that users are shifting savings from informal tools to M- Pesa, perhaps due to the superior security of M- Pesa.
M- Pesa could also affect economic activity directly by increasing access to funds and indirectly by increasing savings and banking rates. Plyler, Hass, and Nagarajan (2010) argue that M- Pesa has promoted the growth rates of

Mobile Banking 277
(small- scale) firms in the communities they studied, and they argue that this was largely driven by the increased circulation of money in these communi-ties. Figure 7.7 provides some supportive evidence of the increase in funds due to M- Pesa, in which almost 35 percent of individuals report that they sent larger transfers due to M- Pesa, while close to 30 percent report that they received larger transfers due to M- Pesa.
We use employment as a measure of economic activity and examine the impacts of M- Pesa on employment. We use a measure of employment that incorporates farm labor (own- farm and on others farm), nonfarm labor (such as civil service employment), and self- employment (such as owning a shop). Individuals are considered employed if they are actively engaged in any of these activities. Row 12 of table 7.13 shows that M- Pesa is associated with increases in any type of employment. For the average M- Pesa adoption level, M- Pesa would increase employment by 12 percentage points, approxi-mately a 15 percent increase from the 2006 employment level. While this is encouraging, column (7) shows no impact of M- Pesa on nonfarm employ-ment. This suggests that the increases in employment due to M- Pesa are driven by changes in farm employment. One possible explanation is that the increased resource flows due to M- Pesa are channeled toward farming, thus boosting the demand for labor and increasing employment. Unfortunately, we do not have the data to investigate these underlying mechanisms further.
We perform some falsification tests to boost the credibility of our empiri-cal methodology. At the time the 2009 survey was collected, the interna-tional money transfer feature of M- Pesa was not yet available. Thus, M- Pesa should have no impact on international money transfers. Rows 14 and 15 of table 7.13 show that we do not find any significant impact of M- Pesa on international transfer patterns. This provides some reassurance that our methodology is not flawed.
7.5 M- Pesa Velocity and the E-Money Loop
7.5.1 Velocity
As a measure of how people are using M- Pesa, and also for the purposes of understanding where M- Pesa fits into a broader monetary framework, we are interested in calculating the “velocity” of M- Pesa. In standard monetary economics, “transactions velocity” is defined as the frequency with which the average unit of money is used in transactions. Transactions velocity is dif-ferent than the more frequently measured income velocity of money, which is simply nominal GDP divided by the relevant money stock.
In the case of M- Pesa, the potentially relevant transactions are deposit of money (creation of a unit of M- Pesa), transfer, and withdrawl of money (extinguishing of a unit of M- Pesa). In this respect, M- Pesa differs from cash, which, in a simple monetary system, would circulate in transactions
278 Isaac Mbiti and David N. Weil
with only rare instances in which it is created or liquidated (although a piece of cash may enter and leave the banking system many times over the course of its life). As our measure of M- Pesa velocity, we focus only on transfers, which are the closest analogue to purchases using money in a simple mon-etary system—indeed, if e-money is eventually used in a money- like fashion, such transfers would play the role of transactions using money.
Our measure of M- Pesa velocity is thus the total value of person- to-person transfers (per unit time) divided by the average outstanding balance of e-float. For example, if 100 units of e-float are created at the beginning of the month, transferred from person to person five times in the month, and extinguished at the end the month, then monthly velocity will be five. Notice that having 100 units of e-float transferred from person to person five times in the month could happen either because the people receiving transfers then transferred the e-float to someone else or because each time a transfer was received, the recipient withdrew his cash and a new user deposited cash and received e-float. We discuss this issue (the length of the “e- money loop”) in the next section.
Of the two numbers required to measure velocity, the harder one to obtain is the outstanding balance of e-float. As discussed above, all money depos-ited to create e-float is held by a trust fund that holds deposits in commer-cial banks. Thus, the outstanding balance of e-float is in principle perfectly observable at any point in time, both to Safaricom and to regulators. This information is not always freely available, however. Weil, Mbiti, and Mwega (2012) were able to obtain monthly data on the size of the trust balance from July 2007 through December 2011.8
The trust balance is by construction identical to the quantity of e-float outstanding. However, in the calculation of transfer velocity it is not clear how to treat e-float that is held by M- Pesa agents. Conceptually, one might want to think of the relevant aggregate for calculating transfer velocity to be e-float held on the phones of customers only. We can construct an esti-mate of this quantity by subtracting estimated e-cash held on the phones of M- Pesa agents from the trust balance. Eijkman, Kendall, and Mas (2010) report end of day e-float for different types of M- Pesa outlets. These range from 90,000 KSh for rural stores to 40,000 KSh for city stores. Rural stores have particularly high end- of-day float because they engage in primarily cash- out transactions. City stores did more balanced business, though with an excess of cash-in over cash- out. These end- of-day figures do not corre-
8. An earlier version of this chapter used a different source of data regarding the size of out-standing e-float. Specifically, we used an audit of M- Pesa conducted by the Ministry of Finance in January 2009. That audit states that “whereas the system transacted about 17 billion KShs in August 2008, the net deposite/ residual value per customer (i.e., deposit less withdrawals) was KShs 203.” We interpreted the figure of 203 KSh as outstanding e-cash per customer. We now think that this interpretation was incorrect. Similarly, we now think that the value of velocity that we derived based on this measure, which was between eleven and fourteen transactions per month, was incorrect.
Mobile Banking 279
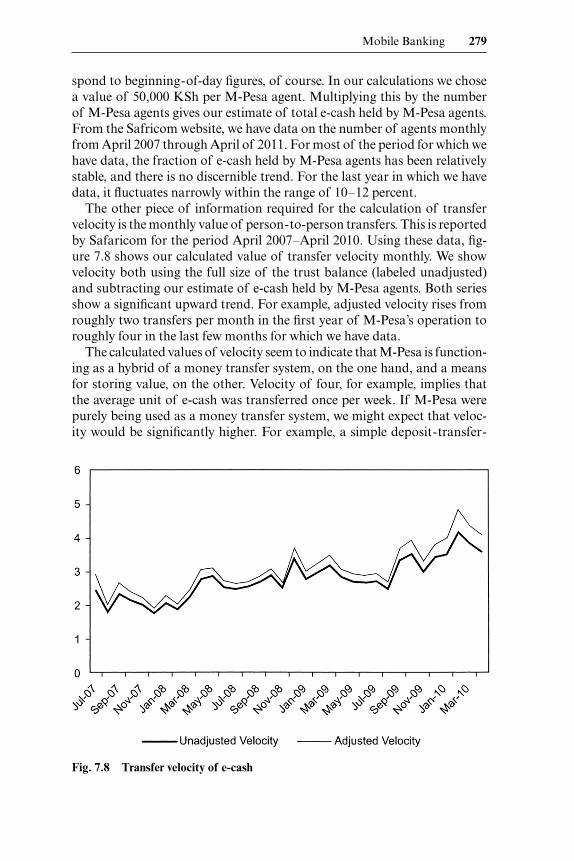
spond to beginning- of-day figures, of course. In our calculations we chose a value of 50,000 KSh per M- Pesa agent. Multiplying this by the number of M- Pesa agents gives our estimate of total e-cash held by M- Pesa agents. From the Safricom website, we have data on the number of agents monthly from April 2007 through April of 2011. For most of the period for which we have data, the fraction of e-cash held by M- Pesa agents has been relatively stable, and there is no discernible trend. For the last year in which we have data, it fluctuates narrowly within the range of 10– 12 percent.
The other piece of information required for the calculation of transfer velocity is the monthly value of person- to-person transfers. This is reported by Safaricom for the period April 2007– April 2010. Using these data, fig-ure 7.8 shows our calculated value of transfer velocity monthly. We show velocity both using the full size of the trust balance (labeled unadjusted) and subtracting our estimate of e-cash held by M- Pesa agents. Both series show a significant upward trend. For example, adjusted velocity rises from roughly two transfers per month in the first year of M- Pesa’s operation to roughly four in the last few months for which we have data.
The calculated values of velocity seem to indicate that M- Pesa is function-ing as a hybrid of a money transfer system, on the one hand, and a means for storing value, on the other. Velocity of four, for example, implies that the average unit of e-cash was transferred once per week. If M- Pesa were purely being used as a money transfer system, we might expect that veloc-ity would be significantly higher. For example, a simple deposit- transfer-
Fig. 7.8 Transfer velocity of e-cash
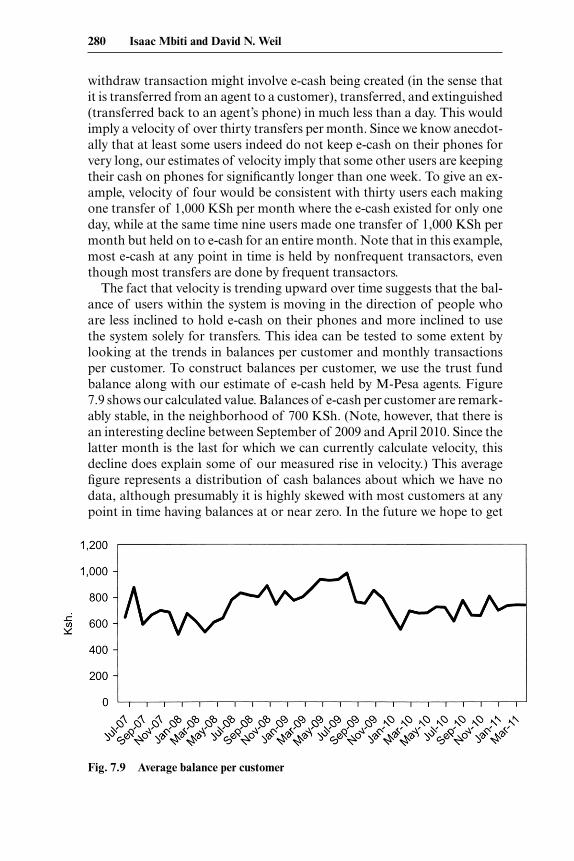
280 Isaac Mbiti and David N. Weil
withdraw transaction might involve e-cash being created (in the sense that it is transferred from an agent to a customer), transferred, and extinguished (transferred back to an agent’s phone) in much less than a day. This would imply a velocity of over thirty transfers per month. Since we know anecdot-ally that at least some users indeed do not keep e-cash on their phones for very long, our estimates of velocity imply that some other users are keeping their cash on phones for significantly longer than one week. To give an ex-ample, velocity of four would be consistent with thirty users each making one transfer of 1,000 KSh per month where the e-cash existed for only one day, while at the same time nine users made one transfer of 1,000 KSh per month but held on to e-cash for an entire month. Note that in this example, most e-cash at any point in time is held by nonfrequent transactors, even though most transfers are done by frequent transactors.
The fact that velocity is trending upward over time suggests that the bal-ance of users within the system is moving in the direction of people who are less inclined to hold e-cash on their phones and more inclined to use the system solely for transfers. This idea can be tested to some extent by looking at the trends in balances per customer and monthly transactions per customer. To construct balances per customer, we use the trust fund balance along with our estimate of e-cash held by M- Pesa agents. Figure 7.9 shows our calculated value. Balances of e-cash per customer are remark-ably stable, in the neighborhood of 700 KSh. (Note, however, that there is an interesting decline between September of 2009 and April 2010. Since the latter month is the last for which we can currently calculate velocity, this decline does explain some of our measured rise in velocity.) This average figure represents a distribution of cash balances about which we have no data, although presumably it is highly skewed with most customers at any point in time having balances at or near zero. In the future we hope to get
Fig. 7.9 Average balance per customer
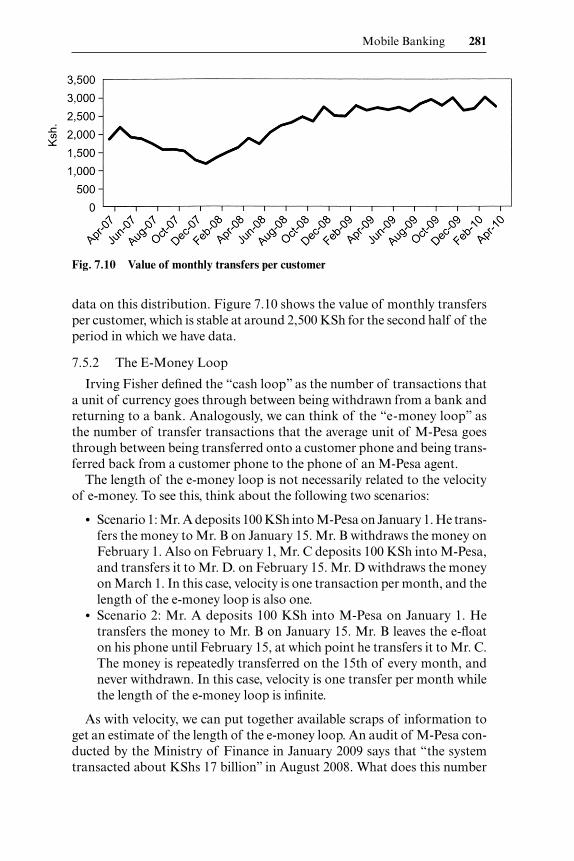
Mobile Banking 281
data on this distribution. Figure 7.10 shows the value of monthly transfers per customer, which is stable at around 2,500 KSh for the second half of the period in which we have data.
7.5.2 The E-Money Loop
Irving Fisher defined the “cash loop” as the number of transactions that a unit of currency goes through between being withdrawn from a bank and returning to a bank. Analogously, we can think of the “e- money loop” as the number of transfer transactions that the average unit of M- Pesa goes through between being transferred onto a customer phone and being trans-ferred back from a customer phone to the phone of an M- Pesa agent.
The length of the e-money loop is not necessarily related to the velocity of e-money. To see this, think about the following two scenarios:
• Scenario 1: Mr. A deposits 100 KSh into M- Pesa on January 1. He trans-fers the money to Mr. B on January 15. Mr. B withdraws the money on February 1. Also on February 1, Mr. C deposits 100 KSh into M- Pesa, and transfers it to Mr. D. on February 15. Mr. D withdraws the money on March 1. In this case, velocity is one transaction per month, and the length of the e-money loop is also one.
• Scenario 2: Mr. A deposits 100 KSh into M- Pesa on January 1. He transfers the money to Mr. B on January 15. Mr. B leaves the e-float on his phone until February 15, at which point he transfers it to Mr. C. The money is repeatedly transferred on the 15th of every month, and never withdrawn. In this case, velocity is one transfer per month while the length of the e-money loop is infinite.
As with velocity, we can put together available scraps of information to get an estimate of the length of the e-money loop. An audit of M- Pesa con-ducted by the Ministry of Finance in January 2009 says that “the system transacted about KShs 17 billion” in August 2008. What does this number
Fig. 7.10 Value of monthly transfers per customer
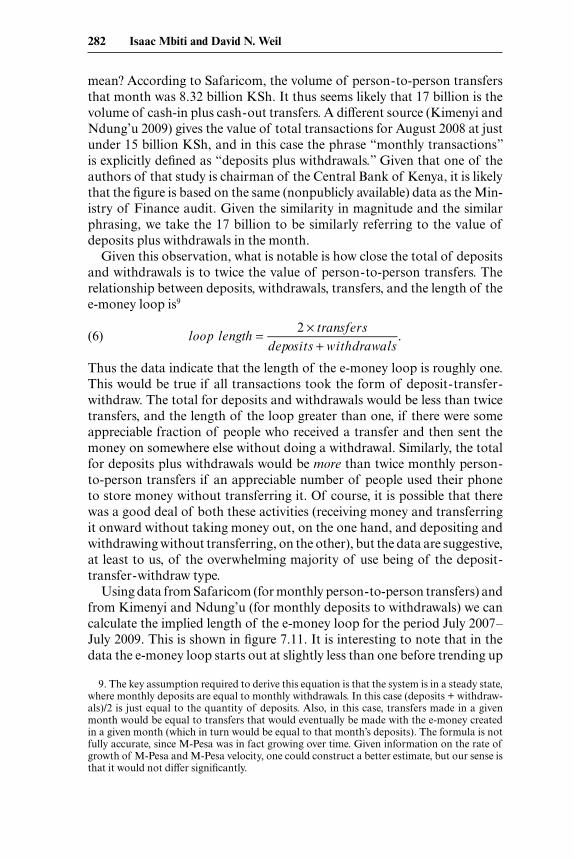
282 Isaac Mbiti and David N. Weil
mean? According to Safaricom, the volume of person- to-person transfers that month was 8.32 billion KSh. It thus seems likely that 17 billion is the volume of cash-in plus cash- out transfers. A different source (Kimenyi and Ndung’u 2009) gives the value of total transactions for August 2008 at just under 15 billion KSh, and in this case the phrase “monthly transactions” is explicitly defined as “deposits plus withdrawals.” Given that one of the authors of that study is chairman of the Central Bank of Kenya, it is likely that the figure is based on the same (nonpublicly available) data as the Min-istry of Finance audit. Given the similarity in magnitude and the similar phrasing, we take the 17 billion to be similarly referring to the value of deposits plus withdrawals in the month.
Given this observation, what is notable is how close the total of deposits and withdrawals is to twice the value of person- to-person transfers. The relationship between deposits, withdrawals, transfers, and the length of the e-money loop is9
(6) loop length = 2 × transfersdeposits + withdrawals
.
Thus the data indicate that the length of the e-money loop is roughly one. This would be true if all transactions took the form of deposit- transfer- withdraw. The total for deposits and withdrawals would be less than twice transfers, and the length of the loop greater than one, if there were some appreciable fraction of people who received a transfer and then sent the money on somewhere else without doing a withdrawal. Similarly, the total for deposits plus withdrawals would be more than twice monthly person- to-person transfers if an appreciable number of people used their phone to store money without transferring it. Of course, it is possible that there was a good deal of both these activities (receiving money and transferring it onward without taking money out, on the one hand, and depositing and withdrawing without transferring, on the other), but the data are suggestive, at least to us, of the overwhelming majority of use being of the deposit- transfer- withdraw type.
Using data from Safaricom (for monthly person- to-person transfers) and from Kimenyi and Ndung’u (for monthly deposits to withdrawals) we can calculate the implied length of the e-money loop for the period July 2007– July 2009. This is shown in figure 7.11. It is interesting to note that in the data the e-money loop starts out at slightly less than one before trending up
9. The key assumption required to derive this equation is that the system is in a steady state, where monthly deposits are equal to monthly withdrawals. In this case (deposits + withdraw-als)/ 2 is just equal to the quantity of deposits. Also, in this case, transfers made in a given month would be equal to transfers that would eventually be made with the e-money created in a given month (which in turn would be equal to that month’s deposits). The formula is not fully accurate, since M- Pesa was in fact growing over time. Given information on the rate of growth of M- Pesa and M- Pesa velocity, one could construct a better estimate, but our sense is that it would not differ significantly.
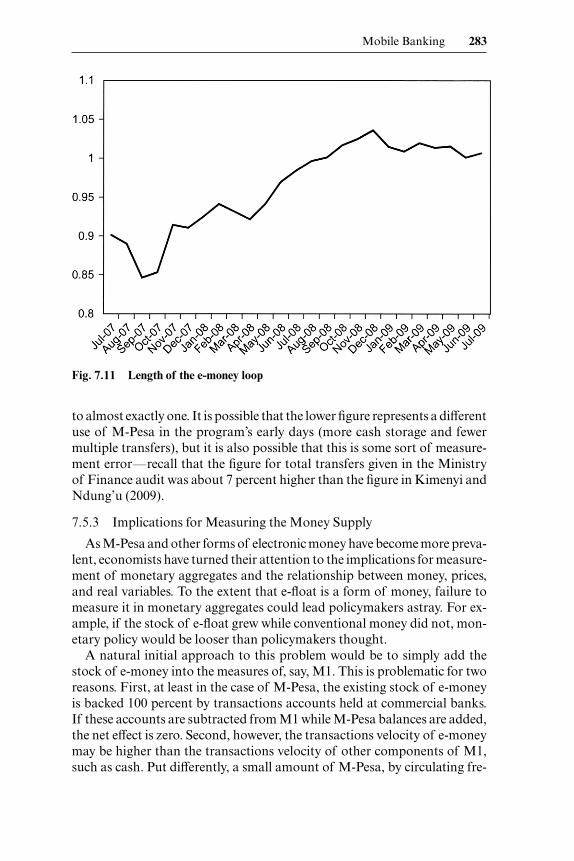
Mobile Banking 283
to almost exactly one. It is possible that the lower figure represents a different use of M- Pesa in the program’s early days (more cash storage and fewer multiple transfers), but it is also possible that this is some sort of measure-ment error—recall that the figure for total transfers given in the Ministry of Finance audit was about 7 percent higher than the figure in Kimenyi and Ndung’u (2009).
7.5.3 Implications for Measuring the Money Supply
As M- Pesa and other forms of electronic money have become more preva-lent, economists have turned their attention to the implications for measure-ment of monetary aggregates and the relationship between money, prices, and real variables. To the extent that e-float is a form of money, failure to measure it in monetary aggregates could lead policymakers astray. For ex-ample, if the stock of e-float grew while conventional money did not, mon-etary policy would be looser than policymakers thought.
A natural initial approach to this problem would be to simply add the stock of e-money into the measures of, say, M1. This is problematic for two reasons. First, at least in the case of M- Pesa, the existing stock of e-money is backed 100 percent by transactions accounts held at commercial banks. If these accounts are subtracted from M1 while M- Pesa balances are added, the net effect is zero. Second, however, the transactions velocity of e-money may be higher than the transactions velocity of other components of M1, such as cash. Put differently, a small amount of M- Pesa, by circulating fre-
Fig. 7.11 Length of the e-money loop

284 Isaac Mbiti and David N. Weil
quently, provides the same transaction (and transfer) services as a much larger quantity of cash.
If one had estimates of the transactions velocities of M- Pesa and the other components of a monetary aggregate, it would then be possible to create a velocity- weighted index, in which those components with higher velocity received a higher weight (see Spindt [1985] for a discussion). As shown above, getting a rough approximation of the velocity of M- Pesa is not difficult, and with better data one could get a truly precise estimate. Unfortunately, measuring the velocity of other monetary aggregates—a problem on which monetary economists have been working since the time of Jevons—is much harder.
For this reason, and also out of curiosity of how M- Pesa compares to other monies, we have pulled together the few estimates of transaction velocity. The estimates span a number of countries and historical eras and, therefore, pertain to a variety of institutional structures and transaction technologies. This may explain some of the vast variation in the data.
A common measure of the velocity of demand deposits is the “demand deposit turnover rate,” defined as the ratio of debits to demand deposits in a period to the average value of demand deposits. In the United States, between 1919 and 1941, the annual turnover rate on demand deposits at commercial banks varied between 19.4 and 53.6 (Board of Governors of the Federal Reserve System 1976). In more recent data, the turnover rate for banks, excluding major New York banks, rose from 135 to 475 per month over the period 1980– 1995 (US Census Bureau 1996). Engberg (1965) pre-sents data on demand deposit turnover in East Africa between 1950– 1963, over which period it rose from 4.1 to 9.9 per quarter. Using data from Cletus (2004), the demand deposit turnover rate in Gambia between 1983 and 1993 varied between two and eleven transactions per month. In Taiwan, in 2007, the annual turnover rate on demand deposits was 328 (Republic of China 2009). In Thailand, monthly demand deposit turnover in 2009 averaged forty- one.10
As far as currency goes, there are even fewer estimates of velocity. Irving Fisher’s calculations for the years around the beginning of the twentieth century in the United States found that transactions velocity of cash was in the neighborhood of twenty per year. Spindt (1985) applies a method sug-gested by Laurent (1970) to look at the velocity of circulation of currency. His estimate is that the velocity of currency in the United States ranged between seven and ten transactions per month over the period 1970– 1985. A study by the US Federal Reserve based on household surveys (Avery et al. 1986) estimated the velocity of currency in 1984 at between fifty and fifty- five transactions per year. Feige (1987) estimates the length of the cash
10. Bank of Thailand online data query. http:// www2.bot.or.th/ statistics/ ReportPage .aspx?reportID=31&language=eng.

Mobile Banking 285
loop in the Netherlands at approximately four transactions in data from the 1960s and 1970s.
A preliminary, conclusion from this exercise is that the transactions veloc-ity of M- Pesa (roughly four transactions per month) does not stand out as being much higher than that of other monetary components that are held by households, particularly cash. This is at least somewhat surprising, since technologically, it would be possible for M- Pesa to have enormous trans-actions velocity. In any case, for the present, even if a very large velocity adjustment were appropriate, M- Pesa does not compare with other parts of the monetary aggregate. The average over the period January– June 2008 of currency (M0) was 85.2 billion shillings, while currency plus demand deposits (M1) was 393 billion shillings (Central Bank of Kenya 2008). By contrast, our calculated value of outstanding e-float in August 2008 was 3.3 billion shillings.
7.6 Why Isn’t M- Pesa Used for Storing Value?
Much of the evidence presented in our chapter is strongly suggestive of the conclusion that M- Pesa is only rarely used for storing value for any sig-nificant period of time. This can be seen in the low value of average M- Pesa holdings at a point in time (700 KSh, or about ten dollars), the velocity of four transactions per month, and in the short length of the e-money loop. Although a significant fraction of users report that they use their M- Pesa accounts for storing money, such storage is of relatively small amounts of money or for relatively short periods of time.
Why don’t people store more value on M- Pesa? One possible reason is that it does not pay interest. If this is the case, then the implementation of M- Kesho or some other scheme to pay interest on transactions could lead to a significant change in behavior. To gather insight into this question, we could ask: At what interest rate would M- Pesa users store significant value on their accounts?
Part of the answer to this question can be gleaned by looking at behavior with respect to withdrawals. Although M- Pesa balances do not pay explicit interest, holding money in M- Pesa does yield interest in the form of reducing transaction costs. Consider the problem of an individual who receives peri-odic transfers into his M- Pesa account. One strategy would be to withdraw each transfer as it is received. An alternative would be to group two or more transfers together and withdraw them all at once. The latter strategy holds money on the M- Pesa account for longer, but involves lower costs.
A general analysis of alternative withdrawal strategies would be enor-mously complex, given the complexity of the price schedule as well as the stochastic nature and varying sizes of transfer receipt. Here, we examine an extremely simple version of the problem to get a feel for the magnitudes involved.

286 Isaac Mbiti and David N. Weil
Consider an individual who receives a transfer of 1,000 KSh on the first of every month. We will allow for only two strategies: first, she can take out the money each time she receives a transfer. Alternatively, she can wait until she has accumulated 2,000 (that is, every other month) and take the money out then. On the M- Pesa price schedule, the price of withdrawing 1,000 KSh is the same as the price of withdrawing 2,000 (i.e., 25 KSh).
Let W be the amount withdrawn, and C be the cost. The monthly interest rate r at which an individual would be indifferent between these two strate-gies is given implicitly by the equation
(7) W −C +W −C1+ r
= 2W −C1+ r
where the left- hand side is the present value of withdrawals net of costs using the first strategy and the right- hand side is the same thing using the second strategy. The solution is
(8) r = CW −C
.
For the example just given (W = 1,000; C = 25), the solution is r = 2.6 percent. On an annual basis this is 36 percent—certainly a high interest rate. Using a smaller value of the amount withdrawn, W, would yield a higher implicit interest rate, as would considering an individual who received transfers more frequently than every other month. For example, an individual who received and withdrew 500 KSh every two weeks—a scenario that seems like it might be consistent with what we see in the data—would be demonstrating a dis-count rate of at least 240 percent per year!
The information on the distribution of withdrawal sizes can also be brought to bear here. Although we do not solve the full- scale problem, it is clear that for moderate interest rates there should be a significant amount of bunching of withdrawals at the high end of price ranges—that is, just below the price notch. An individual who withdraws only a little more than the price notch (say, 3,000 KSh when the price notch is at 2,500 KSh) and who is going to be receiving another transfer in the next few months, is paying an enormous price to get his/ her money early. And yet the striking observation from our data on the distribution of withdrawal amounts is that there seems to be no bunching at all at the price- notch points. There are also, obviously, a very large number of withdrawals of amounts that are far lower than, say, half of the price notch.
Unfortunately, we do not have the data to be completely formal in this analysis. Above, we described the distribution of withdrawal sizes and the frequency of withdrawals, but we do not have these data at the individual level, and so we do not know their joint distribution. We know that most with-drawals are made by individuals who withdraw frequently (every month or more frequently), and that a good fraction of withdrawals are small enough (medians around 1,000 KSh) that two or more of them would fit under the

Mobile Banking 287
2,500 KSh price notch. We also know that there is not a very large mass of withdrawals at the price notch—at least no more than would be expected given the fact that price notches are at round numbers. From this data is seems reasonable to conclude that a significant fraction of withdrawals are made by people who are applying high time discount rates, since otherwise they would be grouping their withdrawals into more economical chunks.
We can extend this example further by considering the costs borne by the sender as well. Although we do not have data on senders, it is a reason-able supposition that in many cases a monthly withdrawal of 1,000 KSh is matched by a monthly transfer of the same amount. As discussed above, the fee for transfers of any size is 30 KSh. Thus there would be the possibility that a husband or son working in the city could transfer KSh 2,000 once every two months, instead of KSh 1,000 every month. The total cost of such a transfer and withdrawal of either 1,000 or 2,000 KSh is 55 KSh (30 KSh for transfer and 25 KSh for withdrawal). Plugging this cost figure into the equation above, the implicit interest rate at which a family would be indif-ferent between transferring 1,000 KSh every month and transferring 2,000 KSh every two months is thus 5.8 percent per month.
A final observation that suggests that users of M- Pesa have high financial discount rates comes from a discussion we had with an employee of Kenya Power and Light Corporation, the country’s electricity supplier. Electricity customers receive monthly bills, and must pay them within a fixed time win-dow or their power will be cut off. A bill- pay service was recently established, whereby M- Pesa users could pay their bills through their cell phones, rather than by directly visiting a KPLC office, post office, or bank, all of which involve waiting in a long line. Despite the superior convenience of M- Pesa, the take-up of the service was relatively low; only about 12 percent of the 1.2 million customers paid by M- Pesa, and we were curious as to why. The employee’s theory was that it had to do with the delay involved in paying with M- Pesa. The M- Pesa payments were batch processed overnight and thus required between twenty- four and forty- eight hours to clear, more time than paying in person where the payments were reflected instantly. Therefore the person paying the bill by M- Pesa would have to have the money one or two days earlier than otherwise. Evidently, this extra one or two days was, to most potential users, more valuable than the huge convenience of not having to pay the bill in person. In fact the KPLC employee stated that M- Pesa use for paying electric bills was actually declining due to this lag in processing. This is again suggestive of very high time discount rates.
It is important to note that the high financial discount rates that house-holds apply to cash that moves through M- Pesa do not necessarily imply that housholds highly discount the future consumption flows or utility. As in a standard Baumol- Tobin model of cash management, another reason to hold small cash balances is if there is a high cost of holding cash itself. Such a cost could be due to theft in a conventional sense, which can be viewed as a tax on cash balances. However, crime rates would have to be extremely
288 Isaac Mbiti and David N. Weil
high to justify the behavior we see. A more likely cost of holding cash is the high implicit tax represented by the ability of other family members to request either gifts or loans from one’s available cash balances. This is notion is supported by Ashraf (2009), who reports that women in Kenya often form secret saving societies to hide income from their husbands. Finally, and somewhat similarly, holdings of cash may simply raise temptations to spend that individuals find impossible to resist. The inability to save cash holdings has been shown to be a constraint to fertilizer adoption in western Kenya (Duflo, Kremer, and Robinson 2011) and promotes participation in ROSCAS that can act as a commitment saving device (Gugerty 2007). It could be that the extra transaction costs associated with holding small cash balances are a price worth paying to avoid giving in to these temptations.
These observations might be taken to suggest that the types of interest rates potentially offered through cell phone banking will do little to alter the amount of money that people store on their phones. However, recent litera-ture on the financial lives of the poor may suggest otherwise. Collins et al. (2009) find that the world’s poor utilize a vast range of financial instruments to meet different needs, and prioritize different qualities of these instruments based on how they use them. For instruments used to smooth day- to-day consumption, they find that it is most important to the poor that these keep their money secure and easily accessible, but pay little attention to the interest they might earn. However, when the poor seek to accumulate what Collins and colleagues refer to as “usefully large sums” to pay for life- cycle events (such as weddings or funerals) or other larger expenses, they do take into account the interest that different financial tools can offer them, along with their security, reliability, and structure (for example, requiring them to make periodic deposits to help ensure that they will succeed in building up a larger sum of money). Based on this, we might say that M- Pesa has found a niche in the former realm of day- to-day cash management, but not as much in the accumulation of larger sums. The introduction of a program encouraging saving and offering interest might allow mobile banking to find an additional niche as a simple and secure financial tool for the accumulation of usefully large sums. One survey found that 38 percent of respondents said that the feature they would most like to see added to M- Pesa was the ability to earn interest on their accounts, making this the most popular response (Jack, Pulver, and Suri 2009). This suggests that interest will be an attractive feature of M- Kesho. (As discussed above, M- Kesho will also offer insurance and microloans, which may also be attractive features.)
7.7 Conclusion
In this chapter we have examined M- Pesa from a number of different perspectives. Using firm- level data from competing money transfer services we find that the introduction of M- Pesa has led to significant decreases in
Mobile Banking 289
the prices of competitors. In addition, we examine microlevel data from the FinAccess surveys, where we find that frequent M- Pesa users are more likely to be urban, educated, banked, and affluent. Our analysis of the 2006 and 2009 rounds of the FinAccess surveys reveal that M- Pesa use increases frequency of sending transfers, decreases the use of informal saving mecha-nisms such as ROSCAS, and increases the probability of being banked. This suggests that M- Pesa is complementary to banks, whereby the adoption of M- Pesa has increased the demand for banking products.
Although a significant number of survey respondents indicate that they use their M- Pesa accounts as a vehicle for saving, our analysis of aggregate data suggests that the overwhelming use of M- Pesa is for transferring money from individual to individual, with extremely little storage of value. This can be seen in many ways. Our estimates of M- Pesa velocity, the number of transactions per month for the typical unit of e-float, is roughly four transactions per month, depending on some auxiliary assumptions. We also estimate the length of the “e- money loop,” that is, the average number of person- to-person transactions that take place between the creation and destruction of a unit of e-float. Our estimate is quite near one. Although we cannot be certain, we take this as evidence that the vast majority of M- Pesa use is of the form of a cash deposit, followed by a single person- to-person transfer of e-float, followed by a cash withdrawal.
Our analysis of data on the size and frequency of M- Pesa withdrawals also suggests that M- Pesa users have relatively high opportunity costs of holding funds on their phones. For example, there seems to be little evidence of users bunching several transfer receipts together into a single withdrawal in order to economize on fees. This suggests that even if M- Pesa were to pay interest at the same rate as banks, there would not be a significant change in the saving behavior of users.
Data Appendix
FinAccess Surveys
The FinAccess surveys, conducted in 2006 and 2009, are nationally repre-sentative household surveys that were designed to measure financial access in Kenya. The surveys were collected by Financial Sector Deepening Trust Kenya (FSD Kenya), with financial and technical support from a variety of partners including the Central Bank of Kenya, donors, and a number of commercial banks in Kenya.The 2006 round consisted of approximately 4,400 individuals, while the 2009 round consisted of close to 6,600 individu-als. A unique feature of this data is that it aimed to capture access to a wide range of both formal and informal financial tools. Moreover, the consis-
290 Isaac Mbiti and David N. Weil
tency of the surveys enable reliable comparisons across time of the changing nature of financial access. Using sampling weights we can aggregate the data to the sublocation level. Sublocations are the lowest administrative unit in Kenya and consist of two to three villages in rural areas or a large neigh-borhood in a city. We combine the 2006 and 2009 FinAccess surveys and create a balanced panel of the 190 sublocations that were surveyed in both rounds.
We constructed the measure of transfer frequency as follows. We con- verted the categorical responses into annual numerical values as follows: Daily = 365 times a year, weekly = fifty- two times a year, monthly = twelve times a year, irregularly/ once in a while = once a year. We then used these conversion factors to change categorical responses on transfer sent and received frequencies, as well as M- Pesa use frequencies, into annualized numerical values. Our wealth measure is constructed by using principal component analysis on the household assets and durable goods such as televisions and refrigerators. We then create wealth quantile dummies based on the principal component analysis.
Transfer Prices
Kabbucho, Sander, and Mukwana (2003) document the prices of various money transfer methods. We use their data from 2003 as the baseline and compare it to current (2010) prices of Moneygram and Western Union. The Moneygram fee schedule is documented online, while the Western Union rates were collected in person by research staff. These fees are converted into a database that contains prices for a series of transfer amounts in 100 KShs intervals. This allows us to compare the prices across comparable set of prices.
M- Pesa Transaction Data
We collect M- Pesa transaction data from an agent in Kisumu. These data contained transaction type and transaction amount over a three- month period in 2010 for three M- Pesa shops. Katito is in a rural area, Homa Bay is in a small town, and Cyber is in an urban environment. Further details of these stores can be obtained from Eijkman, Kendall, and Mas (2010).
References
Aghion, Philippe, and Peter Howitt. 1992. “A Model of Growth through Creative Destruction.” Econometrica 60 (2): 323– 51.

Mobile Banking 291
Aker, Jenny C. 2010. “Information from Markets Near and Far: The Impact of Mobile Phones on Agricultural Markets in Niger.” American Economic Journal: Applied Economics 2 (July): 46– 59.
Aker, Jenny, and Isaac Mbiti. 2010. “Mobile Phones and Economic Development in Africa.” Journal of Economic Perspectives 24 (3): 207– 32.
Ashraf, Nava. 2009. “Spousal Control and Intra- Household Decision Making: An Experimental Study in the Philippines.” American Economic Review 99 (4): 1245– 77.
Avery, Robert B., Gregory E. Elliehausen, Arthur B. Kennickell, and Paul A. Spindt. 1986. “The Use of Cash and Transaction Accounts by American Families.” Fed-eral Reserve Bulletin February:87– 108.
Beck, Thorsten, Asli Demirgüç- Kunt, and Soledad Martinez Peria. 2007. “Reach-ing Out: Access to and Use of Banking Services across Countries.” Journal of Financial Economics 85 (1): 234– 66.
Board of Governors of the Federal Reserve System. 1976. “Banking and Monetary Statistics 1941– 1970.” Section 5, Table 55, September. http:// fraser.stlouisfed .org / publications/ bms2/ issue/ 60/ download/ 106/ section5 .pdf.
Bower, Joseph L., and Clayton M. Christensen. 1995. “Disruptive Technologies: Catching the Wave.” Harvard Business Review January– February. https:// hbr .org / 1995/ 01/ disruptive- technologies- catching- the- wave/ ar/ 1.
Burgess, Robin, and Rohini Pande. 2005. “Do Rural Banks Matter? Evidence from the Indian Social Banking Experiment.” American Economic Review 95 (3): 780– 95.
Central Bank of Kenya. 2008. “Statistical Bulletin, June 2008.” http:// www2.central bank.go.ke/ downloads/ statistics/ bulletin/ Junsb08 .pdf.
Cletus, Agu. 2004. “Efficiency of Commerical Banking in the Gambia.” African Review of Money Finance and Banking 2004:31– 50.
Collins, Daryl, Jonathan Morduch, Stuart Rutherford, and Orlanda Ruthven. 2009. Portfolios of the Poor: How the World’s Poor Live on $2 a Day. Princeton, NJ: Princeton University Press.
Duflo, Esther, Michael Kremer, and Jonathan Robinson. 2011. “Nudging Farmers to Use Fertilizer: Theory and Experimental Evidence from Kenya.” American Economic Review 101 (6): 2350– 90.
Eijkman, Frederik, Jake Kendall, and Ignacio Mas. 2010. “Bridges to Cash: The Retail End of M- PESA.” Savings and Development 34 (2). 219– 52.
Engberg, Holger L. 1965. “Commercial Banking in East Africa, 1950– 1963.” Journal of Modern African Studies 3 (2): 175– 200.
Feige, Edgard L. 1987. “The Theory and Measurement of Cash Payments: A Case Study of the Netherlands.” In The Practice of Econometrics: Studies on Demand, Forcasting, Money and Income International Studies in Economics and Economet-rics, vol. 15, edited by R. D. H. Heijmans and N. Neudecker. Dordrecht, the Netherlands: Kluwer Academic Publishers.
FinMark Trust. 2008. Finscope In Africa, 2008. http:// www .finscope.co.za/ documents / 2008/ FSAfricaBrochure08 .pdf.
Gikunju, Washington. 2009. “Mobile Money Transfers Edge out Rival Operators.” Business Daily, September 14. http:// www .businessdailyafrica .com/ - / 539552/ 657466 / - / view/ printVersion/ - / 2gufmtz/ - / index .html.
Gugerty, Mary Kay. 2007. “You Can’t Save Alone: Commitment and Rotating Sav-ings and Credit Associations in Kenya.” Economic Development and Cultural Change 55:251– 82.
Jack, William, Caroline Pulver, and Tavneet Suri. 2009. “The Performance and Impact of M- Pesa: Preliminary Evidence from a Household Survey.” Power Point

292 Isaac Mbiti and David N. Weil
presentation. http:// technology.cgap .org/ technologyblog/ wp- content/ uploads / 2009/ 10/ fsd_june2009_caroline_pulver .pdf.
Jack, William, and Tavneet Suri. 2010. “The Risk Sharing Benefits of Mobile Money.” Working Paper, MIT.
———. 2011. “Mobile Money: The Economics of M- Pesa.” NBER Working Paper no. 16721, Cambridge, MA.
Jensen, Robert T. 2007. “The Digital Provide: Information (Technology), Market Performance and Welfare in the South Indian Fisheries Sector.” Quarterly Journal of Economics 122 (3): 879−924.
Kabbucho, Kamau, Cerstin Sander, and Peter Mukwana. 2003. “Passing the Buck—Money Transfer Systems: The Practice and Potential for Products in Kenya.” MicroSave Africa Report. http:// microfinancegateway .org/ content/ article/ detail / 19594?PHPSESSID=332fab3a7849fc635883a38e113c62da.
Kimenyi, Mwangi S., and Njuguna S. Ndung’u. 2009. “Expanding the Financial Services Frontier: Lessons from Mobile Phone Banking in Kenya.” Brookings Institution, October 16. http:// www .brookings .edu/ articles/ 2009/ 1016_mobile _phone_kimenyi .aspx.
Laurent, Robert D. 1970. “Currency Transfers by Denomination.” PhD diss., Uni-versity of Chicago.
Mas, Ignacio, and Olga Morawczynski. 2009. “Designing Mobile Transfer Services: Lessons from M- Pesa.” Innovations 2009 (Spring): 77– 91.
Mas, Ignacio, and Amolo Ng’weno. 2009. “Three Keys to M- Pesa’s Success: Brand-ing, Channel Management and Pricing.” Unpublished Manuscript, Bill and Melinda Gates Foundation, December.
Ministry of Finance of Kenya. 2009. “Ministry of Finance Audit Findings on M- Pesa Money Transfer Services.” January 26. http:// kenyapolitical.blogspot .com/ 2009/ 01/ ministry- of-finance- audit- findings- on- m .html.
Morawczynski, Olga. 2009. “Exploring the Usage and Impact of ‘Transformational’ Mobile Financial Services: The Case of M- PESA in Kenya.” Journal of Eastern African Studies 3 (3): 509– 25.
Morawczynski, Olga, and Mark Pickens. 2009. “Poor People Using Mobile Finan-cial Services: Observations on Customer Usage and Impact from M- PESA.” CGAP Brief Online. http:// www .cgap .org/ gm/ document- 1.9.36723/ BR_Poor _People_Using_Mobile_Financial_Services .pdf.
Njiraini, John, and James Anyanzwa. 2008. “Unmasking the Storm Behing M- Pesa.” East African Standard, December. http:// www .standardmedia.co.ke/ business / article/ 1144002826/ unmasking- the- storm- behind- m- pesa?articleID=114400 2826&story_title=unmasking- the- storm- behind- m- pesa&pageNo=2.
Pickens, Mark, David Porteous, and Sarah Rotman. 2009. “Scenarios for Branch-less Banking in 2020.” Focus Note no. 57, Consultative Group to Assist the Poor (CGAP), Washington, DC.
Plyler, Megan, Sherri Hass, and Geetha Nagarajan. 2010. “Community- Level Economic Effects of M- PESA in Kenya: Initial Findings.” IRIS Center Report, University of Maryland. http:// www .fsassessment.umd .edu/ publications/ pdfs / Community- Effects- MPESA- Kenya .pdf.
Republic of China. 2009. “Monthly Bulletin of Statistics.” August. http:// eng.dgbas .gov.tw/ public/ data/ dgbas03/ bs7/ bulletin_eng/ PDF/ eng- month9808 .pdf.
Safaricom. 2007. “M- Pesa Update.” Press Release, December 7.———. 2009. “Industry Update, March 12. http:// www .safaricom.co.ke/ fileadmin
/ template/ main/ downloads/ investor_relations_pdf/ Industry%20Update%20120309 .pdf.

Mobile Banking 293
Schumpeter, Joseph A. 1942. Capitalism, Socialism, and Democracy. New York: Harper and Brothers.
Slemrod, Joel. 2010. “Buenos Notches: Lines and Notches in Tax System Design.” Unpublished Manuscript, University of Michigan.
Spindt, Paul A. 1985. “Money Is What Money Does: Monetary Aggregation and the Equation of Exchange.” Journal of Political Economy 93 (1): 175– 204.
US Census Bureau. 1996. “Statistical Abstract, 1996, Section 16, Banking, Finance, and Insurance.” http:// www .census .gov/ prod/ 2/ gen/ 96statab/ finance .pdf.
Vaughan, Pauline. 2007. “Early Lessons from the Deployment of M- PESA, Voda-phones’s Own Mobile Transactions Service.” In The Transformational Potential of M- Transactions, Vodaphone Policy Paper Series no.6. http:// www .vodaphone .com/ m- transactions.
Weil, David N., Isaac Mbiti, and Francis Mwega. 2012. “The Implications of Innova-tion in the Financial Sector on the Conduct of Monetary Policy in East Africa.” Report submitted to the Interanational Growth Centre Tanzania Country Pro-gramme.