afghanistan national health accounts with disease … · summary of findings in comparison with...
TRANSCRIPT

Islamic Republic of Afghanistan
Ministry of Public Health
Afghanistan National Health Accounts
$1.99bn
Out of Pocket
1.43bn (72%)
Rest of the World
0.46bn (23%)
Government
0.10bn (5%)
SHA.2011
with Disease Accounts, 2014

Afghanistan National Health Accounts
with Disease Accounts, 2014

ii | P a g e
Table of Contents
Acronyms ............................................................................................................................................... v
Acknowledgments ............................................................................................................................... vii
General NHA Findings ............................................................................................................ 1
Disease Accounts Findings ...................................................................................................... 1
Key Highlights ........................................................................................................................ 2
1. Background ................................................................................................................................... 3
1.1. Health and Socioeconomic Status ................................................................................................ 3
1.2. Healthcare System ....................................................................................................................... 3
1.3. NHA Concept and Application .................................................................................................... 4
1.4. History of NHA in Afghanistan ................................................................................................... 4
1.5. Scope of the Third NHA Study .................................................................................................... 4
1.6. Policy Objective of the Third Round of NHA ............................................................................. 4
1.7. Organization of the Report ........................................................................................................... 5
2. Methodologies and Data Collection ............................................................................................. 6
2.1. Overview of Approach ................................................................................................................. 6
2.2. System of Health Accounts (SHA 2011) ..................................................................................... 6
2.3. Data Collection ............................................................................................................................ 7
2.4. Methods and Assumptions ........................................................................................................... 8
2.5. Limitations ................................................................................................................................... 9
3. General NHA Findings ................................................................................................................... 10
3.1. Summary of Findings in Comparison with Previous Rounds .................................................... 10
3.2. International Comparison of NHA ............................................................................................. 12
3.3. Expenditure by Financing Schemes ........................................................................................... 13
3.4. Expenditure by Financing Agents .............................................................................................. 16
3.5. Expenditure by Healthcare Providers ........................................................................................ 17
3.6. Expenditure by Healthcare Functions ........................................................................................ 18

iii | P a g e
3.7. Expenditure on Capital Formation ............................................................................................. 19
4. Disease Accounts Findings ......................................................................................................... 20
4.1. Disease Expenditure by Financing Sources ............................................................................... 21
4.2. Disease Expenditure by Provider ............................................................................................... 23
5. Conclusions and Recommendations .......................................................................................... 25
5.1. Conclusions ................................................................................................................................ 25
5.2. Recommendations ...................................................................................................................... 25
Institutionalization of NHA ................................................................................................................ 28
Annex A. National Health Accounts Tables, extracted from the NHA Production Tool ................. 29
Table A.1: Revenues of Healthcare Financing Schemes, by Financing Sources, FS x HF .............. 29
Table A.2: Financing Scheme, by Function, HC x HF ..................................................................... 31
Table A.3: Financing Scheme, by Healthcare Providers, HP x HF .................................................. 36
Table A.4: Healthcare Provider, by Function, HC x HP ................................................................... 38
Table A.5: Financing Agent, by Financing Sources, HF x FA ......................................................... 46
Table A.6: Financing Sources, by Diseases, FS X DIS .................................................................... 47
Table A.7: Capital Expenditure, by Provider, HK x HP ................................................................... 49
Annex B: Classification of Health Expenditure / NHA Glossary ................................................... 50
Glossary ............................................................................................................................................... 51
References ............................................................................................................................................ 52

iv | P a g e
List of Tables: Table 1: Summary of NHA Findings, 1st, 2nd, and 3rd Rounds .......................................................... 11
Table 2: Breakdown of Revenue of Healthcare Financing as Percentage of CHE ............................... 13
Table 3: Breakdown of Household Out-of-Pocket Expenditure ........................................................... 14
Table 4: Breakdown of Expenditure, by Public Financing Source ....................................................... 15
Table 5: Breakdown of Expenditure, Healthcare Providers .................................................................. 17
Table 6: Breakdown of Expenditure, by Functions .............................................................................. 18
Table 7: Breakdown of Capital Formation ........................................................................................... 19
Table 8: Breakdown of Disease, by Disease Category and Expenditure .............................................. 20
List of Figures Figure 1: Comparison of Total Health Expenditure (USD) Across Three Rounds of the NHA ........... 10
Figure 2: International Comparison of THE as a Percentage of GDP, 2014 ........................................ 12
Figure 3: Private Health Expenditure as a Percentage of THE, 2014 ................................................... 13
Figure 4: Breakdown of Financing Source ........................................................................................... 14
Figure 5: Composition of Household OOP Expenditure ...................................................................... 15
Figure 6: Breakdown of Public Financing Source ................................................................................ 16
Figure 7: Financing Agents Managing Healthcare Service Funds ........................................................ 17
Figure 8: Breakdown of Healthcare Providers ...................................................................................... 18
Figure 9: Breakdown of Healthcare Functions ..................................................................................... 19
Figure 10 : Breakdown of Disease Categories ...................................................................................... 21
v | P a g e
Acronyms
AFN
Afghanis
AHS Afghanistan Health Survey
AMIS ARI ARCS
Afghanistan Financial Management Information System Acute Respiratory Infection Afghan Red Crescent Society
ATM BPHS
HIV/AIDS, Tuberculosis, and Malaria Basic Package of Health Services
CH CHE CIDA CSO EMIS EPHS
Child Health Current Health Expenditure Canadian International Development Agency Central Statistics Organization Expenditure Management Information System Essential Package of Hospital Services
EU FA
European Union Financing Agent
GAVI The Global Alliance for Vaccines and Immunization GCMU Grants and Contracts Management Unit GDP GIRoA
Gross Domestic Product Government of the Islamic Republic of Afghanistan
HEFD HH ICD
Health Economics and Financing Directorate Household International Classification of Diseases
ICRC IEC
International Committee of the Red Cross Information, Education, and Communication
IFRC International Federation of Red Cross and Red Crescent Societies IOM IPD ISAF
International Organization for Migration Inpatient Department International Security Assistance Force
JICA Japan International Cooperation Agency
MoD Ministry of Defense

vi | P a g e
MoE Ministry of Education
MoF Ministry of Finance
MoHE Ministry of Higher Education
MoI Ministry of the Interior
MoPH Ministry of Public Health
NGO Nongovernmental Organization NHA NPISH
National Health Accounts Non-Profit Institutions Serving Households
NRVA NDS
National Risk and Vulnerability Assessment National Directorate of Security
OECD Organization for Economic Cooperation and Development
OOP OPD RH SBA SHA
Out of Pocket Outpatient Department Reproductive Health Skilled Birth Attendant System of Health Accounts
TB THE
Tuberculosis Total Health Expenditure
TIKA Turkish International Cooperation and Development Agency UN United Nations
UNFPA United Nations Population Fund
UNICEF United Nations Children's Fund
UNODC United Nations Office on Drugs and Crime
USAID USD
United States Agency for International Development U.S. Dollar
WFP World Food Programme
WHO
World Health Organization


1 | P a g e
Executive Summary
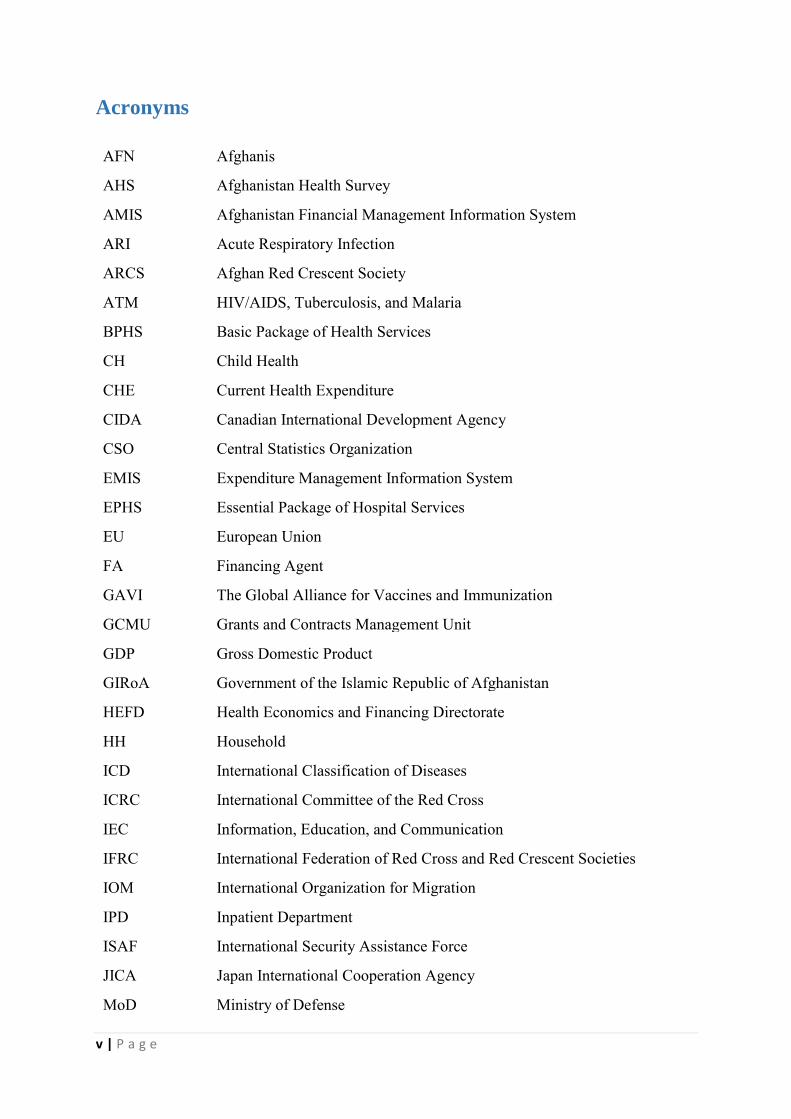
The Afghanistan National Health Accounts (NHA) study was undertaken to track the flow of funds in the health sector for 2014 and compare this round of findings with those of the NHA’s previous two rounds. NHA is an important tool for understanding the health financing of a country and provides a framework for measuring the total expenditure on health, including private households’ out-of-pocket (OOP) expenditures, government expenditure, and donors’ expenditures.
General NHA Findings
In 2014, Afghanistan’s total gross domestic product (GDP) was about 21 billion in U.S. dollars
(USD), which shows an increase in economic growth compared with previous years.
Total health expenditure (THE) in 2014 was about USD 1,992 million, an increase of approximately 32% compared to the previous round; government expenditure on health was around USD 97 million. THE as a percentage of GDP was about 9.5%, an increase of 1.5% compared to the previous round, but current health expenditure (CHE) as a percentage of GDP was about 9.3%. This round of NHA used the System of Health Accounts (SHA) 2011; thus, it separated expenditure on capital from the figure for CHE, which is approximately USD 1,958
million.
Approximately 72% of THE was paid by households out of pocket; about 5% was financed by the government of Afghanistan and about 23% by international partners.
The government of Afghanistan manages some of the funds provided by the donors, estimated at around 12.4% of CHE, whereas the donors themselves managed the balance of donor funding (15.5%). However, individual households managed and expended the amount spent OOP.
A significant proportion of expenditure was incurred for the delivery of services by hospitals (39.8%); the second highest share was for outpatient care providers (26.4%), followed by retailers and other providers of medical goods (24.5%).
Disease Accounts Findings
Expenditure by disease was reported as per the classification of diseases in SHA 2011, which considers the most common diseases and issues in the country: infectious and parasitic infectious diseases (HIV/AIDS, tuberculosis [TB], and malaria [ATM]); reproductive health (RH) issues (maternal conditions, perinatal conditions, family planning, skilled birth attendance); and child health (CH) issues (acute respiratory infections, diarrheal diseases, malnutrition, anemia).
CH consumed the highest percentage of expenditure among these disease categories, estimated at 25.2% of CHE, followed by RH (17.1%), parasitic infectious diseases (2.2%), and immunization (3.1%); the remaining 52.4% of CHE was spent for other diseases not classified in this round of the NHA. These findings indicate room for improvement in the disease accounts, particularly the inclusion of other diseases in future rounds of NHA reports.

2 | P a g e
Key Highlights
The NHA study estimated THE and CHE in this round of NHA at USD 1,992 million and USD 1,958 million, respectively; CHE excludes capital expenditure from THE.
Total Health expenditure as a percentage of GDP was estimated at 9.5%. Public sector financing accounted for 12.4% of THE, including some donors’ funds
transferred or channeled through the government. The government’s financing for healthcare from government revenue constituted 5%
of CHE. Donors’ expenditures accounted for 22.9% of CHE for 2014. Household OOP expenditures on health totaled approximately USD 1,430 million,
equivalent to 73.1% of CHE. Pharmaceuticals accounted for 24.5% of CHE. Hospitals accounted for the largest amount of expenditure at 39.7% of CHE; outpatient
care centers accounted for 26.4%. The study estimated per capita expenditure on health at about USD 70.9 in 2014,
whereas in 2008/2009 and 2011/2012 it was USD 42 and USD 56, respectively. This finding shows an increase of USD 15 per capita compared to the second round.

3 | P a g e
1. Background
1.1. Health and Socioeconomic Status Located in Central Asia, Afghanistan has a total population of approximately 28.1 million. It is a landlocked country with many harsh geographical features. Afghanistan consists of many ethnic, religious, and language groups. Almost two-thirds (73.1%) of its population live in rural areas, about one-third (23.1%) live in urban areas, and the remainder (5.3%) live as nomads. About 49% of the Afghan population is female; 51% is male. Rapid urbanization has become a major challenge in Afghanistan, as many people frequently migrate from rural areas to the cities. Regarding the age population pyramid, approximately 46.2% of the population is under 15 years of age; only 2.7% of its population is age 65 and over. Life expectancy at birth is approximately 63 years for men and 64 years for women (Central Statistical Organization, 2014). As for Afghanistan’s economics status, in 2014 the gross domestic product (GDP) was approximately U.S. dollars (USD) 21 billion, and GDP per capita was approximately USD 747―a decline of USD 25 compared to the previous year. The main reason for this decline was reported as due to a high inflation rate and the devaluation the Afghani (AFN) against the USD (Central Statistical Organization, 2014).
1.2. Healthcare System
Afghanistan’s health system and service delivery has improved significantly since 2002. The Ministry of Public Health (MoPH) has introduced health policies and strategies to strengthen the health system and improve service delivery. The Government of the Islamic Republic of Afghanistan (GIRoA), with financial and technical support from donors, introduced the Basic Package of Health Services (BPHS) in 2003. The main purpose of the BPHS is to deliver preventive and basic healthcare services that address the priority health needs of Afghanistan’s citizens, with a special focus on rural areas (MoPH, 2010). To complement the BPHS, the MoPH introduced the Essential Package of Hospital Services (EPHS) in 2005. The EPHS provides diagnostic and secondary treatment services through provincial and regional hospitals. Each provincial hospital works as a referral point for BPHS facilities. Primary and secondary healthcare services are provided through the BPHS and EPHS; tertiary healthcare is provided in Kabul’s national hospitals.
The BPHS and EPHS are implemented by nongovernmental organizations (NGOs) in 31 provinces through a contracting-out mechanism. In the three remaining provinces, the MoPH delivers these services through a contracting-in mechanism called the Strengthening Mechanism (SM). The MoPH also manages the national hospitals.
Improving the overall health status of Afghanistan’s people―especially women and children―is one of the priorities of the MoPH. The MoPH’s National Health Policy 2015–
2020 and National Health Strategy 2016–2020 (MoPH, 2015, 2016) specifically highlight increasing access to high-quality health services, improving health service delivery, and creating sustainable health financing for attaining universal health coverage.
Understanding the performance in the management and use of funds for health enables the MoPH to allocate and spend its budgeted funds efficiently and advocate for more financing to achieve universal health coverage. Conducting National Health Accounts (NHA) regularly

4 | P a g e
using international standards thus is highly recommended for tracking the resources used to cover the country’s health expenditures.
1.3. NHA Concept and Application
The NHA framework measures current health expenditure (CHE) in a given country’s health system, including public, private, and donor spending. It tracks resources from their origin or source through the financing agents (FAs) who manage the funds to healthcare providers and health functions. In the System of Health Accounts (SHA) 2011 approach, diseases are also identified and disease accounts rather than sub-accounts used, based on the International Classification of Disease (ICD-10) (OECD, 2011). Such a disease-specific classification of health expenditures provides decision makers with the policy implications for different stakeholders.
NHA tools focus on analysis of health financing and funding to incorporate macroeconomic trends among the institutions and organizations that constitute the health system. The results of the NHA approach also have had a significant impact on health financing flows and informing the process of health policy development in a particular country.
1.4. History of NHA in Afghanistan
Afghanistan is one of the countries that produces NHA reports according to the standards of Organization for Economic Cooperation and Development (OECD) and World Health Organization (WHO) tools and frameworks. NHA findings have strongly influenced the policy-making process of the MoPH. The results of the first round of NHA, produced in 2011, stimulated discussion around the reported high out-of-pocket (OOP) expenditure in the country. Similarly, the second round of NHA in 2013 indicated no significant reduction in the share of OOP spending since the first round and made policy recommendations on the potential approaches to reducing such expenditure.
1.5. Scope of the Third NHA Study
The scope of the study was wider in this round, although it aimed at the same purpose as previous rounds. In addition to providing general health expenditure information, it used the NHA and disease accounts methodology to produce expenditure information on selected health sector priorities: RH (antenatal/postnatal care, skilled birth attendance, and family planning); CH (acute respiratory infections, diarrhea, malnutrition, anemia, and immunization); and infectious and parasitic diseases (HIV/AIDS, tuberculosis [TB], and malaria [ATM]).
In the 2011/2012 round, NHA sub-accounts were included only for reproductive health (RH). However, this report for the first time includes disease and services accounts for CH and ATM. To contribute to better programming, more detailed information on disease accounts is preferred; hence, the MoPH intends to include more disease accounts in future rounds.
1.6. Policy Objective of the Third Round of NHA
Building on the same objectives as those of the NHA report for 2011/2012, more objectives were added following the newly published SHA 2011, as follows:

5 | P a g e
To monitor CHE trends and provide a basis for the projection of future health financing needs
To sustain capacity for the production and dissemination of NHAs in future years To motivate an evidence-based change in the public health budgeting process at both
the central and provincial levels To identify disease expenditure by financing source, financing agent, and provider To enable the MoPH and other stakeholders to make decisions based on available
information about the most common diseases in the country To compare expenditure by treatment of disease with expenditure by prevention
services
1.7. Organization of the Report
This report is organized into five sections: Section 1 provides background, objectives, and scope; Section 2 describes the methodology of the study and data collection; Section 3 contains general NHA findings; Section 4 provides disease accounts findings; and Section 5 lays out conclusions and recommendations. All imported tables with disaggregated data can be found in the annexes.

6 | P a g e
2. Methodologies and Data Collection
2.1. Overview of Approach
The 2014 Afghanistan NHA was conducted in accordance with the SHA 2011 of the OECD and WHO’s Guide to Producing National Health Accounts, with Special Applications for Low-
and Middle-Income Countries (WHO, 2003). The collected data were analyzed using the NHA production tool (V.4000). As based on the SHA 2011, the current round of NHA follows the six dimensions listed below (OECD, 2011):
Financing schemes (HF): Components of a country’s health financing system that channel revenues received and use them to pay directly for or purchase goods and services inside health account boundaries
Financing sources (FS): Revenues for health financing schemes received or collected through specific contribution mechanisms
Financing agents (FA): Institutional units that manage health financing schemes Functions (HC): Types of goods and services provided and activities performed within
health accounts boundaries Providers (HP): Entities that receive money in exchange for or in anticipation of
producing activities inside health account boundaries Capital formation (HK): Types of assets that health providers have acquired during the
accounting period and used repeatedly or continuously for more than one year in the production of health services
2.2. System of Health Accounts (SHA 2011)
Healthcare systems around the globe are developing rapidly. The factors driving these changes are innovations in healthcare interventions, pharmaceuticals, and medical technologies; increased demands for healthcare services; and the prevalence and incidence of diseases. As a result, the cost of healthcare has increasingly become a pressing subject of interest to policymakers, analysts, and the general public. This interest in turn fosters increased expectations for more detailed and sophisticated information that can be gained from the greater volume of health expenditure data now available.
With this increased interest in healthcare financing, OECD, the European Union (EU), and WHO produced the SHA 2011. Although built on the SHA1.0, the SHA 2011 addresses the following issues in more detail:
SHA 2011 has developed a healthcare financing interface to allow for a systematic assessment of how finances are mobilized, managed, and used, including financing arrangements (financing schemes), institutional units (financing agents), and revenue-raising mechanisms (revenues for financing schemes).
SHA 2011 has probed into the cost structures of healthcare provision and provided a separate treatment of capital formation to avoid some past ambiguity regarding the links between current health spending and capital expenditure in healthcare systems.
SHA 2011 has improved the study and further analysis of the functional dimension of healthcare.

7 | P a g e
SHA 2011 has improved the breakdown of healthcare expenditure by beneficiary characteristics, such as disease, age, gender, region, and socioeconomic status.
In its effort to apply these improvements in the classification of the NHA, Afghanistan produced its third round of NHA using SHA 2011 while considering country context and the availability of detailed data.
2.3. Data Collection
For this round, the MoPH NHA team collected relevant expenditure data from development partners, NGOs, the Ministry of Finance (MoF), other relevant ministries, nonprofit institution service households, and household surveys.
The team used SHA 2011 tools for the collection, analysis, and classification of the country’s 2014 health expenditure. To identify the household portion of the total health expenditure (THE), we included selected questions from the Afghanistan Household Survey (AHS) 2015. It provided us information on general OOP spending by households during 2014 and on specific expenditures on pharmaceuticals, diagnostics, transportation, and food, broken down by selected disease.
Development Partner Surveys
The MoPH NHA team collected data from all development partners, including bilateral and multilateral organizations and United Nations (UN) agencies, through structured questionnaires. We used the MoPH International Relations Department (IRD) database to collect information on organizations, contacts, and addresses. We identified 37 international partners (donors) and requested that they provide data regarding their 2014 health expenditures.
NGO Surveys
The MoPH is implementing two important packages of health services—the BPHS and EPHS, which cover primary and secondary healthcare services, respectively. The MoPH NHA team obtained from the Grants and Contracts Management Unit (GCMU) of the MoPH an extensive list of NGOs working in the health sector and implementing these packages and other vertical programs. These NGOs act as public providers, agencies, and financial sources for health expenditures. During an orientation workshop, we instructed representatives from implementing NGOs regarding the data required for the NHA and how to fill out the questionnaire. Following the orientation, NGOs completed survey questionnaires and returned them to the MoPH.
Ministries Survey
The MoPH and four other ministries provide healthcare services to the people of Afghanistan—the Ministry of Defense (MoD), Ministry of Interior Affairs (MoI), Ministry of Higher Education (MoHE), Ministry of Education (MoE), as does the National Directorate of Security (NDS). The MoHE runs a large number of teaching hospitals nationwide. The MoE operates a number of health facilities at schools. MoE-supported health expenditure covers the cost of health education programs, pharmaceuticals, and salaries of health workers in the school-based health facilities. The NHA 2014 includes all costs incurred during the same year for all relevant ministries. Due to issues including but not limited to the confidentiality of expenditure data, the NDS did not cooperate with this survey.

8 | P a g e
Household Survey
This round of NHA used household OOP data obtained from the AHS 2015. The MoPH NHA team developed a data collection tool for the NHA, in close collaboration with a third party, to collect information on households’ health expenditures. To collect information on these expenditures, the AHS 2015 included questions that covered facilities at which people had most recently sought treatment, the costs associated with their visits (e.g., diagnostics, pharmaceuticals, transportation, food, and consultation fees), the number of visits over the past 12 months (inpatient) or past two weeks (outpatient), and whether they stayed overnight.
2.4. Methods and Assumptions Disease-specific Data
The team conducted two stakeholders’ consultation workshops, during which it identified the most common RH and CH diseases based on SHA2011 classification. We used the BPHS health facilities costing study conducted by Health Economics and Financing Directorate (HEFD) to obtain outpatient department (OPD) costs of acute respiratory infection (ARI), diarrhea care, malnutrition, anemia, child immunization, family planning, antenatal care, postnatal care, and use skilled birth attendants. To obtain information related to ATM diseases and services, we obtained utilization data from the Health Management Information System (HMIS) for the specific year. We used this method specifically for public health facilities; for other vertical programs, we collected disease-specific expenditure data and allocated them to each service.
During data collection, the NHA team faced some challenges, although compared to previous rounds, the quality of data improved a great deal. Improvements included a greater level of detail; enhanced consistency of the data; and a shortened timeframe for stakeholders’ compilation of data, as requested by the NHA team. During the data collection, the team observed some gaps in data quality but was able to collect data from other sources to cross-verify and/or minimize the errors when producing the NHA report. The team used the following sources of information to collect primary and secondary data.
Sources for the primary and secondary data
We used secondary data collected from the HMIS, BPHS costing conducted by HEFD, and the MoF budget statement for 2014 (1393).
We used the primary data collected from donors, NGOs, and other ministries via the data collection formats produced by the Health Accounts Production Tool (HAPT) (WHO, n.d.). We also obtained primary data on households’ health expenditures from the AHS 2015.
The NHA technical team used the following methods for data collection and analysis:
1. BPHS allocation factor: We derived allocation factors for the selected diseases using the data obtained from the costing study that HEFD conducted in two provinces.
2. EPHS allocation factor: To account for health service expenditures from various financial sources, the NHA team used a hospital-level utilization rate and found allocation factors for each identified disease with the EPHS. We used the formula shown below for the calculation:

9 | P a g e
𝑇𝑜𝑡𝑎𝑙 𝑤𝑒𝑖𝑔ℎ𝑡𝑒𝑑 𝑢𝑡𝑖𝑙𝑖𝑧𝑎𝑡𝑖𝑜𝑛 𝑜𝑓 𝑑𝑖𝑠𝑒𝑎𝑠𝑒𝑠
𝑇𝑜𝑡𝑎𝑙 𝑤𝑒𝑖𝑔ℎ𝑡𝑒𝑑 𝑢𝑡𝑖𝑙𝑖𝑧𝑎𝑡𝑖𝑜𝑛 𝑓𝑜𝑟 𝑎𝑙𝑙 𝑠𝑒𝑟𝑣𝑖𝑐𝑒𝑠= % 𝑢𝑡𝑖𝑙𝑖𝑧𝑎𝑡𝑖𝑜𝑛 𝑓𝑜𝑟 𝑑𝑖𝑠𝑒𝑎𝑠𝑒𝑠 𝑎𝑙𝑙𝑜𝑐𝑎𝑡𝑖𝑜𝑛
3. MoPH ordinary budget: The team allocated a proportion of the ordinary MoPH budget toward selected diseases at both the central and provincial levels. To clarify the details of expenditures, the budget assesses changes in financing patterns for family planning and reproductive health (RH). We included the following issues for the measurements RH, CH and ATM. As the ordinary budget covers only staff salaries, we gathered data regarding the total number of staff working in RH, CH, and ATM services at the MoPH central and provincial levels.
4. Survey of National Hospitals: RH cost allocation factors for gynecology, family planning, and obstetric services were determined when HEFD conducted the cost analysis for the Kabul National Hospitals (GIRoA, 2014). As per that study, the allocation factors of inpatients and outpatients were 81% and 19%, respectively.
2.5. Limitations
Despite significant improvements in the quality of data as a result of enhancements in methodology and recent improvements in the capacity of stakeholders involved with their production, a number of limitations still exist regarding production of the NHA 2014 that must be addressed during the next NHA rounds. For this reason, we recommend that readers exercise caution when using these estimates.

10 | P a g e
3. General NHA Findings
3.1. Summary of Findings in Comparison with Previous Rounds
Total Health Expenditure in Afghanistan
Three rounds of the Afghanistan NHA have demonstrated that THE across all three rounds has increased incrementally. In the first round of the NHA, THE was estimated at approximately USD 1 billion; it increased by about 50% to reach approximately USD 1.5 billion during the second round of estimations in 2011/2012. However, the NHA 2014 indicated that THE has increased by almost 33% in nominal terms and accounts for USD 2 billion; the share of household expenditure on health has dropped slightly, from 75% to 72%. Figure 1 shows the trend in THE in nominal terms across the three rounds of the NHA.
Figure 1: Comparison of Total Health Expenditure (USD) Across Three Rounds of the
NHA
Composition of THE
Although the estimated THE of USD 1,992,000,402 in 2014 shows an increase of about 33% over the second round, the government expenditure on health as a share of THE increased by only 0.1% (approximately USD 97,128,992 USD). THE as a percentage of GDP is about 9.5%—an increase of 1.5% compared to the previous round―but the CHE as a percentage of GPD is about 9.3%. The difference in the CHE and THE in their percentage share of the GDP is due to the exclusion of capital formation from the CHE. With the capital expenditure reported separately, the CHE is around USD 1,958,143,950. To allow for comparability, one can sum the capital expenditure with CHE. Considering the overall increment in THE, per capita health expenditure also increased to USD 70.9. This round of NHA showed a minor decrease in the share of household OOP expenditure, at 72%, whereas in nominal terms it has increased significantly. Despite increased government investment in primary healthcare services, high household OOP expenditure is a matter of serious concern.
-
500,000,000
1,000,000,000
1,500,000,000
2,000,000,000
2,500,000,000
2008-2009 2011-2012 2014

11 | P a g e
Table 1 provides a comparative summary of the three rounds of the Afghanistan NHA.
Table 1: Summary of NHA Findings, 1st, 2nd, and 3rd Rounds
General NHA Indicators 2008/2009 2011/2012 2014
Total population 25,011,400 27,000,000 28,100,000 Total GDP (USD) 10,843,340,000 18,952,000,000 21,010,912,250 Average exchange rate (USD: AFN) 1:50 1:47 1:57 Total government health expenditure (USD) 63,892,239 84,148,093 97,128,992
Current Health Expenditure (CHE) 1,958,143,950 THE 1,043,820,810 1,500,975,945 1,992,000,402 THE per capita (USD) 41.73 55.59 THE as % of GDP 10.0% 8.0% 9.5% Government health expenditure as % of total government expenditure 4.0% 4.2% 4.3%
Financing Source as a % of THE Central government 6.0% 5.6% 5.0% Private 76.0% 73.6% 72.0% Other countries in the world 18.0% 20.8% 23%
Household (HH) Spending Total HH (OOP) spending as % of THE 75.0% 73.3% 71.8%
Total HH (OOP) spending per capita (USD) 31 41 51
Financing Agent Distribution as a % of THE Central government 11.0% 11.8% 12.4% Household 75.0% 73.3% 71.8% NGOs 5.0% 0.3% 0.3% Other countries in the world 8.0% 14.6% 15.5%
Provider Distribution as a % of THE Hospitals 29.0% 24.0% 39.8% Outpatient care centers 32.0% 25.0% 26.4% Retailers and other providers of medical goods 28.0% 26.0% 24.5%
Other 11.0% 25.0% 9.2% Function Distribution as a % of THE
Curative care 59.0% 37.0% 32.7% Pharmaceuticals 28.0% 26.0% 41.7% Prevention and public health programs 5.0% 5.0% 6.8% Health administration 5.0% 6.0% 4.3% Capital formation 2.0% 1.0% 1.7% Ancillary services - 24.0% 12.6% Other 1.0% 1.0% 0.2%

12 | P a g e
3.2. International Comparison of NHA
Contrary to the prevailing perception of the Afghanistan Health System being highly donor dependent, the highest burden of healthcare cost is being borne by the public, as evidenced in the results of the three NHA rounds. Figure 2 shows that Afghanistan finances the highest share of THE of all countries in the region out of its citizens’ pockets. THE is approximately 9% of the country’s GDP—other countries range from 3% to 7%.
Figure 2: International Comparison of THE as a Percentage of GDP, 2014
Source: Global Health Expenditure database.
Comparison of OOP with other countries
The graph in Figure 3 shows a comparative picture of private health expenditure as a percentage of the THE in low- and middle-income countries. As indicated, Afghanistan has the second highest OOP expenditure after Cambodia. In 2014, households’ OOP expenditures were lowest in Iraq, Kazakhstan, and Sri Lanka.
9.3
34
7
3
56
4
0
1
2
3
4
5
6
7
8
9
10
Afghanistan Pakistan Kazakhstan Tajikistan Bangladesh India Nepal Sri Lanka

13 | P a g e
Figure 3: Private Health Expenditure as a Percentage of THE, 2014
Source: Global Health Expenditure database.
3.3. Expenditure by Financing Schemes
Financing schemes for health in Afghanistan mainly derive from three major players: (1) the government, (2) donors, and (3) private households’ OOP expenditure. Government domestic revenue made up 5% of CHE, and government spending funded by donors accounted for 7.6%; this spending is managed by the government through a nondiscretionary budget. Households’ OOP expenditures accounted for the highest share—73.1% of CHE. International donors’ spending on health accounted for 14.2% of health expenditures.
Table 2: Breakdown of Revenue of Healthcare Financing as Percentage of CHE
Breakdown of Expenditure, by Financing Schemes Revenues of Healthcare Financing Schemes Amount Percentage
Transfers from government domestic revenue (allocated to health purposes)
97,128,992 5.0%
Transfers distributed by government from foreign origin 147,865,516 7.6%
Private (household OOP) 1,430,540,103 73.1% Other revenues from nonprofit institutions serving households (NPISH) not elsewhere classified
3,725,504 0.2%
Direct foreign transfers 278,883,835 14.2%
Total 1,958,143,950 100%
7259
40
65
46
71
4760
44
78
0
10
20
30
40
50
60
70
80
90

14 | P a g e
Figure 4: Breakdown of Financing Source
Household OOP Health Expenditure
Using data obtained from the AHS 2015, this round of NHA showed that approximately three-quarters of THE was borne by households. The analysis shows that the 2014 OOP expenditures of USD 1,430,540,103 were approximately equal to the 2011–2012 THE in nominal terms. The providers and services for which household expenditure was incurred were the following: hospitals, 13.5%; ambulatory healthcare centers, 9.8%; retail sales (medicines), 57.4%; and diagnostics, 18.7%. The MoPH leadership and other interested stakeholders should collaborate to design and implement risk protection mechanisms aimed at reducing OOP payments at the point of service and speed up the move toward universal health coverage. Table 3 and Figure 5 show the details of household OOP expenditures, which consist of expenditures on OPD, inpatient department (IPD), retailers and other providers of medical goods and medicines, and diagnostics. The largest health expenditures by households were for retail sales and medical goods and medicines consumed.
Table 3: Breakdown of Household Out-of-Pocket Expenditure
Household OOP expenditures Amount Percentage
Outpatient 192,688,689 13.5%
Inpatient 140,834,957 9.8%
Retailers and other providers of medical goods and medicines 829,727,640
58.0%
Vision products 6,331,786 0.4% Hearing products 1,948,242 0.1% Medicines 821,447,612 57.4% Diagnostics 267,288,818 18.7%
Total HH expenditure 1,430,540,103 100.0%
5%8%
73%
0%
14%
Transfers from governmentdomestic revenue(allocated to health purposes)
Transfers distributed bygovernment from foreign origin
Private (Household Out of Pocket)
Other revenues from NPISH n.e.c.
Direct foreign transfers

15 | P a g e
Figure 5: Composition of Household OOP Expenditure
Public Health Expenditure
Public expenditure by financing scheme is depicted in Table 4. It includes government expenditures on health and funds from international partners distributed to the health sector through government on-budget channels. Public expenditure on health was USD 523,878,343, which also included donors’ expenditures on health through on-budget and off-budget channels. Out of that total amount, approximately USD 426,749,351 was paid by international donors, consisting of USD 147,865,516 and USD 277,145,437 through on- and off-budget channels, respectively. The remaining USD 97,128,992 was spent by GIRoA through different ministries; the MoPH had the highest percentage of expenditure among them.
Table 4: Breakdown of Expenditure, by Public Financing Source
Public Expenditure
Revenues of Healthcare Financing Schemes as a Percentage of CHE (USD) Financing schemes Amount Percentage
Transfers from government domestic revenue 97,128,992 18.47%
(allocated to health purposes) MoPH 84,546,008 87.0% MoD 2,519,643 2.59% MoI 2,180,089 2.24% MoHE 7,674,712 7.90% MoE 208,539 0.21% Transfers distributed by government from foreign origin 147,865,516 28.12%
Direct donors’ expenditures on health 277,145,437 52.70%
Other domestic revenue 3,725,504 0.71%
Total 527,603,846 100.00%
13%
10%
58%
19%OPD
IPD
Retailers & other providersof medical goods &Medicine
Diagnosis

16 | P a g e
Figure 6: Breakdown of Public Financing Source
Donor Health Expenditure
In 2014, international partners (donors) contributed USD 426,749,351 for health in Afghanistan through both on- and off-budget channels to support implementation of the BPHS and EPHS via contracting out and contracting in (MoPH-SM) service delivery mechanisms. This contribution comprised 21.8% of CHE.
3.4. Expenditure by Financing Agents
Various agents manage health expenditures in Afghanistan. Consistent with the previous round of NHA, the 2014 round showed that households managed and paid for almost three-quarters of health expenditure. In the absence of prepayment mechanisms, OOP expenditure occurs for various reasons, and is not an efficient method of financing healthcare services. However, even though GIRoA financed only 5% of CHE, it managed almost 12.5% of it in 2014. Despite the commitment of donors and international partners to spend their money targeted at the health system through the government financing system as on-budget spending, donors still directly manage about 14% of their funds. To ensure that government institutions’ performances improve further, this aid should be channeled through the government’s systems and spent based on MoPH priorities.
16%
1%0%
1%
0%
28%
53%
1%
Ministry of Public Health
Ministry of Defense
Ministry of Interior Affairs
Ministry of Higher Education
Ministry of Education
Transfers distributed by governmentfrom foreign origin
Donors Expenditure on health as public
Other Domestic Revenue

17 | P a g e
Figure 7: Financing Agents Managing Healthcare Service Funds
3.5. Expenditure by Healthcare Providers
As indicated in the following table, hospitals provided services equivalent to almost 40% of CHE and thus held the highest-rank in the list of providers. Outpatient care centers ranked second as providers of healthcare services (equivalent to 25.5% of CHE), and retailers and other providers of medical goods ranked third, (equivalent of 29.4% of CHE). Finally, provision and administration of public health programs, and general health administration made up 4.3% and 4.4% of CHE, respectively, whereas less than 1% (0.7%) was provided by “All others”―not classified.
Table 5: Breakdown of Expenditure, Healthcare Providers
Breakdown of Health Providers Health providers Amount Percentage
Hospitals 783,216,631 40.0%
Outpatient care centers 499,635,911 25.5%
Residential and long-term care 3,320,000 0.2%
Retailers and other providers of medical goods/Medicine 487,937,871 24.9%
Provision and administration of public health programs 84,173,402 4.3%
General health administration 85,811,871 4.4%
All others 14,048,264 0.7%
Total 1,958,143,950 100%
13%
73%
0%
14%
Central Government
Households
Non-Provite Institutioniserving households
Rest of the World (RoW)

18 | P a g e
Figure 8: Breakdown of Healthcare Providers
3.6. Expenditure by Healthcare Functions
This round of NHA classified the following functions. Expenditure on curative care—including both inpatient and outpatient curative care—accounted for 33.27% of CHE; out of this percentage, 50% was spent on OPD and 50% on IPD. The highest percentage of current expenditure was for medical goods dispensed to outpatients, accounting for 42.41%, followed by 12.83% on ancillary services, 6.89% on prevention and public health programs, and 4.38% on health system administration.
Table 6: Breakdown of Expenditure, by Functions
Expenditure by Function Healthcare Functions Amount Percentage
Curative 651,466,893 33.27%
Inpatient curative care 325,399,660 49.95%
Outpatient curative care 326,067,232 50.05%
Rehabilitation care 4,195,472 0.21%
Ancillary services 251,208,810 12.83%
Medical goods dispensed to outpatients 830,374,513 42.41%
Prevention and public health services 134,897,107 6.89%
Health administration of public health programs 85,790,404 4.38%
All others 210,751 0.01%
Total 1,958,143,950 100%
40.0%
25.5%
0.2%
24.9%
4.3%
4.4%0.7% Hospitals
Outpatient care centers
Residential and long termcare
Retialers & other providers ofmedical goods/ medicine
Provision and administrationof public health programs
General healthadministration
All others

19 | P a g e
Figure 9: Breakdown of Healthcare Functions
3.7. Expenditure on Capital Formation
Capital formation is defined as the type of investment that healthcare providers have made during the accounting period that last for more than one year and cost more than $100 in producing health. Table# 7 shows that in 2014, the expenditure on capital formation was financed by donors and the government. Table 7: Breakdown of Capital Formation
Financing
agents
Gross
capital
formation
Non-
produced
non-financial
assets
Unspecified gross
fixed capital
formation (n.e.c.)
All
General government
7,824,785.6 5,846.5 7,830,632.1
MoPH 7,824,785.6 5,846.5 7,830,632.1
Other countries in the world
25,934,249.8 43,616.0 47,954.5 26,025,820.3
All 33,759,035.4 43,616.0 53,801.0 33,856,452.4
33%
0%
13%
43%
7%4%
0% Curative
Rehablitation care
Ancillary services
Medical goods dispensed tooutpatients
Prevention and publichealth services
Health administration ofpublic health programs
All others

20 | P a g e
4. Disease Accounts Findings
The 2014 NHA was the first round in which the most common diseases were identified based on the SHA classifications. Based on our analysis, approximately 2.2% of CHE was spent on HIV/AIDS, TB, and malaria. Expenditures on other diseases and services consisted of the following: 17.1% on RH (maternal conditions, perinatal conditions, contraceptive management/family planning, and use of skilled birth attendants); 25.2% on childhood diseases (acute respiratory infection, diarrheal diseases, malnutrition, and anemia); and more than 50% on other diseases and services. The magnitude of expenditure on these others and the need for evidence-based planning will require inclusion of more disease accounts in the future.
Table 8: Breakdown of Disease, by Disease Category and Expenditure
Expenditure by Disease Category Code Disease categories Amount Percentage
DIS.1 Infectious and parasitic diseases 42,361,392 2.2%
DIS.1.1.1.1 HIV/AIDS 4,025,392 0.2% DIS.1.2 TB 21,368,799 1.1% DIS.1.3 Malaria 16,967,201 0.9% DIS.2 Reproductive health 334,458,863 17.1%
DIS.2.1 Maternal conditions 58,832,690 3.0% DIS.2.2 Perinatal conditions 90,085,675 4.6% DIS.2.3 Contraceptive management (family
planning) 88,431,439 4.5%
DIS.2.4 Skilled birth attendant (SBA) 97,109,058 5.0% DIS.7 Child health diseases 494,109,515 25.2%
DIS.7.1 Acute respiratory infection (ARI) 283,794,526 14.5% DIS.7.2 Diarrheal diseases 96,941,469 5.0% DIS.7.3 Malnutrition (nutritional deficiencies) 97,035,658 5.0% DIS.7.4 Anemia 16,337,862 0.8% DIS.7.5 Child immunization 60,756,786 3.1%
DIS.nec Other diseases not classified above 1,026,457,394 52.4%
Total 1,958,143,950 100%

21 | P a g e
Figure 10 : Breakdown of Disease Categories
4.1. Disease Expenditure by Financing Sources
Table 9 is important for international partners supporting vertical programs―it indicates which partners spent how much for which disease. In this round of NHA, we produced expenditure-by-disease categories and accompanying financing sources, thus identifying the key players and how much each of them spent on each disease.
2.2%
17.1%
25.2%
3.1%
52.4%
Infectious and parasiticdiseases
Reproductive health
Child health diseases
Child immunization
Other disease notclassified above

22 | P a g e
Table 9: Disease Expenditure, by Financing Sources
Disease categories
Transfers from
government
domestic revenue
(allocated to
health purposes)
Transfers
distributed
by
government
from foreign
origin
Other domestic
revenues (other
revenues from
NPISH) n.e.c.
Direct foreign
transfers
Private
Expenditure on
Health
(households’ OOP
expenditures)
Total expenditure
on all diseases
Infectious and parasitic
diseases
399,347 3,381,036 83,802 30,160,280 8,336,927 42,361,392
HIV/AIDS 1,480,000 78,349 2,467,044 4,025,392 TB 313,148 199,353 806 18,158,951 2,696,541 21,368,799 Malaria 86,199 1,701,682 4,647 9,534,286 5,640,387 16,967,201 Reproductive health 4,349,710 2,208,602 358,809 22,537,425 275,004,316 334,458,863 Maternal conditions
697,618 5,292,442 57,721 8,545,440 44,239,469 58,832,690
Perinatal conditions 1,215,935 8,843,110 98,905 4,123,682 75,804,044 90,085,675 Family planning 1,132,664 8,581,442 96,024 5,025,149 73,596,160 88,431,439 SBA 1,303,493 9,491,609 106,160 4,843,153 81,364,643 97,109,058 Child health diseases 6,171,551 0,531,114 409,459 63,015,103 383,982,288 494,109,515
ARI 2,690,216 6,813,457 281,491 7,083,140 246,926,222 283,794,526 Diarrheal disease 2,296,284 8,036,760 70,606 3,320,179 83,217,639 96,941,469 Nutritional program 819,049 4,076,961 39,224 52,163,493 39,936,930 97,035,658 Anemia 366,002 1,603,935 18,138 448,290 13,901,497 16,337,862 Immunization 2,127,764 7,475,741 72,551 51,080,730 60,756,786
Other diseases not classified
above 4,080,619 4,269,024 800,883 12,090,297 763,216,572 1,026,457,394
Total
97,128,992 47,865,516 3,725,504 278,883,835 1,430,540,103 1,958,143,950

23 | P a g e
4.2. Disease Expenditure by Providers
Table # 10 shows the major providers of healthcare for selected diseases during the accounting period: hospitals, ambulatory healthcare, providers of ancillary services, retailers and other providers of medical goods, and providers of preventive care.

24 | P a g e
Table 10: Disease Expenditure, by Providers
Healthcare providers
Classification of diseases /
conditions Hos
pita
ls
Res
iden
tial l
ong-
term
car
e fa
cilit
ies
Prov
ider
s of
ambu
lato
ry
heal
thca
re
Prov
ider
s of
anci
llary
serv
ices
Ret
aile
rs a
nd
othe
r pro
vide
rs
of m
edic
al g
oods
Prov
ider
s of
prev
entiv
e ca
re
Prov
ider
s of
heal
thca
re
syste
m
adm
inis
tratio
n an
d fin
anci
ng
Res
t of e
cono
my
Oth
er c
ount
ries
of th
e w
orld
Uns
peci
fied
heal
thca
re
prov
ider
s (n.
e.c.
)
Total
Infectious and parasitic diseases
17,856,620 5,827,502 0 2,045,654 13,340,650 2,538,103 752,863 0 0 42,361,392
HIV/AIDS and other
sexually transmitted
diseases (STDs)
344,409 2,142,487 1,171,384 367,113 4,025,392
HIV/AIDS and
opportunistic infections
(OIs)
344,409 2,142,487 1,171,384 367,113 4,025,392
HIV/AIDS 344,409 2,142,487 1,171,384 367,113 4,025,392 TB 14,705,458 803,605 146,118 3,976,377 1,737,241 21,368,799 Tuberculosis treatment
(general)
14,705,458 803,605 146,118 3,976,377 1,737,241 21,368,799
Malaria 2,806,753 2,881,411 1,899,536 8,192,889 433,749 752,863 16,967,201 Reproductive health 9,458,374 157,255,501 163,798,431 2,981,848 4,480 960,228 334,458,863
Maternal conditions 1,624,855 29,137,758 26,349,971 1,278,667 2,050 439,390 58,832,690 Perinatal conditions 2,611,173 41,483,859 45,150,504 639,876 930 199,333 90,085,675 Contraceptive
management (family
planning)
2,424,661 42,096,380 43,835,441 74,958 88,431,439
SBA 2,797,685 44,537,505 48,462,515 988,348 1,500 321,505 97,109,058 Child health diseases 100,302,413 0 195,733,332 0 179,433,072 11,367,174 3,406,295 524,024 3,343,205 0 494,109,515
ARI 43,646,847 112,500,846 125,174,537 1,626,952 294,500 550,845 283,794,526
Diarrheal disease 40,725,608 26,366,174 29,126,215 437,061 68,575 217,836 96,941,469 Malnutrition (nutritional
deficiencies)
15,472,018 49,424,622 16,852,292 11,367,174 1,240,072 141,394 2,538,087 97,035,658
Anemia 457,940 7,441,690 8,280,028 102,211 19,556 36,437 16,337,862 Child immunization 0 0 7,660,664 0 0 52,463,655 408,842 77,877 145,749 0 60,756,786
Others 655,599,224 3,320,000 133,158,911 1,520,833 142,660,714 7,001,923 76,476,783 1,486,636 5,076,362 156,008 1,026,457,394
Total 783,216,631 3,320,000 499,635,911 1,520,833 487,937,871 84,173,402 85,811,871 2,845,880 9,525,544 156,008 1,958,143,950

25 | P a g e
5. Conclusions and Recommendations
5.1. Conclusions
Deviating from the previous two rounds, this round of NHA followed the SHA 2011 framework to provide comprehensive information on the volume and composition of health expenditure in Afghanistan. In addition to tracking health expenditures by financing sources, schemes, agents, providers, and functions, for the first time in Afghanistan this round also produced disease accounts for four disease categories: infectious and parasitic diseases, RH, CH diseases, and immunization. Over a two-year period (2011/2012 to 2014), THE increased by 32.7%, accounting for 9.5% of the GDP―equivalent to USD 70.9 per capita in 2014. Although health expenditure has increased substantially from the previous round, the composition of health expenditure follows almost the same pattern to that of the previous NHA.
Consistent with previous rounds of the NHA, the 2014 round revealed that Afghanistan remains highly dependent on OOP expenditure and donor support to finance its health system. The share of OOP remained high, at 72%, which is a major policy concern for the MoPH because such expenditures can lead to financial catastrophe and impoverishment. Also, the share of government financing in THE fell from 5.6% in 2011/12 to 5.0% in 2014, although the burden of disease increased. By disease category, CH consumes the largest share (25.2%) of the current health expenditure, followed by RH (17.1%).
5.2. Recommendations
We make the following specific recommendations based on the findings.
Design and implement financial risk protection mechanisms for households:
GIRoA has been providing healthcare services free of charge at the point of delivery in all public health facilities. Nevertheless, the share of OOP expenditure has hardly been reduced over the years, as seen in the different rounds of the NHA. Current per capita direct expenditure by households in the form of OOP expenditure is USD 51, and there are no mechanisms in place to prevent financial risk due to ill health. As OOP spending is regressive in nature, it not only poses severe barriers in accessing healthcare for individual households but also exacerbates inequity, particularly affecting rural, poor, and vulnerable populations. A large share of OOP spending can lead to catastrophic expenditure, which pushes households further into debt and forces them to sell assets or compromise on their health by not seeking care.
Thus, the government should consider designing and implementing prepaid mechanisms, such as health insurance, to improve financial protection as an interim move toward universal health coverage. Such mechanisms, in addition to generating additional domestic resources for the health sector, could also promote efficiency through strategic purchasing.
Increase government investment in health and broaden the package of health
services: Afghanistan is facing a double burden of communicable and non-

26 | P a g e
communicable diseases during a time that the government financing in total health expenditure has decreased. The share of total government expenditure on health is also substantially lower than international benchmarks. Thus, delivery of services in public health facilities is constrained by limited resources, which may drive patients from public to private facilities. To avoid such a situation and ease people’s access to essential health services, the government should consider allocating more resources to the health sector to strengthen health services in public facilities. With increased government funding, the MoPH may also need to consider revisiting the list of services in the BPHS and EPHS to expand their scope to better address the emerging healthcare needs of the population.
The “youth bulge” and an expected reduction in donor funding inevitably must force an exploration of new streams of revenues, such as earmarking of “sin taxes” (e.g., tobacco tax) for the health sector. Earmarking such taxes can reduce health risks among the population by curtailing the use of harmful products while generating more resources for the sector. A continuous evidence-based dialogue with the MoF and other stakeholders should be conducted to advocate for an increased budget allocation or earmarked taxes for health.
Promote rational use of medicines and cost containment measures:
Pharmaceuticals and other medical non-durables make up the bulk of household health expenses, with a significant proportion dispensed through pharmacies and retail shops. In addition to genuine need, there are a number of reasons for this high level of spending on medicines, which are also highlighted in the newly endorsed National Health
Strategy 2016–2020. First, not only do doctors frequently overprescribe medications, but patients often demand medications that are not clinically indicated. Second, patients commonly overuse medicines because they often ask private pharmacies to prescribe medicines, even though a majority of pharmacies do not have qualified pharmacists. Third, anecdotal evidence suggests that a significant number of pharmaceutical products are also purchased through illegitimate channels.
Thus, the MoPH may need to further assess the country’s drug consumption patterns and promote rational use through an awareness campaign and effective regulation. Further, as the prices of medical goods and services are increasing at a higher pace than general inflation, the government should also prioritize the containment of these prices.
Improve understanding of investments in preventive care: Expenditure on preventive care increased slightly in this round of NHA compared with previous rounds; expenditure on immunization also increased. Under the BPHS and EPHS, physicians and other medical personnel conduct certain preventive activities, including counseling, screening, and vaccinations; and blood pressure, cholesterol, and diabetes tests. However, the time and resources spent on these activities are considered curative under the NHA because they are provided as both inpatient and outpatient services. Thus, government expenditure on preventive health is likely underestimated.

27 | P a g e
Leverage and regulate the private sector through implementation of the MoPH
Private Sector Strategy: With healthcare demands outpacing the supply of services and available resources, the BPHS and EPHS are not adequate to fulfill all of the healthcare needs of the population. Given the low level of government resources allocated to health, sustainability of the BPHS and EPHS depend heavily on donor funding. In this situation, the MoPH should begin leveraging the private sector, given its increasing role in health service delivery. Achieving public health goals will also require more effective use of private resources; thus, the MoPH Private Sector Strategy should be implemented to increase that sector’s overall contribution to health. Engaging and building partnerships with the private sector will enable the public sector to ensure better quality and best practices across providers nationwide. Thus, the government should provide a friendly environment that will foster competition within the private sector, or between the public and private sector, and ensure the quality of services delivered by both. Furthermore, better engagement of the private health sector can help to alleviate the burden of financing the public health system.
Continue efforts for institutionalizing the NHA: The MoPH has made significant
efforts to strengthen the NHA production process, as demonstrated by successive improvements in the methodology and scope of the analysis in the three NHA rounds. The HEFD has also become increasingly capable of producing the NHA with a reduced level of external support―a key development in the institutionalization process. The HEFD should continue to advocate for producing the NHA on a regular basis, rely more on routine information systems, such as the Expenditure Management Information System (EMIS) and Afghanistan Financial Management Information System (AFMIS), and further build the capacity of the NHA team. Moreover, it is crucial to have NHA-related staff financed through the government’s annual ordinary budget to ensure greater sustainability. The NHA technical team should continue to improve the methods and systems for collecting and analyzing data, expand to cover more diseases, and implement the ICD-10 in future rounds.

28 | P a g e
6. Institutionalization of NHA
The NHA is recognized internationally as a strong tool for providing more detailed information on health systems expenditures at the national level. NHA continuously collects and analyzes data that can have a strong impact on policymakers, encouraging them to change or amend strategies and planning of health systems to benefit all citizens. The NHA concentrates on tracking the resources spent for health, which can contribute to improved allocation of funds and reprioritize the delivery of services, programs, and projects.
The role of the NHA in the health system is progressing as its scope has expanded over the course of the different rounds. However, challenges in institutionalizing the NHA continue to exist. The establishment of an NHA office within the HEFD is encouraging. The NHA team consists of several technical and experienced staff who have worked tirelessly and produced the three rounds of NHA within the framework of SHA.1 and SHA 2011, according to their corresponding guidelines. The quality of data collected and analyzed has met the international standard. The confidential nature of financial data to be collected was one of the team’s main challenges, and some of partners still have not shared their expenditure data. Despite such challenges, the NHA team has obtained high-quality data from international donors, ministries, and households to ensure the accuracy and validity of NHA results. Against all odds and in the face of the challenges existing within Afghanistan’s health sector, the MoPH has managed to develop and implement EMIS as an effective step toward simplifying the process of collecting data on health expenditures. The MoPH’s successful implementation of EMIS may allow its partners to record their health expenditures and report them more accurately and easily. The HEFD team of the MoPH designed EMIS in a very comprehensive manner and plans to migrate it to a web-based system. Effective implementation of the EMIS can contribute significantly to institutionalizing the NHA, mainly by routinely providing disaggregated expenditure data. In addition, the MoPH and the Central Statistics Organization (CSO) are working progressively to improve the quality of household expenditure data by conducting regular multidimensional household surveys at the national and community levels. These organizations signed a memorandum of understanding (MoU) in September 2011. Based on this MoU, both partners are obliged to work together to conduct surveys of households and communities. All parties are accountable for data sharing and data analyses based on mutual trust. Such regular household surveys will also help the institutionalization of the NHA in Afghanistan. The MoPH has incorporated questions related to health expenditure in household surveys, such as the National Risk and Vulnerability Assessment (NRVA), which is conducted nationally. The NRVA systematically collects relevant data on OOP health expenditures and has obtained high-quality data regarding OOP expenditures from its various health partners. For this round of the NHA, the team obtained data for household expenditure on health from the AHS 2015. Finally, the NHA team also is accountable for developing a method of analysis to determine household expenditure according to the standards and recommendations of international stakeholders to achieve a better comparison with previous years’ data.

29 | P a g e
Annex A. National Health Accounts Tables, extracted from the NHA Production Tool Table A.1: Revenues of Healthcare Financing Schemes, by Financing Sources, FS x HF Reported currency: US Dollar Financing
schemes
HF.1.1.1.1 HF.1.1.1.2 HF.1.1.1.3 HF.1.1.1.4 HF.1.1.1.5 HF.2.2.1 HF.2.2.2 HF.3.1 All HF
Revenues of
healthcare
financing
schemes
Min
istry
of P
ublic
H
ealth
Min
istry
of D
efen
se
Min
istry
of I
nter
ior
Aff
airs
Min
istry
of H
ighe
r Ed
ucat
ion
Min
istry
of
Educ
atio
n
NPI
SH fi
nanc
ing
sche
mes
(exc
ludi
ng
HF.
2.2.
2)
Res
iden
t for
eign
ag
enci
es’ s
chem
es
Out
-of-
pock
et,
excl
udin
g co
st
shar
ing
FS.1.1.1 Central government revenue
84,546,008 2,519,643 2,180,089 7,674,712 208,539 97,128,992
FS.2 Transfers distributed by government from foreign origin
121,619,566 19,077,798 7,168,152 147,865,516
FS.6.3 Other revenues from NPISH n.e.c.
3,725,504 3,725,504
FS.7.1.4 Direct foreign financial transfer
278,883,835 278,883,835
FS.8.1 Households’ OOP
1,430,540,103 1,430,540,103
All FS 206,165,574 21,597,442 9,348,241 7,674,712 208,539 3,725,504 278,883,835 1,430,540,103 1,958,143,950 Data sources used:
Donors USAID, European Union (EU), United Nations Population Fund (UNFPA), WHO, United Nations Children’s Fund (UNICEF), World Food Program (WFP), Japan International Cooperation Agency (JICA), United Nations Office on Drugs and Crime (UNODC), MSF, International Security Assistance Force (ISAF), Emergency, Afghan Red Crescent Society (ARCS), Canadian International Development Agency (CIDA),

30 | P a g e
Turkish International Cooperation and Development Agency (TIKA), International Federation of Red Cross and Red Crescent Societies (IFRC), Global Alliance for Vaccines and Immunization (GAVI) HSS, CIDA1, EU, EU2, AKDN , HANDICAP, SOZO Int, International Organization for Migration (IOM), Italian cooperation, Medair, IAM, International Committee of the Red Cross (ICRC)
NGOs SDO, SCA, BDN, PU-AMI, HADAAF, CHA, MOVE, SAF, Save the Children, CAF, Cordaid, IMC, HealthNet TPO, AHDS, OHPM, BRAC, AADA, ACTD$, ACTD AFN, ACTD EU, CAF1, PU-AMI 1, AKHS, AKHS1, AFGA, SM
Government sources
MoD, MoE, MoHE, MoI, MoPH
Households Household

31 | P a g e
Table A.2: Financing Schemes, by Functions, HC x HF
Reported currency: US Dollar Financing
schemes
HF.1.1
HF.1.1.1.1 HF.1.1.1.2
HF.1.1.1.3
HF.1.1.1.4
HF.1.1.1.5
HF.2.2
HF.2.2.1 HF.2.2.2 HF.3.1 HF.4.3
All HF
Healthcare functions
Gov
ernm
ent s
chem
es
Min
istry
of P
ublic
Hea
lth
Min
istry
of D
efen
se
Min
istry
of I
nter
ior
Aff
airs
Min
istry
of H
ighe
r Ed
ucat
ion
Min
istry
of E
duca
tion
NPI
SH fi
nanc
ing
sche
mes
(inc
ludi
ng
deve
lopm
ent a
genc
ies)
N
PISH
fina
ncin
g sc
hem
es (e
xclu
ding
H
F.2.
2.2)
Res
iden
t for
eign
ag
enci
es’ s
chem
es
Out
-of-
pock
et, e
xclu
ding
co
st sh
arin
g
Oth
er c
ount
ries o
f the
w
orld
fina
ncin
g sc
hem
es
HC.1.1.1
General inpatient curative care
42,170,930
17,493,928
9,313,855
6,216,517
98,409 36,290,790
165,997,788
277,582,216
General inpatient curative care
51,313,805
17,493,928
9,313,855
6,216,517
0 0 2,545,801
76,368,086
165,997,788
0 329,249,779
HC.1.3.3
Specialized outpatient curative care
723,186 4,955,073 5,678,259
HC.2.1 Inpatient rehabilitative care
3,619,576 3,619,576
HC.2.2 Day rehabilitative care
230,543 230,543
General outpatient curative care
100,265,199
4,103,514 0 1,458,195
25,748
0 1,090,015
28,591,732
185,199,922
0 320,734,326

32 | P a g e
HC.1.1+HC.2.1
Inpatient curative and rehabilitative care
50,591,392
17,493,928
9,313,855
6,216,517
2,545,801
64,469,868
165,997,788
316,629,149
HC.1.2+HC.2.2
Day curative and rehabilitative care
722,413 11,898,217
12,620,630
HC.1.3+HC.2.3
Outpatient curative and rehabilitative care
100,988,385
4,103,514 1,458,195
25,748
1,090,015
33,546,805
185,199,922
326,412,585
HC.4.1 Laboratory services
1,367,202 1,367,202
HC.4.3 Patient transportation
40,000 249,614,753
249,654,753
HC.4.nec
Unspecified ancillary services (n.e.c.)
150,000 34,386 2,468 186,854
HC.5.1.1
Prescribed medicines
821,447,612
821,447,612
HC.5.2.1
Glasses and other vision products
6,331,786 6,331,786
HC.5.2.2
Hearing aids 1,948,242 1,948,242
HC.5.2.3
Other orthopedic appliances and prosthetics (excluding glasses and hearing aids)
646,873 646,873

33 | P a g e
HC.6.1.1.nec
Other and unspecified addictive substances information, education, and communication (IEC) programs (n.e.c.)
201,973 201,973
HC.6.1.2
Nutrition IEC programs
7,832,990 7,832,990
HC.6.1.3
Safe sex IEC programs
78,349 78,349
HC.6.1.nec
Other and unspecified IEC programs (n.e.c.)
3,311,518 3,311,518
HC.6.2 Immunization programs
3,110,000 54,267,708
57,377,708
HC.6.4 Healthy condition monitoring programs
79,409 79,409
HC.6.5.1
Planning & management
5,805 5,805
HC.6.6 Preparing for disaster and emergency response programs
5,662,328 5,662,328
HC.6.7 Food distribution for preventing malnutrition
32,149,284
32,149,284

34 | P a g e
HC.6.8 Preventive care of HIV, TB, malaria, and vaccine-preventable disease
1,480,000 5,002,142 6,482,142
HC.6.9 Prevention and public health services
650,000 59,984
1 21,004,651
21,714,636
HC.6.nec
Unspecified preventive care (n.e.c.)
966 966
HC.7 Administration and public health programs
47,016,181
0 0 0 122,807
0 11,338 38,640,078
0 0 85,790,404
HC.9 Other healthcare services not classified elsewhere (n.e.c.)
50,000 160,751 210,751
All HC 206,165,574
21,597,442
9,348,241
7,674,712
208,539
3,725,504
278,883,835
1,430,540,103
1,958,143,950
Memorandum items HCR.2.3
Community mobilization
189,276 189,276
HCR.2.4
Education and training of health personnel
177,314
754,270 2,163,561
1,839,958 1,092,
828
6,027,932
HCR.2.5
Other food, hygiene, and drinking water control
665 570,809 571,473

35 | P a g e
HCR.2.6
Other research and development in health
277,501
199,686 477,187
Data sources used: Donors USAID, EU, UNFPA, WHO, UNICEF, WFP, JICA, UNODC, MSF, ISAF, Emergency, ARCS, CIDA, TIKA, IFRC, GAVIHSS, CIDA1, EU1,
EU2, AKDN , HANDICAP, SOZO Int, IOM, Italian cooperation, Medair, IAM, ICRC NGOs SDO, SCA, BDN, PU-AMI, HADAAF, CHA, MOVE, SAF, Save the Children, CAF, Cordaid, IMC, HealthNet TPO, AHDS, OHPM, BRAC,
AADA, ACTD$, ACTD AFN, ACTD EU, CAF1, PU-AMI 1, AKHS, AKHS1, AFGA, SM Government sources
MoD, MoE, MoHE, MoI, MoPH
Households
Household

36 | P a g e
Table A.3: Financing Schemes, by Healthcare Providers, HP x HF
Reported currency: US Dollar Financing schemes HF.1.1.1.1 HF.1.1.1.2 HF.1.1.1.3 HF.1.1.1.4 HF.1.1.
1.5 HF.2.2.1 HF.2.2.2 HF.3.1 All HF
Healthcare providers
Min
istry
of P
ublic
H
ealth
Min
istry
of
Def
ense
Min
istry
of
Inte
rior A
ffai
rs
Min
istry
of H
ighe
r Ed
ucat
ion
Min
istry
of
Educ
atio
n
NPI
SH fi
nanc
ing
sche
mes
(e
xclu
ding
H
F.2.
2.2)
Res
iden
t for
eign
ag
enci
es’ s
chem
es
Out
-of-
pock
et,
excl
udin
g co
st
shar
ing
HP.1.1 General hospitals 43,736,439 21,597,442 9,348,241 7,674,712 121,493 40,420,527 612,804,997 735,703,851 HP.1.2 Mental health
hospitals 446,703 148,037 594,740
HP.1.3 Specialized hospitals (other than mental health hospitals)
8,326,264 2,447,392 36,144,385 46,918,041
HP.2.2 Mental health and substance abuse facilities
3,320,000 3,320,000
HP.3.4.1
Family planning centers
2,031,584 2,031,584
All other ambulatory centers
97,981,623 0 0 0 25,748 1,066,932 67,855,373 330,674,651 497,604,327
HP.4.1 Providers of patient transportation and emergency rescue
30,000 30,000
HP.4.2 Medical and diagnostic laboratories
788,364 788,364
HP.4.9 Other providers of ancillary services
700,000 2,468 702,468
HP.5.1 Pharmacies 478,780,427 478,780,427

37 | P a g e
HP.5.2 Retailers and other suppliers of durable medical goods and medical appliances
877,416 8,280,028 9,157,444
HP.6 Providers of preventive care
3,110,000 59,984 78,350 80,925,068 84,173,402
Government health administration agencies
47,016,181 0 0 0 122,807
11,338 38,661,545 0 85,811,871
HP.8.3 Community health workers (or village health workers, community health aides, etc.)
660,000 2,185,880 2,845,880
HP.9 Other countries of the world
9,525,544 9,525,544
HP.nec Unspecified healthcare providers (n.e.c.)
50,000 106,008 156,008
All HP 206,165,574
21,597,442 9,348,241 7,674,712 208,539
3,725,504 278,883,835 1,430,540,103
1,958,143,950
Data sources used: Donors USAID, EU, UNFPA, WHO, UNICEF, WFP, JICA, UNODC, MSF, ISAF, Emergency, ARCS, CIDA, TIKA, IFRC, GAVIHSS, CIDA1, EU1,
EU2, AKDN, HANDICAP, SOZO Int, IOM, Italian cooperation , Medair, IAM, ICRC NGOs SDO, SCA, BDN, PU-AMI, HADAAF, CHA, MOVE, SAF, Save the Children, CAF, Cordaid, IMC, HealthNet TPO, AHDS, OHPM, BRAC,
AADA, ACTD$, ACTD AFN, ACTD EU, CAF1, PU-AMI 1, AKHS, AKHS1, AFGA, SM Government sources
MoD, MoE, MoHE, MoI, MoPH
Households
Household

38 | P a g e
Table A.4: Healthcare Providers, by Functions, HC x HP
Reported currency: US Dollar Healthc
are
provide
rs
HP.1.1
HP.2.2
HP.3.4.9
HP.4.1 HP.4.2
HP.4.9
HP.5.1
HP.5.2 HP.6 HP.7.1
HP.8.2 HP.8.3
HP.8.9
HP.9 HP.nec
All HP
Heal
thca
re
func
tions
Gen
eral
hos
pita
ls
Men
tal h
ealth
and
su
bsta
nce
abus
e fa
cilit
ies
All
Oth
er a
mbu
lato
ry
cent
ers Pr
ovid
ers o
f pat
ient
tra
nspo
rtatio
n an
d em
erge
ncy
resc
ue
Med
ical
and
dia
gnos
tic
labo
rato
ries
Oth
er p
rovi
ders
of
anci
llary
serv
ices
Phar
mac
ies
Ret
ail s
elle
rs a
nd o
ther
su
pplie
rs o
f dur
able
m
edic
al g
oods
and
m
edic
al a
pplia
nces
Pr
ovid
ers o
f pre
vent
ive
care
Gov
ernm
ent h
ealth
ad
min
istra
tion
agen
cies
All
othe
r ind
ustri
es a
s se
cond
ary
prov
ider
s of
heal
thca
re
Com
mun
ity h
ealth
w
orke
rs (o
r vill
age
heal
th w
orke
rs,
com
mun
ity h
ealth
aid
es,
etc.
) O
ther
indu
strie
s n.e
.c.
Oth
er c
ount
ries o
f the
w
orld
Uns
peci
fied
heal
thca
re
prov
ider
s (n.
e.c.
)
HC.1.1.1
General inpatient curative care
276,974,708.
6
607,507.6
0.0 277,582,216.2
HC.1.1.2
Specialized inpatient curative care
32,107,356.9
3,320,000.0
0.0 0.0 35,427,356.9
HC.1.2.2
Specialized day curative care
12,390,087.4
0.0 0.0 12,390,087.4
HC.1.3.1
General outpatient curative care
10,530,712.3
307,438,788.1
0.0 495,804.6
1,834,720.0
320,388,973.0

39 | P a g e
HC.1.3.3
Specialized outpatient curative care
563,186.
4
5,115,073.0
0.0 5,678,259.4
HC.2.1
Inpatient rehabilitative care
3,619,576.0
0.0 0.0 3,619,576.0
HC.2.2
Day rehabilitative care
0.0 0.0 230,543.0
0.0 230,543.0
HC.2.3
Outpatient rehabilitative care
110,000.
0
235,353.0
0.0 345,353.0
HC.1.1+HC.2.1
Inpatient curative and rehabilitative care
312,701,641.
4
3,320,000.0
607,507.6
0.0 316,629,149.0
HC.1.2+HC.2.2
Day curative and rehabilitative care
12,390,087.4
0.0 230,543.0
0.0 12,620,630.4
HC.1.3+HC.2.3
Outpatient curative and
11,203,898.7
312,789,214.2
0.0 495,804.6
1,834,720.0
326,412,585.5

40 | P a g e
rehabilitative care
HC.4.1
Laboratory services
0.0 28,838.0
788,364.4
550,000.0
0.0 1,367,202.4
HC.4.3
Patient transportation
104,140,023.
9
145,474,729.3
30,000.0
0.0 10,000.0
249,654,753.2
HC.4.nec
Unspecified ancillary services (n.e.c.)
34,386.0
0.0 152,468.4
0.0 186,854.4
HC.5.1.1
Prescribed medicines
342,667,184.
9
0.0 478,780,427.
4
0.0 821,447,612.3
HC.5.2.1
Glasses and other vision products
0.0 0.0 6,331,785.9
0.0 6,331,785.9
HC.5.2.2
Hearing aids
0.0 0.0 1,948,241.8
0.0 1,948,241.8
HC.5.2.3
Other orthopedic appliances and prosthetics (excluding
0.0 0.0 646,873.0
0.0 646,873.0

41 | P a g e
glasses and hearing aids)
HC.6.1.1.nec
Other and unspecified addictive substances IEC programs (n.e.c.)
0.0 0.0 201,972.6
0.0 201,972.6
HC.6.1.2
Nutrition IEC programs
0.0 413,655.7
5,525,800.3
0.0 1,893,534.0
7,832,989.9
HC.6.1.3
Safe sex IEC programs
0.0 0.0 78,348.6
0.0 78,348.6
HC.6.1.nec
Other and unspecified IEC programs (n.e.c.)
0.0 0.0 3,127,968.5
0.0 101,630.
5
81,919.0
3,311,518.0
HC.6.2
Immunization programs
0.0 158,950.5
57,218,757.4
0.0 57,377,707.9

42 | P a g e
HC.6.4
Healthy condition monitoring programs
79,409.2
0.0 0.0 79,409.2
HC.6.5.1
Planning & management
0.0 0.0 5,805.0
5,805.0
HC.6.6
Preparing for disaster and emergency response programs
0.0 131,006.3
5,525,800.3
5,521.0
5,662,327.5
HC.6.7
Food distribution for preventing malnutrition
0.0 29,589,769.0
315,573.0
0.0 100,576.3
2,143,366.0
32,149,284.3
HC.6.8
Preventive care of HIV,TB, malaria, and vaccine-preventa
0.0 3,758,932.2
2,723,209.9
0.0 6,482,142.1

43 | P a g e
ble disease
HC.6.9
Prevention and public health services
0.0 4,492,773.8
9,455,971.3
10,141.0
2,239,498.7
3,551,327.9
22,287.8
21,714,636.1
HC.6.nec
Unspecified preventive care (n.e.c.)
0.0 0.0 0.0 965.5
965.5
HC.7.1.1
Planning & management
0.0 0.0 538,382.0
538,382.0
HC.7.1.2
Monitoring & evaluation (M&E)
0.0 0.0 434,623.0
434,623.0
HC.7.1.3
Procurement & supply management
0.0 0.0 806,042.0
806,042.0
HC.7.1.4
Leadership, management, and administrative
0.0 0.0 41,150,240.
9
41,150,240.9

44 | P a g e
HC.7.1.5
Administration of TB program
0.0 0.0 363,476.8
363,476.8
HC.7.1.6
Administration of malaria program
0.0 0.0 322,165.2
322,165.2
HC.7.1.7
Administration of CH program
0.0 0.0 748,775.8
748,775.8
HC.7.1.8
Administration of RH program
0.0 0.0 2,904,269.3
2,904,269.3
HC.7.1.9
Administration of HIV/AIDS program
0.0 0.0 1,948.9
1,948.9
HC.7.1.nec
Other governance and health system administration (n.e.c.)
0.0 0.0 38,520,480.
0
38,520,480.0
HC.9
Other healthcare services
0.0 158,950.5
0.0 51,800.9
210,751.4

45 | P a g e
not classified elsewhere (n.e.c.)
All HC 783,216,631.
5
3,320,000.0
497,604,327.0
30,000.0
788,364.4
702,468.4
478,780,427.
4
9,157,443.7
84,173,401.9
85,811,871.
0
2,845,879.6
9,525,543.9
156,007.7
1,958,143,950.
0
Memorandum
items
0.0 0.0
HCR.2.3
Community mobilization
0.0 0.0 189,276.0
189,276.0
HCR.2.4
Education and training of health personnel
38,836.1
496,621.4
88,232.5
3,149,261.9
931,028.
5
693,673.
0
6,027,931.6
HCR.2.5
Other food, hygiene, and drinking water control
0.0 0.0 570,808.6
664.7
571,473.3
HCR.2.6
Other research and development in health
0.0 0.0 199,685.
6
277,501.
0
477,186.6

46 | P a g e
Table A.5: Financing Agents, by Financing Sources, HF x FA
Reported currency: US Dollar Financing
agents
FA.1.1.1 FA.1.1.5 FA.1.1.6 FA.1.1.7 FA.1.1.8
FA.4 FA.5 FA.7 All FA
Financing schemes
Min
istry
of
Pub
lic
Hea
lth
Min
istry
of
Def
ense
Min
istry
of
Inte
rior
Aff
airs
Min
istry
of
Hig
her
Educ
atio
n
Min
istry
of
Ed
ucat
ion
Non
prof
it in
stitu
tions
se
rvin
g ho
useh
old
s (N
PISH
)
Hou
seho
ld s
Oth
er
coun
tries
of
the
wor
ld
HF.1.1.1.1 Ministry of Public Health
203,331,791
2,475,445 358,338 206,165,574
HF.1.1.1.2 Ministry of Defense
21,597,442
21,597,442
HF.1.1.1.3 Ministry of Interior Affairs
9,348,241
9,348,241
HF.1.1.1.4 Ministry of Higher Education
7,674,712
7,674,712
HF.1.1.1.5 Ministry of Education
208,539 208,539
HF.2.2.1 NPISH financing schemes (excluding HF.2.2.2)
3,725,504
3,725,504
HF.2.2.2 Resident foreign agencies’ schemes
67,193 2,055,261
276,761,381
278,883,835
HF.3.1 Out-of-pocket, excluding cost sharing
1,430,540,103
1,430,540,103
All HF 203,398,984
24,072,887
9,348,241
7,674,712
208,539 6,139,102
1,430,540,103
276,761,381
1,958,143,950

47 | P a g e
Table A.6: Financing Sources, by Diseases, FS X DIS
Reported currency: US Dollar Non-disease-specific expenditures reported separately
Revenues of healthcare financing schemes FS.1.1.1 FS.2 FS.6.3 FS.7.1.4 FS.8.1 All FS
Classification of
diseases /
conditions
Cen
tral
gove
rnm
ent
reve
nue
Tran
sfer
s di
strib
uted
by
gove
rnm
ent
from
fore
ign
orig
in
Oth
er re
venu
es
from
NPI
SH
n.e.
c.
Dire
ct fo
reig
n fin
anci
al
trans
fer
Hou
seho
lds’
ou
t-of-
pock
et
DIS.1.1.1.1 HIV/AIDS 1,480,000
78,349
2,467,044
4,025,392
DIS.1.2.3 TB treatment (general) 313,148
199,353
806
18,158,951
2,696,541
21,368,799
DIS.1.3 Malaria 86,199
1,701,682
4,647
9,534,286
5,640,387
16,967,201
DIS.1.7 Vaccine-preventable diseases 770,698
770,698
DIS.2.1 Maternal conditions 697,618
5,292,442
57,721
8,545,440
44,239,469
58,832,690
DIS.2.2 Perinatal conditions 1,215,935
8,843,110
98,905
4,123,682
75,804,044
90,085,675
DIS.2.3 Contraceptive management (family planning) 1,132,664
8,581,442
96,024
5,025,149
73,596,160
88,431,439
DIS.2.4 SBA 1,303,493
9,491,609
106,160
4,843,153
81,364,643
97,109,058
DIS.7.1 ARI 2,690,216
26,813,457
281,491
7,083,140
246,926,222
283,794,526
DIS.7.2 Diarrheal disease 2,296,284
8,036,760
70,606
3,320,179
83,217,639
96,941,469
DIS.7.3 Malnutrition (nutritional deficiencies) 819,049
4,076,961
39,224
52,163,493
39,936,930
97,035,658
DIS.7.4 Anemia 366,002
1,603,935
18,138
448,290
13,901,497
16,337,862

48 | P a g e
DIS.7.5 Child immunization 2,127,764
7,475,741
72,551
50,310,033
59,986,089
DIS.7.6 Other 31,839,215
58,143,182
2,800,883
74,825,357
763,216,572
930,825,209
DIS.8 Governance, management, and administration 44,466,270
4,730,000
5,948,349
55,144,619
DIS.9 All diseases of IPD & OPD 7,565,134
795,841
25,440,191
33,801,166
DIS.10 Health promotion lifesaving through RMNCH 47,839
47,839
DIS.nec Other and unspecified diseases/conditions (n.e.c.)
210,000
600,000
5,828,561
6,638,561
All DIS 97,128,992
147,865,516
3,725,504
278,883,835
1,430,540,103
1,958,143,950

49 | P a g e
Table A.7: Capital Expenditure, by Providers, HK x HP
Healthcare
providers
HP.1 HP.1.1 HP.1.2 HP.1.3 HP.3 HP.3.4.9 HP.4 HP.6 HP.7 HP.7.4 HP.8 HP.nec All HP
Capital Account
Hos
pita
ls
Gen
eral
ho
spita
ls
Men
tal
heal
th
hosp
itals
Sp
ecia
lized
ho
spita
ls
(oth
er th
an
men
tal h
ealth
ho
spita
ls)
Prov
ider
s of
ambu
lato
ry
heal
thca
re
All
othe
r am
bula
tory
ce
nter
s
Prov
ider
s of
anci
llary
se
rvic
es
Prov
ider
s of
prev
entiv
e ca
re
Prov
ider
s of
heal
thca
re
syst
em
adm
inis
tratio
n an
d fin
anci
ng
Gov
erna
nce,
te
chni
cal
assi
stan
t ad
min
istra
tiv e
Res
t of
econ
omy
Uns
peci
fied
heal
thca
re
prov
ider
s (n
.e.c
.)
HK.1.1.1.1 Residential and non-residential buildings
502,961
3,063,061
3,566,022
HK.1.1.1.2 Other structures 1,227,916 532,662 21,706 2,303,467 3,684,573 00,000 500,253 1,067,641 4,137,584 13,675,804 HK.1.1.2.1 Medical
equipment 2,418,034
4,322,864
24,505 13,587
234,583
7,013,572
HK.1.1.2.2 Transport equipment
2,197,015
26,700
7,197
2,230,912
HK.1.1.2.3 ICT equipment 264,076 11,189 9,925 92,915 11,000 1,999 1,999 593,103 HK.1.1.2.4 Machinery and
equipment n.e.c.
380,196 1,470,839
14,063
1,468,979
138,219
154,773
1,067,537
49,143
4,743,749
HK.1.1.3.1 Computer software and databases
140,760
140,760
HK.1.nec Unspecified gross capital formation (n.e.c.)
377,183 796,865
10,522
301,931
27,915
216,201
34,842
29,653
1,795,113
HK.2.2 Other non-produced, non-financial assets
43,616
43,616
HK.nec Unspecified gross fixed capital formation (n.e.c.)
41,335
12,466
53,801
All HK 4,667,405 532,662
21,706
2,314,656
13,210,754
3,287,646
24,505
2,577,665
1,518,524
370,975
5,249,159
80,795
33,856,452

50 | P a g e
Annex B: Classification of Health Expenditure
Annex. Major Contributors to Afghanistan’s Health Sector
Donor Name Total Expenditure
(Amount in USD)
Total Expenditure
(Percentage)
Households 1,430,540,103 71.81% MoPH as government revenue expenditure 99,581,150 5.00% USAID 80,671,944 4.05% UNICEF 49,706,104 2.50% World Bank 41,060,000 2.06% WHO 35,539,545 1.78% MoD 29,243,500 1.47% MSF 25,954,110 1.30% EU 25,534,092 1.28% JICA 24,464,213 1.23% WFP 22,462,584 1.13% Multiple donors 21,359,934 1.07% ISAF 16,367,422 0.82% CIDA 15,040,546 0.76% GAVIHSS 10,145,662 0.51% ICRC 10,074,229 0.51% UNFPA 9,698,664 0.49% MoI 9,348,241 0.47% Emergency 9,276,001 0.47% MoHE 7,674,713 0.39% AKDN 6,439,470 0.32% TIKA 4,423,473 0.22% ARCS 4,296,977 0.22% IFRC 2,460,168 0.12% Italian cooperation 340,788 0.02% MoE 296,772 0.01%
Total Health Expenditure 1,992,000,405 100%

51 | P a g e
Glossary
Current Health Expenditure (CHE): CHE reported in the SHA is the sum of
healthcare goods and services for final consumption by resident. When broken
down by providers (as in SHA table HC x HP), it also represents the value of that
part of the output of health providers consumed by households; NPISH and
general government are valued at market prices. SHA calls “provision” the value
of the health providers’ output used as final consumption. The same information
would be recorded in SNA in the supply-and-use tables and the production
account―the account showing output as a resource and intermediate
consumption as use. The value of goods and services consumed as intermediate
consumption by health providers is also recorded in the SHA HC x FP tables,
which make use of the factors of provision classification.
Total Health Expenditure (THE): THE consists of all recurrent and capital
expenditures incurred for a period of time and is reported in the SHA.1
methodology.
Gross Domestic Product (GDP): A statistic that refers to the total market value of
goods and services produced within a given period, after deducting the cost of
goods and services used in the process of production but before deducting an
allowance for the consumption of fixed capital.
System of Health Accounts (SHA) (OECD, 2011): A standardized framework for
reporting and classifying health expenditure, developed by OECD and endorsed
by WHO for international reporting by countries.
Financing Scheme: Health care financing schemes are the main types of financing
arrangements through which people obtain health services. Health care financing
schemes includes direct payments by households for services and goods and third
party financing arraignments.
Financing Sources: A term used for the entities that provide resources to
“financing agents” for pooling and distribution. In the case of households in
Afghanistan, the financing source and agent are the same. Most financing sources
are defined clearly by their names.

52 | P a g e
References (OECD), (2011). System of Health Accounts. 2011 (SHA2011), Organization of Economics and
Coordination Development. Organization of Economics and Coordination Development.
Central Statistical Organization, C. (2014). CSO Statistical year book. Kabul, Afghanistan.
MoPH. (2010). Basic Package of Health Services (BPHS) 2010. Kabul: Ministry of Public Health.
MoPH. (2016). National Health Strategy 2016–2020. Kabul, Afghanistan: Government Islamic Republic of Afghanistan, Ministry of Public Health.
OECD, E. W. (2011). A System of HEalth Accounts,. OECD.
WHO. (2003). National Health Accounts Production Guide to produce National Health Accounts
with special applications for low and middle- income countries . Geneva, Switzerland: WHO.
WHO. (n.d.). Nationial Health Accounts Production Tool, User Guide. World Health Organization, USAID, World Bank.

Afghanistan third round of National Health Accounts,
including disease accounts, covers the estimates of
health spending for the year 2014.