afghanistan - global humanitarian assistance
TRANSCRIPT

BR
IEF
ING
PA
PE
R
Tracking major resource fl ows 2002-2010
AFGHANISTAN
AUTHOR:
Lydia PooleDATE:
January 2011VERSION:
1
WORKSTREAMS:
Confl ict & the Military

INTRODUCTIONCONTENTS
International investments
in Afghanistan 2
Have aid pledges been met? 4
Afghanistan compared with other
aid recipients 5
Who are the main donors? 7
How is aid spent? 9
Funding through the Government 9
Funding through the United
Nations (UN) and civil society 10
Funding through military actors 11
What is aid spent on? 11
Sectoral funding 11
Humanitarian aid 13
Domestic security 15
External security presence 16
Domestic investments and resources 17
Measures of progress 19
Annex 21
Basic concepts and defi nitions 21
1
This report refl ects on what we know of international
contributions to Afghanistan, including aid, security and
military-related spending from 2002 to the latest available
data. It considers the contributions of domestic resources
and other resource fl ows in Afghanistan, including foreign
direct investment, remittances and illicit fl ows. It also
identifi es critical gaps in our knowledge with regard to
tracking resource fl ows for poverty reduction, including
and beyond aid.
1
TOTAL AID PLEDGED
US$62 billion2002–13
HUMANITARIAN AID IN 2009
US$592 million
AID WITH LITTLE OR NO AFGHAN
GOVERNMENT INVOLVEMENT
77%2009
GOVERNMENT REVENUE
US$1.3 billion2009
FOREIGN MILITARY OPERATIONS
US$63.1 billion2009
TOTAL INTERNATIONAL AID
US$26.7 billion2002–09
NATO ISAF TROOPS
131,730DECEMBER 2009
AID IN 2009
US$6.1 billion2009

Since late 2001, Afghanistan has become a major site of
concentration of international aid, security and military
resources, totalling around US$286.4 billion, or US$9,426
per Afghan citizen.
Between 2002 and 2009, US$26.7 billion in aid was spent in
Afghanistan. By 2009, Afghanistan was the leading global
recipient of offi cial development assistance (ODA), for the
second consecutive year.
Afghanistan also hosts the world’s largest and most costly
international peacekeeping force mandated by the United
Nations (UN). Foreign military operations in the country
have cost in excess of US$242.9 billion. Volumes of funding
in support of building the security sector and of counter-
narcotics activities are extremely diffi cult to trace, but total
at least US$16.1 billion.
NOTE ON AID TERMINOLOGY
AID
For the purposes of this report, ‘aid’ refers to offi cial
development assistance (ODA) reported to the
Development Assistance Committee of the Organisation
for Economic Co-operation and Development (OECD
DAC), plus aid reported to the Afghanistan Donor
Assistance Database (DAD) by government donors who
do not report to the OECD DAC.
The relatively small amount of aid included here which
is reported through the Afghanistan DAD may include
aid that is not considered eligible under the OECD DAC’s
criteria for ODA.
OFFICIAL DEVELOPMENT ASSISTANCE (ODA)
ODA is a grant or loan from an ‘offi cial’ (government)
source to a developing country or multilateral agency for
the promotion of economic development and welfare.
It is reported by members of the OECD DAC according to
strict criteria each year and by a small number of donors
outside of the OECD DAC group, who typically report a
less comprehensive dataset.
CURRENT/CONSTANT PRICES
All fi gures stated are current prices unless stated
otherwise. Constant (real terms) fi gures show how
expenditure has changed over time after removing the
effects of exchange rates and infl ation. DAC defl ators,
along with annualised exchange rates, are available at:
www.oecd.org/dac. The base rate year used by the DAC
during 2010 was 2008.
For fuller defi nitions of these and other terms,
see ‘Basic concepts and defi nitions’ on page 21.
Sources: Development Initiatives based on OECD DAC data; Government of the Islamic Republic of Afghanistan (GIRoA) Donor
Assistance Database (DAD); Stockholm International Peace Research Institute (SIPRI) database of Multilateral Peacekeeping
Operations; and Development Initiatives research
FIGURE 1: INTERNATIONAL AID, SECURITY AND MILITARY EXPENDITURE, 2002–2009
Foreign military operations (NATO ISAF and OEF) - US$242.9bn
Security related aid/non ODA eligible - US$16.1bn
Aid - US$26.7bn
Multilateral peacekeeping (UNAMA and EUPOL) - US$0.8bn: 0.3%
84.6%
5.6%
9.4%
INTERNATIONAL INVESTMENTS IN AFGHANISTAN
2

3
Bonn Agreement Keywords: Transitional Authority, constitution, elections, ISAF
• Established an Interim Authority for six months, to be replaced by a Transitional
Authority tasked with drafting a constitution and holding elections within two years.
• Set out the roles of a UN-mandated force in securing Kabul, with possible later
expansion, and in training new Afghan security forces.
Tokyo Donor Conference Keywords: recovery, reconstruction
Constitution • New constitution adopted.
Berlin Donor Conference Keywords: recovery, reform, development
Elections • Hamid Karzai elected in presidential elections.
Elections • National Assembly and Provincial Council elections.
Afghanistan Compact Keywords: poverty reduction, aid effectiveness
• Successor to the Bonn Agreement; defi ned principles of cooperation for 2006–11.
• Agreed pillars of activity: security; governance, rule of law and human rights;
economic and social development.
• Performance benchmarks and timelines agreed (many by end of 2010).
• Commitments made to improve aid effectiveness.
Afghan National Development Strategy
(ANDS)
• The ANDS established the strategy, policies, programmes and projects of the Government of
the Islamic Republic of Afghanistan (GIRoA) to be implemented from 2008 to 2012 to achieve
the GIRoA’s development objectives. These are organised under three pillars: (i) security;
(ii) governance, rule of law and human rights; and (iii) economic and social development.
• Cross-cutting issues include: (i) regional cooperation; (ii) counter-narcotics;
(iii) anti-corruption; (iv) gender equality; (v) capacity development; and
(vi) environmental management.
• Donors are encouraged to implement their projects through the national budget or
at the least to ensure that their projects are aligned with ANDS objectives and priorities.
Paris Declaration Keywords: reconstruction, development
• Donors expressed commitments in support of the ANDS.
The Hague Conference Declaration Keywords: good governance, economic growth, security
• Participants stressed the need for greater Afghan ownership of security
and economic development.
London Conference Keywords: security, anti-corruption, reconciliation
• A phased transition to an Afghan lead on security operations to begin late 2010/early 2011.
• Targets for signifi cant increases in Afghan National Army (ANA) and Afghan National
Police (ANP) personnel announced: 171,000 recruits to the ANA and 134,000 to the
ANP by the end of 2011.
• Signifi cant increases in international forces (to around 135,000) announced
with an accompanying ‘civilian surge’.
• A Peace and Reintegration Trust Fund mooted to offer economic alternatives
to those who renounce violence.
• Commitments made to better-coordinated development assistance, increasingly channelled
through the GIRoA. In turn, the GIRoA committed to anti-corruption measures.
Kabul Conference Keywords: security handover
• Afghan forces to lead security operations by 2014.
• At least 50% of aid to be channelled through the Government of Afghanistan.
2001
2005
2002
2004
2008
2006
2009
2010
EVENTS OUTCOMES

HAVE AID PLEDGES BEEN MET?
Donors have pledged a total of US$62 billion in aid
for the reconstruction of Afghanistan in a series of
donor conferences and supplemental pledges for
the period 2002–13.1
Between 2002 and 2009, 43.1% of the total
US$62 billion pledged was disbursed to
development projects and activities.
Individual donor governments vary signifi cantly in their
delivery against pledges. Amongst the leading ten donors,
the European Union (EU) Institutions2, Germany, Sweden
and the Netherlands have disbursed more than they
pledged, while at the end of 2009 the United States and
India had yet to deliver 60% of the amounts that they
pledged for the whole period up to 2013. (See fi gure 2).
TOTAL
PLEDGED
2002-2013
TOTAL
COMMITTED
2002-2009
TOTAL
DISBURSED
2002-2009
% OF PLEDGES
DISBURSED BY
END 2009
US$bn US$bn US$bn
United States 38.0 28.4 10.9 28.8%
EU Institutions 2.0 2.0 2.1 102.8%
United Kingdom 2.9 1.8 1.8 63.3%
Germany 1.2 1.0 1.3 108.0%
Canada 1.7 1.2 1.2 70.3%
Japan 1.9 1.4 1.0 52.5%
Netherlands 0.8 0.9 0.8 102.4%
Norway 0.9 0.6 0.7 71.0%
India* 1.2 1.2 0.4 36.1%
Sweden 0.3 0.5 0.4 147.3%
Italy 0.5 0.4 0.4 79.6%
Turkey 0.2 0.2 0.4 213.7%
Australia 0.4 0.2 0.4 98.8%
Iran (Islamic Republic of)* 0.9 0.3 0.3 39.5%
Spain 0.5 0.1 0.3 59.8%
Denmark 0.7 0.3 0.3 40.2%
France 0.2 0.2 0.2 105.9%
Finland 0.2 0.2 0.1 97.0%
Russia* 0.1 0.1 0.1 104.1%
Switzerland 0.1 0.1 0.1 102.9%
Multilateral agencies 5.3 4.0 2.7 50.6%
Others 5.9 3.3 0.7 12.3%
Total 62.0 46.1 26.7 43.1%
Sources: Development Initiatives based on GIRoA Ministry of Finance data; Afghanistan DAD; and OECD DAC data.
*Note: all disbursements are based on OECD DAC data, excluding India and Russia, which are based on Afghanistan DAD data.
FIGURE 2: AID PLEDGES, COMMITMENTS AND DISBURSEMENTS
4

The volume of aid disbursed has risen each year since
2002, to a high of US$6.1 billion in 2009. (See fi gure 3).
The OECD DAC survey of forward spending plans of 20
OECD DAC donors and 11 multilateral agencies, however,
indicates that country programmable aid3 spending in
Afghanistan was expected to fall in 2010 – although this
does not include predicted aid from the United States,
Japan and Greece, who have not reported their forward
spending plans to the OECD DAC.4 The United States
contributed 49.1% and Japan 2.8% of the total ODA to
Afghanistan in 2009. Their omission from these forward
spending plans is therefore a signifi cant barrier to
achieving more predictable aid. (See fi gure 4).
US$
BIL
LIO
N
1.4
2002 2003 2004 2005 2006 2007 2008 2009
1.82.4
3.0 3.1
4.0
5.0
6.1
DAC countries
Non-DAC countries
Multilateral agencies
Total
FIGURE 3: AID DISBURSEMENTS TO AFGHANISTAN FROM GOVERNMENT DONORS AND MULTILATERAL AGENCIES, 2002–2009
Source: Development Initiatives, based on OECD DAC and Afghanistan DAD data
Source: OECD DAC
FIGURE 4. PLANNED COUNTRY PROGRAMMABLE AID TO AFGHANISTAN, EXCLUDING PREDICTED AID FROM
UNITED STATES, JAPAN AND GREECE
US$
BIL
LIO
N (C
ON
STA
NT
2008
PR
ICES
2009 (provisional) 2010 (predicted) 2011 (predicted) 2012 (predicted)
4.8
4.6 4.64.5
5

AFGHANISTAN COMPARED WITH
OTHER AID RECIPIENTS
In 2000, the year before the war, Afghanistan was the
69th largest recipient of ODA worldwide, receiving 0.3% of
total ODA fl owing to developing countries. By 2008, it had
become the world’s leading aid recipient.
Afghanistan’s share of total ODA to developing countries
increased again by a massive US$1.3 billion in 2009 to
a historic high of US$6.2 billion (constant 2008 prices),
the second largest amount ever received in a single year
by any recipient country, behind Iraq’s US$8.8 billion in
2005. In 2009, Afghanistan received 4.9% of total ODA to
developing countries. (See fi gure 5).
Despite the relatively large overall volumes of aid,
Afghanistan has received less aid per person from donors
reporting to the OECD DAC than other countries that have
also recently experienced interventions by international
forces prior to the establishment of multilateral
peacekeeping operations. At its peak, Afghanistan received
US$172 per person, compared with Bosnia’s peak of
US$369 and Iraq’s peak of US$315. (See fi gure 6).
FIGURE 6. AID PER CAPITA IN RELATION TO YEARS BEFORE AND AFTER INTERNATIONAL MILITARY INTERVENTIONS
FIGURE 5: TOP FIVE RECIPIENTS OF AID FROM ALL DONORS REPORTING TO THE OECD DAC, 2002-2009, CONSTANT 2008 PRICES, US$ BILLION
Source: Development Initiatives, based on OECD DAC data
Source: Development Initiatives, based on OECD DAC data
US$
PER
CA
PIT
A (C
ON
STA
NT
2008
PR
ICES
)
400
350
300
250
200
150
100
50
0
Iraq
Afghanistan
Bosnia
Sierra Leone
-3 -2 -1 0 1 2 3 4 5 6 7 8 9 10 11 12 13
FIRST YEAR OF INTERNATIONAL MILITARY INTERVENTION
2001 2002 2003 2004 2005 2006 2007 2008 2009
India
2.5
Pakistan
2.8
Iraq
2.8
Iraq
5.1
Iraq
8.8
Iraq
5.9
Iraq
4.5
Afghanistan
4.9
Afghanistan
6.2
Pakistan
2.5
Palestinian
/OPT 2.5
Viet Nam
2.2
Afghanistan
2.7
Afghanistan
3.2
Afghanistan
3.3
Afghanistan
4.1
Ethiopia
3.3
Ethiopia
3.9
Serbia
2.3
India
2.4
Tanzania
2.2
Viet Nam
2.1
Indonesia
2.3
Pakistan
2.4
Viet Nam
2.7
Iraq
3.3
Viet Nam
3.7
China
2.2
China
2.0
Afghanistan
2.1
Ethiopia
2.0
Viet Nam
2.2
Sudan
2.3
Ethiopia
2.7
Palestinian
/OPT 2.6
Palestinian
/OPT 3.1
Viet Nam
2.1
Afghanistan
2.0
Ethiopia
2.0
Tanzania
2.0
Ethiopia
2.2
Viet Nam
2.1
Pakistan
2.3
Viet Nam
2.5
Tanzania
3.0
6

WHO ARE THE MAIN DONORS?
Donors reporting to the OECD DAC account for the
largest share of aid to Afghanistan. The United States
is the largest donor by a clear margin, having provided
40.9% of the total aid between 2002 and 2009. The top fi ve
donors reporting to the DAC – the United States, the EU
Institutions, the United Kingdom, Germany and Canada –
collectively provided 64.9% of the total aid to Afghanistan
between 2002 and 2009. (See fi gure 7).
OECD DAC member governments have provided a growing
share of the total volume of aid to Afghanistan, from 72.5%
in 2002 to 80.4% in 2009. Moreover, donor contributions
have shown an increasing concentration, with the share of
the United States growing from 27.0% of the total in 2002
to 48.7% of all aid contributions in 2009. (See fi gure 8).
Government donors outside of the OECD DAC have
reported US$1.6 billion in contributions, 6.0% of the total
aid received between 2002 and 2009. India is the leading
non-DAC donor by volume, having contributed US$432.2
million, followed by Turkey with US$406.1 million and Iran
with US$340.9 million. (See fi gure 9).
TOTAL
BILATERAL AID
DISBURSED
BILATERAL AID
TO AFGHANISTAN
AS % OF AID FROM
ALL DONORS
CONTRIBUTIONS
TO AID SPENT
THROUGH
MULTILATERAL
AGENCIES
SHARE OF BILATERAL
AID CHANNELLED
VIA GOVERNMENT
ALIGNED POOLED
FUNDS
NATIONAL TROOP
CONTRIBUTION AS
SHARE OF TOTAL ISAF
FORCE AT OCT 2010
US$m US$m
United States 10,926 40.9% 278 7.7% 69.0%
EU Institutions 2,093 7.8% 24 31.1% -
United Kingdom 1,835 6.9% 522 44.0% 7.3%
Germany 1,283 4.8% 638 19.5% 3.4%
Canada 1,181 4.4% 80 43.8% 2.2%
Japan 997 3.7% 362 15.5% 0.0%
Netherlands 771 2.9% 212 45.0% 0.3%
Norway 666 2.5% 86 26.7% 0.3%
India* 434 1.6% No data 0.3% -
Sweden 426 1.6% 80 25.7% 0.4%
Italy 410 1.5% 361 20.1% 2.5%
Sources: Development Initiatives, based on OECD DAC; World Bank; United Nations Development Programme (UNDP); and NATO data.
FIGURE 7: TOP TEN GOVERNMENT DONORS, PLUS THE EU INSTITUTIONS, 2002–2009
7

US$
BIL
LIO
N
2002 2003 2004 2005 2006 2007 2008 2009
EU Institutions
Japan
Canada
Germany
United KIngdom
United States
Other DAC countries
6
5
4
3
2
1
0
FIGURE 8: DAC DONOR AID TO AFGHANISTAN 2002–2009
Source: Development Initiatives, based on OECD DAC data
FIGURE 9: NON-DAC DONOR AID TO AFGHANISTAN, 2002–2009
Source: Development Initiatives, based on OECD DAC and Afghanistan DAD data
US$
MIL
LIO
N
400
350
300
250
200
150
100
50
02002 2003 2004 2005 2006 2007 2008 2009
Czech Repbublic
Russian Federation
Iran
Turkey
India
Others
8

HOW IS AID SPENT?
FUNDING THROUGH THE GOVERNMENT
The Government of the Islamic Republic of Afghanistan
(GIRoA) estimates that 77% of aid channelled to the
country up to mid-2009 was directed bilaterally to projects,
with little or no involvement from the government itself.5
The largest proportion of aid captured within the OECD
DAC Creditor Reporting System (CRS) is reported as
having been channelled via the public sector. In 2009,
38.9% of aid reported to the CRS was channelled via the
public sector. However, within this category a relatively
small amount, and a falling proportion of the total aid
channelled through public sector actors, is reported as
having been channelled through the Afghan government.
(See fi gure 10).
Of the 23% of funds that the GIRoA reports as having
been government-managed between 2002 and July 2009,
47.4% was channelled via three major pooled funds, which
support government-identifi ed priorities described in the
2008 Afghan National Development Strategy (ANDS). The
GIRoA has primary responsibility for the prioritisation and
management of funds, while third party fi duciary agents
receive and administer funds on behalf of donors and the
GIRoA. (See fi gure 11).
Sources: World Bank and UNDP
FIGURE 11: GOVERNMENT-ALIGNED POOLED FUNDS IN AFGHANISTAN
NAME LAW AND ORDER TRUST FUND
FOR AFGHANISTAN (LOTFA)
AFGHANISTAN RECONSTRUCTION
TRUST FUND (ARTF)
COUNTER NARCOTICS TRUST
FUND (CNTF)
Administering agent UNDP World Bank UNDP
Period of contributions reported Jan-02 Dec-10 Jan-02 Oct-10 Jun-05 Dec-09
Total value of contributions US$1,594m US$3,984m US$68m
FIGURE 10: AID CHANNELLED THROUGH THE PUBLIC SECTOR, 2007–2009
Source: Development Initiatives based on OECD DAC CRS data
US$
MIL
LIO
N
Public sector (recipient)
Public sector (donor)
Public sector (unspecified)
2007 2008 2009
250.7 197.3
924.9
188.5314.3
214.1321.3
1,701.6
1,460.9
9
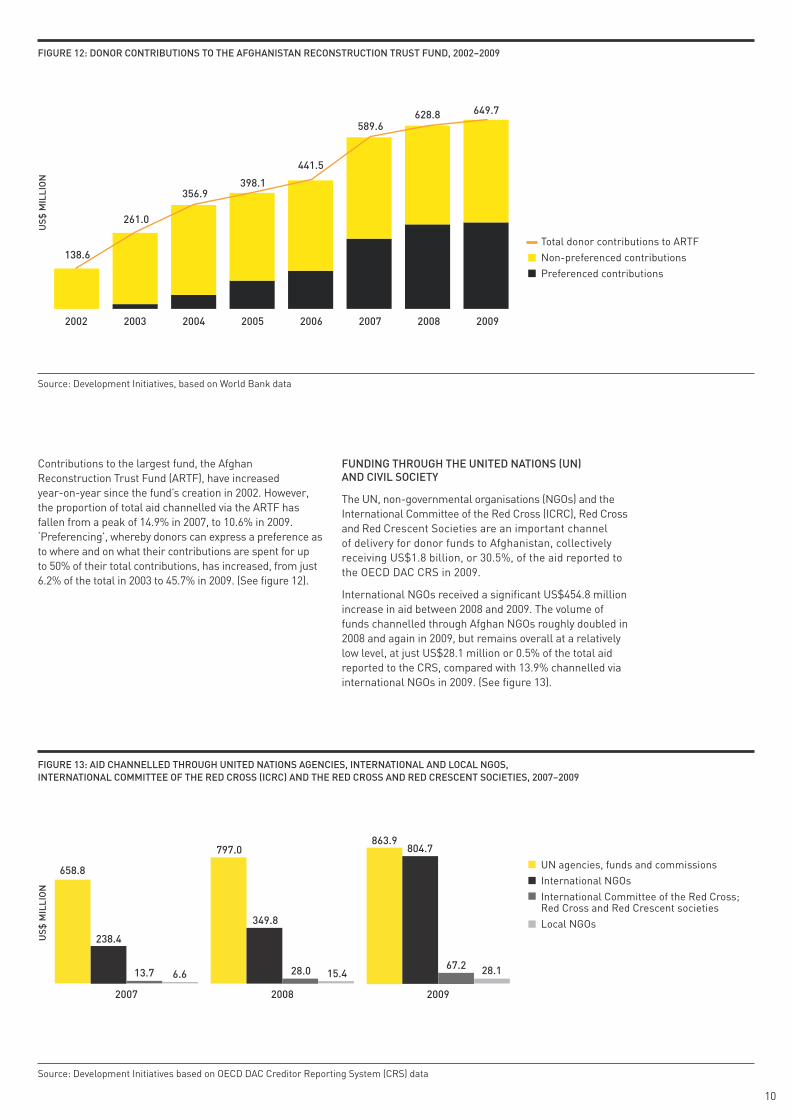
Contributions to the largest fund, the Afghan
Reconstruction Trust Fund (ARTF), have increased
year-on-year since the fund’s creation in 2002. However,
the proportion of total aid channelled via the ARTF has
fallen from a peak of 14.9% in 2007, to 10.6% in 2009.
‘Preferencing’, whereby donors can express a preference as
to where and on what their contributions are spent for up
to 50% of their total contributions, has increased, from just
6.2% of the total in 2003 to 45.7% in 2009. (See fi gure 12).
FUNDING THROUGH THE UNITED NATIONS (UN) AND CIVIL SOCIETY
The UN, non-governmental organisations (NGOs) and the
International Committee of the Red Cross (ICRC), Red Cross
and Red Crescent Societies are an important channel
of delivery for donor funds to Afghanistan, collectively
receiving US$1.8 billion, or 30.5%, of the aid reported to
the OECD DAC CRS in 2009.
International NGOs received a signifi cant US$454.8 million
increase in aid between 2008 and 2009. The volume of
funds channelled through Afghan NGOs roughly doubled in
2008 and again in 2009, but remains overall at a relatively
low level, at just US$28.1 million or 0.5% of the total aid
reported to the CRS, compared with 13.9% channelled via
international NGOs in 2009. (See fi gure 13).
FIGURE 12: DONOR CONTRIBUTIONS TO THE AFGHANISTAN RECONSTRUCTION TRUST FUND, 2002–2009
Source: Development Initiatives, based on World Bank data
Source: Development Initiatives based on OECD DAC Creditor Reporting System (CRS) data
FIGURE 13: AID CHANNELLED THROUGH UNITED NATIONS AGENCIES, INTERNATIONAL AND LOCAL NGOS,
INTERNATIONAL COMMITTEE OF THE RED CROSS (ICRC) AND THE RED CROSS AND RED CRESCENT SOCIETIES, 2007–2009
US$
MIL
LIO
N
138.6
261.0
356.9398.1
441.5
589.6628.8 649.7
2002 2003 2004 2005 2006 2007 2008 2009
Total donor contributions to ARTF
Non-preferenced contributions
Preferenced contributions
US$
MIL
LIO
N
UN agencies, funds and commissions
International NGOs
International Committee of the Red Cross; Red Cross and Red Crescent societies
Local NGOs
2007 2008 2009
658.8
797.0863.9
804.7
67.2 28.1
349.8
28.0 15.4
238.4
13.7 6.6
10

FUNDING THROUGH MILITARY ACTORS
Of the funding that the GIRoA Ministry of Finance
estimates to be outside its control, a signifi cant
proportion is channelled through foreign military actors,
via two North Atlantic Treaty Organisation (NATO)
managed trust funds and 27 joint civilian- and military-
managed Provincial Reconstruction Teams (PRTs), or
channelled directly to aid projects and implementing
agencies by foreign military actors.
The NATO-managed Afghan National Army (ANA) Trust
Fund has been rapidly increasing in importance since its
function was expanded in 2009 to include support to the
‘sustainment’ or recurrent costs of the ANA. It received
donor contributions of US$224.7 million between January
2007 and April 2010. NATO also manages a relatively small
Post-Operations Emergency Relief Fund, which received
US$3.5 million in donor contributions between January
2007 and October 2010.
The GIRoA estimates that around US$2 billion in aid has
fl owed via PRTs, and of this US$517.7 million is recorded
within the Afghanistan Development Assistance Database
(DAD). (See fi gure 14). NATO meanwhile reports that PRT
activities have contributed ‘more than US$545 million’.6
There are signifi cant gaps in the data on funds channelled
via military actors. A total of US$939.2 million in aid
channelled via foreign military actors is captured within the
Afghanistan DAD, but the Ministry of Finance estimates that
around US$14.9 billion in aid was channelled to Afghanistan
via foreign military sources between 2002 and July 2009.7
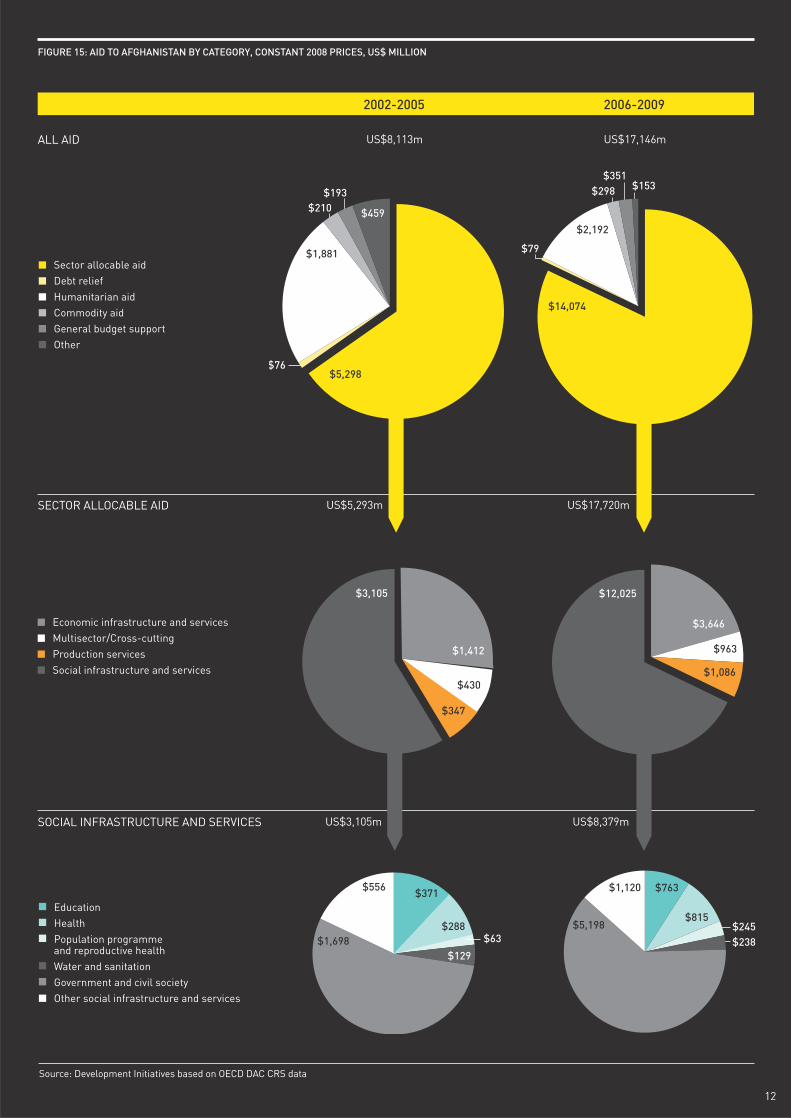
WHAT IS AID SPENT ON?
SECTORAL FUNDING
Of the aid reported to the OECD DAC, there has been
a clear shift in emphasis away from humanitarian aid
towards spending on sector-allocable aid, notably aid
directed towards social infrastructure and services, of
which the largest share is for activities aimed at building
the capacity of government and civil society.
(See fi gure 15).
FIRST-LEVEL IMPLEMENTING AGENCY
DONOR ISAF PRT DONOR MILITARY
US$m US$m US$m
EU Institutions 1.6 - -
Finland 8.7 3.2 -
France - - -
Netherlands 0.0 - -
Poland - 4.3 -
Sweden 5.3 2.0
United States (DoD) - 508.3 372.3
United States (USAID) - - 33.5
Total 15.7 517.7 405.8
Source: Development Initiatives, based on Afghanistan DAD data
FIGURE 14: AID CHANNELLED THROUGH MILITARY IMPLEMENTING ACTORS, 2002–2009
11
Education
Health
Population programme and reproductive health
Water and sanitation
Government and civil society
Other social infrastructure and services
Economic infrastructure and services
Multisector/Cross-cutting
Production services
Social infrastructure and services
Sector allocable aid
Debt relief
Humanitarian aid
Commodity aid
General budget support
Other
2002-2005 2006-2009
FIGURE 15: AID TO AFGHANISTAN BY CATEGORY, CONSTANT 2008 PRICES, US$ MILLION
Source: Development Initiatives based on OECD DAC CRS data
ALL AID US$8,113m US$17,146m
$5,298
$1,881
$210$193
$153$351
$298
$79
$14,074
$459
$76
$2,192
$1,412
$3,105 $12,025
$3,646
$430
$963
$1,086
$347
$63$288
$371$556 $1,120 $763
$815$245
$1,698$5,198
$129$238
SECTOR ALLOCABLE AID US$5,293m US$17,720m
SOCIAL INFRASTRUCTURE AND SERVICES US$3,105m US$8,379m
12

HUMANITARIAN AID
Humanitarian aid increased by 241.5% between 2000 and
2001, reaching a peak of US$890.0 million in 2002, following
the invasion in late 2001. Humanitarian aid had been on a
sharp downward trend since 2002 until a second upsurge
in 2008 to US$870.7 million, when food shortages and
increased insecurity contributed to a signifi cant elevation
in humanitarian needs. This growth in humanitarian aid
has not been sustained, however, and in 2009, despite
the US$1.3 billion increase in total aid, it fell by
US$278.3 million to just US$592.4 million. (See fi gure 16).
Afghanistan is one of the world’s leading recipients of
humanitarian aid, and yet on a per capita basis, it receives
far less than OPT/Palestine and signifi cantly less than
Somalia. In its peak year (2002), Afghanistan received
US$39.60 per person compared with Iraq (2003) US$44.30,
Somalia (2008) US$63.20 and OPT/Palestine (2009)
US$284.90. (See fi gure 17).
Afghanistan has been the subject of a UN consolidated
appeal (CAP) only three times between 2000 and 2010. The
humanitarian community has lacked a platform from which
to advocate for humanitarian funding amidst the powerful
20022001200019991998199719961995
191.4151.4
264.8
175.6112.6
174.0
594.2
890.0
508.2446.1
329.5 359.2 327.9
870.7
592.4
671.0
2003 2004 2005 2006 2007 2008 2009 2010*
US$
MIL
LIO
N
FIGURE 16: HUMANITARIAN AID TO AFGHANISTAN, 1995–2010
Source: Development Initiatives based on OECD DAC and UN OCHA Financial Tracking Service (FTS) data. *Note: 2010 data is reported
from the OCHA FTS, which is not subject to the same reporting criteria as the OECD DAC. Figure are therefore often higher than the
OECD DAC and are not directly comparable
20022001200019991998199719961995 2003 2004 2005 2006 2007 2008 2009US$
PER
CA
PIT
A (C
ON
STA
NT
2008
PR
ICES
)
300
250
200
150
100
50
0
Palestine/OPT
Somalia
Iraq
Afghanistan
FIGURE 17: HUMANITARIAN AID PER CAPITA COMPARISON WITH OTHER CONFLICT-AFFECTED HUMANITARIAN CRISES
Source: Development Initiatives based on OECD DAC data
13

reconstruction, state-building and stabilisation priorities
of many of the major donors. Only since the establishment
of a UN Offi ce for the Coordination of Humanitarian Affairs
(OCHA) offi ce in Kabul in 2009 has Afghanistan consistently
prepared a humanitarian action plan (HAP) and participated
in the UN humanitarian appeal process.
Afghanistan does not have a country-level pooled
humanitarian fund.8 It is the seventh largest recipient of
funds from the UN’s Central Emergency Response Fund
(CERF), receiving US$71.2 million from the fund’s inception
in 2006 to 2010.
In late 2009 a country-level Emergency Response Fund
(ERF) was created to enable national and international
NGOs to access funds to respond to unforeseen
humanitarian needs. The ERF was established with
modest contributions of US$6.3 million in total; these
came from Sweden (US$3.5 million), Norway (US$1.1
million), the Netherlands (US$0.7 million), Ireland (US$0.6
million) and Australia (US$0.4 million).
2010 funding to the UN HAP for Afghanistan indicates
that, while the overall amount of humanitarian funding
to the appeal has not increased, NGOs are increasingly
participating in and securing a greater share of the total
humanitarian funding received. (See fi gure 18).
UN AGENCIES (PLUS IOM) NGOS ALL RECIPIENTS
APPEAL
TITLE
TO
TA
L F
UN
DIN
G U
S$
m
% O
F T
OT
AL
FU
ND
ING
NO
. O
F P
RO
JE
CT
S F
UN
DE
D
% O
F T
OT
AL
NO
.
PR
OJ
EC
TS
FU
ND
ED
AV
ER
AG
E P
RO
JE
CT
SIZ
E
US
$ m
TO
TA
L F
UN
DIN
G U
S$
m
% O
F T
OT
AL
FU
ND
ING
NO
. O
F P
RO
JE
CT
S F
UN
DE
D
% O
F T
OT
AL
NO
.
PR
OJ
EC
TS
FU
ND
ED
AV
ER
AG
E P
RO
JE
CT
SIZ
E
US
$ m
TO
TA
L F
UN
DIN
G U
S$
m
NO
. O
F P
RO
JE
CT
S F
UN
DE
D
Afghanistan
HAP 2009492.0 95% 27 61% 18.2 28.0 5% 17 39% 1.6 520.0 44
Afghanistan
HAP 2010393.4 76% 19 30% 20.7 125.2 24% 45 70% 2.8 518.6 64
FIGURE 18: SHARE OF FUNDING WITHIN THE UN HUMANITARIAN ACTION PLAN (HAP) FOR AFGHANISTAN
RECEIVED BY UN AGENCIES AND NGOS
Source: Development Initiatives, based on UN OCHA FTS data
14

FIGURE 19: FUNDING TO THE SECURITY SECTOR, 2002–2009
Source: Development Initiatives, based on Afghanistan DAD data
61.5%
10.3%
6.6%
3.7%
2.8%
14.3%Government of Afghanistan - US$23.5m: 0.8%
EU Institutions - US$84.3m
Russia - US$109.0m
Germany - US$195.2m
Japan - US$305.4m
United States - US$1,815.4m
Other donors - US$421.4m
DOMESTIC SECURITY
Donors reporting to the OECD DAC have contributed
US$2.1 billion to activities within the security sector,
including demining, security system management and
reform and post-confl ict peace-building. The OECD
DAC’s eligibility criteria for security-related spending do
not allow the costs of ‘military equipment or services’,
including training, to be counted as ODA. Consequently,
donor contributions to funding training, equipment and
sustainment costs of the Afghan National Army and police
and some counter-narcotics activities that are non-ODA-
eligible are not refl ected in the OECD DAC data.
A slightly higher volume of funds to the security sector
is captured within the Afghanistan DAD, which records
US$3 billion, including US$24 million from the GIRoA.
(See fi gure 19). The real costs of building the security
sector in Afghanistan remain, however, largely untracked.
A limited selection of non-ODA-eligible security and
counter-narcotics related donor funding for Afghanistan
– from the United States and United Kingdom and from
donors contributing to the NATO ANA Trust Fund – totalled
US$16.1 billion between 2002 and 2009. (See fi gure 20).
DONOR/FUND US$m
NATO ANA Trust Fund 35.3
United States 15,663.9
United Kingdom 363.4
Total 16,062.6
FIGURE 20: NON-ODA-ELIGIBLE SECURITY-RELATED AID
TO AFGHANISTAN, 2002–2009
Sources: Development Initiatives, based on NATO; United Kingdom
Foreign and Commonwealth Offi ce; United States Special
Inspector General for Reconstruction in Afghanistan (SIGAR);
and OECD DAC data
15

FIGURE 21: PARTIAL COSTS OF UNITED STATES-LED OPERATION ENDURING FREEDOM (OEF)
AND THE NATO-LED INTERNATIONAL SECURITY ASSISTANCE FORCE (ISAF), 2001–2009
Sources: Development Initiatives, based on data from governments of Australia, Canada, Denmark, Italy, Germany,
United Kingdom and United States; NATO; and Development Initiatives research
0.5
2001 2002
Total cost of military operations
Poland
Germany
Italy
Canada
Australia
United Kingdom
NATO
United States
2003 2004 2005 2006 2007 2008 2009
16.8 17.715.2
18.7
23.0
41.0
47.5
63.1
US$
BIL
LIO
N
FIGURE 22: TOTAL TROOP NUMBERS IN NATO ISAF FORCE
Source: NATO ISAF
DECEMBER
2007
DECEMBER
2008
DECEMBER
2009
DECEMBER
2010
41,700 51,350 85,795 131,730
US$m 2002 2003 2004 2005 2006 2007 2008 2009
UNAMA 43.0 37.9 63.6 63.6 62.4 74.2 86.4 170.3
EUPOL 22.2 48.2 100.8
FIGURE 23: UN- AND EU-LED MULTILATERAL SECURITY
MISSIONS, 2002–2009
Source: SIPRI
EXTERNAL SECURITY PRESENCE
By far the greatest expenditure associated with
international involvement in Afghanistan is the cost of
foreign military operations, which has risen steadily since
2003. Reported spending rose sharply from 2006 to reach
a new high of US$63.1 billion in 2009, more than ten times
the total international aid investment in the same year.
The International Security Assistance Force (ISAF) in
Afghanistan was the largest global peacekeeping operation
for the fourth year running in 2010.9 ISAF is a UN-mandated
force and was originally authorised to secure Kabul and
the surrounding areas in December 2001, to allow a secure
space for the new transitional government to convene.
NATO assumed leadership of ISAF in August 2003, and
ISAF’s mandate was expanded to cover the whole country in
October 2003. The NATO-led ISAF force progressively took
over command of the international military forces under the
US-led coalition throughout the country, and had complete
command by 2006.
The United States-led Operation Enduring Freedom (OEF)
continues to conduct counter-insurgency operations
separately from the NATO-led ISAF operation.
Figure 21 provides a partial and conservative estimate
of the costs of the ISAF and OEF operations. This is
based on budgeted or offi cially declared actual costs
of a number of the major troop-contributing nations to
the NATO ISAF force and to the United States-led OEF.
Reported ISAF costs are based on data from troop-
contributing nations who provided 87% of total troop
numbers as at 14 December 2010.
The number of troops participating in the NATO ISAF force
more than doubled between 2007 and 2009. The cost of
military operations in 2010 was likely to be considerably
higher than in 2009 following a ‘troop surge’ that increased
the force by almost 46,000 troops between December 2009
and December 2010. (See fi gure 22)
International expenditure on external security actors also
includes a UN Department of Peacekeeping Operations
(DPKO) political mission in Afghanistan – the UN
Assistance Mission in Afghanistan (UNAMA), which had
a total reported cost of US$601.3 million between 2002
and 2009 – and a European Union police mission, EUPOL,
established in 2007, with a cost of US$171.2 million
between 2007 and 2009.(See fi gure 23).
16

Afghanistan has shown considerable economic growth
since 2001, in large part owing to the billions of dollars
in aid being spent in the country. Gross domestic
product (GDP), which was a meagre US$4.1 billion
in 2002 (US$176 per capita) is predicted to grow to
US$18.7 billion (US$623 per capita) in 2011.10
Foreign direct investment (FDI) has shown modest
growth, from less than US$1 million in 2001 to a peak
of US$300 million in 2008, before falling again to
US$185 million in 2009.
Afghanistan’s extensive illicit economy, meanwhile,
remains buoyant. The informal economy is largely centred
on opium and increasingly on cannabis production,
processing and trade, which developed during two decades
of confl ict, and which saw the virtual collapse of the formal
economy and degeneration of state institutions.
Opium production all but halted in 2001 following a
prohibition decree issued by the Taliban in 2000, but
was rapidly re-established during the power vacuum that
followed the toppling of the Taliban regime at the end of
2001, reinstating Afghanistan as the leading global opium
producer and exporter. Opium production has continued
to provide a major contribution to the Afghan economy,
and is estimated to have generated in excess of
US$2 billion in revenues each year since 2002.
Remittances to Afghanistan are not routinely measured
but could represent a signifi cant fi nancial contribution
to the domestic economy of between US$1 billion and
US$4 billion a year.11 (See fi gure 24).
US$
BIL
LIO
N
2002
0.1
2.5
0.0 0.1
2.3
0.00.2
2.8
1.4
0.3
2.7
2.1
0.2
3.1
2.5
0.2
4.0
3.5
0.3
3.4
4.0
0.2
2.83.1
2003 2004 2005 2006 2007 2008 2009
Foreign dIrect investment
Potential gross opium revenue
Estimated potential income from remittances
FIGURE 24: PRIVATE RESOURCE FLOWS, 2002–2009
Sources: Development Initiatives based on IMF; United Nations Offi ce on Drugs and Crime (UNODC) data;
and Development Initiatives research
DOMESTIC INVESTMENTS AND RESOURCES
17
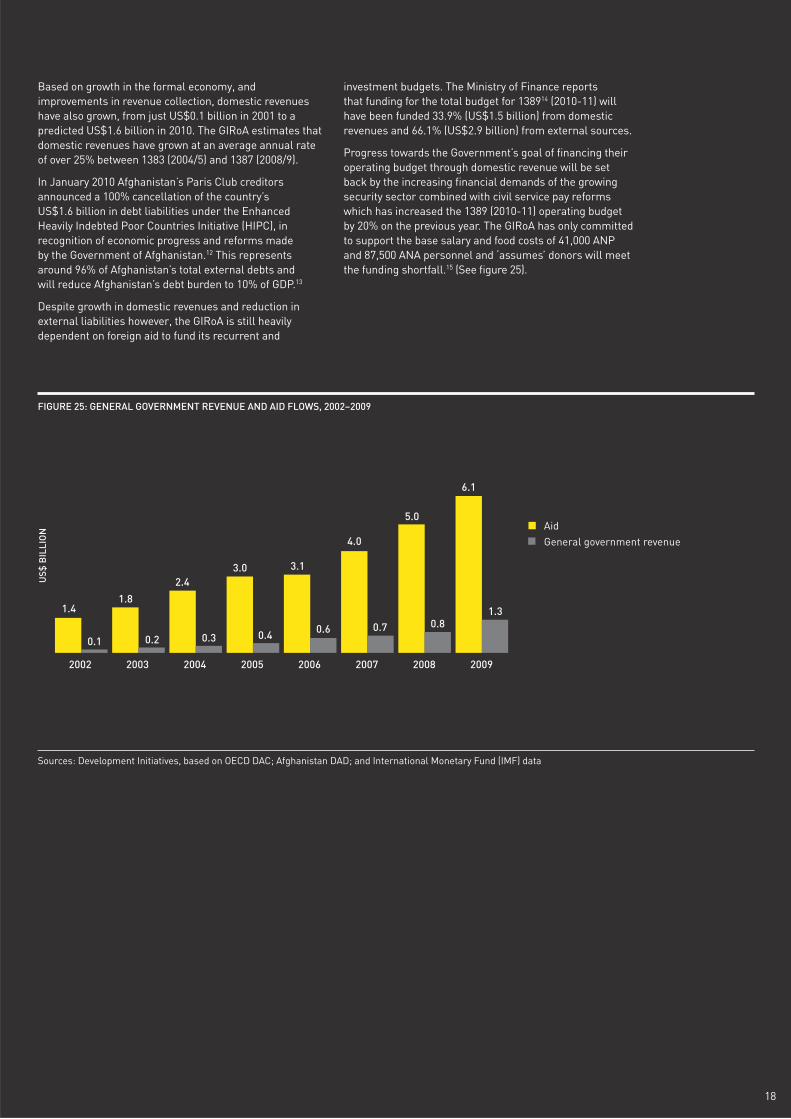
FIGURE 25: GENERAL GOVERNMENT REVENUE AND AID FLOWS, 2002–2009
Sources: Development Initiatives, based on OECD DAC; Afghanistan DAD; and International Monetary Fund (IMF) data
US$
BIL
LIO
N
2002
1.4
0.1
1.8
0.2
2.4
0.3
3.0
0.4
3.1
0.6
4.0
0.7
5.0
0.8
6.1
1.3
2003 2004 2005 2006 2007 2008 2009
Aid
General government revenue
Based on growth in the formal economy, and
improvements in revenue collection, domestic revenues
have also grown, from just US$0.1 billion in 2001 to a
predicted US$1.6 billion in 2010. The GIRoA estimates that
domestic revenues have grown at an average annual rate
of over 25% between 1383 (2004/5) and 1387 (2008/9).
In January 2010 Afghanistan’s Paris Club creditors
announced a 100% cancellation of the country’s
US$1.6 billion in debt liabilities under the Enhanced
Heavily Indebted Poor Countries Initiative (HIPC), in
recognition of economic progress and reforms made
by the Government of Afghanistan.12 This represents
around 96% of Afghanistan’s total external debts and
will reduce Afghanistan’s debt burden to 10% of GDP.13
Despite growth in domestic revenues and reduction in
external liabilities however, the GIRoA is still heavily
dependent on foreign aid to fund its recurrent and
investment budgets. The Ministry of Finance reports
that funding for the total budget for 138914 (2010-11) will
have been funded 33.9% (US$1.5 billion) from domestic
revenues and 66.1% (US$2.9 billion) from external sources.
Progress towards the Government’s goal of fi nancing their
operating budget through domestic revenue will be set
back by the increasing fi nancial demands of the growing
security sector combined with civil service pay reforms
which has increased the 1389 (2010-11) operating budget
by 20% on the previous year. The GIRoA has only committed
to support the base salary and food costs of 41,000 ANP
and 87,500 ANA personnel and ‘assumes’ donors will meet
the funding shortfall.15 (See fi gure 25).
18

Important progress has been made towards reaching
Millennium Development Goal (MDG) targets in health,
education and access to clean water, but Afghanistan is
‘off track’ in meeting Millennium Development Goal 1 to
eradicate extreme poverty. In fact, poverty has deepened
and hunger has increased sharply.16 In 2011, the UN
estimates that 7.8 million people will require food aid.
Displacement continues to seriously affect the lives of
millions of Afghans, and further displacement has resulted
from the rising levels of insecurity since 2009. Five million
former refugees have returned to Afghanistan since
2002, increasing the population by over 20%, according
to UNHCR. In a 2007/08 government-led survey on
vulnerability, 60% of all households reported that this
large infl ux of returnees had affected them negatively
during the past year. Some 2.9 million Afghans remain
displaced as refugees – the largest refugee population
in the world – and around 441,000 people are internally
displaced within Afghanistan.
FIGURE 26: PROGRESS AGAINST THE MILLENNIUM DEVELOPMENT GOALS, 2008
Source: Millennium Development Goals, Islamic Republic of Afghanistan, Annual Progress Report 2008
MDG GOAL INDICATOR BASELINE LATEST
MEASUREMENT
TARGETS
2015 2020
GOAL 4: (On Track)
Reduce child mortality
Under 5 mortality rate (per 1000 live births) 257 191 115 76
Proportion of 1Ðyear old children immunised
against measles (%)35% 68% 90% 100%
GOAL 6: (On Track)
Combat HIV/AIDS,
malaria and other
diseases
Proportion of population in malaria risk areas
using effective malaria prevention measures18% 20% 85% 95%
Prevalence rates associated with tuberculosis
(per 100.000 population)440 231 224 143
GOAL 9: (On Track)
Enhance security
Security expenditure as a % of Public
Expenditures (core +devt budget)43% 25% 20% 20%
Operational Capability
(Battalions with validated capability)0% 60% 100% 100%
GOAL 2: (Achievable)
Achieve universal
primary education
Net enrolment ratio in primary education 54% 60% 100%
Primary completion rate 25% 38% 100%
GOAL 5: (Achievable)
Improve maternal
health
Proportion of births attended
by skilled personnel (%)6.0% 19.9% 50% 75%
Fertility rate (number of live births per woman) 6.3 7.2 4.4 3.1
GOAL 7: (Achievable)
Ensure Environmental
sustainability
Proportion of land area covered by forest 1.6% 1.3% 2.1%
Proportion of population with sustainable
access to an improved water source, urban
and rural
23.0% 41.4% 61.5%
Total slum population 2,458,024 4,500,000 1,543,639
GOAL 8: (Achievable)
Develop a global
partnership for
development
Proportion of bilateral ODA of OECD/DAC
donors that is untied26% 44% 100%
Unemployment rate of young people
aged 15-24 years26% 47% 0%
Cellular subscribers per 1,000 population 1 210 500 800
GOAL 1: (Diffi cult)
Eradicate extreme
poverty and hunger
Proportion of population below
‘cost of basic necessities’ poverty level33% 42% 24% 21%
Proportion of population below minimum level
of dietary energy consumption (<2100 cal./day)30% 39% 11% 9%
GOAL 3: (Diffi cult)
Promote gender
equality and
empower women
Ratio of girls to boys in primary education 0.6 0.59 1
Ratio of female to male Government
employees (central)0.32 0.32 0.5 1
MEASURES OF PROGRESS
19

The development challenges are immense and progress
fragile, not least because of persistent insecurity. Despite
progress in recruiting, equipping and training the Afghan
National Police and Army, and the presence of increasing
numbers of international troops serving under a UN
peacekeeping mandate, Afghanistan is still extremely
dangerous for Afghan citizens, and has become more
so since 2009. Reporting of civilian casualties by the
UN Assistance Mission for Afghanistan (UNAMA) shows
that Afghanistan has become increasingly deadly for
civilians, with the fi rst half of 2010 being the deadliest
January to June (typically the quieter part of the year) on
record. Security incidents affecting foreign and national
aid workers have also increased throughout the period,
reaching an unprecedented 97 reported incidents in 2010.
(See fi gure 27 & fi gure 28).
684
Jan-Jun2007
Jul-Dec2007
Jan-Jun2008
Jul-Dec2008
Jan-Jun2009
Jul-Dec2009
Jan-Jun2010
839 818
1,300
1,054
1,3581,271
FIGURE 27: RECORDED CIVILIAN CASUALTIES, JANUARY 2007–JUNE 2010
Source: United Nations Assistance Mission in Afghanistan (UNAMA)
FIGURE 28: SECURITY INCIDENTS INVOLVING AID WORKERS, 2000–2010
Source: The Aid Worker Security Database (aidworkersecurity.org)
200220012000
9 6 8
22
40 35
5548
63 62
97
2003 2004 2005 2006 2007 2008 2009 2010
Total humanitarian workers affected
Internationals affected
Nationals affected
20

AID
For the purposes of this report, ‘aid’ refers to offi cial
development assistance (ODA) reported to the OECD DAC,
plus aid reported to the Afghanistan Donor Assistance
Database (DAD) by government donors who do not report
to the OECD DAC.
The relatively small amount of aid included here which
is reported through the Afghanistan DAD may include
aid that is not considered eligible under the OECD DAC’s
criteria for ODA.
COMMITMENT
A commitment refers to the fi rm – but not necessarily
legally binding – pledges of assistance made by donors.
CONSTANT PRICES
Constant (real terms) fi gures show how expenditure has
changed over time, after removing the effects of exchange
rates and infl ation. DAC defl ators, along with annualised
exchange rates, are available at: www.oecd.org/dac. The
base rate year used by the DAC during 2010 was 2008.
DEVELOPMENT ASSISTANCE COMMITTEE (DAC)
The DAC is the Development Assistance Committee of
the OECD. Its members are: Australia, Austria, Belgium,
Canada, Denmark, Finland, France, Germany, Greece,
Ireland, Italy, Japan, Korea, Luxembourg, the Netherlands,
New Zealand, Norway, Portugal, Spain, Sweden,
Switzerland, the United Kingdom, the United States and
the European Commission. These members have “agreed
to secure an expansion of aggregate volume of resources
made available to developing countries and to improve their
effectiveness”.
Korea joined the DAC in January 2010. It is treated
as a non-DAC donor for the purposes of this website.
DONOR ASSISTANCE DATABASE (DAD)
The Government of Afghanistan (GIRoA) established
a Donor Assistance Database (DAD) in 2003. The DAD
serves as an aid tracking and management tool and
records all cabinet-approved development projects in
the national budget, as well as extra-budgetary aid
fl ows. The information is publicly available online at:
http://dadafghanistan.gov.af/
GOVERNMENT FUNDING
Government funding includes expenditure by DAC and
non-DAC governments and by the European Commission.
GROSS DOMESTIC PRODUCT (GDP)
The total market value of goods and services produced
by workers and capital within a nation’s borders.
MULTILATERAL AGENCY
An international institution with governmental
membership that conducts all or a signifi cant part of
its activities in favour of developing and aid recipient
countries. Such agencies include multilateral development
banks (e.g. the World Bank and regional development
banks), UN agencies and regional groupings (e.g. certain
EU and Arab agencies).
MULTILATERAL ODA
Multilateral humanitarian aid is funding given to UN
agencies, international organisations or the EC to spend
entirely at their own discretion within their mandate.
It cannot be earmarked in any way.
OFFICIAL DEVELOPMENT ASSISTANCE (ODA)
ODA is a grant or loan from an ‘offi cial’ (government)
source to a developing country or multilateral agency for
the promotion of economic development and welfare.
It is reported by members of the OECD DAC according to
strict criteria each year and by a small number of donors
outside of the OECD DAC group, who typically report a
less comprehensive dataset. It includes sustainable and
poverty-reducing development assistance (for sectors
such as governance, growth, social services, education,
health, and water and sanitation) as well as funding for
humanitarian crises.
REMITTANCES
Private transfers between individuals – often relatives
or friends – in another country.
ANNEX: BASIC CONCEPTS AND DEFINITIONS
1 Government of the Islamic Republic of Afghanistan
(GIRoA), Ministry of Finance, 2009.2 EU Institutions reporting to the OECD DAC include the European
Commission (EC), European Development Fund (EDF), European
Free Trade Association (EFTA), European Investment Bank (EIB)
and other EU Institutions.3 ‘Country programmable aid’ (CPA) is an OECD DAC
classifi cation which estimates the amount of aid that can
be programmed by the donor at partner country level. It
excludes aid that is unpredictable by nature (humanitarian
aid and debt forgiveness and reorganisation); cross-border
fl ows (development research in the donor country, promotion
of development awareness, imputed student costs,
refugees in the donor country and administrative costs);
aid that does not form part of cooperation agreements
between governments (food aid and aid extended by local
governments in donor countries); aid that is not country
programmable by the donor (core funding to national NGOs
and International NGOs); or aid that is not susceptible for
programming at country level (e.g. contributions to public/
private partnerships, for some donors aid extended by other
agencies than the main aid agency).
4 OECD, 20105 GIRoA, 2009, op. cit. 6 NATO, 2009.7 GIRoA, 2009, op cit. 8 Common Humanitarian Funds (CHFs) are currently
active in the Democratic Republic of Congo (DRC),
Sudan, Somalia and the Central African Republic (CAR).9 SIPRI, 2010.10 IMF World Economic Outlook, 2010. Current prices.11 The remittance fi gures here are based on research on
remittances to Afghanistan in 2006 conducted by the
International Fund for Agricultural Development (IFAD)
and modelled against trends in remittance fl ows to the
region recorded by the World Bank.12 IMF, 2010 13 World Bank, Afghanistan Economic Update, April 201014 The Afghan year begins within a day of 21 March of the
Gregorian calendar. 15 Islamic Republic of Afghanistan, National Budget, 1389 16 GIRoA and United Nations, 2008
ENDNOTES
21

International Monetary Fund (2010), World Economic
Outlook (WEO), Rebalancing Growth, IMF April 2010.
http://www.imf.org/external/pubs/ft/weo/2010/01/index.htm
Islamic Republic of Afghanistan, Ministry of Finance,
(2009), Donor Financial Review, Report 1388,
November 2009
Islamic Republic of Afghanistan, National Budget, 1389.
http://siteresources.worldbank.org/AFGHANISTANEXTN/
Resources/305984-1264608805475/6739619
-1282159147458/SY1389Budget.pdf
Islamic Republic of Afghanistan and United Nations
(2008), Millennium Development Goals Islamic Republic
of Afghanistan, Vision 2020, Annual Progress Report 2008.
NATO (2009), Afghanistan Report. http://www.isaf.nato.int/
pdf/20090331_090331_afghanistan_report_2009.pdf
OECD (2010), 2010 OECD Report on Aid Predictability and
Survey on Donors’ Forward Spending Plans 2010–2012,
OECD, Paris.
SIPRI, (2010), SIPRI Yearbook 2010, Armaments,
disarmaments and international security, Stockholm
International Peace Research Institute, Oxford University
Press
UNAMA Human Rights annual reports.
http://unama.unmissions.org/Default.aspx?tabid=1816
UNODC, (2009), Afghanistan Opium Survey 2009
World Bank, (2010), Afghanistan Economic Update,
April 2010
REFERENCES
22

This report is part of a series of publications from Development Initiatives
mapping aid fl ows to Afghanistan in 2002, 2003 and 2005. In this report we
attempt to capture a range of resource fl ows in Afghanistan presenting data,
relationships and trends in an accessible format.
Our work on confl ict-affected states looks at trends in a range of fl ows.
We believe collecting and tracking this data will contribute to a better
understanding of trends, emergent ideas, mechanisms, actors and
changing relationships that affect humanitarian assistance.
Global Humanitarian Assistance is a Development Initiative to improve the
effi ciency, effectiveness and coherence of humanitarian response by further
increasing access to reliable, transparent and understandable information
on the aid provided to people living in humanitarian crises.
Global Humanitarian Assistance | Development Initiatives, Keward Court,
Jocelyn Drive, Wells, Somerset BA5 1DB, UK | Tel: +44 (0)1749 671343
Fax: +44 (0)1749 676721 | Email: [email protected]
www: globalhumanitarianassistance.org
Development Initiatives is a group of people committed to eliminating poverty.
Follow us on Twitter @devinitorg
AFGHANISTANTracking major resource fl ows 2002-2010