afg05 fullf final 14october2006d suz
TRANSCRIPT
Opium Survey 2006
Afghanistan
Oct
ober
200
6
Government of AfghanistanMinistry of Counter Narcotics
ABBREVIATIONSANP Afghan National Police CPEF Central Poppy Eradication Force
GPS Global Positioning System ICMP UNODC Illicit Crop Monitoring Programme
MCN Ministry of Counter Narcotics MoI Ministry of Interior
RAS UNODC Research and Analysis Section UNODC United Nations Office on Drugs and Crime
ACKNOWLEDGEMENTSThe following institutions and individuals contributed to the implementation of the 2006 opium survey in Afghanistan, and to the preparation of the present report:
Survey and Monitoring Direcotorate of the Ministry of Counter- Narcotics, Afghanistan
Mohammad Ibrahim Azhar (Director) Thasbeehullah (Deputy Director) Sher Mohd Walizada (Deputy Director Annual Survey) Survey Coordinators: Khalili Jan (Central Zone); Abdul Mateen (Nangarhar Zone); Ishaq (Badakshan Zone); Hashmatullah (Kandarhar Zone); Fida Mohammad (Balkh Zone); Latif (Herat Zone)
United Nations Office on Drugs and Crime (Kabul)
Doris Buddenburg (Representative) Hakan Demirbuken (Survey Project Manager, RAS/ICMP) Shirish Ravan (Remote Sensing Expert, RAS/ICMP) Nazir Ahmad Shah (National Project Coordinator) Ziuddin Zaki (Data Analyst) Patrick Halewood (Consultant) Abdul Mannan Ahmadzai (Administrative Assistant) Zia Ulhaq (Data Entry Clerk) Regional Coordinators: Mohammad Alam Ghaleb (Nangarhar Zone), Fazal Mohammad Fazli (Kandahar Zone), Lutfurahman Lutfi (Balkh Zone), Mohammad Alem Yaqubi (Badakhshan Zone), Altaf Hussain Joya (Herat Zone) Survey Coordinators: Abdul Basir (Nangarhar Zone); Fawad Alaei (Herat Zone); Mohammad Rafi (Badakshan Zone); Abdul Jalil (Balkh Zone); Palwal (Kandarhar Zone) Segment data collection experts: Sayed Ahmad, Abdul Rahim Marikh
United Nations Office on Drugs and Crime (Vienna)
Anja Korenblik (Manager, RAS/ICMP), Thibault le Pichon (Chief, RAS), Thomas Pietschmann (Research Officer, RAS), Martin Raithelhuber (Programme Officer, RAS/ICMP), Patrick Seramy (Database Management, RAS/ICMP).
The implementation of the survey would not have been possible without the dedicated work of the field surveyors, who often faced difficult security conditions.
The implementation of UNODC Illicit Crop Monitoring Programme and the opium survey in Afghanistan in 2006 was made possible thanks to financial contributions from the Governments of the United Kingdom, Finland, and the United States of America.
This report, and other ICMP survey reports can be downloaded from:
www.unodc.org/unodc/en/crop_monitoring.html
Afghanistan Opium Survey 2006
CONTENTS
PREFACE..................................................................................................................................... III
FACT SHEET - AFGHANISTAN OPIUM SURVEY 2006........................................................1
EXECUTIVE SUMMARY.............................................................................................................3
1 INTRODUCTION......................................................................................................................21
2 FINDINGS ..................................................................................................................................22
2.1 OPIUM POPPY CULTIVATION ........................................................................................................ 22
2.2 OPIUM POPPY CULTIVATION DENSITY ...................................................................................... 44
2.3 CANNABIS CULTIVATION.............................................................................................................. 45
2.4 OPIUM YIELD .................................................................................................................................... 45
2.5 ERADICATION................................................................................................................................... 52
2.6 POTENTIAL OPIUM PRODUCTION................................................................................................ 66
2.7 SECURITY........................................................................................................................................... 68
2.8 OPIUM FARMERS.............................................................................................................................. 68
2.9 REASONS FOR NON-CULTIVATION, STOPPING OR GROWING OPIUM POPPY ................... 72
2.10 LOANS................................................................................................................................................. 74
2.11 EXTERNAL ASSISTANCE AND FARMERS EXPECTATIONS..................................................... 76
2.12 INCOME GENERATION FOR FARMERS........................................................................................ 78
2.13 ETHNIC DISTRIBUTION................................................................................................................... 81
2.14 OPIUM PRICES................................................................................................................................... 83
2.15 MIGRATION ....................................................................................................................................... 88
2.16 POTENTIAL VALUE AND INCOME TO FARMERS...................................................................... 90
2.17 OPIUM AND HEROIN TRAFFICKING............................................................................................. 93
2.18 POTENTIAL VALUE AND INCOME TO THE AFGHAN ECONOMY .......................................... 95
3 METHODOLOGY.....................................................................................................................99
3.1 OPIUM POPPY CULTIVATION ........................................................................................................ 99
3.2 AREA FRAME SAMPLING TOOLS (FST) METHODOLOGY FOR CULTIVATION ESTIMATION (TRIAL) .................................................................................................................... 111
3.3 VILLAGE SURVEY METHODOLOGY .......................................................................................... 113
3.4 OPIUM YIELD AND PRODUCTION .............................................................................................. 117
3.5 OPIUM PRICE................................................................................................................................... 118
3.6 OPIUM GROWING FAMILIES........................................................................................................ 118
3.7 VALUE OF OPIUM PRODUCTION AT FARMGATE LEVEL...................................................... 120
3.8 VALUE OF AFGHAN OPIATES IN NEIGHBOURING COUNTRIES .......................................... 122
4 ANNEXES ................................................................................................................................135
Afghanistan Opium Survey 2006
ii
ANNEX 1: OPIUM CULTIVATION IN AFGHANISTAN PER PROVINCE, 2002-2006 (HECTARES)..... 137
ANNEX 2 INDICATIVE DISTRICT LEVEL ESTIMATIONS OF OPIUM POPPY CULTIVATION,1994-2006 (IN HECTARES) ..................................................................................................................................... 138
ANNEX 3: ERADICATION VERIFICATION ESTIMATES BY DISTRICT (HECTARES)........................ 146
Afghanistan Opium Survey 2006
PREFACE
This is the full report of the opium survey of Afghanistan that the United Nations Office on Drugsand Crime made public in September 2006. There was considerable alarm when it was announcedthat opium cultivation in Afghanistan rose to 165,000 hectares in 2006, a 59% increase over 2005.This 6,100 tons of opium gives Afghanistan the dubious distinction of having nearly a monopolyof the world heroin market.
Major traffickers, warlords and insurgents are reaping the profits of this bumper crop to spreadinstability, infiltrate public institutions, and enrich themselves. Afghanistan is moving from narco-economy to narco-state.
While criminals prosper, the rest of society suffers. In Afghanistan, opium is choking developmentand democratization. The rule of the bullet and the bribe exists where there is no rule of law.
In countries neighbouring Afghanistan, there is a serious risk of a worsening HIV/AIDS epidemicspreading through intravenous heroin injection. Downstream, in traditional Western Europeanmarkets, health officials should brace for a rise in the number of deaths from drug overdoses asthis year’s bumper opium crop will lead to higher-purity doses of heroin. I have written to healthofficials and mayors, warning them of the dangers. More should be done – particularly in richcountries – to improve drug prevention and treatment.
I suspect that in years to come this opium survey will be regarded as a key document in mappingthe fate of Afghanistan. Either it will demonstrate the peak of Afghanistan’s opium problem, or the tipping point at which the country descended into chaos. In the months ahead we mustredouble our efforts to ensure that it is the former and not the latter.
Antonio Maria CostaExecutive Director
UNODC
iii

Afghanistan Opium Survey 2006
iv
Afghanistan Opium Survey 2006
1
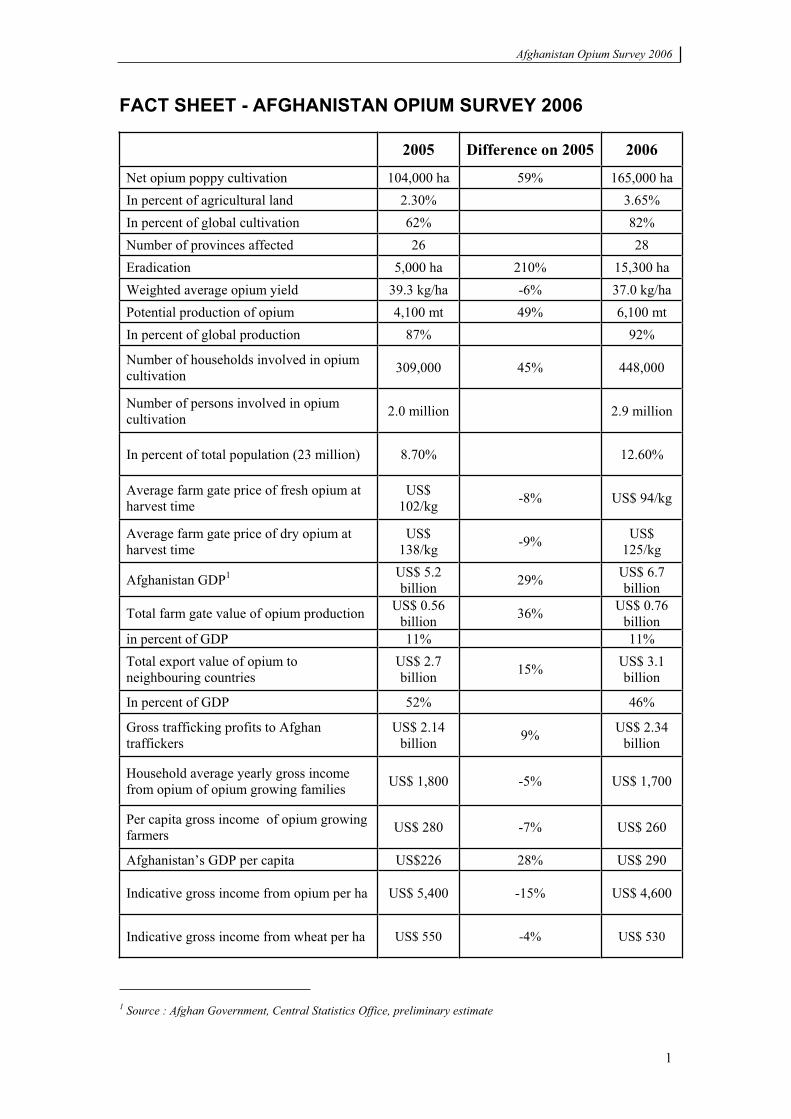
FACT SHEET - AFGHANISTAN OPIUM SURVEY 2006
2005 Difference on 2005 2006
Net opium poppy cultivation 104,000 ha 59% 165,000 ha In percent of agricultural land 2.30% 3.65% In percent of global cultivation 62% 82% Number of provinces affected 26 28 Eradication 5,000 ha 210% 15,300 ha Weighted average opium yield 39.3 kg/ha -6% 37.0 kg/ha Potential production of opium 4,100 mt 49% 6,100 mt In percent of global production 87% 92%
Number of households involved in opium cultivation 309,000 45% 448,000
Number of persons involved in opium cultivation 2.0 million 2.9 million
In percent of total population (23 million) 8.70% 12.60%
Average farm gate price of fresh opium at harvest time
US$ 102/kg -8% US$ 94/kg
Average farm gate price of dry opium at harvest time
US$ 138/kg -9% US$
125/kg
Afghanistan GDP1 US$ 5.2 billion 29% US$ 6.7
billion
Total farm gate value of opium production US$ 0.56 billion 36% US$ 0.76
billion in percent of GDP 11% 11% Total export value of opium to neighbouring countries
US$ 2.7 billion 15% US$ 3.1
billion
In percent of GDP 52% 46%
Gross trafficking profits to Afghan traffickers
US$ 2.14 billion 9% US$ 2.34
billion
Household average yearly gross income from opium of opium growing families US$ 1,800 -5% US$ 1,700
Per capita gross income of opium growing farmers US$ 280 -7% US$ 260
Afghanistan’s GDP per capita US$226 28% US$ 290
Indicative gross income from opium per ha US$ 5,400 -15% US$ 4,600
Indicative gross income from wheat per ha US$ 550 -4% US$ 530
1 Source : Afghan Government, Central Statistics Office, preliminary estimate

Afghanistan Opium Survey 2006
3
EXECUTIVE SUMMARY
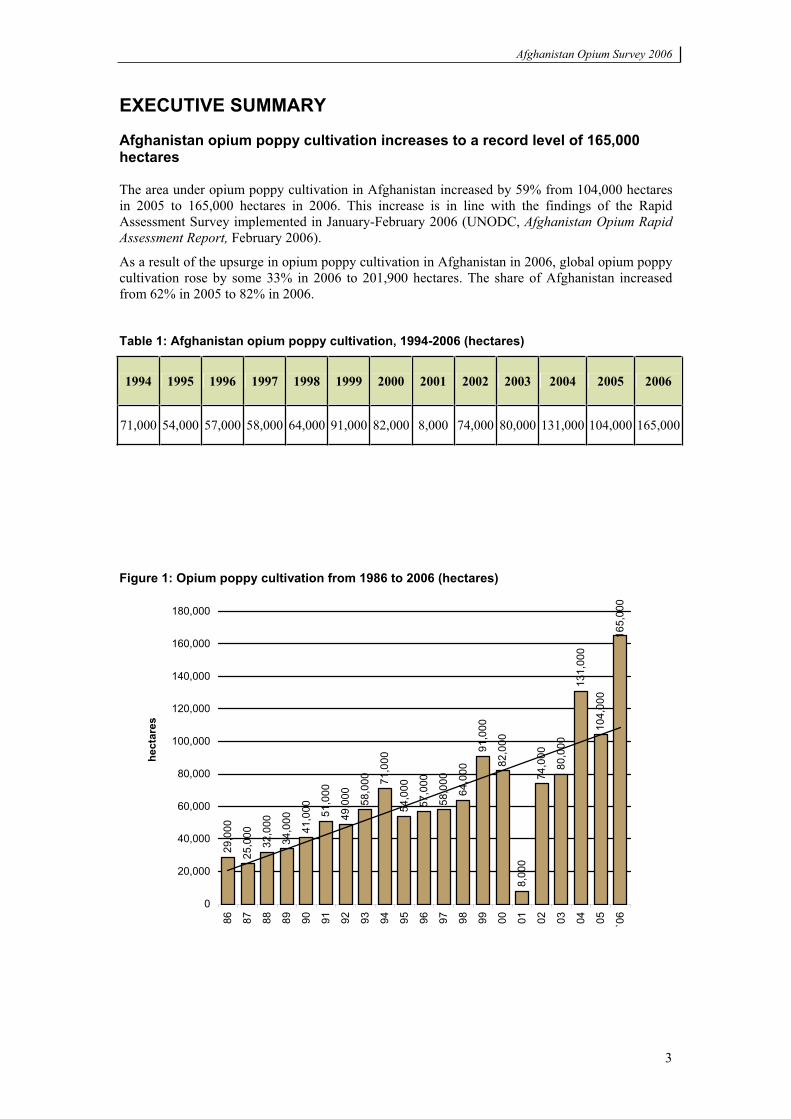
Afghanistan opium poppy cultivation increases to a record level of 165,000 hectares
The area under opium poppy cultivation in Afghanistan increased by 59% from 104,000 hectares in 2005 to 165,000 hectares in 2006. This increase is in line with the findings of the Rapid Assessment Survey implemented in January-February 2006 (UNODC, Afghanistan Opium Rapid Assessment Report, February 2006).
As a result of the upsurge in opium poppy cultivation in Afghanistan in 2006, global opium poppy cultivation rose by some 33% in 2006 to 201,900 hectares. The share of Afghanistan increased from 62% in 2005 to 82% in 2006.
Table 1: Afghanistan opium poppy cultivation, 1994-2006 (hectares)
1994 1995 1996 1997 1998 1999 2000 2001 2002 2003 2004 2005 2006
71,000 54,000 57,000 58,000 64,000 91,000 82,000 8,000 74,000 80,000 131,000 104,000 165,000
Figure 1: Opium poppy cultivation from 1986 to 2006 (hectares)
29,0
00
25,0
00
32,0
00
34,0
00
41,0
00 51,0
00
49,0
00 58,0
00 71,0
00
54,0
00
57,0
00
58,0
00
64,0
00
91,0
00
82,0
00
8,00
0
74,0
00
80,0
00
131,
000
104,
000
165,
000
0
20,000
40,000
60,000
80,000
100,000
120,000
140,000
160,000
180,000
86 87 88 89 90 91 92 93 94 95 96 97 98 99 00 01 02 03 04 05 `06
hect
ares
Afghanistan Opium Survey 2006
4
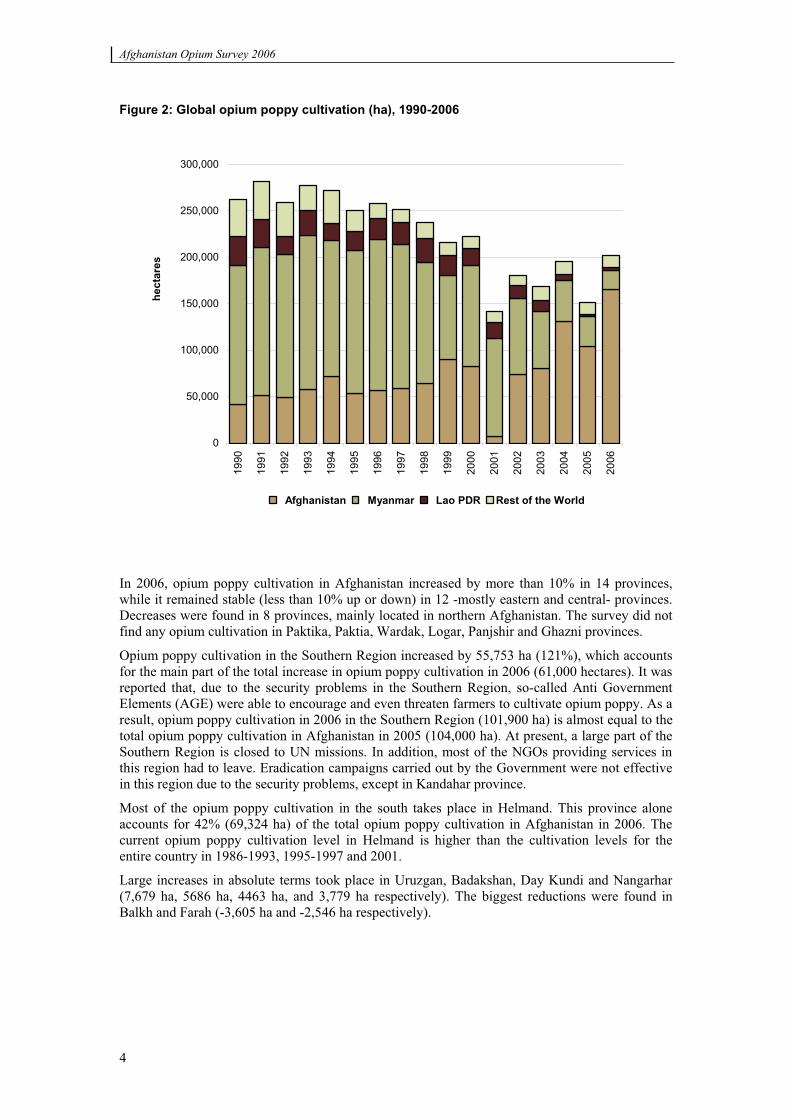
Figure 2: Global opium poppy cultivation (ha), 1990-2006
0
50,000
100,000
150,000
200,000
250,000
300,000
1990
1991
1992
1993
1994
1995
1996
1997
1998
1999
2000
2001
2002
2003
2004
2005
2006
hect
ares
Afghanistan Myanmar Lao PDR Rest of the World
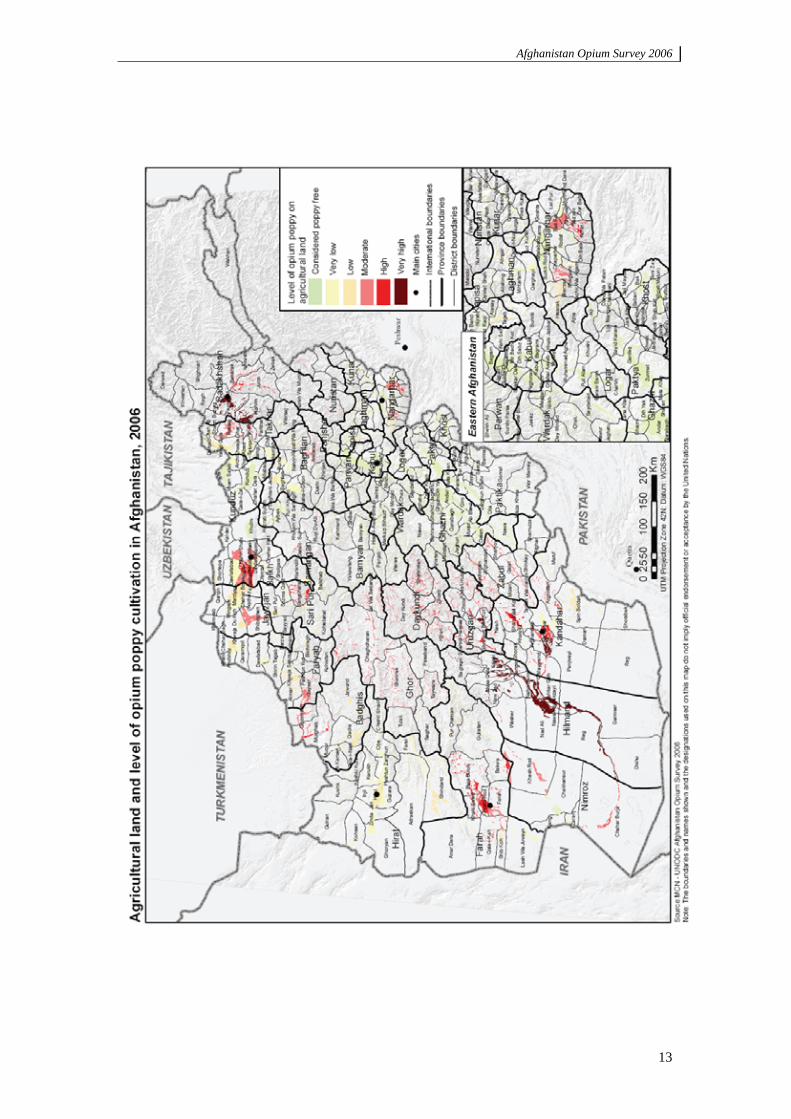
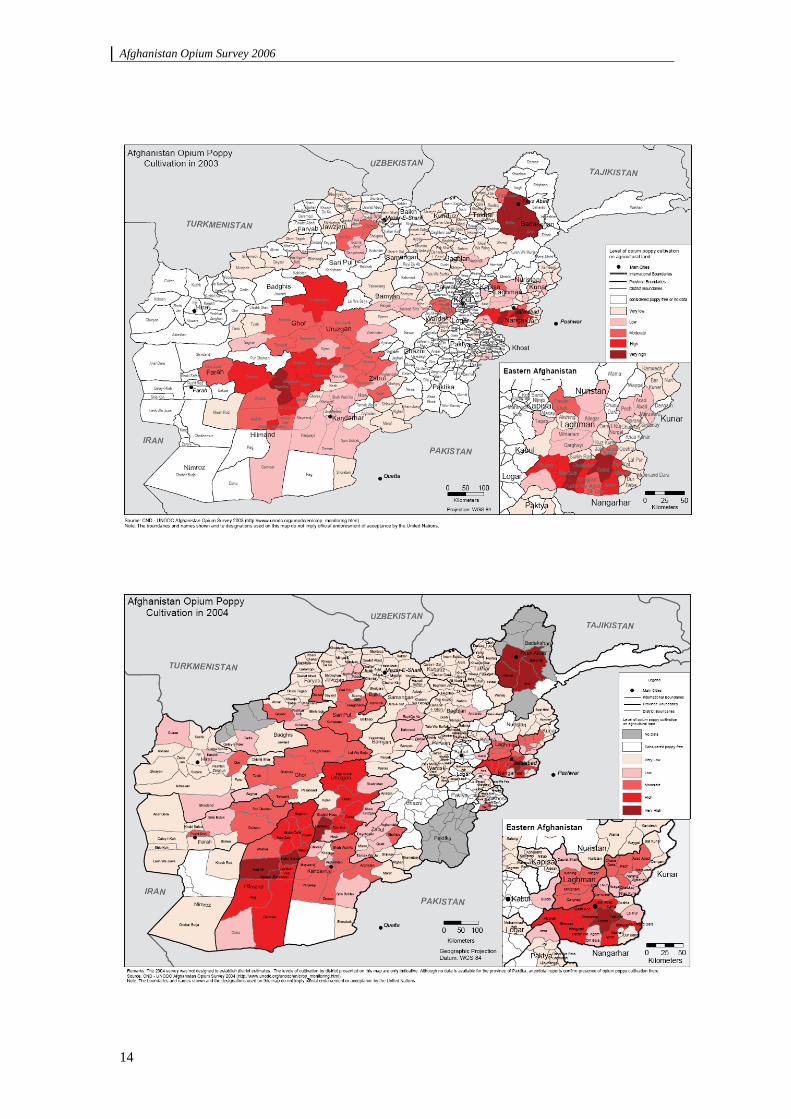
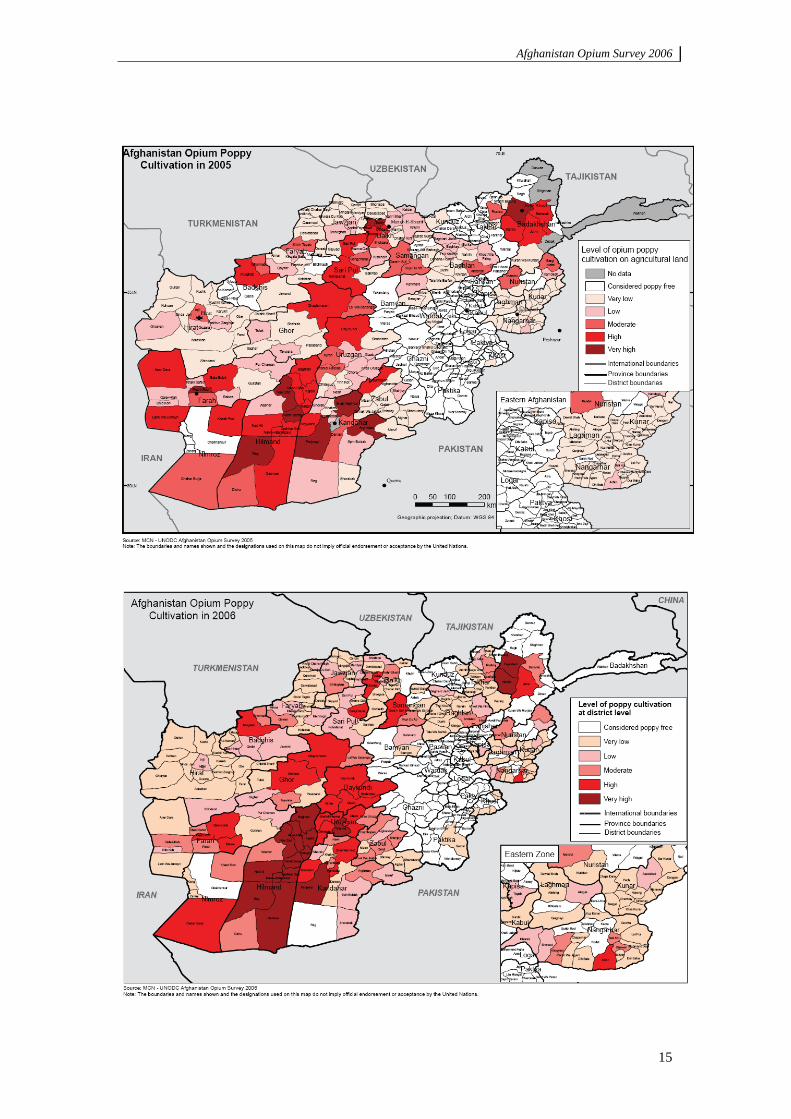
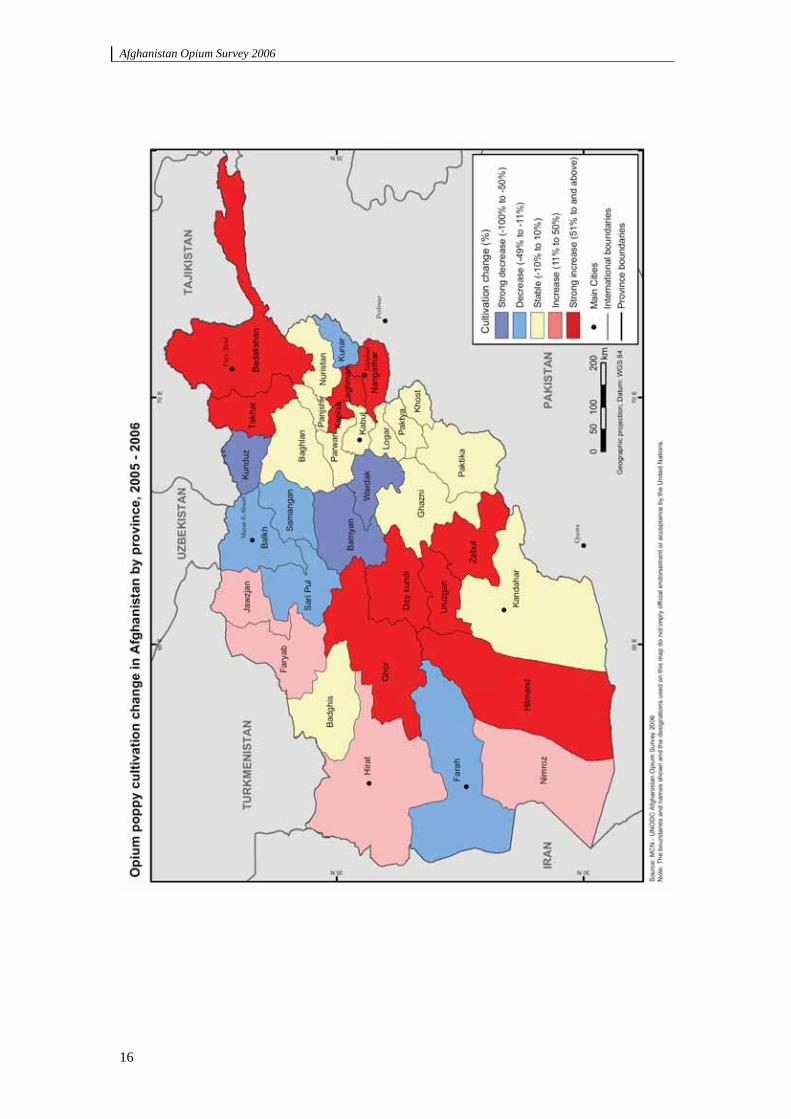
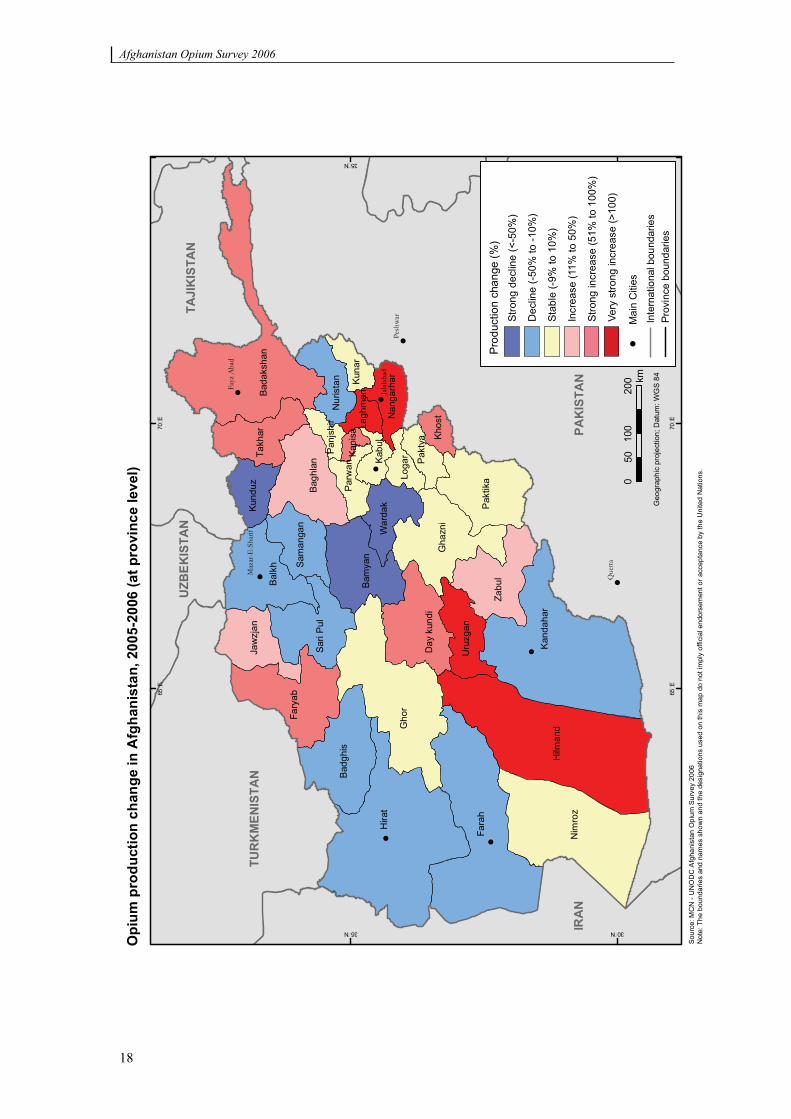
In 2006, opium poppy cultivation in Afghanistan increased by more than 10% in 14 provinces, while it remained stable (less than 10% up or down) in 12 -mostly eastern and central- provinces. Decreases were found in 8 provinces, mainly located in northern Afghanistan. The survey did not find any opium cultivation in Paktika, Paktia, Wardak, Logar, Panjshir and Ghazni provinces.
Opium poppy cultivation in the Southern Region increased by 55,753 ha (121%), which accounts for the main part of the total increase in opium poppy cultivation in 2006 (61,000 hectares). It was reported that, due to the security problems in the Southern Region, so-called Anti Government Elements (AGE) were able to encourage and even threaten farmers to cultivate opium poppy. As a result, opium poppy cultivation in 2006 in the Southern Region (101,900 ha) is almost equal to the total opium poppy cultivation in Afghanistan in 2005 (104,000 ha). At present, a large part of the Southern Region is closed to UN missions. In addition, most of the NGOs providing services in this region had to leave. Eradication campaigns carried out by the Government were not effective in this region due to the security problems, except in Kandahar province.
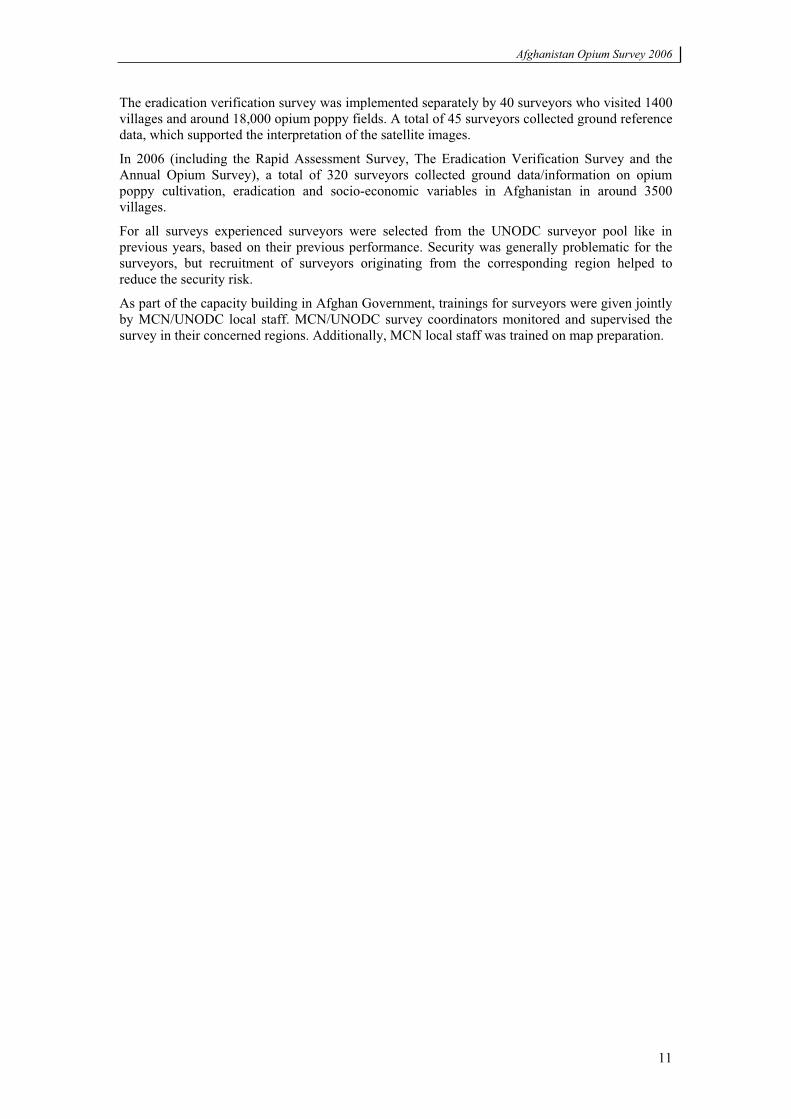
Most of the opium poppy cultivation in the south takes place in Helmand. This province alone accounts for 42% (69,324 ha) of the total opium poppy cultivation in Afghanistan in 2006. The current opium poppy cultivation level in Helmand is higher than the cultivation levels for the entire country in 1986-1993, 1995-1997 and 2001.
Large increases in absolute terms took place in Uruzgan, Badakshan, Day Kundi and Nangarhar (7,679 ha, 5686 ha, 4463 ha, and 3,779 ha respectively). The biggest reductions were found in Balkh and Farah (-3,605 ha and -2,546 ha respectively).
Afghanistan Opium Survey 2006
5
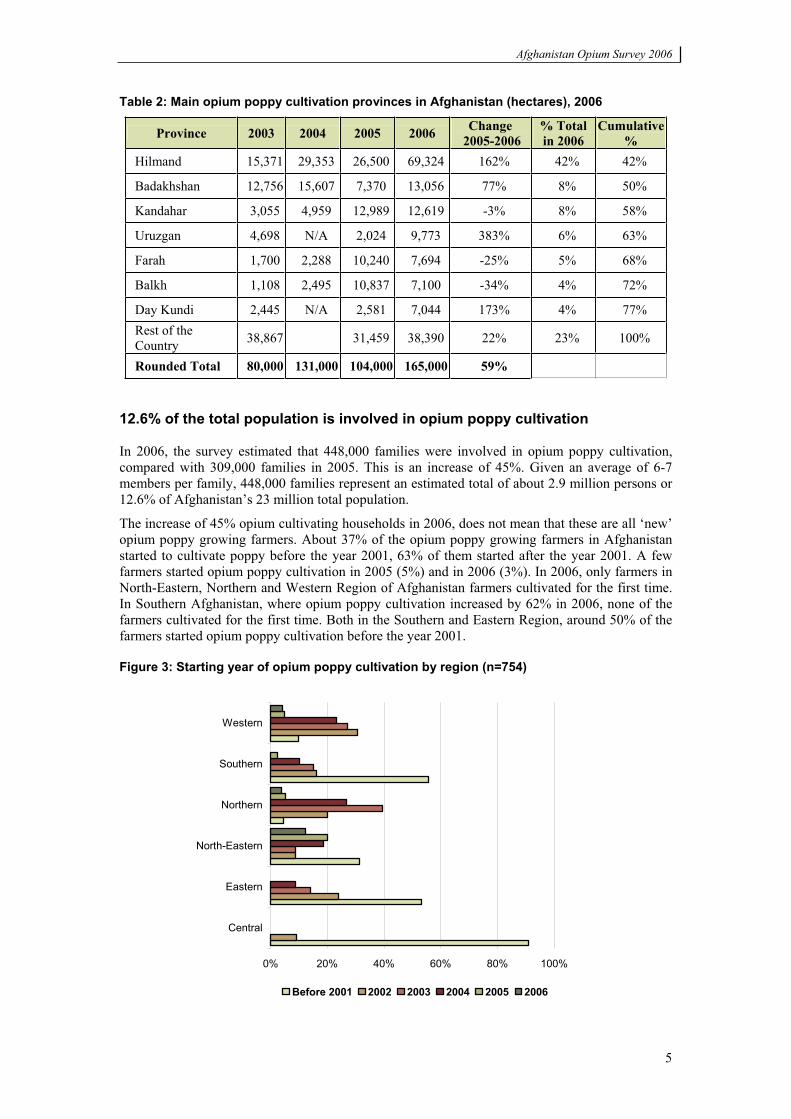
Table 2: Main opium poppy cultivation provinces in Afghanistan (hectares), 2006
Province 2003 2004 2005 2006 Change 2005-2006
% Total in 2006
Cumulative %
Hilmand 15,371 29,353 26,500 69,324 162% 42% 42%
Badakhshan 12,756 15,607 7,370 13,056 77% 8% 50%
Kandahar 3,055 4,959 12,989 12,619 -3% 8% 58%
Uruzgan 4,698 N/A 2,024 9,773 383% 6% 63%
Farah 1,700 2,288 10,240 7,694 -25% 5% 68%
Balkh 1,108 2,495 10,837 7,100 -34% 4% 72%
Day Kundi 2,445 N/A 2,581 7,044 173% 4% 77% Rest of the Country 38,867 31,459 38,390 22% 23% 100%
Rounded Total 80,000 131,000 104,000 165,000 59%
12.6% of the total population is involved in opium poppy cultivation
In 2006, the survey estimated that 448,000 families were involved in opium poppy cultivation, compared with 309,000 families in 2005. This is an increase of 45%. Given an average of 6-7 members per family, 448,000 families represent an estimated total of about 2.9 million persons or 12.6% of Afghanistan’s 23 million total population.
The increase of 45% opium cultivating households in 2006, does not mean that these are all ‘new’ opium poppy growing farmers. About 37% of the opium poppy growing farmers in Afghanistan started to cultivate poppy before the year 2001, 63% of them started after the year 2001. A few farmers started opium poppy cultivation in 2005 (5%) and in 2006 (3%). In 2006, only farmers in North-Eastern, Northern and Western Region of Afghanistan farmers cultivated for the first time. In Southern Afghanistan, where opium poppy cultivation increased by 62% in 2006, none of the farmers cultivated for the first time. Both in the Southern and Eastern Region, around 50% of the farmers started opium poppy cultivation before the year 2001.
Figure 3: Starting year of opium poppy cultivation by region (n=754)
0% 20% 40% 60% 80% 100%
Central
Eastern
North-Eastern
Northern
Southern
Western
Before 2001 2002 2003 2004 2005 2006
Afghanistan Opium Survey 2006
6
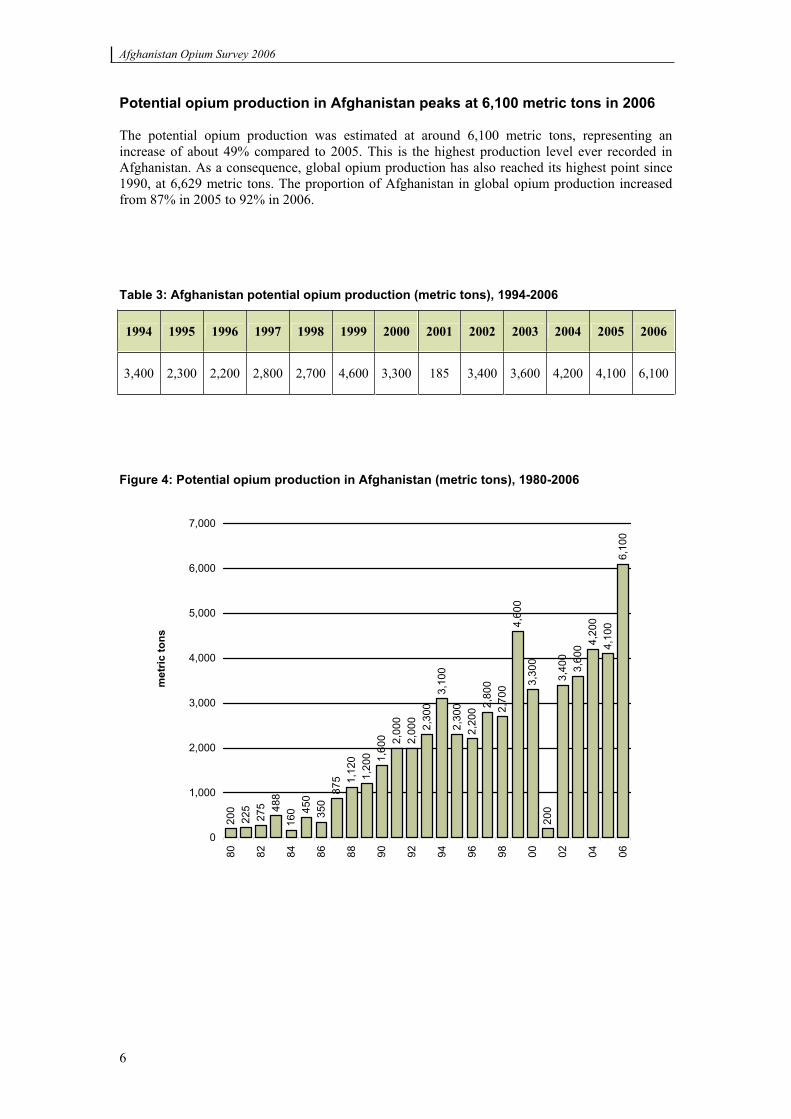
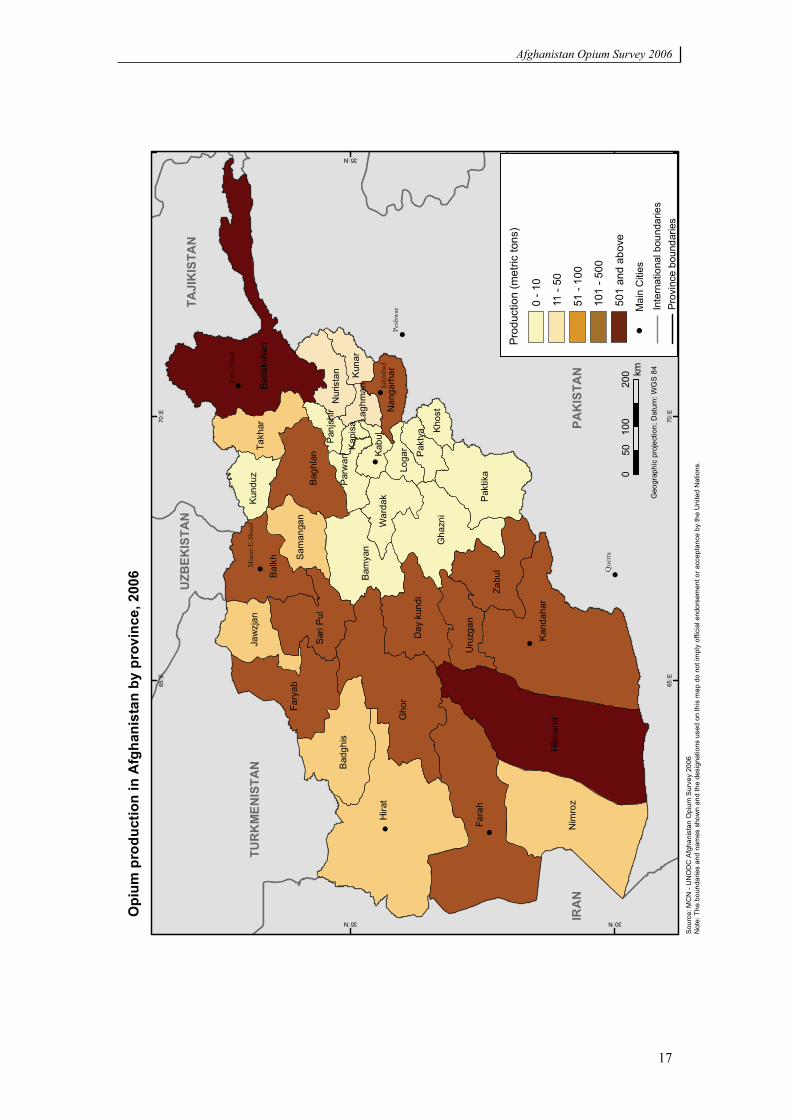
Potential opium production in Afghanistan peaks at 6,100 metric tons in 2006
The potential opium production was estimated at around 6,100 metric tons, representing an increase of about 49% compared to 2005. This is the highest production level ever recorded in Afghanistan. As a consequence, global opium production has also reached its highest point since 1990, at 6,629 metric tons. The proportion of Afghanistan in global opium production increased from 87% in 2005 to 92% in 2006.
Table 3: Afghanistan potential opium production (metric tons), 1994-2006
1994 1995 1996 1997 1998 1999 2000 2001 2002 2003 2004 2005 2006
3,400 2,300 2,200 2,800 2,700 4,600 3,300 185 3,400 3,600 4,200 4,100 6,100
Figure 4: Potential opium production in Afghanistan (metric tons), 1980-2006
200
225
275 48
816
0 450
350
875 1,
120
1,20
0 1,60
0 2,00
02,
300
3,10
02,
300
2,20
0 2,80
02,
700
4,60
03,
300
200
3,40
03,
600 4,
200
4,10
06,
100
2,00
0
0
1,000
2,000
3,000
4,000
5,000
6,000
7,000
80 82 84 86 88 90 92 94 96 98 00 02 04 06
met
ric to
ns
Afghanistan Opium Survey 2006
7
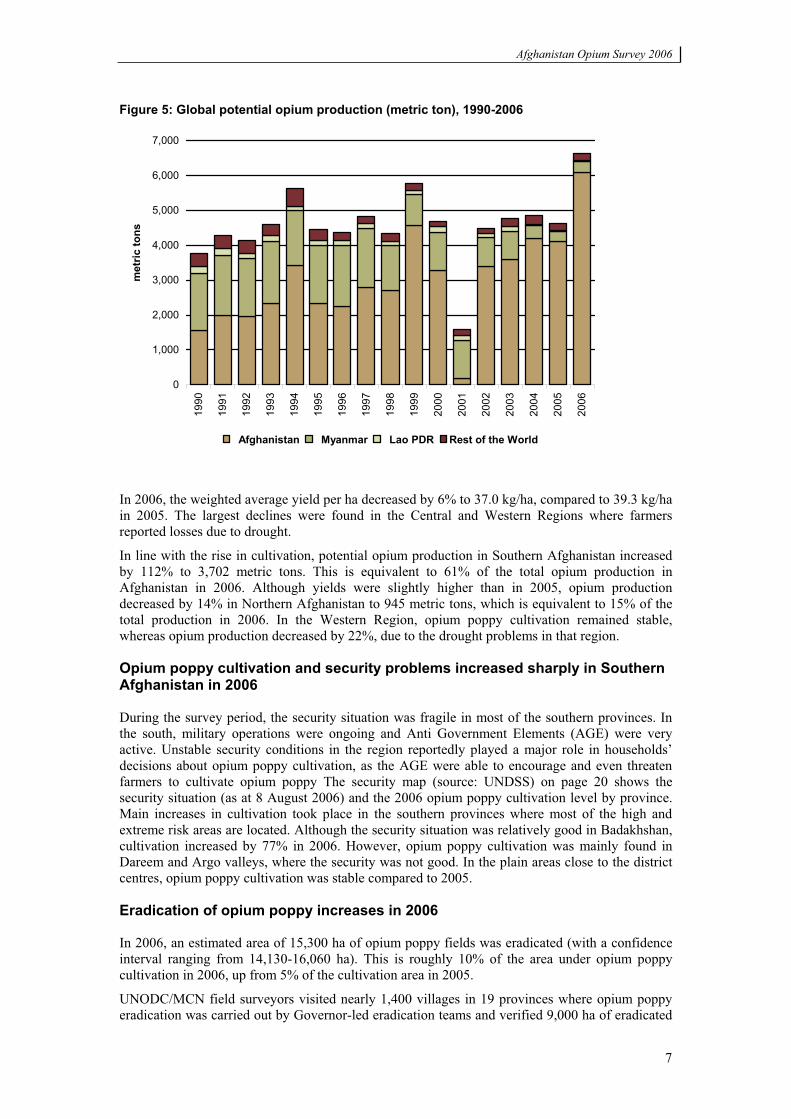
Figure 5: Global potential opium production (metric ton), 1990-2006
0
1,000
2,000
3,000
4,000
5,000
6,000
7,000
1990
1991
1992
1993
1994
1995
1996
1997
1998
1999
2000
2001
2002
2003
2004
2005
2006
met
ric to
ns
Afghanistan Myanmar Lao PDR Rest of the World
In 2006, the weighted average yield per ha decreased by 6% to 37.0 kg/ha, compared to 39.3 kg/ha in 2005. The largest declines were found in the Central and Western Regions where farmers reported losses due to drought.
In line with the rise in cultivation, potential opium production in Southern Afghanistan increased by 112% to 3,702 metric tons. This is equivalent to 61% of the total opium production in Afghanistan in 2006. Although yields were slightly higher than in 2005, opium production decreased by 14% in Northern Afghanistan to 945 metric tons, which is equivalent to 15% of the total production in 2006. In the Western Region, opium poppy cultivation remained stable, whereas opium production decreased by 22%, due to the drought problems in that region.
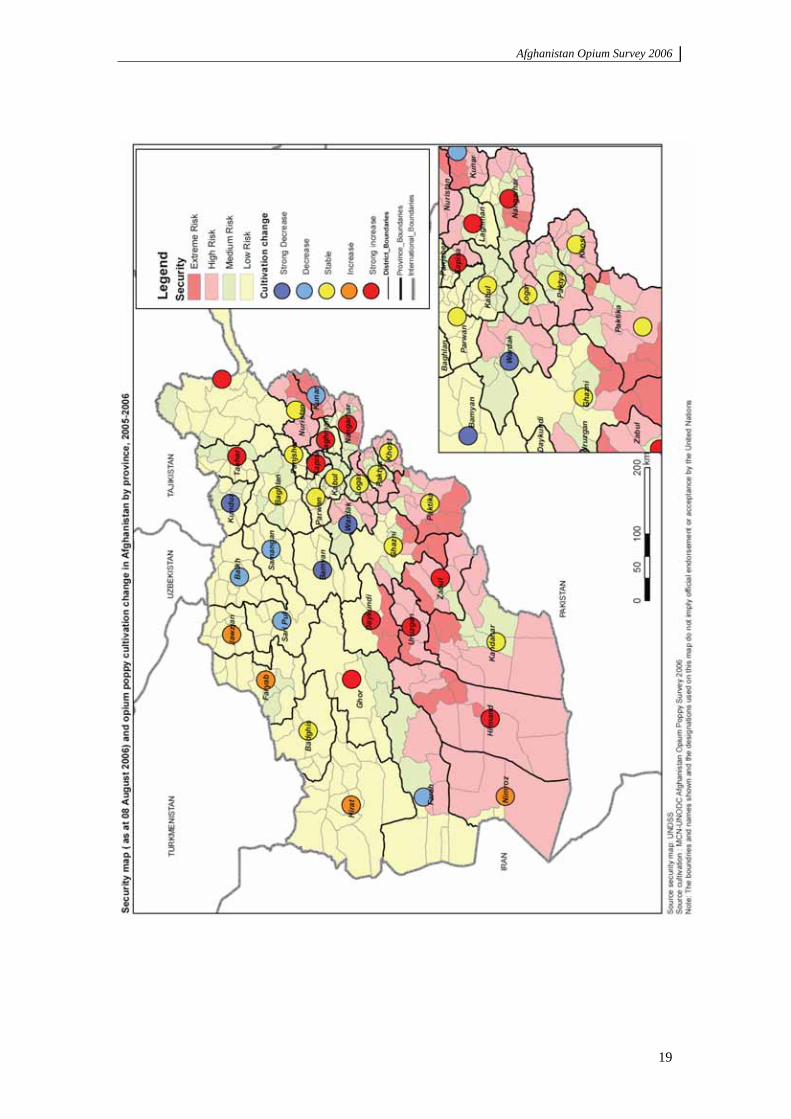
Opium poppy cultivation and security problems increased sharply in Southern Afghanistan in 2006
During the survey period, the security situation was fragile in most of the southern provinces. In the south, military operations were ongoing and Anti Government Elements (AGE) were very active. Unstable security conditions in the region reportedly played a major role in households’ decisions about opium poppy cultivation, as the AGE were able to encourage and even threaten farmers to cultivate opium poppy The security map (source: UNDSS) on page 20 shows the security situation (as at 8 August 2006) and the 2006 opium poppy cultivation level by province. Main increases in cultivation took place in the southern provinces where most of the high and extreme risk areas are located. Although the security situation was relatively good in Badakhshan, cultivation increased by 77% in 2006. However, opium poppy cultivation was mainly found in Dareem and Argo valleys, where the security was not good. In the plain areas close to the district centres, opium poppy cultivation was stable compared to 2005.
Eradication of opium poppy increases in 2006
In 2006, an estimated area of 15,300 ha of opium poppy fields was eradicated (with a confidence interval ranging from 14,130-16,060 ha). This is roughly 10% of the area under opium poppy cultivation in 2006, up from 5% of the cultivation area in 2005.
UNODC/MCN field surveyors visited nearly 1,400 villages in 19 provinces where opium poppy eradication was carried out by Governor-led eradication teams and verified 9,000 ha of eradicated
Afghanistan Opium Survey 2006
8
poppy fields (>18,000 fields). Governors reported eradication in another 320 villages which were not visited by the surveyors. Nationwide, Governors claimed 23,563 ha of eradication in at least 1,700 villages. The surveyors found that, on average, only 57% of these claims could be verified. Applying the average ratio between claimed and actual verified eradication over the total claims, it is estimated that 13,050 hectares were eradicated across Afghanistan in Governor-led eradication programs (4,000 ha in 2005). A further 2,250 ha of opium poppy fields were eradicated by the Afghanistan Eradication Force (AEF) in Helmand and Badakshan (210 ha in 2005)1.
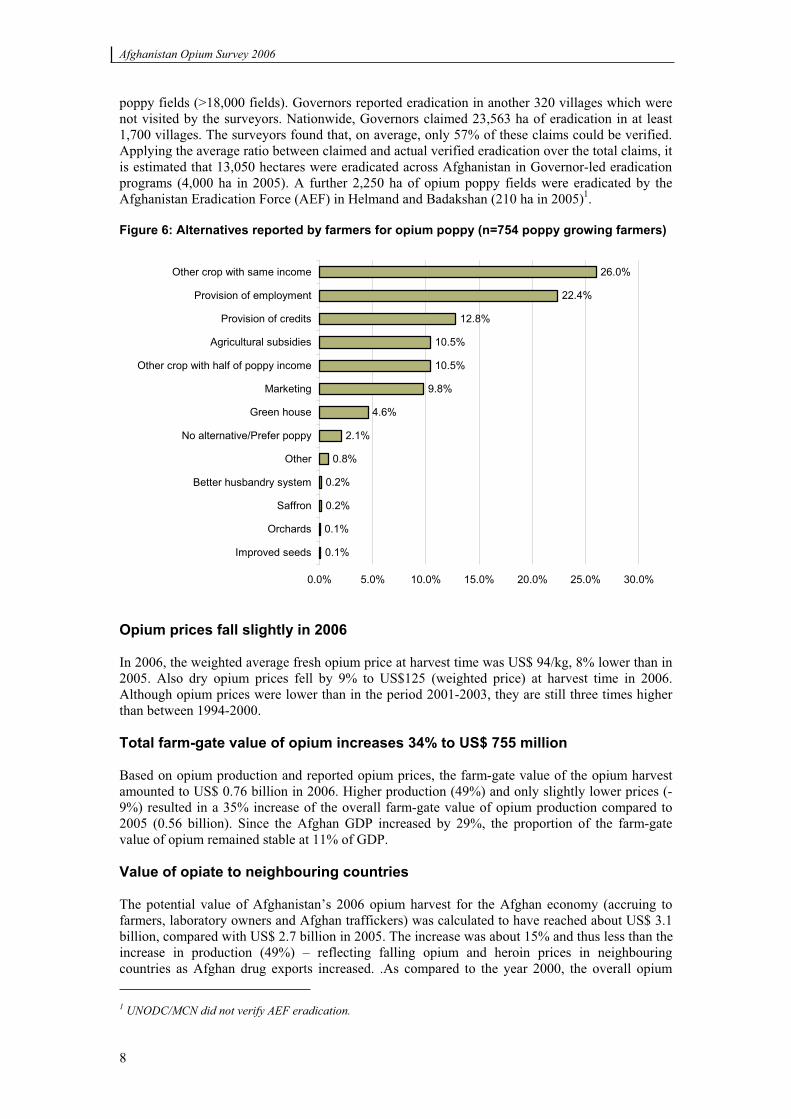
Figure 6: Alternatives reported by farmers for opium poppy (n=754 poppy growing farmers)
0.1%
0.1%
0.2%
0.2%
0.8%
2.1%
4.6%
9.8%
10.5%
10.5%
12.8%
22.4%
26.0%
0.0% 5.0% 10.0% 15.0% 20.0% 25.0% 30.0%
Improved seeds
Orchards
Saffron
Better husbandry system
Other
No alternative/Prefer poppy
Green house
Marketing
Other crop with half of poppy income
Agricultural subsidies
Provision of credits
Provision of employment
Other crop with same income
Opium prices fall slightly in 2006
In 2006, the weighted average fresh opium price at harvest time was US$ 94/kg, 8% lower than in 2005. Also dry opium prices fell by 9% to US$125 (weighted price) at harvest time in 2006. Although opium prices were lower than in the period 2001-2003, they are still three times higher than between 1994-2000.
Total farm-gate value of opium increases 34% to US$ 755 million
Based on opium production and reported opium prices, the farm-gate value of the opium harvest amounted to US$ 0.76 billion in 2006. Higher production (49%) and only slightly lower prices (-9%) resulted in a 35% increase of the overall farm-gate value of opium production compared to 2005 (0.56 billion). Since the Afghan GDP increased by 29%, the proportion of the farm-gate value of opium remained stable at 11% of GDP.
Value of opiate to neighbouring countries
The potential value of Afghanistan’s 2006 opium harvest for the Afghan economy (accruing to farmers, laboratory owners and Afghan traffickers) was calculated to have reached about US$ 3.1 billion, compared with US$ 2.7 billion in 2005. The increase was about 15% and thus less than the increase in production (49%) – reflecting falling opium and heroin prices in neighbouring countries as Afghan drug exports increased. .As compared to the year 2000, the overall opium 1 UNODC/MCN did not verify AEF eradication.
Afghanistan Opium Survey 2006
9
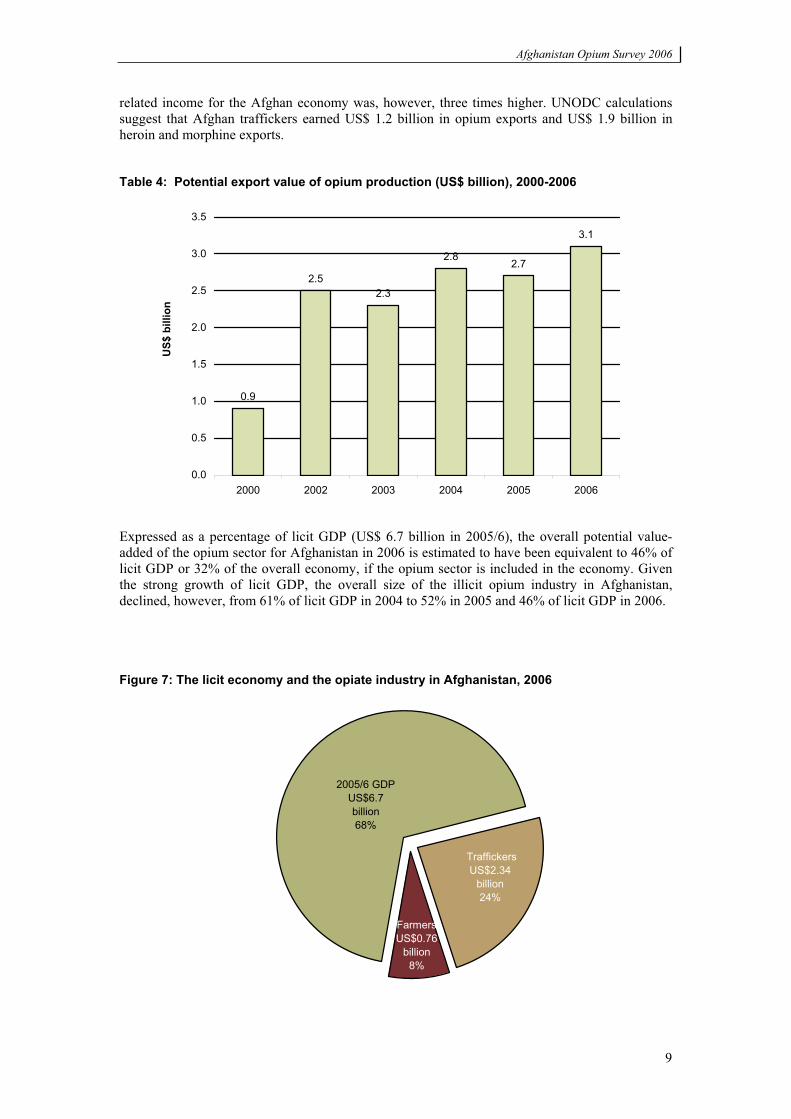
related income for the Afghan economy was, however, three times higher. UNODC calculations suggest that Afghan traffickers earned US$ 1.2 billion in opium exports and US$ 1.9 billion in heroin and morphine exports.
Table 4: Potential export value of opium production (US$ billion), 2000-2006
0.9
2.52.3
2.82.7
3.1
0.0
0.5
1.0
1.5
2.0
2.5
3.0
3.5
2000 2002 2003 2004 2005 2006
US$
bill
ion
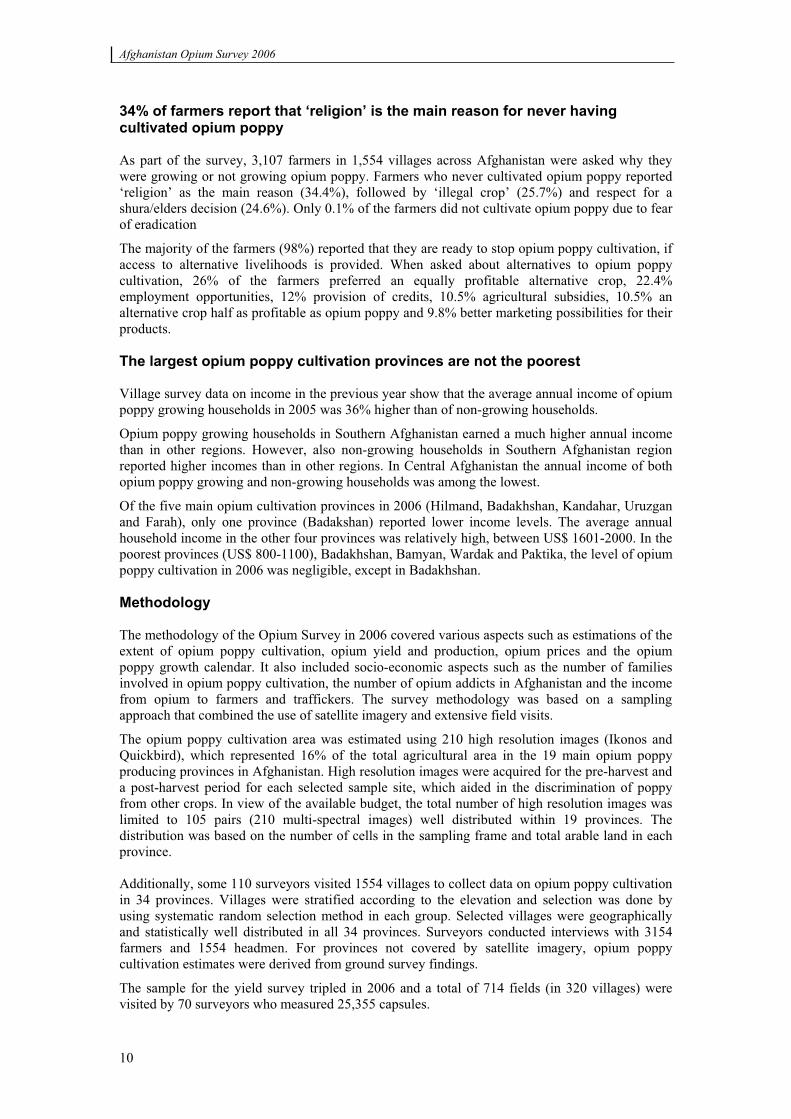
Expressed as a percentage of licit GDP (US$ 6.7 billion in 2005/6), the overall potential value-added of the opium sector for Afghanistan in 2006 is estimated to have been equivalent to 46% of licit GDP or 32% of the overall economy, if the opium sector is included in the economy. Given the strong growth of licit GDP, the overall size of the illicit opium industry in Afghanistan, declined, however, from 61% of licit GDP in 2004 to 52% in 2005 and 46% of licit GDP in 2006.
Figure 7: The licit economy and the opiate industry in Afghanistan, 2006
FarmersUS$0.76
billion 8%
2005/6 GDP US$6.7 billion68%
TraffickersUS$2.34
billion24%
Afghanistan Opium Survey 2006
10
34% of farmers report that ‘religion’ is the main reason for never having cultivated opium poppy
As part of the survey, 3,107 farmers in 1,554 villages across Afghanistan were asked why they were growing or not growing opium poppy. Farmers who never cultivated opium poppy reported ‘religion’ as the main reason (34.4%), followed by ‘illegal crop’ (25.7%) and respect for a shura/elders decision (24.6%). Only 0.1% of the farmers did not cultivate opium poppy due to fear of eradication
The majority of the farmers (98%) reported that they are ready to stop opium poppy cultivation, if access to alternative livelihoods is provided. When asked about alternatives to opium poppy cultivation, 26% of the farmers preferred an equally profitable alternative crop, 22.4% employment opportunities, 12% provision of credits, 10.5% agricultural subsidies, 10.5% an alternative crop half as profitable as opium poppy and 9.8% better marketing possibilities for their products.
The largest opium poppy cultivation provinces are not the poorest
Village survey data on income in the previous year show that the average annual income of opium poppy growing households in 2005 was 36% higher than of non-growing households.
Opium poppy growing households in Southern Afghanistan earned a much higher annual income than in other regions. However, also non-growing households in Southern Afghanistan region reported higher incomes than in other regions. In Central Afghanistan the annual income of both opium poppy growing and non-growing households was among the lowest.
Of the five main opium cultivation provinces in 2006 (Hilmand, Badakhshan, Kandahar, Uruzgan and Farah), only one province (Badakshan) reported lower income levels. The average annual household income in the other four provinces was relatively high, between US$ 1601-2000. In the poorest provinces (US$ 800-1100), Badakhshan, Bamyan, Wardak and Paktika, the level of opium poppy cultivation in 2006 was negligible, except in Badakhshan.
Methodology
The methodology of the Opium Survey in 2006 covered various aspects such as estimations of the extent of opium poppy cultivation, opium yield and production, opium prices and the opium poppy growth calendar. It also included socio-economic aspects such as the number of families involved in opium poppy cultivation, the number of opium addicts in Afghanistan and the income from opium to farmers and traffickers. The survey methodology was based on a sampling approach that combined the use of satellite imagery and extensive field visits.
The opium poppy cultivation area was estimated using 210 high resolution images (Ikonos and Quickbird), which represented 16% of the total agricultural area in the 19 main opium poppy producing provinces in Afghanistan. High resolution images were acquired for the pre-harvest and a post-harvest period for each selected sample site, which aided in the discrimination of poppy from other crops. In view of the available budget, the total number of high resolution images was limited to 105 pairs (210 multi-spectral images) well distributed within 19 provinces. The distribution was based on the number of cells in the sampling frame and total arable land in each province.
Additionally, some 110 surveyors visited 1554 villages to collect data on opium poppy cultivation in 34 provinces. Villages were stratified according to the elevation and selection was done by using systematic random selection method in each group. Selected villages were geographically and statistically well distributed in all 34 provinces. Surveyors conducted interviews with 3154 farmers and 1554 headmen. For provinces not covered by satellite imagery, opium poppy cultivation estimates were derived from ground survey findings.
The sample for the yield survey tripled in 2006 and a total of 714 fields (in 320 villages) were visited by 70 surveyors who measured 25,355 capsules.
Afghanistan Opium Survey 2006
11
The eradication verification survey was implemented separately by 40 surveyors who visited 1400 villages and around 18,000 opium poppy fields. A total of 45 surveyors collected ground reference data, which supported the interpretation of the satellite images.
In 2006 (including the Rapid Assessment Survey, The Eradication Verification Survey and the Annual Opium Survey), a total of 320 surveyors collected ground data/information on opium poppy cultivation, eradication and socio-economic variables in Afghanistan in around 3500 villages.
For all surveys experienced surveyors were selected from the UNODC surveyor pool like in previous years, based on their previous performance. Security was generally problematic for the surveyors, but recruitment of surveyors originating from the corresponding region helped to reduce the security risk.
As part of the capacity building in Afghan Government, trainings for surveyors were given jointly by MCN/UNODC local staff. MCN/UNODC survey coordinators monitored and supervised the survey in their concerned regions. Additionally, MCN local staff was trained on map preparation.
Afghanistan Opium Survey 2006
12
Hira
t
Fara
h
Nim
roz
Hilm
and
Kand
ahar
Zabu
lPa
ktik
a
Gha
zni
Uru
zuga
n
Gho
r
Badg
his
Fary
ab
Jaw
zjan
Sari
Pul
Balk
h Sam
anga
n
Kund
uzTa
khar
Bada
ksha
n
Nur
ista
n
Kuna
rLa
ghm
anKa
pisa
Parw
an
Bagh
lan
Bam
yan
War
dak
Loga
r
Pakt
yaKh
ost
Nan
garh
ar
Panj
shir
65�E
65�E
70�E
70�E
30�N
30�N
35�N
35�N
Opi
um p
oppy
cul
tivat
ion
in A
fgha
nist
an b
y pr
ovin
ce, 2
004-
2006
Sour
ce: M
CN
- U
NO
DC
Afg
hani
stan
Opi
um S
urve
y 20
06N
ote:
The
bou
ndar
ies
and
nam
es s
how
n an
d th
e de
sign
atio
ns u
sed
on th
is m
ap d
o no
t im
ply
offic
ial e
ndor
sem
ent o
r acc
epta
nce
by th
e U
nite
d N
atio
ns.
TUR
KM
ENIS
TAN
IRA
NPA
KIS
TAN
TAJI
KIS
TAN
UZB
EKIS
TAN
10,240
Geo
grap
hic
proj
ectio
n; D
atum
: WG
S 84
020
010
0km
50
69,324
12,619
7,232
13,056
7,694
Cul
tivat
ion
(ha)
Inte
rnat
iona
l bou
ndar
ies
Prov
ince
bou
ndar
ies
2004
2005
2006
Afghanistan Opium Survey 2006
13
Afghanistan Opium Survey 2006
14
Afghanistan Opium Survey 2006
15
Afghanistan Opium Survey 2006
16
Afghanistan Opium Survey 2006
17
!
!
!!
!
!
!
!
!
Day
kun
di
Panj
shir
Hira
t
Fara
h
Hilm
andG
hor
Nim
roz
Kand
ahar
Bada
ksha
n
Uru
zgan
Gha
zni
Balk
h
Zabu
l
Fary
ab
Badg
his
Pakt
ika
Bagh
lan
Sar
i Pul
Bam
yan
Takh
arJa
wzj
an
Parw
an
War
dak
Sam
anga
n
Kund
uz
Nur
ista
n Kuna
r
Kabu
lN
anga
rhar
Khos
t
Pakt
ya
Loga
r
Lagh
man
Kapi
sa
Quet
ta
Pes
hw
ar
Jala
labad
Fay
z A
bad
Maz
ar-E
-Sh
arif
65�E
65�E
70�E
70�E
30�N
30�N
35�N
35�N
Opi
um p
rodu
ctio
n in
Afg
hani
stan
by
prov
ince
, 200
6
Sour
ce: M
CN
- U
NO
DC
Afg
hani
stan
Opi
um S
urve
y 20
06
Not
e: T
he b
ound
arie
s an
d na
mes
sho
wn
and
the
desi
gnat
ions
use
d on
this
map
do
not i
mpl
y of
ficia
l end
orse
men
t or a
ccep
tanc
e by
the
Uni
ted
Nat
ions
.
TUR
KM
ENIS
TAN
IRA
NPA
KIS
TAN
TAJI
KIS
TAN
UZB
EKIS
TAN
Geo
grap
hic
proj
ectio
n; D
atum
: WG
S 84
020
010
0km
50
Prod
uctio
n (m
etric
tons
)
Inte
rnat
iona
l bou
ndar
ies
Prov
ince
bou
ndar
ies
!M
ain
Citi
es
0 - 1
0
11 -
50
51 -
100
101
- 500
501
and
abov
e
Afghanistan Opium Survey 2006
18
!
!
!!
!
!
!
!
!
Uru
zgan
Panj
shir
Hira
t
Fara
h
Hilm
andG
hor
Nim
roz
Kand
ahar
Bada
ksha
n
Day
kun
diG
hazn
i
Balk
h
Zabu
l
Fary
ab
Badg
his
Pakt
ika
Bagh
lan
Sar
i Pul
Bam
yan
Takh
arJa
wzj
an
Parw
an
War
dak
Sam
anga
n
Kund
uz
Nur
ista
n Kuna
r
Kabu
lN
anga
rhar
Khos
t
Pakt
ya
Loga
r
Lagh
man
Kapi
sa
Quet
ta
Pes
hw
ar
Jala
labad
Fay
z A
bad
Maz
ar-E
-Sh
arif
65�E
65�E
70�E
70�E
30�N
30�N
35�N
35�N
Opi
um p
rodu
ctio
n ch
ange
in A
fgha
nist
an, 2
005-
2006
(at p
rovi
nce
leve
l)
Sour
ce: M
CN
- U
NO
DC
Afg
hani
stan
Opi
um S
urve
y 20
06N
ote:
The
bou
ndar
ies
and
nam
es s
how
n an
d th
e de
sign
atio
ns u
sed
on th
is m
ap d
o no
t im
ply
offic
ial e
ndor
sem
ent o
r acc
epta
nce
by th
e U
nite
d N
atio
ns.
TUR
KM
ENIS
TAN
IRA
NPA
KIS
TAN
TAJI
KIS
TAN
UZB
EKIS
TAN
Geo
grap
hic
proj
ectio
n; D
atum
: WG
S 84
020
010
0km
50
Prod
uctio
n ch
ange
(%)
Inte
rnat
iona
l bou
ndar
ies
Prov
ince
bou
ndar
ies
!M
ain
Citi
es
Stro
ng d
eclin
e (<
-50%
)
Dec
line
(-50
% to
-10%
)
Stab
le (-
9% to
10%
)
Incr
ease
(11%
to 5
0%)
Stro
ng in
crea
se (5
1% to
100
%)
Very
stro
ng in
crea
se (>
100)
Afghanistan Opium Survey 2006
19
Afghanistan Opium Survey 2006
20
IRAN
PAKI
STAN
TUR
KMEN
ISTA
NTA
JIKI
STAN
UZB
EKIS
TAN
Sou
rce
: M
CN
-UN
OD
C A
fgha
nist
an O
pium
Pop
py S
urve
y 20
06N
ote:
The
bou
ndrie
s an
d na
mes
sho
wn
and
the
desi
gnat
ions
use
d on
this
map
do
not i
mpl
y of
ficia
l end
orse
men
t or a
ccep
tanc
e by
the
Uni
ted
Nat
ions
Reg
iona
l opi
um p
oppy
cul
tivat
ion
and
prod
uctio
n in
Afg
hani
stan
, 20
06
101,900
3,702
16,615
537
22,574
945
15,234
5908,312
304
Prod
uctio
n (m
t ton
s)
Prov
ince
bou
ndar
ies
Reg
iona
l bou
ndar
ies
Inte
rnat
iona
l bou
ndar
ies
Lege
nd Cul
tivat
ion
(ha)
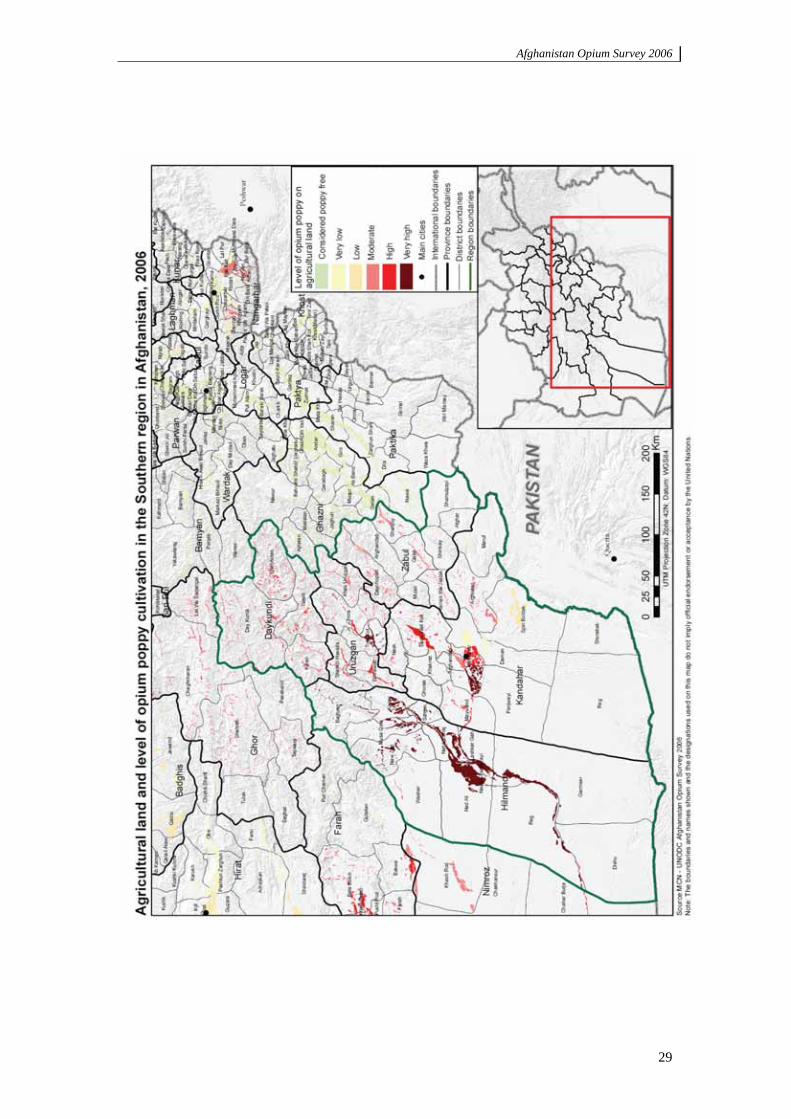
Sout
hern
Wes
tern
Nor
ther
n
Nor
th-E
aste
rn
East
ern
Cen
tral
Afghanistan Opium Survey 2006
21
1 INTRODUCTION
The Afghanistan opium survey is implemented annually by the United Nations Office on Drugs and Crime and, since 2003, in collaboration with the Afghan Government. The survey team collects and analyses information on the location and extent of opium poppy cultivation, the potential production of opium, and the socioeconomic dimensions of the problem. The results provide a detailed picture of the outcome of the current year’s opium season and, with previous years’ data, enable the identification of mid- and long-term trends in the evolution of the illicit drug problem. This information is essential for planning, implementing and monitoring the impact of measures required for tackling a problem, which has serious implications for both the country and the international community.
The opium survey is implemented in the technical framework of UNODC’s Illicit Crop Monitoring Programme (ICMP). The objective of ICMP is to assist the international community in monitoring the extent and evolution of illicit crops in the context of the elimination objective adopted at the General Assembly Special Session on Drugs in June 1998. In the framework of ICMP, monitoring activities are presently supported by UNODC in the other five main countries affected by illicit opium poppy and coca bush cultivation (Myanmar and Lao PDR in Asia, and Colombia, Peru and Bolivia in Latin America), as well as in Morocco, where one of the main areas of illicit cannabis cultivation is located.
The 2006 opium survey in Afghanistan was implemented under the project AD/AFG/F98 “Monitoring of opium production in Afghanistan” and the project AD/GLO/C93 “Illicit Crop Monitoring Programme Support”, with financial contributions from the Governments of Finland, the United Kingdom, and the United States of America.
Afghanistan Opium Survey 2006
22
2 FINDINGS
2.1 Opium Poppy Cultivation
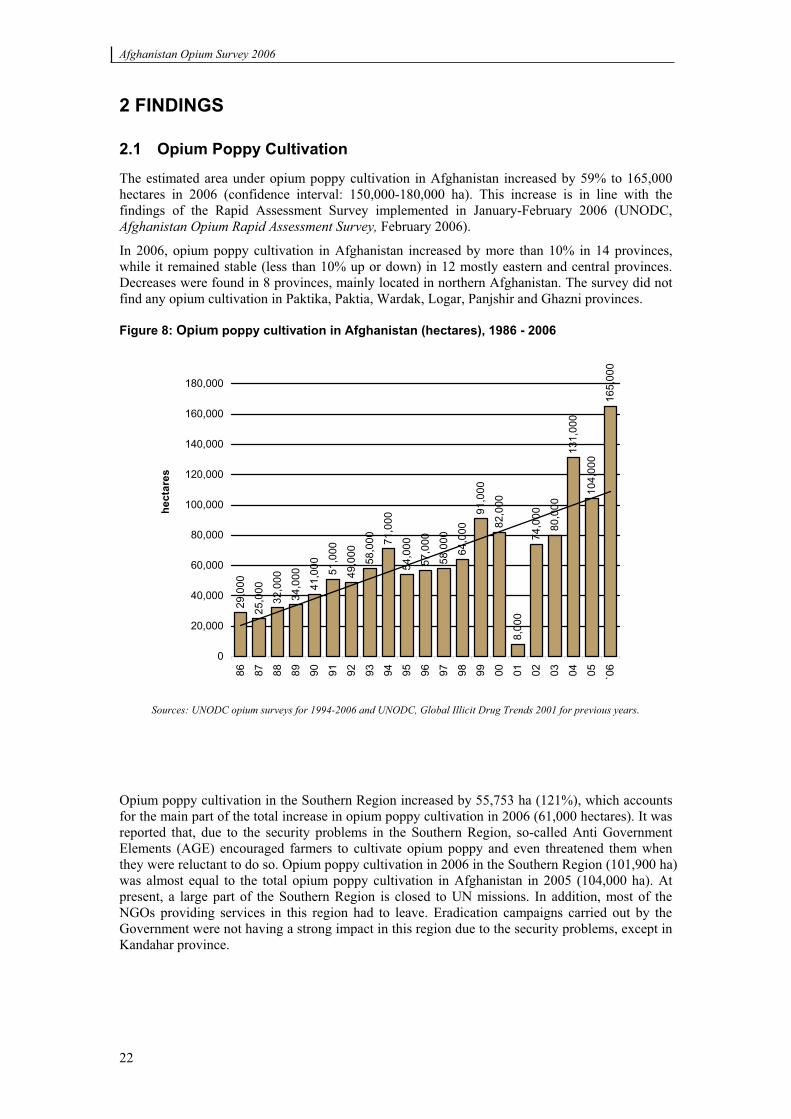
The estimated area under opium poppy cultivation in Afghanistan increased by 59% to 165,000 hectares in 2006 (confidence interval: 150,000-180,000 ha). This increase is in line with the findings of the Rapid Assessment Survey implemented in January-February 2006 (UNODC, Afghanistan Opium Rapid Assessment Survey, February 2006).
In 2006, opium poppy cultivation in Afghanistan increased by more than 10% in 14 provinces, while it remained stable (less than 10% up or down) in 12 mostly eastern and central provinces. Decreases were found in 8 provinces, mainly located in northern Afghanistan. The survey did not find any opium cultivation in Paktika, Paktia, Wardak, Logar, Panjshir and Ghazni provinces.
Figure 8: Opium poppy cultivation in Afghanistan (hectares), 1986 - 2006
29,0
00
25,0
00
32,0
00
34,0
00
41,0
00 51,0
00
49,0
00
58,0
00 71,0
00
54,0
00
57,0
00
58,0
00
64,0
00
91,0
00
82,0
00
8,00
0
74,0
00
80,0
00
131,
000
104,
000
165,
000
0
20,000
40,000
60,000
80,000
100,000
120,000
140,000
160,000
180,000
86 87 88 89 90 91 92 93 94 95 96 97 98 99 00 01 02 03 04 05 `06
hect
ares
Sources: UNODC opium surveys for 1994-2006 and UNODC, Global Illicit Drug Trends 2001 for previous years.
Opium poppy cultivation in the Southern Region increased by 55,753 ha (121%), which accounts for the main part of the total increase in opium poppy cultivation in 2006 (61,000 hectares). It was reported that, due to the security problems in the Southern Region, so-called Anti Government Elements (AGE) encouraged farmers to cultivate opium poppy and even threatened them when they were reluctant to do so. Opium poppy cultivation in 2006 in the Southern Region (101,900 ha) was almost equal to the total opium poppy cultivation in Afghanistan in 2005 (104,000 ha). At present, a large part of the Southern Region is closed to UN missions. In addition, most of the NGOs providing services in this region had to leave. Eradication campaigns carried out by the Government were not having a strong impact in this region due to the security problems, except in Kandahar province.
Afghanistan Opium Survey 2006
23
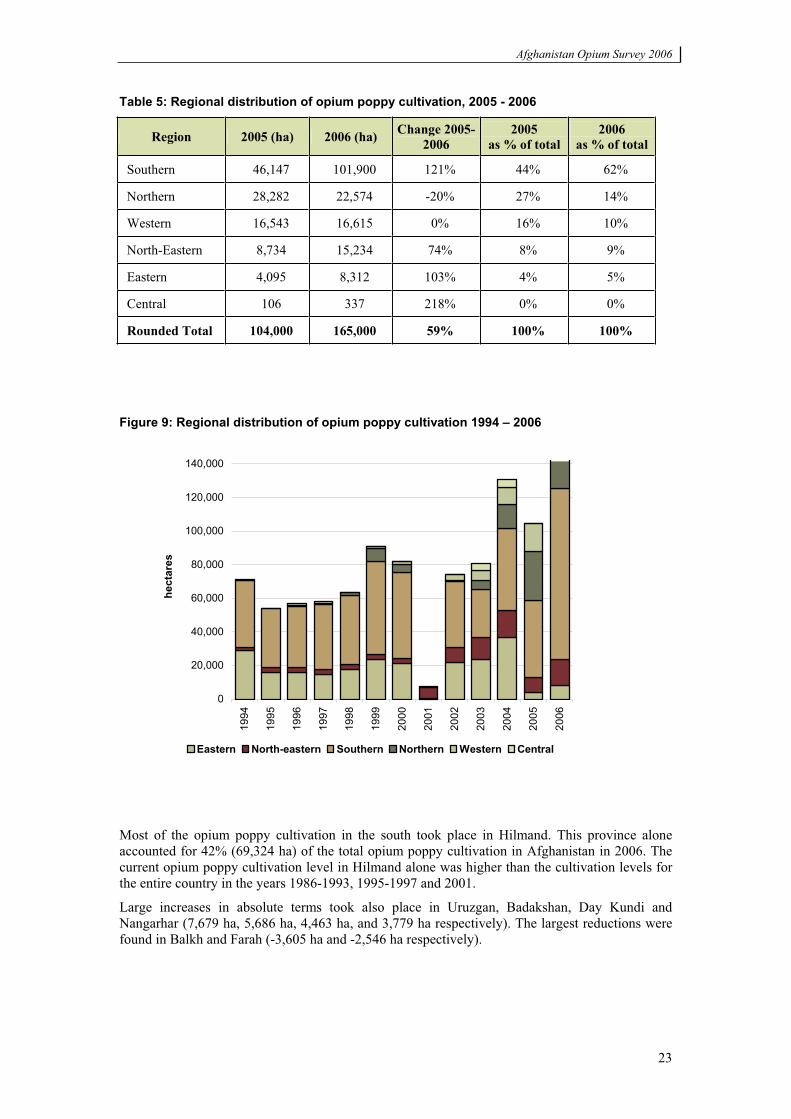
Table 5: Regional distribution of opium poppy cultivation, 2005 - 2006
Region 2005 (ha) 2006 (ha) Change 2005-2006
2005 as % of total
2006 as % of total
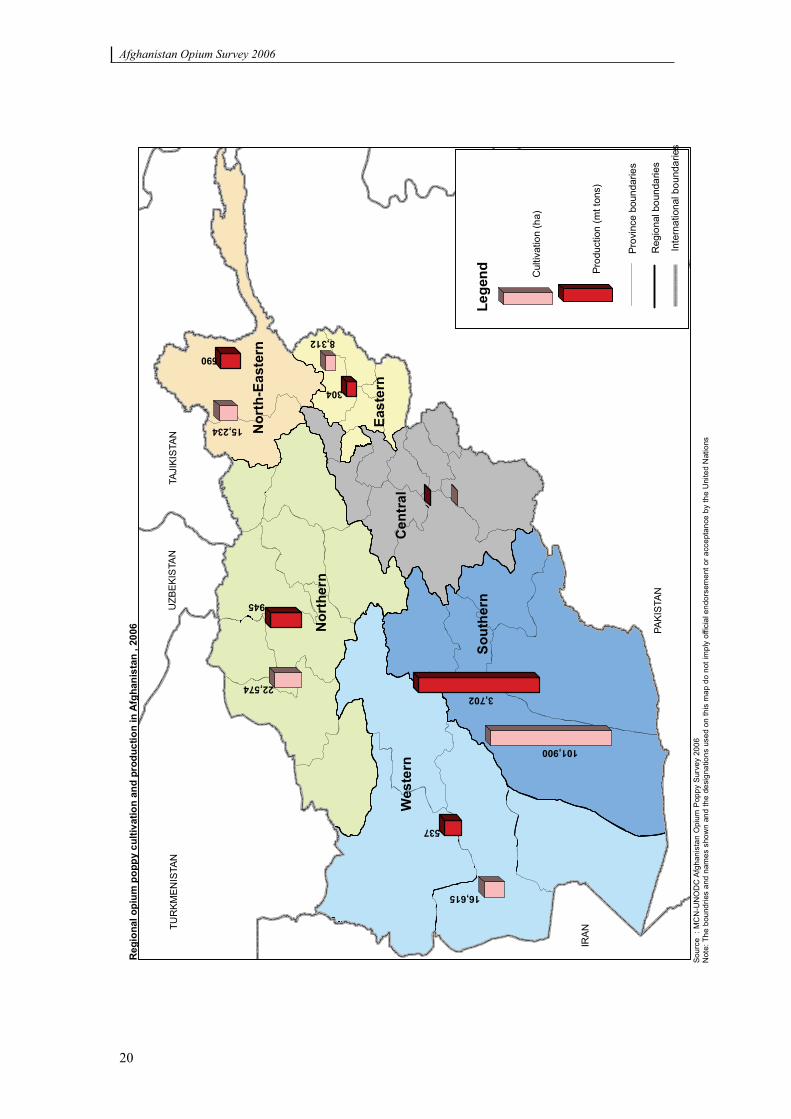
Southern 46,147 101,900 121% 44% 62%
Northern 28,282 22,574 -20% 27% 14%
Western 16,543 16,615 0% 16% 10%
North-Eastern 8,734 15,234 74% 8% 9%
Eastern 4,095 8,312 103% 4% 5%
Central 106 337 218% 0% 0%
Rounded Total 104,000 165,000 59% 100% 100%
Figure 9: Regional distribution of opium poppy cultivation 1994 – 2006
0
20,000
40,000
60,000
80,000
100,000
120,000
140,000
1994
1995
1996
1997
1998
1999
2000
2001
2002
2003
2004
2005
2006
hect
ares
Eastern North-eastern Southern Northern Western Central
Most of the opium poppy cultivation in the south took place in Hilmand. This province alone accounted for 42% (69,324 ha) of the total opium poppy cultivation in Afghanistan in 2006. The current opium poppy cultivation level in Hilmand alone was higher than the cultivation levels for the entire country in the years 1986-1993, 1995-1997 and 2001.
Large increases in absolute terms took also place in Uruzgan, Badakshan, Day Kundi and Nangarhar (7,679 ha, 5,686 ha, 4,463 ha, and 3,779 ha respectively). The largest reductions were found in Balkh and Farah (-3,605 ha and -2,546 ha respectively).
Afghanistan Opium Survey 2006
24
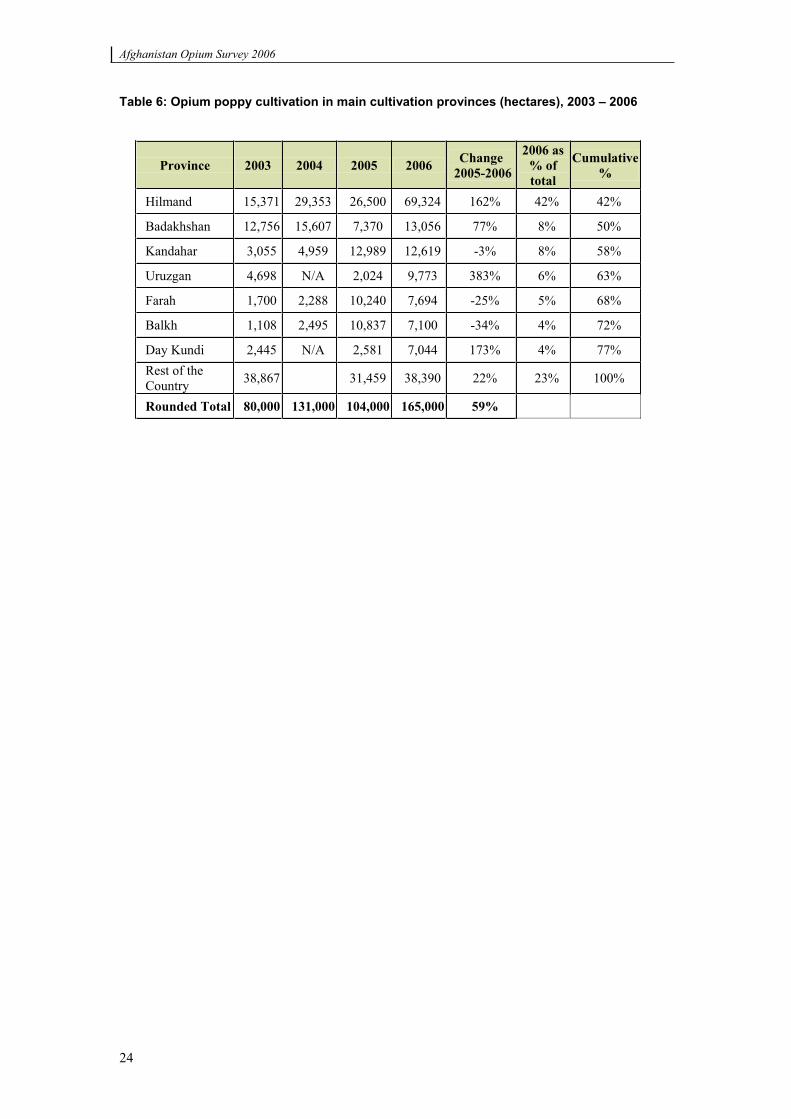
Table 6: Opium poppy cultivation in main cultivation provinces (hectares), 2003 – 2006
Province 2003 2004 2005 2006 Change 2005-2006
2006 as % of total
Cumulative %
Hilmand 15,371 29,353 26,500 69,324 162% 42% 42%
Badakhshan 12,756 15,607 7,370 13,056 77% 8% 50%
Kandahar 3,055 4,959 12,989 12,619 -3% 8% 58%
Uruzgan 4,698 N/A 2,024 9,773 383% 6% 63%
Farah 1,700 2,288 10,240 7,694 -25% 5% 68%
Balkh 1,108 2,495 10,837 7,100 -34% 4% 72%
Day Kundi 2,445 N/A 2,581 7,044 173% 4% 77% Rest of the Country 38,867 31,459 38,390 22% 23% 100%
Rounded Total 80,000 131,000 104,000 165,000 59%
Afghanistan Opium Survey 2006
25
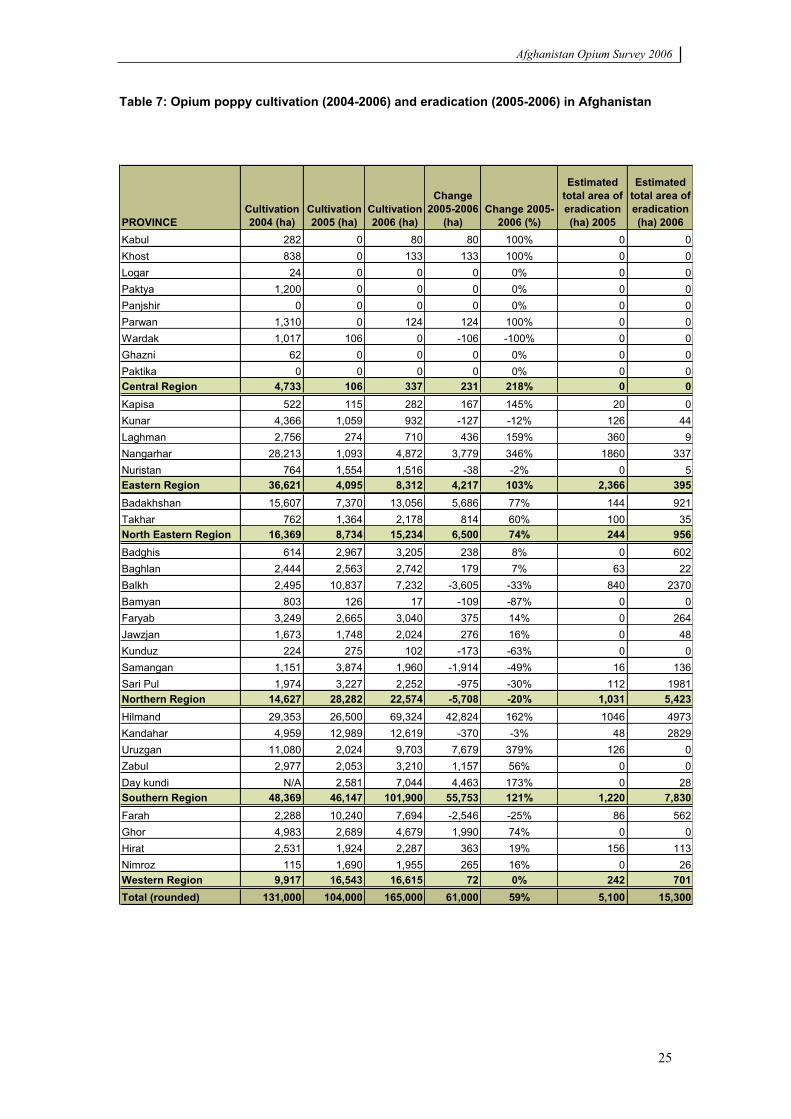
Table 7: Opium poppy cultivation (2004-2006) and eradication (2005-2006) in Afghanistan
PROVINCECultivation 2004 (ha)
Cultivation 2005 (ha)
Cultivation 2006 (ha)
Change 2005-2006
(ha)Change 2005-
2006 (%)
Estimated total area of eradication (ha) 2005
Estimated total area of eradication (ha) 2006
Kabul 282 0 80 80 100% 0 0Khost 838 0 133 133 100% 0 0Logar 24 0 0 0 0% 0 0Paktya 1,200 0 0 0 0% 0 0Panjshir 0 0 0 0 0% 0 0Parwan 1,310 0 124 124 100% 0 0Wardak 1,017 106 0 -106 -100% 0 0Ghazni 62 0 0 0 0% 0 0Paktika 0 0 0 0 0% 0 0Central Region 4,733 106 337 231 218% 0 0Kapisa 522 115 282 167 145% 20 0Kunar 4,366 1,059 932 -127 -12% 126 44Laghman 2,756 274 710 436 159% 360 9Nangarhar 28,213 1,093 4,872 3,779 346% 1860 337Nuristan 764 1,554 1,516 -38 -2% 0 5Eastern Region 36,621 4,095 8,312 4,217 103% 2,366 395Badakhshan 15,607 7,370 13,056 5,686 77% 144 921Takhar 762 1,364 2,178 814 60% 100 35North Eastern Region 16,369 8,734 15,234 6,500 74% 244 956Badghis 614 2,967 3,205 238 8% 0 602Baghlan 2,444 2,563 2,742 179 7% 63 22Balkh 2,495 10,837 7,232 -3,605 -33% 840 2370Bamyan 803 126 17 -109 -87% 0 0Faryab 3,249 2,665 3,040 375 14% 0 264Jawzjan 1,673 1,748 2,024 276 16% 0 48Kunduz 224 275 102 -173 -63% 0 0Samangan 1,151 3,874 1,960 -1,914 -49% 16 136Sari Pul 1,974 3,227 2,252 -975 -30% 112 1981Northern Region 14,627 28,282 22,574 -5,708 -20% 1,031 5,423Hilmand 29,353 26,500 69,324 42,824 162% 1046 4973Kandahar 4,959 12,989 12,619 -370 -3% 48 2829Uruzgan 11,080 2,024 9,703 7,679 379% 126 0Zabul 2,977 2,053 3,210 1,157 56% 0 0Day kundi N/A 2,581 7,044 4,463 173% 0 28Southern Region 48,369 46,147 101,900 55,753 121% 1,220 7,830Farah 2,288 10,240 7,694 -2,546 -25% 86 562Ghor 4,983 2,689 4,679 1,990 74% 0 0Hirat 2,531 1,924 2,287 363 19% 156 113Nimroz 115 1,690 1,955 265 16% 0 26Western Region 9,917 16,543 16,615 72 0% 242 701Total (rounded) 131,000 104,000 165,000 61,000 59% 5,100 15,300
Afghanistan Opium Survey 2006
26
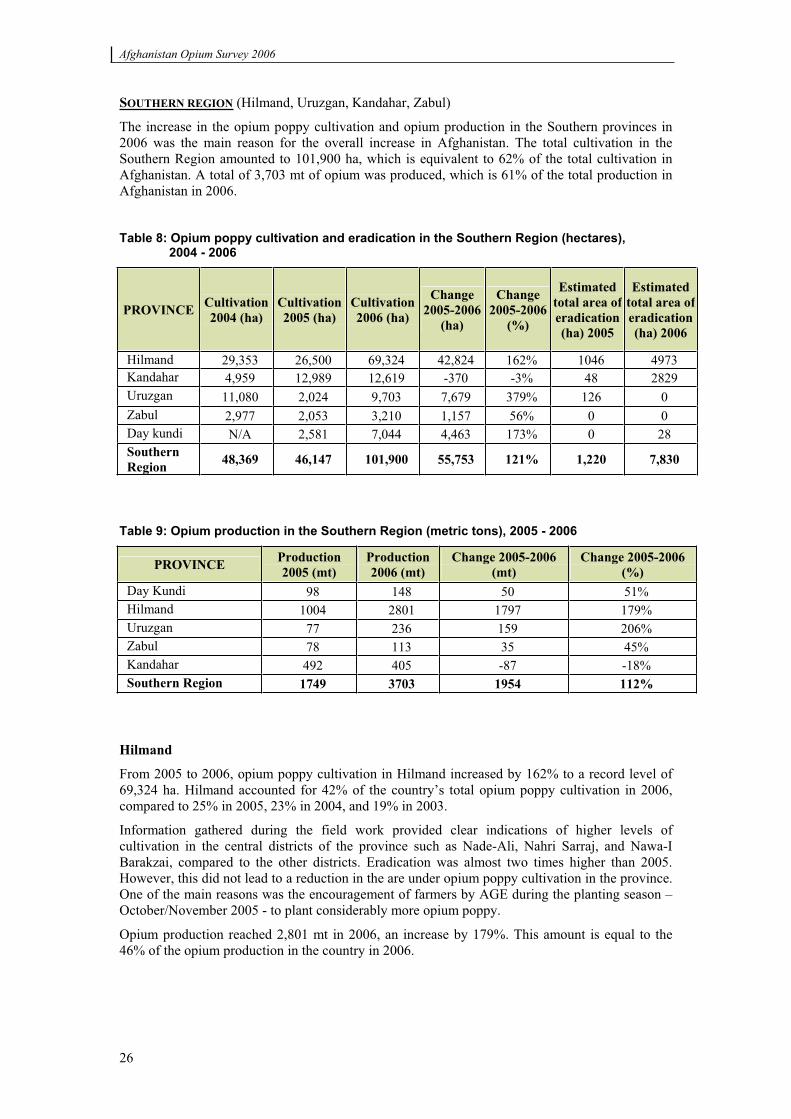
SOUTHERN REGION (Hilmand, Uruzgan, Kandahar, Zabul)
The increase in the opium poppy cultivation and opium production in the Southern provinces in 2006 was the main reason for the overall increase in Afghanistan. The total cultivation in the Southern Region amounted to 101,900 ha, which is equivalent to 62% of the total cultivation in Afghanistan. A total of 3,703 mt of opium was produced, which is 61% of the total production in Afghanistan in 2006.
Table 8: Opium poppy cultivation and eradication in the Southern Region (hectares), 2004 - 2006
PROVINCE Cultivation 2004 (ha)
Cultivation 2005 (ha)
Cultivation 2006 (ha)
Change 2005-2006
(ha)
Change 2005-2006
(%)
Estimated total area of eradication(ha) 2005
Estimated total area of eradication(ha) 2006
Hilmand 29,353 26,500 69,324 42,824 162% 1046 4973 Kandahar 4,959 12,989 12,619 -370 -3% 48 2829 Uruzgan 11,080 2,024 9,703 7,679 379% 126 0 Zabul 2,977 2,053 3,210 1,157 56% 0 0 Day kundi N/A 2,581 7,044 4,463 173% 0 28 Southern Region 48,369 46,147 101,900 55,753 121% 1,220 7,830
Table 9: Opium production in the Southern Region (metric tons), 2005 - 2006
PROVINCE Production 2005 (mt)
Production 2006 (mt)
Change 2005-2006 (mt)
Change 2005-2006 (%)
Day Kundi 98 148 50 51% Hilmand 1004 2801 1797 179% Uruzgan 77 236 159 206% Zabul 78 113 35 45% Kandahar 492 405 -87 -18% Southern Region 1749 3703 1954 112%
Hilmand
From 2005 to 2006, opium poppy cultivation in Hilmand increased by 162% to a record level of 69,324 ha. Hilmand accounted for 42% of the country’s total opium poppy cultivation in 2006, compared to 25% in 2005, 23% in 2004, and 19% in 2003.
Information gathered during the field work provided clear indications of higher levels of cultivation in the central districts of the province such as Nade-Ali, Nahri Sarraj, and Nawa-I Barakzai, compared to the other districts. Eradication was almost two times higher than 2005. However, this did not lead to a reduction in the are under opium poppy cultivation in the province. One of the main reasons was the encouragement of farmers by AGE during the planting season – October/November 2005 - to plant considerably more opium poppy.
Opium production reached 2,801 mt in 2006, an increase by 179%. This amount is equal to the 46% of the opium production in the country in 2006.
Afghanistan Opium Survey 2006
27
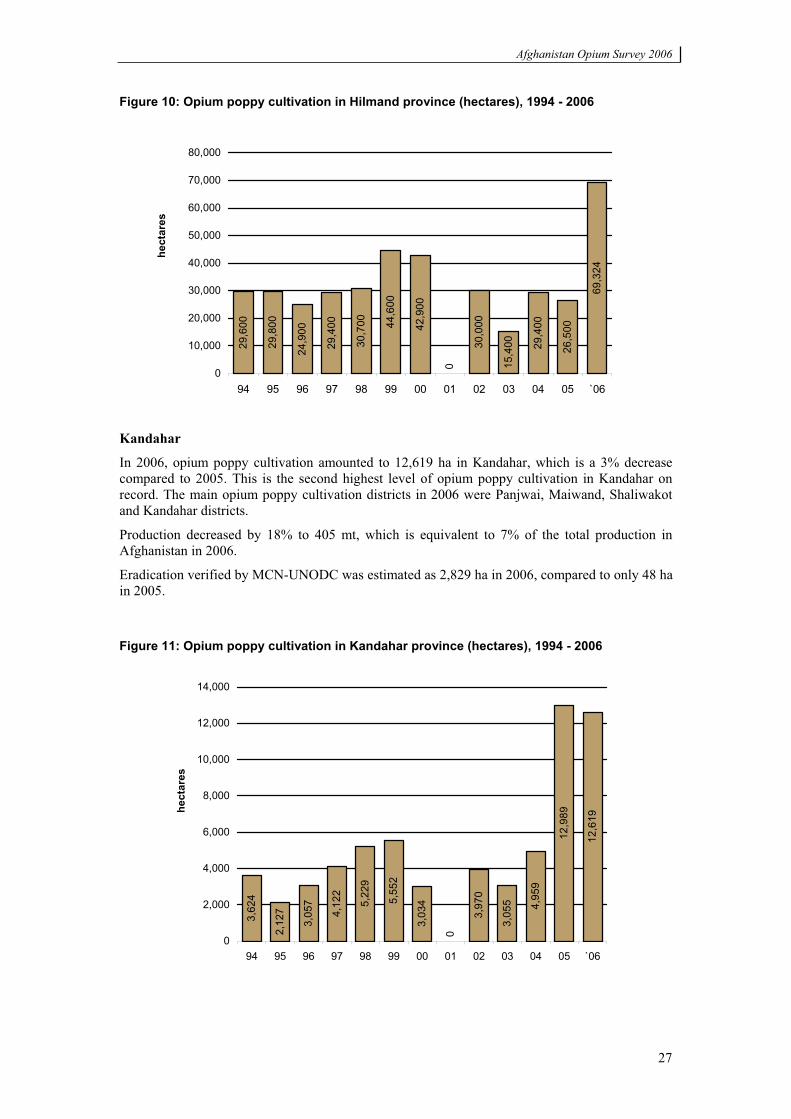
Figure 10: Opium poppy cultivation in Hilmand province (hectares), 1994 - 2006
29,6
00
29,8
00
24,9
00
29,4
00
30,7
00 44,6
00
42,9
00
0
30,0
00
15,4
00 29,4
00
26,5
00
69,3
24
0
10,000
20,000
30,000
40,000
50,000
60,000
70,000
80,000
94 95 96 97 98 99 00 01 02 03 04 05 `06
hect
ares
Kandahar
In 2006, opium poppy cultivation amounted to 12,619 ha in Kandahar, which is a 3% decrease compared to 2005. This is the second highest level of opium poppy cultivation in Kandahar on record. The main opium poppy cultivation districts in 2006 were Panjwai, Maiwand, Shaliwakot and Kandahar districts.
Production decreased by 18% to 405 mt, which is equivalent to 7% of the total production in Afghanistan in 2006.
Eradication verified by MCN-UNODC was estimated as 2,829 ha in 2006, compared to only 48 ha in 2005.
Figure 11: Opium poppy cultivation in Kandahar province (hectares), 1994 - 2006
3,62
4
2,12
7
3,05
7
4,12
2
5,22
9
5,55
2
3,03
4
0
3,97
0
3,05
5 4,95
9
12,9
89
12,6
19
0
2,000
4,000
6,000
8,000
10,000
12,000
14,000
94 95 96 97 98 99 00 01 02 03 04 05 `06
hect
ares
Afghanistan Opium Survey 2006
28
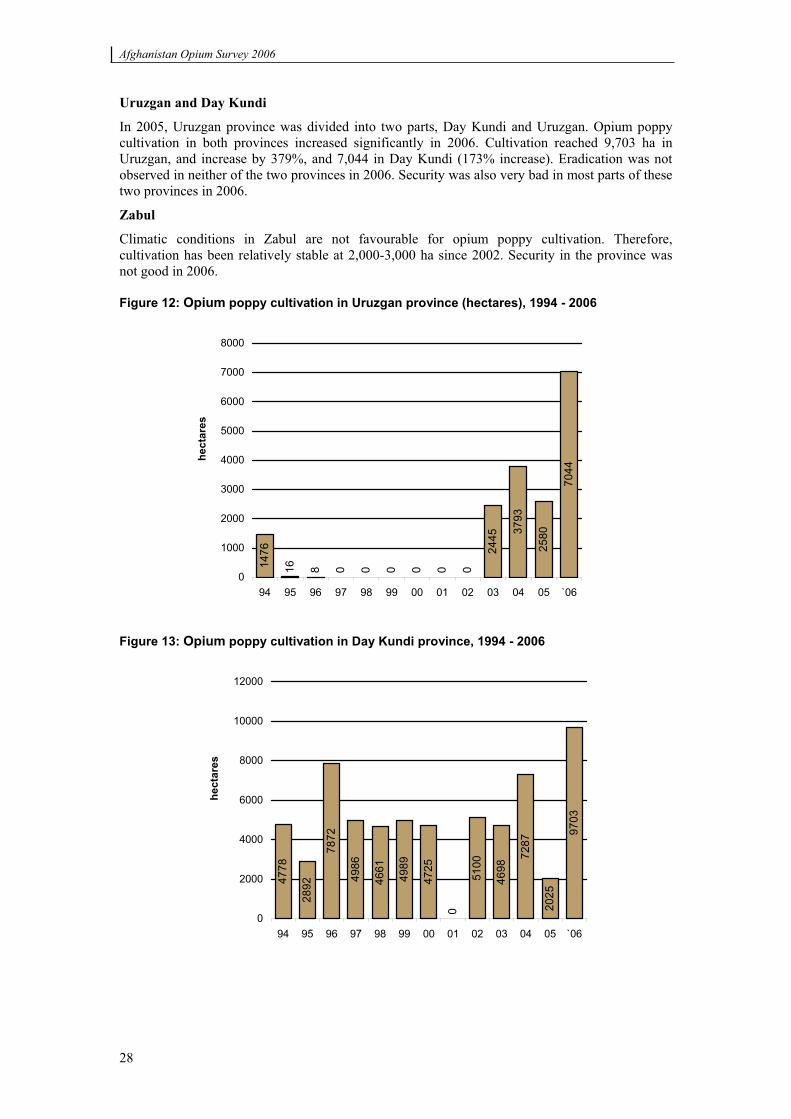
Uruzgan and Day Kundi
In 2005, Uruzgan province was divided into two parts, Day Kundi and Uruzgan. Opium poppy cultivation in both provinces increased significantly in 2006. Cultivation reached 9,703 ha in Uruzgan, and increase by 379%, and 7,044 in Day Kundi (173% increase). Eradication was not observed in neither of the two provinces in 2006. Security was also very bad in most parts of these two provinces in 2006.
Zabul
Climatic conditions in Zabul are not favourable for opium poppy cultivation. Therefore, cultivation has been relatively stable at 2,000-3,000 ha since 2002. Security in the province was not good in 2006.
Figure 12: Opium poppy cultivation in Uruzgan province (hectares), 1994 - 2006
1476
16 8 0 0 0 0 0 0
2445 37
93
2580
7044
0
1000
2000
3000
4000
5000
6000
7000
8000
94 95 96 97 98 99 00 01 02 03 04 05 `06
hect
ares
Figure 13: Opium poppy cultivation in Day Kundi province, 1994 - 2006
4778
2892
7872
4986
4661
4989
4725
0
5100
4698
7287
2025
9703
0
2000
4000
6000
8000
10000
12000
94 95 96 97 98 99 00 01 02 03 04 05 `06
hect
ares
Afghanistan Opium Survey 2006
29
Afghanistan Opium Survey 2006
30
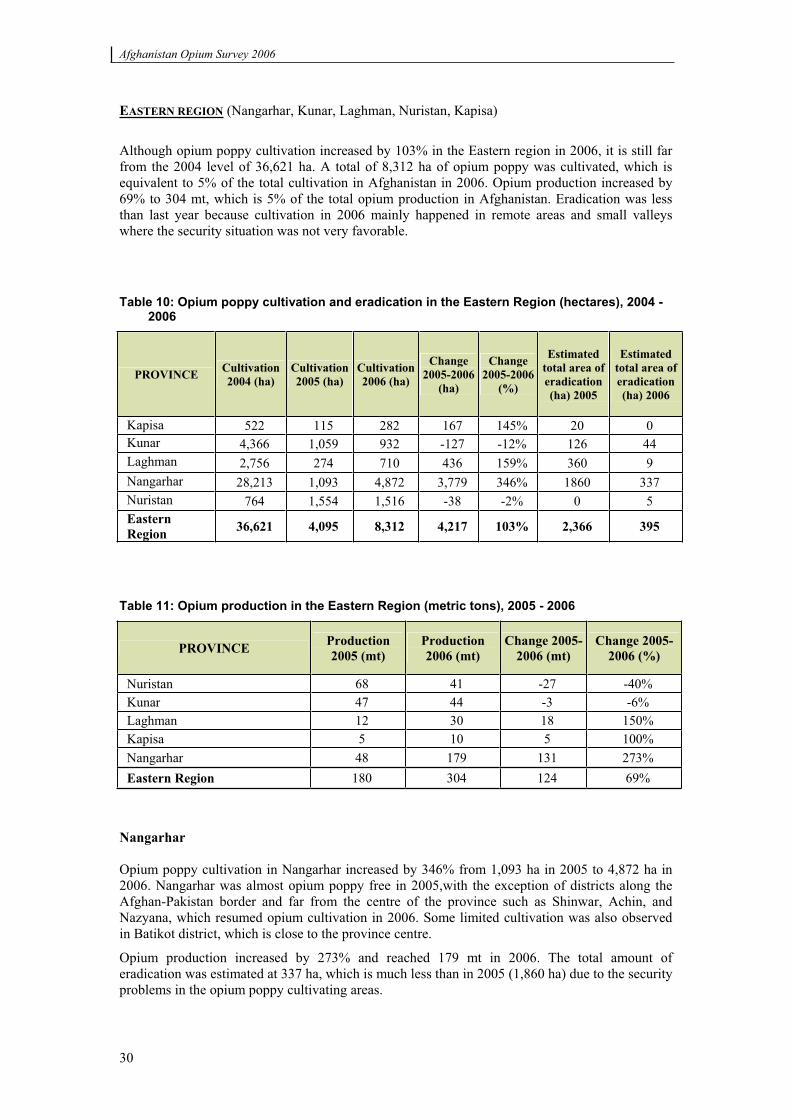
EASTERN REGION (Nangarhar, Kunar, Laghman, Nuristan, Kapisa)
Although opium poppy cultivation increased by 103% in the Eastern region in 2006, it is still far from the 2004 level of 36,621 ha. A total of 8,312 ha of opium poppy was cultivated, which is equivalent to 5% of the total cultivation in Afghanistan in 2006. Opium production increased by 69% to 304 mt, which is 5% of the total opium production in Afghanistan. Eradication was less than last year because cultivation in 2006 mainly happened in remote areas and small valleys where the security situation was not very favorable.
Table 10: Opium poppy cultivation and eradication in the Eastern Region (hectares), 2004 - 2006
PROVINCE Cultivation2004 (ha)
Cultivation2005 (ha)
Cultivation2006 (ha)
Change2005-2006
(ha)
Change2005-2006
(%)
Estimatedtotal area of eradication (ha) 2005
Estimatedtotal area of eradication (ha) 2006
Kapisa 522 115 282 167 145% 20 0 Kunar 4,366 1,059 932 -127 -12% 126 44 Laghman 2,756 274 710 436 159% 360 9 Nangarhar 28,213 1,093 4,872 3,779 346% 1860 337 Nuristan 764 1,554 1,516 -38 -2% 0 5 Eastern Region 36,621 4,095 8,312 4,217 103% 2,366 395
Table 11: Opium production in the Eastern Region (metric tons), 2005 - 2006
PROVINCE Production 2005 (mt)
Production 2006 (mt)
Change 2005-2006 (mt)
Change 2005-2006 (%)
Nuristan 68 41 -27 -40% Kunar 47 44 -3 -6% Laghman 12 30 18 150% Kapisa 5 10 5 100% Nangarhar 48 179 131 273% Eastern Region 180 304 124 69%
Nangarhar
Opium poppy cultivation in Nangarhar increased by 346% from 1,093 ha in 2005 to 4,872 ha in 2006. Nangarhar was almost opium poppy free in 2005,with the exception of districts along the Afghan-Pakistan border and far from the centre of the province such as Shinwar, Achin, and Nazyana, which resumed opium cultivation in 2006. Some limited cultivation was also observed in Batikot district, which is close to the province centre.
Opium production increased by 273% and reached 179 mt in 2006. The total amount of eradication was estimated at 337 ha, which is much less than in 2005 (1,860 ha) due to the security problems in the opium poppy cultivating areas.
Afghanistan Opium Survey 2006
31
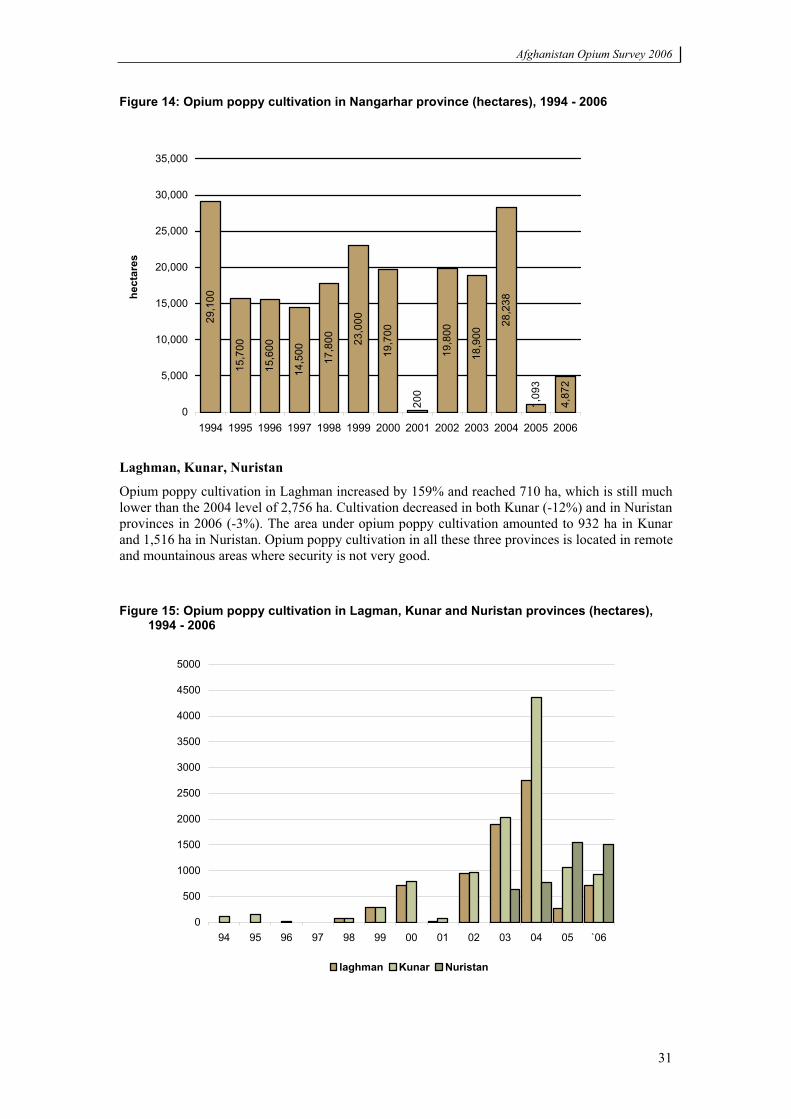
Figure 14: Opium poppy cultivation in Nangarhar province (hectares), 1994 - 2006
29,1
00
15,7
00
15,6
00
14,5
00
17,8
00 23,0
00
19,7
00
200
19,8
00
18,9
00
28,2
38
1,09
3
4,87
2
0
5,000
10,000
15,000
20,000
25,000
30,000
35,000
1994 1995 1996 1997 1998 1999 2000 2001 2002 2003 2004 2005 2006
hect
ares
Laghman, Kunar, Nuristan
Opium poppy cultivation in Laghman increased by 159% and reached 710 ha, which is still much lower than the 2004 level of 2,756 ha. Cultivation decreased in both Kunar (-12%) and in Nuristan provinces in 2006 (-3%). The area under opium poppy cultivation amounted to 932 ha in Kunar and 1,516 ha in Nuristan. Opium poppy cultivation in all these three provinces is located in remote and mountainous areas where security is not very good.
Figure 15: Opium poppy cultivation in Lagman, Kunar and Nuristan provinces (hectares), 1994 - 2006
0
500
1000
1500
2000
2500
3000
3500
4000
4500
5000
94 95 96 97 98 99 00 01 02 03 04 05 `06
laghman Kunar Nuristan
Afghanistan Opium Survey 2006
32
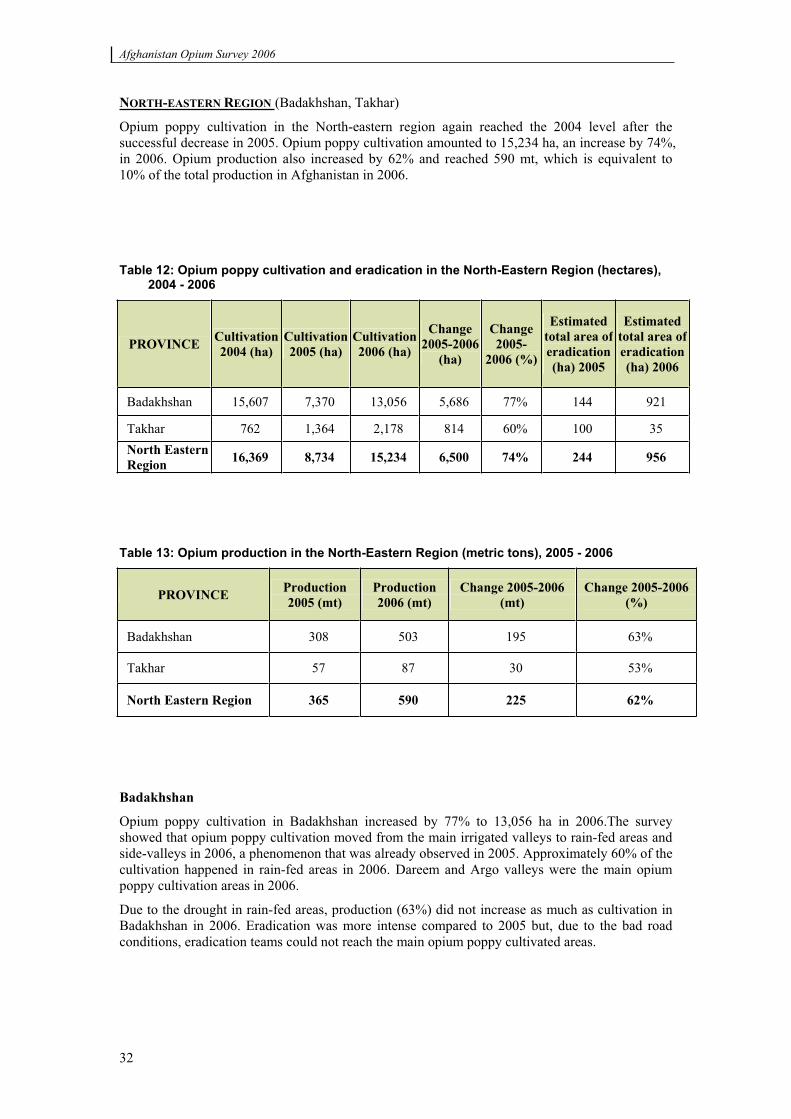
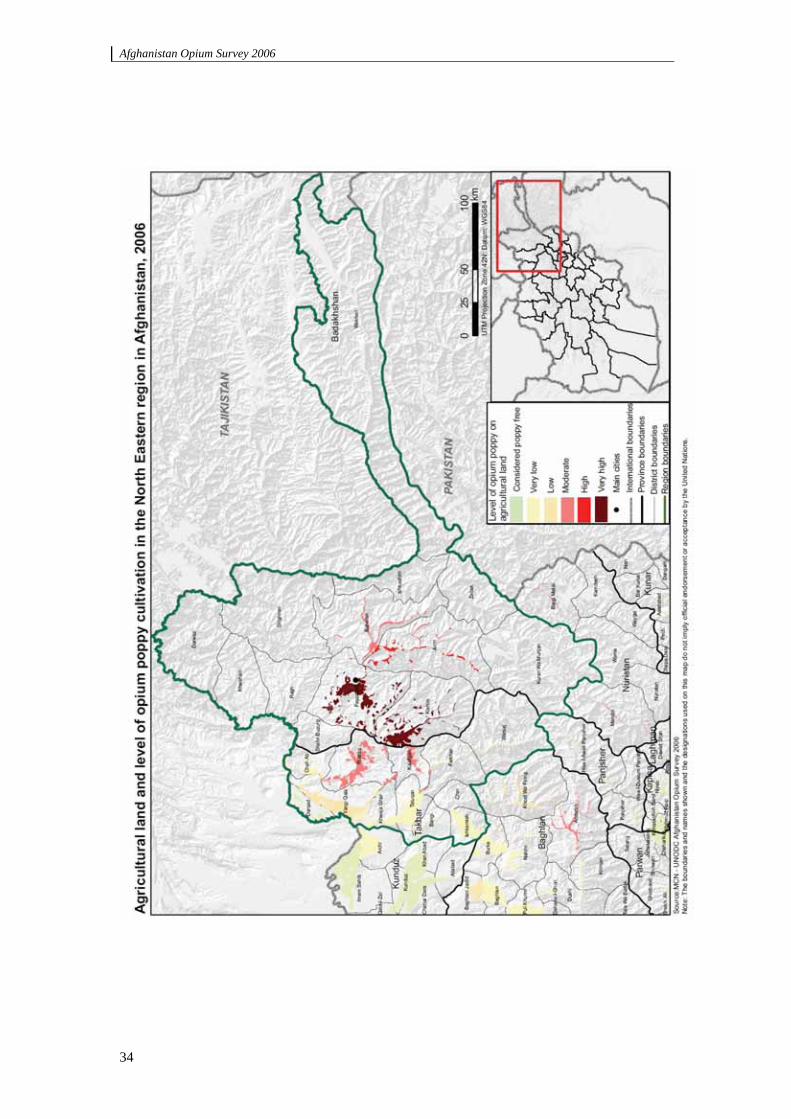
NORTH-EASTERN REGION (Badakhshan, Takhar)
Opium poppy cultivation in the North-eastern region again reached the 2004 level after the successful decrease in 2005. Opium poppy cultivation amounted to 15,234 ha, an increase by 74%, in 2006. Opium production also increased by 62% and reached 590 mt, which is equivalent to 10% of the total production in Afghanistan in 2006.
Table 12: Opium poppy cultivation and eradication in the North-Eastern Region (hectares), 2004 - 2006
PROVINCE Cultivation 2004 (ha)
Cultivation 2005 (ha)
Cultivation 2006 (ha)
Change 2005-2006
(ha)
Change 2005-
2006 (%)
Estimated total area of eradication(ha) 2005
Estimated total area of eradication(ha) 2006
Badakhshan 15,607 7,370 13,056 5,686 77% 144 921
Takhar 762 1,364 2,178 814 60% 100 35 North Eastern Region 16,369 8,734 15,234 6,500 74% 244 956
Table 13: Opium production in the North-Eastern Region (metric tons), 2005 - 2006
PROVINCE Production 2005 (mt)
Production 2006 (mt)
Change 2005-2006 (mt)
Change 2005-2006 (%)
Badakhshan 308 503 195 63%
Takhar 57 87 30 53%
North Eastern Region 365 590 225 62%
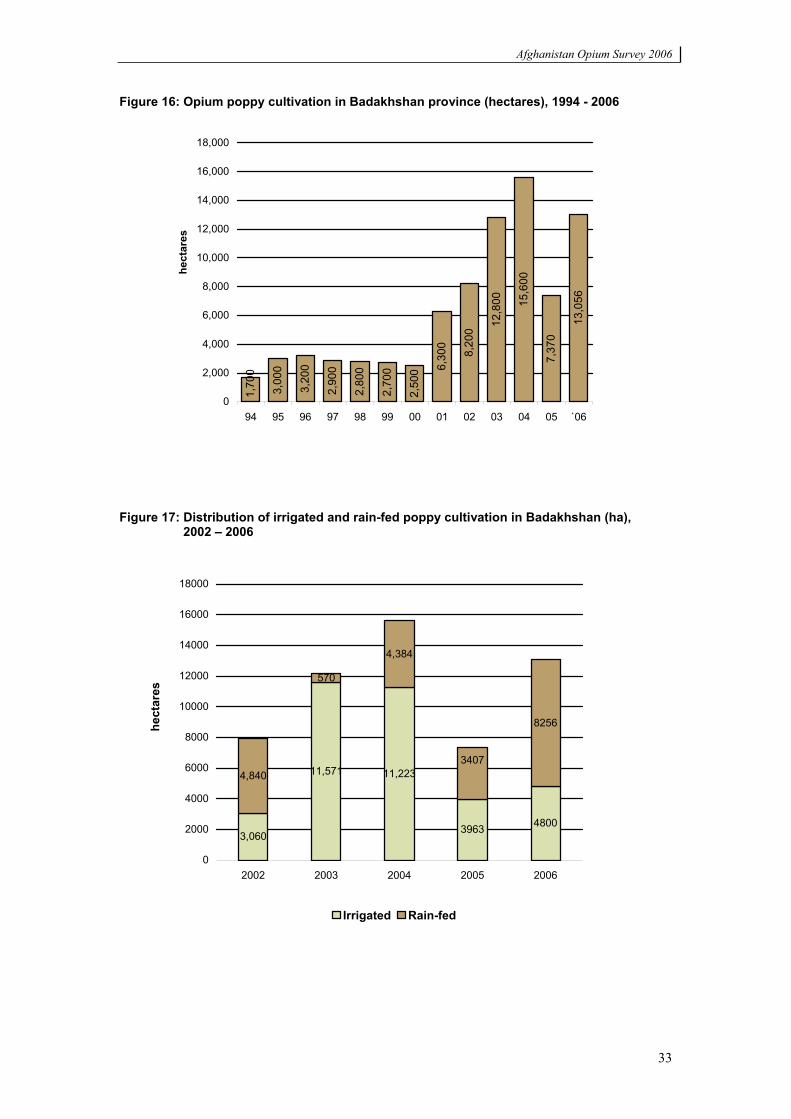
Badakhshan
Opium poppy cultivation in Badakhshan increased by 77% to 13,056 ha in 2006.The survey showed that opium poppy cultivation moved from the main irrigated valleys to rain-fed areas and side-valleys in 2006, a phenomenon that was already observed in 2005. Approximately 60% of the cultivation happened in rain-fed areas in 2006. Dareem and Argo valleys were the main opium poppy cultivation areas in 2006.
Due to the drought in rain-fed areas, production (63%) did not increase as much as cultivation in Badakhshan in 2006. Eradication was more intense compared to 2005 but, due to the bad road conditions, eradication teams could not reach the main opium poppy cultivated areas.
Afghanistan Opium Survey 2006
33
Figure 16: Opium poppy cultivation in Badakhshan province (hectares), 1994 - 2006
1,70
0
3,00
0
3,20
0
2,90
0
2,80
0
2,70
0
2,50
0 6,30
0
8,20
0
12,8
00 15,6
00
7,37
0
13,0
56
0
2,000
4,000
6,000
8,000
10,000
12,000
14,000
16,000
18,000
94 95 96 97 98 99 00 01 02 03 04 05 `06
hect
ares
Figure 17: Distribution of irrigated and rain-fed poppy cultivation in Badakhshan (ha), 2002 – 2006
48003963
11,22311,571
3,060
8256
4,384
570
4,8403407
0
2000
4000
6000
8000
10000
12000
14000
16000
18000
20062005200420032002
hect
ares
Irrigated Rain-fed
Afghanistan Opium Survey 2006
34
Afghanistan Opium Survey 2006
35
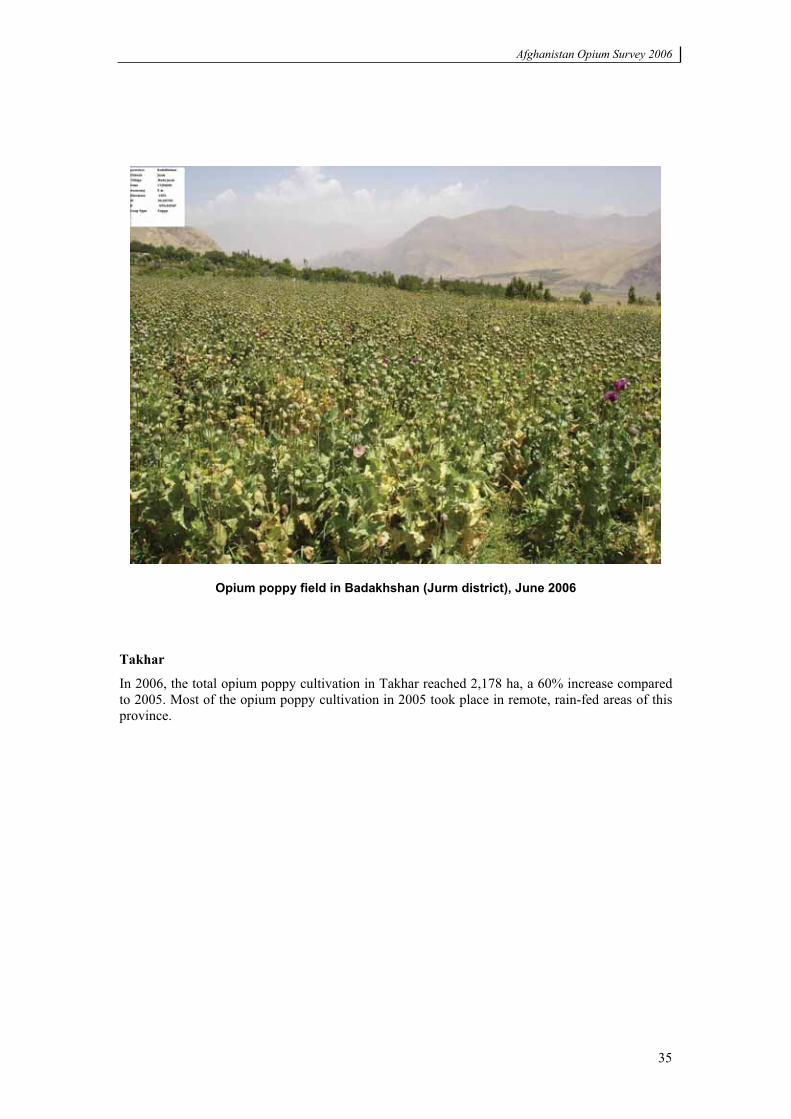
Opium poppy field in Badakhshan (Jurm district), June 2006
Takhar
In 2006, the total opium poppy cultivation in Takhar reached 2,178 ha, a 60% increase compared to 2005. Most of the opium poppy cultivation in 2005 took place in remote, rain-fed areas of this province.
Afghanistan Opium Survey 2006
36
Afghanistan Opium Survey 2006
37
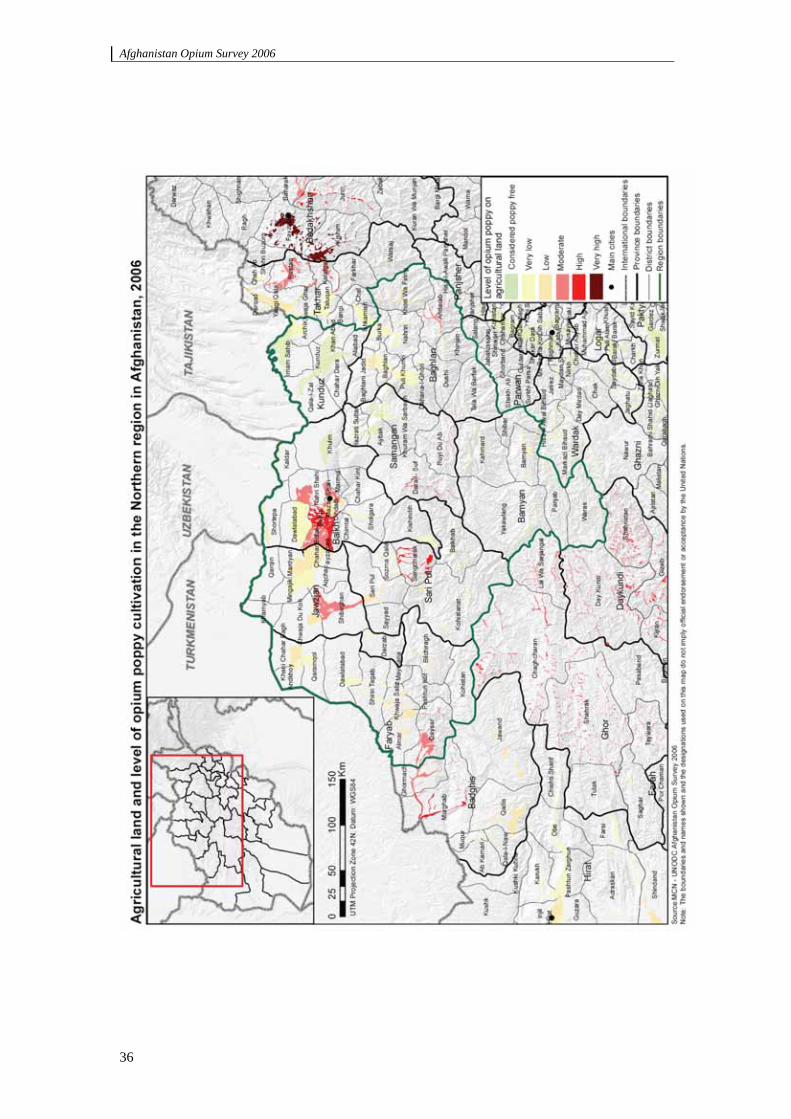
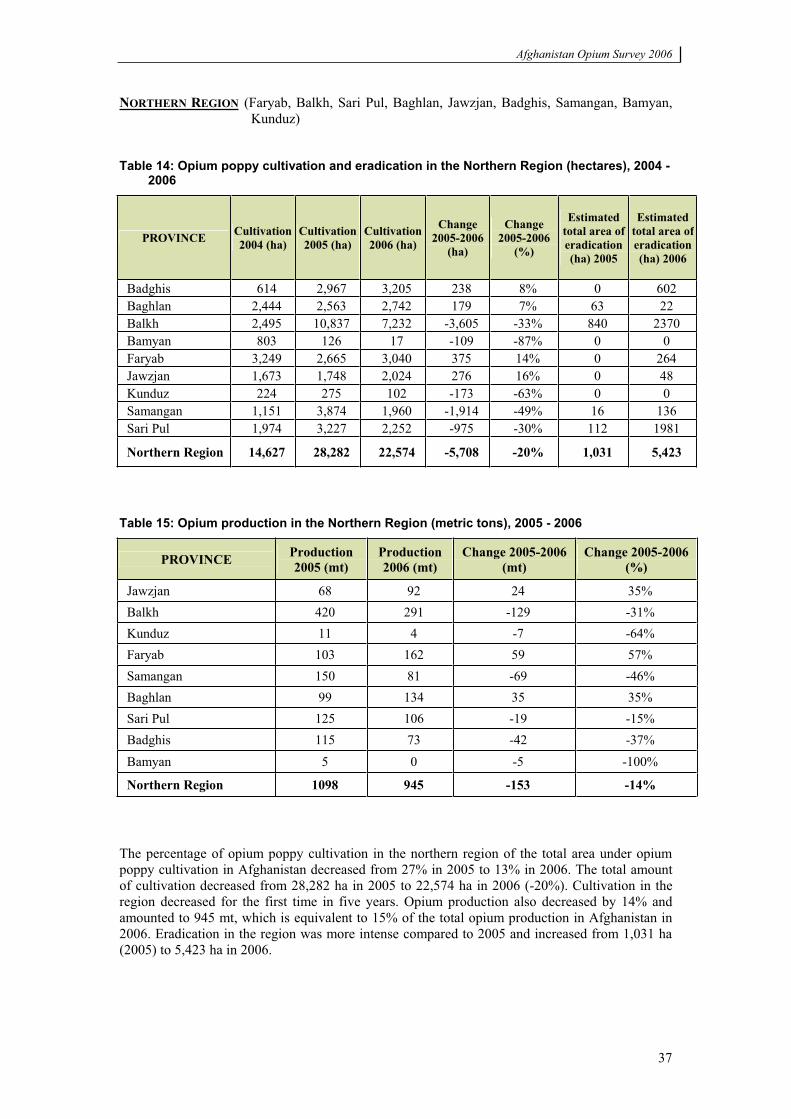
NORTHERN REGION (Faryab, Balkh, Sari Pul, Baghlan, Jawzjan, Badghis, Samangan, Bamyan, Kunduz)
Table 14: Opium poppy cultivation and eradication in the Northern Region (hectares), 2004 - 2006
PROVINCE Cultivation2004 (ha)
Cultivation2005 (ha)
Cultivation2006 (ha)
Change2005-2006
(ha)
Change2005-2006
(%)
Estimatedtotal area of eradication (ha) 2005
Estimatedtotal area of eradication (ha) 2006
Badghis 614 2,967 3,205 238 8% 0 602 Baghlan 2,444 2,563 2,742 179 7% 63 22 Balkh 2,495 10,837 7,232 -3,605 -33% 840 2370 Bamyan 803 126 17 -109 -87% 0 0 Faryab 3,249 2,665 3,040 375 14% 0 264 Jawzjan 1,673 1,748 2,024 276 16% 0 48 Kunduz 224 275 102 -173 -63% 0 0 Samangan 1,151 3,874 1,960 -1,914 -49% 16 136 Sari Pul 1,974 3,227 2,252 -975 -30% 112 1981
Northern Region 14,627 28,282 22,574 -5,708 -20% 1,031 5,423
Table 15: Opium production in the Northern Region (metric tons), 2005 - 2006
PROVINCE Production 2005 (mt)
Production 2006 (mt)
Change 2005-2006 (mt)
Change 2005-2006 (%)
Jawzjan 68 92 24 35% Balkh 420 291 -129 -31% Kunduz 11 4 -7 -64% Faryab 103 162 59 57% Samangan 150 81 -69 -46% Baghlan 99 134 35 35% Sari Pul 125 106 -19 -15% Badghis 115 73 -42 -37% Bamyan 5 0 -5 -100%
Northern Region 1098 945 -153 -14%
The percentage of opium poppy cultivation in the northern region of the total area under opium poppy cultivation in Afghanistan decreased from 27% in 2005 to 13% in 2006. The total amount of cultivation decreased from 28,282 ha in 2005 to 22,574 ha in 2006 (-20%). Cultivation in the region decreased for the first time in five years. Opium production also decreased by 14% and amounted to 945 mt, which is equivalent to 15% of the total opium production in Afghanistan in 2006. Eradication in the region was more intense compared to 2005 and increased from 1,031 ha (2005) to 5,423 ha in 2006.
Afghanistan Opium Survey 2006
38
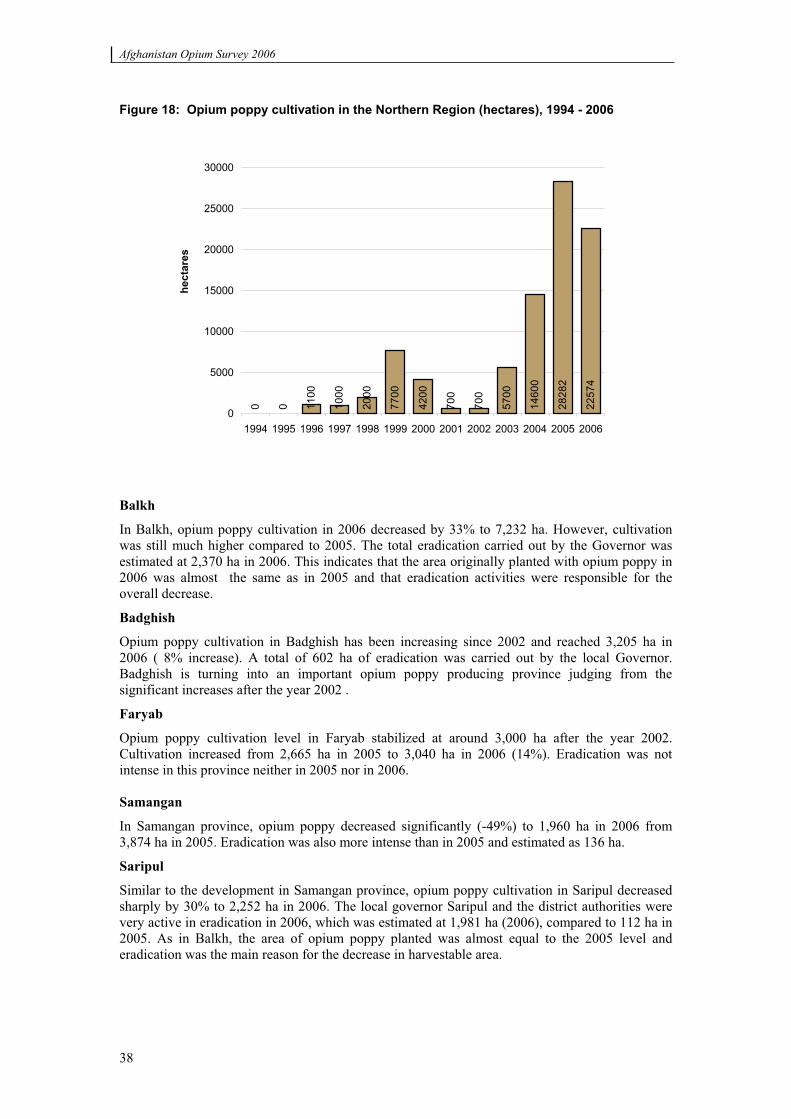
Figure 18: Opium poppy cultivation in the Northern Region (hectares), 1994 - 2006
0 0 1100
1000
2000
7700
4200
700
700
5700
1460
0
2828
2
2257
4
0
5000
10000
15000
20000
25000
30000
1994 1995 1996 1997 1998 1999 2000 2001 2002 2003 2004 2005 2006
hect
ares
Balkh
In Balkh, opium poppy cultivation in 2006 decreased by 33% to 7,232 ha. However, cultivation was still much higher compared to 2005. The total eradication carried out by the Governor was estimated at 2,370 ha in 2006. This indicates that the area originally planted with opium poppy in 2006 was almost the same as in 2005 and that eradication activities were responsible for the overall decrease.
Badghish
Opium poppy cultivation in Badghish has been increasing since 2002 and reached 3,205 ha in 2006 ( 8% increase). A total of 602 ha of eradication was carried out by the local Governor. Badghish is turning into an important opium poppy producing province judging from the significant increases after the year 2002 .
Faryab
Opium poppy cultivation level in Faryab stabilized at around 3,000 ha after the year 2002. Cultivation increased from 2,665 ha in 2005 to 3,040 ha in 2006 (14%). Eradication was not intense in this province neither in 2005 nor in 2006.
Samangan
In Samangan province, opium poppy decreased significantly (-49%) to 1,960 ha in 2006 from 3,874 ha in 2005. Eradication was also more intense than in 2005 and estimated as 136 ha.
Saripul
Similar to the development in Samangan province, opium poppy cultivation in Saripul decreased sharply by 30% to 2,252 ha in 2006. The local governor Saripul and the district authorities were very active in eradication in 2006, which was estimated at 1,981 ha (2006), compared to 112 ha in 2005. As in Balkh, the area of opium poppy planted was almost equal to the 2005 level and eradication was the main reason for the decrease in harvestable area.
Afghanistan Opium Survey 2006
39
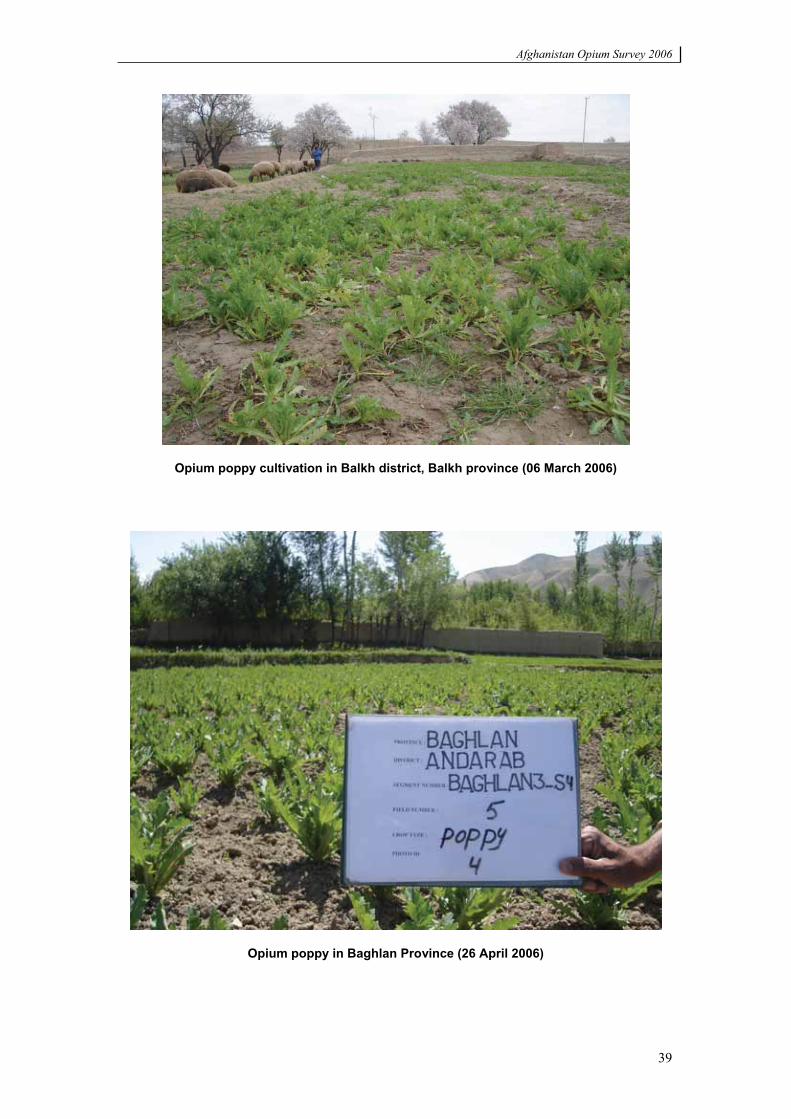
Opium poppy cultivation in Balkh district, Balkh province (06 March 2006)
Opium poppy in Baghlan Province (26 April 2006)
Afghanistan Opium Survey 2006
40
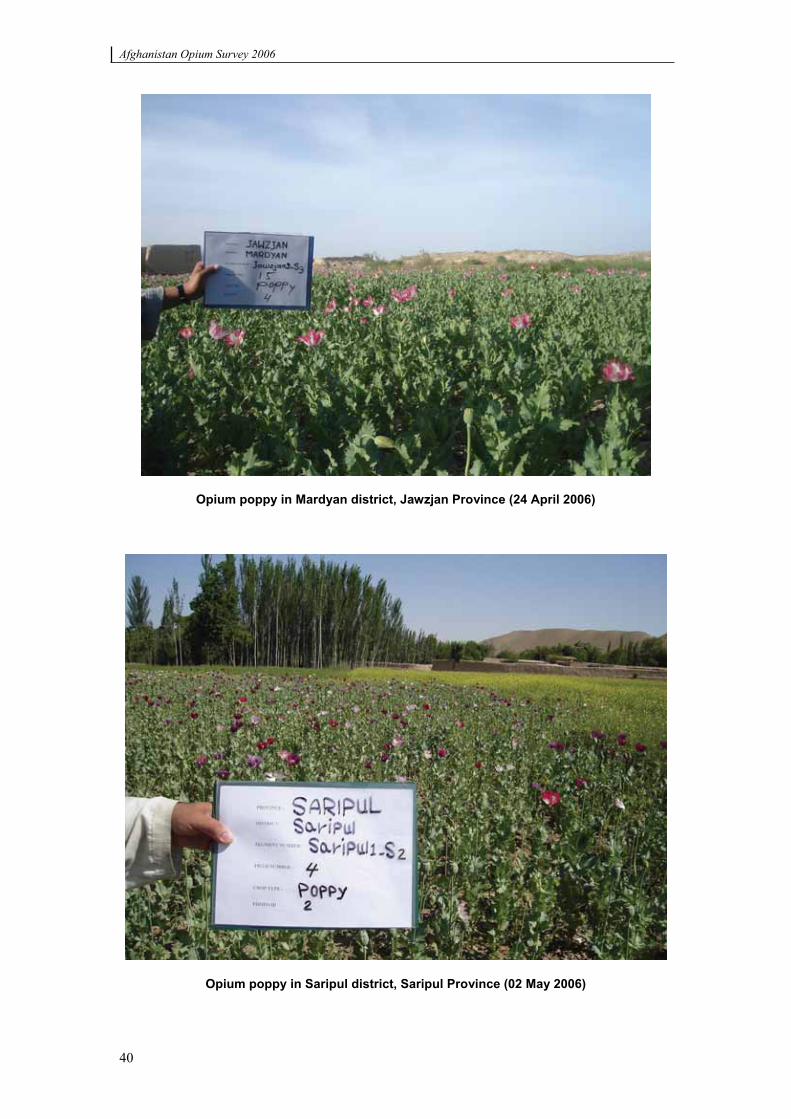
Opium poppy in Mardyan district, Jawzjan Province (24 April 2006)
Opium poppy in Saripul district, Saripul Province (02 May 2006)
Afghanistan Opium Survey 2006
41
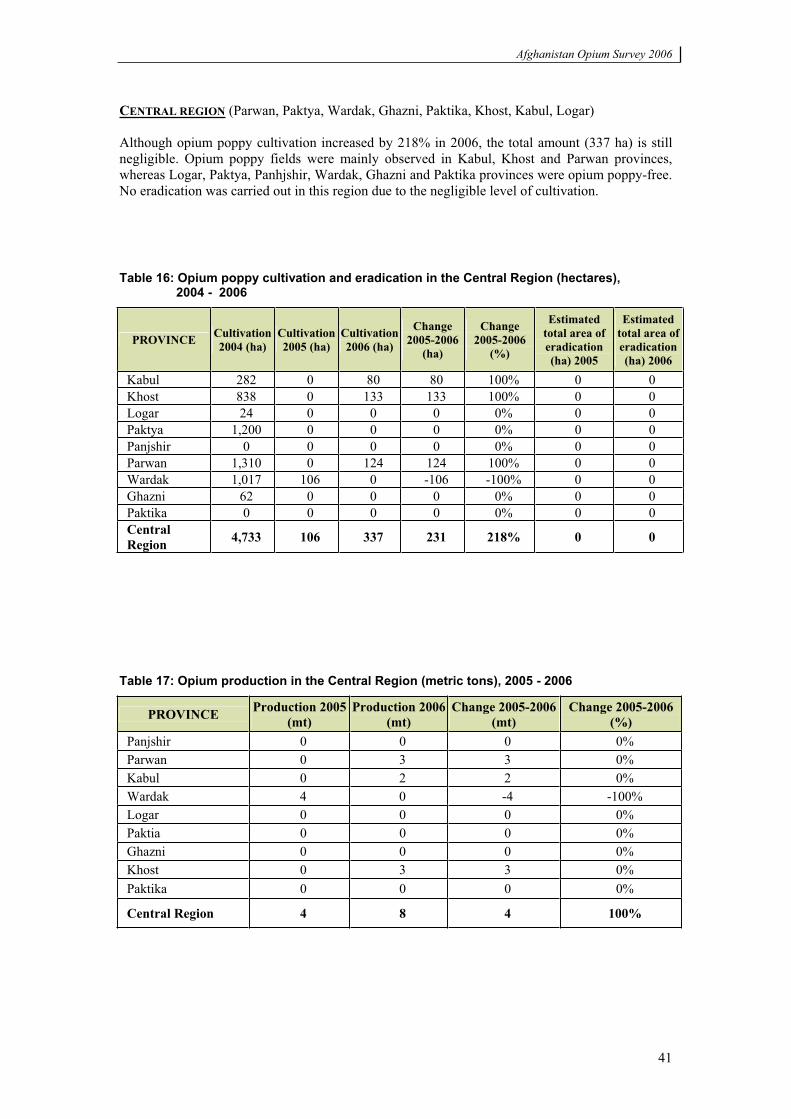
CENTRAL REGION (Parwan, Paktya, Wardak, Ghazni, Paktika, Khost, Kabul, Logar)
Although opium poppy cultivation increased by 218% in 2006, the total amount (337 ha) is still negligible. Opium poppy fields were mainly observed in Kabul, Khost and Parwan provinces, whereas Logar, Paktya, Panhjshir, Wardak, Ghazni and Paktika provinces were opium poppy-free. No eradication was carried out in this region due to the negligible level of cultivation.
Table 16: Opium poppy cultivation and eradication in the Central Region (hectares), 2004 - 2006
PROVINCE Cultivation2004 (ha)
Cultivation2005 (ha)
Cultivation2006 (ha)
Change2005-2006
(ha)
Change2005-2006
(%)
Estimatedtotal area of eradication (ha) 2005
Estimatedtotal area of eradication (ha) 2006
Kabul 282 0 80 80 100% 0 0 Khost 838 0 133 133 100% 0 0 Logar 24 0 0 0 0% 0 0 Paktya 1,200 0 0 0 0% 0 0 Panjshir 0 0 0 0 0% 0 0 Parwan 1,310 0 124 124 100% 0 0 Wardak 1,017 106 0 -106 -100% 0 0 Ghazni 62 0 0 0 0% 0 0 Paktika 0 0 0 0 0% 0 0 Central Region 4,733 106 337 231 218% 0 0
Table 17: Opium production in the Central Region (metric tons), 2005 - 2006
PROVINCE Production 2005 (mt)
Production 2006 (mt)
Change 2005-2006 (mt)
Change 2005-2006 (%)
Panjshir 0 0 0 0% Parwan 0 3 3 0% Kabul 0 2 2 0% Wardak 4 0 -4 -100% Logar 0 0 0 0% Paktia 0 0 0 0% Ghazni 0 0 0 0% Khost 0 3 3 0% Paktika 0 0 0 0%
Central Region 4 8 4 100%
Afghanistan Opium Survey 2006
42
Afghanistan Opium Survey 2006
43
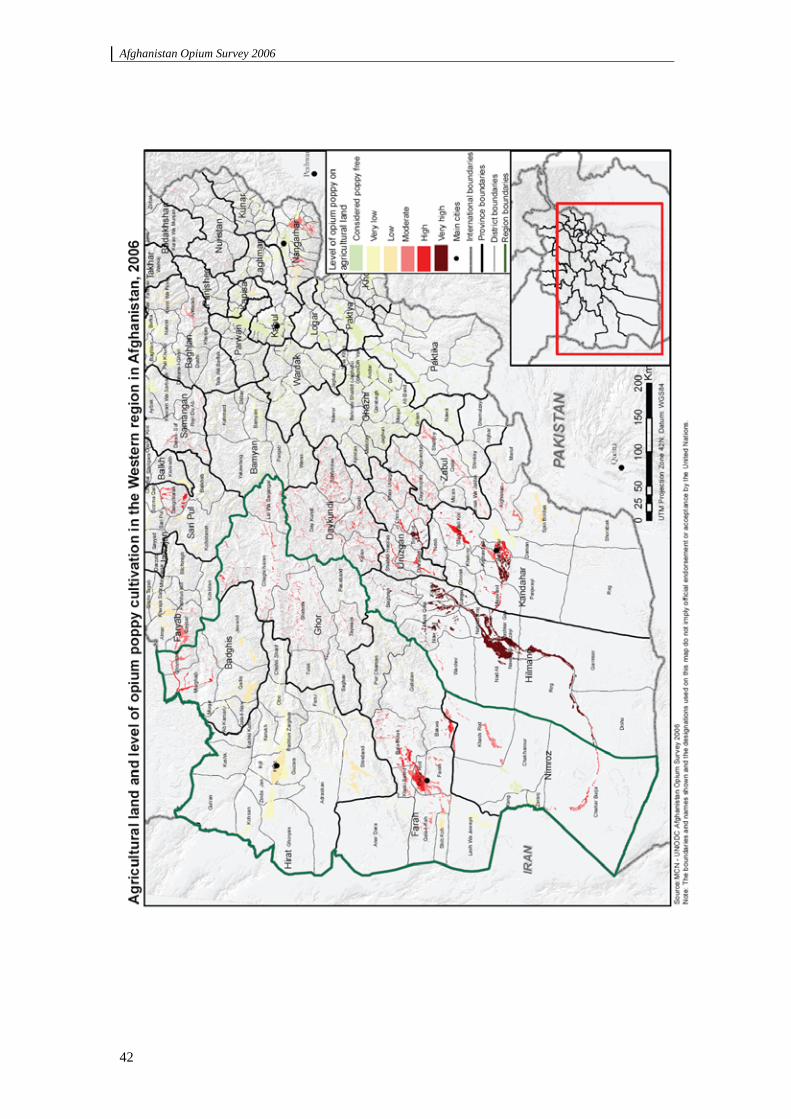
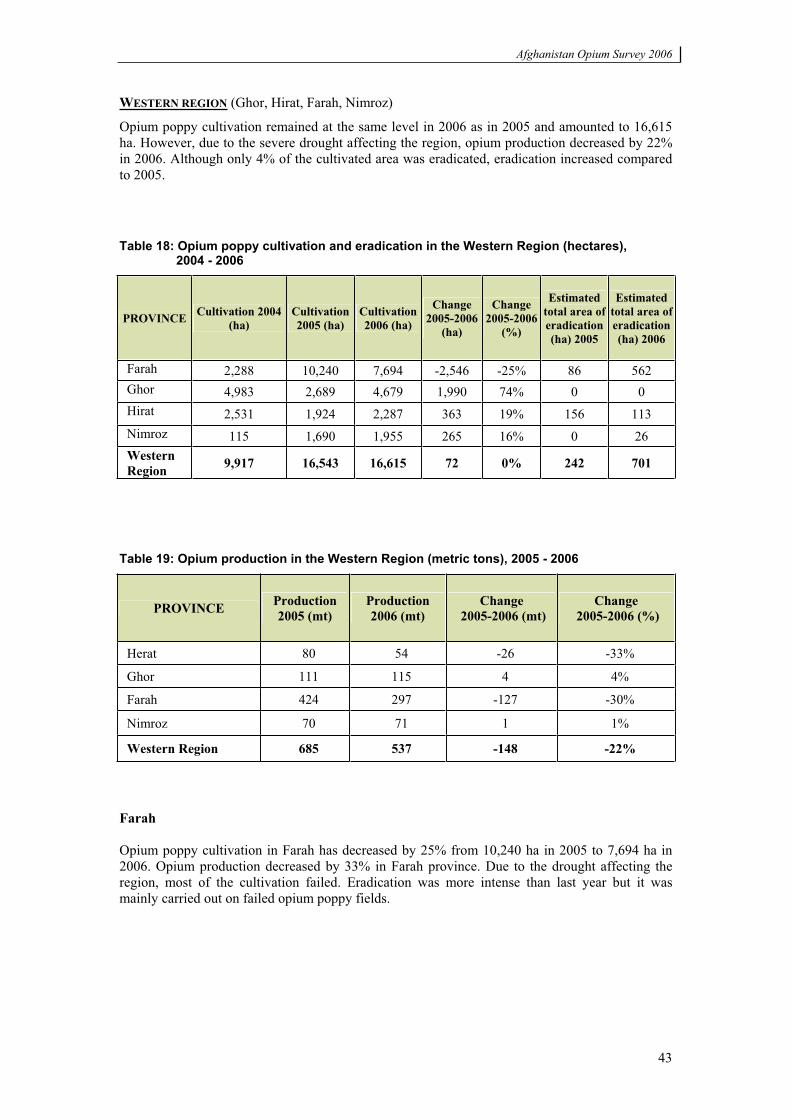
WESTERN REGION (Ghor, Hirat, Farah, Nimroz)
Opium poppy cultivation remained at the same level in 2006 as in 2005 and amounted to 16,615 ha. However, due to the severe drought affecting the region, opium production decreased by 22% in 2006. Although only 4% of the cultivated area was eradicated, eradication increased compared to 2005.
Table 18: Opium poppy cultivation and eradication in the Western Region (hectares), 2004 - 2006
PROVINCE Cultivation 2004 (ha)
Cultivation2005 (ha)
Cultivation2006 (ha)
Change2005-2006
(ha)
Change2005-2006
(%)
Estimatedtotal area of eradication (ha) 2005
Estimatedtotal area of eradication (ha) 2006
Farah 2,288 10,240 7,694 -2,546 -25% 86 562 Ghor 4,983 2,689 4,679 1,990 74% 0 0 Hirat 2,531 1,924 2,287 363 19% 156 113 Nimroz 115 1,690 1,955 265 16% 0 26 WesternRegion 9,917 16,543 16,615 72 0% 242 701
Table 19: Opium production in the Western Region (metric tons), 2005 - 2006
PROVINCE Production 2005 (mt)
Production 2006 (mt)
Change 2005-2006 (mt)
Change 2005-2006 (%)
Herat 80 54 -26 -33%
Ghor 111 115 4 4%
Farah 424 297 -127 -30%
Nimroz 70 71 1 1%
Western Region 685 537 -148 -22%
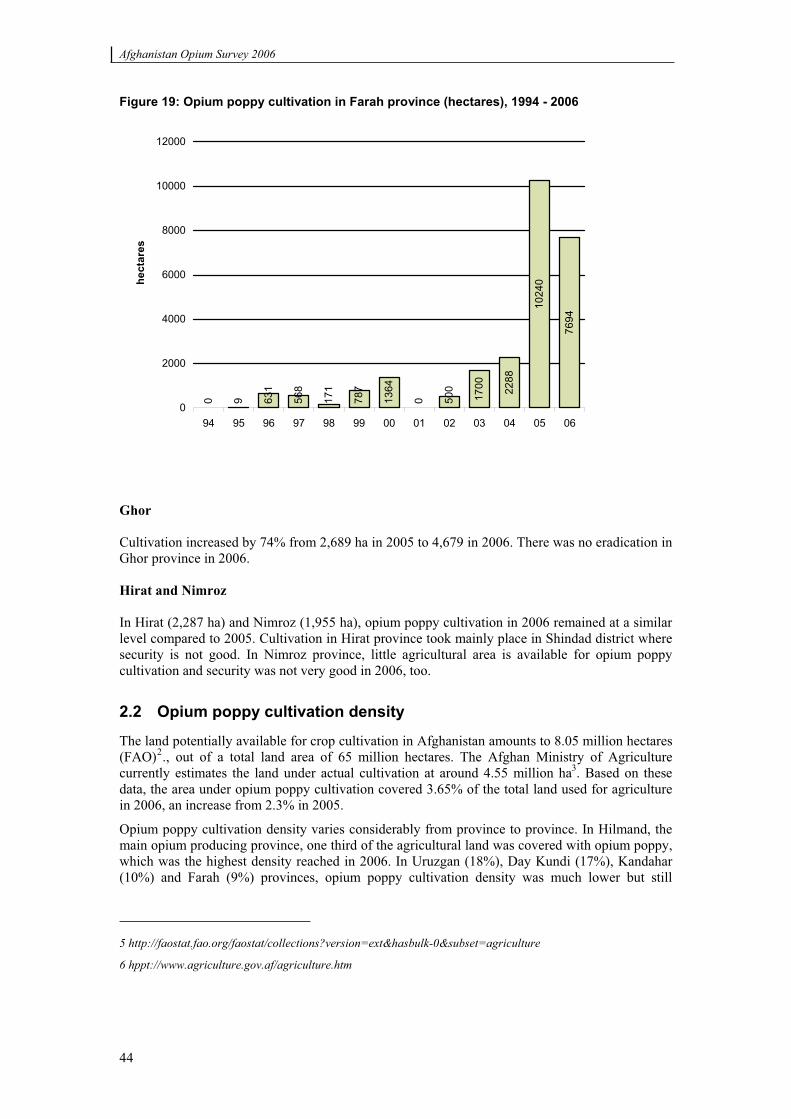
Farah
Opium poppy cultivation in Farah has decreased by 25% from 10,240 ha in 2005 to 7,694 ha in 2006. Opium production decreased by 33% in Farah province. Due to the drought affecting the region, most of the cultivation failed. Eradication was more intense than last year but it was mainly carried out on failed opium poppy fields.
Afghanistan Opium Survey 2006
44
Figure 19: Opium poppy cultivation in Farah province (hectares), 1994 - 2006
0 9 631
568
171
787
1364
0 500
1700 22
88
1024
0
7694
0
2000
4000
6000
8000
10000
12000
94 95 96 97 98 99 00 01 02 03 04 05 06
hect
ares
Ghor
Cultivation increased by 74% from 2,689 ha in 2005 to 4,679 in 2006. There was no eradication in Ghor province in 2006.
Hirat and Nimroz
In Hirat (2,287 ha) and Nimroz (1,955 ha), opium poppy cultivation in 2006 remained at a similar level compared to 2005. Cultivation in Hirat province took mainly place in Shindad district where security is not good. In Nimroz province, little agricultural area is available for opium poppy cultivation and security was not very good in 2006, too.
2.2 Opium poppy cultivation density
The land potentially available for crop cultivation in Afghanistan amounts to 8.05 million hectares (FAO)2., out of a total land area of 65 million hectares. The Afghan Ministry of Agriculture currently estimates the land under actual cultivation at around 4.55 million ha3. Based on these data, the area under opium poppy cultivation covered 3.65% of the total land used for agriculture in 2006, an increase from 2.3% in 2005.
Opium poppy cultivation density varies considerably from province to province. In Hilmand, the main opium producing province, one third of the agricultural land was covered with opium poppy, which was the highest density reached in 2006. In Uruzgan (18%), Day Kundi (17%), Kandahar (10%) and Farah (9%) provinces, opium poppy cultivation density was much lower but still
5 http://faostat.fao.org/faostat/collections?version=ext&hasbulk-0&subset=agriculture
6 hppt://www.agriculture.gov.af/agriculture.htm
Afghanistan Opium Survey 2006
45
relatively high, while in Nangarhar and Faryab, just 5% and 2% respectively of the agricultural land was covered by opium poppy.
2.3 Cannabis cultivation
UNODC surveyors collected information on cannabis cultivation through direct observation and through interviews with district/village elders during the annual opium survey. This information must thus be treated with caution as the survey was not designed to verify the extent of cannabis cultivation. In order to get more detailed information on the level cannabis cultivation in Afghanistan, a survey would need to be done during the cannabis cultivation period (June-September).
Around 50,000 ha of cannabis cultivation was estimated in Afghanistan in 2006 compared to 30,000 ha in 2005. The information obtained from the field showed that, in 2006, cannabis cultivation increased sharply especially in the southern provinces and some parts of Nangarhar and Paktya.
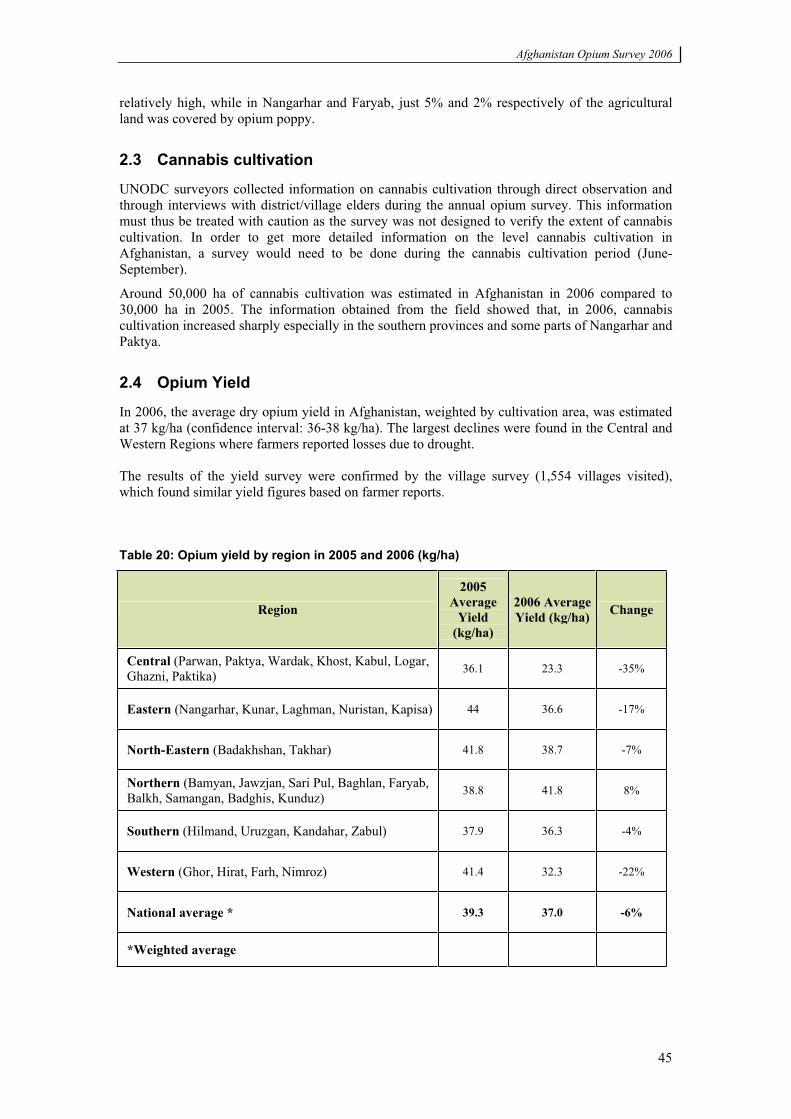
2.4 Opium Yield
In 2006, the average dry opium yield in Afghanistan, weighted by cultivation area, was estimated at 37 kg/ha (confidence interval: 36-38 kg/ha). The largest declines were found in the Central and Western Regions where farmers reported losses due to drought.
The results of the yield survey were confirmed by the village survey (1,554 villages visited), which found similar yield figures based on farmer reports.
Table 20: Opium yield by region in 2005 and 2006 (kg/ha)
Region
2005 Average
Yield(kg/ha)
2006 Average Yield (kg/ha) Change
Central (Parwan, Paktya, Wardak, Khost, Kabul, Logar, Ghazni, Paktika) 36.1 23.3 -35%
Eastern (Nangarhar, Kunar, Laghman, Nuristan, Kapisa) 44 36.6 -17%
North-Eastern (Badakhshan, Takhar) 41.8 38.7 -7%
Northern (Bamyan, Jawzjan, Sari Pul, Baghlan, Faryab, Balkh, Samangan, Badghis, Kunduz) 38.8 41.8 8%
Southern (Hilmand, Uruzgan, Kandahar, Zabul) 37.9 36.3 -4%
Western (Ghor, Hirat, Farh, Nimroz) 41.4 32.3 -22%
National average * 39.3 37.0 -6%
*Weighted average
Afghanistan Opium Survey 2006
46
The sample for the yield survey tripled in 2006. A total of 25,325 opium poppy capsules were measured in 320 villages visited. In 2006, surveyors selected 3 opium poppy fields in each visited sample villages, one field of poor quality, one of medium and one of good quality, instead of only one field per village as in previous surveys. This measure helped to avoid any possible tendency of the surveyors to always select fields of a certain quality, and improved the sample distribution. It should be noted that "field quality" here refers to a relative quality of a field compared to other fields in a village, not to any absolute, quantifiable quality.
Afghanistan Opium Survey 2006
47
Afghanistan Opium Survey 2006
48
Afghanistan Opium Survey 2006
49
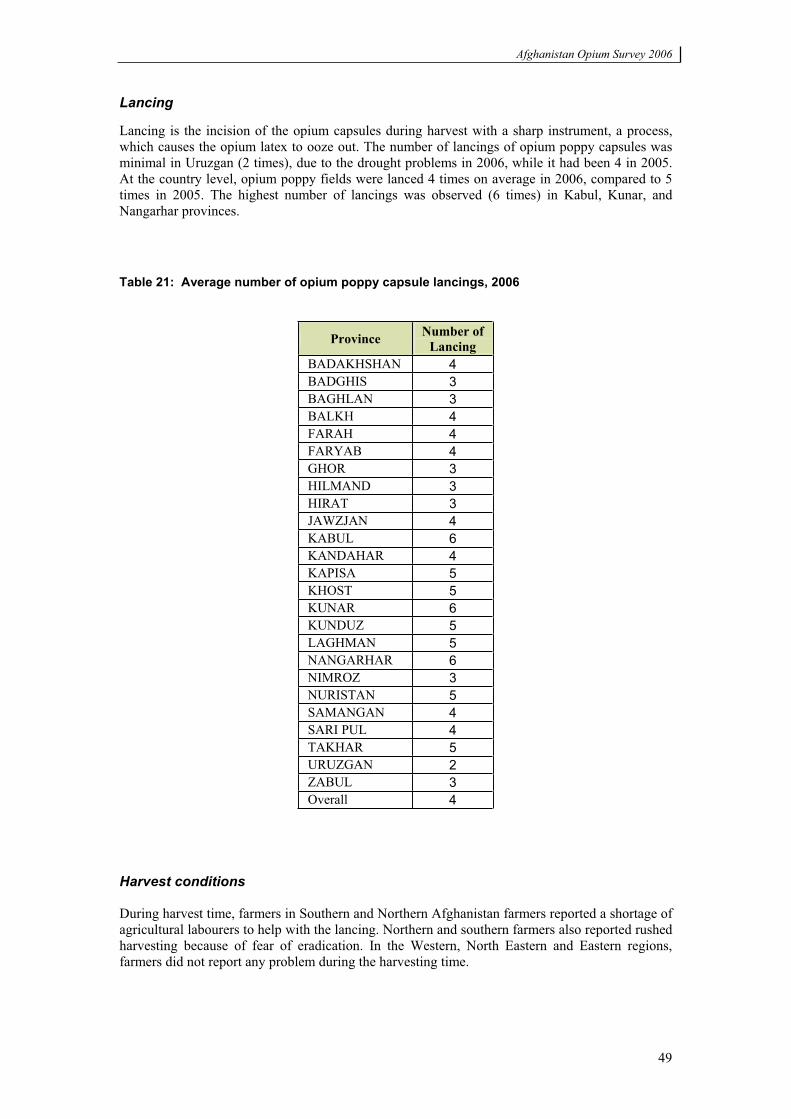
Lancing
Lancing is the incision of the opium capsules during harvest with a sharp instrument, a process, which causes the opium latex to ooze out. The number of lancings of opium poppy capsules was minimal in Uruzgan (2 times), due to the drought problems in 2006, while it had been 4 in 2005. At the country level, opium poppy fields were lanced 4 times on average in 2006, compared to 5 times in 2005. The highest number of lancings was observed (6 times) in Kabul, Kunar, and Nangarhar provinces.
Table 21: Average number of opium poppy capsule lancings, 2006
Province Number of Lancing
BADAKHSHAN 4BADGHIS 3BAGHLAN 3BALKH 4FARAH 4FARYAB 4GHOR 3HILMAND 3HIRAT 3JAWZJAN 4KABUL 6KANDAHAR 4KAPISA 5KHOST 5KUNAR 6KUNDUZ 5LAGHMAN 5NANGARHAR 6NIMROZ 3NURISTAN 5SAMANGAN 4SARI PUL 4TAKHAR 5URUZGAN 2ZABUL 3Overall 4
Harvest conditions
During harvest time, farmers in Southern and Northern Afghanistan farmers reported a shortage of agricultural labourers to help with the lancing. Northern and southern farmers also reported rushed harvesting because of fear of eradication. In the Western, North Eastern and Eastern regions, farmers did not report any problem during the harvesting time.
Afghanistan Opium Survey 2006
50
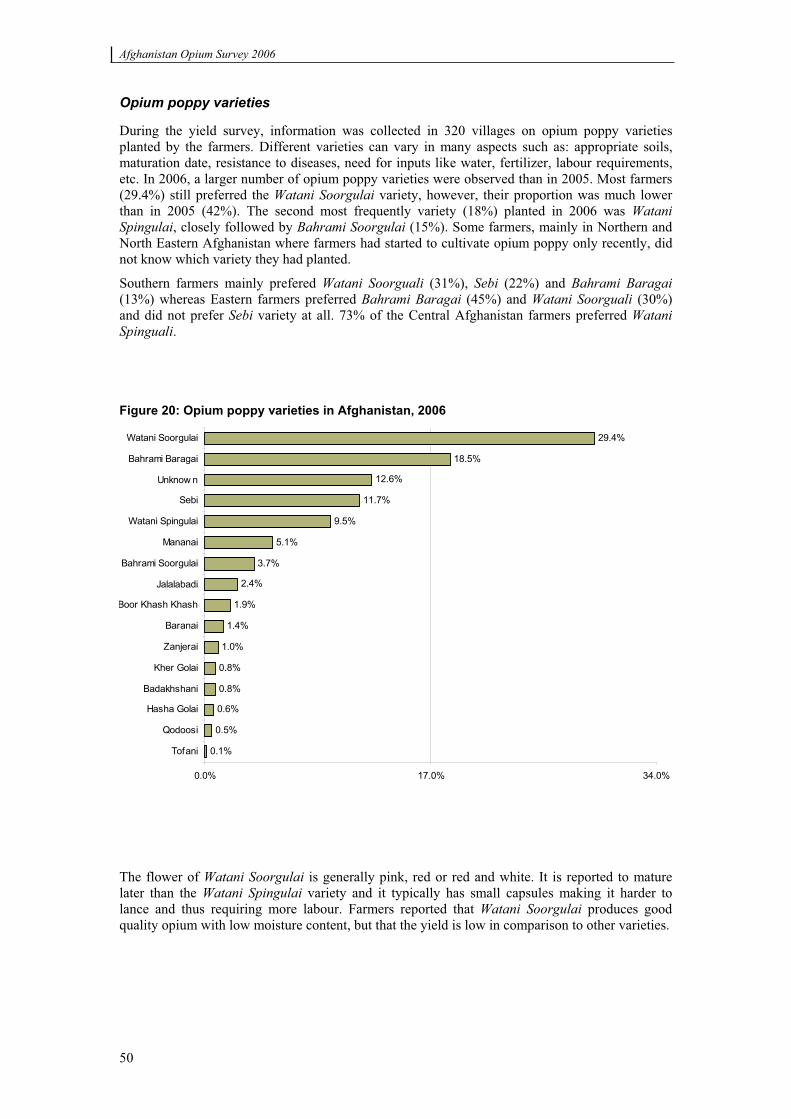
Opium poppy varieties
During the yield survey, information was collected in 320 villages on opium poppy varieties planted by the farmers. Different varieties can vary in many aspects such as: appropriate soils, maturation date, resistance to diseases, need for inputs like water, fertilizer, labour requirements, etc. In 2006, a larger number of opium poppy varieties were observed than in 2005. Most farmers (29.4%) still preferred the Watani Soorgulai variety, however, their proportion was much lower than in 2005 (42%). The second most frequently variety (18%) planted in 2006 was Watani Spingulai, closely followed by Bahrami Soorgulai (15%). Some farmers, mainly in Northern and North Eastern Afghanistan where farmers had started to cultivate opium poppy only recently, did not know which variety they had planted.
Southern farmers mainly prefered Watani Soorguali (31%), Sebi (22%) and Bahrami Baragai(13%) whereas Eastern farmers preferred Bahrami Baragai (45%) and Watani Soorguali (30%) and did not prefer Sebi variety at all. 73% of the Central Afghanistan farmers preferred Watani Spinguali.
Figure 20: Opium poppy varieties in Afghanistan, 2006
0.1%
0.5%
0.6%
0.8%
0.8%
1.0%
1.4%
1.9%
2.4%
3.7%
5.1%
9.5%
11.7%
12.6%
18.5%
29.4%
0.0% 17.0% 34.0%
Tofani
Qodoosi
Hasha Golai
Badakhshani
Kher Golai
Zanjerai
Baranai
Boor Khash Khash
Jalalabadi
Bahrami Soorgulai
Mananai
Watani Spingulai
Sebi
Unknow n
Bahrami Baragai
Watani Soorgulai
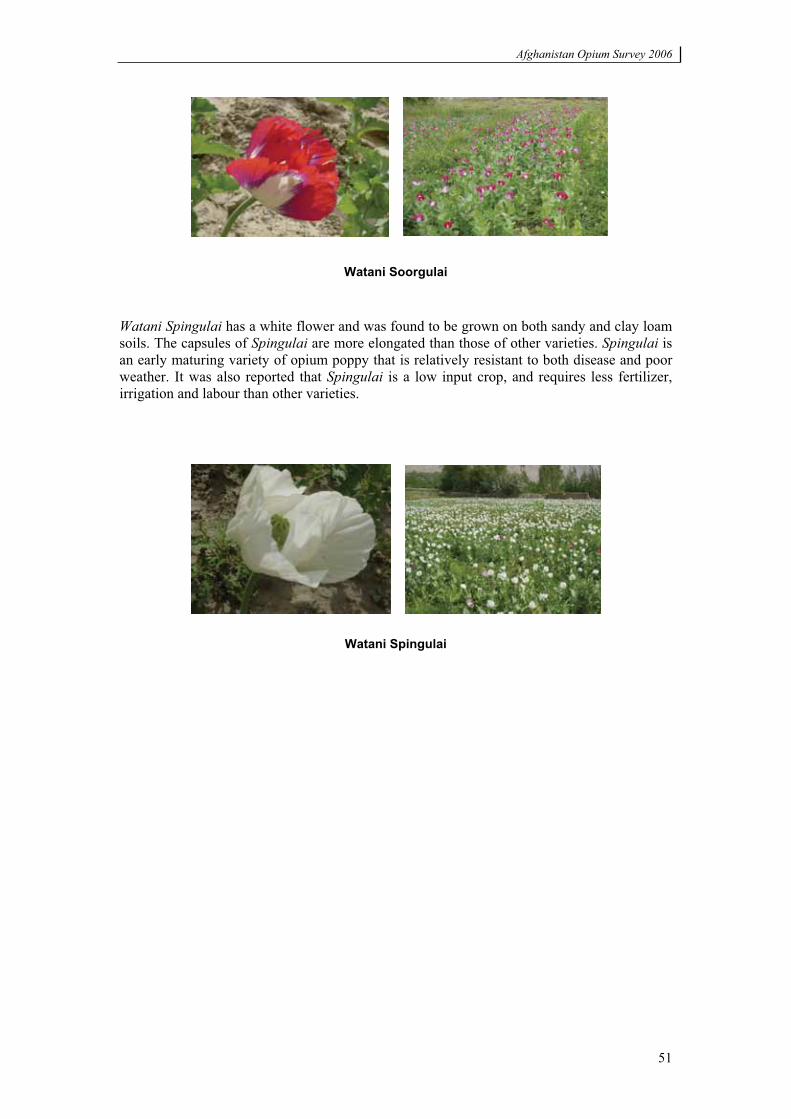
The flower of Watani Soorgulai is generally pink, red or red and white. It is reported to mature later than the Watani Spingulai variety and it typically has small capsules making it harder to lance and thus requiring more labour. Farmers reported that Watani Soorgulai produces good quality opium with low moisture content, but that the yield is low in comparison to other varieties.
Afghanistan Opium Survey 2006
51
Watani Soorgulai
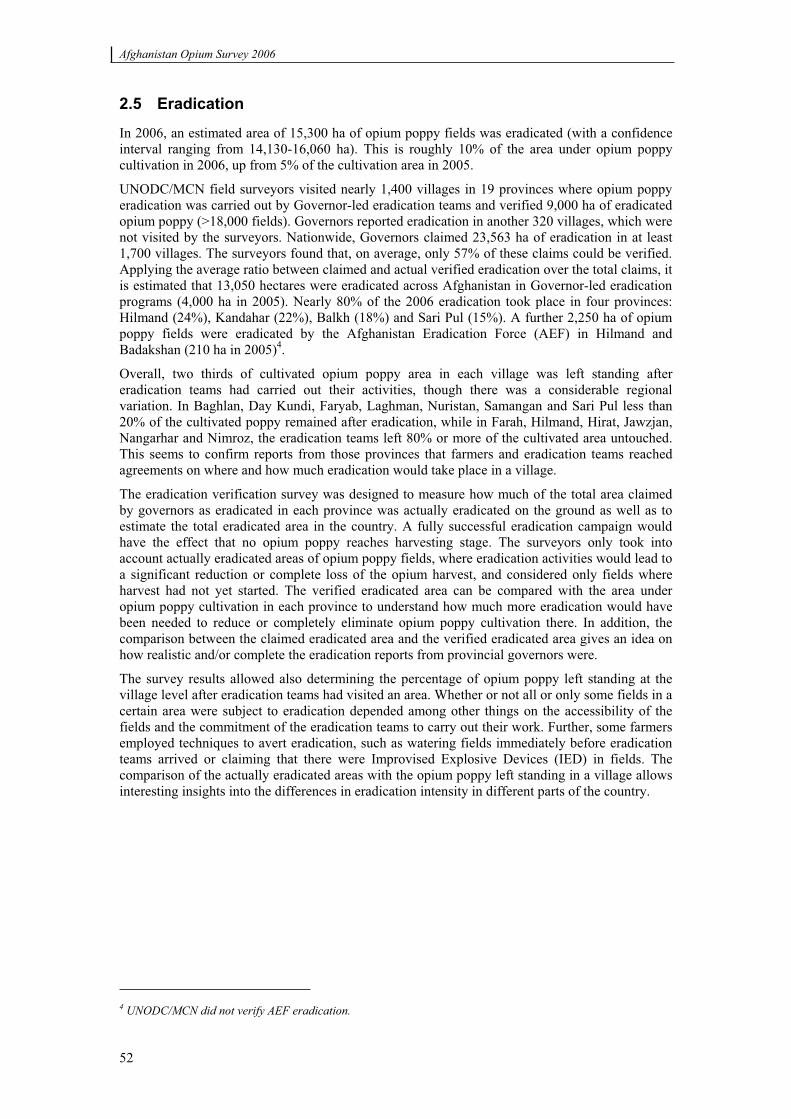
Watani Spingulai has a white flower and was found to be grown on both sandy and clay loam soils. The capsules of Spingulai are more elongated than those of other varieties. Spingulai is an early maturing variety of opium poppy that is relatively resistant to both disease and poor weather. It was also reported that Spingulai is a low input crop, and requires less fertilizer, irrigation and labour than other varieties.
Watani Spingulai
Afghanistan Opium Survey 2006
52
2.5 Eradication
In 2006, an estimated area of 15,300 ha of opium poppy fields was eradicated (with a confidence interval ranging from 14,130-16,060 ha). This is roughly 10% of the area under opium poppy cultivation in 2006, up from 5% of the cultivation area in 2005.
UNODC/MCN field surveyors visited nearly 1,400 villages in 19 provinces where opium poppy eradication was carried out by Governor-led eradication teams and verified 9,000 ha of eradicated opium poppy (>18,000 fields). Governors reported eradication in another 320 villages, which were not visited by the surveyors. Nationwide, Governors claimed 23,563 ha of eradication in at least 1,700 villages. The surveyors found that, on average, only 57% of these claims could be verified. Applying the average ratio between claimed and actual verified eradication over the total claims, it is estimated that 13,050 hectares were eradicated across Afghanistan in Governor-led eradication programs (4,000 ha in 2005). Nearly 80% of the 2006 eradication took place in four provinces: Hilmand (24%), Kandahar (22%), Balkh (18%) and Sari Pul (15%). A further 2,250 ha of opium poppy fields were eradicated by the Afghanistan Eradication Force (AEF) in Hilmand and Badakshan (210 ha in 2005)4.
Overall, two thirds of cultivated opium poppy area in each village was left standing after eradication teams had carried out their activities, though there was a considerable regional variation. In Baghlan, Day Kundi, Faryab, Laghman, Nuristan, Samangan and Sari Pul less than 20% of the cultivated poppy remained after eradication, while in Farah, Hilmand, Hirat, Jawzjan, Nangarhar and Nimroz, the eradication teams left 80% or more of the cultivated area untouched. This seems to confirm reports from those provinces that farmers and eradication teams reached agreements on where and how much eradication would take place in a village.
The eradication verification survey was designed to measure how much of the total area claimed by governors as eradicated in each province was actually eradicated on the ground as well as to estimate the total eradicated area in the country. A fully successful eradication campaign would have the effect that no opium poppy reaches harvesting stage. The surveyors only took into account actually eradicated areas of opium poppy fields, where eradication activities would lead to a significant reduction or complete loss of the opium harvest, and considered only fields where harvest had not yet started. The verified eradicated area can be compared with the area under opium poppy cultivation in each province to understand how much more eradication would have been needed to reduce or completely eliminate opium poppy cultivation there. In addition, the comparison between the claimed eradicated area and the verified eradicated area gives an idea on how realistic and/or complete the eradication reports from provincial governors were.
The survey results allowed also determining the percentage of opium poppy left standing at the village level after eradication teams had visited an area. Whether or not all or only some fields in a certain area were subject to eradication depended among other things on the accessibility of the fields and the commitment of the eradication teams to carry out their work. Further, some farmers employed techniques to avert eradication, such as watering fields immediately before eradication teams arrived or claiming that there were Improvised Explosive Devices (IED) in fields. The comparison of the actually eradicated areas with the opium poppy left standing in a village allows interesting insights into the differences in eradication intensity in different parts of the country.
4 UNODC/MCN did not verify AEF eradication.
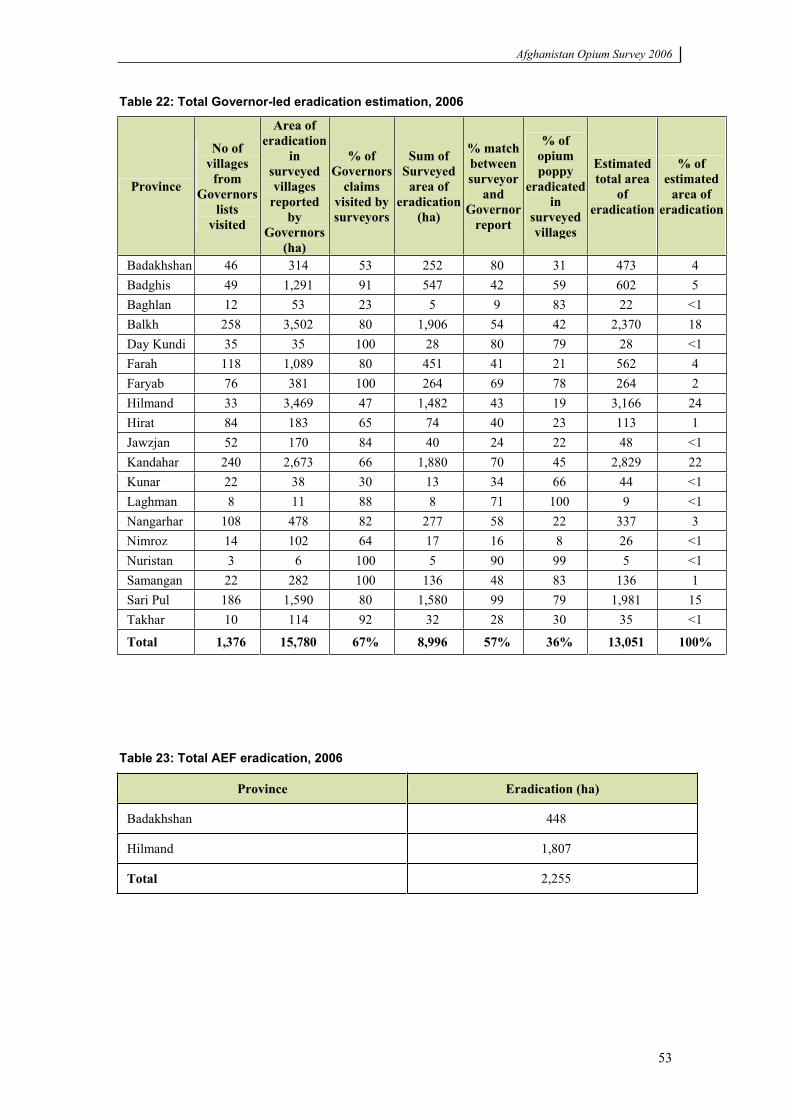
Afghanistan Opium Survey 2006
53
Table 22: Total Governor-led eradication estimation, 2006
Province
No of villages
from Governors
listsvisited
Area of eradication
insurveyed villages
reported by
Governors(ha)
% of Governors
claimsvisited by surveyors
Sum of Surveyed
area of eradication
(ha)
% match betweensurveyor
and Governor
report
% of opium poppy
eradicatedin
surveyed villages
Estimated total area
of eradication
% of estimated
area of eradication
Badakhshan 46 314 53 252 80 31 473 4 Badghis 49 1,291 91 547 42 59 602 5 Baghlan 12 53 23 5 9 83 22 <1 Balkh 258 3,502 80 1,906 54 42 2,370 18 Day Kundi 35 35 100 28 80 79 28 <1 Farah 118 1,089 80 451 41 21 562 4 Faryab 76 381 100 264 69 78 264 2 Hilmand 33 3,469 47 1,482 43 19 3,166 24 Hirat 84 183 65 74 40 23 113 1 Jawzjan 52 170 84 40 24 22 48 <1 Kandahar 240 2,673 66 1,880 70 45 2,829 22 Kunar 22 38 30 13 34 66 44 <1 Laghman 8 11 88 8 71 100 9 <1 Nangarhar 108 478 82 277 58 22 337 3 Nimroz 14 102 64 17 16 8 26 <1 Nuristan 3 6 100 5 90 99 5 <1 Samangan 22 282 100 136 48 83 136 1 Sari Pul 186 1,590 80 1,580 99 79 1,981 15 Takhar 10 114 92 32 28 30 35 <1
Total 1,376 15,780 67% 8,996 57% 36% 13,051 100%
Table 23: Total AEF eradication, 2006
Province Eradication (ha)
Badakhshan 448
Hilmand 1,807
Total 2,255
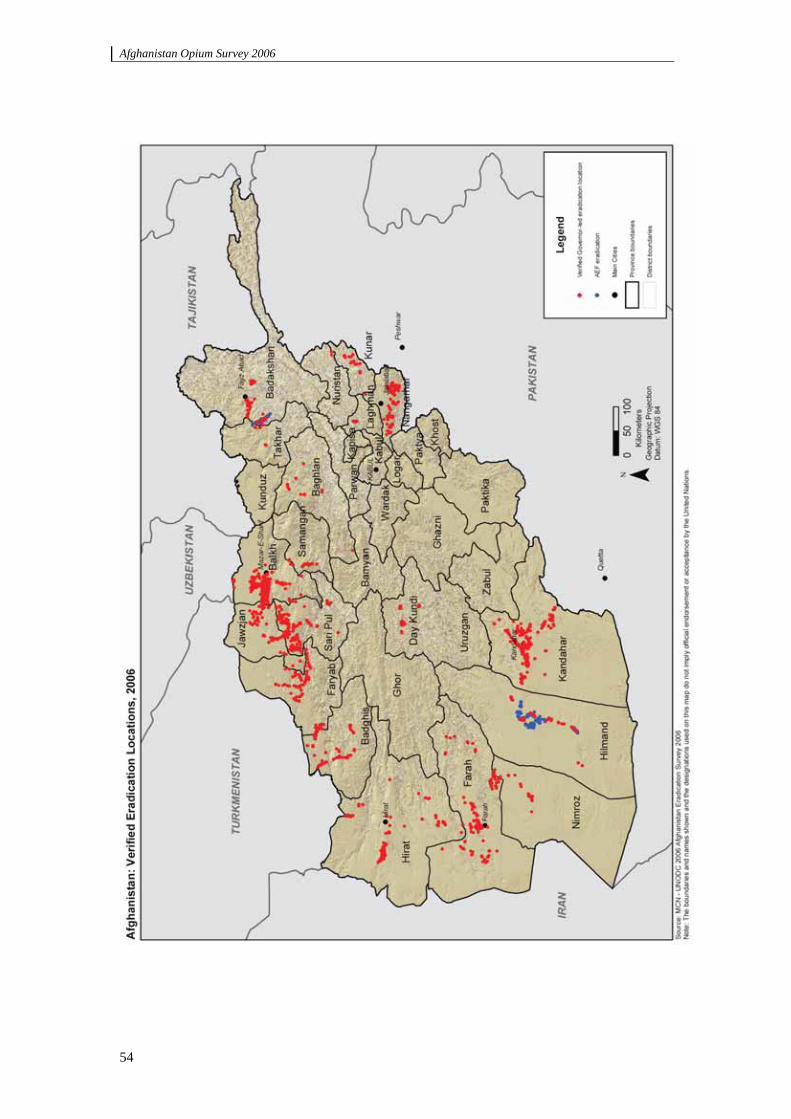
Afghanistan Opium Survey 2006
54
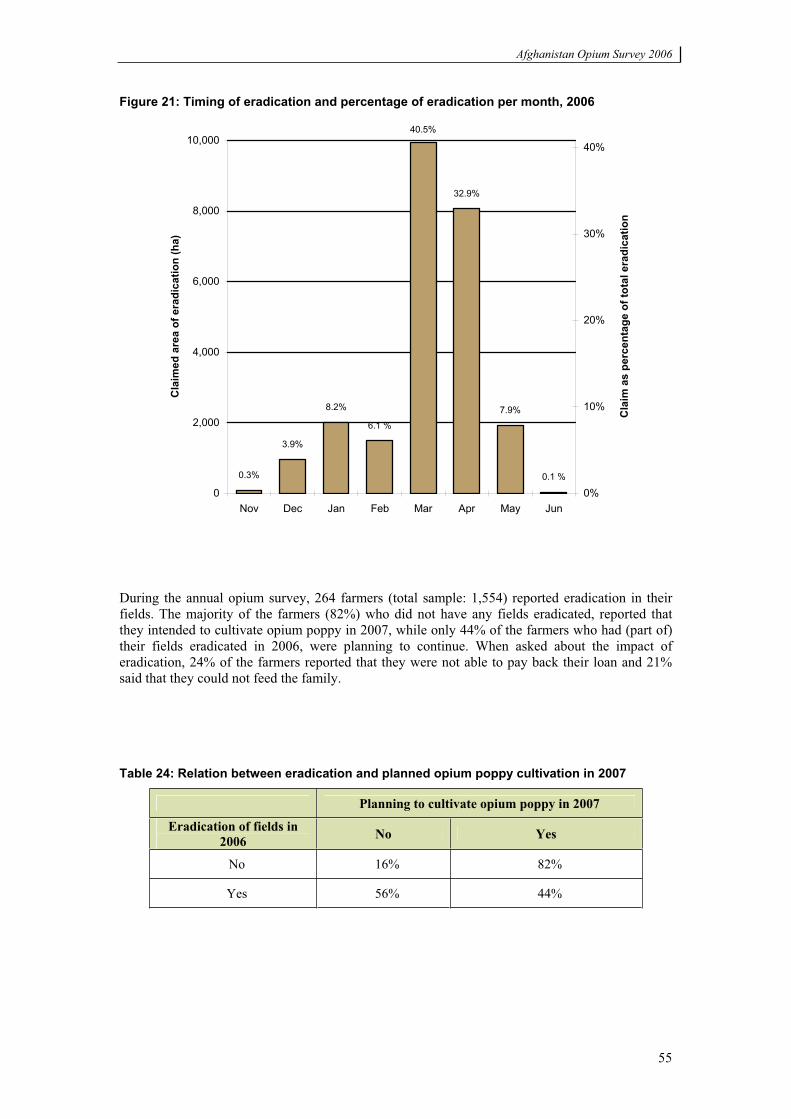
Afghanistan Opium Survey 2006
55
Figure 21: Timing of eradication and percentage of eradication per month, 2006
0.1 %
7.9%
0.3%
3.9%
8.2%
6.1 %
40.5%
32.9%
0
2,000
4,000
6,000
8,000
10,000
Nov Dec Jan Feb Mar Apr May Jun
Cla
imed
are
a of
era
dica
tion
(ha)
0%
10%
20%
30%
40%
Cla
im a
s pe
rcen
tage
of t
otal
era
dica
tion
During the annual opium survey, 264 farmers (total sample: 1,554) reported eradication in their fields. The majority of the farmers (82%) who did not have any fields eradicated, reported that they intended to cultivate opium poppy in 2007, while only 44% of the farmers who had (part of) their fields eradicated in 2006, were planning to continue. When asked about the impact of eradication, 24% of the farmers reported that they were not able to pay back their loan and 21% said that they could not feed the family.
Table 24: Relation between eradication and planned opium poppy cultivation in 2007
Planning to cultivate opium poppy in 2007
Eradication of fields in 2006 No Yes
No 16% 82%
Yes 56% 44%
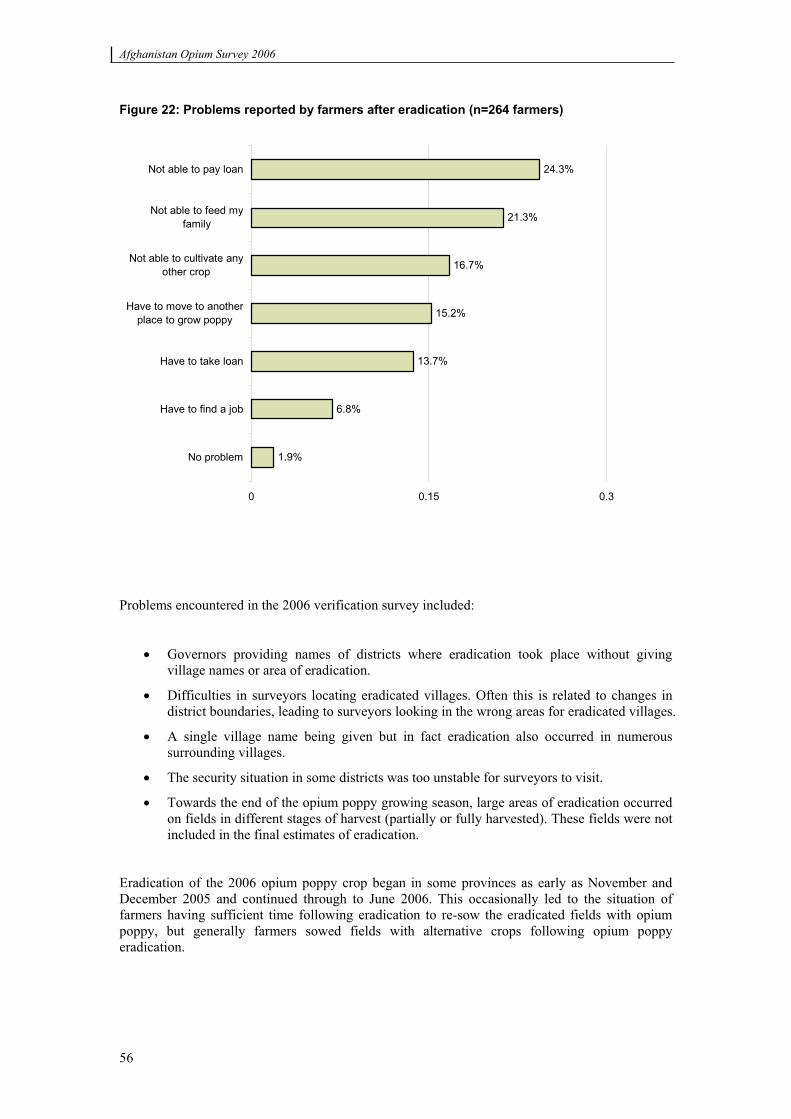
Afghanistan Opium Survey 2006
56
Figure 22: Problems reported by farmers after eradication (n=264 farmers)
1.9%
6.8%
13.7%
15.2%
16.7%
21.3%
24.3%
0 0.15 0.3
No problem
Have to find a job
Have to take loan
Have to move to anotherplace to grow poppy
Not able to cultivate anyother crop
Not able to feed myfamily
Not able to pay loan
Problems encountered in the 2006 verification survey included:
Governors providing names of districts where eradication took place without giving village names or area of eradication.
Difficulties in surveyors locating eradicated villages. Often this is related to changes in district boundaries, leading to surveyors looking in the wrong areas for eradicated villages.
A single village name being given but in fact eradication also occurred in numerous surrounding villages.
The security situation in some districts was too unstable for surveyors to visit.
Towards the end of the opium poppy growing season, large areas of eradication occurred on fields in different stages of harvest (partially or fully harvested). These fields were not included in the final estimates of eradication.
Eradication of the 2006 opium poppy crop began in some provinces as early as November and December 2005 and continued through to June 2006. This occasionally led to the situation of farmers having sufficient time following eradication to re-sow the eradicated fields with opium poppy, but generally farmers sowed fields with alternative crops following opium poppy eradication.
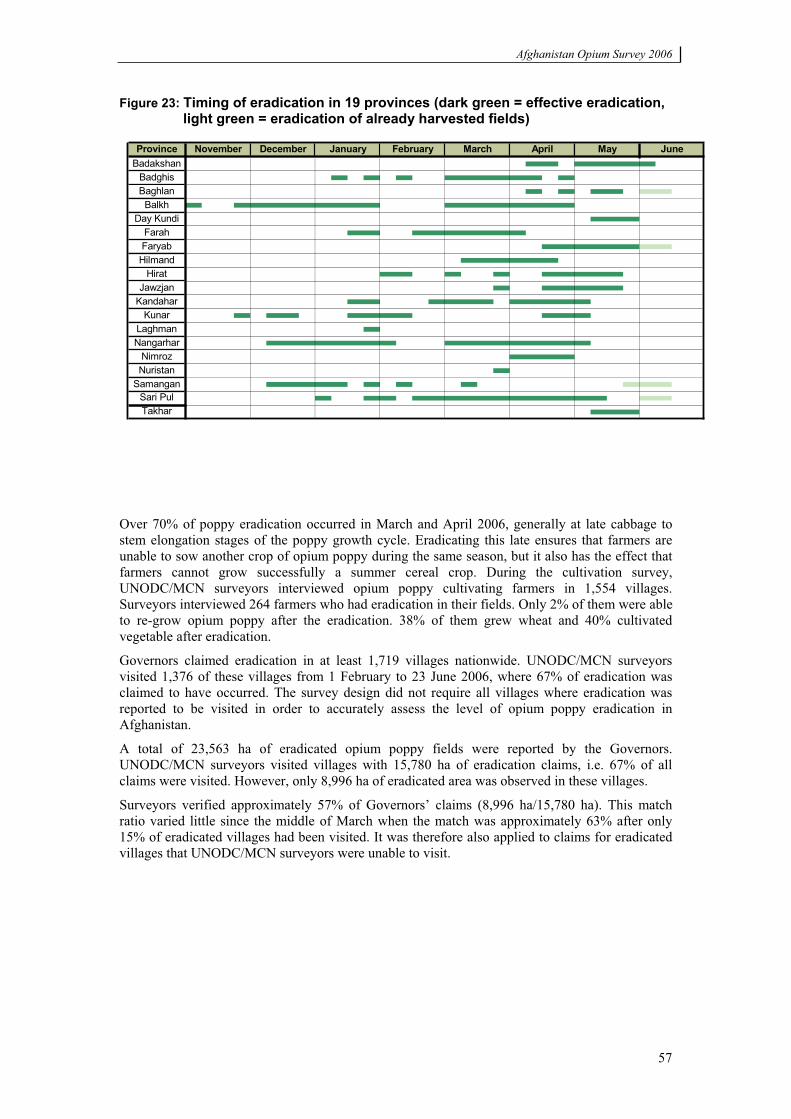
Afghanistan Opium Survey 2006
57
Figure 23: Timing of eradication in 19 provinces (dark green = effective eradication, light green = eradication of already harvested fields)
Over 70% of poppy eradication occurred in March and April 2006, generally at late cabbage to stem elongation stages of the poppy growth cycle. Eradicating this late ensures that farmers are unable to sow another crop of opium poppy during the same season, but it also has the effect that farmers cannot grow successfully a summer cereal crop. During the cultivation survey, UNODC/MCN surveyors interviewed opium poppy cultivating farmers in 1,554 villages. Surveyors interviewed 264 farmers who had eradication in their fields. Only 2% of them were able to re-grow opium poppy after the eradication. 38% of them grew wheat and 40% cultivated vegetable after eradication.
Governors claimed eradication in at least 1,719 villages nationwide. UNODC/MCN surveyors visited 1,376 of these villages from 1 February to 23 June 2006, where 67% of eradication was claimed to have occurred. The survey design did not require all villages where eradication was reported to be visited in order to accurately assess the level of opium poppy eradication in Afghanistan.
A total of 23,563 ha of eradicated opium poppy fields were reported by the Governors. UNODC/MCN surveyors visited villages with 15,780 ha of eradication claims, i.e. 67% of all claims were visited. However, only 8,996 ha of eradicated area was observed in these villages.
Surveyors verified approximately 57% of Governors’ claims (8,996 ha/15,780 ha). This match ratio varied little since the middle of March when the match was approximately 63% after only 15% of eradicated villages had been visited. It was therefore also applied to claims for eradicated villages that UNODC/MCN surveyors were unable to visit.
Province November December January February March April May JuneBadakshan
BadghisBaghlan
Balkh Day Kundi
FarahFaryab
HilmandHirat
JawzjanKandahar
Kunar
SamanganSari PulTakhar
LaghmanNangarhar
NimrozNuristan
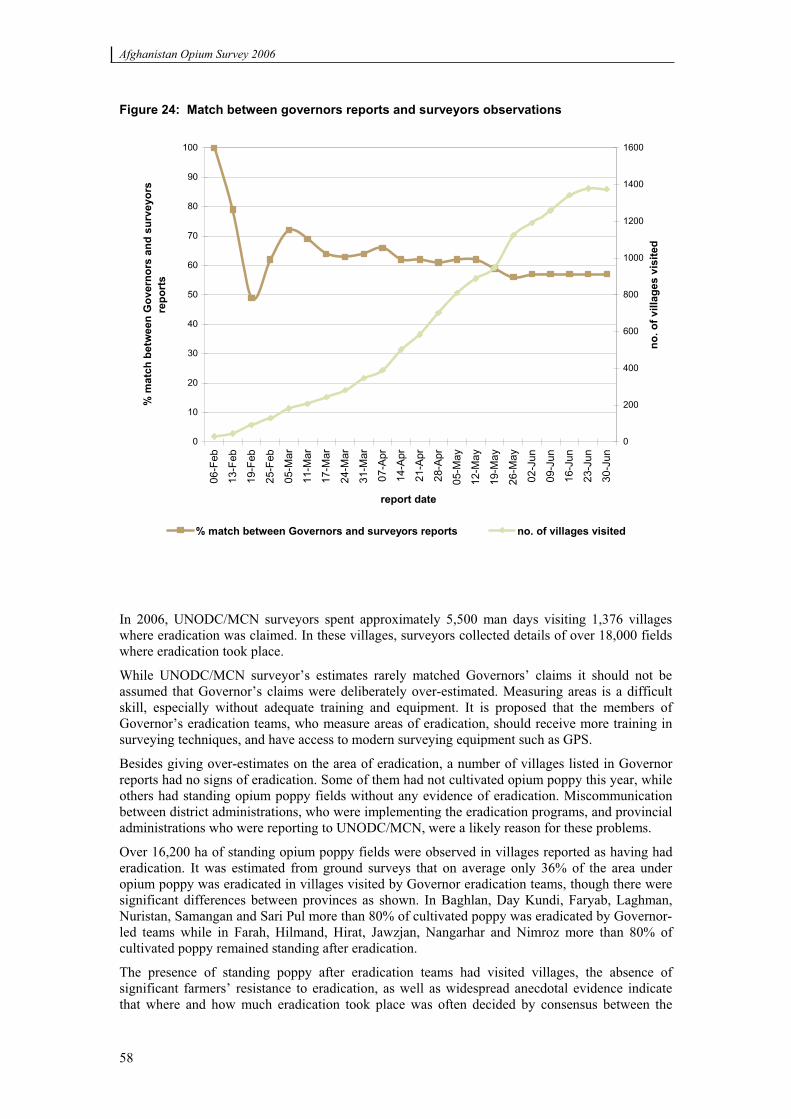
Afghanistan Opium Survey 2006
58
Figure 24: Match between governors reports and surveyors observations
0
10
20
30
40
50
60
70
80
90
100
06-F
eb
13-F
eb
19-F
eb
25-F
eb
05-M
ar
11-M
ar
17-M
ar
24-M
ar
31-M
ar
07-A
pr
14-A
pr
21-A
pr
28-A
pr
05-M
ay
12-M
ay
19-M
ay
26-M
ay
02-J
un
09-J
un
16-J
un
23-J
un
30-J
un
report date
% m
atch
bet
wee
n G
over
nors
and
sur
veyo
rsre
port
s
0
200
400
600
800
1000
1200
1400
1600
no. o
f vill
ages
vis
ited
% match between Governors and surveyors reports no. of villages visited
In 2006, UNODC/MCN surveyors spent approximately 5,500 man days visiting 1,376 villages where eradication was claimed. In these villages, surveyors collected details of over 18,000 fields where eradication took place.
While UNODC/MCN surveyor’s estimates rarely matched Governors’ claims it should not be assumed that Governor’s claims were deliberately over-estimated. Measuring areas is a difficult skill, especially without adequate training and equipment. It is proposed that the members of Governor’s eradication teams, who measure areas of eradication, should receive more training in surveying techniques, and have access to modern surveying equipment such as GPS.
Besides giving over-estimates on the area of eradication, a number of villages listed in Governor reports had no signs of eradication. Some of them had not cultivated opium poppy this year, while others had standing opium poppy fields without any evidence of eradication. Miscommunication between district administrations, who were implementing the eradication programs, and provincial administrations who were reporting to UNODC/MCN, were a likely reason for these problems.
Over 16,200 ha of standing opium poppy fields were observed in villages reported as having had eradication. It was estimated from ground surveys that on average only 36% of the area under opium poppy was eradicated in villages visited by Governor eradication teams, though there were significant differences between provinces as shown. In Baghlan, Day Kundi, Faryab, Laghman, Nuristan, Samangan and Sari Pul more than 80% of cultivated poppy was eradicated by Governor-led teams while in Farah, Hilmand, Hirat, Jawzjan, Nangarhar and Nimroz more than 80% of cultivated poppy remained standing after eradication.
The presence of standing poppy after eradication teams had visited villages, the absence of significant farmers’ resistance to eradication, as well as widespread anecdotal evidence indicate that where and how much eradication took place was often decided by consensus between the
Afghanistan Opium Survey 2006
59
farmers and the eradication teams. As in 2005, there were many accounts of eradication teams accepting money from farmers who wanted to avert eradication.
The Afghanistan Eradication Force eradicated 1,807 ha of opium poppy fields in Hilmand and 456 ha in Badakshan, where there activities ceased in early June. This compares to 209 ha eradicated in 5 provinces by the Central Poppy Elimination Forces (CPEF) in 2005. AEF eradication was not verified by UNODC, but by international verifiers provided by the US Embassy in Kabul. The quality of the eradication carried out by AEF was generally of a much higher standard than Governor-led eradication, as well as the quality of their reports to UNODC.
Security incidents involving eradication teams were fewer this year than in 2005. AEF teams came under regular attack in Hilmand province during May, with up to three casualties suffered by anti-government elements during one incident. During May, a medical clinic in Badghish was attacked and five healthcare workers were killed. The doctor at the clinic was the brother of the head of the local poppy eradication team, and the attack was claimed to be in response to opium poppy eradication activities. One opium poppy farmer was killed in June during eradication in Badakshan. It was reported that a local commander with large landholdings under opium poppy created the unrest to protect his fields from eradication. There were no reports of eradication teams being attacked in any other provinces, though eradication was often met with minor, local hostility. No UNODC/MCN surveyors reported any significant security incidents directly aimed at them, even though they carried out their work in many isolated, instable regions.
Eastern Region (Kunar, Laghman, Nangarhar & Nuristan)
Approximately 730 ha of eradication were claimed in the Eastern Region. UNODC/MCN surveyors visited 80% of all claims and recorded 303 ha of eradication. The final estimate for eradication in this Region is 395 ha.
The small area of eradication in the Eastern Region reflects the low level of opium poppy cultivation in this area rather than reluctance on the part of Governors to carry out eradication. Opium poppy in this region is also frequently grown in isolated valleys where government control is not strong.
Kunar was one of the provinces where cooperation between district/provincial administrations and UNODC/MCN surveyors was poor. Governors lists were often vague with few village names or inaccurate areas of eradication being provided. Laghman had little eradication, but little opium poppy cultivation was observed by surveyors outside of villages targeted by eradication. The Nangarhar Governor carried out eradication from December 2005 through to May 2006. While much of the eradication was effective some villages were revisited by eradication teams three times before all opium poppy was removed. Nuristan is not a significant opium poppy growing province. Most opium poppy is grown in extremely isolated valleys, which makes eradication difficult.
Southern Region (Day Kundi, Hilmand, Kandahar, Nimroz, Uruzgan & Zabul)
Nearly 50% (11,626 ha) of all Governors eradication claims were received from the Southern Region. Surveyors visited 54% of all claims and reported 3,454 ha of eradication. The final estimate of Governor-led eradication in this region is 6,049 ha. A further 1,807 ha of eradication was carried out by AEF in Hilmand.
Day Kundi did not begin eradication until mid-May and it was estimated that 28 ha of poppy eradication was carried out. Hilmand is estimated to have the largest area of Governor-led eradication of all provinces in 2006 (3,166 ha). Most of this eradication was in Dishu, Garmser and Reg districts, but extensive areas of opium poppy fields in central Hilmand were left untouched. On average only 20% of opium poppy was eradicated in the villages visited by Governor eradication teams. Extensive eradication was also estimated in Kandahar (2,829 ha), though it was more evenly distributed across districts than in Hilmand. Approximately 50% of poppy was eradicated in each village visited by Governor eradication teams, with very few opium poppy growing villages having 100% eradication. The Nimroz Governors office carried out a
Afghanistan Opium Survey 2006
60
small amount of eradication in April (26 ha). Traditionally, Nimroz was not a significant poppy growing province. No reports of eradication were received from either Uruzgan or Zabul. In Uruzgan it was claimed by the Governors office that an extensive opium poppy disease rendered eradication unnecessary.
Western Region (Farah, Ghor & Hirat)
Governors in the Western Region claimed 1,636 ha of eradication in 2006. UNODC/MCN surveyors visited 80% of all Governors claims (1,272 ha) and reported 525 ha of eradication. The 42% match between Governors claims and surveyors estimates was the lowest of all regions. The final estimate of eradication in the Western Region was 675 ha.
Governor-led eradication took place in Farah province from January to early April 2006, by which time it is estimated that 562 ha of opium poppy fields had been eradicated. In Hirat province, 113 ha of opium poppy fields were eradicated from February to late May. There were some difficulties getting accurate reports from the Hirat Governor as eradication was carried out by district level administrations and their reports to the Governor were often late and incomplete. No eradication reports were received from Ghor province.
Northern Region (Badghis, Baghlan, Balkh, Faryab, Jawzjan, Samangan, Sari Pul)
Approximately 40% (8,868 ha) of all Governor eradication claims were received from the Northern region. Surveyors visited villages where 82% (7,269 ha) of eradication was claimed and reported 4,478 ha of eradicated opium poppy fields. The final estimate of eradication in Northern Region is 5,423 ha, equal to 42% of all Governor-led eradication in 2006.
Sporadic eradication was carried out in Badghis province from January to April. In total, 602 ha of eradication was estimated for this province. The Baghlan Governor carried out an estimated area of 22 ha of eradication in April and May, though reports were received in June of eradication of harvested opium poppy fields. The Balkh Governor reported 4,355 ha of eradication from November 2005 through to April 2006. UNODC/MCN surveyors visited 80% of all claims and observed 1,906 ha of eradicated poppy fields. It is estimated that 2,370 ha of eradication was carried out in Balkh in 2006, 20% of national Governor-led eradication. Eradication teams under the supervision of the Governor of Faryab began eradication in mid-April and continued through to the end of May. A total of 381 ha of eradication were claimed. UNODC/MCN estimated that 264 ha of eradication took place in 2006. A further 300 ha were reported eradicated in June; UNODC/MCN surveyors visited a sample of this eradication and found that it was mostly on harvested fields. The Jawzjan Governor claimed 202 ha of eradication from March to May. Based on the reports of UNODC/MCN surveyors, it is estimated that 48 ha of eradication occurred. In Samangan, Governor-led eradication teams claimed 282 ha of eradication. Surveyors visited all these claims and reported 136 ha of eradication. In May, a report of nearly 800 ha of eradication was received from Samangan, but surveyors reported that all eradication in May was on harvested opium poppy fields. Approximately 2,000 ha of eradication were claimed in Sari Pul. Based on UNODC/MCN surveyors’ reports from 80% of these claims, it is estimated that 1,981 ha of eradication took place in Sari Pul this year.
Northwest Region (Badakhshan & Takhar)
Governors in Northern Region claimed 713 ha of eradication in 2006. Based on UNODC/MCN surveyors’ reports, a total area of 508 ha of eradication is estimated for 2006. A further 456 ha of eradication was reported by the AEF in Badakshan.
Badakhshan eradication accounted for 94% (473 ha) of all Governor-led eradication in Northern Region. The eradication program began in early April and finished in early June. UNODC/MCN received reports of flowering poppy fields as late as July 2006 in isolated, high altitude areas. Based on surveyors’ reports, an estimated 35 ha of eradication took place during May 2006.
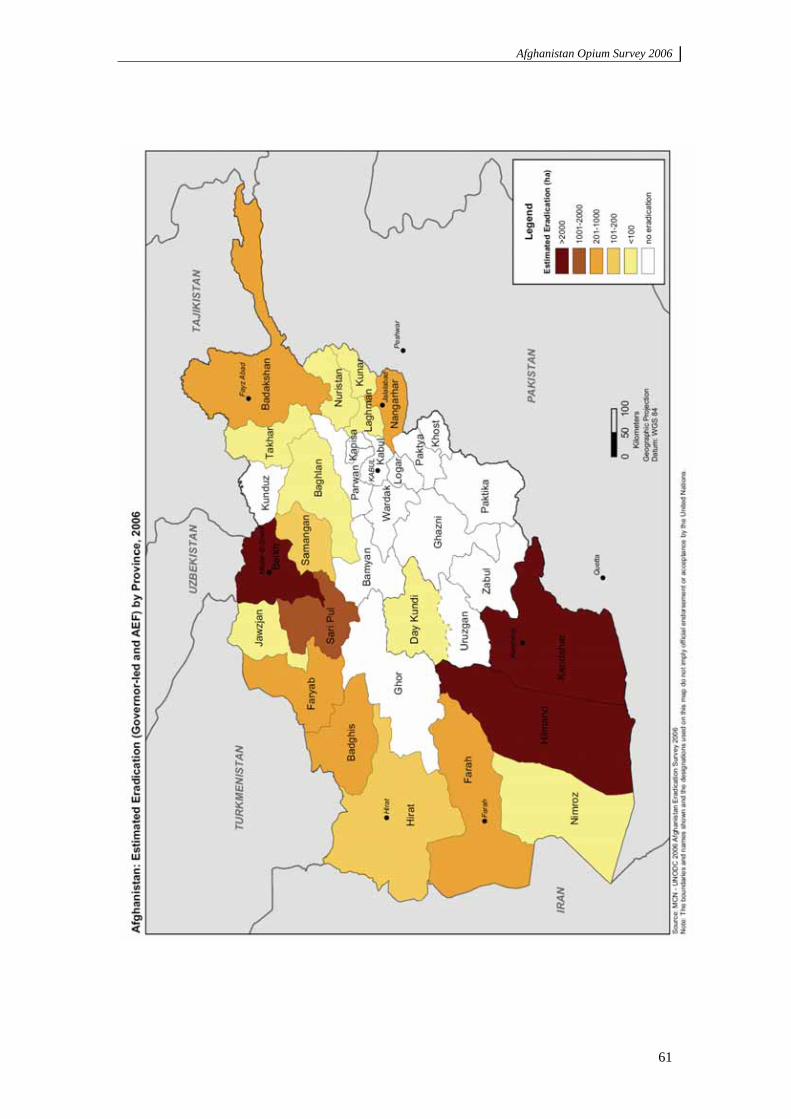
Afghanistan Opium Survey 2006
61
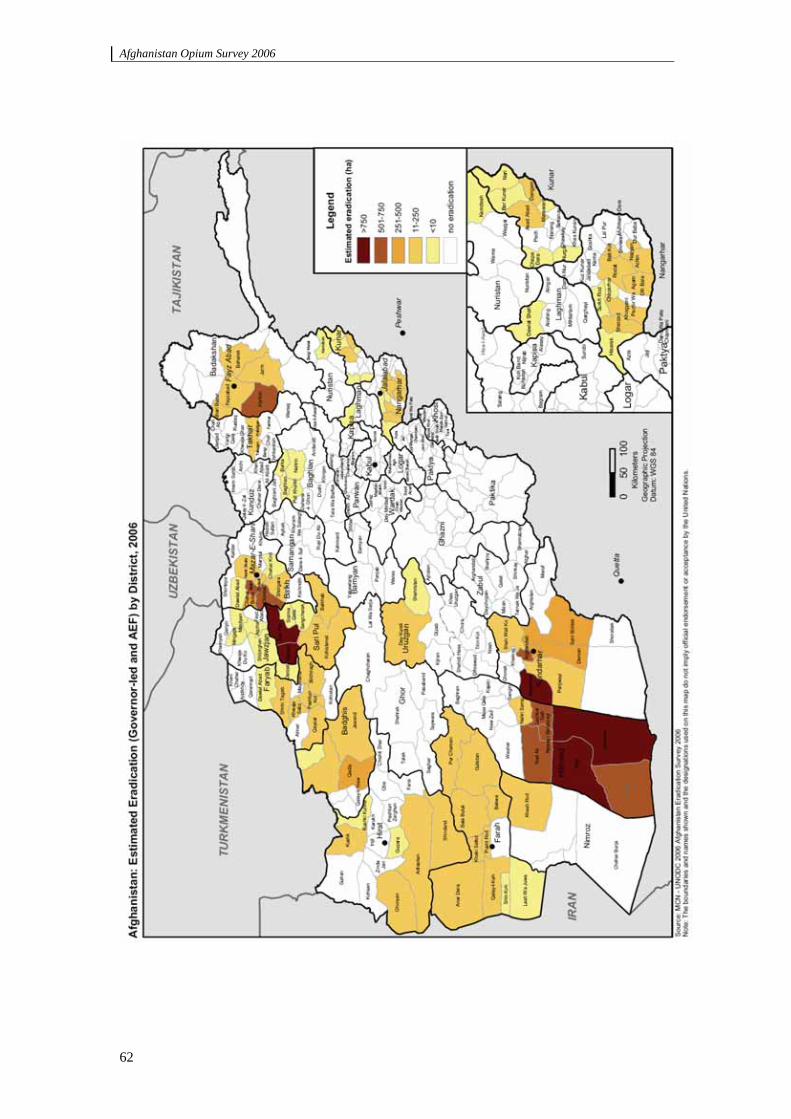
Afghanistan Opium Survey 2006
62
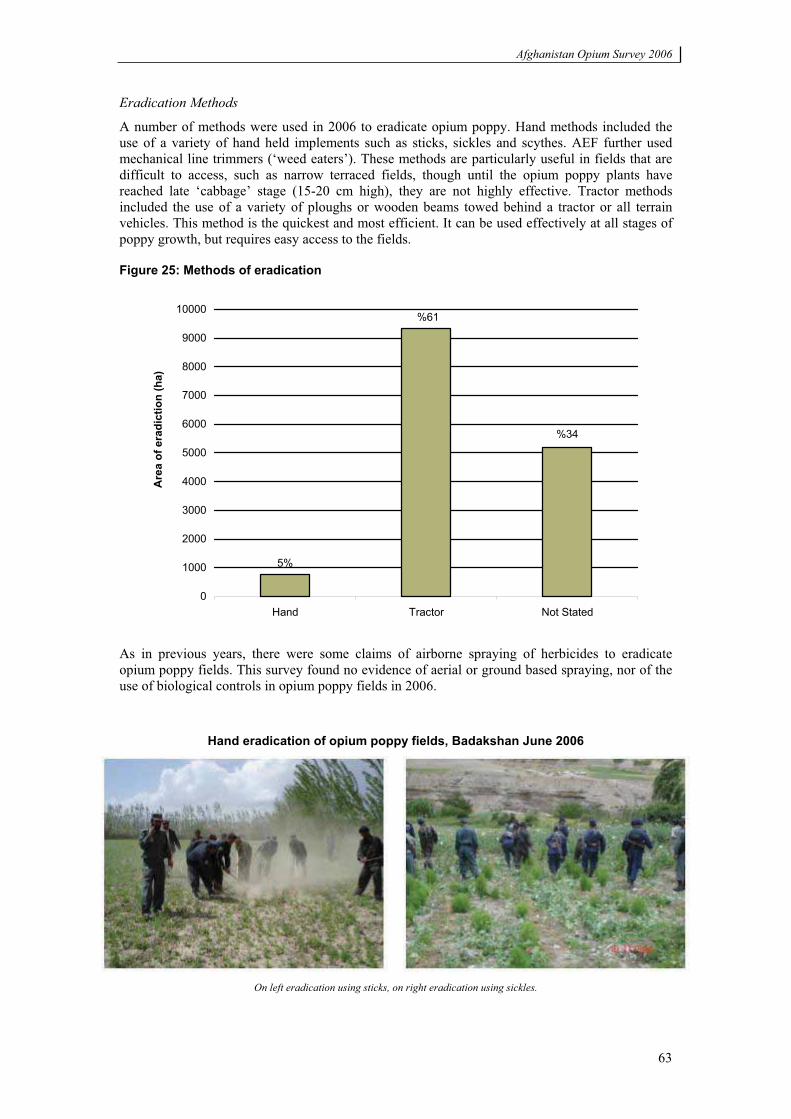
Afghanistan Opium Survey 2006
63
Eradication Methods
A number of methods were used in 2006 to eradicate opium poppy. Hand methods included the use of a variety of hand held implements such as sticks, sickles and scythes. AEF further used mechanical line trimmers (‘weed eaters’). These methods are particularly useful in fields that are difficult to access, such as narrow terraced fields, though until the opium poppy plants have reached late ‘cabbage’ stage (15-20 cm high), they are not highly effective. Tractor methods included the use of a variety of ploughs or wooden beams towed behind a tractor or all terrain vehicles. This method is the quickest and most efficient. It can be used effectively at all stages of poppy growth, but requires easy access to the fields.
Figure 25: Methods of eradication
%34
5%
%61
0
1000
2000
3000
4000
5000
6000
7000
8000
9000
10000
Hand Tractor Not Stated
Are
a of
era
dict
ion
(ha)
As in previous years, there were some claims of airborne spraying of herbicides to eradicate opium poppy fields. This survey found no evidence of aerial or ground based spraying, nor of the use of biological controls in opium poppy fields in 2006.
Hand eradication of opium poppy fields, Badakshan June 2006
On left eradication using sticks, on right eradication using sickles.
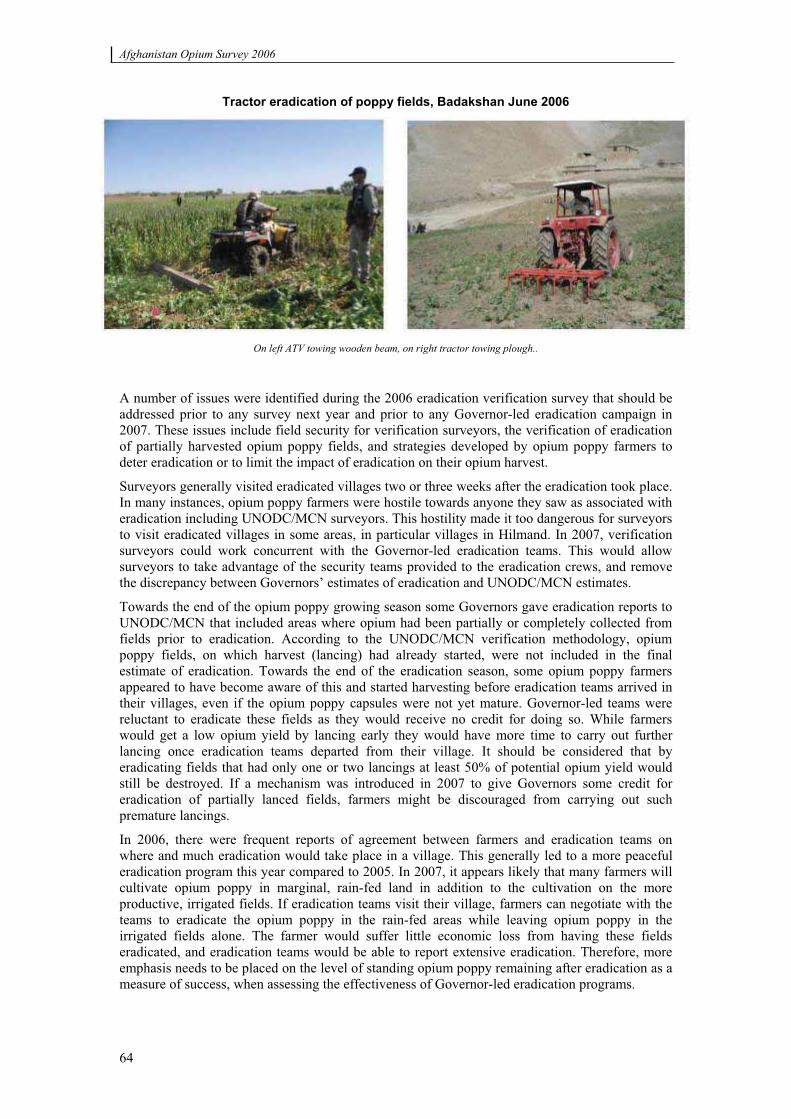
Afghanistan Opium Survey 2006
64
Tractor eradication of poppy fields, Badakshan June 2006
On left ATV towing wooden beam, on right tractor towing plough..
A number of issues were identified during the 2006 eradication verification survey that should be addressed prior to any survey next year and prior to any Governor-led eradication campaign in 2007. These issues include field security for verification surveyors, the verification of eradication of partially harvested opium poppy fields, and strategies developed by opium poppy farmers to deter eradication or to limit the impact of eradication on their opium harvest.
Surveyors generally visited eradicated villages two or three weeks after the eradication took place. In many instances, opium poppy farmers were hostile towards anyone they saw as associated with eradication including UNODC/MCN surveyors. This hostility made it too dangerous for surveyors to visit eradicated villages in some areas, in particular villages in Hilmand. In 2007, verification surveyors could work concurrent with the Governor-led eradication teams. This would allow surveyors to take advantage of the security teams provided to the eradication crews, and remove the discrepancy between Governors’ estimates of eradication and UNODC/MCN estimates.
Towards the end of the opium poppy growing season some Governors gave eradication reports to UNODC/MCN that included areas where opium had been partially or completely collected from fields prior to eradication. According to the UNODC/MCN verification methodology, opium poppy fields, on which harvest (lancing) had already started, were not included in the final estimate of eradication. Towards the end of the eradication season, some opium poppy farmers appeared to have become aware of this and started harvesting before eradication teams arrived in their villages, even if the opium poppy capsules were not yet mature. Governor-led teams were reluctant to eradicate these fields as they would receive no credit for doing so. While farmers would get a low opium yield by lancing early they would have more time to carry out further lancing once eradication teams departed from their village. It should be considered that by eradicating fields that had only one or two lancings at least 50% of potential opium yield would still be destroyed. If a mechanism was introduced in 2007 to give Governors some credit for eradication of partially lanced fields, farmers might be discouraged from carrying out such premature lancings.
In 2006, there were frequent reports of agreement between farmers and eradication teams on where and much eradication would take place in a village. This generally led to a more peaceful eradication program this year compared to 2005. In 2007, it appears likely that many farmers will cultivate opium poppy in marginal, rain-fed land in addition to the cultivation on the more productive, irrigated fields. If eradication teams visit their village, farmers can negotiate with the teams to eradicate the opium poppy in the rain-fed areas while leaving opium poppy in the irrigated fields alone. The farmer would suffer little economic loss from having these fields eradicated, and eradication teams would be able to report extensive eradication. Therefore, more emphasis needs to be placed on the level of standing opium poppy remaining after eradication as a measure of success, when assessing the effectiveness of Governor-led eradication programs.
Afghanistan Opium Survey 2006
65
Methodology:
Initially, thirty five field surveyors were employed to carry out the verification survey, increasing to forty surveyors by April, 2006. The surveyors were trained in eradication monitoring in Kabul from 20-24 January 2006 and were deployed to the field on 1 February 2006. Their training included field surveying techniques, identification of opium poppy eradication and interviewing skills.
The surveyors regularly visited Governors’ offices in 22 provinces and requested the details of Governor led eradication programs. The Governors’ Offices were asked to provide village lists consisting of location, date, method and area of eradication. Surveyors reported this information to the Kabul verification officer by telephone as soon as they received the data. The officer then instructed them to visit a sample of the villages provided by the Governor’s Office.
Villages were visited as soon as possible after eradication happened, taking into account the local security situation, though the design of the survey did not require all eradicated villages to be visited in order to accurately assess the level of eradication in Afghanistan. If a surveyor did not receive a village list from the Governor’s Office, the Kabul officer provided the surveyor with a list of randomly selected villages within the province for them to visit. The surveyors visited the assigned villages and if any eradication had occurred, they collected GPS coordinates and photographs of eradicated fields. They further provided an estimate of the total area of opium poppy eradicated and the total area of standing opium poppy remaining in the village. Surveyors reported these findings to the Kabul officer each day where it was entered into a database.
Estimation of total Governor-led eradication in each province
provincein villagesin visitedGovernorsbyclaimedneradicatioTotalprovincein villagesin visitedsurveyorsbyn verifiederadicatioTotalp Equation 1
Estimation = E = p x Total eradication claim in province by Governor Equation 2
Estimation of total Governor-led eradication nationwide19
1estimationneradicatioNational
iiE
Where Ei= Total estimated eradication in province i
The confidence interval of the estimation was found by using the bootstrap technique. Equation 1 and 2 were iterated 10,000 times to find the confidence interval for the estimation. The 90% confidence interval was estimated as 14,130-16,060 ha.
The survey design did not include and accuracy assessment of the individual measurements done by the surveyors. Imprecision of estimations are possible as the security situation during the eradication verification survey did not allow surveyors to employ time-consuming, sophisticated measurement procedures. The cumulative effect (magnitude and direction) of these imprecision on the final estimate cannot be statistically established but based on random checks UNODC experts estimate that the effect was likely limited.
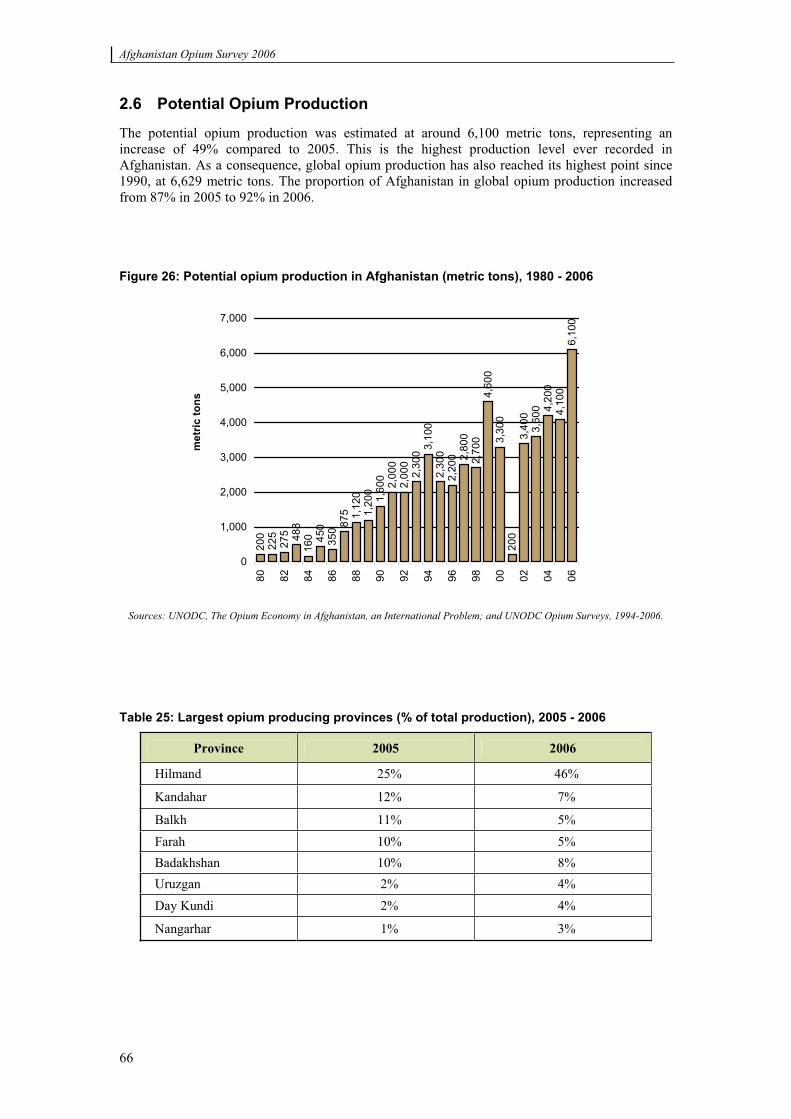
Afghanistan Opium Survey 2006
66
2.6 Potential Opium Production
The potential opium production was estimated at around 6,100 metric tons, representing an increase of 49% compared to 2005. This is the highest production level ever recorded in Afghanistan. As a consequence, global opium production has also reached its highest point since 1990, at 6,629 metric tons. The proportion of Afghanistan in global opium production increased from 87% in 2005 to 92% in 2006.
Figure 26: Potential opium production in Afghanistan (metric tons), 1980 - 2006 20
022
527
5 488
160 45
035
0 875 1,12
01,
200 1,60
0 2,00
02,
300 3,
100
2,30
02,
200 2,
800
2,70
04,
600
3,30
020
03,
400
3,60
0 4,20
04,
100
6,10
0
2,00
0
0
1,000
2,000
3,000
4,000
5,000
6,000
7,000
80 82 84 86 88 90 92 94 96 98 00 02 04 06
met
ric to
ns
Sources: UNODC, The Opium Economy in Afghanistan, an International Problem; and UNODC Opium Surveys, 1994-2006.
Table 25: Largest opium producing provinces (% of total production), 2005 - 2006
Province 2005 2006
Hilmand 25% 46%
Kandahar 12% 7%
Balkh 11% 5% Farah 10% 5% Badakhshan 10% 8% Uruzgan 2% 4% Day Kundi 2% 4%
Nangarhar 1% 3%
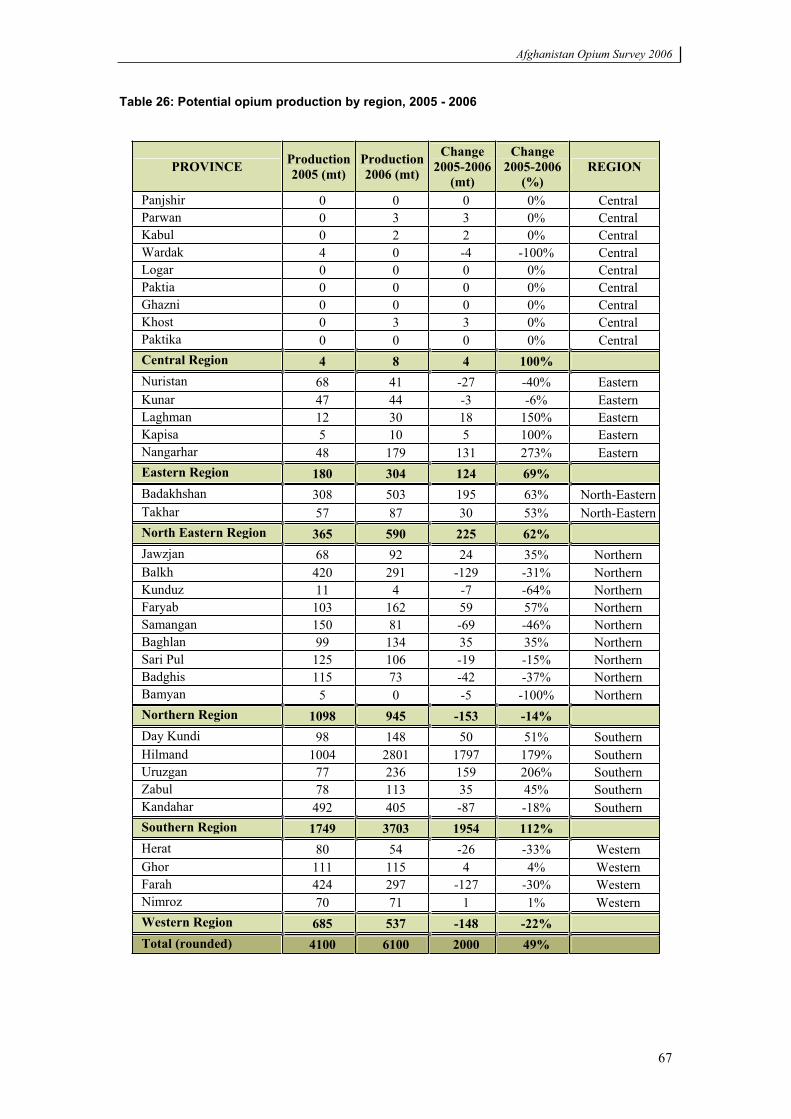
Afghanistan Opium Survey 2006
67
Table 26: Potential opium production by region, 2005 - 2006
PROVINCE Production 2005 (mt)
Production 2006 (mt)
Change 2005-2006
(mt)
Change 2005-2006
(%) REGION
Panjshir 0 0 0 0% Central Parwan 0 3 3 0% Central Kabul 0 2 2 0% Central Wardak 4 0 -4 -100% Central Logar 0 0 0 0% Central Paktia 0 0 0 0% Central Ghazni 0 0 0 0% Central Khost 0 3 3 0% Central Paktika 0 0 0 0% Central Central Region 4 8 4 100% Nuristan 68 41 -27 -40% Eastern Kunar 47 44 -3 -6% Eastern Laghman 12 30 18 150% Eastern Kapisa 5 10 5 100% Eastern Nangarhar 48 179 131 273% Eastern Eastern Region 180 304 124 69% Badakhshan 308 503 195 63% North-EasternTakhar 57 87 30 53% North-EasternNorth Eastern Region 365 590 225 62% Jawzjan 68 92 24 35% Northern Balkh 420 291 -129 -31% Northern Kunduz 11 4 -7 -64% Northern Faryab 103 162 59 57% Northern Samangan 150 81 -69 -46% Northern Baghlan 99 134 35 35% Northern Sari Pul 125 106 -19 -15% Northern Badghis 115 73 -42 -37% Northern Bamyan 5 0 -5 -100% Northern Northern Region 1098 945 -153 -14% Day Kundi 98 148 50 51% Southern Hilmand 1004 2801 1797 179% Southern Uruzgan 77 236 159 206% Southern Zabul 78 113 35 45% Southern Kandahar 492 405 -87 -18% Southern Southern Region 1749 3703 1954 112% Herat 80 54 -26 -33% Western Ghor 111 115 4 4% Western Farah 424 297 -127 -30% Western Nimroz 70 71 1 1% Western Western Region 685 537 -148 -22% Total (rounded) 4100 6100 2000 49%
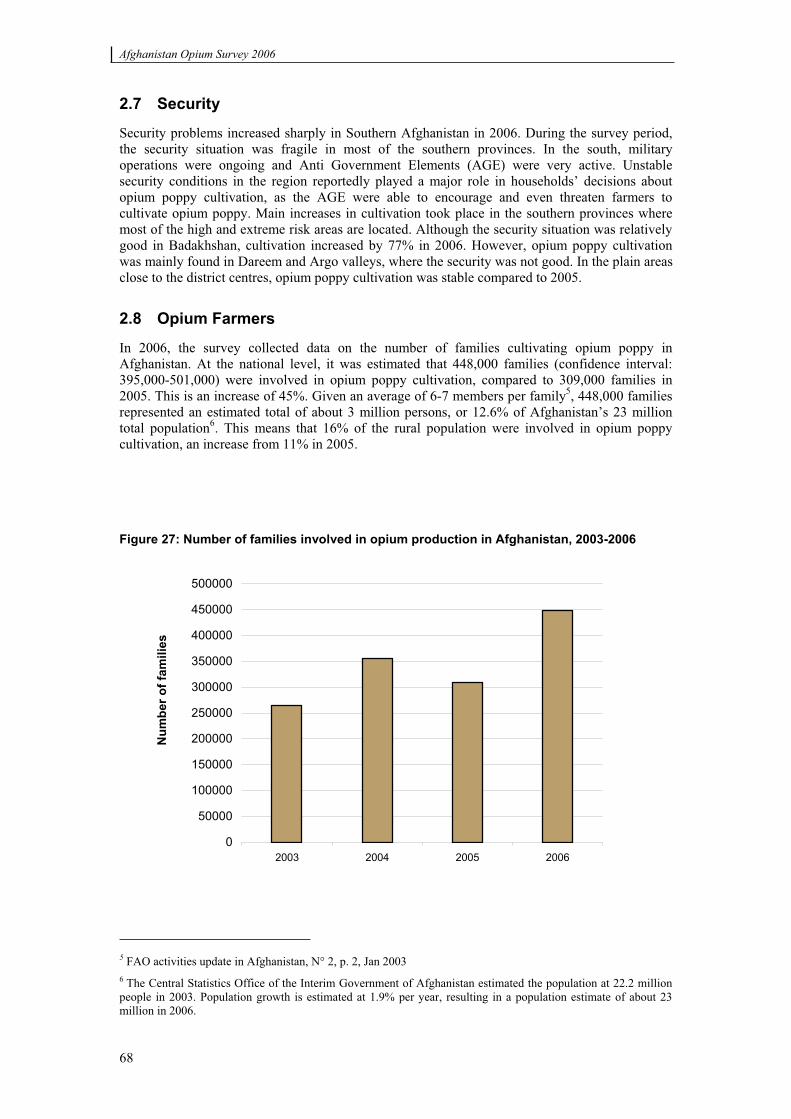
Afghanistan Opium Survey 2006
68
2.7 Security
Security problems increased sharply in Southern Afghanistan in 2006. During the survey period, the security situation was fragile in most of the southern provinces. In the south, military operations were ongoing and Anti Government Elements (AGE) were very active. Unstable security conditions in the region reportedly played a major role in households’ decisions about opium poppy cultivation, as the AGE were able to encourage and even threaten farmers to cultivate opium poppy. Main increases in cultivation took place in the southern provinces where most of the high and extreme risk areas are located. Although the security situation was relatively good in Badakhshan, cultivation increased by 77% in 2006. However, opium poppy cultivation was mainly found in Dareem and Argo valleys, where the security was not good. In the plain areas close to the district centres, opium poppy cultivation was stable compared to 2005.
2.8 Opium Farmers
In 2006, the survey collected data on the number of families cultivating opium poppy in Afghanistan. At the national level, it was estimated that 448,000 families (confidence interval: 395,000-501,000) were involved in opium poppy cultivation, compared to 309,000 families in 2005. This is an increase of 45%. Given an average of 6-7 members per family5, 448,000 families represented an estimated total of about 3 million persons, or 12.6% of Afghanistan’s 23 million total population6. This means that 16% of the rural population were involved in opium poppy cultivation, an increase from 11% in 2005.
Figure 27: Number of families involved in opium production in Afghanistan, 2003-2006
Num
ber o
f fam
ilies
0
50000
100000
150000
200000
250000
300000
350000
400000
450000
500000
2003 2004 2005 2006
5 FAO activities update in Afghanistan, N° 2, p. 2, Jan 2003 6 The Central Statistics Office of the Interim Government of Afghanistan estimated the population at 22.2 million people in 2003. Population growth is estimated at 1.9% per year, resulting in a population estimate of about 23 million in 2006.
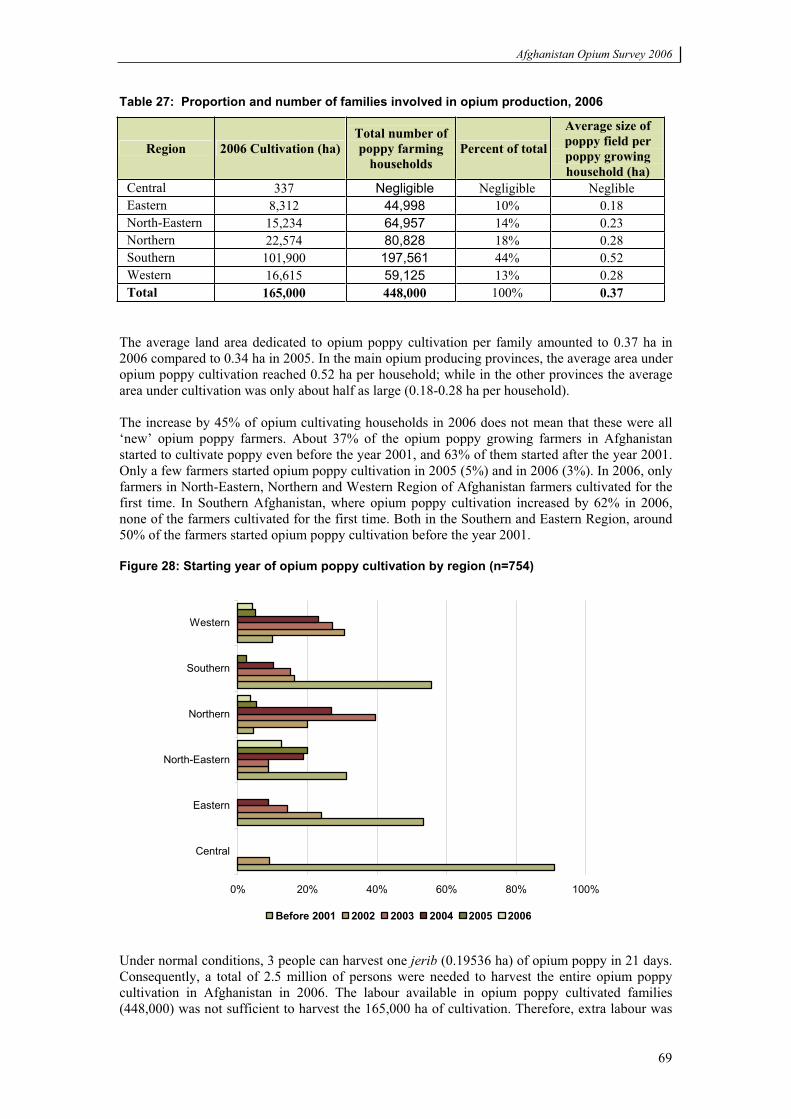
Afghanistan Opium Survey 2006
69
Table 27: Proportion and number of families involved in opium production, 2006
Region 2006 Cultivation (ha)Total number of poppy farming
households Percent of total
Average size of poppy field per poppy growing household (ha)
Central 337 Negligible Negligible Neglible Eastern 8,312 44,998 10% 0.18 North-Eastern 15,234 64,957 14% 0.23 Northern 22,574 80,828 18% 0.28 Southern 101,900 197,561 44% 0.52 Western 16,615 59,125 13% 0.28 Total 165,000 448,000 100% 0.37
The average land area dedicated to opium poppy cultivation per family amounted to 0.37 ha in 2006 compared to 0.34 ha in 2005. In the main opium producing provinces, the average area under opium poppy cultivation reached 0.52 ha per household; while in the other provinces the average area under cultivation was only about half as large (0.18-0.28 ha per household).
The increase by 45% of opium cultivating households in 2006 does not mean that these were all ‘new’ opium poppy farmers. About 37% of the opium poppy growing farmers in Afghanistan started to cultivate poppy even before the year 2001, and 63% of them started after the year 2001. Only a few farmers started opium poppy cultivation in 2005 (5%) and in 2006 (3%). In 2006, only farmers in North-Eastern, Northern and Western Region of Afghanistan farmers cultivated for the first time. In Southern Afghanistan, where opium poppy cultivation increased by 62% in 2006, none of the farmers cultivated for the first time. Both in the Southern and Eastern Region, around 50% of the farmers started opium poppy cultivation before the year 2001.
Figure 28: Starting year of opium poppy cultivation by region (n=754)
0% 20% 40% 60% 80% 100%
Central
Eastern
North-Eastern
Northern
Southern
Western
Before 2001 2002 2003 2004 2005 2006
Under normal conditions, 3 people can harvest one jerib (0.19536 ha) of opium poppy in 21 days. Consequently, a total of 2.5 million of persons were needed to harvest the entire opium poppy cultivation in Afghanistan in 2006. The labour available in opium poppy cultivated families (448,000) was not sufficient to harvest the 165,000 ha of cultivation. Therefore, extra labour was
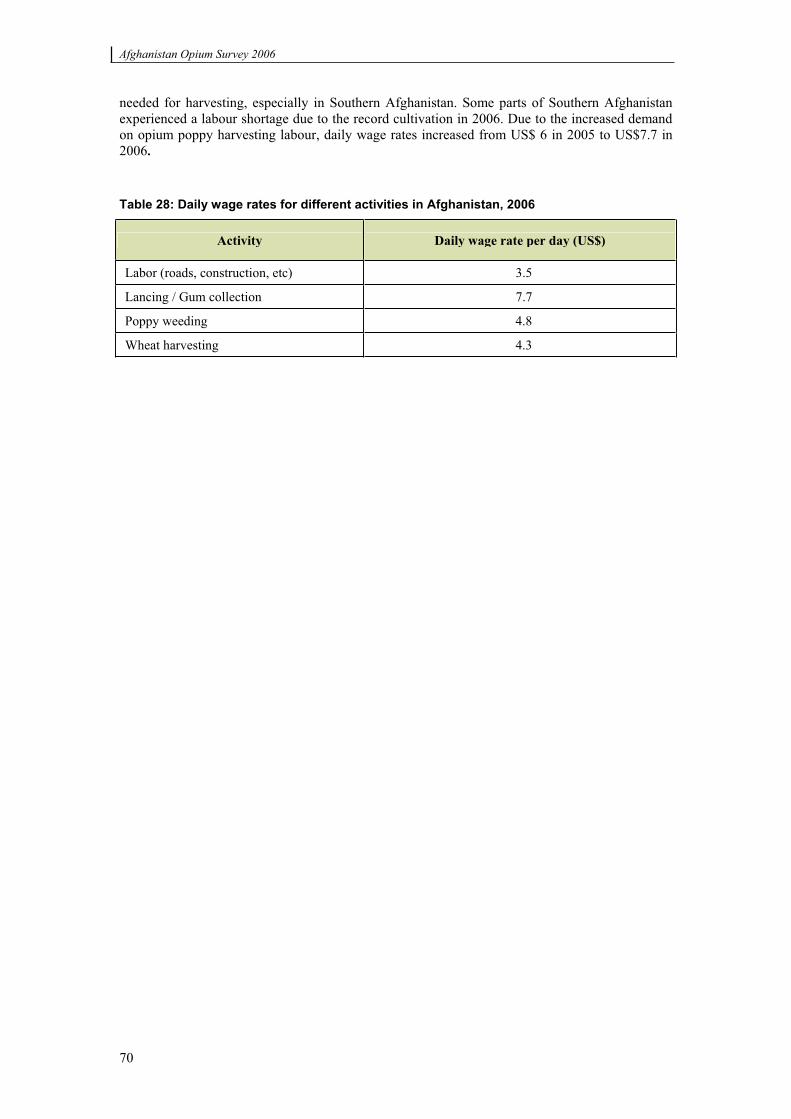
Afghanistan Opium Survey 2006
70
needed for harvesting, especially in Southern Afghanistan. Some parts of Southern Afghanistan experienced a labour shortage due to the record cultivation in 2006. Due to the increased demand on opium poppy harvesting labour, daily wage rates increased from US$ 6 in 2005 to US$7.7 in 2006.
Table 28: Daily wage rates for different activities in Afghanistan, 2006
Activity Daily wage rate per day (US$)
Labor (roads, construction, etc) 3.5
Lancing / Gum collection 7.7
Poppy weeding 4.8
Wheat harvesting 4.3
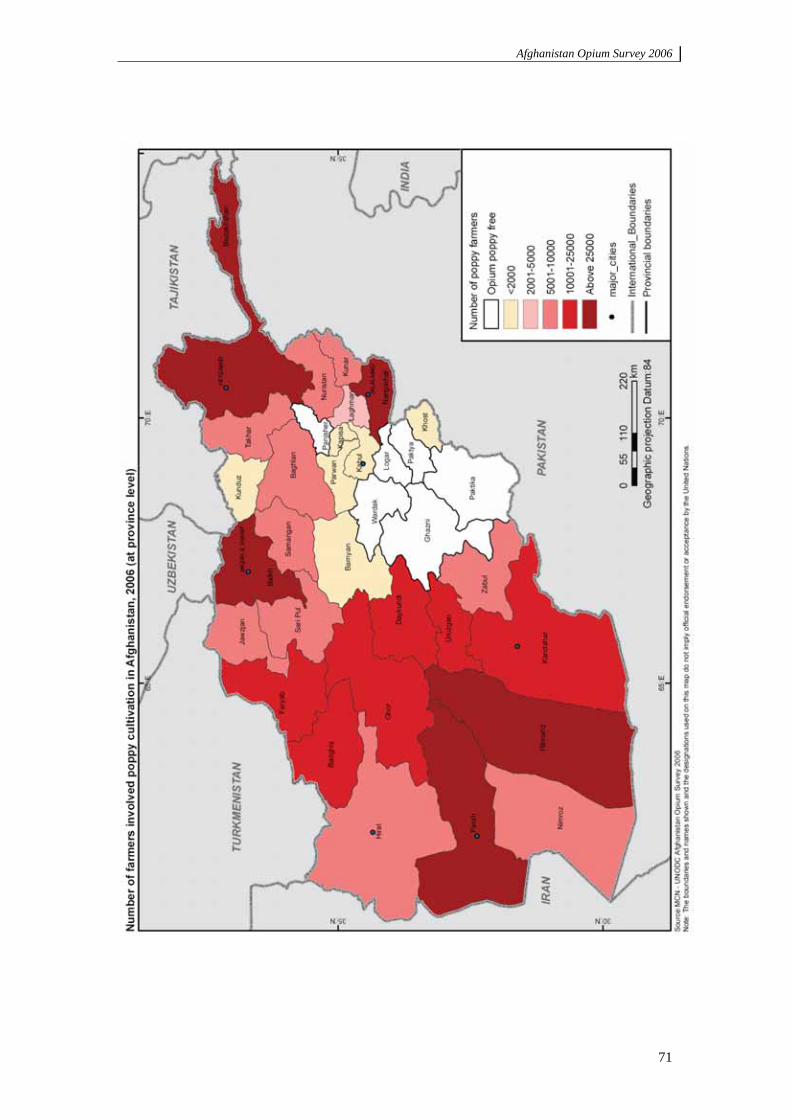
Afghanistan Opium Survey 2006
71
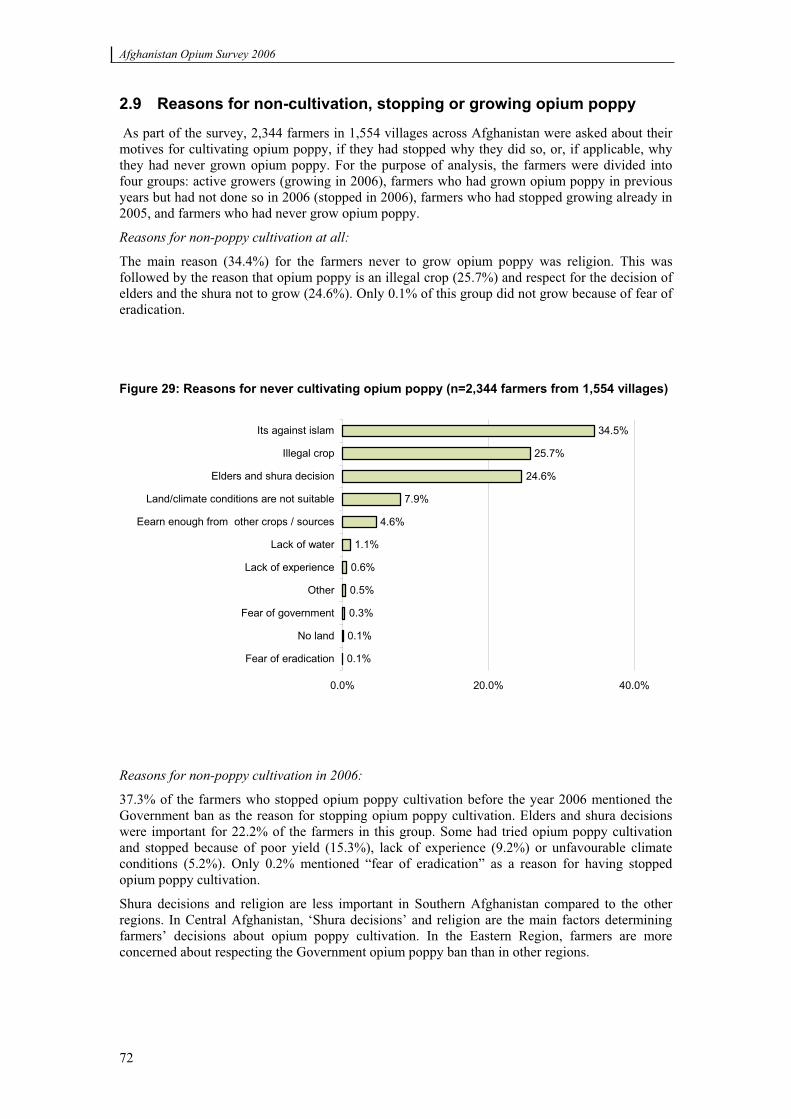
Afghanistan Opium Survey 2006
72
2.9 Reasons for non-cultivation, stopping or growing opium poppy
As part of the survey, 2,344 farmers in 1,554 villages across Afghanistan were asked about their motives for cultivating opium poppy, if they had stopped why they did so, or, if applicable, why they had never grown opium poppy. For the purpose of analysis, the farmers were divided into four groups: active growers (growing in 2006), farmers who had grown opium poppy in previous years but had not done so in 2006 (stopped in 2006), farmers who had stopped growing already in 2005, and farmers who had never grow opium poppy.
Reasons for non-poppy cultivation at all:
The main reason (34.4%) for the farmers never to grow opium poppy was religion. This was followed by the reason that opium poppy is an illegal crop (25.7%) and respect for the decision of elders and the shura not to grow (24.6%). Only 0.1% of this group did not grow because of fear of eradication.
Figure 29: Reasons for never cultivating opium poppy (n=2,344 farmers from 1,554 villages)
0.1%
0.1%
0.3%
0.5%
0.6%
1.1%
4.6%
7.9%
24.6%
25.7%
34.5%
0.0% 20.0% 40.0%
Fear of eradication
No land
Fear of government
Other
Lack of experience
Lack of water
Eearn enough from other crops / sources
Land/climate conditions are not suitable
Elders and shura decision
Illegal crop
Its against islam
Reasons for non-poppy cultivation in 2006:
37.3% of the farmers who stopped opium poppy cultivation before the year 2006 mentioned the Government ban as the reason for stopping opium poppy cultivation. Elders and shura decisions were important for 22.2% of the farmers in this group. Some had tried opium poppy cultivation and stopped because of poor yield (15.3%), lack of experience (9.2%) or unfavourable climate conditions (5.2%). Only 0.2% mentioned “fear of eradication” as a reason for having stopped opium poppy cultivation.
Shura decisions and religion are less important in Southern Afghanistan compared to the other regions. In Central Afghanistan, ‘Shura decisions’ and religion are the main factors determining farmers’ decisions about opium poppy cultivation. In the Eastern Region, farmers are more concerned about respecting the Government opium poppy ban than in other regions.
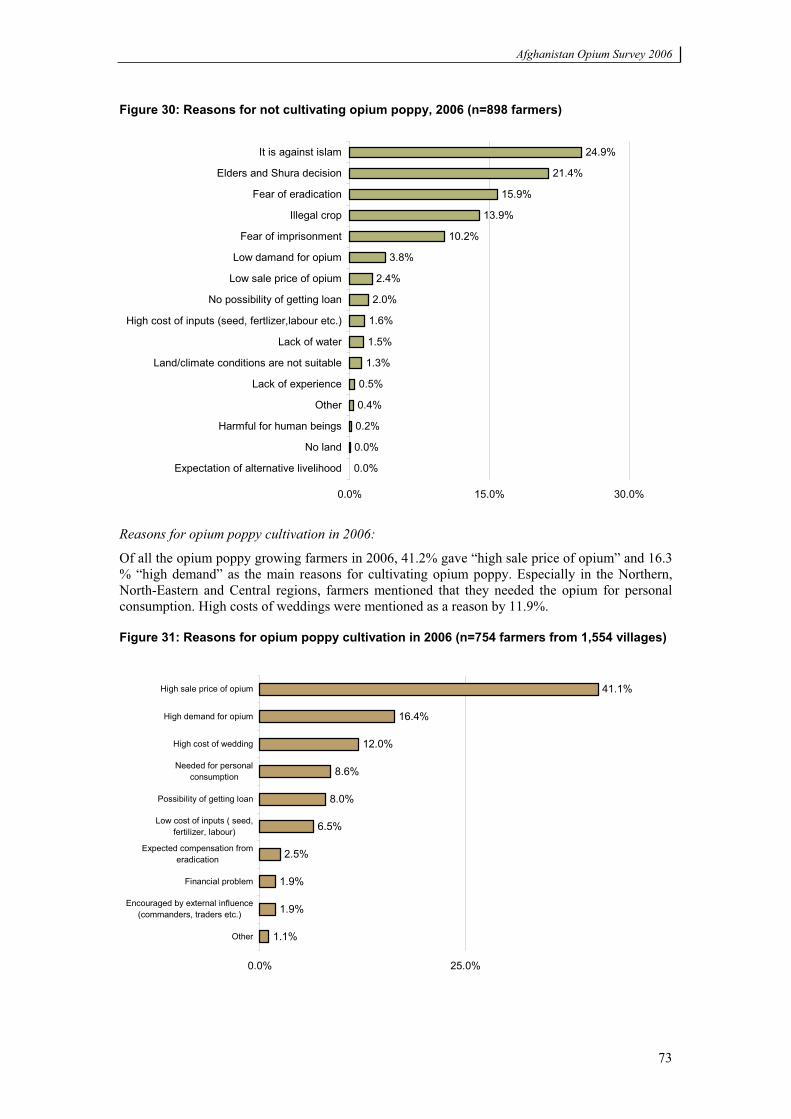
Afghanistan Opium Survey 2006
73
Figure 30: Reasons for not cultivating opium poppy, 2006 (n=898 farmers)
0.0%
0.0%
0.2%
0.4%
0.5%
1.3%
1.5%
1.6%
2.0%
2.4%
3.8%
10.2%
13.9%
15.9%
21.4%
24.9%
0.0% 15.0% 30.0%
Expectation of alternative livelihood
No land
Harmful for human beings
Other
Lack of experience
Land/climate conditions are not suitable
Lack of water
High cost of inputs (seed, fertlizer,labour etc.)
No possibility of getting loan
Low sale price of opium
Low damand for opium
Fear of imprisonment
Illegal crop
Fear of eradication
Elders and Shura decision
It is against islam
Reasons for opium poppy cultivation in 2006:
Of all the opium poppy growing farmers in 2006, 41.2% gave “high sale price of opium” and 16.3 % “high demand” as the main reasons for cultivating opium poppy. Especially in the Northern, North-Eastern and Central regions, farmers mentioned that they needed the opium for personal consumption. High costs of weddings were mentioned as a reason by 11.9%.
Figure 31: Reasons for opium poppy cultivation in 2006 (n=754 farmers from 1,554 villages)
1.1%
1.9%
1.9%
2.5%
6.5%
8.0%
8.6%
12.0%
16.4%
41.1%
0.0% 25.0%
Other
Encouraged by external influence(commanders, traders etc.)
Financial problem
Expected compensation fromeradication
Low cost of inputs ( seed,fertilizer, labour)
Possibility of getting loan
Needed for personalconsumption
High cost of wedding
High demand for opium
High sale price of opium
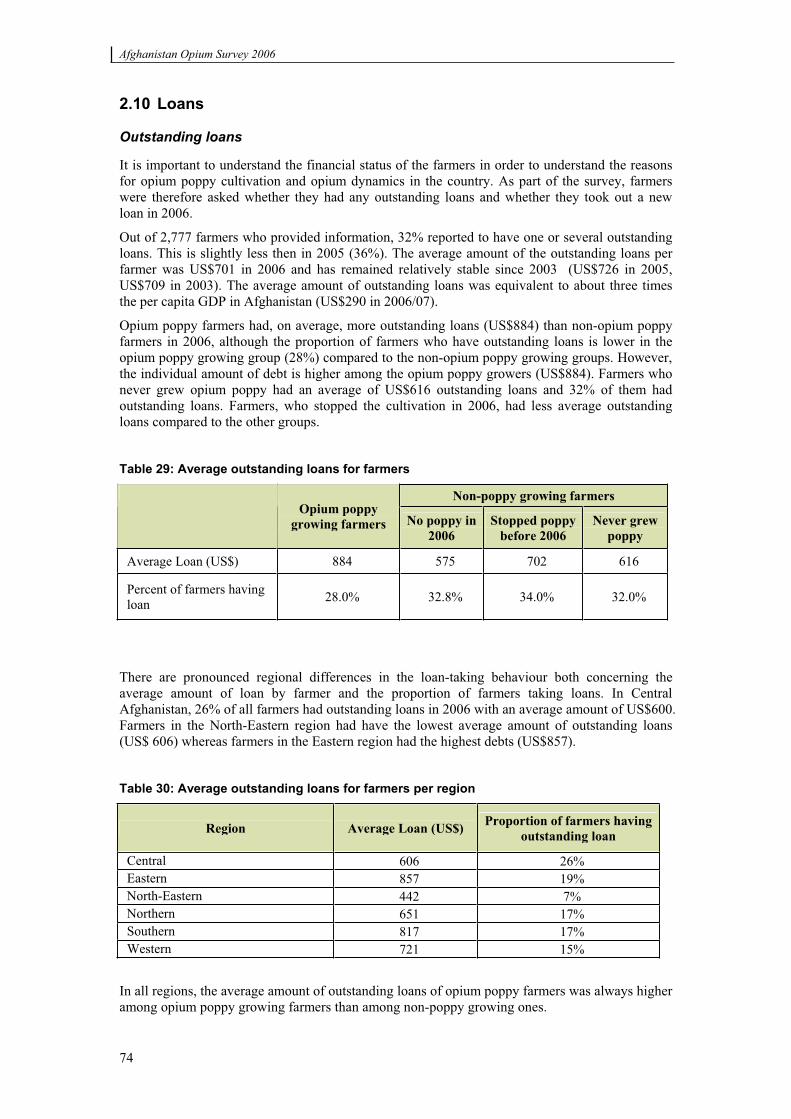
Afghanistan Opium Survey 2006
74
2.10 Loans
Outstanding loans
It is important to understand the financial status of the farmers in order to understand the reasons for opium poppy cultivation and opium dynamics in the country. As part of the survey, farmers were therefore asked whether they had any outstanding loans and whether they took out a new loan in 2006.
Out of 2,777 farmers who provided information, 32% reported to have one or several outstanding loans. This is slightly less then in 2005 (36%). The average amount of the outstanding loans per farmer was US$701 in 2006 and has remained relatively stable since 2003 (US$726 in 2005, US$709 in 2003). The average amount of outstanding loans was equivalent to about three times the per capita GDP in Afghanistan (US$290 in 2006/07).
Opium poppy farmers had, on average, more outstanding loans (US$884) than non-opium poppy farmers in 2006, although the proportion of farmers who have outstanding loans is lower in the opium poppy growing group (28%) compared to the non-opium poppy growing groups. However, the individual amount of debt is higher among the opium poppy growers (US$884). Farmers who never grew opium poppy had an average of US$616 outstanding loans and 32% of them had outstanding loans. Farmers, who stopped the cultivation in 2006, had less average outstanding loans compared to the other groups.
Table 29: Average outstanding loans for farmers
Non-poppy growing farmers Opium poppy
growing farmers No poppy in 2006
Stopped poppy before 2006
Never grew poppy
Average Loan (US$) 884 575 702 616
Percent of farmers having loan 28.0% 32.8% 34.0% 32.0%
There are pronounced regional differences in the loan-taking behaviour both concerning the average amount of loan by farmer and the proportion of farmers taking loans. In Central Afghanistan, 26% of all farmers had outstanding loans in 2006 with an average amount of US$600. Farmers in the North-Eastern region had have the lowest average amount of outstanding loans (US$ 606) whereas farmers in the Eastern region had the highest debts (US$857).
Table 30: Average outstanding loans for farmers per region
Region Average Loan (US$) Proportion of farmers having outstanding loan
Central 606 26% Eastern 857 19% North-Eastern 442 7% Northern 651 17% Southern 817 17% Western 721 15%
In all regions, the average amount of outstanding loans of opium poppy farmers was always higher among opium poppy growing farmers than among non-poppy growing ones.
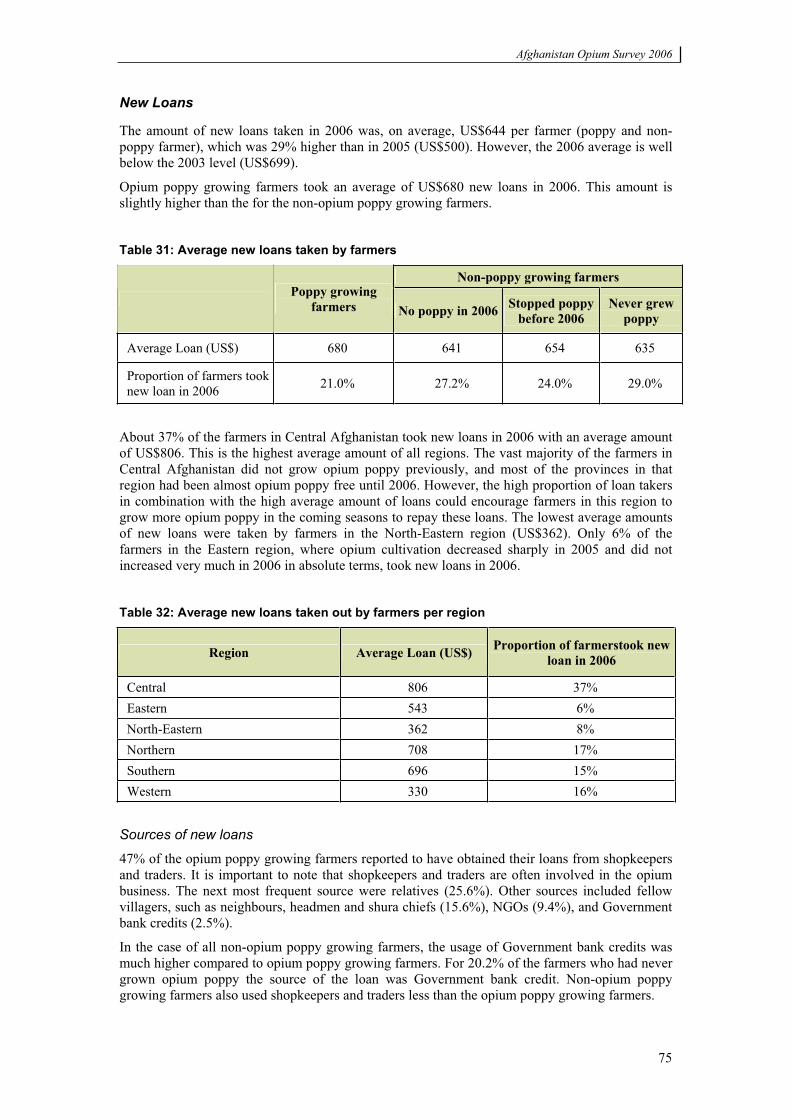
Afghanistan Opium Survey 2006
75
New Loans
The amount of new loans taken in 2006 was, on average, US$644 per farmer (poppy and non-poppy farmer), which was 29% higher than in 2005 (US$500). However, the 2006 average is well below the 2003 level (US$699).
Opium poppy growing farmers took an average of US$680 new loans in 2006. This amount is slightly higher than the for the non-opium poppy growing farmers.
Table 31: Average new loans taken by farmers
Non-poppy growing farmers Poppy growing
farmers No poppy in 2006 Stopped poppy before 2006
Never grew poppy
Average Loan (US$) 680 641 654 635
Proportion of farmers took new loan in 2006 21.0% 27.2% 24.0% 29.0%
About 37% of the farmers in Central Afghanistan took new loans in 2006 with an average amount of US$806. This is the highest average amount of all regions. The vast majority of the farmers in Central Afghanistan did not grow opium poppy previously, and most of the provinces in that region had been almost opium poppy free until 2006. However, the high proportion of loan takers in combination with the high average amount of loans could encourage farmers in this region to grow more opium poppy in the coming seasons to repay these loans. The lowest average amounts of new loans were taken by farmers in the North-Eastern region (US$362). Only 6% of the farmers in the Eastern region, where opium cultivation decreased sharply in 2005 and did not increased very much in 2006 in absolute terms, took new loans in 2006.
Table 32: Average new loans taken out by farmers per region
Region Average Loan (US$) Proportion of farmerstook new loan in 2006
Central 806 37% Eastern 543 6% North-Eastern 362 8% Northern 708 17% Southern 696 15% Western 330 16%
Sources of new loans
47% of the opium poppy growing farmers reported to have obtained their loans from shopkeepers and traders. It is important to note that shopkeepers and traders are often involved in the opium business. The next most frequent source were relatives (25.6%). Other sources included fellow villagers, such as neighbours, headmen and shura chiefs (15.6%), NGOs (9.4%), and Government bank credits (2.5%).
In the case of all non-opium poppy growing farmers, the usage of Government bank credits was much higher compared to opium poppy growing farmers. For 20.2% of the farmers who had never grown opium poppy the source of the loan was Government bank credit. Non-opium poppy growing farmers also used shopkeepers and traders less than the opium poppy growing farmers.
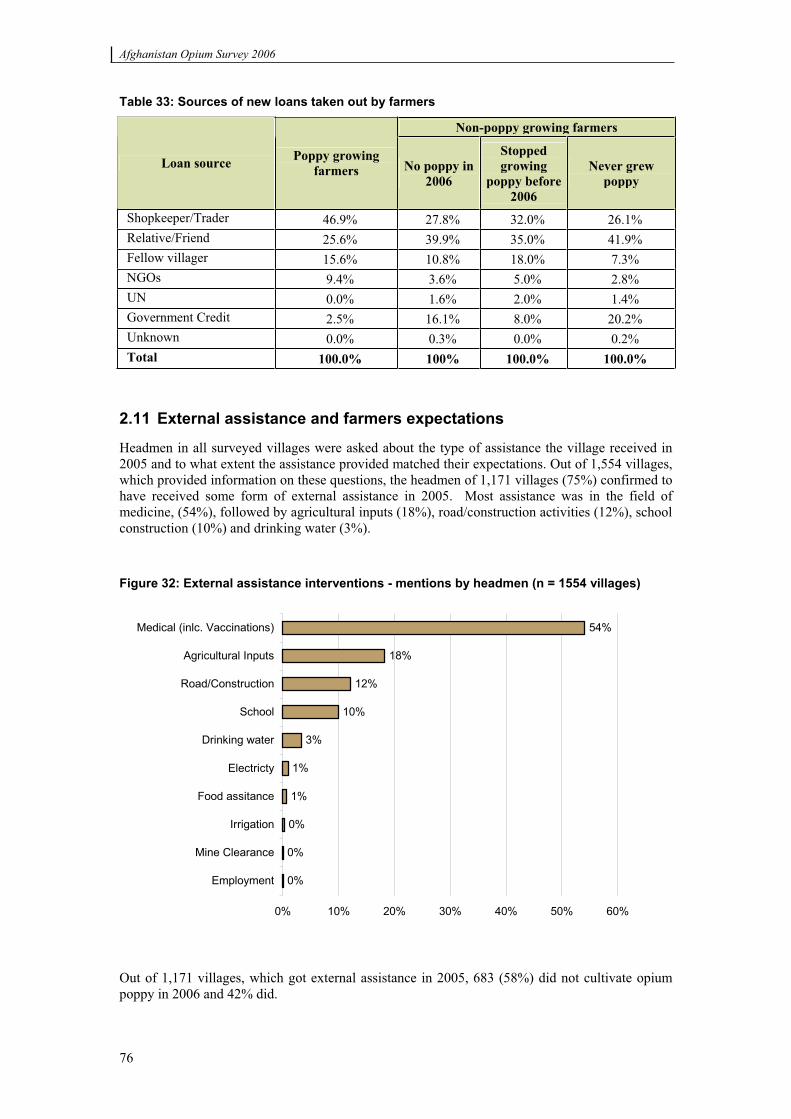
Afghanistan Opium Survey 2006
76
Table 33: Sources of new loans taken out by farmers
Non-poppy growing farmers
Loan source Poppy growing farmers No poppy in
2006
Stopped growing
poppy before 2006
Never grew poppy
Shopkeeper/Trader 46.9% 27.8% 32.0% 26.1% Relative/Friend 25.6% 39.9% 35.0% 41.9% Fellow villager 15.6% 10.8% 18.0% 7.3% NGOs 9.4% 3.6% 5.0% 2.8% UN 0.0% 1.6% 2.0% 1.4% Government Credit 2.5% 16.1% 8.0% 20.2% Unknown 0.0% 0.3% 0.0% 0.2% Total 100.0% 100% 100.0% 100.0%
2.11 External assistance and farmers expectations
Headmen in all surveyed villages were asked about the type of assistance the village received in 2005 and to what extent the assistance provided matched their expectations. Out of 1,554 villages, which provided information on these questions, the headmen of 1,171 villages (75%) confirmed to have received some form of external assistance in 2005. Most assistance was in the field of medicine, (54%), followed by agricultural inputs (18%), road/construction activities (12%), school construction (10%) and drinking water (3%).
Figure 32: External assistance interventions - mentions by headmen (n = 1554 villages)
0%
0%
0%
1%
1%
3%
10%
12%
18%
54%
0% 10% 20% 30% 40% 50% 60%
Employment
Mine Clearance
Irrigation
Food assitance
Electricty
Drinking water
School
Road/Construction
Agricultural Inputs
Medical (inlc. Vaccinations)
Out of 1,171 villages, which got external assistance in 2005, 683 (58%) did not cultivate opium poppy in 2006 and 42% did.
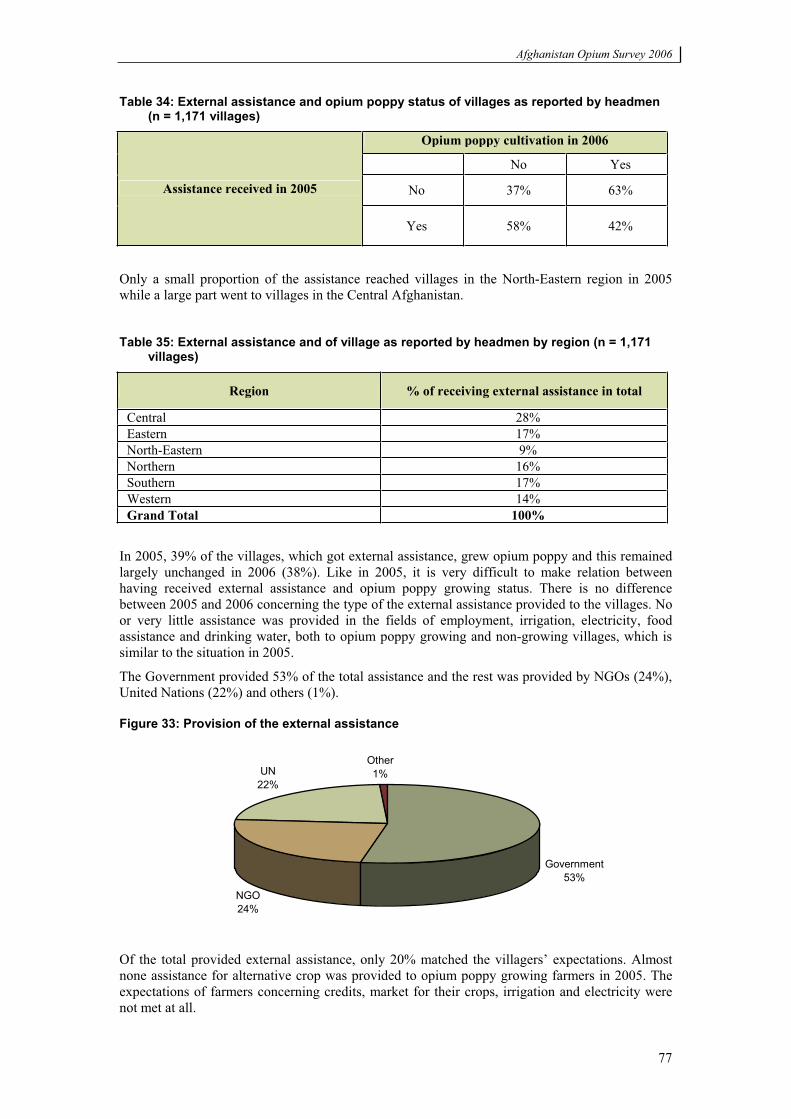
Afghanistan Opium Survey 2006
77
Table 34: External assistance and opium poppy status of villages as reported by headmen (n = 1,171 villages)
Opium poppy cultivation in 2006
No Yes
No 37% 63% Assistance received in 2005
Yes 58% 42%
Only a small proportion of the assistance reached villages in the North-Eastern region in 2005 while a large part went to villages in the Central Afghanistan.
Table 35: External assistance and of village as reported by headmen by region (n = 1,171 villages)
Region % of receiving external assistance in total
Central 28% Eastern 17% North-Eastern 9% Northern 16% Southern 17% Western 14% Grand Total 100%
In 2005, 39% of the villages, which got external assistance, grew opium poppy and this remained largely unchanged in 2006 (38%). Like in 2005, it is very difficult to make relation between having received external assistance and opium poppy growing status. There is no difference between 2005 and 2006 concerning the type of the external assistance provided to the villages. No or very little assistance was provided in the fields of employment, irrigation, electricity, food assistance and drinking water, both to opium poppy growing and non-growing villages, which is similar to the situation in 2005.
The Government provided 53% of the total assistance and the rest was provided by NGOs (24%), United Nations (22%) and others (1%).
Figure 33: Provision of the external assistance
Government53%
NGO24%
UN22%
Other1%
Of the total provided external assistance, only 20% matched the villagers’ expectations. Almost none assistance for alternative crop was provided to opium poppy growing farmers in 2005. The expectations of farmers concerning credits, market for their crops, irrigation and electricity were not met at all.
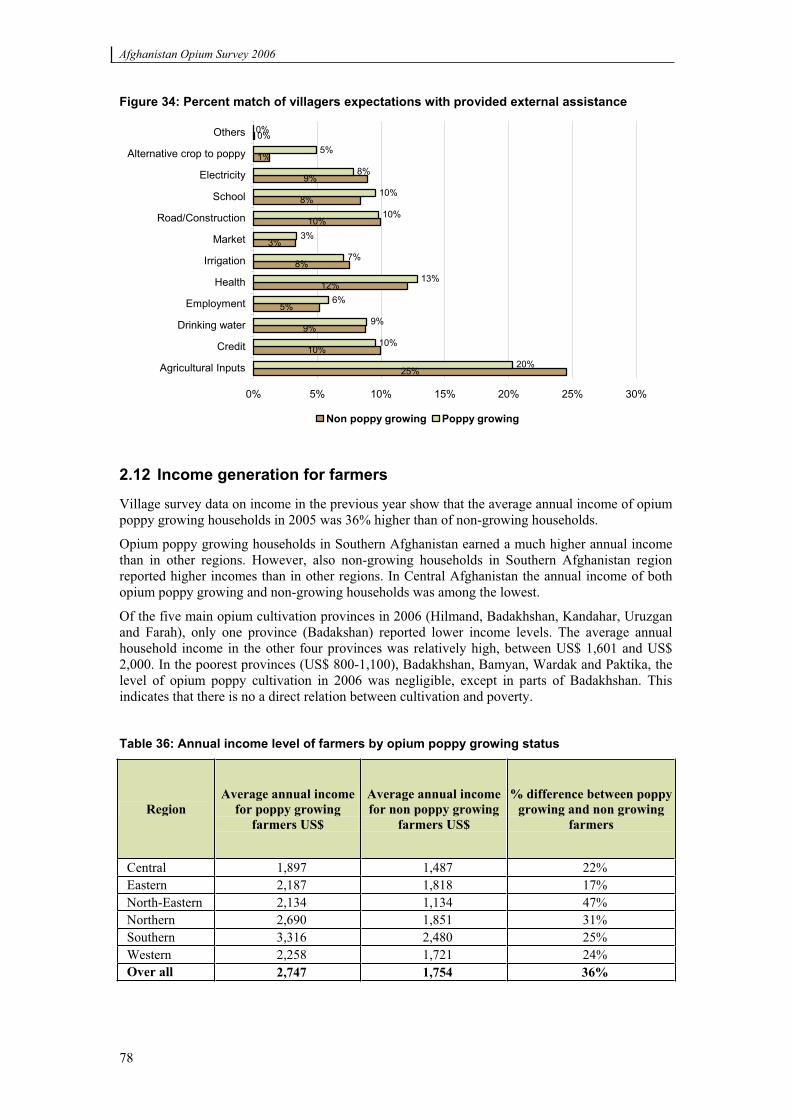
Afghanistan Opium Survey 2006
78
Figure 34: Percent match of villagers expectations with provided external assistance
25%
10%
9%
5%
12%
8%
3%
10%
8%
9%
1%
0%
20%
10%
9%
6%
13%
7%
3%
10%
10%
8%
5%
0%
0% 5% 10% 15% 20% 25% 30%
Agricultural Inputs
Credit
Drinking water
Employment
Health
Irrigation
Market
Road/Construction
School
Electricity
Alternative crop to poppy
Others
Non poppy growing Poppy growing
2.12 Income generation for farmers
Village survey data on income in the previous year show that the average annual income of opium poppy growing households in 2005 was 36% higher than of non-growing households.
Opium poppy growing households in Southern Afghanistan earned a much higher annual income than in other regions. However, also non-growing households in Southern Afghanistan region reported higher incomes than in other regions. In Central Afghanistan the annual income of both opium poppy growing and non-growing households was among the lowest.
Of the five main opium cultivation provinces in 2006 (Hilmand, Badakhshan, Kandahar, Uruzgan and Farah), only one province (Badakshan) reported lower income levels. The average annual household income in the other four provinces was relatively high, between US$ 1,601 and US$ 2,000. In the poorest provinces (US$ 800-1,100), Badakhshan, Bamyan, Wardak and Paktika, the level of opium poppy cultivation in 2006 was negligible, except in parts of Badakhshan. This indicates that there is no a direct relation between cultivation and poverty.
Table 36: Annual income level of farmers by opium poppy growing status
Region Average annual income
for poppy growing farmers US$
Average annual income for non poppy growing
farmers US$
% difference between poppygrowing and non growing
farmers
Central 1,897 1,487 22% Eastern 2,187 1,818 17% North-Eastern 2,134 1,134 47% Northern 2,690 1,851 31% Southern 3,316 2,480 25% Western 2,258 1,721 24% Over all 2,747 1,754 36%
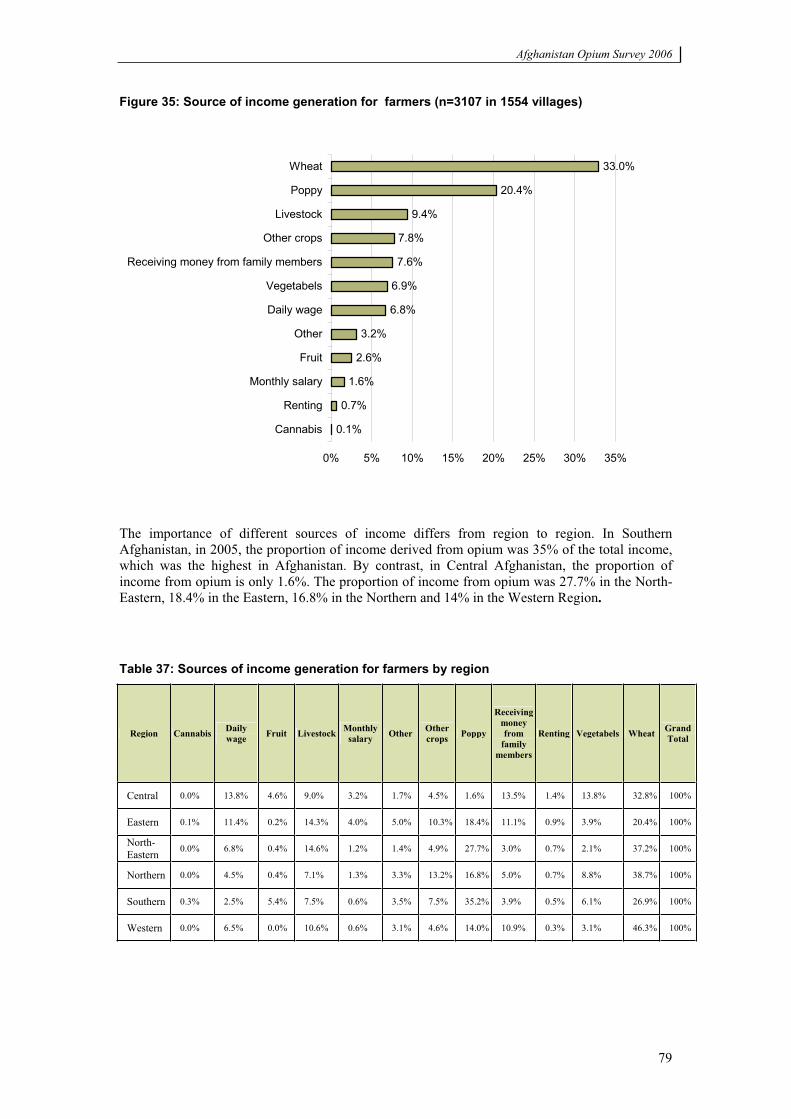
Afghanistan Opium Survey 2006
79
Figure 35: Source of income generation for farmers (n=3107 in 1554 villages)
0.1%
0.7%
1.6%
2.6%
3.2%
6.8%
6.9%
7.6%
7.8%
9.4%
20.4%
33.0%
0% 5% 10% 15% 20% 25% 30% 35%
Cannabis
Renting
Monthly salary
Fruit
Other
Daily wage
Vegetabels
Receiving money from family members
Other crops
Livestock
Poppy
Wheat
The importance of different sources of income differs from region to region. In Southern Afghanistan, in 2005, the proportion of income derived from opium was 35% of the total income, which was the highest in Afghanistan. By contrast, in Central Afghanistan, the proportion of income from opium is only 1.6%. The proportion of income from opium was 27.7% in the North-Eastern, 18.4% in the Eastern, 16.8% in the Northern and 14% in the Western Region.
Table 37: Sources of income generation for farmers by region
Region Cannabis Daily wage Fruit Livestock Monthly
salary Other Othercrops Poppy
Receiving money from
family members
Renting Vegetabels Wheat GrandTotal
Central 0.0% 13.8% 4.6% 9.0% 3.2% 1.7% 4.5% 1.6% 13.5% 1.4% 13.8% 32.8% 100%
Eastern 0.1% 11.4% 0.2% 14.3% 4.0% 5.0% 10.3% 18.4% 11.1% 0.9% 3.9% 20.4% 100%
North-Eastern 0.0% 6.8% 0.4% 14.6% 1.2% 1.4% 4.9% 27.7% 3.0% 0.7% 2.1% 37.2% 100%
Northern 0.0% 4.5% 0.4% 7.1% 1.3% 3.3% 13.2% 16.8% 5.0% 0.7% 8.8% 38.7% 100%
Southern 0.3% 2.5% 5.4% 7.5% 0.6% 3.5% 7.5% 35.2% 3.9% 0.5% 6.1% 26.9% 100%
Western 0.0% 6.5% 0.0% 10.6% 0.6% 3.1% 4.6% 14.0% 10.9% 0.3% 3.1% 46.3% 100%
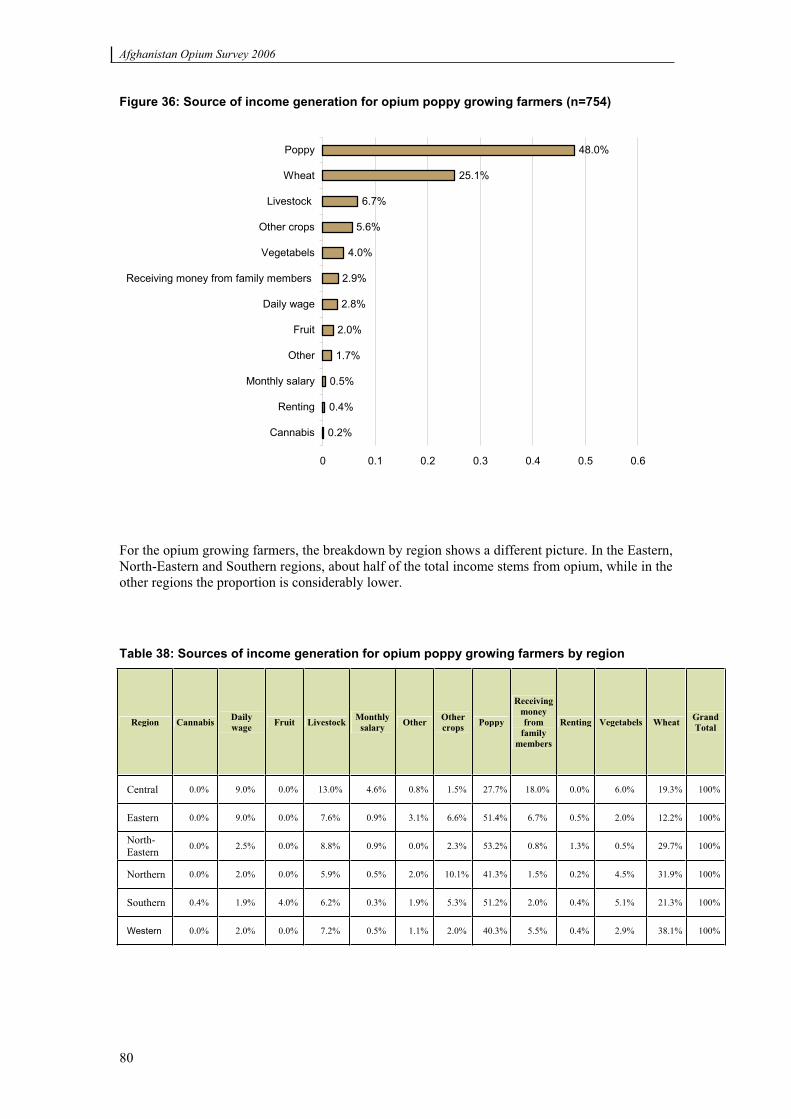
Afghanistan Opium Survey 2006
80
Figure 36: Source of income generation for opium poppy growing farmers (n=754)
0.2%
0.4%
0.5%
1.7%
2.0%
2.8%
2.9%
4.0%
5.6%
6.7%
25.1%
48.0%
0 0.1 0.2 0.3 0.4 0.5 0.6
Cannabis
Renting
Monthly salary
Other
Fruit
Daily wage
Receiving money from family members
Vegetabels
Other crops
Livestock
Wheat
Poppy
For the opium growing farmers, the breakdown by region shows a different picture. In the Eastern, North-Eastern and Southern regions, about half of the total income stems from opium, while in the other regions the proportion is considerably lower.
Table 38: Sources of income generation for opium poppy growing farmers by region
Region Cannabis Daily wage Fruit Livestock Monthly
salary Other Othercrops Poppy
Receiving money from
family members
Renting Vegetabels Wheat GrandTotal
Central 0.0% 9.0% 0.0% 13.0% 4.6% 0.8% 1.5% 27.7% 18.0% 0.0% 6.0% 19.3% 100%
Eastern 0.0% 9.0% 0.0% 7.6% 0.9% 3.1% 6.6% 51.4% 6.7% 0.5% 2.0% 12.2% 100%
North-Eastern 0.0% 2.5% 0.0% 8.8% 0.9% 0.0% 2.3% 53.2% 0.8% 1.3% 0.5% 29.7% 100%
Northern 0.0% 2.0% 0.0% 5.9% 0.5% 2.0% 10.1% 41.3% 1.5% 0.2% 4.5% 31.9% 100%
Southern 0.4% 1.9% 4.0% 6.2% 0.3% 1.9% 5.3% 51.2% 2.0% 0.4% 5.1% 21.3% 100%
Western 0.0% 2.0% 0.0% 7.2% 0.5% 1.1% 2.0% 40.3% 5.5% 0.4% 2.9% 38.1% 100%
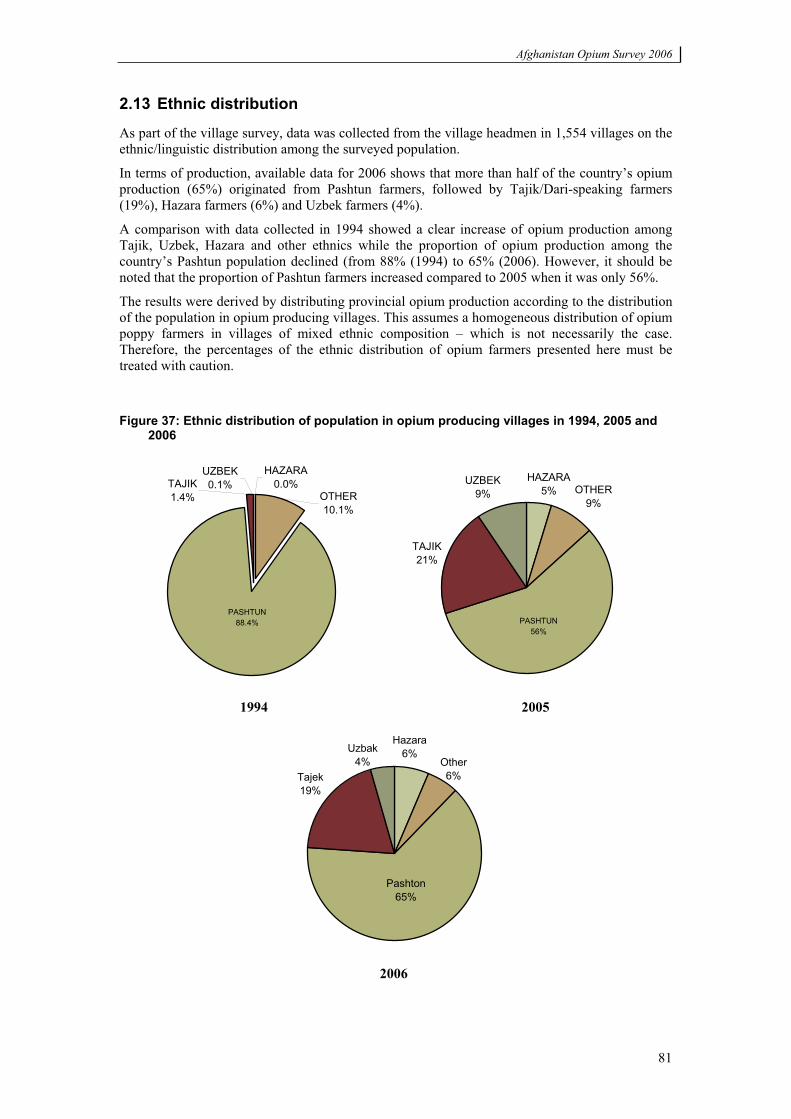
Afghanistan Opium Survey 2006
81
2.13 Ethnic distribution
As part of the village survey, data was collected from the village headmen in 1,554 villages on the ethnic/linguistic distribution among the surveyed population.
In terms of production, available data for 2006 shows that more than half of the country’s opium production (65%) originated from Pashtun farmers, followed by Tajik/Dari-speaking farmers (19%), Hazara farmers (6%) and Uzbek farmers (4%).
A comparison with data collected in 1994 showed a clear increase of opium production among Tajik, Uzbek, Hazara and other ethnics while the proportion of opium production among the country’s Pashtun population declined (from 88% (1994) to 65% (2006). However, it should be noted that the proportion of Pashtun farmers increased compared to 2005 when it was only 56%.
The results were derived by distributing provincial opium production according to the distribution of the population in opium producing villages. This assumes a homogeneous distribution of opium poppy farmers in villages of mixed ethnic composition – which is not necessarily the case. Therefore, the percentages of the ethnic distribution of opium farmers presented here must be treated with caution.
Figure 37: Ethnic distribution of population in opium producing villages in 1994, 2005 and 2006
PASHTUN88.4%
HAZARA0.0%
OTHER10.1%
TAJIK1.4%
UZBEK0.1%
HAZARA5% OTHER
9%
TAJIK21%
UZBEK9%
PASHTUN56%
1994 2005
Pashton65%
Other6%
Uzbak4%
Hazara6%
Tajek19%
2006
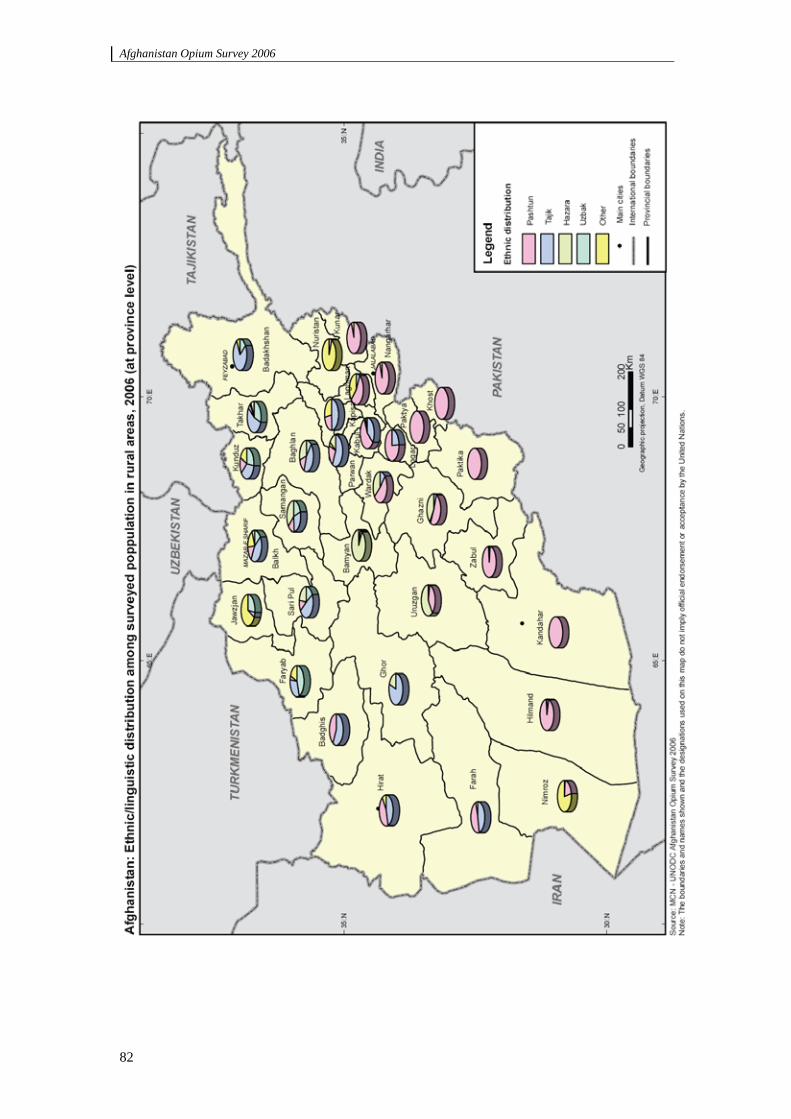
Afghanistan Opium Survey 2006
82
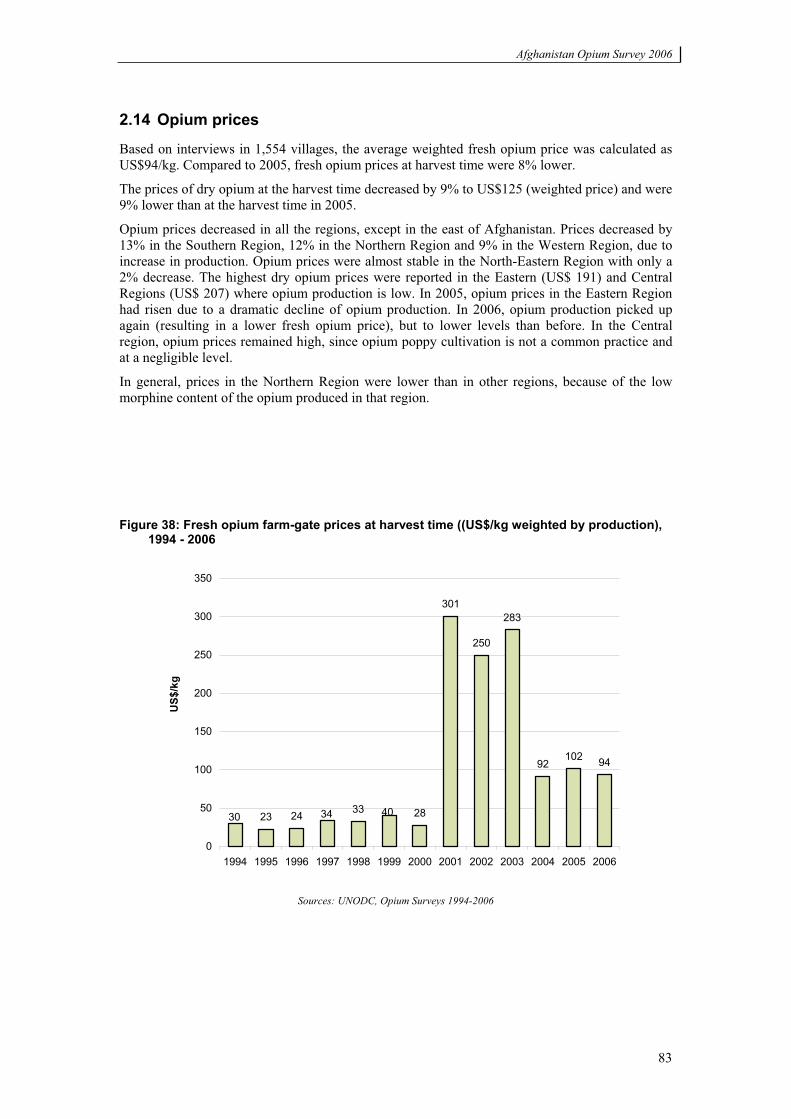
Afghanistan Opium Survey 2006
83
2.14 Opium prices
Based on interviews in 1,554 villages, the average weighted fresh opium price was calculated as US$94/kg. Compared to 2005, fresh opium prices at harvest time were 8% lower.
The prices of dry opium at the harvest time decreased by 9% to US$125 (weighted price) and were 9% lower than at the harvest time in 2005.
Opium prices decreased in all the regions, except in the east of Afghanistan. Prices decreased by 13% in the Southern Region, 12% in the Northern Region and 9% in the Western Region, due to increase in production. Opium prices were almost stable in the North-Eastern Region with only a 2% decrease. The highest dry opium prices were reported in the Eastern (US$ 191) and Central Regions (US$ 207) where opium production is low. In 2005, opium prices in the Eastern Region had risen due to a dramatic decline of opium production. In 2006, opium production picked up again (resulting in a lower fresh opium price), but to lower levels than before. In the Central region, opium prices remained high, since opium poppy cultivation is not a common practice and at a negligible level.
In general, prices in the Northern Region were lower than in other regions, because of the low morphine content of the opium produced in that region.
Figure 38: Fresh opium farm-gate prices at harvest time ((US$/kg weighted by production), 1994 - 2006
23 24 33 28
301
250
283
92102 94
30 34 40
0
50
100
150
200
250
300
350
1994 1995 1996 1997 1998 1999 2000 2001 2002 2003 2004 2005 2006
US$
/kg
Sources: UNODC, Opium Surveys 1994-2006
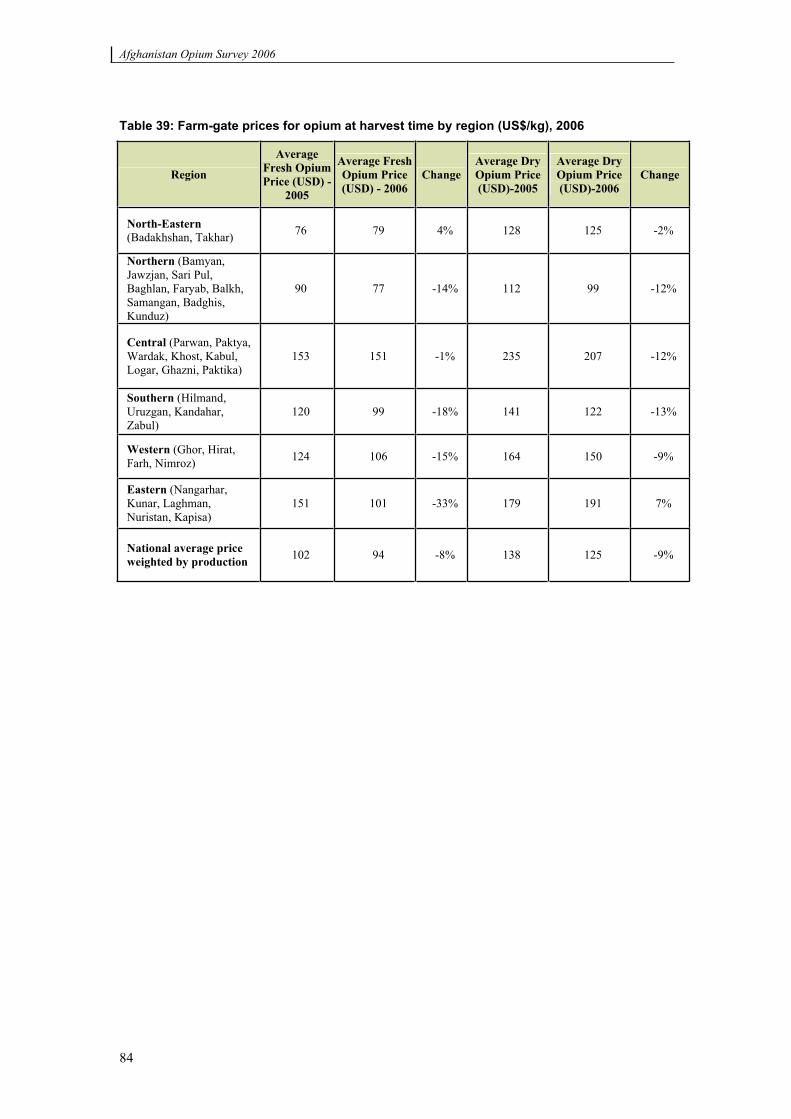
Afghanistan Opium Survey 2006
84
Table 39: Farm-gate prices for opium at harvest time by region (US$/kg), 2006
Region
AverageFresh Opium Price (USD) -
2005
Average Fresh Opium Price (USD) - 2006
ChangeAverage Dry Opium Price (USD)-2005
Average Dry Opium Price (USD)-2006
Change
North-Eastern(Badakhshan, Takhar) 76 79 4% 128 125 -2%
Northern (Bamyan, Jawzjan, Sari Pul, Baghlan, Faryab, Balkh, Samangan, Badghis, Kunduz)
90 77 -14% 112 99 -12%
Central (Parwan, Paktya, Wardak, Khost, Kabul, Logar, Ghazni, Paktika)
153 151 -1% 235 207 -12%
Southern (Hilmand, Uruzgan, Kandahar, Zabul)
120 99 -18% 141 122 -13%
Western (Ghor, Hirat, Farh, Nimroz) 124 106 -15% 164 150 -9%
Eastern (Nangarhar, Kunar, Laghman, Nuristan, Kapisa)
151 101 -33% 179 191 7%
National average price weighted by production 102 94 -8% 138 125 -9%
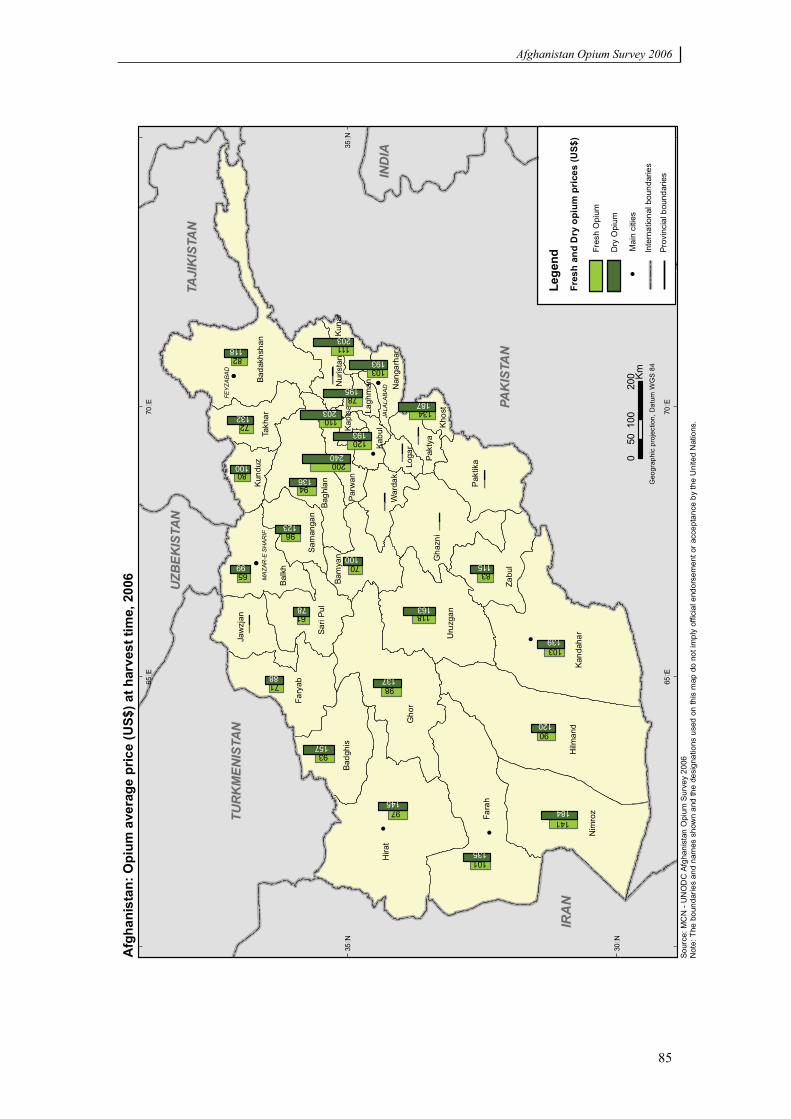
Afghanistan Opium Survey 2006
85
!
!
!
!
!
!!
!
!
!
IRA
NIR
AN
PAK
ISTA
NPA
KIS
TAN
IND
IAIN
DIA
TUR
KM
ENIS
TAN
TUR
KM
ENIS
TAN
TAJI
KIS
TAN
TAJI
KIS
TAN
UZB
EKIS
TAN
UZB
EKIS
TAN
FE
YZ
AB
AD
JA
LA
LA
BA
D
MA
ZA
R-E
SH
AR
IF
Hira
t
Fara
h
Gho
r
Hilm
and
Nim
roz
Kand
ahar
Bada
khsh
an
Uru
zgan
Gha
zni
Balk
h
Zabu
l
Fary
ab
Bagh
lan Pa
ktik
a
Badg
his
Sari
Pul
Takh
ar
Bam
yan
Jaw
zjan
Parw
an
War
dak
Nur
ista
n
Pakt
ya
Kund
uz
Sam
anga
n
Kuna
r
Kabu
l
Nan
garh
ar
Khos
t
Loga
r
Lagh
man
Kapi
sa
65�E
65�E
70�E
70�E
30�N
30�N
35�N
35�N
Afg
hani
stan
: Opi
um a
vera
ge p
rice
(US$
) at h
arve
st ti
me,
200
6
Sour
ce: M
CN
- U
NO
DC
Afg
hani
stan
Opi
um S
urve
y 20
06
Not
e: T
he b
ound
arie
s an
d na
mes
sho
wn
and
the
desi
gnat
ions
use
d on
this
map
do
not i
mpl
y of
ficia
l end
orse
men
t or a
ccep
tanc
e by
the
Uni
ted
Nat
ions
.
010
020
050
KmG
eogr
aphi
c pr
ojec
tion,
Dat
um W
GS
84
184141
11882
15793
13694
9965
10070
Lege
nd
Dry
Opi
um
Fres
h O
pium
Fres
h an
d D
ry o
pium
pri
ces
(US$
)
!M
ain
citie
s
Inte
rnat
iona
l bou
ndar
ies
Prov
inci
al b
ound
arie
s
135101
8871
13798
12090
14597
193120
139103
203110
187134
203111
10080
19578
193103
240200
12396
7861
13272
163118
11583
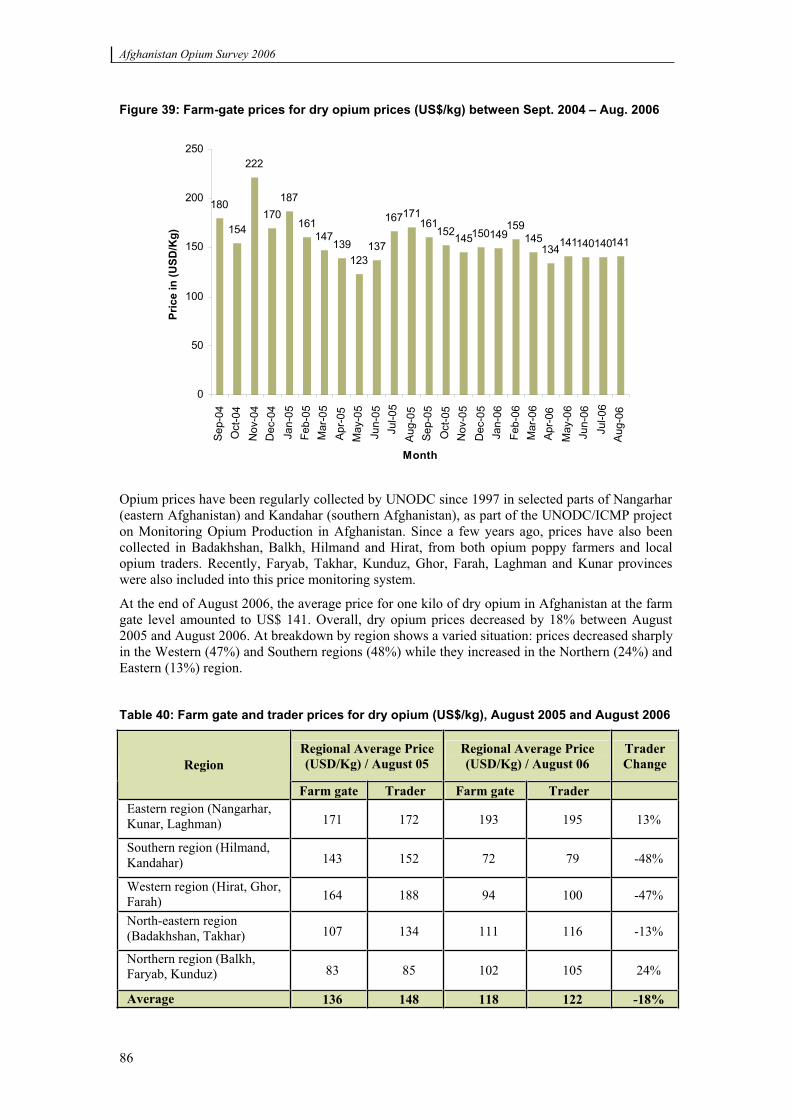
Afghanistan Opium Survey 2006
86
Figure 39: Farm-gate prices for dry opium prices (US$/kg) between Sept. 2004 – Aug. 2006
180
154
222
170187
161147
139123
137
167171161
152145150149159
145134141140140141
0
50
100
150
200
250
Sep-
04O
ct-0
4N
ov-0
4D
ec-0
4Ja
n-05
Feb-
05M
ar-0
5A
pr-0
5M
ay-0
5Ju
n-05
Jul-0
5A
ug-0
5Se
p-05
Oct
-05
Nov
-05
Dec
-05
Jan-
06Fe
b-06
Mar
-06
Apr
-06
May
-06
Jun-
06Ju
l-06
Aug
-06
Month
Pric
e in
(USD
/Kg)
Opium prices have been regularly collected by UNODC since 1997 in selected parts of Nangarhar (eastern Afghanistan) and Kandahar (southern Afghanistan), as part of the UNODC/ICMP project on Monitoring Opium Production in Afghanistan. Since a few years ago, prices have also been collected in Badakhshan, Balkh, Hilmand and Hirat, from both opium poppy farmers and local opium traders. Recently, Faryab, Takhar, Kunduz, Ghor, Farah, Laghman and Kunar provinces were also included into this price monitoring system.
At the end of August 2006, the average price for one kilo of dry opium in Afghanistan at the farm gate level amounted to US$ 141. Overall, dry opium prices decreased by 18% between August 2005 and August 2006. At breakdown by region shows a varied situation: prices decreased sharply in the Western (47%) and Southern regions (48%) while they increased in the Northern (24%) and Eastern (13%) region.
Table 40: Farm gate and trader prices for dry opium (US$/kg), August 2005 and August 2006
Regional Average Price (USD/Kg) / August 05
Regional Average Price (USD/Kg) / August 06
TraderChange Region
Farm gate Trader Farm gate TraderEastern region (Nangarhar, Kunar, Laghman) 171 172 193 195 13%
Southern region (Hilmand, Kandahar) 143 152 72 79 -48%
Western region (Hirat, Ghor, Farah) 164 188 94 100 -47%
North-eastern region (Badakhshan, Takhar) 107 134 111 116 -13%
Northern region (Balkh, Faryab, Kunduz) 83 85 102 105 24%
Average 136 148 118 122 -18%
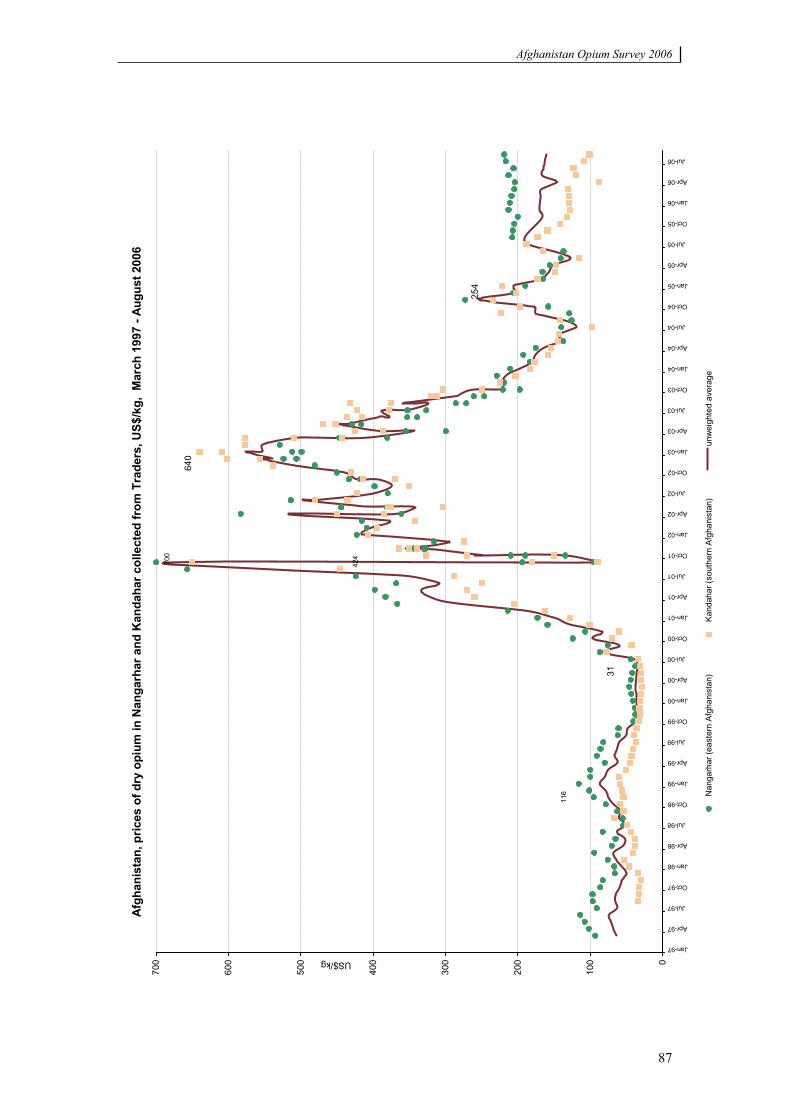
Afghanistan Opium Survey 2006
87
700
116
424
31
640
254
0
100
200
300
400
500
600
700
Jan-97
Apr-97
Jul-97
Oct-97
Jan-98
Apr-98
Jul-98
Oct-98
Jan-99
Apr-99
Jul-99
Oct-99
Jan-00
Apr-00
Jul-00
Oct-00
Jan-01
Apr-01
Jul-01
Oct-01
Jan-02
Apr-02
Jul-02
Oct-02
Jan-03
Apr-03
Jul-03
Oct-03
Jan-04
Apr-04
Jul-04
Oct-04
Jan-05
Apr-05
Jul-05
Oct-05
Jan-06
Apr-06
Jul-06
US$/kg
Nan
garh
ar (e
aste
rn A
fgha
nist
an)
Kan
daha
r (so
uthe
rn A
fgha
nist
an)
unw
eigh
ted
aver
age
Afgh
anis
tan,
pric
es o
f dry
opi
um in
Nan
garh
ar a
nd K
anda
har c
olle
cted
from
Tra
ders
, US$
/kg,
Mar
ch 1
997
- Aug
ust 2
006
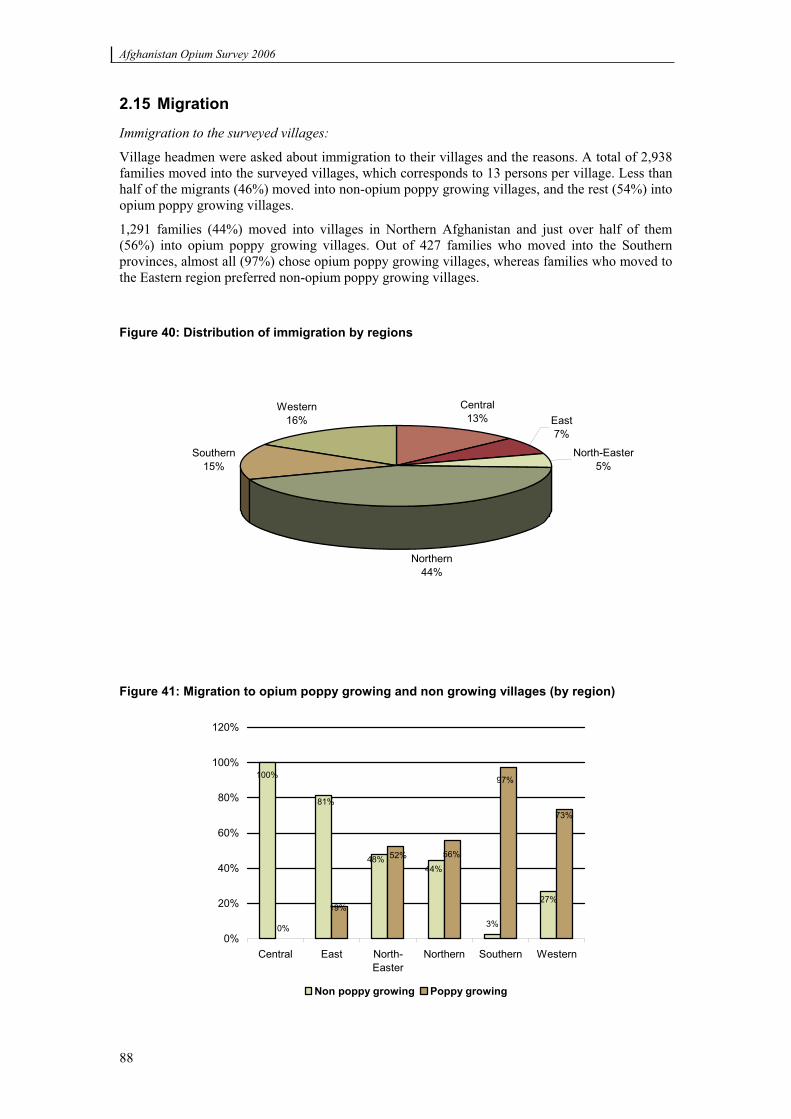
Afghanistan Opium Survey 2006
88
2.15 Migration
Immigration to the surveyed villages:
Village headmen were asked about immigration to their villages and the reasons. A total of 2,938 families moved into the surveyed villages, which corresponds to 13 persons per village. Less than half of the migrants (46%) moved into non-opium poppy growing villages, and the rest (54%) into opium poppy growing villages.
1,291 families (44%) moved into villages in Northern Afghanistan and just over half of them (56%) into opium poppy growing villages. Out of 427 families who moved into the Southern provinces, almost all (97%) chose opium poppy growing villages, whereas families who moved to the Eastern region preferred non-opium poppy growing villages.
Figure 40: Distribution of immigration by regions
Central13% East
7%
North-Easter5%
Northern44%
Southern15%
Western16%
Figure 41: Migration to opium poppy growing and non growing villages (by region)
3%0%
48%
81%
100%
44%
27%
52%
19%
56%
97%
73%
0%
20%
40%
60%
80%
100%
120%
Central East North-Easter
Northern Southern Western
Non poppy growing Poppy growing
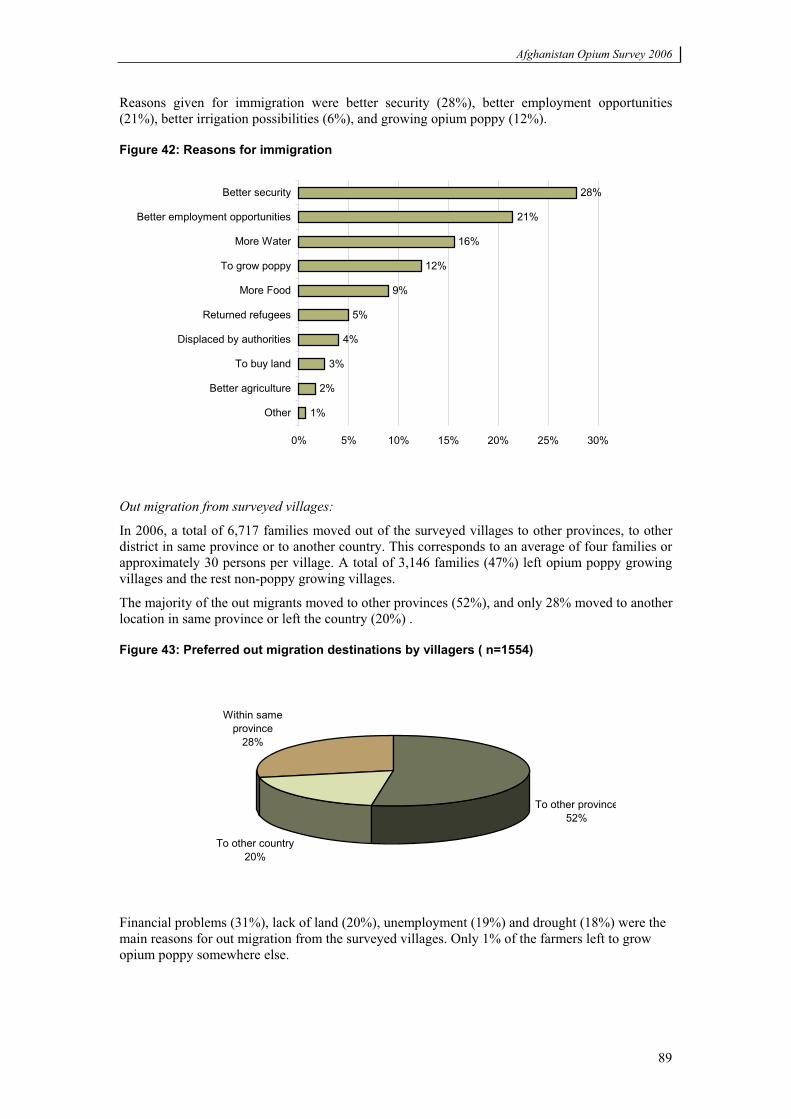
Afghanistan Opium Survey 2006
89
Reasons given for immigration were better security (28%), better employment opportunities (21%), better irrigation possibilities (6%), and growing opium poppy (12%).
Figure 42: Reasons for immigration
1%
2%
3%
4%
5%
9%
12%
16%
21%
28%
0% 5% 10% 15% 20% 25% 30%
Other
Better agriculture
To buy land
Displaced by authorities
Returned refugees
More Food
To grow poppy
More Water
Better employment opportunities
Better security
Out migration from surveyed villages:
In 2006, a total of 6,717 families moved out of the surveyed villages to other provinces, to other district in same province or to another country. This corresponds to an average of four families or approximately 30 persons per village. A total of 3,146 families (47%) left opium poppy growing villages and the rest non-poppy growing villages.
The majority of the out migrants moved to other provinces (52%), and only 28% moved to another location in same province or left the country (20%) .
Figure 43: Preferred out migration destinations by villagers ( n=1554)
To other province52%
To other country20%
Within same province
28%
Financial problems (31%), lack of land (20%), unemployment (19%) and drought (18%) were the main reasons for out migration from the surveyed villages. Only 1% of the farmers left to grow opium poppy somewhere else.
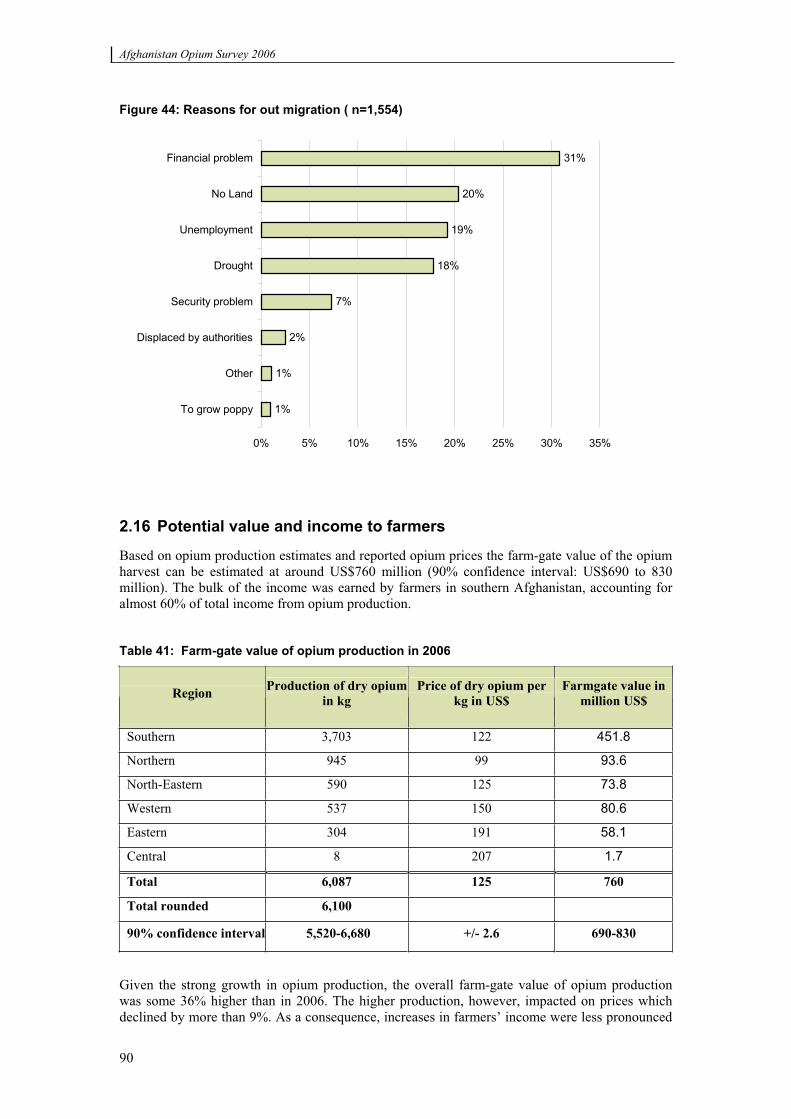
Afghanistan Opium Survey 2006
90
Figure 44: Reasons for out migration ( n=1,554)
1%
1%
2%
7%
18%
19%
20%
31%
0% 5% 10% 15% 20% 25% 30% 35%
To grow poppy
Other
Displaced by authorities
Security problem
Drought
Unemployment
No Land
Financial problem
2.16 Potential value and income to farmers
Based on opium production estimates and reported opium prices the farm-gate value of the opium harvest can be estimated at around US$760 million (90% confidence interval: US$690 to 830 million). The bulk of the income was earned by farmers in southern Afghanistan, accounting for almost 60% of total income from opium production.
Table 41: Farm-gate value of opium production in 2006
Region Production of dry opiumin kg
Price of dry opium per kg in US$
Farmgate value in million US$
Southern 3,703 122 451.8
Northern 945 99 93.6
North-Eastern 590 125 73.8
Western 537 150 80.6
Eastern 304 191 58.1
Central 8 207 1.7
Total 6,087 125 760
Total rounded 6,100
90% confidence interval 5,520-6,680 +/- 2.6 690-830
Given the strong growth in opium production, the overall farm-gate value of opium production was some 36% higher than in 2006. The higher production, however, impacted on prices which declined by more than 9%. As a consequence, increases in farmers’ income were less pronounced
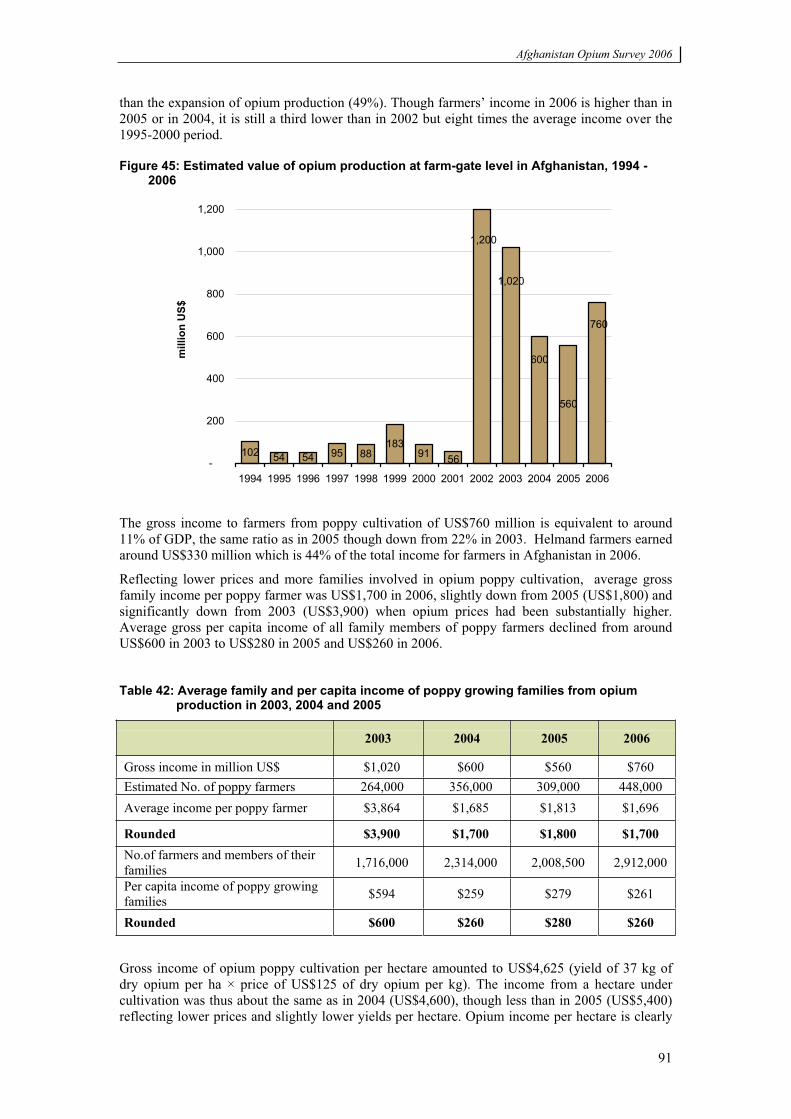
Afghanistan Opium Survey 2006
91
than the expansion of opium production (49%). Though farmers’ income in 2006 is higher than in 2005 or in 2004, it is still a third lower than in 2002 but eight times the average income over the 1995-2000 period.
Figure 45: Estimated value of opium production at farm-gate level in Afghanistan, 1994 - 2006
102 54 54 95 88183
91
560
760
600
1,020
56
1,200
-
200
400
600
800
1,000
1,200
1994 1995 1996 1997 1998 1999 2000 2001 2002 2003 2004 2005 2006
mill
ion
US$
The gross income to farmers from poppy cultivation of US$760 million is equivalent to around 11% of GDP, the same ratio as in 2005 though down from 22% in 2003. Helmand farmers earned around US$330 million which is 44% of the total income for farmers in Afghanistan in 2006.
Reflecting lower prices and more families involved in opium poppy cultivation, average gross family income per poppy farmer was US$1,700 in 2006, slightly down from 2005 (US$1,800) and significantly down from 2003 (US$3,900) when opium prices had been substantially higher. Average gross per capita income of all family members of poppy farmers declined from around US$600 in 2003 to US$280 in 2005 and US$260 in 2006.
Table 42: Average family and per capita income of poppy growing families from opium production in 2003, 2004 and 2005
2003 2004 2005 2006
Gross income in million US$ $1,020 $600 $560 $760 Estimated No. of poppy farmers 264,000 356,000 309,000 448,000 Average income per poppy farmer $3,864 $1,685 $1,813 $1,696
Rounded $3,900 $1,700 $1,800 $1,700 No.of farmers and members of their families 1,716,000 2,314,000 2,008,500 2,912,000
Per capita income of poppy growing families $594 $259 $279 $261
Rounded $600 $260 $280 $260
Gross income of opium poppy cultivation per hectare amounted to US$4,625 (yield of 37 kg of dry opium per ha × price of US$125 of dry opium per kg). The income from a hectare under cultivation was thus about the same as in 2004 (US$4,600), though less than in 2005 (US$5,400) reflecting lower prices and slightly lower yields per hectare. Opium income per hectare is clearly
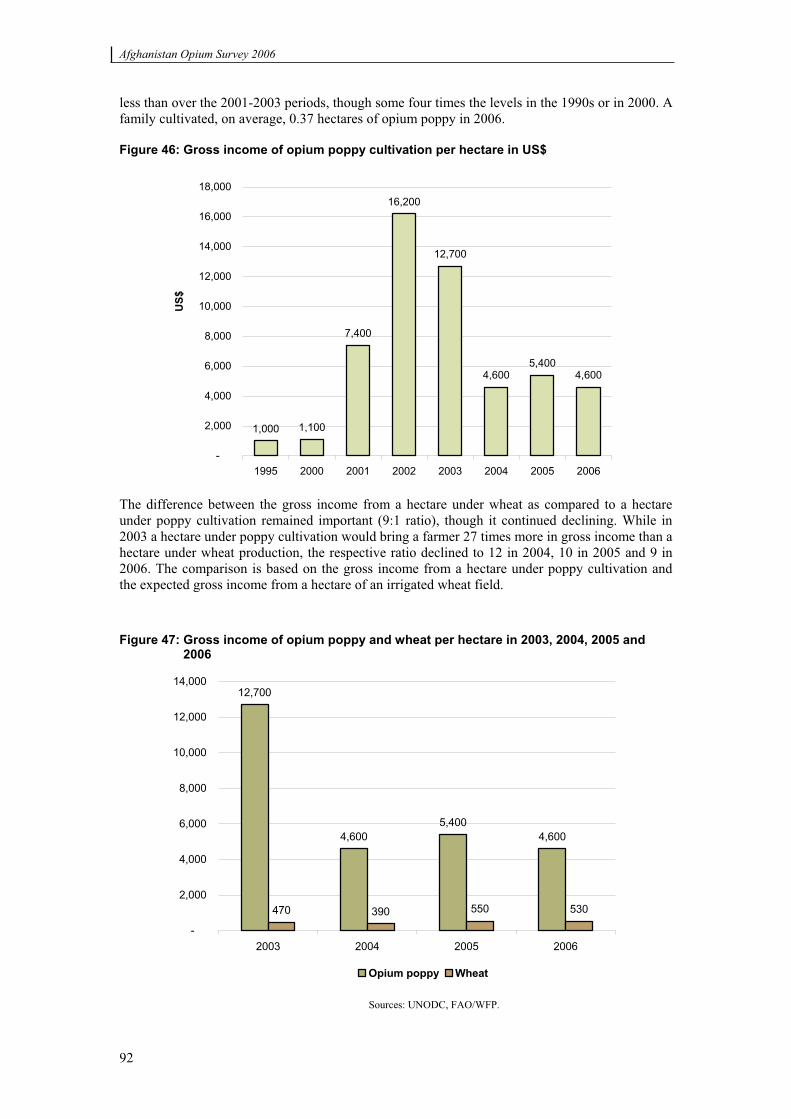
Afghanistan Opium Survey 2006
92
less than over the 2001-2003 periods, though some four times the levels in the 1990s or in 2000. A family cultivated, on average, 0.37 hectares of opium poppy in 2006.
Figure 46: Gross income of opium poppy cultivation per hectare in US$
1,000 1,100
7,400
16,200
12,700
4,6005,400
4,600
-
2,000
4,000
6,000
8,000
10,000
12,000
14,000
16,000
18,000
1995 2000 2001 2002 2003 2004 2005 2006
US$
The difference between the gross income from a hectare under wheat as compared to a hectare under poppy cultivation remained important (9:1 ratio), though it continued declining. While in 2003 a hectare under poppy cultivation would bring a farmer 27 times more in gross income than a hectare under wheat production, the respective ratio declined to 12 in 2004, 10 in 2005 and 9 in 2006. The comparison is based on the gross income from a hectare under poppy cultivation and the expected gross income from a hectare of an irrigated wheat field.
Figure 47: Gross income of opium poppy and wheat per hectare in 2003, 2004, 2005 and 2006
12,700
4,6005,400
4,600
470 390 550 530
-
2,000
4,000
6,000
8,000
10,000
12,000
14,000
2003 2004 2005 2006
Opium poppy Wheat
Sources: UNODC, FAO/WFP.
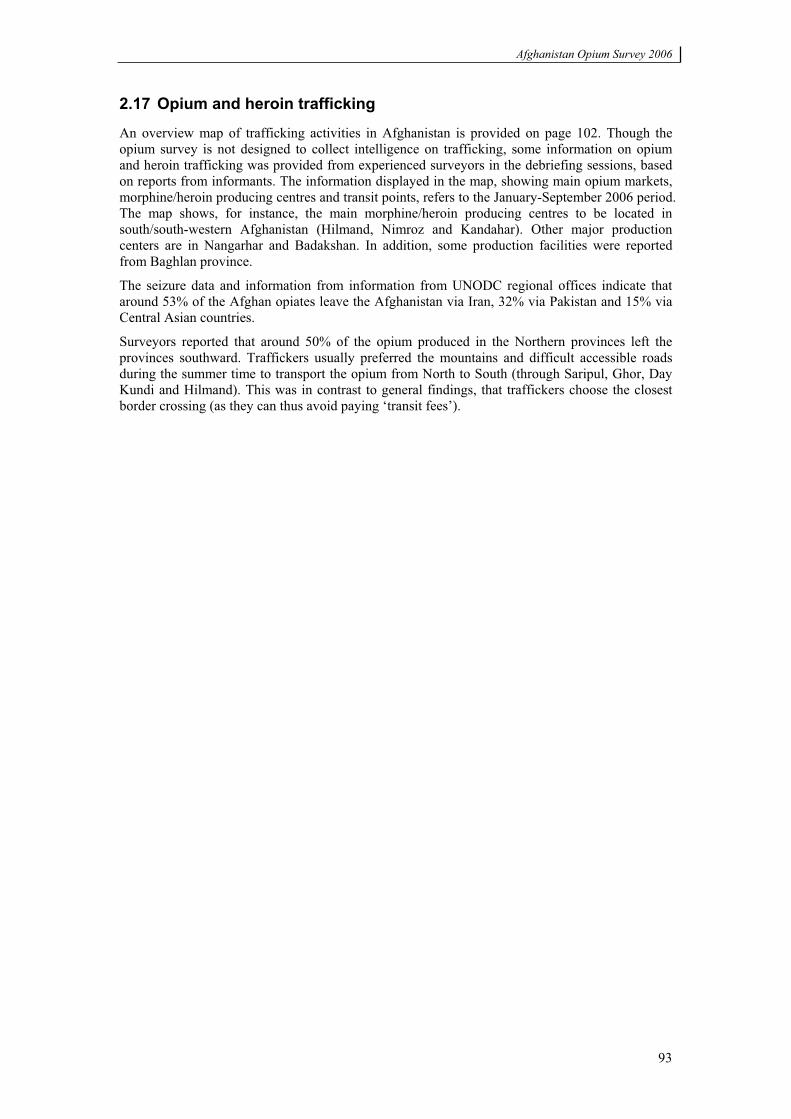
Afghanistan Opium Survey 2006
93
2.17 Opium and heroin trafficking
An overview map of trafficking activities in Afghanistan is provided on page 102. Though the opium survey is not designed to collect intelligence on trafficking, some information on opium and heroin trafficking was provided from experienced surveyors in the debriefing sessions, based on reports from informants. The information displayed in the map, showing main opium markets, morphine/heroin producing centres and transit points, refers to the January-September 2006 period. The map shows, for instance, the main morphine/heroin producing centres to be located in south/south-western Afghanistan (Hilmand, Nimroz and Kandahar). Other major production centers are in Nangarhar and Badakshan. In addition, some production facilities were reported from Baghlan province.
The seizure data and information from information from UNODC regional offices indicate that around 53% of the Afghan opiates leave the Afghanistan via Iran, 32% via Pakistan and 15% via Central Asian countries.
Surveyors reported that around 50% of the opium produced in the Northern provinces left the provinces southward. Traffickers usually preferred the mountains and difficult accessible roads during the summer time to transport the opium from North to South (through Saripul, Ghor, Day Kundi and Hilmand). This was in contrast to general findings, that traffickers choose the closest border crossing (as they can thus avoid paying ‘transit fees’).
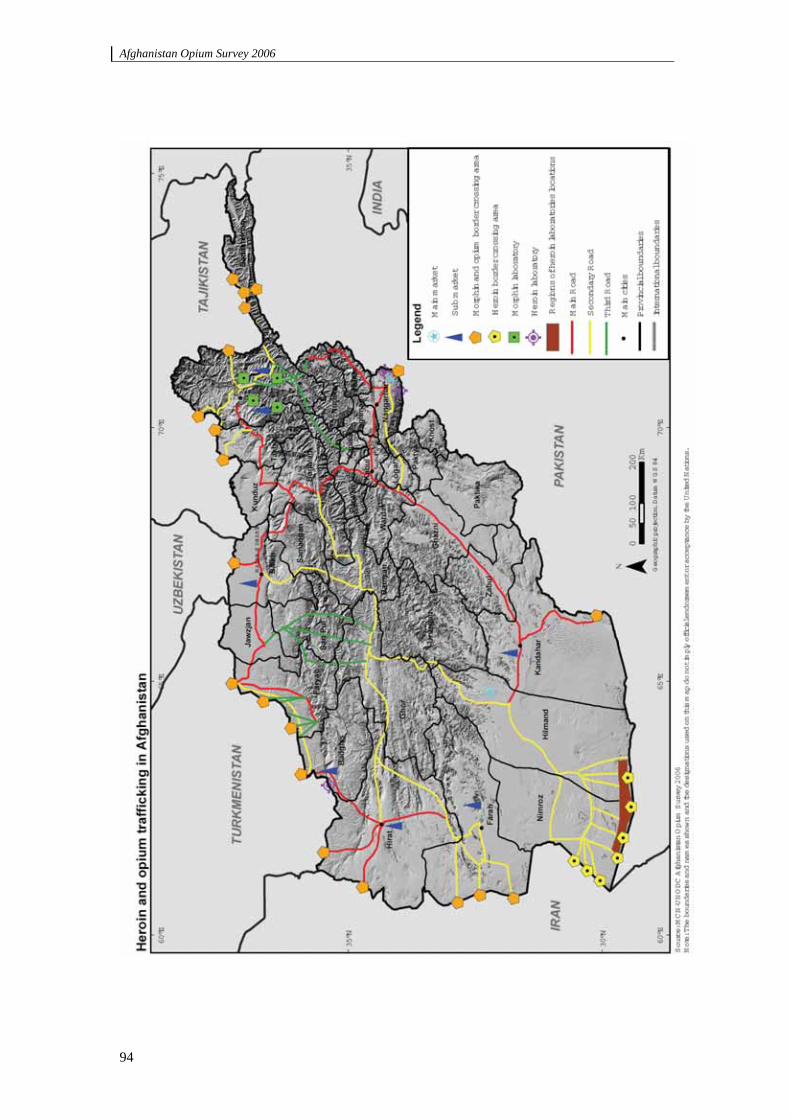
Afghanistan Opium Survey 2006
94
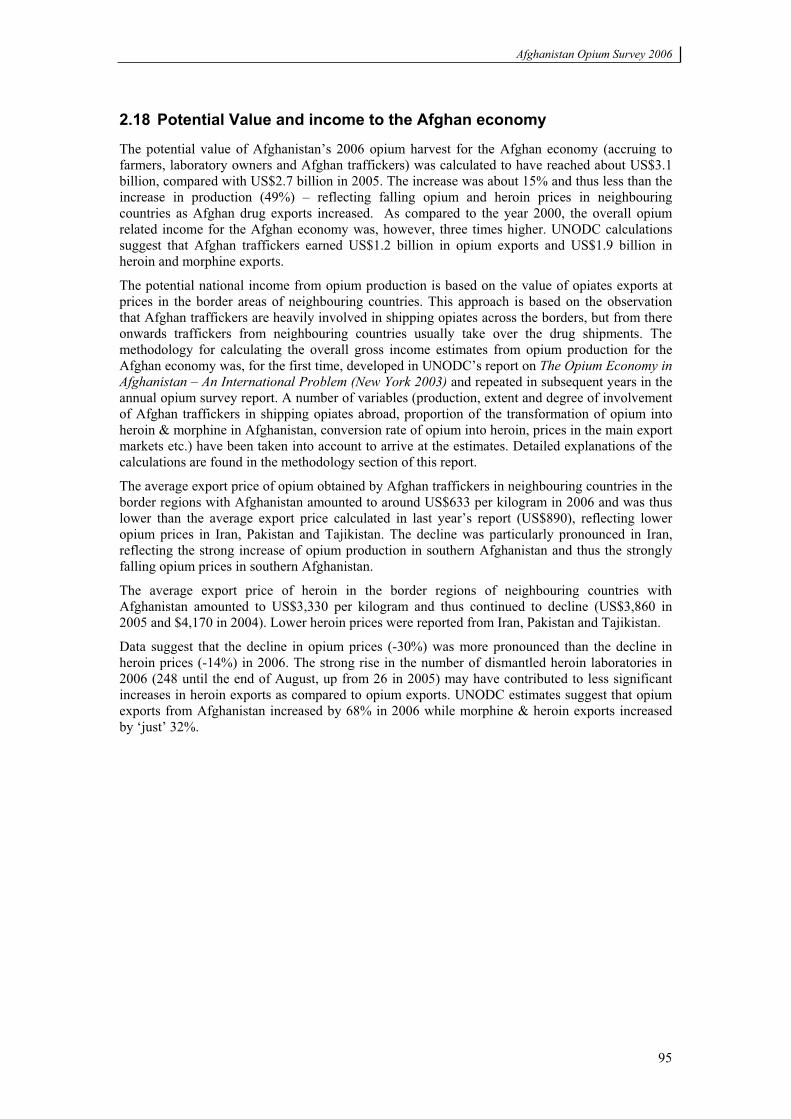
Afghanistan Opium Survey 2006
95
2.18 Potential Value and income to the Afghan economy
The potential value of Afghanistan’s 2006 opium harvest for the Afghan economy (accruing to farmers, laboratory owners and Afghan traffickers) was calculated to have reached about US$3.1 billion, compared with US$2.7 billion in 2005. The increase was about 15% and thus less than the increase in production (49%) – reflecting falling opium and heroin prices in neighbouring countries as Afghan drug exports increased. As compared to the year 2000, the overall opium related income for the Afghan economy was, however, three times higher. UNODC calculations suggest that Afghan traffickers earned US$1.2 billion in opium exports and US$1.9 billion in heroin and morphine exports.
The potential national income from opium production is based on the value of opiates exports at prices in the border areas of neighbouring countries. This approach is based on the observation that Afghan traffickers are heavily involved in shipping opiates across the borders, but from there onwards traffickers from neighbouring countries usually take over the drug shipments. The methodology for calculating the overall gross income estimates from opium production for the Afghan economy was, for the first time, developed in UNODC’s report on The Opium Economy in Afghanistan – An International Problem (New York 2003) and repeated in subsequent years in the annual opium survey report. A number of variables (production, extent and degree of involvement of Afghan traffickers in shipping opiates abroad, proportion of the transformation of opium into heroin & morphine in Afghanistan, conversion rate of opium into heroin, prices in the main export markets etc.) have been taken into account to arrive at the estimates. Detailed explanations of the calculations are found in the methodology section of this report.
The average export price of opium obtained by Afghan traffickers in neighbouring countries in the border regions with Afghanistan amounted to around US$633 per kilogram in 2006 and was thus lower than the average export price calculated in last year’s report (US$890), reflecting lower opium prices in Iran, Pakistan and Tajikistan. The decline was particularly pronounced in Iran, reflecting the strong increase of opium production in southern Afghanistan and thus the strongly falling opium prices in southern Afghanistan.
The average export price of heroin in the border regions of neighbouring countries with Afghanistan amounted to US$3,330 per kilogram and thus continued to decline (US$3,860 in 2005 and $4,170 in 2004). Lower heroin prices were reported from Iran, Pakistan and Tajikistan.
Data suggest that the decline in opium prices (-30%) was more pronounced than the decline in heroin prices (-14%) in 2006. The strong rise in the number of dismantled heroin laboratories in 2006 (248 until the end of August, up from 26 in 2005) may have contributed to less significant increases in heroin exports as compared to opium exports. UNODC estimates suggest that opium exports from Afghanistan increased by 68% in 2006 while morphine & heroin exports increased by ‘just’ 32%.
Afghanistan Opium Survey 2006
96
Figure 48: Potential income from opium production, 2000-2006 (gross income for farmers and Afghan traffickers)
0.9
2.52.3
2.8 2.7
3.1
0.0
0.5
1.0
1.5
2.0
2.5
3.0
3.5
2000 2002 2003 2004 2005 2006
US$
bill
ion
Sources: UNODC, The Opium Economy in Afghanistan, UNODC, Afghanistan Opium Survey 2003, 2004 and 2005.
Expressed as a percentage of licit GDP (US$6.7 billion in 2005/6), the overall potential value-added of the opium sector for Afghanistan in 2006 is estimated to have been equivalent to 46% of licit GDP or 32% of the overall economy, if the opium sector is included in the economy. Given the strong growth of licit GDP, the overall size of the illicit opium industry in Afghanistan, declined, however, from 61% of licit GDP in 2004 to 52% in 2005 and 46% of licit GDP in 2006.
The main beneficiaries from opium production in Afghanistan have been - once again - the drug traffickers. About 76% of the total incomes from Afghanistan’s opium economy were reaped by traffickers (including laboratory owners) and 24% by farmers. Income of farmers increased, however, stronger in 2006 (36%) than the income of traffickers (9%) which rose from US$2.14 billion in 2005 to US$2.34 billion in 2006, equivalent to 35% of licit GDP in 2006 and down from 41% of GDP in 2005. Nonetheless, these are still substantial amounts in the hands of the war lords and organized crime which – in cooperation with the insurgency - have the potential to destabilize the country.
Figure 49: The licit economy and the opiate industry in Afghanistan in 2006
TraffickersUS$2.34
billion24%
2005/6 GDP US$6.7 billion68%
FarmersUS$0.76
billion 8%
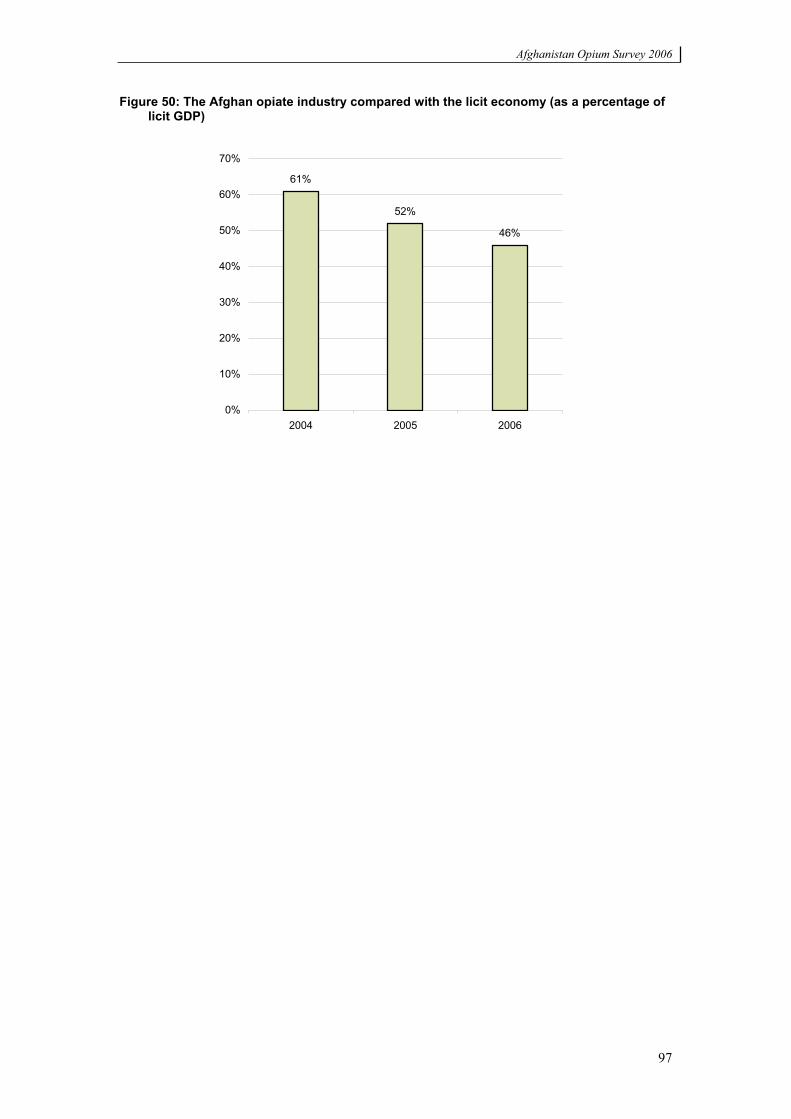
Afghanistan Opium Survey 2006
97
Figure 50: The Afghan opiate industry compared with the licit economy (as a percentage of licit GDP)
46%
61%
52%
0%
10%
20%
30%
40%
50%
60%
70%
2004 2005 2006

Afghanistan Opium Survey 2006
99
3 METHODOLOGY
This chapter covers various methodological aspects such as estimations of the extent of opium poppy cultivation, opium yield and production, opium prices and the opium poppy growth calendar. It also covers socio-economic aspects such as the number of families involved in opium poppy cultivation, reasons for cultivation/non-cultivation of opium poppy and the income from opium to farmers and traffickers. The survey methodology was based on a sampling approach that combined the use of satellite imagery and extensive field visits.
UNODC has a cooperation agreement with the National Soil Resource Institute, Cranfield University (United Kingdom) to develop new survey techniques and to improve the survey methodology. As a result of this cooperation, the ‘bootstrap’ technique was introduced for the first time in 2004 for calculation of the variance of the cultivation estimates. In addition to this, a national sampling frame (10x10 km grids for entire Afghanistan) was introduced to the survey, instead of provincial sampling frames. In 2005, a “bias correction” method was introduced to further improve the opium poppy area estimates. The bias correction method makes use of ground reference data to calibrate the estimates from the satellite imagery. In 2006, a trial was conducted with the so-called Frame Sampling Tools (FST) methodology for opium cultivation estimation was assessed for in 5 provinces, namely Helmand, Kandahar, Nimroz, Farah and Balkh.
3.1 Opium Poppy Cultivation
A remote sensing approach has been used by UNODC since 2002 to monitor the extent of opium poppy cultivation in the main opium poppy growing areas of Afghanistan, because satellite imagery supported with good ground reference information offers a reliable and efficient tool for the estimation of opium poppy cultivation and minimizes the security problems faced by the surveyors in the field.
In 2006, a total of 210 high-resolution satellite images were acquired for 105 sample locations covering 19 provinces. These images covered 16% of the total agricultural land in these 19 provinces. This is an increase of satellite coverage compared to 2005 and 2004. In 2005, 190 images at 79 sample locations were processed to cover 15 provinces accounting for 214,000 ha agricultural land, whereas in 2004, only 112 images at 56 sample locations were processed to cover 10 provinces accounting for 131,000 ha agricultural land. The nineteen provinces surveyed in 2006 using satellite data accounted for 95% of the opium poppy cultivation of the country. In the remaining 15 provinces, opium poppy cultivation was estimated from the surveyors’ assessment of the extent of opium cultivation in sampled villages.
Establishment of the sampling frame for satellite image selection
The sampling frame was established by extracting the potential land available for opium poppy cultivation in 19 provinces. The arable land was delineated from 2002 and 2003 Landsat-7 images. The arable land in the sampling frame covers mostly irrigated areas, except in Badakshan province, where rain-fed land is also included. The total arable land in the 20 provinces amounted to 16,486 km2 (or 1,648,680 ha), which is equivalent to 37% of the total irrigated agricultural area in Afghanistan. Land use maps of Hilmand, Kandahar, Balkh, Farah, Uruzgan and Nangarhar provinces were updated using SPOT imagery (10m resolution) of 2005.
The area under opium poppy cultivation was interpreted based on high-resolution IKONOS (10x010 km) and Quickbird (8x8 km) satellite images. The IKONOS image locations were randomly selected from a 10x10 km grid that was overlaid on the map of arable land. Cells with less than 1% arable land were removed in order to cover the maximum arable land with a minimum number of cells. The final sampling frame consisted of 1,828 cells in 19 provinces. Optimizing the sampling frame reduces the probability of selecting a cell containing marginal areas of arable land, which ensures optimal use of the high-resolution satellite images.
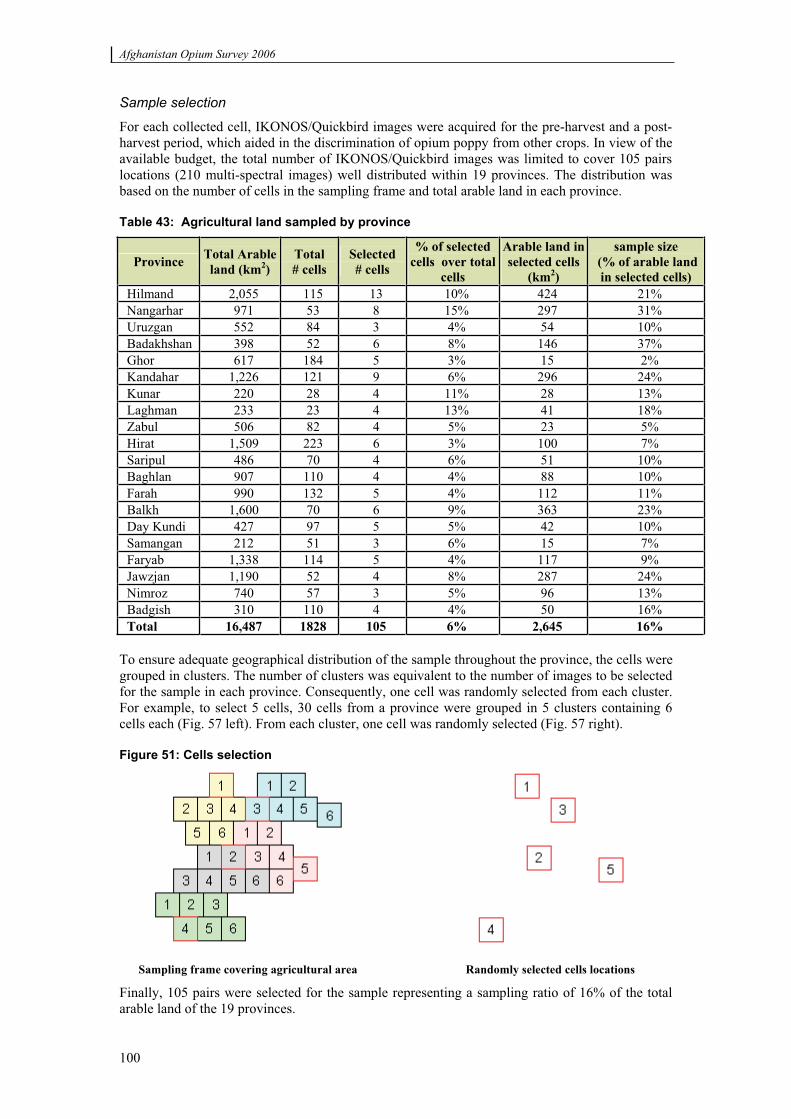
Afghanistan Opium Survey 2006
100
Sample selection
For each collected cell, IKONOS/Quickbird images were acquired for the pre-harvest and a post-harvest period, which aided in the discrimination of opium poppy from other crops. In view of the available budget, the total number of IKONOS/Quickbird images was limited to cover 105 pairs locations (210 multi-spectral images) well distributed within 19 provinces. The distribution was based on the number of cells in the sampling frame and total arable land in each province.
Table 43: Agricultural land sampled by province
Province Total Arable land (km2)
Total # cells
Selected# cells
% of selected cells over total
cells
Arable land in selected cells
(km2)
sample size (% of arable land in selected cells)
Hilmand 2,055 115 13 10% 424 21% Nangarhar 971 53 8 15% 297 31% Uruzgan 552 84 3 4% 54 10% Badakhshan 398 52 6 8% 146 37% Ghor 617 184 5 3% 15 2% Kandahar 1,226 121 9 6% 296 24% Kunar 220 28 4 11% 28 13% Laghman 233 23 4 13% 41 18% Zabul 506 82 4 5% 23 5% Hirat 1,509 223 6 3% 100 7% Saripul 486 70 4 6% 51 10% Baghlan 907 110 4 4% 88 10% Farah 990 132 5 4% 112 11% Balkh 1,600 70 6 9% 363 23% Day Kundi 427 97 5 5% 42 10% Samangan 212 51 3 6% 15 7% Faryab 1,338 114 5 4% 117 9% Jawzjan 1,190 52 4 8% 287 24% Nimroz 740 57 3 5% 96 13% Badgish 310 110 4 4% 50 16% Total 16,487 1828 105 6% 2,645 16%
To ensure adequate geographical distribution of the sample throughout the province, the cells were grouped in clusters. The number of clusters was equivalent to the number of images to be selected for the sample in each province. Consequently, one cell was randomly selected from each cluster. For example, to select 5 cells, 30 cells from a province were grouped in 5 clusters containing 6 cells each (Fig. 57 left). From each cluster, one cell was randomly selected (Fig. 57 right).
Figure 51: Cells selection
Sampling frame covering agricultural area Randomly selected cells locations
Finally, 105 pairs were selected for the sample representing a sampling ratio of 16% of the total arable land of the 19 provinces.
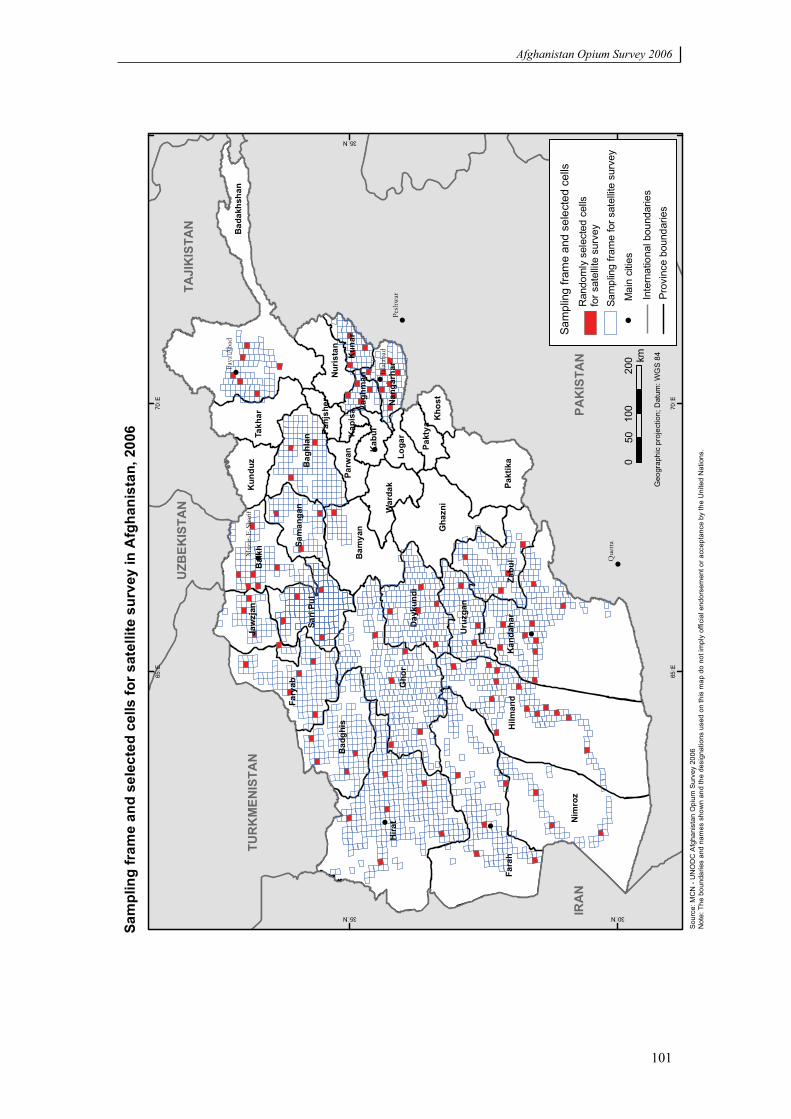
Afghanistan Opium Survey 2006
101
!
!
!!
!
!
!
!
!
Quet
ta
Pes
hw
ar
Jala
labad
Fay
z A
bad
Maz
ar-E
-Sh
arif
Fara
hH
ilman
dK
anda
har
Zabu
lPa
ktik
a
Hira
tG
hor
Nim
roz
Bad
akhs
han
Bal
kh
Gha
zni
Fary
ab
Bad
ghis
Bam
yan
Bag
hlan
Sari
Pul
Takh
ar
Day
kund
i
Jaw
zjan
Uru
zgan
War
dak
Nur
ista
n
Sam
anga
n
Kun
duz
Kun
ar
Pakt
ya
Loga
r
Parw
an Kab
ul
Nan
garh
ar
Kho
st
Panj
sher La
ghm
anK
apis
a
65�E
65�E
70�E
70�E
30�N
30�N
35�N
35�N
Sam
plin
g fr
ame
and
sele
cted
cel
ls fo
r sat
ellit
e su
rvey
in A
fgha
nist
an, 2
006
Sour
ce: M
CN
- U
NO
DC
Afg
hani
stan
Opi
um S
urve
y 20
06
Not
e: T
he b
ound
arie
s an
d na
mes
sho
wn
and
the
desi
gnat
ions
use
d on
this
map
do
not i
mpl
y of
ficia
l end
orse
men
t or a
ccep
tanc
e by
the
Uni
ted
Nat
ions
.
TUR
KM
ENIS
TAN
IRA
NPA
KIS
TAN
TAJI
KIS
TAN
UZB
EKIS
TAN
Geo
grap
hic
proj
ectio
n; D
atum
: WG
S 84
020
010
0km
50
Prov
ince
bou
ndar
ies
!M
ain
citie
s
Inte
rnat
iona
l bou
ndar
ies
Sam
plin
g fra
me
and
sele
cted
cel
lsR
ando
mly
sel
ecte
d ce
lls
for s
atel
lite
surv
eySa
mpl
ing
fram
e fo
r sat
ellit
e su
rvey
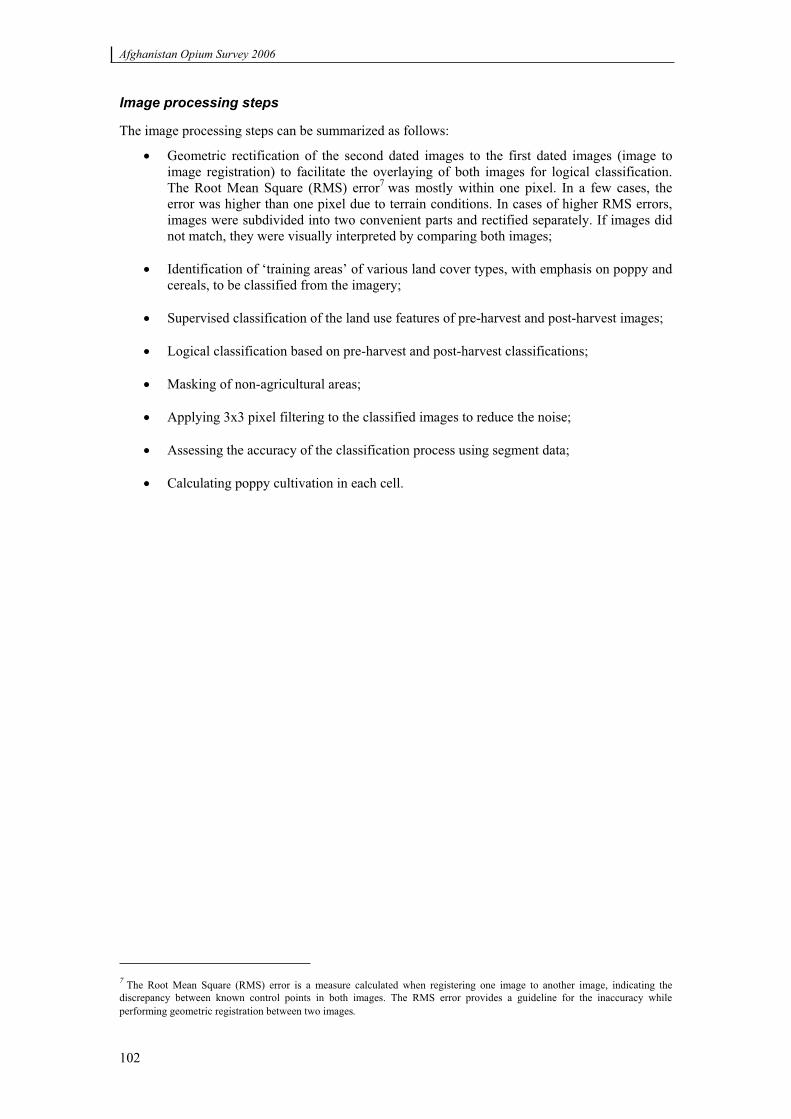
Afghanistan Opium Survey 2006
102
Image processing steps
The image processing steps can be summarized as follows:
Geometric rectification of the second dated images to the first dated images (image to image registration) to facilitate the overlaying of both images for logical classification. The Root Mean Square (RMS) error7 was mostly within one pixel. In a few cases, the error was higher than one pixel due to terrain conditions. In cases of higher RMS errors, images were subdivided into two convenient parts and rectified separately. If images did not match, they were visually interpreted by comparing both images;
Identification of ‘training areas’ of various land cover types, with emphasis on poppy and cereals, to be classified from the imagery;
Supervised classification of the land use features of pre-harvest and post-harvest images;
Logical classification based on pre-harvest and post-harvest classifications;
Masking of non-agricultural areas;
Applying 3x3 pixel filtering to the classified images to reduce the noise;
Assessing the accuracy of the classification process using segment data;
Calculating poppy cultivation in each cell.
7 The Root Mean Square (RMS) error is a measure calculated when registering one image to another image, indicating the discrepancy between known control points in both images. The RMS error provides a guideline for the inaccuracy while performing geometric registration between two images.
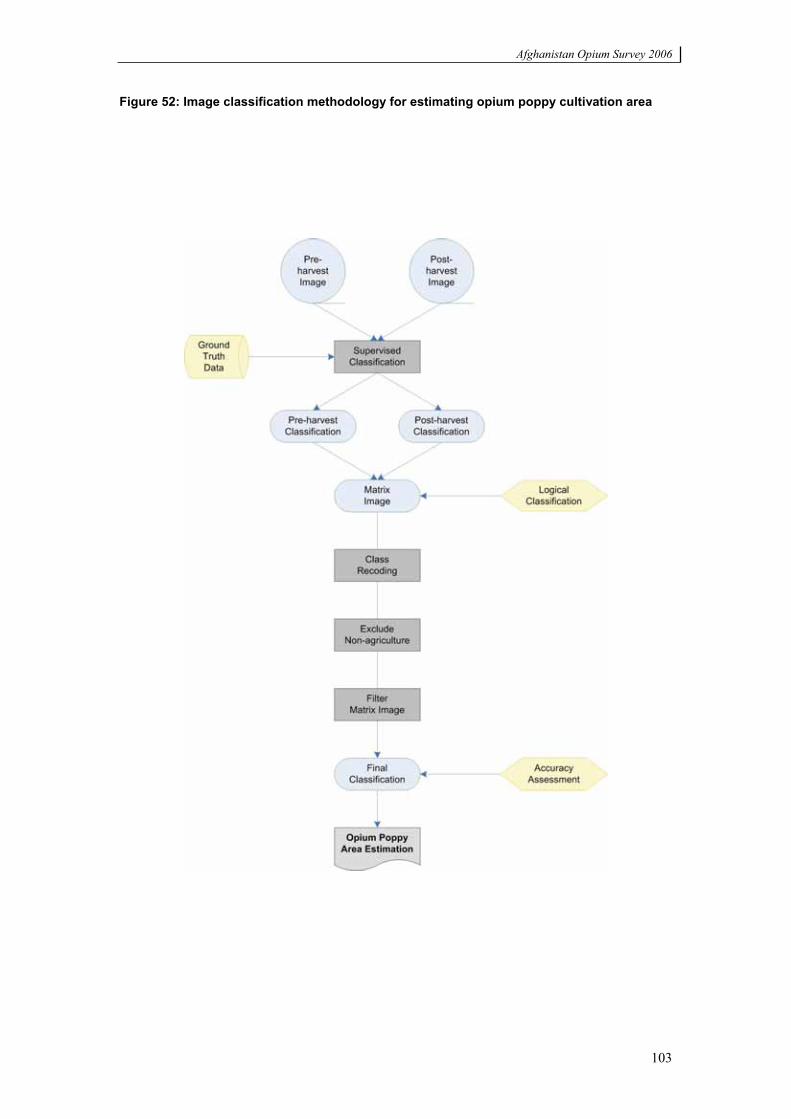
Afghanistan Opium Survey 2006
103
Figure 52: Image classification methodology for estimating opium poppy cultivation area
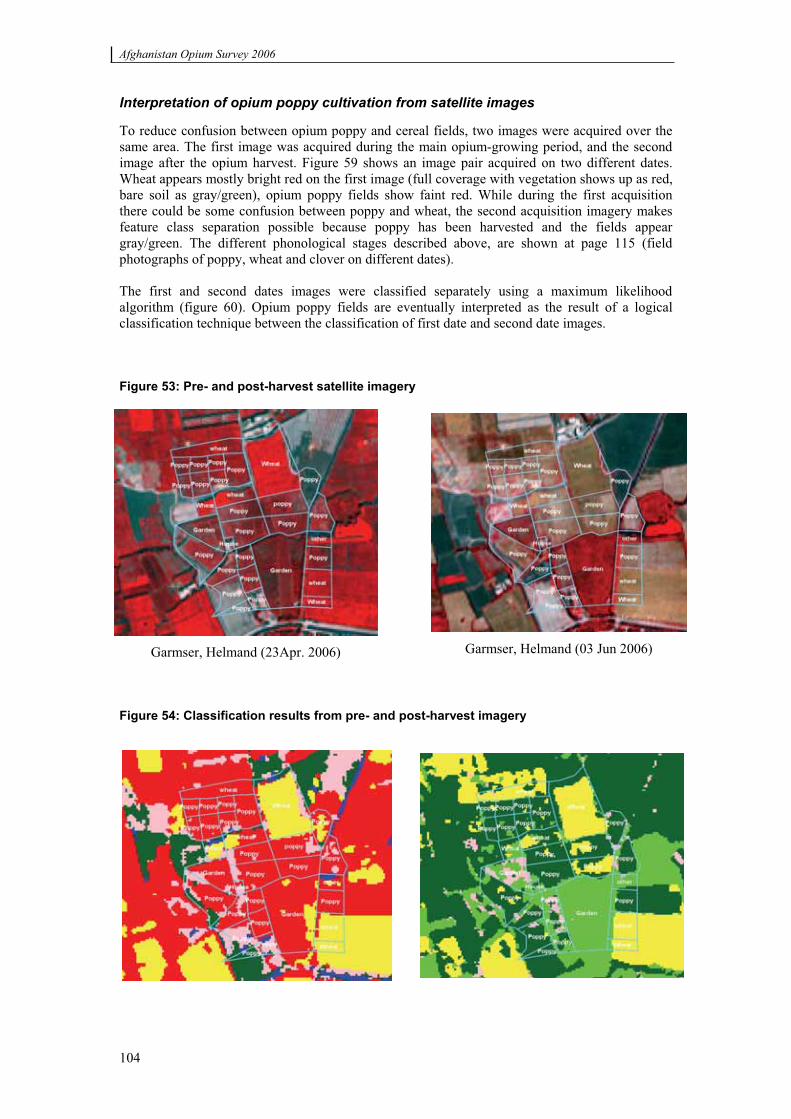
Afghanistan Opium Survey 2006
104
Interpretation of opium poppy cultivation from satellite images
To reduce confusion between opium poppy and cereal fields, two images were acquired over the same area. The first image was acquired during the main opium-growing period, and the second image after the opium harvest. Figure 59 shows an image pair acquired on two different dates. Wheat appears mostly bright red on the first image (full coverage with vegetation shows up as red, bare soil as gray/green), opium poppy fields show faint red. While during the first acquisition there could be some confusion between poppy and wheat, the second acquisition imagery makes feature class separation possible because poppy has been harvested and the fields appear gray/green. The different phonological stages described above, are shown at page 115 (field photographs of poppy, wheat and clover on different dates).
The first and second dates images were classified separately using a maximum likelihood algorithm (figure 60). Opium poppy fields are eventually interpreted as the result of a logical classification technique between the classification of first date and second date images.
Figure 53: Pre- and post-harvest satellite imagery
Garmser, Helmand (23Apr. 2006) Garmser, Helmand (03 Jun 2006)
Figure 54: Classification results from pre- and post-harvest imagery
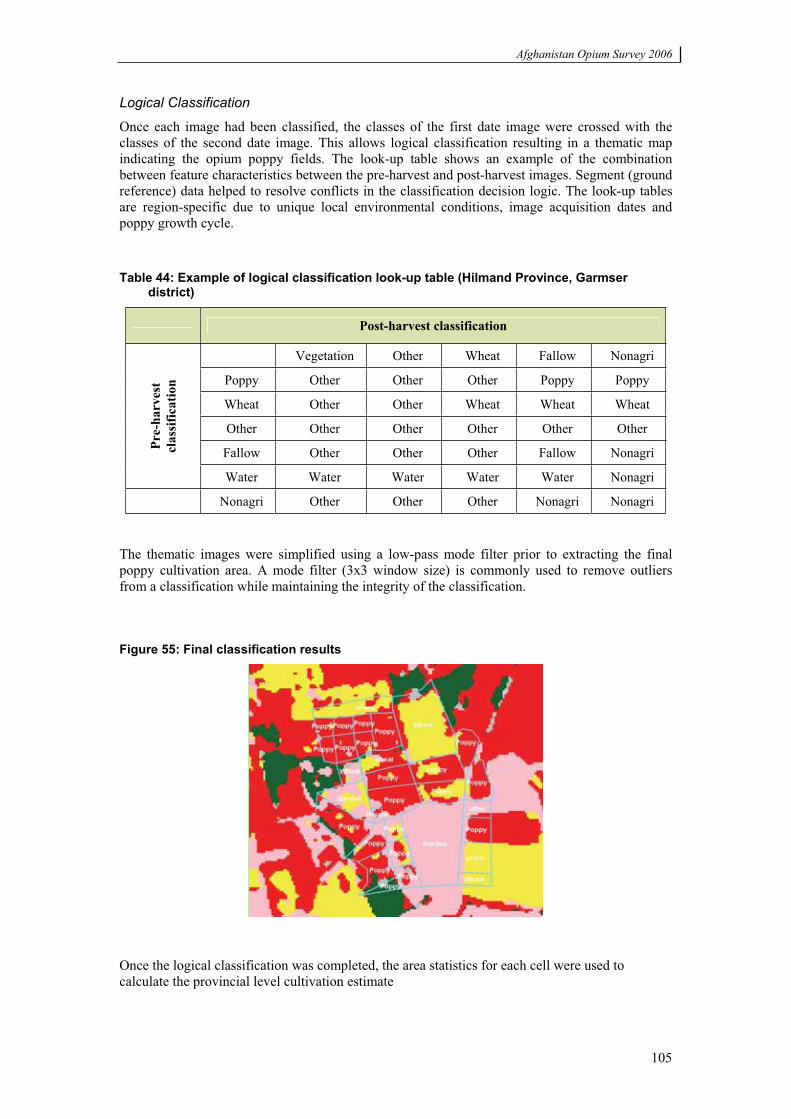
Afghanistan Opium Survey 2006
105
Logical Classification
Once each image had been classified, the classes of the first date image were crossed with the classes of the second date image. This allows logical classification resulting in a thematic map indicating the opium poppy fields. The look-up table shows an example of the combination between feature characteristics between the pre-harvest and post-harvest images. Segment (ground reference) data helped to resolve conflicts in the classification decision logic. The look-up tables are region-specific due to unique local environmental conditions, image acquisition dates and poppy growth cycle.
Table 44: Example of logical classification look-up table (Hilmand Province, Garmser district)
Post-harvest classification
Vegetation Other Wheat Fallow Nonagri
Poppy Other Other Other Poppy Poppy
Wheat Other Other Wheat Wheat Wheat
Other Other Other Other Other Other
Fallow Other Other Other Fallow Nonagri Pre-
harv
est
clas
sific
atio
n
Water Water Water Water Water Nonagri
Nonagri Other Other Other Nonagri Nonagri
The thematic images were simplified using a low-pass mode filter prior to extracting the final poppy cultivation area. A mode filter (3x3 window size) is commonly used to remove outliers from a classification while maintaining the integrity of the classification.
Figure 55: Final classification results
Once the logical classification was completed, the area statistics for each cell were used to calculate the provincial level cultivation estimate
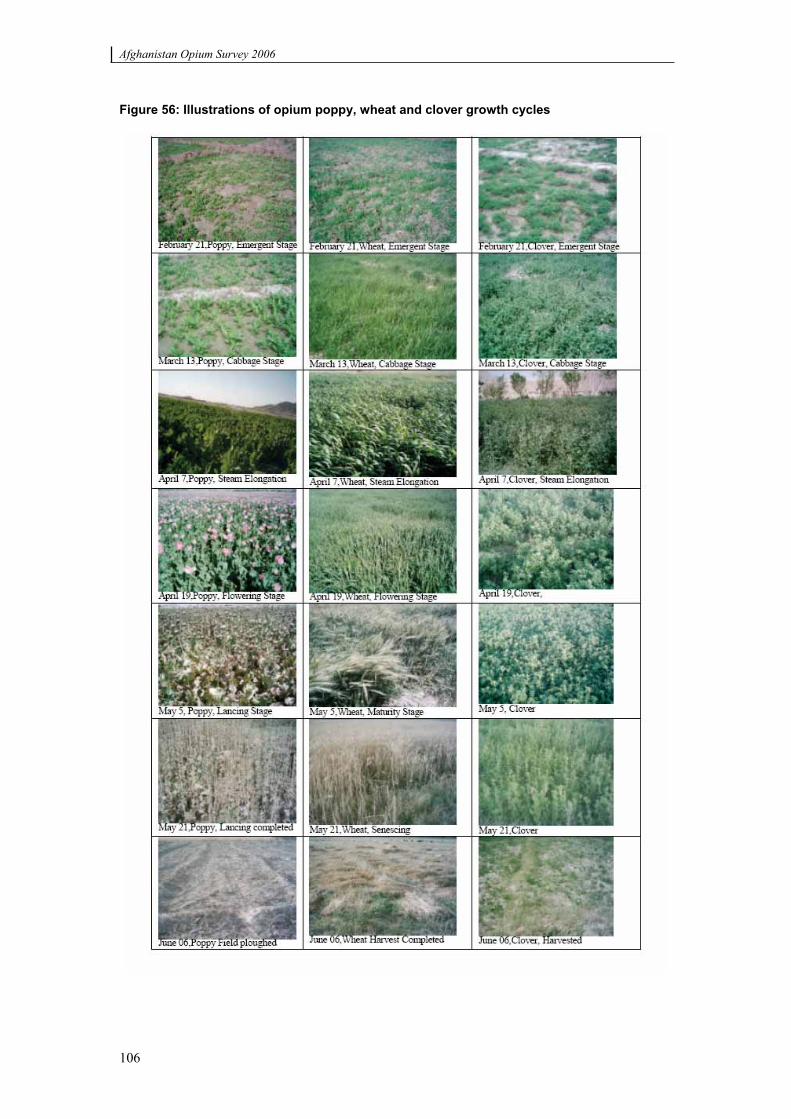
Afghanistan Opium Survey 2006
106
Figure 56: Illustrations of opium poppy, wheat and clover growth cycles
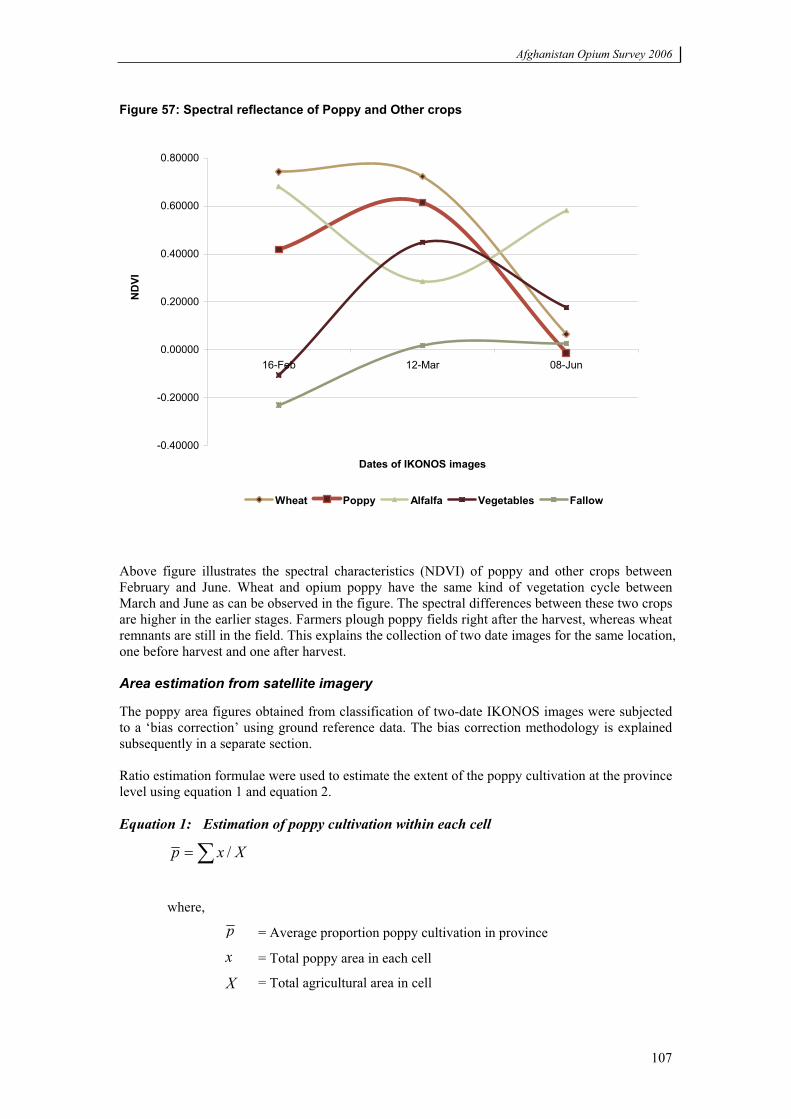
Afghanistan Opium Survey 2006
107
Figure 57: Spectral reflectance of Poppy and Other crops
-0.40000
-0.20000
0.00000
0.20000
0.40000
0.60000
0.80000
16-Feb 12-Mar 08-Jun
Dates of IKONOS images
ND
VI
Wheat Poppy Alfalfa Vegetables Fallow
Above figure illustrates the spectral characteristics (NDVI) of poppy and other crops between February and June. Wheat and opium poppy have the same kind of vegetation cycle between March and June as can be observed in the figure. The spectral differences between these two crops are higher in the earlier stages. Farmers plough poppy fields right after the harvest, whereas wheat remnants are still in the field. This explains the collection of two date images for the same location, one before harvest and one after harvest.
Area estimation from satellite imagery
The poppy area figures obtained from classification of two-date IKONOS images were subjected to a ‘bias correction’ using ground reference data. The bias correction methodology is explained subsequently in a separate section.
Ratio estimation formulae were used to estimate the extent of the poppy cultivation at the province level using equation 1 and equation 2.
Equation 1: Estimation of poppy cultivation within each cell
Xxp /
where,
p = Average proportion poppy cultivation in province
x = Total poppy area in each cell
X = Total agricultural area in cell
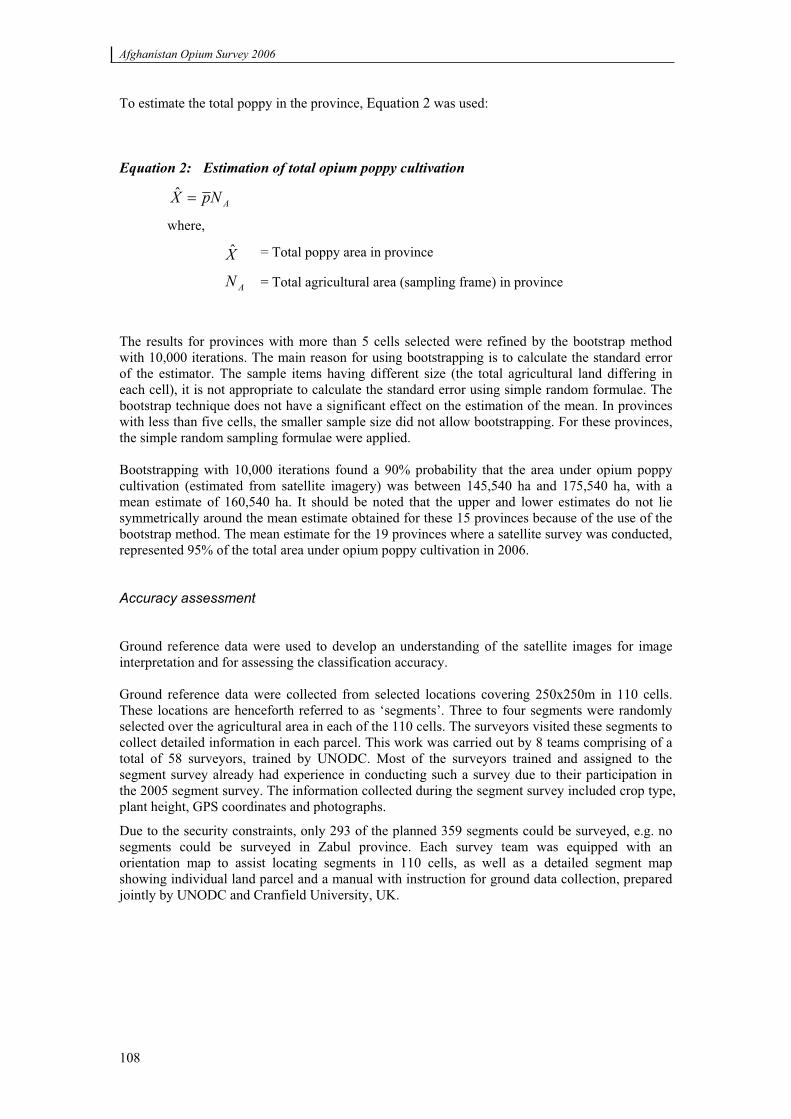
Afghanistan Opium Survey 2006
108
To estimate the total poppy in the province, Equation 2 was used:
Equation 2: Estimation of total opium poppy cultivation
ANpX̂
where,
X̂ = Total poppy area in province
AN = Total agricultural area (sampling frame) in province
The results for provinces with more than 5 cells selected were refined by the bootstrap method with 10,000 iterations. The main reason for using bootstrapping is to calculate the standard error of the estimator. The sample items having different size (the total agricultural land differing in each cell), it is not appropriate to calculate the standard error using simple random formulae. The bootstrap technique does not have a significant effect on the estimation of the mean. In provinces with less than five cells, the smaller sample size did not allow bootstrapping. For these provinces, the simple random sampling formulae were applied.
Bootstrapping with 10,000 iterations found a 90% probability that the area under opium poppy cultivation (estimated from satellite imagery) was between 145,540 ha and 175,540 ha, with a mean estimate of 160,540 ha. It should be noted that the upper and lower estimates do not lie symmetrically around the mean estimate obtained for these 15 provinces because of the use of the bootstrap method. The mean estimate for the 19 provinces where a satellite survey was conducted, represented 95% of the total area under opium poppy cultivation in 2006.
Accuracy assessment
Ground reference data were used to develop an understanding of the satellite images for image interpretation and for assessing the classification accuracy.
Ground reference data were collected from selected locations covering 250x250m in 110 cells. These locations are henceforth referred to as ‘segments’. Three to four segments were randomly selected over the agricultural area in each of the 110 cells. The surveyors visited these segments to collect detailed information in each parcel. This work was carried out by 8 teams comprising of a total of 58 surveyors, trained by UNODC. Most of the surveyors trained and assigned to the segment survey already had experience in conducting such a survey due to their participation in the 2005 segment survey. The information collected during the segment survey included crop type, plant height, GPS coordinates and photographs.
Due to the security constraints, only 293 of the planned 359 segments could be surveyed, e.g. no segments could be surveyed in Zabul province. Each survey team was equipped with an orientation map to assist locating segments in 110 cells, as well as a detailed segment map showing individual land parcel and a manual with instruction for ground data collection, prepared jointly by UNODC and Cranfield University, UK.
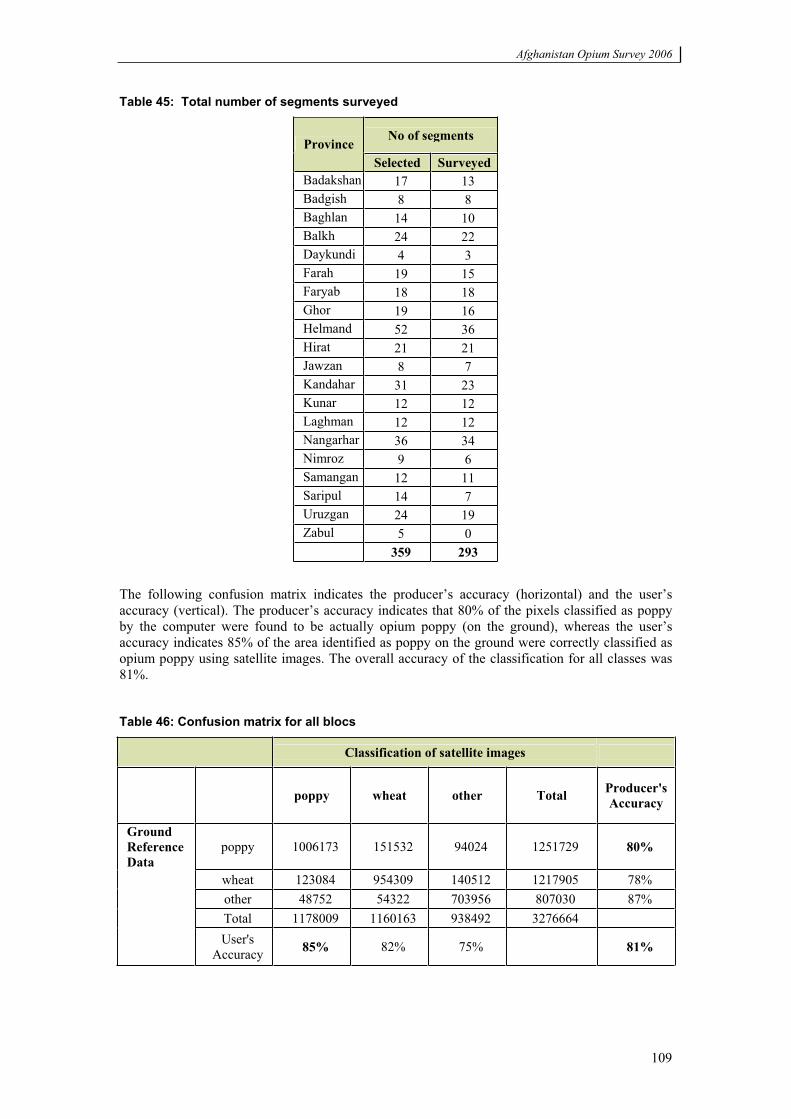
Afghanistan Opium Survey 2006
109
Table 45: Total number of segments surveyed
No of segments ProvinceSelected Surveyed
Badakshan 17 13 Badgish 8 8 Baghlan 14 10 Balkh 24 22 Daykundi 4 3 Farah 19 15 Faryab 18 18 Ghor 19 16 Helmand 52 36 Hirat 21 21 Jawzan 8 7 Kandahar 31 23 Kunar 12 12 Laghman 12 12 Nangarhar 36 34 Nimroz 9 6 Samangan 12 11 Saripul 14 7 Uruzgan 24 19 Zabul 5 0
359 293
The following confusion matrix indicates the producer’s accuracy (horizontal) and the user’s accuracy (vertical). The producer’s accuracy indicates that 80% of the pixels classified as poppy by the computer were found to be actually opium poppy (on the ground), whereas the user’s accuracy indicates 85% of the area identified as poppy on the ground were correctly classified as opium poppy using satellite images. The overall accuracy of the classification for all classes was 81%.
Table 46: Confusion matrix for all blocs
Classification of satellite images
poppy wheat other Total Producer'sAccuracy
Ground Reference Data
poppy 1006173 151532 94024 1251729 80%
wheat 123084 954309 140512 1217905 78% other 48752 54322 703956 807030 87% Total 1178009 1160163 938492 3276664 User's
Accuracy 85% 82% 75% 81%
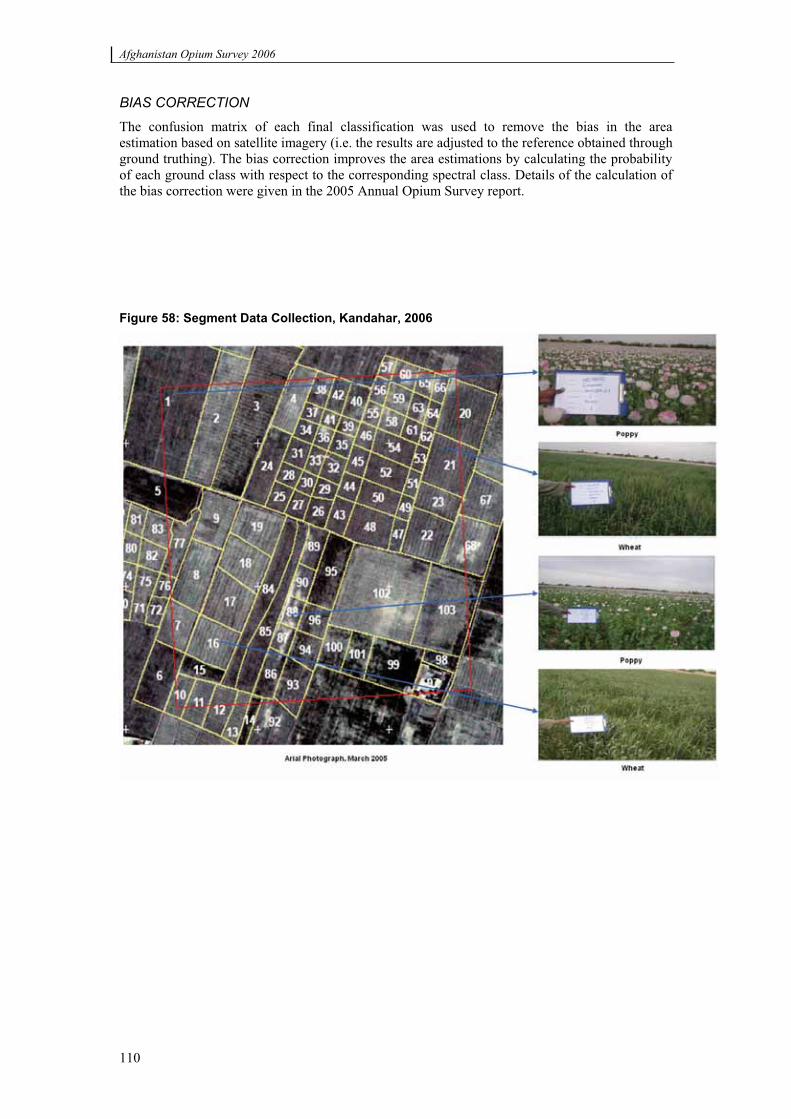
Afghanistan Opium Survey 2006
110
BIAS CORRECTION
The confusion matrix of each final classification was used to remove the bias in the area estimation based on satellite imagery (i.e. the results are adjusted to the reference obtained through ground truthing). The bias correction improves the area estimations by calculating the probability of each ground class with respect to the corresponding spectral class. Details of the calculation of the bias correction were given in the 2005 Annual Opium Survey report.
Figure 58: Segment Data Collection, Kandahar, 2006
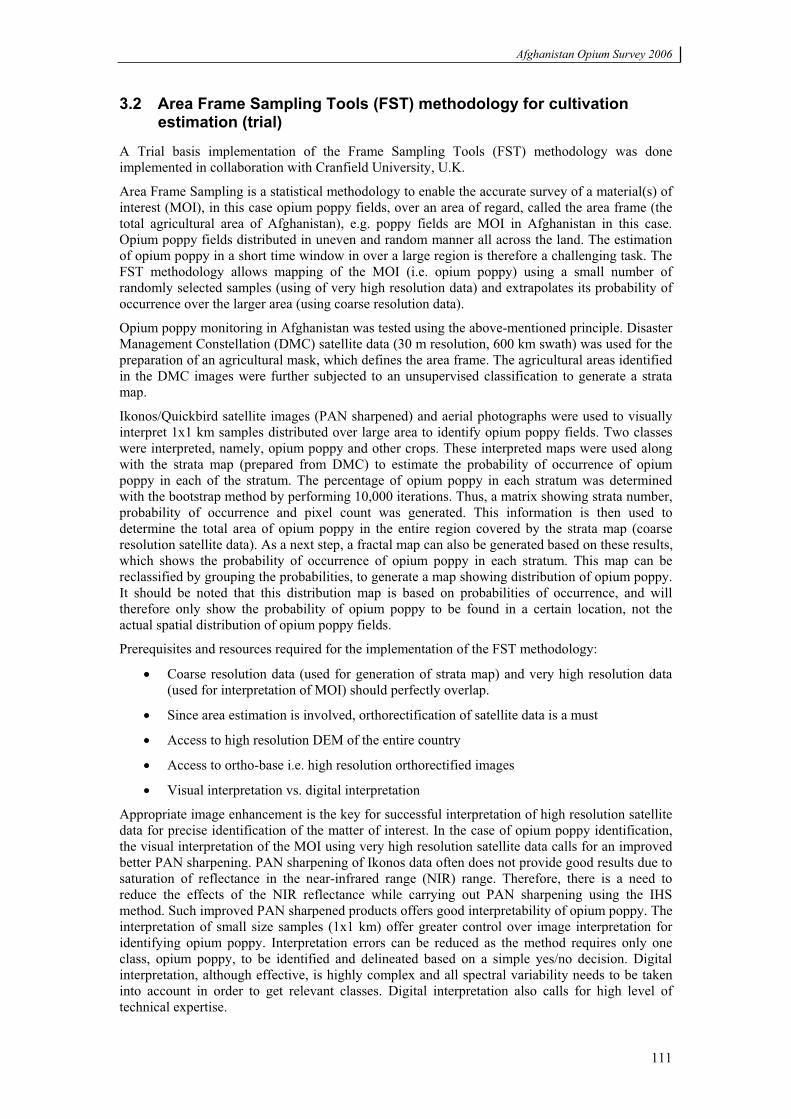
Afghanistan Opium Survey 2006
111
3.2 Area Frame Sampling Tools (FST) methodology for cultivation estimation (trial)
A Trial basis implementation of the Frame Sampling Tools (FST) methodology was done implemented in collaboration with Cranfield University, U.K.
Area Frame Sampling is a statistical methodology to enable the accurate survey of a material(s) of interest (MOI), in this case opium poppy fields, over an area of regard, called the area frame (the total agricultural area of Afghanistan), e.g. poppy fields are MOI in Afghanistan in this case. Opium poppy fields distributed in uneven and random manner all across the land. The estimation of opium poppy in a short time window in over a large region is therefore a challenging task. The FST methodology allows mapping of the MOI (i.e. opium poppy) using a small number of randomly selected samples (using of very high resolution data) and extrapolates its probability of occurrence over the larger area (using coarse resolution data).
Opium poppy monitoring in Afghanistan was tested using the above-mentioned principle. Disaster Management Constellation (DMC) satellite data (30 m resolution, 600 km swath) was used for the preparation of an agricultural mask, which defines the area frame. The agricultural areas identified in the DMC images were further subjected to an unsupervised classification to generate a strata map.
Ikonos/Quickbird satellite images (PAN sharpened) and aerial photographs were used to visually interpret 1x1 km samples distributed over large area to identify opium poppy fields. Two classes were interpreted, namely, opium poppy and other crops. These interpreted maps were used along with the strata map (prepared from DMC) to estimate the probability of occurrence of opium poppy in each of the stratum. The percentage of opium poppy in each stratum was determined with the bootstrap method by performing 10,000 iterations. Thus, a matrix showing strata number, probability of occurrence and pixel count was generated. This information is then used to determine the total area of opium poppy in the entire region covered by the strata map (coarse resolution satellite data). As a next step, a fractal map can also be generated based on these results, which shows the probability of occurrence of opium poppy in each stratum. This map can be reclassified by grouping the probabilities, to generate a map showing distribution of opium poppy. It should be noted that this distribution map is based on probabilities of occurrence, and will therefore only show the probability of opium poppy to be found in a certain location, not the actual spatial distribution of opium poppy fields.
Prerequisites and resources required for the implementation of the FST methodology:
Coarse resolution data (used for generation of strata map) and very high resolution data (used for interpretation of MOI) should perfectly overlap.
Since area estimation is involved, orthorectification of satellite data is a must
Access to high resolution DEM of the entire country
Access to ortho-base i.e. high resolution orthorectified images
Visual interpretation vs. digital interpretation
Appropriate image enhancement is the key for successful interpretation of high resolution satellite data for precise identification of the matter of interest. In the case of opium poppy identification, the visual interpretation of the MOI using very high resolution satellite data calls for an improved better PAN sharpening. PAN sharpening of Ikonos data often does not provide good results due to saturation of reflectance in the near-infrared range (NIR) range. Therefore, there is a need to reduce the effects of the NIR reflectance while carrying out PAN sharpening using the IHS method. Such improved PAN sharpened products offers good interpretability of opium poppy. The interpretation of small size samples (1x1 km) offer greater control over image interpretation for identifying opium poppy. Interpretation errors can be reduced as the method requires only one class, opium poppy, to be identified and delineated based on a simple yes/no decision. Digital interpretation, although effective, is highly complex and all spectral variability needs to be taken into account in order to get relevant classes. Digital interpretation also calls for high level of technical expertise.
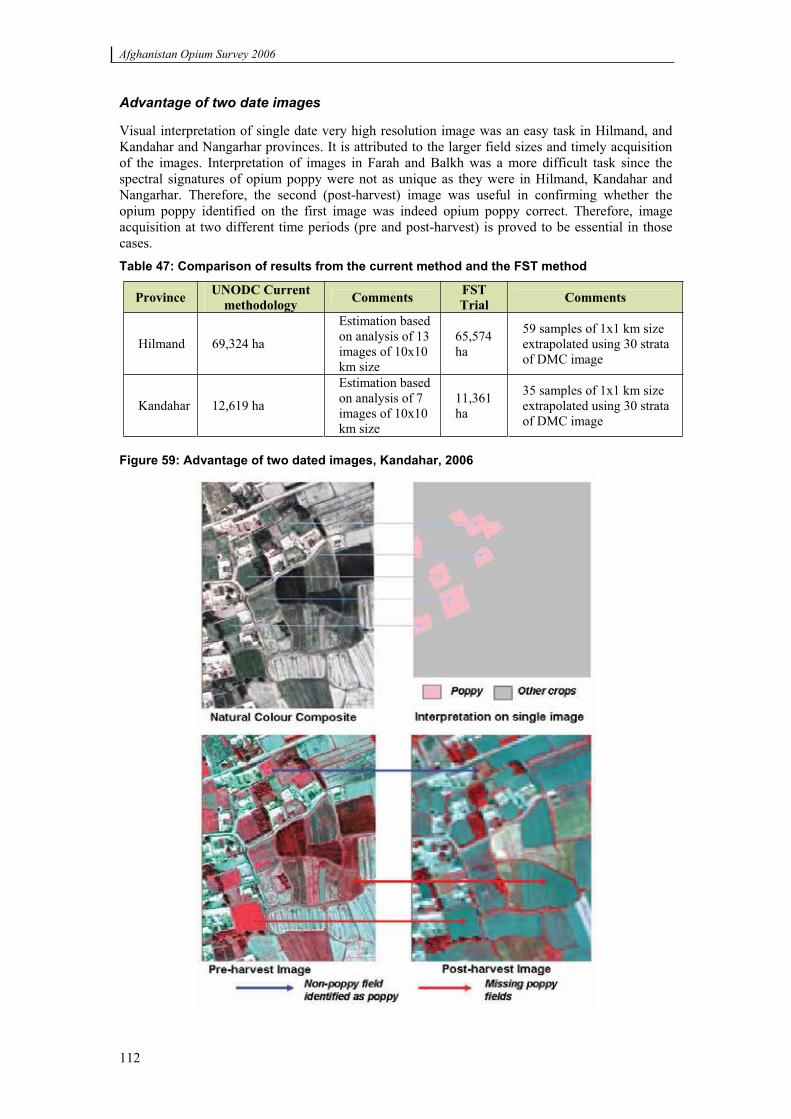
Afghanistan Opium Survey 2006
112
Advantage of two date images
Visual interpretation of single date very high resolution image was an easy task in Hilmand, and Kandahar and Nangarhar provinces. It is attributed to the larger field sizes and timely acquisition of the images. Interpretation of images in Farah and Balkh was a more difficult task since the spectral signatures of opium poppy were not as unique as they were in Hilmand, Kandahar and Nangarhar. Therefore, the second (post-harvest) image was useful in confirming whether the opium poppy identified on the first image was indeed opium poppy correct. Therefore, image acquisition at two different time periods (pre and post-harvest) is proved to be essential in those cases.Table 47: Comparison of results from the current method and the FST method
Province UNODC Current methodology Comments FST
Trial Comments
Hilmand 69,324 ha
Estimation based on analysis of 13 images of 10x10 km size
65,574 ha
59 samples of 1x1 km size extrapolated using 30 strata of DMC image
Kandahar 12,619 ha
Estimation based on analysis of 7 images of 10x10 km size
11,361 ha
35 samples of 1x1 km size extrapolated using 30 strata of DMC image
Figure 59: Advantage of two dated images, Kandahar, 2006
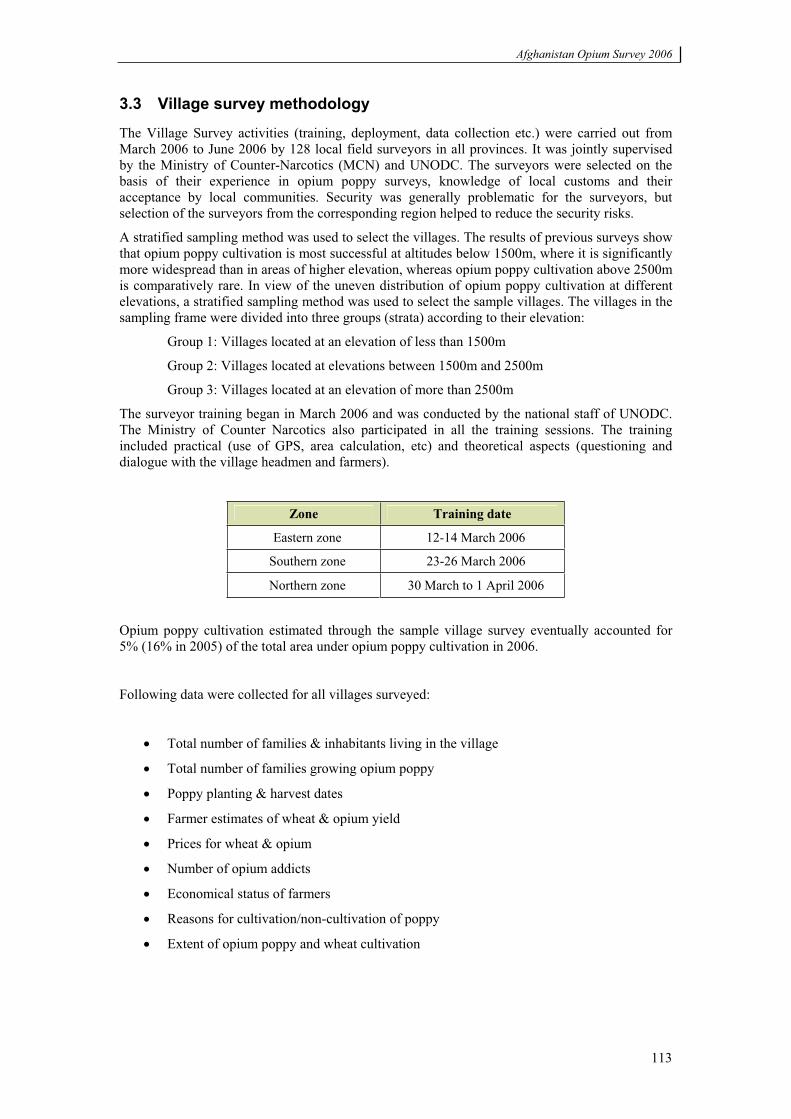
Afghanistan Opium Survey 2006
113
3.3 Village survey methodology
The Village Survey activities (training, deployment, data collection etc.) were carried out from March 2006 to June 2006 by 128 local field surveyors in all provinces. It was jointly supervised by the Ministry of Counter-Narcotics (MCN) and UNODC. The surveyors were selected on the basis of their experience in opium poppy surveys, knowledge of local customs and their acceptance by local communities. Security was generally problematic for the surveyors, but selection of the surveyors from the corresponding region helped to reduce the security risks.
A stratified sampling method was used to select the villages. The results of previous surveys show that opium poppy cultivation is most successful at altitudes below 1500m, where it is significantly more widespread than in areas of higher elevation, whereas opium poppy cultivation above 2500m is comparatively rare. In view of the uneven distribution of opium poppy cultivation at different elevations, a stratified sampling method was used to select the sample villages. The villages in the sampling frame were divided into three groups (strata) according to their elevation:
Group 1: Villages located at an elevation of less than 1500m
Group 2: Villages located at elevations between 1500m and 2500m
Group 3: Villages located at an elevation of more than 2500m
The surveyor training began in March 2006 and was conducted by the national staff of UNODC. The Ministry of Counter Narcotics also participated in all the training sessions. The training included practical (use of GPS, area calculation, etc) and theoretical aspects (questioning and dialogue with the village headmen and farmers).
Zone Training date
Eastern zone 12-14 March 2006
Southern zone 23-26 March 2006
Northern zone 30 March to 1 April 2006
Opium poppy cultivation estimated through the sample village survey eventually accounted for 5% (16% in 2005) of the total area under opium poppy cultivation in 2006.
Following data were collected for all villages surveyed:
Total number of families & inhabitants living in the village
Total number of families growing opium poppy
Poppy planting & harvest dates
Farmer estimates of wheat & opium yield
Prices for wheat & opium
Number of opium addicts
Economical status of farmers
Reasons for cultivation/non-cultivation of poppy
Extent of opium poppy and wheat cultivation
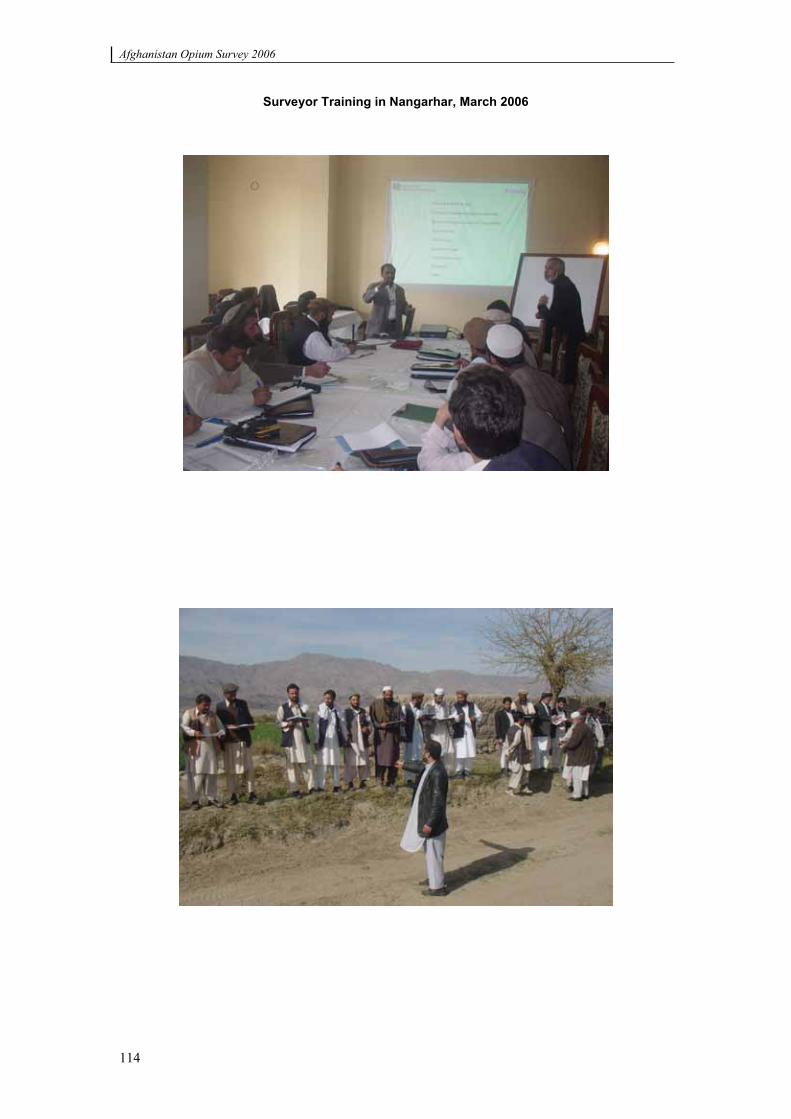
Afghanistan Opium Survey 2006
114
Surveyor Training in Nangarhar, March 2006
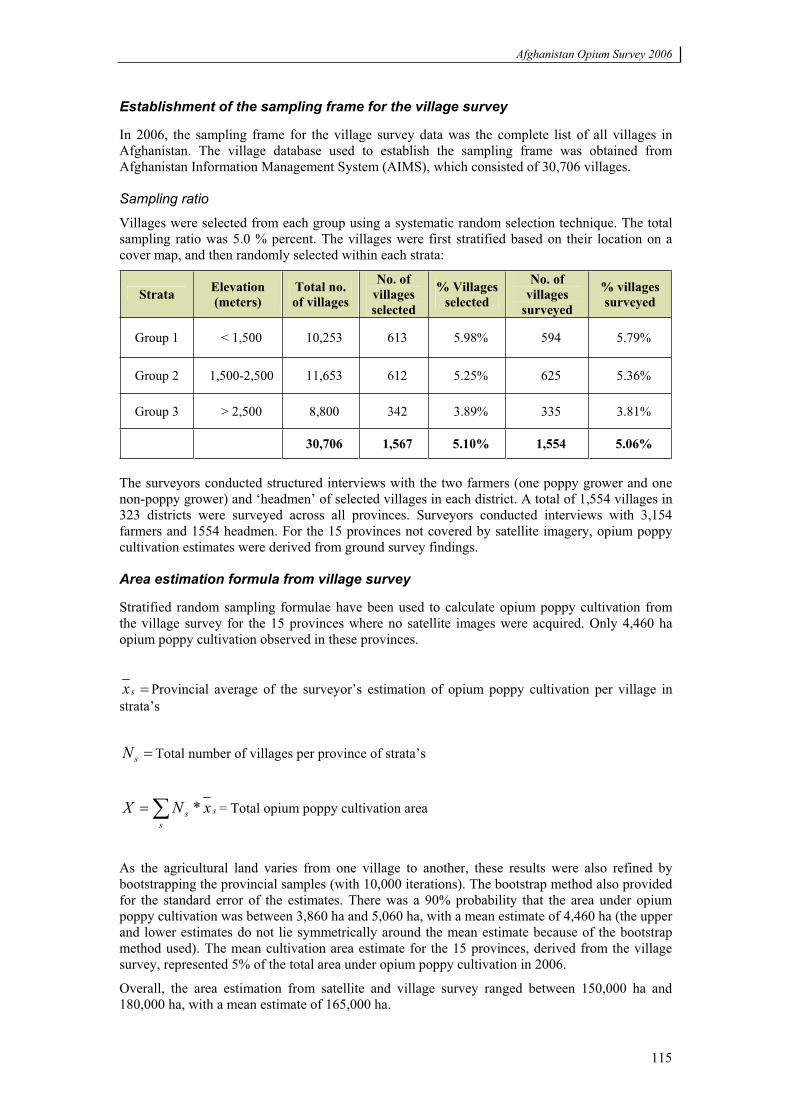
Afghanistan Opium Survey 2006
115
Establishment of the sampling frame for the village survey
In 2006, the sampling frame for the village survey data was the complete list of all villages in Afghanistan. The village database used to establish the sampling frame was obtained from Afghanistan Information Management System (AIMS), which consisted of 30,706 villages.
Sampling ratio
Villages were selected from each group using a systematic random selection technique. The total sampling ratio was 5.0 % percent. The villages were first stratified based on their location on a cover map, and then randomly selected within each strata:
Strata Elevation (meters)
Total no. of villages
No. of villages selected
% Villages selected
No. of villages
surveyed
% villages surveyed
Group 1 < 1,500 10,253 613 5.98% 594 5.79%
Group 2 1,500-2,500 11,653 612 5.25% 625 5.36%
Group 3 > 2,500 8,800 342 3.89% 335 3.81%
30,706 1,567 5.10% 1,554 5.06%
The surveyors conducted structured interviews with the two farmers (one poppy grower and one non-poppy grower) and ‘headmen’ of selected villages in each district. A total of 1,554 villages in 323 districts were surveyed across all provinces. Surveyors conducted interviews with 3,154 farmers and 1554 headmen. For the 15 provinces not covered by satellite imagery, opium poppy cultivation estimates were derived from ground survey findings.
Area estimation formula from village survey
Stratified random sampling formulae have been used to calculate opium poppy cultivation from the village survey for the 15 provinces where no satellite images were acquired. Only 4,460 ha opium poppy cultivation observed in these provinces.
sx Provincial average of the surveyor’s estimation of opium poppy cultivation per village in strata’s
sN Total number of villages per province of strata’s
ss
s xNX * = Total opium poppy cultivation area
As the agricultural land varies from one village to another, these results were also refined by bootstrapping the provincial samples (with 10,000 iterations). The bootstrap method also provided for the standard error of the estimates. There was a 90% probability that the area under opium poppy cultivation was between 3,860 ha and 5,060 ha, with a mean estimate of 4,460 ha (the upper and lower estimates do not lie symmetrically around the mean estimate because of the bootstrap method used). The mean cultivation area estimate for the 15 provinces, derived from the village survey, represented 5% of the total area under opium poppy cultivation in 2006.
Overall, the area estimation from satellite and village survey ranged between 150,000 ha and 180,000 ha, with a mean estimate of 165,000 ha.
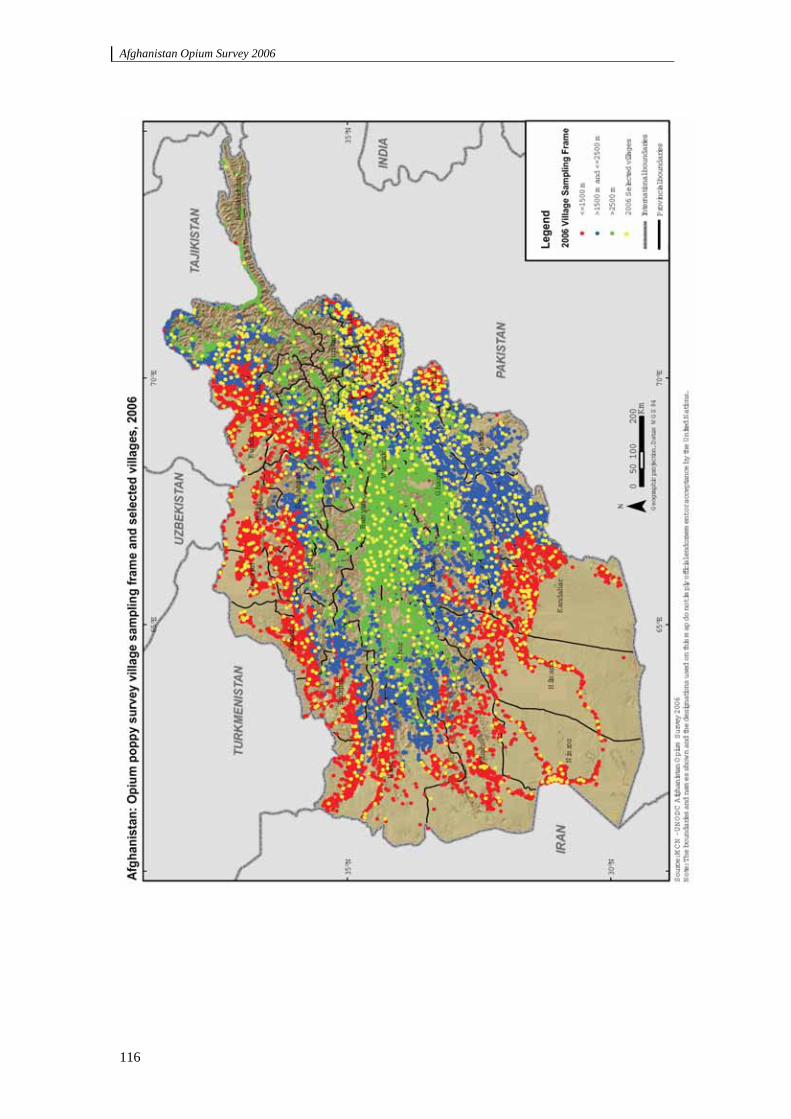
Afghanistan Opium Survey 2006
116
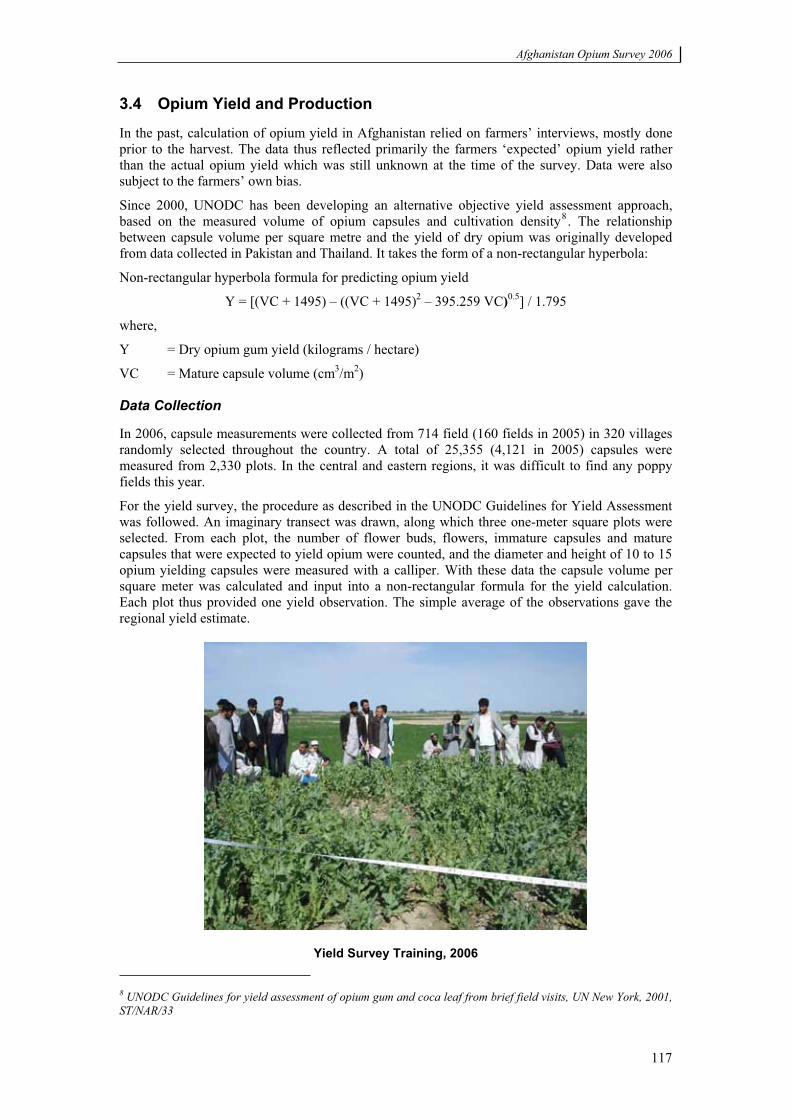
Afghanistan Opium Survey 2006
117
3.4 Opium Yield and Production
In the past, calculation of opium yield in Afghanistan relied on farmers’ interviews, mostly done prior to the harvest. The data thus reflected primarily the farmers ‘expected’ opium yield rather than the actual opium yield which was still unknown at the time of the survey. Data were also subject to the farmers’ own bias.
Since 2000, UNODC has been developing an alternative objective yield assessment approach, based on the measured volume of opium capsules and cultivation density8. The relationship between capsule volume per square metre and the yield of dry opium was originally developed from data collected in Pakistan and Thailand. It takes the form of a non-rectangular hyperbola:
Non-rectangular hyperbola formula for predicting opium yield
Y = [(VC + 1495) – ((VC + 1495)2 – 395.259 VC)0.5] / 1.795
where,
Y = Dry opium gum yield (kilograms / hectare)
VC = Mature capsule volume (cm3/m2)
Data Collection
In 2006, capsule measurements were collected from 714 field (160 fields in 2005) in 320 villages randomly selected throughout the country. A total of 25,355 (4,121 in 2005) capsules were measured from 2,330 plots. In the central and eastern regions, it was difficult to find any poppy fields this year.
For the yield survey, the procedure as described in the UNODC Guidelines for Yield Assessment was followed. An imaginary transect was drawn, along which three one-meter square plots were selected. From each plot, the number of flower buds, flowers, immature capsules and mature capsules that were expected to yield opium were counted, and the diameter and height of 10 to 15 opium yielding capsules were measured with a calliper. With these data the capsule volume per square meter was calculated and input into a non-rectangular formula for the yield calculation. Each plot thus provided one yield observation. The simple average of the observations gave the regional yield estimate.
Yield Survey Training, 2006 8 UNODC Guidelines for yield assessment of opium gum and coca leaf from brief field visits, UN New York, 2001, ST/NAR/33
Afghanistan Opium Survey 2006
118
3.5 Opium Price
Between April and August 2006, data were collected on the price of fresh and dry opium. In the 2006 village survey some 3,100 farmers in 1,554 villages were interviewed to provide data on fresh and dry opium prices. The average regional values for price of dry opium were used to estimate the total value of opium produced in Afghanistan in 20065.
Since November 2002, UNODC conducts maintains an regular opium price monitoring system. , collecting prices of fresh and dry opium are collected from farmers and traders on a monthly basis in Nangarhar, Hilmand and Kandahar, and since May 2005 also in Hirat, Balkh and Badakhshan provinces and since January 2006 in Faryab, Kunduz, Takhar, Laghman, Kunar, Farah and Ghor. About 180-200 farmers and 170-190 local traders are interviewed each month to provide this information.
3.6 Opium Growing Families
To estimate the number of families involved in opium poppy cultivation in Afghanistan, data were collected during the village survey on the number of families growing opium poppy in the sampled villages.
Stratified simple random sampling formulae were used to derive the number of opium growing families in Afghanistan as follow:
sx average number of opium poppy growing farmers per village in the sample in strata s
sN Total number of villages in the sampling frame in strata s
ss xNX * = Total number of families growing opium
As the sampled villages did not have a similar population size, the results were refined with a bootstrap of 10,000 iterations, providing an estimate for the mean and for the standard error. A total of 448,000 poppy (range 395,000 – 501,000) growing households were estimated in Afghanistan.
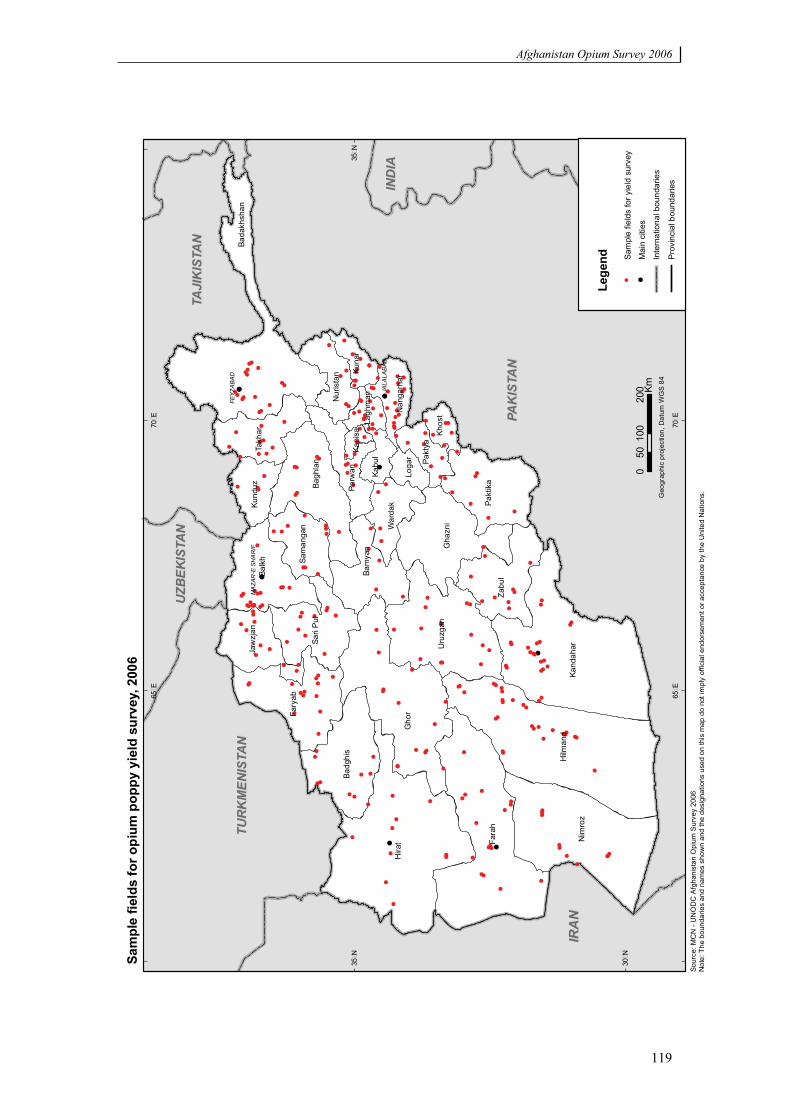
Afghanistan Opium Survey 2006
119
!
!
!
!
!
!!
!
!
!
!!!
!!
!
!!
!!!!
! !
!!
!
!
!!
!
!!!
!!
!!
!
!
!
!
!
!
!!
!
!!
!
!
!
!
!!
!!
!
!
!
!!
!
!
!!
!
!
!
!
!
!
!
!
!
!
! !
!
!
!
!
!
!
!
!
!
!!
!!
!
!
!
!!
!!
!
!!
!
!
!
!
!
!
!
!
! !
!!
!
!
!
!
!
!!
!
!
!!
!
! !
!
!!
!
!
!
!
!!
!
!
!
!
!
!!
!!
!
!
!
!
!
!!
!
!
!
!!
!
!
!
!
!
!
!
!
!
!
!
!
!
!!
!!
!
!!
!
!
!!!
!!
!
! !
!!!
!
!
! !
!!
!!
!!
!!
!!
! !
!!
!!
!!
!!
!!
! !
!!
!!!
!
! !
!!
!
!
!
!!
!!!
!!
!
!
!!
!
!
!
!
!
!
!!
!!
!!
! !
!
!!
!!
!!
!!
!
!!
!!
!!
!!
!
!
!!
!
!
!!
!
!
! !!!
!!
!
!!
!!
!
!
!
!
!
!
!
!
!
!
!!!
! !
!
!!!
! !
!
!
!!
!!!
!
!!
!
!
!
IRA
NIR
AN
PAK
ISTA
NPA
KIS
TAN
IND
IAIN
DIA
TURK
MEN
ISTA
NTU
RKM
ENIS
TAN
TAJI
KIS
TAN
TAJI
KIS
TAN
UZBE
KIST
ANUZ
BEKI
STAN
FE
YZ
AB
AD
JA
LA
LA
BA
D
MA
ZA
R-E
SH
AR
IF
Hira
t Fara
h
Gho
r
Hilm
and
Nim
roz
Kand
ahar
Bada
khsh
an
Uru
zgan
Gha
zni
Balk
h
Zabu
l
Fary
ab
Bagh
lan
Pakt
ika
Badg
his
Sari
Pul
Takh
ar
Bam
yan
Jaw
zjan
Parw
an
War
dak
Nur
ista
n
Kund
uz
Sam
anga
n
Pakt
ya
Kuna
r
Kabu
l
Nan
garh
ar
Khos
t
Loga
r
Lagh
man
Kapi
sa
65�E
65�E
70�E
70�E
30�N
30�N
35�N
35�N
Sam
ple
field
s fo
r opi
um p
oppy
yie
ld s
urve
y, 2
006
Sour
ce: M
CN
- U
NO
DC
Afg
hani
stan
Opi
um S
urve
y 20
06
Not
e: T
he b
ound
arie
s an
d na
mes
sho
wn
and
the
desi
gnat
ions
use
d on
this
map
do
not i
mpl
y of
ficia
l end
orse
men
t or a
ccep
tanc
e by
the
Uni
ted
Nat
ions
.
010
020
050
KmG
eogr
aphi
c pr
ojec
tion,
Dat
um W
GS
84
Lege
nd
!Sa
mpl
e fie
lds
for y
ield
sur
vey
!M
ain
citie
s
Prov
inci
al b
ound
arie
s
Inte
rnat
iona
l bou
ndar
ies
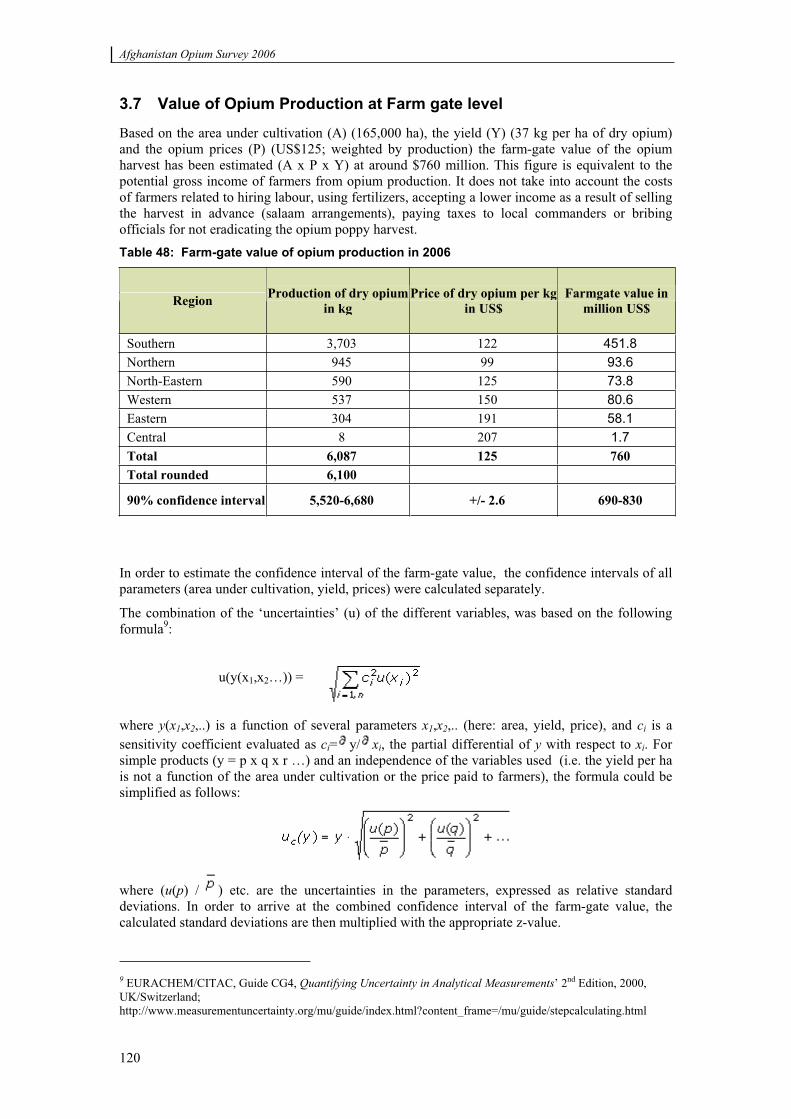
Afghanistan Opium Survey 2006
120
3.7 Value of Opium Production at Farm gate level
Based on the area under cultivation (A) (165,000 ha), the yield (Y) (37 kg per ha of dry opium) and the opium prices (P) (US$125; weighted by production) the farm-gate value of the opium harvest has been estimated (A x P x Y) at around $760 million. This figure is equivalent to the potential gross income of farmers from opium production. It does not take into account the costs of farmers related to hiring labour, using fertilizers, accepting a lower income as a result of selling the harvest in advance (salaam arrangements), paying taxes to local commanders or bribing officials for not eradicating the opium poppy harvest. Table 48: Farm-gate value of opium production in 2006
Region Production of dry opiumin kg
Price of dry opium per kgin US$
Farmgate value in million US$
Southern 3,703 122 451.8Northern 945 99 93.6North-Eastern 590 125 73.8Western 537 150 80.6Eastern 304 191 58.1Central 8 207 1.7Total 6,087 125 760 Total rounded 6,100
90% confidence interval 5,520-6,680 +/- 2.6 690-830
In order to estimate the confidence interval of the farm-gate value, the confidence intervals of all parameters (area under cultivation, yield, prices) were calculated separately.
The combination of the ‘uncertainties’ (u) of the different variables, was based on the following formula9:
u(y(x1,x2…)) =
where y(x1,x2,..) is a function of several parameters x1,x2,.. (here: area, yield, price), and ci is a sensitivity coefficient evaluated as ci= y/ xi, the partial differential of y with respect to xi. For simple products (y = p x q x r …) and an independence of the variables used (i.e. the yield per ha is not a function of the area under cultivation or the price paid to farmers), the formula could be simplified as follows:
where (u(p) / ) etc. are the uncertainties in the parameters, expressed as relative standard deviations. In order to arrive at the combined confidence interval of the farm-gate value, the calculated standard deviations are then multiplied with the appropriate z-value.
9 EURACHEM/CITAC, Guide CG4, Quantifying Uncertainty in Analytical Measurements’ 2nd Edition, 2000, UK/Switzerland; http://www.measurementuncertainty.org/mu/guide/index.html?content_frame=/mu/guide/stepcalculating.html
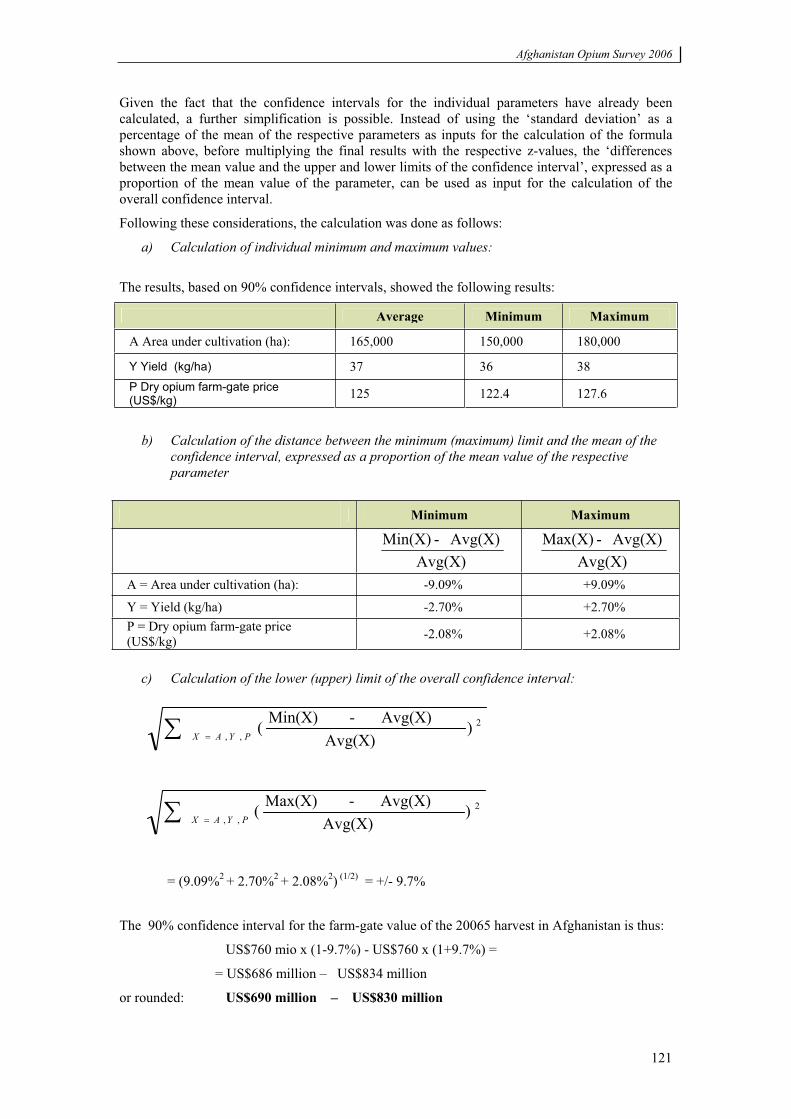
Afghanistan Opium Survey 2006
121
Given the fact that the confidence intervals for the individual parameters have already been calculated, a further simplification is possible. Instead of using the ‘standard deviation’ as a percentage of the mean of the respective parameters as inputs for the calculation of the formula shown above, before multiplying the final results with the respective z-values, the ‘differences between the mean value and the upper and lower limits of the confidence interval’, expressed as a proportion of the mean value of the parameter, can be used as input for the calculation of the overall confidence interval.
Following these considerations, the calculation was done as follows:
a) Calculation of individual minimum and maximum values:
The results, based on 90% confidence intervals, showed the following results:
Average Minimum Maximum
A Area under cultivation (ha): 165,000 150,000 180,000
Y Yield (kg/ha) 37 36 38 P Dry opium farm-gate price (US$/kg) 125 122.4 127.6
b) Calculation of the distance between the minimum (maximum) limit and the mean of the confidence interval, expressed as a proportion of the mean value of the respective parameter
Minimum Maximum
Avg(X)Avg(X)-Min(X)
Avg(X)Avg(X)-Max(X)
A = Area under cultivation (ha): -9.09% +9.09%
Y = Yield (kg/ha) -2.70% +2.70% P = Dry opium farm-gate price (US$/kg) -2.08% +2.08%
c) Calculation of the lower (upper) limit of the overall confidence interval:
PYAX ,,2)
Avg(X)Avg(X)-Min(X)(
PYAX ,,2)
Avg(X)Avg(X)-Max(X)(
= (9.09%2 + 2.70%2 + 2.08%2) (1/2) = +/- 9.7%
The 90% confidence interval for the farm-gate value of the 20065 harvest in Afghanistan is thus:
US$760 mio x (1-9.7%) - US$760 x (1+9.7%) =
= US$686 million – US$834 million
or rounded: US$690 million – US$830 million
Afghanistan Opium Survey 2006
122
3.8 Value of Afghan Opiates in Neighbouring Countries
Opiates are usually trafficked by Afghan traders to neighbouring countries. In general, Afghan traffickers are involved in shipping the opiates across the borders. From there onwards, traffickers from neighbouring countries take over the consignments. The value of the opium production (partly transformed into morphine/heroin) in neighbouring countries close to the borders with Afghanistan is thus considered to be a good proxy for the overall gross income made by Afghan citizens from the opium sector. 10 The approach taken to calculate such an income has remained largely unchanged as compared to previous years in order to guarantee direct comparability of the results.
The calculation has followed the following steps:
establishment of an appropriate conversion ratio of opium into heroin; establishment of a distribution pattern of opium production between (i) opium destined for exports and (ii) opium destined for transformation into heroin & morphine; establishment of a distribution pattern of (i) opium exports and of (ii) heroin & morphine exports;analysis of opium prices as well as of heroin & morphine prices in neighbouring countries in border regions with Afghanistan; using prices in neighbouring countries in the border regions with Afghanistan and the distribution pattern to calculate an average weighted export opium price and an average weighted heroin/morphine price; multiplying opium export volumes with export prices of opium to arrive at the value of opium exports and (ii) multiplying heroin & morphine export volumes with heroin and morphine export prices to arrive at the value of heroin and morphine exports.
Conversion of opium into heroin
The first question relates to the amounts of opium needed to produce 1 kg of heroin. Traditionally a 10:1 rule of thumb ratio has been used (10 kg of opium for 1 kg of heroin). Previous research showed that such a transformation ratio is correct for many opium producing countries, notably in countries of South-East Asia which until the early 1990s used to dominate global heroin production.
Afghanistan, however, is different. Dating back to the late 1950s, the analysis of an opium sample showed already a morphine content of almost 17%. Authorities in the Kyrgyz Republic reported that the morphine content of opium trafficked through their country (in general, originating in Afghanistan) ranged from 14% to 22%, with a typical morphine content of 18% (ARQ, 2001).11
Over the 2000-2003 period, UNODC collected opium samples across Afghanistan, dried them and analyzed the morphine content of these samples. Overall 39 opium samples from 29 test fields across Afghanistan were collected. The morphine content of dry opium in these samples ranged from 8% to 24%. The highest morphine yields over the 2000-2003 period were found in Badakshan (on average slightly more than 16%12). The average morphine content of fields in Nangarhar was above 15%. The average morphine content in Hilmand was above 12%. The average morphine content from the 39 samples in Afghanistan was 15% (confidence interval:
10 There are, of course, also traders from neighbouring countries (notably from Pakistan, Iran and Tajikistan) purchasing opiates in Afghanistan and smuggling them across the border. Similarly, some Afghan traffickers are involved in shipping the opiates from Afghanistan to the main transhipment markets, located further inland in neighbouring countries. These effects are considered to offset each other. 11 UNODC, Limited Opium Yield Assessment Surveys, Technical report: Observations and findings, December 2003.12 There was, however, a clear downward trend in the morphine content of opium in Badakshan; while the average morphine content was 18% in 2000 and 17% in 2001 it fell to 11% in 2003. This went hand in hand with a marked increase in the use of irrigated land for poppy cultivation (instead of rain-fed land), a strong increase in yields per hectare and a strong decline of opium prices, far below the national average.
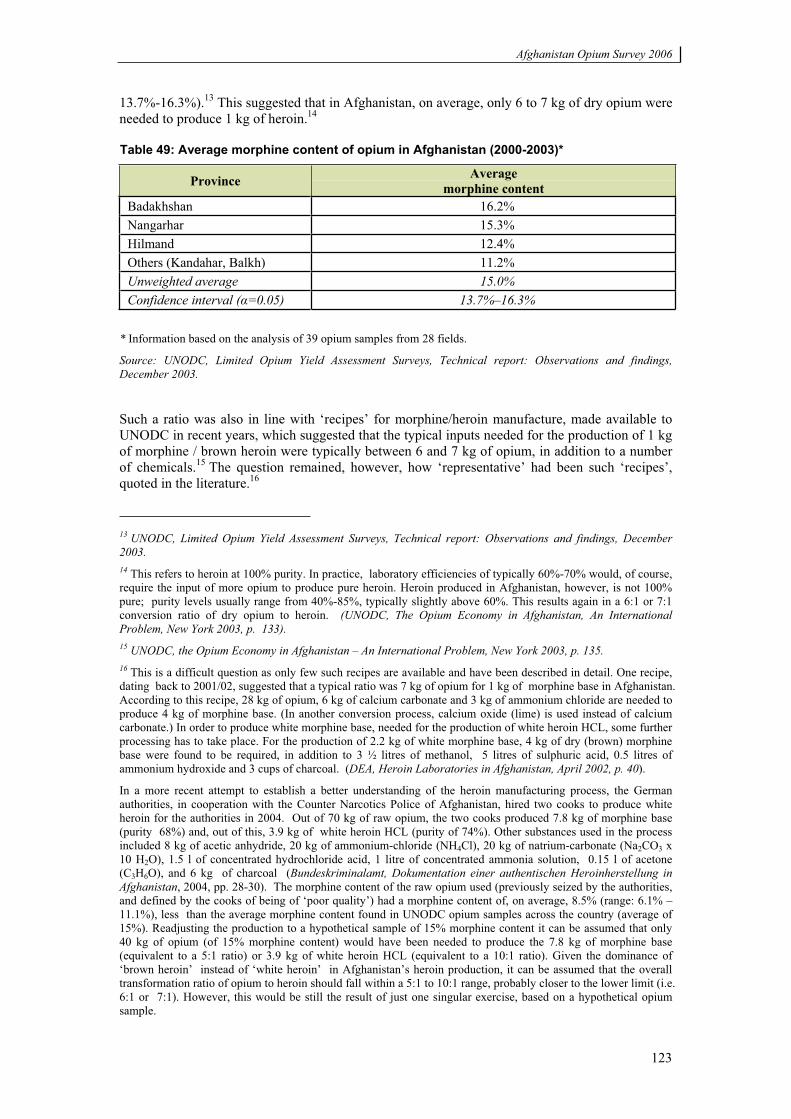
Afghanistan Opium Survey 2006
123
13.7%-16.3%).13 This suggested that in Afghanistan, on average, only 6 to 7 kg of dry opium were needed to produce 1 kg of heroin.14
Table 49: Average morphine content of opium in Afghanistan (2000-2003)*
Province Average morphine content
Badakhshan 16.2% Nangarhar 15.3% Hilmand 12.4% Others (Kandahar, Balkh) 11.2% Unweighted average 15.0% Confidence interval ( =0.05) 13.7%–16.3%
* Information based on the analysis of 39 opium samples from 28 fields.
Source: UNODC, Limited Opium Yield Assessment Surveys, Technical report: Observations and findings, December 2003.
Such a ratio was also in line with ‘recipes’ for morphine/heroin manufacture, made available to UNODC in recent years, which suggested that the typical inputs needed for the production of 1 kg of morphine / brown heroin were typically between 6 and 7 kg of opium, in addition to a number of chemicals.15 The question remained, however, how ‘representative’ had been such ‘recipes’, quoted in the literature.16
13 UNODC, Limited Opium Yield Assessment Surveys, Technical report: Observations and findings, December 2003.14 This refers to heroin at 100% purity. In practice, laboratory efficiencies of typically 60%-70% would, of course, require the input of more opium to produce pure heroin. Heroin produced in Afghanistan, however, is not 100% pure; purity levels usually range from 40%-85%, typically slightly above 60%. This results again in a 6:1 or 7:1 conversion ratio of dry opium to heroin. (UNODC, The Opium Economy in Afghanistan, An International Problem, New York 2003, p. 133). 15 UNODC, the Opium Economy in Afghanistan – An International Problem, New York 2003, p. 135. 16 This is a difficult question as only few such recipes are available and have been described in detail. One recipe, dating back to 2001/02, suggested that a typical ratio was 7 kg of opium for 1 kg of morphine base in Afghanistan. According to this recipe, 28 kg of opium, 6 kg of calcium carbonate and 3 kg of ammonium chloride are needed to produce 4 kg of morphine base. (In another conversion process, calcium oxide (lime) is used instead of calcium carbonate.) In order to produce white morphine base, needed for the production of white heroin HCL, some further processing has to take place. For the production of 2.2 kg of white morphine base, 4 kg of dry (brown) morphine base were found to be required, in addition to 3 ½ litres of methanol, 5 litres of sulphuric acid, 0.5 litres of ammonium hydroxide and 3 cups of charcoal. (DEA, Heroin Laboratories in Afghanistan, April 2002, p. 40).
In a more recent attempt to establish a better understanding of the heroin manufacturing process, the German authorities, in cooperation with the Counter Narcotics Police of Afghanistan, hired two cooks to produce white heroin for the authorities in 2004. Out of 70 kg of raw opium, the two cooks produced 7.8 kg of morphine base (purity 68%) and, out of this, 3.9 kg of white heroin HCL (purity of 74%). Other substances used in the process included 8 kg of acetic anhydride, 20 kg of ammonium-chloride (NH4Cl), 20 kg of natrium-carbonate (Na2CO3 x 10 H2O), 1.5 l of concentrated hydrochloride acid, 1 litre of concentrated ammonia solution, 0.15 l of acetone (C3H6O), and 6 kg of charcoal (Bundeskriminalamt, Dokumentation einer authentischen Heroinherstellung in Afghanistan, 2004, pp. 28-30). The morphine content of the raw opium used (previously seized by the authorities, and defined by the cooks of being of ‘poor quality’) had a morphine content of, on average, 8.5% (range: 6.1% – 11.1%), less than the average morphine content found in UNODC opium samples across the country (average of 15%). Readjusting the production to a hypothetical sample of 15% morphine content it can be assumed that only 40 kg of opium (of 15% morphine content) would have been needed to produce the 7.8 kg of morphine base (equivalent to a 5:1 ratio) or 3.9 kg of white heroin HCL (equivalent to a 10:1 ratio). Given the dominance of ‘brown heroin’ instead of ‘white heroin’ in Afghanistan’s heroin production, it can be assumed that the overall transformation ratio of opium to heroin should fall within a 5:1 to 10:1 range, probably closer to the lower limit (i.e. 6:1 or 7:1). However, this would be still the result of just one singular exercise, based on a hypothetical opium sample.
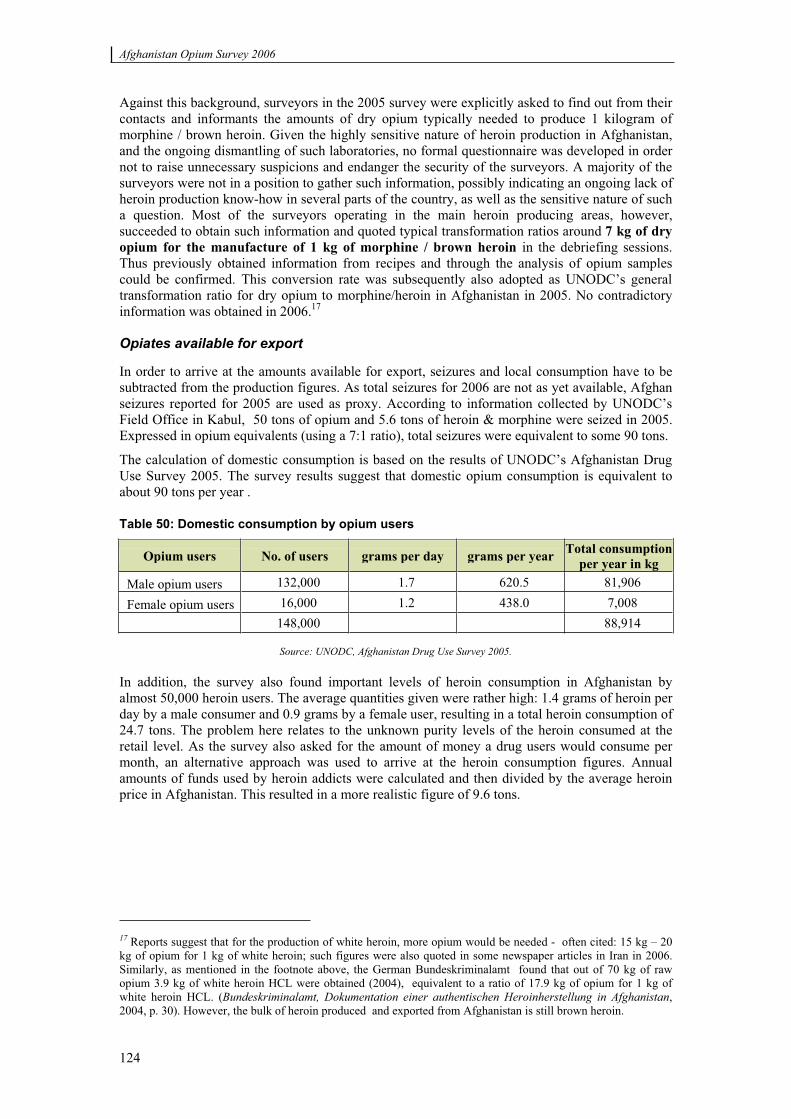
Afghanistan Opium Survey 2006
124
Against this background, surveyors in the 2005 survey were explicitly asked to find out from their contacts and informants the amounts of dry opium typically needed to produce 1 kilogram of morphine / brown heroin. Given the highly sensitive nature of heroin production in Afghanistan, and the ongoing dismantling of such laboratories, no formal questionnaire was developed in order not to raise unnecessary suspicions and endanger the security of the surveyors. A majority of the surveyors were not in a position to gather such information, possibly indicating an ongoing lack of heroin production know-how in several parts of the country, as well as the sensitive nature of such a question. Most of the surveyors operating in the main heroin producing areas, however, succeeded to obtain such information and quoted typical transformation ratios around 7 kg of dry opium for the manufacture of 1 kg of morphine / brown heroin in the debriefing sessions. Thus previously obtained information from recipes and through the analysis of opium samples could be confirmed. This conversion rate was subsequently also adopted as UNODC’s general transformation ratio for dry opium to morphine/heroin in Afghanistan in 2005. No contradictory information was obtained in 2006.17
Opiates available for export
In order to arrive at the amounts available for export, seizures and local consumption have to be subtracted from the production figures. As total seizures for 2006 are not as yet available, Afghan seizures reported for 2005 are used as proxy. According to information collected by UNODC’s Field Office in Kabul, 50 tons of opium and 5.6 tons of heroin & morphine were seized in 2005. Expressed in opium equivalents (using a 7:1 ratio), total seizures were equivalent to some 90 tons.
The calculation of domestic consumption is based on the results of UNODC’s Afghanistan Drug Use Survey 2005. The survey results suggest that domestic opium consumption is equivalent to about 90 tons per year .
Table 50: Domestic consumption by opium users
Opium users No. of users grams per day grams per year Total consumption per year in kg
Male opium users 132,000 1.7 620.5 81,906
Female opium users 16,000 1.2 438.0 7,008 148,000 88,914
Source: UNODC, Afghanistan Drug Use Survey 2005.
In addition, the survey also found important levels of heroin consumption in Afghanistan by almost 50,000 heroin users. The average quantities given were rather high: 1.4 grams of heroin per day by a male consumer and 0.9 grams by a female user, resulting in a total heroin consumption of 24.7 tons. The problem here relates to the unknown purity levels of the heroin consumed at the retail level. As the survey also asked for the amount of money a drug users would consume per month, an alternative approach was used to arrive at the heroin consumption figures. Annual amounts of funds used by heroin addicts were calculated and then divided by the average heroin price in Afghanistan. This resulted in a more realistic figure of 9.6 tons.
17 Reports suggest that for the production of white heroin, more opium would be needed - often cited: 15 kg – 20 kg of opium for 1 kg of white heroin; such figures were also quoted in some newspaper articles in Iran in 2006. Similarly, as mentioned in the footnote above, the German Bundeskriminalamt found that out of 70 kg of raw opium 3.9 kg of white heroin HCL were obtained (2004), equivalent to a ratio of 17.9 kg of opium for 1 kg of white heroin HCL. (Bundeskriminalamt, Dokumentation einer authentischen Heroinherstellung in Afghanistan,2004, p. 30). However, the bulk of heroin produced and exported from Afghanistan is still brown heroin.
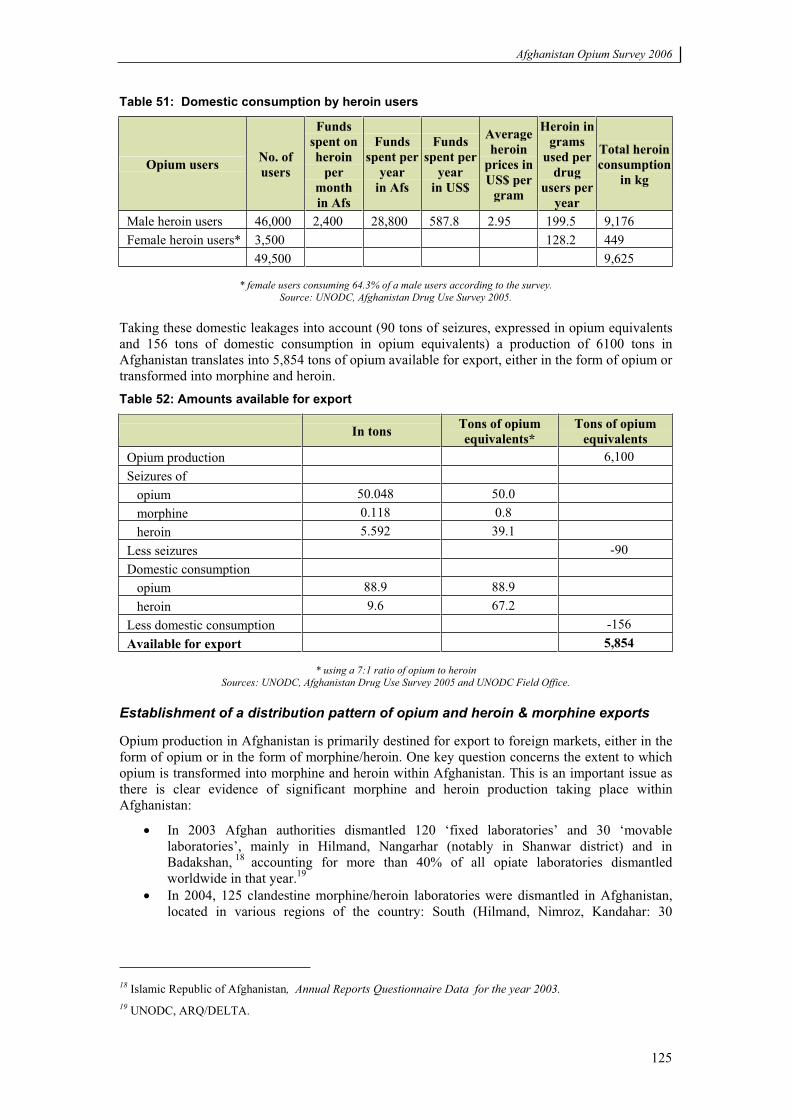
Afghanistan Opium Survey 2006
125
Table 51: Domestic consumption by heroin users
Opium users No. of users
Funds spent on heroin
permonthin Afs
Funds spent per
yearin Afs
Funds spent per
yearin US$
Average heroin
prices in US$ per
gram
Heroin in grams
used per drug
users per year
Total heroin consumption
in kg
Male heroin users 46,000 2,400 28,800 587.8 2.95 199.5 9,176 Female heroin users* 3,500 128.2 449 49,500 9,625
* female users consuming 64.3% of a male users according to the survey. Source: UNODC, Afghanistan Drug Use Survey 2005.
Taking these domestic leakages into account (90 tons of seizures, expressed in opium equivalents and 156 tons of domestic consumption in opium equivalents) a production of 6100 tons in Afghanistan translates into 5,854 tons of opium available for export, either in the form of opium or transformed into morphine and heroin. Table 52: Amounts available for export
In tons Tons of opium equivalents*
Tons of opium equivalents
Opium production 6,100 Seizures of opium 50.048 50.0 morphine 0.118 0.8 heroin 5.592 39.1 Less seizures -90 Domestic consumption opium 88.9 88.9 heroin 9.6 67.2 Less domestic consumption -156 Available for export 5,854
* using a 7:1 ratio of opium to heroin Sources: UNODC, Afghanistan Drug Use Survey 2005 and UNODC Field Office.
Establishment of a distribution pattern of opium and heroin & morphine exports
Opium production in Afghanistan is primarily destined for export to foreign markets, either in the form of opium or in the form of morphine/heroin. One key question concerns the extent to which opium is transformed into morphine and heroin within Afghanistan. This is an important issue as there is clear evidence of significant morphine and heroin production taking place within Afghanistan:
In 2003 Afghan authorities dismantled 120 ‘fixed laboratories’ and 30 ‘movable laboratories’, mainly in Hilmand, Nangarhar (notably in Shanwar district) and in Badakshan, 18 accounting for more than 40% of all opiate laboratories dismantled worldwide in that year.19
In 2004, 125 clandestine morphine/heroin laboratories were dismantled in Afghanistan, located in various regions of the country: South (Hilmand, Nimroz, Kandahar: 30
18 Islamic Republic of Afghanistan, Annual Reports Questionnaire Data for the year 2003. 19 UNODC, ARQ/DELTA.
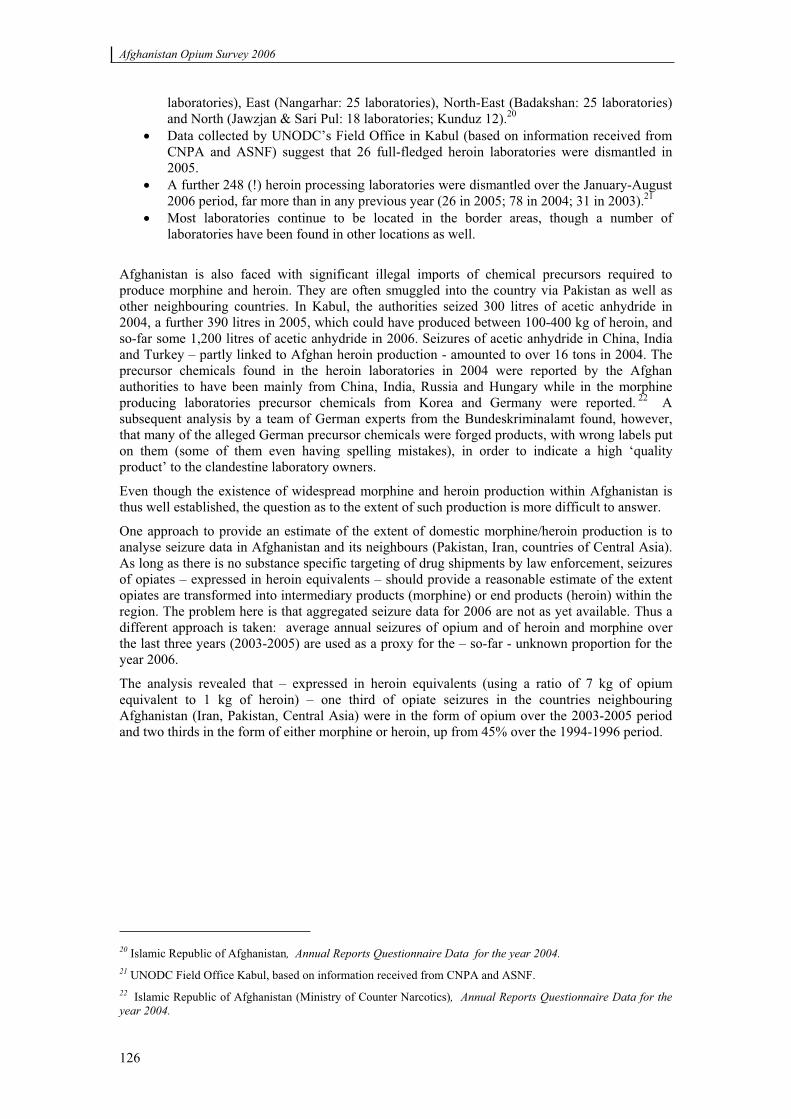
Afghanistan Opium Survey 2006
126
laboratories), East (Nangarhar: 25 laboratories), North-East (Badakshan: 25 laboratories) and North (Jawzjan & Sari Pul: 18 laboratories; Kunduz 12).20
Data collected by UNODC’s Field Office in Kabul (based on information received from CNPA and ASNF) suggest that 26 full-fledged heroin laboratories were dismantled in 2005. A further 248 (!) heroin processing laboratories were dismantled over the January-August 2006 period, far more than in any previous year (26 in 2005; 78 in 2004; 31 in 2003).21
Most laboratories continue to be located in the border areas, though a number of laboratories have been found in other locations as well.
Afghanistan is also faced with significant illegal imports of chemical precursors required to produce morphine and heroin. They are often smuggled into the country via Pakistan as well as other neighbouring countries. In Kabul, the authorities seized 300 litres of acetic anhydride in 2004, a further 390 litres in 2005, which could have produced between 100-400 kg of heroin, and so-far some 1,200 litres of acetic anhydride in 2006. Seizures of acetic anhydride in China, India and Turkey – partly linked to Afghan heroin production - amounted to over 16 tons in 2004. The precursor chemicals found in the heroin laboratories in 2004 were reported by the Afghan authorities to have been mainly from China, India, Russia and Hungary while in the morphine producing laboratories precursor chemicals from Korea and Germany were reported. 22 A subsequent analysis by a team of German experts from the Bundeskriminalamt found, however, that many of the alleged German precursor chemicals were forged products, with wrong labels put on them (some of them even having spelling mistakes), in order to indicate a high ‘quality product’ to the clandestine laboratory owners.
Even though the existence of widespread morphine and heroin production within Afghanistan is thus well established, the question as to the extent of such production is more difficult to answer.
One approach to provide an estimate of the extent of domestic morphine/heroin production is to analyse seizure data in Afghanistan and its neighbours (Pakistan, Iran, countries of Central Asia). As long as there is no substance specific targeting of drug shipments by law enforcement, seizures of opiates – expressed in heroin equivalents – should provide a reasonable estimate of the extent opiates are transformed into intermediary products (morphine) or end products (heroin) within the region. The problem here is that aggregated seizure data for 2006 are not as yet available. Thus a different approach is taken: average annual seizures of opium and of heroin and morphine over the last three years (2003-2005) are used as a proxy for the – so-far - unknown proportion for the year 2006.
The analysis revealed that – expressed in heroin equivalents (using a ratio of 7 kg of opium equivalent to 1 kg of heroin) – one third of opiate seizures in the countries neighbouring Afghanistan (Iran, Pakistan, Central Asia) were in the form of opium over the 2003-2005 period and two thirds in the form of either morphine or heroin, up from 45% over the 1994-1996 period.
20 Islamic Republic of Afghanistan, Annual Reports Questionnaire Data for the year 2004. 21 UNODC Field Office Kabul, based on information received from CNPA and ASNF.22 Islamic Republic of Afghanistan (Ministry of Counter Narcotics), Annual Reports Questionnaire Data for the year 2004.
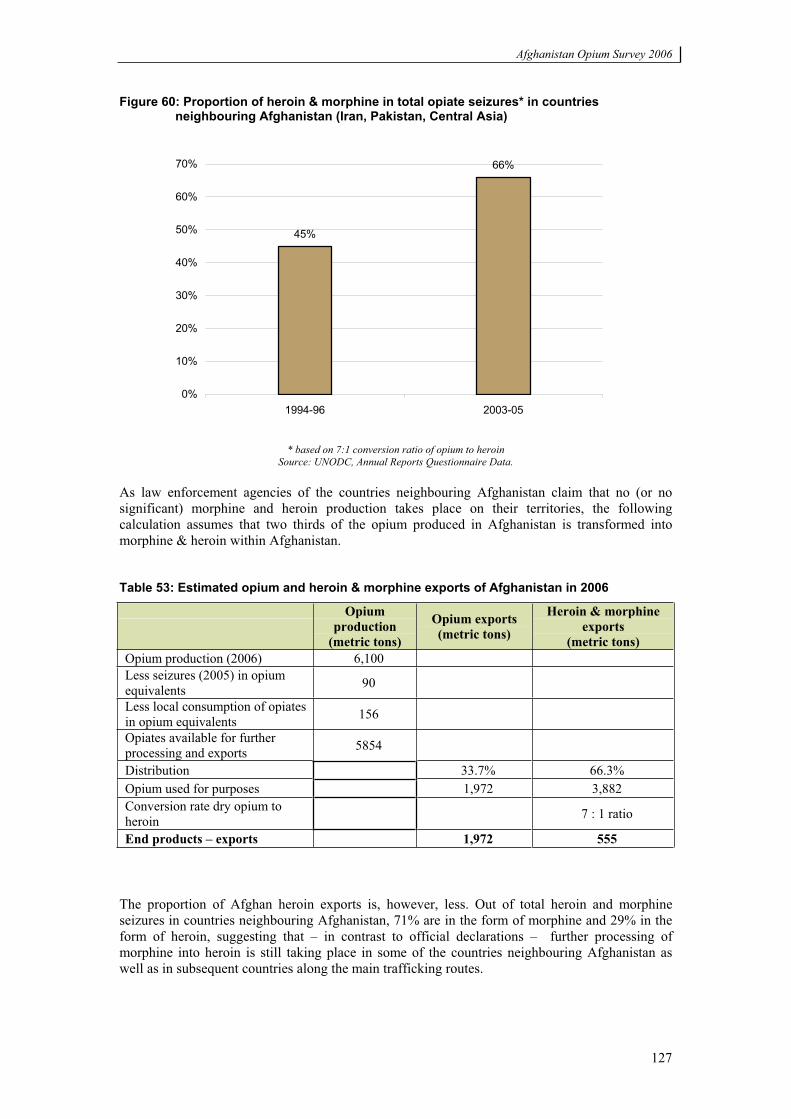
Afghanistan Opium Survey 2006
127
Figure 60: Proportion of heroin & morphine in total opiate seizures* in countries neighbouring Afghanistan (Iran, Pakistan, Central Asia)
45%
66%
0%
10%
20%
30%
40%
50%
60%
70%
1994-96 2003-05
* based on 7:1 conversion ratio of opium to heroin Source: UNODC, Annual Reports Questionnaire Data.
As law enforcement agencies of the countries neighbouring Afghanistan claim that no (or no significant) morphine and heroin production takes place on their territories, the following calculation assumes that two thirds of the opium produced in Afghanistan is transformed into morphine & heroin within Afghanistan.
Table 53: Estimated opium and heroin & morphine exports of Afghanistan in 2006
Opiumproduction
(metric tons)
Opium exports (metric tons)
Heroin & morphine exports
(metric tons) Opium production (2006) 6,100 Less seizures (2005) in opium equivalents 90
Less local consumption of opiates in opium equivalents 156
Opiates available for further processing and exports 5854
Distribution 33.7% 66.3% Opium used for purposes 1,972 3,882 Conversion rate dry opium to heroin 7 : 1 ratio
End products – exports 1,972 555
The proportion of Afghan heroin exports is, however, less. Out of total heroin and morphine seizures in countries neighbouring Afghanistan, 71% are in the form of morphine and 29% in the form of heroin, suggesting that – in contrast to official declarations – further processing of morphine into heroin is still taking place in some of the countries neighbouring Afghanistan as well as in subsequent countries along the main trafficking routes.
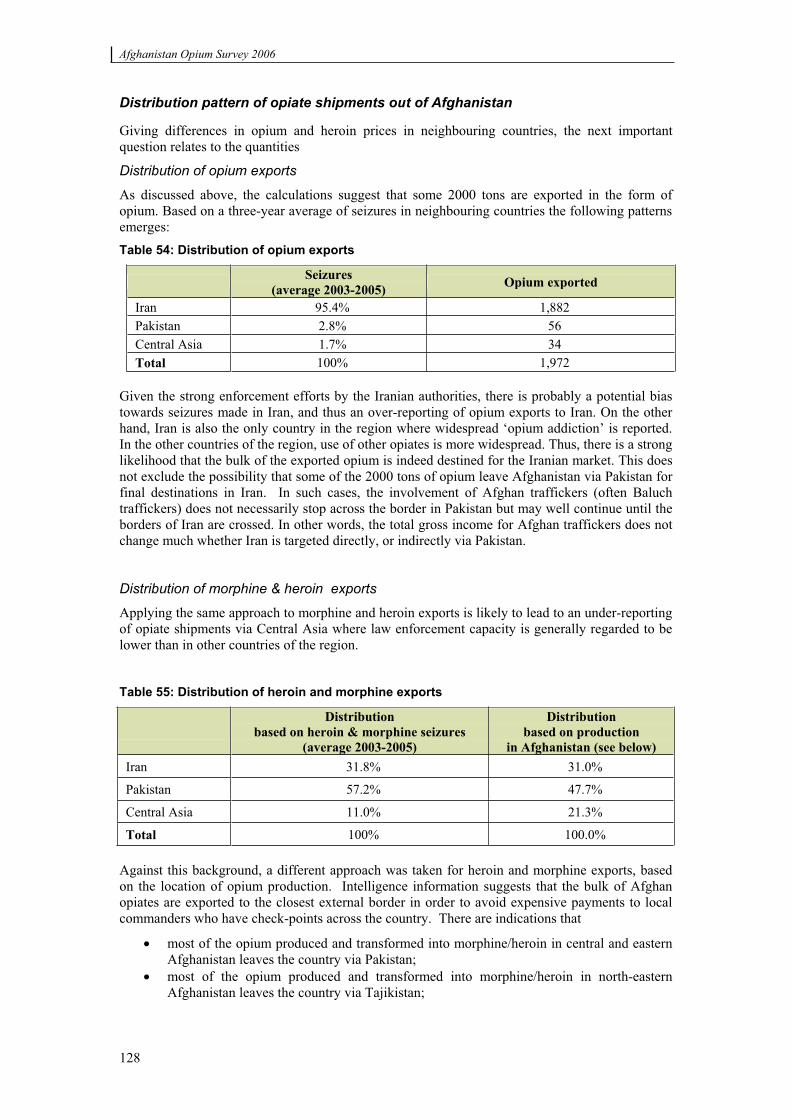
Afghanistan Opium Survey 2006
128
Distribution pattern of opiate shipments out of Afghanistan
Giving differences in opium and heroin prices in neighbouring countries, the next important question relates to the quantities
Distribution of opium exports
As discussed above, the calculations suggest that some 2000 tons are exported in the form of opium. Based on a three-year average of seizures in neighbouring countries the following patterns emerges: Table 54: Distribution of opium exports
Seizures (average 2003-2005) Opium exported
Iran 95.4% 1,882 Pakistan 2.8% 56 Central Asia 1.7% 34 Total 100% 1,972
Given the strong enforcement efforts by the Iranian authorities, there is probably a potential bias towards seizures made in Iran, and thus an over-reporting of opium exports to Iran. On the other hand, Iran is also the only country in the region where widespread ‘opium addiction’ is reported. In the other countries of the region, use of other opiates is more widespread. Thus, there is a strong likelihood that the bulk of the exported opium is indeed destined for the Iranian market. This does not exclude the possibility that some of the 2000 tons of opium leave Afghanistan via Pakistan for final destinations in Iran. In such cases, the involvement of Afghan traffickers (often Baluch traffickers) does not necessarily stop across the border in Pakistan but may well continue until the borders of Iran are crossed. In other words, the total gross income for Afghan traffickers does not change much whether Iran is targeted directly, or indirectly via Pakistan.
Distribution of morphine & heroin exports
Applying the same approach to morphine and heroin exports is likely to lead to an under-reporting of opiate shipments via Central Asia where law enforcement capacity is generally regarded to be lower than in other countries of the region.
Table 55: Distribution of heroin and morphine exports
Distribution based on heroin & morphine seizures
(average 2003-2005)
Distribution based on production
in Afghanistan (see below) Iran 31.8% 31.0%
Pakistan 57.2% 47.7%
Central Asia 11.0% 21.3%
Total 100% 100.0%
Against this background, a different approach was taken for heroin and morphine exports, based on the location of opium production. Intelligence information suggests that the bulk of Afghan opiates are exported to the closest external border in order to avoid expensive payments to local commanders who have check-points across the country. There are indications that
most of the opium produced and transformed into morphine/heroin in central and eastern Afghanistan leaves the country via Pakistan; most of the opium produced and transformed into morphine/heroin in north-eastern Afghanistan leaves the country via Tajikistan;
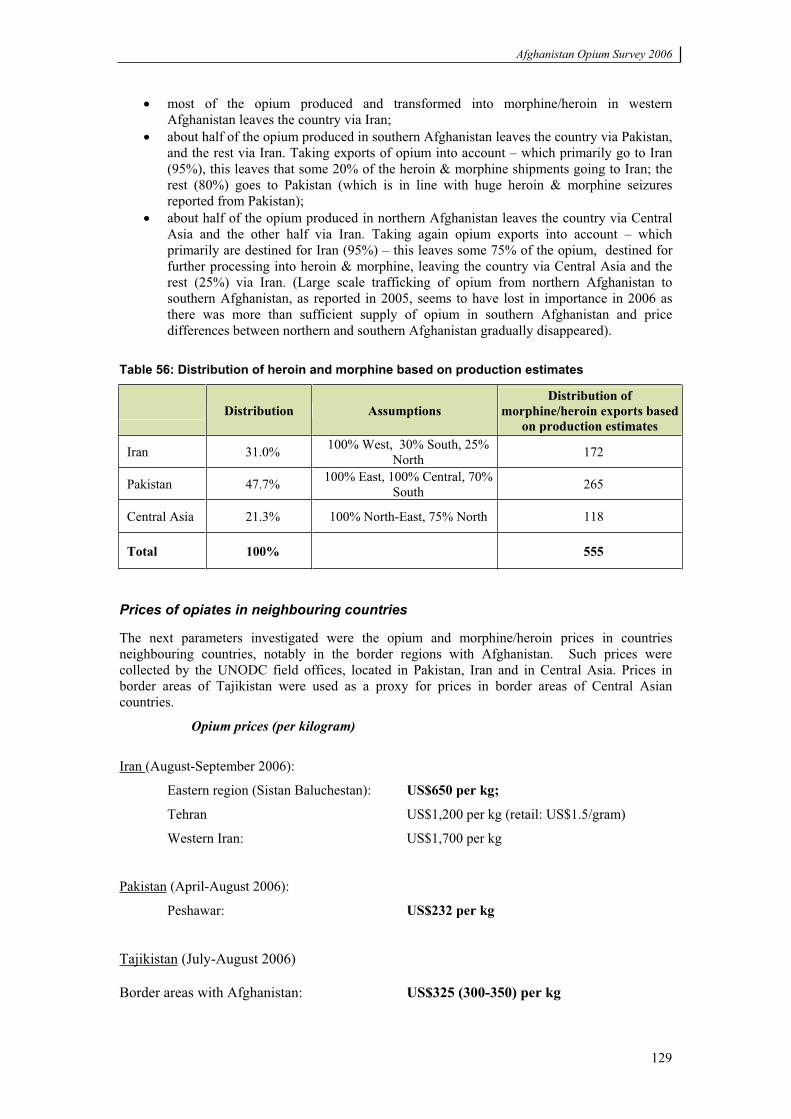
Afghanistan Opium Survey 2006
129
most of the opium produced and transformed into morphine/heroin in western Afghanistan leaves the country via Iran; about half of the opium produced in southern Afghanistan leaves the country via Pakistan, and the rest via Iran. Taking exports of opium into account – which primarily go to Iran (95%), this leaves that some 20% of the heroin & morphine shipments going to Iran; the rest (80%) goes to Pakistan (which is in line with huge heroin & morphine seizures reported from Pakistan); about half of the opium produced in northern Afghanistan leaves the country via Central Asia and the other half via Iran. Taking again opium exports into account – which primarily are destined for Iran (95%) – this leaves some 75% of the opium, destined for further processing into heroin & morphine, leaving the country via Central Asia and the rest (25%) via Iran. (Large scale trafficking of opium from northern Afghanistan to southern Afghanistan, as reported in 2005, seems to have lost in importance in 2006 as there was more than sufficient supply of opium in southern Afghanistan and price differences between northern and southern Afghanistan gradually disappeared).
Table 56: Distribution of heroin and morphine based on production estimates
Distribution Assumptions Distribution of
morphine/heroin exports based on production estimates
Iran 31.0% 100% West, 30% South, 25% North 172
Pakistan 47.7% 100% East, 100% Central, 70% South 265
Central Asia 21.3% 100% North-East, 75% North 118
Total 100% 555
Prices of opiates in neighbouring countries
The next parameters investigated were the opium and morphine/heroin prices in countries neighbouring countries, notably in the border regions with Afghanistan. Such prices were collected by the UNODC field offices, located in Pakistan, Iran and in Central Asia. Prices in border areas of Tajikistan were used as a proxy for prices in border areas of Central Asian countries.
Opium prices (per kilogram)
Iran (August-September 2006):
Eastern region (Sistan Baluchestan): US$650 per kg;
Tehran US$1,200 per kg (retail: US$1.5/gram)
Western Iran: US$1,700 per kg
Pakistan (April-August 2006):
Peshawar: US$232 per kg
Tajikistan (July-August 2006)
Border areas with Afghanistan: US$325 (300-350) per kg
Afghanistan Opium Survey 2006
130
Dushanbe: US$ 425 (400-450) per kg
Heroin prices (per kilogram)
Iran (August-September 2006):
Eastern region (Sistan Baluchistan): US$2,200 per kilogram (40%-50% purity)
Tehran: US$3,450 per kilogram
Western provinces: US$4,900 per kilogram
Prices are, however, not directly comparable with those in Afghanistan due to dilutions with other substances.
Calculation of the purity adjustment ratio:
Afghanistan: brown heroin (base): 68% purity23
Sistan Baluchistan: (brown) heroin : 45% (40%-50% purity):
Purity adjustment ratio: 1.5
Purity adjusted prices in Sistan Baluchistan
(adjusted to Afghan purity levels) US$3,300 (US$2200 *1.5) per kilogram
Pakistan (May-August 2006):
Peshawar: US$3,135 per kilogram
Tajikistan (July-August 2006)
- high-quality heroin prices:Dushanbe (January-June 2006) US$4600 (4,500-4,700) per kilogram Dushanbe (July-August 2006) US$4250 (4,000-4,500) per kilogram Change: -7.6%
Kathlon (January-June 2006) US$4,000 per kilogram Pamir (January-June 2006) US$4,250 (4000-4500) per kilogram Average (January-June 2006) US$4,125 per kilogram
Estimated prices over July-August 2006: Assumed change in drug prices24: -7.6% Average (border areas with Afghanistan) U$3,810 (4125 * (1-7.6%)) per kilogram
23 Bundeskriminalamt, Dokumentation einer authentischen Heroinherstellung in Afghanistan, Wiesbaden 2005.24 No high-purity heroin prices were collected over the July-August period in the Tajik border regions with Afghanistan; however, low purity heroin prices showed a decline in the border areas. It can be thus assumed that high-purity heroin prices declined as well. The decline reported from Dushanbe is used as a proxy for the likely decline in the border regions.
Afghanistan Opium Survey 2006
131
Results
Combining all the elements discussed above, the calculations result in a likely overall gross income (‘value added’) of around US$3.1 billion for Afghanistan (farmers and traffickers) from the opium sector for 2006. This would be equivalent to about 46% of legal GDP (US$6.7 billion in 2005/06) or 32% of overall GDP in Afghanistan. Table 57: Estimate of potential total Afghan gross income from the opium sector in 2006
Opium exports
Opium prices per
kg
Opium distribution
based on seizures
Heroin & morphine exports
Heroinprice per kg
Heroin & morphine
distribution based on
opium production
Total
Total exports in tons 1,972 mt 555 mt
Iran US$650 95.4% US$3,300 31.0%
Pakistan US$232 2.8% US$3,135 47.7%
Central Asia US$325 1.7% US$3,810 21.3% Average export price weighted by distribution
US$ 633 100.0% US$ 3,330 100.0%
Value in billion US$ (exports in kg × export price in US$)
US$ 1.25
billion
US$ 1.85 billion
US$ 3.1
billion
The calculations suggest an average export price for opium of US$633 per kilograms and for heroin of US$3,330 per kilogram. Both the average opium price and the average heroin price were thus lower than a year earlier (US$893 and US$3,856), reflecting increased production in 2006. Data also suggest that the decline in opium prices was more pronounced (-30%) than the decline in heroin prices (-14%).
Deducting the farmers’ income of US$0.76 billion, the overall gross income for traffickers amounts to US$2.34 billion in 2006, slightly more than traffickers gross profits in 2005 (US$2.14 billion). The estimate does not take into account the fact that some Afghan traffickers do not only ship the opium or heroin to the borders of neighbouring countries, but also onwards to major transhipment places where prices are usually far higher. On the other hand, not all of the opiates are smuggled out of the country by Afghan traffickers. Some of the opium and heroin is also being trafficked by traders from neighbouring countries, notably from Pakistan, Iran and Tajikistan, to markets outside Afghanistan. The estimate above assumes that these additional factors more or less offset each other.
Confidence interval
The best available mid-point estimate has been given above. Nonetheless, it must be clear that there could be significant variations, if actual values of the key parameters used were to fall towards the lower or the higher end of the respective ranges. In the following sub-chapter, the 90% confidence interval of the various indicators will be calculated and discussed.
Production (90% confidence interval)
The calculation of the range of opium production was already discussed in the methodology sub-chapter on the value of opium production. Opium production could range from 5,520 to 6,680 tons. Deducting domestic leakages due to seizures and domestic consumption (246 tons), the amounts available for export would range from 5,274 to 6,434 tons.
Afghanistan Opium Survey 2006
132
Based on this confidence interval, Afghan opium exports could range from 1,777 to 2,168 tons, and morphine & heroin exports from 500 to 609 tons.
Calculation of 90% confidence interval for opium and heroin & morphine exports.
Opium production:
range: 5,520 – 6,680 metric tons (mean: 6,100 tons)
less seizures: 90 metric tons
less local consumption: 156 metric tons
Available for export:
Range: 5,274 – 6,434 metric tons
Opium exports (33.7% of production)
range: 1,777 - 2,168 metric tons (+/- 9.9% of mean of 1,972 tons)
Heroin & morphine exports (66.3% of production; 7:1 ratio)
range: 500-609 metric tons; (+/- 9.9% of mean of 555 tons)
The calculation of a confidence intervals for price data in the countries neighbouring Afghanistan has been far more difficult as UNODC is not directly involved in the data collection process and thus does not have the raw data at its disposal. Price ranges, aiming to reflect a 90% confidence interval, have been calculated for neighbouring countries; but they must be treated with caution.
In the case of Tajikistan minimum and maximum prices have been available for opium for the July-August 2006 period. With regard to heroin, they have been only available for the January-June 2006 period. There were, however, indications that not only opium but also heroin prices decreased over the July-August period. Price information of low purity heroin – which declined – was available, but it was not clear to what extent changes in purity levels were responsible for the decline. In order to take the likely price declines into account, changes in heroin prices, identified in other parts of the country were used as a proxy for the likely change in the border areas. There has been, however, no possibility to evaluate the confidence interval arising from this downward adjustment of heroin prices.
In the case of Iran, no ranges for the opium prices in Sistan Baluchistan were reported in 2006. However, time series data of opium price fluctuations for 2004/05 exist. Based on these price fluctuations, a 90% confidence interval of the mean price was established last year. The results were applied to the new price data for 2006.
In the case of Pakistan (Peshawar), no minimum and maximum prices were reported. However, time series data for 2006 exist, which enabled the calculation of a confidence interval.
Prices (90% confidence interval)
Opium prices in Iran (Sistan Baluchistan): US$624-U$676; +/- 4% of mean (US$650)
Afghanistan Opium Survey 2006
133
Opium prices in Pakistan (Peshawar): US$214-US$250; +/- 8% of mean (US232)
Opium prices in Tajikistan (border region): US$300-US$350; +/- 17% of mean (US$300)
Heroin prices in Iran (Sistan Baluchistan): Mean: US$2,200
Adjusted for falling purity levels:
Heroin prices in Iran (Sistan Baluchistan): US$2,937-US$3,663; +/- 11% of mean ($3300)
Heroin prices in Pakistan (Peshawar): US$2,696-US$3,574; +/- 14% of mean ($3135)
Heroin prices in Tajkistan (border region): US$3750-US$4,500; +/- 9% of mean ($4125)
Adjusted for decline in summer months:
Heroin prices in Tajkistan (border region): US$3,470-US$4,150; +/- 9% of mean ($3810)
Based on these price ranges and opiate production & export ranges, the following confidence intervals (90%) could be calculated:
a) Keeping production levels constant and multiplying them with minimum and maximum prices would result in a range of US$2.8 to US$3.4 billion;
b) Keeping prices constant and calculating the confidence intervals based on minimum and maximum production levels, would result in a range of US$2.8 to US$3.3 billion;
c) Calculating the average minimum export prices (US$607 for opium and 2,995 for heroin), the average maximum export prices (US$658 for opium and 3,799 for heroin), as well as the minimum and maximum production estimates, and applying the formula shown below, gives a range of the value of the Afghan opiates market of US$2.7 to US$3.5 billion.
The last estimate is considered to be the best for the overall 90% confidence interval of the figure of US$3.1 billion. It can be thus stated that the size of the Afghan opiate industry is equivalent to between 40% and 52% of licit Afghan GDP in 2006, with the best estimate suggesting a proportion equivalent to 46% of GDP.
= Avg(j1) x Avg(j2) x (1-2
1
2)Avg(j)
Avg(j)-Min(j)(j
) (minimum)
Avg(j1) x Avg(j2) x (1+2
1
2)Avg(j)
Avg(j)-Max(j)(j
) (maximum)
where j=1 for prices and j=2 for production
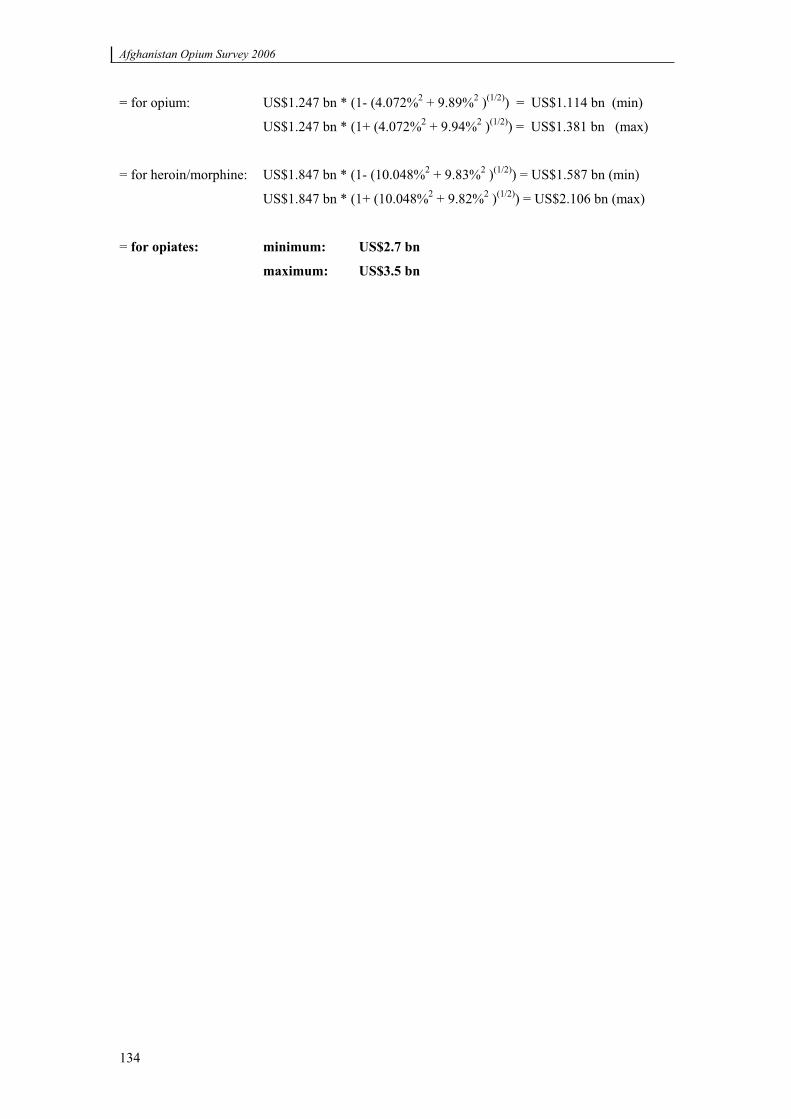
Afghanistan Opium Survey 2006
134
= for opium: US$1.247 bn * (1- (4.072%2 + 9.89%2 )(1/2)) = US$1.114 bn (min)
US$1.247 bn * (1+ (4.072%2 + 9.94%2 )(1/2)) = US$1.381 bn (max)
= for heroin/morphine: US$1.847 bn * (1- (10.048%2 + 9.83%2 )(1/2)) = US$1.587 bn (min)
US$1.847 bn * (1+ (10.048%2 + 9.82%2 )(1/2)) = US$2.106 bn (max)
= for opiates: minimum: US$2.7 bn
maximum: US$3.5 bn

135
4 ANNEXES

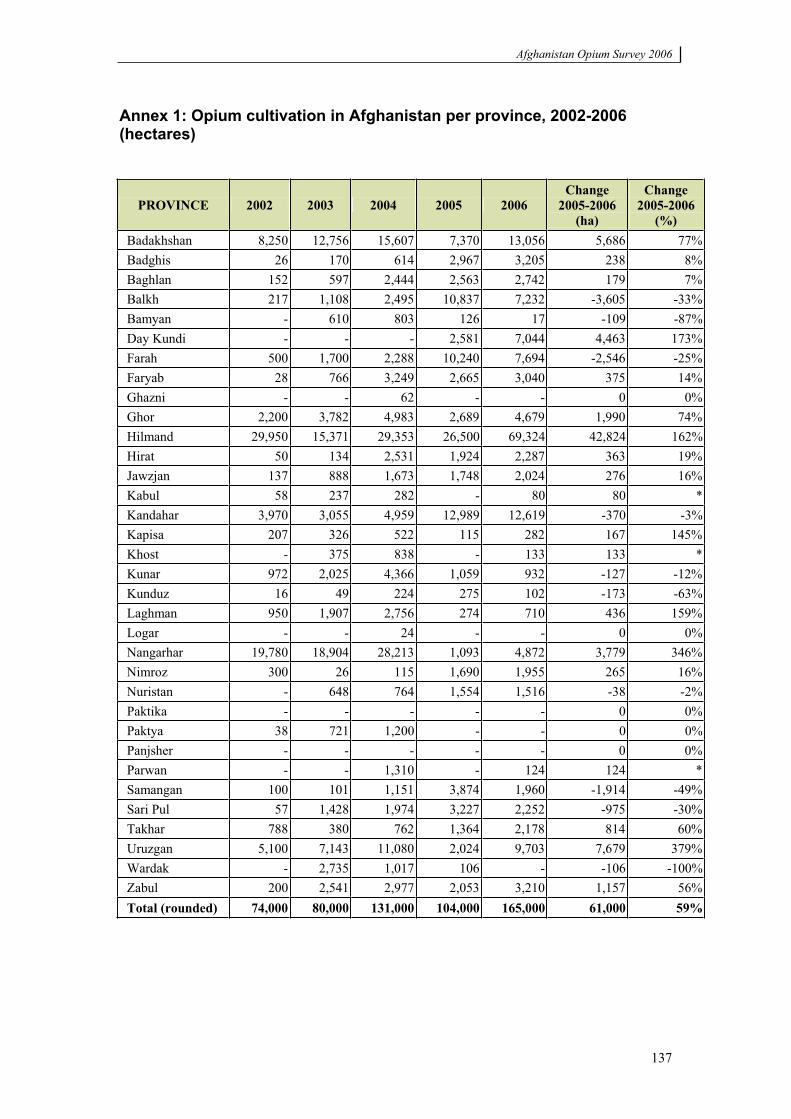
Afghanistan Opium Survey 2006
137
Annex 1: Opium cultivation in Afghanistan per province, 2002-2006 (hectares)
PROVINCE 2002 2003 2004 2005 2006 Change
2005-2006 (ha)
Change 2005-2006
(%) Badakhshan 8,250 12,756 15,607 7,370 13,056 5,686 77%Badghis 26 170 614 2,967 3,205 238 8%Baghlan 152 597 2,444 2,563 2,742 179 7%Balkh 217 1,108 2,495 10,837 7,232 -3,605 -33%Bamyan - 610 803 126 17 -109 -87%Day Kundi - - - 2,581 7,044 4,463 173%Farah 500 1,700 2,288 10,240 7,694 -2,546 -25%Faryab 28 766 3,249 2,665 3,040 375 14%Ghazni - - 62 - - 0 0%Ghor 2,200 3,782 4,983 2,689 4,679 1,990 74%Hilmand 29,950 15,371 29,353 26,500 69,324 42,824 162%Hirat 50 134 2,531 1,924 2,287 363 19%Jawzjan 137 888 1,673 1,748 2,024 276 16%Kabul 58 237 282 - 80 80 *Kandahar 3,970 3,055 4,959 12,989 12,619 -370 -3%Kapisa 207 326 522 115 282 167 145%Khost - 375 838 - 133 133 *Kunar 972 2,025 4,366 1,059 932 -127 -12%Kunduz 16 49 224 275 102 -173 -63%Laghman 950 1,907 2,756 274 710 436 159%Logar - - 24 - - 0 0%Nangarhar 19,780 18,904 28,213 1,093 4,872 3,779 346%Nimroz 300 26 115 1,690 1,955 265 16%Nuristan - 648 764 1,554 1,516 -38 -2%Paktika - - - - - 0 0%Paktya 38 721 1,200 - - 0 0%Panjsher - - - - - 0 0%Parwan - - 1,310 - 124 124 *Samangan 100 101 1,151 3,874 1,960 -1,914 -49%Sari Pul 57 1,428 1,974 3,227 2,252 -975 -30%Takhar 788 380 762 1,364 2,178 814 60%Uruzgan 5,100 7,143 11,080 2,024 9,703 7,679 379%Wardak - 2,735 1,017 106 - -106 -100%Zabul 200 2,541 2,977 2,053 3,210 1,157 56%Total (rounded) 74,000 80,000 131,000 104,000 165,000 61,000 59%
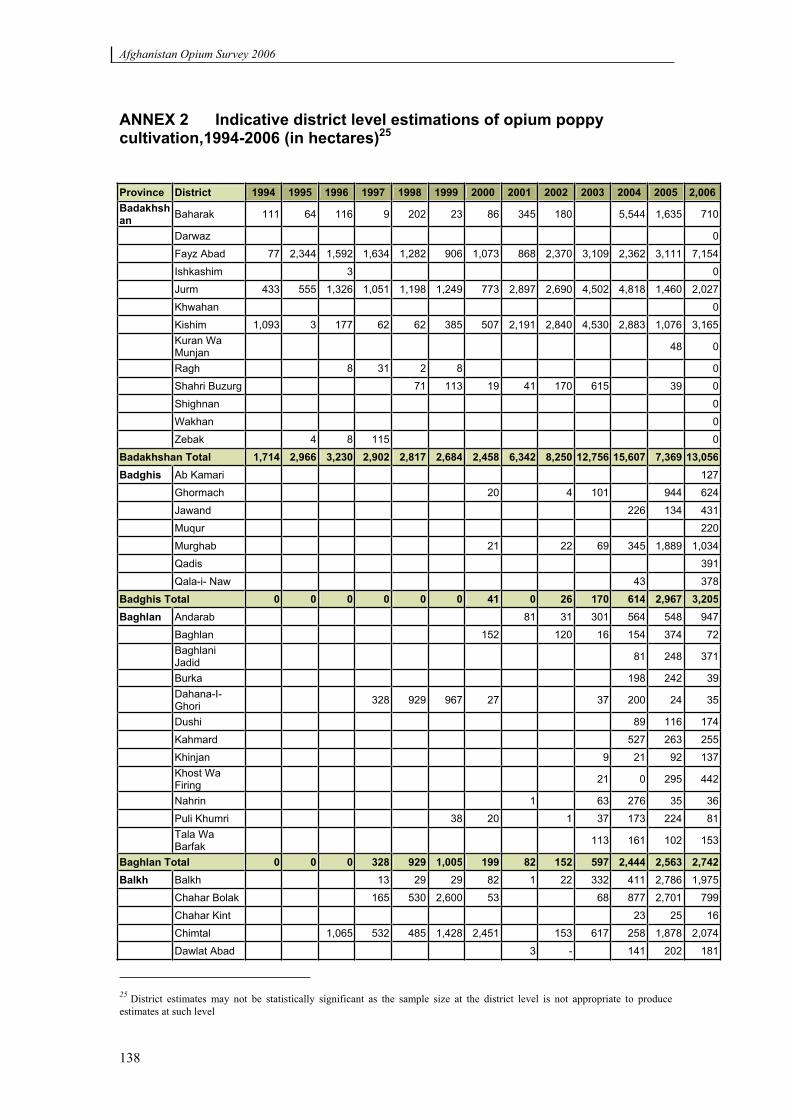
Afghanistan Opium Survey 2006
138
ANNEX 2 Indicative district level estimations of opium poppy cultivation,1994-2006 (in hectares)25
Province District 1994 1995 1996 1997 1998 1999 2000 2001 2002 2003 2004 2005 2,006Badakhshan Baharak 111 64 116 9 202 23 86 345 180 5,544 1,635 710
Darwaz 0
Fayz Abad 77 2,344 1,592 1,634 1,282 906 1,073 868 2,370 3,109 2,362 3,111 7,154
Ishkashim 3 0
Jurm 433 555 1,326 1,051 1,198 1,249 773 2,897 2,690 4,502 4,818 1,460 2,027
Khwahan 0
Kishim 1,093 3 177 62 62 385 507 2,191 2,840 4,530 2,883 1,076 3,165Kuran Wa Munjan 48 0
Ragh 8 31 2 8 0
Shahri Buzurg 71 113 19 41 170 615 39 0
Shighnan 0
Wakhan 0
Zebak 4 8 115 0
Badakhshan Total 1,714 2,966 3,230 2,902 2,817 2,684 2,458 6,342 8,250 12,756 15,607 7,369 13,056Badghis Ab Kamari 127
Ghormach 20 4 101 944 624
Jawand 226 134 431
Muqur 220
Murghab 21 22 69 345 1,889 1,034
Qadis 391
Qala-i- Naw 43 378
Badghis Total 0 0 0 0 0 0 41 0 26 170 614 2,967 3,205Baghlan Andarab 81 31 301 564 548 947
Baghlan 152 120 16 154 374 72BaghlaniJadid 81 248 371
Burka 198 242 39Dahana-I- Ghori 328 929 967 27 37 200 24 35
Dushi 89 116 174
Kahmard 527 263 255
Khinjan 9 21 92 137Khost Wa Firing 21 0 295 442
Nahrin 1 63 276 35 36
Puli Khumri 38 20 1 37 173 224 81Tala Wa Barfak 113 161 102 153
Baghlan Total 0 0 0 328 929 1,005 199 82 152 597 2,444 2,563 2,742Balkh Balkh 13 29 29 82 1 22 332 411 2,786 1,975
Chahar Bolak 165 530 2,600 53 68 877 2,701 799
Chahar Kint 23 25 16
Chimtal 1,065 532 485 1,428 2,451 153 617 258 1,878 2,074
Dawlat Abad 3 - 141 202 181
25 District estimates may not be statistically significant as the sample size at the district level is not appropriate to produce estimates at such level
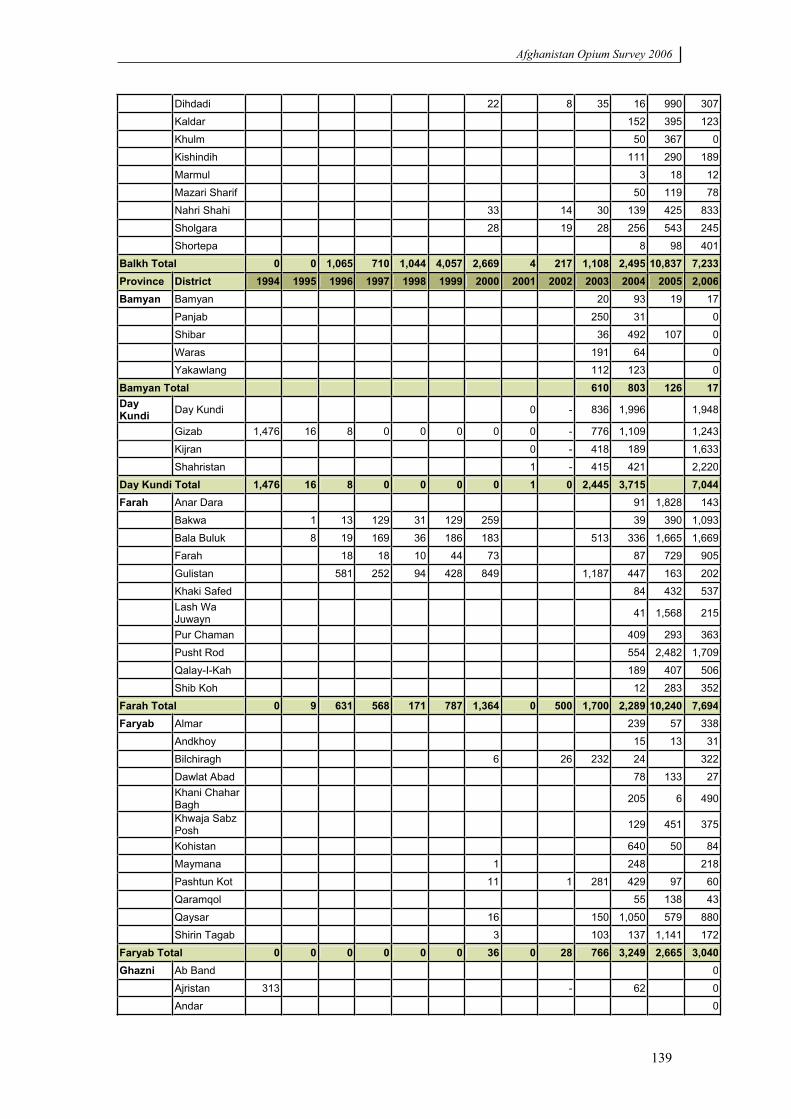
Afghanistan Opium Survey 2006
139
Dihdadi 22 8 35 16 990 307
Kaldar 152 395 123
Khulm 50 367 0
Kishindih 111 290 189
Marmul 3 18 12
Mazari Sharif 50 119 78
Nahri Shahi 33 14 30 139 425 833
Sholgara 28 19 28 256 543 245
Shortepa 8 98 401
Balkh Total 0 0 1,065 710 1,044 4,057 2,669 4 217 1,108 2,495 10,837 7,233Province District 1994 1995 1996 1997 1998 1999 2000 2001 2002 2003 2004 2005 2,006Bamyan Bamyan 20 93 19 17
Panjab 250 31 0
Shibar 36 492 107 0
Waras 191 64 0
Yakawlang 112 123 0
Bamyan Total 610 803 126 17Day Kundi Day Kundi 0 - 836 1,996 1,948
Gizab 1,476 16 8 0 0 0 0 0 - 776 1,109 1,243
Kijran 0 - 418 189 1,633
Shahristan 1 - 415 421 2,220
Day Kundi Total 1,476 16 8 0 0 0 0 1 0 2,445 3,715 7,044Farah Anar Dara 91 1,828 143
Bakwa 1 13 129 31 129 259 39 390 1,093
Bala Buluk 8 19 169 36 186 183 513 336 1,665 1,669
Farah 18 18 10 44 73 87 729 905
Gulistan 581 252 94 428 849 1,187 447 163 202
Khaki Safed 84 432 537Lash Wa Juwayn 41 1,568 215
Pur Chaman 409 293 363
Pusht Rod 554 2,482 1,709
Qalay-I-Kah 189 407 506
Shib Koh 12 283 352
Farah Total 0 9 631 568 171 787 1,364 0 500 1,700 2,289 10,240 7,694Faryab Almar 239 57 338
Andkhoy 15 13 31
Bilchiragh 6 26 232 24 322
Dawlat Abad 78 133 27Khani Chahar Bagh 205 6 490
Khwaja Sabz Posh 129 451 375
Kohistan 640 50 84
Maymana 1 248 218
Pashtun Kot 11 1 281 429 97 60
Qaramqol 55 138 43
Qaysar 16 150 1,050 579 880
Shirin Tagab 3 103 137 1,141 172
Faryab Total 0 0 0 0 0 0 36 0 28 766 3,249 2,665 3,040Ghazni Ab Band 0
Ajristan 313 - 62 0
Andar 0
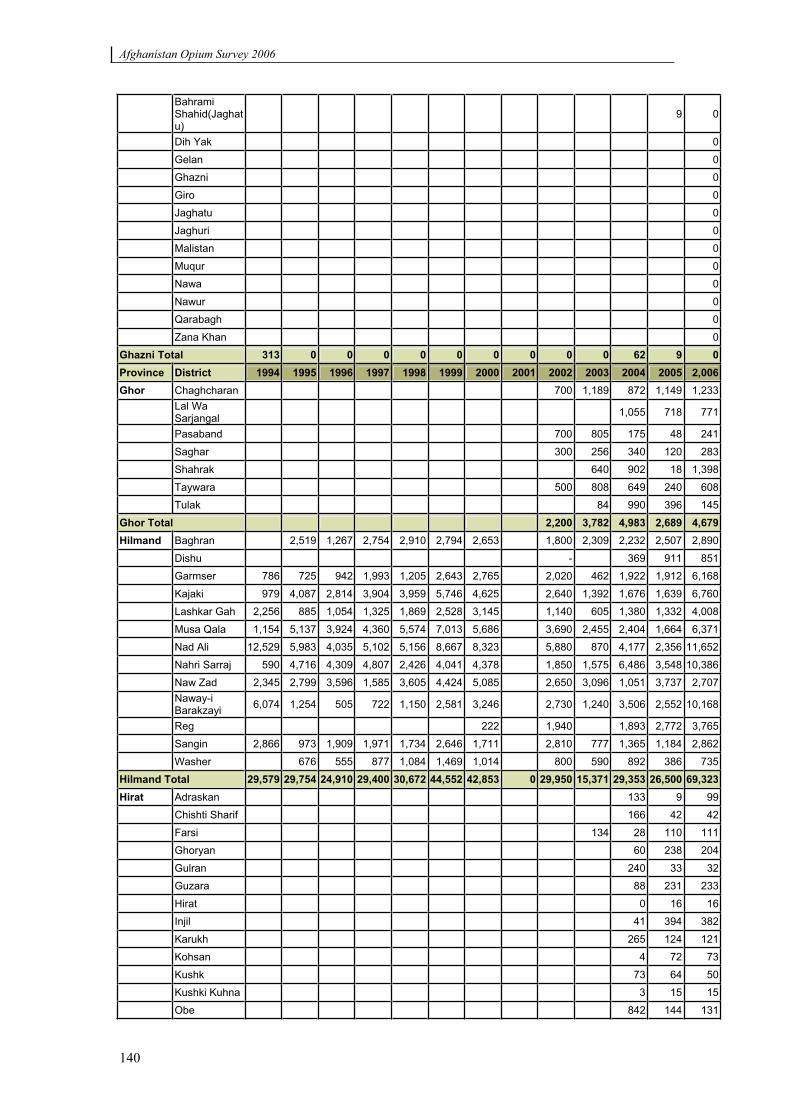
Afghanistan Opium Survey 2006
140
BahramiShahid(Jaghatu)
9 0
Dih Yak 0
Gelan 0
Ghazni 0
Giro 0
Jaghatu 0
Jaghuri 0
Malistan 0
Muqur 0
Nawa 0
Nawur 0
Qarabagh 0
Zana Khan 0
Ghazni Total 313 0 0 0 0 0 0 0 0 0 62 9 0Province District 1994 1995 1996 1997 1998 1999 2000 2001 2002 2003 2004 2005 2,006Ghor Chaghcharan 700 1,189 872 1,149 1,233
Lal Wa Sarjangal 1,055 718 771
Pasaband 700 805 175 48 241
Saghar 300 256 340 120 283
Shahrak 640 902 18 1,398
Taywara 500 808 649 240 608
Tulak 84 990 396 145
Ghor Total 2,200 3,782 4,983 2,689 4,679Hilmand Baghran 2,519 1,267 2,754 2,910 2,794 2,653 1,800 2,309 2,232 2,507 2,890
Dishu - 369 911 851
Garmser 786 725 942 1,993 1,205 2,643 2,765 2,020 462 1,922 1,912 6,168
Kajaki 979 4,087 2,814 3,904 3,959 5,746 4,625 2,640 1,392 1,676 1,639 6,760
Lashkar Gah 2,256 885 1,054 1,325 1,869 2,528 3,145 1,140 605 1,380 1,332 4,008
Musa Qala 1,154 5,137 3,924 4,360 5,574 7,013 5,686 3,690 2,455 2,404 1,664 6,371
Nad Ali 12,529 5,983 4,035 5,102 5,156 8,667 8,323 5,880 870 4,177 2,356 11,652
Nahri Sarraj 590 4,716 4,309 4,807 2,426 4,041 4,378 1,850 1,575 6,486 3,548 10,386
Naw Zad 2,345 2,799 3,596 1,585 3,605 4,424 5,085 2,650 3,096 1,051 3,737 2,707Naway-i Barakzayi 6,074 1,254 505 722 1,150 2,581 3,246 2,730 1,240 3,506 2,552 10,168
Reg 222 1,940 1,893 2,772 3,765
Sangin 2,866 973 1,909 1,971 1,734 2,646 1,711 2,810 777 1,365 1,184 2,862
Washer 676 555 877 1,084 1,469 1,014 800 590 892 386 735
Hilmand Total 29,579 29,754 24,910 29,400 30,672 44,552 42,853 0 29,950 15,371 29,353 26,500 69,323Hirat Adraskan 133 9 99
Chishti Sharif 166 42 42
Farsi 134 28 110 111
Ghoryan 60 238 204
Gulran 240 33 32
Guzara 88 231 233
Hirat 0 16 16
Injil 41 394 382
Karukh 265 124 121
Kohsan 4 72 73
Kushk 73 64 50
Kushki Kuhna 3 15 15
Obe 842 144 131
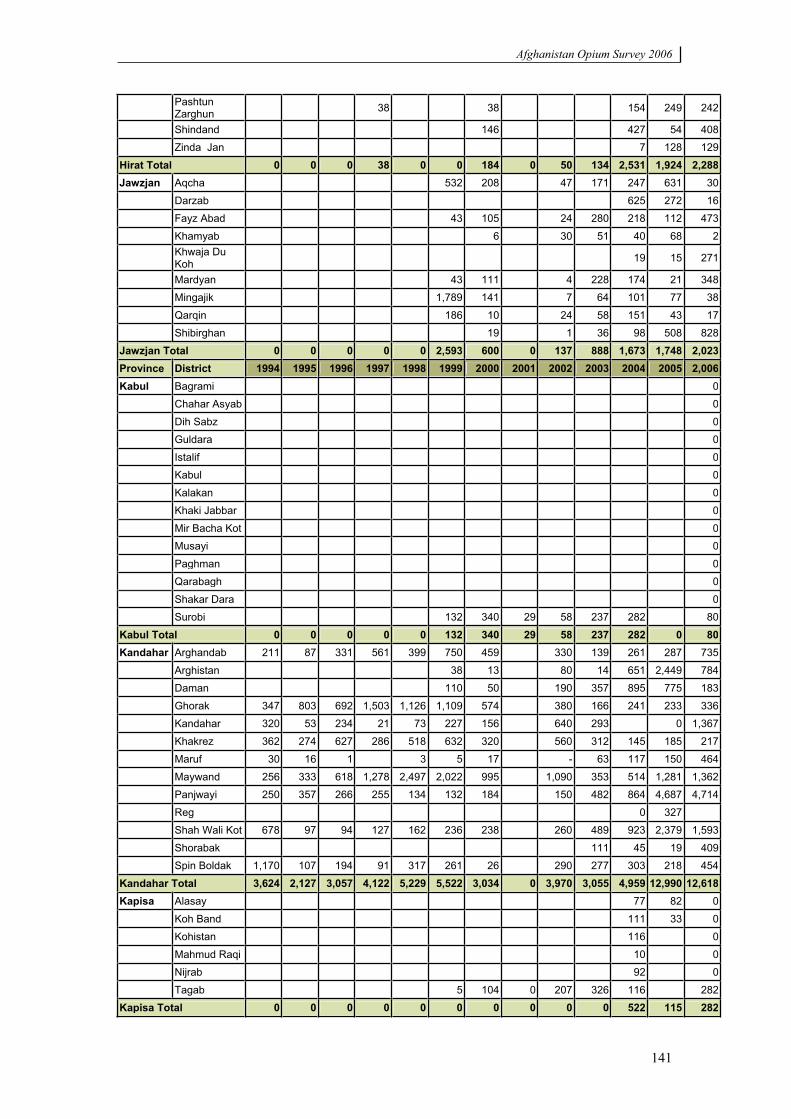
Afghanistan Opium Survey 2006
141
PashtunZarghun 38 38 154 249 242
Shindand 146 427 54 408
Zinda Jan 7 128 129
Hirat Total 0 0 0 38 0 0 184 0 50 134 2,531 1,924 2,288Jawzjan Aqcha 532 208 47 171 247 631 30
Darzab 625 272 16
Fayz Abad 43 105 24 280 218 112 473
Khamyab 6 30 51 40 68 2Khwaja Du Koh 19 15 271
Mardyan 43 111 4 228 174 21 348
Mingajik 1,789 141 7 64 101 77 38
Qarqin 186 10 24 58 151 43 17
Shibirghan 19 1 36 98 508 828
Jawzjan Total 0 0 0 0 0 2,593 600 0 137 888 1,673 1,748 2,023Province District 1994 1995 1996 1997 1998 1999 2000 2001 2002 2003 2004 2005 2,006Kabul Bagrami 0
Chahar Asyab 0
Dih Sabz 0
Guldara 0
Istalif 0
Kabul 0
Kalakan 0
Khaki Jabbar 0
Mir Bacha Kot 0
Musayi 0
Paghman 0
Qarabagh 0
Shakar Dara 0
Surobi 132 340 29 58 237 282 80
Kabul Total 0 0 0 0 0 132 340 29 58 237 282 0 80Kandahar Arghandab 211 87 331 561 399 750 459 330 139 261 287 735
Arghistan 38 13 80 14 651 2,449 784
Daman 110 50 190 357 895 775 183
Ghorak 347 803 692 1,503 1,126 1,109 574 380 166 241 233 336
Kandahar 320 53 234 21 73 227 156 640 293 0 1,367
Khakrez 362 274 627 286 518 632 320 560 312 145 185 217
Maruf 30 16 1 3 5 17 - 63 117 150 464
Maywand 256 333 618 1,278 2,497 2,022 995 1,090 353 514 1,281 1,362
Panjwayi 250 357 266 255 134 132 184 150 482 864 4,687 4,714
Reg 0 327
Shah Wali Kot 678 97 94 127 162 236 238 260 489 923 2,379 1,593
Shorabak 111 45 19 409
Spin Boldak 1,170 107 194 91 317 261 26 290 277 303 218 454
Kandahar Total 3,624 2,127 3,057 4,122 5,229 5,522 3,034 0 3,970 3,055 4,959 12,990 12,618Kapisa Alasay 77 82 0
Koh Band 111 33 0
Kohistan 116 0
Mahmud Raqi 10 0
Nijrab 92 0
Tagab 5 104 0 207 326 116 282
Kapisa Total 0 0 0 0 0 0 0 0 0 0 522 115 282
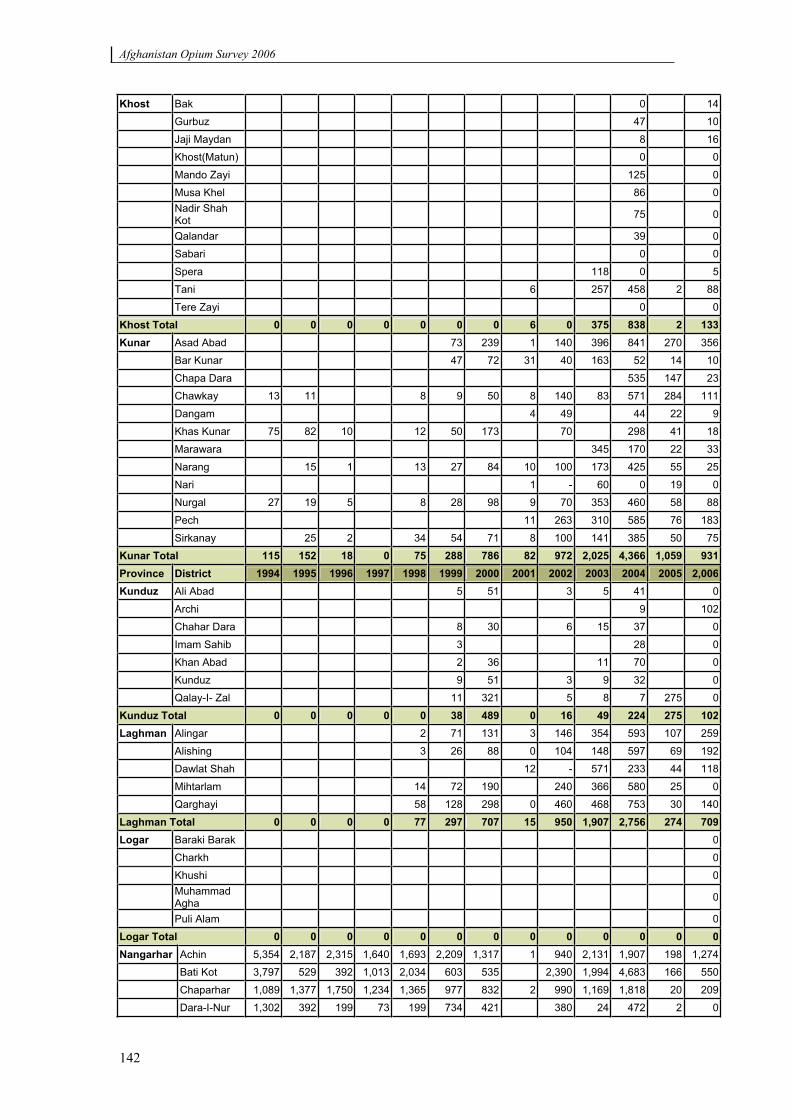
Afghanistan Opium Survey 2006
142
Khost Bak 0 14
Gurbuz 47 10
Jaji Maydan 8 16
Khost(Matun) 0 0
Mando Zayi 125 0
Musa Khel 86 0Nadir Shah Kot 75 0
Qalandar 39 0
Sabari 0 0
Spera 118 0 5
Tani 6 257 458 2 88
Tere Zayi 0 0
Khost Total 0 0 0 0 0 0 0 6 0 375 838 2 133Kunar Asad Abad 73 239 1 140 396 841 270 356
Bar Kunar 47 72 31 40 163 52 14 10
Chapa Dara 535 147 23
Chawkay 13 11 8 9 50 8 140 83 571 284 111
Dangam 4 49 44 22 9
Khas Kunar 75 82 10 12 50 173 70 298 41 18
Marawara 345 170 22 33
Narang 15 1 13 27 84 10 100 173 425 55 25
Nari 1 - 60 0 19 0
Nurgal 27 19 5 8 28 98 9 70 353 460 58 88
Pech 11 263 310 585 76 183
Sirkanay 25 2 34 54 71 8 100 141 385 50 75
Kunar Total 115 152 18 0 75 288 786 82 972 2,025 4,366 1,059 931Province District 1994 1995 1996 1997 1998 1999 2000 2001 2002 2003 2004 2005 2,006Kunduz Ali Abad 5 51 3 5 41 0
Archi 9 102
Chahar Dara 8 30 6 15 37 0
Imam Sahib 3 28 0
Khan Abad 2 36 11 70 0
Kunduz 9 51 3 9 32 0
Qalay-I- Zal 11 321 5 8 7 275 0
Kunduz Total 0 0 0 0 0 38 489 0 16 49 224 275 102Laghman Alingar 2 71 131 3 146 354 593 107 259
Alishing 3 26 88 0 104 148 597 69 192
Dawlat Shah 12 - 571 233 44 118
Mihtarlam 14 72 190 240 366 580 25 0
Qarghayi 58 128 298 0 460 468 753 30 140
Laghman Total 0 0 0 0 77 297 707 15 950 1,907 2,756 274 709Logar Baraki Barak 0
Charkh 0
Khushi 0MuhammadAgha 0
Puli Alam 0
Logar Total 0 0 0 0 0 0 0 0 0 0 0 0 0Nangarhar Achin 5,354 2,187 2,315 1,640 1,693 2,209 1,317 1 940 2,131 1,907 198 1,274
Bati Kot 3,797 529 392 1,013 2,034 603 535 2,390 1,994 4,683 166 550
Chaparhar 1,089 1,377 1,750 1,234 1,365 977 832 2 990 1,169 1,818 20 209
Dara-I-Nur 1,302 392 199 73 199 734 421 380 24 472 2 0
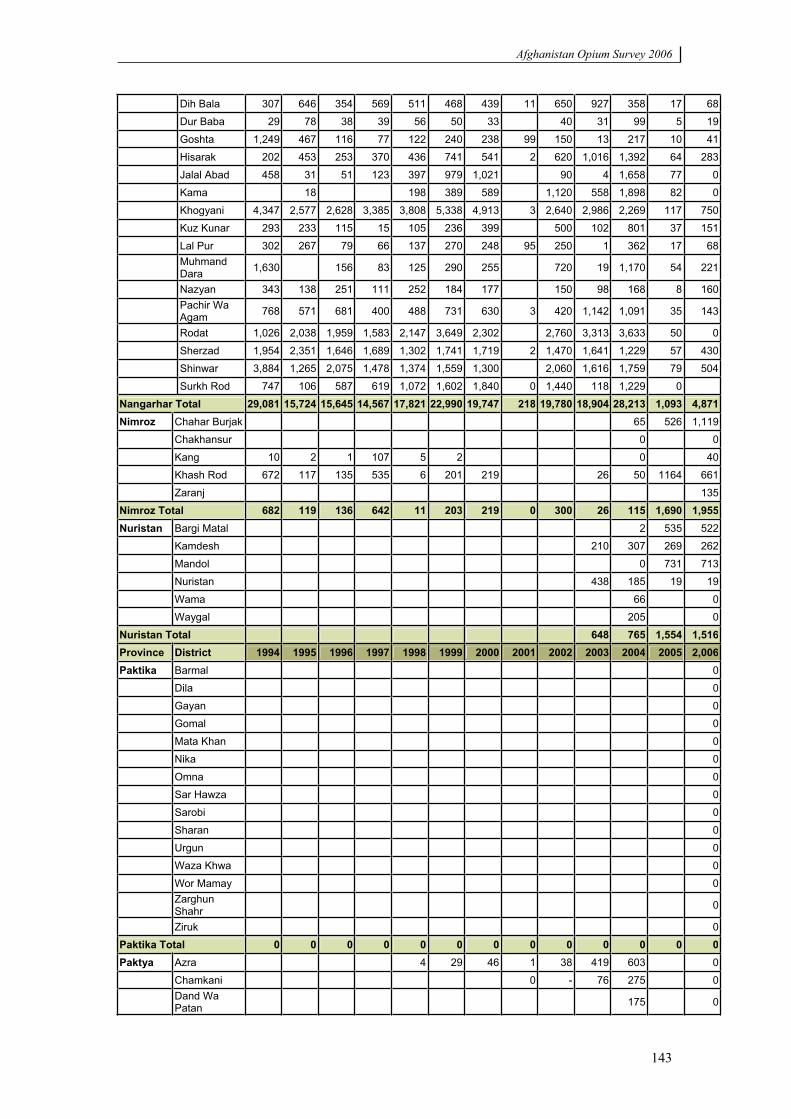
Afghanistan Opium Survey 2006
143
Dih Bala 307 646 354 569 511 468 439 11 650 927 358 17 68
Dur Baba 29 78 38 39 56 50 33 40 31 99 5 19
Goshta 1,249 467 116 77 122 240 238 99 150 13 217 10 41
Hisarak 202 453 253 370 436 741 541 2 620 1,016 1,392 64 283
Jalal Abad 458 31 51 123 397 979 1,021 90 4 1,658 77 0
Kama 18 198 389 589 1,120 558 1,898 82 0
Khogyani 4,347 2,577 2,628 3,385 3,808 5,338 4,913 3 2,640 2,986 2,269 117 750
Kuz Kunar 293 233 115 15 105 236 399 500 102 801 37 151
Lal Pur 302 267 79 66 137 270 248 95 250 1 362 17 68MuhmandDara 1,630 156 83 125 290 255 720 19 1,170 54 221
Nazyan 343 138 251 111 252 184 177 150 98 168 8 160Pachir WaAgam 768 571 681 400 488 731 630 3 420 1,142 1,091 35 143
Rodat 1,026 2,038 1,959 1,583 2,147 3,649 2,302 2,760 3,313 3,633 50 0
Sherzad 1,954 2,351 1,646 1,689 1,302 1,741 1,719 2 1,470 1,641 1,229 57 430
Shinwar 3,884 1,265 2,075 1,478 1,374 1,559 1,300 2,060 1,616 1,759 79 504
Surkh Rod 747 106 587 619 1,072 1,602 1,840 0 1,440 118 1,229 0
Nangarhar Total 29,081 15,724 15,645 14,567 17,821 22,990 19,747 218 19,780 18,904 28,213 1,093 4,871Nimroz Chahar Burjak 65 526 1,119
Chakhansur 0 0
Kang 10 2 1 107 5 2 0 40
Khash Rod 672 117 135 535 6 201 219 26 50 1164 661
Zaranj 135
Nimroz Total 682 119 136 642 11 203 219 0 300 26 115 1,690 1,955Nuristan Bargi Matal 2 535 522
Kamdesh 210 307 269 262
Mandol 0 731 713
Nuristan 438 185 19 19
Wama 66 0
Waygal 205 0
Nuristan Total 648 765 1,554 1,516Province District 1994 1995 1996 1997 1998 1999 2000 2001 2002 2003 2004 2005 2,006Paktika Barmal 0
Dila 0
Gayan 0
Gomal 0
Mata Khan 0
Nika 0
Omna 0
Sar Hawza 0
Sarobi 0
Sharan 0
Urgun 0
Waza Khwa 0
Wor Mamay 0Zarghun Shahr 0
Ziruk 0
Paktika Total 0 0 0 0 0 0 0 0 0 0 0 0 0Paktya Azra 4 29 46 1 38 419 603 0
Chamkani 0 - 76 275 0Dand Wa Patan 175 0
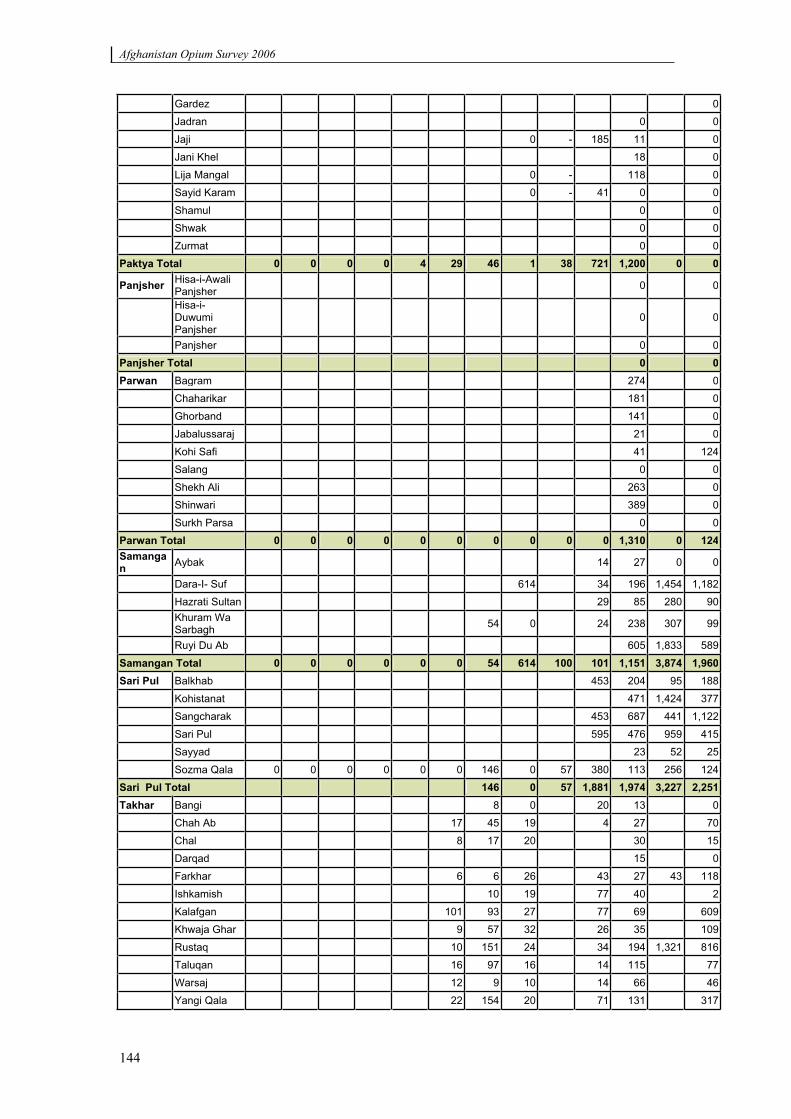
Afghanistan Opium Survey 2006
144
Gardez 0
Jadran 0 0
Jaji 0 - 185 11 0
Jani Khel 18 0
Lija Mangal 0 - 118 0
Sayid Karam 0 - 41 0 0
Shamul 0 0
Shwak 0 0
Zurmat 0 0
Paktya Total 0 0 0 0 4 29 46 1 38 721 1,200 0 0
Panjsher Hisa-i-Awali Panjsher 0 0
Hisa-i-Duwumi Panjsher
0 0
Panjsher 0 0
Panjsher Total 0 0Parwan Bagram 274 0
Chaharikar 181 0
Ghorband 141 0
Jabalussaraj 21 0
Kohi Safi 41 124
Salang 0 0
Shekh Ali 263 0
Shinwari 389 0
Surkh Parsa 0 0
Parwan Total 0 0 0 0 0 0 0 0 0 0 1,310 0 124Samangan Aybak 14 27 0 0
Dara-I- Suf 614 34 196 1,454 1,182
Hazrati Sultan 29 85 280 90Khuram Wa Sarbagh 54 0 24 238 307 99
Ruyi Du Ab 605 1,833 589
Samangan Total 0 0 0 0 0 0 54 614 100 101 1,151 3,874 1,960Sari Pul Balkhab 453 204 95 188
Kohistanat 471 1,424 377
Sangcharak 453 687 441 1,122
Sari Pul 595 476 959 415
Sayyad 23 52 25
Sozma Qala 0 0 0 0 0 0 146 0 57 380 113 256 124
Sari Pul Total 146 0 57 1,881 1,974 3,227 2,251Takhar Bangi 8 0 20 13 0
Chah Ab 17 45 19 4 27 70
Chal 8 17 20 30 15
Darqad 15 0
Farkhar 6 6 26 43 27 43 118
Ishkamish 10 19 77 40 2
Kalafgan 101 93 27 77 69 609
Khwaja Ghar 9 57 32 26 35 109
Rustaq 10 151 24 34 194 1,321 816
Taluqan 16 97 16 14 115 77
Warsaj 12 9 10 14 66 46
Yangi Qala 22 154 20 71 131 317
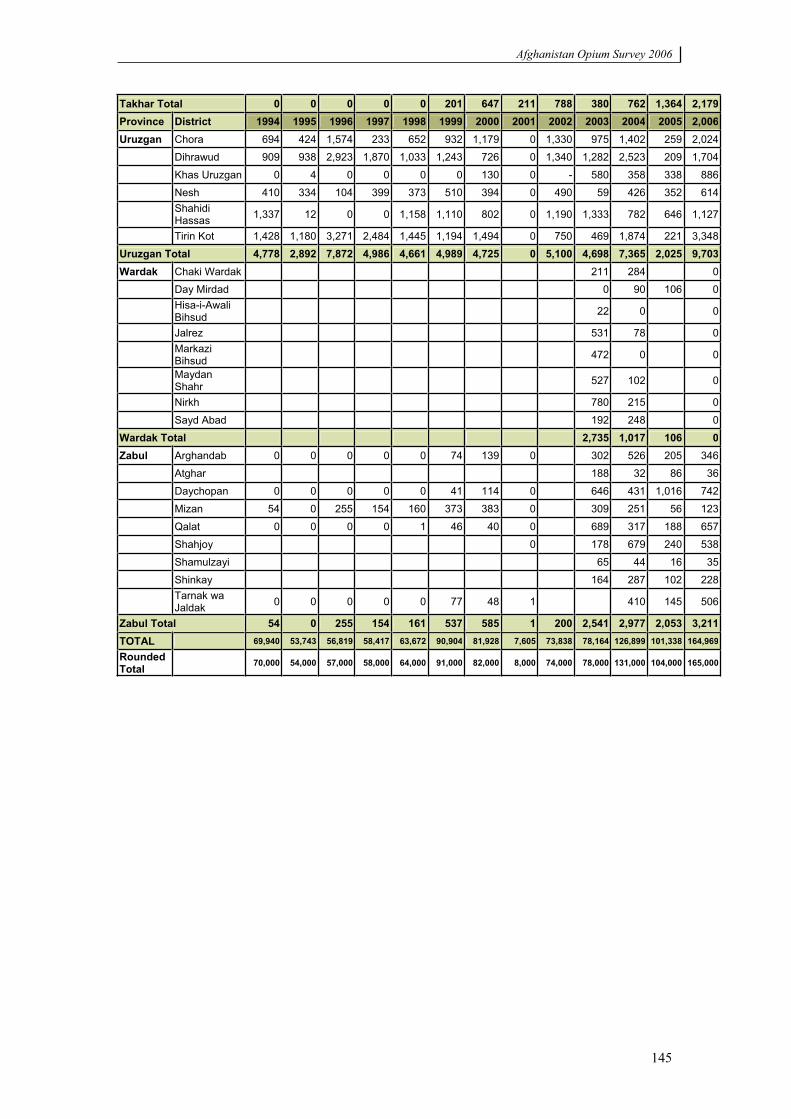
Afghanistan Opium Survey 2006
145
Takhar Total 0 0 0 0 0 201 647 211 788 380 762 1,364 2,179Province District 1994 1995 1996 1997 1998 1999 2000 2001 2002 2003 2004 2005 2,006Uruzgan Chora 694 424 1,574 233 652 932 1,179 0 1,330 975 1,402 259 2,024
Dihrawud 909 938 2,923 1,870 1,033 1,243 726 0 1,340 1,282 2,523 209 1,704
Khas Uruzgan 0 4 0 0 0 0 130 0 - 580 358 338 886
Nesh 410 334 104 399 373 510 394 0 490 59 426 352 614ShahidiHassas 1,337 12 0 0 1,158 1,110 802 0 1,190 1,333 782 646 1,127
Tirin Kot 1,428 1,180 3,271 2,484 1,445 1,194 1,494 0 750 469 1,874 221 3,348
Uruzgan Total 4,778 2,892 7,872 4,986 4,661 4,989 4,725 0 5,100 4,698 7,365 2,025 9,703Wardak Chaki Wardak 211 284 0
Day Mirdad 0 90 106 0Hisa-i-Awali Bihsud 22 0 0
Jalrez 531 78 0MarkaziBihsud 472 0 0
Maydan Shahr 527 102 0
Nirkh 780 215 0
Sayd Abad 192 248 0
Wardak Total 2,735 1,017 106 0Zabul Arghandab 0 0 0 0 0 74 139 0 302 526 205 346
Atghar 188 32 86 36
Daychopan 0 0 0 0 0 41 114 0 646 431 1,016 742
Mizan 54 0 255 154 160 373 383 0 309 251 56 123
Qalat 0 0 0 0 1 46 40 0 689 317 188 657
Shahjoy 0 178 679 240 538
Shamulzayi 65 44 16 35
Shinkay 164 287 102 228Tarnak wa Jaldak 0 0 0 0 0 77 48 1 410 145 506
Zabul Total 54 0 255 154 161 537 585 1 200 2,541 2,977 2,053 3,211TOTAL 69,940 53,743 56,819 58,417 63,672 90,904 81,928 7,605 73,838 78,164 126,899 101,338 164,969
Rounded Total 70,000 54,000 57,000 58,000 64,000 91,000 82,000 8,000 74,000 78,000 131,000 104,000 165,000
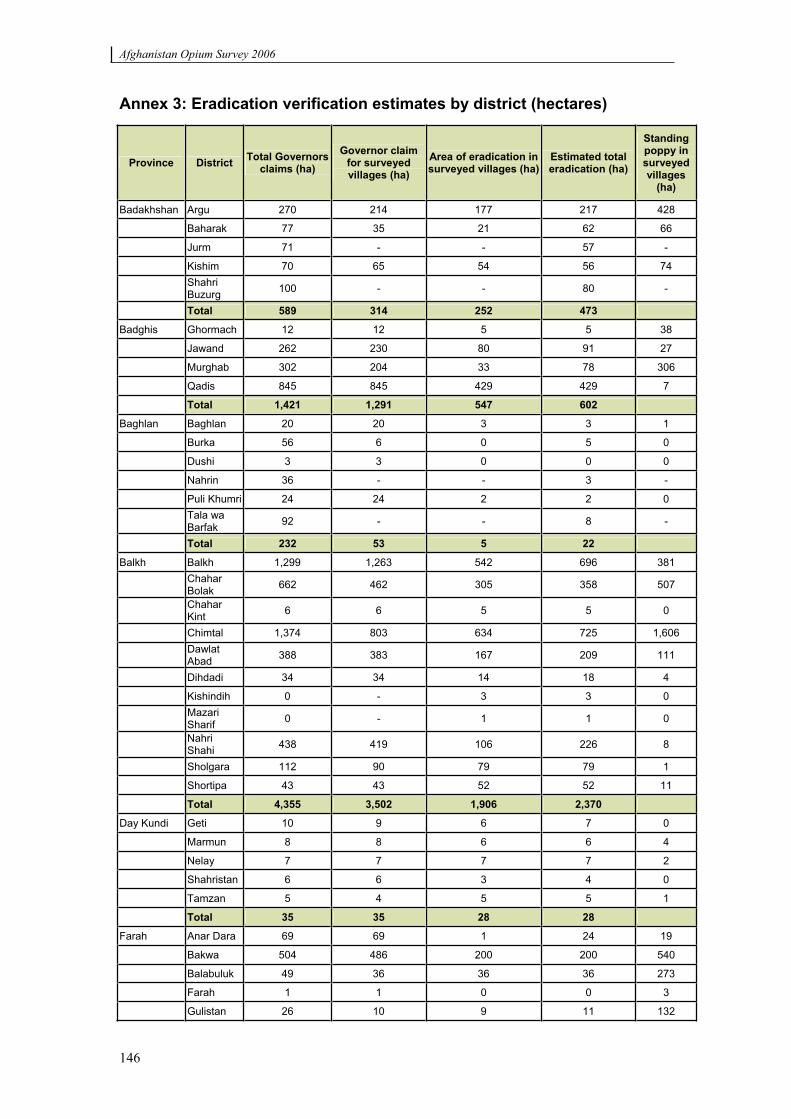
Afghanistan Opium Survey 2006
146
Annex 3: Eradication verification estimates by district (hectares)
Province District Total Governors claims (ha)
Governor claim for surveyed villages (ha)
Area of eradication in surveyed villages (ha)
Estimated total eradication (ha)
Standing poppy in surveyed villages
(ha)
Badakhshan Argu 270 214 177 217 428
Baharak 77 35 21 62 66
Jurm 71 - - 57 -
Kishim 70 65 54 56 74 ShahriBuzurg 100 - - 80 -
Total 589 314 252 473
Badghis Ghormach 12 12 5 5 38
Jawand 262 230 80 91 27
Murghab 302 204 33 78 306
Qadis 845 845 429 429 7
Total 1,421 1,291 547 602
Baghlan Baghlan 20 20 3 3 1
Burka 56 6 0 5 0
Dushi 3 3 0 0 0
Nahrin 36 - - 3 -
Puli Khumri 24 24 2 2 0 Tala wa Barfak 92 - - 8 -
Total 232 53 5 22
Balkh Balkh 1,299 1,263 542 696 381 ChaharBolak 662 462 305 358 507
ChaharKint 6 6 5 5 0
Chimtal 1,374 803 634 725 1,606 Dawlat Abad 388 383 167 209 111
Dihdadi 34 34 14 18 4
Kishindih 0 - 3 3 0 MazariSharif 0 - 1 1 0
NahriShahi 438 419 106 226 8
Sholgara 112 90 79 79 1
Shortipa 43 43 52 52 11
Total 4,355 3,502 1,906 2,370
Day Kundi Geti 10 9 6 7 0
Marmun 8 8 6 6 4
Nelay 7 7 7 7 2
Shahristan 6 6 3 4 0
Tamzan 5 4 5 5 1
Total 35 35 28 28
Farah Anar Dara 69 69 1 24 19
Bakwa 504 486 200 200 540
Balabuluk 49 36 36 36 273
Farah 1 1 0 0 3
Gulistan 26 10 9 11 132
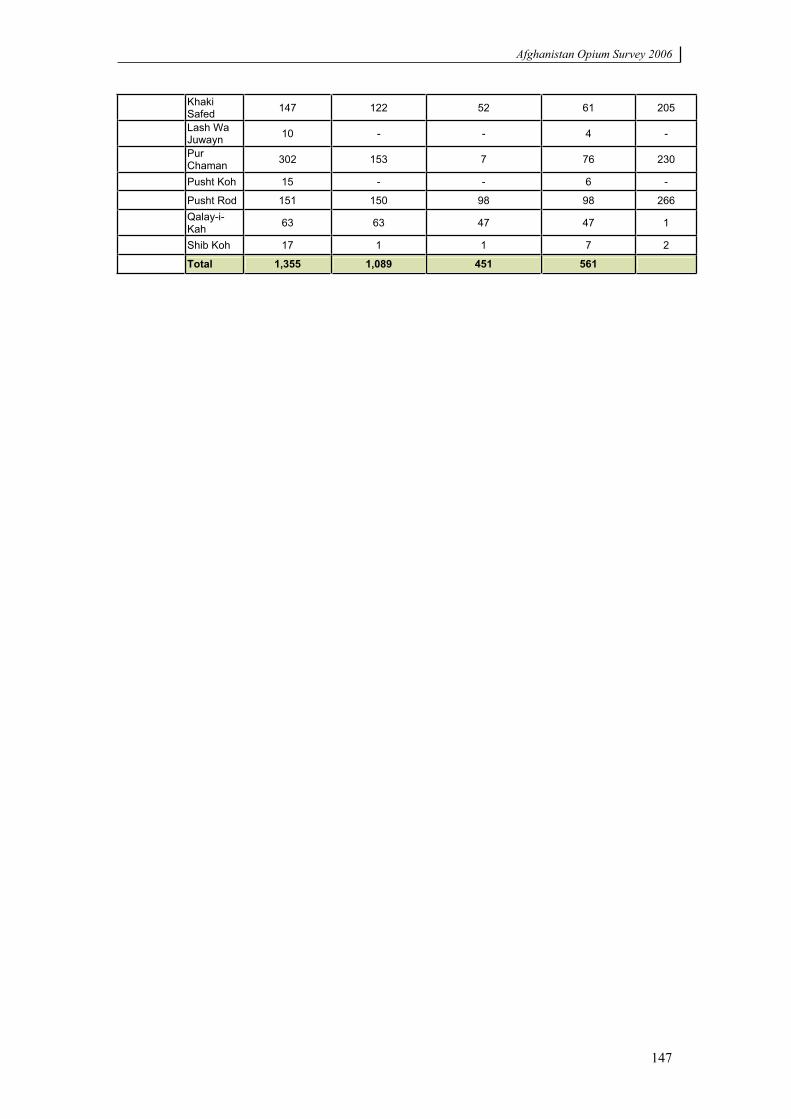
Afghanistan Opium Survey 2006
147
KhakiSafed 147 122 52 61 205
Lash Wa Juwayn 10 - - 4 -
PurChaman 302 153 7 76 230
Pusht Koh 15 - - 6 -
Pusht Rod 151 150 98 98 266 Qalay-i-Kah 63 63 47 47 1
Shib Koh 17 1 1 7 2
Total 1,355 1,089 451 561
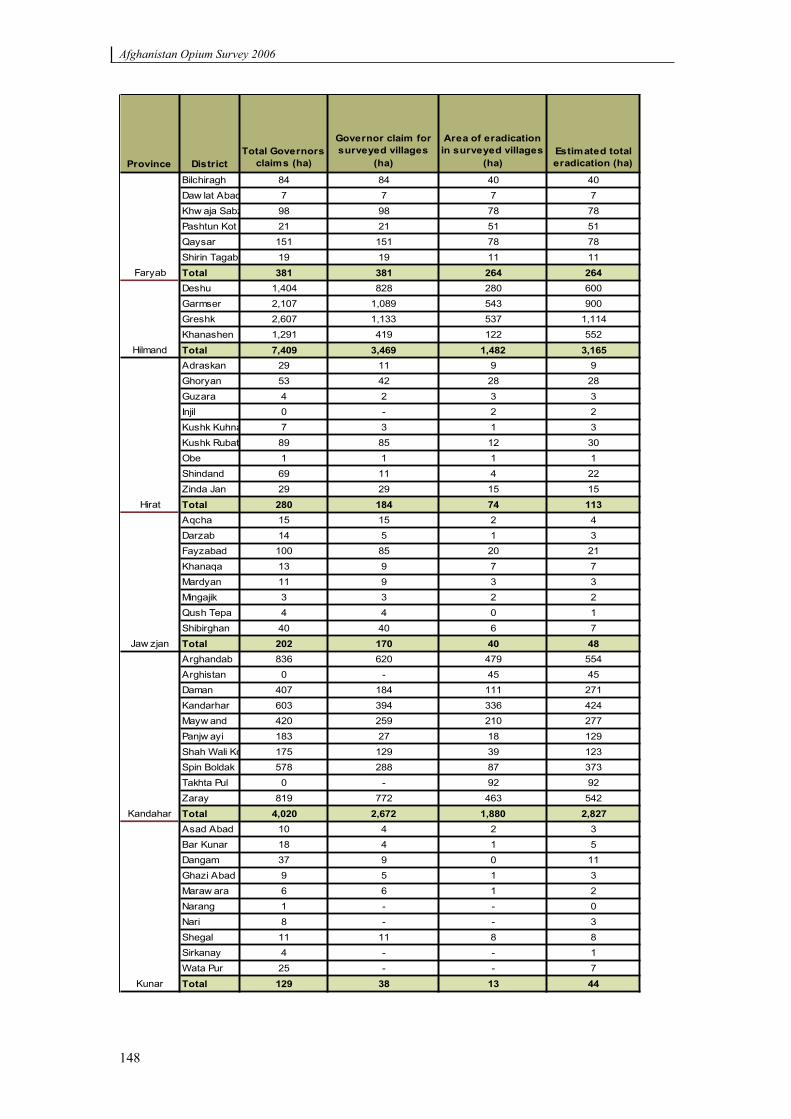
Afghanistan Opium Survey 2006
148
Province DistrictTotal Governors
claims (ha)
Governor claim for surveyed villages
(ha)
Area of eradication in surveyed villages
(ha)Estimated total eradication (ha)
Bilchiragh 84 84 40 40Daw lat Abad 7 7 7 7Khw aja Sabz 98 98 78 78Pashtun Kot 21 21 51 51Qaysar 151 151 78 78Shirin Tagab 19 19 11 11Total 381 381 264 264Deshu 1,404 828 280 600Garmser 2,107 1,089 543 900Greshk 2,607 1,133 537 1,114Khanashen 1,291 419 122 552
Total 7,409 3,469 1,482 3,165Adraskan 29 11 9 9Ghoryan 53 42 28 28Guzara 4 2 3 3Injil 0 - 2 2Kushk Kuhna 7 3 1 3Kushk Rubat 89 85 12 30Obe 1 1 1 1Shindand 69 11 4 22Zinda Jan 29 29 15 15Total 280 184 74 113Aqcha 15 15 2 4Darzab 14 5 1 3Fayzabad 100 85 20 21Khanaqa 13 9 7 7Mardyan 11 9 3 3Mingajik 3 3 2 2Qush Tepa 4 4 0 1Shibirghan 40 40 6 7Total 202 170 40 48Arghandab 836 620 479 554Arghistan 0 - 45 45Daman 407 184 111 271Kandarhar 603 394 336 424Mayw and 420 259 210 277Panjw ayi 183 27 18 129Shah Wali Ko 175 129 39 123Spin Boldak 578 288 87 373Takhta Pul 0 - 92 92Zaray 819 772 463 542Total 4,020 2,672 1,880 2,827Asad Abad 10 4 2 3Bar Kunar 18 4 1 5Dangam 37 9 0 11Ghazi Abad 9 5 1 3Maraw ara 6 6 1 2Narang 1 - - 0Nari 8 - - 3Shegal 11 11 8 8Sirkanay 4 - - 1Wata Pur 25 - - 7
Total 129 38 13 44
Kandahar
Kunar
Faryab
Hilmand
Hirat
Jaw zjan

Vienna International Centre, P.O. Box 500, A-1400 Vienna, Austria Tel: (+43 1) 26060-0, Fax: (+43 1) 26060-5866, www.unodc.org
Printed in Afghanistan