affordable light rail rail futures conference london 15th nov. 2008
DESCRIPTION
Affordable Light Rail Rail Futures Conference London 15th Nov. 2008. Prof. Lewis Lesley Technical Director TRAM Power Ltd. Affordable to whom ?. The taxpayer (NAO 2004 Report) The operator (need subsidy) The passenger (pays three times ?). Why Light Rail ?. Carbon free/neutral/savings - PowerPoint PPT PresentationTRANSCRIPT
Affordable Light RailRail Futures Conference London 15th Nov. 2008
Prof. Lewis LesleyTechnical Director
TRAM Power Ltd.
Affordable to whom ?
The taxpayer (NAO 2004 Report) The operator (need subsidy) The passenger (pays three times ?)
Why Light Rail ?
Carbon free/neutral/savingsProven to divert car trips (30-40%)Reduce noise and pollution in streetsAccessibleLow energy/ oil free electrical powerIncrease urban activity density
Best use of public money ?
A UK tramway scheme is £300mThis is 4 hospitalsOr 20 secondary schoolsOr 1000 miles of cycle lanes/ways
– Cycling is carbon & oil free– Promotes health & fitness– Increases activity density
Rail like the Medieval Church ?
Untouchable high “priesthood”Special language, few understandNeeds constant money indulgencesSeen to be for good of countryCarries only 1% of UK trips (7%pax
km)– 70% London based
6% of UK freight traffic
Light Rail SWOT - 1
STRENGTHS– Incremental development over 150 years– >400 systems worldwide– Attracts car users (30-40% US DOT)– Reduces traffic congestion & pollution– Increase road passenger capacity– Reduce central car parking– Strengthens city centre
Light Rail SWOT - 2
WEAKNESSES– Criticised by NAO April 2004 Report– Complex procurement process– Legal costs > engineering design– Multiple objectives rarely achieved– Patronage forecasts mostly too high– Need for operating subsidy (& grants)– Twice as costly as continental schemes

Light Rail SWOT - 3
OPPORTUNITIES– Buses squeezed by fuel and staffing– Social image is poor– 50% of UK bus trips in London (£1.5bn pa sub)– Bus market 10% of 1955 peak– Bus gizmos don’t get people out of cars– Polluting and dependent on oil– Bus operators could go upmarket with trams ?
Tram drivers easier to recruitTram drivers stay longer
Light Rail SWOT - 4
THREATS– 5 UK schemes funded in last 20 years– One every four years– Take 150 years to match Germany 2004– To impact on
CO2, NOX and PM10Congestion modal shift
– UK needs a new tramway every 4 MONTHS ?
Answering NAO Report ?
Tramways to target high (car)traffic flowsNot best way to reduce unemploymentNot Civic “One-upmanship” contestTaxis and bikes are cheaperTram routes direct, fast and frequentAbandoned rail lines not always goodStrategic Park and Ride stations
New Technology ?
Tramways are not mini main line trainsTrams are road vehicles running on railsKnowledge and experience lostTrack installation less disruptiveDon’t relocate utilitiesOHL is light, can be strung from buildings
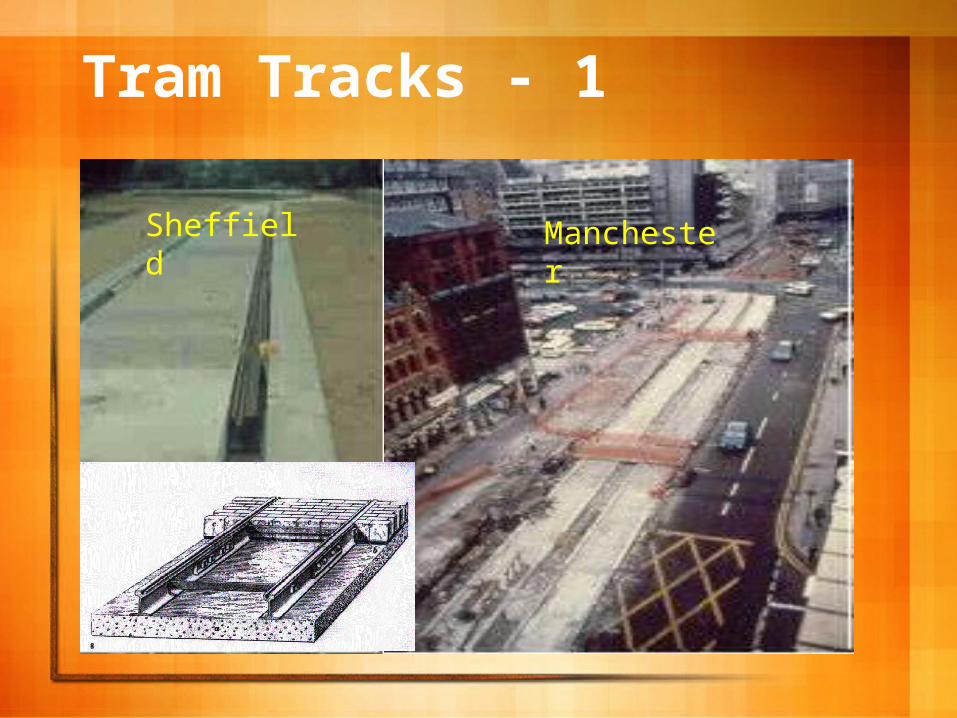
Tram Tracks - 1
Sheffield Manchester
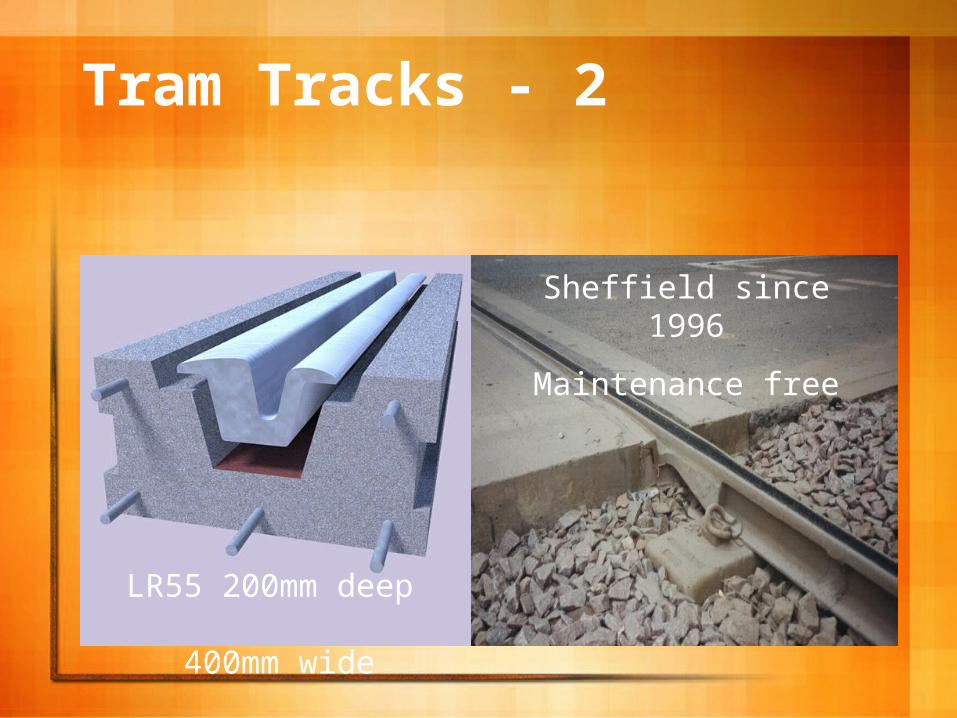
Tram Tracks - 2
LR55 200mm deep 400mm wide
Sheffield since 1996
Maintenance free
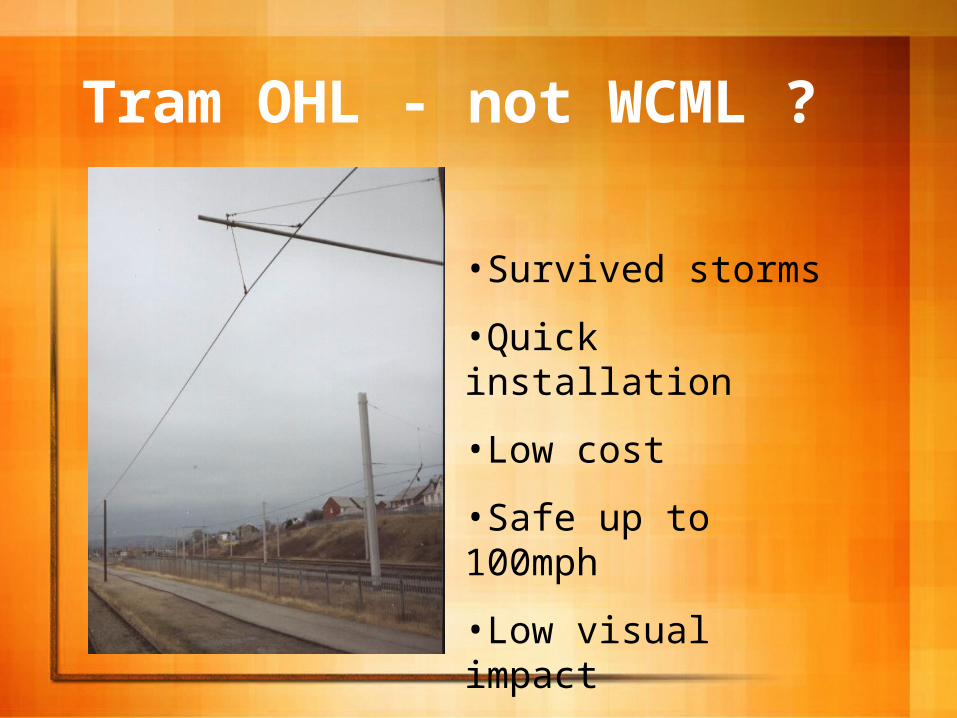
Tram OHL - not WCML ?
•Survived storms
•Quick installation
•Low cost
•Safe up to 100mph
•Low visual impact
•Minimum poles
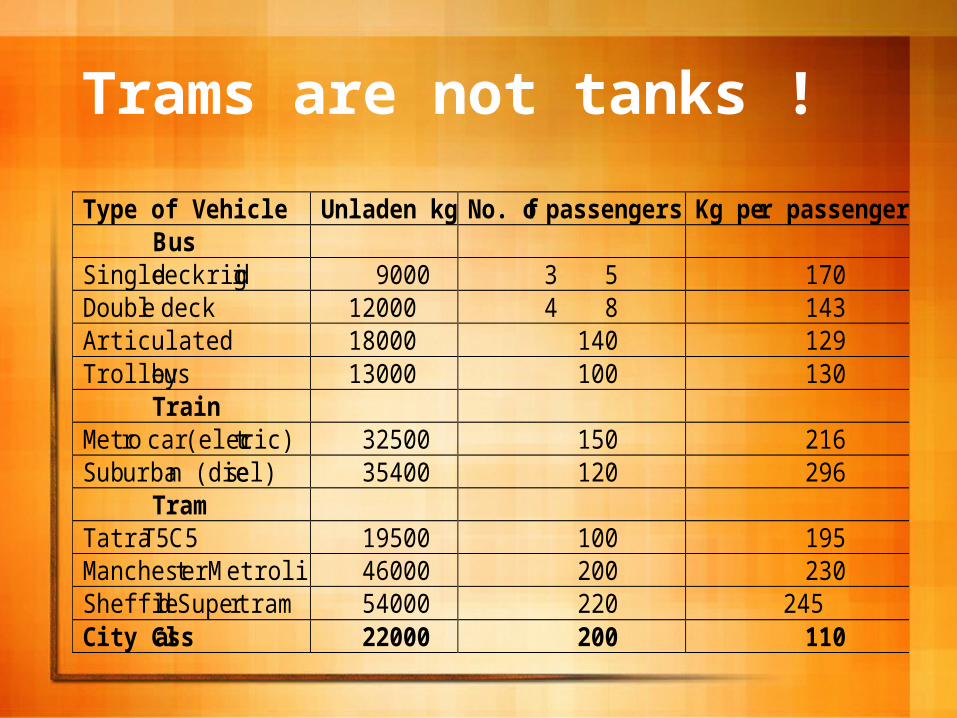
Trams are not tanks !
Type of Vehicle Unladen kg No. of passengers Kg per passenger Bus Single deck rigid 9000 53 170 Double deck 12000 84 143 Articulated 18000 140 129 Trolleybus 13000 100 130 Train Metro car (electric) 32500 150 216 Suburban (diesel) 35400 120 296 Tram Tatra T5C5 19500 100 195 Manchester Metrolink 46000 200 230 Sheffield Supertram 54000 220 245 City Class 22000 200 110
Energy ?
Trains have lower rolling resistance than buses
But the same energy consumption about 40 pax km/litre diesel
Because of heavier train mass per pax
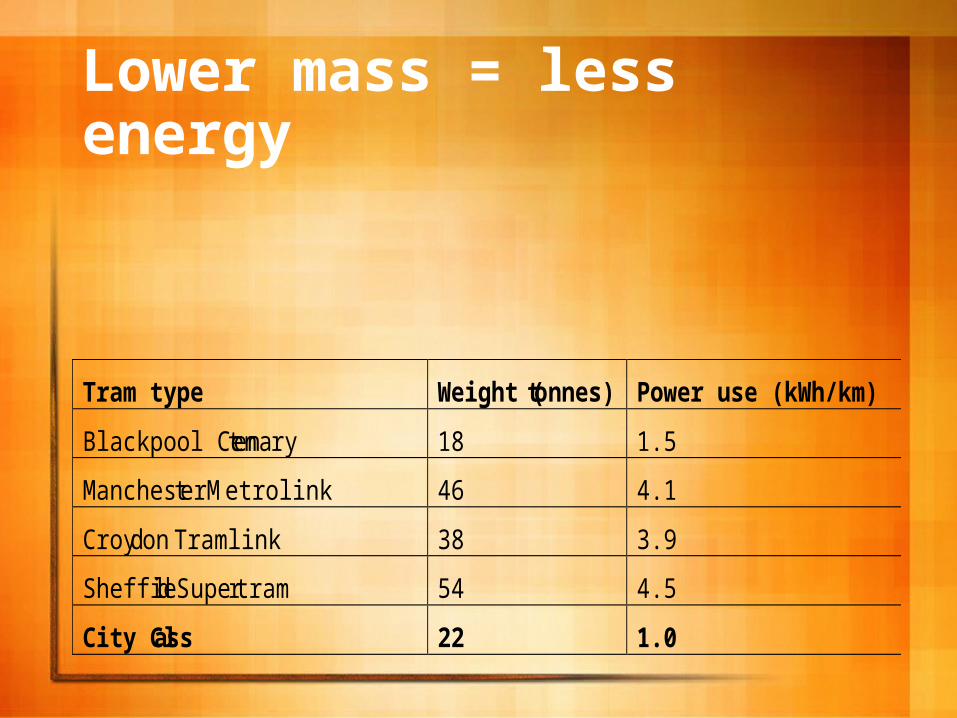
Lower mass = less energy
Tram type Weight (tonnes) Power use (kWh/km)
Blackpool Centenary 18 1.5
Manchester Metrolink 46 4.1
Croydon Tramlink 38 3.9
Sheffield Supertram 54 4.5
City Class 22 1.0

City Class in Birkenhead

Delivering Projects - 2 ways
Last 50 years = public funding/promotionPrior to 1940 = municipal and private cosPrior to 1900 all railways & trams privatePublic schemes = political interestsPrivate Cos = commercial objectives ?

Tramways - commercial ?
Revenue > operating costsCapital investment tramway onlyIRR > 10% not “Green Book”Due diligenceGetting Council on sideGetting residents on sideGetting commuters out of cars
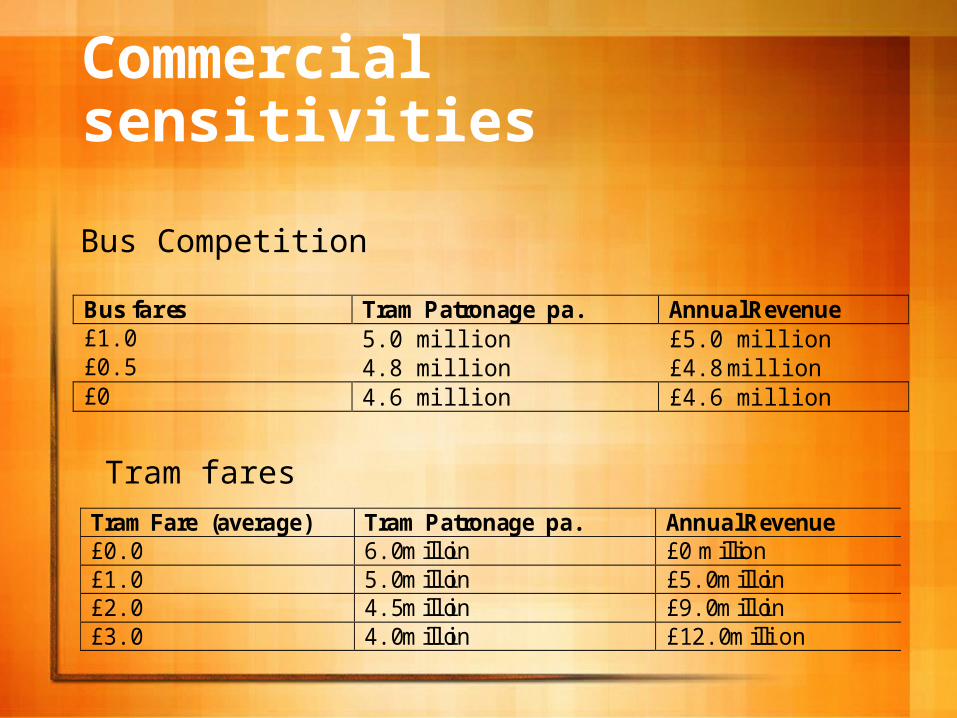
Commercial sensitivities
Bus fares Tram Patronage pa. Annual Revenue £1.0 5.0 million £5.0 million £0.5 4.8 million £4.8 million £0 4.6 million £4.6 million
Bus Competition
Tram Fare (average) Tram Patronage pa. Annual Revenue £0.0 6.0 million £0 million £1.0 5.0 million £5.0 million £2.0 4.5 million £9.0 million £3.0 4.0 million £12.0 million
Tram fares
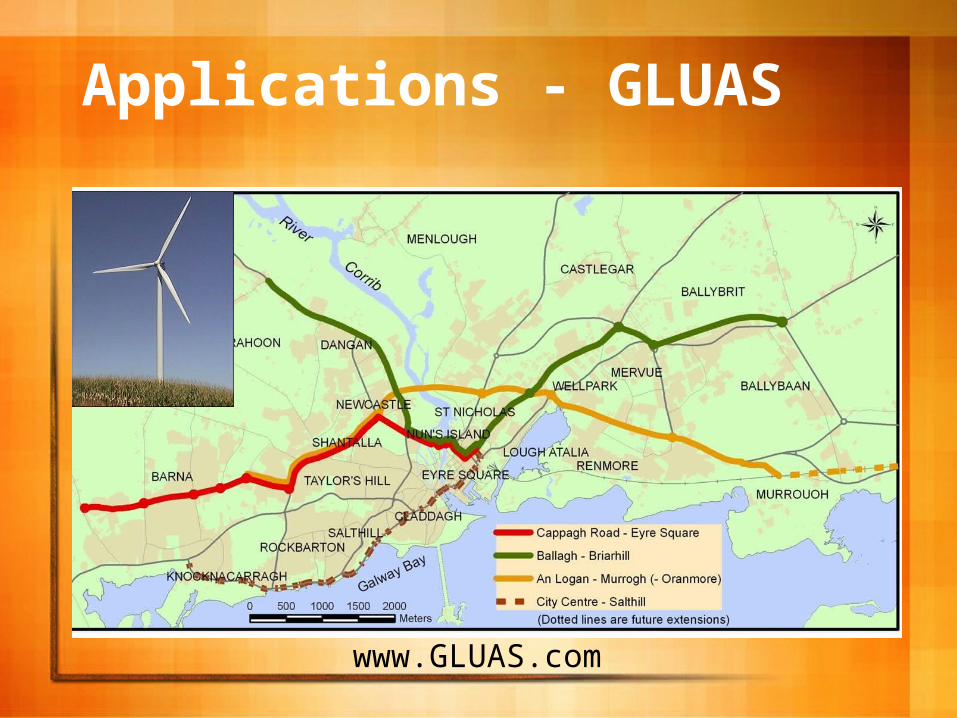
Applications - GLUAS
www.GLUAS.com
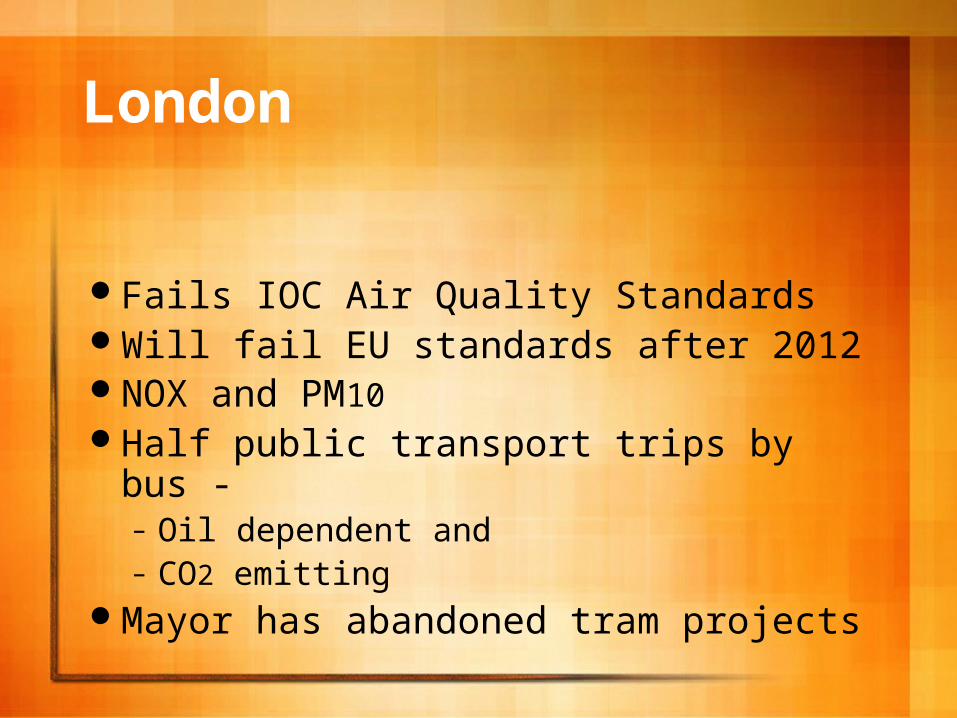
London
Fails IOC Air Quality StandardsWill fail EU standards after 2012NOX and PM10Half public transport trips by bus -
– Oil dependent and– CO2 emitting
Mayor has abandoned tram projects

QuickTime™ and aTIFF (Uncompressed) decompressor
are needed to see this picture.
The CROST Project
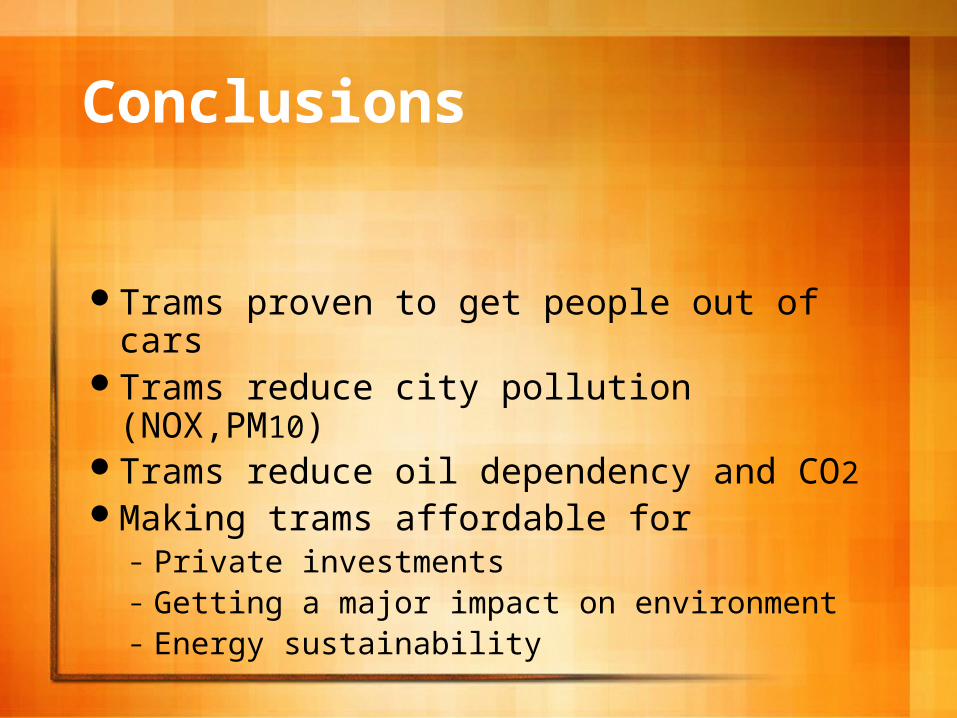
Conclusions
Trams proven to get people out of carsTrams reduce city pollution (NOX,PM10)Trams reduce oil dependency and CO2Making trams affordable for
– Private investments– Getting a major impact on environment– Energy sustainability