affected pathways and transcriptional regulators in gene
TRANSCRIPT
RESEARCH ARTICLE
Affected pathways and transcriptional
regulators in gene expression response to an
ultra-marathon trail: Global and independent
activity approaches
Maria Maqueda1,2*, Emma Roca3,4, Daniel Brotons5, Jose Manuel Soria6,
Alexandre Perera1,2
1 Department of ESAII, Center for Biomedical Engineering Research, Universitat Politècnica de Catalunya,
Barcelona, Catalonia, Spain, 2 CIBER de Bioingenierıa, Biomateriales y Nanomedicina (CIBER-BBN),
Barcelona, Catalonia, Spain, 3 Summit 2014 S.L., Centelles, Barcelona, Catalonia Spain, 4 Department of
Electronic Engineering, Center for Biomedical Engineering Research, Universitat Politècnica de Catalunya,
Barcelona, Catalonia, Spain, 5 Catalan Sports Council, Barcelona, Catalonia, Spain, 6 Unit of Genomics of
Complex Diseases, Institut de Recerca de l’Hospital de la Santa Creu i Sant Pau, Barcelona, Catalonia, Spain
Abstract
Gene expression (GE) analyses on blood samples from marathon and half-marathon run-
ners have reported significant impacts on the immune and inflammatory systems. An ultra-
marathon trail (UMT) represents a greater effort due to its more testing conditions. For the
first time, we report the genome-wide GE profiling in a group of 16 runners participating in
an 82 km UMT competition. We quantified their differential GE profile before and after the
race using HuGene2.0st microarrays (Affymetrix Inc., California, US). The results obtained
were decomposed by means of an independent component analysis (ICA) targeting inde-
pendent expression modes. We observed significant differences in the expression levels of
5,084 protein coding genes resulting in an overrepresentation of 14% of the human biologi-
cal pathways from the Kyoto Encyclopedia of Genes and Genomes database. These were
mainly clustered on terms related with protein synthesis repression, altered immune system
and infectious diseases related mechanisms. In a second analysis, 27 out of the 196 tran-
scriptional regulators (TRs) included in the Open Regulatory Annotation database were
overrepresented. Among these TRs, we identified transcription factors from the hypoxia-
inducible factors (HIF) family EPAS1 (p< 0.01) and HIF1A (p<0.001), and others jointly
described in the gluconeogenesis program such as HNF4 (p< 0.001), EGR1 (p<0.001),
CEBPA (p< 0.001) and a highly specific TR, YY1 (p<0.01). The five independent compo-
nents, obtained from ICA, further revealed a down-regulation of 10 genes distributed in the
complex I, III and V from the electron transport chain. This mitochondrial activity reduction is
compatible with HIF-1 system activation. The vascular endothelial growth factor (VEGF)
pathway, known to be regulated by HIF, also emerged (p<0.05). Additionally, and related to
the brain rewarding circuit, the endocannabinoid signalling pathway was overrepresented
(p<0.05).
PLOS ONE | https://doi.org/10.1371/journal.pone.0180322 October 13, 2017 1 / 26
a1111111111
a1111111111
a1111111111
a1111111111
a1111111111
OPENACCESS
Citation: Maqueda M, Roca E, Brotons D, Soria
JM, Perera A (2017) Affected pathways and
transcriptional regulators in gene expression
response to an ultra-marathon trail: Global and
independent activity approaches. PLoS ONE 12
(10): e0180322. https://doi.org/10.1371/journal.
pone.0180322
Editor: Xia Li, College of Bioinformatics Science
and Technology, CHINA
Received: February 10, 2017
Accepted: June 14, 2017
Published: October 13, 2017
Copyright: © 2017 Maqueda et al. This is an open
access article distributed under the terms of the
Creative Commons Attribution License, which
permits unrestricted use, distribution, and
reproduction in any medium, provided the original
author and source are credited.
Data Availability Statement: All CEL files obtained
from HuGene20st microarrays (Affymetrix) are
available in GEO repository (GSE93945).
Funding: The study was supported by the
Bioinformatics and Biomedical Signals Laboratory
(B2SLab), a consolidated research group of the
Generalitat de Catalunya, Spain (2014SGR-1063).
ER has a commercial affiliation with Summit 2014
S.L. This funder did not provide any support in the
form of salaries for author ER and did not have any
Introduction
Previous research has identified mechanisms triggered with the practice of moderate exercise that
yield beneficial effects on health, specially on cardiovascular disease [1]. These effects may be ex-
plained due to the adaptation of many organs to cope with required musculoskeletal performance
[2]. However, health benefits for the case of extreme endurance exercise remain unclear [3,4].
Ultra-marathon trails (UMTs) could be considered as extreme endurance exercise since
their running events should be longer than the traditional marathon (42.195 km). Typically,
they are run through a mountainous terrain with a considerable accumulated altitude change.
Due to their high physical and psychological demand, UMTs are identified as an ideal sport
for investigating a wide range of physiological responses [5]. These competitions show a grow-
ing popularity as indicated by the, approximately, sevenfold increase in the number of finishers
of 100km worldwide ultra-marathons between 1998 and 2011 [6]. In parallel, the amount of
scientific contributions focusing on UMT interventions has risen. They cover a varied range of
perspectives: some authors detected reactive oxygen species (ROS) promotion, oxidative stress
and inflammation in runners (n = 46) participating in a 330km UMT from capillary blood
sample using micro-invasive analytic methods [7]; others evidenced a respiratory muscle
strength reduction in inspiratory muscles when running a 110km UMT (n = 22) [8] or even,
the adversely impact in the cognitive performance after a 168km UMT race (n = 17) [9].
To the best of our knowledge, there are no studies that approach UMT runners’ genome-
wide gene expression (GE) response. This methodology has been used in other type of exer-
cise-related interventions such as a single bout of 4-hour stationary cycling (n = 5) [10] or after
a specific running endurance training (n = 13) [11]. On the other hand, GE on particular sets
of genes has been assessed in shorter distances as marathon races when studying the response
of specific interleukins (n = 16) [12] or in toll-like receptors (n = 47) [13].
A better understanding of the immune and inflammatory response has been the main moti-
vation with regard to peripheral blood sample experiments. The link between exercise and
immune system has long been studied tracing the beginning back to 1893 when an exercise-
induced leukocytosis was described [14]. Prior studies suggest that moderate exercise nega-
tively correlates with upper respiratory tract infections (URTI) incidence among other positive
clinical implications [15]. However, this may not be the case in marathon or similar events
where the opposite effect is detected [16]. A mechanistic explanation of an increased URTI
risk in marathon runners (n = 16) is proposed elsewhere [17]. This study is based on the ratio
imbalance of GE values from genes related to T-helper 1 (Th1) and Th2 cells. Likewise, other
authors summarized the exercise impact on the GE of common inflammatory markers in a
diverse range of exercise disciplines, intensity and duration [18].
In other experiments, the use of skeletal muscle biopsy samples is driven by the understand-
ing of the adaptation of the human skeletal muscle to exercise [19]. In this context, the role
of the hypoxia-inducible factor family (HIF), as reviewed in [20], is of great interest since its
target genes include the vascular endothelial growth factor (VEGF), which related signalling
pathway is one of the events driving the vascular system remodelling known to occur with
dynamic exercise [2].
In this study, we obtained the genome-wide GE profiling in a group of runners (n = 16)
participating in an 82km UMT race. We report the biological pathways and transcriptional
regulators enriched by the list of differentially expressed genes as a result of the UMT interven-
tion. For doing so, we addressed the genetic response from a global perspective and from an
independent activity approach after implementing a statistical method capable of extracting
independent sources of information.
Gene expression profiling in ultra-marathon trail runners
PLOS ONE | https://doi.org/10.1371/journal.pone.0180322 October 13, 2017 2 / 26
additional role in the study design, data collection
and analysis, decision to publish or preparation of
the manuscript.
Competing interests: ER has a commercial
affiliation with Summit 2014 S.L. but this funder
has no competing interests regarding the results of
this study. The authors have declared that no
competing interests exist. This commercial
affiliation does not alter our adherence to PLOS
ONE policies on sharing data and materials.
Materials and methods
Ethical approval
All procedures involved in this study conformed to the Declaration of Helsinki. Ethical
approval was granted by the Ethics Committee of the Catalan Sports Council from Govern-
ment of Catalonia (Approval number 0099S/2046/2013). Written informed consent was
obtained from all individuals participating in the study.
Experimental design
We approached and recruited 18 healthy runners who accepted to voluntarily participate in
the study. They were athletes with prior experience in UMTs and presented no muscle injuries
in the previous six months. One of the subjects dropout so finally, a total of 17 runners partici-
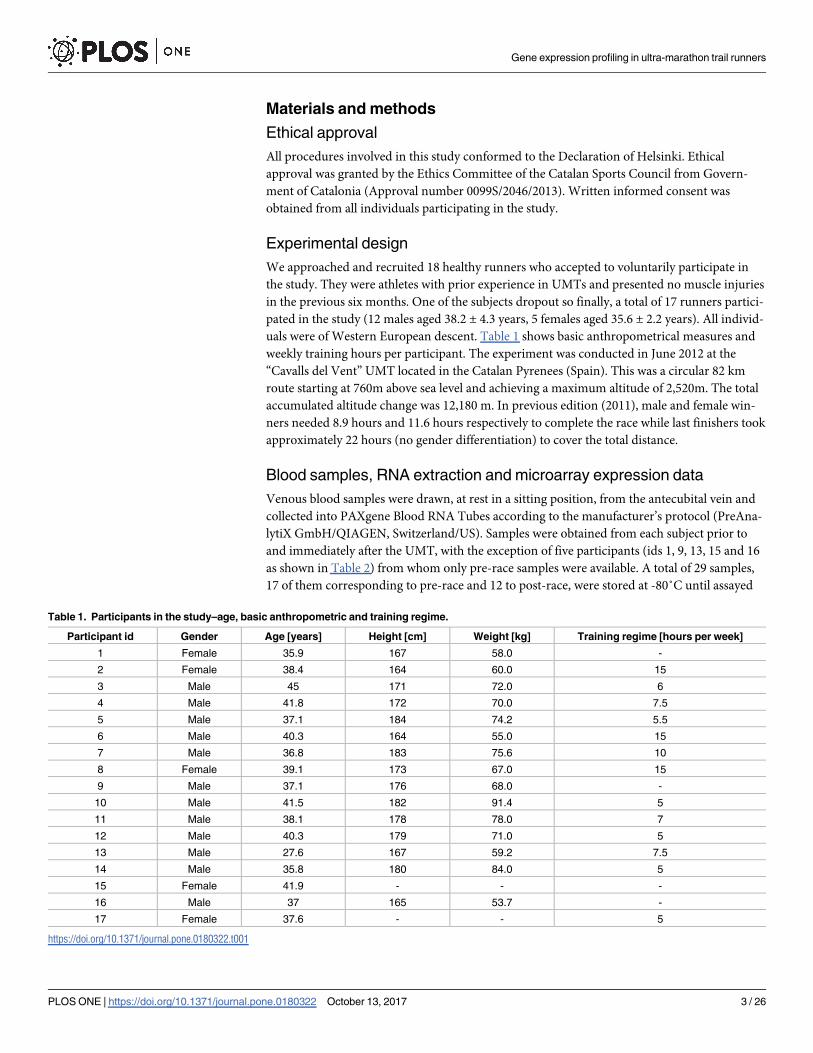
pated in the study (12 males aged 38.2 ± 4.3 years, 5 females aged 35.6 ± 2.2 years). All individ-
uals were of Western European descent. Table 1 shows basic anthropometrical measures and
weekly training hours per participant. The experiment was conducted in June 2012 at the
“Cavalls del Vent” UMT located in the Catalan Pyrenees (Spain). This was a circular 82 km
route starting at 760m above sea level and achieving a maximum altitude of 2,520m. The total
accumulated altitude change was 12,180 m. In previous edition (2011), male and female win-
ners needed 8.9 hours and 11.6 hours respectively to complete the race while last finishers took
approximately 22 hours (no gender differentiation) to cover the total distance.
Blood samples, RNA extraction and microarray expression data
Venous blood samples were drawn, at rest in a sitting position, from the antecubital vein and
collected into PAXgene Blood RNA Tubes according to the manufacturer’s protocol (PreAna-
lytiX GmbH/QIAGEN, Switzerland/US). Samples were obtained from each subject prior to
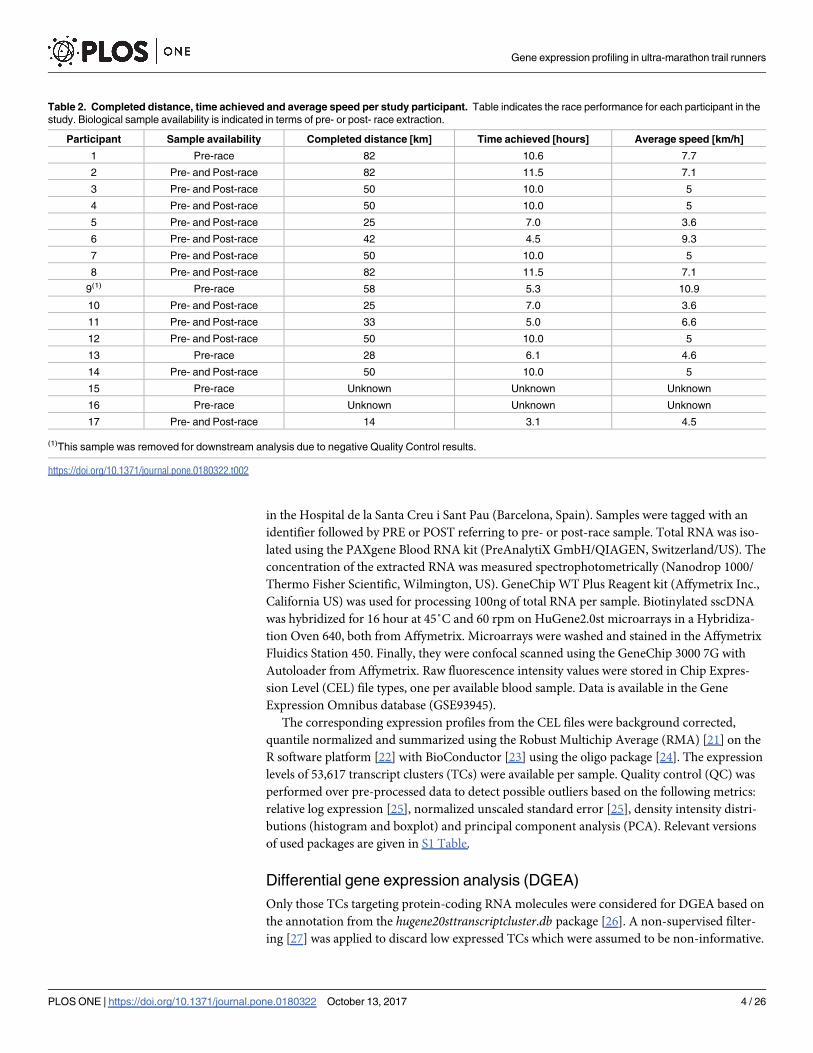
and immediately after the UMT, with the exception of five participants (ids 1, 9, 13, 15 and 16
as shown in Table 2) from whom only pre-race samples were available. A total of 29 samples,
17 of them corresponding to pre-race and 12 to post-race, were stored at -80˚C until assayed
Table 1. Participants in the study–age, basic anthropometric and training regime.
Participant id Gender Age [years] Height [cm] Weight [kg] Training regime [hours per week]
1 Female 35.9 167 58.0 -
2 Female 38.4 164 60.0 15
3 Male 45 171 72.0 6
4 Male 41.8 172 70.0 7.5
5 Male 37.1 184 74.2 5.5
6 Male 40.3 164 55.0 15
7 Male 36.8 183 75.6 10
8 Female 39.1 173 67.0 15
9 Male 37.1 176 68.0 -
10 Male 41.5 182 91.4 5
11 Male 38.1 178 78.0 7
12 Male 40.3 179 71.0 5
13 Male 27.6 167 59.2 7.5
14 Male 35.8 180 84.0 5
15 Female 41.9 - - -
16 Male 37 165 53.7 -
17 Female 37.6 - - 5
https://doi.org/10.1371/journal.pone.0180322.t001
Gene expression profiling in ultra-marathon trail runners
PLOS ONE | https://doi.org/10.1371/journal.pone.0180322 October 13, 2017 3 / 26
in the Hospital de la Santa Creu i Sant Pau (Barcelona, Spain). Samples were tagged with an
identifier followed by PRE or POST referring to pre- or post-race sample. Total RNA was iso-
lated using the PAXgene Blood RNA kit (PreAnalytiX GmbH/QIAGEN, Switzerland/US). The
concentration of the extracted RNA was measured spectrophotometrically (Nanodrop 1000/
Thermo Fisher Scientific, Wilmington, US). GeneChip WT Plus Reagent kit (Affymetrix Inc.,
California US) was used for processing 100ng of total RNA per sample. Biotinylated sscDNA
was hybridized for 16 hour at 45˚C and 60 rpm on HuGene2.0st microarrays in a Hybridiza-
tion Oven 640, both from Affymetrix. Microarrays were washed and stained in the Affymetrix
Fluidics Station 450. Finally, they were confocal scanned using the GeneChip 3000 7G with
Autoloader from Affymetrix. Raw fluorescence intensity values were stored in Chip Expres-
sion Level (CEL) file types, one per available blood sample. Data is available in the Gene
Expression Omnibus database (GSE93945).
The corresponding expression profiles from the CEL files were background corrected,
quantile normalized and summarized using the Robust Multichip Average (RMA) [21] on the
R software platform [22] with BioConductor [23] using the oligo package [24]. The expression
levels of 53,617 transcript clusters (TCs) were available per sample. Quality control (QC) was
performed over pre-processed data to detect possible outliers based on the following metrics:
relative log expression [25], normalized unscaled standard error [25], density intensity distri-
butions (histogram and boxplot) and principal component analysis (PCA). Relevant versions
of used packages are given in S1 Table.
Differential gene expression analysis (DGEA)
Only those TCs targeting protein-coding RNA molecules were considered for DGEA based on
the annotation from the hugene20sttranscriptcluster.db package [26]. A non-supervised filter-
ing [27] was applied to discard low expressed TCs which were assumed to be non-informative.
Table 2. Completed distance, time achieved and average speed per study participant. Table indicates the race performance for each participant in the
study. Biological sample availability is indicated in terms of pre- or post- race extraction.
Participant Sample availability Completed distance [km] Time achieved [hours] Average speed [km/h]
1 Pre-race 82 10.6 7.7
2 Pre- and Post-race 82 11.5 7.1
3 Pre- and Post-race 50 10.0 5
4 Pre- and Post-race 50 10.0 5
5 Pre- and Post-race 25 7.0 3.6
6 Pre- and Post-race 42 4.5 9.3
7 Pre- and Post-race 50 10.0 5
8 Pre- and Post-race 82 11.5 7.1
9(1) Pre-race 58 5.3 10.9
10 Pre- and Post-race 25 7.0 3.6
11 Pre- and Post-race 33 5.0 6.6
12 Pre- and Post-race 50 10.0 5
13 Pre-race 28 6.1 4.6
14 Pre- and Post-race 50 10.0 5
15 Pre-race Unknown Unknown Unknown
16 Pre-race Unknown Unknown Unknown
17 Pre- and Post-race 14 3.1 4.5
(1)This sample was removed for downstream analysis due to negative Quality Control results.
https://doi.org/10.1371/journal.pone.0180322.t002
Gene expression profiling in ultra-marathon trail runners
PLOS ONE | https://doi.org/10.1371/journal.pone.0180322 October 13, 2017 4 / 26
TCs with expression values higher than the overall intensity mean, computed across all arrays,
and on more than 12 arrays were selected for DGEA. The genefilter package [28] was used for
this purpose. Then, a linear regression model (LM) was fitted to each TC expression value
according to Eq (1).
gk ¼ b0k þ b1k � g þ b2k � d þ �k ð1Þ
where gk is the expression value of TC k, β0k is the LM intercept for TC expression value k, β1k
and β2k are the unknown coefficients for the variables gender g and distance d respectively and
�k are the random errors. The empirical Bayes moderated t-statistics tested whether each indi-
vidual coefficient was zero using the limma package [29]. Statistically significant differentially
expressed TCs (differential TCs) were selected and ranked (adjusted p-value < 5%, FDR) per
LM predictor variable. Entrez Gene identifiers (IDs) were mapped from their differential TCs.
The resulting list of differential genes was used as input for the downstream analysis (Fig 1).
A heatmap was generated with gplots package [30] for selected TCs including a hierarchical
clustering with complete linkage method.
Independent activity analysis
Microarray expression data could be understood as a linear combination of independent
expression sources, each one associated with a particular biological reading [31]. We computed
an Independent Component Analysis (ICA) to extract these expression sources [32] according
to Eq (2).
XT ¼ SA ð2Þ
where X is an n ×m matrix of the expression values of n genes under m array samples. The col-
umns of the m × k source matrix S contain k independent components (ICs) and the k × nmatrix A represents the linear mixing matrix. The row of matrix A comprises the weights with
which the expression levels of the n genes contribute to each kth expression mode.
The list of differential genes was selected to build a matrix X. First, the optimum number of
k ICs for X was obtained by estimating the optimal number of components in the PCA using
Gene 1 Gene 2 Gene 3
Gene n
Differential Genes
from DGEA Global response to intervention
Independent response blocks to
intervention Gene 1 Gene 2 Gene 3
Gene 1 Gene 2 Gene 3
Gene 1 Gene 2 Gene 3
ICA
GEA + TREA
IC1 IC2
ICk
Biological Knowledge databases
KEGG PATHWAY Reactome The Gene Ontology
Regulatory Annotation databases
ORegAnno
TR 1 TR 2 TR 3
Overrepresented pathways
Overregulated TRs
Deflation method + ICA
TR 1 TR 2
TR 1 TR 2
TR 1 TR 2
TR 1 TR 2
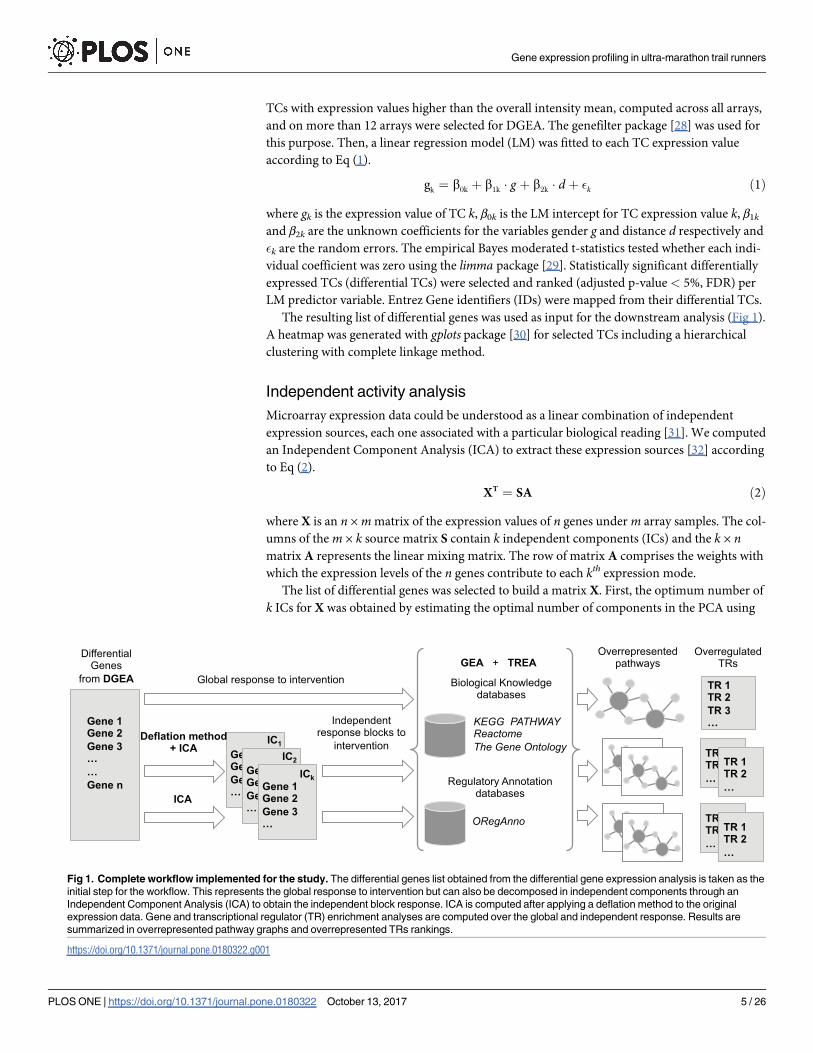
Fig 1. Complete workflow implemented for the study. The differential genes list obtained from the differential gene expression analysis is taken as the
initial step for the workflow. This represents the global response to intervention but can also be decomposed in independent components through an
Independent Component Analysis (ICA) to obtain the independent block response. ICA is computed after applying a deflation method to the original
expression data. Gene and transcriptional regulator (TR) enrichment analyses are computed over the global and independent response. Results are
summarized in overrepresented pathway graphs and overrepresented TRs rankings.
https://doi.org/10.1371/journal.pone.0180322.g001
Gene expression profiling in ultra-marathon trail runners
PLOS ONE | https://doi.org/10.1371/journal.pone.0180322 October 13, 2017 5 / 26
the generalized cross-validation approximation (GCV) and the smoothing method [33], both
implemented in the FactoMineR package [34]. Then a deflationary method was applied to X to
remove the first component of variance as computed by the PCA. This was applied to elimi-
nate the main response to the intervention characterized by the immune system and the
genetic information processes as latter shown. These powerful signals act as a masking effect
for the rest of underlying processes making difficult for ICA to detect them. Deflation was
applied according to Eq (3):
YT ¼ zi1 ϕj1 ð3Þ
where Y is an n ×m matrix which refers to the expression values of n genes from m array sam-
ples captured by the first principal component (PC1), zi1 is the scores vector of the ith array
sample in PC1 and ϕj1 corresponds to the loadings vector of the jth gene. Lastly, an estimated
matrix XT was built according to Eq (4):
XT ¼ XT � YT ð4Þ
ICA was performed over both the matrixes XT and XT where k − 1 ICs were considered in
the second case due to the applied deflation. The fastICA package was used [35] (εt <1e-4,
G� log cosh with α1 = 1 [32], ICs extracted simultaneously). Those genes with absolute weight
value included in the ninth decile were considered as the most representative genes for each
specific IC.
Gene enrichment analysis (GEA)
A GEA was applied in two stages: (i) globally when considering the list of differential genes and
(ii) specifically for each IC derived from ICA and only considering the most representative genes.
GEA was computed over Kyoto Encyclopedia of Genes and Genoms (KEGG) PATHWAY [36],
Reactome [37] and The Gene Ontology (GO) Biological Processes [38] databases with the package
clusterProfiler [39]. For each queried biological pathway or GO term, an adjusted p-value was cal-
culated with a hypergeometric distribution test (adjusted p-value< 5%, False Discovery Rate
FDR). The background distribution was defined by all available annotations in the relevant data-
base or by the list of differential genes if the global or ICA stage was considered, respectively.
Transcriptional regulator enrichment analysis (TREA)
To explore overrepresented transcriptional regulators (TRs) as a response to UMT completed
distance, a TREA was conducted. We considered differential genes to be potentially regulated
by one or more TRs. The TREA was implemented with a hypergeometric model to assess
whether the number of differential genes related to a specific TR was larger than expected. TRs
were ranked based on their adjusted p-values (<5%, FDR). The TREA was implemented in
two stages, globally and specifically per IC. A compilation of interactions between human TRs
and target genes (TGs) was obtained from the Open Regulatory Annotation (ORA) database
v3.0 [40]. Interactions between 196 regulatory elements and 23,991 TGs were chosen (type of
regulation was set to transcription factor binding site, GRCh37/hg19). Background distribution
was defined by the complete customized database or by the list of differential genes if the global
or ICA stage was considered, respectively.
Results
Only 3 out of the 17 initial participants in the study finished the UMT while the rest of volun-
teers decided to leave the race at different distances along the trail. This was due to the adverse
Gene expression profiling in ultra-marathon trail runners
PLOS ONE | https://doi.org/10.1371/journal.pone.0180322 October 13, 2017 6 / 26
weather conditions mainly because of low temperatures (from 0.9˚C to 13.1˚C) and rain pres-
ence (from 0 to 6.1mm/h). The corresponding completed distance per participant and respec-
tive achieved time is given in Table 2. Additionally, biological sample availability is
commented relative to its extraction before and/or after the race (pre- and post-race
respectively).
QC excluded one pre-race sample, without post-race counterpart, which showed an abnor-
mal pattern (S1 Fig). Pre-processing and QC was repeated after its removal with positive
results. Therefore, a total of 28 samples, 16 of them pre-race and 12 post-race, were kept for
further analysis. After filtering by target protein-coding RNA molecules, 25,272 TCs were
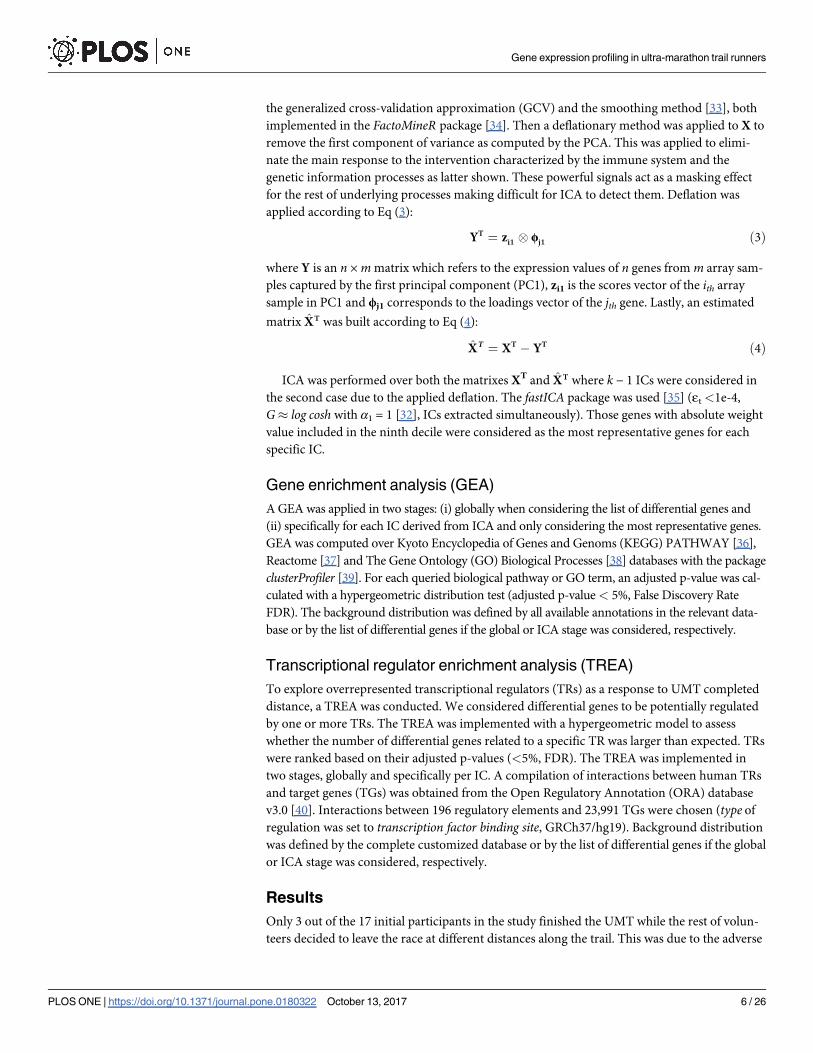
available for DGEA. This group of TCs interrogated 22,072 different genes. To visualize their
main source of variance, a PCA was conducted over their expression values. PC1 captured
25% of the total data variance, this being aligned with the effect of participating in the UMT
(Fig 2).
DGEA reveals a list of 5084 distinct genes responding to intervention
DGEA identified 5,974 differential TCs as a response to UMT (β2 6¼ 0). Among the list of 5,974
differential TCs, 5,499 were unambiguously annotated to a single gene (S2 Table) while 475
had multiple annotations (S3 Table). The list of 5,499 differential TCs corresponded to 5,084
distinct genes which were mainly down-regulated (63%) rather than up-regulated (37%). No
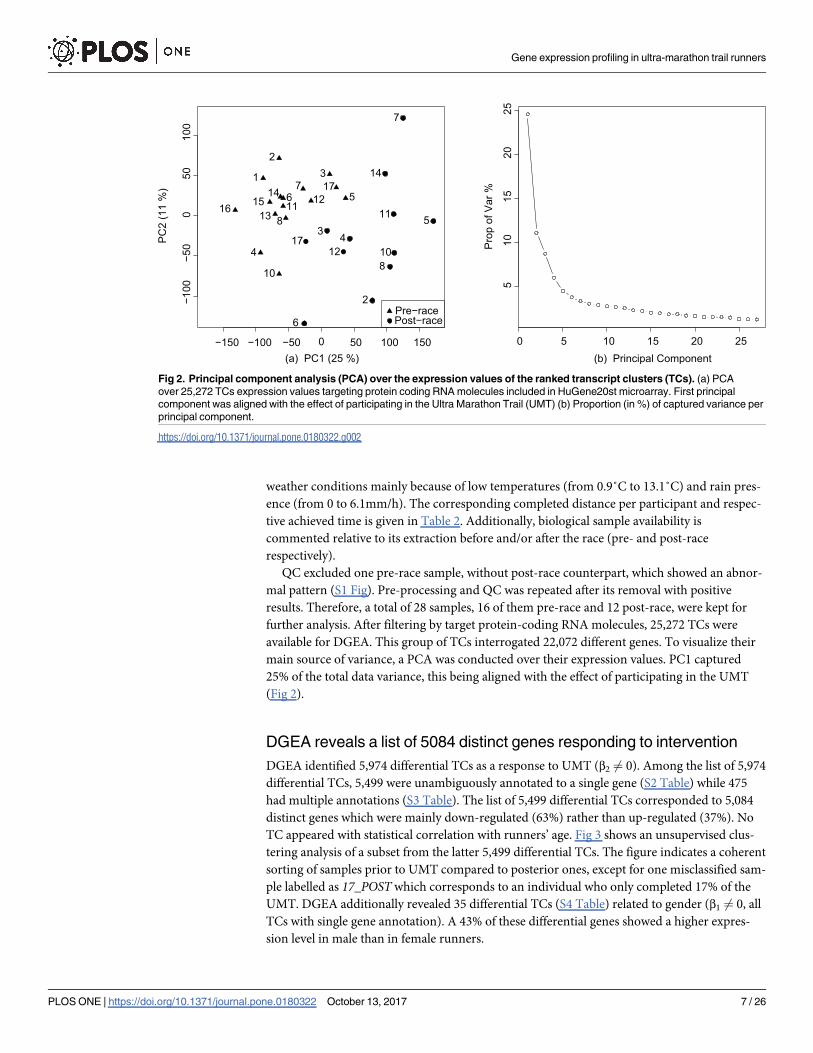
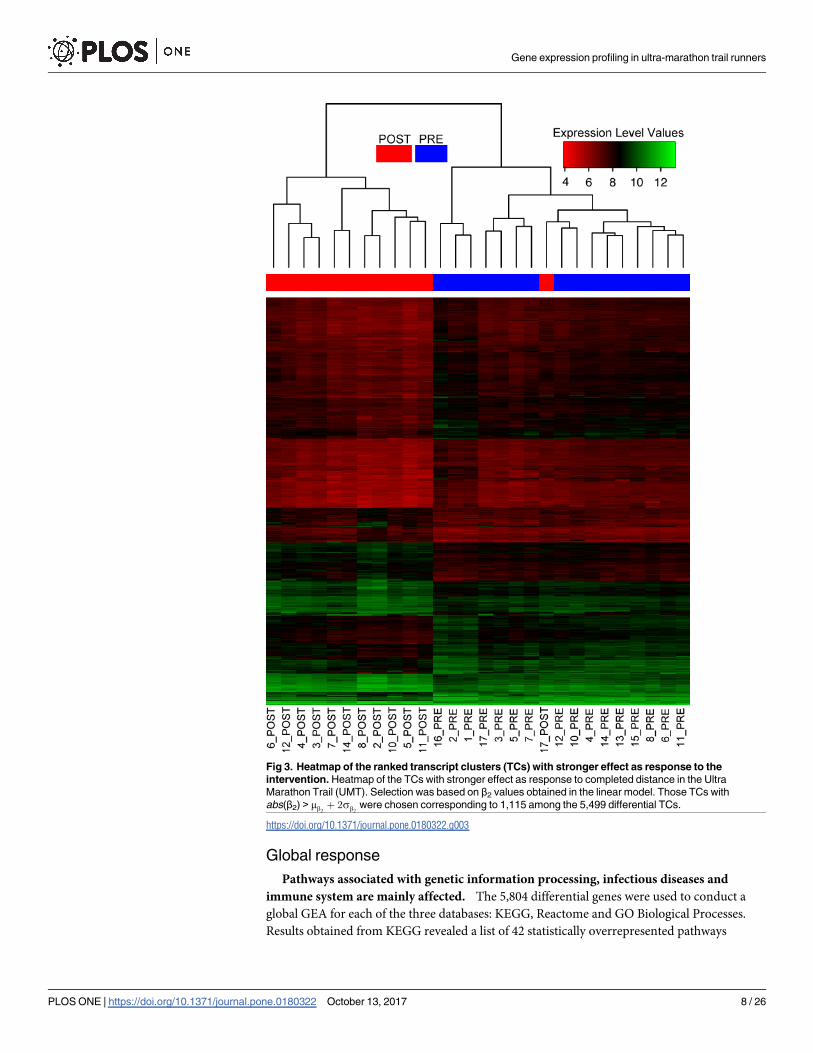
TC appeared with statistical correlation with runners’ age. Fig 3 shows an unsupervised clus-
tering analysis of a subset from the latter 5,499 differential TCs. The figure indicates a coherent
sorting of samples prior to UMT compared to posterior ones, except for one misclassified sam-
ple labelled as 17_POST which corresponds to an individual who only completed 17% of the
UMT. DGEA additionally revealed 35 differential TCs (S4 Table) related to gender (β1 6¼ 0, all
TCs with single gene annotation). A 43% of these differential genes showed a higher expres-
sion level in male than in female runners.
Fig 2. Principal component analysis (PCA) over the expression values of the ranked transcript clusters (TCs). (a) PCA
over 25,272 TCs expression values targeting protein coding RNA molecules included in HuGene20st microarray. First principal
component was aligned with the effect of participating in the Ultra Marathon Trail (UMT) (b) Proportion (in %) of captured variance per
principal component.
https://doi.org/10.1371/journal.pone.0180322.g002
Gene expression profiling in ultra-marathon trail runners
PLOS ONE | https://doi.org/10.1371/journal.pone.0180322 October 13, 2017 7 / 26
Global response
Pathways associated with genetic information processing, infectious diseases and
immune system are mainly affected. The 5,804 differential genes were used to conduct a
global GEA for each of the three databases: KEGG, Reactome and GO Biological Processes.
Results obtained from KEGG revealed a list of 42 statistically overrepresented pathways
Fig 3. Heatmap of the ranked transcript clusters (TCs) with stronger effect as response to the
intervention. Heatmap of the TCs with stronger effect as response to completed distance in the Ultra
Marathon Trail (UMT). Selection was based on β2 values obtained in the linear model. Those TCs with
abs(β2) > mb2þ 2sb2
were chosen corresponding to 1,115 among the 5,499 differential TCs.
https://doi.org/10.1371/journal.pone.0180322.g003
Gene expression profiling in ultra-marathon trail runners
PLOS ONE | https://doi.org/10.1371/journal.pone.0180322 October 13, 2017 8 / 26
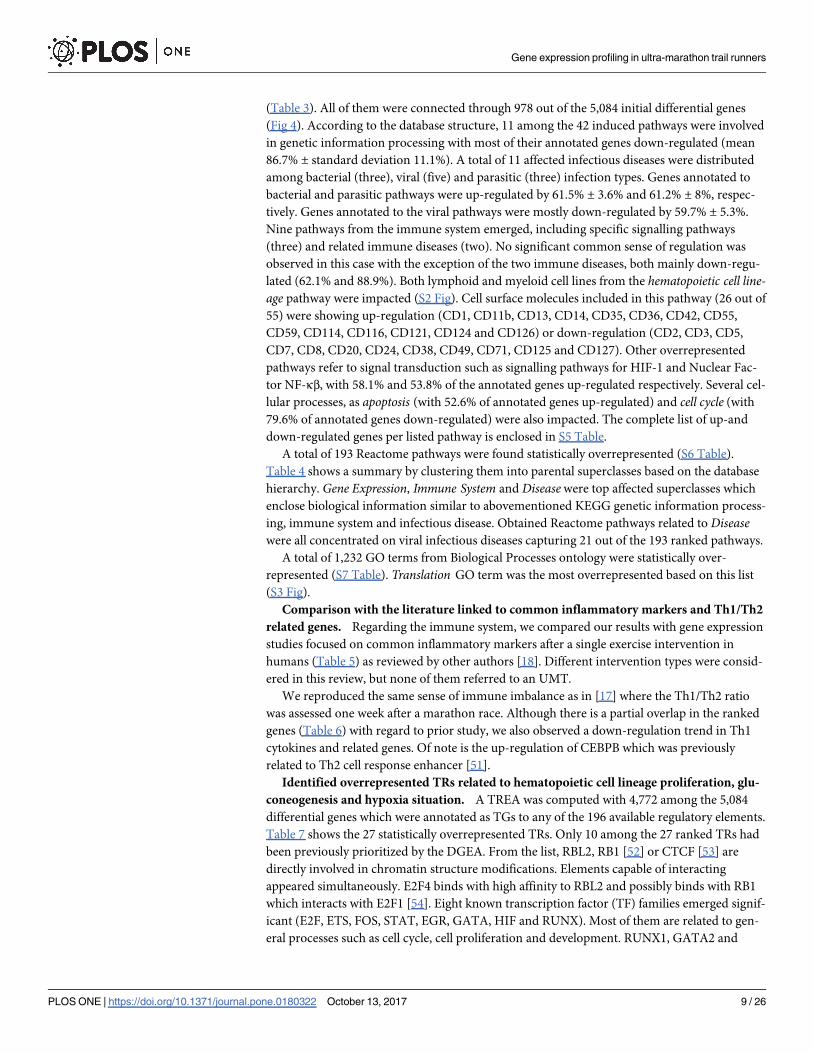
(Table 3). All of them were connected through 978 out of the 5,084 initial differential genes
(Fig 4). According to the database structure, 11 among the 42 induced pathways were involved
in genetic information processing with most of their annotated genes down-regulated (mean
86.7% ± standard deviation 11.1%). A total of 11 affected infectious diseases were distributed
among bacterial (three), viral (five) and parasitic (three) infection types. Genes annotated to
bacterial and parasitic pathways were up-regulated by 61.5% ± 3.6% and 61.2% ± 8%, respec-
tively. Genes annotated to the viral pathways were mostly down-regulated by 59.7% ± 5.3%.
Nine pathways from the immune system emerged, including specific signalling pathways
(three) and related immune diseases (two). No significant common sense of regulation was
observed in this case with the exception of the two immune diseases, both mainly down-regu-
lated (62.1% and 88.9%). Both lymphoid and myeloid cell lines from the hematopoietic cell line-age pathway were impacted (S2 Fig). Cell surface molecules included in this pathway (26 out of
55) were showing up-regulation (CD1, CD11b, CD13, CD14, CD35, CD36, CD42, CD55,
CD59, CD114, CD116, CD121, CD124 and CD126) or down-regulation (CD2, CD3, CD5,
CD7, CD8, CD20, CD24, CD38, CD49, CD71, CD125 and CD127). Other overrepresented
pathways refer to signal transduction such as signalling pathways for HIF-1 and Nuclear Fac-
tor NF-κβ, with 58.1% and 53.8% of the annotated genes up-regulated respectively. Several cel-
lular processes, as apoptosis (with 52.6% of annotated genes up-regulated) and cell cycle (with
79.6% of annotated genes down-regulated) were also impacted. The complete list of up-and
down-regulated genes per listed pathway is enclosed in S5 Table.
A total of 193 Reactome pathways were found statistically overrepresented (S6 Table).
Table 4 shows a summary by clustering them into parental superclasses based on the database
hierarchy. Gene Expression, Immune System and Disease were top affected superclasses which
enclose biological information similar to abovementioned KEGG genetic information process-
ing, immune system and infectious disease. Obtained Reactome pathways related to Diseasewere all concentrated on viral infectious diseases capturing 21 out of the 193 ranked pathways.
A total of 1,232 GO terms from Biological Processes ontology were statistically over-
represented (S7 Table). Translation GO term was the most overrepresented based on this list
(S3 Fig).
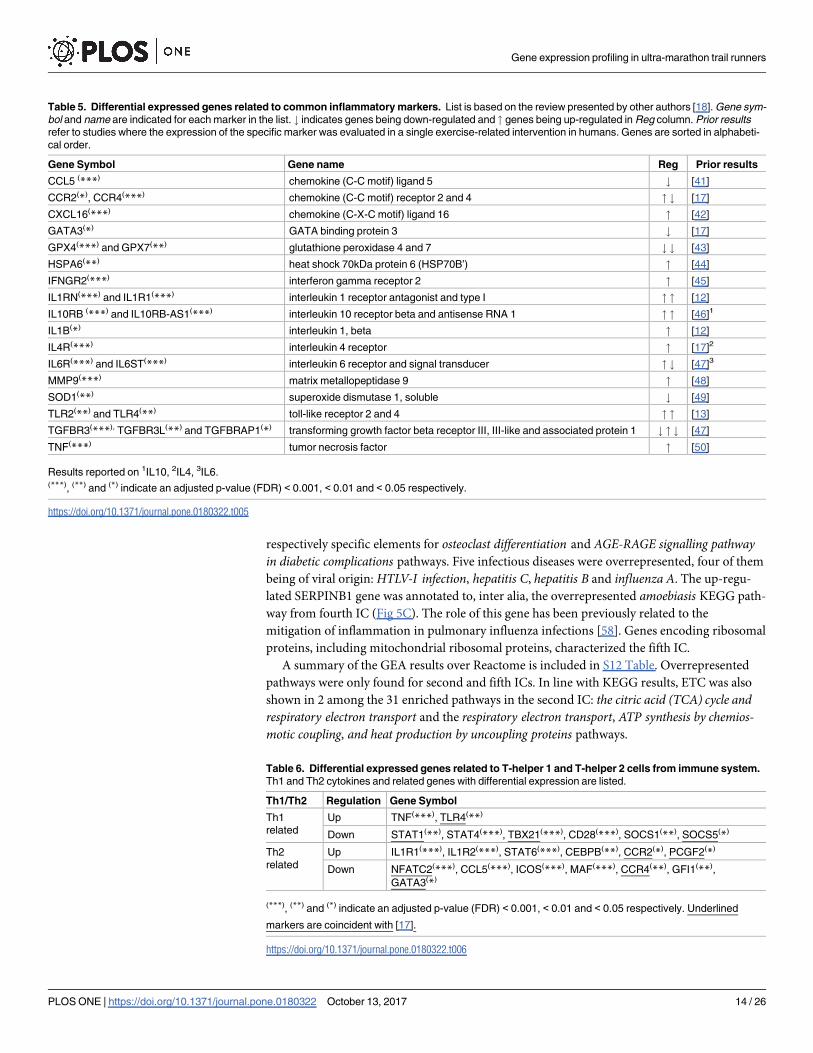
Comparison with the literature linked to common inflammatory markers and Th1/Th2
related genes. Regarding the immune system, we compared our results with gene expression
studies focused on common inflammatory markers after a single exercise intervention in
humans (Table 5) as reviewed by other authors [18]. Different intervention types were consid-
ered in this review, but none of them referred to an UMT.
We reproduced the same sense of immune imbalance as in [17] where the Th1/Th2 ratio
was assessed one week after a marathon race. Although there is a partial overlap in the ranked
genes (Table 6) with regard to prior study, we also observed a down-regulation trend in Th1
cytokines and related genes. Of note is the up-regulation of CEBPB which was previously
related to Th2 cell response enhancer [51].
Identified overrepresented TRs related to hematopoietic cell lineage proliferation, glu-
coneogenesis and hypoxia situation. A TREA was computed with 4,772 among the 5,084
differential genes which were annotated as TGs to any of the 196 available regulatory elements.
Table 7 shows the 27 statistically overrepresented TRs. Only 10 among the 27 ranked TRs had
been previously prioritized by the DGEA. From the list, RBL2, RB1 [52] or CTCF [53] are
directly involved in chromatin structure modifications. Elements capable of interacting
appeared simultaneously. E2F4 binds with high affinity to RBL2 and possibly binds with RB1
which interacts with E2F1 [54]. Eight known transcription factor (TF) families emerged signif-
icant (E2F, ETS, FOS, STAT, EGR, GATA, HIF and RUNX). Most of them are related to gen-
eral processes such as cell cycle, cell proliferation and development. RUNX1, GATA2 and
Gene expression profiling in ultra-marathon trail runners
PLOS ONE | https://doi.org/10.1371/journal.pone.0180322 October 13, 2017 9 / 26
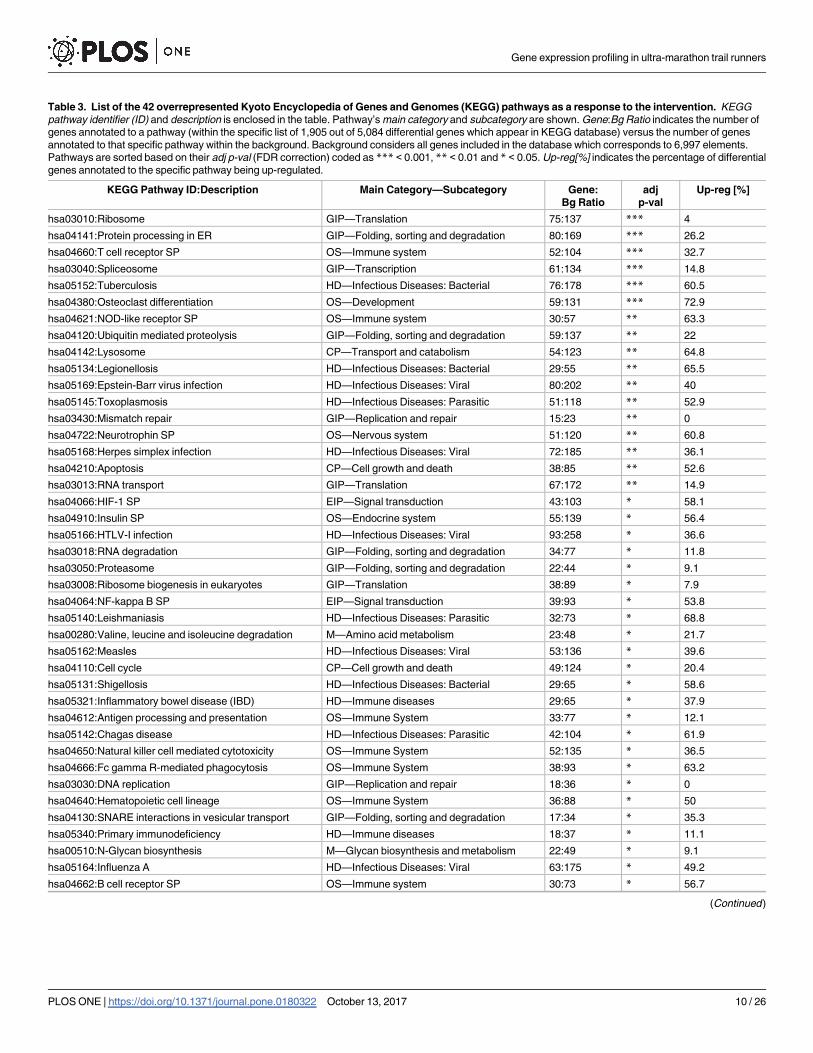
Table 3. List of the 42 overrepresented Kyoto Encyclopedia of Genes and Genomes (KEGG) pathways as a response to the intervention. KEGG
pathway identifier (ID) and description is enclosed in the table. Pathway’s main category and subcategory are shown. Gene:Bg Ratio indicates the number of
genes annotated to a pathway (within the specific list of 1,905 out of 5,084 differential genes which appear in KEGG database) versus the number of genes
annotated to that specific pathway within the background. Background considers all genes included in the database which corresponds to 6,997 elements.
Pathways are sorted based on their adj p-val (FDR correction) coded as *** < 0.001, ** < 0.01 and * < 0.05. Up-reg[%] indicates the percentage of differential
genes annotated to the specific pathway being up-regulated.
KEGG Pathway ID:Description Main Category—Subcategory Gene:
Bg Ratio
adj
p-val
Up-reg [%]
hsa03010:Ribosome GIP—Translation 75:137 *** 4
hsa04141:Protein processing in ER GIP—Folding, sorting and degradation 80:169 *** 26.2
hsa04660:T cell receptor SP OS—Immune system 52:104 *** 32.7
hsa03040:Spliceosome GIP—Transcription 61:134 *** 14.8
hsa05152:Tuberculosis HD—Infectious Diseases: Bacterial 76:178 *** 60.5
hsa04380:Osteoclast differentiation OS—Development 59:131 *** 72.9
hsa04621:NOD-like receptor SP OS—Immune system 30:57 ** 63.3
hsa04120:Ubiquitin mediated proteolysis GIP—Folding, sorting and degradation 59:137 ** 22
hsa04142:Lysosome CP—Transport and catabolism 54:123 ** 64.8
hsa05134:Legionellosis HD—Infectious Diseases: Bacterial 29:55 ** 65.5
hsa05169:Epstein-Barr virus infection HD—Infectious Diseases: Viral 80:202 ** 40
hsa05145:Toxoplasmosis HD—Infectious Diseases: Parasitic 51:118 ** 52.9
hsa03430:Mismatch repair GIP—Replication and repair 15:23 ** 0
hsa04722:Neurotrophin SP OS—Nervous system 51:120 ** 60.8
hsa05168:Herpes simplex infection HD—Infectious Diseases: Viral 72:185 ** 36.1
hsa04210:Apoptosis CP—Cell growth and death 38:85 ** 52.6
hsa03013:RNA transport GIP—Translation 67:172 ** 14.9
hsa04066:HIF-1 SP EIP—Signal transduction 43:103 * 58.1
hsa04910:Insulin SP OS—Endocrine system 55:139 * 56.4
hsa05166:HTLV-I infection HD—Infectious Diseases: Viral 93:258 * 36.6
hsa03018:RNA degradation GIP—Folding, sorting and degradation 34:77 * 11.8
hsa03050:Proteasome GIP—Folding, sorting and degradation 22:44 * 9.1
hsa03008:Ribosome biogenesis in eukaryotes GIP—Translation 38:89 * 7.9
hsa04064:NF-kappa B SP EIP—Signal transduction 39:93 * 53.8
hsa05140:Leishmaniasis HD—Infectious Diseases: Parasitic 32:73 * 68.8
hsa00280:Valine, leucine and isoleucine degradation M—Amino acid metabolism 23:48 * 21.7
hsa05162:Measles HD—Infectious Diseases: Viral 53:136 * 39.6
hsa04110:Cell cycle CP—Cell growth and death 49:124 * 20.4
hsa05131:Shigellosis HD—Infectious Diseases: Bacterial 29:65 * 58.6
hsa05321:Inflammatory bowel disease (IBD) HD—Immune diseases 29:65 * 37.9
hsa04612:Antigen processing and presentation OS—Immune System 33:77 * 12.1
hsa05142:Chagas disease HD—Infectious Diseases: Parasitic 42:104 * 61.9
hsa04650:Natural killer cell mediated cytotoxicity OS—Immune System 52:135 * 36.5
hsa04666:Fc gamma R-mediated phagocytosis OS—Immune System 38:93 * 63.2
hsa03030:DNA replication GIP—Replication and repair 18:36 * 0
hsa04640:Hematopoietic cell lineage OS—Immune System 36:88 * 50
hsa04130:SNARE interactions in vesicular transport GIP—Folding, sorting and degradation 17:34 * 35.3
hsa05340:Primary immunodeficiency HD—Immune diseases 18:37 * 11.1
hsa00510:N-Glycan biosynthesis M—Glycan biosynthesis and metabolism 22:49 * 9.1
hsa05164:Influenza A HD—Infectious Diseases: Viral 63:175 * 49.2
hsa04662:B cell receptor SP OS—Immune system 30:73 * 56.7
(Continued )
Gene expression profiling in ultra-marathon trail runners
PLOS ONE | https://doi.org/10.1371/journal.pone.0180322 October 13, 2017 10 / 26
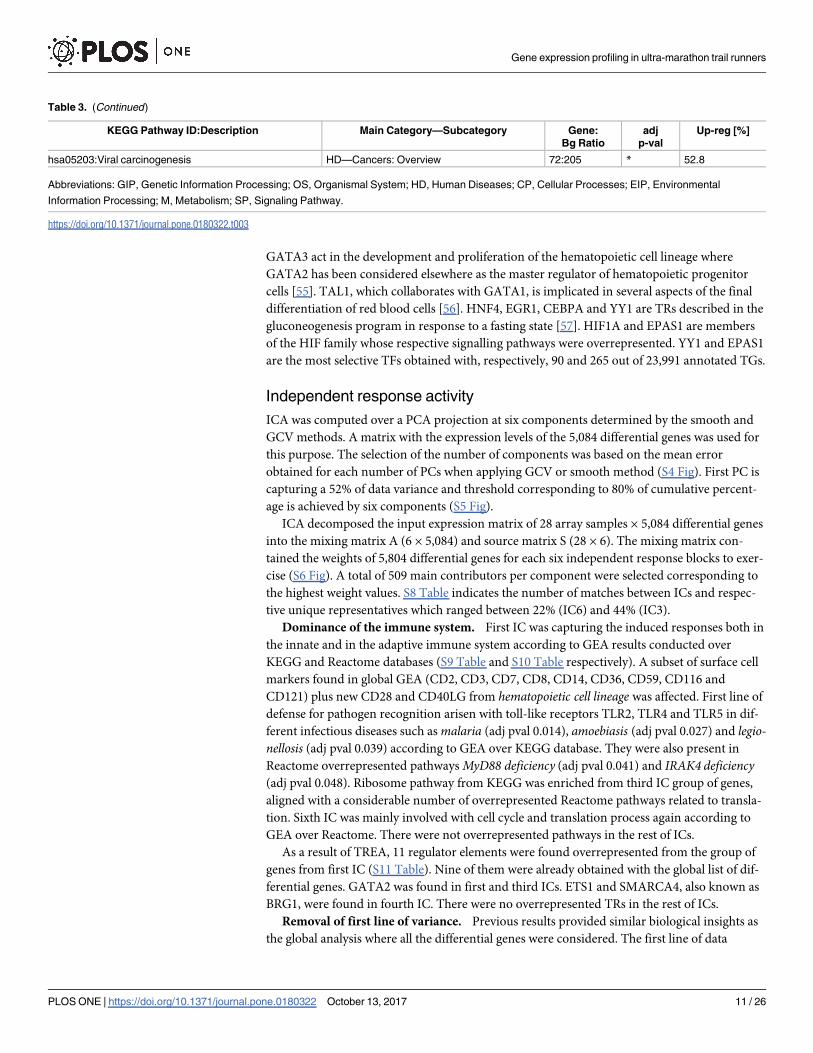
GATA3 act in the development and proliferation of the hematopoietic cell lineage where
GATA2 has been considered elsewhere as the master regulator of hematopoietic progenitor
cells [55]. TAL1, which collaborates with GATA1, is implicated in several aspects of the final
differentiation of red blood cells [56]. HNF4, EGR1, CEBPA and YY1 are TRs described in the
gluconeogenesis program in response to a fasting state [57]. HIF1A and EPAS1 are members
of the HIF family whose respective signalling pathways were overrepresented. YY1 and EPAS1
are the most selective TFs obtained with, respectively, 90 and 265 out of 23,991 annotated TGs.
Independent response activity
ICA was computed over a PCA projection at six components determined by the smooth and
GCV methods. A matrix with the expression levels of the 5,084 differential genes was used for
this purpose. The selection of the number of components was based on the mean error
obtained for each number of PCs when applying GCV or smooth method (S4 Fig). First PC is
capturing a 52% of data variance and threshold corresponding to 80% of cumulative percent-
age is achieved by six components (S5 Fig).
ICA decomposed the input expression matrix of 28 array samples × 5,084 differential genes
into the mixing matrix A (6 × 5,084) and source matrix S (28 × 6). The mixing matrix con-
tained the weights of 5,804 differential genes for each six independent response blocks to exer-
cise (S6 Fig). A total of 509 main contributors per component were selected corresponding to
the highest weight values. S8 Table indicates the number of matches between ICs and respec-
tive unique representatives which ranged between 22% (IC6) and 44% (IC3).
Dominance of the immune system. First IC was capturing the induced responses both in
the innate and in the adaptive immune system according to GEA results conducted over
KEGG and Reactome databases (S9 Table and S10 Table respectively). A subset of surface cell
markers found in global GEA (CD2, CD3, CD7, CD8, CD14, CD36, CD59, CD116 and
CD121) plus new CD28 and CD40LG from hematopoietic cell lineage was affected. First line of
defense for pathogen recognition arisen with toll-like receptors TLR2, TLR4 and TLR5 in dif-
ferent infectious diseases such as malaria (adj pval 0.014), amoebiasis (adj pval 0.027) and legio-nellosis (adj pval 0.039) according to GEA over KEGG database. They were also present in
Reactome overrepresented pathways MyD88 deficiency (adj pval 0.041) and IRAK4 deficiency(adj pval 0.048). Ribosome pathway from KEGG was enriched from third IC group of genes,
aligned with a considerable number of overrepresented Reactome pathways related to transla-
tion. Sixth IC was mainly involved with cell cycle and translation process again according to
GEA over Reactome. There were not overrepresented pathways in the rest of ICs.
As a result of TREA, 11 regulator elements were found overrepresented from the group of
genes from first IC (S11 Table). Nine of them were already obtained with the global list of dif-
ferential genes. GATA2 was found in first and third ICs. ETS1 and SMARCA4, also known as
BRG1, were found in fourth IC. There were no overrepresented TRs in the rest of ICs.
Removal of first line of variance. Previous results provided similar biological insights as
the global analysis where all the differential genes were considered. The first line of data
Table 3. (Continued)
KEGG Pathway ID:Description Main Category—Subcategory Gene:
Bg Ratio
adj
p-val
Up-reg [%]
hsa05203:Viral carcinogenesis HD—Cancers: Overview 72:205 * 52.8
Abbreviations: GIP, Genetic Information Processing; OS, Organismal System; HD, Human Diseases; CP, Cellular Processes; EIP, Environmental
Information Processing; M, Metabolism; SP, Signaling Pathway.
https://doi.org/10.1371/journal.pone.0180322.t003
Gene expression profiling in ultra-marathon trail runners
PLOS ONE | https://doi.org/10.1371/journal.pone.0180322 October 13, 2017 11 / 26
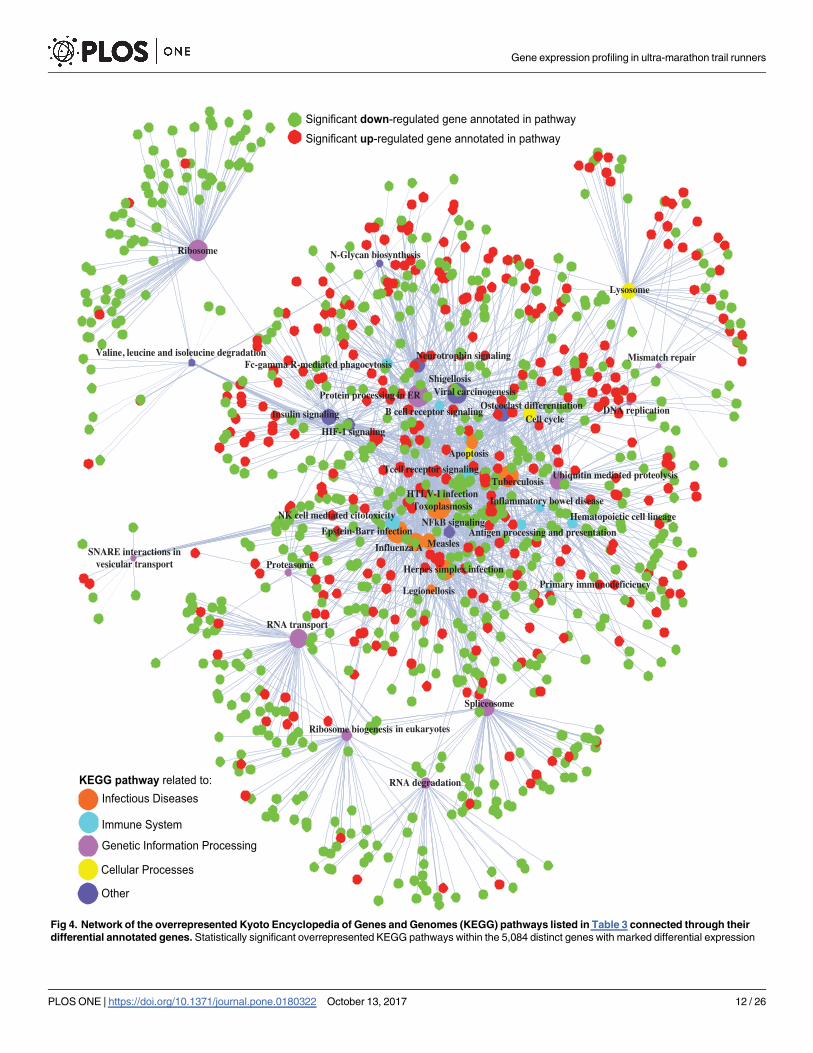
Fig 4. Network of the overrepresented Kyoto Encyclopedia of Genes and Genomes (KEGG) pathways listed in Table 3 connected through their
differential annotated genes. Statistically significant overrepresented KEGG pathways within the 5,084 distinct genes with marked differential expression
Gene expression profiling in ultra-marathon trail runners
PLOS ONE | https://doi.org/10.1371/journal.pone.0180322 October 13, 2017 12 / 26
variance, accounting for 52% as determined by PC1, featured the immune system response to
the intervention. To avoid this, ICA was again computed over the PCA projection at five com-
ponents after considering the deflationary method over the initial matrix X of 5,084 differential
GE levels. Five IC sets were obtained and their 509 main contributors were selected for apply-
ing GEA and TREA on each one. The number of matches between them and respective unique
elements now ranged between 65% (IC5) and 72% (IC2) (Table 8).
Terms relative to electron transport chain, a complex signal transduction network and
nervous system. According to GEA results over KEGG (Table 9), first IC elucidated four
down-regulated genes responsible for encoding major histocompatibility complex (MHC)
class II proteins (HLA-DPA1, HLA-DPB1, HLA-DMA and HLA-DRA) (Fig 5A). These,
together with the up-regulated TNF gene, matched in seven out of the nine overrepresented
KEGG pathways, related to immune, autoimmune or alloimmune responses. The second IC
presented three neurodegenerative diseases: Parkinson’s, Alzheimer’s and Huntington’s diseases(Fig 5B). All of them shared 10 down-regulated genes from the electron transport chain (ETC)
in the mitochondrion (Table 10). Genes involved in signal transduction stood out among the
24 KEGG pathways enriched from third IC (Fig 5D). There were two main hubs of signal com-
munication. The up-regulated MAPK3, MAPK13, PIK3R5, PIK3CD genes and the down-reg-
ulated MAPK8 and MAPK9 genes characterized one hub. Among them, MAPK3, PIK3R5 and
PIK3CD were common for 20 out of the 24 pathways. The other hub was featured by the up-
regulated PRKACA and ADCY4, related to cAMP second messengers, and GNAI2 gene. Two
pathways associated with the nervous system, retrograde endocannabinoid signalling and mor-phine addiction, showed up-regulation in most of their annotated differential genes with a 70%
and a 85.7% respectively. GABRD gene which encodes for a neurotransmitter GABA receptor
was one of these up-regulated genes. OSCAR and AGER genes, both up-regulated, were
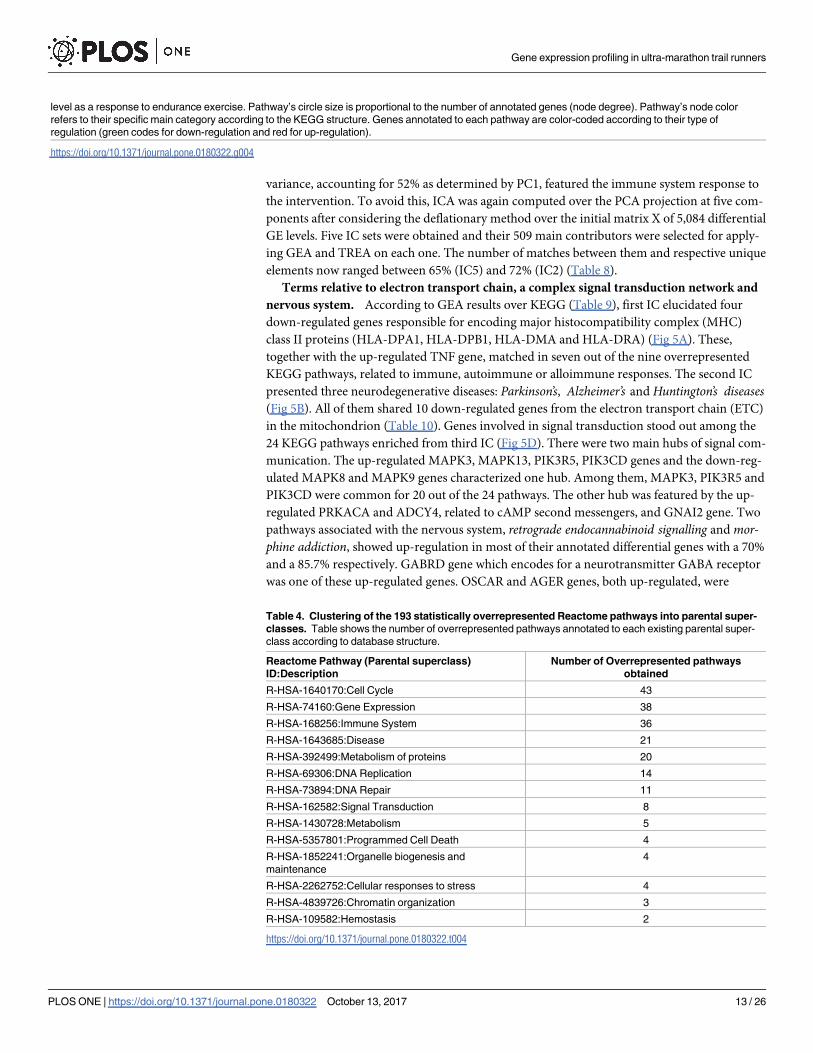
level as a response to endurance exercise. Pathway’s circle size is proportional to the number of annotated genes (node degree). Pathway’s node color
refers to their specific main category according to the KEGG structure. Genes annotated to each pathway are color-coded according to their type of
regulation (green codes for down-regulation and red for up-regulation).
https://doi.org/10.1371/journal.pone.0180322.g004
Table 4. Clustering of the 193 statistically overrepresented Reactome pathways into parental super-
classes. Table shows the number of overrepresented pathways annotated to each existing parental super-
class according to database structure.
Reactome Pathway (Parental superclass)
ID:Description
Number of Overrepresented pathways
obtained
R-HSA-1640170:Cell Cycle 43
R-HSA-74160:Gene Expression 38
R-HSA-168256:Immune System 36
R-HSA-1643685:Disease 21
R-HSA-392499:Metabolism of proteins 20
R-HSA-69306:DNA Replication 14
R-HSA-73894:DNA Repair 11
R-HSA-162582:Signal Transduction 8
R-HSA-1430728:Metabolism 5
R-HSA-5357801:Programmed Cell Death 4
R-HSA-1852241:Organelle biogenesis and
maintenance
4
R-HSA-2262752:Cellular responses to stress 4
R-HSA-4839726:Chromatin organization 3
R-HSA-109582:Hemostasis 2
https://doi.org/10.1371/journal.pone.0180322.t004
Gene expression profiling in ultra-marathon trail runners
PLOS ONE | https://doi.org/10.1371/journal.pone.0180322 October 13, 2017 13 / 26
respectively specific elements for osteoclast differentiation and AGE-RAGE signalling pathwayin diabetic complications pathways. Five infectious diseases were overrepresented, four of them
being of viral origin: HTLV-I infection, hepatitis C, hepatitis B and influenza A. The up-regu-
lated SERPINB1 gene was annotated to, inter alia, the overrepresented amoebiasis KEGG path-
way from fourth IC (Fig 5C). The role of this gene has been previously related to the
mitigation of inflammation in pulmonary influenza infections [58]. Genes encoding ribosomal
proteins, including mitochondrial ribosomal proteins, characterized the fifth IC.
A summary of the GEA results over Reactome is included in S12 Table. Overrepresented
pathways were only found for second and fifth ICs. In line with KEGG results, ETC was also
shown in 2 among the 31 enriched pathways in the second IC: the citric acid (TCA) cycle andrespiratory electron transport and the respiratory electron transport, ATP synthesis by chemios-motic coupling, and heat production by uncoupling proteins pathways.
Table 5. Differential expressed genes related to common inflammatory markers. List is based on the review presented by other authors [18]. Gene sym-
bol and name are indicated for each marker in the list. # indicates genes being down-regulated and " genes being up-regulated in Reg column. Prior results
refer to studies where the expression of the specific marker was evaluated in a single exercise-related intervention in humans. Genes are sorted in alphabeti-
cal order.
Gene Symbol Gene name Reg Prior results
CCL5 (***) chemokine (C-C motif) ligand 5 # [41]
CCR2(*), CCR4(***) chemokine (C-C motif) receptor 2 and 4 " # [17]
CXCL16(***) chemokine (C-X-C motif) ligand 16 " [42]
GATA3(*) GATA binding protein 3 # [17]
GPX4(***) and GPX7(**) glutathione peroxidase 4 and 7 # # [43]
HSPA6(**) heat shock 70kDa protein 6 (HSP70B’) " [44]
IFNGR2(***) interferon gamma receptor 2 " [45]
IL1RN(***) and IL1R1(***) interleukin 1 receptor antagonist and type I " " [12]
IL10RB (***) and IL10RB-AS1(***) interleukin 10 receptor beta and antisense RNA 1 " " [46]1
IL1B(*) interleukin 1, beta " [12]
IL4R(***) interleukin 4 receptor " [17]2
IL6R(***) and IL6ST(***) interleukin 6 receptor and signal transducer " # [47]3
MMP9(***) matrix metallopeptidase 9 " [48]
SOD1(**) superoxide dismutase 1, soluble # [49]
TLR2(**) and TLR4(**) toll-like receptor 2 and 4 " " [13]
TGFBR3(***), TGFBR3L(**) and TGFBRAP1(*) transforming growth factor beta receptor III, III-like and associated protein 1 # " # [47]
TNF(***) tumor necrosis factor " [50]
Results reported on 1IL10, 2IL4, 3IL6.(***), (**) and (*) indicate an adjusted p-value (FDR) < 0.001, < 0.01 and < 0.05 respectively.
https://doi.org/10.1371/journal.pone.0180322.t005
Table 6. Differential expressed genes related to T-helper 1 and T-helper 2 cells from immune system.
Th1 and Th2 cytokines and related genes with differential expression are listed.
Th1/Th2 Regulation Gene Symbol
Th1
related
Up TNF(***), TLR4(**)
Down STAT1(**), STAT4(***), TBX21(***), CD28(***), SOCS1(**), SOCS5(*)
Th2
related
Up IL1R1(***), IL1R2(***), STAT6(***), CEBPB(**), CCR2(*), PCGF2(*)
Down NFATC2(***), CCL5(***), ICOS(***), MAF(***), CCR4(**), GFI1(**),
GATA3(*)
(***), (**) and (*) indicate an adjusted p-value (FDR) < 0.001, < 0.01 and < 0.05 respectively. Underlined
markers are coincident with [17].
https://doi.org/10.1371/journal.pone.0180322.t006
Gene expression profiling in ultra-marathon trail runners
PLOS ONE | https://doi.org/10.1371/journal.pone.0180322 October 13, 2017 14 / 26
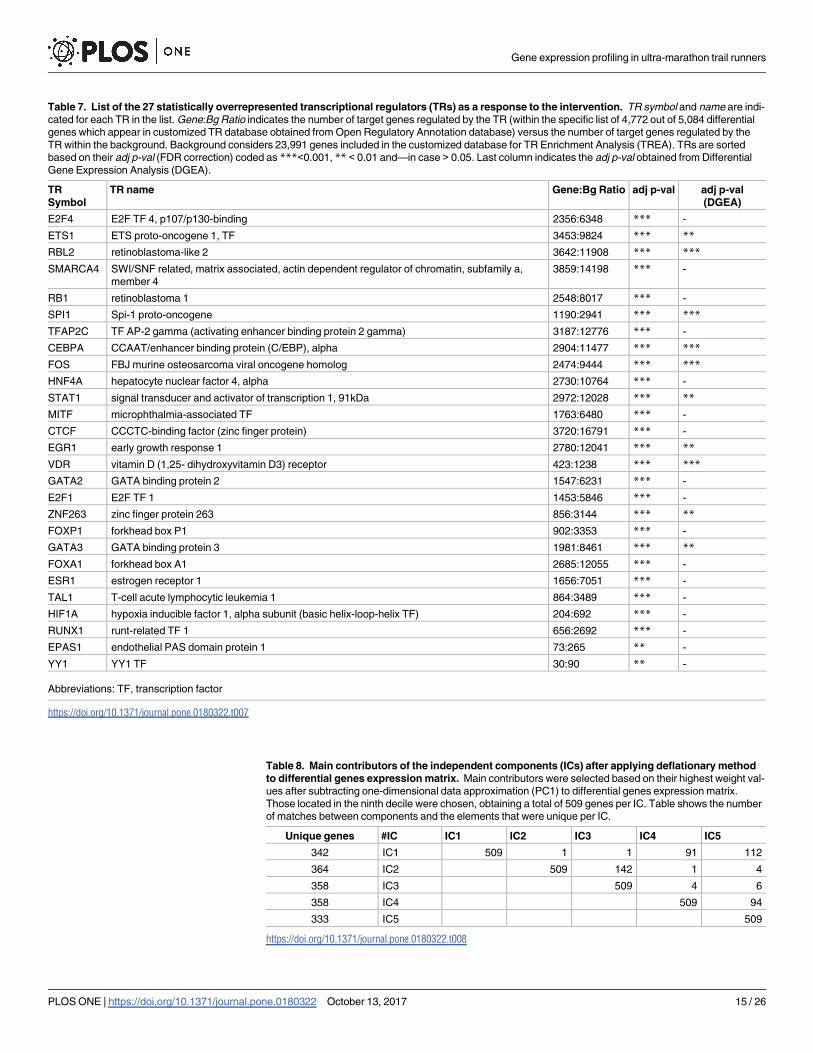
Table 7. List of the 27 statistically overrepresented transcriptional regulators (TRs) as a response to the intervention. TR symbol and name are indi-
cated for each TR in the list. Gene:Bg Ratio indicates the number of target genes regulated by the TR (within the specific list of 4,772 out of 5,084 differential
genes which appear in customized TR database obtained from Open Regulatory Annotation database) versus the number of target genes regulated by the
TR within the background. Background considers 23,991 genes included in the customized database for TR Enrichment Analysis (TREA). TRs are sorted
based on their adj p-val (FDR correction) coded as ***<0.001, ** < 0.01 and—in case > 0.05. Last column indicates the adj p-val obtained from Differential
Gene Expression Analysis (DGEA).
TR
Symbol
TR name Gene:Bg Ratio adj p-val adj p-val
(DGEA)
E2F4 E2F TF 4, p107/p130-binding 2356:6348 *** -
ETS1 ETS proto-oncogene 1, TF 3453:9824 *** **
RBL2 retinoblastoma-like 2 3642:11908 *** ***
SMARCA4 SWI/SNF related, matrix associated, actin dependent regulator of chromatin, subfamily a,
member 4
3859:14198 *** -
RB1 retinoblastoma 1 2548:8017 *** -
SPI1 Spi-1 proto-oncogene 1190:2941 *** ***
TFAP2C TF AP-2 gamma (activating enhancer binding protein 2 gamma) 3187:12776 *** -
CEBPA CCAAT/enhancer binding protein (C/EBP), alpha 2904:11477 *** ***
FOS FBJ murine osteosarcoma viral oncogene homolog 2474:9444 *** ***
HNF4A hepatocyte nuclear factor 4, alpha 2730:10764 *** -
STAT1 signal transducer and activator of transcription 1, 91kDa 2972:12028 *** **
MITF microphthalmia-associated TF 1763:6480 *** -
CTCF CCCTC-binding factor (zinc finger protein) 3720:16791 *** -
EGR1 early growth response 1 2780:12041 *** **
VDR vitamin D (1,25- dihydroxyvitamin D3) receptor 423:1238 *** ***
GATA2 GATA binding protein 2 1547:6231 *** -
E2F1 E2F TF 1 1453:5846 *** -
ZNF263 zinc finger protein 263 856:3144 *** **
FOXP1 forkhead box P1 902:3353 *** -
GATA3 GATA binding protein 3 1981:8461 *** **
FOXA1 forkhead box A1 2685:12055 *** -
ESR1 estrogen receptor 1 1656:7051 *** -
TAL1 T-cell acute lymphocytic leukemia 1 864:3489 *** -
HIF1A hypoxia inducible factor 1, alpha subunit (basic helix-loop-helix TF) 204:692 *** -
RUNX1 runt-related TF 1 656:2692 *** -
EPAS1 endothelial PAS domain protein 1 73:265 ** -
YY1 YY1 TF 30:90 ** -
Abbreviations: TF, transcription factor
https://doi.org/10.1371/journal.pone.0180322.t007
Table 8. Main contributors of the independent components (ICs) after applying deflationary method
to differential genes expression matrix. Main contributors were selected based on their highest weight val-
ues after subtracting one-dimensional data approximation (PC1) to differential genes expression matrix.
Those located in the ninth decile were chosen, obtaining a total of 509 genes per IC. Table shows the number
of matches between components and the elements that were unique per IC.
Unique genes #IC IC1 IC2 IC3 IC4 IC5
342 IC1 509 1 1 91 112
364 IC2 509 142 1 4
358 IC3 509 4 6
358 IC4 509 94
333 IC5 509
https://doi.org/10.1371/journal.pone.0180322.t008
Gene expression profiling in ultra-marathon trail runners
PLOS ONE | https://doi.org/10.1371/journal.pone.0180322 October 13, 2017 15 / 26
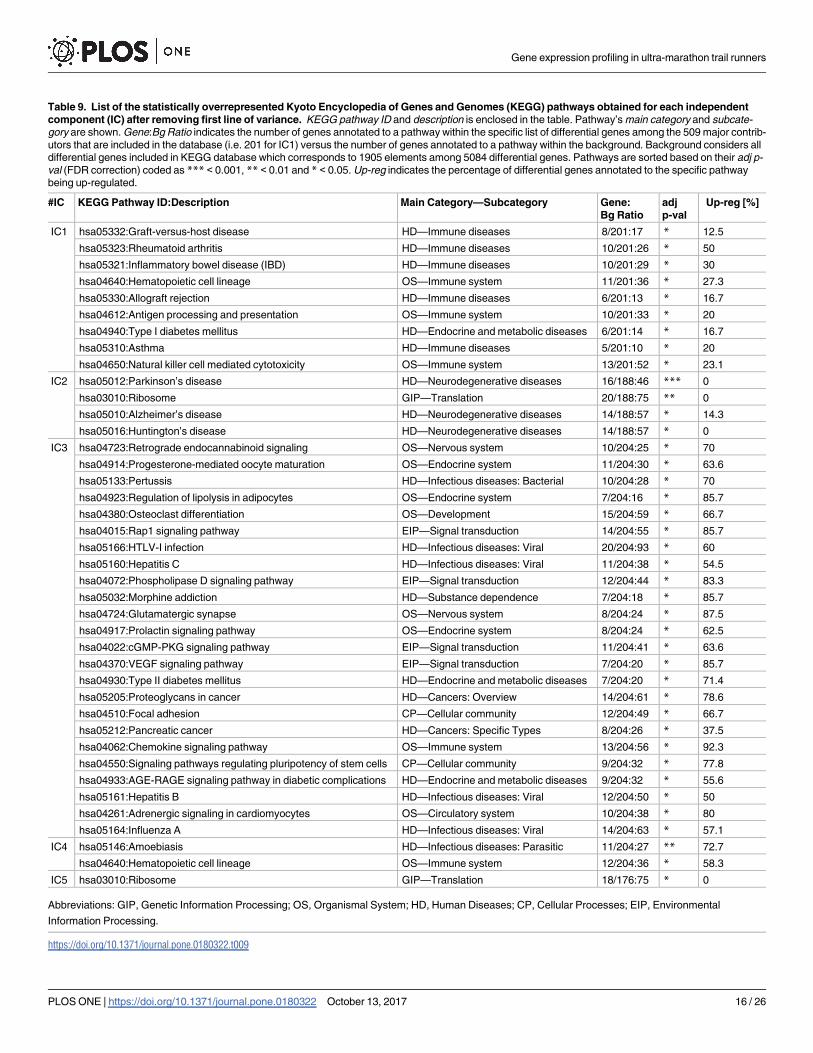
Table 9. List of the statistically overrepresented Kyoto Encyclopedia of Genes and Genomes (KEGG) pathways obtained for each independent
component (IC) after removing first line of variance. KEGG pathway ID and description is enclosed in the table. Pathway’s main category and subcate-
gory are shown. Gene:Bg Ratio indicates the number of genes annotated to a pathway within the specific list of differential genes among the 509 major contrib-
utors that are included in the database (i.e. 201 for IC1) versus the number of genes annotated to a pathway within the background. Background considers all
differential genes included in KEGG database which corresponds to 1905 elements among 5084 differential genes. Pathways are sorted based on their adj p-
val (FDR correction) coded as *** < 0.001, ** < 0.01 and * < 0.05. Up-reg indicates the percentage of differential genes annotated to the specific pathway
being up-regulated.
#IC KEGG Pathway ID:Description Main Category—Subcategory Gene:
Bg Ratio
adj
p-val
Up-reg [%]
IC1 hsa05332:Graft-versus-host disease HD—Immune diseases 8/201:17 * 12.5
hsa05323:Rheumatoid arthritis HD—Immune diseases 10/201:26 * 50
hsa05321:Inflammatory bowel disease (IBD) HD—Immune diseases 10/201:29 * 30
hsa04640:Hematopoietic cell lineage OS—Immune system 11/201:36 * 27.3
hsa05330:Allograft rejection HD—Immune diseases 6/201:13 * 16.7
hsa04612:Antigen processing and presentation OS—Immune system 10/201:33 * 20
hsa04940:Type I diabetes mellitus HD—Endocrine and metabolic diseases 6/201:14 * 16.7
hsa05310:Asthma HD—Immune diseases 5/201:10 * 20
hsa04650:Natural killer cell mediated cytotoxicity OS—Immune system 13/201:52 * 23.1
IC2 hsa05012:Parkinson’s disease HD—Neurodegenerative diseases 16/188:46 *** 0
hsa03010:Ribosome GIP—Translation 20/188:75 ** 0
hsa05010:Alzheimer’s disease HD—Neurodegenerative diseases 14/188:57 * 14.3
hsa05016:Huntington’s disease HD—Neurodegenerative diseases 14/188:57 * 0
IC3 hsa04723:Retrograde endocannabinoid signaling OS—Nervous system 10/204:25 * 70
hsa04914:Progesterone-mediated oocyte maturation OS—Endocrine system 11/204:30 * 63.6
hsa05133:Pertussis HD—Infectious diseases: Bacterial 10/204:28 * 70
hsa04923:Regulation of lipolysis in adipocytes OS—Endocrine system 7/204:16 * 85.7
hsa04380:Osteoclast differentiation OS—Development 15/204:59 * 66.7
hsa04015:Rap1 signaling pathway EIP—Signal transduction 14/204:55 * 85.7
hsa05166:HTLV-I infection HD—Infectious diseases: Viral 20/204:93 * 60
hsa05160:Hepatitis C HD—Infectious diseases: Viral 11/204:38 * 54.5
hsa04072:Phospholipase D signaling pathway EIP—Signal transduction 12/204:44 * 83.3
hsa05032:Morphine addiction HD—Substance dependence 7/204:18 * 85.7
hsa04724:Glutamatergic synapse OS—Nervous system 8/204:24 * 87.5
hsa04917:Prolactin signaling pathway OS—Endocrine system 8/204:24 * 62.5
hsa04022:cGMP-PKG signaling pathway EIP—Signal transduction 11/204:41 * 63.6
hsa04370:VEGF signaling pathway EIP—Signal transduction 7/204:20 * 85.7
hsa04930:Type II diabetes mellitus HD—Endocrine and metabolic diseases 7/204:20 * 71.4
hsa05205:Proteoglycans in cancer HD—Cancers: Overview 14/204:61 * 78.6
hsa04510:Focal adhesion CP—Cellular community 12/204:49 * 66.7
hsa05212:Pancreatic cancer HD—Cancers: Specific Types 8/204:26 * 37.5
hsa04062:Chemokine signaling pathway OS—Immune system 13/204:56 * 92.3
hsa04550:Signaling pathways regulating pluripotency of stem cells CP—Cellular community 9/204:32 * 77.8
hsa04933:AGE-RAGE signaling pathway in diabetic complications HD—Endocrine and metabolic diseases 9/204:32 * 55.6
hsa05161:Hepatitis B HD—Infectious diseases: Viral 12/204:50 * 50
hsa04261:Adrenergic signaling in cardiomyocytes OS—Circulatory system 10/204:38 * 80
hsa05164:Influenza A HD—Infectious diseases: Viral 14/204:63 * 57.1
IC4 hsa05146:Amoebiasis HD—Infectious diseases: Parasitic 11/204:27 ** 72.7
hsa04640:Hematopoietic cell lineage OS—Immune system 12/204:36 * 58.3
IC5 hsa03010:Ribosome GIP—Translation 18/176:75 * 0
Abbreviations: GIP, Genetic Information Processing; OS, Organismal System; HD, Human Diseases; CP, Cellular Processes; EIP, Environmental
Information Processing.
https://doi.org/10.1371/journal.pone.0180322.t009
Gene expression profiling in ultra-marathon trail runners
PLOS ONE | https://doi.org/10.1371/journal.pone.0180322 October 13, 2017 16 / 26
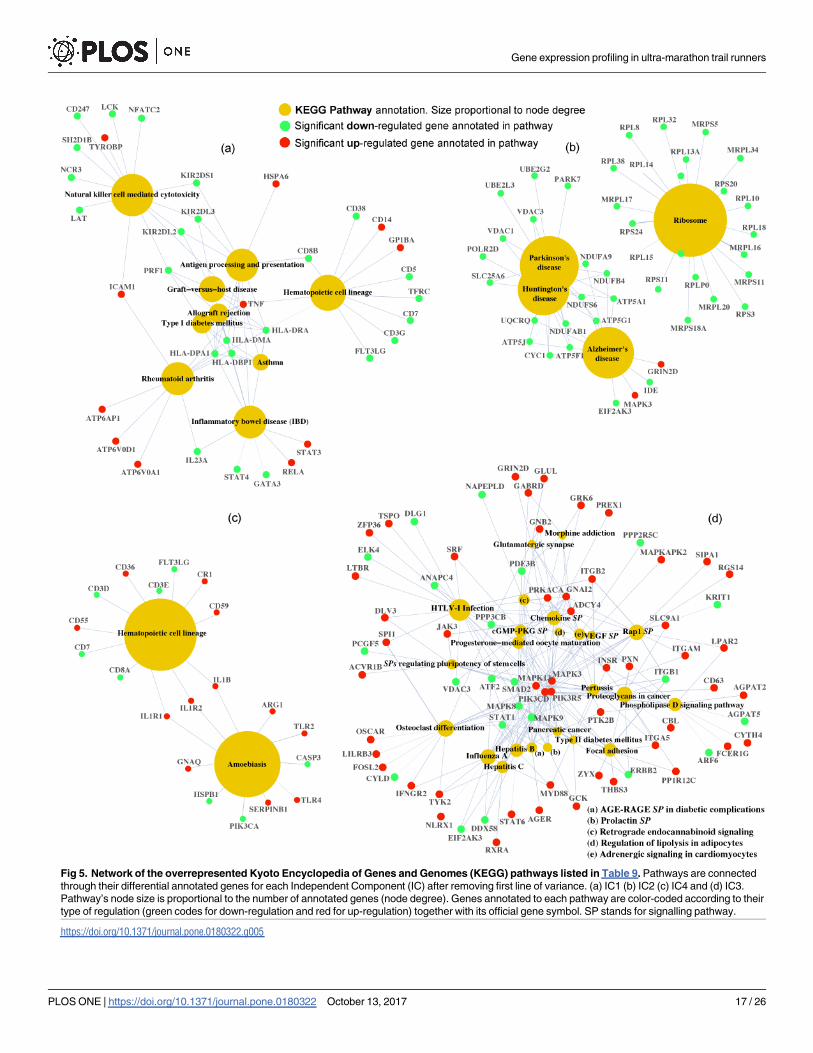
Fig 5. Network of the overrepresented Kyoto Encyclopedia of Genes and Genomes (KEGG) pathways listed in Table 9. Pathways are connected
through their differential annotated genes for each Independent Component (IC) after removing first line of variance. (a) IC1 (b) IC2 (c) IC4 and (d) IC3.
Pathway’s node size is proportional to the number of annotated genes (node degree). Genes annotated to each pathway are color-coded according to their
type of regulation (green codes for down-regulation and red for up-regulation) together with its official gene symbol. SP stands for signalling pathway.
https://doi.org/10.1371/journal.pone.0180322.g005
Gene expression profiling in ultra-marathon trail runners
PLOS ONE | https://doi.org/10.1371/journal.pone.0180322 October 13, 2017 17 / 26
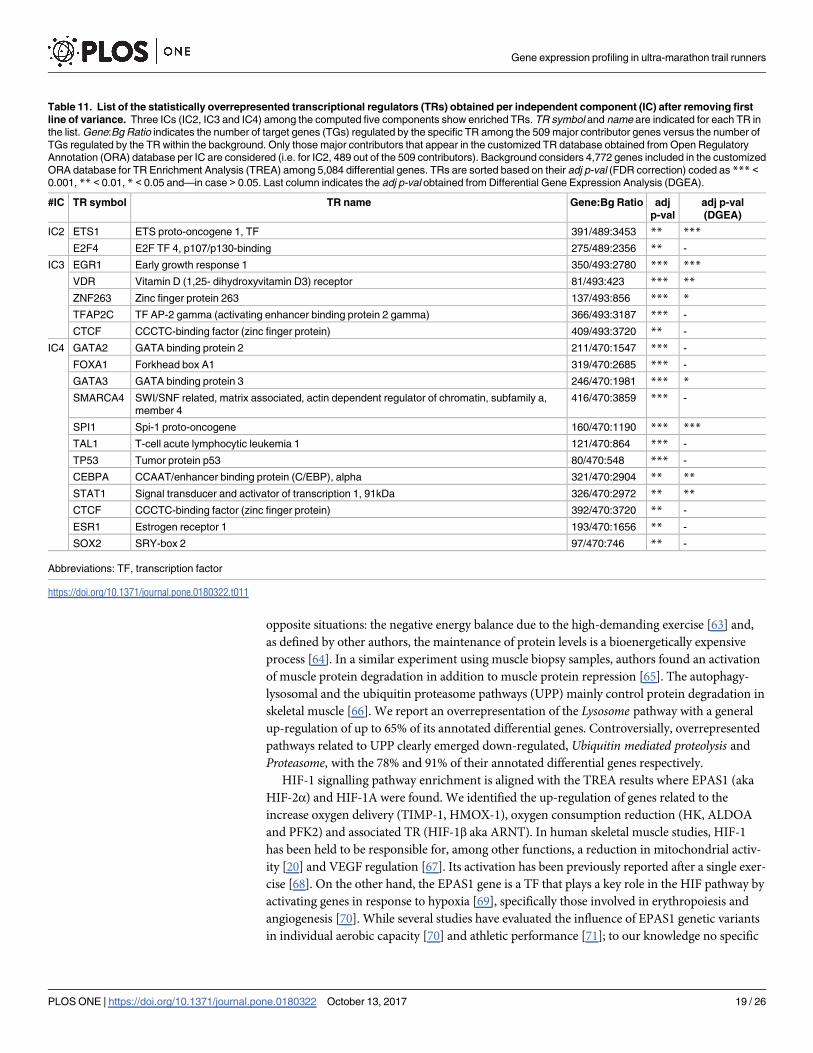
Overrepresented TRs among ICs are aligned with pathway enrichment results. A list
of 19 TRs was found overrepresented in IC2, IC3 and IC4 as a result of TREA (Table 11).
Most of them, 17 out of the 19, were already prioritized when considering a global response
(Table 7). In this case, ETS1 and E2F4 transcription factors were enriched in the second IC.
E2F4 belong to E2F family which is known by its dual role in cell proliferation and its contribu-
tion to cell death in response to cell stress [59]. The third IC showed five enriched TRs (EGR1,
VDR, ZNF263, TFAP2C and CTCF) where, as best we know, the last three have an unspecific
TR role. EGR1 was connected to MAPK and vascular endothelial growth factor (VEGF) signal-
ling, both highlighted GEA results for IC3 (Table 9), when studying the relationship between
insulin sensitivity and exercise-induced gene expression [60]. The VDR gene is known to be con-
nected to bone homeostasis [61] which is compatible with the presence of osteoclast differentia-
tion pathway (Table 7 –IC3). From fourth IC, TP53 and SOX2 genes were the new hits found.
Discussion and conclusions
Previous studies have accumulated evidence about the health risk reduction as a result of mod-
erate physical activity [1]. Nevertheless, an U-curve pattern has been previously described
when considering the effect of high intensity and prolonged exercise over cardiovascular [3] or
URTI [16] risks. In this sense, an UMT is of interest due to its extreme conditions [5] and its
consequences on the whole body homeostasis. To our knowledge, the present study is the first
genome-wide investigation aiming an expression profiling in response to a UMT race.
Our results show that gene expression is heavily impacted by the intervention based on the
5,084 protein-coding genes, among 23,557 initially tested, with significant differential expression.
The global gene enrichment analysis reveals extensive alterations in human biology mainly con-
centrated around the immune system, infectious diseases and genetic information processing.
A 36% of the enriched infectious diseases terms (Table 3) are caused by parasitic (Toxoplas-mosis) and viral pathogens (Epstein-Barr virus infection, Herpes simplex infection and InfluenzaA) associated with URTI [62], An additional 27% implicates pathogens responsible of other
respiratory infections such Legionellosis, Measles and Tuberculosis, the latter primarily attack-
ing the lungs, while the rest were unrelated respiratory infections. These results do not neces-
sarily imply that subjects presented a particular infection, but its genetic mechanisms triggered
by the strenuous exercise.
We interpret protein synthesis as repressed based on the systematic down-regulation of the
genes annotated to the related intracellular processes. This response is compatible with two
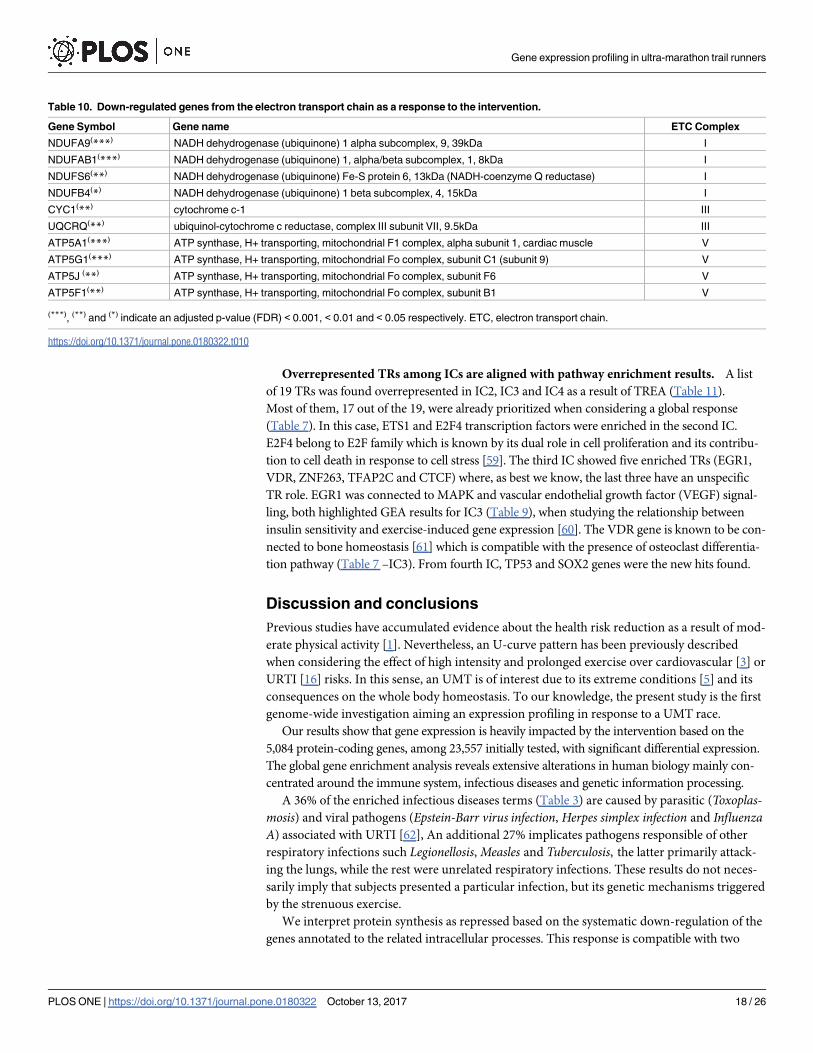
Table 10. Down-regulated genes from the electron transport chain as a response to the intervention.
Gene Symbol Gene name ETC Complex
NDUFA9(***) NADH dehydrogenase (ubiquinone) 1 alpha subcomplex, 9, 39kDa I
NDUFAB1(***) NADH dehydrogenase (ubiquinone) 1, alpha/beta subcomplex, 1, 8kDa I
NDUFS6(**) NADH dehydrogenase (ubiquinone) Fe-S protein 6, 13kDa (NADH-coenzyme Q reductase) I
NDUFB4(*) NADH dehydrogenase (ubiquinone) 1 beta subcomplex, 4, 15kDa I
CYC1(**) cytochrome c-1 III
UQCRQ(**) ubiquinol-cytochrome c reductase, complex III subunit VII, 9.5kDa III
ATP5A1(***) ATP synthase, H+ transporting, mitochondrial F1 complex, alpha subunit 1, cardiac muscle V
ATP5G1(***) ATP synthase, H+ transporting, mitochondrial Fo complex, subunit C1 (subunit 9) V
ATP5J (**) ATP synthase, H+ transporting, mitochondrial Fo complex, subunit F6 V
ATP5F1(**) ATP synthase, H+ transporting, mitochondrial Fo complex, subunit B1 V
(***), (**) and (*) indicate an adjusted p-value (FDR) < 0.001, < 0.01 and < 0.05 respectively. ETC, electron transport chain.
https://doi.org/10.1371/journal.pone.0180322.t010
Gene expression profiling in ultra-marathon trail runners
PLOS ONE | https://doi.org/10.1371/journal.pone.0180322 October 13, 2017 18 / 26
opposite situations: the negative energy balance due to the high-demanding exercise [63] and,
as defined by other authors, the maintenance of protein levels is a bioenergetically expensive
process [64]. In a similar experiment using muscle biopsy samples, authors found an activation
of muscle protein degradation in addition to muscle protein repression [65]. The autophagy-
lysosomal and the ubiquitin proteasome pathways (UPP) mainly control protein degradation in
skeletal muscle [66]. We report an overrepresentation of the Lysosome pathway with a general
up-regulation of up to 65% of its annotated differential genes. Controversially, overrepresented
pathways related to UPP clearly emerged down-regulated, Ubiquitin mediated proteolysis and
Proteasome, with the 78% and 91% of their annotated differential genes respectively.
HIF-1 signalling pathway enrichment is aligned with the TREA results where EPAS1 (aka
HIF-2α) and HIF-1A were found. We identified the up-regulation of genes related to the
increase oxygen delivery (TIMP-1, HMOX-1), oxygen consumption reduction (HK, ALDOA
and PFK2) and associated TR (HIF-1β aka ARNT). In human skeletal muscle studies, HIF-1
has been held to be responsible for, among other functions, a reduction in mitochondrial activ-
ity [20] and VEGF regulation [67]. Its activation has been previously reported after a single exer-
cise [68]. On the other hand, the EPAS1 gene is a TF that plays a key role in the HIF pathway by
activating genes in response to hypoxia [69], specifically those involved in erythropoiesis and
angiogenesis [70]. While several studies have evaluated the influence of EPAS1 genetic variants
in individual aerobic capacity [70] and athletic performance [71]; to our knowledge no specific
Table 11. List of the statistically overrepresented transcriptional regulators (TRs) obtained per independent component (IC) after removing first
line of variance. Three ICs (IC2, IC3 and IC4) among the computed five components show enriched TRs. TR symbol and name are indicated for each TR in
the list. Gene:Bg Ratio indicates the number of target genes (TGs) regulated by the specific TR among the 509 major contributor genes versus the number of
TGs regulated by the TR within the background. Only those major contributors that appear in the customized TR database obtained from Open Regulatory
Annotation (ORA) database per IC are considered (i.e. for IC2, 489 out of the 509 contributors). Background considers 4,772 genes included in the customized
ORA database for TR Enrichment Analysis (TREA) among 5,084 differential genes. TRs are sorted based on their adj p-val (FDR correction) coded as *** <0.001, ** < 0.01, * < 0.05 and—in case > 0.05. Last column indicates the adj p-val obtained from Differential Gene Expression Analysis (DGEA).
#IC TR symbol TR name Gene:Bg Ratio adj
p-val
adj p-val
(DGEA)
IC2 ETS1 ETS proto-oncogene 1, TF 391/489:3453 ** ***
E2F4 E2F TF 4, p107/p130-binding 275/489:2356 ** -
IC3 EGR1 Early growth response 1 350/493:2780 *** ***
VDR Vitamin D (1,25- dihydroxyvitamin D3) receptor 81/493:423 *** **
ZNF263 Zinc finger protein 263 137/493:856 *** *
TFAP2C TF AP-2 gamma (activating enhancer binding protein 2 gamma) 366/493:3187 *** -
CTCF CCCTC-binding factor (zinc finger protein) 409/493:3720 ** -
IC4 GATA2 GATA binding protein 2 211/470:1547 *** -
FOXA1 Forkhead box A1 319/470:2685 *** -
GATA3 GATA binding protein 3 246/470:1981 *** *
SMARCA4 SWI/SNF related, matrix associated, actin dependent regulator of chromatin, subfamily a,
member 4
416/470:3859 *** -
SPI1 Spi-1 proto-oncogene 160/470:1190 *** ***
TAL1 T-cell acute lymphocytic leukemia 1 121/470:864 *** -
TP53 Tumor protein p53 80/470:548 *** -
CEBPA CCAAT/enhancer binding protein (C/EBP), alpha 321/470:2904 ** **
STAT1 Signal transducer and activator of transcription 1, 91kDa 326/470:2972 ** **
CTCF CCCTC-binding factor (zinc finger protein) 392/470:3720 ** -
ESR1 Estrogen receptor 1 193/470:1656 ** -
SOX2 SRY-box 2 97/470:746 ** -
Abbreviations: TF, transcription factor
https://doi.org/10.1371/journal.pone.0180322.t011
Gene expression profiling in ultra-marathon trail runners
PLOS ONE | https://doi.org/10.1371/journal.pone.0180322 October 13, 2017 19 / 26
studies have explored the EPAS1 response to exercise from a transcriptomics approach. Addi-
tionally, there is prior evidence of the collaboration of ETS1, another overrepresented TF, with
HIF-1 in regulating hypoxia-inducible genes in pathological situations [72].
ICA identified further biological pathways including key alteration in mitochondrial activity
and endocannabinoid signalling. Several genes from the ETC were systematically down-regulated
as a obtained from the GEA applied to the ICs (Table 10). Most of them (NDUFA9, NDUFAB1,
CYC1, UQCRQ and ATP5A1) are reported as a direct effect of ETS1 in cancer cells in its role of
mitochondrial stress and dysfunction regulation [73]. TP53 gene was one of the additional tran-
scriptional regulators retrieved after applying ICA. TP53 stands as an stress sensor of the cell such
as oxidative stress, hypoxia and nutrient depravation [74], signals compatible with the experiment.
Additionally, the TP53 gene has been related to the regulation of mitochondrial respiration [75]
and possible exercise-induced mitochondrial biogenesis [2,76] through interactions with TFAM
in the mitochondria. However, we have not observed any differential expression in TFAM. With
regard to the endocannabinoid-signalling pathway, recent studies in mice describe the so called
“runner’s high” dependence on the endocannabinoid system in response to wheel running [77]
and how this exercise-induced effect is intensity-modulated in humans [78,79].
The current study has, however, certain limitations. First, the small sample size could limit
the results validation in newer cohorts. However, the findings are consistent with existing liter-
ature in exercise-related studies. Secondly, the physical effort of each runner may be heteroge-
neous for the same completed distance. Nevertheless, this feature may be difficult to include in
the linear regression model beyond the runner’s subjective perception.
In conclusion, the present study points to almost one fourth of all protein-coding genes
affected by running an UMT, with a substantial number of human biology pathways overrep-
resented. In agreement with prior exercise-related studies, the global physiological approach is
predominantly associated with immune system, infectious diseases and genetic information
processing. The independent activity approach revealed additional pathways beyond the
abovementioned which will require tailored investigations in larger sample sizes. Biological
pathways and transcriptional regulators overrepresentation analysis offered a complementary
interpretation of the results.
Supporting information
S1 Fig. Quality control–PCA over the expression values of the pre-processed microarray
data from the initial 29 samples.
(PDF)
S2 Fig. Overrepresented hematopoietic cell lineage extracted from KEGG pathway data-
base with differential genes highlighted.
(PDF)
S3 Fig. Summary of the 1232 statistically overrepresented GO terms from Biological Pro-
cesses ontology.
(PDF)
S4 Fig. Estimation of the optimal number of components in PCA with GCV and smooth
methods.
(PDF)
S5 Fig. Cumulative percentage of variance in PCA computed over the expression matrix of
5,084 differential genes.
(PDF)
Gene expression profiling in ultra-marathon trail runners
PLOS ONE | https://doi.org/10.1371/journal.pone.0180322 October 13, 2017 20 / 26
S6 Fig. Histogram of each kth row of the mixing matrix A representing the weights of the
5,084 differential genes.
(PDF)
S1 Table. Software and package versions used in the study.
(PDF)
S2 Table. List of 5,499 differential expressed transcript clusters with single gene annota-
tion.
(CSV)
S3 Table. List of 475 differential expressed transcript clusters with multiple gene annota-
tions.
(CSV)
S4 Table. List of 35 differential expressed transcript clusters related to gender contribu-
tion.
(CSV)
S5 Table. Detailed list of the 42 overrepresented pathways from KEGG as a result of GEA.
(CSV)
S6 Table. Detailed list of the 193 overrepresented pathways from Reactome as a result of
GEA.
(CSV)
S7 Table. Detailed list of the 1233 overrepresented GO terms from GO–Biological Pro-
cesses ontology as a result of GEA.
(CSV)
S8 Table. Number of main contributors to each IC based on their highest weight values.
(PDF)
S9 Table. List of the statistically overrepresented KEGG pathways obtained per IC after
ICA.
(PDF)
S10 Table. List of the statistically overrepresented Reactome pathways obtained per IC
after ICA.
(PDF)
S11 Table. List of the statistically overrepresented transcriptional regulators (TRs)
obtained per IC after ICA.
(PDF)
S12 Table. List of the statistically overrepresented Reactome pathways obtained for IC2
and IC5 after removing first line of variance.
(PDF)
Acknowledgments
The study was supported by the Bioinformatics and Biomedical Signals Laboratory (B2SLab),
a consolidated research group of the Generalitat de Catalunya, Spain (2014SGR-1063).
The authors would like to thank the runners who volunteered to participate in this research
study.
Gene expression profiling in ultra-marathon trail runners
PLOS ONE | https://doi.org/10.1371/journal.pone.0180322 October 13, 2017 21 / 26
Author Contributions
Conceptualization: ER DB JS AP.
Data curation: MM AP.
Formal analysis: MM AP.
Funding acquisition: JS AP.
Investigation: MM ER DB JS AP.
Methodology: MM AP.
Project administration: MM ER DB JS AP.
Resources: ER DB JS.
Software: MM AP.
Supervision: DB JS AP.
Validation: MM.
Visualization: MM.
Writing – original draft: MM AP.
Writing – review & editing: MM ER DB JS AP.
References1. Lee D- C, Pate RR, Lavie CJ, Sui X, Church TS, Blair SN. Leisure-time running reduces all-cause and
cardiovascular mortality risk. J Am Coll Cardiol 2014; 64:472–81. https://doi.org/10.1016/j.jacc.2014.
04.058 PMID: 25082581
2. Hawley JA, Hargreaves M, Joyner MJ, Zierath JR. Integrative Biology of Exercise. Cell 2014; 159:738–
49. https://doi.org/10.1016/j.cell.2014.10.029 PMID: 25417152
3. O’Keefe JH, Patil HR, Lavie CJ, Magalski A, Vogel RA, McCullough PA. Potential Adverse Cardiovas-
cular Effects From Excessive Endurance Exercise. Mayo Clin Proc 2012; 87:587–95. https://doi.org/10.
1016/j.mayocp.2012.04.005 PMID: 22677079
4. Knez WL, Coombes JS, Jenkins DG. Ultra-endurance exercise and oxidative damage: implications for
cardiovascular health. Sports Med 2006; 36:429–41. PMID: 16646630
5. Millet GP, Millet GY. Ultramarathon is an outstanding model for the study of adaptive responses to
extreme load and stress. BMC Med 2012; 10:77. https://doi.org/10.1186/1741-7015-10-77 PMID:
22812424
6. Cejka N, Rust CA, Lepers R, Onywera V, Rosemann T, Knechtle B. Participation and performance
trends in 100-km ultra-marathons worldwide. J Sports Sci 2014; 32:354–66. https://doi.org/10.1080/
02640414.2013.825729 PMID: 24015856
7. Mrakic-Sposta S, Gussoni M, Moretti S, Pratali L, Giardini G, Tacchini P, et al. Effects of mountain ultra-
marathon running on ROS production and oxidative damage by micro-invasive analytic techniques.
PLoS One 2015; 10. https://doi.org/10.1371/journal.pone.0141780 PMID: 26540518
8. Wuthrich TU, Marty J, Kerherve H, Millet GY, Verges S, Spengler CM. Aspects of respiratory muscle
fatigue in a mountain ultramarathon race. Med Sci Sports Exerc 2015; 47:519–27. https://doi.org/10.
1249/MSS.0000000000000449 PMID: 25033264
9. Hurdiel R, Peze T, Daugherty J, Girard J, Poussel M, Poletti L, et al. Combined effects of sleep depriva-
tion and strenuous exercise on cognitive performances during The North Face(R) Ultra Trail du Mont
Blanc(R) (UTMB(R)). J Sports Sci 2015; 33:670–4. https://doi.org/10.1080/02640414.2014.960883
PMID: 25333827
10. Nakamura S, Kobayashi M, Sugino T, Kajimoto O, Matoba R, Matsubara K. Effect of exercise on gene
expression profile in unfractionated peripheral blood leukocytes. Biochem Biophys Res Commun 2010;
391:846–51. https://doi.org/10.1016/j.bbrc.2009.11.150 PMID: 19945435
Gene expression profiling in ultra-marathon trail runners
PLOS ONE | https://doi.org/10.1371/journal.pone.0180322 October 13, 2017 22 / 26
11. Dias RG, Silva MSM, Duarte NE, Bolani W, Alves CR, Junior JRL, et al. PBMCs express a transcrip-
tome signature predictor of oxygen uptake responsiveness to endurance exercise training in men. Phy-
siol Genomics 2015; 47:13–23. https://doi.org/10.1152/physiolgenomics.00072.2014 PMID: 25465030
12. Ostrowski K, Rohde T, Zacho M, Asp S, Pedersen BK. Evidence that interleukin-6 is produced in
human skeletal muscle during prolonged running. J Physiol 1998; 508:949–53. https://doi.org/10.1111/
j.1469-7793.1998.949bp.x PMID: 9518745
13. Nickel T, Emslander I, Sisic Z, David R, Schmaderer C, Marx N, et al. Modulation of dendritic cells and
toll-like receptors by marathon running. Eur J Appl Physiol 2012; 112:1699–708. https://doi.org/10.
1007/s00421-011-2140-8 PMID: 21881949
14. Shephard RJ. Development of the discipline of exercise immunology. Exerc Immunol Rev 2010;
16:194–222. PMID: 20839500
15. Nieman DC. Clinical implications of exercise immunology. J Sport Heal Sci 2012; 1:12–7. https://doi.
org/10.1016/j.jshs.2012.04.004
16. Nieman DC. Upper respiratory tract infections and exercise. Thorax 1995; 50:1229–31. PMID: 8553291
17. Xiang L, Rehm KE, Marshall GD. Effects of strenuous exercise on Th1/Th2 gene expression from
human peripheral blood mononuclear cells of marathon participants. Mol Immunol 2014; 60:129–34.
https://doi.org/10.1016/j.molimm.2014.03.004 PMID: 24853398
18. Gjevestad GO, Holven KB, Ulven SM. Effects of Exercise on Gene Expression of Inflammatory Markers
in Human Peripheral Blood Cells: A Systematic Review. Curr Cardiovasc Risk Rep 2015; 9:34. https://
doi.org/10.1007/s12170-015-0463-4 PMID: 26005511
19. Egan B, Zierath JR. Exercise metabolism and the molecular regulation of skeletal muscle adaptation.
Cell Metab 2013; 17:162–84. https://doi.org/10.1016/j.cmet.2012.12.012 PMID: 23395166
20. Lindholm ME, Rundqvist H. Skeletal muscle hypoxia-inducible factor-1 and exercise. Exp Physiol 2016;
101:28–32. https://doi.org/10.1113/EP085318 PMID: 26391197
21. Irizarry RA, Hobbs B, Collin F, Beazer-Barclay YD, Antonellis KJ, Scherf U, et al. Exploration, normali-
zation, and summaries of high density oligonucleotide array probe level data. Biostatistics 2003; 4:249–
64. https://doi.org/10.1093/biostatistics/4.2.249 PMID: 12925520
22. Team RC. R: A language and environment for statistical computing. R Foundation for Statistical Com-
puting. n.d.
23. Gentleman RC, Carey VJ, Bates DM, Bolstad B, Dettling M, Dudoit S, et al. Bioconductor: open soft-
ware development for computational biology and bioinformatics. Genome Biol 2004; 5:R80. https://doi.
org/10.1186/gb-2004-5-10-r80 PMID: 15461798
24. Carvalho BS, Irizarry RA. A framework for oligonucleotide microarray preprocessing. Bioinformatics
2010; 26:2363–7. https://doi.org/10.1093/bioinformatics/btq431 PMID: 20688976
25. Bolstad BM, Collin F, K.M. S, Irizarry RA, Speed TP. Experimental Design and Low-Level Analysis of
Microarray Data. Int Rev Neurobiol 2004; 60:25–58. https://doi.org/10.1016/S0074-7742(04)60002-X
PMID: 15474586
26. MacDonald JW. hugene20sttranscriptcluster.db: Affymetrix hugene20 annotation data (chip hugen-
e20sttranscriptcluster). R package version 8.3.1. 2013.
27. Bourgon R, Gentleman R, Huber W. Independent filtering increases detection power for high-through-
put experiments. Proc Natl Acad Sci 2010; 107:9546–51. https://doi.org/10.1073/pnas.0914005107
PMID: 20460310
28. Gentleman R, Carey V, Huber W, Hahne. F. genefilter: genefilter: methods for filtering genes from high-
throughput experiments. R package version 1.50.0. n.d.
29. Ritchie ME, Phipson B, Wu D, Hu Y, Law CW, Shi W, et al. limma powers differential expression analy-
ses for RNA-sequencing and microarray studies. Nucleic Acids Res 2015. https://doi.org/10.1093/nar/
gkv007 PMID: 25605792
30. Warnes GR, Bolker B, Bonebakker L, Gentleman R, Huber W, Liaw A, et al. gplots: Various R Program-
ming Tools for Plotting Data. R package version 2.17.0. n.d.
31. Kong W, Mou X, Hu X. Exploring matrix factorization techniques for significant genes identification of
Alzheimer’s disease microarray gene expression data. BMC Bioinformatics 2011; 12 Suppl 5:S7.
https://doi.org/10.1186/1471-2105-12-S5-S7 PMID: 21989140
32. Hyvarinen A, Oja E. Independent component analysis: algorithms and applications. Neural Netw 2000;
13:411–30. PMID: 10946390
33. Josse J, Husson F. Selecting the number of components in principal component analysis using cross-
validation approximations. Comput Stat Data Anal 2012; 56:1869–79.
34. Lê S, Josse J, Husson F, others. FactoMineR: an R package for multivariate analysis. R package ver-
sion 1.31.4. J Stat Softw 2008; 25:1–18.
Gene expression profiling in ultra-marathon trail runners
PLOS ONE | https://doi.org/10.1371/journal.pone.0180322 October 13, 2017 23 / 26
35. Marchini JL, Heaton C, Ripley BD. fastICA: FastICA Algorithms to perform ICA and Projection Pursuit.
R package version 1.2.0. 2013.
36. Kanehisa M, Goto S. KEGG: kyoto encyclopedia of genes and genomes. Nucleic Acids Res 2000;
28:27–30. PMID: 10592173
37. Croft D, Mundo AF, Haw R, Milacic M, Weiser J, Wu G, et al. The Reactome pathway knowledgebase.
Nucleic Acids Res 2014; 42:D472–7. https://doi.org/10.1093/nar/gkt1102 PMID: 24243840
38. Ashburner M, Ball CA, Blake JA, Botstein D, Butler H, Cherry JM, et al. Gene ontology: tool for the unifi-
cation of biology. The Gene Ontology Consortium. Nat Genet 2000; 25:25–9. https://doi.org/10.1038/
75556 PMID: 10802651
39. Yu G, Wang L-G, Han Y, He Q-Y. clusterProfiler: an R package for comparing biological themes among
gene clusters. OMICS 2012; 16:284–7. https://doi.org/10.1089/omi.2011.0118 PMID: 22455463
40. Lesurf R, Cotto KC, Wang G, Griffith M, Kasaian K, Jones SJM, et al. ORegAnno 3.0: a community-
driven resource for curated regulatory annotation. Nucleic Acids Res 2015; 44:D126–32. https://doi.org/
10.1093/nar/gkv1203 PMID: 26578589
41. Connolly PH, Caiozzo VJ, Zaldivar F, Nemet D, Larson J, Hung S-P, et al. Effects of exercise on gene
expression in human peripheral blood mononuclear cells. J Appl Physiol 2004; 97:1461–9. https://doi.
org/10.1152/japplphysiol.00316.2004 PMID: 15194674
42. Ulven SM, Foss SS, Skjolsvik AM, Stadheim HK, Myhrstad MC, Raael E, et al. An acute bout of exer-
cise modulate the inflammatory response in peripheral blood mononuclear cells in healthy young men.
Arch Physiol Biochem 2015; 121:41–9. https://doi.org/10.3109/13813455.2014.1003566 PMID:
25720858
43. Henriquez-Olguin C, Diaz-Vegas A, Utreras-Mendoza Y, Campos C, Arias-Calderon M, Llanos P, et al.
NOX2 Inhibition Impairs Early Muscle Gene Expression Induced by a Single Exercise Bout. Front Phy-
siol 2016; 7:282. https://doi.org/10.3389/fphys.2016.00282 PMID: 27471471
44. Fehrenbach E, Niess AM, Schlotz E, Passek F, Dickhuth H- H, Northoff H. Transcriptional and transla-
tional regulation of heat shock proteins in leukocytes of endurance runners. J Appl Physiol 2000; 89:704
LP–710.
45. Vance DD, Chen GL, Stoutenberg M, Myerburg RJ, Jacobs K, Nathanson L, et al. Cardiac perfor-
mance, biomarkers and gene expression studies in previously sedentary men participating in half-mara-
thon training 2014; 6. https://doi.org/10.1186/2052-1847-6-6 PMID: 24552436
46. Rodriguez-Miguelez P, Fernandez-Gonzalo R, Almar M, Mejias Y, Rivas A, de Paz JA, et al. Role of
Toll-like receptor 2 and 4 signaling pathways on the inflammatory response to resistance training in
elderly subjects. Age (Dordr) 2014; 36:9734. https://doi.org/10.1007/s11357-014-9734-0 PMID:
25427999
47. Kimsa MC, Strzalka-Mrozik B, Kimsa MW, Gola J, Kochanska-Dziurowicz A, Zebrowska A, et al. Differ-
ential expression of inflammation-related genes after intense exercise. Prague Med Rep 2014; 115:24–
32. https://doi.org/10.14712/23362936.2014.3 PMID: 24874932
48. Buttner P, Mosig S, Lechtermann A, Funke H, Mooren FC. Exercise affects the gene expression profiles
of human white blood cells. J Appl Physiol 2007; 102:26–36. https://doi.org/10.1152/japplphysiol.
00066.2006 PMID: 16990507
49. Jenkins NT, Landers RQ, Prior SJ, Soni N, Spangenburg EE, Hagberg JM. Effects of acute and chronic
endurance exercise on intracellular nitric oxide and superoxide in circulating CD34(+) and CD34(-)
cells. J Appl Physiol 2011; 111:929–37. https://doi.org/10.1152/japplphysiol.00541.2011 PMID:
21700895
50. Joro R, Uusitalo A, DeRuisseau KC, Atalay M. Changes in cytokines, leptin, and IGF-1 levels in over-
trained athletes during a prolonged recovery phase: A case-control study. J Sports Sci 2016:1–8.
https://doi.org/10.1080/02640414.2016.1266379 PMID: 27966392
51. Huber R, Pietsch D, Panterodt T, Brand K. Regulation of C/EBPbeta and resulting functions in cells of
the monocytic lineage. Cell Signal 2012; 24:1287–96. https://doi.org/10.1016/j.cellsig.2012.02.007
PMID: 22374303
52. Gonzalo S, Garcıa-Cao M, Fraga MF, Schotta G, Peters AHFM, Cotter SE, et al. Role of the RB1 family
in stabilizing histone methylation at constitutive heterochromatin. Nat Cell Biol 2005; 7:420–8. https://
doi.org/10.1038/ncb1235 PMID: 15750587
53. Ong C- T, Corces VG. CTCF: An Architectural Protein Bridging Genome Topology and Function. Nat
Rev Genet 2014; 15:234–46. https://doi.org/10.1038/nrg3663 PMID: 24614316
54. The UniProt Consortium. UniProt: a hub for protein information. Nucleic Acids Res 2014; 43:D204–12.
https://doi.org/10.1093/nar/gku989 PMID: 25348405
Gene expression profiling in ultra-marathon trail runners
PLOS ONE | https://doi.org/10.1371/journal.pone.0180322 October 13, 2017 24 / 26
55. Bresnick EH, Katsumura KR, Lee H-Y, Johnson KD, Perkins AS. Master regulatory GATA transcription
factors: mechanistic principles and emerging links to hematologic malignancies. Nucleic Acids Res
2012; 40:5819–31. https://doi.org/10.1093/nar/gks281 PMID: 22492510
56. Kassouf MT, Hughes JR, Taylor S, McGowan SJ, Soneji S, Green AL, et al. Genome-wide identification
of TAL1’s functional targets: insights into its mechanisms of action in primary erythroid cells. Genome
Res 2010; 20:1064–83. https://doi.org/10.1101/gr.104935.110 PMID: 20566737
57. Goldstein I, Hager GL. Transcriptional and Chromatin Regulation during Fasting—The Genomic Era.
Trends Endocrinol Metab 2015; 26:699–710. https://doi.org/10.1016/j.tem.2015.09.005 PMID:
26520657
58. Gong D, Farley K, White M, Hartshorn KL, Benarafa C, Remold-O’Donnell E. Critical role of serpinB1 in
regulating inflammatory responses in pulmonary influenza infection. J Infect Dis 2011; 204:592–600.
https://doi.org/10.1093/infdis/jir352 PMID: 21791661
59. Iaquinta PJ, Lees JA. Life and death decisions by the E2F transcription factors. Curr Opin Cell Biol
2007; 19:649–57. https://doi.org/10.1016/j.ceb.2007.10.006 PMID: 18032011
60. McLean CS, Mielke C, Cordova JM, Langlais PR, Bowen B, Miranda D, et al. Gene and MicroRNA
Expression Responses to Exercise; Relationship with Insulin Sensitivity. PLoS One 2015; 10:
e0127089. https://doi.org/10.1371/journal.pone.0127089 PMID: 25984722
61. Anderson PH, Lam NN, Turner AG, Davey RA, Kogawa M, Atkins GJ, et al. The pleiotropic effects of
vitamin D in bone. J Steroid Biochem Mol Biol 2013; 136:190–4. https://doi.org/10.1016/j.jsbmb.2012.
08.008 PMID: 22981997
62. Walsh NP, Gleeson M, Shephard RJ, Gleeson M, Woods JA, Bishop NC, et al. Position statement. Part
one: Immune function and exercise. Exerc Immunol Rev 2011; 17:6–63. PMID: 21446352
63. Pikosky MA, Smith TJ, Grediagin A, Castaneda-Sceppa C, Byerley L, Glickman EL, et al. Increased
protein maintains nitrogen balance during exercise-induced energy deficit. Med Sci Sports Exerc 2008;
40:505–12. https://doi.org/10.1249/MSS.0b013e31815f6643 PMID: 18379214
64. Smiles WJ, Hawley JA, Camera DM. Effects of skeletal muscle energy availability on protein turnover
responses to exercise. J Exp Biol 2016; 219:214–25. https://doi.org/10.1242/jeb.125104 PMID:
26792333
65. Jamart C, Francaux M, Millet GY, Deldicque L, Frère D, Feasson L. Modulation of autophagy and ubi-
quitin-proteasome pathways during ultra-endurance running. J Appl Physiol 2012; 112:1529–37.
https://doi.org/10.1152/japplphysiol.00952.2011 PMID: 22345427
66. Sandri M. Signaling in Muscle Atrophy and Hypertrophy. Physiology 2008; 23:160 LP–170.
67. Hoier B, Hellsten Y. Exercise-induced capillary growth in human skeletal muscle and the dynamics of
VEGF. Microcirculation 2014; 21:301–14. https://doi.org/10.1111/micc.12117 PMID: 24450403
68. Ameln H. Physiological activation of hypoxia inducible factor-1 in human skeletal muscle. FASEB J
2005. https://doi.org/10.1096/fj.04-2304fje PMID: 15811877
69. Patel SA, Simon MC. Biology of hypoxia-inducible factor-2alpha in development and disease. Cell
Death Differ 2008; 15:628–34. https://doi.org/10.1038/cdd.2008.17 PMID: 18259197
70. Voisin S, Cieszczyk P, Pushkarev VP, Dyatlov DA, Vashlyayev BF, Shumaylov VA, et al. EPAS1 gene
variants are associated with sprint/power athletic performance in two cohorts of European athletes.
BMC Genomics 2014; 15:382. https://doi.org/10.1186/1471-2164-15-382 PMID: 24884370
71. Henderson J, Withford-Cave JM, Duffy DL, Cole SJ, Sawyer NA, Gulbin JP, et al. The EPAS1 gene
influences the aerobic–anaerobic contribution in elite endurance athletes. Hum Genet 2005; 118:416–
23. https://doi.org/10.1007/s00439-005-0066-0 PMID: 16208515
72. Salnikow K, Aprelikova O, Ivanov S, Tackett S, Kaczmarek M, Karaczyn A, et al. Regulation of hypoxia-
inducible genes by ETS1 transcription factor. Carcinogenesis 2008; 29:1493–9. https://doi.org/10.1093/
carcin/bgn088 PMID: 18381358
73. Verschoor ML, Wilson LA, Verschoor CP, Singh G. Ets-1 regulates energy metabolism in cancer cells.
PLoS One 2010; 5:e13565. https://doi.org/10.1371/journal.pone.0013565 PMID: 21042593
74. Bieging KT, Mello SS, Attardi LD. Unravelling mechanisms of p53-mediated tumour suppression. Nat
Rev Cancer 2014; 14:359–70. https://doi.org/10.1038/nrc3711 PMID: 24739573
75. Lago CU, Sung HJ, Ma W, Wang P, Hwang PM. p53, aerobic metabolism, and cancer. Antioxid Redox
Signal 2011; 15:1739–48. https://doi.org/10.1089/ars.2010.3650 PMID: 20919942
76. Bartlett JD, Louhelainen J, Iqbal Z, Cochran AJ, Gibala MJ, Gregson W, et al. Reduced carbohydrate
availability enhances exercise-induced p53 signaling in human skeletal muscle: implications for mito-
chondrial biogenesis. Am J Physiol Regul Integr Comp Physiol 2013; 304:R450–8. https://doi.org/10.
1152/ajpregu.00498.2012 PMID: 23364526
Gene expression profiling in ultra-marathon trail runners
PLOS ONE | https://doi.org/10.1371/journal.pone.0180322 October 13, 2017 25 / 26
77. Fuss J, Steinle J, Bindila L, Auer MK, Kirchherr H, Lutz B, et al. A runner’s high depends on cannabinoid
receptors in mice. Proc Natl Acad Sci 2015; 112:13105–8. https://doi.org/10.1073/pnas.1514996112
PMID: 26438875
78. Tantimonaco M, Ceci R, Sabatini S, Catani MV, Rossi A, Gasperi V, et al. Physical activity and the
endocannabinoid system: an overview. Cell Mol Life Sci 2014; 71:2681–98. https://doi.org/10.1007/
s00018-014-1575-6 PMID: 24526057
79. Raichlen DA, Foster AD, Seillier A, Giuffrida A, Gerdeman GL. Exercise-induced endocannabinoid sig-
naling is modulated by intensity. Eur J Appl Physiol 2013; 113:869–75. https://doi.org/10.1007/s00421-
012-2495-5 PMID: 22990628
Gene expression profiling in ultra-marathon trail runners
PLOS ONE | https://doi.org/10.1371/journal.pone.0180322 October 13, 2017 26 / 26