aestimatio, the ieb international journal of … · 28 aesti matio t ieb o n a s s e t m a n a g e...
TRANSCRIPT

26
AESTIMATIO, THE IEB INTERNATIONAL JOURNAL OF FINANCE, 2017. 14: 26-45© 2017 AESTIMATIO, THE IEB INTERNATIONAL JOURNAL OF FINANCE
On asset managers, hedge funds and ETFs
Camarero Aguilera, SantiagoLópez Pascual, Joaquín
� RECEIVED : 30 AUGUST 2016
� ACCEPTED : 3 JANUARY 2017
AbstractThe returns generated by the traditional asset management industry do not justify the
current fees charged. An “excessive” reward for the risk taken leads to the assumption
of disproportionate risks and to a non-efficient allocation of resources. This situation
has been become more evident with the appearance of low-cost index-tracking funds,
such as exchange-traded funds (ETFs) and robo-advisors, which are favoured in the
current low-return, low-volatility and high-correlation investment climate. However,
the market cannot be entirely made up of index funds with no discrimination; this
would ultimately lead to a massive misallocation of capital.
In this context, the traditional asset management and hedge fund industries need to
evolve and adapt to the new environment that requires more transparency, lower fees
and new pay structures with more robust set ups.
Keywords: Hedge fund, ETF, Smart beta, Mutual fund.
JEL classification: G1 , G2.
Camarero Aguilera, S. Bankia and CUNEF, Leonardo Prieto Castro, 2, 28040, Madrid. +34 91 423 96 95. E-mail: [email protected].
López Pascual, J. Universidad Rey Juan Carlos. Department of Business Economics, Facultad de CC Jurídicas y Sociales,Campus Vicálvaro. Paseo Artilleros s/n 28032 Madrid. +34 91 488 77 05 E-mail: [email protected]
RESE
ARCH ARTICLE
A E S T I M AT I OT I E B
DOI:10.5605/IEB.14.2
2 Please cite this article as:Camarero Aguilera, S. and López Pascual, J. (2017). On asset managers, hedge funds and ETFs,AESTIMATIO, The IEB International Journal of Finance, 14, pp. 26-45.
doi: 10.5605/IEB.14.2

2727
AESTIMATIO, THE IEB INTERNATIONAL JOURNAL OF FINANCE, 2017. 14: 26-45© 2017 AESTIMATIO, THE IEB INTERNATIONAL JOURNAL OF FINANCE
Sobre gestoras, hedge funds y ETFs
Camarero Aguilera, SantiagoLópez Pascual, Joaquín
ResumenLas rentabilidades generadas en la industria tradicional de gestión de activos no per-
miten justificar los niveles de comisiones que actualmente se aplican. Una remune-
ración demasiado elevada por el riesgo asumido incentiva la toma de riesgos excesivos
y por consiguiente una asignación de recursos ineficiente. Esta situación se ha hecho
más evidente con la aparición de nuevo fondos de bajo coste e indexados, como los
ETF y los “robo advisors”, favorecidos por el contexto actual de baja rentabilidad y
volatilidad, y de alta correlación. No obstante, el mercado no debe caer en la tenta-
ción de componerse únicamente de fondos indexados que no proporcionan ningún
tipo de discriminación. El resultado sería igualmente una masiva asignación inefi-
ciente de capital.
En este contexto, la industria tradicional de gestión de activos y la de hedge funds ne-
cesitan reestructurarse y adaptarse a una nueva realidad que requiere de ellos una
mayor transparencia, menores comisiones y mejoras en sus prácticas de gobierno cor-
porativo.
Palabras clave: Hedge fund, ETF, Smart beta, fondo de inversión.
A E S T I M AT I OT I E B

28
A E S T I M AT I OT I E B
On
asse
t man
ager
s, he
dge
fund
s an
d ET
Fs. C
amarero A
guilera, S. and
Lóp
ez Pascual, J.
AES
TIM
ATIO
, TH
EIE
BIN
TERN
ATIO
NA
LJO
URN
AL
OF
FIN
AN
CE,
2017
. 14:
26-4
5
n 1. Asset management industry outlook
Supported by favourable demographic drivers, many experts expect a positive long-
term outlook for the asset management industry, with an average annual growth
of around 5% in terms of assets under management (AUM).
In spite of this rosy long-term outlook, asset managers will remain under strong
pressure in the short term due to mounting regulatory constraints and decreasing
returns. In addition, traditional players, such as active mutual funds, will be chal-
lenged by the growing weight of passive strategies. Even the alternative segments,
such as hedge funds, will not be immune to this trend. There will be continued pres-
sure on the whole sector to move towards efficiency improvements, more trans-
parency and fee reduction.
There has always been an aura of sophistication around the hedge fund industry
despite the fact that it suffers from the same underlying problem as the traditional
active asset management industry: consistent underperformance as compared to
equity benchmarks during recent years.
The two industries share many problems, challenges and restructuring needs. How-
ever, their distinct investor profiles means that they adapt to the new reality at dif-
ferent speeds; the hedge fund industry is mainly funded by professional investors
while traditional asset management is favoured by retail clients.
n Figure 1. Capital-weighted breakdown by investor type (hedge funds)
SOURCE: PREQIN HEDGE FUND INVESTOR PROFILES; PREQIN (2016).
Private sector pension fund 15%
Asset manager 12%
Endowment plan 9%
Insurance company 8%
Foundation 5%
Bank 4%
Wealth manager 3%
Family office 2%
Public pension fund 25%
Other 1%
Sovereign Wealth fund 16%

29
A E S T I M AT I OT I E B
On asset m
anagers, hedge funds and ETFs. Camarero Aguilera, S. and López Pascual, J.
AESTIM
ATIO, TH
EIEB
INTERN
ATION
AL
JOU
RNA
LO
FFIN
AN
CE, 2017. 14: 26-45
Traditional fund managers seem to compete on the basis of past performance, with
studies indicating that this is the most influential factor for retail investors in picking
a fund. The hedge fund industry, on the other hand, is funded by professional in-
vestors looking to construct diversified portfolios across multiple asset classes on the
“Efficient Frontier”, and seeking to maximize risk-adjusted returns according to mod-
ern portfolio theory. To enhance portfolio fund returns, hedge funds do not need to
outperform equities; they need to provide returns uncorrelated with equities that will
outperform other instruments on a risk-adjusted return basis.
However, this is not a foolproof strategy. Passive fund managers are developing in-
creasingly sophisticated strategies that are presenting fresh challenges to traditional
and alternative managers, with the rise of passive funds and robo-advisors becoming
one of the biggest threats. It is expected that both traditional and alternative indus-
tries will continue to lose market share against these newcomers. According to
ETF.com, the AUM in the ETF industry have grown from $300mn in 2005 to more
than $3tn in 2015 with more than 6000 ETF available. This is basically the same size
estimated for the hedge fund industry, according to BarclayHedge.
In this context, the traditional asset management and hedge fund industries need to
evolve and adapt to this new environment that requires better transparency, lower
fees and new pay structures with more robust set ups. Particularly relevant in the
hedge fund industry is the fee problem, where asymmetric and “excessive” rewards
for the risk taken lead to the assumption of disproportionate risks, such as too much
leverage. This problem contributes to the non-efficient allocation of resources.
In our opinion, the hedge fund industry makes a crucial contribution to the integra-
tion and comprehensiveness of the financial market, however an incomplete under-
standing of these funds leads to their return characteristics being exaggerated and
their inherent level of volatility being underestimated, hence making hedge funds in-
vestments appear more attractive than they really are.
Hedge funds provide exposure to different risk factors than those of the traditional
assets classes—equity, bonds and cash. Hedge fund return replication is a complex
task for passive funds and robo-advisors due to the lack of transparency, their het-
erogeneous approaches and the complexity inherent in the construction of hedge
fund indexes.
However, this does not make the hedge fund industry immune to the new ETF com-
petitors. On the one hand, the hedge fund industry is not fulfilling its expected role,
and on the other hand, the new passive funds are providing ever-better proxies of
hedge fund strategies. A new generation of funds called “smart beta” is trying to repli-

cate some of the hedge fund strategies, for now mainly equity related, which repre-
sents an advancement over the mere passive tracking of an index. This new smart
ETFs industry is still in its initial phase but promises to play a prominent role in the
near future and to press for more efficient and better structured active management
and hedge fund industries.
This article aims to provide a better understanding of hedge fund analysis —an in-
dustry unfortunately still not well understood among many investors and re-
searchers—and the contribution of this “asset class” to portfolio optimization.
We show how to identify risk factors and to replicate the return distributions of dif-
ferent hedge fund strategies through simple financial derivatives, an approach that
we believe could form the basis for the development of a new phase of “smart beta”
funds that could be applied to yet more strategies.
A summary of related studies can be found in Camarero Aguilera (2013). That
paper laid the groundwork for a set of studies that we performed aiming to design
financial models able to replicate hedge fund index return distributions, studies
that concluded with Camarero Aguilera and López Pascual (2013) and Camarero
Aguilera (2014).
n 2. Traditional asset management and hedge fund objectivesand challenges
According to Morningstar, its rated funds had not, on average, outperformed their
sector benchmarks net of fees since the 2008 market crash. The Financial Conduct
Authority (FCA), in its recent “Asset Management Market Study”, finds, like others
before it, that active managers underperform the index after costs, and it finds little
evidence of persistence in outperformance.
It is still remarkable that traditional asset managers, at least when it comes to retail
clients, do not compete on price at all. According to the FCA, this is partly due to
“investors’ ignorance”. More than half of retail investors surveyed by the FCA did not
know that they paid charges on investment products. However, there is one part of
the market where fees have come down: passive or “tracker” funds, which try to match
an index. Their fees have fallen by more than half since the turn of the decade due to
the growing pressure of ETFs.
One could argue that the more sophisticated investment approach followed by hedge
funds and the different objectives of their investor base would provide some shelter
30
A E S T I M AT I OT I E B
On
asse
t man
ager
s, he
dge
fund
s an
d ET
Fs. C
amarero A
guilera, S. and
Lóp
ez Pascual, J.
AES
TIM
ATIO
, TH
EIE
BIN
TERN
ATIO
NA
LJO
URN
AL
OF
FIN
AN
CE,
2017
. 14:
26-4
5

from these pressures. Traditional fund managers seem to compete on the basis of
past performance, with studies indicating that this is the most influential factor for
retail investors in picking a fund. The hedge fund industry, on the other hand, is
funded by professional investors looking to construct diversified portfolios across
multiple asset classes on the “Efficient Frontier”, and seeking to maximize risk-ad-
justed returns according to modern portfolio theory.
To enhance portfolio fund returns, hedge funds do not need to outperform equities;
they “only” need to provide returns uncorrelated with equities that will outperform
other instruments on a risk-adjusted return basis. However, these models have
proven to break down during strong market sell-offs.
As illustrated in Camarero Aguilera (2014), there are many reasons behind this fact.
The main one is that two of the inputs in portfolio construction are dynamic and
non-linear. When markets sell off, correlations tend to increase. When combined
with a spike in volatility, this creates much more tail risk than originally perceived.
Many portfolio optimization models use hedge fund index returns as input for their
calculations. However, there are some important issues to consider when working
with hedge fund indexes, such as survivorship bias. In addition, most hedge fund
strategies, except short bias, show common characteristics such as negative skew-
ness, positive excess kurtosis and serial correlation.
Therefore, it is not surprising that we are seeing a growing number of public pension
funds pulling out of hedge funds or reducing their hedge fund exposure1. They cite
“complexity” as a major factor for their decision to stop investing in these funds,
as well as high associated costs. “With hedge funds, you’re certain of the high costs,
but uncertain of the return,” stated Jan Willem van Oostveen, PFZW’s Manager of
Financial and Investment Policy, adding that “For a long time, hedge funds were a
useful tool…but lately they have not made a sufficient contribution.” He further
noted the “high remuneration in the hedge funds sector and often limited concern
for society and the environment”.
Nonetheless, the overall level of AUM in the industry, which hovers just below $3tn,
has not fallen dramatically over the last years.
1 CalPERS was the first high-profile public pension to pull out of hedge funds in late 2014 (https://www.calpers.ca.gov). Itsdecision was followed by other big public retirement plans such as PFZW (Pensioenfonds Zorg en Welzijn), Europe’s secondbiggest pension fund, which announced on 9 January 2015 that it was to stop all further investments in hedge funds.
31
A E S T I M AT I OT I E B
On asset m
anagers, hedge funds and ETFs. Camarero Aguilera, S. and López Pascual, J.
AESTIM
ATIO, TH
EIEB
INTERN
ATION
AL
JOU
RNA
LO
FFIN
AN
CE, 2017. 14: 26-45

n 3. Hedge fund indexes
Before investing in hedge funds it should be understood that hedge funds are not a ho-
mogenous asset class. Databases providers develop a series of benchmark indexes de-
signed to reflect hedge fund industry performance. Their objective is to identify and to
group hedge funds that really compete using similar investment strategies. However,
there is no consensus as to the number of investment strategies used by hedge funds.
In addition, the number of strategies is continually increasing in parallel with the devel-
opment of new products.
The process of building a hedge fund index is complex due to the nature of the infor-
mation involved. A hedge fund could seek opportunistic exposure or drift from its pub-
lished investment style without notice. Therefore, it is important to filter any new data
from a quantitative and qualitative point of view.
There are important problems to consider when working with hedge fund indexes, such
as survivorship bias. Many hedge funds that were included in the indexes at some point
in the past might not now comply with the index requirements or might be defunct. For
example, Hedge Fund Research (HFR), a database provider, minimizes this problem by
trying to include a fund’s performance up until the final liquidation of the fund.
It is important to highlight the work done in the index analysis field by some researchers.
Amin and Kat (2003) found that concentrating only on surviving funds leads to over-
estimating the mean return on individual hedge funds by approximately 2% and intro-
duces significant biases in estimates of the standard deviation, skewness and kurtosis.
In addition, Brooks and Kat (2002) argued that the serial correlation of hedge fund re-
turns seems inconsistent with the notion of efficient markets. They suggest that one
possible explanation could be the fact that many hedge funds invest in illiquid or com-
plex assets.
It is not always easy to find up-to-date valuations of these assets; therefore, the last re-
ported transaction price or model valuations are sometimes used. López and Cuellar
(2007) used similar arguments to explain the serial correlation in hedge fund returns,
affirming that real valuations show the same problem due to the illiquid securities being
appraised. These explanations are also corroborated by many researchers, who claim
that hedge funds, to a certain extent, manage the reported returns in order to “smooth”
their return distributions.
These findings add an extra layer of complication to the analysis of hedge funds and
to the quality of the data used by researchers and investors in such analysis.
32
A E S T I M AT I OT I E B
On
asse
t man
ager
s, he
dge
fund
s an
d ET
Fs. C
amarero A
guilera, S. and
Lóp
ez Pascual, J.
AES
TIM
ATIO
, TH
EIE
BIN
TERN
ATIO
NA
LJO
URN
AL
OF
FIN
AN
CE,
2017
. 14:
26-4
5

n 4. Using hedge funds in asset portfolio construction
As stated above, most strategies except short bias show common characteristics such
as negative skewness, positive excess kurtosis and serial correlation. The main conse-
quence of these characteristics is that the left tail of the return distribution is longer
than the right; therefore, large losses are bigger than those suggested by the standard
deviation. Furthermore, the serial correlation of the returns does not show that the
model underestimates the true variance and reduces the effective number of degrees
of freedom in a time series. In the case of hedge fund analysis, this means underesti-
mating the true risk of our investment and overallocating to hedge funds when we
undertake a mean variance portfolio analysis.
Therefore, in order to corroborate the validity of the Capital Assets Pricing Model
(CAPM) approach for hedge funds, it is important to study the statistical character-
istics of their return distributions.
The Central Limit Theorem (CLT) affirms that the distribution of the average of a
sufficiently large number of independent variables approaches normality if certain
conditions are fulfilled:
n The mean and standard deviations or the processes generating the returns should
be stationary over time.
n The processes generating the returns should be independent of each other rather
than a function of general systematic factors.
Camarero Aguilera (2014) showed that hedge funds display serial correlation in their
returns, which challenges the hypothesis of independent identically distributed (i.i.d.)
random variables.
In addition, the CLT approach provided is based on the hypothesis of a portfolio built
from Nk equally weighted assets. However, the objective of any optimization process
is to maximize return and minimize risk. This leads, as Amenc and Martellini (2002)
stated, to the largest proportion of capital being allocated to the asset class for
which the estimation error in the expected returns is the greatest.
It is also important to point out certain characteristics of the CLT. It allows us to es-
timate the probability of the return being in the interval of size ~s /√n around the
mean value. However, it should not be used to estimate the probability of a large loss
Rn <–L in the limit of large n, since as n gets larger, the variance gets smaller. Therefore,
this approach skips over all the information embedded in the tails of the distribution,
which, as we have shown in the case of hedge funds, is very significant.
33
A E S T I M AT I OT I E B
On asset m
anagers, hedge funds and ETFs. Camarero Aguilera, S. and López Pascual, J.
AESTIM
ATIO, TH
EIEB
INTERN
ATION
AL
JOU
RNA
LO
FFIN
AN
CE, 2017. 14: 26-45

The last point to make here regards the treatment of systematic and unsystematic
risk. As Markowitz (2012) shows:
s 2p =∑
n
i=1 x 2i s 2
i +∑n
i=1∑nj=1xixjsij =
=∑n
i=1 x 2i s 2
i +∑n
i=1∑nj=1xixjsisjrij
where:
s 2p is the portfolio variance,
xixj are the asset weights,
rij is the correlation between the returns of two assets.
The systematic risk is the undiversifiable part of the portfolio risk due to the correla-
tion between the different assets.
Therefore, an important limitation is that the final portfolio return distribution will
depend on the correlation assumptions. Many models treat the correlation as a con-
stant or a linear function, however, a more robust approach is to treat correlation as
a stochastic variable.
Assuming that the b of a security is time-invariant, it is easy to assess the changes in
correlation as the market volatility changes.
ri,m = cov(ri ,rm) = cov(ri ,rm) sm = bsm
where:
ri,m = is the correlation between the returns of asset i and the market.
We have thus shown that:
n The correlation depends on a non-linear relation.
n Higher market volatility increases the correlation between our variables, challenging
the robustness of the model.
Our findings explain why, in market downturns when market volatility increases, asset
returns became more correlated. At the same time, we can conclude that the validity
of the CAPM or any other linear portfolio building model becomes compromised
when we see changes in the correlation levels.
As we have shown, this is particularly true in the case of the hedge funds, where the i.i.d.
of the returns is challenged from the outset due to the serial correlation of their returns.
34
A E S T I M AT I OT I E B
On
asse
t man
ager
s, he
dge
fund
s an
d ET
Fs. C
amarero A
guilera, S. and
Lóp
ez Pascual, J.
AES
TIM
ATIO
, TH
EIE
BIN
TERN
ATIO
NA
LJO
URN
AL
OF
FIN
AN
CE,
2017
. 14:
26-4
5
i≠j
i≠j
sism s 2m si si

n 5. Identifying risk factor exposures and replicating hedgefund performance
As we previously pointed out, there is no consensus as to the number of investment
strategies used by hedge funds. In addition, the number of strategies is continually
increasing in parallel with the development of new products.
HFR has created the following index classification:
l Table 1. Hedge fund strategy classification
SOURCE: WWW.HEDGEFUNDRESEARCH.COM
The historical return analysis provides an important source of information for evalu-
ating and understanding hedge fund investment styles. These time series can help us
to identify each strategy’s exposure to risk factors. If we can replicate the return dis-
tribution, we would be able to replicate the hedge fund exposure.
There have been a number of different attempts to replicate the non-normality and
non-linearity of hedge fund returns through conditional multifactor models. One of
the latest publications in this field, Camarero and López Pascual (2013), focused on
the purchase and sale of plain vanilla options to assimilate and explain the returns of
different hedge fund strategies.
This approach allows us to classify strategies and provide an intuitive explanation of the
risk factor behaviour. In addition, this paper opens the door to the study of hedge fund
risk through options-based models (such as the Quadratic Value at Risk measures).
35
A E S T I M AT I OT I E B
On asset m
anagers, hedge funds and ETFs. Camarero Aguilera, S. and López Pascual, J.
AESTIM
ATIO, TH
EIEB
INTERN
ATION
AL
JOU
RNA
LO
FFIN
AN
CE, 2017. 14: 26-45
Hedge fund strategy classification
Equity hedge Event driven Macro Relative value
Equity market neutral Activist Active trading Fixed income-Asset backed
Fundamental growth Credit arbitrage Commodity: agricultureFixed income-Convertiblearbitrage
Fundamental value Distressed/Restructuring Commodity: energy Fixed income-corporate
Quantitative directional Merger arbitrage Commodity: metals Fixed income-sovereign
Sector: energy/basic materials
Private issue/regulation D
Commodity: multi Volatility
Sector: technology/healthcare
Special situationsCurrency: discretionary
Yield alternatives:energy infrastructure
Short bias Multi-strategy Currency: systematic Yield alternatives: real state
Multi-strategy Discretionary thematic Multi-strategy
Systematic diversified multi-strategy

The proposed approach is simple; it starts by analysing the changes in the risk profile
of the different investment strategies in response to the upward and to the downward
movements of the equity market. We illustrate a few examples2 of arbitrage strategies
based on the monthly performance of the HFRI Indexes from June 2007 to March
2011, as developed originally in Camarero Aguilera and López Pascual (2013):
Arbitrage strategiesThe aim of these strategies is to exploit relative mispricing in certain securities, looking
for negative correlation in the returns of the selected securities.
Arbitrage hedge fund strategies achieve consistently small positive returns, with low
volatility; however, in times of stress they suffer larger losses than would be predicted
based on the historical volatility of their returns.
The replication of these strategies resembles the selling of options, so arbitrageurs seem
to be net sellers of volatility. As mentioned above, in times of market stress such funds
may suffer large losses, precisely when the correlation in the markets tends to increase.
Therefore, these funds are not only consistently short volatility (vega and gamma), they
are also short correlation, which explains why they would suffer larger losses in times
of stress than would be predicted based on the historical volatility of their returns.
Volatility strategyThese funds trade volatility as an asset class through both listed and unlisted instru-
ments. The instruments used are mainly derivatives or other types of assets with embed-
ded derivatives. The price of these instruments depends on the volatility level; therefore,
hedging other risk factors, it is possible to isolate the exposure to the volatility.
n Figure 2. The distribution of volatility index returns
SOURCE: BLOOMBERG
2 For readers interested in a more in-depth analysis and calibration parameters, please refer to Camarero Aguilera andLópez Pascual (2013).
36
A E S T I M AT I OT I E B
On
asse
t man
ager
s, he
dge
fund
s an
d ET
Fs. C
amarero A
guilera, S. and
Lóp
ez Pascual, J.
AES
TIM
ATIO
, TH
EIE
BIN
TERN
ATIO
NA
LJO
URN
AL
OF
FIN
AN
CE,
2017
. 14:
26-4
5
0.00%
5.00%
10.00%
15.00%
20.00%
25.00%
30.00%
Volatility index Normal dist.
8.00%
6.00%
4.00%
2.00%
0.00%
-2.0
0%
-4.0
0%
-6.0
0%
-8.0
0%
-10.0
0%
10.0
0%

l Table 2. The statistics of the volatility index return distribution
Volatility
Mean 0.040%
Median 0.652%
Std. dev. 1.704%
Skew -0.8604
Kurtosis 0.494
Min. -4.53%
Max. 2.76%
N. of positive 56.52%
N. of negative 43.48%
We observe that the returns from this strategy assimilates the sale of a series of strad-
dles on equity market returns, with the strikes set around 0%, as illustrated in Figure
3. This means that hedge funds managers generate the biggest returns when the equity
market barely moves. When large equity market movements occur to either side, their
returns are reduced.
n Figure 3. Volatility index returns vs. S&P 500 returns
SOURCE: BLOOMBERG
One of the first conclusions that we reach is that these hedge funds consistently
achieve their returns by selling volatility to the market. This finding contradicts the
claims made by many volatility hedge fund managers that they maintain a net long
volatility position or have the skills to change from being short volatility to long volatil-
37
A E S T I M AT I OT I E B
On asset m
anagers, hedge funds and ETFs. Camarero Aguilera, S. and López Pascual, J.
AESTIM
ATIO, TH
EIEB
INTERN
ATION
AL
JOU
RNA
LO
FFIN
AN
CE, 2017. 14: 26-45
-5.00%
-3.00%
-1.00%
1.00%
3.00%
5.00%
-10.00% -8.00% -6.00% -4.00% -2.00% 0.00% 2.00% 4.00% 6.00% 8.00% 10.00%
Vol
atili
ty in
dex
S&P 500 returns

ity when the market moves. It is worth noting that the tail risk in this strategy seems
to be quite limited.
Accordingly, we expect a return distribution for this strategy with a high concentration
of small positive returns, low variance and no fat tail.
l Table 3. Comparison between volatility and options strategies distributions
Volatility index Options strategy
Mean 0.040% 0.051%
Median 0.652% 0.103%
Stand. desv. 1.704% 1.312%
Skew -0.860 -0.205
Kurtosis 0.494 3.290
Min. -4.53% -4.42%
Max. 2.76% 4.04%
N. of positive 56.52% 50.00%
N. of negative 43.48% 50.00%
In Figure 4, we can see how the synthetic option strategy proposed achieves a very similar
return distribution and absolute performance once the returns are adjusted for the stan-
dard 2/20 fee (a fee of 2% on AUM and 20% on performance with a high-water mark).
n Figure 4. Return distributions and performances (in base 100) of volatilityindex vs. options portfolio
Return distributions Index performance
* Note that the S&P 500 returns are not adjusted with the 2/20 commissions.SOURCE: BLOOMBERG
Relative value strategyThis type of fund looks for discrepancies in the market price of certain securities.
These opportunities can be identified through the use of fundamental, macro models
or quantitative analysis. There are no restrictions in terms of the securities used.
38
A E S T I M AT I OT I E B
On
asse
t man
ager
s, he
dge
fund
s an
d ET
Fs. C
amarero A
guilera, S. and
Lóp
ez Pascual, J.
AES
TIM
ATIO
, TH
EIE
BIN
TERN
ATIO
NA
LJO
URN
AL
OF
FIN
AN
CE,
2017
. 14:
26-4
5
0.00%
5.00%
10.00%
15.00%
20.00%
30.00%
25.00%
35.00%
40.00%
Volatility index Options strategy Normal dist.
8.00%
6.00%
4.00%
2.00%
0.00%
-2.0
0%
-4.0
0%
-6.0
0%
-8.0
0%
-10.0
0%
10.0
0%
100
80
60
40
20
120
-
01/11
/2010
01/08/2
010
01/05/2
010
01/02/2
010
01/11
/2009
01/08/2
009
01/05/2
009
01/02/2
009
01/11
/2008
01/08/2
008
01/05/2
008
01/02/2
008
01/11
/2007
01/08/2
007
01/05/2
007
01/02/2
011
Vol driven S&P 500 Opt. strategy

n Figure 5. The distribution of relative value arbitrage returns
SOURCE: BLOOMBERG
l Table 4. The statistics of the relative value arbitrage returns
Volatility
Mean -0.043%
Median 0.650%
Std. dev. 3.592%
Skew -1.7597
Kurtosis 5.135
Min. -14.11%
Max. 6.81%
N. of positive 58.70%
N. of negative 41.30%
n Figure 6. Relative value arbitrage index returns vs. S&P 500 returns
SOURCE: BLOOMBERG
The relative value arbitrage returns are similar to the sale of put options on the eq-
uity market, as illustrated in Figure 6. Our results are coherent with the findings of
Mitchell and Pulvino (2001), who found that risk arbitrage returns are positively
39
A E S T I M AT I OT I E B
On asset m
anagers, hedge funds and ETFs. Camarero Aguilera, S. and López Pascual, J.
AESTIM
ATIO, TH
EIEB
INTERN
ATION
AL
JOU
RNA
LO
FFIN
AN
CE, 2017. 14: 26-45
0.00%
5.00%
10.00%
15.00%
20.00%
25.00%
30.00%
Relative value arbitrage index Normal dist.
8.00%
6.00%
4.00%
2.00%
0.00%
-2.0
0%
-4.0
0%
-6.0
0%
-8.0
0%
-10.0
0%
10.0
0%
-20.00%
-15.00%
-10.00%
-5.00%
0.00%
5.00%
10.00%
15.00%
-20.00% -15.00% -10.00% -5.00% 0.00% 5.00% 10.00% 15.00%
S&P 500 Returns
Rel
ativ
e va
lue
arb
itra
ge
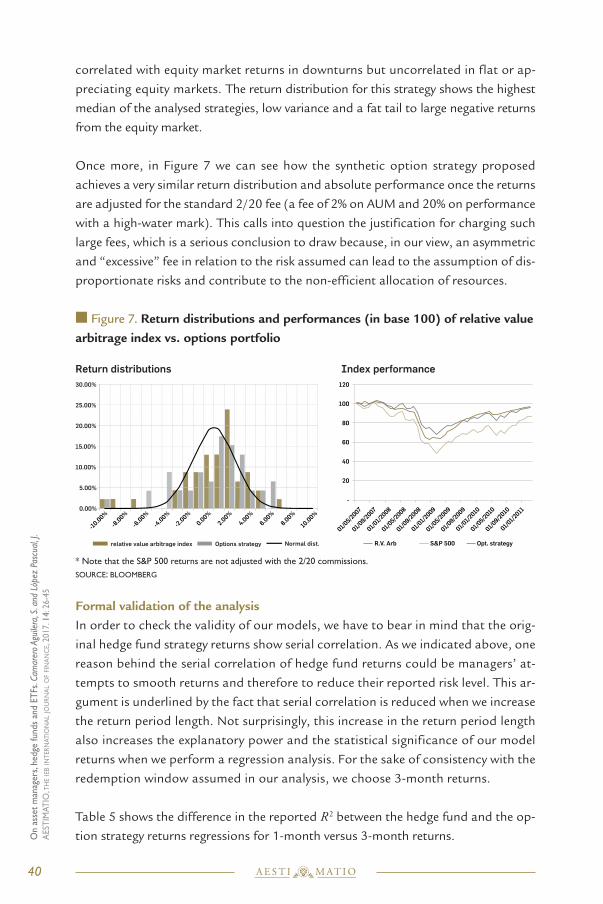
correlated with equity market returns in downturns but uncorrelated in flat or ap-
preciating equity markets. The return distribution for this strategy shows the highest
median of the analysed strategies, low variance and a fat tail to large negative returns
from the equity market.
Once more, in Figure 7 we can see how the synthetic option strategy proposed
achieves a very similar return distribution and absolute performance once the returns
are adjusted for the standard 2/20 fee (a fee of 2% on AUM and 20% on performance
with a high-water mark). This calls into question the justification for charging such
large fees, which is a serious conclusion to draw because, in our view, an asymmetric
and “excessive” fee in relation to the risk assumed can lead to the assumption of dis-
proportionate risks and contribute to the non-efficient allocation of resources.
n Figure 7. Return distributions and performances (in base 100) of relative valuearbitrage index vs. options portfolio
Return distributions Index performance
* Note that the S&P 500 returns are not adjusted with the 2/20 commissions.SOURCE: BLOOMBERG
Formal validation of the analysisIn order to check the validity of our models, we have to bear in mind that the orig-
inal hedge fund strategy returns show serial correlation. As we indicated above, one
reason behind the serial correlation of hedge fund returns could be managers’ at-
tempts to smooth returns and therefore to reduce their reported risk level. This ar-
gument is underlined by the fact that serial correlation is reduced when we increase
the return period length. Not surprisingly, this increase in the return period length
also increases the explanatory power and the statistical significance of our model
returns when we perform a regression analysis. For the sake of consistency with the
redemption window assumed in our analysis, we choose 3-month returns.
Table 5 shows the difference in the reported R 2 between the hedge fund and the op-
tion strategy returns regressions for 1-month versus 3-month returns.
40
A E S T I M AT I OT I E B
On
asse
t man
ager
s, he
dge
fund
s an
d ET
Fs. C
amarero A
guilera, S. and
Lóp
ez Pascual, J.
AES
TIM
ATIO
, TH
EIE
BIN
TERN
ATIO
NA
LJO
URN
AL
OF
FIN
AN
CE,
2017
. 14:
26-4
5
0.00%
5.00%
10.00%
15.00%
20.00%
30.00%
25.00%
relative value arbitrage index Options strategy Normal dist.
8.00%
6.00%
4.00%
2.00%
0.00%
-2.0
0%
-4.0
0%
-6.0
0%
-8.0
0%
-10.0
0%
10.0
0%
100
80
60
40
20
120
-
01/09/2
010
01/05/2
010
01/01/
2010
01/09/2
009
01/05/2
009
01/01/
2009
01/09/2
008
01/05/2
008
01/01/
2008
01/09/2
007
01/05/2
007
01/01/
2011
R.V. Arb S&P 500 Opt. strategy

l Table 5. R2 between hedge fund and option strategies for different periods ofreturns
R2 Volatility Relative value arbitrage Equity market neutral Short bias
1-month returns 0.05 0.43 0.01 0.86
3-month returns 0.35 0.82 0.55 0.88
Figure 8 illustrates the regression analysis of the 3-month hedge fund returns on op-
tions strategies returns, the R2 results and the statistical significance of the variables.
n Figure 8. Regression of hedge fund on options strategies for quarterly returns,fitted model and error distribution
VOLATILITY
Coefficient Std. error t-value t-prob Part. R2
OPC_3 1.45161 0.5207 2.79 0.015 0.3570
sigma 2.89923 RSS 117.677419
log-likelihood -36.7333 DW 1.79
no. of observations 15 no. of parameters 1
mean(VOL_3) -0.0666667 var(VOL_3) 12.1956
RELATIVE VALUE
Coefficient Std. error t-value t-prob Part. R2
Opc_3 1.11861 0.1193 9.37 0.000 0.8222
sigma 2.7937 RSS 148.290146
log-likelihood -48.4132 DW 2.15
no. of observations 20 no. of parameters 1
mean(RV_3) -0.2 var(RV_3) 41.66
41
A E S T I M AT I OT I E B
On asset m
anagers, hedge funds and ETFs. Camarero Aguilera, S. and López Pascual, J.
AESTIM
ATIO, TH
EIEB
INTERN
ATION
AL
JOU
RNA
LO
FFIN
AN
CE, 2017. 14: 26-45
VOL_3 Fitted5
0
-5
0 1
VOL_3 x Fitted5
0
-5
0 2-2-4 0
++ +
++
+++ +
+
+
+
++
+
1
0
-10
10
-20
RV_3 Fitted
-5 0 5-20 -15 -10
0
-10
10
-20
RV_3 x Fitted
+ ++ ++ +
++++
++
+ +
+
+
+ +
+

n 6. Conclusions
The asset management industry is going through a profound restructuring process
driven by the growing prominence of passive strategies and ETFs in a low return
world. The industry plays a vital role in helping institutions and individuals meet
their future financial needs, and in a low interest rate, low return world, this is more
important than ever. Finding solutions to an ever-increasing demand for income
remains a critical challenge for the industry.
In this context, the traditional asset management and hedge fund industries need
to evolve and to adapt to the new environment that requires more transparency,
new lower fees and new pay fee structures with more robust set ups.
Particularly relevant is the fee problem. The returns generated by the traditional
asset management industry, and especially hedge funds, do not justify the current
fees charged.
This issue has become very obvious with the appearance of new, cheaper funds such
as ETFs and robo-advisors. On the one hand, it is true that an asymmetric and “ex-
cessive” reward for the risk taken leads to the assumption of disproportionate risks
and to a non-efficient allocation of resources; on the other hand, the current low
return/low volatility/high correlation investment climate favours low-cost index-
tracking funds over active managers.
We have shown in this document how this trend is beginning to affect niche sectors
such as the alternative space occupied by hedge funds. There are important limita-
tions and considerations to bear in mind when investing in hedge funds. Two of the
inputs in portfolio construction are dynamic and non-linear. When markets sell off,
correlations tend to increase. When combined with a spike in volatility, this creates
much more tail risk than originally perceived.
In addition, we have provided an approach using financial options that enables us
to identify the relevant risk factors which explain hedge fund strategies’ returns and
risks. This technique allows us to replicate return distributions and account for the
non-linearity and non-normality of these returns, outperforming most of the hedge
fund absolute returns strategies if we assume lower commissions. Therefore, we
can see no justification for the large fees still being charged across large parts of
the hedge fund industry. At the same time, we consider that this type of approach
could form the basis for the development of a new phase of “smart beta” funds
that could be applied to yet more strategies, for which we see an enormous growth
opportunity.
42
A E S T I M AT I OT I E B
On
asse
t man
ager
s, he
dge
fund
s an
d ET
Fs. C
amarero A
guilera, S. and
Lóp
ez Pascual, J.
AES
TIM
ATIO
, TH
EIE
BIN
TERN
ATIO
NA
LJO
URN
AL
OF
FIN
AN
CE,
2017
. 14:
26-4
5
Our finding corroborates the consensus that traditional asset managers and hedge funds
will be challenged by the growing weight of passive funds, and this trend will eventually
affect even the most sophisticated strategies. Nonetheless, there is still a place for active
management. The market cannot be entirely made up of index funds with no discrimi-
nation; this would ultimately lead to a massive misallocation of capital. For now, how-
ever, restructuring is called for and there will be continued pressure on the whole sector
to move towards efficiency improvements, more transparency and fee reduction.
Efficiency, fee reduction and improvement in pay structures will translate into bigger
returns for investors and a better alignment between investment managers and in-
vestors, contributing to a more efficient allocation of resources and promoting funds
that offer real value to investors, whether through outperformance, diversification or
any other means.
Transparency is an important factor in reliability, corporate governance and risk man-
agement, and facilitates the work of asset allocators/investors, overcoming important
mathematical complexity generated in some of the most sophisticated strategies.
Managers need to realize that drawdowns matter less if they can be explained and
they are holding true to their stated strategy, as an ETF does.
“It is not often that a man can make opportunities for himself. But he can put himself in such
shape that when or if the opportunities come he is ready”. (Theodore Roosevelt)
n References
n Amenc, N. and Martellini, L. (2002). Portfolio Optimisation and Hedge Fund Style Allocation Decisions, Journal of
Alternative Investments, 5(2), pp. 7-20.
n Amin, G. and Kat, H. (2003). Hedge Fund Performance 1990–2000. Do the ‘‘Money Machines’’ Really Add Value?,
Journal of Financial and Quantitative Analysis, 38(2), pp. 1-24.
n Brooks, Ch. and Kat, H.M. (2002). The Statistical Properties of Hedge Fund Index Returns and their Implications
for Investors, Journal of Alternative Investments, 5, pp. 26-44.
n Camarero Aguilera, S. (2013): Medidas de riesgo para analizar Hegde Funds, Funds People magazine, June.
n Camarero Aguilera, S. (2014). Analysing hedge funds risk measures and portfolio construction, Doctoral Thesis,
University Rey Juan Carlos, Madrid.
n Camarero Aguilera, S. and López Pascual, J. (2013): Analysing hedge fund strategies through the use of an option
based approach, Revista Española de Financiación y Contabilidad, Vol. XLII, 158, pp. 167-186.
43
A E S T I M AT I OT I E B
On asset m
anagers, hedge funds and ETFs. Camarero Aguilera, S. and López Pascual, J.
AESTIM
ATIO, TH
EIEB
INTERN
ATION
AL
JOU
RNA
LO
FFIN
AN
CE, 2017. 14: 26-45

n Financial Conduct Authority (2016). Asset Management Market Study, MS15/2.2. Available at https://www.
fca.org.uk/publication/market-studies/ms15-2-2-interim-report.pdf.1
n López Pascual, J. and Cuellar, R.D. (2007).The challenges of launching, rating and regulating funds of hedge funds,
Journal of Derivatives & Hedge Funds, 13(3), pp. 247-262.
n Markowitz, H. (2012). The “Great confusion” concerning MPT, AESTIMATIO, the IEB International Journal of
Finance, 4, pp. 8-27.1
n Mitchell, M. and Pulvino, T. (2001). Characteristics of Risk and Return in Risk Arbitrage, Journal of Finance, 56(6),
pp. 2135-2175.
n Preqin (2016). 2016 Preqin Global Hedge Fund Report. Available at www.prequin.com.1
44
A E S T I M AT I OT I E B
On
asse
t man
ager
s, he
dge
fund
s an
d ET
Fs. C
amarero A
guilera, S. and
Lóp
ez Pascual, J.
AES
TIM
ATIO
, TH
EIE
BIN
TERN
ATIO
NA
LJO
URN
AL
OF
FIN
AN
CE,
2017
. 14:
26-4
5

n
45
A E S T I M AT I OT I E B
On asset m
anagers, hedge funds and ETFs. Camarero Aguilera, S. and López Pascual, J.
AESTIM
ATIO, TH
EIEB
INTERN
ATION
AL
JOU
RNA
LO
FFIN
AN
CE, 2017. 14: 26-45