aes bioflux - advances in environmental sciences bioflux, 2011, volume 3, issue 3. 245 (estebenet...
TRANSCRIPT

AES Bioflux, 2011, Volume 3, Issue 3. http://www.aes.bioflux.com.ro 243
AES BIOFLUX Advances in Environmental Sciences - International Journal of the Bioflux Society Geographic phenetic variation in the golden apple snail, Pomacea canaliculata (Ampullariidae) based on geometric approaches to morphometrics Mark Anthony J. Torres1, Ravindra C. Joshi2, Leocadio S. Sebastian2, and Cesar G. Demayo1
1Department of Biological Sciences, College of Science and Mathematic,
MSU-IIT, Iligan City, Philippines. 2Philippine Rice Research Institute, Science City of Muñoz, Nueva Ecija, Philippines.
Corresponding autor: [email protected]
Abstract. This study was conducted to describe and explain morphological variation within and among populations of the golden apple snail (Pomacea canaliculata) using the geometric morphometric approach. The foundation of this research is to describe patterns of morphological variation in both natural and managed populations. These descriptions are then used to frame hypotheses on the roles natural selection and geographical isolation play in evolution. Results showed variability within and among populations of the pest. Results also showed a wide range of variability within, and among populations of the golden apple snail and that geography alone could not explain such variability. The results of this study are discussed in the light of how variation within populations is translated into differences between populations. Key words: geometric morphometrics, Pomacea, landmarks, golden apple snail.
Introduction. The mechanism by which variation within populations is translated into differences between populations, species, and higher taxa is one of the central problems in evolutionary biology. According to neo-Darwinian theory, population processes such as gene flow, genetic drift, mutation and natural selection can alter the frequencies of phenotypes within populations (Lee 2002; Balanyà et al 2003). Combined with long periods of time, these processes provide a sufficient explanation for the divergence between related groups.
Invasive species exhibit wide morphological differences both within and among populations even when populations of invasive species are assumed to be genetically depauperate as its gene pool is reduced by strong founder effects (Balanyà et al 1994; Allendorf & Lundquist 2003; Huey et al 2005). In some cases, there can be considerable differences which are comparable to interspecific differences in many groups of organisms. As invasive species spread through a new environment, they encounter novel selection pressures and challenges that permit population differentiation expressed as variability in morphologic and genetic characteristics (Gharrett & Thomason 1987; Gilchrist & Partridge 1999; Gilchrist et al 2001; García-Ramos & Rodríguez 2002; Huey et al 2005). Thus, invasive species provide excellent opportunity to study the evolution of phenotypic differences using contemporary populations in which phenotypic properties and ecological context can be assessed (Hendry & Quinn 1997; Thompson 1998; Trussel & Etter 2001). Also, the extended geographical range of invasive species permit placement of process at the population level into a larger evolutionary context.
This introduced invasive species, the golden apple snail (GAS; Pomacea canaliculata) provides a good model for inferring the mechanisms behind population differentiation. This organism is believed to be comprised of a complex of morphologically divergent populations that occur in ecologically diverse habitats. This species is abundant in both natural and managed systems in the Philippines, and large samples can be

AES Bioflux, 2011, Volume 3, Issue 3. http://www.aes.bioflux.com.ro 244
collected for use in population-level analysis. Populations of this organism exhibits striking phenotypic differences that are sometimes correlated with habitat type.
In recent years, the extreme morphological variation exhibited by introduced invasive species has attracted the interest of pest management practitioners. Studies on morphological disparities of traits of pests are rapidly yielding exciting insights into the complex nature of the organisms.
A wide array of specialized tools to investigate morphological variation in organisms is rapidly maturing. Recently, a general analytical framework for assessing patterns of phenotypic change known as geometric morphometrics (GM) has been gaining recognition worldwide (Rohlf 1993; Rao & Suryawanshi 1996; Rohlf 2001; Adams et al 2004; Slice 2007). Geometric morphometrics provides a way of separating the shape and size components of biological form to make it easier to conduct studies on determining trends in character evolution (Dryden & Mardia 1998). In fact, the methods of GM have already found wide applications in studies conducted to determine, describe and measure the extent of spatial and temporal changes in populations of organisms (Bruner 2004). The method of GM models the shapes of biological structures as geometric configurations of a set of landmarks that are collected from two-dimensional images of the form.
The present study concerns the description and explanation of morphological variation within and among populations of P. canaliculata using the geometric morphometric approach. The foundation of this research is to describe patterns of morphological variation in natural populations. These descriptions are then used to frame hypotheses on the roles natural selection and geographical isolation play in evolution. Morphological variation among populations can also be used to identify candidate populations for the study of novel genetic variation.
This study concerns morphologic variability in the golden apple snail to address pertinent problems in the evolution and spread of invasive species. The objectives of this study is to determine geographic phenetic variation in the golden apple snail, P. canaliculata (Ampullariidae) using traditional and geometric approaches to morphometrics.
The golden apple snail was used as model in addressing pertinent problems in the evolution and spread of invasive species. History tells us that these organisms have been repeatedly introduced around the world, either by accident or by intention. The populations of each taxon served as natural experiments that provided opportunity to explore the evolutionary roles of geography and habitat. Establishment of the geographic patterns of natural populations of the golden apple snail will provide an evolutionary baseline that can be used in the design of effective management strategies against this invasive pest.
The golden apple snail is of equal interest as its taxonomy is poorly understood considering the immense diversity in life histories and phenotypic characteristics within and among populations (Cazzaniga 2006). As they continue to threaten rice production in the Philippines, population studies such as this provides a solid and logical way to describe the extent of phenotypic plasticity and diversity of GAS in the Philippines. Information from this study can be used in the formulation of detailed ecological and management strategies against this pest.
The methods of geometric morphometrics specifically landmark and outline based analysis in this study to describe differences in selected morphological characters within and between populations of P. canaliculata. Analysis of the patterns of distribution within populations will be analyzed using relative warps and principal component analysis. Material and Methods. Adult snails were collected from different environmental regimes: canals, streams, rivers, lakes, ponds, sewerage areas, and agricultural farms with or without history of molluscide or any agricultural chemical applications. The snails were identified using available literatures and monographs (Baoanan & Pagulayan 2006; Cowie et al 2006; Howells et al 2006). Only P. canaliculata were processed and digitized for the morphometric analysis. The snails were sexed through examination of the presence of the albumin gland and penis sheath, which are characteristic of males

AES Bioflux, 2011, Volume 3, Issue 3. http://www.aes.bioflux.com.ro 245
(Estebenet & Martin 2003). Images of the shells were captured using a digital camera. The shells were positioned in such a way that the columella is at 90 of the x-axis in the apertural view and in the orientation in which the apex is visible. In this way, measurement error was minimized. Photographs of the top of the shells were also captured. Considerable care was observed to photograph the shells in the same position. Fortunately, it was possible to detect bad images of the top. Good images had the top pointing straight at the camera. Images where the shell top was pointing to some other directions (i.e. left, right etc) were discarded. About three to four images were captured for each shell and the best photographs were used in the analyses.
Landmark selection and digitization. The landmarks were carefully selected for it to provide a comprehensive summary of morphology and shape disparities among the samples. Some of the landmarks represent distinct anatomical loci that were homologous from one form to the other. Some of the points represented conserved topological positions relative to other landmarks including those that lie on junctions between two structures. The landmarks were digitized using the TpsDig ver. 2 (Rohlf 2004a).
The landmarks used in this study fall into three classes. Type 1 landmarks were those located on discrete juxtapositions of structures such as junctions of the spires in the GAS shell. Type 2 landmarks that represent points at maximal curvatures were also collected such as those that lie in some parts of the GAS shell. Helping points or Type 3 landmarks include extremal points or points identified (or constructed) by reference to other features/landmarks such as points that are found furthest from another structure or point, intersection or division of hypothetical planes or the top of the shell.
The shell of the apple snail is spherical or heliciform or elongate ovate shell form having three to five sutures with wide oval or circular aperture. It has no siphonal canal and the outer lip of the aperture is not reflected. The shapes of the curves in the shell of the snails provide important biological information but lack obvious points at which they should be samples. Such points were regarded as “deficient” or “semi” landmarks in recognition of the fact that the dimensionality of their coordinate locations exceeds that of their biologically relevant content (Bookstein 1991). To solve this problem, “semi” landmarks were allowed to slide in the preprocessing step along directions of arbitrary variability to minimize bending energy using the sliding-landmark support in the tpsRelw software (Bookstein 1997).
A total of 14 landmarks were used to summarize the shape of the shell (Fig. 1a). The first three landmarks are located on the whorls of the shell. Landmarks 4 and 5 describe the shape outer whorl.
These landmarks were treated as pseudolandmarks and were allowed to slide during the preprocessing stage to minimize bending energy. Landmarks 6 to 14 define the outline of the shell opening. Of these, landmarks 7 to 11 are located on the outer lip while the landmarks 13 and 14 are found on the inner lip. Most of these landmarks were as pseudolandmarks.
Thirteen landmarks were used in the analysis of the shape of the shell top (Fig. 1b). Of these, only three are true landmarks which include 1 and 8 on the shell opening and 13 on the last whorl of the shell top. The other landmarks were treated as pseudolandmarks and were also allowed to slide during the preprocessing stage to reduce bending energy.
Landmark-based analysis. The landmarks digitized using the TpsDig ver. 2 (Rohlf 2004a) were superimposed using the generalized Procrustes analysis in TpsRelw, ver. 1.41 (Rohlf 2004b). This procedure was used to standardize the size of the structures and optimize their rotation and translation to ensure minimal distances between corresponding landmarks (Bookstein 1991; Dryden & Mardia 1998; Zelditch et al 2004; Neustupa & Šťastný 2006). The residuals are in the form of shape variables that were used in the succeeding analysis.

AES Bioflux, 2011, Volume 3, Issue 3. http://www.aes.bioflux.com.ro 246
Fig. 1. Designated landmarks and pseudolandmarks on the (a) shell and (b) top.
Visualizing shape differences. Shape differences between and among
configurations were depicted in many ways in this study. Landmark-based analysis the thin-plate splines (TPS) was used to illustrate shape differences between and among populations of the organisms. The deformation grids are based on the classic D’ Arcy Thompson transformation grids. These grids take into account information regarding shape differences at discrete points (landmarks) and from those data interpolate shape differences between those points. Phenetic relationships of the populations based on the shapes of the structures. The uniform (affine) and non-uniform (non-affine) components of shape variability were subjected to Discriminant Function analysis. Then the group centroids for each function were used in determining the phenetic relationships of the populations using non-metric multidimensional scaling (Hammer et al 2001).
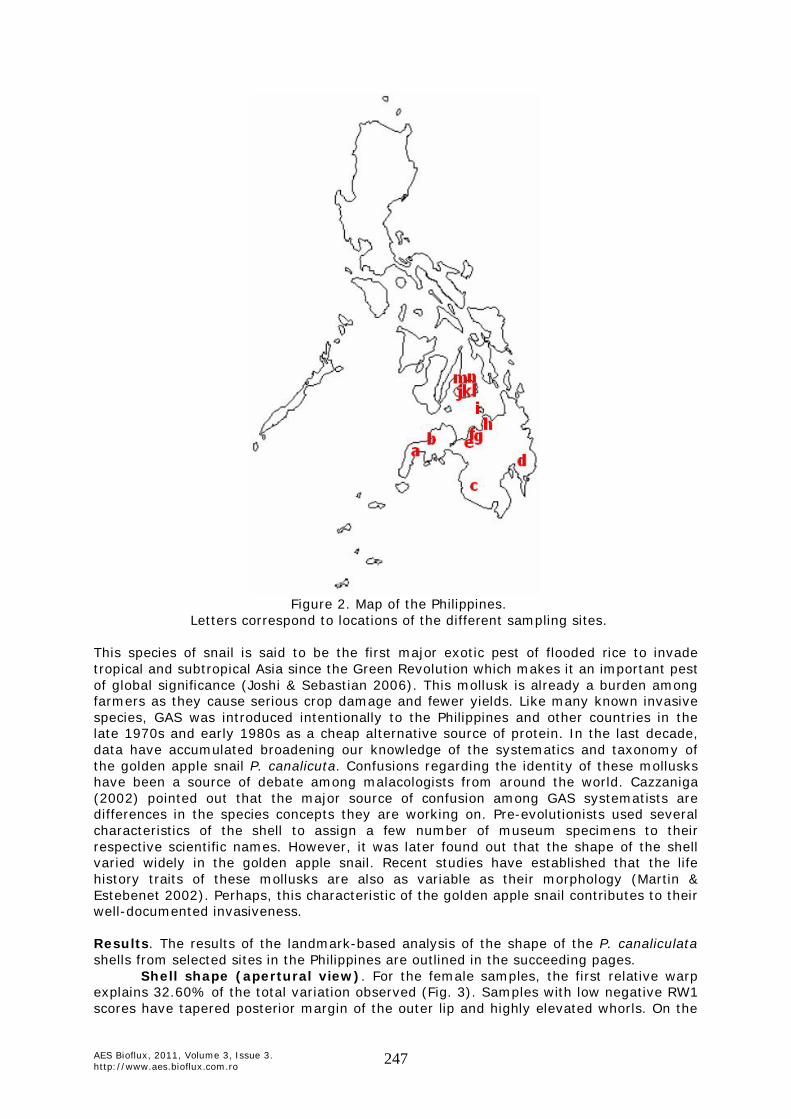
This part of the paper present results of traditional and geometric morphometric analyses aimed at an assessment of the extent and spatial distribution of the phenotypic variation within and among populations of the golden apple snail, P. canaliculata. Table 1 is a summary of the number of samples collected from the sampling sites. Island populations were included to test the role of geography in population differentiation. A map is provided in Figure 2.
Table 1
Frequency distribution of golden apple snails, P. canaliculata used in this study
APERTURAL TOP SITE HABITAT CODE F M F M
Balangao, Zamboanga Sibugay ricefield a 71 12 61 8 Katipunan, Zamboanga del Norte ricefield b 106 49 95 47 Datu Abdullah Sangki, Sharif Kabungsuan ricefield c 122 25 134 30 Digos, Davao del Sur river d 15 5 15 5 Kapatagan, Lanao del Norte ricefield e 172 96 0 0 Lawis, Iligan City stream f 119 8 118 13 Kiwalan, Iligan City canal g 105 31 95 32 Claveria, Misamis Oriental ricefield h 29 21 44 34 Poblacion, Camiguin canal i 62 44 66 43 Agapi, Loay, Bohol ricefield j 36 8 33 8 Agapi, Loboc, Bohol ricefield k 135 91 138 90 Gotozon, Bohol ricefield l 58 61 53 60 Quinoguitan, Bohol ricefield m 161 37 151 35 Ondol, Bohol ricefield n 146 57 144 55
AES Bioflux, 2011, Volume 3, Issue 3. http://www.aes.bioflux.com.ro 247
Figure 2. Map of the Philippines.
Letters correspond to locations of the different sampling sites.
This species of snail is said to be the first major exotic pest of flooded rice to invade tropical and subtropical Asia since the Green Revolution which makes it an important pest of global significance (Joshi & Sebastian 2006). This mollusk is already a burden among farmers as they cause serious crop damage and fewer yields. Like many known invasive species, GAS was introduced intentionally to the Philippines and other countries in the late 1970s and early 1980s as a cheap alternative source of protein. In the last decade, data have accumulated broadening our knowledge of the systematics and taxonomy of the golden apple snail P. canalicuta. Confusions regarding the identity of these mollusks have been a source of debate among malacologists from around the world. Cazzaniga (2002) pointed out that the major source of confusion among GAS systematists are differences in the species concepts they are working on. Pre-evolutionists used several characteristics of the shell to assign a few number of museum specimens to their respective scientific names. However, it was later found out that the shape of the shell varied widely in the golden apple snail. Recent studies have established that the life history traits of these mollusks are also as variable as their morphology (Martin & Estebenet 2002). Perhaps, this characteristic of the golden apple snail contributes to their well-documented invasiveness. Results. The results of the landmark-based analysis of the shape of the P. canaliculata shells from selected sites in the Philippines are outlined in the succeeding pages.
Shell shape (apertural view). For the female samples, the first relative warp explains 32.60% of the total variation observed (Fig. 3). Samples with low negative RW1 scores have tapered posterior margin of the outer lip and highly elevated whorls. On the

AES Bioflux, 2011, Volume 3, Issue 3. http://www.aes.bioflux.com.ro 248
other hand, those with high positive scores along the first relative warp axis have narrower opening relative to the body whorl. Also, these samples are seen to have less pronounced whorls. The results of the analysis of the distribution of the populations along the RW axes showed that the samples collected from a sewerage system in Poblacion (Camiguin, i) had higher mean positive RW1 score. The second relative warp axis explains 26.38% of the total variance and describes differences in the shape of the shell opening and the whorls. A high positive RW2 score means that a shell has less pronounced whorls in the anterior portion of the shell and more globose shell opening. On the other hand, a sample with a low negative RW2 score has shell with more pronounced whorls and with the anterior portion of the inner lip depressed towards the center of the shell opening. As with the RW1 axis, the results showed considerable overlaps in the distribution of the RW2 scores across all populations. The third relative warp explains 15.33% of the total variance in shape. The female samples from Balangao (Zamboanga Sibugay, a) had higher RW3 scores suggestive of having a deeply depressed anterior inner lip and less pronounced whorls.
For the male samples, the first relative warp (RW1) explains 40.19% of the variance in shape and explains variation in the breadth of the shell opening (Fig. 4). Although one can find differences in the mean RW1 scores across all populations of GAS, there are considerable overlaps in their ranges. The second relative warp (RW2) explains differences in the shape of the posterior margin of the outer lip and accounts for 27.26% of the total variation. Noteworthy is the narrow range of RW2 scores for the Digos (Davao del Sur, d) population. The snails from this area were collected from a river. Analysis of the distribution of the populations along the third relative warp axis (RW3) showed that the samples from a ricefield in Balangao (Zamboanga Sibugay, a) have the anterior portion of the inner lip depressed towards the center of the shell opening. The stream population from Lawis (Iligan City, f) also had high RW3 scores. The third relative warp accounts for 8.06% only of the total shape variation. The range of variability in the shape described by RW3 is minimal for the Digos (Davao del Sur, d) population.
The same observation regarding minimal variation in the shapes of the shell in the samples from Digos (Davao del Sur, d) is true for the fourth relative warp (RW4). The RW4 accounts for 5.8% of the total variance in shape space. This relative warp describes differences in the shape of the body whorl. Samples with low negative RW4 scores have broader broader body whorl in contrast with those having higher positive scores.
Comparison of the mean shapes among the female GAS populations showed that the mean shape of almost all populations are highly similar except for that of Balangao (Zamboanga Sibugay, a) which has the anterior portion of the lip depressed towards the center of the shell opening (Fig. 5). The mean shape of the canal population from Poblacion (Camiguin, i) also differed from the rest of the populations with respect to the positions of the landmarks in the posterior portion of the outer lip.
The average shapes of the shell for the male samples are similar with that of their female counterparts (Fig. 6). The male samples from Balangao (Zamboanga Sibugay, a) also had the anterior portion of the inner lip depressed towards the center of the shell opening.
The results showed that there are no observable differences in the average shapes between the two sexes per population.

AES Bioflux, 2011, Volume 3, Issue 3. http://www.aes.bioflux.com.ro 249
Fig. 3. Summary of the geometric morphometric analysis showing the consensus morphology
(uppermost panels) and the variation in shell morphology among the female samples produced by the first four relative warps explaining more than 5% of the total shape variation (RW1 = 32.60%, RW2 = 26.38%, RW3 = 15.33%, RW4 = 8.23%). The distribution of the RW2 scores followed that of a normal curve (W = 0.9982, P = 0.1488, Shapiro-Wilks W test). The rest of the RW scores deviated from normality (W < 0.9924, P < 0.05, Shapiro-Wilks W test).
Fig. 4. Summary of the geometric morphometric analysis showing the consensus morphology
(uppermost panels) and the variation in shell morphology among the male samples produced by the first four relative warps explaining more than 5% of the variance (RW1 = 40.19%, RW2 = 27.26%, RW3 = 8.06%, RW4 = 5.8%). The distribution of the RW1 and RW4 scores followed that of the normal curve (W > 0.9972, P > 0.4782, Shapiro-Wilks W test). On the other hand, the distribution of the RW2 and RW3 scores deviated from normality (W < 0.9935, P < 0.05, Shapiro-Wilks W test).

AES Bioflux, 2011, Volume 3, Issue 3. http://www.aes.bioflux.com.ro 250
Fig. 5. The thin-plate splines illustrating the changes in the shape of the shell obtained from
overall consensus of average configurations of each population of the golden apple snail (all females). For abbreviations see Table 5.
Fig. 6. The thin-plate splines illustrating the changes in the shape of the shell obtained from
overall consensus of average configurations of each population of the golden apple snail (all males). For abbreviations see Table 1.
The relationship of the GAS female populations in three-dimensional morphospace based on the shape of the shell is summarized in Figure 7a. The plot was derived from nonmetric multidimensional scaling of group centroids after discriminant function analysis of the uniform and non-uniform transformations. Results showed that the four populations from Bohol clustered together. These include Ondol (n), Quinoguitan (m), Agapi Loay (j), and Agapi Loboc (k). These areas are geographically close populations. Gotozon (Bohol, l) is also plotted close to the other Bohol populations. The canal population from Poblacion (Camiguin, i) is shown to have a different overall shape when compared to the other populations. Considerable variations in the positions of the ricefield populations in the three-dimensional morphospace can be observed.
Fig. 7. Relationships of the GAS (a-female, b- male) populations in three-dimensional morphospace
produced by nonmetric-multidimensional scaling of sample variation decomposed into uniform and non-uniform partial warps (PW).

AES Bioflux, 2011, Volume 3, Issue 3. http://www.aes.bioflux.com.ro 251
The plot for the male samples showed minor differences in the relationships of the Bohol populations with the Agape Loay (j) now plotted close to the Gotozon (l) (Fig. 7b). The samples from Poblacion (Camiguin, i) differed in shape from the rest of the samples. Considerable variation in the position of the ricefield populations can still be observed.
Whorl shape differences (top view). The shapes of the whorls in the topmost portion of the shells were also compared using landmarks assigned at specific positions in the sutures, last whorl and in the shell opening.
For the female samples, the results of the relative warp analyses showed that the first relative warp (RW1) separates the Balangao (Zamboanga Sibugay, a) population from the others (Fig. 8). The other populations have higher RW1 scores which means that most of the samples collected have body whorls that increases fast in diameter from the shell top to the shell opening. The opposite is true for the Balangao (Zamboanga, a) samples where the body whorl decreases in diameter as it approaches the opening of the shell. The variation described by RW1 accounts for 43.78% of the total variation. The second relative warp (RW2) describes 18.73% or nearly half the variance associated with RW1. Considerable overlaps in the distribution of the RW2 scores can be observed. The same is true with the results of the analysis of comparing the RW3 scores of all populations. The fourth relative warp (RW4) explains 8.63% of the variation and describes the breadth of the whorls on the top most portion of the shell. The samples from Poblacion (Camiguin, i) differed from the other populations in having higher RW4 scores.
Fig. 8. Summary of the geometric morphometric analysis showing the consensus morphology
(uppermost panels) and the variation in the female shell (top view) morphology produced by the first four relative warps explaining more than 5% of the variance (RW1 = 43.78%, RW2 = 18.73%, RW3 = 15.09%, RW4 = 8.63%). The distribution of the RW2 to RW4 scores followed that of the normal curve (W > 0.998, P > 0.1721, Shapiro-Wilks W test). On the other hand, the distribution of the RW1 scores deviated from normality (W = 0.9698, P < 0.05, Shapiro-Wilks W test).
For the male population, the Balangao (Zamboanga Sibugay, a) population is seen to have higher RW1 scores when compared to the other populations. This population has characteristically narrower shell opening (Fig. 9). The variation ascribed by the first relative warp accounts for 39.28% of the total variation.
Differences in the RW2 scores of the male populations of GAS can be observed, however, there are overlaps in the distribution of the scores suggestive of similarities in

AES Bioflux, 2011, Volume 3, Issue 3. http://www.aes.bioflux.com.ro 252
the shape of the whorls ascribed to RW2. This relative warp accounts for 21.54% of the total variance in shape space and describes differences in the diameter of the first whorl and the breadth of the shell opening.
As for the third relative warp (RW3), a wide range of variability in the diameter of the first whorl with respect to the shell top can be observed. This relative warp accounts for 16.15% of the total variation in morphospace.
The fourth relative warp (RW4), also showed similarities in the shapes of the shell opening as indicated by the range of the scores. Samples with low negative scores have their body whorl increasing in diameter from the shell top towards the opening. This warp accounts for only 9.32% of the variation.
The mean shapes of each population with respect to the overall consensus configuration were reconstructed via thin-plate spline analysis (Fig. 10 & 11). Results showed that the Balangao (Zamboanga Sibugay, a) population could be differentiated from the other populations in having an average shape that has a narrower shell opening when viewed from the top. This is true for both the female and male populations.
Fig. 9. Summary of the geometric morphometric analysis showing the consensus morphology
(uppermost panels) and the variation in the male shell (top view) morphology produced by the first two relative warps explaining more than 5% of the total variance (RW1 = 39.28%, RW2 = 21.54%, RW3 = 16.15%, RW4 = 9.32%). The distribution of the RW1 scores deviated from normality (W = 0.979, P < 0.05, Shapiro-Wilks W test). The distribution of the RW2 to RW4 scores followed that of a normal curve (W > 0.995, P > 0.1439, Shapiro-Wilks W test).
Fig. 10. The thin-plate splines illustrating the changes in the shape of the shell (top view) obtained
from overall consensus of average configurations of each population of the golden apple snail (all females). For abbreviations see Table 5.

AES Bioflux, 2011, Volume 3, Issue 3. http://www.aes.bioflux.com.ro 253
Fig. 11. The thin-plate splines illustrating the changes in the shape of the shell (top view) obtained
from overall consensus of average configurations of each population of the golden apple snail (all females). For abbreviations see Table 5.
The relationships of the GAS populations were plotted in three dimensional spaces using the method of non-metric multidimensional scaling of the group centroids (Figure 12). Results clearly showed the separation of the Balangao (Zamboanga Sibugay, a) population from the rest of the sites in both sexes. The Bohol populations did not cluster together (j, k, l, m, n). Thus, geographically close populations show different morphologies along the second axis. Also, the ricefield populations are spread in both the female and male plot.
Fig. 12. Relationships of the GAS (a-female, b- male) populations in three-dimensional
morphospace produced by nonmetric-multidimensional scaling of sample variation in shell morphology (top) decomposed into uniform and non-uniform partial warps (PW).
The results show that the shell varies in shape and that this variation can be summarized in multidimensional space using relative warp analysis. The plot of the group centroids analyzed using nonmetric multidimensional scaling also suggest differences in shell morphology that cannot be attributed to allometric growth. However, the results of previous morphometric studies have shown that shell growth in P. canaliculata is positive for allometry, which was shown to result in shape dissimilarities when coupled with size differences among populations. Thus, care must be observed in the comparison of shell shape among populations of the golden apple snail. Estebenet & Cazzaniga (1998) demonstrated the existence of definite allometric growth in the shell of GAS, affecting among others the shell width, aperture width, ratio between the lengths of the spire vs. aperture length. Also, the overall shape becomes more globose and the aperture becomes wider during the course of ontogeny.
To determine whether the observed differences in shell shape are due to allometric growth, linear measurements were collected and analyzed. These include the height and width of the shell, maximum length and width of the shell opening and weight. These size measures were collected specifically to test if the shape differences observed between the Balangao (Zamboanga Sibugay, a) population is due to ontogenetic allometry or changes in the shape of the organism because of development. The different size measures are shown in Figure 13. Based on Fig. 13a, the height of the

AES Bioflux, 2011, Volume 3, Issue 3. http://www.aes.bioflux.com.ro 254
shell in Balangao (Zamboanga Sibugay, a) is similar with those from Claveria (Misamis Oriental, h). Two populations have higher mean shell height, namely Digos (Davao del Sur, d) and Lawis (Iligan City, f). The populations also varied with respect to the maximum width of the shell. The mollusks collected from the ricefield in Balangao (Zamboanga Sibugay, a) had relatively bigger shells as shown in comparable to those found in Lawis stream (Iligan City, f) Fig. 13b. This shows that there are no observable differences between GAS grown in different environmental regimes. The results also showed that the populations that shared similar shell shape characteristics differ in some of the linear measurements. The samples collected from Lawis stream (Iligan City, f) have longer and wider operculum when compared to the canal and ricefield populations. On the other hand, the samples collected from Bohol (i, j, k and l) have smaller-sized operculum comparable to the samples collected from the rice fields of Katipunan (Zamboanga del Norte, b) and Datu Abdullah Sangki (Sharif Kabungsuan, c). The plot of the weight of the shells in Fig.13e has a similar topology with the plot of the heights of the shell in Fig.13a. Thus, samples with longer shells weigh more than samples with shorter shells. The results showed that the populations that were grouped based on similarities of the shape of the shell varied in their weights.
All in all, the results showed that the variation in shell morphology of the Balangao (Zamboanga Sibugay, a) population could not be attributed to allometric changes as a result of ontogeny. Truly, there must be a genetic basis behind the observed differences in shell shape. According to Cazzaniga (2006), shell shape remains recognizable when snails from dissimilar sources are reared under homogenous laboratory conditions, which is a strong indication of a genetic basis for the observed differences. The separation of the Balangao (Zamboanga Sibugay, a) in the plots suggest of possible genetic differentiation among the populations. In some cases, geographically close populations were also plotted close in the scatter plot. Shell shape, however, as with any other phenotype is a product of the interaction between the genetic architecture of the individual and the environment. Thus, one should not discount the influence of environmental conditions in brining about differences in shell shape. There might be a strong environmental influence in shell shape considering that the shell shape of laboratory snails differs from that of their field counterparts (Cazzaniga 2006). Also, significant shell shape differences were observed between snails from contrasting types of water bodies. Also, lotic and lentic populations have established differences in shell shape (Estebenet et al 2006). The same author concluded that environmentally based variation of shell shape overrides the genetically based variation that would result from isolation or genetic drift resulting to widely overlapping ecophenotypic morphs that show an almost continuous variation.
Although there is a general consensus that shell differences in the golden apple snail are due mostly to cumulative environmental effects, Estebenet et al (2006) remarked that the observed difference could also arise because of differences in varying reproductive behaviors that has a large genetic basis. Thus, the use of geometric morphometric analysis should be done in future studies to determine the limits of shell shape variation due to differences in genetically based reproductive behaviors. This suggests for a total evidence analysis in the study of the extent of diversity in this “species” of mollusk.
Further tests must be conducted to determine heritability of shell shape differences. This can be done to test how much the genes contribute to observable differences in shell shape. This can be easily done as golden apple snails can be reared in laboratory conditions.
Studies on the extent of variability of invasive species are very important as these organisms contribute to the continuing decline in biodiversity as well as compete with man as most are pests and weeds of agricultural systems.
It is within the framework of variability as a fundamental and basic characteristic of life that this study was conducted. Specifically, this study was conducted to describe patterns of morphological differentiation in the invasive species, the golden apple snail.

AES Bioflux, 2011, Volume 3, Issue 3. http://www.aes.bioflux.com.ro 255
A review of the literature revealed that economics was central to the cause of the introduction of the species examined. The golden apple snail was introduced to the Philippines as cheap alternative source of protein and alternative livelihood for the people.
Fig. 13. Box-and-whisker plots showing differences among the GAS populations based on the
following characters: (a) shell height (b) shell width (c) maximum length of the shell opening (d) maximum width of the shell opening and (e) weight in grams. See table 1 for references to the codes.
Results for the golden apple snail showed geography contributes in shaping the structure of the populations. There must be a reason behind the wide variation in the phenotypes of rice field populations as these are exposed to varying selection pressures in the form of molluscides etc. Detailed examination of how populations of the golden apple snail respond to such selection pressure should be done.
The practical importance of determining the nature of variability in populations of this species lies in the fact that inadequate taxonomic knowledge of target pest is one of the reasons for failure of management programs. Consequently, the lack of awareness of the differences between and among populations may cause added problems in formulating guidelines and policies against pests and weeds. Conclusions and Recommendations. The results of the current study strongly suggest the existence of morphological differences in populations of P. canaliculata. The existence of morphological differentiation within, among, and between populations of indicates possible genetic differentiation. As to the argument whether population differences indicate speciation remains to be further investigated. Are the variations observed an indication of the existence of infraspecific categories or geographical races? More data on important variables such as environmental heterogeneity and sample position within the population’s distribution should be further explored.
Are the variations in the shell shape an indication of phenotypic plasticity in the species? Are the variations observed due to the ability of an organism with a given genotype to change its phenotype in response to changes in the environment? Many cases of such plasticity express several highly morphologically distinct results.

AES Bioflux, 2011, Volume 3, Issue 3. http://www.aes.bioflux.com.ro 256
Organisms of fixed genotype may differ in the amount of phenotypic plasticity they display when exposed to the same environmental change. Hence phenotypic plasticity can evolve and be adaptive if fitness is increased by changing phenotype.
There is really a need for more studies that will involve the determination of the genetic basis of variations observed among the local populations of the golden Apple snail. There are questions also as to how can these variations be maintained? Are the variations due to multiple niche polymorphism, or mutation which is considered to be sufficient to maintain observed levels of genetic variance in polygenic characters? Or are the populations have reduced recombination where there seem to be a high level of distinctness of the various populations?
The reasons for the existence of variations and the degree to which they represent are still unknown. Genetically-based geographic differences in morphometric characters including the relative contribution of environmental and genetic components to geographic variations in such morphometric characters are also not known yet.
It is recommended that more genetic and behavioral evidences be accumulated to support the species level status of the morphometric groups, and more can be done to investigate the evolutionary barriers among the populations of this species. Careful scrutiny of morphological and genetic divergence in this species should be done and continuous genetic sampling and analysis should be pursued. This is because the patterns of covariation between morphology and molecules are not often uniform. In some organisms, it seems that high levels of genetic divergence do not necessarily predict clear-cut morphological divergence, just as clear-cut levels of morphological divergence do not necessarily indicate high levels of genetic distance. It will also be very important to sample more individuals across their geographic ranges to have a better understanding of patterns of intra- and inter-populational variation. Although the advent of geometric morphometrics continues to advance out knowledge of the extent of diversity in organisms, molecular methods should also be used to uncover cryptic genetic lineages.
There is also a need to assess how control programs such as insecticide applications, biocontrol agents, and other practices would affect the genetic structure of the pest populations. Comparison of manipulated populations with natural ones would help in determining how number reduction, or suppression, influences variability. Ideally, populations should be surveyed before; during and after control practices have been applied. Acknowledgement. The authors would like to acknowledge the support of the Philippine Rice Research Institute (PHILRice)for the funding of this research. References Adams D. C., Rohlf F. J., Slice D. E., 2004 Geometric morphometrics: ten years of
progress following the “revolution.” Italian Journal of Zoology 71(1):5-16. Allendorf F. W., Lundquist L. L., 2003 Introduction: population biology, evolution, and
control of invasive species. Conservation Biology 17:24-30. Balanyà J., Segarra C., Prevosti A., Serra L., 1994 Colonization of America by Drosophila
subobscura: the founder event and a rapid expansion. Journal of Heredity 85:427-432.
Balanyà J., Serra L., Gilchrist G. W., Huey R. B., Pascual M., Mestres F., Solé E., 2003 Evolutionary pace of chromosomal polymorphism in colonizing populations of Drosophila subobscura: an evolutionary time series. Evolution 57:1837-1845.
Baonan Z. G., Pagulayan R. C., 2006 Taxonomy of golden apple snails (Ampullariidae). In: R.C. Joshi and L.S. Sebastian (eds.). Global advances in ecology and management of golden apple snails. Science City of Muñoz, Nueva Ecija: Philippine Rice Research Institute. pp. 25-36.
Bookstein F. L., 1991 Morphometric tools for landmark data: geometry and biology. Cambridge University Press, Cambridge.
Bookstein F. L., 1997 Landmark methods for forms without landmarks: Morphometrics of group differences in outline shape. Med Image Anal 1:225-243.

AES Bioflux, 2011, Volume 3, Issue 3. http://www.aes.bioflux.com.ro 257
Bruner E., 2004 Variability in facial size and shape among north and east African human populations. Italian Journal of Zoology 71(1):51-56.
Cazzaniga N. J., 2002 Old species and new concepts in the taxonomy of Pomacea (Gastropoda: Ampulariidae). Biocell 26(1):71-81.
Cazzaniga N. J., 2006 Pomacea canaliculata: Harmless and useless in its natural realm (Argentina). In: R. C. Joshi, L. S. Sebastian (eds.). Global advances in ecology and management of golden apple snails. Science City of Muñoz, Nueva Ecija: Philippine Rice Research Institute, pp. 37-60.
Cowie R. H., Hayes K. A., Thiengo S. C., 2006 What are apple snails? Confused taxonomy and some preliminary resolution. In: R. C. Joshi, L. S. Sebastian (eds.). Global advances in ecology and management of golden apple snails. Science City of Muñoz, Nueva Ecija: Philippine Rice Research Institute, pp. 2-24.
Dryden I. L., Mardia K. V., 1998 Statistical shape analysis. John Wiley & Sons, New York. Estebenet A. L., Cazzaniga N. J., 1998 Sex related differential growth in Pomacea
canaliculata (Gastropoda: Ampullariidae). Journal of Molluscan Studies 64:119-123.
Estebenet A. L., Martín P. R., 2003 Shell interpopulation variation and its origin in Pomacea canaliculata (Gastropoda:Ampullariidae) from Southern Pampas, Argentina. J Moll Stud 69:301-310.
Estebenet A. L., Martín P. R., Burela S., 2006 Conchological variation and its origin in Pomacea canaliculata and other South American Ampullaridae (Gastropoda, Architaenioglossa). Biocell 30(2):329-335.
García-Ramos G., Rodríguez D., 2002 Evolutionary speed of species invasion. Evolution 56:661—668.
Gharrett A. J., Thomason M. A., 1987 Genetic changes in pink salmon (Oncorhynchus gorbuscha) following their introduction into the Great Lakes. Canadian Journal of Fisheries and Aquatic Sciences 44:787-792.
Gilchrist A. S., Partridge L., 1999 A comparison of the genetic basis of wing size divergence in three parallel body size clines of Drosophila melanogaster. Genetics 153:1775-1787.
Gilchrist G. W., Huey R. B., Serra L., 2001 Rapid evolution of wing size clines in Drosophila subobscura. Genetica 112/113:273-286.
Hammer Ø., Harper D. A. T., Ryan P. D., 2001 PAST: Paleontological Statistics Software Package for Education and Data Analysis. Palaeontologia Electronica 4(1): 9pp. http://palaeo-electronica.org/2001_1/past/issue1_01.htm
Hendry A. P., Quinn T. P., 1997 Variation in adult life history and morphology among populations of sockeye salmon (Oncorhynchus nerka) within Lake Washington, WA, in relation to habitat features and ancestral affinities. Canadian Journal of Fisheries and Aquatic Science 54:74-84.
Howells R. G., Burlakova L. E., Karatayev A. Y., Marfurt R. K., Burks R. L., 2006 In: R. C. Joshi, L. S. Sebastian (eds.). Global advances in ecology and management of golden apple snails. Science City of Muñoz, Nueva Ecija: Philippine Rice Research Institute, pp. 73-112.
Huey R. B., Gilchrist G. W., Hendry A. P., 2005 Using Invasive Species to Study Evolution. In: Species invasions: insights into ecology, evolution, and biogeography. Edited by D. F. Sax, J. Stachowicz, and S.D. Gaines, Sinauer, Sunderland, MA, 2005, 495 pp.
Joshi R. C., Sebastian L. S., 2006 Global advances in ecology and management of golden apple snails. Nueva Ecija: Philippine Rice Research Institute, 588 pp.
Lee C. E., 2002 Evolutionary genetics of invasive species. Trends in Ecology and Evolution 17:183-189.
Martín P. R., Estebenet A. L., 2002 Inter-population variation of life-history traits in Pomacea canaliculata (Gastropoda: Ampullariidae) in Southwestern Buenos Aires Province, Argentina. Malacologia 44:153-163.
Mardia K. V., Bookstein F. L., Moreton I. J., 2000 Statistical assessment of bilateral symmetry of shapes. Biometrika 87:285-300.

AES Bioflux, 2011, Volume 3, Issue 3. http://www.aes.bioflux.com.ro 258
Neustupa J., Šťastný J., 2006 The geometric morphometric study of Central European species of the genus Micrasterias (Zygnematophyceae, Viridiplantae). Preslia 79: 401–417.
Rao C. R., Suryawanshi S., 1996 Statistical analysis of shape of objects based on landmark data. Proceedings of the National Academy of Science USA 93(22):12132-12136.
Rohlf F. J., 1993 A revolution in morphometrics. Trends in Ecology and Evolution 8(4):129-132.
Rohlf F. J., 2001 Comparative methods for the analysis of continuous variables: geometric interpretations. Evolution 55(11):21443-2160.
Rohlf F. J., 2004a TpsDig Version 2.0 – Department of Ecology and Evolution, State University of New York at Stony Brook, New York.
Rohlf F. J., 2004b TpsRelw Version 1.41 - Department of Ecology and Evolution, State University of New York at Stony Brook, New York.
Slice D. E., 2007 Geometric morphometrics. Annual Review of Anthropology 36:261-281. Thompson J. N., 1998 Rapid evolution as an ecological process. Trends in Ecology and
Evolution 13:329-332. Trussel G. C., Etter R. J., 2001 Integrating genetic and environmental forces that shape
the evolution of geographic variation in a marine snail. Genetica 112/113:321-337.
Zelditch M. L., Swiderski D. L., Sheets D. H., Fink W. L., 2004 Geometric morphometrics for biologists: a primer. Elsevier Academic Press, London.
Received: 30 August 2011. Accepted: 11 September 2011. Published: 23 September 2011. Authors: Mark Anthony J. Torres, Department of Biological Sciences, College of Science and Mathematic, MSU-IIT, Iligan City, Philippines; [email protected] Ravindra C. Joshi, Philippine Rice Research Institute, Science City of Muñoz, Nueva Ecija, Philippines. Leocadio S. Sebastian, Philippine Rice Research Institute, Science City of Muñoz, Nueva Ecija, Philippines. Cesar G. Demayo, Department of Biological Sciences, College of Science and Mathematic, MSU-IIT, Iligan City, Philippines. How to cite this article: Torres M. A. J., Joshi R. C., Sebastian L. S., Demayo C. G., 2011 Geographic phenetic variation in the golden apple snail, Pomacea canaliculata (Ampullariidae) based on geometric approaches to morphometrics. AES Bioflux 3(3):243-258.