aerosols and climate : uncertainties and the need for
TRANSCRIPT

aerosols and climate :uncertainties
and the need for standardization
Frank Raes, Jean-Philippe Putaud, Annette Borowiak

• Set the stage for Workshop that aims at developing a cross academic, industry, public stakeholder and government outlook on key aerosol metrology issues critical to furthering our understanding of aerosols in the climate theatre
From the letter of invitation:
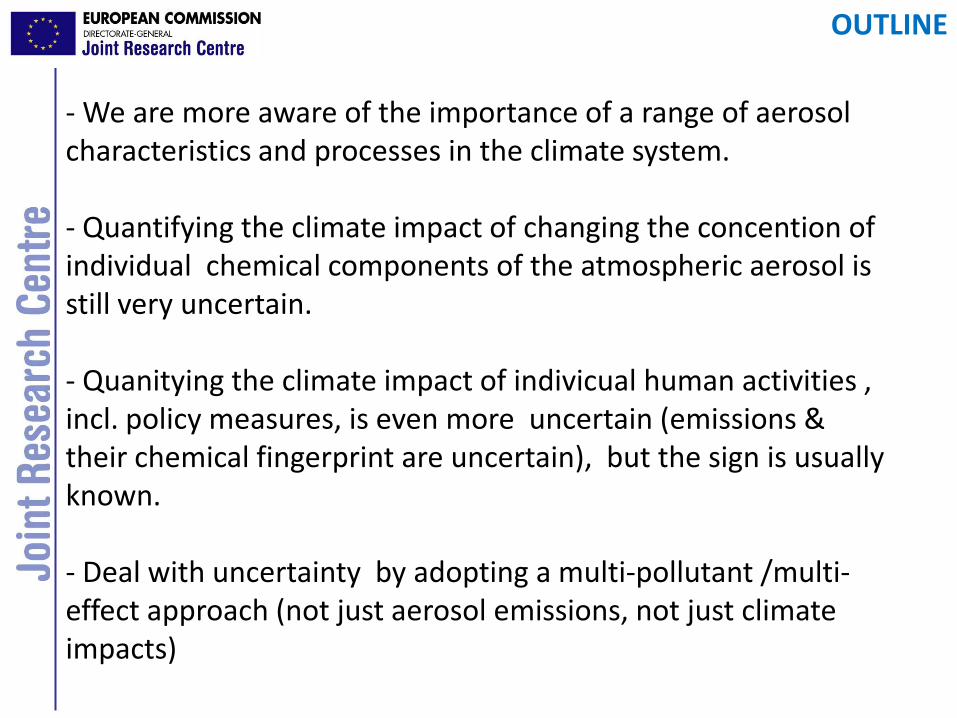
- We are more aware of the importance of a range of aerosol characteristics and processes in the climate system.
- Quantifying the climate impact of changing the concention of individual chemical components of the atmospheric aerosol is still very uncertain.
- Quanitying the climate impact of indivicual human activities ,incl. policy measures, is even more uncertain (emissions & their chemical fingerprint are uncertain), but the sign is usually known.
- Deal with uncertainty by adopting a multi-pollutant /multi-effect approach (not just aerosol emissions, not just climate impacts)
OUTLINE
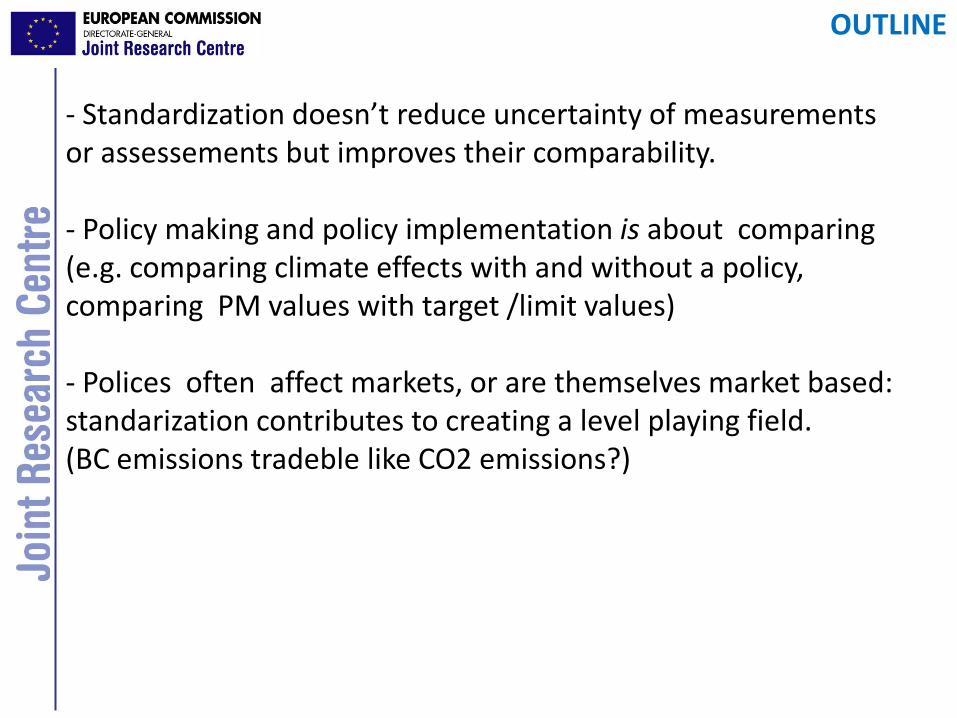
- Standardization doesn’t reduce uncertainty of measurements or assessements but improves their comparability.
- Policy making and policy implementation is about comparing (e.g. comparing climate effects with and without a policy, comparing PM values with target /limit values)
- Polices often affect markets, or are themselves market based: standarization contributes to creating a level playing field.(BC emissions tradeble like CO2 emissions?)
OUTLINE

size, chemical composition, morphology
ATMOSPHERIC AEROSOL PARTICLESor: Particulate Matter
Diameter (micrometer)0.01 0.1 1 10

PM2.5, Central Europe, regional background
SO423%
NH411%
NO310%
unacc.19%
OM24%
EC8%
sea salt1%
dust4%
PM2.5, Eastern USA, urban background
dust20%
seasalt2%
SO423%
NO38%
NH411%
unacc.7%
OM21%
EC8%
PM2.5, Central Europe, urban background
SO418%
NH410%
NO312%
unacc.18%
OM24%
EC13%
dust4% sea salt
1%
PM2.5, Shanghai, China, urban background
dust13%
sea salt2%
SO422%
NO39%NH4
9%
unacc.3%
OM32%
EC10%
PM2.5, Eastern India (Kolkata), urban backgroung
dust3% seasalt
10%
SO413%
NO37%
NH42%
OM55%
EC10%
PM2.5, Northern India (Gual Pahari), regional background
dust5% sea salt
5%
SO416%
NO37%
OM48%
EC9%
NH47%
unacc3%
PM2.5, Eastern USA, regional background
dust20%
seasalt1%
SO431%
NO35%
NH413%
unacc.8%
OM19%
EC3%
regionalbackground
urbanbackground
CentralEurope
EasternUSA
ChinaShanghai
NorthernIndia
Elemental carbon
Organic Matter
Unaccounted
Ammonium
Nitrate
Sulfate
Seasalt
Dust
Source, J.P. Putaud, JRC
chemical composition of PM2.5, worldwide (2000 – 2010)
11 μg/m3 20 μg/m3
10 μg/m3
68 μg/m3
10 μg/m3
122 μg/m387 μg/m3

Posfai et al. JGR 1999

TOA Radiative Forcing for components
IPCC
4A
R, 2
007
}{ )()1(2)1()1(21 22
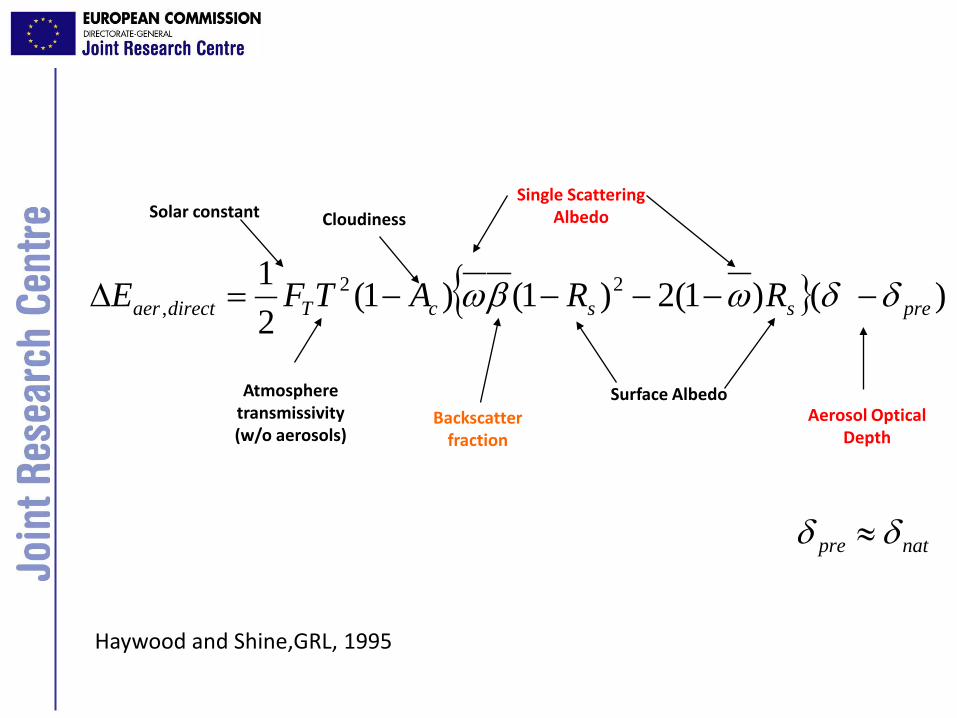
, presscTdirectaer RRATFE δδωβω −−−−−=∆
Solar constant
Atmosphere transmissivity(w/o aerosols)
CloudinessSingle Scattering
Albedo
Surface AlbedoAerosol Optical
Depth Backscatter
fraction
natpre δδ ≈
Haywood and Shine,GRL, 1995

Chun
g et
al.,
JGR,
200
5
Aerosol Optical Depth: MODIS vs. AERONET
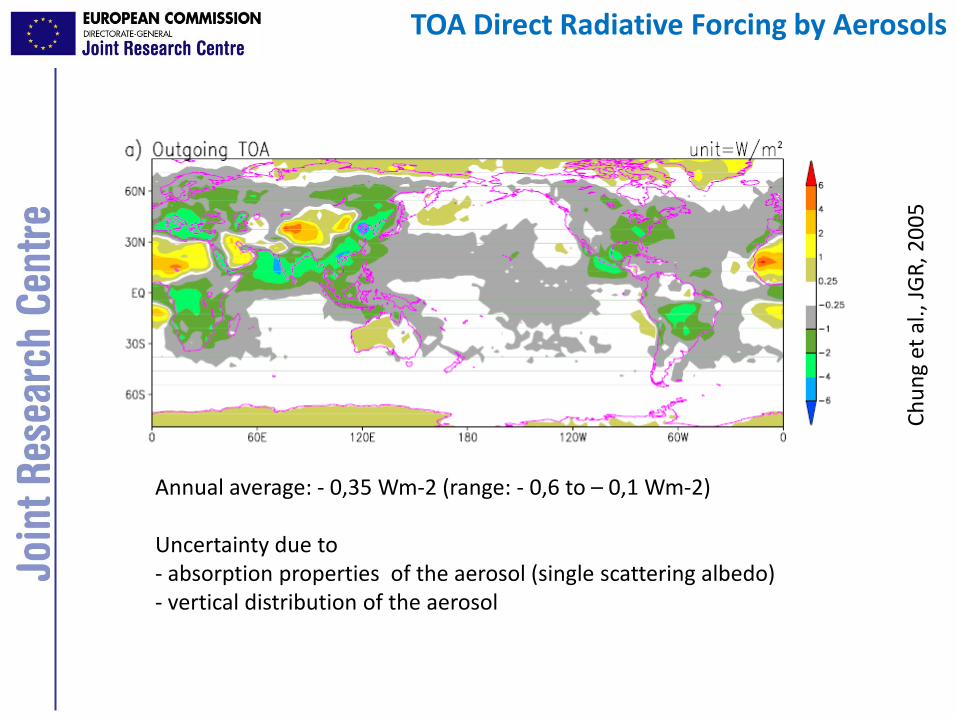
Annual average: - 0,35 Wm-2 (range: - 0,6 to – 0,1 Wm-2)
Uncertainty due to- absorption properties of the aerosol (single scattering albedo)- vertical distribution of the aerosol
Chun
g et
al.,
JGR,
200
5
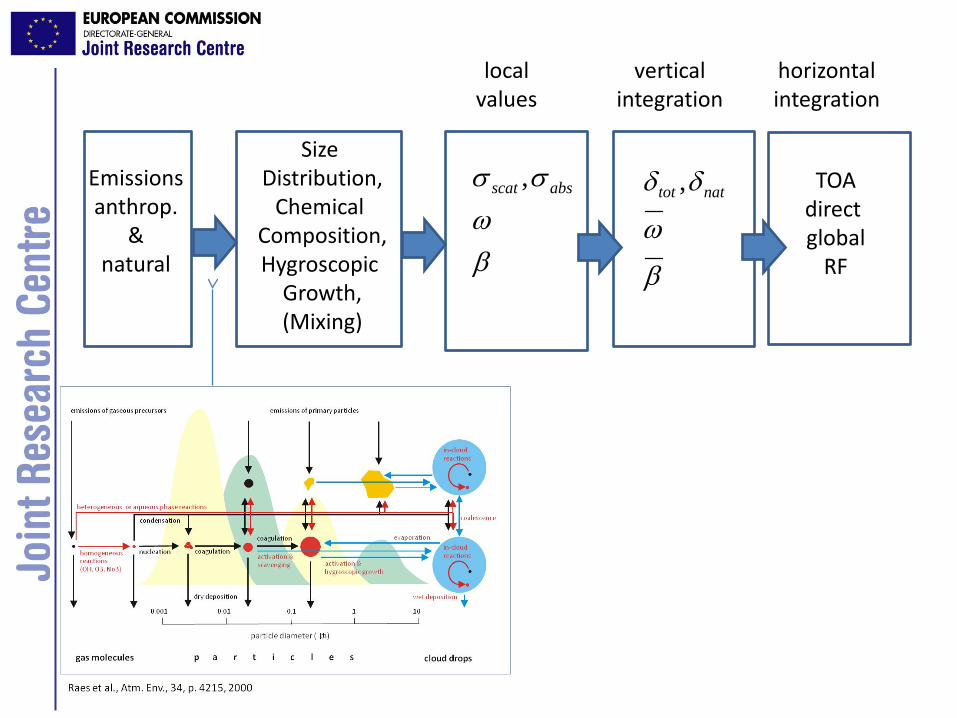
TOA Direct Radiative Forcing by Aerosols

Size Distribution,
Chemical Composition,Hygroscopic
Growth,(Mixing)
βω
σσ absscat
β
ω
δδ nattot − TOAdirect global
RF
localvalues
verticalintegration
horizontalintegration
closure experiments
)(),(4
),,(2
λσπ
λ spppp
psca dmdDmDnD
mDQ =∫∫


- The GAW – World Calibration Centre for Aerosol Physicshttp://gaw.tropos.de/WCCAP/
- Intercomparisons
0
1
2
3
4
5
6
2002 2003 2004 2005 2006 2007 2008 2009 2010 2011
Condensation Particle Counters
Dif. & Scan. Mobility Particle Sizers
Nephelometers
Absorption Spectrometers
Hygroscopicity-TDMA
Eu+NAm
Eu+NAm+Aus
Eu+NAm+Aus+Asia

Emissionsanthrop.
&natural
Size Distribution,
Chemical Composition,Hygroscopic
Growth,(Mixing)
βω
σσ absscat ,
β
ω
δδ nattot , TOAdirect global
RF
localvalues
verticalintegration
horizontalintegration

Emissions of Black Carbon Aerosols
BC measured as - absorbing aerosol- elemental carbon- fraction of PM
Emissionsanthrop.
&natural
Size Distribution,
Chemical Composition,Hygroscopic
Growth,(Mixing)
βω
σσ absscat ,
β
ω
δδ nattot , TOAdirect global
RF
localvalues
verticalintegration
horizontalintegration

sameemissions
TOA Direct Radiative Forcing by Aerosols
IPCC
4A
R ,2
007

sensitivity analysiswith the same model
constrained byobservations
TOA 1st Indirect Radiative Forcing by Aerosols
IPCC
4A
R ,2
007

IPCC
4A
R, 2
007
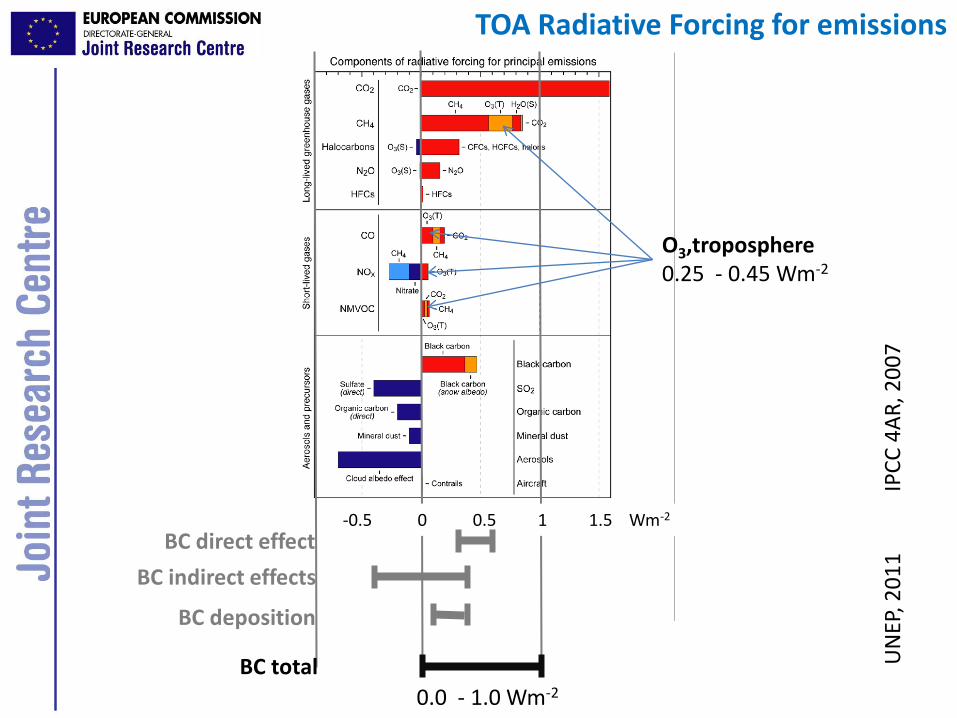
-0.5 0 0.5 1 1.5 Wm-2
BC direct effect
BC indirect effects
BC deposition
BC total UN
EP, 2
011
O3,troposphere0.25 - 0.45 Wm-2
0.0 - 1.0 Wm-2
TOA Radiative Forcing for emissions

Climate given at 2050, air quality benefits for 2030 and beyond
UNEP 2011

Climate given at 2050, air quality benefits for 2030 and beyond
UNEP 2011

CEN TC 264 – currently active WGs
WG 15: PM2.5 and PM10 (filter sampling & weighing)
WG 21: measurement of PAHs
WG 32: Particle number concentration
WG 35: EC/OC in PM
Published standards
EN 12341: PM10 filter sampling & weighing (required by2008 directive
EN 14907: PM2.5 filter sampling & weighing (required by2008 directive
EN 14902: Cd, As Ni, Pb in PM
EN 15549: BaP in PM
prEN 15980: PAHs in PM
Standardization activities in EU by CEN

• Deviations to reference cannot be explained by measurement inaccuracy (based on previous inter-comparisons)• Large filter inhomogeneity• No certified values for OC and EC (thermal protocol dependent)
TC amount measured in NIST RM 8785 by 13 labs in Europe
0
10
20
30
40
50
60
5 3 3 5 4 5 3 3 5 3 5 0 7 3
UoC NILU CHMI ISAC FMI ACUV IfT IfT ULund ITM JRC PSI CSIC LaMP
0
10
20
30
40
50
60TC (µg/cm²) IMPROVE
TC (µg/cm²) NOSH
av. TC reported by participant (µg/cm²)
Fig. 1: TC amounts determined by the EUSAAR partners and reference values.Also shown are the uncertainties of these values.
EU

- We are more aware of the importance of a range of aerosol characteristics and processes in the climate system.-Quantifyingthe climate impactof changing the concentraion of individual chemical components of the atmospheric aerosol is still very uncertain.-Quanitying the climate impact of indivicual human activities ,incl. policy measures, is even more uncertain (emissions & theirchemical fingerprint are uncertain) but the sign is usually known.-Deal with uncertainty by adopting a multi-pollutant /multi-effectapproach (not just aerosol emissions, not just climate impacts)
CONCLUSIONS

- Standardization doesn’t reduce uncertainty of measurements or assessemnts but improves their comparability.
- Policy making and policy implementation about camparing (e.g. climate effect with and without a policy, comparing PM values with target /limit values)
- Polices often affect markets, or are themselves market based: standarization contributes to creating a level playing field.(BC emissions tradeble like CO2 emissions?)
- Aerosol & Climate science has become relevant!
CONCLUSIONS
thanks

AeroCom (Schultz et al., 2006) compared instantaneous direct radiative forcing due to anthropogenic aerosols produced by 9 different global models (from Europe, Japan and the USA) with detailed aerosol modules,USING THE SAME EMISSIONS
Differences in computed direct aerosol forcing (range +0.04 to −0.41Wm−2) are due to:• diversity in simulated aerosol residence times• mass extinction coefficients• forcing efficiencies (forcing per unit optical depth)
+
• in clear-sky conditions: aerosol absorption, size, and surface albedo• in cloud-sky conditions: cloud fields and relative altitudes of absorbing aerosol and clouds
TOA Direct Radiative Forcing by Aerosols

Global TOADirect
Radiative Forcing
Global TOA
IndirectRadiative Forcing
Charlson et al., Science, 1992

Snow, IceAlbedo
Global TOADirect
Radiative Forcing
Global Radiative Forcing
RegionalClimate Impacts
Global TOA
IndirectRadiative Forcing
RegionalClimate Impacts
Global &RegionalClimate Impacts
GlobalClimate Impacts
GlobalClimate Impacts
Charlson et al., Science, 1992

Emissionsanthrop.
&natural
Size Distribution,
Chemical Composition,Hygroscopic
Growth,(Mixing)
βω
σσ absscat ,
β
ω
δδ nattot , TOAdirect global
RF
CloudClimatology
TOAindirect global
RF
localvalues
verticalintegration
horizontalintegration
CCN, CCNnat
CloudDropletNumber
localvalues
integration

)()( preout
preinoutin EEEERF −−−=

)()( preout
preinoutin EEEERF −−−=
)()( preoutout
preinin EEEERF −−−=
outin EERF ∆−∆=
albedosurfaceoutaerosolsoutGHGoutsolarin EEEERF _,,,, ∆−∆−∆−∆=
Radiative Forcing: bottom-up


ATMOSPHERIC OZONE

Computing future aerosol radiative forcing:
scenarios → emissions → concentration fields → climate forcing
- Model validation (against measured aerosol constituents’ concentrations too)
- Model inter-comparisons
AeroCom (Schultz et al., 2006) compared instantaneous direct radiative forcing due to anthropogenic aerosols produced by 9 different global models (from Europe, Japan and the USA) with detailed aerosol modules.
Differences in computed direct aerosol forcing (range +0.04 to −0.41Wm−2) are due to:• diversity in simulated aerosol residence times• mass extinction coefficients• forcing efficiencies (forcing per unit optical depth)
+
• in clear-sky conditions: aerosol absorption, size, and surface albedo• in cloud-sky conditions: cloud fields and relative altitudes of absorbing aerosol and clouds

Reduced from 6.4 measured to 0,9To match GCMs

Computing current aerosol direct radiative forcing:
- E.g. Haywood and Shine’s approximation (1995) for a given WL:
Solar constant
Atmosphere transmissivity(w/o aerosols
Cloudiness
Single Scattering Albedo
Surface Albedo Aerosol Optical Depth
Backscastter fraction
- Radiative transfer modules (e.g. Modtran) need:- extinction vertical profile- extinction, absorption, and asymmetry factor WL dependence
Computing current aerosol indirect radiative forcing:
- mainly (?) remote sensing- CCN number ↔ CN number size distribution, hygroscopicity
Is total present forcing, not
Bar = average over solar an
In Charlsons work, optical depth is that of anthro If you use measurements you have natural + ant

Measurements of aerosol characteristics relevant to climate forcing
are currently performed for research (rather than regulation) purposes
⇒ they are done with conscience and awarenessDifferent flow rates in Nephelometer give same scattering measurementsDifferent ΔT in CPCs give same number of particles with Dp>50nm
go back to a basic physical principle
⇒ they aim at getting true (and not only “comparable”) valuesNo need for standardisation if several methods can measure the same truthE.g. - aerosol absorption from photoacoustic spectrometer =
- extinction cell (extinction – scattering)In contrast with PM mass concentration (gravimetric methods) which give wrong data because of
sampling artifacts and analytical artifacts (aerosol water uptake at 45-50% RH), and then errors have to be the same everywhere.
⇒ continuous closure checks used as strigent data quality check
Still a lot has been done regarding standardisation in the field of aerosol metrology for climate over the past decade ( GAW SAG, GAW-WCCAP, …,EMEP) Very often payed by European Commission

2003 WMO-GAW Guidelines (72 p.)2011 WMO-GAW SOPs (76 p.)

- The GAW – World Calibration Centre for Aerosol Physicshttp://gaw.tropos.de/WCCAP/
- Intercomparisons
- Audits (on-site check of sampling configuration, instruments, etc…)Tamanrasset/Assekrem Algeria 2003Hohenpeissenberg Germany 2003Anmyeon South-Korea 2004Pallas Finland 2004Danum Valley Malaysia 2004Mace Head Ireland 2004Waliguan-Beijing China 2005Danum Valley Malaysia 2005Danum Valley Malaysia 2006Cape Point South Africa 2006Ny-Alesund Norway 2006Beo-Moussala Bulgaria 2006Izana Tenerife, Spain 2006Point Barrow Alaska, USA 2007Monte Cimone Italy 2007Harwell UK 2007Mauna Loa Hawaii, USA 2007Finokalia Crete, Greece 2007Cabauw The Netherlands 2008Bukit Koto Tabang Indonesia 2008Vavihill Sweden 2008Cape Grim Australia 2008Shangdianzi China 2009Danum Valley Malaysia 2009Hyytiälä Finland 2009Birkenes Norway 2009Finokalia Crete, Greece 2009Preila Lithuania 2009Aspvreten Sweden 2009Melpitz Germany 2009Ispra Italy 2010JFJ, PdD, Kosetice, K-Puszta 2010 ?
I can make a GANTT-like diagram with this too, highlighting stations from the 5 continents

Computing future aerosol radiative forcing:
scenarios → emissions → concentration fields → climate forcing
- Model validation (against measured aerosol constituents’ concentrations too)
- inorganics: nitrate, sulfate, (ammonium), etc…
- ∃ reference materials (NIST SRM 2694, IRMM xxx, …)
- ∃ yearly or twice yearly regular inter-comparisonsGAW - QA/SAC-Americas: 78 labs worldwide
(http://qasac-americas.org/)EMEP- CCC: 51 labs worldwide (http://tarantula.nilu.no/projects/ccc/)
- carbonaceous aerosol
- reference material (NIST RM 8785) ?
- yearly inter-comparison with EUSSAR project (18 Eu labs)
- punctual inter-continental inter-comparisonEnvCan, IMPROVE, EUSAAR

• Deviations to reference cannot be explained by measurement inaccuracy (based on previous inter-comparisons)• Large filter inhomogeneity• No certified values for OC and EC (thermal protocol dependent)
TC amount measured in NIST RM 8785 by 13 labs in Europe
0
10
20
30
40
50
60
5 3 3 5 4 5 3 3 5 3 5 0 7 3
UoC NILU CHMI ISAC FMI ACUV IfT IfT ULund ITM JRC PSI CSIC LaMP
0
10
20
30
40
50
60TC (µg/cm²) IMPROVE
TC (µg/cm²) NOSH
av. TC reported by participant (µg/cm²)
Fig. 1: TC amounts determined by the EUSAAR partners and reference values.Also shown are the uncertainties of these values.
EU

∫∫= ppp
pscasca dmdDtrmDND
mDQtr ),,,(4
),,(),,(2π
λλσ
effects on radiation balance: scattering and absorption
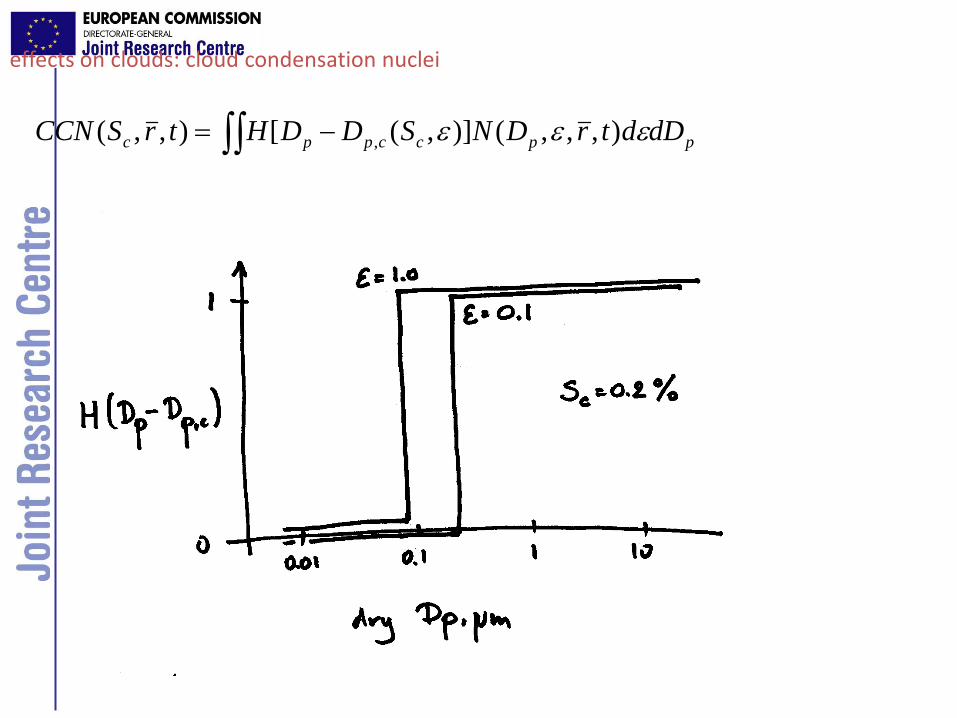
∫∫ −= ppccppc dDdtrDNSDDHtrSCCN εεε ),,,()],([),,( ,
effects on clouds: cloud condensation nuclei

The GAW – World Calibration Centre for Aerosol Physicshttp://gaw.tropos.de/WCCAP/
- Intercomparisons
- Audits
- Travelling reference instruments (for especially remote stations)

Definitions
What is a Standard?
A standard is an established norm or requirement
It is usually a formal document that establishes uniform technical criteria, methods, processes and practices
It may be developed privately or unilaterally, for example by a corporation, regulatory body, military
Simply They define how things should be done

∫∫= ppp
pscasca dmdDtrmDND
mDQtr ),,,(4
),,(),,(2π
λλσ
effects on radiation balance: scattering and absorption

∫∫ −= ppccppc dDdtrDNSDDHtrSCCN εεε ),,,()],([),,( ,
effects on clouds: cloud condensation nuclei

“Black Carbon” or “Elemental Carbon” is:- carbon-containing particulate matter, resulting from incomplete combustion
- it withstands high temperatures- it is black, hence absorbs light
- emitted together with CO2, CO, NMHC, organic particlate matter)
BLACK CARBON PARTICLES
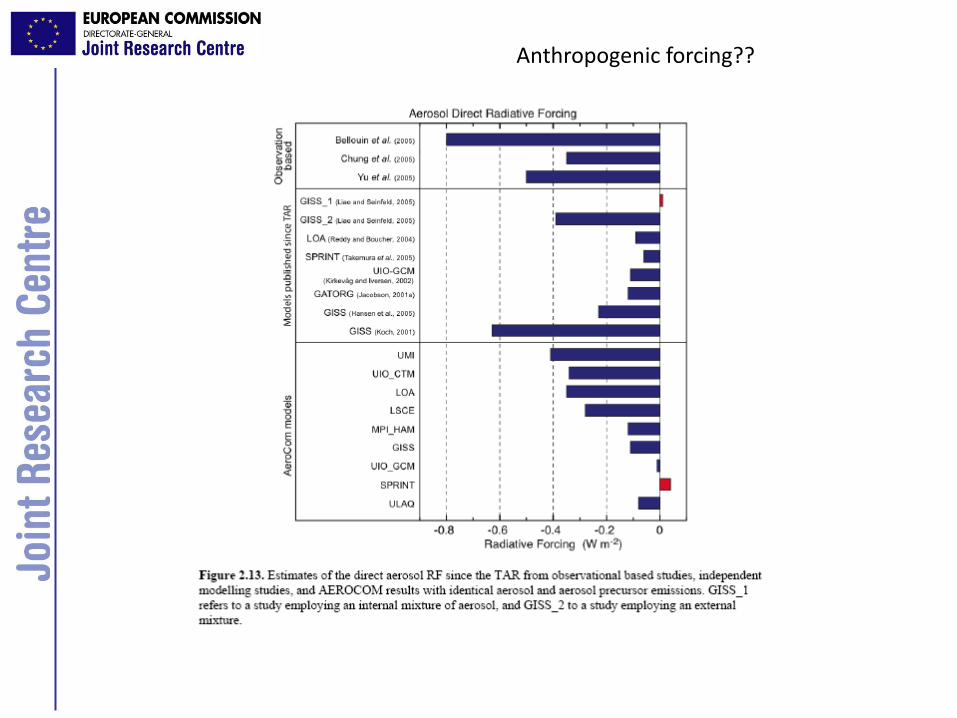
Anthropogenic forcing??


ng/m3
Observed Modeled
Measuring and modeling BC surface concentrations
Koch et al., 2009

impacts of BC and tropospheric ozone
On air quality
Black carbon and ozone in the lower atmosphere are harmful air pollutants affecting health of humans and ecosystems
Black carbon, a component of particulate matter, and ozone both lead to premature deaths worldwide. (PM2.5: ∼2 million per year , WHO)
Ozone is also the most important air pollutant, responsible for reducing crop yields, and thus affects food security.
On global and regional climate ?

present impacts of BC and tropospheric ozone
On global and regional climate
Changes in their burdens over the 20th Century result in an expected equilibrium global warming of 0.0-0.8 C due to BC and 0.1-0.4 C due to O3. (The equilibrium warming expected from CO2 is about 1.3 C.)
Atmospheric heating by BC disturbs tropical rainfall and regional circulation patterns such as the Asian monsoon.
Black carbon’s darkening of snow and ice surfaces increases their absorption of sunlight, which, along with atmospheric heating, exacerbates melting of snow and ice around the world, including in the Arctic, the Himalayas.
UN
EP, 2
011
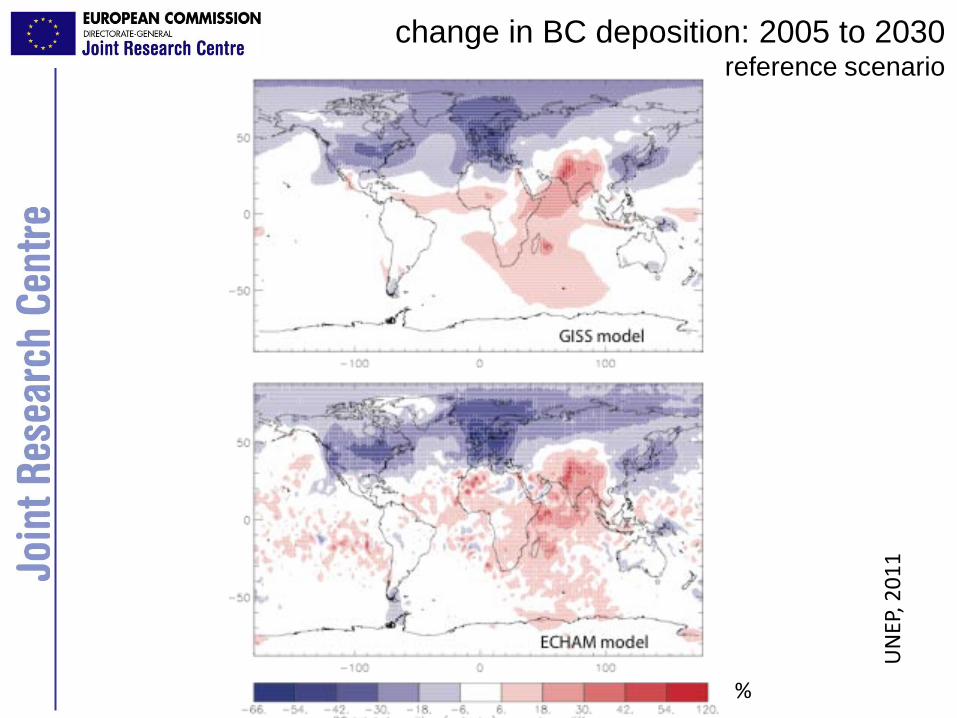
change in BC deposition: 2005 to 2030reference scenario
%

expected impacts of BC and tropospheric ozoneireference scenario: 2005 to 2030
Avoidance of 0.2-1.8 million premature deaths per year , in North America, East Asia, SE Asia & Pacific, While in increase by 0.1-2.0 million in South, West & Central Asia and Africa..
Decreasing production of wheat, rice corn and soy by 7 to 120 million tonnes across Asia with an associated economic loss of US$ 1 – 20 billion. Increasing crop yields in US and Europe.
The compensating warming and cooling impacts of changes in BC, ozone and other aerosols lead to a small net warming of less than 0.1 C globally
Black carbon’s darkening of snow and ice and atmospheric heating, keeps exacerbating melting of snow and ice in the Himalayas
Conclusions so far:
based on our knowledge of the behaviour of BC and ozone in the atmosphere, and of their impacts on air quality,And on lobal and regional climate in teh near term
it makes a lot of sense to look for measures that specifically target the emissions of BC and ozone precursors in order to solve a range of important problems at once.
thanks
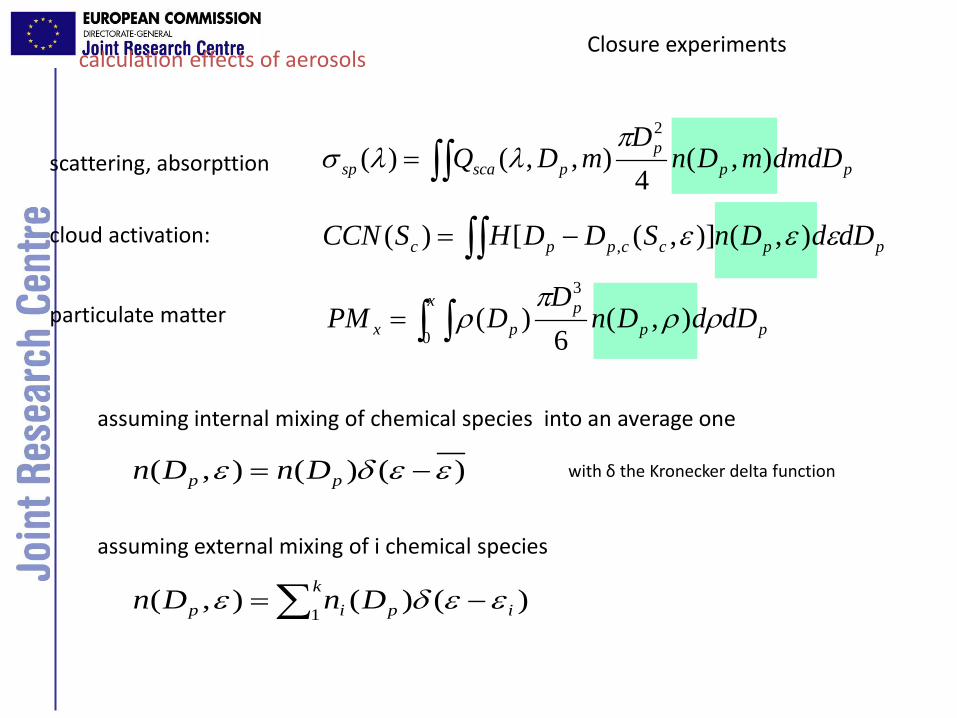
calculation effects of aerosols
∫∫= ppp
pscasp dmdDmDnD
mDQ ),(4
),,()(2π
λλσ
∫∫ −= ppccppc dDdDnSDDHSCCN εεε ),()],([)( ,
∫ ∫=x
ppp
px dDdDnD
DPM0
3
),(6
)( ρρπ
ρ
)()(),( εεδε −= pp DnDn
assuming internal mixing of chemical species into an average one
assuming external mixing of i chemical species
∑ −=k
ipip DnDn1
)()(),( εεδε
with δ the Kronecker delta function
scattering, absorpttion
cloud activation:
particulate matter
Closure experiments

- We are more aware of the importance of a range of aerosol processes in the climate system.-Quantifyingthe climate impactof changing the concentraion of individual chemical components of the atmospheric aerosol is still very uncertain.-Quanitying the climate impact of indivicual human activities ,incl. policy measures, is even more uncertain (emissions & theirchemical fingerprint are uncertain) but the sign is usually known.-Deal with uncertainty by adopting a multi-pollutant /multi-effectapproach (not just aerosol emissions, not just climate impacts)
conclusions

- Standardization doesn’t reduce uncertainty of measurements or assessemnts but improves their comparability.
- Policy making and policy implementation about camparing (e.g. climate effect with and without a policy, comparing PM values with target /limit values)
- Polices often affect markets, or are themselves market based: standarization contributes to creating a level playing field.(BC emissions tradeble like CO2 emissions?)
- Aerosol & Climate science has become relevant!
conclusions
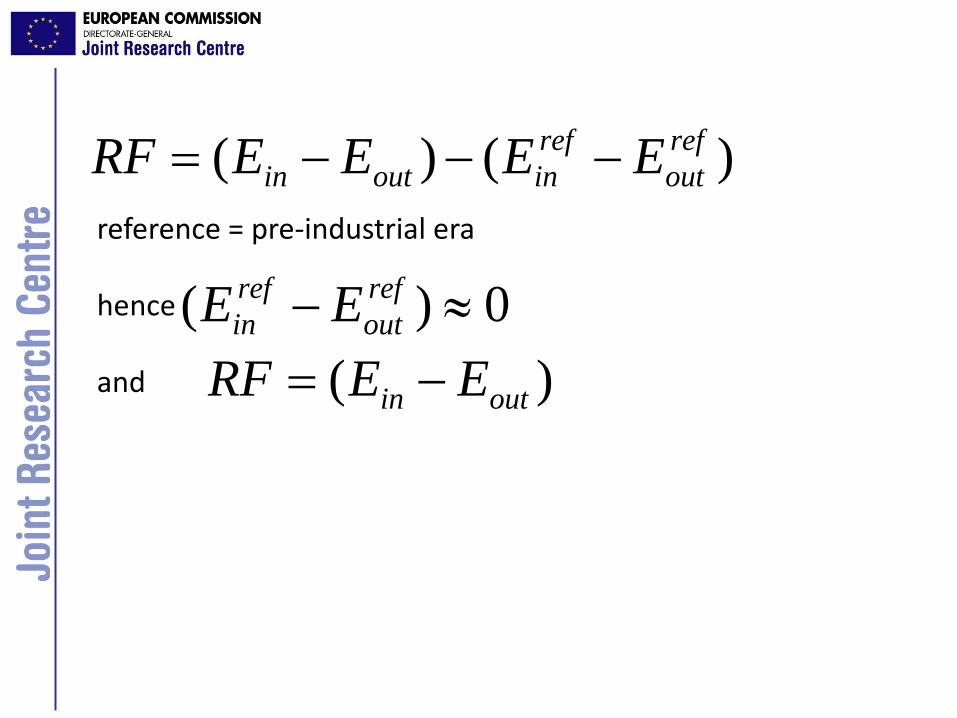
)()( refout
refinoutin EEEERF −−−=
reference = pre-industrial era
hence
and
0)( ≈− refout
refin EE
)( outin EERF −=
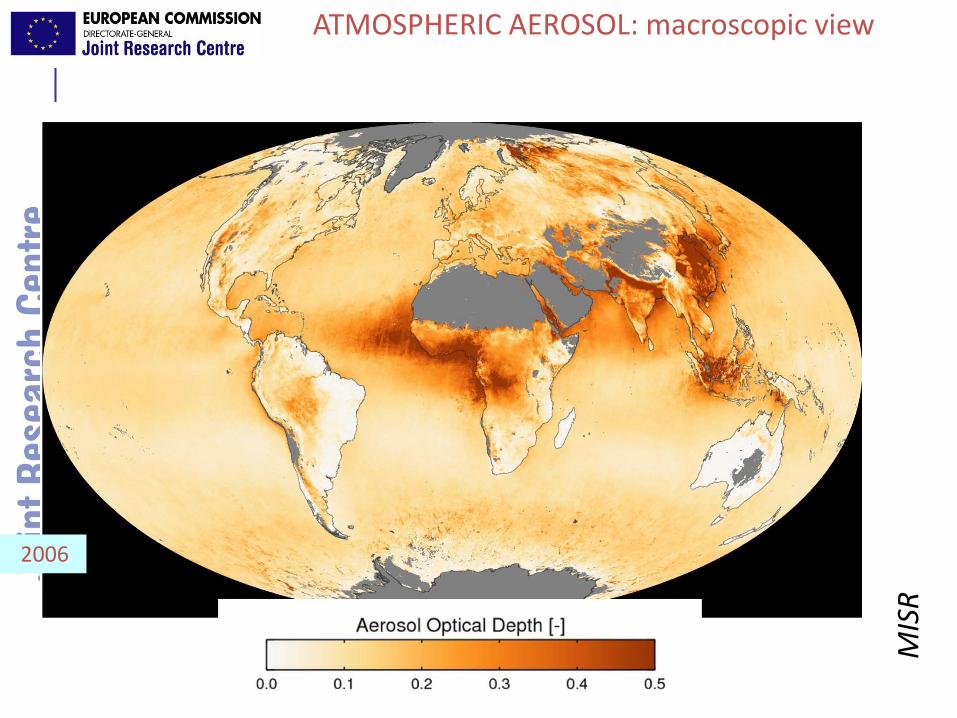
ATMOSPHERIC AEROSOL: macroscopic view
MIS
R
2006

AeroCom (Schultz et al., 2006) compared instantaneous direct radiative forcing due to anthropogenic aerosols produced by 9 different global models with detailed aerosol modules, using identical emissions.
Differences in computed direct aerosol forcing (range +0.04 to −0.41Wm−2) are due to:
• diversity in simulated aerosol residence times• mass extinction coefficients• forcing efficiencies (forcing per unit optical depth)+• in clear-sky conditions: aerosol absorption, size, and surface albedo• in cloud-sky conditions: cloud fields and relative altitudes of absorbing aerosol and clouds

• For any statement that I going to make there is an expert in the room that can go much mre n depth, or even challenge it• Steve: father if not grand-father: without a beard mor like a father• When interest of standardization organizations > relevance!• PM/healt already relevant: legislation > lavel playing field money (even though this community knows much less aerosol,but
there is epidemiological evidence!) (do we havedirect evidence of impacts of aerosols on climate:, and that it is important?)• How can we go from microscopic compexity to values regional or glonal impacts on radiation balece and climate?• Do we need to consider all that complexity, to come to usefull values?• Not yet legislation for aerosols and climate, scientific need (but e.g. BC in CDM is discussed ?) anyway relevance • Ozone vs PM, PM external internal mixing: onc you ave O3, RF easy to calculate.once you have PM dot easy to calculate• TOA forcing, RF = delta(present) – delta (pre-industrial) > role of knowing pre-industrial values
– Overall Earth radiation balance– Delta aerosols, delta GHG.delat alsbedl
• - IPCC usual graph (not policy relevant), immediately show other IPCC (more relevant) > Shindell• At this point usefull to make a distinction between – assessement of present day effects of PM on climate (relevant to
monitor compliamce with legilation: standardization) – predicting future impacts of PM on climate (policy development)• Paper Charlson et al. / Haywood & Shine
– based on secondary parameters: problem of pre-industrial– Based on primar parameters related to emisioins
• What did we learn? Include TOA > TOA+ surface+atmospheric forcing >regional impacts• We know a lot about aerosols, compared to what health people know or want to consider about PM. Still the latter made it
to policy and hence standardization: research becomes different ...• Ibe exampels of standardization work in air quality work• Two communities are any way mergibg: e.g. UNEP assessement.
– RF of BC emissions (IGAC, telephone conference India, US, Nairobi, Europe)– Effect on Climate, Health Crops. Integrated > uncertainties are less problematic.
• Conclusion?