aerc.jnkvv.orgaerc.jnkvv.org/jnkvvuserpdf/2001-2010/2001-2010/93 final.pdf · preface . the present...
TRANSCRIPT

CCUULLTTIIVVAATTIIOONN OOFF MMEEDDIICCIINNAALL AANNDD AARROOMMAATTIICC CCRROOPPSS AASS AA MMEEAANNSS OOFF DDIIVVEERRSSIIFFIICCAATTIIOONN IINN
AAGGRRIICCUULLTTUURREE IINN MMAADDHHYYAA PPRRAADDEESSHH
PROJECT LEADER
N. KHAN H.O. SHARMA
ASSOCIATES
KAMTA PRASAD Asstt. Statistical Officer C.K. MISHRA Junior Computer
COMPUTER TYPING SIKANDAR KHAN
PREFACE The present study has been assigned by the Directorate of Economics and Statistics, Ministry of Agriculture, Government of India to some the Agro-Economic Research Centers of the country under the coordination ship of Institute for Social and Economics Change, Bangalore ( Karnataka). This Centre took up this study for Madhya Pradesh State.
The present study was conducted by Dr. H.O. Sharma, and Dr. N. Khan, Research Officers of this Centre who planned the study design, conducted field investigation, tabulation and analysis and drafted the report. Study based on field data collected from selected 100 farmers (50 from Isabgol and 50 from Lemongrass) and the significant observations were recorded. The answer of the question "Is the cultivation of medicinal and aromatic crops is the means of diversification?" is in affirmative side that yes the cultivation of medicinal and aromatic crops is the real means of diversification of agriculture. As even after facing many problems in production and marketing of medicinal and aromatic crops and got less profit or losses in production of these crops, the producers did not returns back to the production of traditional crops ( paddy and wheat ). But they jumped over more remunerative crops like cumin and colius in the area under study. As the cultivation of these crops improved their cropping intensity, power of decision making and gave more orientation towards their socio-economic development. I wish to express my deep sense of gratitude to the officials of the Directorate of Economics and Statistics, Department of Agriculture & Cooperation, Ministry of Agriculture, Government of India, New Delhi. On behalf of the Centre, I express my deep sense of gratitude to Dr. D. P. Singh, Hon'ble Vice-Chancellor, Dr. V. S. Tomar, Director Research Services and Dean (Faculty of Agriculture) , Dr. C. B. Singh , Director Extension Services , Dr. J.S. Raghu, Dean, The Head of the Departments and other officials of J.N. Krishi Vishwa Vidyalaya, Jabalpur for providing guidance and help at various stages in successful completion of this study of high importance. I extend my heartfelt thanks to the coordinator of this study Dr. R.S. Deshpandey, , Head Agricultural Development and Rural Transformation, Institute for social and economics Change, Bangalore ( Karnataka) Economics Research Centre, Delhi who provided necessary guidelines for conducting this study.
I am very thankful to the states and districts level staff of the departments of Agriculture, Horticulture, Madhya Pradesh, Dean, College of Horticulture , Mandsour, Deputy Director ( Horticulture), Mandsour and Jabalpur ( M.P.) for providing not only secondary data but also helping in collection of field data from the selected farmers. I am very thankful to Dr. N.L. Idnani, Dr. J.P Tiwari, Dr. V.K. Agrwal, Dr. A. B. Tiwari, Dr. Hari Patidar with all the scientists and supporting staff members of Agro-Economic Research Centre and Department of Agricultural Economics deserve to be complemented for their untiring efforts in bringing this innovative study to its perfect shape. I would also offer my thanks to Mr. Sikandar Khan and Mr. C.K. Mishra who took painstaking job of doing the computer typing and photocopying respectively of the report. I hope the findings and suggestions made in the study would be useful to policy makers of the States and Govt. of India. (P.K. Mishra) Honorary Director Professor & Head
CONTENTS
CHAPTERS TITLES PAGES CHAPTER-I INTRODUCTION 1 - 17
1.1 Preamble 1 1.2 Research Methodology 9 1.3 Salient Features of Selected Crops 12
1.3.1 ISABGOL (Plantago Ovata Forsk) 12 1.3.2 LEMONGRASS (Cymbopogon flexuosus) 14
1.4 A Brief Review about the Crops and their Uses 16 CHAPTER-II PROFILE OF THE STUDY AREA 18 - 50 2.1 General Description of the State 21
2.1.1 Physiography 21 2.1.2 Soils 25 2.1.3 Climate 25
2.1.3.1 Rain fall 26 2.1.3.2 Temperature 26 2.1.4 Land use pattern 26 2.1.5 Population 27 2.1.6 Cropping Pattern 29 2.1.7 Land Holding Pattern 31 2.1.8 Irrigation Potential 32 2.1.9 Fertilizers, Bio-Fertilizers and Equipment Use 34 2.1.10 Horticultural status 35 2.1.11 Agri-Export Zones 35
2.2 Description of Selected Districts 36 2.2.1 MANDSAUR 36 2.2.1.1 Land Use Pattern 37 2.2.1.2 Cropping pattern 38 2.2.1.3 Area & Numbers of Holdings 39 2.2.1.4 Irrigation Potential 40 2.2.1.5 HYVs fertilizer, Bio fertilizer Consumption 41 2.2.1.6 Farm Machinery 42 2.2.1.7 Horticultural Status 42 2.2.2 JABALPUR 43 2.2.2.1 Land Use Pattern 44 2.2.2.2 Cropping pattern 45 2.2.2.3 Area & Numbers of Holdings 46 2.2.2.4 Irrigation Potential 47 2.2.2.5 HYVs fertilizer, Bio fertilizer Consumption 49 2.2.2.6 Farm Machinery 49 2.2.2.7 Horticultural Status 50
( ii )
CHAPTERS TITLES PAGES CHAPTER-III RELATIVE ECONOMICS OF MEDICINAL AND
AROMATIC CROPS 51 - 86
3.1 Medicinal crop: Isabgol 51 3.1.1 General Information of the Isabgol Growers: 51 3.1.1.1 Age & educational levels 51
3.1.1.2 Land Utilization Pattern 52 3.1.1.3 Cropping Pattern 53
3.1.2 Cost of Cultivation 55 3.1.2.1 Operational Cost 55 3.1.2.2 Total Cost 56 3.1.2.3 Returns from Isabgol 57 3.1.3 Competing Crop of Isabgol: Wheat 58
3.1.3.1 General Features of Wheat 58 3.1.3.2 Cost of Cultivation 60 3.1.3.2.1 Operational Cost 60 3.1.3.2.2 Total Cost 62 3.1.3.2.3 Returns from Wheat 64 3.1.4 Isabgol Vs Wheat 65 3.1.5 Recommended Package Vs Farmer’s Practices 66 3.2 Aromatic Crop: Lemon Grass 70 3.2.1 General Information of the Lemongrass Growers 70
3.2.1.1 Age and Educational Levels 70 3.2.1.2 Land Utilization Pattern 71 3.2.1.3 Cropping Pattern 71 3.2.2 Cost of cultivation 73 3.2.2.1 Operational Cost 73 3.2.2.2 Total Cost 74 3.2.2.3 Returns from Lemongrass 77 3.2.3 Competing Crop of Lemongrass- Paddy- Wheat 77 3.2.3.1 General Features of Paddy- Wheat Cropping Sequence 78 3.2.3.3 Returns from Paddy- Wheat Cropping system 82 3.2.3.4 Lemon grass Vs Paddy- Wheat cropping system 84
CHAPTER- IV MOTIVATING FACTORS AND PROCESS OF DECISION –MAKING
87 - 98
4.1 Medicinal crop: Isabgol 87 4.1.1 Motivating Factors 87 4.1.2 Factors that Provoke farmers to shift area under Wheat to Isabgol 88 4.1.3 Marketing Problems 89 4.1.4 Factors those Determining farmers’ decisions to bring more area
under Isabgol Crop Cultivation 90

( iii )
CHAPTERS TITLES PAGES 4.1.5 Factors that Provoke farmers to shift area under Isabgol to Cumin 90 4.1.6 Factors those Determining farmers’ decisions to bring area under
wheat 91
4.2 Aromatic Crop :Lemon grass 93 4.2.1 Motivating Factors 93 Marketing Problems 4.2.2 Factors that Provoke farmers to shift area under paddy- wheat to
lemongrass 93
4.2.3 Marketing Problems 94 4.2.4 Factors those Determining farmers’ decisions to bring area under
Lemongrass 95
4.2.5 Factors that Provoke farmers to shift area under lemongrass to Colius
96
4.2.6 Factors those Determining farmers’ decisions to bring area under Paddy- Wheat than Lemongrass
97
CHAPTER -V PROBLEMS IN MARKETING 99 - 100 5.1 Markets problems in Wheat 99 5.2 Market problems in Paddy-Wheat 100 5.3 Contractual Agreement 100 5.4 Constraints faced by firms CHAPTER- VI SUMMARY & CONCLUSIONS 101- 108 6.1 Backdrop 101 6.2 Objectives of the study 102 6.3 Research Methodology 102 6.4 Major Findings 103 6.5 Conclusions 107
................

( iv)
LIST OF TABLES
TABLE NO. PARTICULARS PAGES CHAPTER – I INTRODUCTION 01 – 17
1.1 Medicinal Crops of Madhya Pradesh 07 1.2 Major Aromatic Crops of M.P. and their uses 08 1.3 Medicinal and aromatic crops grown in Madhya Pradesh 10 1.4 Isabgol growing districts of Madhya Pradesh 10 1.5 Lemongrass growing districts of Madhya Pradesh 11 1.6 List of identified medicinal crops by the GOI 16
CHAPTER – II PROFILE OF THE STUDY AREA 18 – 50 2.1 Agro-Climatic Regions and covered Districts/Tehsils in Madhya Pradesh 24 2.2 Soil types and districts covered in Madhya Pradesh 25 2.3 Seasons and their periods in Madhya Pradesh 25 2.4 Land use pattern of Madhya Pradesh 27 2.5 Population parameters of M.P. 28 2.6 Per cent increase in Rural and Urban Population during different
census. 28
2.7.1 Area, Production and Productivity of Major crops of Madhya Pradesh as compared to India.
30
2.7.2 Cropping Pattern of Madhya Pradesh 31 2.8 Numbers (‘000) and Area (000’ ha) of Operational Holding in M.P. 32 2.9.1 Source wise irrigated area in M.P. 33 2.9.2 Crop wise irrigated area in Madhya Pradesh 33 2.10 Fertilizers, Bio- fertilizers consumption and equipments in M.P. 34 2.11 Area and Production of different horticultural crops 35 2.12 Agri- Export Zones of Madhya Pradesh 35 2.12.1 Land use pattern of Mandsaur 38 2.13 Cropping Pattern of Mandsaur district 39 2.14 Numbers (‘000) and Area (000’ ha) of Operational Holding in Mandsaur 40 2.15.1 Source wise irrigated area in Mandsaur 41 2.15.2 Crop wise irrigated area in Mandsaur 41 2.16 Fertilizers, Bio-fertilizers consumption in Mandsaur 42 2.17 Numbers of farm machinery in Mandsaur district 42 2.18 Area of different Horticultural crops in Mandsaur 43 2.19 Land use pattern of Jabalpur (2002-03) 45 2.20 Cropping pattern of Jabalpur district 46 2.21 Numbers (‘000) and Area (000’ ha) of Operational Holding in Jabalpur 47 2.22.1 Source wise irrigated area in Jabalpur district 48 2.22.2 Crop wise irrigated area in Jabalpur district 48

( v )
2.23 Fertilizers, Bio-fertilizers consumption in Jabalpur district 49 2.24 Numbers of farm machinery in Jabalpur district 49 2.25 Area and Production of different horticultural Crop in Jabalpur 50
CHAPTER-III RELATIVE ECONOMICS OF MEDICINAL AND AROMATIC CROPS
51 - 86
3.1 General features of Isabgol growers 52 3.2 Details of Land holding of Isabgol growers 52 3.3 Details of Cropping pattern of Isabgol growers 53 3.4 Details of Labour employed in cultivation Isabgol 56 3.5 Total Cost of cultivation of Isabgol 57 3.6 Returns from Cultivation of Isabgol 58 3.7 Details of labour employed in cultivation of Wheat 61 3.8 Economics of cultivation of Wheat 63 3.9 Returns from Cultivation of Wheat 64 3.10 Comparative cost and returns of Isabgol and Wheat 65 3.11 Comparative cost and return analysis of Farmers’ Practice with RPP 67 3.12 Problems faced by growers in cultivation of Isabgol 69 3.13 General features of lemongrass growers 70 3.14 Details of Land holding of lemongrass growers 71 3.15 Details of Cropping pattern of lemongrass growers 73 3.16 Details of Labour employed in cultivation of lemongrass 74 3.17 Economics of cultivation of lemongrass 75 3.18 Returns from Cultivation of lemongrass 77 3.19 Area, production and yield of Paddy of major paddy producing states 79 3.20 Constituents of Rice 79 3.21 Details of labour employed in cultivation Paddy- Wheat 81 3.22 Cost and Returns from cultivation of Paddy- Wheat 83 3.23 Comparative cost and returns of Lemongrass and Paddy-Wheat 84
CHAPTER- IV MOTIVATING FACTORS AND PROCESS OF DECISION –MAKING 87 - 98 4.1 Motivating factors for taking cultivation of Isabgol 87 4.2 Factors that provoke farmers to shift area under Wheat to Isabgol 88 4.3 Marketing problems faced by the farmers in growing Isabgol 89 4.4 Factors determining farmers’ decisions to bring more area under Isabgol crop cultivation 90 4.5 Factors that provoke farmers, to shift area under Isabgol to Cumin 91 4.6 Factors determining farmers, decisions to bring more area under Wheat than Isabgol 92 4.7 Motivating factors for taking cultivation of Lemongrass 93 4.8 Factors that provoke farmers to shift area under Paddy- Wheat to
Lemongrass 94
( vi )
4.9 Marketing problems faced by the farmers in growing Lemongrass 95 4.10 Factors determining farmers’ decisions to bring more area under
Lemongrass crop cultivation 96
4.11 Factors that provoke farmers, to shift area under Lemongrass to Colius 97 4.12 Factors determining farmers, decisions to bring more area under Paddy-
Wheat than Lemongrass 98
CHAPTER -V PROBLEMS IN MARKETING 99 - 100 5.1 Marketing problems faced by the farmers in growing Wheat 99 5.2 Marketing problems faced by the farmers in growing Paddy- Wheat 100

LIST OF FIGURES
FIGURE NO. PARTICULARS PAGES
CHAPTER – II PROFILE OF THE STUDY AREA 18 - 50 2.1 Area and Production of Medicinal and Aromatic Crops in M.P. 19 2.2 Agro-Climatic Zones of Madhya Pradesh 23 2.3 Map of Mandsaur District of M.P. 37 2.4 Map of Jabalpur District of M.P. 44
CHAPTER-III RELATIVE ECONOMICS OF MEDICINAL AND AROMATIC CROPS
51 - 86
3.1 Land Utilization Pattern of Isabgol Growers 54 3.2 Cropping Pattern of Isabgol Growers 54 3.3 Cost of Cultivation of Isabgol 61 3.4 Returns from Isabgol and Wheat 62 3.5 Farmer’s Practice Vs Recommended Practice 68 3.6 Land Utilization Pattern of Lemongrass Growers 72 3.7 Cropping Pattern of Lemongrass Growers 72 3.8 Cost of Cultivation of Cultivation of Lemongrass 76 3.9 Returns from Lemongrass and Paddy- Wheat Cropping System 85
......................
CHAPTER I
INTRODUCTION 1.1 Preamble
"vea= v{kje~ ukfLr uk ukS"kf/k ouLifre~
v;ksX; iq:"k S ukfLr] ;ksDrkLrRo nqyZHk:" (There is no word, which have not power of becoming a useful sentence ( mantra),there is
no plant , which does not have quality to becoming a medicine and there is no person , which
does not have qualities . Only the people are rare, who can identify and use them properly.)
There are so many plants now found in the world, which are identifying as
medicinal and aromatic plants and, cultivators are cultivated them as a crop. However,
our knowledge of medicinal crops has mostly been inherited traditionally, use of plants
has mostly been inherited traditionally, use of plants for curing various ailments are not
confined to the doctors only but is known to several households as well. There are many
interesting and sometimes astonishing things to learn from collectors of medicinal herbs.
Spreading and preserving this knowledge on medicinal plants and their uses has become
important for human existence. There is a growing tendency all over the world to shift
from synthetic to natural based products including medicinal plants. It is also timely now
to consider neglected and little, known medicinal plants.
The cultivation of medicinal and aromatic crops provides sustainable
means of natural source of high value industrial raw material for pharmaceutical, agri-
chemical, food and cosmetic industries and opens up new possibilities for higher level of
gains for farmer with a significant scope for progress in rural economy. Though, these
plants have been known and used since ancient times to heal and cure diseases, recently,
technological advancements and validation of traditional knowledge and usage are
leading to consumer inclination towards naturals and high market value for these crops.
Such crops in India now covering an area of merely about 0.4 million hectares are finding
a much higher place in international agri- business with an estimated annual growth rate
of 10-15 per cent.
1
In modern medicine also, plants occupy a very significant place as raw
material for some important drugs, although synthetic drugs and antibiotics brought about
a revolution in controlling different diseases. But these synthetic drugs are out of reach
to millions of people. Those who live in remote places depend on traditional healers,
whom they know and trust judicious use of medicinal herbs can even cure deadly
diseases that have long defied synthetic drugs.
In India, the use of different parts of several medicinal plants to cure
specific ailments has been in vogue from ancient times. The indigenous system of
medicine namely ‘Ayurvedic’, ‘Siddha’ and ‘Unani’ have been in existence for several
centuries. These systems of medicine cater the needs of nearly seventy per cent of our
population residing in the villages. Apart from India, these systems of medicines are
prevalent in Korea, China, Singapore, West Asia and many other countries. Besides the
demands made by these systems as their raw material, the demand for medicinal plants
made by the modern pharmaceutical industries has also increased manifold. Thus, these
constitute a group of industrially important crops which bring appreciable income to the
country by way of export.
Our pharmaceutical industry is fairly advanced and sophisticated. The
plant based drugs, however have shortened the life span of the source of material. There
is continuous search for more potent and cheaper raw material to feed the industry with
concerted research and development effort, many medicinal plants could provide raw
material in abundance to the indigenous pharmacies and local herbalists. Strong linkages
should be developed between medicinal plant growers, health experts and pharmaceutical
industries for developing scientific basis on which these systems of medicines are
working. An integrated system of medicine based a natural products and synthetics may
yield the most effective and cheap package for WHO’s goal of “health for all by the year
2010”
India possesses a huge wealth of medicinal and aromatic crops and is
traditionally associated with the use of medicinal and aromatic plants for human,
livestock and plant health. With the present world going herbal, trends at consumer level
favouring use of naturals are considered more harmonious with human metabolism. With
2
increasing global population and consequent rise in demand of pharma, perfumery and
flavour industries for MAPs, farming of these crops becomes an attractive alternative to
conventional crops.
In coming year land and water resources are sure to face acute
degradation, also the stresses as of supply of nonrenewable fossil fuel and phosphates
will be constrained while agri-chemical inputs gradually will have to be substituted.
Under such conditions, MAP’s with inherent capability to grow under natural stress with
rather better yields of secondary metabolites (active constituents) would be crops of
choice for sustainability. Isolation of bio-molecules from medicinal and aromatic plants
and improving their contents in plants would further enhance the demand and
consequently the profits as these molecules may find use in wide range of applications
such as anti-bacterial, antifungal, anti-protozoan, anti-cancers, hepato-protective, anti-
obesity, anti-diabetic, anti-depressants, cardiovascular and nerving stimulators and bio-
enhancers.
Introduction of new rotation based upon these newly developed short
duration genotypes have enabled growers to achieve profits ranging from 60-
75,000/ha/year. Mints have really transformed the socio-economic status poor farmers
with all round improvement in quality of their life with visible impacts in the form of
housing, nutrition in form of balanced meals to the family, mechanization of their farms
and machinery including post harvest processing capabilities and their visible move
towards literacy with their children going to school.
Many medicinal and aromatic crops do not require intensive agri-inputs
and grow well under natural stress conditions, may it be water, light, nutrients or salts. A
number of aromatic grasses such as lemongrass, palmarosa, vetiver and plants like
chamomile are the potential crops suited for salt affected soils providing subsistence
profits ranging from Rs.15-20,000/hectares/ year to the poor farmers. These crops have
great possibilities as a large chunk (more than 7.0 million hectares) of land is available
across the country where food/vegetable crops just cannot be grown profitably.
Many varieties of plants like ashwagandha, senna, kalmegh, basil,
lemongrass and palmarosa have been developed and demonstrated to grow well under
3

rain-fed/dry land conditions providing profits in the range of Rs.10-15,000/ha or more
within a short crop period. Moreover, such MAPs can be successfully cultivated in areas
prone to destruction of crops by wild animal.
The great importance of collecting good herbarium material for taxonomic
identification of the collected species must be stressed. There is need for conservation of
all useful plant species, and also cultivation, maintenance and assessment of germ plasm
for future use, since among the most vulnerable plant species in India, the most over
exploited are the medicinal plants. ( Khanujia, et. al ,20051)
The Government of India with the help of Central Institute of Medicinal
and Aromatic Plants (CIMAP), Lucknow and State government with the help of their
agricultural departments, agricultural universities and other institutions have taken the
initiative for the all-round development of promising plants and has developed
technology packages for cultivation of important medicinal and aromatic crops including
genotypes producing quality nucleus material acceptable in world market. The developed
agro-technologies have been beneficial for the farmers (especially marginal) as well as
industries.
India is a leading exporter of the medicinal plants in the world trade. The
major export of medicinal plant parts of whole plants from India are poppy husk and
seeds, Psyllijm (Plantago ovata) husk and seeds, senna (cassia angustifplia) leaves and
pods, chirayata (swertia angustifolia) galanthus (Alpinia S.P.) rhizomes. Tukmaria and
Zedoary (Curcuma Zedoaria) roots, Periwinkle (catharanthus roseus) roots and leaves,
Glycerrhiza glabra dried rhizomes, Ipecae dried rhizomes and roots, kuth roots, nux-
vomica dried ripe seeds, Sarasparilla, Serpentina roots and some ayurvedic herbs.
Major importer of medicinal plants from India are U.S.A., Japan
Germany, U.K. France and Switzerland, countries like South Korea and China are also
important exporters of these plants. South Korea is the major exporter of ginseng (Panax
SPP.) in the world market.
1 Khanujia, S.P.S, Kalra, Alok and Singh, A.K. (2005) Gain from entrepreneurship, The Hindu Survey of Indian Agriculture, 192-194
4
During the past decade a dramatic increase in exports of medicinal and
aeromatic crops attests to global interest in their products as well as in the traditional
health system. Commercially, these plant derived medicines, essential oils and products
are worth about US $ 72 billion (Rs.360, 000 crores) worldwide, which include global
business of medicinal herbal material of US $ 60 billion (Rs.3000, 000 crores).
According to the WHO estimates the projected demand for medicinal plants alone by the
year 2050 would be US $ 5 trillion (Rs.250, 00,000 crores).
The domestic market of Indian System of Medicine and Homeopathy
(ISMH) is of the order of Rs.4,000 crores (US $ 800 million) of which ayurveda drug
market alone is about Rs.3,500 crores (US $ 700 million). India’s total export earning
from the crude drugs, herbal extracts and finished products stands at meager Rs.800
crores (US $ 160 million). However, India, with large and diverse geographical area
gifted with rich plant biodiversity contributes hardly up to 2 per cent in the global trade.
Interestingly, on the essential oil from the essential oil crops as against the world
production of 1,10,000 t (US $ 9200 million). India contributes about 15 per cent in
terms of production and much better proportion of 21 per cent for the value.
But amazingly, India’s share in world export of essential oil and
perfumery material is merely 0.4 per cent. It is estimated that India’s annual production
of MAP raw materials may equal about 6000 crores (US $ 1200 million). The future
thrust holds great promise for India in the fast changing global economy as far as
production and trade of natural raw material is concerned. The hold on value of aromatic
produce is replicable for medicinal plants as collection to sound agro technologies
research in India by R& D organizations like CIMAP with backing of post harvest
processing technologies are also being developed at the same pace.
Madhya Pradesh a leading state in commercial cultivation and trade of
many medicinal and aromatic plants specially Asgandh, Sarpgandha, Bach, Isabgol,
Safed Musli, Muskdana, Rosha grass, Leman grass, Khurasani ajwain, sadabahar,
Chandrasur, Chitraik and opium. The state having mega bio-diversity and 11 agro-
5
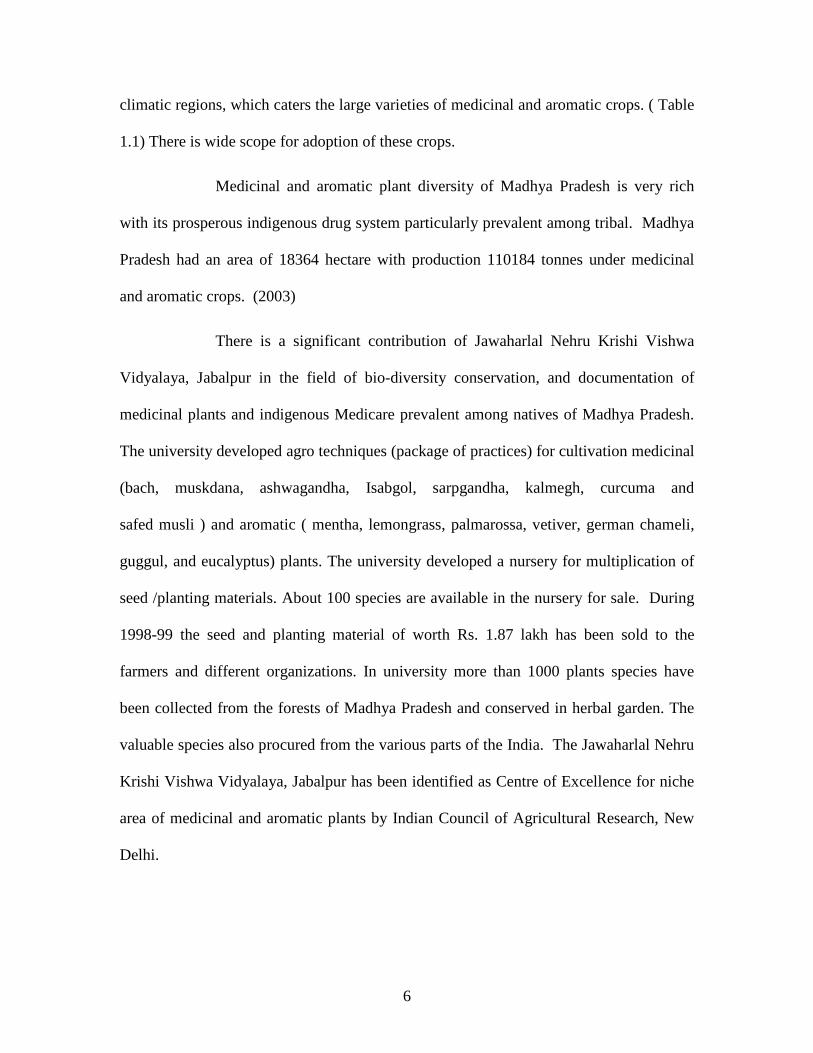
climatic regions, which caters the large varieties of medicinal and aromatic crops. ( Table
1.1) There is wide scope for adoption of these crops.
Medicinal and aromatic plant diversity of Madhya Pradesh is very rich
with its prosperous indigenous drug system particularly prevalent among tribal. Madhya
Pradesh had an area of 18364 hectare with production 110184 tonnes under medicinal
and aromatic crops. (2003)
There is a significant contribution of Jawaharlal Nehru Krishi Vishwa
Vidyalaya, Jabalpur in the field of bio-diversity conservation, and documentation of
medicinal plants and indigenous Medicare prevalent among natives of Madhya Pradesh.
The university developed agro techniques (package of practices) for cultivation medicinal
(bach, muskdana, ashwagandha, Isabgol, sarpgandha, kalmegh, curcuma and
safed musli ) and aromatic ( mentha, lemongrass, palmarossa, vetiver, german chameli,
guggul, and eucalyptus) plants. The university developed a nursery for multiplication of
seed /planting materials. About 100 species are available in the nursery for sale. During
1998-99 the seed and planting material of worth Rs. 1.87 lakh has been sold to the
farmers and different organizations. In university more than 1000 plants species have
been collected from the forests of Madhya Pradesh and conserved in herbal garden. The
valuable species also procured from the various parts of the India. The Jawaharlal Nehru
Krishi Vishwa Vidyalaya, Jabalpur has been identified as Centre of Excellence for niche
area of medicinal and aromatic plants by Indian Council of Agricultural Research, New
Delhi.
6
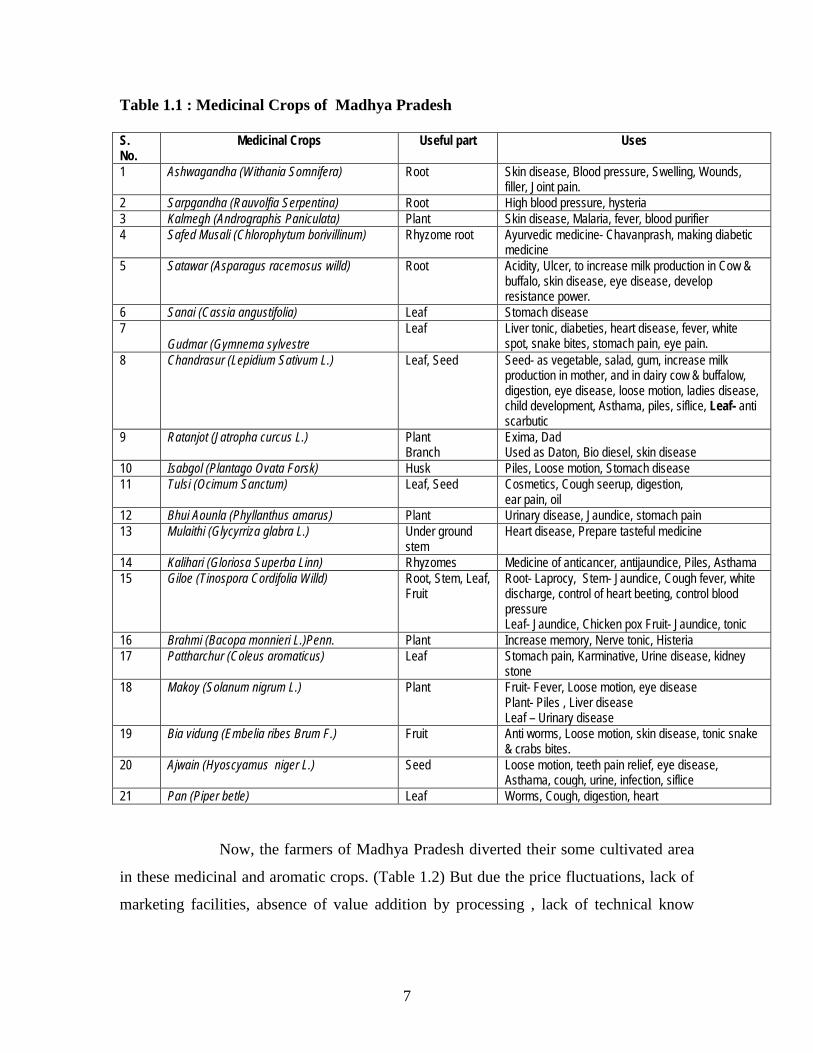
Table 1.1 : Medicinal Crops of Madhya Pradesh S. No.
Medicinal Crops Useful part Uses
1 Ashwagandha (Withania Somnifera) Root Skin disease, Blood pressure, Swelling, Wounds, filler, Joint pain.
2 Sarpgandha (Rauvolfia Serpentina) Root High blood pressure, hysteria 3 Kalmegh (Andrographis Paniculata) Plant Skin disease, Malaria, fever, blood purifier 4 Safed Musali (Chlorophytum borivillinum) Rhyzome root Ayurvedic medicine- Chavanprash, making diabetic
medicine 5 Satawar (Asparagus racemosus willd) Root Acidity, Ulcer, to increase milk production in Cow &
buffalo, skin disease, eye disease, develop resistance power.
6 Sanai (Cassia angustifolia) Leaf Stomach disease 7
Gudmar (Gymnema sylvestre Leaf Liver tonic, diabeties, heart disease, fever, white
spot, snake bites, stomach pain, eye pain. 8 Chandrasur (Lepidium Sativum L.) Leaf, Seed Seed- as vegetable, salad, gum, increase milk
production in mother, and in dairy cow & buffalow, digestion, eye disease, loose motion, ladies disease, child development, Asthama, piles, siflice, Leaf- anti scarbutic
9 Ratanjot (Jatropha curcus L.) Plant Branch
Exima, Dad Used as Daton, Bio diesel, skin disease
10 Isabgol (Plantago Ovata Forsk) Husk Piles, Loose motion, Stomach disease 11 Tulsi (Ocimum Sanctum) Leaf, Seed Cosmetics, Cough seerup, digestion,
ear pain, oil 12 Bhui Aounla (Phyllanthus amarus) Plant Urinary disease, Jaundice, stomach pain 13 Mulaithi (Glycyrriza glabra L.) Under ground
stem Heart disease, Prepare tasteful medicine
14 Kalihari (Gloriosa Superba Linn) Rhyzomes Medicine of anticancer, antijaundice, Piles, Asthama 15 Giloe (Tinospora Cordifolia Willd) Root, Stem, Leaf,
Fruit Root- Laprocy, Stem- Jaundice, Cough fever, white discharge, control of heart beeting, control blood pressure Leaf- Jaundice, Chicken pox Fruit- Jaundice, tonic
16 Brahmi (Bacopa monnieri L.)Penn. Plant Increase memory, Nerve tonic, Histeria 17 Pattharchur (Coleus aromaticus) Leaf Stomach pain, Karminative, Urine disease, kidney
stone 18 Makoy (Solanum nigrum L.) Plant Fruit- Fever, Loose motion, eye disease
Plant- Piles , Liver disease Leaf – Urinary disease
19 Bia vidung (Embelia ribes Brum F.) Fruit Anti worms, Loose motion, skin disease, tonic snake & crabs bites.
20 Ajwain (Hyoscyamus niger L.) Seed Loose motion, teeth pain relief, eye disease, Asthama, cough, urine, infection, siflice
21 Pan (Piper betle) Leaf Worms, Cough, digestion, heart
Now, the farmers of Madhya Pradesh diverted their some cultivated area
in these medicinal and aromatic crops. (Table 1.2) But due the price fluctuations, lack of
marketing facilities, absence of value addition by processing , lack of technical know
7
how of cultivation and procurement etc. problems related to these crops, the area as well
as production of these crop fluctuate year to year or even season to season.
Table 1.2: Major Aromatic Crops of Madhya Pradesh and their Uses
S. No.
Crops & their botanical name
Useful part Uses
1 Lemongrass (Cymbopogon flexuosus steud) Oil Cosmetic creams, soaps, insecticide, joint pain, odomas, gulab jal
2 Pamarosa (Cymbopogon maritini stapf) Oil Soap, Cosmetic, Scent, from its oil Jernoil extracted which used in Aroma industries
3 Java citronela (cymbopogon winter ianus) Oil Cosmetic, soap, preparation of aromatic jeeraniol, Hydroxisionel chemical, Anti mosqueto ointment deodorant.
4 Tulsi (ocimum besilium) Leaf, Seed Cosmetics, cough seerup, digestion, earpain, oil 5 Mentha (Mentha arvensis L) Oil Karminative, expectorant, stomach disease, cough &
cold, throat infection, fever, gas 6 Pachouli (Pogostemon calin Benth) Oil Scent, oil is itself top quality scent, soap, cosmetic
tobacco, cream, Anti worms, Medicine, its juice used in T.B.
7 Rajnigandha (Polianthes tubrosa L.) Oil & Flower Oil- in Aroma industries Flower- making Bucke, cut flower
8 Jama rosa (Cymbopogon nardas)
Oil Cosmetic, knee pain and arthritics
9 Lavender (Lavandula Officinalise L.) Oil Soap, shaving cream, powder, Anti-worm, Aromatherapy
10 Khus (Vetiveria Zizanioides) Oil, Root Oil- Scent, Cosmetic, Medicine, Root- Used in cooler
11 Nagarmotha (Cyperus Scariosus) Rhyzomes Heart disease, Loose motion, Ladies disease, body resistance, siflice
12 German Chameli (Matricaria Chamomella) Oil Oil- Anti allergy, body resistance, cream, shampoo, Flower & plant- Digestion, Cough, hair die, wine industries
13 Jasmine (Jasminum grandiflorum) Leaf, flower & plant
Leaf- mouth ulcer, Ear disease Flower- Crab bite, skin disease Plant- Loose motion, anti-worms, urine disease, and diseases concern with ladies.
Keeping these facts, the project entitled “Cultivation of Medicinal crops and
Aromatic crops as a means of diversification in Agriculture in Madhya Pradesh” was
entrusted to Agro-Economic Research Centre, , Jabalpur by Govt. of India, Ministry of
Agriculture & Cooperation, Directorate of Economics & Statistics, AER Division, New
Delhi with the following objectives.
8
Objectives of the Study
1. To understand the economics of cultivation/ production/ gathering of the
selected medicinal and aromatic crops and find their economic and market
potential as preferred for cultivation by the farmers.
2. To assess the extent of area being cultivated under selected medicinal and
aromatic crops.
3. Estimation of domestic and international demand for the selected medicinal
and aromatic crops in the light of the effect of new IPR regime on
pharmaceuticals.
4. To study the relative economic impact of cultivation of medicinal and
aromatic crops by the farmers (Relative costs- benefits, Market conditions).
5. To identify the bottlenecks in the marketing of medicinal and aromatic crops
and suggest possible remedies.
1.2 Research Methodology:
The study was confined to one of the leading state in cultivation of
medicinal and aromatic crops of India i.e. Madhya Pradesh contributing about 10 per
cent of area of India. The areas under these medicinal & aromatic crops grown in the
State were taken as a parameter for selection of crops. One crop from medicinal group
and another one from aromatic group were selected for the depth-in study. In Madhya
Pradesh the MAPS’ are growing in the area of 14,352 ha. In which the Isabgol (30.40%)
occupied the maximum acreage. Hence, Isabgol crop was selected in medicinal group,
while the lemon grass (289 ha) is a dominating crop in aromatic group, as it an only
aromatic crop of the state having the recorded data and grown in large scale was selected
for the study. (Table 1.3)
9
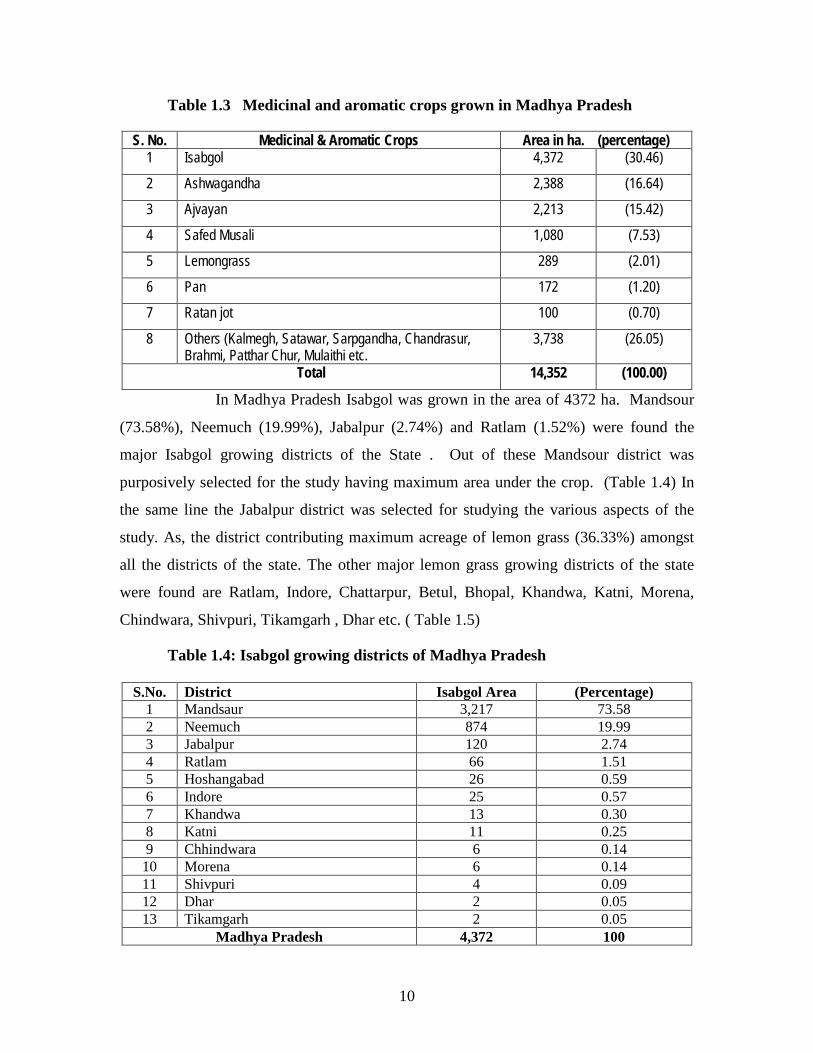
Table 1.3 Medicinal and aromatic crops grown in Madhya Pradesh
S. No. Medicinal & Aromatic Crops Area in ha. (percentage) 1 Isabgol 4,372 (30.46)
2 Ashwagandha 2,388 (16.64)
3 Ajvayan 2,213 (15.42)
4 Safed Musali 1,080 (7.53)
5 Lemongrass 289 (2.01)
6 Pan 172 (1.20)
7 Ratan jot 100 (0.70)
8 Others (Kalmegh, Satawar, Sarpgandha, Chandrasur, Brahmi, Patthar Chur, Mulaithi etc.
3,738 (26.05)
Total 14,352 (100.00)
In Madhya Pradesh Isabgol was grown in the area of 4372 ha. Mandsour
(73.58%), Neemuch (19.99%), Jabalpur (2.74%) and Ratlam (1.52%) were found the
major Isabgol growing districts of the State . Out of these Mandsour district was
purposively selected for the study having maximum area under the crop. (Table 1.4) In
the same line the Jabalpur district was selected for studying the various aspects of the
study. As, the district contributing maximum acreage of lemon grass (36.33%) amongst
all the districts of the state. The other major lemon grass growing districts of the state
were found are Ratlam, Indore, Chattarpur, Betul, Bhopal, Khandwa, Katni, Morena,
Chindwara, Shivpuri, Tikamgarh , Dhar etc. ( Table 1.5)
Table 1.4: Isabgol growing districts of Madhya Pradesh
S.No. District Isabgol Area (Percentage) 1 Mandsaur 3,217 73.58 2 Neemuch 874 19.99 3 Jabalpur 120 2.74 4 Ratlam 66 1.51 5 Hoshangabad 26 0.59 6 Indore 25 0.57 7 Khandwa 13 0.30 8 Katni 11 0.25 9 Chhindwara 6 0.14
10 Morena 6 0.14 11 Shivpuri 4 0.09 12 Dhar 2 0.05 13 Tikamgarh 2 0.05
Madhya Pradesh 4,372 100
10
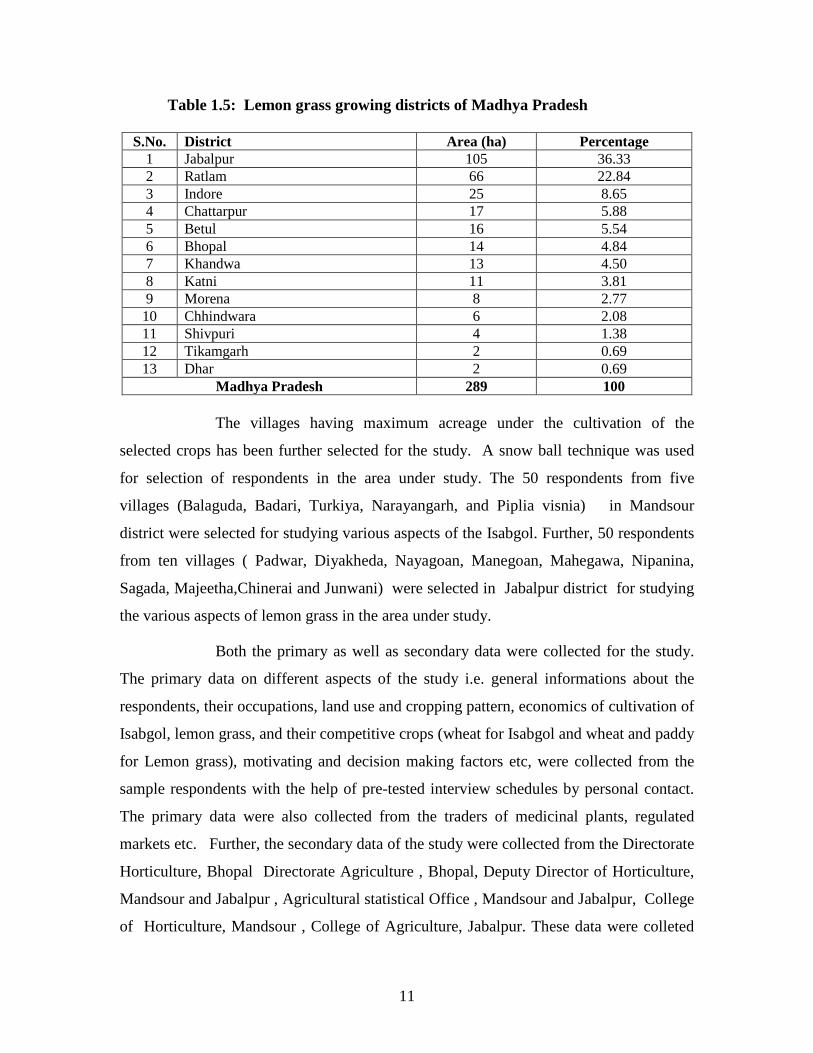
Table 1.5: Lemon grass growing districts of Madhya Pradesh
S.No. District Area (ha) Percentage 1 Jabalpur 105 36.33 2 Ratlam 66 22.84 3 Indore 25 8.65 4 Chattarpur 17 5.88 5 Betul 16 5.54 6 Bhopal 14 4.84 7 Khandwa 13 4.50 8 Katni 11 3.81 9 Morena 8 2.77
10 Chhindwara 6 2.08 11 Shivpuri 4 1.38 12 Tikamgarh 2 0.69 13 Dhar 2 0.69
Madhya Pradesh 289 100
The villages having maximum acreage under the cultivation of the
selected crops has been further selected for the study. A snow ball technique was used
for selection of respondents in the area under study. The 50 respondents from five
villages (Balaguda, Badari, Turkiya, Narayangarh, and Piplia visnia) in Mandsour
district were selected for studying various aspects of the Isabgol. Further, 50 respondents
from ten villages ( Padwar, Diyakheda, Nayagoan, Manegoan, Mahegawa, Nipanina,
Sagada, Majeetha,Chinerai and Junwani) were selected in Jabalpur district for studying
the various aspects of lemon grass in the area under study.
Both the primary as well as secondary data were collected for the study.
The primary data on different aspects of the study i.e. general informations about the
respondents, their occupations, land use and cropping pattern, economics of cultivation of
Isabgol, lemon grass, and their competitive crops (wheat for Isabgol and wheat and paddy
for Lemon grass), motivating and decision making factors etc, were collected from the
sample respondents with the help of pre-tested interview schedules by personal contact.
The primary data were also collected from the traders of medicinal plants, regulated
markets etc. Further, the secondary data of the study were collected from the Directorate
Horticulture, Bhopal Directorate Agriculture , Bhopal, Deputy Director of Horticulture,
Mandsour and Jabalpur , Agricultural statistical Office , Mandsour and Jabalpur, College
of Horticulture, Mandsour , College of Agriculture, Jabalpur. These data were colleted
11

on area, production, recommended cultivation practices of Isabgol and lemon grass etc.
aspects for the study. The primary data were colleted for the year 2003-2004 and the
secondary data are related to the year 1995-96 to 2002-03.
Mean, percentage, regression coefficient and linear growth statistical tools
were used for analysis the collected data. Where as, the operational cost, variable cost,
fixed cost, total cost, gross return, net return over variables cost, net return over total cost,
return per rupee at variable cost, return per rupee at total cost etc. are the cost of
cultivation concepts which were used for analyzing the cost of cultivation of the selected
crops.
1.3 Salient Features of Selected Crops:
As Isabgol from medicinal group and lemon grass in aromatic group were
selected for the study. The salient features of these crops are given in this subhead.
1.3.1 ISABGOL (Plantago Ovata Forsk)
Plantago is genus of over two hundred and fifty species and ten species are
found in India. These are scapigerous herbs. Psyllium husk, which is commonly
known as “Isopgul” is obtained from ripe seeds of Plantago Ovata Forsk and
Plantago Psyllium Decne. There are three types of Isabgol i.e. white ,red and black,
in which only white is used as medicines, while others are of low standards. It comes
under family-Plantensi.
A natural remedy for constipation regulates bowel functions. A bulk forming laxative
• Help reduce risk of heart attack by decreasing serum cholesterol through proper excretion of bile acids.
• Consumed with water prior to meals, reduces constipation of fat and calorie.
• Help reduce risk of heart attack by decreasing serum cholesterol through proper excretion of bile acids
ISABGOL (Plantago Ovata Forsk) Main Uses of ISABGOL (Plantago Ovata Forsk)
12
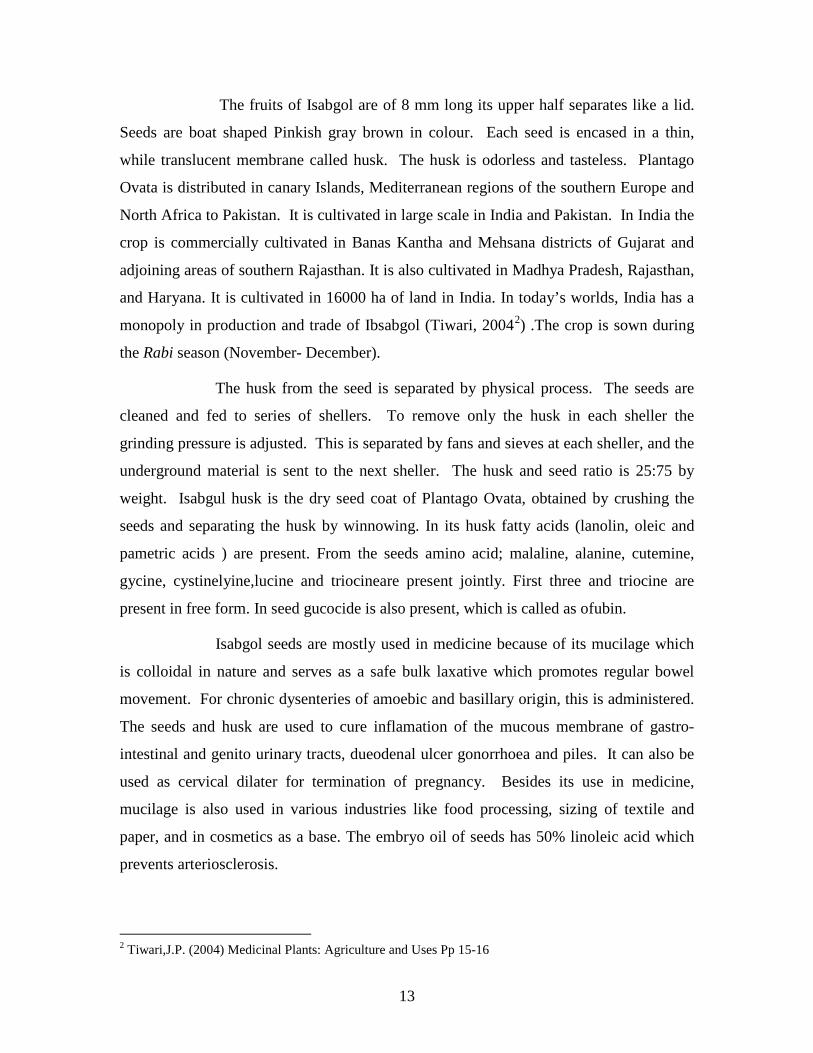
The fruits of Isabgol are of 8 mm long its upper half separates like a lid.
Seeds are boat shaped Pinkish gray brown in colour. Each seed is encased in a thin,
while translucent membrane called husk. The husk is odorless and tasteless. Plantago
Ovata is distributed in canary Islands, Mediterranean regions of the southern Europe and
North Africa to Pakistan. It is cultivated in large scale in India and Pakistan. In India the
crop is commercially cultivated in Banas Kantha and Mehsana districts of Gujarat and
adjoining areas of southern Rajasthan. It is also cultivated in Madhya Pradesh, Rajasthan,
and Haryana. It is cultivated in 16000 ha of land in India. In today’s worlds, India has a
monopoly in production and trade of Ibsabgol (Tiwari, 20042) .The crop is sown during
the Rabi season (November- December).
The husk from the seed is separated by physical process. The seeds are
cleaned and fed to series of shellers. To remove only the husk in each sheller the
grinding pressure is adjusted. This is separated by fans and sieves at each sheller, and the
underground material is sent to the next sheller. The husk and seed ratio is 25:75 by
weight. Isabgul husk is the dry seed coat of Plantago Ovata, obtained by crushing the
seeds and separating the husk by winnowing. In its husk fatty acids (lanolin, oleic and
pametric acids ) are present. From the seeds amino acid; malaline, alanine, cutemine,
gycine, cystinelyine,lucine and triocineare present jointly. First three and triocine are
present in free form. In seed gucocide is also present, which is called as ofubin.
Isabgol seeds are mostly used in medicine because of its mucilage which
is colloidal in nature and serves as a safe bulk laxative which promotes regular bowel
movement. For chronic dysenteries of amoebic and basillary origin, this is administered.
The seeds and husk are used to cure inflamation of the mucous membrane of gastro-
intestinal and genito urinary tracts, dueodenal ulcer gonorrhoea and piles. It can also be
used as cervical dilater for termination of pregnancy. Besides its use in medicine,
mucilage is also used in various industries like food processing, sizing of textile and
paper, and in cosmetics as a base. The embryo oil of seeds has 50% linoleic acid which
prevents arteriosclerosis.
2 Tiwari,J.P. (2004) Medicinal Plants: Agriculture and Uses Pp 15-16
13

1.3.2LEMONGRASS (Cymbopogon flexuosus)
The botanical genus name cymbopogan is derived from Greek Kymbe
“boat” and pogon beard”, it refers to the boat shaped spathes and the many awned
inflorescences which remind to a beard.
Lemongrass comes under family –
Poaceae (Gramineae), and is a perennial
herb widely cultivated in the tropics and
subtropics, designates two different
spices, East Indian, Cymbopogon
flexuosus (DC) Stapf, and West Indian
Cymbopogon citratus (DC ex Nees)
Stapf. East Indian lemongrass, also
known as cochin or Malabar grass is
native to India, while west Indian
lemongrass is native to southern Indian
and Ceylon. The lemongrasses are
cultivated commercially in Guatemala,
India, the people’s Republic of china,
Paraguay, England, Sri Lanka and other
parts of Indochina. Africa, Central
America and South America. The Plant
grows in dense clumps up to 2 meters in
diameter and has leaves up to 1 meter
long.
The plants need a warm, humid climate in full sun. They grow well in
sandy soils with adequate drainage. Since the plants rarely flower or set seed,
propagation is by root or plant division. The plants are harvested mechanically or by
hand about four times each year with the productive population lasting three to five years.
The quality of lemongrass oil is generally determined by the content of citral, the
aldehyde responsible for lemon odor. Some other constituents of the essential oils are
14
terpineol, myrcene, citronellol, methyl heptenone, dipentene, geraniol, limonene, nerol,
and farnesol, West Indian oil differs from East Indian Oil in that it is less soluble in 70
per cent alcohol and has a slightly lower citral content.
Lemongrass is used in herbal teas and other nonalcoholic beverages in
baked goods, and in confections. Such as soaps and creams, Citral extracted from the oil,
is used in flavoring soft drinks in scenting soaps and detergents, and as a mask for
disagreeable orders in several industrial products, Citral is also used in the synthesis of
ion ones used in perfumes and cosmetics.
The grass is considered a diuretic, tonic and stimulant. It promotes good
digestion, and a preparation of lemongrass with pepper has been used for relief of
menstrual troubles and nausea. It induces perspiration, to cool the body and reduce a
fever. Lemongrass is generally recognized as safe for human consumption of as a plant
extract/ essential oil.
As a medicinal plant, lemongrass has been considered a carminative and
insect repellent. West Indian lemongrass is reported to have antimicrobial activity oil of
West Indian lemongrass act as a central nervous system depressant. Oil of East Indian
lemongrass has antifungal activity. The volatile oils may also have some pesticide and
mutagenic activities. It is used to relief headache and tension by aromatherapy. It is also
used for beer brewing and preparation of spiced wines.
15

1.4 A Brief Review about the Crops and their Uses
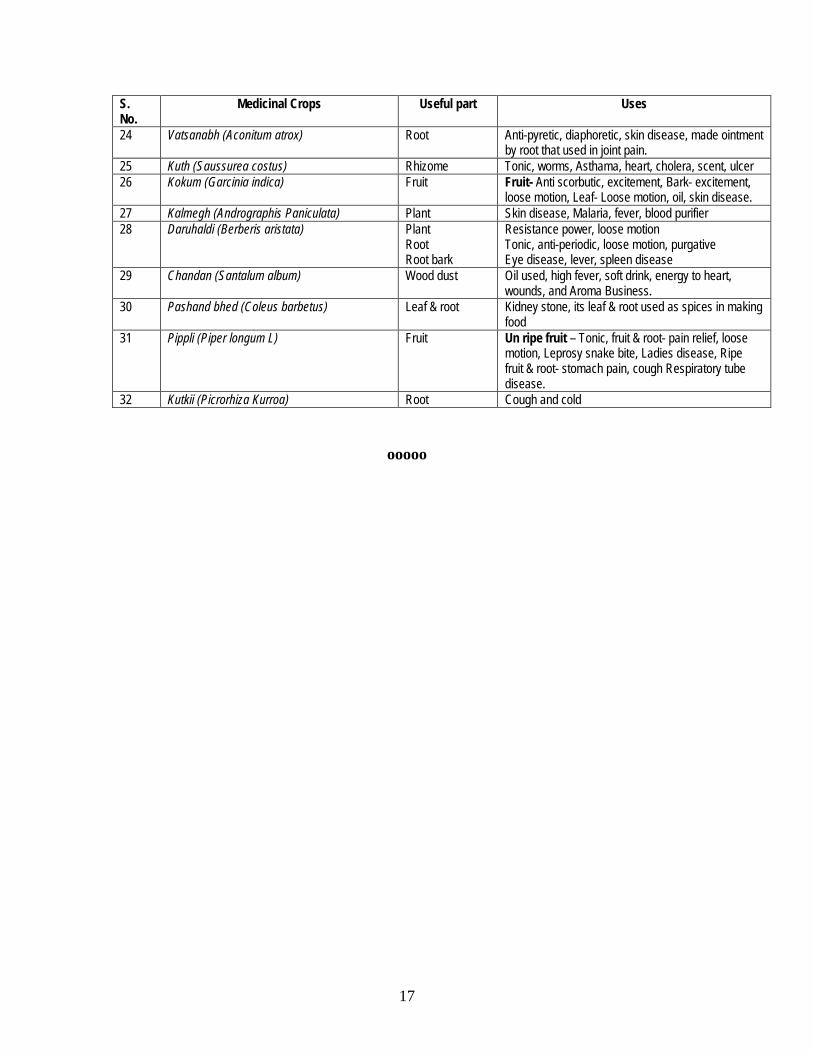
The National Medicinal Plant Board, New Delhi has identified specific 32
medicinal progeny. There demands are increasing in domestic & international market.
The list of identified medicinal crops by the government of India is as follows.
Table 1.6 : The list of identified medicinal crops by the government of India
S. No.
Medicinal Crops Useful part Uses
1 Aounla (Emblica officinalis) Fruit Aurvedic medicine- Triffla, Chavanprash 2 Ashok (Saraca Osoca) Bark Kidney stone, Urinary disease, gynecological disease 3 Makoy (Solanum nigrum) Plant Fruit- Fever, Loose motion, Eye disease
Plant- Piles, Liver disease Leaf – Urinary disease
4 Ashwagandha (withania somnifera)
Root Skin disease, Blood pressure, Swelling, wounds filler joint pain
5 Mulaithi (Glycyrrhiza glabvra) Underground stem
Heart disease, prepare tasteful medicine
6 Atees (Aconitumhetero phyllum) Root Tonic, Cough, Loose motion 7 Safed Musali (Chlorophytum brovillianum) Rhyzomes root Aurvedic medicine- Chavanprash, making diabetic
medicine 8 Bel (Aegle marmelos) Seed gum pulp Acidity, stomach disease 9 Bhui Aounla (Phyllanthus amarus) Plant Urinary disease, Jaundice, Stomach pain 10 Kesar (Corcus sativa) Flower Stomach pain, Carminatives, Urine disease, kidney
stone 11 Brahmi (Bacopa monnieri) Plant Increase memory, Nerve tonic, Hysteria 12 Chiraita (Swertia Chirata) Plant Stomach pain, worms, Loose motion, Asthama, Piles,
Liver disease 13 Giloe (Tinospora Cardifolia) Root, Stem, Leaf,
Fruit Root – Leprosy, Stem – Jaundice, cough fever, white discharge, control of heart beating, control blood pressure. Leaf- Jaundice, chicken pox, Fruit- Jaundice, tonic
14 Sarpgandha (Rauvolfia serpentina) Root High blood pressure, hysteria 15 Gudmar (Gymnema Sylvestre) Leaf Liver tonic, diabetes, heart disease, fever, white spot
snake bites, stomach pain, eye pain. 16 Sanai (Cassia angustifolia) Leaf Stomach disease 17 Guggle (Commiphora wightii) Gum Worms, cough, eye tonic, removal of blood impurity,
joint pain 18 Sataveri (Asparagus racemasus) Root Acidity, to increase milk production in cow & buffalo,
skin disease, eye disease, develop resistance power. 19 Isabgol (Plantago Ovata Forsk Husk Piles, Loose motion, stomach disease. 20 Tulsi (Ocimum sanctum) Leaf. Seed Cosmetics, cough syrup, digestion, ear pain, Oil 21 Jatamasi (Nardostachys jatamansi) Rhizomes Hysteria, heart tonic, hair tonic, low blood pressure,
in making hair oil.
22 Bia vidung (Embelia ribes) Fruit Anti worms, loose motion, skin disease, snake & crab bites.
23 Kalihari (Gloriasa Super ba) Rhizomes Medicine of anti cancer, anti jaundice, piles, asthama.
16
S. No.
Medicinal Crops Useful part Uses
24 Vatsanabh (Aconitum atrox) Root Anti-pyretic, diaphoretic, skin disease, made ointment by root that used in joint pain.
25 Kuth (Saussurea costus) Rhizome Tonic, worms, Asthama, heart, cholera, scent, ulcer 26 Kokum (Garcinia indica) Fruit Fruit- Anti scorbutic, excitement, Bark- excitement,
loose motion, Leaf- Loose motion, oil, skin disease. 27 Kalmegh (Andrographis Paniculata) Plant Skin disease, Malaria, fever, blood purifier 28 Daruhaldi (Berberis aristata) Plant
Root Root bark
Resistance power, loose motion Tonic, anti-periodic, loose motion, purgative Eye disease, lever, spleen disease
29 Chandan (Santalum album) Wood dust Oil used, high fever, soft drink, energy to heart, wounds, and Aroma Business.
30 Pashand bhed (Coleus barbetus) Leaf & root Kidney stone, its leaf & root used as spices in making food
31 Pippli (Piper longum L) Fruit Un ripe fruit – Tonic, fruit & root- pain relief, loose motion, Leprosy snake bite, Ladies disease, Ripe fruit & root- stomach pain, cough Respiratory tube disease.
32 Kutkii (Picrorhiza Kurroa) Root Cough and cold
ooooo
17

CHAPTER II PROFILE OF THE STUDY AREA
The group of medicinal and aromatic plants comprises a large of spices
which provides raw material for pharmaceutical, photochemical food flavors, cosmetic and
perfumery industries. Majority of the commercial supply of medicinal derived from the wild
resources and due to increasing demand of herbal drugs, many of these spices are frequently
facing a constant threat of extinction. Mounting demand of these medicinal plants spices can
only be fulfilled by promoting the large scale cultivation of the suitable crop and conserve of
bio-diversity of the natural resources. Medicinal and aromatic plants diversity of Madhya
Pradesh is very rich with its prosperous indigenous drug system particularly prevalent among
tribal. Due to the scientific research and development programme related to medicinal and
aromatic crops in Madhya Pradesh. By the massive efforts of the government and other
agencies, the area as well as production of these crop increased from 23328 ha to 27892 ha
and 139968 t to 167352 t respectively from 1999 to 2001 in Madhya Pradesh. The
cultivators were attracted from the market price the products of these crops, but soon after
when the supply of the product are increases the price of these product were fell
tremendously.
The problems related to medicinal and aromatic crops are lack of location specific
research related to these medicinal and aromatics crops suited to the soil and climate different
agro-climatic conditions of the Madhya Pradesh. The lack of technical knowledge of
cultivation of these crops, the poor value addition and inadequate marketing facilities for the
produce of these particular crops in the state, has resulted into decreasing trend of area and
production. The area and production for these crops during the period from 1999 to 2002
decreased by 1592 ha and 9554 ton per year. (Fig.1)These factors call for the further
intestifications of the efforts of the government. The marketing facilities and information
net work in the state are so weak that the list of processing plants in the state are not
available to the research workers. (Appendix -1) Although, there are few processing plants
of low capacity are functioning but not in the records. The time series data related to area
and production of various medicinal and aromatic crops being cultivated in the state has not
gave due weight-age as other crops. The patwari of particular village has not recorded data of
these crops, as area under theses crops particular village is negligible.
18

Fig. 2.1: Area & production of medicinal and aromatic Crops in M.P.
Hence, the efforts are made by the government officials that the secretary of the gram
panchayat will also look after the records the village patwari that whether he records data of
all crops i.e. major or minor sincerely or not. Further, there is an urgent need to adopt
scientific measure for cultivation, long term preservation, protection and sustainable
utilization of medicinal and aromatic crops in the state. The development programme on
medicinal and aromatic plants is also required to be monitored by quality analysis of the
produce in order to ensure materials of uniform quality in term of alkaloid, essential oil and
other chemical constitutions for which these plants are valued in the market.
The main medicinal plants which are growing at commercial lines and
recommended by the state government for the cultivation are ashwagandha ( Withania
somnifera L. Dunal L. ), sarpgandha ( Rauvolfia serpentina L.), kalmegh ( Andrographis
23328 26510 27892 20225 20825
15196 18364
139968
159060 167352
121350 124950
91176
110184
y = -9554.4x + 168795 R 2 = 0.5893
y = -1592.4x + 28132 R 2 = 0.5893
0
20000
40000
60000
80000
100000
120000
140000
160000
180000
1 2 3 4 5 6 7 Years( from 1995-2002)
ha/t
Area
Production
19

peniculata ), bhui aounla ( Phyllanthus amarus Schum & thonn), mulaithi ( Glycyrriza glabra
L. ) , kalihari ( Gloriosa superba Linn. ), giloe ( Tinospora cordifolia Willd.), gudmar(
Gymnema sylvestre ), satawar( Asparagus racemosus Willd.), tulsi ( Ocimum sanctum ), sanai
( Cassia angustifloia Vahl.), brahmi ( Bacopa monnieri L.Penn. ), pattharchur ( Coleus
forskohlli ), makoy ( Solanum nigrum L. ), biavidung ( Embelia ribes Burm F. ), safed
musli( Chlorophytum borivillianum ), isabgol (Plantago ovata Forsk.),
ajwayan(Trachyspermum ammi L..), pan (Piper betle), ratanjot (Jatropha curcus L.),
Chandrasur ( lepidium sativum L.), whereas the main aromatic plants which are grown in
M.P. are lemon grass ( Cybmbopogon flexuosus Steud.) , pamarosa ( Cybmbopogon maritini
Stapf.), jamarosa ( Cybmbopogon nardas), khus( vetiveria zizanioides ), mentha ( mentha
arvensis L.), rajni gandha( Polianthes tubrosa L.), lavender ( Levendula officinalis L.),
jasmine( Jasminum sembsi), nagarmotha ( Cyperus scariosus), pachouli( Pogostemon calin
Benth.) german chameli ( Matricaria Chamomella ), java citronela ( Cybmbopogon
winterianus )etc. But these crops are grown in very small scale due the risk (particularly
related to the market price of the produce) in taking these crops in the area under study. It is
also mentioned that traders, who sold the planting materials of these crops are in benefited, as
they sold the planting materials at higher price to the cultivators at the time when the supply
of these crop was low and the price in the market was high. They take the advantage of the
time. And when the produce of the cultivators are came in the market, due to more supply
their prices lowered down.
20
2.1 General Description of the State:
Madhya Pradesh, in its present form, came into existence on November 1, 2000
following its bifurcation to create a new state of Chattisgarh. The undivided Madhya Pradesh
was founded on November 1, 1956.Madhya Pradesh, because of its central location in India,
has remained a crucible of historical currents from North, South, East and West.
Madhya Pradesh is situated in the heart of India between latitudes 170-260
North and longitude 740 –840 East. It is the second largest state after Rajasthan of Indian
Union with a total geographical area of 308 thousand square Kilometers. In terms of
population (6, 03, 85,118) it occupies 5th position in India (2001). It has 9-commissionaire
division (Chambal, Gwalior, Bhopal, Ujjain, Indore, Sagar, Rewa, Jabalpur and
Hoshangabad) divided into 45 districts, 260 tehsils, 313 blocks & 370 towns and 76,468
villages. It is abundantly rich in minerals and bio resources. With 27% of land area under
forests, it supports a wide variety of animal and plant life. The state has a rich history, culture
and crafts.
2.2.2 Physiography:
The Physiography of the state exhibits a great deal of diversity with areas ranging
from less than 50 meter above Mean Sea Level to more than 1200 meter. The state falls under
the catchments of Jamuna, Ganga, Narmada, Mahanadi and Godavari. On the basis of broad
land features, the state could be classified in 5 physiographic regions and 11 agro-climatic
zones (Table2.1& Fig 2.2.)
1. Northern low lying plains comprising Gwalior, Bhind and Morena districts
and extend to Bundelkhand up to the west of Panna range and excludes certain
parts of Rewa district between Panna and Kymore hills of Baghelkhand.
2. The Malwa and Vindhyan Plateau comprises of Vidisha, Shivpuri, Datia,
Guna, Morena, Ujjain and Mandsour districts and parts of Sehore, Raisen and
Dewas districts. It consists of large undulating plains of black cotton soil
21

dotted with flat-topped hills. It has also hilly Vindhyan Plateau situated it the
north of Narmada Valley and to the south of the low-lying regions of
Bundelkhand and Baghelkhand. It spared from east of Malwa plateau to
Maikal and Dorea hills Satpura range
3. The Narmada Valley stretching from Jabalpur in the east up to Barwani
district in the west. It is nearly 560 Km long and 48 Km wide and is walled on
the north by the Vindhyan range and on the south by Satpura range. It covers
the districts of Jabalpur, Nasinghpur, Hoshangabad, Khandwa, Khargone,
Barwani, Dhar, and some parts of Raisen, Sehore, and Dewas districts.
4. The Satpura range runs from west to east for about 640 Km through Khandwa,
Betul, Chhindwara, Seoni, Mandla, Bilaspur and Sarguja districts. Its northern
spurs go into Hoshangabad and Nasinghpur districts and in the south an
extensive spur of 160 Km covers entire Balaghat districts.
5. Madhya Pradesh also covers Balaghat and Shahdol district of Chattisgarh
Plains and Northern Hills of Chattisgarh zone respectively.
22
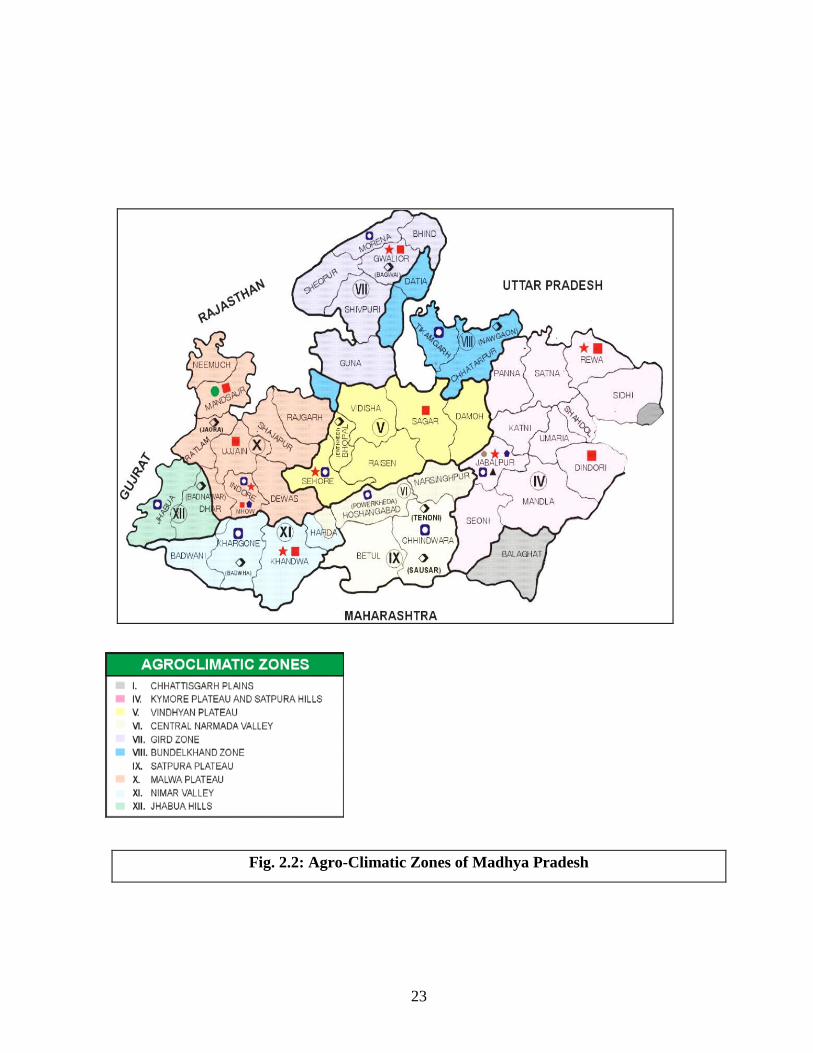
Fig. 2.2: Agro-Climatic Zones of Madhya Pradesh
23

Table-2.1: Agro-Climatic Regions and covered Districts /Tehsils in Madhya Pradesh
(Area in Lakh ha)
Agro-Climatic Regions Districts /Tehsils Geogra-phical Area
Percent to Geographical Area
1.Malwa Plateau Indore, Dhar, (Dhar, Badnawar, Sardarpur tehsils) Shajapur,
Mandsour, Neemuch, Ratlam, Ujjain, Dewas Rajgarh districts
and Petlawad tehsil of Jhabua district
51.47 16.74
2.Vindhyan Plateau Bhopal, Vidisha, Sehore (Sehore, Ashta, Ichhawar,
Nasrullaganj tehsils) Raisen (Raisen, Gairatganj, Begamganj,
Silwani, Goharganj, Udaipura tehsils), Damoh, Guna
(Chachora & Raghogarh tehsils) & Sagar districts
42.59 13.85
3.Central Narmada Valley Hoshangabad (Seoni-Malwa, Hoshangabad, Sohagpur
tehsils), Harda, Nasinghpur districts, Budhani and Barelli tehsil
of Sehore and Raisen districts respectively
17.45 5.67
4.Satpura Plateau Betul, Chhindwara districts 21.93 7.13
5.Jhabua Hills Jhabua, Jobat, Alirajpur tehsils of Jhabua district & kukshi
tehsil of Dhar district
6.88 2.24
6.Gird Region Gwalior, Bhind, Morena, Shivpur-Kalan, Guna (Mungawali
and Ashoknagar tehsils), Shivpuri (Shivpuri, Kolaras, Pohari
tehsils)
31.85 10.36
7. Kymore Plateau Jabalpur, Katni, Rewa, Panna, Satna, Sidhi, Seoni and
Gopadbanas & Deosar tehsils of Sidhi district.
49.97 16.25
8.Bundel Khand Region Tikamgarh, Chhatarpur, Datia districts, Karela, Pachore tehsil
of Shivpuri and Guna tehsil of Guna district
22.82 7.42
9.Nimar Valley Khandwa, Khargone, Burhanpur, Barwani district, Manawar
tehsil of Dhar district and Harda district
25.17 8.18
10.Northern Hills of Chattisgarh
Shahdol, Umariya, Anuppur, Mandla, Dindori district &
Singrauli tehsil of Sidhi district
28.17 9.16
11. Chattisgarh plain Balaghat district 9.25 3.00
Madhya Pradesh 307.55 100.00
24

2.1.2 Soils: The main soil types found in Madhya Pradesh are alluvial, deep black, medium black
shallow black, mixed red and black, mixed red and yellow and skeletal soils.
(Table 2. 2)
Table 2.2: - Soil types and districts covered in Madhya Pradesh.
Types of Soil Districts covered
Alluvial Soil Bhind, Morena and Gwalior Deep Black Soil Hoshangabad and Nasinghpur Medium Black Soil Jabalpur, Sagar, Vidisha, Sehore, Damoh, Guna, Bhopal,
Raisen, Rajgarh, Indore, Dewas, Ujjain, Mandsour, Shajapur, Ratlam, Dhar, Khargone and Khandwa
Shallow Black Soil Betul, Chhindwara and Seoni Red & Black Soil Shivpuri, Rewa, Satna, Panna, Sidhi, Chhaterpur,
Tikamgarh, Datia and some parts of Guna district. Red & Yellow Soil Balaghat. Gravelly Soil Mandla.
2.1.3 Climate:
The climate of Madhya Pradesh by virtue of its location is predominantly
moist sub humid to dry sub humid, semi arid to dry sub-humid and semi arid in east, west and
central plateau and hills respectively, according to agro-climatic regions of India. The seasons
in Madhya Pradesh are as given below:
Table 2.3: Seasons and their periods in Madhya Pradesh
Seasons Period
From To Rainy June September Post Monsoon October November Winter December February Summer March May
25

2.1.3.1 Rain fall:
The annual rainfall received in the state varies from 800 mm. in the northern and
western regions to 1600 mm in the eastern districts. In some years rainfall goes much below
to the normal. Most of rainfall is received in the Monsoon season from June to September
and about 10 per cent of the rainfall is received in the remaining part of the year.
2.1.3.2 Temperature:
The maximum temperature during extreme summer reaches as high as 470C
and the minimum during winter dips up to 50C. The maximum normal temperature varies
between 25 and 350C and minimum normal between 100 to 200C.The relative humidity
ranges from 40 to 70 % throughout the year.
2.1.4 Land use pattern:
Classification of land use gives an idea of how the land is put to different use and
where intensive cultivation can be adopted in particular and how the limited land available
can be put to alternative uses for the development of the area in general without affecting
adversely the environment ecology. Madhya Pradesh occupies to total of 30755.60 thousand
ha of geographical area out of this 48.93% ( 15048.50 thousand ha) is the net area sown
with 4842.73 thousand ha under double cropping area. The cropping intensity was only
123.66 per cent for the state as a whole. The State also has 27.90 per cent of the area under
forest, 3.83 per cent area under uncultivated land, and 3.93 per cent under fallow land. (Table
2.4)
26
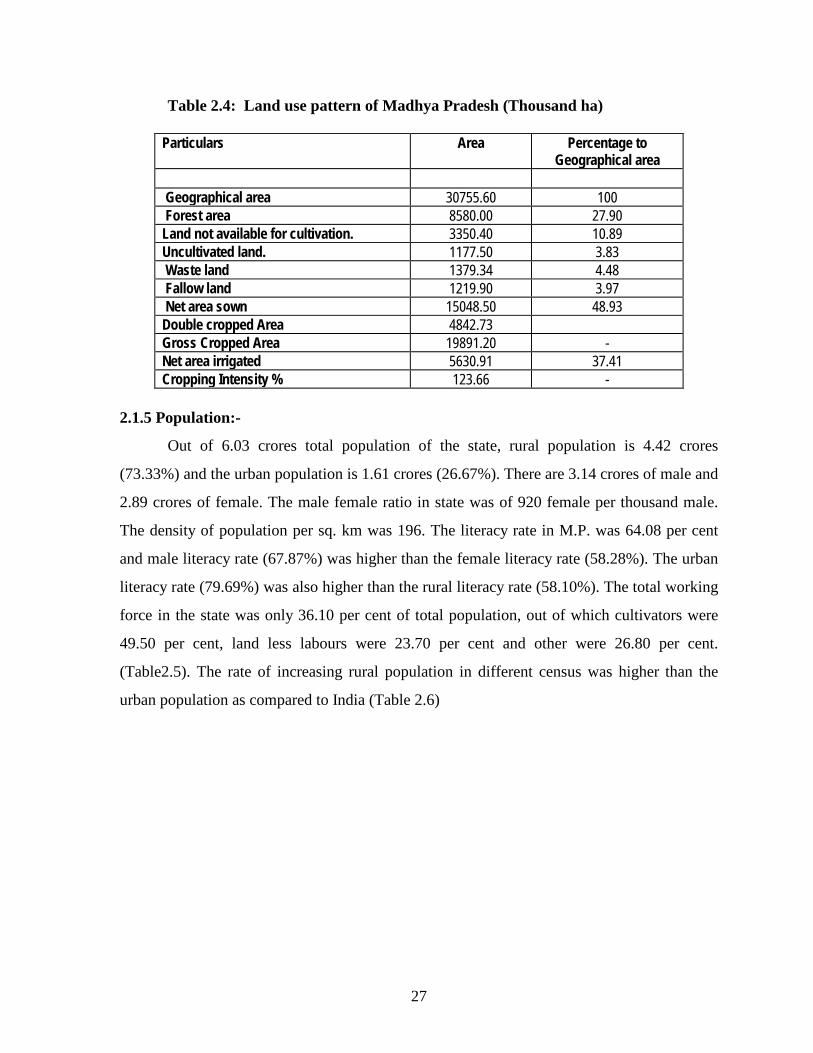
Table 2.4: Land use pattern of Madhya Pradesh (Thousand ha)
Particulars Area Percentage to Geographical area
Geographical area 30755.60 100 Forest area 8580.00 27.90 Land not available for cultivation. 3350.40 10.89 Uncultivated land. 1177.50 3.83 Waste land 1379.34 4.48 Fallow land 1219.90 3.97 Net area sown 15048.50 48.93 Double cropped Area 4842.73 Gross Cropped Area 19891.20 - Net area irrigated 5630.91 37.41 Cropping Intensity % 123.66 -
2.1.5 Population:-
Out of 6.03 crores total population of the state, rural population is 4.42 crores
(73.33%) and the urban population is 1.61 crores (26.67%). There are 3.14 crores of male and
2.89 crores of female. The male female ratio in state was of 920 female per thousand male.
The density of population per sq. km was 196. The literacy rate in M.P. was 64.08 per cent
and male literacy rate (67.87%) was higher than the female literacy rate (58.28%). The urban
literacy rate (79.69%) was also higher than the rural literacy rate (58.10%). The total working
force in the state was only 36.10 per cent of total population, out of which cultivators were
49.50 per cent, land less labours were 23.70 per cent and other were 26.80 per cent.
(Table2.5). The rate of increasing rural population in different census was higher than the
urban population as compared to India (Table 2.6)
27

Table 2.5: - Population parameters of M.P.(Census-2001)
Table 2.6 : Per cent increase in Rural and Urban Population during Different census.
Censuses Rural Urban India M.P. India M.P. 1951 8.80 4.82 41.40 34.52
1961 20.64 22.83 26.41 39.57
1971 21.63 26.83 38.23 44.31
1981 19.32 21.28 46.14 52.92
1991 20.01 22.44 36.47 43.92
2001 17.97 22.02 31.13 31.19
Particulars Population Percentage to the total population
Population Male 3,14,56,873 52.09 Female 2,89,28,245 47.91 Rural 4,42,85,528 73.33 Urban 1,61,02,590 26.67 Total Population
6,03,85,118 100.00
Female per thousand male 920 Density per Sq Km 196 Literacy Rate Rural Literacy 58.10 Urban Literacy 79.69 Male Literacy 76.87 Female Literacy 50.28 Total Literacy
64.08
Working Force Cultivators 49.50 Landless labours 23.70 Other working Force 26.80 Total Working Force
36.10
28
2.1.6 Cropping Pattern: Madhya Pradesh occupied 125.36 million ha of land under total food grains,
which was 14.42 per cent of the India. The total acreage under major cereals, pulses and
oilseed were 126.88, 23.82 and 26.71 million ha which were respectively of 10.31, 21.2 and
23.10 percentage of the India. (Table 2.7.1). As regards to total production of M.P. the State
produces 203.94 million tonnes of total food grains, in which cereal production was of
214.63 million t, pulses production was 14.81 millions t. and oilseed production was 25.21
million t. The M.P. contributed 8.08, 24.02 and 22.30 per cent of total cereals, pulses and
oilseeds respectively to India’s production. The productivity of bajra, gram, arhar and rape
seed and mustard in M.P. was that of higher than the India, while the productivity of other
crops was lower in M.P. (Table 2.7.2)
29
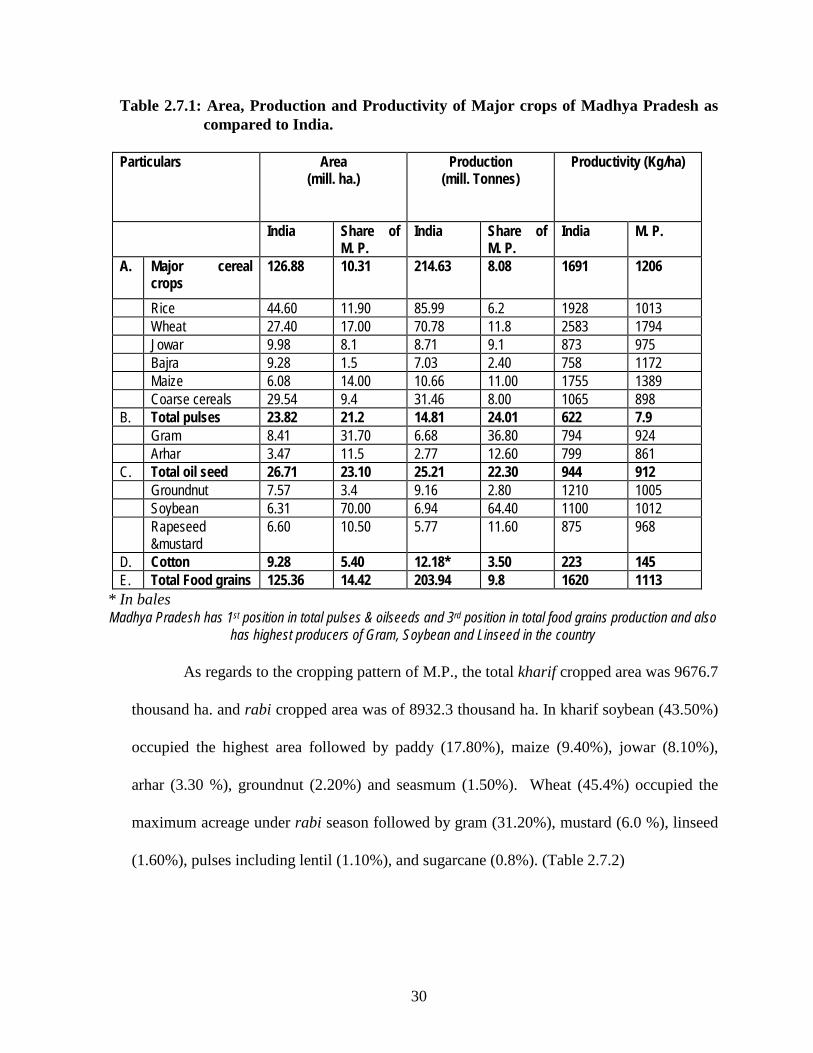
Table 2.7.1: Area, Production and Productivity of Major crops of Madhya Pradesh as compared to India.
Particulars
Area (mill. ha.)
Production (mill. Tonnes)
Productivity (Kg/ha)
India Share of M. P.
India Share of M. P.
India M. P.
A. Major cereal crops
126.88 10.31 214.63 8.08 1691 1206
Rice 44.60 11.90 85.99 6.2 1928 1013 Wheat 27.40 17.00 70.78 11.8 2583 1794 Jowar 9.98 8.1 8.71 9.1 873 975 Bajra 9.28 1.5 7.03 2.40 758 1172 Maize 6.08 14.00 10.66 11.00 1755 1389 Coarse cereals 29.54 9.4 31.46 8.00 1065 898 B. Total pulses 23.82 21.2 14.81 24.01 622 7.9 Gram 8.41 31.70 6.68 36.80 794 924 Arhar 3.47 11.5 2.77 12.60 799 861 C. Total oil seed 26.71 23.10 25.21 22.30 944 912 Groundnut 7.57 3.4 9.16 2.80 1210 1005 Soybean 6.31 70.00 6.94 64.40 1100 1012 Rapeseed
&mustard 6.60 10.50 5.77 11.60 875 968
D. Cotton 9.28 5.40 12.18* 3.50 223 145 E. Total Food grains 125.36 14.42 203.94 9.8 1620 1113
* In bales Madhya Pradesh has 1st position in total pulses & oilseeds and 3rd position in total food grains production and also
has highest producers of Gram, Soybean and Linseed in the country As regards to the cropping pattern of M.P., the total kharif cropped area was 9676.7
thousand ha. and rabi cropped area was of 8932.3 thousand ha. In kharif soybean (43.50%)
occupied the highest area followed by paddy (17.80%), maize (9.40%), jowar (8.10%),
arhar (3.30 %), groundnut (2.20%) and seasmum (1.50%). Wheat (45.4%) occupied the
maximum acreage under rabi season followed by gram (31.20%), mustard (6.0 %), linseed
(1.60%), pulses including lentil (1.10%), and sugarcane (0.8%). (Table 2.7.2)
30
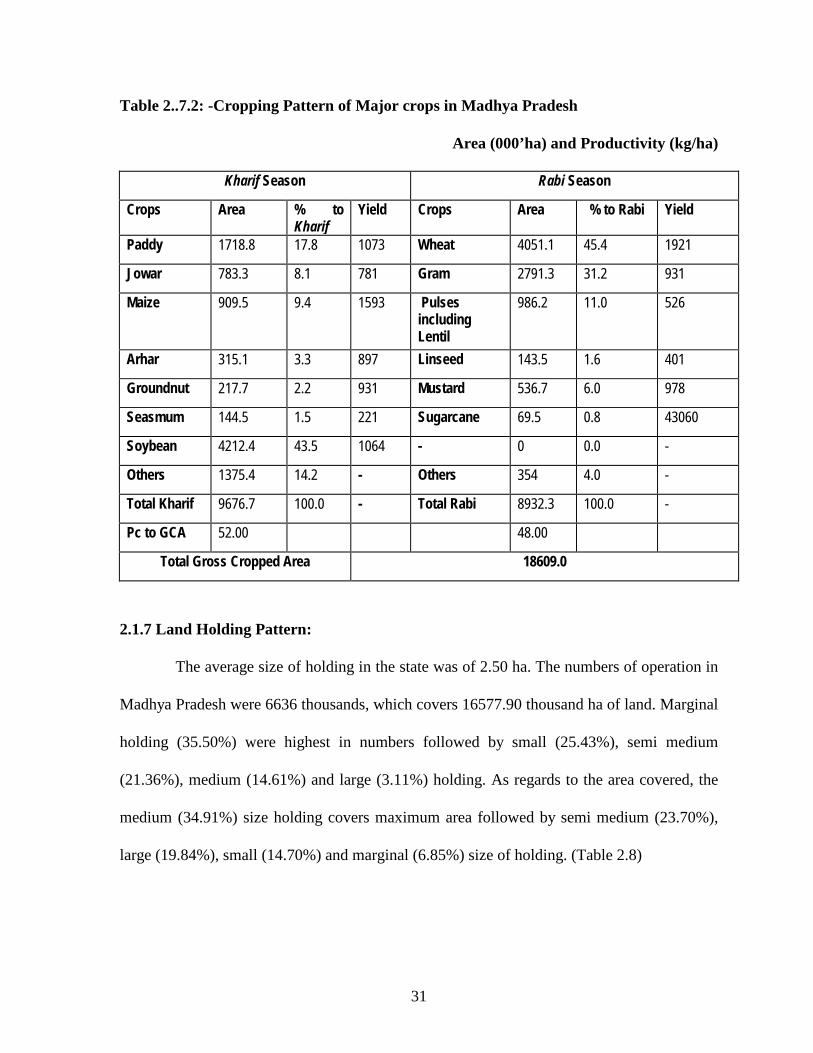
Table 2..7.2: -Cropping Pattern of Major crops in Madhya Pradesh
Area (000’ha) and Productivity (kg/ha)
Kharif Season Rabi Season
Crops Area % to Kharif
Yield Crops Area % to Rabi Yield
Paddy 1718.8 17.8 1073 Wheat 4051.1 45.4 1921
Jowar 783.3 8.1 781 Gram 2791.3 31.2 931
Maize 909.5 9.4 1593 Pulses including Lentil
986.2 11.0 526
Arhar 315.1 3.3 897 Linseed 143.5 1.6 401
Groundnut 217.7 2.2 931 Mustard 536.7 6.0 978
Seasmum 144.5 1.5 221 Sugarcane 69.5 0.8 43060
Soybean 4212.4 43.5 1064 - 0 0.0 -
Others 1375.4 14.2 - Others 354 4.0 -
Total Kharif 9676.7 100.0 - Total Rabi 8932.3 100.0 -
Pc to GCA 52.00 48.00
Total Gross Cropped Area 18609.0
2.1.7 Land Holding Pattern:
The average size of holding in the state was of 2.50 ha. The numbers of operation in
Madhya Pradesh were 6636 thousands, which covers 16577.90 thousand ha of land. Marginal
holding (35.50%) were highest in numbers followed by small (25.43%), semi medium
(21.36%), medium (14.61%) and large (3.11%) holding. As regards to the area covered, the
medium (34.91%) size holding covers maximum area followed by semi medium (23.70%),
large (19.84%), small (14.70%) and marginal (6.85%) size of holding. (Table 2.8)
31
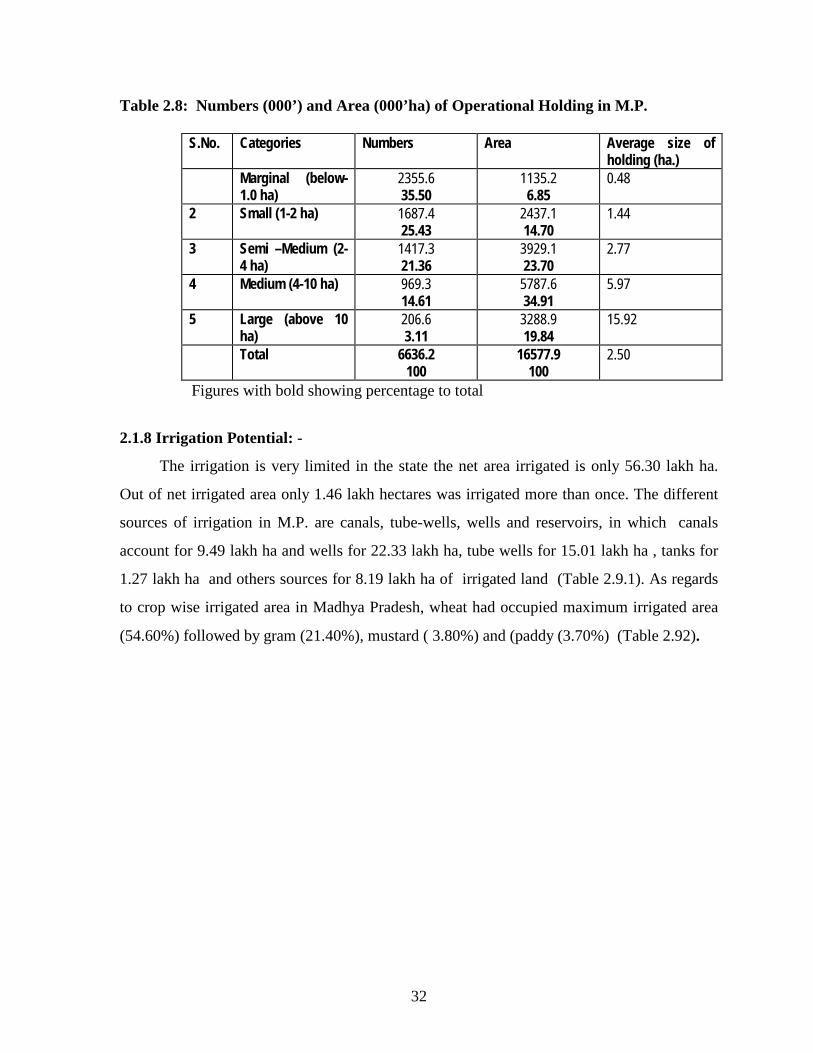
Table 2.8: Numbers (000’) and Area (000’ha) of Operational Holding in M.P.
S.No. Categories Numbers Area Average size of holding (ha.)
Marginal (below-1.0 ha)
2355.6 35.50
1135.2 6.85
0.48
2 Small (1-2 ha) 1687.4 25.43
2437.1 14.70
1.44
3 Semi –Medium (2-4 ha)
1417.3 21.36
3929.1 23.70
2.77
4 Medium (4-10 ha) 969.3 14.61
5787.6 34.91
5.97
5 Large (above 10 ha)
206.6 3.11
3288.9 19.84
15.92
Total 6636.2 100
16577.9 100
2.50
Figures with bold showing percentage to total
2.1.8 Irrigation Potential: -
The irrigation is very limited in the state the net area irrigated is only 56.30 lakh ha.
Out of net irrigated area only 1.46 lakh hectares was irrigated more than once. The different
sources of irrigation in M.P. are canals, tube-wells, wells and reservoirs, in which canals
account for 9.49 lakh ha and wells for 22.33 lakh ha, tube wells for 15.01 lakh ha , tanks for
1.27 lakh ha and others sources for 8.19 lakh ha of irrigated land (Table 2.9.1). As regards
to crop wise irrigated area in Madhya Pradesh, wheat had occupied maximum irrigated area
(54.60%) followed by gram (21.40%), mustard ( 3.80%) and (paddy (3.70%) (Table 2.92).
32

Table.2.9.1 – Source wise irrigated area in M.P. ( ha)
Irrigation Sources Net irrigated
Area Percentage to
Total Gross irrigated Area
1. Wells 2233493 39.67 1534791
2. Canals 949210 16.86 990457
3. Tanks 127210 2.26 131259
4. Tube wells 1501130 26.66 2294458
5. Reservoirs/ others 819838 14.56 825105
Total 5630881 100.00 5776070
Table 2.9.2 : Crop wise irrigated area in Madhya Pradesh
Area ( ha)
Crops Area Percentage to Total
Wheat 3151051 54.6
Gram 1234626 21.4
Paddy 212320 3.7
Mustard 216714 3.8
Cotton 202335 3.5
Sugarcane 69185 1.2
Barley 37433 0.6
Linseed 4768 0.1
Maize 13663 0.2
Others 633975 11.0
Total Irrigated Area 5776070 100.0
33

2..1.11 Fertilizers, Bio-Fertilizers and Equipment Use
The total fertilizers consumption was only 39.9 kg/ha in Madhya Pradesh, which was
quite low as compared to India (81.8kg/ha.).The consumption of nitrogenous, phosphatic and
potassic fertilizers was only 23.30, 14.67 and 1.98 kg/ ha respectively. The bio fertilizer
consumptions was also not at satisfactory level, as the farmer of the state consumed only 0.1,
0.1 and 0.2 packets per ha. of Rhizobium, Azotobactor and PSB cultures respectively, in their
fields. The position of farm machinery is still traditional with local differences in ownerships
and operational methods of tractors, iron ploughs and wooden ploughs. At present there are
243145 tractors, 3265161 wooden plough, 577696 iron ploughs, 348334 diesel pumps and
1411640 electrics pumps in the state. (Table 2.10)
Table 2.10: - Fertilizers, Bio-fertilizers consumption (2000-01) and Equipments in Madhya Pradesh
Particulars Quantity (t) Kg Per ha
Fertilizer’s consumption Nitrogenous 606072 23.30 Phosphatic 381679 14.67 Potassic 51520 1.98 Total 1039271 39.95 Bio-fertilizer's Packets Packets/ha Rhizobium 2080778 0.1 Azotobactor 575416 0.1 P. S. B. 3144651 0.2 Total 5800845 0.4 Equipment Numbers Per Farm Tractor 243145 0.019 Wooden Plough 3265161 0.577 Iron Plough 577696 0.049 Diesel Pump 348334 0.19 Electric Pump 1411640 0.116 Sugarcane Crusher Power 7421 Sugarcane Crusher Bullock 7103 Bullock Cart 1415305
34
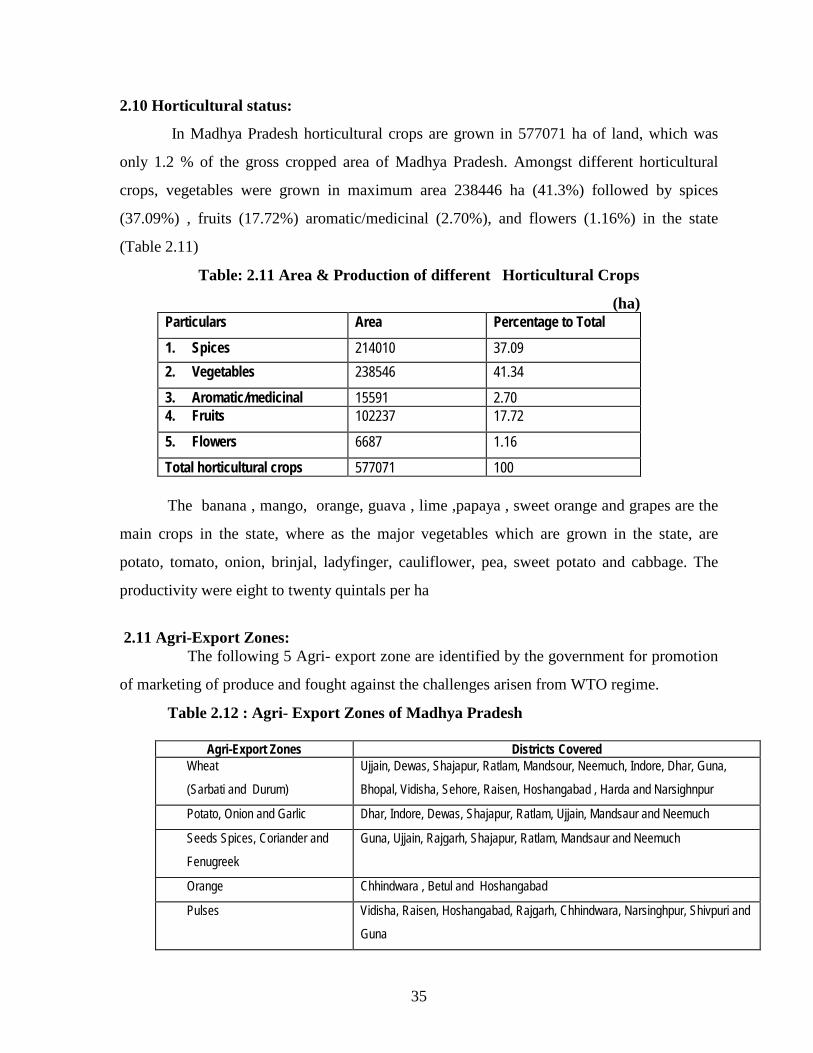
2.10 Horticultural status:
In Madhya Pradesh horticultural crops are grown in 577071 ha of land, which was
only 1.2 % of the gross cropped area of Madhya Pradesh. Amongst different horticultural
crops, vegetables were grown in maximum area 238446 ha (41.3%) followed by spices
(37.09%) , fruits (17.72%) aromatic/medicinal (2.70%), and flowers (1.16%) in the state
(Table 2.11)
Table: 2.11 Area & Production of different Horticultural Crops
(ha) Particulars Area Percentage to Total 1. Spices 214010 37.09 2. Vegetables 238546 41.34
3. Aromatic/medicinal 15591 2.70 4. Fruits 102237 17.72
5. Flowers 6687 1.16
Total horticultural crops 577071 100 The banana , mango, orange, guava , lime ,papaya , sweet orange and grapes are the
main crops in the state, where as the major vegetables which are grown in the state, are
potato, tomato, onion, brinjal, ladyfinger, cauliflower, pea, sweet potato and cabbage. The
productivity were eight to twenty quintals per ha
2.11 Agri-Export Zones: The following 5 Agri- export zone are identified by the government for promotion
of marketing of produce and fought against the challenges arisen from WTO regime.
Table 2.12 : Agri- Export Zones of Madhya Pradesh
Agri-Export Zones Districts Covered Wheat
(Sarbati and Durum)
Ujjain, Dewas, Shajapur, Ratlam, Mandsour, Neemuch, Indore, Dhar, Guna,
Bhopal, Vidisha, Sehore, Raisen, Hoshangabad , Harda and Narsighnpur
Potato, Onion and Garlic Dhar, Indore, Dewas, Shajapur, Ratlam, Ujjain, Mandsaur and Neemuch
Seeds Spices, Coriander and
Fenugreek
Guna, Ujjain, Rajgarh, Shajapur, Ratlam, Mandsaur and Neemuch
Orange Chhindwara , Betul and Hoshangabad
Pulses Vidisha, Raisen, Hoshangabad, Rajgarh, Chhindwara, Narsinghpur, Shivpuri and
Guna
35

2.2 Description of Selected Districts: 2.2.1 MANDSAUR:
Mandsour district falls in Malwa Agro climatic region of M.P. It is rich in
archaeological and historical heritage. But what makes it famous is the temple of Lord
Pashupatinath located on the bank of shivna river. Its idol has parallel only in Nepal.
The most common language is Malwi ( Rajasthani and Hindi Mixed ). It is also
famous for large production of Opium around the world. The slate pencil industry is
the main industry of the district.
Mandsaur District forms the northern projection of Madhya Pradesh from its western
Division, i.e. Ujjain Commissioner's Division. It lies between the parallels of latitude 230
45' 50" North and 250 2' 55" North, and between the meridians of longitude 740 42' 30"
East and 750 50' 20" East.
The District is bounded by four Districts of Rajasthan, namely Chittorgarh in
the west and north,Bhilwara in north, Kota in the north-east and Jhalawar in the east while
Ratlam District of Madhya Pradesh bounds it in the South.
The District takes its name from the headquarter’s town, Mandsaur. It is considered
to have been evolved from Marhsaur, originating from Marh and Saur (or Dasaur, two of
the villages which merged in the town. The District is divided into four sub divisions and
six tehsils. The sub divisional head quarters are at Mandsaur, Malhargarh, Sitamau and
Garoth. Among the tehsils, Malhargarh and Mandsaur lie in the west, arranged from north
to south. Similarly Suwasra Bhanpura, Garoth and Sitamau lie in the eastern part.
The District is an average size district of Madhya Pradesh. It extends for about 142 km.
from north to south and 124 km. from east to west. The total area is 5521 sq. km. with a
population of 1183274 in 2001. The Scheduled Castes population of the District is
212262, Scheduled Tribes 37526.
36
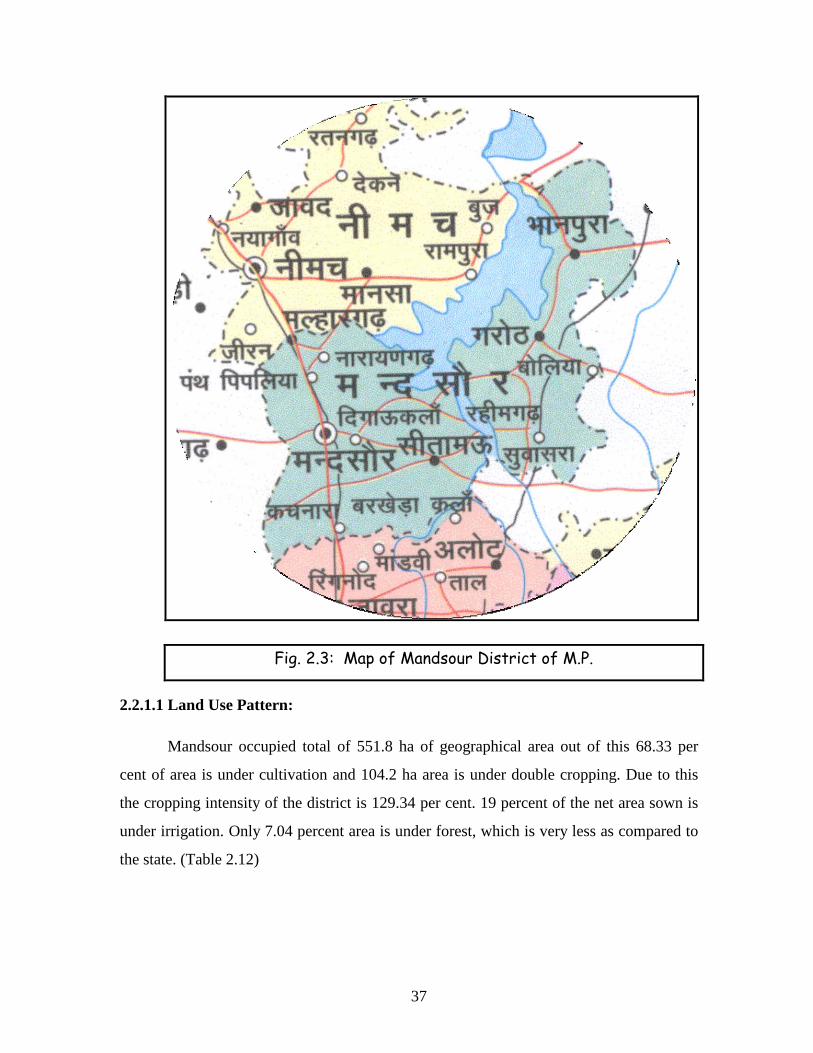
Fig. 2.3: Map of Mandsour District of M.P.
2.2.1.1 Land Use Pattern:
Mandsour occupied total of 551.8 ha of geographical area out of this 68.33 per
cent of area is under cultivation and 104.2 ha area is under double cropping. Due to this
the cropping intensity of the district is 129.34 per cent. 19 percent of the net area sown is
under irrigation. Only 7.04 percent area is under forest, which is very less as compared to
the state. (Table 2.12)
37

Table 2.12: Land use pattern of Mandsour
(Thousand ha)
Particulars Area Percentage to Geographical area Geographical area 551.8 100 Forest area 36.6 6.63 Land not available for cultivation. 122.7 22.24 Uncultivated land. 13.2 2.39 Waste land 19.6 3.55 Fallow land 4.5 0.82 Net area sown 355.2 64.37 Double cropped Area 104.2 Gross Cropped Area 459.4 Net area irrigated 67.5 19 Cropping Intensity % 129.34
*Percentage to Net Area Sown
2.2.1.2 Cropping Pattern:
The cropping pattern is kharif dominated in Mandsour district.
Cultivators devoted their 81.41 per cent of gross cropped area under Kharif
season. Soybean (59.7%) and Maize (12.2%) are the main kharif crops whereas
Wheat (13.65%) and gram (13.2%) are the major rabi crops cultivated by the
farmers. The cultivators harvested a yield of 2525 kg/ha of maize, 987 kg/ha of
groundnut, 719 kg/ha of soybean, 2638 kg/ha of wheat, 690 kg/ha of gram and
670kg /ha of mustard. In rabi season Opium is also cultivated in the 3.8
thousand ha (1/10 of ha area by each farmer) in the district under the
supervision of the government.
38

Table 2.13: Cropping pattern of Mandsour district.
( thousand ha)
Kharif Season Rabi Season
Crops Area % to Kharif
Yield Crops Area % to Rabi
Yield
Paddy 0 0.0 0 Wheat 33.3 13.6 2638
Jowar 13.9 3.7 545 Gram 32.5 13.2 690
Maize 45.8 12.2 2525 Lentil 1.2 0.5 384
Arhar 1.2 0.3 586 Linseed 2.8 1.1 534
Groundnut 1.5 0.4 987 Mustard 9.3 3.8 670
Seasmum 0.1 0.0 346 Sugarcane 0 0.0 0
Soybean 223.4 59.7 719 Opium 3.8 1.5 -
Others 88.1 23.6 - Others 2.5 1.0 -
Total Kharif 374 100.0 764 Total Rabi 85.4 34.8 1081
Pc to GCA 81.41 18.59
Total Gross Cropped Area 459.4
2.2.1.3 Area & Numbers of Holdings:
The average size of holding in the Mandsour is of 2.22 ha. The numbers of
operation holdings in the district are 161.5 thousand, which covers 357.9 thousand ha area
of the district. Marginal holding are highest (37.59%) in numbers followed by small
(26.44%), semi medium (20.80%), medium (13.44%) and large (1.73%), while medium
holding are highest in area (36.80%) followed by semi medium (26.24%), small
(17.44%), large (10.59%) and marginal ( 8.94%) in the district.( Table 2.14)
39
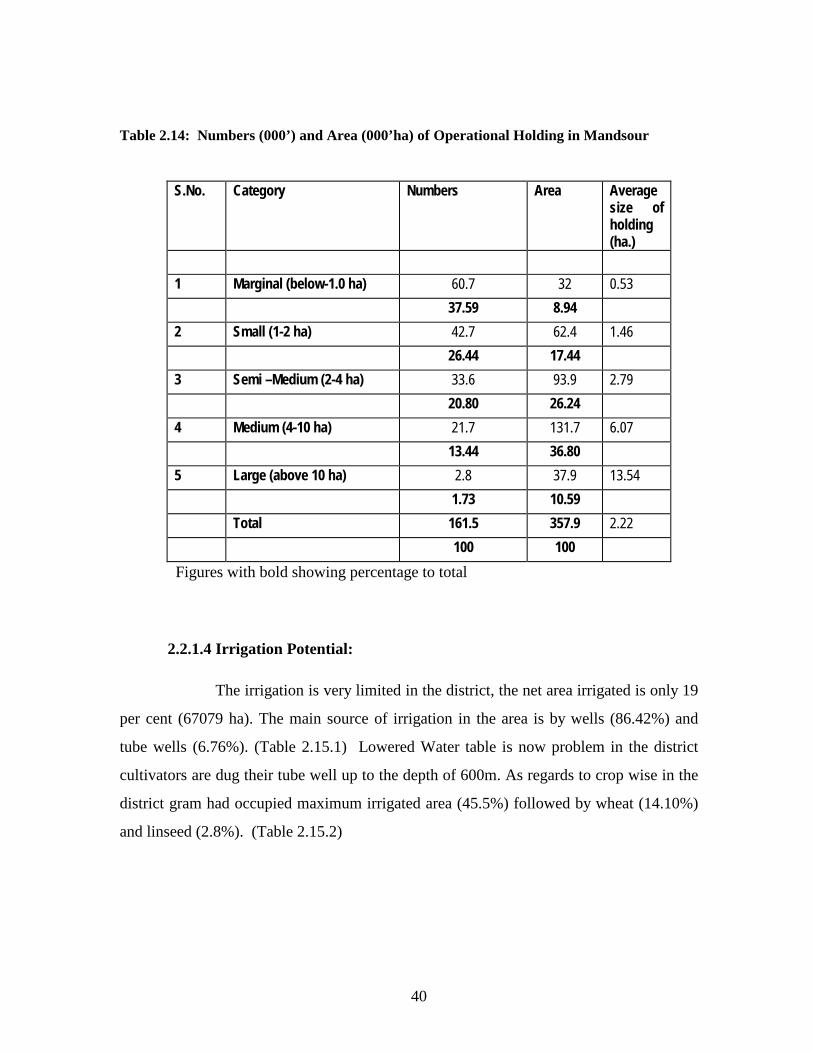
Table 2.14: Numbers (000’) and Area (000’ha) of Operational Holding in Mandsour
S.No. Category Numbers Area Average size of holding (ha.)
1 Marginal (below-1.0 ha) 60.7 32 0.53 37.59 8.94 2 Small (1-2 ha) 42.7 62.4 1.46 26.44 17.44 3 Semi –Medium (2-4 ha) 33.6 93.9 2.79 20.80 26.24 4 Medium (4-10 ha) 21.7 131.7 6.07 13.44 36.80 5 Large (above 10 ha) 2.8 37.9 13.54 1.73 10.59 Total 161.5 357.9 2.22 100 100
Figures with bold showing percentage to total
2.2.1.4 Irrigation Potential:
The irrigation is very limited in the district, the net area irrigated is only 19
per cent (67079 ha). The main source of irrigation in the area is by wells (86.42%) and
tube wells (6.76%). (Table 2.15.1) Lowered Water table is now problem in the district
cultivators are dug their tube well up to the depth of 600m. As regards to crop wise in the
district gram had occupied maximum irrigated area (45.5%) followed by wheat (14.10%)
and linseed (2.8%). (Table 2.15.2)
40

Table 2.15.1: Source wise irrigated area in Mandsour.
Irrigation Sources Net irrigated
Area
Percentage to Total
Gross Irrigated Area
1. Wells 57972 86.42 58361
2. Canals 486 0.72 486
3. Tanks 87 0.13 87
4. Tube wells 4536 6.76 4536
5. Reservoirs/ others 3998 5.96 3998
Total 67079 100.00 67468
Table 2.15.2: Crop wise irrigated area in Mandsour. (ha)
Crops Area Percentage to Total
Wheat 2405 14.1 Gram 7755 45.5 Paddy 0 0.0 Mustard 6230 36.5 Cotton 67 0.4 Sugarcane 5 0.0 Barley 121 0.7 Linseed 479 2.8 Maize 0 0.0 Others 0 0.0 Total Irrigated Area 17062 100.0
2.2.1.5 HYVs, fertilizer, Bio fertilizer Consumption:
In the district only 8684 ha area is under high yielding varieties seeds.
The fertilizer consumption in district is 60.36 kg/ha, which is more than double as
compared to the state. The cultivators also used plant protection measures in their crop
28282 ha of area. They used 1.66 liters of plant protection chemicals in their field, which
is more than the state average. The farmers also used seed treated material in 17966 ha of
area. (Table 2.16)
41
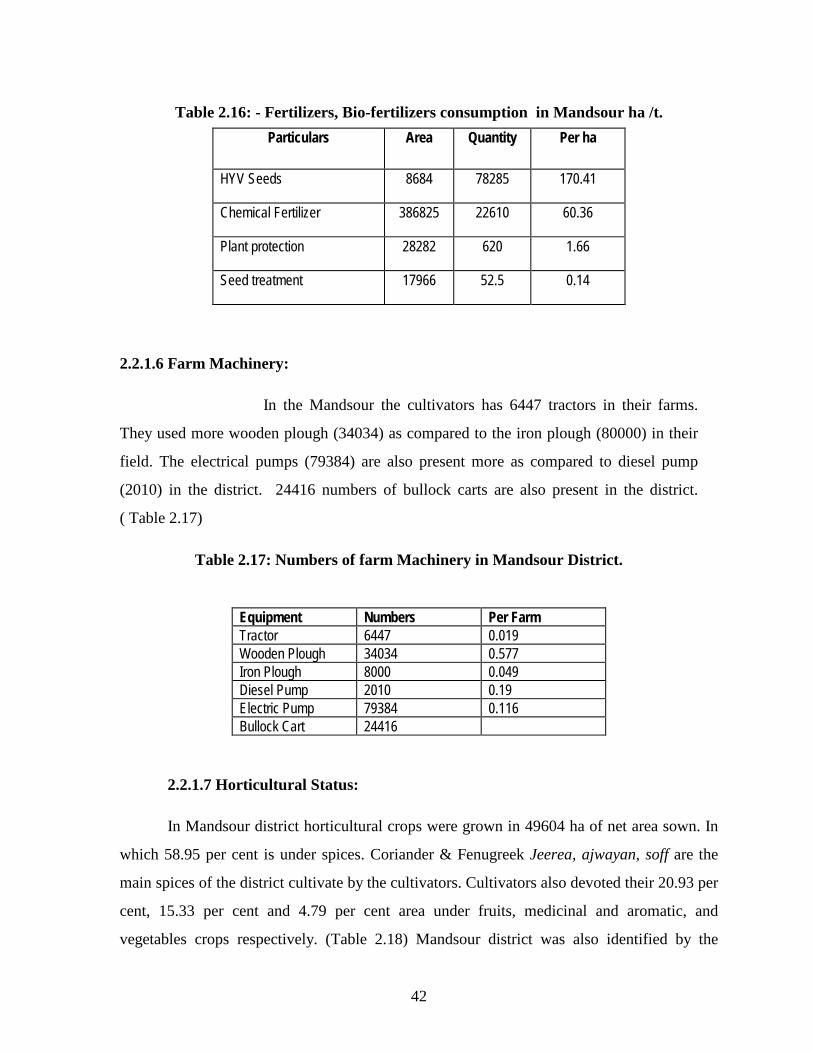
Table 2.16: - Fertilizers, Bio-fertilizers consumption in Mandsour ha /t. Particulars Area Quantity Per ha
HYV Seeds 8684 78285 170.41
Chemical Fertilizer 386825 22610 60.36
Plant protection 28282 620 1.66
Seed treatment 17966 52.5 0.14
2.2.1.6 Farm Machinery:
In the Mandsour the cultivators has 6447 tractors in their farms.
They used more wooden plough (34034) as compared to the iron plough (80000) in their
field. The electrical pumps (79384) are also present more as compared to diesel pump
(2010) in the district. 24416 numbers of bullock carts are also present in the district.
( Table 2.17)
Table 2.17: Numbers of farm Machinery in Mandsour District.
Equipment Numbers Per Farm Tractor 6447 0.019 Wooden Plough 34034 0.577 Iron Plough 8000 0.049 Diesel Pump 2010 0.19 Electric Pump 79384 0.116 Bullock Cart 24416
2.2.1.7 Horticultural Status:
In Mandsour district horticultural crops were grown in 49604 ha of net area sown. In
which 58.95 per cent is under spices. Coriander & Fenugreek Jeerea, ajwayan, soff are the
main spices of the district cultivate by the cultivators. Cultivators also devoted their 20.93 per
cent, 15.33 per cent and 4.79 per cent area under fruits, medicinal and aromatic, and
vegetables crops respectively. (Table 2.18) Mandsour district was also identified by the
42
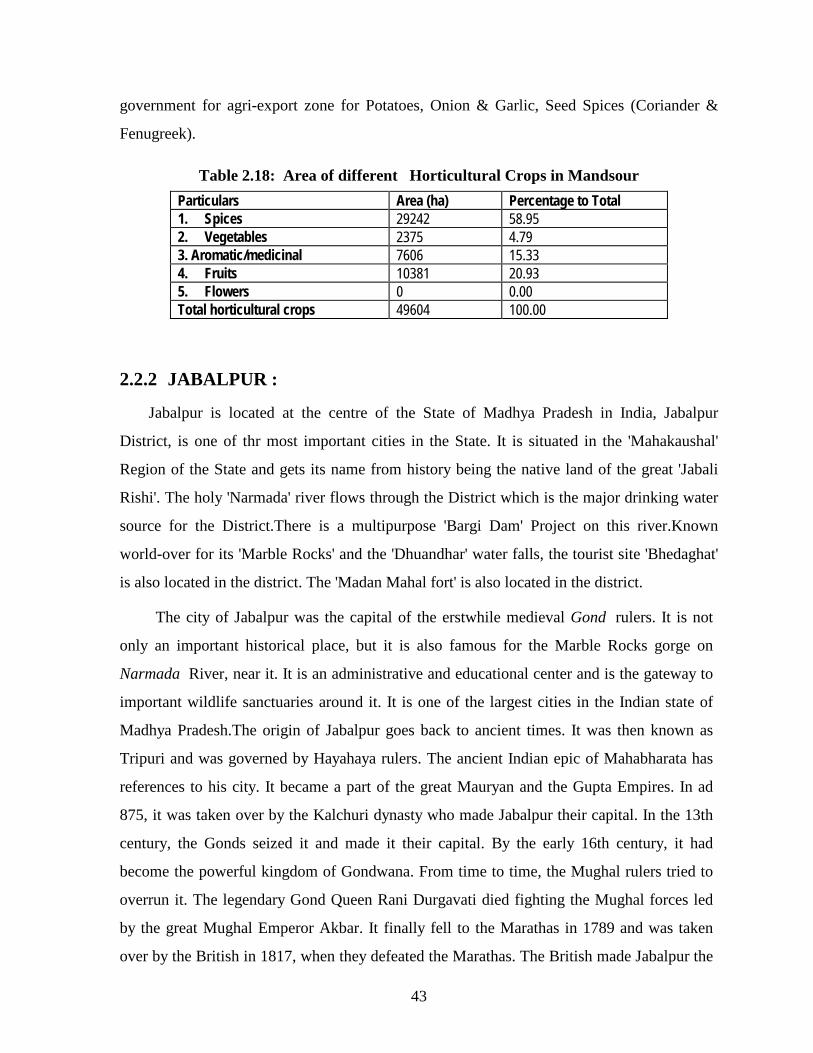
government for agri-export zone for Potatoes, Onion & Garlic, Seed Spices (Coriander &
Fenugreek).
Table 2.18: Area of different Horticultural Crops in Mandsour Particulars Area (ha) Percentage to Total 1. Spices 29242 58.95 2. Vegetables 2375 4.79 3. Aromatic/medicinal 7606 15.33 4. Fruits 10381 20.93 5. Flowers 0 0.00 Total horticultural crops 49604 100.00
2.2.2 JABALPUR :
Jabalpur is located at the centre of the State of Madhya Pradesh in India, Jabalpur
District, is one of thr most important cities in the State. It is situated in the 'Mahakaushal'
Region of the State and gets its name from history being the native land of the great 'Jabali
Rishi'. The holy 'Narmada' river flows through the District which is the major drinking water
source for the District.There is a multipurpose 'Bargi Dam' Project on this river.Known
world-over for its 'Marble Rocks' and the 'Dhuandhar' water falls, the tourist site 'Bhedaghat'
is also located in the district. The 'Madan Mahal fort' is also located in the district.
The city of Jabalpur was the capital of the erstwhile medieval Gond rulers. It is not
only an important historical place, but it is also famous for the Marble Rocks gorge on
Narmada River, near it. It is an administrative and educational center and is the gateway to
important wildlife sanctuaries around it. It is one of the largest cities in the Indian state of
Madhya Pradesh.The origin of Jabalpur goes back to ancient times. It was then known as
Tripuri and was governed by Hayahaya rulers. The ancient Indian epic of Mahabharata has
references to his city. It became a part of the great Mauryan and the Gupta Empires. In ad
875, it was taken over by the Kalchuri dynasty who made Jabalpur their capital. In the 13th
century, the Gonds seized it and made it their capital. By the early 16th century, it had
become the powerful kingdom of Gondwana. From time to time, the Mughal rulers tried to
overrun it. The legendary Gond Queen Rani Durgavati died fighting the Mughal forces led
by the great Mughal Emperor Akbar. It finally fell to the Marathas in 1789 and was taken
over by the British in 1817, when they defeated the Marathas. The British made Jabalpur the
43

commission headquarters of the Narmada territories and established a cantonment here.
Culture of The Jabalpur District has been reconsituted on 25-05-1998. It now has four
tehsils Jabalpur, Sihora, Patan and Kundam. There are 07 Blocks in the district with 1449
habited villages, 60 unhabited 1209 revenue village and 04 forest villages. As per Census
2001 Population of the district is 21,67,469.
Fig 2.4: Map of Jabalpur District.
2.2.2.1 Land use pattern:
Jabalpur district occupied total of 519.8 ha of geographical area out of this 52.81
per cent of area is under cultivation and 100.1 ha area is under double cropping. Due to
this the cropping intensity of the district is 136.47 per cent, which is recorded higher than
M.P. the 40.55 percent of the net area sown is under irrigation, which is also higher than
44
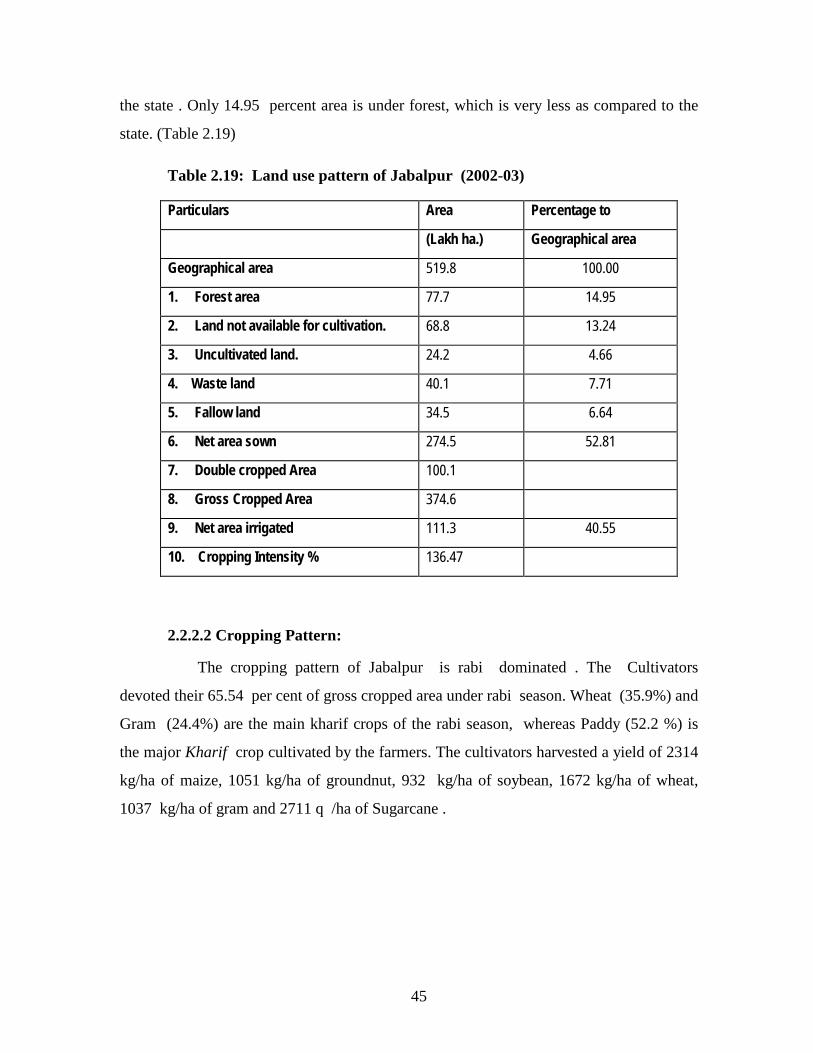
the state . Only 14.95 percent area is under forest, which is very less as compared to the
state. (Table 2.19)
Table 2.19: Land use pattern of Jabalpur (2002-03)
Particulars Area Percentage to
(Lakh ha.) Geographical area
Geographical area 519.8 100.00
1. Forest area 77.7 14.95
2. Land not available for cultivation. 68.8 13.24
3. Uncultivated land. 24.2 4.66
4. Waste land 40.1 7.71
5. Fallow land 34.5 6.64
6. Net area sown 274.5 52.81
7. Double cropped Area 100.1
8. Gross Cropped Area 374.6
9. Net area irrigated 111.3 40.55
10. Cropping Intensity % 136.47
2.2.2.2 Cropping Pattern:
The cropping pattern of Jabalpur is rabi dominated . The Cultivators
devoted their 65.54 per cent of gross cropped area under rabi season. Wheat (35.9%) and
Gram (24.4%) are the main kharif crops of the rabi season, whereas Paddy (52.2 %) is
the major Kharif crop cultivated by the farmers. The cultivators harvested a yield of 2314
kg/ha of maize, 1051 kg/ha of groundnut, 932 kg/ha of soybean, 1672 kg/ha of wheat,
1037 kg/ha of gram and 2711 q /ha of Sugarcane .
45
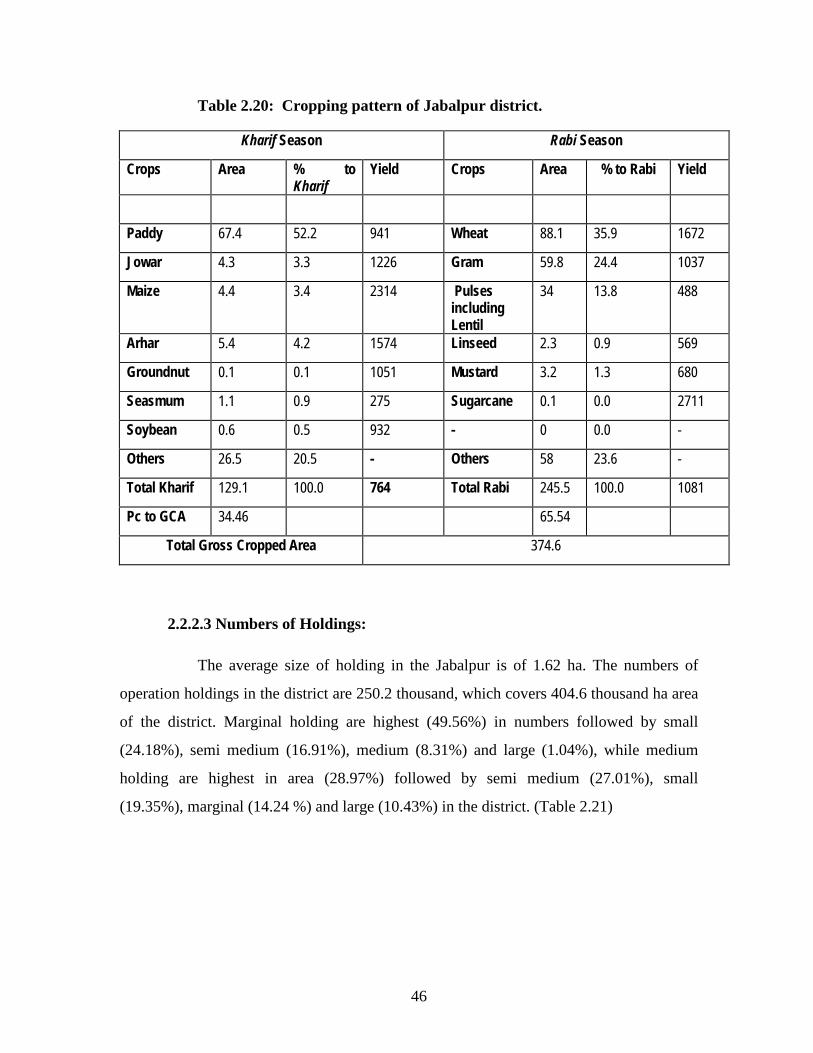
Table 2.20: Cropping pattern of Jabalpur district.
Kharif Season Rabi Season
Crops Area % to Kharif
Yield Crops Area % to Rabi Yield
Paddy 67.4 52.2 941 Wheat 88.1 35.9 1672
Jowar 4.3 3.3 1226 Gram 59.8 24.4 1037
Maize 4.4 3.4 2314 Pulses including Lentil
34 13.8 488
Arhar 5.4 4.2 1574 Linseed 2.3 0.9 569
Groundnut 0.1 0.1 1051 Mustard 3.2 1.3 680
Seasmum 1.1 0.9 275 Sugarcane 0.1 0.0 2711
Soybean 0.6 0.5 932 - 0 0.0 -
Others 26.5 20.5 - Others 58 23.6 -
Total Kharif 129.1 100.0 764 Total Rabi 245.5 100.0 1081
Pc to GCA 34.46 65.54
Total Gross Cropped Area 374.6
2.2.2.3 Numbers of Holdings:
The average size of holding in the Jabalpur is of 1.62 ha. The numbers of
operation holdings in the district are 250.2 thousand, which covers 404.6 thousand ha area
of the district. Marginal holding are highest (49.56%) in numbers followed by small
(24.18%), semi medium (16.91%), medium (8.31%) and large (1.04%), while medium
holding are highest in area (28.97%) followed by semi medium (27.01%), small
(19.35%), marginal (14.24 %) and large (10.43%) in the district. (Table 2.21)
46
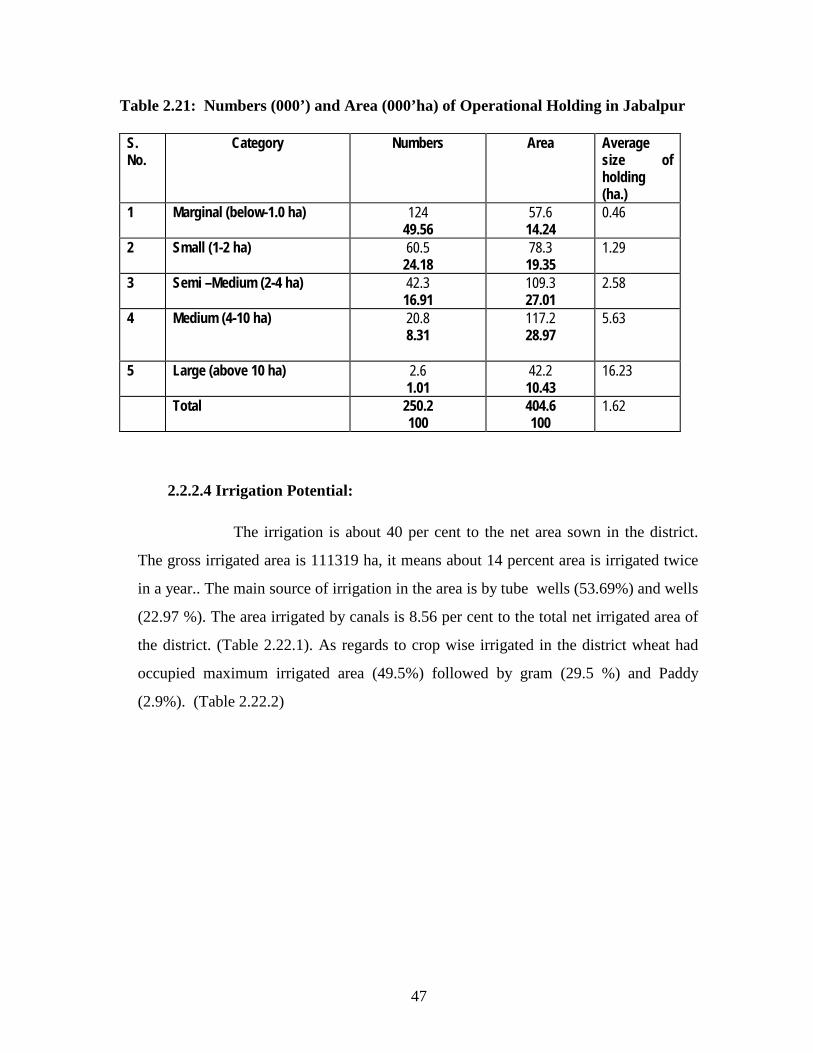
Table 2.21: Numbers (000’) and Area (000’ha) of Operational Holding in Jabalpur
S. No.
Category Numbers Area Average size of holding (ha.)
1 Marginal (below-1.0 ha) 124 49.56
57.6 14.24
0.46
2 Small (1-2 ha) 60.5 24.18
78.3 19.35
1.29
3 Semi –Medium (2-4 ha) 42.3 16.91
109.3 27.01
2.58
4 Medium (4-10 ha) 20.8 8.31
117.2 28.97
5.63
5 Large (above 10 ha) 2.6 1.01
42.2 10.43
16.23
Total 250.2 100
404.6 100
1.62
2.2.2.4 Irrigation Potential:
The irrigation is about 40 per cent to the net area sown in the district.
The gross irrigated area is 111319 ha, it means about 14 percent area is irrigated twice
in a year.. The main source of irrigation in the area is by tube wells (53.69%) and wells
(22.97 %). The area irrigated by canals is 8.56 per cent to the total net irrigated area of
the district. (Table 2.22.1). As regards to crop wise irrigated in the district wheat had
occupied maximum irrigated area (49.5%) followed by gram (29.5 %) and Paddy
(2.9%). (Table 2.22.2)
47

Table 2.22.1: Source wise irrigated area in Jabalpur district.
Irrigation Sources Net irrigated Area
Percentage to Total Gross irrigated Area
1. Wells 22402 22.97 22928
2. Canals 8344 8.56 8344
3. Tanks 97 0.10 97
4. Tube wells 52366 53.69 65693
5. Reservoirs/ others 14320 14.68 14587
Total 97529 100.00 111319
Table 2.22.2: Crop wise irrigated area in Jabalpur district. (ha)
Crops Area Percentage to Total
Wheat 55129 49.5
Gram 32823 29.5
Paddy 3221 2.9
Mustard 63 0.1
Cotton 0 0.0
Sugarcane 308 0.3
Barley 3 0.0
Linseed 23 0.0
Maize 0 0.0
Others 19749 17.7
Total Irrigated Area 111319 100.0
48
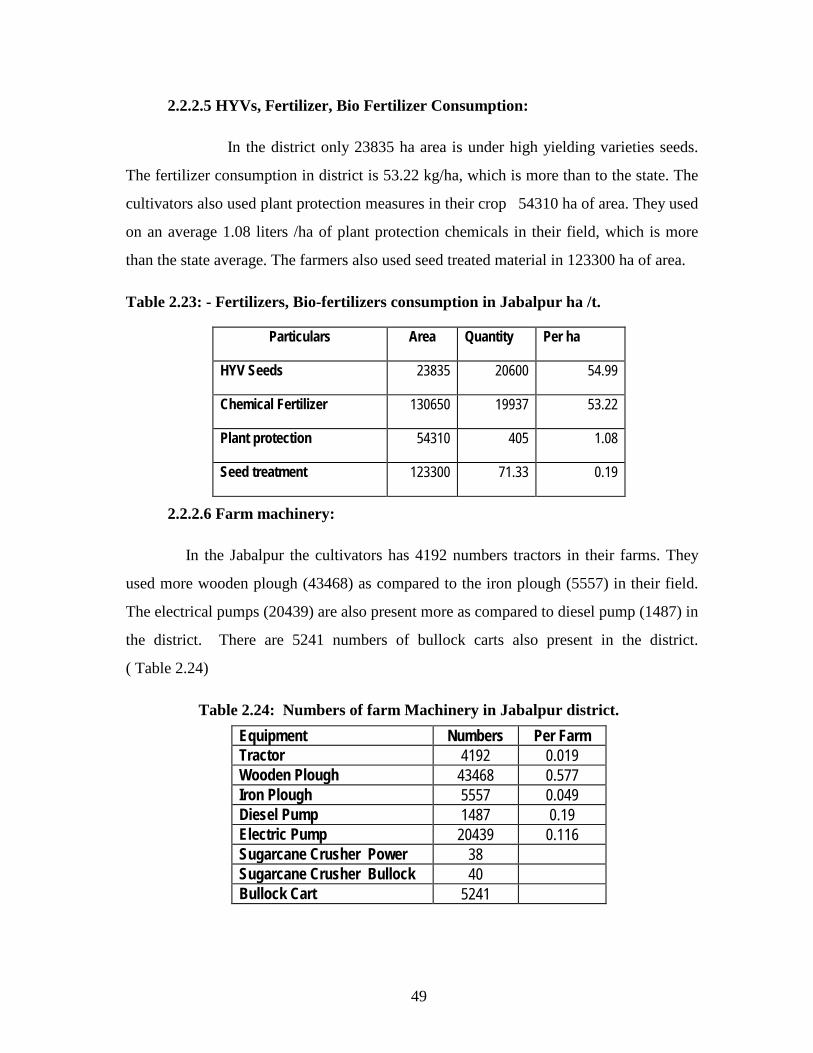
2.2.2.5 HYVs, Fertilizer, Bio Fertilizer Consumption:
In the district only 23835 ha area is under high yielding varieties seeds.
The fertilizer consumption in district is 53.22 kg/ha, which is more than to the state. The
cultivators also used plant protection measures in their crop 54310 ha of area. They used
on an average 1.08 liters /ha of plant protection chemicals in their field, which is more
than the state average. The farmers also used seed treated material in 123300 ha of area.
Table 2.23: - Fertilizers, Bio-fertilizers consumption in Jabalpur ha /t.
Particulars Area Quantity Per ha
HYV Seeds 23835 20600 54.99
Chemical Fertilizer 130650 19937 53.22
Plant protection 54310 405 1.08
Seed treatment 123300 71.33 0.19
2.2.2.6 Farm machinery:
In the Jabalpur the cultivators has 4192 numbers tractors in their farms. They
used more wooden plough (43468) as compared to the iron plough (5557) in their field.
The electrical pumps (20439) are also present more as compared to diesel pump (1487) in
the district. There are 5241 numbers of bullock carts also present in the district.
( Table 2.24)
Table 2.24: Numbers of farm Machinery in Jabalpur district. Equipment Numbers Per Farm Tractor 4192 0.019 Wooden Plough 43468 0.577 Iron Plough 5557 0.049 Diesel Pump 1487 0.19 Electric Pump 20439 0.116 Sugarcane Crusher Power 38 Sugarcane Crusher Bullock 40 Bullock Cart 5241
49

2.2.2.7 Horticultural Status:
In Jabalpur district horticultural crops were grown in 62532 ha of net area
sown. In which 88.30 per cent is under vegetables. Green Pea, Cauliflower, Cabbage, Potato
tomato, onion, brinjal, ladyfinger, etc. are the main vegetables of the district. The district has
a potential to develop as an agri-export zone for green pea. The Cultivators also devoted their
4.58 per cent, 4.42 per cent and 1.34 per cent and 1.36 percent of total horticultural producing
area to fruits, spices, flowers and aromatics and medicinal crops respectively in the district.
(Table 2.25)
Table: 2.25: Area & Production of different Horticultural Crops in Jabalpur
Particulars Area (ha) Percentage to Total 1. Spices 2762 4.42 2. Vegetables 55216 88.30 3. Aromatic/medicinal 841 1.34 4. Fruits 2861 4.58 5. Flowers 852 1.36 Total horticultural crops 62532 100
00000
50
CHAPTER III
RELATIVE ECONOMICS OF MEDICINAL CROPS
This chapter deals with the relative economics of a major medicinal (Isabgol)
and a major aromatic (Lemon grass) crop cultivated in Madhya Pradesh. In this chapter
emphasis is given to evaluate the economics of cultivation of these particular crops, with
their competitive crops i.e. wheat crop in case of Isabgol and paddy - wheat crop
sequences in case of lemon grass. An attempt was also made to compare the cost of
cultivation of these crops with their competitive crops. The chapter also highlighted the
general information of the selected cultivators, their land holding pattern, and cropping
pattern who cultivates these crops in the area under study. Thus, the chapter broadly
classified on the basis of crops selected for the study as; a) Medicinal Crop: Isabgol and
b) Aromatic Crop: Lemon grass.
3.1 Medicinal crop: Isabgol
As discussed earlier Isabgol is the major medicinal crop of the state contributing
30.46 per cent of the total area under medicinal crops. In this sub head general
information of the respondents, economics of cultivation of Isabgol and wheat is taken
into consideration. An attempt is also made to compare economics of these two crops.
3.1.1 General Information of the Isabgol Growers:
General information of the farmers includes age, size of family, their educational
levels, land utilization and cropping pattern of sample respondents.
3.1.1.1 Age & educational levels:
The average Isabgol grower of the area under study has been found in the age
group of 45 years and having 7 members in his family. The 98 per cent of Isabgol
growers have been found literate. Majority of them have literate up to primary (42.0%)
and high school (38.0%). The 12 per cent and 6 per cent of Isabgol growers also holds
higher secondary school certificate and bachelor degree respectively. (Table 3.1)
51

Table 3.1: General features of Isabgol Growers
Particulars Unit Total Percentage 1. Age ( Average) Years 45 2. Size of the family Numbers 7 3. Education Level
i )Illiterate Numbers 1 2.0 ii) Literate Numbers 49 98.0 a)Primary Numbers 21 42.0 b) High School Numbers 19 38.0 c) Higher secondary Numbers 3 6.0 d) Bachelor degree Numbers 6 12.0
4. Total Numbers 50 100.0
3.1.1.2 Land Utilization Pattern:
As regards to their land utilization pattern, an average Isabgol grower had used
their land resource more intensively as their cropping intensity is found to be 192.11 per
cent. His 88.54 per cent area is under irrigation and only 1.80 percent area is under
current fellow. (Table 3.2)
Table3.2: Details of Land Holding of Isabgol Growers
Particulars Area Percentage to Total
Total Area 4.45 100.00 irrigated Area 3.94 88.54 Un irrigated Area 0.51 11.46 Fallow Land a)Current 0.08 1.80 b)Permanent 0 0.00 Pasture land 0.04 0.90 Uncultivated land 0.02 0.45 Net Area Sown 4.31 96.85 Double Cropped area 3.97 Gross cropped Area 8.28 Cropping Intensity 192.11
52

3.1.1.3 Cropping Pattern: An average farmer used their land resource both in kharif as well as
rabi season in the same proportion. He allocates his 51.59 per cent area in kharif and
48.41 per cent in rabi season. Soybean is found to be a major crop in the area, in which an
average Isabgol grower has, allocates his 42.20 per cent of gross cropped area. Wheat
(19.51%), gram (7.56%), Isabgol (6.71%), mustard (5.61%), maize (3.78%), cumin
(0.85%) are other crops taken by the cultivators. (Table 3.3)
Opium, a narcotic crop also taken by the
cultivators of the area selected for the
study. This crop is taken by the cultivators
in the close monitoring of the state
government. An average cultivators
allocates his 1.22 per cent (0.10 ha) area
under this particular crop. He had been
harvested a produce of latex (8 kg/ha)
from this particular crop and received rate
of Rs. 8000/kg from the government.
Table3.3: Details of Cropping Pattern of Isabgol Growers (ha)
Particulars Area Percentage to Gross Cropped Area
Kharif Season 4.23 51.59 Soybean 3.46 42.20 Maize 0.31 3.78 Others 0.46 5.61 Rabi Season 3.97 48.41 Wheat 1.60 19.51 Gram 0.62 7.56 Isabgol 0.55 6.71 Mustard 0.46 5.61 Cumin 0.07 0.85 Opium 0.10 1.22 Others 0.57 6.95 Gross Cropped Area 8.20 100.00
53
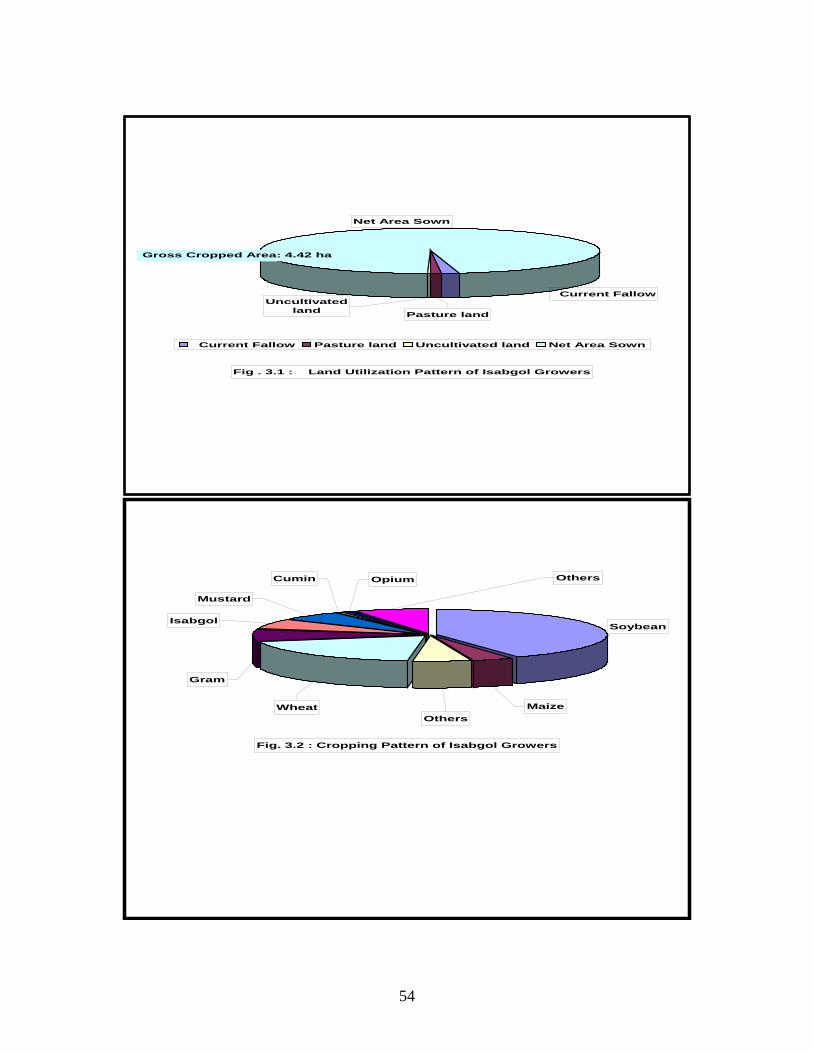
Fig . 3.1 : Land Utilization Pattern of Isabgol Growers
Net Area Sown
Pasture land
Current FallowUncultivated
land
Current Fallow Pasture land Uncultivated land Net Area Sown
Gross Cropped Area: 4.42 ha
Fig. 3.2 : Cropping Pattern of Isabgol Growers
Soybean
MaizeOthers
Wheat
Gram
Isabgol
Mustard
Cumin Opium Others
54

3.1.2 Cost of Cultivation: To analyse the cost of cultivation of Isabgol, total variable (operational and input) as
well as fixed cost are taken in to consideration.
3.1.2.1 Operational Cost:
Operational cost comprises of labours i.e. human (men and women), bullock
labour days and machine hours engaged in the cultivation of Isabgol, presented in Table
3.4.
It is observed from the data that an average Isabgol grower’s engaged 36 men, 16
women and 2 bullock labour days per ha in cultivation of Isabgol. He had also applied 16
machine hours per ha to produce Isabgol in his farm. It is also found that he had engaged
maximum men labour in harvesting (10 days/ha ) followed by processing
( 7 days/ha),irrigation (6 days/ha), application of chemical fertilizer ( top dressing of
urea) (3 days/ha each), , sowing, marketing of produce and weeding ( 2 days/ha each ),
and transportation & application of FYM in the field ( 1 days/ha ). As regards to women
labour he engaged maximum women labour in harvesting (12 days/ha) followed by
weeding and processing of produce ( 2 days /ha each) in the cultivation of Isabgol. Now,
bullock power was observed rarely used in the area under study. This power is only used
by the cultivators only in transportation of produce and FYM in the field (1 days/ha
each). Where as, machine power is now widely used in the cultivation of crops. The
16 machine hours per ha was observed to be used in the cultivation of Isabgol. Amongst,
all the operations maximum machine power hours used in land preparation (6 hours/ha)
followed by processing of produce ( 6 hours/ha), sowing (2 hours/ha) , and transportation
of produce to the market (1 hours/ha each) in cultivation of Isabgol. The per farm data
shows that on an average farmer used 19.80 men, 8.80 women and 1.10 bullock labour
days in his farm. He also engaged 8.80 machine hours per farm to cultivate Isabgol in his
farm in the area under study. (Table 3.4)
55

Table 3.4: Details of labour Employed in Cultivation of Isabgol Growers
( ha)
S. No.
Operations Per hectare Per Farm M* W* Bp* Mp* M W Bp Mp
1 Land Preparation 1 0 0 6 0.55 0.00 0.00 3.30 2 FYM-Transportation and
Application 1 0 1 0 0.55 0.00 0.55 0.00
3 Sowing 2 0 0 2 1.10 0.00 0.00 1.10 4 Chemical fertilizer 3 0 0 1.65 0.00 0.00 0.00 5 Weeding -manual 2 2 0 0 1.10 1.10 0.00 0.00 6 irrigation 6 0 0 0 3.30 0.00 0.00 0.00 7 Harvesting 10 12 0 0 5.50 6.60 0.00 0.00 8 Processing 7 2 0 6 3.85 1.10 0.00 3.30 9 Packing 2 0 0 0 1.10 0.00 0.00 0.00 10 Transportation 1 0 1 1 0.55 0.00 0.55 0.55 11 Marketing 1 0 0 1 0.55 0.00 0.00 0.55 Total 36 16 2 16 19.80 8.80 1.10 8.80
M*=Men, W*= Women Bp* = Bullock Power, Mp*= Machine Power
3.1.2.2 Total Cost:
The total cost of cultivation includes variable as well as fixed cost. The details of
all these are presented in Table 3.5. It is observed from the data that an average grower of
the study area spent Rs. 14760.22 per hectare in the cultivation of Isabgol. In which the
total variable cost was found to be 69.91 percent (Rs. 10318.72/ha) of the total cost of
cultivation. The remaining 30.09 per cent (Rs. 4441.50) was the total fixed cost. In the
total variable cost, the labour cost was found to be constituted the highest, in which an
average Isabgol grower spends 68.90 per cent, while other items contributed only 31.10
percent to the total variable cost. Thus, the cultivation of Isabgol in the area has been
found labour intensive rather than capital intensive. An average Isabgol grower spends
only 11.34 per cent, 9.75 percent, 4.65 percent and 1.39 per cent of the total variable cost
incurred in the cultivation of Isabgol on irrigation, fertilizer, seed and FYM respectively.
An average cultivator spend more in machine power (Rs. 3750.00/ha) followed by men
(Rs. 2200.00/ha), women labour (Rs. 760.00/ha) and bullock labour (Rs.400.00/ha) in the
area under study. Thus, the cultivators used more machine power as compared to human
and bullock labour. The rental value of land plays an important role in fixed cost, which
was 99.07 per cent share of the total fixed cost.
56

Table 3.5: Total Cost of Cultivation of Isabgol (ha)
S.No. Particulars Quantity Value Percentage
to Total Percentage to TVC/FC Per ha
Per farm Per ha Per farm
A VARIABLE COST 1 Seed 20.87 11.48 479.91 263.95 3.25 4.65 2 FYM ( tractor trolley) 0.47 0.26 143.34 78.84 0.97 1.39 3 Chemical fertilizer a) Urea 70.67 38.87 367.47 202.11 2.49 3.56 b) DAP 79.96 43.98 791.56 435.36 5.36 7.67 d) MOP 2.22 1.22 11.54 6.35 0.08 0.11 4 Total Fertilizer 1170.57 643.81 7.93 11.34 5 Labour a) Men 36 19.80 2200.00 1210.00 14.90 21.32 b) Women 16 8.80 760.00 418.00 5.15 7.37 c) Bullock Power 2 1.10 400.00 220.00 2.71 3.88 d) Machine Power 16 8.80 3750.00 2062.50 25.41 36.34 6 Total Labour 7110.00 3910.50 48.17 68.90 7 Amortized cost of
irrigation 3 1.65 1006.00 553.30 6.82 9.75 8 Packing 12 6.60 156.00 85.80 1.06 1.51 9 Interest on working
capital 252.90 139.10 1.71 2.45 10 Total Variable Cost 10318.72 5675.30 69.91 100 B FIXED COST 11 Rental value of land 4400.00 2420.00 29.81 99.07 12 Depreciation 41.50 22.83 0.28 0.93 13 Total Fixed cost 4441.50 2442.83 30.09 100.00 14 TOTAL COST OF
CULTIVATION 14760.22 8118.12 100.00
3.1.2.3 Returns from Isabgol:
An average cultivator of the area received Rs. 26,400 per hectare from the
cultivation of Isabgol. He has received a net return of Rs. 16081.28 per ha on his variable
cost, which he spent in the cultivation of Isabgol. When considered the total cost of
cultivation, it is found that on an average a cultivators received a net return of
Rs. 11639.78 per ha from the cultivation of Isabgol in the area under study. He has been
able to got Rs. 2.56 and Rs. 1.79 on the investment of Rs. 1.00 over variable and total
cost respectively. Thus, the cultivation of Isabgol has been found to be a profitable
combination of the crop rotation prevailed in the area under study.( Table3.6)
57

Table 3.6: Returns from Cultivation of Isabgol (ha)
S. No. Particulars
Quantity Value Per ha Per
farm Per ha Per farm 1 Yield of main product 12 6.60 2 Price per kg 2200 1210.00 26400 14520.00 3 Yield of byproduct 4 Price per kg 5 Gross return 26400 14520.00 6 Total variable cost of cultivation 10318.72 5563.88 7 Total cost of cultivation 14760.22 8006.71 8 Net Return:
a) Over variable cost 16081.28 8956.12 b) Over total cost 11639.78 6513.29 9 Cost of Production /q
a) Over variable cost/q 859.89 b) Over total cost/q 1230.02 10 Return per Rupee a) Over variable cost 2.56 b) Over total cost 1.79
3.1.3 Competing Crop of Isabgol: Wheat
As discussed earlier that Isabgol is the competing crop to wheat. The cultivators
of the study area shifted the some area of wheat in Isabgol. Though, all the selected
Isabgol growers have also grown Isabgol and wheat hence, the data related to cost of
cultivation of wheat also collected from the same respondents.
3.1.3.1 General Features of Wheat:
The consumption of wheat (Triticum aestivum) in the form of flour and bread has
recently increased significantly in the tropical regions. Wheat is the world’s number one
cereal crop in 2001 it was grown on about 214 million ha, which is about 14 per cent of
the global arable land area. Although the area under wheat has remained static around
220 million ha, its production has increased from 355 million tonnes in 1975 to 578
million tonnes in 2001 due to development of better varieties and improved production
practices. As a contrast to paddy, which is mostly grown in Asia, wheat is grown in all
the six continents of the world. The India has the largest area under wheat, while the
China ranks first in the total production of wheat. However in productivity of India
58

,China and Russia are much behind the European Countries. The India, occupies a
distinct position. Although area under wheat is about 61.00 per cent of that under paddy,
it was this crop that brought in the green revolution in India and paved way for the
country’s food security. The introduction of Mexican dwarf wheat varieties in the mid-
sixties revolutionized the wheat productivity as well as its total production in India.
Wheat contributes remarkable share in the Green Revolution.
In India, wheat is grown in almost all the states in northern and central India.
Uttar Pradesh ranks first in area and total production, while Punjab ranks first in
productivity. One of the major factors responsible for higher productivity in Punjab is
that almost 100 per cent area under wheat is irrigated. The other factor responsible for
good yields of wheat in Punjab is very high level of fertilizer application.
Madhya Pradesh contributed 14.0 per cent share of area and 7.0 per cent share of
production of India’s total areas and production. In Madhya Pradesh wheat is
concentrated particularly in the Central Narmada Valley and the Vindhyan Plateau
agro-climatic regions. Narsinghpur, Hoshangabad, Sehore, Raisen , Bhopal, Sagar,
Damoh, Vidisha and Guna are the major wheat growing districts of the state. Ujjain,
Dewas, Shajapur, Ratlam, Mandsaur, Neemuch, Indore, Dhar, Khargone, Guna, Sehore,
Vidisha, Raisen, Hoshangabad, Harda and Narsinghpur. districts are also indentified
under Agricultural export zone for Wheat in Madhya Pradesh. The most important
cultivated species of the wheat are Triticum aestivum (Hexaploid) and Tritium durum
(Tetraploid). In general, the maximum productivity potential of high yielding semi-
dwarf wheat varieties under irrigated conditions is attained by sowing them between the
10th and 25th of November in all the zones. Rainfed wheat is generally sown during the
period from the second fortnight of October to early November.
In India wheat is ground to prepare flour which is mainly consumed bread
(chapati). Its flour is also used to prepare fried chapatis called Puris and Parantha and
most important uses are to prepare backing bread, Pastry and biscuits. It is also used for
the production of semolina for the macaroni industry and for preparing break fast foods.
Varieties of durum wheat having large white Kernels are often used for
puffing.Wheat straw makes an important fodder, while by-products of wheat flour mills,
59
particularly bran are used as cattle feed. Among the industrial uses of wheat, the
production of starch for the paper industry is important.
The chemical composition of wheat grain determines its nutritional quality,
Broadly wheat grain has the following composition. Wheat contains 60 – 68 per cent of
starch, 08 - 15 per cent of protein,1.5 – 2.0 per cent of fat, 2.0 – 2.5 per cent of cellulose
and 1.5 – 2.0 per cent of minerals. Besides the above constituents, wheat grain also
contains vitamins A, B, B2, nicotinic acid and vitamin E. The essential amino acids viz
isoleucine, leucine, lysine, methionine, phenylamine, thyceonine and voline are contained
in the range of 26- 30 per cent of total amino acids.
3.1.3.2 Cost of Cultivation: Wheat is the major crop of the area grown by the sample respondents and it account
for 20 per cent of gross cropped area. It is the second major crop of the area after
soybean.
3.1.3.2.1 Operational Cost:
The operational cost of wheat is presented in Table 3.7.It is observed from the
data that an average wheat grower’s engaged 38 men, 23 women and 2 bullock labour
days per ha in cultivation of crop. He also engaged 20 machine hours per ha to produce
wheat. It is also found that he had engaged maximum men labour in irrigation (10
days/ha ) followed by harvesting (9 days/ha), processing ( 6 days/ha), application of
chemical fertilizer ( 3days/ha), sowing, packing and weeding (2 days/ha each), land
preparation , transportation and application of FYM, transportation and marketing of
produce and weeding ( 1 days/ha each ). As regards to women labour, he engaged
maximum women labour in harvesting (16 days/ha) followed by processing of produce,
and weeding ( 2 days /ha each) in the cultivation of wheat. Now, bullock power is rarely
used in the area under study. This power is only used by the cultivators only in
transportation of produce and FYM in the field and transportation of produce to the
market (1 days/ha each). Where as machine power is now widely used in the cultivation,
20 machine hours per ha observed to be used in the cultivation of crop. Amongst all the
operations in cultivation of wheat, maximum machine power hours used in land
preparation (6 hours/ha) followed by processing of produce ( 10 hours/ha), sowing (2
hours/ha) , and transportation of produce and marketing of produce to the market (1
60
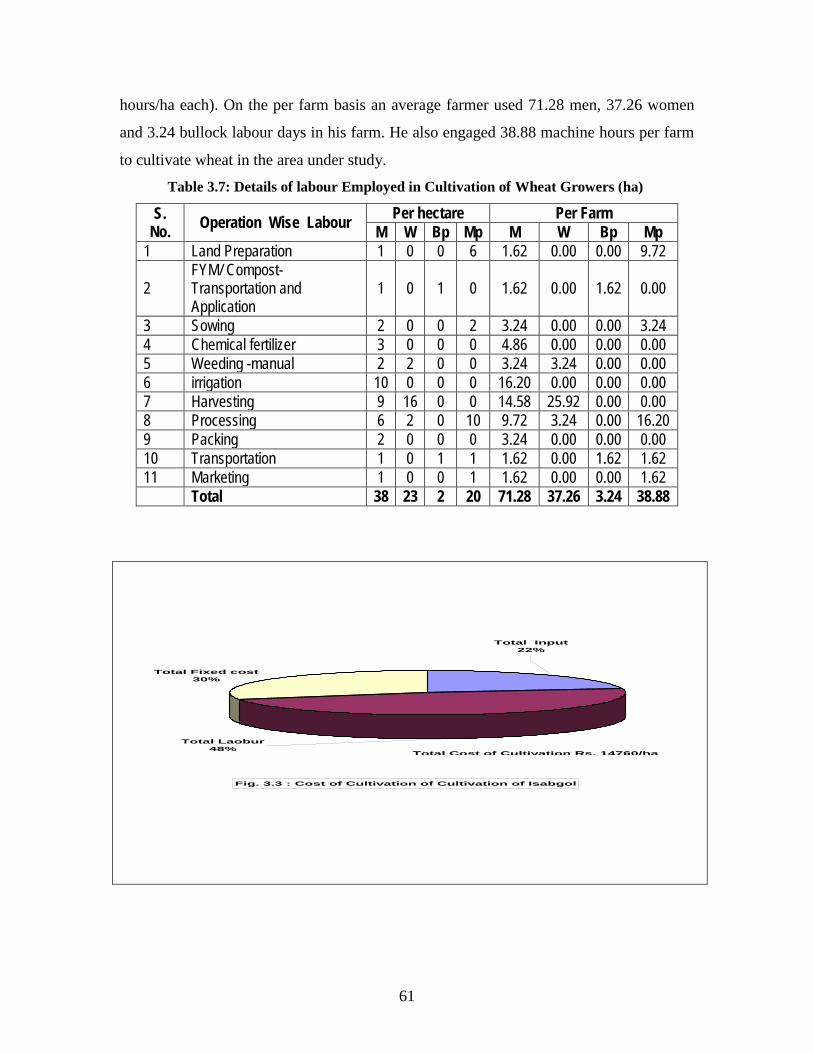
hours/ha each). On the per farm basis an average farmer used 71.28 men, 37.26 women
and 3.24 bullock labour days in his farm. He also engaged 38.88 machine hours per farm
to cultivate wheat in the area under study.
Table 3.7: Details of labour Employed in Cultivation of Wheat Growers (ha)
S. No. Operation Wise Labour Per hectare Per Farm
M W Bp Mp M W Bp Mp 1 Land Preparation 1 0 0 6 1.62 0.00 0.00 9.72
2 FYM/ Compost-Transportation and Application
1 0 1 0 1.62 0.00 1.62 0.00
3 Sowing 2 0 0 2 3.24 0.00 0.00 3.24 4 Chemical fertilizer 3 0 0 0 4.86 0.00 0.00 0.00 5 Weeding -manual 2 2 0 0 3.24 3.24 0.00 0.00 6 irrigation 10 0 0 0 16.20 0.00 0.00 0.00 7 Harvesting 9 16 0 0 14.58 25.92 0.00 0.00 8 Processing 6 2 0 10 9.72 3.24 0.00 16.20 9 Packing 2 0 0 0 3.24 0.00 0.00 0.00 10 Transportation 1 0 1 1 1.62 0.00 1.62 1.62 11 Marketing 1 0 0 1 1.62 0.00 0.00 1.62
Total 38 23 2 20 71.28 37.26 3.24 38.88
Fig. 3.3 : Cost of Cultivation of Cultivation of Isabgol
Total Input 22%
Total Laobur 48%
Total Fixed cost 30%
Total Cost of Cultivation Rs. 14760/ha
61

26400.00
24651.76
16081.28
8651.25
11639.78
5414.55
0.00
5000.00
10000.00
15000.00
20000.00
25000.00
30000.00
Rs./ha
Gross return Net Return:Over variable
cost
Net Return:Over total cost
Fig.3.4 : Returns from Isabgol and Wheat
Isabgol Wheat
3.1.3.2.2 Total Cost:
. The detail of the total cost of cultivation of wheat is presented in table 3.8. It is
observed from the data that an average grower of the study area spent Rs. 16798.81 per
hectare in the cultivation of wheat. The total variable cost was found to be 80.73 percent
(Rs. 13562.11/ha) to the total cost of cultivation. The remaining 19.27 per cent (Rs.
3236.70/ha) was the total fixed cost. In the total variable cost, the labour cost was the
highest (61.46 %), while remaining other items contributed only 38.54 percent to the total
variable cost. Thus, the cultivation of this crop was labour intensive rather than capital
intensive. An average farmer spent only 15.37 per cent, 9.26 percent, 8.24 percent and
2.62 per cent in irrigation, seed, fertilizer, and packaging of produce respectively to the
total variable cost incurred in the cultivation of wheat. Amongst all labours used in the
cultivation of crop, an average cultivator spend more in machine power (Rs. 5000.00/ha)
followed by men (Rs. 1900.00/ha), women labour (Rs. 1035.00/ha) and bullock labour
62

(Rs.400.00/ha) in the area under study. Thus, the wheat cultivators used more machine
power as compared to human and bullock labour. The rental value of land (Rs.3195.20)
plays an important role in fixed cost, which was found to be 98.72 per cent share of the
total fixed cost.
Table 3.8: Economics of Cultivation of Wheat (ha)
S. No. Particulars
Quantity Value Percentage
to Total Percentage to TVC/FC Per ha
Per farm Per ha Per farm
A VARIABLE COST 1 Seed 125.6 203.52 1256.30 2035.21 7.48 9.26 2 FYM( tractor trolley) 0.47 0.76 143.34 232.21 0.85 1.06 3 Chemical fertilizer a) Urea 68.24 110.55 354.85 574.85 2.11 2.62 b) DAP 72.56 117.55 718.34 1163.72 4.28 5.30 d) MOP 8.56 13.87 44.08 71.42 0.26 0.33 4 Labour a) Men 38 61.56 1900.00 3078.00 11.31 14.01 b) Women 23 37.26 1035.00 1676.70 6.16 7.63 c) Bullock Power 2 3.24 400.00 648.00 2.38 2.95 d) Machine Power 20 32.40 5000.00 8100.00 29.76 36.87 Total Labour 8335.00 13502.70 49.62 61.46 5 Amortized cost of
irrigation 5 8.10 2085.00 3377.70 12.41 15.37
6 Packing material, packing ,loading, transportation
30 48.60 355.80 576.40 2.12 2.62
7 Interest on working capital ( 10 % per annum for crop season )
269.39 436.41 1.60 1.99
8 Total Variable Cost 13562.11 21970.61 80.73 100 B FIXED COST 9 Rental value of land 3195.20 5176.22 19.02 98.72 10 Depreciation 41.50 67.23 0.25 1.28 11 Total Fixed cost 3236.70 5243.45 19.27 100.00 12 TOTAL COST OF
CULTIVATION 16798.81 27214.07 100.00
63
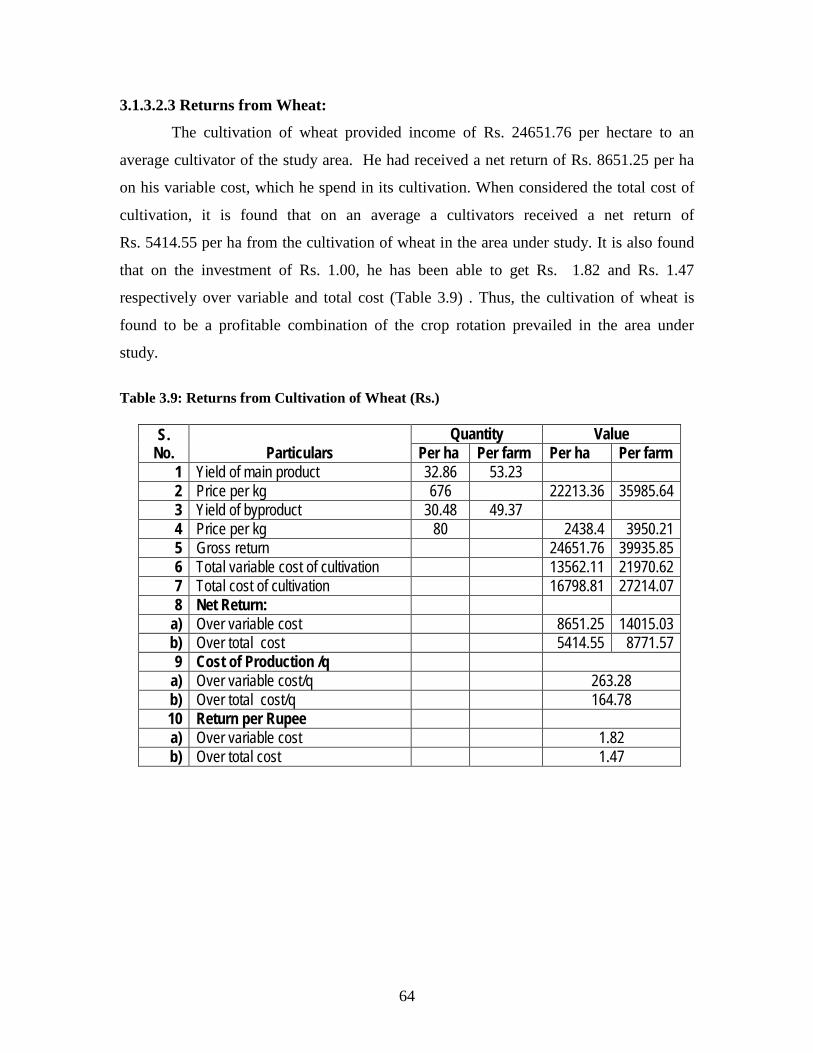
3.1.3.2.3 Returns from Wheat:
The cultivation of wheat provided income of Rs. 24651.76 per hectare to an
average cultivator of the study area. He had received a net return of Rs. 8651.25 per ha
on his variable cost, which he spend in its cultivation. When considered the total cost of
cultivation, it is found that on an average a cultivators received a net return of
Rs. 5414.55 per ha from the cultivation of wheat in the area under study. It is also found
that on the investment of Rs. 1.00, he has been able to get Rs. 1.82 and Rs. 1.47
respectively over variable and total cost (Table 3.9) . Thus, the cultivation of wheat is
found to be a profitable combination of the crop rotation prevailed in the area under
study.
Table 3.9: Returns from Cultivation of Wheat (Rs.)
S.
No. Particulars Quantity Value
Per ha Per farm Per ha Per farm 1 Yield of main product 32.86 53.23 2 Price per kg 676 22213.36 35985.64 3 Yield of byproduct 30.48 49.37 4 Price per kg 80 2438.4 3950.21 5 Gross return 24651.76 39935.85 6 Total variable cost of cultivation 13562.11 21970.62 7 Total cost of cultivation 16798.81 27214.07 8 Net Return:
a) Over variable cost 8651.25 14015.03 b) Over total cost 5414.55 8771.57 9 Cost of Production /q
a) Over variable cost/q 263.28 b) Over total cost/q 164.78 10 Return per Rupee a) Over variable cost 1.82 b) Over total cost 1.47
64

3.1.4 Isabgol Vs Wheat: An attempt has also been made to compare the cost and returns of Isabgol and
wheat in the area under study and data related to these are presented in table 3.10.
Table 3. 10: Comparative Cost & Returns of Isabgol and wheat ( Rs/ha)
S. No. Particulars Isabgol Wheat
Percentage Difference
over Isabgol A COSTS
1 Total Input 3208.72 5227.11 -62.90 2 Total Labours 7110.00 8335.00 -17.23 3 Total Variable Cost 10318.72 13562.11 -31.43 4 Total Fixed cost 4441.50 3236.70 27.13 5 Total Cost of Cultivation 14760.22 16798.81 -13.81
B RETURNS 1 Gross return 26400.00 24651.76 6.62 2 Net Return: a) Over variable cost 16081.28 8651.25 46.20 b) Over total cost 11639.78 5414.55 53.48 3 Cost of Production /q a) Over variable cost 859.89 263.28 69.38 b) Over total cost 1230.02 164.78 86.60 4 Return per Rupee a) Over variable cost 2.56 1.82 28.86 b) Over total cost 1.79 1.47 17.81
An average cultivator of the area received 46.20 per cent and 53.48 per cent more
net return per ha over variable cost and total cost from cultivation of Isabgol over wheat.
It is also clear from the data that an average farmer invested 13.81 per cent less in
cultivation of Isabgol than the wheat but received 53.48 per cent more net income as
compare to wheat. On investment of Rs. 1.00 an average grower received Rs. 2.56 over
the variable cost and Rs. 1.79 over the total cost for cultivation of Isabgol, while he
received only Rs.1.82 at variable cost and Rs.1.47 over total cost from cultivation of
wheat in the area under study. Thus, the cultivation of Isabgol crop is more profitable
than that of wheat the resource limitation, as Isabgol is more profitable and low cost
venture.
65
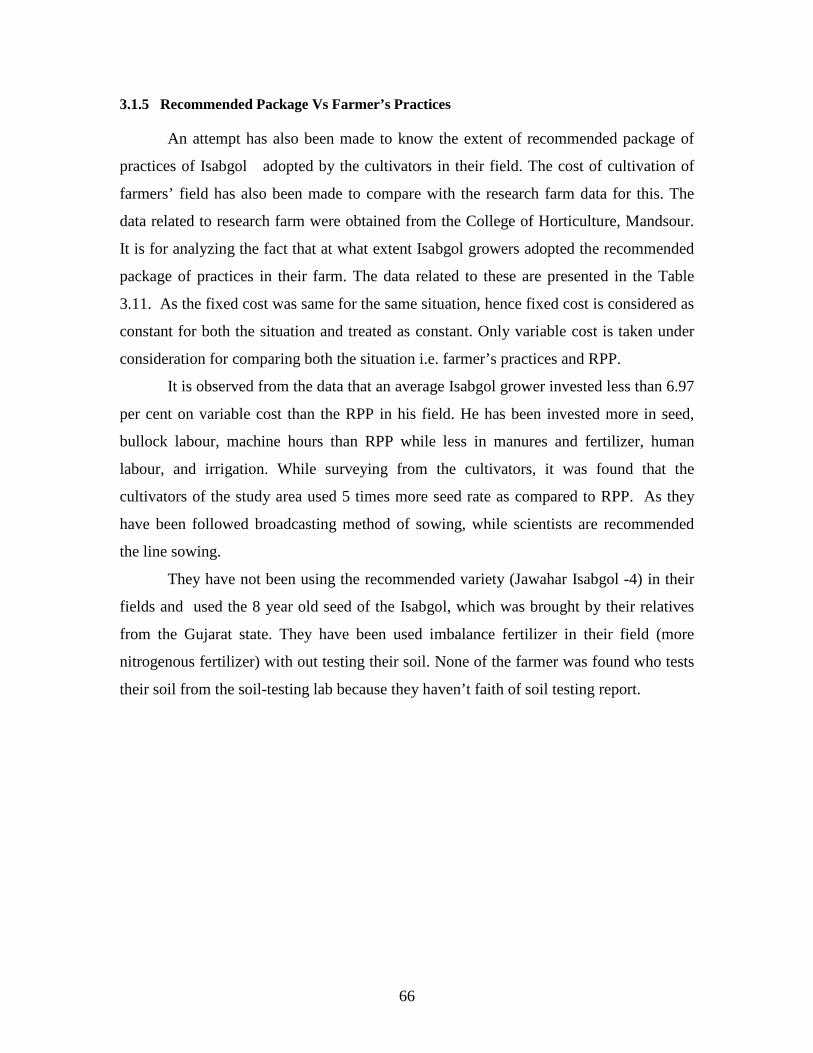
3.1.5 Recommended Package Vs Farmer’s Practices
An attempt has also been made to know the extent of recommended package of
practices of Isabgol adopted by the cultivators in their field. The cost of cultivation of
farmers’ field has also been made to compare with the research farm data for this. The
data related to research farm were obtained from the College of Horticulture, Mandsour.
It is for analyzing the fact that at what extent Isabgol growers adopted the recommended
package of practices in their farm. The data related to these are presented in the Table
3.11. As the fixed cost was same for the same situation, hence fixed cost is considered as
constant for both the situation and treated as constant. Only variable cost is taken under
consideration for comparing both the situation i.e. farmer’s practices and RPP.
It is observed from the data that an average Isabgol grower invested less than 6.97
per cent on variable cost than the RPP in his field. He has been invested more in seed,
bullock labour, machine hours than RPP while less in manures and fertilizer, human
labour, and irrigation. While surveying from the cultivators, it was found that the
cultivators of the study area used 5 times more seed rate as compared to RPP. As they
have been followed broadcasting method of sowing, while scientists are recommended
the line sowing.
They have not been using the recommended variety (Jawahar Isabgol -4) in their
fields and used the 8 year old seed of the Isabgol, which was brought by their relatives
from the Gujarat state. They have been used imbalance fertilizer in their field (more
nitrogenous fertilizer) with out testing their soil. None of the farmer was found who tests
their soil from the soil-testing lab because they haven’t faith of soil testing report.
66
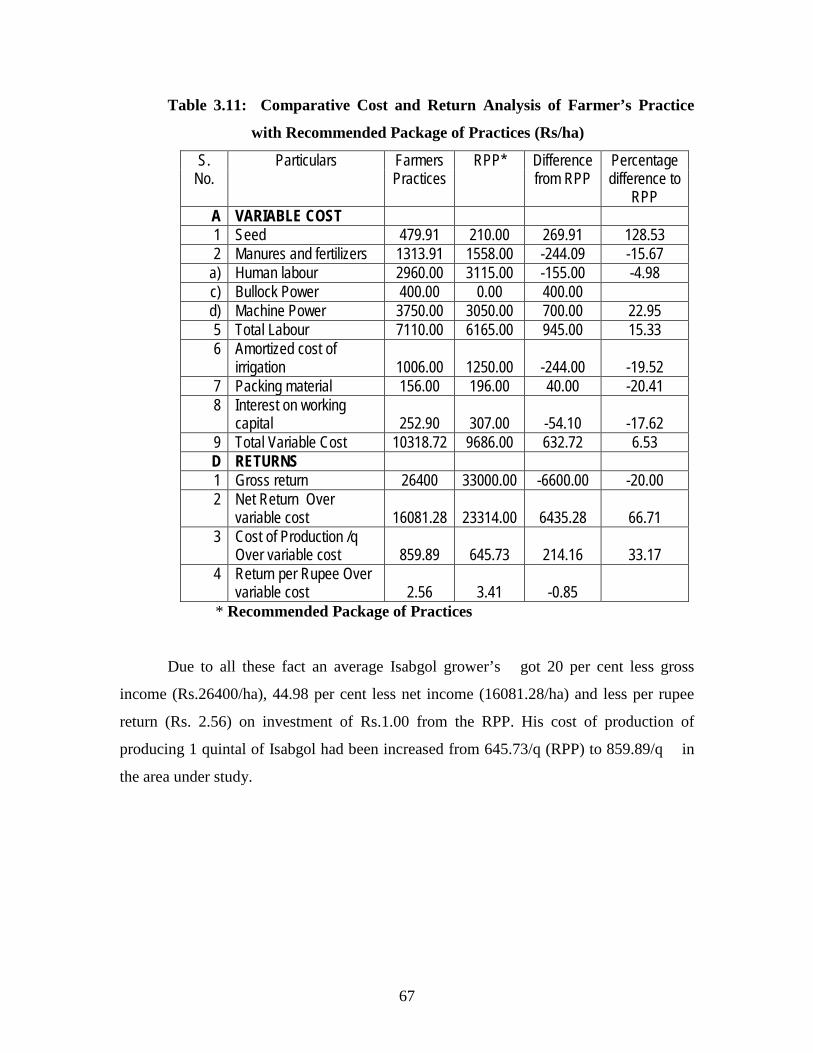
Table 3.11: Comparative Cost and Return Analysis of Farmer’s Practice
with Recommended Package of Practices (Rs/ha)
S. No.
Particulars Farmers Practices
RPP* Difference from RPP
Percentage difference to
RPP A VARIABLE COST 1 Seed 479.91 210.00 269.91 128.53 2 Manures and fertilizers 1313.91 1558.00 -244.09 -15.67
a) Human labour 2960.00 3115.00 -155.00 -4.98 c) Bullock Power 400.00 0.00 400.00 d) Machine Power 3750.00 3050.00 700.00 22.95 5 Total Labour 7110.00 6165.00 945.00 15.33 6 Amortized cost of
irrigation 1006.00 1250.00 -244.00 -19.52 7 Packing material 156.00 196.00 40.00 -20.41 8 Interest on working
capital 252.90 307.00 -54.10 -17.62 9 Total Variable Cost 10318.72 9686.00 632.72 6.53 D RETURNS 1 Gross return 26400 33000.00 -6600.00 -20.00 2 Net Return Over
variable cost 16081.28 23314.00 6435.28 66.71 3 Cost of Production /q
Over variable cost 859.89 645.73 214.16 33.17 4 Return per Rupee Over
variable cost 2.56 3.41 -0.85 * Recommended Package of Practices
Due to all these fact an average Isabgol grower’s got 20 per cent less gross
income (Rs.26400/ha), 44.98 per cent less net income (16081.28/ha) and less per rupee
return (Rs. 2.56) on investment of Rs.1.00 from the RPP. His cost of production of
producing 1 quintal of Isabgol had been increased from 645.73/q (RPP) to 859.89/q in
the area under study.
67

Fig. 3.5 : Farmer's Practice Vs Recommended Package
3.1.6 Problems in Cultivation:
The problems that are faced by the Isabgol growers in the area under study are
presented in Table 3.12. It is observed from the data that the cent per cent Isabgol
growers reported that they have one and only one problem in cultivation of Isabgol in the
area under study that of unfavorable weather conditions at the time of maturity of crop.
They told that if the rains are occurred at the time of maturity of crop they have been lost
their whole produce. As the grain of Isabgol has a quality of absorbing moisture. This is
the only problem that they faced while cultivation of the crop. The other problems that
they faced were not specifically related only to Isabgol. These are the general problems,
which were related to all crops including Isabgol.
Table 3.12: Problems Faced by growers in cultivation of Isabgol
Particulars
Rank given by the Respondents 1 2 3 4 5 6 7
No. % No. % No. % No. % No. % No. % No. % Lack of technical know how 27 54 23 46 0 0 0 0 0 0 0 0 0 0
Lack of Capital 0 0 0 0 4 8 4 8 7 14 15 30 20 40 Lack of Credit facilities 0 0 0 0 0 0 0 0 6 12 10 20 34 68 Non availability of desired input 26 52 12 24 10 20 2 4 0 0 0 0 0 0
Problem of Electricity at 25 50 13 26 4 8 3 6 2 4 2 4 1 2
26400 33000
16081.28 23314
0 5000
10000 15000 20000 25000 30000 35000
Rs./ha
Gross return Net Return Over Variable cost
Farmers Practices RPP*
68
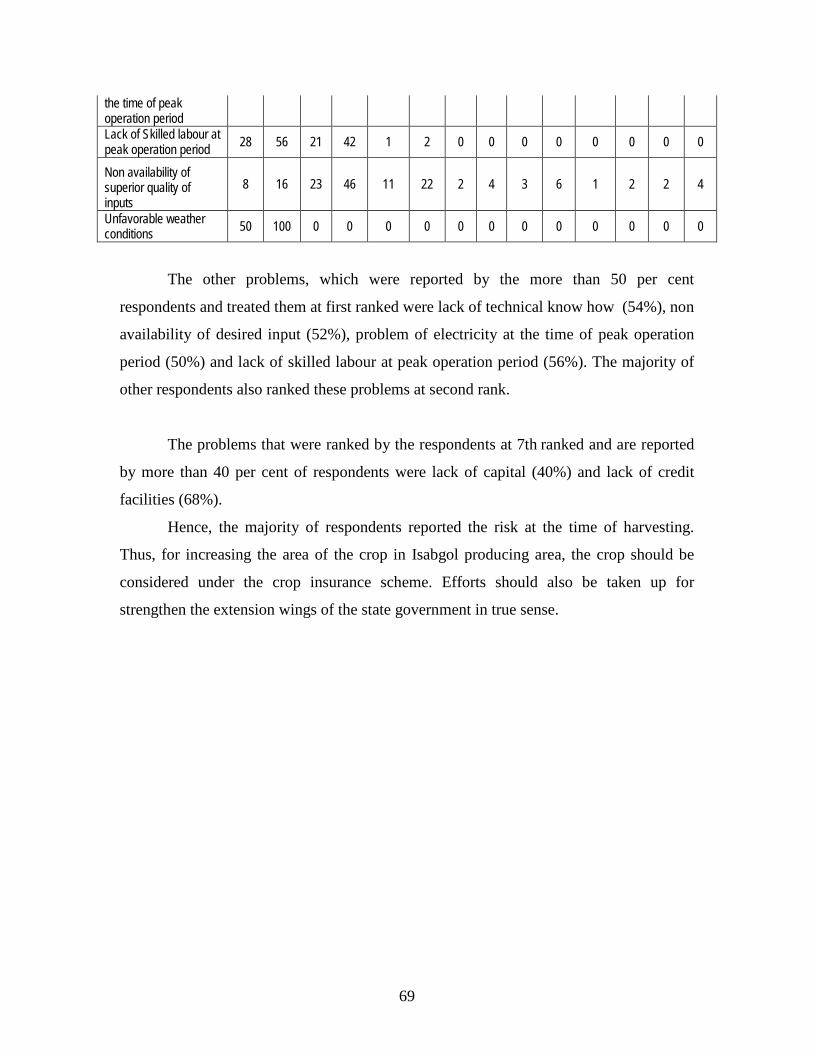
The other problems, which were reported by the more than 50 per cent
respondents and treated them at first ranked were lack of technical know how (54%), non
availability of desired input (52%), problem of electricity at the time of peak operation
period (50%) and lack of skilled labour at peak operation period (56%). The majority of
other respondents also ranked these problems at second rank.
The problems that were ranked by the respondents at 7th ranked and are reported
by more than 40 per cent of respondents were lack of capital (40%) and lack of credit
facilities (68%).
Hence, the majority of respondents reported the risk at the time of harvesting.
Thus, for increasing the area of the crop in Isabgol producing area, the crop should be
considered under the crop insurance scheme. Efforts should also be taken up for
strengthen the extension wings of the state government in true sense.
the time of peak operation period Lack of Skilled labour at peak operation period 28 56 21 42 1 2 0 0 0 0 0 0 0 0
Non availability of superior quality of inputs
8 16 23 46 11 22 2 4 3 6 1 2 2 4
Unfavorable weather conditions 50 100 0 0 0 0 0 0 0 0 0 0 0 0
69
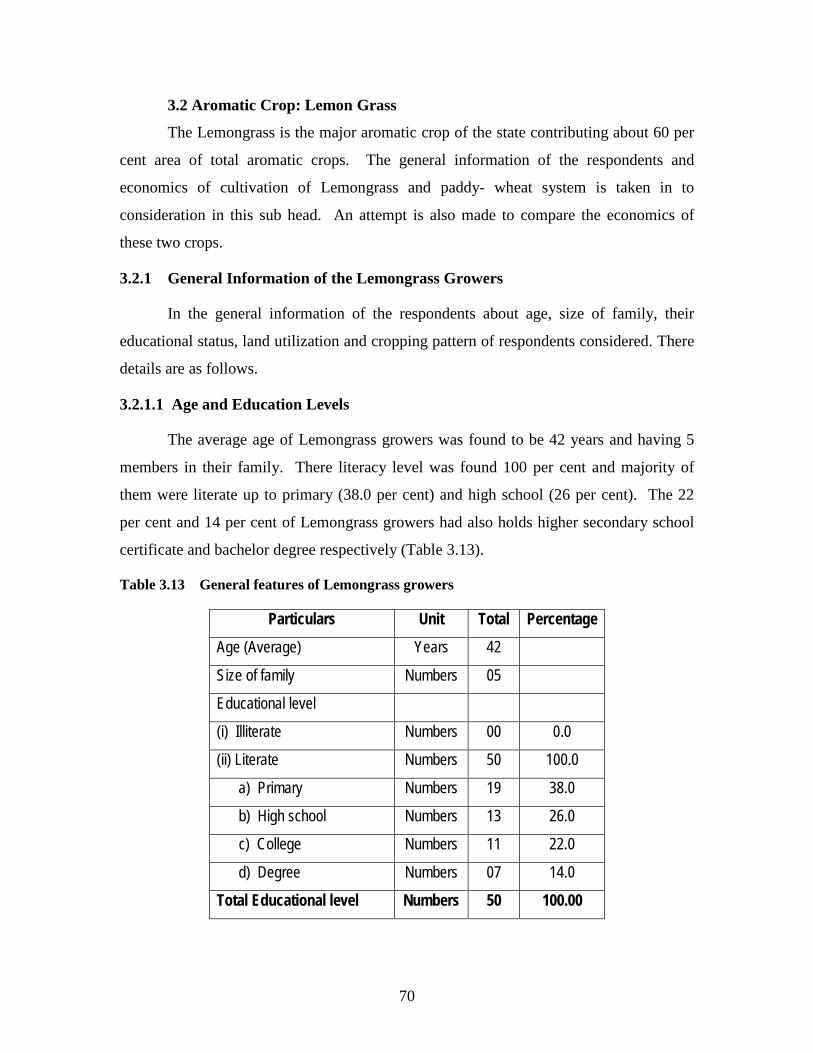
3.2 Aromatic Crop: Lemon Grass
The Lemongrass is the major aromatic crop of the state contributing about 60 per
cent area of total aromatic crops. The general information of the respondents and
economics of cultivation of Lemongrass and paddy- wheat system is taken in to
consideration in this sub head. An attempt is also made to compare the economics of
these two crops.
3.2.1 General Information of the Lemongrass Growers
In the general information of the respondents about age, size of family, their
educational status, land utilization and cropping pattern of respondents considered. There
details are as follows.
3.2.1.1 Age and Education Levels
The average age of Lemongrass growers was found to be 42 years and having 5
members in their family. There literacy level was found 100 per cent and majority of
them were literate up to primary (38.0 per cent) and high school (26 per cent). The 22
per cent and 14 per cent of Lemongrass growers had also holds higher secondary school
certificate and bachelor degree respectively (Table 3.13).
Table 3.13 General features of Lemongrass growers
Particulars Unit Total Percentage Age (Average) Years 42
Size of family Numbers 05
Educational level
(i) Illiterate Numbers 00 0.0
(ii) Literate Numbers 50 100.0
a) Primary Numbers 19 38.0
b) High school Numbers 13 26.0
c) College Numbers 11 22.0
d) Degree Numbers 07 14.0
Total Educational level Numbers 50 100.00
70

3.2.1.2 Land Utilization Pattern As regards to their land holding pattern of the selected Lemongrass growers is
concerned, An average Lemongrass grower’s had used their land resources more
intensively, as their cropping intensity was found to be 199.05 per cent. His 91.09 per
cent area was under irrigation and only 8.91 per cent area of their size of holding was
found rainfed (Table 3.14).
Table 3.14 Details of land holding of Lemongrass growers (ha.)
Particulars Area Percentage 1. Total Area 7.52 100.00 2. Irrigated area 6.85 91.09 3. Un-irrigated 0.67 8.91 4. Fallow Land
Current 0.10 1.33 Permanent 0.00 0.00
5. Pasture land 0.06 0.80 6. Uncultivated land 0.02 0.27 7. Net area Sown 7.34 97.60 8. Double Cropped Area 7.27 9. Gross Cropped Area 14.61 10. Cropping Intensity 199.05
3.2.1.3 Cropping Pattern
An average farmer used their land resources both in kharif as well as rabi season
in the same proportion. (Table 3.15) They devoted their 49.66 per cent of land area in
kharif and 50.34 per cent area in rabi season. Paddy was found to be a major kharif crop
in the area (28.96 per cent) and other crops contributing very meager area like in Jowar
(2.94 per cent), maize (2.18 per cent) and medicinal and aromatic crop (10.52 per cent).
Lemongrass only contributing 2.73 per cent area in kharif and rabi season. The selected
growers also taking vegetable crop in both the season (kharif and rabi) due to nearness of
urban market to fetch the better price. In rabi season cereals are wheat which such the
major crop contributing (29.37 per cent) and in case of pulses gram which contributing
(6.69 per cent).
71

Fig . 3.6 : Land Utilization Pattern of Lemon grass Growers
Net Area Sown
Pasture land
Current Fallow
Uncultivated land
Current Fallow Pasture land Uncultivated land Net Area Sown
Gross Cropped Area: 14.61ha
Fig. 3.7: Cropping Pattern of Lemongrass Growers
Paddy
Jowar
MaizeWheat
Gram
Pea
Moong & UradMedicinal
72

Table 3.15 Details of cropping pattern of Lemongrass growers (ha.)
Particulars Area Percentage Kharif season Paddy 4.24 28.96 Jowar 0.43 2.94 Maize 0.31 2.12 Moong and Urad 0.38 2.60 Medicinal and Aromatic Crops Safed Musali 0.33 2.25 Lemongrass 0.44 2.73 Colius 0.45 3.07 Jatropha 0.36 2.46 Others (vegetables) 0.37 2.53 Rabi Season Wheat 4.30 29.37 Gram 0.98 6.69 Pea 0.25 1.71 Medicinal and Aromatic Crops Lemongrass 0.40 2.73 Colius 0.45 3.07 Jatropha 0.36 2.46 Others (Vegetable) 0.37 2.63 Gross Cropped Area 14.64 100.00
3.2.2 Cost of Cultivation To analyse the cost of cultivation of lemongrass total variable (operational and
input) as well as fixed cost are taken up for analysis. As lemon grass is a perennial crop
having duration of approximately. But due to various problems in its cultivation and
marketing, an average cultivator of the study area uprooted the crop only in 3 years.
Hence, the analysis was done only for the 3 years from the collected primary data from
lemongrass growers and their mean is considered for interpretation.
3.2.2.1Operational Cost
In operational cost all the labours human days (man and women), bullock days
and machine hours engaged in the cultivation of Lemongrass in a hectare of land and in a
farm are taken in to consideration and presented in table 3.16.
It is observed from the data that an average Lemongrass grower’s engaged 61
men days and 49 women days and 22 machine hours per hectare to produce Lemongrass
73
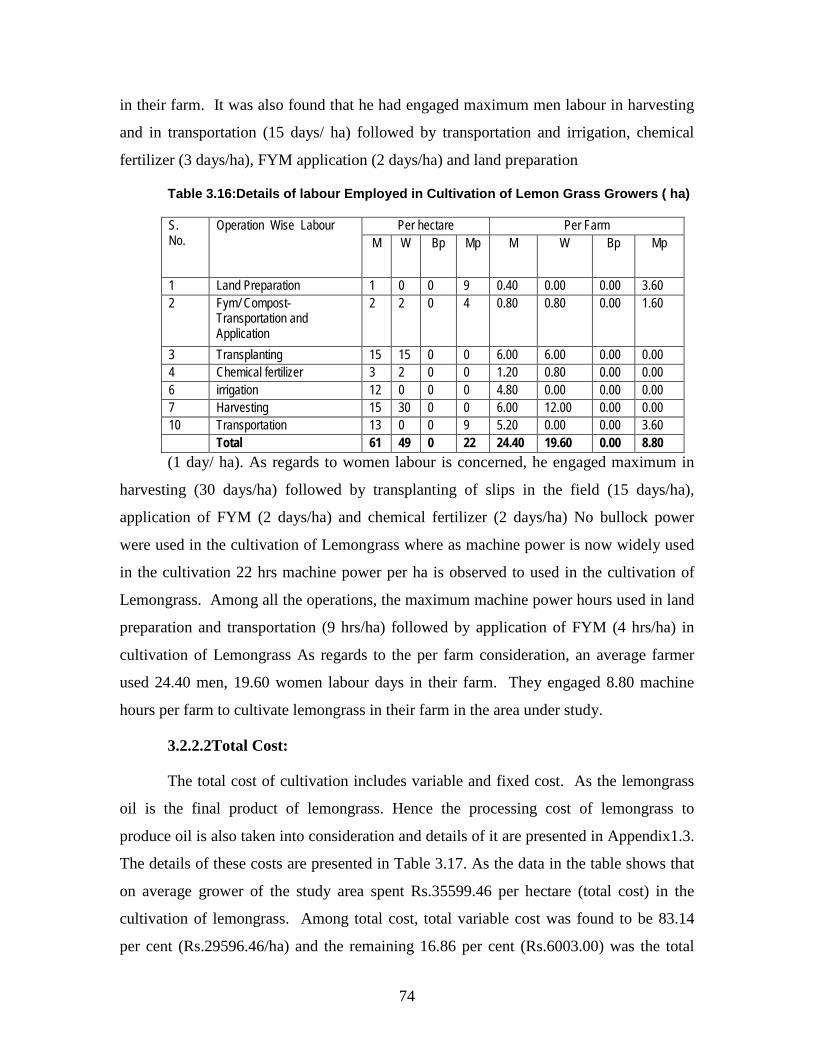
in their farm. It was also found that he had engaged maximum men labour in harvesting
and in transportation (15 days/ ha) followed by transportation and irrigation, chemical
fertilizer (3 days/ha), FYM application (2 days/ha) and land preparation
Table 3.16:Details of labour Employed in Cultivation of Lemon Grass Growers ( ha)
S. No.
Operation Wise Labour Per hectare Per Farm M W Bp Mp M W Bp Mp
1 Land Preparation 1 0 0 9 0.40 0.00 0.00 3.60 2 Fym/ Compost-
Transportation and Application
2 2 0 4 0.80 0.80 0.00 1.60
3 Transplanting 15 15 0 0 6.00 6.00 0.00 0.00 4 Chemical fertilizer 3 2 0 0 1.20 0.80 0.00 0.00 6 irrigation 12 0 0 0 4.80 0.00 0.00 0.00 7 Harvesting 15 30 0 0 6.00 12.00 0.00 0.00 10 Transportation 13 0 0 9 5.20 0.00 0.00 3.60 Total 61 49 0 22 24.40 19.60 0.00 8.80 (1 day/ ha). As regards to women labour is concerned, he engaged maximum in
harvesting (30 days/ha) followed by transplanting of slips in the field (15 days/ha),
application of FYM (2 days/ha) and chemical fertilizer (2 days/ha) No bullock power
were used in the cultivation of Lemongrass where as machine power is now widely used
in the cultivation 22 hrs machine power per ha is observed to used in the cultivation of
Lemongrass. Among all the operations, the maximum machine power hours used in land
preparation and transportation (9 hrs/ha) followed by application of FYM (4 hrs/ha) in
cultivation of Lemongrass As regards to the per farm consideration, an average farmer
used 24.40 men, 19.60 women labour days in their farm. They engaged 8.80 machine
hours per farm to cultivate lemongrass in their farm in the area under study.
3.2.2.2Total Cost:
The total cost of cultivation includes variable and fixed cost. As the lemongrass
oil is the final product of lemongrass. Hence the processing cost of lemongrass to
produce oil is also taken into consideration and details of it are presented in Appendix1.3.
The details of these costs are presented in Table 3.17. As the data in the table shows that
on average grower of the study area spent Rs.35599.46 per hectare (total cost) in the
cultivation of lemongrass. Among total cost, total variable cost was found to be 83.14
per cent (Rs.29596.46/ha) and the remaining 16.86 per cent (Rs.6003.00) was the total
74

fixed cost. Among the total variable cost, the contribution of planting material was found
highest (33.70 per cent) followed by labour (32.61 per cent) irrigation (9.46 per cent),
packing material and transportation (1.69 per cent) and FYM given to the land (1.25 per
cent). An average cultivator spent more in machine labour (Rs.4950.00/ha.) followed by
men
Table 3.17: Economics of cultivation of lemon grass. ( Rs.)
Particulars Quantity Value Percentage to Total
Percentage to TVC
Per ha Per farm Per ha Per farm
VARIABLE COST Planting Material 49870.00 19948.00 9974.00 3989.60 28.02 33.70 Fym ( tractor trolley) 3.71 1.48 371.00 148.40 1.04 1.25 Chemical fertilizer 0.00 0.00 0.00 Urea 153.00 61.20 780.30 312.12 2.19 2.64 DAP 57.00 22.80 561.45 224.58 1.58 1.90 MOP 32.00 12.80 149.12 59.65 0.42 0.50 Labour Men 61.00 24.40 2745.00 1098.00 7.71 9.27 Women 49.00 19.60 1960.00 784.00 5.51 6.62 Bullock Power 0.00 0.00 0.00 0.00 0.00 0.00 Machine Power 22.00 8.80 4950.00 1980.00 13.90 16.72 Total Labour Amortized cost of irrigation 6.00 0.00 2800.00 1120.00 7.87 9.46 Processing Cost 91.80 36.72 2115.00 846.00 5.94 Packing material, packing, loading, transportation
500.00 200.00 1.40 1.69
Interest on working capital 2690.59 1076.24 7.56 9.09
Total Variable Cost 29596.46 11838.58 83.14 100 FIXED COST Rental value of land 5508.00 2203.20 15.47 91.75 Depreciation 495.00 198.00 1.39 8.25 Total Fixed cost 6003.00 2401.20 16.86 100.00 TOTAL COST OF CULTIVATION 35599.46 14239.78 100.00
75

(Rs.2745.00/ha) women labour (Rs.1960.00/ha) in the area under study. It was
found that Lemongrass grower used more machine labours as compared to human labour.
As regards the fixed cost of rental value of land plays an important role in the cultivation
which was found to be 91.75 per cent of the total fixed cost. An average lemongrass
grower spent Rs. 2115.00 as a processing cost of lemon grass oil which is nearly found to
be 6.00 per cent of the total cost of cultivation in the area under study.
Fig. 3.8 : Cost of Cultivation of Cultivation of Lemongrassl
Total Input 56%
Total Laobur 27%
Total Fixed cost 17%
Total Cost of Cultivation Rs. 35599.46/ha
76

3.2.2.3 Returns from Lemongrass
Average Lemongrass growers received Rs.27540 per hectare returns from
extraction of oil after processing the raw lemon grass leaves. As regard the net return
over total cost, it was found to be negative (Rs.-8059.46/ ha.). The net return over the
total variable cost was also found negative (Rs.-2056.46/ha). The cost of production/ liter
was found Rs.332.40 over variable cost, while it was Rs.387.79 over total cost. It means
the Lemongrass grower of the area under study are not receiving sufficient profit from
their produce of the lemon grass, as the one liter price of the produce was less in the area
under study. The data also reveals that an average Lemongrass grower receiving only Rs
0.93 on total variable cost, while he received only Rs.0.77 over total cost of cultivation
on investment of Rs. 1.00. ( Table 3.18)
Table 3.18: Returns from Cultivation of Lemon grass ( ha)
S. No. Particulars
Quantity Value Per ha Per farm Per ha Per farm
1 Yield of main product 91.8 36.72 2 Price per liter 300 27540 11016.00 3 Yield of byproduct 4 Price per kg 5 Gross return 27540 11016.00 6 Total variable cost of cultivation 29596.46 11838.58 7 Total cost of cultivation 35599.46 14239.78 8 Net Return:
a) Over variable cost -2056.46 -822.58 b) Over total cost -8059.46 -3223.78 9 Cost of Production /liter
a) Over variable cost 322.40 b) Over total cost 387.79 10 Return per Rupee a) Over variable cost 0.93 b) Over total cost 0.77
3.2.3 Competing Crop of Lemongrass- Paddy- Wheat
Lemongrass is the perennial crop, which is suitable for the development of waste
land and the recommendation of this particular crop is only for the degraded land which
is not use for cultivation purposes. Lemon grass has an ability to develop these degraded
77

lands into cultivable land in due course of time (approximate 5 years).But due to lack of
technical know-how, the cultivators of the study area shifted their traditional crop
rotation (paddy - wheat) in to lemongrass crop cultivation. Hence, this crop rotation i. e.
paddy followed by wheat is taken into consideration, while comparing this particular crop
(Lemongrass). The economics of related to paddy and wheat crop individually is given in
Appendix 1.4. As the data of cost of cultivation of paddy and wheat were collected from
the same respondents hence, their general information of paddy-wheat growers is same as
of lemongrass growers.
3.2.3.1 General Features of Paddy –Wheat cropping Sequence:
The Paddy –Wheat cropping sequence is the main cropping sequence in the area
of the state where average rainfall is above 1200mm. The general feature of wheat is
already discussed. Hence, in this subhead the general feature of paddy is dealt in detail.
Among the food crops, paddy (Oryza Sativa (L)occupies an extremely important
position. It constitutes the main source of food throughout Asia and other parts of the
world. Paddy is the only grain crop which can be grown under a wide range of edaphic
and environmental conditions, such as monsoonal conditions prevalent in the major areas
of tropical Asia and elsewhere. Frequent flooding is a normal feature in these areas. In
India, paddy occupies the first position among the cereals in respect of both area and
production. In 2001, paddy was grown on about 152 million ha. in the entire world.
The productivity of paddy in different states of India is lower as compared to
India (Table 3.19). Factors like drought lodging, weeds, soils acidity/ sodicity, poor soil
fertility, insect pest diseases, rodents etc. are responsible for low yields and the yield loss
varies from ecosystem to ecosystem.
In north- eastern as well as peninsular parts of India paddy is grown through out the year,
subject to the availability of the required volume of water through rainfall and/ or
irrigation. It has been observed that generally a single rainfed paddy crop can be
produced if the rainfall varies between 1000 and 1500 millimeters. This quantum of
rainfall should be distributed over a period of 90 to 110 days. If requires 20 – 34oC
temperature. A seed rate used 30-60 kg./hectare, nursery plant transplanted after 21 days
of sowing up to 2nd & 3rd week of July. Among the total Area and Production of India,
Madhya Pradesh is contributed 4.0 per cent area and 2.0 per cent of production.
78
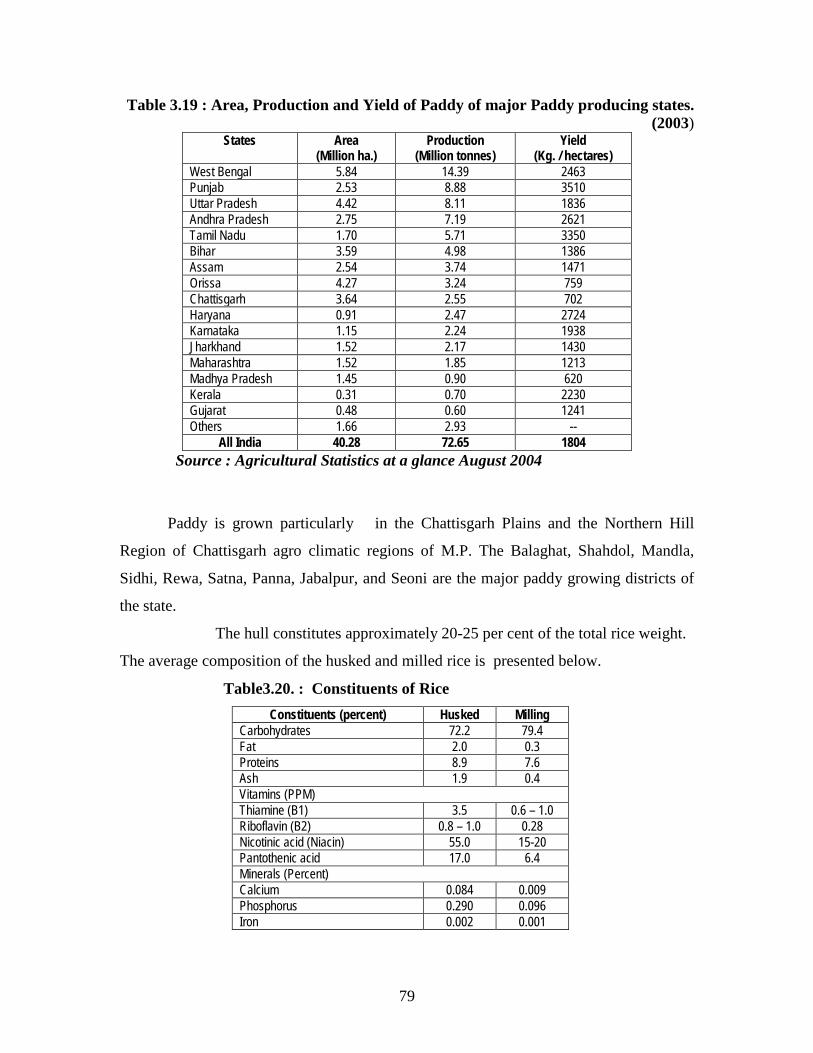
Table 3.19 : Area, Production and Yield of Paddy of major Paddy producing states. (2003)
States Area (Million ha.)
Production (Million tonnes)
Yield (Kg. / hectares)
West Bengal 5.84 14.39 2463 Punjab 2.53 8.88 3510 Uttar Pradesh 4.42 8.11 1836 Andhra Pradesh 2.75 7.19 2621 Tamil Nadu 1.70 5.71 3350 Bihar 3.59 4.98 1386 Assam 2.54 3.74 1471 Orissa 4.27 3.24 759 Chattisgarh 3.64 2.55 702 Haryana 0.91 2.47 2724 Karnataka 1.15 2.24 1938 Jharkhand 1.52 2.17 1430 Maharashtra 1.52 1.85 1213 Madhya Pradesh 1.45 0.90 620 Kerala 0.31 0.70 2230 Gujarat 0.48 0.60 1241 Others 1.66 2.93 --
All India 40.28 72.65 1804 Source : Agricultural Statistics at a glance August 2004
Paddy is grown particularly in the Chattisgarh Plains and the Northern Hill
Region of Chattisgarh agro climatic regions of M.P. The Balaghat, Shahdol, Mandla,
Sidhi, Rewa, Satna, Panna, Jabalpur, and Seoni are the major paddy growing districts of
the state.
The hull constitutes approximately 20-25 per cent of the total rice weight.
The average composition of the husked and milled rice is presented below.
Table3.20. : Constituents of Rice Constituents (percent) Husked Milling
Carbohydrates 72.2 79.4 Fat 2.0 0.3 Proteins 8.9 7.6 Ash 1.9 0.4 Vitamins (PPM) Thiamine (B1) 3.5 0.6 – 1.0 Riboflavin (B2) 0.8 – 1.0 0.28 Nicotinic acid (Niacin) 55.0 15-20 Pantothenic acid 17.0 6.4 Minerals (Percent) Calcium 0.084 0.009 Phosphorus 0.290 0.096 Iron 0.002 0.001
79

Rice is mostly consumed as cooked whole grains. Milling technology is therefore
geared to obtain maximum out turn of milled rice reducing the breakage to the minimum.
The most commonly used machine is a rice huller, which combines de-husking and
polishing in one operation, but the whole rice recovery is below 65% and rice breakage
is very high (30 – 40 per cent). For further improving the milling and nutritive value of
rice, it is parboiled before milling. This process involves soaking in water steaming &
drying. Rice when milled usually yields apart from white rice 21- 24 per cent, husk 3- 7
per cent and 0.2 – 2 per cent broken and germs.
Rice by and large is consumed as a whole grain. It is also used for brewing in
many regions. However Rice is ground into flour to manufacture products viz. snack
foods like rice cake, noodles, cookies as well as baby food. In general flour made from
waxy rice is better in quality for use as a thickening agent to make white sauces,
puddings, and gravies. The most widespread use of rice hull littering or bedding which
has been practiced since ages. Hulls are also used as boiler fuel. These are particularly
useful for bedding of poultry pans/ sheds. Rice hull ash used as oil absorbent and
provides an anti solid surface. Water proof (resistant) composite building boards can be
successfully made from the rice hull.
Paddy bran is source of protein, oil and nutrients. It is mainly used as a animal
feed but its use is limited owing to a high oil content along with a high level of fatty
acids. Its oil content varies from 5- 20 percent. High quality edible oil is extracted from
fresh raw paddy bran. Paddy bran oil is highly rich is nutrients like vitamin E. It is
helpful in lowering the cholesterol level in the blood. It is used for cooking and frying
after necessary processing crude paddy bran oils which have a high acid value are
generally used to produce solidified oil. stearic and acids glycerin and soap. Rice wax is
useful for industrial, cosmetic and edible purposes after it has been perfectly processed.
Paddy straw does not make a good fodder is yet fed to the animals is used as bedding
material in animal sheds. Paddy straw is also used as a packing material mainly as a filter
for various finished goods, fruits and vegetables. It can be used as a mulching material
for soil and water conservation.
80

3.2.3.1Cost of Cultivation:
The cost of cultivation related paddy-wheat crop rotation is given under this sub
head, which includes operational cost, total cost and returns per ha and per farm in the
area under study.
3.2.3.1.1 Operational Cost:
As per the data given in table 3.21, it is clear that an average grower employed
more women labours (118 days) followed by men (65.7 days ) and machine
(36.55hours ) in cultivation of paddy- wheat crops. Among the 118 women days which
were utilized in cultivation the maximum were engaged in harvesting (52.3 days)
followed by transplanting (38 days), weeding (18.1 days), processing (7.6 days) and
packing (2 days). As regard to men days the maximum were used in irrigation(17.8
days followed by harvesting (9.5 days), processing (8.6 days), transportation (5.5 days),
weeding (4.5 days), chemical fertilizer (4.3 days), marketing (4 days), land preparation,
FYM & transplanting (2. 2 days/ha.) .
Table 3.21: Details of labour Employed in Cultivation of Paddy Wheat Growers ( ha)
S. No. Operation Wise Labour
Per hactare Per Farm M W Bp Mp M W Bp Mp
1 Land Preparation 2.00 0.00 0.00 9.10 8.54 0.00 0.00 38.86
2 Fym/ Compost-Transportation and Application
2.00 0.00 0.00 2.00 8.48 0.00 0.00 8.48
3 Transplanting 4.00 38.00 0.00 5.95 17.02 161.18 0.00 25.40 4 Chemical fertilizer 4.30 0.00 0.00 0.00 18.35 0.00 0.00 0.00 5 Weeding -manual 4.50 18.10 0.00 0.00 19.20 76.74 0.00 0.00 6 irrigation 17.80 0.00 0.00 0.00 76.22 0.00 0.00 0.00 7 Harvesting 9.50 52.30 0.00 0.00 40.61 222.77 0.00 0.00 8 Processing 8.60 7.60 0.00 15.50 36.76 32.34 0.00 66.38 9 Packing 3.50 2.00 0.00 0.00 14.90 8.54 0.00 0.00
10 Transportation 5.50 0.00 0.00 2.00 23.50 0.00 0.00 8.54 11 Marketing 4.00 0.00 0.00 2.00 17.08 0.00 0.00 8.54 Total 65.70 118.00 0.00 36.55 280.67 501.58 0.00 156.20
As regards to the machine power which was used in cultivation of paddy-wheat
cropping system it is found that only 36.55 hours used in the study area. Amongst the
total number of machine power hours was found the maximum were used in processing
81

(15.5 hours) followed by land preparation (9.1hours), Transplanting (5.96 hours) and
transportation as well as marketing and FYM application per ha in the study area.
3.2.3.2 Total Cost
The total cost of cultivation of paddy- wheat cropping system per hectare of an
average farmer is presented in table 3.22. The total cost includes both variable as well as
fixed cost. It is observed from the data that total cost Rs.33,738.59/ha occurred in
cultivation of paddy-wheat during a year in which variable cost was Rs.26,326.54/ ha
(78.03%) and fixed cost Rs.7412.06/ha (21.97%). Amongst the total variable cost it was
found that 60.40 per cent cost spent on labour and 39.60 per cent cost spent on input by
average sample farmer. It shows that the prevailing paddy-wheat cropping system was
labour intensive rather than capital intensive. Amongst the total labour cost the
maximum used in machine labour (31.24%) followed by women labour (17.93 per cent)
and men labour (11.23 per cent) used in their field for the cultivation of paddy-wheat
crops. Amongst the input cost it was found that the maximum cost was spent on
irrigation (13.24 per cent) followed by fertilizer (9.74 per cent), seed (9.30 per cent),
packing (3.18 per cent) and FYM (1 per cent).
3.2.3.3 Returns from Paddy-Wheat cropping System:
The returns obtained by an average cultivator are presented in table 3.22. It is
depicted from the data that an average farmer received Rs. 17,085.22/ hectare as a net
return over variable cost and Rs.9,673.17/ ha over total cost. The cost of production of
producing a quintal of paddy and wheat was found to be Rs.436.74/ quintal over variable
cost and Rs.559.70/ quintal over total cost in the area under study. As regards returns
from per rupees investment an average farmer got Rs.1.65 over variable cost and Rs.1.29
over total cost in paddy- wheat cropping system in the study area.
82

Table 3.22: Cost and Returns from Cultivation of Paddy -wheat
S. No Particulars Per ha Per farm Percentage
to Total Percentage to
TVC/FC
A VARIABLE COST 1 Seed 2447.60 20902.50 7.25 9.30 2 Fym ( tractor trolley) 264.30 2257.12 0.78 1.00 3 Chemical fertilizer 0.00 0 0.00 a) Urea 873.73 7461.67 2.59 3.32 b) DAP 1515.03 12938.34 4.49 5.75 d) MOP 175.59 1499.59 0.52 0.67 4 Labour a) Men 2956.50 25248.51 8.76 11.23 b) Women 4720.00 40308.8 13.99 17.93 c) Bullock Power 0.00 0 0.00 0.00 d) Machine Power 8223.75 70230.83 24.37 31.24 Total Labour 15900.25 135788.10 47.13 5 Amortized cost of irrigation 3486.25 29772.58 10.33 13.24 6 Packing material, packing
,loading, transportation 837.80 7154.81 2.48 3.18
7 Interest on working capital 825.99 7053.96 2.45 3.14 8 Total Variable Cost 26326.54 224828.60 78.03 100 B FIXED COST 9 Rental value of land 7907.62 67531.07 23.44 106.69 10 Depreciation 822.38 7023.08 2.44 11.10 11 Total Fixed cost 7412.06 63298.95 21.97 100.00 c TOTAL COST OF
CULTIVATION 33738.59 288127.60 100.00
D RETURNS 12 Gross return 43411.76 370736.40 13 Net Return:
Over variable cost 17085.22 145907.80 Over total cost 9673.17 82608.84
14 Per Rupee Return Over variable cost 1.65 Over total cost 1.29
15 Cost of Production Over variable cost 436.74 Over total cost 559.70
83

3.2.3.4 Lemon grass Vs Paddy-Wheat cropping System:
The comparative economics of lemongrass over paddy-wheat cropping system per
ha and per farm have been worked out and presented in table 3.23. It is depicted from the
data that lemongrass is not a profitable combination when we compared it with paddy-
wheat cropping system. An average farmer received 930.81 per cent less net return over
variable cost from paddy-wheat cropping sequences as compared to lemongrass. He also
got 220.02 percent less over total cost of cultivation as compared to paddy-wheat
cropping system.
Table 3.23: Comparative Cost & Returns of Lemon grass and Paddy -Wheat ( Rs/ha)
S. No. Particulars Lemon
grass Paddy-Wheat
Percentage Difference
over Lemon grass
COST 1 Total Input 1994146 10426.29 99.48 2 Total Labour 9655.00 15900.25 -64.68 3 Total Variable Cost 29596.46 26326.54 11.05 4 Total Fixed cost 6003.00 7412.06 -23.47 5 TOTAL COST OF
CULTIVATION 35599.46 33738.60 5.23
RETURN 1 Gross return 27540.00 43411.76 -57.63 2 Net Return: a) Over variable cost -2056.46 17085.22 930.81 b) Over total cost -8059.46 9673.16 220.02 4 Return per Rupee a) Over variable cost 0.93 1.65 -77.32 b) Over total cost 0.77 1.29 -67.53
84
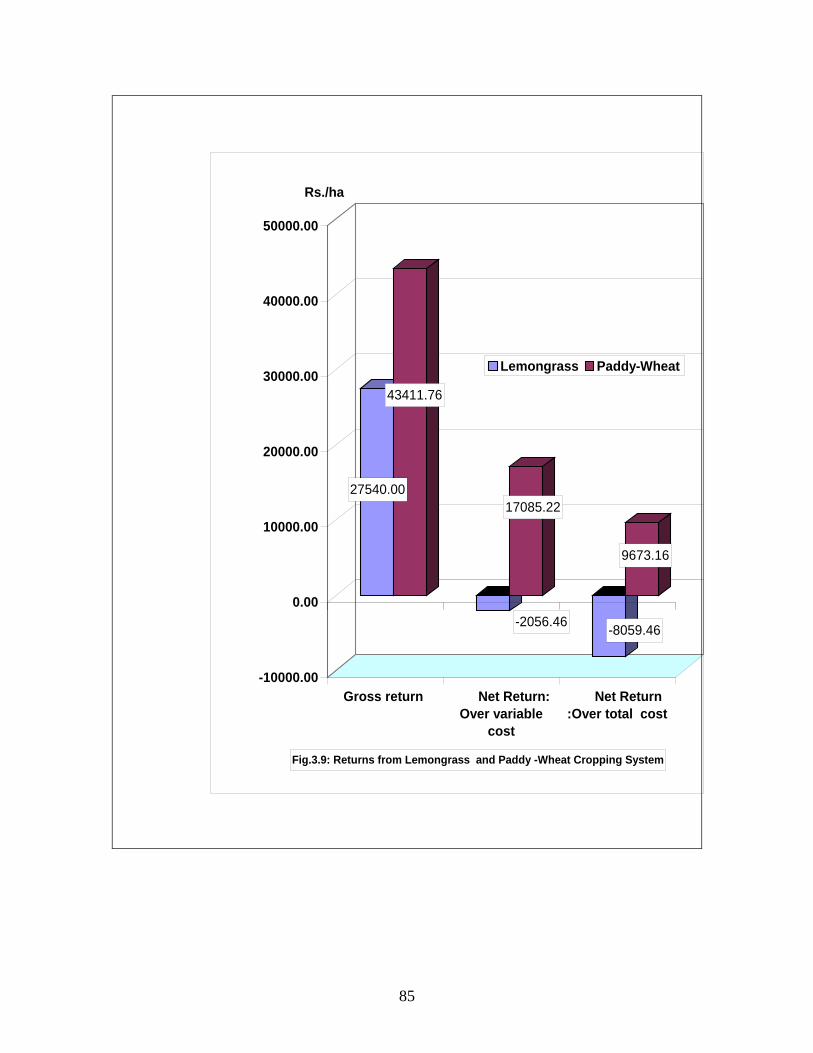
27540.00
43411.76
-2056.46
17085.22
-8059.46
9673.16
-10000.00
0.00
10000.00
20000.00
30000.00
40000.00
50000.00
Rs./ha
Gross return Net Return:Over variable
cost
Net Return:Over total cost
Fig.3.9: Returns from Lemongrass and Paddy -Wheat Cropping System
Lemongrass Paddy-Wheat
85
The cultivation of lemon grass is capital intensive rather than labour intensive.
The cultivation of lemongrass provided less employment (-64.68%) as compared to
paddy- wheat cropping system, while it need more input (99.48%) as compared to paddy
-wheat cropping system. The cultivation of lemongrass needs more cost (5.23%) as
compared to paddy -wheat cropping system. Due to all these reasons the cultivators of
the study area shifted their lemon grass area to other crops (Colius).
Hence, the growing of lemongrass is proved to be a means of diversification due
to the fact that after growing lemongrass the cultivators rather than came back to their
traditional cropping system i.e. paddy-wheat, they shifted their lemongrass area to a more
remunerative medicinal crop i.e. colius in the area under study.
oooo
86
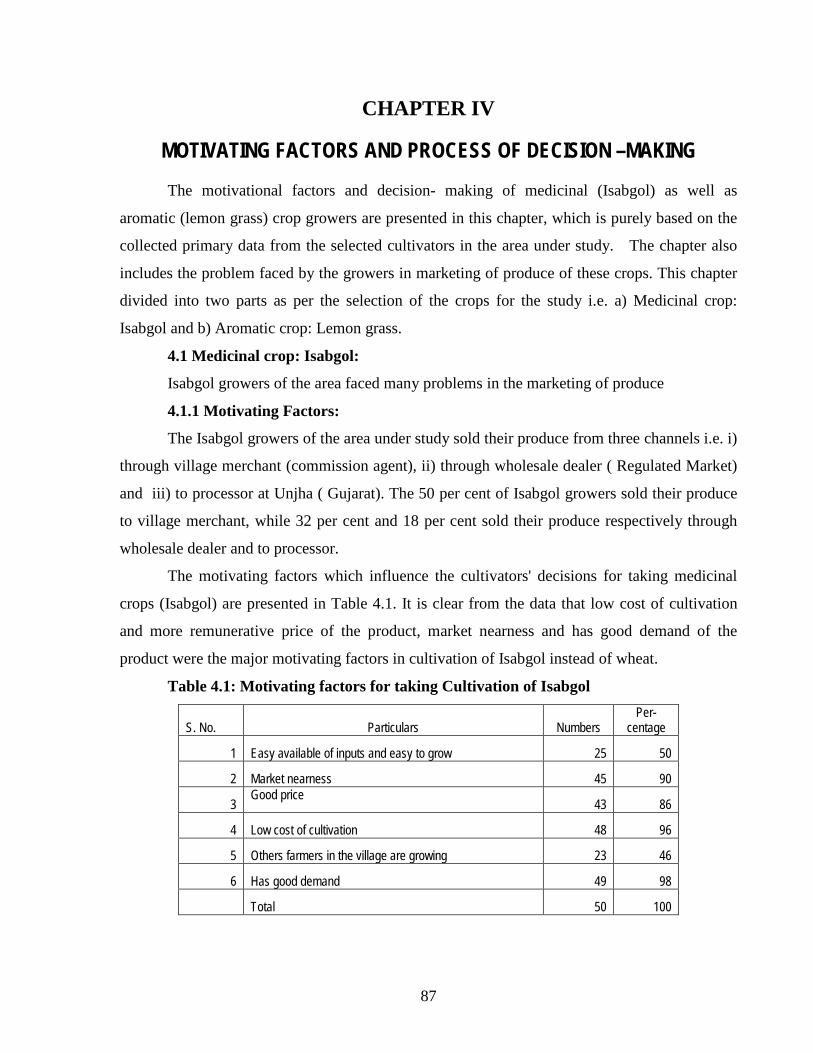
CHAPTER IV
MOTIVATING FACTORS AND PROCESS OF DECISION –MAKING
The motivational factors and decision- making of medicinal (Isabgol) as well as
aromatic (lemon grass) crop growers are presented in this chapter, which is purely based on the
collected primary data from the selected cultivators in the area under study. The chapter also
includes the problem faced by the growers in marketing of produce of these crops. This chapter
divided into two parts as per the selection of the crops for the study i.e. a) Medicinal crop:
Isabgol and b) Aromatic crop: Lemon grass.
4.1 Medicinal crop: Isabgol:
Isabgol growers of the area faced many problems in the marketing of produce
4.1.1 Motivating Factors:
The Isabgol growers of the area under study sold their produce from three channels i.e. i)
through village merchant (commission agent), ii) through wholesale dealer ( Regulated Market)
and iii) to processor at Unjha ( Gujarat). The 50 per cent of Isabgol growers sold their produce
to village merchant, while 32 per cent and 18 per cent sold their produce respectively through
wholesale dealer and to processor.
The motivating factors which influence the cultivators' decisions for taking medicinal
crops (Isabgol) are presented in Table 4.1. It is clear from the data that low cost of cultivation
and more remunerative price of the product, market nearness and has good demand of the
product were the major motivating factors in cultivation of Isabgol instead of wheat.
Table 4.1: Motivating factors for taking Cultivation of Isabgol
S. No. Particulars Numbers Per-
centage
1 Easy available of inputs and easy to grow 25 50
2 Market nearness 45 90
3 Good price
43 86
4 Low cost of cultivation 48 96
5 Others farmers in the village are growing 23 46
6 Has good demand 49 98
Total 50 100
87

These reasons were reported by more than 85 per cent of cultivators in the area under
study. Other factors which, influenced the farmers' decisions and reported by the 50 and 46 per
cent of cultivators were easy availability of input and easy to grow by the cultivators, and others
farmers in the village are growing.
4.1.2 Factors that Provoke farmers to shift area under Wheat to Isabgol:
Factors that provoke farmers to shift area under wheat to Isabgol are presented in table
4.2. It is depicted from the data that the major factors that provoke them are the higher price of
Isabgol than wheat (80% and 20 %), less problem in marketing (20 % and 80%), less market
margin and more profit in growing Isabgol than Wheat as reported by the majority of cultivators
and put them at 1st and 2nd ranked. The factors which are of least importance and cultivators put
them at 6th and 7th ranked are it is tedious to grow wheat, inadequate knowledge and unfavorable
weather condition to grow wheat in the area under study.
Table 4.2: Factors that Provoke farmers to shift area under Wheat to Isabgol
S.NO. Particulars
Rank given by the Respondents
1 2 3 4 5 6 7
No. % No. % No. % No. % No. % No. % No. % 1 Price of the Isabgol is
higher than Wheat 40 80 10 20 0 0 0 0 0 0 0 0 0 0 2 Large market margin and
less profit 30 60 5 10 3 6 2 4 4 8 6 12 0 0 3 No Problem of pest and
diseases on the crop 0 0 0 0 0 0 0 0 0 0 24 48 26 52 4
Problem in marketing 0 0 0 0 0 0 0 0 0 0 10 20 40 80 5
Price Fluctuations 2 4 4 0 4 8 3 6 24 48 10 20 3 6 6 It is tedious to grow the
medicinal crop 0 0 0 0 0 0 0 0 0 0 14 28 36 72 7
Inadequate Knowledge 0 0 0 0 2 4 0 0 0 0 25 50 24 48 8 Unfavorable weather
conditions at the time of harvesting 0 0 0 0 0 0 0 0 0 0 32 64 18 36
88

4.1.3 Marketing Problems:
There are so many problems existed in the marketing of medicinal crops as reported by
numbers of research workers. But Isabgol is an exception to these medicinal crops. As the majority of
Isabgol growers frankly reported that they have not any problem as related to marketing of Isabgol in
the area under study. The 48 per cent of them reported this fact at 1st rank while others (52%) ranked it
at 2nd position. Thus, there is no specific problem related to Isabgol is found in the area under study.
All the general problems which were faced by Isabgol growers are the higher commission of village
merchant, delay in payment, irrational deductions as reported by 40 per cent, 46 per cent , and 46 per
cent respectively cultivators and put this problems at 1st and 2nd rank, while others were reported them
at 3rd to 7th rank . (Table 4.3)The others problems which are of less importance and more than 40 per
cent Isabgol growers put them at 7th position are quote lower price than actual prevailing price (54%),
Whole sellers not taking consent while selling (68%), harassment by middlemen (56%) and distant
market ( 46%)
Table 4.3: Marketing Problems Faced by the Farmers in growing Isabgol
Particulars Rank given by the Respondents
1 2 3 4 5 6 7 No. % No. % No. % No. % No. % No. % No. %
Quote lower price than actual prevailing price 0 0 0 0 0 0 0 0 0 0 23 46 27 54 Higher Commission 20 40 15 30 4 8 4 8 7 14 0 0 0 0 Whole sellers not taking consent while selling 0 0 0 0 0 0 0 0 6 12 10 20 34 68 Delay in payment 23 46 15 30 10 20 2 4 0 0 0 0 0 0 Irrational deductions 23 46 15 30 4 8 3 6 2 4 2 4 1 2 harassment by middlemen 0 0 0 0 0 0 0 0 1 2 21 42 28 56 Distant market 8 16 2 4 1 2 2 4 3 6 11 22 23 46 No Problem 0 0 0 0 0 0 0 0 0 0 24 48 26 52
89
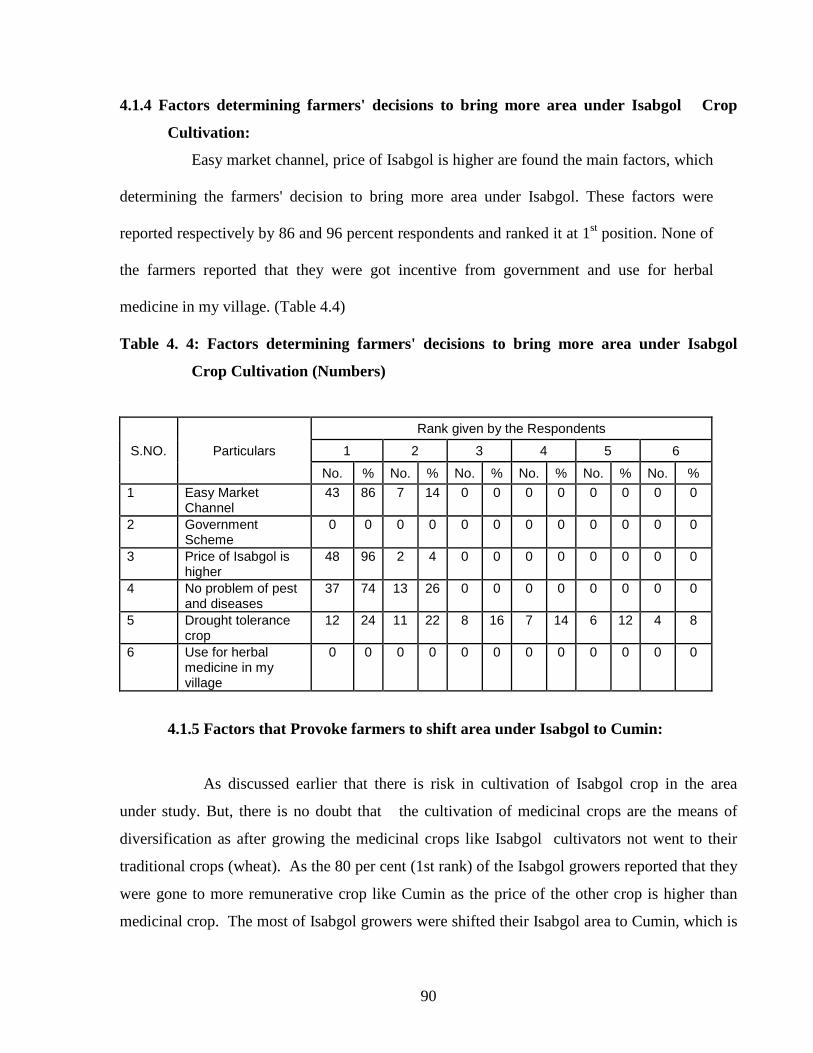
4.1.4 Factors determining farmers' decisions to bring more area under Isabgol Crop
Cultivation:
Easy market channel, price of Isabgol is higher are found the main factors, which
determining the farmers' decision to bring more area under Isabgol. These factors were
reported respectively by 86 and 96 percent respondents and ranked it at 1st position. None of
the farmers reported that they were got incentive from government and use for herbal
medicine in my village. (Table 4.4)
Table 4. 4: Factors determining farmers' decisions to bring more area under Isabgol
Crop Cultivation (Numbers)
S.NO. Particulars
Rank given by the Respondents
1 2 3 4 5 6
No. % No. % No. % No. % No. % No. % 1 Easy Market
Channel 43 86 7 14 0 0 0 0 0 0 0 0
2 Government Scheme
0 0 0 0 0 0 0 0 0 0 0 0
3 Price of Isabgol is higher
48 96 2 4 0 0 0 0 0 0 0 0
4 No problem of pest and diseases
37 74 13 26 0 0 0 0 0 0 0 0
5 Drought tolerance crop
12 24 11 22 8 16 7 14 6 12 4 8
6 Use for herbal medicine in my village
0 0 0 0 0 0 0 0 0 0 0 0
4.1.5 Factors that Provoke farmers to shift area under Isabgol to Cumin:
As discussed earlier that there is risk in cultivation of Isabgol crop in the area
under study. But, there is no doubt that the cultivation of medicinal crops are the means of
diversification as after growing the medicinal crops like Isabgol cultivators not went to their
traditional crops (wheat). As the 80 per cent (1st rank) of the Isabgol growers reported that they
were gone to more remunerative crop like Cumin as the price of the other crop is higher than
medicinal crop. The most of Isabgol growers were shifted their Isabgol area to Cumin, which is
90

one of the more remunerative crops of the area under study. In the same cost of cultivation and
same productivity levels cultivators got more remuneration as the price of Cumin is
approximately Rs.7000/- per quintal.
Table 4.5: Factors that Provoke farmers, to shift area under Isabgol to Cumin
(Numbers)
Particulars Rank given by the Respondents
1 2 3 4 5 6 7 No. % No. % No. % No. % No. % No. % No. %
Price of the other crop is higher than medicinal crop 40 80 10 20 0 0 0 0 0 0 0 0 0 0 Large market margin and less profit 30 60 5 10 3 6 2 4 4 8 6 12 0 0 No Problem of pest and diseases on the crop 0 0 0 0 0 0 0 0 0 0 24 48 26 52 Problem in marketing 0 0 0 0 0 0 0 0 0 0 10 20 40 80 Price Fluctuations 24 48 10 20 4 8 3 6 2 4 4 0 3 6 It is tedious to grow the medicinal crop 0 0 0 0 0 0 0 0 0 0 14 28 36 72 Inadequate Knowledge 25 50 24 48 2 4 0 0 0 0 0 0 0 0 Unfavorable weather conditions at the time of harvesting 32 64 18 36 0 0 0 0 0 0 0 0 0 0
The other factors that provoked by them and more than 40 per cent of Isabgol growers
put it at 1st rank are price fluctuation, and inadequate knowledge. The factors that of less
importance and Isabgol growers put them at 7th ranked are no problem of pest and diseases on
the crop, problem in marketing, and it is tedious to grow the medicinal crop as reported by 72,
80, and 52 per cent of Isabgol growers in the study area.
4.1.6 Factors those Determining farmers’ decisions to bring area under Wheat:
The cultivators' still not compromised with Isabgol cultivation with the wheat as it is
consumed at his home (100%) , having easy market channels(60%), government schemes ( 80%) i.e.
support price , crop insurance, crop loan etc. , more tolerance to rains as compared to Isabgol (72%) ,
91

less price fluctuation than Isabgol( 52%) more knowledge of cultivation ( 52%) and unfavorable
weather conditions at the time of harvesting (64%) .
Table 4. 6: Factors determining farmers' decisions to bring more area under wheat than Isabgol
(Numbers)
Particulars Rank given by the Respondents 1 2 3 4 5 6 7 No. % No. % No. % No. % No. % No. % No. %
Easy Market Channel 30 60 20 40 0 0 0 0 0 0 0 0 0 0 Government Scheme 40 80 10 20 0 0 0 0 0 0 0 0 0 0 No Problem of pest and diseases 0 0 0 0 0 0 0 0 0 0 24 48 26 52 Tolerant to rains 36 72 14 28 0 0 0 0 0 0 0 0 0 0 Price Fluctuations 26 52 8 16 4 8 3 6 2 4 4 0 3 6 It is tedious to grow the medicinal crop 0 0 0 0 0 0 0 0 0 0 14 28 36 72 Adequate Knowledge 26 52 23 46 1 2 0 0 0 0 0 0 0 0 Home Consumption 50 100 0 0 0 0 0 0 0 0 0 0 0 0
More than 50 per cent of cultivators of the area under study reported all these factors and
put by them at 1st ranked. (Table 4.6). The others factors which were of less importance and put by
the cultivators at 7th ranked are it is tedious to grow the medicinal crop and no problem of pest and
diseases as reported by 72 and 52 per cent of cultivators respectively.
92

4.2 Aromatic crop: Lemongrass:
The cultivators of the study area are facing so many problems in the marketing of lemon
grass produce (oil).
4.2.1 Motivating Factors:
The motivating factors are entirely different from those of given for the medicinal crop
of the study. The real fact is that, in the study area, the traders were convinced the cultivators
that if they produce lemon grass in their field, they become millionaires in a short span of time.
In this way, the traders sold their planting material of lemongrass to the innocent farmers at high
price and were benefited. After that, the traders shifted their area of cultivation to another
remunerative crop or in another business. Although, in some extent the motivational factors for
taking lemongrass cultivation in the area under study were, easy available of inputs and easy to
grow, and has good demand as reported by 42 and 28 per cent of respondents in the area under
study. (Table 4.7)
Table 4.7: Motivating factors for taking Cultivation of Lemongrass
S. No. Particulars No. Percentage 1 Easy available of inputs and easy to grow 21 42 2 Market nearness 6 12 3 Good price 4 8 4 Low cost of cultivation 2 4 5 Others farmers in the village are growing 3 6 6 Has good demand 14 28
Total 50 100 4.2.2 Factors that Provoke farmers to shift area under Paddy –Wheat to
Lemongrass:
The factors that provoke farmers to shift area under paddy - wheat to lemongrass are
presented in table 4.8. It is depicted from the data that price of lemongrass is higher than paddy-
wheat, large market margin and less profit were the main factors ,which provoke farmers to shift
area under paddy –wheat crops to lemon grass as reported by 58 and 20 percent, and 52 and 18
percent farmers and ranked it at respectively at 1st and 2nd position. Others factors i.e. problem
93
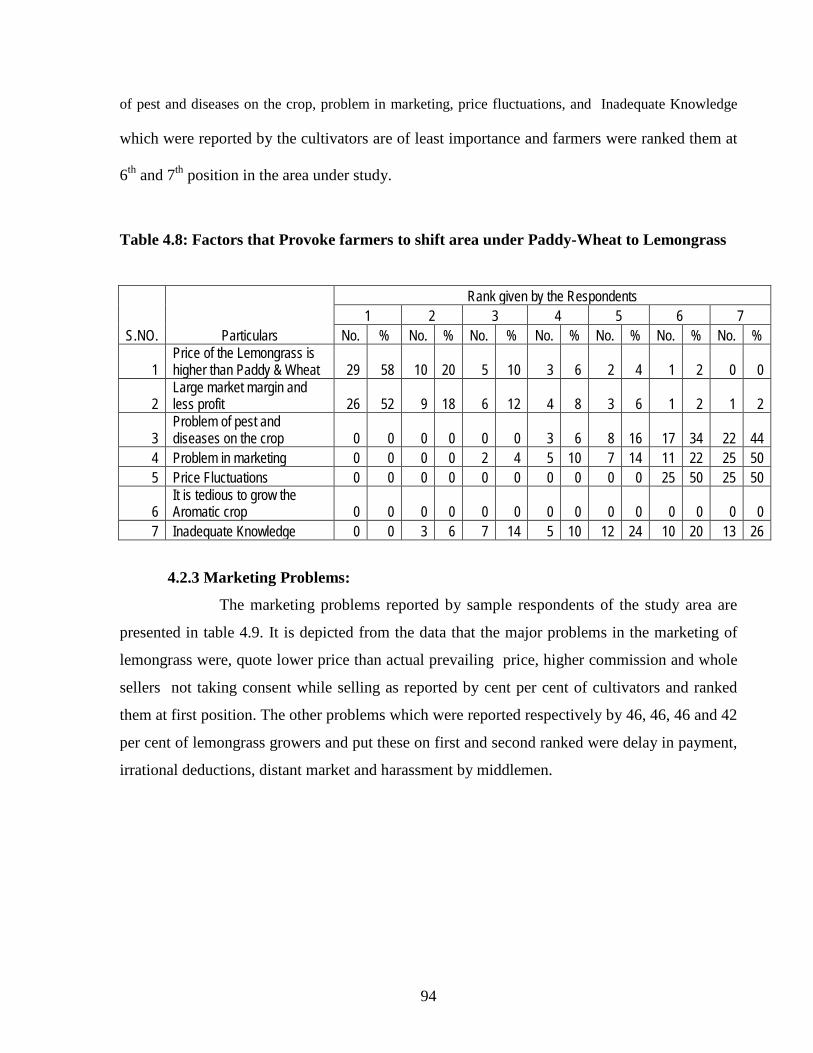
of pest and diseases on the crop, problem in marketing, price fluctuations, and Inadequate Knowledge
which were reported by the cultivators are of least importance and farmers were ranked them at
6th and 7th position in the area under study.
Table 4.8: Factors that Provoke farmers to shift area under Paddy-Wheat to Lemongrass
S.NO. Particulars
Rank given by the Respondents 1 2 3 4 5 6 7
No. % No. % No. % No. % No. % No. % No. %
1 Price of the Lemongrass is higher than Paddy & Wheat 29 58 10 20 5 10 3 6 2 4 1 2 0 0
2 Large market margin and less profit 26 52 9 18 6 12 4 8 3 6 1 2 1 2
3 Problem of pest and diseases on the crop 0 0 0 0 0 0 3 6 8 16 17 34 22 44
4 Problem in marketing 0 0 0 0 2 4 5 10 7 14 11 22 25 50 5 Price Fluctuations 0 0 0 0 0 0 0 0 0 0 25 50 25 50
6 It is tedious to grow the Aromatic crop 0 0 0 0 0 0 0 0 0 0 0 0 0 0
7 Inadequate Knowledge 0 0 3 6 7 14 5 10 12 24 10 20 13 26
4.2.3 Marketing Problems:
The marketing problems reported by sample respondents of the study area are
presented in table 4.9. It is depicted from the data that the major problems in the marketing of
lemongrass were, quote lower price than actual prevailing price, higher commission and whole
sellers not taking consent while selling as reported by cent per cent of cultivators and ranked
them at first position. The other problems which were reported respectively by 46, 46, 46 and 42
per cent of lemongrass growers and put these on first and second ranked were delay in payment,
irrational deductions, distant market and harassment by middlemen.
94
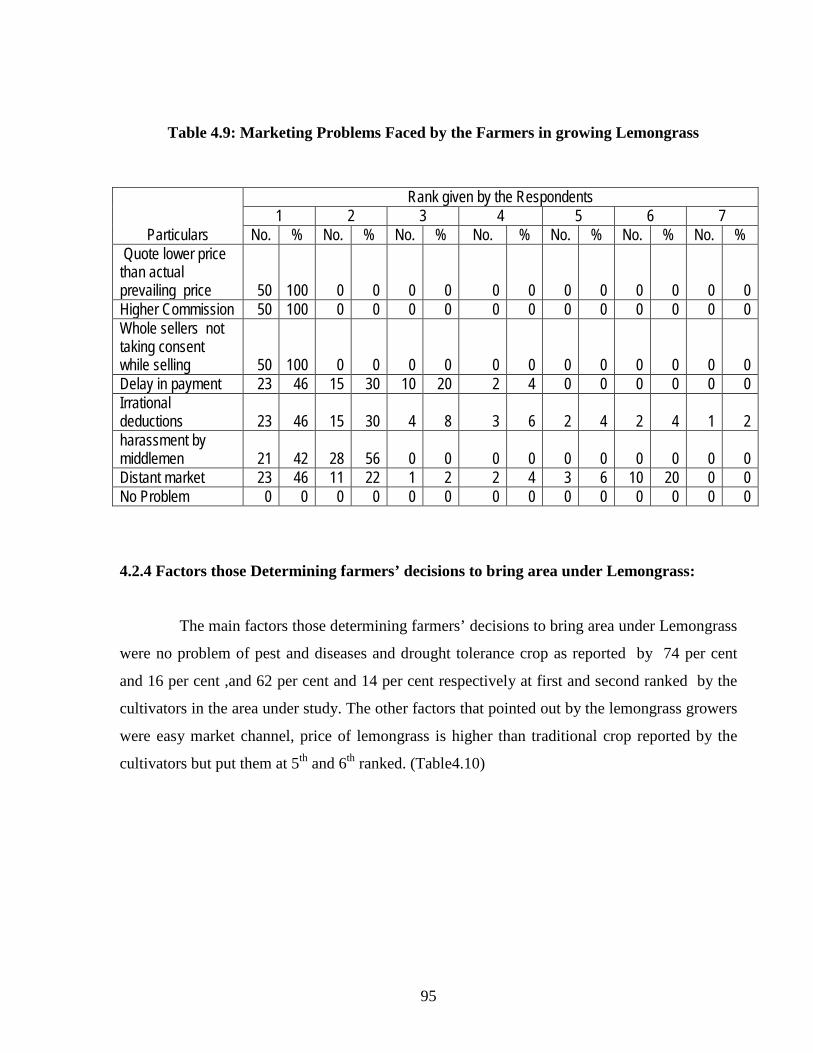
Table 4.9: Marketing Problems Faced by the Farmers in growing Lemongrass
4.2.4 Factors those Determining farmers’ decisions to bring area under Lemongrass:
The main factors those determining farmers’ decisions to bring area under Lemongrass
were no problem of pest and diseases and drought tolerance crop as reported by 74 per cent
and 16 per cent ,and 62 per cent and 14 per cent respectively at first and second ranked by the
cultivators in the area under study. The other factors that pointed out by the lemongrass growers
were easy market channel, price of lemongrass is higher than traditional crop reported by the
cultivators but put them at 5th and 6th ranked. (Table4.10)
Particulars
Rank given by the Respondents 1 2 3 4 5 6 7
No. % No. % No. % No. % No. % No. % No. % Quote lower price than actual prevailing price 50 100 0 0 0 0 0 0 0 0 0 0 0 0 Higher Commission 50 100 0 0 0 0 0 0 0 0 0 0 0 0 Whole sellers not taking consent while selling 50 100 0 0 0 0 0 0 0 0 0 0 0 0 Delay in payment 23 46 15 30 10 20 2 4 0 0 0 0 0 0 Irrational deductions 23 46 15 30 4 8 3 6 2 4 2 4 1 2 harassment by middlemen 21 42 28 56 0 0 0 0 0 0 0 0 0 0 Distant market 23 46 11 22 1 2 2 4 3 6 10 20 0 0 No Problem 0 0 0 0 0 0 0 0 0 0 0 0 0 0
95
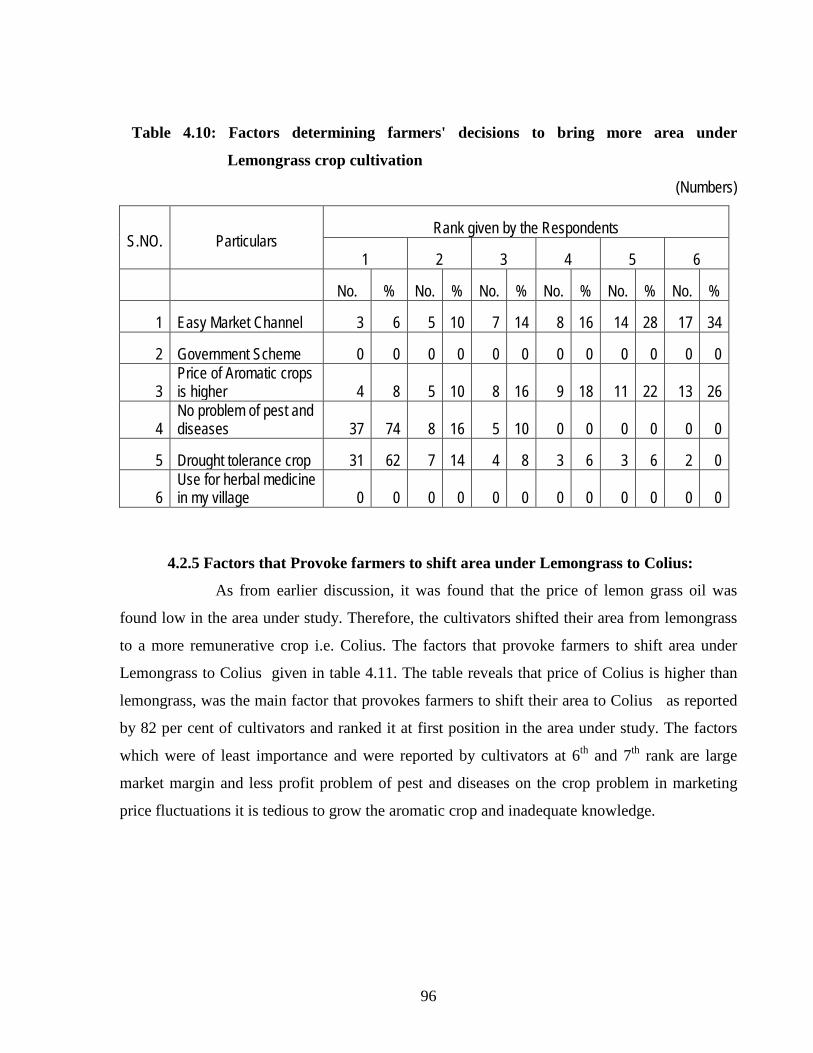
Table 4.10: Factors determining farmers' decisions to bring more area under
Lemongrass crop cultivation
(Numbers)
S.NO.
Particulars
Rank given by the Respondents
1 2 3 4 5 6
No. % No. % No. % No. % No. % No. %
1 Easy Market Channel 3 6 5 10 7 14 8 16 14 28 17 34
2 Government Scheme 0 0 0 0 0 0 0 0 0 0 0 0
3 Price of Aromatic crops is higher 4 8 5 10 8 16 9 18 11 22 13 26
4 No problem of pest and diseases 37 74 8 16 5 10 0 0 0 0 0 0
5 Drought tolerance crop 31 62 7 14 4 8 3 6 3 6 2 0
6 Use for herbal medicine in my village 0 0 0 0 0 0 0 0 0 0 0 0
4.2.5 Factors that Provoke farmers to shift area under Lemongrass to Colius:
As from earlier discussion, it was found that the price of lemon grass oil was
found low in the area under study. Therefore, the cultivators shifted their area from lemongrass
to a more remunerative crop i.e. Colius. The factors that provoke farmers to shift area under
Lemongrass to Colius given in table 4.11. The table reveals that price of Colius is higher than
lemongrass, was the main factor that provokes farmers to shift their area to Colius as reported
by 82 per cent of cultivators and ranked it at first position in the area under study. The factors
which were of least importance and were reported by cultivators at 6th and 7th rank are large
market margin and less profit problem of pest and diseases on the crop problem in marketing
price fluctuations it is tedious to grow the aromatic crop and inadequate knowledge.
96
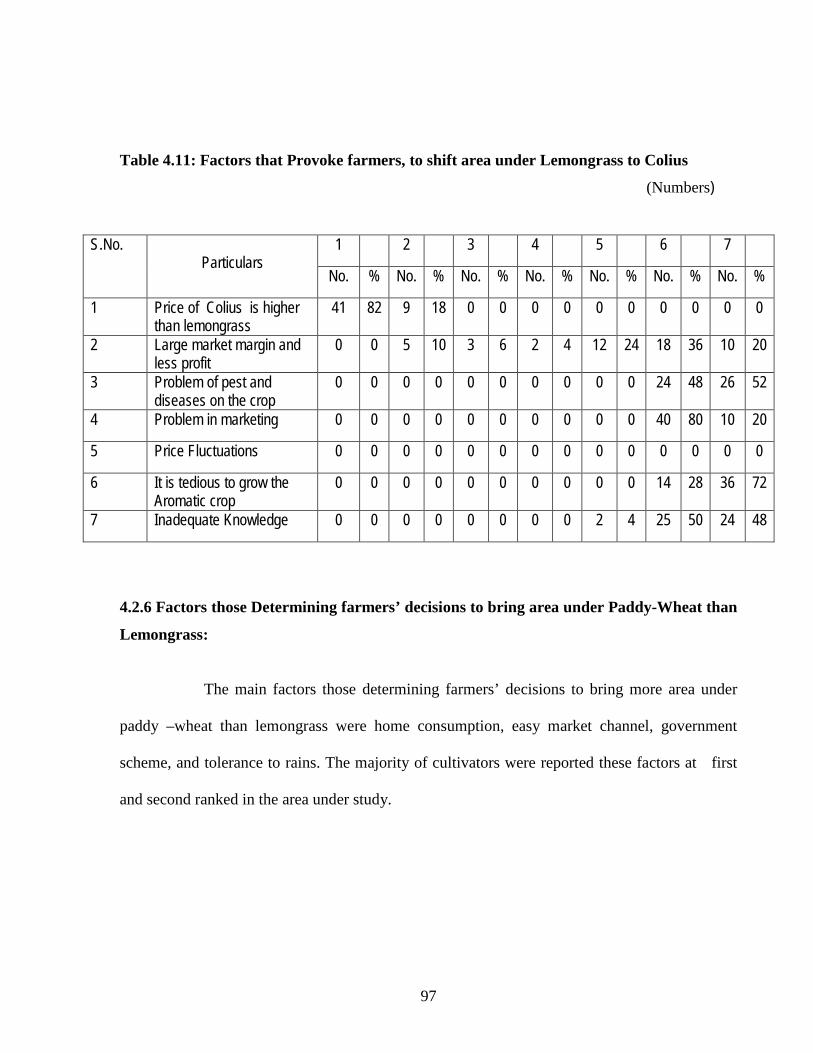
Table 4.11: Factors that Provoke farmers, to shift area under Lemongrass to Colius
(Numbers)
4.2.6 Factors those Determining farmers’ decisions to bring area under Paddy-Wheat than
Lemongrass:
The main factors those determining farmers’ decisions to bring more area under
paddy –wheat than lemongrass were home consumption, easy market channel, government
scheme, and tolerance to rains. The majority of cultivators were reported these factors at first
and second ranked in the area under study.
S.No.
Particulars
1 2 3 4 5 6 7
No. % No. % No. % No. % No. % No. % No. %
1 Price of Colius is higher than lemongrass
41 82 9 18 0 0 0 0 0 0 0 0 0 0
2 Large market margin and less profit
0 0 5 10 3 6 2 4 12 24 18 36 10 20
3 Problem of pest and diseases on the crop
0 0 0 0 0 0 0 0 0 0 24 48 26 52
4 Problem in marketing 0 0 0 0 0 0 0 0 0 0 40 80 10 20
5 Price Fluctuations 0 0 0 0 0 0 0 0 0 0 0 0 0 0
6 It is tedious to grow the Aromatic crop
0 0 0 0 0 0 0 0 0 0 14 28 36 72
7 Inadequate Knowledge 0 0 0 0 0 0 0 0 2 4 25 50 24 48
97
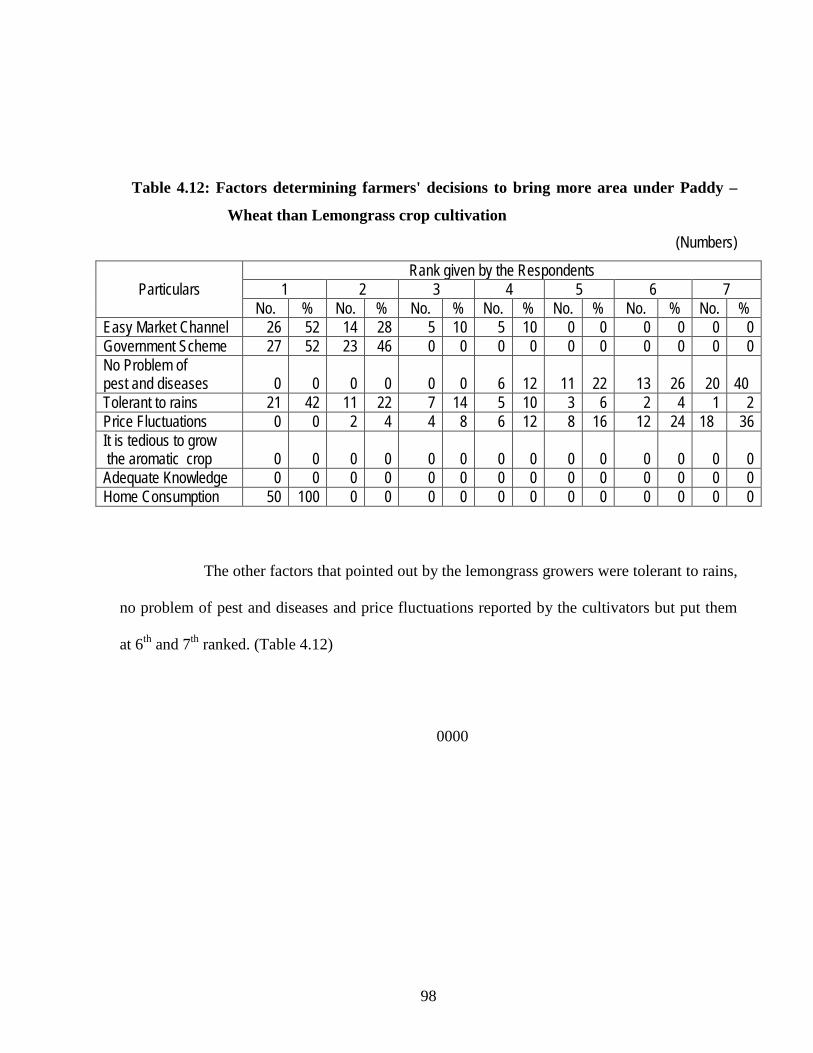
Table 4.12: Factors determining farmers' decisions to bring more area under Paddy –
Wheat than Lemongrass crop cultivation
(Numbers)
Particulars Rank given by the Respondents
1 2 3 4 5 6 7 No. % No. % No. % No. % No. % No. % No. %
Easy Market Channel 26 52 14 28 5 10 5 10 0 0 0 0 0 0 Government Scheme 27 52 23 46 0 0 0 0 0 0 0 0 0 0 No Problem of pest and diseases 0 0 0 0 0 0 6 12 11 22 13 26 20 40 Tolerant to rains 21 42 11 22 7 14 5 10 3 6 2 4 1 2 Price Fluctuations 0 0 2 4 4 8 6 12 8 16 12 24 18 36 It is tedious to grow the aromatic crop 0 0 0 0 0 0 0 0 0 0 0 0 0 0 Adequate Knowledge 0 0 0 0 0 0 0 0 0 0 0 0 0 0 Home Consumption 50 100 0 0 0 0 0 0 0 0 0 0 0 0
The other factors that pointed out by the lemongrass growers were tolerant to rains,
no problem of pest and diseases and price fluctuations reported by the cultivators but put them
at 6th and 7th ranked. (Table 4.12)
0000
98
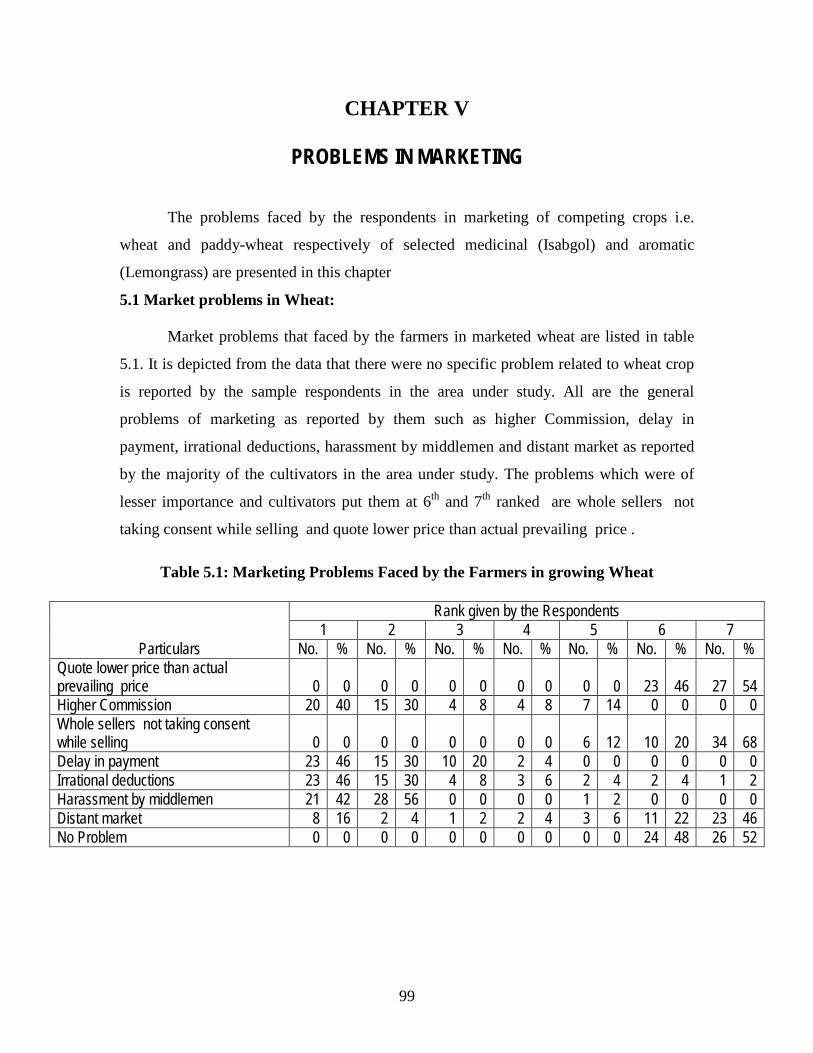
CHAPTER V
PROBLEMS IN MARKETING
The problems faced by the respondents in marketing of competing crops i.e.
wheat and paddy-wheat respectively of selected medicinal (Isabgol) and aromatic
(Lemongrass) are presented in this chapter
5.1 Market problems in Wheat:
Market problems that faced by the farmers in marketed wheat are listed in table
5.1. It is depicted from the data that there were no specific problem related to wheat crop
is reported by the sample respondents in the area under study. All are the general
problems of marketing as reported by them such as higher Commission, delay in
payment, irrational deductions, harassment by middlemen and distant market as reported
by the majority of the cultivators in the area under study. The problems which were of
lesser importance and cultivators put them at 6th and 7th ranked are whole sellers not
taking consent while selling and quote lower price than actual prevailing price .
Table 5.1: Marketing Problems Faced by the Farmers in growing Wheat
Particulars
Rank given by the Respondents 1 2 3 4 5 6 7
No. % No. % No. % No. % No. % No. % No. % Quote lower price than actual prevailing price 0 0 0 0 0 0 0 0 0 0 23 46 27 54 Higher Commission 20 40 15 30 4 8 4 8 7 14 0 0 0 0 Whole sellers not taking consent while selling 0 0 0 0 0 0 0 0 6 12 10 20 34 68 Delay in payment 23 46 15 30 10 20 2 4 0 0 0 0 0 0 Irrational deductions 23 46 15 30 4 8 3 6 2 4 2 4 1 2 Harassment by middlemen 21 42 28 56 0 0 0 0 1 2 0 0 0 0 Distant market 8 16 2 4 1 2 2 4 3 6 11 22 23 46 No Problem 0 0 0 0 0 0 0 0 0 0 24 48 26 52
99
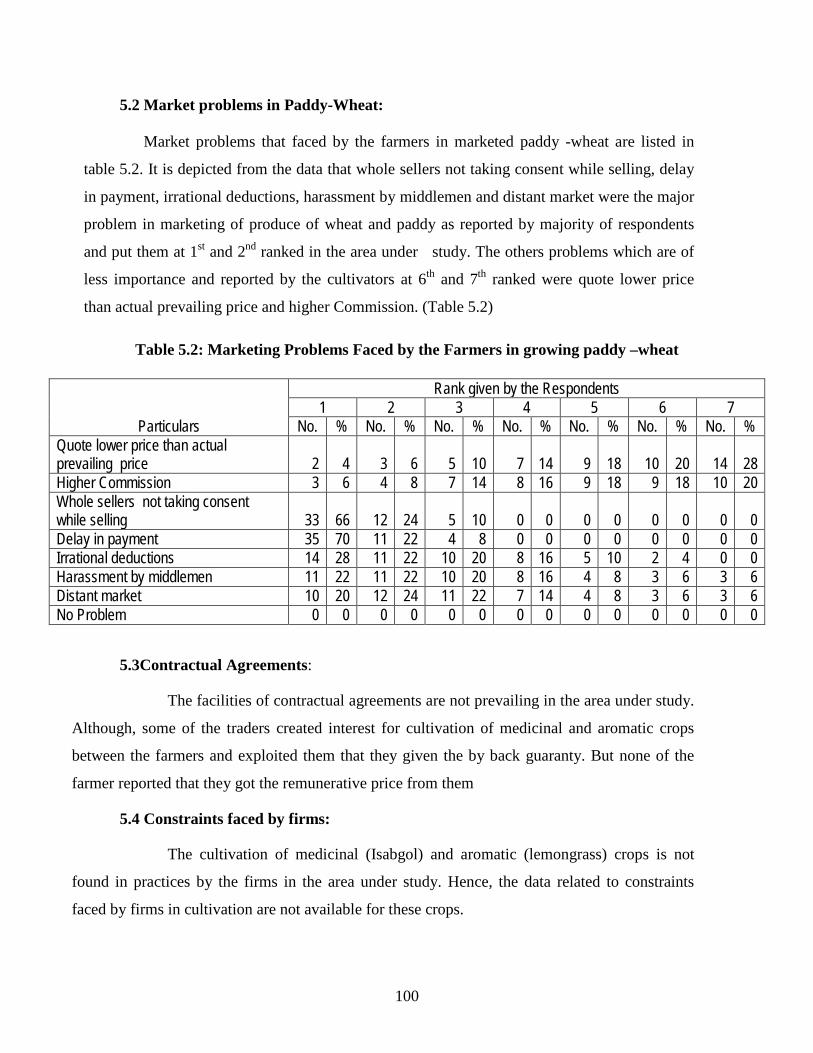
5.2 Market problems in Paddy-Wheat:
Market problems that faced by the farmers in marketed paddy -wheat are listed in
table 5.2. It is depicted from the data that whole sellers not taking consent while selling, delay
in payment, irrational deductions, harassment by middlemen and distant market were the major
problem in marketing of produce of wheat and paddy as reported by majority of respondents
and put them at 1st and 2nd ranked in the area under study. The others problems which are of
less importance and reported by the cultivators at 6th and 7th ranked were quote lower price
than actual prevailing price and higher Commission. (Table 5.2)
Table 5.2: Marketing Problems Faced by the Farmers in growing paddy –wheat
5.3Contractual Agreements:
The facilities of contractual agreements are not prevailing in the area under study.
Although, some of the traders created interest for cultivation of medicinal and aromatic crops
between the farmers and exploited them that they given the by back guaranty. But none of the
farmer reported that they got the remunerative price from them
5.4 Constraints faced by firms:
The cultivation of medicinal (Isabgol) and aromatic (lemongrass) crops is not
found in practices by the firms in the area under study. Hence, the data related to constraints
faced by firms in cultivation are not available for these crops.
Particulars
Rank given by the Respondents 1 2 3 4 5 6 7
No. % No. % No. % No. % No. % No. % No. % Quote lower price than actual prevailing price 2 4 3 6 5 10 7 14 9 18 10 20 14 28 Higher Commission 3 6 4 8 7 14 8 16 9 18 9 18 10 20 Whole sellers not taking consent while selling 33 66 12 24 5 10 0 0 0 0 0 0 0 0 Delay in payment 35 70 11 22 4 8 0 0 0 0 0 0 0 0 Irrational deductions 14 28 11 22 10 20 8 16 5 10 2 4 0 0 Harassment by middlemen 11 22 11 22 10 20 8 16 4 8 3 6 3 6 Distant market 10 20 12 24 11 22 7 14 4 8 3 6 3 6 No Problem 0 0 0 0 0 0 0 0 0 0 0 0 0 0
100

101