aer annual rin powercor australia ltd basis of preparation ... 54459 powercor 2016... · basis of...
TRANSCRIPT

AER Annual RIN
Powercor Australia Ltd
Basis of Preparation documents
Year ending 31 December 2016

Powercor 2016 Annual RIN Basis of Preparation document.doc Page 2
Table of Contents
Contents
2.11 Labour .......................................................................................................... 3
3.6 Quality of Services ........................................................................................... 5
3.6.8 Network Performance- Feeder reliability ........................................................ 48
3.6.9 Network Performance – Planned outages ....................................................... 53
4.1 Public Lighting ............................................................................................... 55
6.2 STPIS Reliability ............................................................................................ 57
6.6 STPIS Customer Service ................................................................................. 60
6.7 STPIS Daily Performance ................................................................................ 64
6.8 STPIS Exclusions ........................................................................................... 70
6.9 STPIS – GSLs ................................................................................................ 73
7.8 Avoided TUOS ............................................................................................... 96
7.10 Juris Scheme ............................................................................................... 98
7.11 DMIS-DMIA ............................................................................................... 100
7.12 Safety and Bushfire Related Expenditure ....................................................... 102
7.13 TARC ........................................................................................................ 109
8.1 Income ....................................................................................................... 111
8.2 Capex ........................................................................................................ 114
8.4 Opex .......................................................................................................... 120
9.5 TUOS ........................................................................................................... 96

Powercor 2016 Annual RIN Basis of Preparation document.doc Page 3
AER ANNUAL RIN Basis of Preparation (BOP) Template The purpose of this template is to explain, for each Variable, the basis upon which the Businesses prepared information to populate the input cells. It is used to demonstrate to the AER that the information provided is consistent with the requirements of the RIN Notice. This information must be provided for each variable and must be accurately described as it will be audited and provided to the AER. Please use plain English, complete sentences and avoid acronyms. Information table
Template name 2.11 Labour Table name Table 2.11.3 : Labour / Non-Labour Expenditure Split
Variable name In-house labour expenditure, Labour expenditure outsourced to related parties, labour expenditure outsourced to unrelated parties, Controllable non-labour expenditure, Uncontrollable non-labour expenditure
BOP ID ANFPAL 2.11BOP1
A. Demonstrate how the information provided is consistent with the requirements of the Notice (refer AER 2016 Annual RIN, Appendix A Section 1)
Requirements: Please reference Appendix A Sections 1-7 of the AER 2016 Annual RIN. Response: All expenditures have been reported in accordance with the requirements of the RIN and are:
• Derived and verifiable from the statutory accounts and state fairly the financial position of Powercor.
• Directly attributed to standard control services, alternative control services, negotiated distribution services, in accordance with the approved Cost Allocation Methodology for the particular regulatory year.
B. Source (refer AER 2016 Annual RIN, Appendix A Section 1) Please explain the source from where the data has been obtained (i.e. systems such as GIS, SAP, OAS, Audited financial statements etc.). If the data is not being obtained from the originating source (i.e. it was sourced from a report), the originating source for the data in the report will need to be provided as well. Response: Variables: In-house labour expenditure, Labour expenditure outsourced to related parties, labour expenditure outsourced to unrelated parties, Controllable non-labour expenditure, Uncontrollable non-labour expenditure
• The data for the expenditure categories and cost allocations has been sourced from the SAP accounting system. SAP is the primary financial reporting system and is the source of providing the audited statutory accounts for Powercor.
C. Methodology & Assumptions (refer AER 2016 Annual RIN, Appendix A Section 1) Please explain the methodology applied including any assumptions made to determine the final value populated in the RIN. Where applicable please reference the relevant processes and procedures used.
Powercor 2016 Annual RIN Basis of Preparation document.doc Page 4
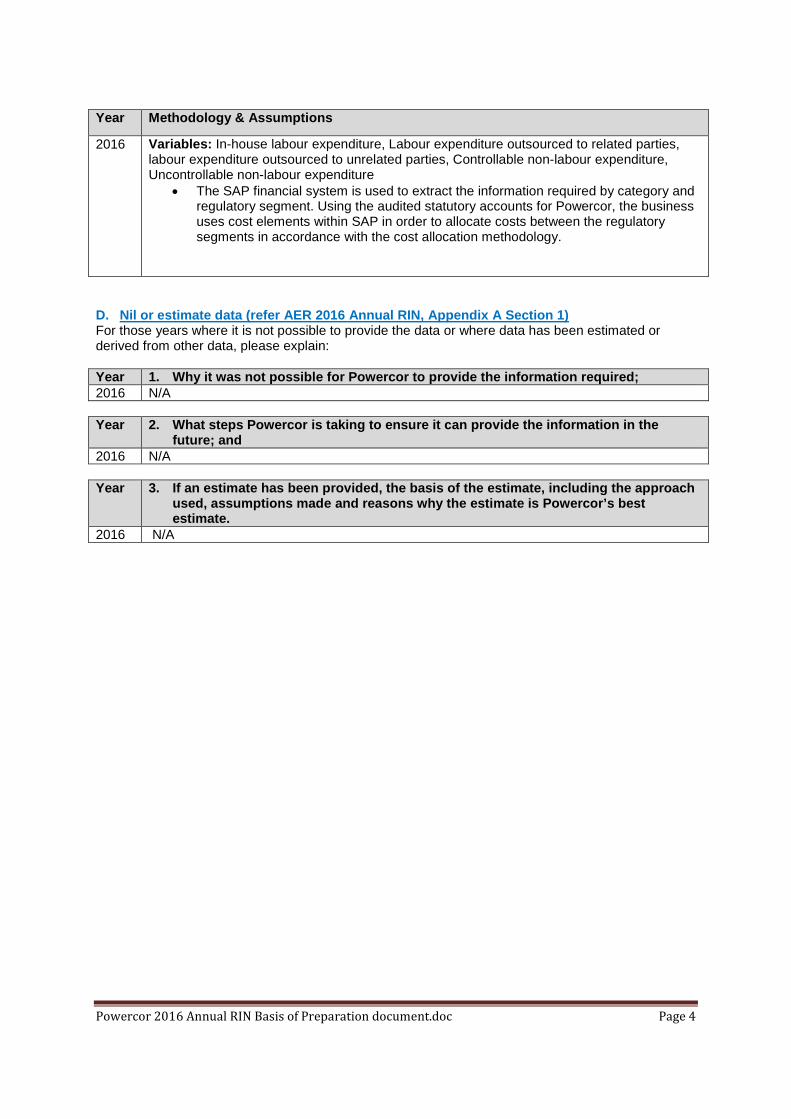
Year Methodology & Assumptions
2016 Variables: In-house labour expenditure, Labour expenditure outsourced to related parties, labour expenditure outsourced to unrelated parties, Controllable non-labour expenditure, Uncontrollable non-labour expenditure
• The SAP financial system is used to extract the information required by category and regulatory segment. Using the audited statutory accounts for Powercor, the business uses cost elements within SAP in order to allocate costs between the regulatory segments in accordance with the cost allocation methodology.
D. Nil or estimate data (refer AER 2016 Annual RIN, Appendix A Section 1) For those years where it is not possible to provide the data or where data has been estimated or derived from other data, please explain: Year 1. Why it was not possible for Powercor to provide the information required; 2016 N/A Year 2. What steps Powercor is taking to ensure it can provide the information in the
future; and 2016 N/A Year 3. If an estimate has been provided, the basis of the estimate, including the approach
used, assumptions made and reasons why the estimate is Powercor’s best estimate.
2016 N/A

Powercor 2016 Annual RIN Basis of Preparation document.doc Page 5
AER ANNUAL RIN Basis of Preparation (BOP) Template The purpose of this template is to explain, for each Variable, the basis upon which the Businesses prepared information to populate the input cells. It is used to demonstrate to the AER that the information provided is consistent with the requirements of the RIN Notice. This information must be provided for each variable and must be accurately described as it will be audited and provided to the AER. Please use plain English, complete sentences and avoid acronyms.
Template name 3.6 Quality of Services and Customer Service Table name Table 3.6.5: Quality of Supply
Variable name Over Voltage Events BOP ID ANPAL2BOP24
A. Demonstrate how the information provided is consistent with the requirements of the Notice (refer AER 2016 Annual RIN, Appendix A Section 10 – 1.1(a))
Requirements of the Notice: (copy requirements from ‘Definitions’ or ‘Principles and Requirements’ sections of the RIN)
Over voltage events - due to high voltage injection
The number of over-voltage events, due to high voltage injection, in the distribution or transmission system leading to at least one customer complaint
Over voltage events - due to lightning
The number of over-voltage events, due to lightning, in the distribution or transmission system leading to at least one customer complaint
Over voltage events - due to voltage regulation or other cause
The number of over-voltage events, due to voltage regulation or other cause, in the distribution or transmission system leading to at least one customer complaint, including events due to an unknown cause
Response: (provide affirmation that the above requirements have been met) The information extracted for the purpose of reporting to the business on a monthly basis along with our requirement to provide accurate figures to the AER Annual RIN report is via a customised SAP based system CARE (Customer Action and Response).’ Our business has clear definition of an Inquiry and complaint : A customer inquiry is: • any request for information on a product or service offered • a request is to fix an error • the first time a matter is raised and we are able to respond to the customer’s satisfaction A customer complaint is where: • the customer expressly requests a complaint be made • we do not respond to the customer’s issue or the customer is unhappy with our
response and they contact us again It is important that all information extracted out of CARE is reconciled and reviewed on a monthly basis. Our business reporting allows us to undertake this activity to maintain accurate and consistent

Powercor 2016 Annual RIN Basis of Preparation document.doc Page 6
reporting.
B. Source (refer AER 2016 Annual RIN, Appendix A Section 10 – 1.1(b)) Please explain the source from where the data has been obtained (i.e. systems such as GIS, SAP, OAS, Audited financial statements etc.). If the data is not being obtained from the originating source (i.e. it was sourced from a report), the originating source for the data in the report will need to be provided as well. CARE which is a SAP based system. It is a tractable workflow system that ensures everyone in the business can raise a CARE. The CARE system currently has two CARE administrators who monitor, assess and assign CAREs to relevant members of the business as investigation managers and or responsible managers. Reporting is extracted via the CARE system. It is an effective and efficient, complaints and Inquires management system that recognises and addresses the needs and expectations of customer’s concerns in line with Australian Standards .It is a real time system with mandatory user fields with inbuilt escalation notifications. Reporting is customised. All personnel are aware of their roles and responsibilities and authorities in respect to updating and completing a CARE. Customer numbers are based on the total number of complaints received and extracted out of CARE. The CARE administrators assess the CARE’s and assign the relevant categories and sub categories. These are mandatory fields which assist us with reporting requirements. Copy of the CARE table below:

Powercor 2016 Annual RIN Basis of Preparation document.doc Page 7
C. Methodology & Assumptions (refer AER 2016 Annual RIN, Appendix A Section 10 – 1.1(c)) Please explain the methodology applied including any assumptions made to determine the final value populated in the RIN. Where applicable please reference the relevant processes and procedures used. Year Methodology & Assumptions
2014 Methodology used -. It is essential that all information extracted from the CARE system is reviewed and validated at year end. We make no assumptions regarding data it is accurate data extracted from the CARE system. Customer numbers are based on total number of complaints received and investigated by the relevant investigation manager.
2015 Methodology used -. It is essential that all information extracted from the CARE system is reviewed and validated at year end. We make no assumptions regarding data it is accurate data extracted from the CARE system. Customer numbers are based on total number of complaints received and investigated by the relevant investigation manager.
2016 Methodology used -. It is essential that all information extracted from the CARE system is reviewed and validated at year end. We make no assumptions regarding data it is accurate data extracted from the CARE system. Customer numbers are based on total number of complaints received and investigated by the relevant investigation manager.
D. Nil or estimate data (refer AER 2016 Annual RIN, Appendix A Section 10 – 1.1(d)) For those years where it is not possible to provide the data or where data has been estimated or derived from other data, please explain: Year 1. Why it was not possible for Powercor to provide the information required; 2014 Nil 2015 Nil 2016 Nil Year 2. What steps Powercor is taking to ensure it can provide the information in the
future; and 2014 Nil 2015 Nil 2016 Nil Year 3. If an estimate has been provided, the basis of the estimate, including the approach
used, assumptions made and reasons why the estimate is Powercor’s best estimate.
2014 Nil 2015 Nil 2016 Nil

Powercor 2016 Annual RIN Basis of Preparation document.doc Page 8
AER ANNUAL RIN Basis of Preparation (BOP) Template The purpose of this template is to explain, for each Variable, the basis upon which the Businesses prepared information to populate the input cells. It is used to demonstrate to the AER that the information provided is consistent with the requirements of the RIN Notice. This information must be provided for each variable and must be accurately described as it will be audited and provided to the AER. Please use plain English, complete sentences and avoid acronyms.
Template name 3.6 Quality of service & Customer Service Table name Table 3.6.5: Quality of Supply
Variable name Customers receiving over-voltage BOP ID ANPAL2BOP25
A. Demonstrate how the information provided is consistent with the requirements of the Notice (refer AER 2016 Annual RIN, Appendix A Section 10 – 1.1(a))
Requirements of the Notice: (copy requirements from ‘Definitions’ or ‘Principles and Requirements’ sections of the RIN)
Customers receiving over-voltage - due to high voltage injection
The estimated number of customers affected by over-voltage events due to high voltage injection, based on customer’s with confirmed damage (including estimated damage) as investigated by the DNSP
Customers receiving over-voltage - due to lightning
The estimated number of customers affected by over-voltage events due to lightning, based on customer with confirmed damage (including estimated damage) and investigated by the DNSP
Customers receiving over-voltage - due to voltage regulation or other cause
The estimated number of customers affected by over-voltage events due to voltage regulations or other causes (including events due to unknown causes), based on confirmed damage (including estimated damage) and investigated by the DNSP
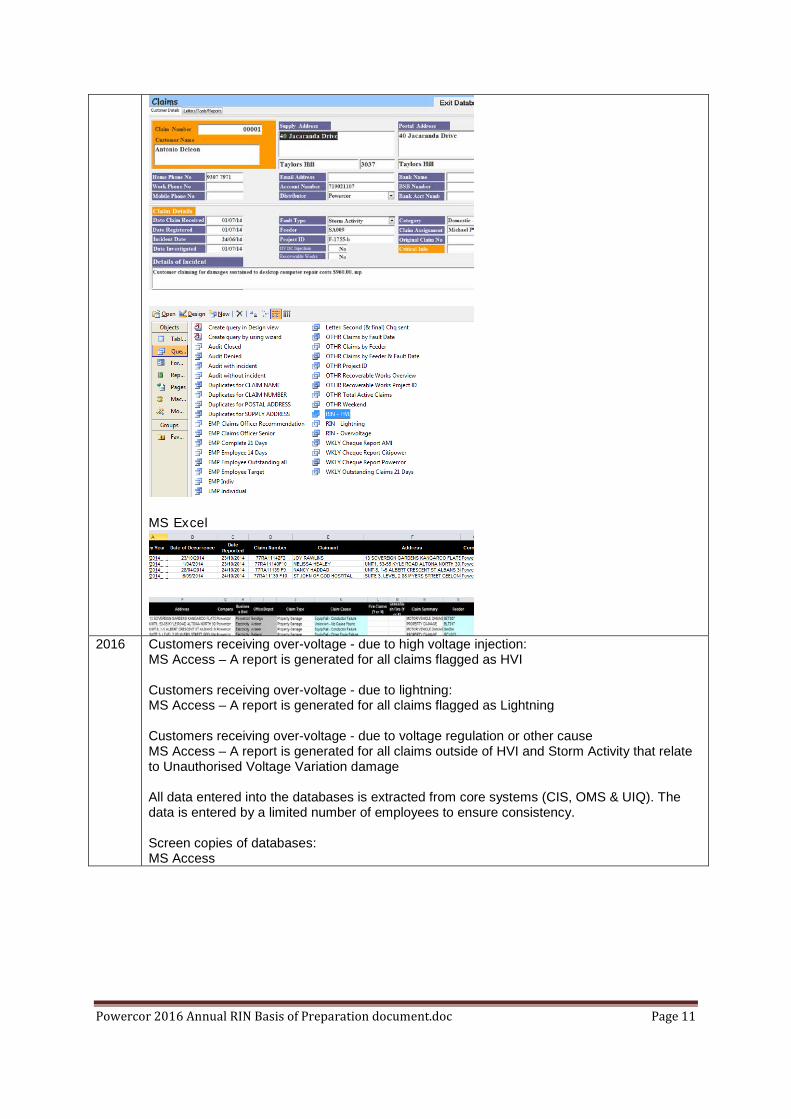
Response: (provide affirmation that the above requirements have been met) The data provided is extracted from two separate sources. All claims received from Powercor are registered in either a MS Access or MS Excel database depending on the area responsible for the claim (Customer Services or Corporate Risk). These databases capture the cause of all voltage variation events which result in a claim for damages or loss against the businesses.
B. Source (refer AER 2016 Annual RIN, Appendix A Section 10 – 1.1(b)) Please explain the source from where the data has been obtained (i.e. systems such as GIS, SAP, OAS, Audited financial statements etc.). If the data is not being obtained from the originating source (i.e. it was sourced from a report), the originating source for the data in the report will need to be provided as well.

Powercor 2016 Annual RIN Basis of Preparation document.doc Page 9
Response: The source data comes from MS Access and Excel. All claims are registered in this database based on gathering information from other core systems: CIS, OMS & UIQ. A report is generated on each of the requirements and data is filtered to provide the figures required. C. Methodology & Assumptions (refer AER 2016 Annual RIN, Appendix A Section 10 – 1.1(c)) Please explain the methodology applied including any assumptions made to determine the final value populated in the RIN. Where applicable please reference the relevant processes and procedures used. Year Methodology & Assumptions
2014 Customers receiving over-voltage - due to high voltage injection: MS Access – A report is generated for all claims flagged as HVI MS Excel – Data is filtered for all claims and cross reference against MS Access data to indicate which claims relate to a HVI Customers receiving over-voltage - due to lightning: MS Access – A report is generated for all claims flagged as Lightning MS Excel – Data is filtered for all claims and cross reference against MS Access data to indicate which claims relate to a lightning An assumption is made that “Storm Activity” is included as lightning. Current database restrictions do not separate the two. Customers receiving over-voltage - due to voltage regulation or other cause MS Access – A report is generated for all claims outside of HVI and Storm Activity that relate to Unauthorised Voltage Variation damage MS Excel – Data is filtered for all claims and cross reference against MS Access data to indicate which claims relate to a UVV, outside of HVI or Storm Activity. All data entered into the databases is extracted from core systems (CIS, OMS & UIQ). The data is entered by a limited number of employees to ensure consistency. A data extracted from MS Access is a standard report and this is than against the Excel database by matching incident date, feeder and customer names to ensure the correct claims are matched. Screen copies of databases: MS Access

Powercor 2016 Annual RIN Basis of Preparation document.doc Page 10
MS Excel
2015 Customers receiving over-voltage - due to high voltage injection:
MS Access – A report is generated for all claims flagged as HVI MS Excel – Data is filtered for all claims and cross reference against MS Access data to indicate which claims relate to a HVI Customers receiving over-voltage - due to lightning: MS Access – A report is generated for all claims flagged as Lightning MS Excel – Data is filtered for all claims and cross reference against MS Access data to indicate which claims relate to a lightning An assumption is made that “Storm Activity” is included as lightning. Current database restrictions do not separate the two. Customers receiving over-voltage - due to voltage regulation or other cause MS Access – A report is generated for all claims outside of HVI and Storm Activity that relate to Unauthorised Voltage Variation damage MS Excel – Data is filtered for all claims and cross reference against MS Access data to indicate which claims relate to a UVV, outside of HVI or Storm Activity. All data entered into the databases is extracted from core systems (CIS, OMS & UIQ). The data is entered by a limited number of employees to ensure consistency. A data extracted from MS Access is a standard report and this is than against the Excel database by matching incident date, feeder and customer names to ensure the correct claims are matched. Screen copies of databases: MS Access
Powercor 2016 Annual RIN Basis of Preparation document.doc Page 11
MS Excel
2016 Customers receiving over-voltage - due to high voltage injection:
MS Access – A report is generated for all claims flagged as HVI Customers receiving over-voltage - due to lightning: MS Access – A report is generated for all claims flagged as Lightning Customers receiving over-voltage - due to voltage regulation or other cause MS Access – A report is generated for all claims outside of HVI and Storm Activity that relate to Unauthorised Voltage Variation damage All data entered into the databases is extracted from core systems (CIS, OMS & UIQ). The data is entered by a limited number of employees to ensure consistency. Screen copies of databases: MS Access

Powercor 2016 Annual RIN Basis of Preparation document.doc Page 12
D. Nil or estimate data (refer AER 2016 Annual RIN, Appendix A Section 10 – 1.1(d)) For those years where it is not possible to provide the data or where data has been estimated or derived from other data, please explain: Year 1. Why it was not possible for Powercor to provide the information required; 2014 Data can be supplied – an assumption is being made for Lightning 2015 Nil 2016 Nil Year 2. What steps Powercor is taking to ensure it can provide the information in the
future; and 2014 Database reporting enhancements to be made to join MS Access and Excel.
Reporting to be enhanced to separate Lightning claims 2015 Nil
2016 Nil
Year 3. If an estimate has been provided, the basis of the estimate, including the approach
used, assumptions made and reasons why the estimate is Powercor’s best estimate.
2014 Assumption has been made for Lightning claims. Current databases do not separate this data.
2015 Nil
2016 Nil

Powercor 2016 Annual RIN Basis of Preparation document.doc Page 13
AER ANNUAL RIN Basis of Preparation (BOP) Template The purpose of this template is to explain, for each Variable, the basis upon which the Businesses prepared information to populate the input cells. It is used to demonstrate to the AER that the information provided is consistent with the requirements of the RIN Notice. This information must be provided for each variable and must be accurately described as it will be audited and provided to the AER. Please use plain English, complete sentences and avoid acronyms.
Template name 3.6 Quality of service and Customer Service Table name Table 3.6.5: Quality of Supply
Variable name Voltage variations - steady state (zone sub) Voltage variations - one minute (zone sub) Voltage variations - 10 seconds (zone sub) Min<0.7 Voltage variations - 10 seconds (zone sub) Min<0.8 Voltage variations - 10 seconds (zone sub) Min<0.9 Voltage variations - % zone subs monitored
BOP ID ANPAL2BOP26
A. Demonstrate how the information provided is consistent with the requirements of the Notice (refer AER 2016 Annual RIN, Appendix A Section 10 – 1.1(a))
Requirements of the Notice: (copy requirements from ‘Definitions’ or ‘Principles and Requirements’ sections of the RIN) Voltage variations - steady state (zone sub) - The aggregate number, in the Relevant Regulatory Year, of variations at each monitored location in a zone substation, outside of the standard nominal voltage range or set point voltage under steady state (greater than or equal to 1 minute) conditions Voltage variations - one minute (zone sub) - The aggregate number, in the Relevant Regulatory Year, of variations at each monitored location in a zone substation, outside of the standard nominal voltage range or set point voltage, and with a duration greater than or equal to 10 seconds and less than 1 minute Voltage variations - 10 seconds (zone sub) Min<0.7 - The aggregate number, in the Relevant Regulatory Year, of variations at each monitored location in a zone substation, outside the standard nominal voltage range or set point voltage, and with a duration greater than or equal to 0.01 seconds (0.5 cycles) and less than 10 seconds, and where the minimum voltage variation during that excursion is less than 70% of the nominal voltage or set point voltage Voltage variations - 10 seconds (zone sub) Min<0.8 - The aggregate number, in the Relevant Regulatory Year, of variations at each monitored location in a zone substation, outside the standard nominal voltage range or set point voltage, and with a duration greater than or equal to 0.01 seconds (0.5 cycles) and less than 10 seconds, and where the minimum voltage during that excursion is less than 80% of the nominal voltage or set point voltage Voltage variations - 10 seconds (zone sub) Min<0.9 - The aggregate number, in the Relevant Regulatory Year, of variations at each monitored location in a zone substation, outside of the standard nominal voltage range or set point voltage and with a duration greater than or equal to 0.01 seconds (0.5 cycles) and less than 10 seconds, and where the minimum voltage variation during that excursion is less than 90% of the nominal voltage or set point voltage Voltage variations - % zone subs monitored - The percentage of zone substations with recorders installed at the end of each Relevant Regulatory Year Response: (provide affirmation that the above requirements have been met) The data source and methodology described below demonstrates that zone substation voltage
Powercor 2016 Annual RIN Basis of Preparation document.doc Page 14
variation are captured in a systematic manner and stored in a managed environment. The reporting through the PQM server considers the nature and attributes of the voltage variation event and presents the number of events against the nominated variables. The percentage of zone substations monitored is assessed through knowing all zone substation managed through the PQM system. The requirements for reporting of the variables are therefore met.
B. Source (refer AER 2016 Annual RIN, Appendix A Section 10 – 1.1(b)) Please explain the source from where the data has been obtained (i.e. systems such as GIS, SAP, OAS, Audited financial statements etc.). If the data is not being obtained from the originating source (i.e. it was sourced from a report), the originating source for the data in the report will need to be provided as well. Response: Voltage variations at zone substations are captured by the Station level Power Quality Meters (PQM) and then stored in the centrally managed PQM Server.
All PQMs at zone substations are captured with their zone substation name at the server. C. Methodology & Assumptions (refer AER 2016 Annual RIN, Appendix A Section 10 – 1.1(c)) Please explain the methodology applied including any assumptions made to determine the final value populated in the RIN. Where applicable please reference the relevant processes and procedures used. Year Methodology & Assumptions
2014 For all Powercor zone substations PQM meters are installed. Power Quality Meters. For PQMs the voltage thresholds are set within the meter and all voltage events that are outside the prescribed voltage limit are captured with a time stamp, duration and voltage level that is then stored in the centrally managed PQM Server. Reports are run in the PQM Server for the calendar year required to be reported on. The reports extract and filter all the captured voltage events against the variables listed above. % zone subs monitored The percentage of zone substations monitored is calculated by comparing zone substation monitored by the PQM server with the total zone substation list for Powercor.
2015 For all Powercor zone substations PQM meters are installed. Power Quality Meters. For PQMs the voltage thresholds are set within the meter and all voltage events that are outside the prescribed voltage limit are captured with a time stamp, duration and voltage level that is then stored in the centrally managed PQM Server. Reports are run in the PQM Server for the calendar year required to be reported on. The reports extract and filter all the captured voltage events against the variables listed above. % zone subs monitored
Powercor 2016 Annual RIN Basis of Preparation document.doc Page 15
The percentage of zone substations monitored is calculated by comparing zone substation monitored by the PQM server with the total zone substation list for Powercor.
2016 Power Quality Meters. For PQMs the voltage thresholds are set within the meter and all voltage events that are outside the prescribed voltage limit are captured with a time stamp, duration and voltage level that is then stored in the centrally managed PQM Server. Reports are run in the PQM Server for the calendar year required to be reported on. The reports extract and filter all the captured voltage events against the variables listed above. % zone subs monitored All zone substations are monitored through PQM system.
D. Nil or estimate data (refer AER 2016 Annual RIN, Appendix A Section 10 – 1.1(d)) For those years where it is not possible to provide the data or where data has been estimated or derived from other data, please explain: Year 1. Why it was not possible for Powercor to provide the information required; 2014 Data will not be provided where a zone substation PQM had failed during the year, and data
was not available while awaiting repair or replacement. 2015 Data will not be provided where a zone substation PQM had failed during the year, and data
was not available while awaiting repair or replacement. 2016 Data will not be provided where a zone substation PQM had failed during the year, and data
was not available while awaiting repair or replacement. Year 2. What steps Powercor is taking to ensure it can provide the information in the
future; and 2014 Not Applicable - All zone substations are monitored through PQM system. 2015 Not Applicable - All zone substations are monitored through PQM system. 2016 Not Applicable - All zone substations are monitored through PQM system. Year 3. If an estimate has been provided, the basis of the estimate, including the approach
used, assumptions made and reasons why the estimate is Powercor’s best estimate.
2014 No estimate is provided for missing data. 2015 No estimate is provided for missing data. 2016 No estimate is provided for missing data.

Powercor 2016 Annual RIN Basis of Preparation document.doc Page 16
AER ANNUAL RIN Basis of Preparation (BOP) Template The purpose of this template is to explain, for each Variable, the basis upon which the Businesses prepared information to populate the input cells. It is used to demonstrate to the AER that the information provided is consistent with the requirements of the RIN Notice. This information must be provided for each variable and must be accurately described as it will be audited and provided to the AER. Please use plain English, complete sentences and avoid acronyms.
Template name 3.6 Quality of service and Customer Services Table name Table 3.6.5: Quality of supply
Variable name Voltage variations - steady state (feeder) Voltage variations - % feeders monitored
BOP ID ANPAL2BOP27
A. Demonstrate how the information provided is consistent with the requirements of the Notice (refer AER 2016 Annual RIN, Appendix A Section 10 – 1.1(a))
Requirements of the Notice: (copy requirements from ‘Definitions’ or ‘Principles and Requirements’ sections of the RIN) Appendix C – non- financial templates – Definitions Voltage variations - % feeders monitored - The percentage of feeders required to be monitored (i.e. one feeder supplied from each zone substation) that have recorders installed at the end of each Relevant Regulatory Year. Voltage variations - steady state (feeder) - The aggregate number, in the Relevant Regulatory Year, of variations at each monitored location on a feeder, outside the standard nominal voltage range or set point voltage under steady state (greater than or equal to 1 minute) conditions. Response: (provide affirmation that the above requirements have been met) The data provided is consistent with the source data used for Voltage variation reporting over the past five years in the ESC/AER Annual RIN Reports and meets the requirements of this Information Notice.
B. Source (refer AER 2016 Annual RIN, Appendix A Section 10 – 1.1(b)) Please explain the source from where the data has been obtained (i.e. systems such as GIS, SAP, OAS, Audited financial statements etc.). If the data is not being obtained from the originating source (i.e. it was sourced from a report), the originating source for the data in the report will need to be provided as well. Response: For Powercor (PAL), the originating data sources are: • DCI Sentry Outage and Voltage Monitoring System (2014) • AMI Energy Consumption Meters (2014, 2015, 2016) C. Methodology & Assumptions (refer AER 2016 Annual RIN, Appendix A Section 10 – 1.1(c))

Powercor 2016 Annual RIN Basis of Preparation document.doc Page 17
Please explain the methodology applied including any assumptions made to determine the final value populated in the RIN. Where applicable please reference the relevant processes and procedures used. Year Methodology & Assumptions
2014 Voltage variations - % feeders monitored –
DCI Sentry Meters January-September 2014
The total number of DCI Sentry meters installed across the network that have been programmed to record Steady State Voltage variations. This number was then used to determine the number of Zone Substation Feeders monitored out of the total population of Zone Substations to give the required %.
AMI Meters October-December 2014 The total number of AMI meters installed across the network that have been programmed to record Steady State Voltage variations. This number was then used to determine the number of Zone Substation Feeders monitored out of the total population of Zone Substations to give the required %. Note:- The DCI Sentry meter system was retired from service in Quarter 3 of 2014 and is replaced by the AMI Meters.
Voltage variations - steady state (feeder)
DCI Sentry Meters January-September 2014 Selected DCI Sentry meters were programmed to record Voltage variations according to the Electricity Distribution Code - May 2012. Section 4.2.2 Table 1. At the end of the reporting period, the Steady State Voltage variation data from the DCI Sentry master station was analysed to collate the events that matched the requirement in the Electricity Distribution Code. Where a DCI Sentry meter was found to have failed to record any data and it was determined that the meter was faulty; then the data from the period where the meter was operational was substituted for this site. This number of voltage excursions from operational meters and non-operational meters (estimated) was then reported for this metric.
AMI Meters October-December 2014 Over recent years AMI meters have been installed across the distribution network to record customers’ energy consumption and provide this data at regular intervals. One of the features of the AMI meter is the ability to record Voltage variations. Selected meters were identified across the network and reprogrammed to record Steady State Voltage variations according to the Distribution Code – May 2012. Section 4.2.2 table 1. At the end of the reporting period the following Business Intelligence (BI) report will be run to obtain the number of Steady State Voltage variation at the extremity of one feeder per Zone Substation

Powercor 2016 Annual RIN Basis of Preparation document.doc Page 18
“Meter Event Summary”. Reference should be made to the following documents which explain the running of the above report. AMI_Sentry_User_Guide.doc Note: - The DCI Sentry meter system was retired from service in Quarter 3 of 2014 and is replaced by the AMI Meters.
2015 Voltage variations - % feeders monitored –
AMI Meters The total number of AMI meters installed across the network that have been programmed to record Steady State Voltage variations. This number was then used to determine the number of Zone Substation Feeders monitored out of the total population of Zone Substations to give the required %.
Voltage variations - steady state (feeder)
AMI Meters Over recent years AMI meters have been installed across the distribution network to record customers’ energy consumption and provide this data at regular intervals. One of the features of the AMI meter is the ability to record Voltage variations. Selected meters were identified across the network and reprogrammed to record Steady State Voltage variations according to the Distribution Code – May 2012. Section 4.2.2 table 1. At the end of the reporting period the following Business Intelligence (BI) report will be run to obtain the number of Steady State Voltage variation at the extremity of one feeder per Zone Substation “Meter Event Summary”. Reference should be made to the following documents which explain the running of the above report. AMI_Sentry_User_Guide.doc
2016 Voltage variations - % feeders monitored – AMI Meters The total number of AMI meters installed across the network that have been programmed to record Steady State Voltage variations. This number was then used to determine the number of Zone Substation Feeders monitored out of the total population of Zone Substations to give the required %.
Voltage variations - steady state (feeder)
AMI Meters Over recent years AMI meters have been installed across the distribution network to

Powercor 2016 Annual RIN Basis of Preparation document.doc Page 19
record customers’ energy consumption and provide this data at regular intervals. One of the features of the AMI meter is the ability to record Voltage variations. Selected meters were identified across the network and reprogrammed to record Steady State Voltage variations according to the Distribution Code – December 2015. Section 4.2.2 table 1. At the end of the reporting period the following Business Intelligence (BI) report will be run to obtain the number of Steady State Voltage variation at the extremity of one feeder per Zone Substation “Meter Event Summary”. Reference should be made to the following documents which explain the running of the above report. AMI_Sentry_User_Guide.doc
D. Nil or estimate data (refer AER 2016 Annual RIN, Appendix A Section 10 – 1.1(d)) For those years where it is not possible to provide the data or where data has been estimated or derived from other data, please explain: Year 1. Why it was not possible for Powercor to provide the information required; 2014 The DCI Sentry system that has been used to record Voltage variations was not installed on
100% of Powercor’s distribution feeders. Notably AC Zone Substation has no Sentry meters installed on its feeders. The DCI Sentry system was originally installed during the period 1998-2001 and has come to the end of its serviceable life with a growing number of sites no longer fully recording Steady State Voltage variations. During 2014 a project was completed to utilise the voltage recording capability of the AMI meters which were installed across the distribution network over recent years; permitting the decommissioning of the DCI Sentry system.
2015 Not applicable 2016 Not applicable Year 2. What steps Powercor is taking to ensure it can provide the information in the
future; and 2014 During 2014 a project was completed to utilise the voltage recording capability of the AMI
Energy consumption meters which were installed across the distribution network over recent years; permitting the decommissioning of the DCI Sentry system.
2015 Not applicable 2016 Not applicable Year 3. If an estimate has been provided, the basis of the estimate, including the approach
used, assumptions made and reasons why the estimate is Powercor’s best estimate.
2014 Where a DCI Sentry meter has been identified as having failed, then data from the preceding operational period has been substituted.
2015 Not applicable 2016 Not applicable

Powercor 2016 Annual RIN Basis of Preparation document.doc Page 20
AER ANNUAL RIN Basis of Preparation (BOP) Template The purpose of this template is to explain, for each Variable, the basis upon which the Businesses prepared information to populate the input cells. It is used to demonstrate to the AER that the information provided is consistent with the requirements of the RIN Notice. This information must be provided for each variable and must be accurately described as it will be audited and provided to the AER. Please use plain English, complete sentences and avoid acronyms.
Template name 3.6 Quality of Service and Customer Service Table name Table 3.6.6: Complaints – technical quality of supply
Variable name Technical quality of supply (ALL) BOP ID ANPAL2BOP28
A. Demonstrate how the information provided is consistent with the requirements of the Notice (refer AER 2016 Annual RIN, Appendix A Section 10 – 1.1(a))
Requirements of the Notice: (copy requirements from ‘Definitions’ or ‘Principles and Requirements’ sections of the RIN)
Complaint - technical quality of supply The number of complaints relating to the technical quality of supply
Complaints - technical quality of supply - number
The total number of complaints made to the DNSP Where the complaint raised issues about voltage variations.
Complaints by category - Low voltage supply
The proportion of complaints made to the DNSP where the complainant raised issues about low voltage supply
Complaints by category - Noise from appliances
The proportion of complaints made to the DNSP where the complainant raised issues about noise from appliances
Complaints by category - Other
The proportion of complaints made to the DNSP where the complainant raised issues about any matter that is not low voltage supply, voltage dips, voltage swell, voltage spike, TV or radio interference or noise from appliances.
Complaints by category - TV or radio interference
The proportion of complaints made to the DNSP where the complainant raised issues about TV or radio interference
Complaints by category - Voltage dips The proportion of complaints made to the DNSP where the complainant raised issues about voltage dips
Complaints by category - Voltage spike (impulsive transient)
The proportion of complaints made to the DNSP where the complainant raised issues about voltage spikes (impulsive transient)
Complaints by category - Voltage swell
The proportion of complaints made to the DNSP where the complainant raised issues about voltage swell
Complaints by Likely Cause - Customer internal problem
The proportion of complaints where the event that gave rise to the complaint was likely to be a customer internal problem
Complaints by Likely Cause - Environmental
The proportion of complaints where the event that gave rise to the complaint was likely to be environmental

Powercor 2016 Annual RIN Basis of Preparation document.doc Page 21
Complaints by Likely Cause - Network equipment faulty
The proportion of complaints where the event that gave rise to the complaint was likely to be faulty network equipment
Complaints by Likely Cause - Network interference by another customer
The proportion of complaints where the event that gave rise to the complaint was likely to be network interference by another customer
Complaints by Likely Cause - Network interference by NSP equipment
The proportion of complaints where the event that gave rise to the complaint was likely to be network interference by NSP equipment
Complaints by Likely Cause - Network limitation
The proportion of complaints where the event that gave rise to the complaint was likely to be a network limitation
Complaints by Likely Cause - No problem identified
The proportion of complaints where the event that gave rise to the complaint was not able to be identified
Complaints by Likely Cause - Other
The proportion of complaints where the event that gave rise to the complaint was likely to be a cause other than faulty network equipment, network interference by NSP equipment, network interference by another customer, a network limitation, a customer internal problem, environmental, or not able to be identified.
Response: (provide affirmation that the above requirements have been met) The information extracted for the purpose of reporting to the business and the AER, the total number of complaints made to the DNSP where the complaint raised issues about voltage variations is via a customised SAP based system CARE (Customer Action and Response). Below is a screen copy of the CARE system that provides the data which is reported to the AER. Category is selected by the CARE Administrator Sub Category is selected by the CARE Administrator Root cause, ESC Compl. Category , ESC Quality category, ESC likely cause, ESC-lighting, ESC/Volt/Reg/other, ESC – caused by HVI are all updated by the investigation manager based on their investigation of the event.. These are all Mandatory fields.
Our business has clear definition of an Inquiry and complaint : A customer inquiry is: • any request for information on a product or service offered • a request is to fix an error • the first time a matter is raised and we are able to respond to the customer’s satisfaction A customer complaint is where:

Powercor 2016 Annual RIN Basis of Preparation document.doc Page 22
• the customer expressly requests a complaint be made • we do not respond to the customer’s issue or the customer is unhappy with our
response and they contact us again It is important that all information extracted out of CARE is reconciled and reviewed on a monthly basis. Our business reporting allows us to undertake this activity to maintain accurate and consistent reporting.
B. Source (refer AER 2016 Annual RIN, Appendix A Section 10 – 1.1(b)) Please explain the source from where the data has been obtained (i.e. systems such as GIS, SAP, OAS, Audited financial statements etc.). If the data is not being obtained from the originating source (i.e. it was sourced from a report), the originating source for the data in the report will need to be provided as well. CARE which is a SAP based system. It is a tractable workflow system that ensures everyone in the business can raise a CARE. The CARE system currently has two CARE administrators who monitor, assess and assign CAREs to relevant members of the business as investigation managers and or responsible managers. Reporting is extracted via the CARE system. It is the responsibility of the investigation managers and responsible managers to ensure data extracted from the system is accurate. It is an effective and efficient, complaints and Inquires management system that recognises and addresses the needs and expectations of customer’s concerns in line with Australian Standards .It is a real time system with mandatory user fields with inbuilt escalation notifications. Reporting is customised. All personnel are aware of their roles and responsibilities and authorities in respect to updating and completing a CARE. C. Methodology & Assumptions (refer AER 2016 Annual RIN, Appendix A Section 10 – 1.1(c)) Please explain the methodology applied including any assumptions made to determine the final value populated in the RIN. Where applicable please reference the relevant processes and procedures used. Year Methodology & Assumptions
2014 Methodology used- It is essential that all information extracted from the CARE system is reviewed and validated at year end. We make no assumptions regarding data it is accurate data extracted from the CARE system.
2015 Methodology used- It is essential that all information extracted from the CARE system is reviewed and validated at year end. We make no assumptions regarding data it is accurate data extracted from the CARE system.
2016 Methodology used- It is essential that all information extracted from the CARE system is reviewed and validated at year end. We make no assumptions regarding data it is accurate data extracted from the CARE system.
D. Nil or estimate data (refer AER 2016 Annual RIN, Appendix A Section 10 – 1.1(d)) For those years where it is not possible to provide the data or where data has been estimated or derived from other data, please explain: Year 1. Why it was not possible for Powercor to provide the information required; 2014 Nil 2015 Nil

Powercor 2016 Annual RIN Basis of Preparation document.doc Page 23
2016 Nil Year 2. What steps Powercor is taking to ensure it can provide the information in the
future; and 2014 Nil 2015 Nil 2016 Nil Year 3. If an estimate has been provided, the basis of the estimate, including the approach
used, assumptions made and reasons why the estimate is Powercor’s best estimate.
2014 Nil 2015 Nil 2016 Nil

Powercor 2016 Annual RIN Basis of Preparation document.doc Page 24
AER ANNUAL RIN Basis of Preparation (BOP) Template The purpose of this template is to explain, for each Variable, the basis upon which the Businesses prepared information to populate the input cells. It is used to demonstrate to the AER that the information provided is consistent with the requirements of the RIN Notice. This information must be provided for each variable and must be accurately described as it will be audited and provided to the AER. Please use plain English, complete sentences and avoid acronyms.
Template name 3.6 – Customer Service Table name Table 3.6.7.1 Timely provision of Services (Connections)
Variable name Number of new connections (newly energised properties & Re-energised sites) Number of new connections not provided on or before the agreed date for newly energised & re-energised sites.
BOP ID ANPAL 1bBOP4
A. Demonstrate how the information provided is consistent with the requirements of the Notice (refer AER 2016 Annual RIN, Appendix A Section 10 – 1.1(a))
Requirements of the Notice: (copy requirements from ‘Definitions’ or ‘Principles and Requirements’ sections of the RIN) New Connections – number. The volume of new connections comprises two elements as detailed below in 1b(1) & 1b(ii) 1b(i) New connections – number: - Total number of new supply connections to customers' premises (excluding re-energisations) 1b(ii) New connections – number – Total number of re-energisations (Fuse Insertions/ manual remote) to customers premises (excluding newly energised sites 1b(i)) This number also includes same day and after hours re-energisations and manual remote re-energisations.
1b(iii) New connections - number of supply connections :- (excluding re-energisations) not met before the agreed date with the customer.
Response: (provide affirmation that the above requirements have been met) The Requirements of the RIN have been met as the information provided meets the above definitions.
B. Source (refer AER 2016 Annual RIN, Appendix A Section 10 – 1.1(b)) Please explain the source from where the data has been obtained (i.e. systems such as GIS, SAP, OAS, Audited financial statements etc.). If the data is not being obtained from the originating source (i.e. it was sourced from a report), the originating source for the data in the report will need to be provided as well. Response: The record of truth for customer connections is CIS O/V. All new connections are processed through CIS O/V and each service order processed is time and date stamped to prove activity has been undertaken and completed. The record of truth for customer re-energisations is also CIS O/V. The service orders for re-energisations are validated through MTS before processed through CIS O/V.

Powercor 2016 Annual RIN Basis of Preparation document.doc Page 25
C. Methodology & Assumptions (refer AER 2016 Annual RIN, Appendix A Section 10 – 1.1(c)) Please explain the methodology applied including any assumptions made to determine the final value populated in the RIN. Where applicable please reference the relevant processes and procedures used. Year Methodology & Assumptions
2014 A BI report is run at the end of each month to identify and summarise the number of new connections for Powercor. The BI report is sourced from the activity undertaken in CIS O/V. The report indicates the timeframe in days taken to connect a new customer and identifies whether this period of time is within the agreed timeframe of 10 business days or by the customer agree date if later than 10 days. A review of the report captures the metrics required for this reporting item For “Number of new connections” the BI report “End to end timeframe” is used. For “Number of new connections not provided on or before the agreed date” the Missed GSLs (FBL1N) report is used.
2015 As per 2014, except for “Number of new connections not provided on or before the agreed date”, where the “DVPA” report is used to identify connections exceeding 10 days, which are reviewed to remove any where the connection was made on/before an agreed date.
2016 As per 2015: For “Number of new connections not provided on or before the agreed date” the Missed GSLs (FBL1N) report is used For “Number of New supply Connections” SAP is used to extract volume & revenue. Finance create volume report for New Connections for newly energised properties using (Revenue $/new Connection tariff $) For “ Number of New connection re-energisations” BI reports are used to extract volume data as detailed: BASIC : SRG- Invoice Report AMRS MRIM: SRG MRIM Invoice Report AMRS & SRG AMI Invoice Report AMRS AMI: AMI Energisation – work volume & time analysis report
D. Nil or estimate data (refer AER 2016 Annual RIN, Appendix A Section 10 – 1.1(d)) For those years where it is not possible to provide the data or where data has been estimated or derived from other data, please explain: Year 1. Why it was not possible for Powercor to provide the information required; 2014 N/A 2015 N/A 2016 N/A Year 2. What steps Powercor is taking to ensure it can provide the information in the
future; and 2014 N/A 2015 N/A 2016 N/A Year 3. If an estimate has been provided, the basis of the estimate, including the approach
used, assumptions made and reasons why the estimate is Powercor’s best estimate.
2014 N/A 2015 N/A 2016 N/A

Powercor 2016 Annual RIN Basis of Preparation document.doc Page 26
AER ANNUAL RIN Basis of Preparation (BOP) Template The purpose of this template is to explain, for each Variable, the basis upon which the Businesses prepared information to populate the input cells. It is used to demonstrate to the AER that the information provided is consistent with the requirements of the RIN Notice. This information must be provided for each variable and must be accurately described as it will be audited and provided to the AER. Please use plain English, complete sentences and avoid acronyms. Information table
Template name 3.6.7 - Customer service metrics Table name 3.6.7.2 - Timely repair of faulty street lights
Variable name Street lights - average monthly number "out" BOP ID ANPAL 2BOP29
A. Demonstrate how the information provided is consistent with the requirements of the Notice (refer AER 2016 Annual RIN, Appendix A Section 10 – 1.1(a))
Requirements of the Notice: (copy requirements from ‘Definitions’ or ‘Principles and Requirements’ sections of the RIN) Street lights - average monthly number "out" - The total number of street lights reported by customers as not working over the year, divided by twelve
Response: (provide affirmation that the above requirements have been met) As per the requirements of the Notice, the total number of street lights reported by customers as not working within the reporting period, divided by twelve has been provided for Powercor.
B. Source (refer AER 2016 Annual RIN, Appendix A Section 10 – 1.1(b)) Please explain the source from where the data has been obtained (i.e. systems such as GIS, SAP, OAS, Audited financial statements etc.). If the data is not being obtained from the originating source (i.e. it was sourced from a report), the originating source for the data in the report will need to be provided as well. Response: Actual data is extracted from Streetlight Manager (Salesforce) for the reportable period. C. Methodology & Assumptions (refer AER 2016 Annual RIN, Appendix A Section 10 – 1.1(c)) Please explain the methodology applied including any assumptions made to determine the final value populated in the RIN. Where applicable please reference the relevant processes and procedures used. Year Methodology & Assumptions
2014 Extraction from PLFMS listing total number of streetlights reported by customers as not working in the reporting period, divided by twelve for Powercor.
2015 Extraction from Streetlight Manager (Salesforce) listing total number of streetlights reported by customers as not working in the reporting period, divided by twelve for Powercor.

Powercor 2016 Annual RIN Basis of Preparation document.doc Page 27
2016 As per 2015
D. Nil or estimate data (refer AER 2016 Annual RIN, Appendix A Section 10 – 1.1(d)) For those years where it is not possible to provide the data or where data has been estimated or derived from other data, please explain: Year 1. Why it was not possible for Powercor to provide the information required; 2014 N/A 2015 N/A 2016 N/A Year 2. What steps Powercor is taking to ensure it can provide the information in the
future; and 2014 N/A 2015 N/A 2016 N/A Year 3. If an estimate has been provided, the basis of the estimate, including the approach
used, assumptions made and reasons why the estimate is Powercor’s best estimate.
2014 N/A 2015 N/A 2016 N/A

Powercor 2016 Annual RIN Basis of Preparation document.doc Page 28
AER ANNUAL RIN Basis of Preparation (BOP) Template The purpose of this template is to explain, for each Variable, the basis upon which the Businesses prepared information to populate the input cells. It is used to demonstrate to the AER that the information provided is consistent with the requirements of the RIN Notice. This information must be provided for each variable and must be accurately described as it will be audited and provided to the AER. Please use plain English, complete sentences and avoid acronyms. Information table
Template name 3.6.7 - Customer service metrics Table name 3.6.7.2 - Timely repair of faulty street lights
Variable name Street lights - not repaired by "fix by" date BOP ID ANPAL 2BOP30
A. Demonstrate how the information provided is consistent with the requirements of the Notice (refer AER 2016 Annual RIN, Appendix A Section 10 – 1.1(a))
Requirements of the Notice: (copy requirements from ‘Definitions’ or ‘Principles and Requirements’ sections of the RIN) As per the Victorian Electricity Distribution Code and the Public Lighting Code.
Public Lighting Code Apr 2005 - repair or replace standard fittings within 7 business days of a fault report and use best endeavours to repair or replace non-standard fittings within 7 business days of a fault report subject to the availability of fittings.
The number of streetlight faults reported by person as not working in the reporting period.
Response: (provide affirmation that the above requirements have been met) As per the requirements of the Notice, the total number of street light faults reported by person as not working in the reporting period has been provided for Powercor.
B. Source (refer AER 2016 Annual RIN, Appendix A Section 10 – 1.1(b)) Please explain the source from where the data has been obtained (i.e. systems such as GIS, SAP, OAS, Audited financial statements etc.). If the data is not being obtained from the originating source (i.e. it was sourced from a report), the originating source for the data in the report will need to be provided as well. Response: Actual data is extracted from Streetlight Manager (Salesforce) for the reportable period. C. Methodology & Assumptions (refer AER 2016 Annual RIN, Appendix A Section 10 – 1.1(c)) Please explain the methodology applied including any assumptions made to determine the final value populated in the RIN. Where applicable please reference the relevant processes and procedures used. Year Methodology & Assumptions

Powercor 2016 Annual RIN Basis of Preparation document.doc Page 29
2014 Extraction from PLFMS listing total number of streetlight faults reported by person as not working in the reporting period has been provided for Powercor.
2015 Extraction from Streetlight Manager (Salesforce) listing total number of streetlight faults reported by person as not working in the reporting period has been provided for Powercor.
2016 As per 2015
D. Nil or estimate data (refer AER 2016 Annual RIN, Appendix A Section 10 – 1.1(d)) For those years where it is not possible to provide the data or where data has been estimated or derived from other data, please explain: Year 1. Why it was not possible for Powercor to provide the information required; 2014 N/A 2015 N/A 2016 N/A Year 2. What steps Powercor is taking to ensure it can provide the information in the
future; and 2014 N/A 2015 N/A 2016 N/A Year 3. If an estimate has been provided, the basis of the estimate, including the approach
used, assumptions made and reasons why the estimate is Powercor’s best estimate.
2014 N/A 2015 N/A 2016 N/A

Powercor 2016 Annual RIN Basis of Preparation document.doc Page 30
AER ANNUAL RIN Basis of Preparation (BOP) Template The purpose of this template is to explain, for each Variable, the basis upon which the Businesses prepared information to populate the input cells. It is used to demonstrate to the AER that the information provided is consistent with the requirements of the RIN Notice. This information must be provided for each variable and must be accurately described as it will be audited and provided to the AER. Please use plain English, complete sentences and avoid acronyms. Information table
Template name 3.6.7 - Customer service metrics Table name 3.6.7.2 - Timely repair of faulty street lights
Variable name Street lights - average number of days to repair BOP ID ANPAL 2BOP31
A. Demonstrate how the information provided is consistent with the requirements of the Notice (refer AER 2016 Annual RIN, Appendix A Section 10 – 1.1(a))
Requirements of the Notice: (copy requirements from ‘Definitions’ or ‘Principles and Requirements’ sections of the RIN) Street lights - average number of days to repair: The average number of days to repair street lights that were reported as not working.
Response: (provide affirmation that the above requirements have been met) As per the requirements of the Notice, the average number of days to repair street lights that were reported by customers as not working within the reporting period has been provided for Powercor.
B. Source (refer AER 2016 Annual RIN, Appendix A Section 10 – 1.1(b)) Please explain the source from where the data has been obtained (i.e. systems such as GIS, SAP, OAS, Audited financial statements etc.). If the data is not being obtained from the originating source (i.e. it was sourced from a report), the originating source for the data in the report will need to be provided as well. Response: Actual data is extracted from Streetlight Manager (Salesforce) for the reportable period. C. Methodology & Assumptions (refer AER 2016 Annual RIN, Appendix A Section 10 – 1.1(c)) Please explain the methodology applied including any assumptions made to determine the final value populated in the RIN. Where applicable please reference the relevant processes and procedures used. Year Methodology & Assumptions
2014 Extraction from PLFMS listing average number of days to repair streetlights reported by customers as not working in the reporting period for Powercor.
2015 Extraction from Streetlight Manager (Salesforce) listing average number of days to repair streetlights reported by customers as not working in the reporting period for Powercor.
Powercor 2016 Annual RIN Basis of Preparation document.doc Page 31
2016 As per 2015
D. Nil or estimate data (refer AER 2016 Annual RIN, Appendix A Section 10 – 1.1(d)) For those years where it is not possible to provide the data or where data has been estimated or derived from other data, please explain: Year 1. Why it was not possible for Powercor to provide the information required; 2014 N/A 2015 N/A 2016 N/A Year 2. What steps Powercor is taking to ensure it can provide the information in the
future; and 2014 N/A 2015 N/A 2016 N/A Year 3. If an estimate has been provided, the basis of the estimate, including the approach
used, assumptions made and reasons why the estimate is Powercor’s best estimate.
2014 N/A 2015 N/A 2016 N/A

Powercor 2016 Annual RIN Basis of Preparation document.doc Page 32
AER ANNUAL RIN Basis of Preparation (BOP) Template The purpose of this template is to explain, for each Variable, the basis upon which the Businesses prepared information to populate the input cells. It is used to demonstrate to the AER that the information provided is consistent with the requirements of the RIN Notice. This information must be provided for each variable and must be accurately described as it will be audited and provided to the AER. Please use plain English, complete sentences and avoid acronyms. Information table
Template name 3.6.7 - Customer service metrics Table name 3.6.7.2 - Timely repair of faulty street lights
Variable name Total number of street lights BOP ID ANPAL 2BOP32
A. Demonstrate how the information provided is consistent with the requirements of the Notice (refer AER 2016 Annual RIN, Appendix A Section 10 – 1.1(a))
Requirements of the Notice: (copy requirements from ‘Definitions’ or ‘Principles and Requirements’ sections of the RIN) The number of streetlights in the reporting period
Response: (provide affirmation that the above requirements have been met) As per the requirements of the Notice, the total number of street lights within the reporting period has been provided for Powercor.
B. Source (refer AER 2016 Annual RIN, Appendix A Section 10 – 1.1(b)) Please explain the source from where the data has been obtained (i.e. systems such as GIS, SAP, OAS, Audited financial statements etc.). If the data is not being obtained from the originating source (i.e. it was sourced from a report), the originating source for the data in the report will need to be provided as well. Response: Actual data is extracted from our Graphical Information System (GIS) for the reportable period. C. Methodology & Assumptions (refer AER 2016 Annual RIN, Appendix A Section 10 – 1.1(c)) Please explain the methodology applied including any assumptions made to determine the final value populated in the RIN. Where applicable please reference the relevant processes and procedures used. Year Methodology & Assumptions
2014 Extraction from GIS of the total number of streetlights in the reporting period for Powercor. This report is extracted on the 1st day of the January and used for the preceding year for reporting purposes.
2015 Extraction from GIS of the total number of streetlights in the reporting period for Powercor. This report is extracted on the 1st day of the January and used for the preceding year for reporting purposes.

Powercor 2016 Annual RIN Basis of Preparation document.doc Page 33
2016 As per 2015 D. Nil or estimate data (refer AER 2016 Annual RIN, Appendix A Section 10 – 1.1(d)) For those years where it is not possible to provide the data or where data has been estimated or derived from other data, please explain: Year 1. Why it was not possible for Powercor to provide the information required; 2014 N/A 2015 N/A 2016 N/A Year 2. What steps Powercor is taking to ensure it can provide the information in the
future; and 2014 N/A 2015 N/A 2016 N/A Year 3. If an estimate has been provided, the basis of the estimate, including the approach
used, assumptions made and reasons why the estimate is Powercor’s best estimate.
2014 N/A 2015 N/A 2016 N/A

Powercor 2016 Annual RIN Basis of Preparation document.doc Page 34
AER ANNUAL RIN
Basis of Preparation (BOP) Template The purpose of this template is to explain, for each Variable, the basis upon which the Businesses prepared information to populate the input cells. It is used to demonstrate to the AER that the information provided is consistent with the requirements of the RIN Notice. This information must be provided for each variable and must be accurately described as it will be audited and provided to the AER. Please use plain English, complete sentences and avoid acronyms.
Template name 3.6 Quality of service and Customer Service Table name Table 3.6.7: Customer Service
Variable name Calls to Call Centre Fault Line BOP ID ANPAL2BOP33
A. Demonstrate how the information provided is consistent with the requirements of the Notice (refer AER 2016 Annual RIN, Appendix A Section 10 – 1.1(a))
The total number of calls to the fault line to be reported, including any answered by an automated response service and terminated without being answered by an operator. Excludes missed calls where the fault line is overloaded.
Customers that call the Faults line enter the phone system through an Interactive Voice Response (IVR) system. Based on the menu options they choose they are routed to the relevantly skilled agents and assigned queue priorities. All calls that enter the IVR are assigned a call type. Call types ending with “_IVR” are used to identify the total number of calls that have been offered to that IVR, which includes any call that receives an automated response service (such as estimated fault restoration time) The reporting system counts the calls against many metrics, including ‘Calls Offered’ Because of this, and the fact that call types denoted with “_IVR” include all calls for that call type/phone line, we are able to easily count the total number of calls to the call centre fault line as per the AER definition.
B. Source (refer AER 2016 Annual RIN, Appendix A Section 10 – 1.1(b)) Please explain the source from where the data has been obtained (i.e. systems such as GIS, SAP, OAS, Audited financial statements etc.). If the data is not being obtained from the originating source (i.e. it was sourced from a report), the originating source for the data in the report will need to be provided as well. The data for this metric comes directly from our telephony reporting tool Exony. Exony connects to the CISCO database and provides the reporting interface. Data is then exported from Exony into Excel so it can be formatted and presented in the correct format for the AER RIN document. This includes only using the correct call types depending on the business being reported

Powercor 2016 Annual RIN Basis of Preparation document.doc Page 35
C. Methodology & Assumptions (refer AER 2016 Annual RIN, Appendix A Section 10 – 1.1(c)) Please explain the methodology applied including any assumptions made to determine the final value populated in the RIN. Where applicable please reference the relevant processes and procedures used. Year Methodology & Assumptions
2014 None. It is essentially one raw metric pulled from the telephony system. 2015 None, as with previous years 2016 None, as with previous years D. Nil or estimate data (refer AER 2016 Annual RIN, Appendix A Section 10 – 1.1(d)) For those years where it is not possible to provide the data or where data has been estimated or derived from other data, please explain: Year 1. Why it was not possible for Powercor to provide the information required; 2014 n/a 2015 n/a 2016 n/a Year 2. What steps Powercor is taking to ensure it can provide the information in the
future; and 2014 n/a 2015 n/a 2016 n/a Year 3. If an estimate has been provided, the basis of the estimate, including the approach
used, assumptions made and reasons why the estimate is Powercor’s best estimate.
2014 n/a 2015 n/a 2016 n/a

Powercor 2016 Annual RIN Basis of Preparation document.doc Page 36
AER ANNUAL RIN Basis of Preparation (BOP) Template The purpose of this template is to explain, for each Variable, the basis upon which the Businesses prepared information to populate the input cells. It is used to demonstrate to the AER that the information provided is consistent with the requirements of the RIN Notice. This information must be provided for each variable and must be accurately described as it will be audited and provided to the AER. Please use plain English, complete sentences and avoid acronyms.
Template name 3.6 Quality of service and Customer Service Table name Table 3.6.7: Customer Service
Variable name Calls to Fault Line answered in 30 seconds BOP ID ANPAL2BOP34
A. Demonstrate how the information provided is consistent with the requirements of the Notice (refer AER 2016 Annual RIN, Appendix A Section 10 – 1.1(a))
The total number of calls to the fault line answered in 30 seconds where the time to answer a call is measured from when the call enters the telephone system of the call centre (including that time when it may be ringing unanswered by any response) and the caller speaks with a human operator, but excluding: (a) the time that the caller is connected to an automated interactive service that provides substantive information; (b) calls to payment lines and automated interactive services; (c) calls abandoned by the customer within 30 seconds of the call being queued for response by a human operator (where the time in which a telephone call is abandoned is not measured, then an estimate of the number of calls abandoned within 30 seconds will be determined by taking 20 per cent of all calls abandoned); and (d) being placed in an automated queuing system does not constitute a response.
Customers that call the Faults line enter the phone system through an Interactive Voice Response (IVR) system. Based on the menu options they choose they are routed to the relevantly skilled agents and assigned queue priorities. The telephony system assigns them a certain call type only when they have been routed to queue to an agent (i.e. Not calls to a payment line or automated service) The reporting system records counts the calls against many metrics, including ‘Answered in 30 seconds’ and ‘Abandoned in 30 seconds’. Because of this, and the fact that only certain call types have been queued to an agent, we are able to easily count the number of calls that have waited 30 seconds or less before being answered by an agent.
B. Source (refer AER 2016 Annual RIN, Appendix A Section 10 – 1.1(b)) Please explain the source from where the data has been obtained (i.e. systems such as GIS, SAP, OAS, Audited financial statements etc.). If the data is not being obtained from the originating source (i.e. it was sourced from a report), the originating source for the data in the report will need to be provided as well.

Powercor 2016 Annual RIN Basis of Preparation document.doc Page 37
The data for this variable comes directly from our telephony reporting tool Exony. Exony connects to the CISCO database and provides the reporting interface. Data is then exported from Exony into Excel so it can be formatted and presented in the correct format for the AER RIN document. C. Methodology & Assumptions (refer AER 2016 Annual RIN, Appendix A Section 10 – 1.1(c)) Please explain the methodology applied including any assumptions made to determine the final value populated in the RIN. Where applicable please reference the relevant processes and procedures used. Year Methodology & Assumptions
2014 None. It is essentially raw data pulled straight from the system with no further assumptions or methodologies used.
2015 None, as with previous years 2016 None, as with previous years D. Nil or estimate data (refer AER 2016 Annual RIN, Appendix A Section 10 – 1.1(d)) For those years where it is not possible to provide the data or where data has been estimated or derived from other data, please explain: Year 1. Why it was not possible for Powercor to provide the information required; 2014 n/a 2015 n/a 2016 n/a Year 2. What steps Powercor is taking to ensure it can provide the information in the
future; and 2014 n/a 2015 n/a 2016 n/a Year 3. If an estimate has been provided, the basis of the estimate, including the approach
used, assumptions made and reasons why the estimate is Powercor’s best estimate.
2014 n/a 2015 n/a 2016 n/a

Powercor 2016 Annual RIN Basis of Preparation document.doc Page 38
AER ANNUAL RIN Basis of Preparation (BOP) Template The purpose of this template is to explain, for each Variable, the basis upon which the Businesses prepared information to populate the input cells. It is used to demonstrate to the AER that the information provided is consistent with the requirements of the RIN Notice. This information must be provided for each variable and must be accurately described as it will be audited and provided to the AER. Please use plain English, complete sentences and avoid acronyms.
Template name 3.6 Quality of service and Customer Service Table name Table 3.6.7: Customer Service
Variable name Calls to fault line - average waiting time before call answered BOP ID ANPAL2BOP35
A. Demonstrate how the information provided is consistent with the requirements of the Notice (refer AER 2016 Annual RIN, Appendix A Section 10 – 1.1(a))
The average time in seconds from when calls enter the system (including that time when a call may be ringing unanswered) and the caller speaks to a human operator or is connected to an interactive service that provides the information requested
Customers that call the Faults line enter the phone system through an Interactive Voice Response (IVR) system. Based on the menu options they choose they are routed to the relevantly skilled agents and assigned queue priorities. All calls that enter the IVR are assigned a call type. Call types ending with “_IVR” are used to identify the total number of calls that have been offered to that IVR, which includes any call that receives an automated response service (such as estimated fault restoration time). Call types ending with “_CC” indicate calls that have transitioned through IVR and have been offered to an operator in the call centre. The reporting system counts the calls against many metrics, including ‘Answered Wait Time’ and ‘Calls Answered’ Because of these call metrics and call types we are able to easily collate the wait time of calls before they are answered by an operator or are connected to an IVR that provides the information requested
B. Source (refer AER 2016 Annual RIN, Appendix A Section 10 – 1.1(b)) Please explain the source from where the data has been obtained (i.e. systems such as GIS, SAP, OAS, Audited financial statements etc.). If the data is not being obtained from the originating source (i.e. it was sourced from a report), the originating source for the data in the report will need to be provided as well. The data for these metrics comes directly from our telephony reporting tool Exony. Exony connects to the CISCO database and provides the reporting interface. Data is then exported from Exony into Excel so it can be formatted and presented in the correct format for the AER RIN document. This includes only using the correct call types depending on the business being reported

Powercor 2016 Annual RIN Basis of Preparation document.doc Page 39
C. Methodology & Assumptions (refer AER 2016 Annual RIN, Appendix A Section 10 – 1.1(c)) Please explain the methodology applied including any assumptions made to determine the final value populated in the RIN. Where applicable please reference the relevant processes and procedures used. Year Methodology & Assumptions
2014 None. It is essentially a number of raw metrics pulled from the telephony system and collated for AER reporting.
2015 None, as with previous years
2016 None, as with previous years
D. Nil or estimate data (refer AER 2016 Annual RIN, Appendix A Section 10 – 1.1(d)) For those years where it is not possible to provide the data or where data has been estimated or derived from other data, please explain: Year 1. Why it was not possible for Powercor to provide the information required; 2014 n/a 2015 n/a 2016 n/a Year 2. What steps Powercor is taking to ensure it can provide the information in the
future; and 2014 n/a 2015 n/a 2016 n/a Year 3. If an estimate has been provided, the basis of the estimate, including the approach
used, assumptions made and reasons why the estimate is Powercor’s best estimate.
2014 n/a 2015 n/a 2016 n/a
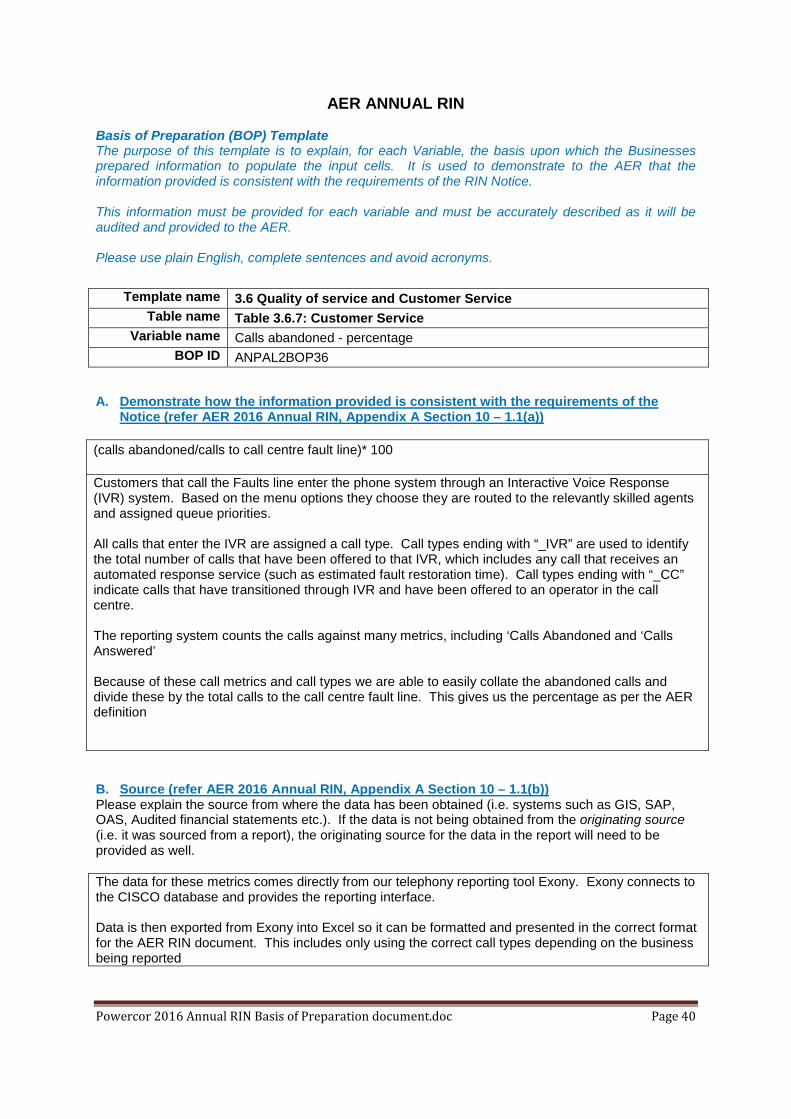
Powercor 2016 Annual RIN Basis of Preparation document.doc Page 40
AER ANNUAL RIN Basis of Preparation (BOP) Template The purpose of this template is to explain, for each Variable, the basis upon which the Businesses prepared information to populate the input cells. It is used to demonstrate to the AER that the information provided is consistent with the requirements of the RIN Notice. This information must be provided for each variable and must be accurately described as it will be audited and provided to the AER. Please use plain English, complete sentences and avoid acronyms.
Template name 3.6 Quality of service and Customer Service Table name Table 3.6.7: Customer Service
Variable name Calls abandoned - percentage BOP ID ANPAL2BOP36
A. Demonstrate how the information provided is consistent with the requirements of the Notice (refer AER 2016 Annual RIN, Appendix A Section 10 – 1.1(a))
(calls abandoned/calls to call centre fault line)* 100
Customers that call the Faults line enter the phone system through an Interactive Voice Response (IVR) system. Based on the menu options they choose they are routed to the relevantly skilled agents and assigned queue priorities. All calls that enter the IVR are assigned a call type. Call types ending with “_IVR” are used to identify the total number of calls that have been offered to that IVR, which includes any call that receives an automated response service (such as estimated fault restoration time). Call types ending with “_CC” indicate calls that have transitioned through IVR and have been offered to an operator in the call centre. The reporting system counts the calls against many metrics, including ‘Calls Abandoned and ‘Calls Answered’ Because of these call metrics and call types we are able to easily collate the abandoned calls and divide these by the total calls to the call centre fault line. This gives us the percentage as per the AER definition
B. Source (refer AER 2016 Annual RIN, Appendix A Section 10 – 1.1(b)) Please explain the source from where the data has been obtained (i.e. systems such as GIS, SAP, OAS, Audited financial statements etc.). If the data is not being obtained from the originating source (i.e. it was sourced from a report), the originating source for the data in the report will need to be provided as well. The data for these metrics comes directly from our telephony reporting tool Exony. Exony connects to the CISCO database and provides the reporting interface. Data is then exported from Exony into Excel so it can be formatted and presented in the correct format for the AER RIN document. This includes only using the correct call types depending on the business being reported

Powercor 2016 Annual RIN Basis of Preparation document.doc Page 41
C. Methodology & Assumptions (refer AER 2016 Annual RIN, Appendix A Section 10 – 1.1(c)) Please explain the methodology applied including any assumptions made to determine the final value populated in the RIN. Where applicable please reference the relevant processes and procedures used. Year Methodology & Assumptions
2014 None. It is essentially a number of raw metrics pulled from the telephony system and collated for AER reporting.
2015 None, as with previous years 2016 None, as with previous years D. Nil or estimate data (refer AER 2016 Annual RIN, Appendix A Section 10 – 1.1(d)) For those years where it is not possible to provide the data or where data has been estimated or derived from other data, please explain: Year 1. Why it was not possible for Powercor to provide the information required; 2014 n/a 2015 n/a 2016 n/a Year 2. What steps Powercor is taking to ensure it can provide the information in the
future; and 2014 n/a 2015 n/a 2016 n/a Year 3. If an estimate has been provided, the basis of the estimate, including the approach
used, assumptions made and reasons why the estimate is Powercor’s best estimate.
2014 n/a 2015 n/a 2016 n/a

Powercor 2016 Annual RIN Basis of Preparation document.doc Page 42
AER ANNUAL RIN Basis of Preparation (BOP) Template The purpose of this template is to explain, for each Variable, the basis upon which the Businesses prepared information to populate the input cells. It is used to demonstrate to the AER that the information provided is consistent with the requirements of the RIN Notice. This information must be provided for each variable and must be accurately described as it will be audited and provided to the AER. Please use plain English, complete sentences and avoid acronyms.
Template name 3.6 Quality of service and Customer Service Table name Table 3.6.7: Customer Service
Variable name Call centre - number of overload events BOP ID ANPAL2BOP37
A. Demonstrate how the information provided is consistent with the requirements of the Notice (refer AER 2016 Annual RIN, Appendix A Section 10 – 1.1(a))
The number of times that the call centre queuing system is inadequate to queue all incoming calls
Telstra provides reports on request to identify times and details of situations where the IVR system was unable to queue incoming calls due to an ‘overload event’
B. Source (refer AER 2016 Annual RIN, Appendix A Section 10 – 1.1(b)) Please explain the source from where the data has been obtained (i.e. systems such as GIS, SAP, OAS, Audited financial statements etc.). If the data is not being obtained from the originating source (i.e. it was sourced from a report), the originating source for the data in the report will need to be provided as well. The data for these metrics comes directly from a Telstra reporting tool. C. Methodology & Assumptions (refer AER 2016 Annual RIN, Appendix A Section 10 – 1.1(c)) Please explain the methodology applied including any assumptions made to determine the final value populated in the RIN. Where applicable please reference the relevant processes and procedures used. Year Methodology & Assumptions
2014 None. 2015 None 2016 None D. Nil or estimate data (refer AER 2016 Annual RIN, Appendix A Section 10 – 1.1(d)) For those years where it is not possible to provide the data or where data has been estimated or derived from other data, please explain: Year 1. Why it was not possible for Powercor to provide the information required; 2014 n/a 2015 n/a
Powercor 2016 Annual RIN Basis of Preparation document.doc Page 43
2016 n/a Year 2. What steps Powercor is taking to ensure it can provide the information in the
future; and 2014 n/a 2015 n/a 2016 n/a Year 3. If an estimate has been provided, the basis of the estimate, including the approach
used, assumptions made and reasons why the estimate is Powercor’s best estimate.
2014 n/a 2015 n/a 2016 n/a

Powercor 2016 Annual RIN Basis of Preparation document.doc Page 44
AER ANNUAL RIN Basis of Preparation (BOP) Template The purpose of this template is to explain, for each Variable, the basis upon which the Businesses prepared information to populate the input cells. It is used to demonstrate to the AER that the information provided is consistent with the requirements of the RIN Notice. This information must be provided for each variable and must be accurately described as it will be audited and provided to the AER. Please use plain English, complete sentences and avoid acronyms.
Template name 3.6 Quality of Service and Customer Service Table name Table 3.6.7: Customer Service
Variable name Customer Complaints (ALL) BOP ID ANPAL2BOP38
A. Demonstrate how the information provided is consistent with the requirements of the Notice (refer AER 2016 Annual RIN, Appendix A Section 10 – 1.1(a))
Requirements of the Notice: (copy requirements from ‘Definitions’ or ‘Principles and Requirements’ sections of the RIN)
Complaint
A written or verbal expression of dissatisfaction about an action, a proposed action, or a failure to act by a distributor, its employees or contractors. This includes failure by a distributor to observe its published practices or procedures
Complaint - administrative process or customer service
The number of complaints relating to the administrative process or customer service of Powercor, excluding those reported under 'connection and augmentation'
Complaint - connection or augmentation
The number of complaints about: (a) the quality and timeliness of a new connection; and (b) the cost, timeliness and quality of augmentation works
Complaint - other The number of complaints that are not under the categories of 'connection & augmentation', 'reliability of supply', 'quality of supply' and 'administrative process or customer service'
Complaint - reliability of supply The number of complaints relating to the reliability of supply Complaint - technical quality of supply
The number of complaints relating to the technical quality of supply
Response: (provide affirmation that the above requirements have been met) The information extracted for the purpose of reporting to the business on a monthly basis along with our requirement to provide accurate figures to the AER Annual RIN report is via a customised SAP based system CARE (Customer Action and Response). It includes a written or verbal expression of dissatisfaction about an action, a proposed action, or a failure to act by a distributor, its employees or contractors.
This includes failure by a distributor to observe its published practices or procedures
Our business has clear definition of an Inquiry and complaint : A customer inquiry is:

Powercor 2016 Annual RIN Basis of Preparation document.doc Page 45
• any request for information on a product or service offered • a request is to fix an error • the first time a matter is raised and we are able to respond to the customer’s satisfaction A customer complaint is where: • the customer expressly requests a complaint be made • we do not respond to the customer’s issue or the customer is unhappy with our response and
they contact us again Special Notes for customer concerns with activities managed by major contractors: On occasion, the business engages contractors to provide turnkey services including the management of all customer interactions associated with their respective activities. For such arrangements contractors are required to comply with Powercor complaints management requirements. It is important that all information extracted out of CARE is reconciled and reviewed on a monthly basis. Our business reporting allows us to undertake this activity to maintain accurate and consistent reporting
We are guided by our Customer complaints POLICY:
Our company vision “Connecting for a bright future” and the company value “Make it easy for your customer” includes the need for excellence in customer service. To fulfil our vision and values, we treat all customer feedback on our performance as an opportunity to learn and improve our customer service. We aim to resolve customer complaints at the interface between the customer and the officer responsible for service provision. Where this cannot be achieved, we have an internal escalation process that is designed to reach a mutually acceptable solution to the customer complaint. We acknowledge receipt of customer complaints within 2 working days. Our aim is to resolve customer complaints within 8 working days. Where we cannot reach a resolution within 8 working days we will keep the customer informed of progress and seek agreement with the customer on the resolution timeframe. We review trends in customer complaints to seek continual improvement in all aspects of our business. Customer Inquiries and Complaints are covered in the Procedure 03-10-P0014– “Complaint & Dispute Resolution Procedure“
B. Source (refer AER 2016 Annual RIN, Appendix A Section 10 – 1.1(b)) Please explain the source from where the data has been obtained (i.e. systems such as GIS, SAP, OAS, Audited financial statements etc.). If the data is not being obtained from the originating source (i.e. it was sourced from a report), the originating source for the data in the report will need to be provided as well. CARE which is a SAP based system. It is a tractable workflow system that ensures everyone in the business can raise a CARE. The CARE system currently has two CARE administrators who monitor, assess and assign CAREs to relevant members of the business as investigation managers and or responsible managers. Reporting is extracted via the CARE system. It is the responsibility of the investigation managers and responsible managers to ensure data extracted from the system is accurate. The CARE administrators assess the CARE and ensure the relevant category and sub

Powercor 2016 Annual RIN Basis of Preparation document.doc Page 46
category is select.
It is an effective and efficient, complaints and Inquires management system that recognises and addresses the needs and expectations of customer’s concerns in line with Australian Standards .It is a real time system with mandatory user fields with inbuilt escalation notifications. Reporting is customised. All personnel are aware of their roles and responsibilities and authorities in respect to updating and completing a CARE. C. Methodology & Assumptions (refer AER 2016 Annual RIN, Appendix A Section 10 – 1.1(c)) Please explain the methodology applied including any assumptions made to determine the final value populated in the RIN. Where applicable please reference the relevant processes and procedures used. Year Methodology & Assumptions
2014 Methodology used - It is essential that all information extracted from the CARE system is reviewed and validated at year end. We make no assumptions regarding data it is accurate data extracted from the CARE system
2015 Methodology used - It is essential that all information extracted from the CARE system is reviewed and validated at year end. We make no assumptions regarding data it is accurate data extracted from the CARE system
2016 Methodology used - It is essential that all information extracted from the CARE system is reviewed and validated at year end. We make no assumptions regarding data it is accurate data extracted from the CARE system
D. Nil or estimate data (refer AER 2016 Annual RIN, Appendix A Section 10 – 1.1(d)) For those years where it is not possible to provide the data or where data has been estimated or derived from other data, please explain: Year 1. Why it was not possible for Powercor to provide the information required; 2014 Nil 2015 Nil 2016 Nil Year 2. What steps Powercor is taking to ensure it can provide the information in the
future; and 2014 Nil 2015 Nil 2016 Nil Year 3. If an estimate has been provided, the basis of the estimate, including the approach
used, assumptions made and reasons why the estimate is Powercor’s best estimate.
2014 Nil

Powercor 2016 Annual RIN Basis of Preparation document.doc Page 47
2015 Nil 2016 Nil

Powercor 2016 Annual RIN Basis of Preparation document.doc Page 48
AER ANNUAL RIN Basis of Preparation (BOP) Template The purpose of this template is to explain, for each Variable, the basis upon which the Businesses prepared information to populate the input cells. It is used to demonstrate to the AER that the information provided is consistent with the requirements of the RIN Notice. This information must be provided for each variable and must be accurately described as it will be audited and provided to the AER. Please use plain English, complete sentences and avoid acronyms. Information table
Template name 3.6.8 Network Performance - Feeder reliability Table name Table 3.6.8: Annual Feeder Reliability Data
Variable name All variables BOP ID ANPAL 4aBOP39
A. Demonstrate how the information provided is consistent with the requirements of the Notice (refer AER 2016 Annual RIN, Appendix A Section 10 – 1.1(a))
Requirements of the Notice: (copy requirements from ‘Definitions’ or ‘Principles and Requirements’ sections of the RIN) Appendix C – non- financial templates – Definitions • Feeder ID/name - The unique code or feeder identifier that the DNSP uses internally.
• Description of feeder service area - A description of the location of the Feeder • Feeder classification - "The following classification of the Feeder as:
CBD: network is predominantly commercial, high-rise buildings, supplied by a predominantly underground distribution network containing significant interconnection and redundancy when compared to urban areas. Urban: the network is not a CBD network, with actual maximum demand over the reporting period per total feeder (network) route length greater than 0.3 MVA/km; Rural Short: not a CBD or urban network with a network route length less than 200 km; Rural Long: not a CBD or urban network with a total network route length greater than 200 km; or as otherwise agreed with by the AER."
• Number of distribution customers - The average of the number of Distribution Customers at the beginning of each Relevant Regulatory Year and the number of Distribution Customers at the end of the Relevant Regulatory Year.
• Length of high voltage distribution lines (overhead) - The route length (measured in kilometres) of overhead lines in service (the total length of Feeders including all spurs), where each SWER line, single-phase line, and three-phase line counts as one line. A double circuit line counts as two lines.
• Length of high voltage distribution lines (underground) - The route length (measured in kilometres) of underground lines in service (the total length of Feeders including all spurs), where

Powercor 2016 Annual RIN Basis of Preparation document.doc Page 49
each SWER line, single-phase line, and three-phase line counts as one line. A double circuit line counts as two lines.
• Maximum demand (MVA) - The recorded maximum demand for the Feeder.
• Energy not supplied (unplanned & planned) (MWh) - "The estimate of energy not supplied (due to unplanned & planned outage) to be based on average Customer demand (multiplied by number of customers interrupted and the duration of the interruption). Average Customer demand to be determined from (in order of preference):
(a) average consumption of the Customers interrupted based on their billing history (b) Feeder demand at the time of the interruption divided by the number of Customers on the Feeder (c) average consumption of Customers on the Feeder based on their billing history (d) average feeder demand derived from Feeder maximum demand and estimated load factor, divided by the number of customers on the Feeder."
• Unplanned outage -"The number of unplanned events causing interruptions on the DNSP's
network, including deliberate interruptions in response to an emergency event but does not include:
(a) momentary outages and single premise outages (b) subsequent outages caused by network switching during fault finding."
• Total unplanned customer minutes off supply (Mins) - The sum of the duration of each unplanned
interruption experienced by Customers on a Feeder, including single premise outages but not including momentary interruptions.
• Unplanned interruptions (SAIFI) - "The total number of unplanned sustained Customer interruptions divided by the total number of Distribution Customers. Unplanned SAIFI excludes momentary interruptions (one minute or less). SAIFI is expressed per 0.01 interruptions.
The number of Distribution Customers used to derive SAIFI should reflect the relevant network type:
Whole network - total Distribution Customers Network classification (CBD/Urban/Rural short/Rural long) - CBD/Urban/Rural
short/Rural long Customers respectively Individual Feeder - Customers on that Feeder.
Note: The number of Distribution Customers used to derive SAIDI and SAIFI is defined in the STPIS as: the average of the number of Customers at the beginning of the reporting period and the number of Customers at the end of the reporting period."
• Planned outage - The number of planned events causing interruptions and does not include
single premise outages.
• Planned interruptions (SAIFI) - "The total number of planned sustained Customer interruptions divided by the total number of Distribution Customers. Planned SAIFI excludes momentary interruptions (one minute or less). SAIFI is expressed per 0.01 interruptions.
The number of Distribution Customers used to derive SAIFI should reflect the relevant network type:
Whole network - total Distribution Customers Network classification (CBD/Urban/Rural short/Rural long) - CBD/Urban/Rural
short/Rural long Customers respectively Individual Feeder - Customers on that Feeder.
Note: The number of Distribution Customers used to derive SAIDI and SAIFI is defined in the STPIS as: the average of the number of Customers at the beginning of the reporting period and the number of Customers at the end of the reporting period."

Powercor 2016 Annual RIN Basis of Preparation document.doc Page 50
• Total number of momentary feeder outages - The number of feeder outages of less than or equal
to 1 minute (where each sequence of auto-reclose attempts resulting in a successful auto re-close is counted as one outage), but greater than 0.5 seconds, in duration, including any outage of an entire feeder (including due to a sub-transmission fault) that results in an interruption, and does not include an outage of a feeder section. Each sequence of auto-reclose attempts resulting in a successful auto re-close is counted as one momentary outage if the sequence is completed in no more than one minute. Re-closes that are followed by lockout are to be excluded from the momentary outage indicator.
• MAIFI Momentary Average Interruption Frequency Index - "As per the ESCV's Information specification (Service performance) for Victorian Electricity Distributors, 1 January 2009, p. 30: The total number of momentary interruptions divided by the total number of distribution customers.
• Exclusion category/ Excluded event/Event category - The exclusions allowed under clauses 3.3 and 5.4 of the service target performance incentive scheme that applies to the DNSP.
• Low Reliability Feeder (SAIDI) - "A Yes or No answer describing whether the annual reported SAIDI for a feeder is above or below the reporting threshold:
CBD Feeder - 70, where the number of interruptions is greater than 1; Urban - 270; Short rural - 600; Long rural - 850.
An answer of Yes is required if the reported SAIDI exceeds the threshold, and an answer of No is required if the reported SAIDI is less than or equal to the threshold. This definition includes both planned and unplanned SAIDI."
Response: (provide affirmation that the above requirements have been met) The data provided is consistent with the source data used for reliability reporting over the past five years in the ESC/AER Annual RIN Reports and meets the requirements of this Information Notice.
B. Source (refer AER 2016 Annual RIN, Appendix A Section 10 – 1.1(b)) Please explain the source from where the data has been obtained (i.e. systems such as GIS, SAP, OAS, Audited financial statements etc.). If the data is not being obtained from the originating source (i.e. it was sourced from a report), the originating source for the data in the report will need to be provided as well. Response: For Powercor (PAL), the originating data sources are: • OMS (Outage Management System)
• GIS (Geographical Information System) • The annual customer aggregated consumption data were obtained from the feeder electrical
energy meters Electricity distribution network service providers AER Service Target Performance Incentive Scheme (STPIS), November 2009, particularly section 3.3 Exclusions
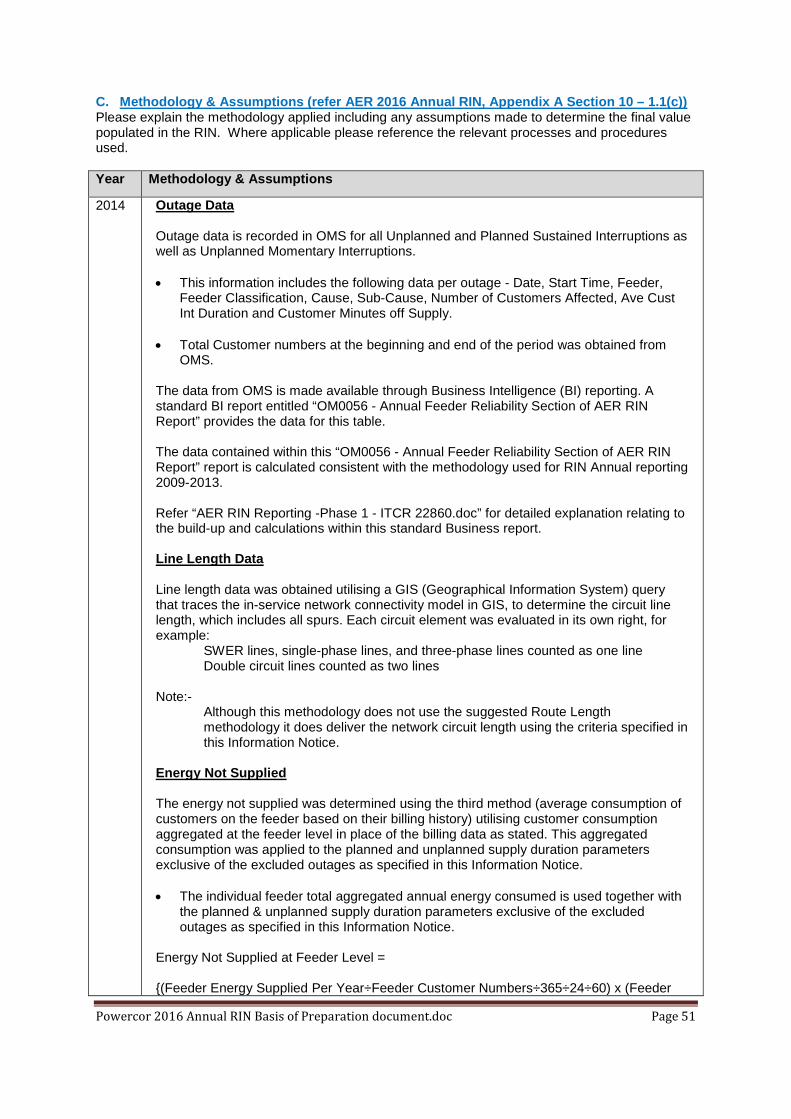
Powercor 2016 Annual RIN Basis of Preparation document.doc Page 51
C. Methodology & Assumptions (refer AER 2016 Annual RIN, Appendix A Section 10 – 1.1(c)) Please explain the methodology applied including any assumptions made to determine the final value populated in the RIN. Where applicable please reference the relevant processes and procedures used. Year Methodology & Assumptions
2014 Outage Data Outage data is recorded in OMS for all Unplanned and Planned Sustained Interruptions as well as Unplanned Momentary Interruptions. • This information includes the following data per outage - Date, Start Time, Feeder,
Feeder Classification, Cause, Sub-Cause, Number of Customers Affected, Ave Cust Int Duration and Customer Minutes off Supply.
• Total Customer numbers at the beginning and end of the period was obtained from
OMS. The data from OMS is made available through Business Intelligence (BI) reporting. A standard BI report entitled “OM0056 - Annual Feeder Reliability Section of AER RIN Report” provides the data for this table. The data contained within this “OM0056 - Annual Feeder Reliability Section of AER RIN Report” report is calculated consistent with the methodology used for RIN Annual reporting 2009-2013. Refer “AER RIN Reporting -Phase 1 - ITCR 22860.doc” for detailed explanation relating to the build-up and calculations within this standard Business report. Line Length Data Line length data was obtained utilising a GIS (Geographical Information System) query that traces the in-service network connectivity model in GIS, to determine the circuit line length, which includes all spurs. Each circuit element was evaluated in its own right, for example:
SWER lines, single-phase lines, and three-phase lines counted as one line Double circuit lines counted as two lines
Note:- Although this methodology does not use the suggested Route Length methodology it does deliver the network circuit length using the criteria specified in this Information Notice.
Energy Not Supplied The energy not supplied was determined using the third method (average consumption of customers on the feeder based on their billing history) utilising customer consumption aggregated at the feeder level in place of the billing data as stated. This aggregated consumption was applied to the planned and unplanned supply duration parameters exclusive of the excluded outages as specified in this Information Notice. • The individual feeder total aggregated annual energy consumed is used together with
the planned & unplanned supply duration parameters exclusive of the excluded outages as specified in this Information Notice.
Energy Not Supplied at Feeder Level = {(Feeder Energy Supplied Per Year÷Feeder Customer Numbers÷365÷24÷60) x (Feeder

Powercor 2016 Annual RIN Basis of Preparation document.doc Page 52
Minutes off Supply)}
2015 As for 2014 2016 As for 2014 except for Outage Data
Unplanned customer minutes off-supply (SAIDI) is now being reported instead of Unplanned
customer minutes off-supply. • SAIDI calculations utilised individual Feeder Customer Numbers instead of Network
Customer Numbers. • SAIFI calculations now utilised individual Feeder Customer Numbers instead of Network
Customer Numbers. • MAIFI calculations now utilise individual Feeder Customer Numbers instead of Network
Customer Numbers. D. Nil or estimate data (refer AER 2016 Annual RIN, Appendix A Section 10 – 1.1(d)) For those years where it is not possible to provide the data or where data has been estimated or derived from other data, please explain: Year 1. Why it was not possible for Powercor to provide the information required; 2014 Outage & Line Length Data
Not Applicable Energy Not Supplied Energy not supplied is an estimate of the energy that was not supplied as a result of customer interruptions. The energy not supplied was determined using the third method utilising customer consumption aggregated at the feeder level in place of the billing data.
2015 As for 2014 2016 As for 2014 Year 2. What steps Powercor is taking to ensure it can provide the information in the
future; and 2014 Not Applicable 2015 As for 2014 2016 As for 2014 Year 3. If an estimate has been provided, the basis of the estimate, including the approach
used, assumptions made and reasons why the estimate is Powercor’s best estimate.
2014 Outage & Line Length Data Not Applicable Energy Not Supplied The basis for the estimate was the third method (average consumption of customers on the feeder based on their billing history) as per the requirements of the Notice.
2015 As for 2014 2016 As for 2014
AER ANNUAL RIN

Powercor 2016 Annual RIN Basis of Preparation document.doc Page 53
Basis of Preparation (BOP) Template The purpose of this template is to explain, for each Variable, the basis upon which the Businesses prepared information to populate the input cells. It is used to demonstrate to the AER that the information provided is consistent with the requirements of the RIN Notice. This information must be provided for each variable and must be accurately described as it will be audited and provided to the AER. Please use plain English, complete sentences and avoid acronyms.
Template name 3.6.9 Network performance – planned outages Table name Table 3.6.9: Planned outages
Variable name All variables BOP ID ANPAL 4cBOP40
A. Demonstrate how the information provided is consistent with the requirements of the Notice (refer AER 2016 Annual RIN, Appendix A Section 10 – 1.1(a))
Requirements of the Notice: (copy requirements from ‘Definitions’ or ‘Principles and Requirements’ sections of the RIN) Appendix C – non- financial templates – Definitions • SAIDI System Average Interruption Duration Index As per the STPIS: the sum of the duration of
each sustained interruption (in minutes) divided by the total number of distribution customers as defined in the service target performance incentive scheme
• SAIFI System Average Interruption Frequency Index As per the STPIS: the total number of
sustained interruptions divided by the total number of distribution customers as defined in the service target performance incentive scheme
Response: (provide affirmation that the above requirements have been met) The data provided is consistent with the source data used for reliability reporting over the past five years in the ESC/AER Annual RIN Reports and meets the requirements of this Information Notice.
B. Source (refer AER 2016 Annual RIN, Appendix A Section 10 – 1.1(b)) Please explain the source from where the data has been obtained (i.e. systems such as GIS, SAP, OAS, Audited financial statements etc.). If the data is not being obtained from the originating source (i.e. it was sourced from a report), the originating source for the data in the report will need to be provided as well. Response: For Powercor, the originating data source is the: • OMS (Outage Management System) 2016
Electricity distribution network service providers AER Service Target Performance Incentive Scheme (STPIS), November 2009, particularly section 3.3 Exclusions

Powercor 2016 Annual RIN Basis of Preparation document.doc Page 54
C. Methodology & Assumptions (refer AER 2016 Annual RIN, Appendix A Section 10 – 1.1(c)) Please explain the methodology applied including any assumptions made to determine the final value populated in the RIN. Where applicable please reference the relevant processes and procedures used. Year Methodology & Assumptions
2014 u Outage data is recorded in OMS for all Planned Sustained Interruptions. • This information includes the following data per outage - Date, Start Time, Feeder,
Feeder Classification, Cause, Sub-Cause, Number of Customers Affected, Ave Cust Int Duration and Customer Minutes off Supply.
• Total Customer numbers at the beginning and end of the period was obtained from
OMS. The data from OMS is made available through Business Intelligence (BI) reporting. A standard BI report entitled “OM0053 - STPIS Reliability Section of AER RIN Report” provides the data for this table. The data contained within this “OM0053 - STPIS Reliability Section of AER RIN Report” is calculated consistent with the methodology used for Annual RIN reporting 2009-2013. Refer “AER RIN Reporting - Phase 1 - ITCR 22860.doc” for detailed explanation relating to the build-up and calculations within this standard Business report.
2015 As for 2014 2016 As per 2014 D. Nil or estimate data (refer AER 2016 Annual RIN, Appendix A Section 10 – 1.1(d)) For those years where it is not possible to provide the data or where data has been estimated or derived from other data, please explain: Year 1. Why it was not possible for Powercor to provide the information required; 2014 Not Applicable 2015 As for 2014 2016 As per 2014 Year 2. What steps Powercor is taking to ensure it can provide the information in the
future; and 2014 Not Applicable 2015 As for 2014 2016 As per 2014 Year 3. If an estimate has been provided, the basis of the estimate, including the approach
used, assumptions made and reasons why the estimate is Powercor’s best estimate.
2014 Not Applicable 2015 As for 2014 2016 As per 2014
Powercor 2016 Annual RIN Basis of Preparation document.doc Page 55
AER ANNUAL RIN Basis of Preparation (BOP) Template The purpose of this template is to explain, for each Variable, the basis upon which the Businesses prepared information to populate the input cells. It is used to demonstrate to the AER that the information provided is consistent with the requirements of the RIN Notice. This information must be provided for each variable and must be accurately described as it will be audited and provided to the AER. Please use plain English, complete sentences and avoid acronyms. Information table
Template name 4.1 Public Lighting Table name Table 4.1.4: Public Lighting Metrics by Tariff
Variable name Tariff Categories BOP ID ANFPAL 4.1BOP1
A. Demonstrate how the information provided is consistent with the requirements of the Notice (refer AER 2016 Annual RIN, Appendix A Section 1)
Requirements: Please reference Appendix A Sections 1-7 of the AER 2016 Annual RIN. Response: All expenditures have been reported in accordance with the requirements of the RIN and are:
• Derived and verifiable from the statutory accounts and state fairly the financial position of Powercor.
• Directly attributed to standard control services, alternative control services, negotiated distribution services, in accordance with the approved Cost Allocation Methodology for the particular regulatory year.
B. Source (refer AER 2016 Annual RIN, Appendix A Section 1) Please explain the source from where the data has been obtained (i.e. systems such as GIS, SAP, OAS, Audited financial statements etc.). If the data is not being obtained from the originating source (i.e. it was sourced from a report), the originating source for the data in the report will need to be provided as well. Response: Variables: Category P LED High Output, Category P LED Standard Output, Compact Fluoro 32W, Compact, Fluoro 42W, Fluorescent T5 (2X14W), Fluorescent T5 (2X24W), Mercury vapour 125 watt, Mercury vapour 250 watt, Mercury vapour 400 watt, Mercury vapour 50 watt, Mercury vapour 80 watt, Metal halide 150 watt, Metal halide 250 watt, Metal halide 70 watt, Sodium 150 watt, Sodium 250 watt, Sodium 400 watt
• The data for the expenditure categories and cost allocations has been sourced from the SAP accounting system. SAP is the primary financial reporting system and is the source of providing the audited statutory accounts for Powercor.
• Pole inventory data is sourced from GIS. C. Methodology & Assumptions (refer AER 2016 Annual RIN, Appendix A Section 1) Please explain the methodology applied including any assumptions made to determine the final value populated in the RIN. Where applicable please reference the relevant processes and procedures used.

Powercor 2016 Annual RIN Basis of Preparation document.doc Page 56
Year Methodology & Assumptions
2016 Variables: Category P LED High Output, Category P LED Standard Output, Compact Fluoro 32W, Compact, Fluoro 42W, Fluorescent T5 (2X14W), Fluorescent T5 (2X24W), Mercury vapour 125 watt, Mercury vapour 250 watt, Mercury vapour 400 watt, Mercury vapour 50 watt, Mercury vapour 80 watt, Metal halide 150 watt, Metal halide 250 watt, Metal halide 70 watt, Sodium 150 watt, Sodium 250 watt, Sodium 400 watt
• The SAP financial system is used to extract the information required by category and regulatory segment. Using the audited statutory accounts for Powercor, the business uses cost elements within SAP in order to allocate costs between the regulatory segments in accordance with the cost allocation methodology.
• Number of lights are reported as per inventory recorded in GIS D. Nil or estimate data (refer AER 2016 Annual RIN, Appendix A Section 1) For those years where it is not possible to provide the data or where data has been estimated or derived from other data, please explain: Year 1. Why it was not possible for Powercor to provide the information required; 2016 N/A Year 2. What steps Powercor is taking to ensure it can provide the information in the
future; and 2016 N/A Year 3. If an estimate has been provided, the basis of the estimate, including the approach
used, assumptions made and reasons why the estimate is Powercor’s best estimate.
2016 N/A

Powercor 2016 Annual RIN Basis of Preparation document.doc Page 57
AER ANNUAL RIN Basis of Preparation (BOP) Template The purpose of this template is to explain, for each Variable, the basis upon which the Businesses prepared information to populate the input cells. It is used to demonstrate to the AER that the information provided is consistent with the requirements of the RIN Notice. This information must be provided for each variable and must be accurately described as it will be audited and provided to the AER. Please use plain English, complete sentences and avoid acronyms.
Template name 6.2 STPIS Reliability Table name Table 6.2.1: SAIDI
Table 6.2.2: SAIFI Table 6.2.3: MAIFI Table 6.2.4: Average Distribution Customers
Variable name All variables BOP ID ANPAL 1aBOP1
A. Demonstrate how the information provided is consistent with the requirements of the Notice (refer AER 2016 Annual RIN, Appendix A Section 10 – 1.1(a))
Requirements of the Notice: (copy requirements from ‘Definitions’ or ‘Principles and Requirements’ sections of the RIN) Appendix C – non- financial templates – Definitions • SAIDI System Average Interruption Duration Index: As per the STPIS: the sum of the duration of
each sustained interruption (in minutes) divided by the total number of distribution customers as defined in the service target performance incentive scheme
• SAIFI System Average Interruption Frequency Index: As per the STPIS: the total number of
sustained interruptions divided by the total number of distribution customers as defined in the service target performance incentive scheme
• MAIFI Momentary Average Interruption Frequency Index: As per the ESCV's Information
specification (Service performance) for Victorian Electricity Distributors, 1 January 2009, p. 30: The total number of momentary interruptions divided by the total number of distribution customers.
• Customer numbers at the start of period: The number of Distribution Customers, measured on the
first day of the Relevant Regulatory Year. • Customer numbers at the end of period: The number of Distribution Customers, measured on the
last day of the Relevant Regulatory Year. Response: (provide affirmation that the above requirements have been met) The data provided is consistent with the source data used for reliability reporting over the past five years in the ESC/AER Annual RIN Reports and meets the requirements of this Information Notice.
B. Source (refer AER 2016 Annual RIN, Appendix A Section 10 – 1.1(b))

Powercor 2016 Annual RIN Basis of Preparation document.doc Page 58
Please explain the source from where the data has been obtained (i.e. systems such as GIS, SAP, OAS, Audited financial statements etc.). If the data is not being obtained from the originating source (i.e. it was sourced from a report), the originating source for the data in the report will need to be provided as well. Response: For Powercor, the originating data source is the: • OMS (Outage Management System) 2016 Electricity distribution network service providers AER Service Target Performance Incentive Scheme (STPIS), November 2009, particularly section 3.3 Exclusions
C. Methodology & Assumptions (refer AER 2016 Annual RIN, Appendix A Section 10 – 1.1(c)) Please explain the methodology applied including any assumptions made to determine the final value populated in the RIN. Where applicable please reference the relevant processes and procedures used. Year Methodology & Assumptions
2014 Outage data is recorded in OMS for all Unplanned and Planned Sustained Interruptions as
well as Unplanned Momentary Interruptions. • This information includes the following data per outage - Date, Start Time, Feeder,
Feeder Classification, Cause, Sub-Cause, Number of Customers Affected, Ave Cust Int Duration and Customer Minutes off Supply.
• Total Customer numbers at the beginning and end of the period was obtained from
OMS. The data from OMS is made available through Business Intelligence (BI) reporting. A standard BI report entitled “OM0053 - STPIS Reliability Section of AER RIN Report” provides the data for this table. The data contained within this “OM0053 - STPIS Reliability Section of AER RIN Report” report is calculated consistent with the methodology used for Annual RIN reporting for 2009-2013. Refer “AER RIN Reporting - Phase 1 - ITCR 22860.doc” for detailed explanation relating to the build-up and calculations within this standard Business report.
2015 As for 2014 2016 As for 2014 D. Nil or estimate data (refer AER 2016 Annual RIN, Appendix A Section 10 – 1.1(d)) For those years where it is not possible to provide the data or where data has been estimated or derived from other data, please explain: Year 1. Why it was not possible for Powercor to provide the information required; 2014 Not Applicable 2015 As for 2014 2016 As for 2014 Year 2. What steps Powercor is taking to ensure it can provide the information in the

Powercor 2016 Annual RIN Basis of Preparation document.doc Page 59
future; and 2014 Not Applicable 2015 As for 2014 2016 As for 2014 Year 3. If an estimate has been provided, the basis of the estimate, including the approach
used, assumptions made and reasons why the estimate is Powercor’s best estimate.
2014 Not Applicable 2015 As for 2014 2016 As for 2014

Powercor 2016 Annual RIN Basis of Preparation document.doc Page 60
AER ANNUAL RIN Basis of Preparation (BOP) Template The purpose of this template is to explain, for each Variable, the basis upon which the Businesses prepared information to populate the input cells. It is used to demonstrate to the AER that the information provided is consistent with the requirements of the RIN Notice. This information must be provided for each variable and must be accurately described as it will be audited and provided to the AER. Please use plain English, complete sentences and avoid acronyms.
Template name 6.6 STPIS Customer Service Table name Table 6.6.1: Telephone Answering
Variable name Number of calls received BOP ID ANPAL 1bBOP2
A. Demonstrate how the information provided is consistent with the requirements of the Notice (refer AER 2016 Annual RIN, Appendix A Section 10 – 1.1(a))
The number of calls to the fault line excluding: (a) calls to payment lines and automated interactive services; (b) calls abandoned by the customer within 30 seconds of the call being queued for response by a human operator (where the time in which a telephone call is abandoned is not measured, then an estimate of the number of calls abandoned within 30 seconds will be determined by taking 20 per cent of all calls abandoned).
Customers that call the Faults line enter the phone system through an Interactive Voice Response (IVR) system. Based on the menu options they choose they are routed to the relevantly skilled agents and assigned queue priorities. The telephony system assigns them a certain call type only when they have been routed to queue to an agent (i.e. Not calls to a payment line or automated service) The reporting system counts the calls against many metrics, including ‘Calls Offered’ and ‘Abandoned in 30 seconds’. Because of this, and the fact that only certain call types have been queued to an agent, we are able to easily count the number of calls received by the fault line (‘Calls Offered’) excluding automated interactive calls and calls that have abandoned within 30 seconds. To calculate correctly we deduct the number of calls abandoned from the number of calls offered in order to correctly present the data as per the above definition
B. Source (refer AER 2016 Annual RIN, Appendix A Section 10 – 1.1(b)) Please explain the source from where the data has been obtained (i.e. systems such as GIS, SAP, OAS, Audited financial statements etc.). If the data is not being obtained from the originating source (i.e. it was sourced from a report), the originating source for the data in the report will need to be provided as well. The data for this variable comes directly from our telephony reporting tool Exony. Exony connects to the CISCO database and provides the reporting interface.

Powercor 2016 Annual RIN Basis of Preparation document.doc Page 61
Data is then exported from Exony into Excel so it can be formatted and presented in the correct format for the AER RIN document. This includes deducting the number of calls abandoned within 30 seconds from the total number of calls offered at the agent level C. Methodology & Assumptions (refer AER 2016 Annual RIN, Appendix A Section 10 – 1.1(c)) Please explain the methodology applied including any assumptions made to determine the final value populated in the RIN. Where applicable please reference the relevant processes and procedures used. Year Methodology & Assumptions
2014 None. It is essentially two raw metrics pulled from the telephony system. Calls offered to agent and Calls abandoned within 30 seconds at agent level. The delta is ‘Number of calls received’
2015 None, as with previous years 2016 None, as with previous years D. Nil or estimate data (refer AER 2016 Annual RIN, Appendix A Section 10 – 1.1(d)) For those years where it is not possible to provide the data or where data has been estimated or derived from other data, please explain: Year 1. Why it was not possible for Powercor to provide the information required; 2014 n/a 2015 n/a 2016 n/a Year 2. What steps Powercor is taking to ensure it can provide the information in the
future; and 2014 n/a 2015 n/a 2016 n/a Year 3. If an estimate has been provided, the basis of the estimate, including the approach
used, assumptions made and reasons why the estimate is Powercor’s best estimate.
2014 n/a 2015 n/a 2016 n/a

Powercor 2016 Annual RIN Basis of Preparation document.doc Page 62
AER ANNUAL RIN Basis of Preparation (BOP) Template The purpose of this template is to explain, for each Variable, the basis upon which the Businesses prepared information to populate the input cells. It is used to demonstrate to the AER that the information provided is consistent with the requirements of the RIN Notice. This information must be provided for each variable and must be accurately described as it will be audited and provided to the AER. Please use plain English, complete sentences and avoid acronyms.
Template name 6.6 STPIS Customer Service Table name Table 6.6.1: Telephone Answering
Variable name Number of calls answered in 30 seconds BOP ID ANPAL 1bBOP3
A. Demonstrate how the information provided is consistent with the requirements of the Notice (refer AER 2016 Annual RIN, Appendix A Section 10 – 1.1(a))
The total number of calls to the fault line answered in 30 seconds where the time to answer a call is measured from when the call enters the telephone system of the call centre (including that time when it may be ringing unanswered by any response) and the caller speaks with a human operator, but excluding: (a) the time that the caller is connected to an automated interactive service that provides substantive information; (b) calls to payment lines and automated interactive services; (c) calls abandoned by the customer within 30 seconds of the call being queued for response by a human operator (where the time in which a telephone call is abandoned is not measured, then an estimate of the number of calls abandoned within 30 seconds will be determined by taking 20 per cent of all calls abandoned); and (d) being placed in an automated queuing system does not constitute a response.
Customers that call the Faults line enter the phone system through an Interactive Voice Response (IVR) system. Based on the menu options they choose they are routed to the relevantly skilled agents and assigned queue priorities. The telephony system assigns them a certain call type only when they have been routed to queue to an agent (i.e. Not calls to a payment line or automated service) The reporting system records counts the calls against many metrics, including ‘Answered in 30 seconds’ and ‘Abandoned in 30 seconds’. Because of this, and the fact that only certain call types have been queued to an agent, we are able to easily count the number of calls that have waited 30 seconds or less before being answered by an agent.
B. Source (refer AER 2016 Annual RIN, Appendix A Section 10 – 1.1(b)) Please explain the source from where the data has been obtained (i.e. systems such as GIS, SAP, OAS, Audited financial statements etc.). If the data is not being obtained from the originating source (i.e. it was sourced from a report), the originating source for the data in the report will need to be provided as well.

Powercor 2016 Annual RIN Basis of Preparation document.doc Page 63
The data for this variable comes directly from our telephony reporting tool Exony. Exony connects to the CISCO database and provides the reporting interface. Data is then exported from Exony into Excel so it can be formatted and presented in the correct format for the AER RIN document. C. Methodology & Assumptions (refer AER 2016 Annual RIN, Appendix A Section 10 – 1.1(c)) Please explain the methodology applied including any assumptions made to determine the final value populated in the RIN. Where applicable please reference the relevant processes and procedures used. Year Methodology & Assumptions
2014 None. It is essentially raw data pulled straight from the system with no further assumptions or methodologies used.
2015 None, as with previous years 2016 None, as with previous years D. Nil or estimate data (refer AER 2016 Annual RIN, Appendix A Section 10 – 1.1(d)) For those years where it is not possible to provide the data or where data has been estimated or derived from other data, please explain: Year 1. Why it was not possible for Powercor to provide the information required; 2014 Not applicable 2015 n/a 2016 n/a Year 2. What steps Powercor is taking to ensure it can provide the information in the
future; and 2014 Not applicable 2015 n/a 2016 n/a Year 3. If an estimate has been provided, the basis of the estimate, including the approach
used, assumptions made and reasons why the estimate is Powercor’s best estimate.
2014 Not applicable 2015 n/a 2016 n/a

Powercor 2016 Annual RIN Basis of Preparation document.doc Page 64
AER ANNUAL RIN Basis of Preparation (BOP) Template The purpose of this template is to explain, for each Variable, the basis upon which the Businesses prepared information to populate the input cells. It is used to demonstrate to the AER that the information provided is consistent with the requirements of the RIN Notice. This information must be provided for each variable and must be accurately described as it will be audited and provided to the AER. Please use plain English, complete sentences and avoid acronyms.
Template name 6.7 STPIS Daily Performance Table name Table 6.7.1: Daily Performance Data (unplanned)
Variable name All variables BOP ID ANPAL 1cBOP9
A. Demonstrate how the information provided is consistent with the requirements of the Notice (refer AER 2016 Annual RIN, Appendix A Section 10 – 1.1(a))
Requirements of the Notice: (copy requirements from ‘Definitions’ or ‘Principles and Requirements’ sections of the RIN) Appendix C – non- financial templates – Definitions • MAIFI Momentary Average Interruption Frequency Index "As per the ESCV's Information
specification (Service performance) for Victorian Electricity Distributors, 1 January 2009, p. 30: The total number of momentary interruptions divided by the total number of distribution customers.
Response: (provide affirmation that the above requirements have been met) The data provided is consistent with the source data used for reliability reporting over the past five years in the ESC/AER Annual RIN Reports and meets the requirements of this Information Notice.
B. Source (refer AER 2016 Annual RIN, Appendix A Section 10 – 1.1(b)) Please explain the source from where the data has been obtained (i.e. systems such as GIS, SAP, OAS, Audited financial statements etc.). If the data is not being obtained from the originating source (i.e. it was sourced from a report), the originating source for the data in the report will need to be provided as well. Response: For Powercor, the originating data source is the: • OMS (Outage Management System) 2016 Electricity distribution network service providers AER Service Target Performance Incentive Scheme (STPIS), November 2009, particularly section 3.3 Exclusions C. Methodology & Assumptions (refer AER 2016 Annual RIN, Appendix A Section 10 – 1.1(c))
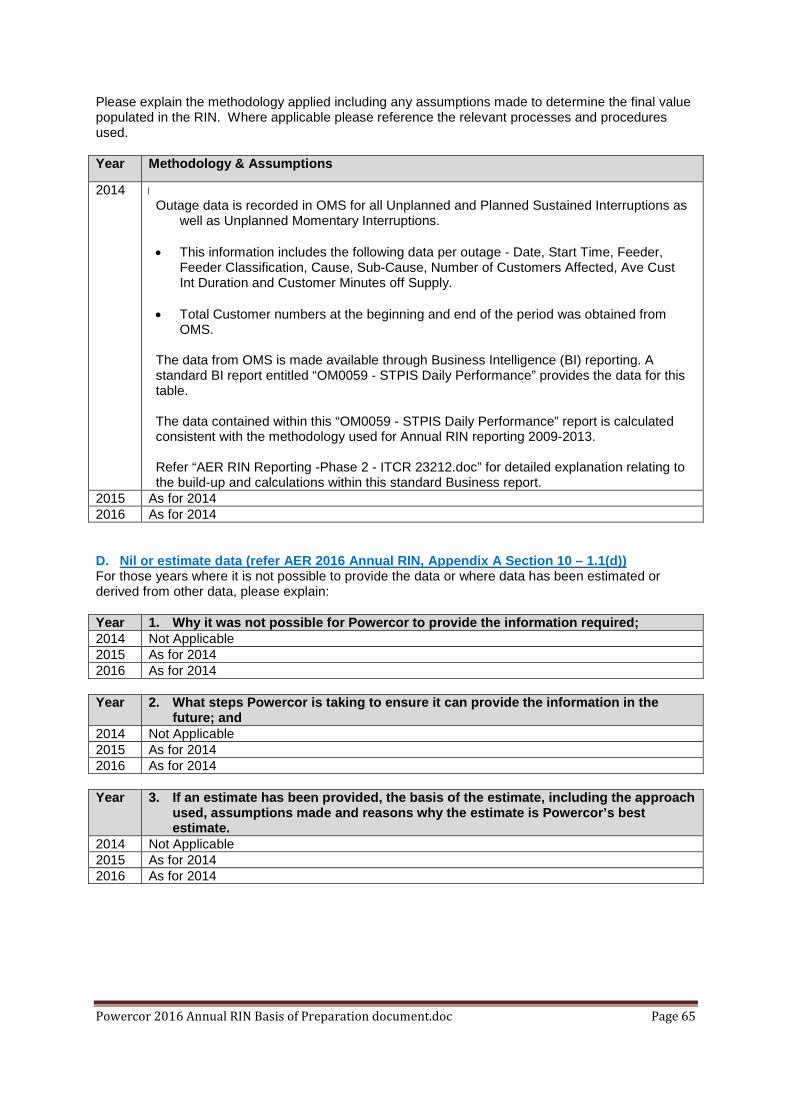
Powercor 2016 Annual RIN Basis of Preparation document.doc Page 65
Please explain the methodology applied including any assumptions made to determine the final value populated in the RIN. Where applicable please reference the relevant processes and procedures used. Year Methodology & Assumptions
2014 u Outage data is recorded in OMS for all Unplanned and Planned Sustained Interruptions as
well as Unplanned Momentary Interruptions. • This information includes the following data per outage - Date, Start Time, Feeder,
Feeder Classification, Cause, Sub-Cause, Number of Customers Affected, Ave Cust Int Duration and Customer Minutes off Supply.
• Total Customer numbers at the beginning and end of the period was obtained from
OMS. The data from OMS is made available through Business Intelligence (BI) reporting. A standard BI report entitled “OM0059 - STPIS Daily Performance” provides the data for this table. The data contained within this “OM0059 - STPIS Daily Performance” report is calculated consistent with the methodology used for Annual RIN reporting 2009-2013. Refer “AER RIN Reporting -Phase 2 - ITCR 23212.doc” for detailed explanation relating to the build-up and calculations within this standard Business report.
2015 As for 2014 2016 As for 2014 D. Nil or estimate data (refer AER 2016 Annual RIN, Appendix A Section 10 – 1.1(d)) For those years where it is not possible to provide the data or where data has been estimated or derived from other data, please explain: Year 1. Why it was not possible for Powercor to provide the information required; 2014 Not Applicable 2015 As for 2014 2016 As for 2014 Year 2. What steps Powercor is taking to ensure it can provide the information in the
future; and 2014 Not Applicable 2015 As for 2014 2016 As for 2014 Year 3. If an estimate has been provided, the basis of the estimate, including the approach
used, assumptions made and reasons why the estimate is Powercor’s best estimate.
2014 Not Applicable 2015 As for 2014 2016 As for 2014

Powercor 2016 Annual RIN Basis of Preparation document.doc Page 66
AER ANNUAL RIN Basis of Preparation (BOP) Template The purpose of this template is to explain, for each Variable, the basis upon which the Businesses prepared information to populate the input cells. It is used to demonstrate to the AER that the information provided is consistent with the requirements of the RIN Notice. This information must be provided for each variable and must be accurately described as it will be audited and provided to the AER. Please use plain English, complete sentences and avoid acronyms.
Template name 6.7 STPIS Daily Performance Table name Table 6.7.1: Daily Performance Data
Variable name Number of calls received BOP ID ANPAL 1cBOP10
A. Demonstrate how the information provided is consistent with the requirements of the Notice (refer AER 2016 Annual RIN, Appendix A Section 10 – 1.1(a))
The number of calls to the fault line excluding: (a) calls to payment lines and automated interactive services; (b) calls abandoned by the customer within 30 seconds of the call being queued for response by a human operator (where the time in which a telephone call is abandoned is not measured, then an estimate of the number of calls abandoned within 30 seconds will be determined by taking 20 per cent of all calls abandoned).
Customers that call the Faults line enter the phone system through an Interactive Voice Response (IVR) system. Based on the menu options they choose they are routed to the relevantly skilled agents and assigned queue priorities. The telephony system assigns them a certain call type only when they have been routed to queue to an agent (i.e. Not calls to a payment line or automated service) The reporting system counts the calls against many metrics, including ‘Calls Offered’ and ‘Abandoned in 30 seconds’. Because of this, and the fact that only certain call types have been queued to an agent, we are able to easily count the number of calls received by the fault line (‘Calls Offered’) excluding automated interactive calls and calls that have abandoned within 30 seconds. To calculate correctly we deduct the number of calls abandoned from the number of calls offered in order to correctly present the data as per the above definition
B. Source (refer AER 2016 Annual RIN, Appendix A Section 10 – 1.1(b)) Please explain the source from where the data has been obtained (i.e. systems such as GIS, SAP, OAS, Audited financial statements etc.). If the data is not being obtained from the originating source (i.e. it was sourced from a report), the originating source for the data in the report will need to be provided as well. The data for this variable comes directly from our telephony reporting tool Exony. Exony connects to the CISCO database and provides the reporting interface.

Powercor 2016 Annual RIN Basis of Preparation document.doc Page 67
Data is then exported from Exony into Excel so it can be formatted and presented in the correct format for the AER RIN document. This includes deducting the number of calls abandoned within 30 seconds from the total number of calls offered at the agent level C. Methodology & Assumptions (refer AER 2016 Annual RIN, Appendix A Section 10 – 1.1(c)) Please explain the methodology applied including any assumptions made to determine the final value populated in the RIN. Where applicable please reference the relevant processes and procedures used. Year Methodology & Assumptions
2014 None. It is essentially two raw metrics pulled from the telephony system. Calls offered to agent and Calls abandoned within 30 seconds at agent level. The delta is ‘Number of calls received’
2015 None, as with previous years 2016 None, as with previous years D. Nil or estimate data (refer AER 2016 Annual RIN, Appendix A Section 10 – 1.1(d)) For those years where it is not possible to provide the data or where data has been estimated or derived from other data, please explain: Year 1. Why it was not possible for Powercor to provide the information required; 2014 n/a 2015 n/a 2016 n/a Year 2. What steps Powercor is taking to ensure it can provide the information in the
future; and 2014 n/a 2015 n/a 2016 n/a Year 3. If an estimate has been provided, the basis of the estimate, including the approach
used, assumptions made and reasons why the estimate is Powercor’s best estimate.
2014 n/a 2015 n/a 2016 n/a

Powercor 2016 Annual RIN Basis of Preparation document.doc Page 68
AER ANNUAL RIN Basis of Preparation (BOP) Template The purpose of this template is to explain, for each Variable, the basis upon which the Businesses prepared information to populate the input cells. It is used to demonstrate to the AER that the information provided is consistent with the requirements of the RIN Notice. This information must be provided for each variable and must be accurately described as it will be audited and provided to the AER. Please use plain English, complete sentences and avoid acronyms.
Template name 6.7 STPIS Daily Performance Table name Table 6.7.1: Daily Performance Data
Variable name Number of calls answered in 30 seconds BOP ID ANPAL 1cBOP11
A. Demonstrate how the information provided is consistent with the requirements of the Notice (refer AER 2016 Annual RIN, Appendix A Section 10 – 1.1(a))
The total number of calls to the fault line answered in 30 seconds where the time to answer a call is measured from when the call enters the telephone system of the call centre (including that time when it may be ringing unanswered by any response) and the caller speaks with a human operator, but excluding: (a) the time that the caller is connected to an automated interactive service that provides substantive information; (b) calls to payment lines and automated interactive services; (c) calls abandoned by the customer within 30 seconds of the call being queued for response by a human operator (where the time in which a telephone call is abandoned is not measured, then an estimate of the number of calls abandoned within 30 seconds will be determined by taking 20 per cent of all calls abandoned); and (d) being placed in an automated queuing system does not constitute a response.
Customers that call the Faults line enter the phone system through an Interactive Voice Response (IVR) system. Based on the menu options they choose they are routed to the relevantly skilled agents and assigned queue priorities. The telephony system assigns them a certain call type only when they have been routed to queue to an agent (i.e. Not calls to a payment line or automated service) The reporting system records counts the calls against many metrics, including ‘Answered in 30 seconds’ and ‘Abandoned in 30 seconds’. Because of this, and the fact that only certain call types have been queued to an agent, we are able to easily count the number of calls that have waited 30 seconds or less before being answered by an agent.
B. Source (refer AER 2016 Annual RIN, Appendix A Section 10 – 1.1(b)) Please explain the source from where the data has been obtained (i.e. systems such as GIS, SAP, OAS, Audited financial statements etc.). If the data is not being obtained from the originating source (i.e. it was sourced from a report), the originating source for the data in the report will need to be provided as well.

Powercor 2016 Annual RIN Basis of Preparation document.doc Page 69
The data for this variable comes directly from our telephony reporting tool Exony. Exony connects to the CISCO database and provides the reporting interface. Data is then exported from Exony into Excel so it can be formatted and presented in the correct format for the AER RIN document. C. Methodology & Assumptions (refer AER 2016 Annual RIN, Appendix A Section 10 – 1.1(c)) Please explain the methodology applied including any assumptions made to determine the final value populated in the RIN. Where applicable please reference the relevant processes and procedures used. Year Methodology & Assumptions
2014 None. It is essentially raw data pulled straight from the system with no further assumptions or methodologies used.
2015 None, as with previous years 2016 None, as with previous years D. Nil or estimate data (refer AER 2016 Annual RIN, Appendix A Section 10 – 1.1(d)) For those years where it is not possible to provide the data or where data has been estimated or derived from other data, please explain: Year 1. Why it was not possible for Powercor to provide the information required; 2014 n/a 2015 n/a 2016 n/a Year 2. What steps Powercor is taking to ensure it can provide the information in the
future; and 2014 n/a 2015 n/a 2016 n/a Year 3. If an estimate has been provided, the basis of the estimate, including the approach
used, assumptions made and reasons why the estimate is Powercor’s best estimate.
2014 n/a 2015 n/a 2016 n/a

Powercor 2016 Annual RIN Basis of Preparation document.doc Page 70
AER ANNUAL RIN Basis of Preparation (BOP) Template The purpose of this template is to explain, for each Variable, the basis upon which the Businesses prepared information to populate the input cells. It is used to demonstrate to the AER that the information provided is consistent with the requirements of the RIN Notice. This information must be provided for each variable and must be accurately described as it will be audited and provided to the AER. Please use plain English, complete sentences and avoid acronyms.
Template name 6.8 STPIS Exclusions Table name Table 6.8.1: Exclusions
Variable name All variables BOP ID ANPAL 1eBOP12
A. Demonstrate how the information provided is consistent with the requirements of the Notice (refer AER 2016 Annual RIN, Appendix A Section 10 – 1.1(a))
Requirements of the Notice: (copy requirements from ‘Definitions’ or ‘Principles and Requirements’ sections of the RIN) Appendix C – non- financial templates – Definitions • Feeder ID/name The unique code or feeder identifier that the DNSP uses.
• Feeder classification - "The following classification of the Feeder as:
CBD: network is predominantly commercial, high-rise buildings, supplied by a predominantly underground distribution network containing significant interconnection and redundancy when compared to urban areas. Urban: the network is not a CBD network, with actual maximum demand over the reporting period per total feeder (network) route length greater than 0.3 MVA/km; Rural Short: not a CBD or urban network with a network route length less than 200 km; Rural Long: not a CBD or urban network with a total network route length greater than 200 km; or as otherwise agreed with by the AER."
• Interruption - Any planned or unplanned, momentary or sustained, loss of electricity supply to a customer associated with an outage of any part of the electricity supply network, including generation facilities and transmission networks, of more than 0.5 seconds (as recorded by equipment such as SCADA or, where such equipment does not exist, at the time of the first customer call relating to the network outage), including outages affecting a single premises; and not including subsequent interruptions caused by network switching during fault finding. An interruption ends when supply is again generally available to the customer.
• Duration of interruption (unplanned) (mins) - The duration of an unplanned interruption
experienced by a customer. • Total unplanned minutes off supply - The sum of the duration of each unplanned interruption
experienced by customers on a feeder, including single premise outages but not including momentary interruptions.
• Exclusion category/ Excluded event/Event category The exclusions allowed under clauses 3.3

Powercor 2016 Annual RIN Basis of Preparation document.doc Page 71
and 5.4 of the service target performance incentive scheme that applies to the DNSP.
• MAIFI Momentary Average Interruption Frequency Index "As per the ESCV's Information specification (Service performance) for Victorian Electricity Distributors, 1 January 2009, p. 30: The total number of momentary interruptions divided by the total number of distribution customers.
Response: (provide affirmation that the above requirements have been met) The data provided is consistent with the source data used for reliability reporting over the past five years in the ESC/AER Annual RIN Reports and meets the requirements of this Information Notice.
B. Source (refer AER 2016 Annual RIN, Appendix A Section 10 – 1.1(b)) Please explain the source from where the data has been obtained (i.e. systems such as GIS, SAP, OAS, Audited financial statements etc.). If the data is not being obtained from the originating source (i.e. it was sourced from a report), the originating source for the data in the report will need to be provided as well. Response: For Powercor, the originating data source is the: • OMS (Outage Management System) 2016 Electricity distribution network service providers AER Service Target Performance Incentive Scheme (STPIS), November 2009, particularly section 3.3 Exclusions. C. Methodology & Assumptions (refer AER 2016 Annual RIN, Appendix A Section 10 – 1.1(c)) Please explain the methodology applied including any assumptions made to determine the final value populated in the RIN. Where applicable please reference the relevant processes and procedures used. Year Methodology & Assumptions
2014 u Outage data is recorded in OMS for all Unplanned and Planned Sustained Interruptions
and Unplanned Momentary Interruptions. • This information includes the following data per outage - Date, Start Time, Feeder,
Feeder Classification, Cause, Sub-Cause, Number of Customers Affected, Ave Cust Int Duration and Customer Minutes off Supply.
• Total Customer numbers at the beginning and end of the period was obtained from
OMS. The data from OMS is made available through Business Intelligence (BI) reporting. A standard BI report entitled “OM0057 - STPIS Exclusions Report” provides the data for this table. The data contained within this “OM0057 - STPIS Exclusions Report” report is calculated consistent with the methodology used for Annual RIN reporting 2009-2013. Refer “AER RIN Reporting -Phase 2 - ITCR 23212.doc” for detailed explanation relating to the build-up and calculations within this standard Business report.

Powercor 2016 Annual RIN Basis of Preparation document.doc Page 72
2015 As for 2014 2016 As for 2014 D. Nil or estimate data (refer AER 2016 Annual RIN, Appendix A Section 10 – 1.1(d)) For those years where it is not possible to provide the data or where data has been estimated or derived from other data, please explain: Year 1. Why it was not possible for Powercor to provide the information required; 2014 Not Applicable 2015 As for 2014 2016 As for 2014 Year 2. What steps Powercor is taking to ensure it can provide the information in the
future; and 2014 Not Applicable 2015 As for 2014 2016 As for 2014 Year 3. If an estimate has been provided, the basis of the estimate, including the approach
used, assumptions made and reasons why the estimate is Powercor’s best estimate.
2014 Not Applicable 2015 As for 2014 2016 As for 2014
Powercor 2016 Annual RIN Basis of Preparation document.doc Page 73
AER ANNUAL RIN
Basis of Preparation (BOP) Template The purpose of this template is to explain, for each Variable, the basis upon which the Businesses prepared information to populate the input cells. It is used to demonstrate to the AER that the information provided is consistent with the requirements of the RIN Notice. This information must be provided for each variable and must be accurately described as it will be audited and provided to the AER. Please use plain English, complete sentences and avoid acronyms.
Template name 6.9 STPIS – GSLs Table name Table 6.9.1 – GSLs jurisdictional scheme: Appointments – normal Table name Table 6.9.1 – GSLs jurisdictional scheme: Connections
Variable name Appointments; Customer arranged appointments central Appointments not met within 15 mins of agreed time Appointments – GSL payments (number and $) Connections: Connections made Connections not made be agreed date Connections GSL payments – 1-4 day delay (number and $) Connections GSL payments – 5+ day delay (number and $)
BOP ID ANPAL 1fBOP13
A. Demonstrate how the information provided is consistent with the requirements of the Notice (refer AER 2016 Annual RIN, Appendix A Section 10 – 1.1(a))
Requirements of the Notice: (copy requirements from ‘Definitions’ or ‘Principles and Requirements’ sections of the RIN) Victorian jurisdictional GSL scheme - As per the Victorian Electricity Distribution Code
• Customer arranged appointments central: Appointments requested by the customer for a meeting with the distributor’s staff, at any location.
• Appointments not met within 15 mins of agreed time: Appointments requested by the customer for a meeting with the distributor’s staff not met within 15 minutes of appointed time
• Appointments – GSL payments (number and $): The number of payments and the total amount payable for not meeting appointments
• Connections Made: the number of connections made to customer’s premises for newly
energised Sites • Connections not made on agreed date: the number of connections to customer’s premises
made after the date agreed to with the customer • Connections - GSL payments - 1-4 day delay: The number of payments and the total amount
payable for connection of supply to customers’ premises one to four business days after the date agreed with the customer.
• Connections - GSL payments - 5+ day delay: The number of payments and the total amount payable for connection of supply to the customers’ premises five or more business days after the date agreed with the customer.

Powercor 2016 Annual RIN Basis of Preparation document.doc Page 74
Response: (provide affirmation that the above requirements have been met) The Requirements of the RIN have been met as the information provided meets the above definitions.
B. Source (refer AER 2016 Annual RIN, Appendix A Section 10 – 1.1(b)) Please explain the source from where the data has been obtained (i.e. systems such as GIS, SAP, OAS, Audited financial statements etc.). If the data is not being obtained from the originating source (i.e. it was sourced from a report), the originating source for the data in the report will need to be provided as well. Response: The numbers of appointments made, and any missed appointments, are manually collated from various sources then entered into a reporting spreadsheet at the end of each month: (Raw Data File)
• Special Reading appointments are booked by Retailers directly with our Special Reading contractor who maintains a spreadsheet of appointments which is sent through to us weekly.
• Truck appointments are booked using outlook calendars. • CTA appointments are managed through their diaries.
Missed new connections are determined from the “DVPA” report, calculating the number of working days between paperwork received and connection date, then reviewing any >10 days for details of agreed dates. Missed re-energisations are also captured in our CARE system The record of truth for payment of missed appointments, missed new connections and missed connections (to previously connected properties) is through a SAP report run on payments made to customers for these breaches. The SAP code report is numbered FBL 1N This report captures all cheques produced. The report is has separate company codes. Company codes = 4550 for Powercor and for CitiPower the code = 4650 The Connections total is obtained via BI Reports:
• For “Number of new connections” the BI report “End to end timeframe” & BTS New Connections Report is used.
• For “Number of Re-energisations” the BI reports “AMI Work Volume Report”, “SRG – Invoice Report AMRS (SRGIR)”, “SRG – AMI Invoice Report AMRS (SRGIR)” & “SRG – MRIM Invoice Report AMRS (SRGIR)” are used.
C. Methodology & Assumptions (refer AER 2016 Annual RIN, Appendix A Section 10 – 1.1(c)) Please explain the methodology applied including any assumptions made to determine the final value populated in the RIN. Where applicable please reference the relevant processes and procedures used. Year Methodology & Assumptions
2014 A SAP report is run at the end of each month to identify and summarise the number of payments made to customers for either missed appointments, missed new connections or missed connections (to previously connected properties)

Powercor 2016 Annual RIN Basis of Preparation document.doc Page 75
The assumption is that we only record those customers who we have raised a CARE and a GSL payment as a result of a GSL breach
2015 As per 2014. In addition, the 4 Re-energisation reports overlap some service orders, so duplicated entries are removed to provide the total re-energisations.
2016 As per 2015 D. Nil or estimate data (refer AER 2016 Annual RIN, Appendix A Section 10 – 1.1(d)) For those years where it is not possible to provide the data or where data has been estimated or derived from other data, please explain: Year 1. Why it was not possible for Powercor to provide the information required; 2014 N/A 2015 N/A 2016 N/A Year 2. What steps Powercor is taking to ensure it can provide the information in the
future; and 2014 N/A 2015 N/A 2016 N/A Year 3. If an estimate has been provided, the basis of the estimate, including the approach
used, assumptions made and reasons why the estimate is Powercor’s best estimate.
2014 N/A 2015 N/A 2016 N/A

Powercor 2016 Annual RIN Basis of Preparation document.doc Page 76
AER ANNUAL RIN
Basis of Preparation (BOP) Template The purpose of this template is to explain, for each Variable, the basis upon which the Businesses prepared information to populate the input cells. It is used to demonstrate to the AER that the information provided is consistent with the requirements of the RIN Notice. This information must be provided for each variable and must be accurately described as it will be audited and provided to the AER. Please use plain English, complete sentences and avoid acronyms.
Template name 6.9 STPIS GSLs Table name Table 6.9.1: Guaranteed service levels - jurisdictional GSL schemes
Variable name Reliability of Supply (ALL) BOP ID ANPAL 1fBOP15
A. Demonstrate how the information provided is consistent with the requirements of the Notice (refer AER 2016 Annual RIN, Appendix A Section 10 – 1.1(a))
Requirements of the Notice: Victorian jurisdictional GSL scheme – As per the Victorian Electricity Distribution Code: 6.3 Supply restoration and low reliability payments 2014 and 2015 GSL scheme 6.3.1 A distributor must make a supply restoration payment to a customer of:
(a) $100 where the customer experiences more than 20 hours of unplanned sustained interruptions per year; or (b) $150 where the customer experiences more than 30 hours of unplanned sustained interruptions per year; or (c) $300 where the customer experiences more than 60 hours of unplanned sustained interruptions per year; not counting the period of an event to which clause 6.3.3 or 6.3.4 applies.
6.3.2 A distributor must make a low reliability payment to a customer of: (a) $100 where the customer experiences more than 10 unplanned sustained interruptions per year; or (b) $150 where the customer experiences more than 15 unplanned sustained interruptions per year; or (c) $300 where the customer experiences more than 30 unplanned sustained interruptions per year; and (d) $25 where the customer experiences more than 24 momentary interruptions per year; or (e) $35 where the customer experiences more than 36 momentary interruptions per year,
2016 – 2020 GSL scheme 6.3 Supply restoration and low reliability payments 6.3.1 A distributor must make a supply restoration payment to a customer of:
(a) $120 where the customer experiences more than 20 hours of unplanned sustained interruptions per year; or (b) $180 where the customer experiences more than 30 hours of unplanned sustained interruptions per year; or (c) $360 where the customer experiences more than 60 hours of unplanned sustained interruptions per year; or (d) $80 where the customer is supplied by a CBD feeder or an urban feeder and experiences an unplanned sustained interruption of more than 12 hours, and 20

Powercor 2016 Annual RIN Basis of Preparation document.doc Page 77
hours or less of unplanned sustained interruptions in that year; or (e) $80 where the customer is supplied by a short rural feeder or a long rural feeder and experiences an unplanned sustained interruption of more than 18 hours, and 20 hours or less of unplanned sustained interruptions in that year; not counting the period of an event to which clause 6.3.3 or 6.3.4 applies
6.3.2 A distributor must make a low reliability payment to a customer of: (a) $120 where the customer experiences more than 8 unplanned sustained interruptions per year; or (b) $180 where the customer experiences more than 12 unplanned sustained interruptions per year; or (c) $360 where the customer experiences more than 24 unplanned sustained interruptions per year; and (d) $30 where the customer experiences more than 24 momentary interruptions per year; or (e) $40 where the customer experiences more than 36 momentary interruptions per year, not counting an event to which clause 6.3.3 or 6.3.4 applies.
6.4 Time for payment Any payments required to be made by the distributor to a customer under this clause 6 must be paid by the distributor as soon as practicable after the obligation arises under clauses 6.1 or 6.2 and as soon as practicable following the end of the year in which the obligation arises under clause 6.3. Response: (provide affirmation that the above requirements have been met) The requirements of the RIN Notice have been met as well as the Victorian Electricity Distribution Code.
B. Source (refer AER 2016 Annual RIN, Appendix A Section 10 – 1.1(b)) Please explain the source from where the data has been obtained (i.e. systems such as GIS, SAP, OAS, Audited financial statements etc.). If the data is not being obtained from the originating source (i.e. it was sourced from a report), the originating source for the data in the report will need to be provided as well. Response: Source data originates from OMS (Outage Management System), stored in SAP, and ultimately derived using BI (Business Intelligence) reports. C. Methodology & Assumptions (refer AER 2016 Annual RIN, Appendix A Section 10 – 1.1(c)) Please explain the methodology applied including any assumptions made to determine the final value populated in the RIN. Where applicable please reference the relevant processes and procedures used. Year Methodology & Assumptions
2014 All customer Unplanned Outage data is captured through our OMS system (PowerOn). Business Intelligence takes customer outage data and interrogates according to GSL thresholds. On a monthly basis:
• A BI query is made on YTD customer interrupt data to identify customers where GSL thresholds have been met – this establishes GSL liability;
• On receipt of Management approval, Reliability GSL payments are processed for customers.
• Cheques are then mailed.

Powercor 2016 Annual RIN Basis of Preparation document.doc Page 78
2015 All customer Unplanned Outage data is captured through our OMS system (PowerOn). Business Intelligence takes customer outage data and interrogates according to GSL thresholds. On a monthly basis, a BI query is made on YTD customer interrupt data to identify customers where GSL thresholds have been met – this establishes GSL liability; In following year January, after completion of full year fault data validation and on receipt of Management approval, Reliability GSL payments are processed for customers and sent to Retailers via the Network Bill for inclusion in the next customer bill.
2016 Same as 2015 D. Nil or estimate data (refer AER 2016 Annual RIN, Appendix A Section 10 – 1.1(d)) For those years where it is not possible to provide the data or where data has been estimated or derived from other data, please explain: Year 1. Why it was not possible for Powercor to provide the information required; 2014 n/a 2015 n/a 2016 n/a Year 2. What steps Powercor is taking to ensure it can provide the information in the
future; and 2014 n/a 2015 n/a 2016 n/a Year 3. If an estimate has been provided, the basis of the estimate, including the approach
used, assumptions made and reasons why the estimate is Powercor’s best estimate.
2014 n/a 2015 n/a 2016 n/a

Powercor 2016 Annual RIN Basis of Preparation document.doc Page 79
AER ANNUAL RIN Basis of Preparation (BOP) Template The purpose of this template is to explain, for each Variable, the basis upon which the Businesses prepared information to populate the input cells. It is used to demonstrate to the AER that the information provided is consistent with the requirements of the RIN Notice. This information must be provided for each variable and must be accurately described as it will be audited and provided to the AER. Please use plain English, complete sentences and avoid acronyms. Information table
Template name 6.9 STPIS GSLs Table name 6.9.1- GSLs jurisdictional GSL schemes: Streetlights
Variable name Streetlights BOP ID ANPAL 1fBOP16
A. Demonstrate how the information provided is consistent with the requirements of the Notice (refer AER 2016 Annual RIN, Appendix A Section 10 – 1.1(a))
Requirements of the Notice: (copy requirements from ‘Definitions’ or ‘Principles and Requirements’ sections of the RIN) The number of streetlights in the reporting period
Response: (provide affirmation that the above requirements have been met) As per the requirements of the Notice, the total number of street lights within the reporting period has been provided for Powercor.
B. Source (refer AER 2016 Annual RIN, Appendix A Section 10 – 1.1(b)) Please explain the source from where the data has been obtained (i.e. systems such as GIS, SAP, OAS, Audited financial statements etc.). If the data is not being obtained from the originating source (i.e. it was sourced from a report), the originating source for the data in the report will need to be provided as well. Response: Actual data is extracted from our Graphical Information System (GIS) for the reportable period. C. Methodology & Assumptions (refer AER 2016 Annual RIN, Appendix A Section 10 – 1.1(c)) Please explain the methodology applied including any assumptions made to determine the final value populated in the RIN. Where applicable please reference the relevant processes and procedures used. Year Methodology & Assumptions
2014 Extraction from GIS of the total number of streetlights in the reporting period for Powercor. This report is extracted on the 1st day of the January and used for the preceding year for reporting purposes.
2015 Extraction from GIS of the total number of streetlights in the reporting period for Powercor. This report is extracted on the 1st day of the January and used for the preceding year for

Powercor 2016 Annual RIN Basis of Preparation document.doc Page 80
reporting purposes. 2016 As per 2015 D. Nil or estimate data (refer AER 2016 Annual RIN, Appendix A Section 10 – 1.1(d)) For those years where it is not possible to provide the data or where data has been estimated or derived from other data, please explain: Year 1. Why it was not possible for Powercor to provide the information required; 2014 N/A 2015 N/A 2016 N/A Year 2. What steps Powercor is taking to ensure it can provide the information in the
future; and 2014 N/A 2015 N/A 2016 N/A Year 3. If an estimate has been provided, the basis of the estimate, including the approach
used, assumptions made and reasons why the estimate is Powercor’s best estimate.
2014 N/A 2015 N/A 2016 N/A
Powercor 2016 Annual RIN Basis of Preparation document.doc Page 81
AER ANNUAL RIN Basis of Preparation (BOP) Template The purpose of this template is to explain, for each Variable, the basis upon which the Businesses prepared information to populate the input cells. It is used to demonstrate to the AER that the information provided is consistent with the requirements of the RIN Notice. This information must be provided for each variable and must be accurately described as it will be audited and provided to the AER. Please use plain English, complete sentences and avoid acronyms. Information table
Template name 6.9 STPIS GSLs Table name 6.9.1- GSLs jurisdictional schemes: Street lights
Variable name Street lights “out” during period BOP ID ANPAL 1fBOP17
A. Demonstrate how the information provided is consistent with the requirements of the Notice (refer AER 2016 Annual RIN, Appendix A Section 10 – 1.1(a))
Requirements of the Notice: (copy requirements from ‘Definitions’ or ‘Principles and Requirements’ sections of the RIN) The number of street lights reported by person as not working within the reporting period.
As per the Victorian Electricity Distribution Code and the Public Lighting Code.
Response: (provide affirmation that the above requirements have been met) As per the requirements of the Notice, the total number of streetlight faults reported by person as not working in the reporting period has been provided for Powercor.
B. Source (refer AER 2016 Annual RIN, Appendix A Section 10 – 1.1(b)) Please explain the source from where the data has been obtained (i.e. systems such as GIS, SAP, OAS, Audited financial statements etc.). If the data is not being obtained from the originating source (i.e. it was sourced from a report), the originating source for the data in the report will need to be provided as well. Response: Actual data is extracted from Streetlight Manager (Salesforce) for the reportable period. C. Methodology & Assumptions (refer AER 2016 Annual RIN, Appendix A Section 10 – 1.1(c)) Please explain the methodology applied including any assumptions made to determine the final value populated in the RIN. Where applicable please reference the relevant processes and procedures used. Year Methodology & Assumptions
2014 Extraction from PLFMS listing total number of streetlight faults reported by person as not working in the reporting period has been provided for Powercor.
2015 Extraction from Streetlight Manager (Salesforce) listing total number of

Powercor 2016 Annual RIN Basis of Preparation document.doc Page 82
streetlight faults reported by person as not working in the reporting period has been provided for Powercor.
2016 As per 2015 D. Nil or estimate data (refer AER 2016 Annual RIN, Appendix A Section 10 – 1.1(d)) For those years where it is not possible to provide the data or where data has been estimated or derived from other data, please explain: Year 1. Why it was not possible for Powercor to provide the information required; 2014 N/A 2015 N/A 2016 N/A Year 2. What steps Powercor is taking to ensure it can provide the information in the
future; and 2014 N/A 2015 N/A 2016 N/A Year 3. If an estimate has been provided, the basis of the estimate, including the approach
used, assumptions made and reasons why the estimate is Powercor’s best estimate.
2014 N/A 2015 N/A 2016 N/A
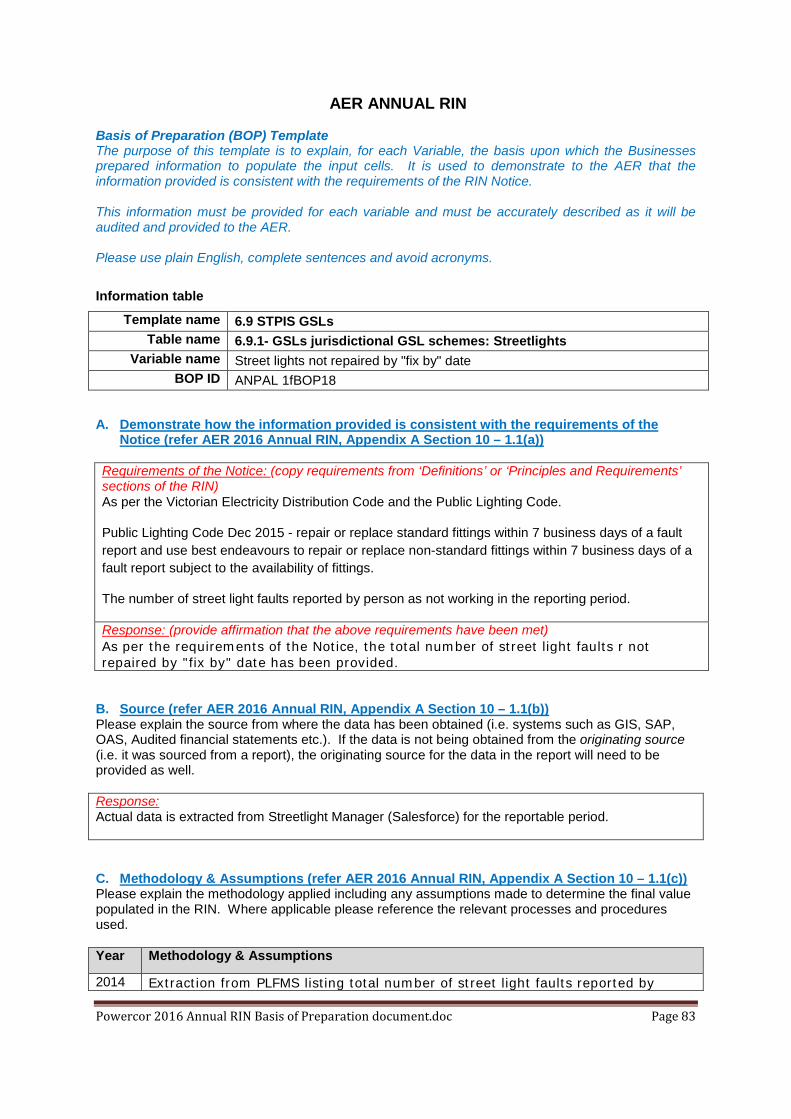
Powercor 2016 Annual RIN Basis of Preparation document.doc Page 83
AER ANNUAL RIN Basis of Preparation (BOP) Template The purpose of this template is to explain, for each Variable, the basis upon which the Businesses prepared information to populate the input cells. It is used to demonstrate to the AER that the information provided is consistent with the requirements of the RIN Notice. This information must be provided for each variable and must be accurately described as it will be audited and provided to the AER. Please use plain English, complete sentences and avoid acronyms. Information table
Template name 6.9 STPIS GSLs Table name 6.9.1- GSLs jurisdictional GSL schemes: Streetlights
Variable name Street lights not repaired by "fix by" date BOP ID ANPAL 1fBOP18
A. Demonstrate how the information provided is consistent with the requirements of the Notice (refer AER 2016 Annual RIN, Appendix A Section 10 – 1.1(a))
Requirements of the Notice: (copy requirements from ‘Definitions’ or ‘Principles and Requirements’ sections of the RIN) As per the Victorian Electricity Distribution Code and the Public Lighting Code.
Public Lighting Code Dec 2015 - repair or replace standard fittings within 7 business days of a fault report and use best endeavours to repair or replace non-standard fittings within 7 business days of a fault report subject to the availability of fittings.
The number of street light faults reported by person as not working in the reporting period.
Response: (provide affirmation that the above requirements have been met) As per the requirements of the Notice, the total number of street light faults r not repaired by "fix by" date has been provided.
B. Source (refer AER 2016 Annual RIN, Appendix A Section 10 – 1.1(b)) Please explain the source from where the data has been obtained (i.e. systems such as GIS, SAP, OAS, Audited financial statements etc.). If the data is not being obtained from the originating source (i.e. it was sourced from a report), the originating source for the data in the report will need to be provided as well. Response: Actual data is extracted from Streetlight Manager (Salesforce) for the reportable period. C. Methodology & Assumptions (refer AER 2016 Annual RIN, Appendix A Section 10 – 1.1(c)) Please explain the methodology applied including any assumptions made to determine the final value populated in the RIN. Where applicable please reference the relevant processes and procedures used. Year Methodology & Assumptions
2014 Extraction from PLFMS listing total number of street light faults reported by
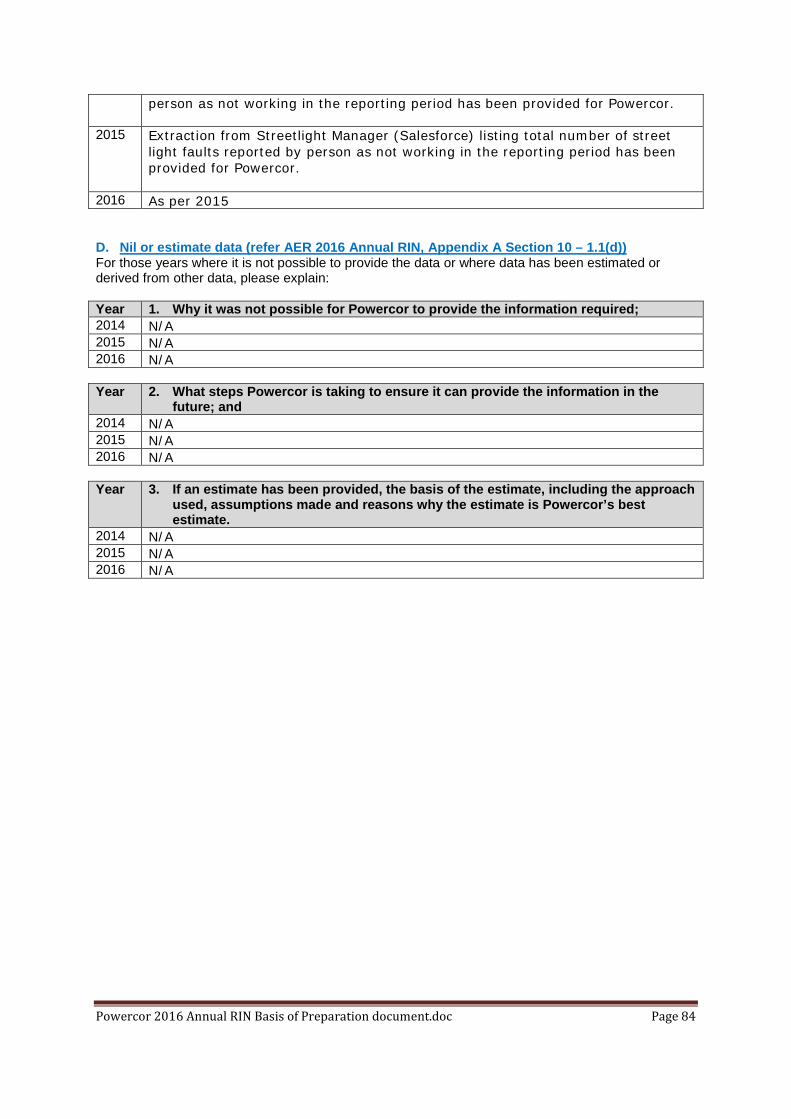
Powercor 2016 Annual RIN Basis of Preparation document.doc Page 84
person as not working in the reporting period has been provided for Powercor.
2015 Extraction from Streetlight Manager (Salesforce) listing total number of street light faults reported by person as not working in the reporting period has been provided for Powercor.
2016 As per 2015 D. Nil or estimate data (refer AER 2016 Annual RIN, Appendix A Section 10 – 1.1(d)) For those years where it is not possible to provide the data or where data has been estimated or derived from other data, please explain: Year 1. Why it was not possible for Powercor to provide the information required; 2014 N/A 2015 N/A 2016 N/A Year 2. What steps Powercor is taking to ensure it can provide the information in the
future; and 2014 N/A 2015 N/A 2016 N/A Year 3. If an estimate has been provided, the basis of the estimate, including the approach
used, assumptions made and reasons why the estimate is Powercor’s best estimate.
2014 N/A 2015 N/A 2016 N/A

Powercor 2016 Annual RIN Basis of Preparation document.doc Page 85
AER ANNUAL RIN Basis of Preparation (BOP) Template The purpose of this template is to explain, for each Variable, the basis upon which the Businesses prepared information to populate the input cells. It is used to demonstrate to the AER that the information provided is consistent with the requirements of the RIN Notice. This information must be provided for each variable and must be accurately described as it will be audited and provided to the AER. Please use plain English, complete sentences and avoid acronyms. Information table
Template name 6.9 STPIS GSLs Table name 6.9.1- GSLs jurisdictional GSL schemes: Streetlights
Variable name Street lights not repaired in 2 business days BOP ID ANPAL 1fBOP19
A. Demonstrate how the information provided is consistent with the requirements of the Notice (refer AER 2016 Annual RIN, Appendix A Section 10 – 1.1(a))
Requirements of the Notice: (copy requirements from ‘Definitions’ or ‘Principles and Requirements’ sections of the RIN) Victorian jurisdictional GSL scheme - As per the Victorian Electricity Distribution Code and the Public Lighting Code.
Public Lighting Code Apr 2005 - Where a distributor does not repair a public light within 2 business days of a fault report or a period otherwise agreed between the distributor and the person, it must pay the first person who reported the fault a minimum of $25 if that person is the occupier of an immediately neighbouring residence or is the proprietor of an immediately neighbouring business.
The number of street light faults reported by person who is the occupier of an immediately neighbouring residence or is the proprietor of an immediately neighbouring business as not working in the reporting period.
Response: (provide affirmation that the above requirements have been met) As per the requirements of the Notice, the total number of street light faults reported by person who is the occupier of an immediately neighbouring residence or is the proprietor of an immediately neighbouring business and not repaired within 2 business days of a fault report or a period otherwise agreed between the distributor and the person, in the reporting period has been provided for Powercor.
B. Source (refer AER 2016 Annual RIN, Appendix A Section 10 – 1.1(b)) Please explain the source from where the data has been obtained (i.e. systems such as GIS, SAP, OAS, Audited financial statements etc.). If the data is not being obtained from the originating source (i.e. it was sourced from a report), the originating source for the data in the report will need to be provided as well. Response: Actual data is extracted from Streetlight Manager (Salesforce) for the reportable period.

Powercor 2016 Annual RIN Basis of Preparation document.doc Page 86
C. Methodology & Assumptions (refer AER 2016 Annual RIN, Appendix A Section 10 – 1.1(c)) Please explain the methodology applied including any assumptions made to determine the final value populated in the RIN. Where applicable please reference the relevant processes and procedures used. Year Methodology & Assumptions
2014 Extraction from PLFMS total number of streetlight faults reported by person who is the occupier of an immediately neighbouring residence or is the proprietor of an immediately neighbouring business and not repaired within 2 business days of a fault report or a period otherwise agreed between the distributor and the person, in the reporting period has been provided for Powercor.
2015 Extraction from Streetlight Manager (Salesforce) total number of streetlight faults reported by person who is the occupier of an immediately neighbouring residence or is the proprietor of an immediately neighbouring business and not repaired within 2 business days of a fault report or a period otherwise agreed between the distributor and the person, in the reporting period has been provided for Powercor.
2016 As per 2015 D. Nil or estimate data (refer AER 2016 Annual RIN, Appendix A Section 10 – 1.1(d)) For those years where it is not possible to provide the data or where data has been estimated or derived from other data, please explain: Year 1. Why it was not possible for Powercor to provide the information required; 2014 N/A 2015 N/A 2016 N/A Year 2. What steps Powercor is taking to ensure it can provide the information in the
future; and 2014 N/A 2015 N/A 2016 N/A Year 3. If an estimate has been provided, the basis of the estimate, including the approach
used, assumptions made and reasons why the estimate is Powercor’s best estimate.
2014 N/A 2015 N/A 2016 N/A

Powercor 2016 Annual RIN Basis of Preparation document.doc Page 87
AER ANNUAL RIN Basis of Preparation (BOP) Template The purpose of this template is to explain, for each Variable, the basis upon which the Businesses prepared information to populate the input cells. It is used to demonstrate to the AER that the information provided is consistent with the requirements of the RIN Notice. This information must be provided for each variable and must be accurately described as it will be audited and provided to the AER. Please use plain English, complete sentences and avoid acronyms. Information table
Template name 6.9 STPIS GSLs Table name 6.9.1- GSLs jurisdictional GSL schemes: Streetlights
Variable name Street lights – number of business days to repair BOP ID ANPAL 1fBOP20
A. Demonstrate how the information provided is consistent with the requirements of the Notice (refer AER 2016 Annual RIN, Appendix A Section 10 – 1.1(a))
Requirements of the Notice: (copy requirements from ‘Definitions’ or ‘Principles and Requirements’ sections of the RIN) The number of street light faults reported by person as not working in the reporting period.
The average number of days to repair street lights that were reported as not working.
Response: (provide affirmation that the above requirements have been met) As per the requirements of the Notice, the average number of days to repair street lights that were reported as not working in the reporting period has been provided for Powercor
B. Source (refer AER 2016 Annual RIN, Appendix A Section 10 – 1.1(b)) Please explain the source from where the data has been obtained (i.e. systems such as GIS, SAP, OAS, Audited financial statements etc.). If the data is not being obtained from the originating source (i.e. it was sourced from a report), the originating source for the data in the report will need to be provided as well. Response: Actual data is extracted from Streetlight Manager (Salesforce) for the reportable period. C. Methodology & Assumptions (refer AER 2016 Annual RIN, Appendix A Section 10 – 1.1(c)) Please explain the methodology applied including any assumptions made to determine the final value populated in the RIN. Where applicable please reference the relevant processes and procedures used. Year Methodology & Assumptions
2014 Extraction from PLFMS listing the average number of days to repair street lights that were reported as not working in the reporting period has been provided for Powercor.

Powercor 2016 Annual RIN Basis of Preparation document.doc Page 88
2015 Extraction from Streetlight Manager (Salesforce) listing the average number of days to repair street lights that were reported as not working in the reporting period has been provided for Powercor.
2016 As per 2015 D. Nil or estimate data (refer AER 2016 Annual RIN, Appendix A Section 10 – 1.1(d)) For those years where it is not possible to provide the data or where data has been estimated or derived from other data, please explain: Year 1. Why it was not possible for Powercor to provide the information required; 2014 N/A 2015 N/A 2016 N/A Year 2. What steps Powercor is taking to ensure it can provide the information in the
future; and 2014 N/A 2015 N/A 2016 N/A Year 3. If an estimate has been provided, the basis of the estimate, including the approach
used, assumptions made and reasons why the estimate is Powercor’s best estimate.
2014 N/A 2015 N/A 2016 N/A

Powercor 2016 Annual RIN Basis of Preparation document.doc Page 89
AER ANNUAL RIN Basis of Preparation (BOP) Template The purpose of this template is to explain, for each Variable, the basis upon which the Businesses prepared information to populate the input cells. It is used to demonstrate to the AER that the information provided is consistent with the requirements of the RIN Notice. This information must be provided for each variable and must be accurately described as it will be audited and provided to the AER. Please use plain English, complete sentences and avoid acronyms. Information table
Template name 6.9 STPIS GSLs Table name 6.9.1- GSLs jurisdictional GSL schemes: Streetlights
Variable name Street lights – GSL payments – number BOP ID ANPAL 1fBOP21
A. Demonstrate how the information provided is consistent with the requirements of the Notice (refer AER 2016 Annual RIN, Appendix A Section 10 – 1.1(a))
Requirements of the Notice: (copy requirements from ‘Definitions’ or ‘Principles and Requirements’ sections of the RIN) Victorian jurisdictional GSL scheme - As per the Victorian Electricity Distribution Code and the Public Lighting Code.
Public Lighting Code Apr 2005 - Where a distributor does not repair a public light within 2 business days of a fault report or a period otherwise agreed between the distributor and the person, it must pay the first person who reported the fault a minimum of $25 if that person is the occupier of an immediately neighbouring residence or is the proprietor of an immediately neighbouring business.
The number of street light faults reported by person who is the occupier of an immediately neighbouring residence or is the proprietor of an immediately neighbouring business as not working in the reporting period.
Response: (provide affirmation that the above requirements have been met) As per the requirements of the Notice, the total number of street light faults not repaired within 2 business days of a fault report or a period otherwise agreed between the distributor and the person who is the first to report it and is the occupier of an immediately neighbouring residence or is the proprietor of an immediately neighbouring business as not working in the reporting period has been provided for Powercor.
B. Source (refer AER 2016 Annual RIN, Appendix A Section 10 – 1.1(b)) Please explain the source from where the data has been obtained (i.e. systems such as GIS, SAP, OAS, Audited financial statements etc.). If the data is not being obtained from the originating source (i.e. it was sourced from a report), the originating source for the data in the report will need to be provided as well. Response: Actual data is extracted from our SAP financial system and collaborated from reporting available in the Streetlight Manager (Salesforce) for the reportable period.

Powercor 2016 Annual RIN Basis of Preparation document.doc Page 90
C. Methodology & Assumptions (refer AER 2016 Annual RIN, Appendix A Section 10 – 1.1(c)) Please explain the methodology applied including any assumptions made to determine the final value populated in the RIN. Where applicable please reference the relevant processes and procedures used. Year Methodology & Assumptions
2014 Extraction from PLFMS listing total number of streetlight faults not repaired within 2 business days or a period otherwise agreed between the distributor and the person who is the first person to report it and is the occupier of an immediately neighbouring residence or is the proprietor of an immediately neighbouring business as not working in the reporting period has been provided for Powercor.
2015 Extraction from SAP financial system to list total GSL’s payments for the reporting period. 2016 As per 2015 D. Nil or estimate data (refer AER 2016 Annual RIN, Appendix A Section 10 – 1.1(d)) For those years where it is not possible to provide the data or where data has been estimated or derived from other data, please explain: Year 1. Why it was not possible for Powercor to provide the information required; 2014 N/A 2015 N/A 2016 N/A Year 2. What steps Powercor is taking to ensure it can provide the information in the
future; and 2014 N/A 2015 N/A 2016 N/A Year 3. If an estimate has been provided, the basis of the estimate, including the approach
used, assumptions made and reasons why the estimate is Powercor’s best estimate.
2014 N/A 2015 N/A 2016 N/A

Powercor 2016 Annual RIN Basis of Preparation document.doc Page 91
AER ANNUAL RIN Basis of Preparation (BOP) Template The purpose of this template is to explain, for each Variable, the basis upon which the Businesses prepared information to populate the input cells. It is used to demonstrate to the AER that the information provided is consistent with the requirements of the RIN Notice. This information must be provided for each variable and must be accurately described as it will be audited and provided to the AER. Please use plain English, complete sentences and avoid acronyms. Information table
Template name 6.9 STPIS GSLs Table name 6.9.1- GSLs jurisdictional GSL schemes: Streetlights
Variable name Street lights – GSL payments – ($) BOP ID ANPAL 1fBOP22
A. Demonstrate how the information provided is consistent with the requirements of the Notice (refer AER 2016 Annual RIN, Appendix A Section 10 – 1.1(a))
Requirements of the Notice: (copy requirements from ‘Definitions’ or ‘Principles and Requirements’ sections of the RIN) Victorian jurisdictional GSL scheme - As per the Victorian Electricity Distribution Code and the Public Lighting Code.
Public Lighting Code Apr 2005 - Where a distributor does not repair a public light within 2 business days of a fault report or a period otherwise agreed between the distributor and the person, it must pay the first person who reported the fault a minimum of $25 if that person is the occupier of an immediately neighbouring residence or is the proprietor of an immediately neighbouring business.
The number of street light faults reported by person who is the occupier of an immediately neighbouring residence or is the proprietor of an immediately neighbouring business as not working in the reporting period.
Response: (provide affirmation that the above requirements have been met) As per the requirements of the Notice, the total amount ($) of GSL’s paid for street light faults not repaired within 2 business days of a fault being report or a period otherwise agreed between the distributor and the person, being the first person to report the fault and is the occupier of an immediately neighbouring residence or is the proprietor of an immediately neighbouring business in the reporting period has been provided for Powercor.
B. Source (refer AER 2016 Annual RIN, Appendix A Section 10 – 1.1(b)) Please explain the source from where the data has been obtained (i.e. systems such as GIS, SAP, OAS, Audited financial statements etc.). If the data is not being obtained from the originating source (i.e. it was sourced from a report), the originating source for the data in the report will need to be provided as well. Response: Actual data is extracted from our SAP financial system and collaborated from reporting available in the Streetlight Manager (Salesforce) for the reportable period.

Powercor 2016 Annual RIN Basis of Preparation document.doc Page 92
C. Methodology & Assumptions (refer AER 2016 Annual RIN, Appendix A Section 10 – 1.1(c)) Please explain the methodology applied including any assumptions made to determine the final value populated in the RIN. Where applicable please reference the relevant processes and procedures used. Year Methodology & Assumptions
2014 Extraction from SAP financial system to list total amount ($) of GSL payments for the reporting period.
2015 Extraction from SAP financial system to list total amount ($) of GSL payments for the reporting period.
2016 As per 2015 D. Nil or estimate data (refer AER 2016 Annual RIN, Appendix A Section 10 – 1.1(d)) For those years where it is not possible to provide the data or where data has been estimated or derived from other data, please explain: Year 1. Why it was not possible for Powercor to provide the information required; 2014 N/A 2015 N/A 2016 N/A Year 2. What steps Powercor is taking to ensure it can provide the information in the
future; and 2014 N/A 2015 N/A 2016 N/A Year 3. If an estimate has been provided, the basis of the estimate, including the approach
used, assumptions made and reasons why the estimate is Powercor’s best estimate.
2014 N/A 2015 N/A 2016 N/A

Powercor 2016 Annual RIN Basis of Preparation document.doc Page 93
2016 AER ANNUAL RIN Basis of Preparation (BOP) Template The purpose of this template is to explain, for each Variable, the basis upon which the Businesses prepared information to populate the input cells. It is used to demonstrate to the AER that the information provided is consistent with the requirements of the RIN Notice. This information must be provided for each variable and must be accurately described as it will be audited and provided to the AER. Please use plain English, complete sentences and avoid acronyms.
Template name 6.9 STPIS GSLs Table name Table 6.9.1: GSLs- jurisdiction GSL schemes
Variable name Planned Interruptions – 4 business days’ notice not given BOP ID ANPAL 1fBOP23
A. Demonstrate how the information provided is consistent with the requirements of the Notice (refer AER 2016 Annual RIN, Appendix A Section 10 – 1.1(a))
Requirements of the Notice: (copy requirements from ‘Definitions’ or ‘Principles and Requirements’ sections of the RIN)
Planned interruptions - 4 days’ notice not given
The number of planned interruptions of which customers were given less than four days’ notice. Response: (provide affirmation that the above requirements have been met) The information extracted for the purpose of reporting to the business on a monthly basis along with our requirement to provide accurate figures to the AER Annual RIN report is via 2 methods in 2016. 1 January – 31 May 2017: A customised SAP based system CARE (Customer Action and Response). It provides the business with the number of planned events causing interruptions based upon customer calls to the contact centre. 1 June-31 December 2017: Multiple reporting channels directed to the Network Access Manger including (but not limited to) the following:
• CARE entries (as per Jan 1 to May 31) • Identified via AMI meter power down in Control Centre. • Identified via AMI meter power down in Dispatch Room. • Customers directly approaching field crews.
B. Source (refer AER 2016 Annual RIN, Appendix A Section 10 – 1.1(b)) Please explain the source from where the data has been obtained (i.e. systems such as GIS, SAP, OAS, Audited financial statements etc.). If the data is not being obtained from the originating source (i.e. it was sourced from a report), the originating source for the data in the report will need to be provided as well.
• CARE which is a SAP based system. It is a tractable workflow system that ensures everyone in the business can raise a CARE. The CARE system currently has two CARE administrators who monitor, assess and assign CAREs to relevant members of the business as investigation managers and or responsible managers. Reporting is extracted via the CARE system. It is the responsibility of the investigation managers and responsible managers to ensure data extracted from the system is accurate.

Powercor 2016 Annual RIN Basis of Preparation document.doc Page 94
• (Originating Source) AMI meter power downs occur when an AMI meter is interrupted and it
sends a notification back to the Control Centre and Dispatch Room Outage Management System (OMS). AMI meters which have been notified as part of a planned outage do not display in the OMS. When an AMI powerdown is identified and associated with a planned interruption an email notification is sent to the Network Access Manager for investigation.
• (Originating Source) Customers will often directly approach field crews if their power is interrupted and they identify planned works in the area. These instances are reported back to the Control Centre and an email notification is sent to the Network Access Manager for investigation.
For the period 1 Jan – 31 May CARE is the source data For the period 1 June-31 December the source data is a spreadsheet maintained by the Manager Network Access which utilises the source and originating source data detailed above. C. Methodology & Assumptions (refer AER 2016 Annual RIN, Appendix A Section 10 – 1.1(c)) Please explain the methodology applied including any assumptions made to determine the final value populated in the RIN. Where applicable please reference the relevant processes and procedures used. Year Methodology & Assumptions
2014 Methodology used - It is essential that all information extracted from the CARE system is reviewed and validated at year end. We make no assumptions regarding data it is accurate data extracted from the CARE system.
2015 Methodology used - It is essential that all information extracted from the CARE system is reviewed and validated at year end. Manual adjustments are made however these are based on factual investigations leading to real numbers of customers.
2016 Each identified breach was fully investigated to determine root cause and extent of the breach. This investigation determined the number of customers involved in each breach. The data regarding all breaches 1 Jan – 31 May is maintained in the CARE system and is assumed correct. The data regarding all breaches 1 June – 31 December is kept in a spreadsheet maintained by the Manager Network Access and is assumed to be accurate.
D. Nil or estimate data (refer AER 2016 Annual RIN, Appendix A Section 10 – 1.1(d)) For those years where it is not possible to provide the data or where data has been estimated or derived from other data, please explain: Year 1. Why it was not possible for Powercor to provide the information required; 2014 Nil 2015 Nil 2016 Nil Year 2. What steps Powercor is taking to ensure it can provide the information in the
future; and 2014 Nil 2015 Nil 2016 Nil Year 3. If an estimate has been provided, the basis of the estimate, including the approach
used, assumptions made and reasons why the estimate is Powercor’s best estimate.
2014 Nil
Powercor 2016 Annual RIN Basis of Preparation document.doc Page 95
2015 Nil 2016 Nil

Powercor 2016 Annual RIN Basis of Preparation document.doc Page 96
AER ANNUAL RIN
Basis of Preparation (BOP) Template The purpose of this template is to explain, for each Variable, the basis upon which the Businesses prepared information to populate the input cells. It is used to demonstrate to the AER that the information provided is consistent with the requirements of the RIN Notice. This information must be provided for each variable and must be accurately described as it will be audited and provided to the AER. Please use plain English, complete sentences and avoid acronyms. Information table
Template name 9.5 TUOS 7.8 Avoided TUOS
Table name TUOS Charges (AEMO), Transmission connection fees (Ausnet), Cross boundary network charges, Payments to embedded generators Avoided TUOS payments
Variable name TUoS BOP ID ANFPAL 27BOP43
A. Demonstrate how the information provided is consistent with the requirements of the Notice (refer AER 2016 Annual RIN, Appendix A Section 10 – 1.1(a))
Requirements of the Notice: (copy requirements from ‘Definitions’ or ‘Principles and Requirements’ sections of the RIN) Please reference Appendix A Sections 1-9 of the AER 2016 Annual RIN. Response: (provide affirmation that the above requirements have been met) All expenditures have been reported in accordance with the requirements of the RIN and are:
• Derived and verifiable from the statutory accounts and state fairly the financial position of Powercor
• Directly attributed to standard control services in accordance with the approved Cost Allocation Methodology for the particular regulatory year.
Transmission charges from AEMO, Ausnet (previously SPI Powernet), Jemena and SAPN (previously ETSA) are costs that are incurred to transport energy from the generator to the distribution business via the transmission businesses’ assets. These charges are directly allocated to Powercor and are an allowable pass-through cost under standard control services. Avoided Cost Payments are separately disclosed on this template. Payments are made to embedded generators on Powercor’s distribution network where their generation activities resulted in Powercor avoiding payment for transmission services.
B. Source (refer AER 2016 Annual RIN, Appendix A Section 10 – 1.1(b)) Please explain the source from where the data has been obtained (i.e. systems such as GIS, SAP, OAS, Audited financial statements etc.). If the data is not being obtained from the originating source (i.e. it was sourced from a report), the originating source for the data in the report will need to be provided as well.

Powercor 2016 Annual RIN Basis of Preparation document.doc Page 97
Response: All Transmission costs (AEMO, Ausnet), Cross boundary network charges (Jemena, SAPN) and Avoided TUOS payments are recorded at the time of being invoiced by an eligible embedded generator and may include payments from previous years. Total transmission costs agree to the pass-through costs included in the annual pricing proposal approved by the AER.
C. Methodology & Assumptions (refer AER 2016 Annual RIN, Appendix A Section 10 – 1.1(c)) Please explain for 2016, the methodology applied including any assumptions made to determine the final value populated in the RIN. Where applicable please reference the relevant processes and procedures used. Year Methodology & Assumptions
2014 All transmission costs included in the RIN template are based on actual invoices received. This is the approach taken in the annual pricing proposal which is approved by the AER.
2015 All transmission costs included in the RIN template are based on actual invoices received. This is the approach taken in the annual pricing proposal which is approved by the AER.
2016 All transmission costs included in the RIN template are based on actual invoices received. This is the approach taken in the annual pricing proposal which is approved by the AER.
D. Nil or estimate data (refer AER 2016 Annual RIN, Appendix A Section 10 – 1.1(d)) For those years where it is not possible to provide the data or where data has been estimated or derived from other data, please explain: Year 1. Why it was not possible for Powercor to provide the information required; 2014 NA 2015 NA 2016 NA Year 2. What steps Powercor is taking to ensure it can provide the information in the
future; and 2014 NA 2015 NA 2016 NA Year 3. If an estimate has been provided, the basis of the estimate, including the approach
used, assumptions made and reasons why the estimate is Powercor’s best estimate.
2014 NA 2015 NA 2016 NA

Powercor 2016 Annual RIN Basis of Preparation document.doc Page 98
AER ANNUAL RIN
Basis of Preparation (BOP) Template The purpose of this template is to explain, for each Variable, the basis upon which the Businesses prepared information to populate the input cells. It is used to demonstrate to the AER that the information provided is consistent with the requirements of the RIN Notice. This information must be provided for each variable and must be accurately described as it will be audited and provided to the AER. Please use plain English, complete sentences and avoid acronyms. Information table
Template name 7.10 Juris Scheme Table name Jurisdictional Scheme Payments
Variable name JUoS BOP ID ANFPAL 29BOP45
A. Demonstrate how the information provided is consistent with the requirements of the Notice (refer AER 2016 Annual RIN, Appendix A Section 10 – 1.1(a))
Requirements of the Notice: (copy requirements from ‘Definitions’ or ‘Principles and Requirements’ sections of the RIN) Please reference Appendix A Sections 1-9 of the AER 2016 Annual RIN. Response: (provide affirmation that the above requirements have been met) All expenditures have been reported in accordance with the requirements of the RIN and are:
• Derived and verifiable from the statutory accounts and state fairly the financial position of Powercor
• Directly attributed to standard control services in accordance with the approved Cost Allocation Methodology for the particular regulatory year.
Jurisdictional Scheme amounts are feed in tariff payments made to customers who have contributed energy onto Powercor’s distribution network. The costs are directly allocated to Powercor and are an allowable pass through cost.
B. Source (refer AER 2016 Annual RIN, Appendix A Section 10 – 1.1(b)) Please explain the source from where the data has been obtained (i.e. systems such as GIS, SAP, OAS, Audited financial statements etc.). If the data is not being obtained from the originating source (i.e. it was sourced from a report), the originating source for the data in the report will need to be provided as well. Response: Jurisdictional scheme amounts for PFIT and TFIT are sourced from monthly CISOV reports. Total jurisdictional scheme payments agree to the ledger account 507600 in SAP excluding the accrual. C. Methodology & Assumptions (refer AER 2016 Annual RIN, Appendix A Section 10 – 1.1(c))

Powercor 2016 Annual RIN Basis of Preparation document.doc Page 99
Please explain for 2016, the methodology applied including any assumptions made to determine the final value populated in the RIN. Where applicable please reference the relevant processes and procedures used. Year Methodology & Assumptions
2014 Jurisdictional scheme amounts for PFIT and TFIT are sourced from monthly CISOV reports. The jurisdictional scheme payments disclosed in this template are cash payments. This is the approach taken in the annual pricing proposal which is approved by the AER The Jurisdictional scheme payments inclusive of accruals are provided in RIN template 16 – Juris Scheme.
2015 Jurisdictional scheme amounts for PFIT and TFIT are sourced from monthly CISOV reports. The jurisdictional scheme payments disclosed in this template are cash payments. This is the approach taken in the annual pricing proposal which is approved by the AER The Jurisdictional scheme payments inclusive of accruals are provided in RIN template 16 – Juris Scheme.
2016 Jurisdictional scheme amounts for PFIT and TFIT are sourced from monthly CISOV reports. The jurisdictional scheme payments disclosed in this template are cash payments. This is the approach taken in the annual pricing proposal which is approved by the AER The Jurisdictional scheme payments exclusive of accruals are provided in RIN template 7.10 Juris Scheme.
D. Nil or estimate data (refer AER 2016 Annual RIN, Appendix A Section 10 – 1.1(d)) For those years where it is not possible to provide the data or where data has been estimated or derived from other data, please explain: Year 1. Why it was not possible for Powercor to provide the information required; 2014 NA 2015 NA 2016 NA Year 2. What steps Powercor is taking to ensure it can provide the information in the
future; and 2014 NA 2015 NA 2016 NA Year 3. If an estimate has been provided, the basis of the estimate, including the approach
used, assumptions made and reasons why the estimate is Powercor’s best estimate.
2014 NA 2015 NA 2016 NA

Powercor 2016 Annual RIN Basis of Preparation document.doc Page 100
AER ANNUAL RIN Basis of Preparation (BOP) Template The purpose of this template is to explain, for each Variable, the basis upon which the Businesses prepared information to populate the input cells. It is used to demonstrate to the AER that the information provided is consistent with the requirements of the RIN Notice. This information must be provided for each variable and must be accurately described as it will be audited and provided to the AER. Please use plain English, complete sentences and avoid acronyms. Information table
Template name 7.11 DMIS-DMIA Table name Table 7.11.1: DMIA – Projects submitted for approval
Variable name No projects reported for 2016 BOP ID ANFPAL 7.11BOP1
A. Demonstrate how the information provided is consistent with the requirements of the Notice (refer AER 2016 Annual RIN, Appendix A Section 1)
Requirements: Please reference Appendix A Sections 1-7 of the AER 2016 Annual RIN. Response: All revenue and expenditures have been reported in accordance with the requirements of the RIN and are:
• Derived and verifiable from the statutory accounts and state fairly the financial position of Powercor.
• Directly attributed to standard control services, alternative control services, negotiated distribution services, in accordance with the approved Cost Allocation Methodology for the particular regulatory year.
B. Source (refer AER 2016 Annual RIN, Appendix A Section 1) Please explain the source from where the data has been obtained (i.e. systems such as GIS, SAP, OAS, Audited financial statements etc.). If the data is not being obtained from the originating source (i.e. it was sourced from a report), the originating source for the data in the report will need to be provided as well. Response: Variables: No projects reported for 2016
• The data for the categories and cost allocations has been sourced from the SAP accounting system. SAP is the primary financial reporting system and is the source of providing the audited statutory accounts for Powercor.
C. Methodology & Assumptions (refer AER 2016 Annual RIN, Appendix A Section 1) Please explain the methodology applied including any assumptions made to determine the final value populated in the RIN. Where applicable please reference the relevant processes and procedures used.

Powercor 2016 Annual RIN Basis of Preparation document.doc Page 101
Year Methodology & Assumptions
2016 Variables: No projects reported for 2016 • The SAP financial system is used to extract the information required by category and
regulatory segment. Using the audited statutory accounts for Powercor, the business uses cost elements within SAP in order to allocate costs & revenues between the regulatory segments in accordance with the cost allocation methodology.
D. Nil or estimate data (refer AER 2016 Annual RIN, Appendix A Section 1) For those years where it is not possible to provide the data or where data has been estimated or derived from other data, please explain: Year 1. Why it was not possible for Powercor to provide the information required; 2016 N/A Year 2. What steps Powercor is taking to ensure it can provide the information in the
future; and 2016 N/A Year 3. If an estimate has been provided, the basis of the estimate, including the approach
used, assumptions made and reasons why the estimate is Powercor’s best estimate.
2016 N/A

Powercor 2016 Annual RIN Basis of Preparation document.doc Page 102
AER ANNUAL RIN Basis of Preparation (BOP) Template The purpose of this template is to explain, for each Variable, the basis upon which the Businesses prepared information to populate the input cells. It is used to demonstrate to the AER that the information provided is consistent with the requirements of the RIN Notice. This information must be provided for each variable and must be accurately described as it will be audited and provided to the AER. Please use plain English, complete sentences and avoid acronyms. Information table
Template name 7.12 Safety and Bushfire Related Expenditure Table name 7.12.1 Safety and bushfire related asset group definitions and allocation
basis 7.12.2.1 Bushfire related – Number of activities 7.12.3.1 Safety related – Number of activities 7.12.3.4 Safety improvement outcomes reported to ESV
Variable name Number of activities, actual volumes BOP ID ANFPAL 22BOP35
A. Demonstrate how the information provided is consistent with the requirements of the Notice
Requirements: Please reference Appendix A Sections 1-9 of the AER 2016 Annual RIN. Response: All expenditures have been reported in accordance with the requirements of the RIN and are:
• Derived and verifiable from the statutory accounts and state fairly the financial position of Powercor.
• Directly attributed to standard control services, alternative control services, negotiated distribution services, unregulated distribution services and metering services provided by Advanced Metering Infrastructure in accordance with the approved Cost Allocation Methodology for the particular regulatory year.
B. Source Please explain the source from where the data has been obtained (i.e. systems such as
GIS, SAP, OAS, Audited financial statements etc.). If the data is not being obtained from the originating source (i.e. it was sourced from a report), the originating source for the data in the report will need to be provided as well.
Response: Variables: Actual Units
• Replacement data has been sourced from SAP. • VBRC Armour Rods and Dampers units are extracted from the AD&R Mobility solution which
sources data from SAP. • VBRC Asset Inspection units sourced from invoices received from Electrix • VBRC Units (Kms) for Spacers - The source data is derived from the contractor invoice

Powercor 2016 Annual RIN Basis of Preparation document.doc Page 103
C. Methodology & Assumptions Please explain the methodology applied including any
assumptions made to determine the final value populated in the RIN. Where applicable please reference the relevant processes and procedures used.
Year Methodology & Assumptions
2014 Variables: Actual Units • All replacement data has been sourced and reported from SAP. • VBRC Armour Rods and Dampers units are extracted from the AD&R Mobility solution
which sources data from SAP. • VBRC Asset Inspection units sourced from invoices received from Electrix • VBRC Units (Kms) for Spacers - The source data is derived from the contractor invoice
divided by the contract survey rate. Variables: AER expected volumes
• AER volumes have been sourced and reported from the 2011-2015 Final Decision. Variables: As approved under pass-through applications
• Volumes sourced and reported as per December 2011 Victorian Bushfire Royal Commission Powercor Australia Pass Through Application
2015 As Per 2014 2016 As Per 2014
In addition to the comments for 2014, during 2015 Powercor began implementing a process where maintenance performed at a site (typically a pole) gets bundled together within SAP. Where possible the bundling process reduces all of the work at a single site into the smallest number of isolated pieces of work at that site. For example if a pole is being replaced, any defective services, pole top structures or any other equipment at that site will be bundled into the pole replacement as a single piece of work and costed to that pole replacement.
As a result of this change in process it is expected that some asset types will increase in total expenditure while others will decrease in expenditure and volume.
For 2016 there is no requirement to provide AER expected volumes or as approved under pass-through applications
D. Nil or estimate data For those years where it is not possible to provide the data or where data has been estimated or derived from other data, please explain: Year 1. Why it was not possible for Powercor to provide the information required; 2014 N/A 2015 N/A 2016 N/A Year 2. What steps Powercor is taking to ensure it can provide the information in the future;
and 2014 N/A 2015 N/A 2016 N/A Year 3. If an estimate has been provided, the basis of the estimate, including the approach
used, assumptions made and reasons why the estimate is Powercor’s best estimate. 2014 N/A 2015 N/A 2016 N/A

Powercor 2016 Annual RIN Basis of Preparation document.doc Page 104
AER ANNUAL RIN Basis of Preparation (BOP) Template The purpose of this template is to explain, for each Variable, the basis upon which the Businesses prepared information to populate the input cells. It is used to demonstrate to the AER that the information provided is consistent with the requirements of the RIN Notice. This information must be provided for each variable and must be accurately described as it will be audited and provided to the AER. Please use plain English, complete sentences and avoid acronyms. Information table
Template name 7.12 Safety and Bushfire Related Expenditure Table name 7.12.2.2 Expenditure
7.12.3.2 Expenditure Variable name Actual $0, Exclusive of margins & overheads, Value of margins & overheads,
Actual $0’s per unit BOP ID ANFPAL 22BOP36
A. Demonstrate how the information provided is consistent with the requirements of the Notice
Requirements: Please reference Appendix A Sections 1-9 of the AER 2016 Annual RIN. Response: All expenditures have been reported in accordance with the requirements of the RIN and are:
• Derived and verifiable from the statutory accounts and state fairly the financial position of Powercor.
• Directly attributed to standard control services, alternative control services, negotiated distribution services, unregulated distribution services and metering services provided by Advanced Metering Infrastructure in accordance with the approved Cost Allocation Methodology for the particular regulatory year.
B. Source Please explain the source from where the data has been obtained (i.e. systems such as
GIS, SAP, OAS, Audited financial statements etc.). If the data is not being obtained from the originating source (i.e. it was sourced from a report), the originating source for the data in the report will need to be provided as well.
Response: Variables: Actual $0
• The SAP financial system is used to extract the information required by category and regulatory segment. Using the audited statutory accounts for Powercor, the business uses cost elements within SAP in order to allocate costs between the regulatory segments in accordance with the cost allocation methodology.
• C. Methodology & Assumptions Please explain the methodology applied including any
assumptions made to determine the final value populated in the RIN. Where applicable please reference the relevant processes and procedures used.

Powercor 2016 Annual RIN Basis of Preparation document.doc Page 105
Year Methodology & Assumptions
2014 Variables: Actual $0 • The SAP financial system is used to extract the information required by category and
regulatory segment. Using the audited statutory accounts for Powercor, the business uses cost elements within SAP in order to allocate costs between the regulatory segments in accordance with the cost allocation methodology.
• Expenditure for non-VBRC replacements has been allocated across categories based on volumes sourced from SAP.
• Incremental maintenance costs for asset inspections have been calculated as per increased requirements of HBRA. Please refer to BOP ID “ANFPAL 15BOP13v1.0” for methodology.
Variables: AER expected expenditure
• AER expected expenditure has been sourced and reported from the 2011 Regulatory Proposal with AER cost escalation applied.
Variables: As approved pass through
• Expenditure sourced and reported as per December 2011 Victorian Bushfire Royal Commission Powercor Australia Pass Through Application
2015 As per 2014 – Where regulatory segments no longer exist, legacy reports that break costs into the legacy regulatory segments have been run to determine costs per segment.
2016 As Per 2015 In addition to the comments for 2015, during 2015 Powercor began implementing a process where maintenance performed at a site (typically a pole) gets bundled together within SAP. Where possible the bundling process reduces all of the work at a single site into the smallest number of isolated pieces of work at that site. For example if a pole is being replaced, any defective services, pole top structures or any other equipment at that site will be bundled into the pole replacement as a single piece of work and costed to that pole replacement.
As a result of this change in process it is expected that some asset types will increase in total expenditure while others will decrease in expenditure and volume. The Safety Related numbers are determined based on a percentage allocation of the Consolidated Line Maintenance Capex and Unplanned Line Maintenance function codes which are applied to the historical safety related function codes which match the categories included in the RIN. For 2016 there is no requirement to provide AER expected expenditure or as approved under pass-through applications
D. Nil or estimate data For those years where it is not possible to provide the data or where data
has been estimated or derived from other data, please explain: Year 1. Why it was not possible for Powercor to provide the information required; 2014 Pole replacement costs are not captured by material and/or voltage within the SAP system. 2015 As per 2014 2016 As per 2014 Year 2. What steps Powercor is taking to ensure it can provide the information in the
future; and 2014 N/A 2015 N/A 2016 N/A
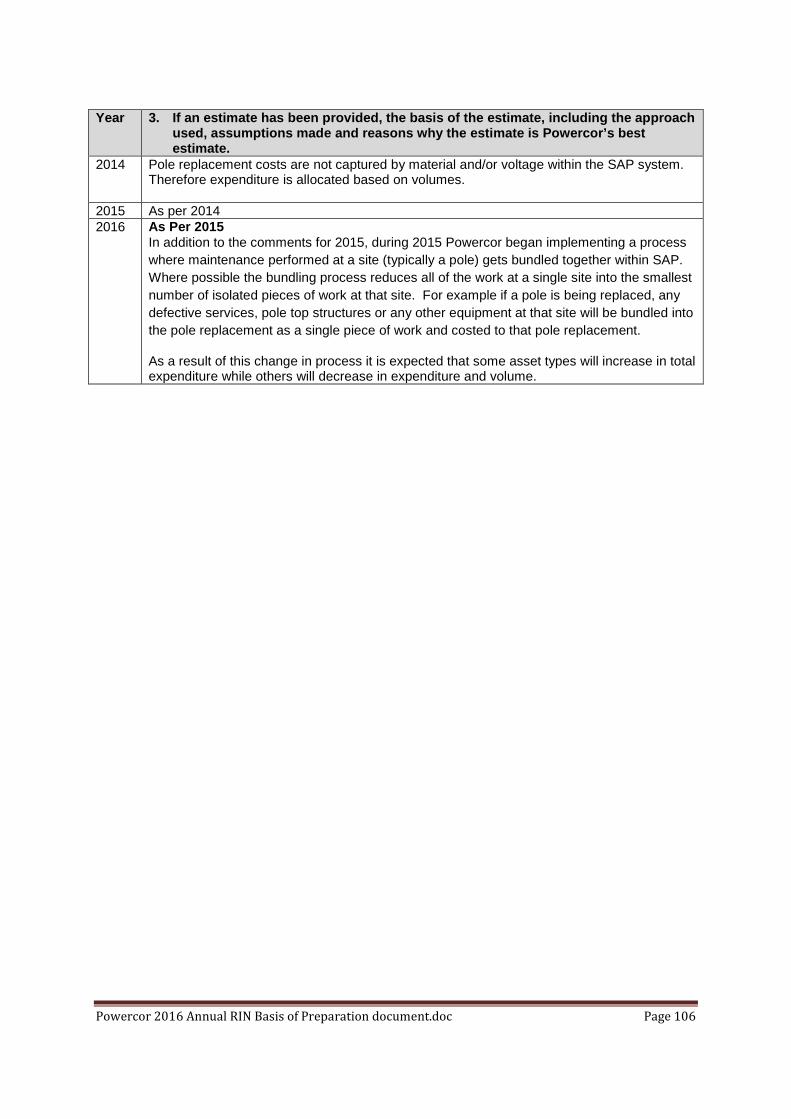
Powercor 2016 Annual RIN Basis of Preparation document.doc Page 106
Year 3. If an estimate has been provided, the basis of the estimate, including the approach
used, assumptions made and reasons why the estimate is Powercor’s best estimate.
2014 Pole replacement costs are not captured by material and/or voltage within the SAP system. Therefore expenditure is allocated based on volumes.
2015 As per 2014 2016 As Per 2015
In addition to the comments for 2015, during 2015 Powercor began implementing a process where maintenance performed at a site (typically a pole) gets bundled together within SAP. Where possible the bundling process reduces all of the work at a single site into the smallest number of isolated pieces of work at that site. For example if a pole is being replaced, any defective services, pole top structures or any other equipment at that site will be bundled into the pole replacement as a single piece of work and costed to that pole replacement.
As a result of this change in process it is expected that some asset types will increase in total expenditure while others will decrease in expenditure and volume.

Powercor 2016 Annual RIN Basis of Preparation document.doc Page 107
AER ANNUAL RIN Basis of Preparation (BOP) Template The purpose of this template is to explain, for each Variable, the basis upon which the Businesses prepared information to populate the input cells. It is used to demonstrate to the AER that the information provided is consistent with the requirements of the RIN Notice. This information must be provided for each variable and must be accurately described as it will be audited and provided to the AER. Please use plain English, complete sentences and avoid acronyms. Information table
Template name 7.12 Safety and Bushfire Related Expenditure Table name 7.12.2.3 Unit Costs
7.12.3.3 Unit Costs
Variable name Actual $0 BOP ID ANFPAL 22BOP37
A. Demonstrate how the information provided is consistent with the requirements of the Notice (refer AER 2016 Annual RIN, Appendix A Section 10 – 1.1(a))
Requirements: Please reference Appendix A Sections 1-9 of the AER 2016 Annual RIN. Response: All expenditures have been reported in accordance with the requirements of the RIN and are:
• Derived and verifiable from the statutory accounts and state fairly the financial position of Powercor.
• Directly attributed to standard control services, alternative control services, negotiated distribution services, unregulated distribution services and metering services provided by Advanced Metering Infrastructure in accordance with the approved Cost Allocation Methodology for the particular regulatory year.
B. Source (refer AER 2016 Annual RIN, Appendix A Section 10 – 1.1(b)) Please explain the source from where the data has been obtained (i.e. systems such as GIS, SAP, OAS, Audited financial statements etc.). If the data is not being obtained from the originating source (i.e. it was sourced from a report), the originating source for the data in the report will need to be provided as well. Response: Unit rates are derived based on a formula of Cost divided by Units, sourced as per above. C. Methodology & Assumptions (refer AER 2016 Annual RIN, Appendix A Section 10 – 1.1(c)) Please explain the methodology applied including any assumptions made to determine the final value populated in the RIN. Where applicable please reference the relevant processes and procedures used. Year Methodology & Assumptions
2014 Variables: Actual $000, AER expected expenditure $000

Powercor 2016 Annual RIN Basis of Preparation document.doc Page 108
• Unit rates are a product of cost divided by volumes as reported in the Safety and Bushfire Related Expenditure template.
2015 As per 2014 2016 As Per 2015
In addition to the comments for 2015, during 2015 Powercor began implementing a process where maintenance performed at a site (typically a pole) gets bundled together within SAP. Where possible the bundling process reduces all of the work at a single site into the smallest number of isolated pieces of work at that site. For example if a pole is being replaced, any defective services, pole top structures or any other equipment at that site will be bundled into the pole replacement as a single piece of work and costed to that pole replacement.
As a result of this change in process it is expected that some asset types will increase in total expenditure while others will decrease in expenditure and volume. This will cause changes in the unit rates compared to previous years For 2016 there is no requirement to provide AER expected expenditure
D. Nil or estimate data (refer AER 2016 Annual RIN, Appendix A Section 10 – 1.1(d)) For those years where it is not possible to provide the data or where data has been estimated or derived from other data, please explain: Year 1. Why it was not possible for Powercor to provide the information required; 2014 N/A 2015 N/A 2016 N/A Year 2. What steps Powercor is taking to ensure it can provide the information in the
future; and 2014 N/A 2015 N/A 2016 N/A Year 3. If an estimate has been provided, the basis of the estimate, including the approach
used, assumptions made and reasons why the estimate is Powercor’s best estimate.
2014 N/A 2015 N/A 2016 N/A

Powercor 2016 Annual RIN Basis of Preparation document.doc Page 109
AER ANNUAL RIN Basis of Preparation (BOP) Template The purpose of this template is to explain, for each Variable, the basis upon which the Businesses prepared information to populate the input cells. It is used to demonstrate to the AER that the information provided is consistent with the requirements of the RIN Notice. This information must be provided for each variable and must be accurately described as it will be audited and provided to the AER. Please use plain English, complete sentences and avoid acronyms. Information table
Template name 7.13 TARC Table name Table 7.13.1: Total Annual Retailer Charges
Variable name TARC BOP ID ANFPAL 7.13BOP1
A. Demonstrate how the information provided is consistent with the requirements of the Notice (refer AER 2016 Annual RIN, Appendix A Section 1)
Requirements: Please reference Appendix A Sections 1-7 of the AER 2016 Annual RIN. Response: All revenue and expenditures have been reported in accordance with the requirements of the RIN and are:
• Derived and verifiable from the statutory accounts and state fairly the financial position of Powercor.
• Directly attributed to standard control services, alternative control services, negotiated distribution services, in accordance with the approved Cost Allocation Methodology for the particular regulatory year.
B. Source (refer AER 2016 Annual RIN, Appendix A Section 1) Please explain the source from where the data has been obtained (i.e. systems such as GIS, SAP, OAS, Audited financial statements etc.). If the data is not being obtained from the originating source (i.e. it was sourced from a report), the originating source for the data in the report will need to be provided as well. Response: Variables: TARC
• The data for the categories and cost allocations has been sourced from the SAP accounting system. SAP is the primary financial reporting system and is the source of providing the audited statutory accounts for Powercor.
C. Methodology & Assumptions (refer AER 2016 Annual RIN, Appendix A Section 1) Please explain the methodology applied including any assumptions made to determine the final value populated in the RIN. Where applicable please reference the relevant processes and procedures used.

Powercor 2016 Annual RIN Basis of Preparation document.doc Page 110
Year Methodology & Assumptions
2016 Variables: TARC • The SAP financial system is used to extract the information required by category and
regulatory segment. Using the audited statutory accounts for Powercor, the business uses cost elements within SAP in order to allocate costs & revenues between the regulatory segments in accordance with the cost allocation methodology.
D. Nil or estimate data (refer AER 2016 Annual RIN, Appendix A Section 1) For those years where it is not possible to provide the data or where data has been estimated or derived from other data, please explain: Year 1. Why it was not possible for Powercor to provide the information required; 2016 N/A Year 2. What steps Powercor is taking to ensure it can provide the information in the
future; and 2016 N/A Year 3. If an estimate has been provided, the basis of the estimate, including the approach
used, assumptions made and reasons why the estimate is Powercor’s best estimate.
2016 N/A

Powercor 2016 Annual RIN Basis of Preparation document.doc Page 111
AER ANNUAL RIN Basis of Preparation (BOP) Template The purpose of this template is to explain, for each Variable, the basis upon which the Businesses prepared information to populate the input cells. It is used to demonstrate to the AER that the information provided is consistent with the requirements of the RIN Notice. This information must be provided for each variable and must be accurately described as it will be audited and provided to the AER. Please use plain English, complete sentences and avoid acronyms. Information table
Template name 8.1 Income Table name Table 8.1.1: Income Statement
Variable name Distribution Revenue, , Cross boundary revenue, Contributions, Interest Income, Jurisdictional Scheme amounts, Profit from sale of Fixed Assets, TUOS Revenue, Pass through revenue (F-Factor), Other Revenue, TUOS expenditure, Avoided TUOS expenditure, Cross boundary expenditure, Depreciation, Finance Charges, Impairment Losses, Jurisdictional scheme amounts, Loss from sale of Fixed Assets, Maintenance expenditure, Operating Expenditure excluding maintenance expenditure, Other, Income Tax Expenses/(Benefit)
BOP ID ANFPAL 8.1BOP1
A. Demonstrate how the information provided is consistent with the requirements of the Notice (refer AER 2016 Annual RIN, Appendix A Section 1)
Requirements: Please reference Appendix A Sections 1-7 of the AER 2016 Annual RIN. Response: All revenue and expenditures have been reported in accordance with the requirements of the RIN and are:
• Derived and verifiable from the statutory accounts and state fairly the financial position of Powercor.
• Directly attributed to standard control services, alternative control services, negotiated distribution services, in accordance with the approved Cost Allocation Methodology for the particular regulatory year.
B. Source (refer AER 2016 Annual RIN, Appendix A Section 1) Please explain the source from where the data has been obtained (i.e. systems such as GIS, SAP, OAS, Audited financial statements etc.). If the data is not being obtained from the originating source (i.e. it was sourced from a report), the originating source for the data in the report will need to be provided as well. Response: Variables: Distribution Revenue, , Cross boundary revenue, Contributions, Jurisdictional Scheme amounts, Profit from sale of Fixed Assets, TUOS Revenue, Pass through revenue (F-Factor), Other Revenue, TUOS expenditure, Avoided TUOS expenditure, Cross boundary expenditure, Impairment Losses, Jurisdictional scheme amounts, Loss from sale of Fixed Assets, Other
• The data for the categories and cost allocations has been sourced from the SAP accounting system. SAP is the primary financial reporting system and is the source of providing the audited statutory accounts for Powercor.
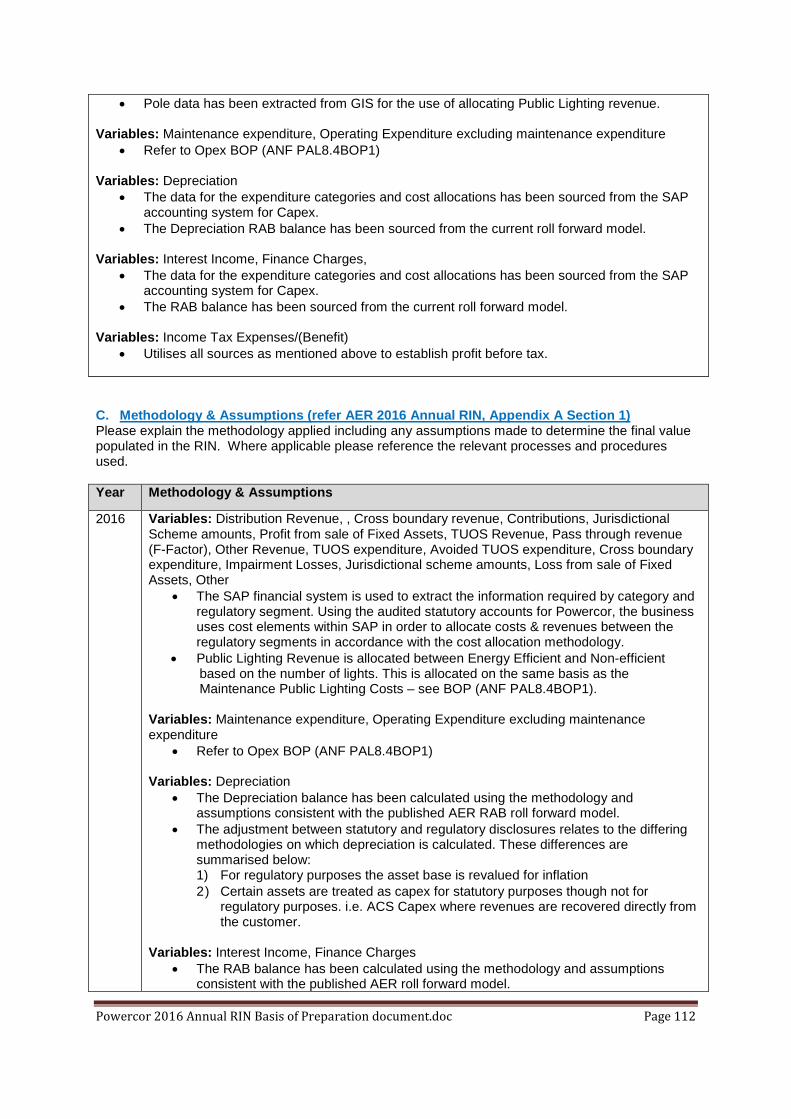
Powercor 2016 Annual RIN Basis of Preparation document.doc Page 112
• Pole data has been extracted from GIS for the use of allocating Public Lighting revenue. Variables: Maintenance expenditure, Operating Expenditure excluding maintenance expenditure
• Refer to Opex BOP (ANF PAL8.4BOP1)
Variables: Depreciation • The data for the expenditure categories and cost allocations has been sourced from the SAP
accounting system for Capex. • The Depreciation RAB balance has been sourced from the current roll forward model.
Variables: Interest Income, Finance Charges,
• The data for the expenditure categories and cost allocations has been sourced from the SAP accounting system for Capex.
• The RAB balance has been sourced from the current roll forward model. Variables: Income Tax Expenses/(Benefit)
• Utilises all sources as mentioned above to establish profit before tax. C. Methodology & Assumptions (refer AER 2016 Annual RIN, Appendix A Section 1) Please explain the methodology applied including any assumptions made to determine the final value populated in the RIN. Where applicable please reference the relevant processes and procedures used. Year Methodology & Assumptions
2016 Variables: Distribution Revenue, , Cross boundary revenue, Contributions, Jurisdictional Scheme amounts, Profit from sale of Fixed Assets, TUOS Revenue, Pass through revenue (F-Factor), Other Revenue, TUOS expenditure, Avoided TUOS expenditure, Cross boundary expenditure, Impairment Losses, Jurisdictional scheme amounts, Loss from sale of Fixed Assets, Other
• The SAP financial system is used to extract the information required by category and regulatory segment. Using the audited statutory accounts for Powercor, the business uses cost elements within SAP in order to allocate costs & revenues between the regulatory segments in accordance with the cost allocation methodology.
• Public Lighting Revenue is allocated between Energy Efficient and Non-efficient based on the number of lights. This is allocated on the same basis as the Maintenance Public Lighting Costs – see BOP (ANF PAL8.4BOP1).
Variables: Maintenance expenditure, Operating Expenditure excluding maintenance expenditure
• Refer to Opex BOP (ANF PAL8.4BOP1) Variables: Depreciation
• The Depreciation balance has been calculated using the methodology and assumptions consistent with the published AER RAB roll forward model.
• The adjustment between statutory and regulatory disclosures relates to the differing methodologies on which depreciation is calculated. These differences are summarised below: 1) For regulatory purposes the asset base is revalued for inflation 2) Certain assets are treated as capex for statutory purposes though not for
regulatory purposes. i.e. ACS Capex where revenues are recovered directly from the customer.
Variables: Interest Income, Finance Charges
• The RAB balance has been calculated using the methodology and assumptions consistent with the published AER roll forward model.

Powercor 2016 Annual RIN Basis of Preparation document.doc Page 113
• Statutory balances for each of these variables have been apportioned using the ratio of the RAB balances between each of the regulatory segments. Note, the RAB balances are only used to allocate the statutory balances and thus are not used to derive the above listed variables.
Variables: Income Tax Expenses/(Benefit)
• Apportions income tax expense as reported in the Statutory Accounts based on the ratio of profit before tax disclosed per regulatory segment in the Income Statement.
D. Nil or estimate data (refer AER 2016 Annual RIN, Appendix A Section 1) For those years where it is not possible to provide the data or where data has been estimated or derived from other data, please explain: Year 1. Why it was not possible for Powercor to provide the information required; 2016 N/A Year 2. What steps Powercor is taking to ensure it can provide the information in the
future; and 2016 N/A Year 3. If an estimate has been provided, the basis of the estimate, including the approach
used, assumptions made and reasons why the estimate is Powercor’s best estimate.
2016 N/A

Powercor 2016 Annual RIN Basis of Preparation document.doc Page 114
AER ANNUAL RIN Basis of Preparation (BOP) Template The purpose of this template is to explain, for each Variable, the basis upon which the Businesses prepared information to populate the input cells. It is used to demonstrate to the AER that the information provided is consistent with the requirements of the RIN Notice. This information must be provided for each variable and must be accurately described as it will be audited and provided to the AER. Please use plain English, complete sentences and avoid acronyms. Information table
Template name 8.2 Capex Table name Table 8.2.1 : Capex by Purpose – Standard Control Services
Variable name Replacement Capex, Augmentation Capex, Connections Capex, VBRC, IT Capex, Other Capex
BOP ID ANFPAL 8.2.1BOP1
A. Demonstrate how the information provided is consistent with the requirements of the Notice (refer AER 2016 Annual RIN, Appendix A Section 1)
Requirements: Please reference Appendix A Sections 1-7 of the AER 2016 Annual RIN. Response: All expenditures have been reported in accordance with the requirements of the RIN and are:
• Derived and verifiable from the statutory accounts and state fairly the financial position of Powercor.
• Directly attributed to standard control services, alternative control services, negotiated distribution services, in accordance with the approved Cost Allocation Methodology for the particular regulatory year.
B. Source (refer AER 2016 Annual RIN, Appendix A Section 1) Please explain the source from where the data has been obtained (i.e. systems such as GIS, SAP, OAS, Audited financial statements etc.). If the data is not being obtained from the originating source (i.e. it was sourced from a report), the originating source for the data in the report will need to be provided as well. Response: Variables: Replacement Capex, Augmentation Capex, Connections Capex, VBRC, IT Capex, Other Capex
• The data for the expenditure categories and cost allocations has been sourced from the SAP accounting system. SAP is the primary financial reporting system and is the source of providing the audited statutory accounts for Powercor.
Variables Forecast (Standard Control Services): Replacement Capex, Augmentation Capex, Connections Capex, VBRC, IT Capex, Other Capex
• Forecast expenditure has been sourced from the 2016-20 Final Determination

Powercor 2016 Annual RIN Basis of Preparation document.doc Page 115
C. Methodology & Assumptions (refer AER 2016 Annual RIN, Appendix A Section 1) Please explain the methodology applied including any assumptions made to determine the final value populated in the RIN. Where applicable please reference the relevant processes and procedures used. Year Methodology & Assumptions
2016 Variables: Replacement Capex, Augmentation Capex, Connections Capex, VBRC, IT Capex, Other Capex
• The SAP financial system is used to extract the information required by category and regulatory segment. Using the audited statutory accounts for Powercor, the business uses cost elements within SAP in order to allocate costs between the regulatory segments in accordance with the cost allocation methodology.
Variables Forecast (Standard Control Services): Replacement Capex, Augmentation Capex, Connections Capex, VBRC, IT Capex, Other Capex
Forecast expenditure has been sourced from the 2016-20 Final Determination
D. Nil or estimate data (refer AER 2016 Annual RIN, Appendix A Section 1) For those years where it is not possible to provide the data or where data has been estimated or derived from other data, please explain: Year 1. Why it was not possible for Powercor to provide the information required; 2016 N/A Year 2. What steps Powercor is taking to ensure it can provide the information in the
future; and 2016 N/A Year 3. If an estimate has been provided, the basis of the estimate, including the approach
used, assumptions made and reasons why the estimate is Powercor’s best estimate.
2016 N/A
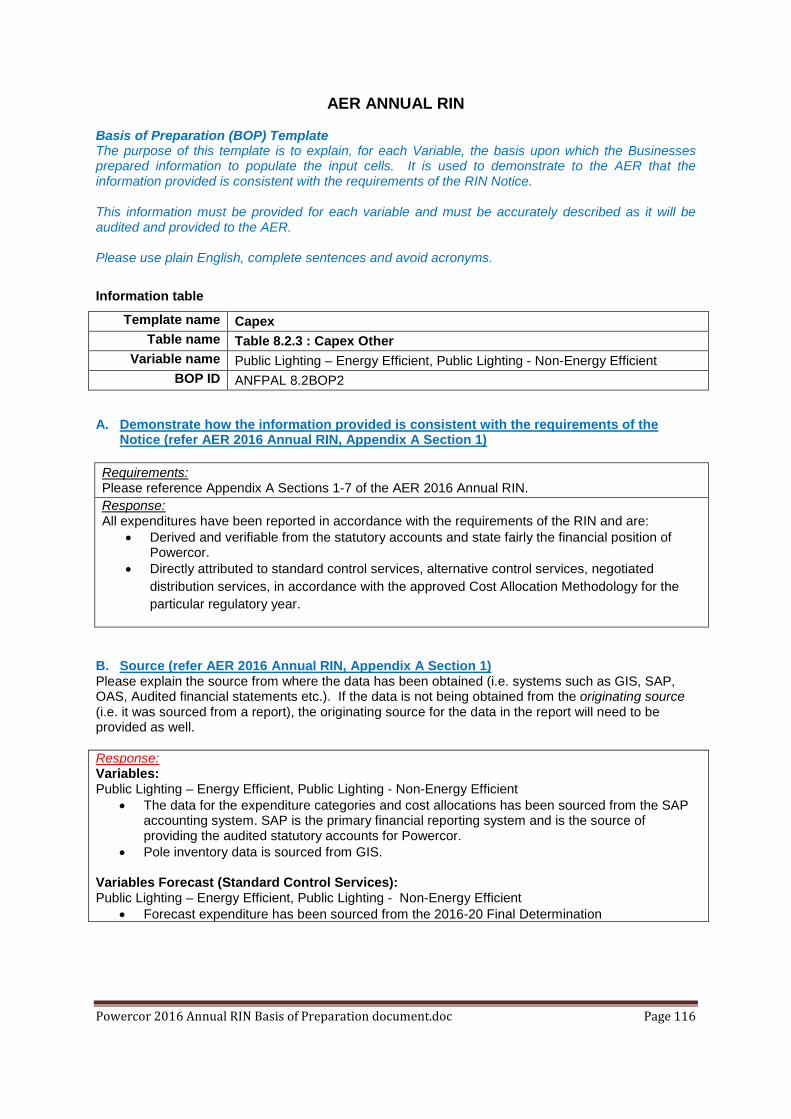
Powercor 2016 Annual RIN Basis of Preparation document.doc Page 116
AER ANNUAL RIN Basis of Preparation (BOP) Template The purpose of this template is to explain, for each Variable, the basis upon which the Businesses prepared information to populate the input cells. It is used to demonstrate to the AER that the information provided is consistent with the requirements of the RIN Notice. This information must be provided for each variable and must be accurately described as it will be audited and provided to the AER. Please use plain English, complete sentences and avoid acronyms. Information table
Template name Capex Table name Table 8.2.3 : Capex Other
Variable name Public Lighting – Energy Efficient, Public Lighting - Non-Energy Efficient BOP ID ANFPAL 8.2BOP2
A. Demonstrate how the information provided is consistent with the requirements of the Notice (refer AER 2016 Annual RIN, Appendix A Section 1)
Requirements: Please reference Appendix A Sections 1-7 of the AER 2016 Annual RIN. Response: All expenditures have been reported in accordance with the requirements of the RIN and are:
• Derived and verifiable from the statutory accounts and state fairly the financial position of Powercor.
• Directly attributed to standard control services, alternative control services, negotiated distribution services, in accordance with the approved Cost Allocation Methodology for the particular regulatory year.
B. Source (refer AER 2016 Annual RIN, Appendix A Section 1) Please explain the source from where the data has been obtained (i.e. systems such as GIS, SAP, OAS, Audited financial statements etc.). If the data is not being obtained from the originating source (i.e. it was sourced from a report), the originating source for the data in the report will need to be provided as well. Response: Variables: Public Lighting – Energy Efficient, Public Lighting - Non-Energy Efficient
• The data for the expenditure categories and cost allocations has been sourced from the SAP accounting system. SAP is the primary financial reporting system and is the source of providing the audited statutory accounts for Powercor.
• Pole inventory data is sourced from GIS.
Variables Forecast (Standard Control Services): Public Lighting – Energy Efficient, Public Lighting - Non-Energy Efficient
• Forecast expenditure has been sourced from the 2016-20 Final Determination

Powercor 2016 Annual RIN Basis of Preparation document.doc Page 117
C. Methodology & Assumptions (refer AER 2016 Annual RIN, Appendix A Section 1) Please explain the methodology applied including any assumptions made to determine the final value populated in the RIN. Where applicable please reference the relevant processes and procedures used. Year Methodology & Assumptions
2016 Variables: Public Lighting – Energy Efficient, Public Lighting - Non-Energy Efficient • The SAP financial system is used to extract the information required by category and
regulatory segment. Using the audited statutory accounts for Powercor, the business uses cost elements within SAP in order to allocate costs between the regulatory segments in accordance with the cost allocation methodology.
• Public Lighting Capex is allocated between Energy Efficient and Non-efficient based on the number of lights.
Variables Forecast (Standard Control Services): Public Lighting – Energy Efficient, Public Lighting - Non-Energy Efficient
• Forecast expenditure has been sourced from the 2016-20 Final Determination
D. Nil or estimate data (refer AER 2016 Annual RIN, Appendix A Section 1) For those years where it is not possible to provide the data or where data has been estimated or derived from other data, please explain: Year 1. Why it was not possible for Powercor to provide the information required; 2016 N/A Year 2. What steps Powercor is taking to ensure it can provide the information in the
future; and 2016 N/A Year 3. If an estimate has been provided, the basis of the estimate, including the approach
used, assumptions made and reasons why the estimate is Powercor’s best estimate.
2016 N/A

Powercor 2016 Annual RIN Basis of Preparation document.doc Page 118
AER ANNUAL RIN Basis of Preparation (BOP) Template The purpose of this template is to explain, for each Variable, the basis upon which the Businesses prepared information to populate the input cells. It is used to demonstrate to the AER that the information provided is consistent with the requirements of the RIN Notice. This information must be provided for each variable and must be accurately described as it will be audited and provided to the AER. Please use plain English, complete sentences and avoid acronyms. Information table
Template name Capex Table name Table 8.2.4 : Capex By Asset Class
Table 8.2.5: Capital Contributions by Asset Class Table 8.2.6: Disposals by Asset Class
Variable name Subtransmission, Distribution system assets, Standard metering, Public lighting, SCADA/Network control, Non-network general assets – IT, Non-network general assets – Other, VBRC, Supervisory cables, Old SWER ACR’s, Land
BOP ID ANFPAL 8.2BOP3
A. Demonstrate how the information provided is consistent with the requirements of the Notice (refer AER 2016 Annual RIN, Appendix A Section 1)
Requirements: Please reference Appendix A Sections 1-7 of the AER 2016 Annual RIN. Response: All expenditures have been reported in accordance with the requirements of the RIN and are:
• Derived and verifiable from the statutory accounts and state fairly the financial position of Powercor.
• Directly attributed to standard control services, alternative control services, negotiated distribution services, in accordance with the approved Cost Allocation Methodology for the particular regulatory year.
B. Source (refer AER 2016 Annual RIN, Appendix A Section 1) Please explain the source from where the data has been obtained (i.e. systems such as GIS, SAP, OAS, Audited financial statements etc.). If the data is not being obtained from the originating source (i.e. it was sourced from a report), the originating source for the data in the report will need to be provided as well. Response: Variables: Subtransmission, Distribution system assets, Standard metering, Public lighting, SCADA/Network control, Non-network general assets – IT, Non-network general assets – Other, VBRC, Supervisory cables, Old SWER ACR’s, Land
• The data for the expenditure categories and cost allocations has been sourced from the SAP accounting system. SAP is the primary financial reporting system and is the source of providing the audited statutory accounts for Powercor.
Variables Forecast (Standard Control Services): Subtransmission, Distribution system assets, Standard metering, Public lighting, SCADA/Network control, Non-network general assets – IT, Non-network general assets – Other, VBRC, Supervisory
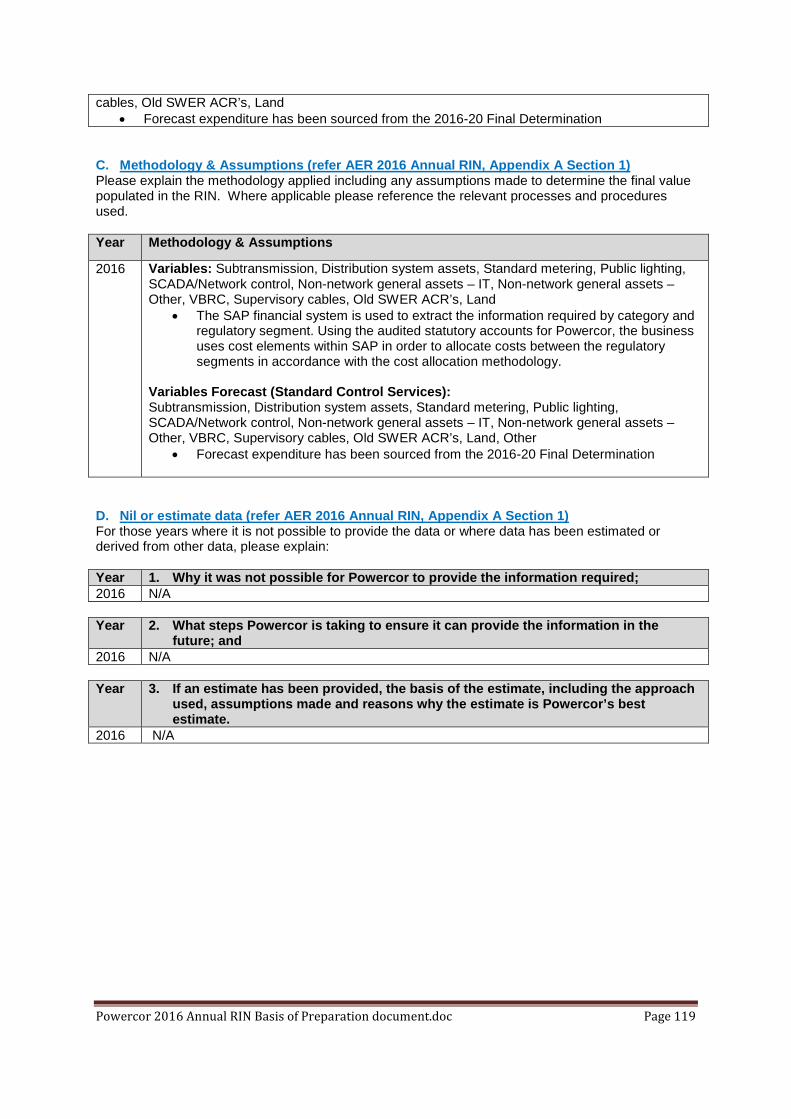
Powercor 2016 Annual RIN Basis of Preparation document.doc Page 119
cables, Old SWER ACR’s, Land • Forecast expenditure has been sourced from the 2016-20 Final Determination
C. Methodology & Assumptions (refer AER 2016 Annual RIN, Appendix A Section 1) Please explain the methodology applied including any assumptions made to determine the final value populated in the RIN. Where applicable please reference the relevant processes and procedures used. Year Methodology & Assumptions
2016 Variables: Subtransmission, Distribution system assets, Standard metering, Public lighting, SCADA/Network control, Non-network general assets – IT, Non-network general assets – Other, VBRC, Supervisory cables, Old SWER ACR’s, Land
• The SAP financial system is used to extract the information required by category and regulatory segment. Using the audited statutory accounts for Powercor, the business uses cost elements within SAP in order to allocate costs between the regulatory segments in accordance with the cost allocation methodology.
Variables Forecast (Standard Control Services): Subtransmission, Distribution system assets, Standard metering, Public lighting, SCADA/Network control, Non-network general assets – IT, Non-network general assets – Other, VBRC, Supervisory cables, Old SWER ACR’s, Land, Other
• Forecast expenditure has been sourced from the 2016-20 Final Determination
D. Nil or estimate data (refer AER 2016 Annual RIN, Appendix A Section 1) For those years where it is not possible to provide the data or where data has been estimated or derived from other data, please explain: Year 1. Why it was not possible for Powercor to provide the information required; 2016 N/A Year 2. What steps Powercor is taking to ensure it can provide the information in the
future; and 2016 N/A Year 3. If an estimate has been provided, the basis of the estimate, including the approach
used, assumptions made and reasons why the estimate is Powercor’s best estimate.
2016 N/A

Powercor 2016 Annual RIN Basis of Preparation document.doc Page 120
AER ANNUAL RIN Basis of Preparation (BOP) Template The purpose of this template is to explain, for each Variable, the basis upon which the Businesses prepared information to populate the input cells. It is used to demonstrate to the AER that the information provided is consistent with the requirements of the RIN Notice. This information must be provided for each variable and must be accurately described as it will be audited and provided to the AER. Please use plain English, complete sentences and avoid acronyms. Information table
Template name 8.4 Opex Table name Table 8.4.1: Operating and Maintenance Expenditure – By Purpose
Table 8.4.2: Operating and Maintenance Expenditure – By Purpose – Margins Only
Variable name Routine, Condition based, Emergency, SCADA/Network Control, Other – Standard Control Services, Network Operating Costs, Billing & Revenue Collection, Advertising/Marketing, Customer Service, Regulatory, Regulatory Reset, IT, License Fee, GSL Payments, Non-network alternative costs, debt Raising Costs, Other Operating – Standard Control Services, Public Lighting, Connection Services, Metering Services, Ancillary Network Services Negotiated Services
BOP ID ANFPAL 8.4BOP1
A. Demonstrate how the information provided is consistent with the requirements of the Notice (refer AER 2016 Annual RIN, Appendix A Section 1)
Requirements: Please reference Appendix A Sections 1-7 of the AER 2016 Annual RIN. Response: All expenditures have been reported in accordance with the requirements of the RIN and are:
• Derived and verifiable from the statutory accounts and state fairly the financial position of Powercor.
• Directly attributed to standard control services, alternative control services, negotiated distribution services, in accordance with the approved Cost Allocation Methodology for the particular regulatory year.
B. Source (refer AER 2016 Annual RIN, Appendix A Section 1) Please explain the source from where the data has been obtained (i.e. systems such as GIS, SAP, OAS, Audited financial statements etc.). If the data is not being obtained from the originating source (i.e. it was sourced from a report), the originating source for the data in the report will need to be provided as well. Response: Variables: SCADA/Network Control, Other – Standard Control Services, Network Operating Costs, Billing & Revenue Collection, Advertising/Marketing, Customer Service, Regulatory, Regulatory Reset, IT, License Fee, GSL Payments, Non-network alternative costs, debt Raising Costs, Other Operating – Standard Control Services, Connection Services, Metering Services, Ancillary Network Services, Negotiated Services
• The data for the expenditure categories and cost allocations has been sourced from the SAP accounting system. SAP is the primary financial reporting system and is the source of providing the audited statutory accounts for Powercor.
Variables: Public Lighting
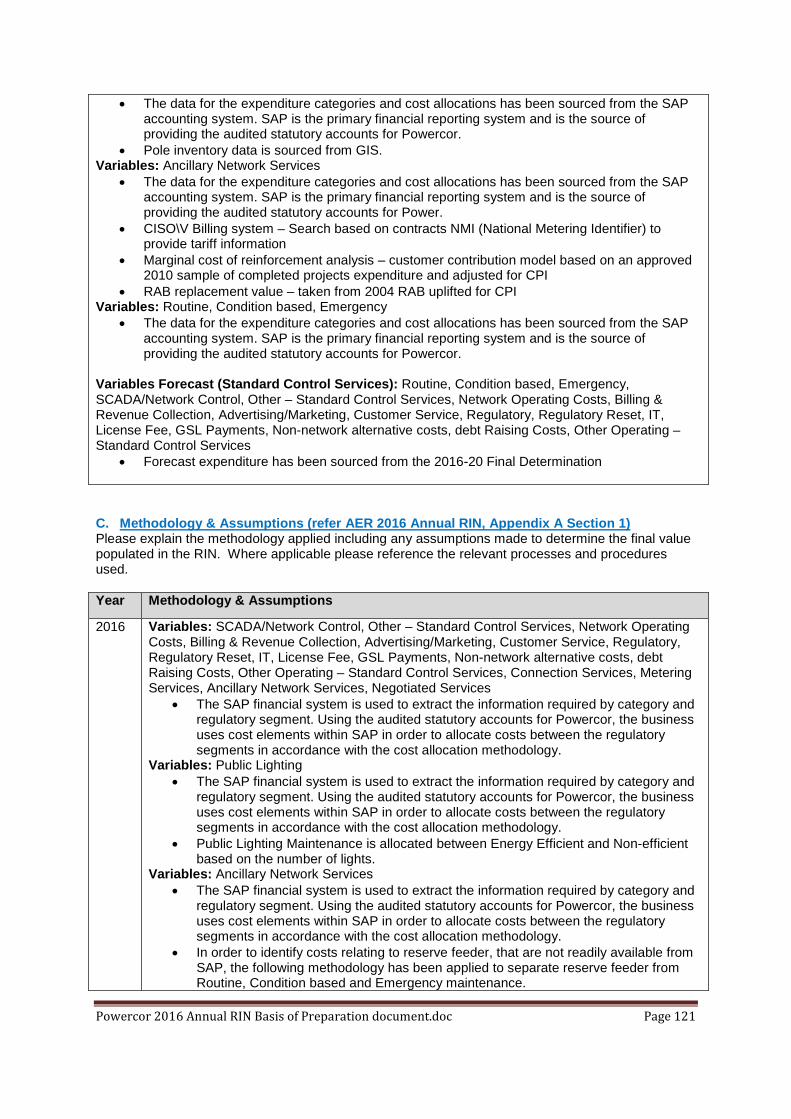
Powercor 2016 Annual RIN Basis of Preparation document.doc Page 121
• The data for the expenditure categories and cost allocations has been sourced from the SAP accounting system. SAP is the primary financial reporting system and is the source of providing the audited statutory accounts for Powercor.
• Pole inventory data is sourced from GIS. Variables: Ancillary Network Services
• The data for the expenditure categories and cost allocations has been sourced from the SAP accounting system. SAP is the primary financial reporting system and is the source of providing the audited statutory accounts for Power.
• CISO\V Billing system – Search based on contracts NMI (National Metering Identifier) to provide tariff information
• Marginal cost of reinforcement analysis – customer contribution model based on an approved 2010 sample of completed projects expenditure and adjusted for CPI
• RAB replacement value – taken from 2004 RAB uplifted for CPI Variables: Routine, Condition based, Emergency
• The data for the expenditure categories and cost allocations has been sourced from the SAP accounting system. SAP is the primary financial reporting system and is the source of providing the audited statutory accounts for Powercor.
Variables Forecast (Standard Control Services): Routine, Condition based, Emergency, SCADA/Network Control, Other – Standard Control Services, Network Operating Costs, Billing & Revenue Collection, Advertising/Marketing, Customer Service, Regulatory, Regulatory Reset, IT, License Fee, GSL Payments, Non-network alternative costs, debt Raising Costs, Other Operating – Standard Control Services
• Forecast expenditure has been sourced from the 2016-20 Final Determination C. Methodology & Assumptions (refer AER 2016 Annual RIN, Appendix A Section 1) Please explain the methodology applied including any assumptions made to determine the final value populated in the RIN. Where applicable please reference the relevant processes and procedures used. Year Methodology & Assumptions
2016 Variables: SCADA/Network Control, Other – Standard Control Services, Network Operating Costs, Billing & Revenue Collection, Advertising/Marketing, Customer Service, Regulatory, Regulatory Reset, IT, License Fee, GSL Payments, Non-network alternative costs, debt Raising Costs, Other Operating – Standard Control Services, Connection Services, Metering Services, Ancillary Network Services, Negotiated Services
• The SAP financial system is used to extract the information required by category and regulatory segment. Using the audited statutory accounts for Powercor, the business uses cost elements within SAP in order to allocate costs between the regulatory segments in accordance with the cost allocation methodology.
Variables: Public Lighting • The SAP financial system is used to extract the information required by category and
regulatory segment. Using the audited statutory accounts for Powercor, the business uses cost elements within SAP in order to allocate costs between the regulatory segments in accordance with the cost allocation methodology.
• Public Lighting Maintenance is allocated between Energy Efficient and Non-efficient based on the number of lights.
Variables: Ancillary Network Services • The SAP financial system is used to extract the information required by category and
regulatory segment. Using the audited statutory accounts for Powercor, the business uses cost elements within SAP in order to allocate costs between the regulatory segments in accordance with the cost allocation methodology.
• In order to identify costs relating to reserve feeder, that are not readily available from SAP, the following methodology has been applied to separate reserve feeder from Routine, Condition based and Emergency maintenance.

Powercor 2016 Annual RIN Basis of Preparation document.doc Page 122
o Apply a marginal cost of reinforcement to the total demand of Kilo Volt Amps (kvas) for reserve feeder contracts to calculate a total reinforcement cost. Then apply the maintenance percentage which is calculated by taking current year’s maintenance expenditure divided by the current years RAB adjusted for CPI.
Variables: Routine, Condition based, Emergency • The SAP financial system is used to extract the information required by category and
regulatory segment. Using the audited statutory accounts for Powercor, the business uses cost elements within SAP in order to allocate costs between the regulatory segments in accordance with the cost allocation methodology.
• Note: This expenditure is materially sourced from SAP. The only factor impacting reporting of these costs is where amounts have been identified, as above, for asset inspection public lighting and reserve feeder ACS costs within cost elements associated with these activities due to the organisations accounting structure not readily separating these functions.
Variables Forecast (Standard Control Services): Routine, Condition based, Emergency, SCADA/Network Control, Other – Standard Control Services, Network Operating Costs, Billing & Revenue Collection, Advertising/Marketing, Customer Service, Regulatory, Regulatory Reset, IT, License Fee, GSL Payments, Non-network alternative costs, debt Raising Costs, Other Operating – Standard Control Service Standard Control Services
• Forecast expenditure has been sourced from the 2016-20 Final Determination
D. Nil or estimate data (refer AER 2016 Annual RIN, Appendix A Section 10 – 1) For those years where it is not possible to provide the data or where data has been estimated or derived from other data, please explain: Year 1. Why it was not possible for Powercor to provide the information required; 2016 The organisations accounting structure does not readily capture costs relating to reserve
feeder at the required level of detail. Year 2. What steps Powercor is taking to ensure it can provide the information in the
future; and 2016 N/A Year 3. If an estimate has been provided, the basis of the estimate, including the approach
used, assumptions made and reasons why the estimate is Powercor’s best estimate.
2016 Variables: Ancillary Network Services • The organisations accounting structure does not readily capture costs relating to
reserve feeder. The methodology as explained in section C has been applied using actual data variables in order to estimate the implied cost of reserve feeder.