aequitas: a bias and fairness audit toolkit - arxiv.org · contribute to make auditing for bias and...
TRANSCRIPT

arxiv Submitted ; Published
Aequitas: A Bias and Fairness Audit Toolkit
Pedro Saleiro [email protected]
Benedict KuesterLoren HinksonJesse LondonAbby StevensAri AnisfeldKit T. RodolfaRayid Ghani [email protected]
Center for Data Science and Public Policy
University of Chicago
Chicago, IL 60637, USA
Editor:
Abstract
Recent work has raised concerns on the risk of unintended bias in AI systems beingused nowadays that can affect individuals unfairly based on race, gender or religion, amongother possible characteristics. While a lot of bias metrics and fairness definitions have beenproposed in recent years, there is no consensus on which metric/definition should be usedand there are very few available resources to operationalize them. Therefore, despite recentawareness, auditing for bias and fairness when developing and deploying AI systems is notyet a standard practice. We present Aequitas, an open source bias and fairness audit toolkitthat was released in 2018 and it is an intuitive and easy to use addition to the machinelearning workflow, enabling users to seamlessly test models for several bias and fairnessmetrics in relation to multiple population sub-groups. Aequitas facilitates informed andequitable decisions around developing and deploying algorithmic decision making systemsfor both data scientists, machine learning researchers and policymakers.
Keywords: Bias, Fairness, Audit, Ethics, Policy, Data Science Tools
1. Introduction
Artificial Intelligence (AI) based systems are becoming ubiquitous in many different areas ofpractice in our society, from banking and insurance to human resource management, fromcriminal justice and law enforcement to healthcare. These systems are usually based on aMachine Learning (ML) model that is typically optimized for an utility measure focused onefficiency or effectiveness defined by the product managers and decision makers (e.g. AUCor overall accuracy). However, recent scrutiny of such systems such as the Gender Shadesproject Buolamwini and Gebru (2018) about how commercial facial recognition systemshave disparate errors in detecting gender of darker skin women, or Google’s efforts to reducegender bias in machine translation Kuczmarski (2018), has increased awareness aroundpossible unintended biases that AI systems might have against people from specific groups,often under-represented, based on race, gender, religion or age, among other characteristics.
c©2018 University of Chicago.
arX
iv:1
811.
0557
7v2
[cs
.LG
] 2
9 A
pr 2
019
Saleiro, Kuester, Stevens, Anisfeld, Hinkson, London and Ghani
While general purpose AI systems and their unintended biases might seem inoffensivewhen looked detached from specific applications, as the case of general purpose facial recog-nition systems or machine translation, these ML models might have dramatic consequenceswhen applied to policy areas that have a direct impact in peoples lives such as the job mar-ket or surveillance and law enforcement, as demonstrated by the ProPublica article aboutCOMPAS Angwin et al. (2016) and subsequent discussions.
These are daunting times. On one hand the rush for developing and deploying AI hasresulted in remarkable achievements at an astonishing speed in both hardware and softwarefor AI, on the other hand the development of new policies and practices adjusted to thisnew reality of ubiquitous AI, and its ethical implications, has been dramatically slower.
The AI and Data Science research communities have been trying to respond to theseconcerns by 1) developing methods to detect bias and discrimination in AI systems Caldersand Verwer (2010); Dwork et al. (2012); Zemel et al. (2013); Hardt et al. (2016); Zafar et al.(2017b,a), and 2) developing methods to mitigate bias and disparate impact or definingtradeoffs among different criteria Hardt et al. (2016); Kamishima et al. (2011); Feldmanet al. (2015); Kleinberg et al. (2016); Corbett-Davies et al. (2017); Zafar et al. (2017a);Kearns et al. (2017); Noriega-Campero et al. (2018). A lot of this work has focused on asingle disparity measure between only two groups (e.g. female vs male, black vs white),analyzing tradeoffs for a pair of measures, using synthetic datasets, toy UCI data sets, orapplied to a single problem.
There has been very little extensive empirical work done on computing and evaluatinga wide variety of various bias metrics and fairness definitions on real world public policyproblems. There is also no consensus on what happens across policy problems in differentdomains in practice, and what tradeoffs and possible solutions should be used. Moreover,a recent comparative study Friedler et al. (2018) of bias mitigation methods has shownthat fairness interventions might be more brittle than previously thought. We believethat in order for AI to have a beneficial policy impact, the research community has to domore on the applied side of this problem, evaluate and operationalize our methods on realpolicy problems, and provide tools for data scientists and policymakers to help them makeinformed decisions. To overcome these barriers we developed Aequitas, an open source1 biasand fairness audit toolkit that was released in May 2018 2 and it is an intuitive and easy touse addition to the ML workflow, enabling users to seamlessly audit ML models for severalbias and fairness metrics in relation to multiple population sub-groups. Aequitas can beused directly as a Python library, via command line interface or a web application, makingit accessible and friendly to a wide range of users (from data scientists to policymakers).
We believe that systematic audits for bias and fairness is the first step to make in-formed model selection decisions, to better understand the causes of bias against specificgroups, and to create trust in AI among the general population. Aequitas contributes tomake auditing for bias and fairness a standard procedure when developing, maintainingor considering deploying AI systems. Aequitas had an imediate impact in both the datascience and public policy communities and it was featured in a Nature3 news article about“bias detectives”. The web application4 alone has served more than 2400 sessions from1300 unique users, while the source code had an average of 300 views and 20 clones perweek.
1. https://github.com/dssg/aequitas2. https://twitter.com/datascifellows/status/9942041005427834883. https://www.nature.com/articles/d41586-018-05469-34. http://aequitas.dssg.io/
2
Aequitas: A Bias and Fairness Audit Toolkit
2. Related Work
Fairness has been defined has being being accountable on the treatment Pedreshi et al.(2008); Dwork et al. (2012); Luong et al. (2011); Calders and Zliobaite (2013); Hardt et al.(2016) or impact levelKleinberg et al. (2016); Chouldechova (2017); Feldman et al. (2015).There is fairness on the treatment when the sensitive attributes are not explicitly usedin the modeling. Fairness on impact is concerned only with the predictions and can bemeasured using ground-truth label information or not. This work focuses on assessingfairness on the impact using parity based measures.
Impact is a very common notion of fairness in previous work Calders and Verwer(2010); Hardt et al. (2016); Zafar et al. (2017a); Feldman et al. (2015); Zemel et al. (2013);Kamishima et al. (2011); Zafar et al. (2017c). A predictor has parity on impact when thefraction of elements of the group predicted as positive is the same across groups. On theother hand, a predictor has statistical or demographic parity Calders et al. (2009); Luonget al. (2011); Zemel et al. (2013); Dwork et al. (2012); Zliobaite (2015); Zafar et al. (2015);Corbett-Davies et al. (2017) if there is an equal fraction of elements of each group amongall predicted positives, i.e., the “benefits” are equally distributed.
In statistical risk assessment a risk score is considered calibrated, or test-fair Kleinberget al. (2016); Chouldechova (2017) if it has equal precision among different groups (e.g.male vs female) for every value of the predicted risk score. This is a notion similar toequalized odds Hardt et al. (2016), which consists in having equalized false negative rateand false positive rates. When the application gives more importance to the positiveoutcome (“advantage”outcome), Hardt et al.Hardt et al. (2016) propose the notion of equalopportunity, which consists in relaxing the equalized odds notion to just care for the falsenegative rate parity.
Kleinberg et al.Kleinberg et al. (2016), Joseph et al. Joseph et al. (2016) and Choulde-chova Chouldechova (2017) discuss the relation between model calibration, prevalence, falsenegative and false positive rates in risk assessment prediction. Prevalence corresponds tothe fraction of data points labeled as positive on each group. Both authors show that whenthere is calibration and the prevalence is different between groups then it is not possible tohave both equal false positive and negative rates across groups, i.e., balance for the positiveand negative classes.
There is also the notion of individual fairness, which states that similar entities shouldreceive similar predictions regardless of the sensitive attribute. Dwork et al. uses a distancemeasure between entities and tries to model classifiers having similar predictions amongsimilar entities, using a Lipschitz condition. Luong et al. Luong et al. (2011) propose asimilar notion but focused on entities on similarity of entities having a negative outcome.
Previous work in this line of research has not focused on empirical analysis of thedefinitions of bias neither empirical validation of the proposed solutions, being very commonthe use of synthetic datasets, with exception of the use of COMPAS, for obvious reasons.Recent work of Chouldechova et al. Chouldechova et al. (2018) presents a case study ofusing a risk assessment model to predict adverse outcomes based on child maltreatmentreferrals in the state of Pennsylvania.
In the past couple of years there have been released many github repositories dedicatedto bias and fairness in ML. The majority of these repositories comprise ad-hoc analyses andcode implementations of the bias and fairness definitions proposed in the literature. Forexample, FairTest Tramer et al. (2017) focused in the upstream detection of bias by ana-lyzing training sets and checking for correlations between labels and protected attributes.FairML Adebayo (2016) is a library that can be categorized as an attempt to increaseinterpretability of the predictions of black box models with respect to perturbations inthe inputs, and therefore can also be used to measure how different models react to data
3
Saleiro, Kuester, Stevens, Anisfeld, Hinkson, London and Ghani
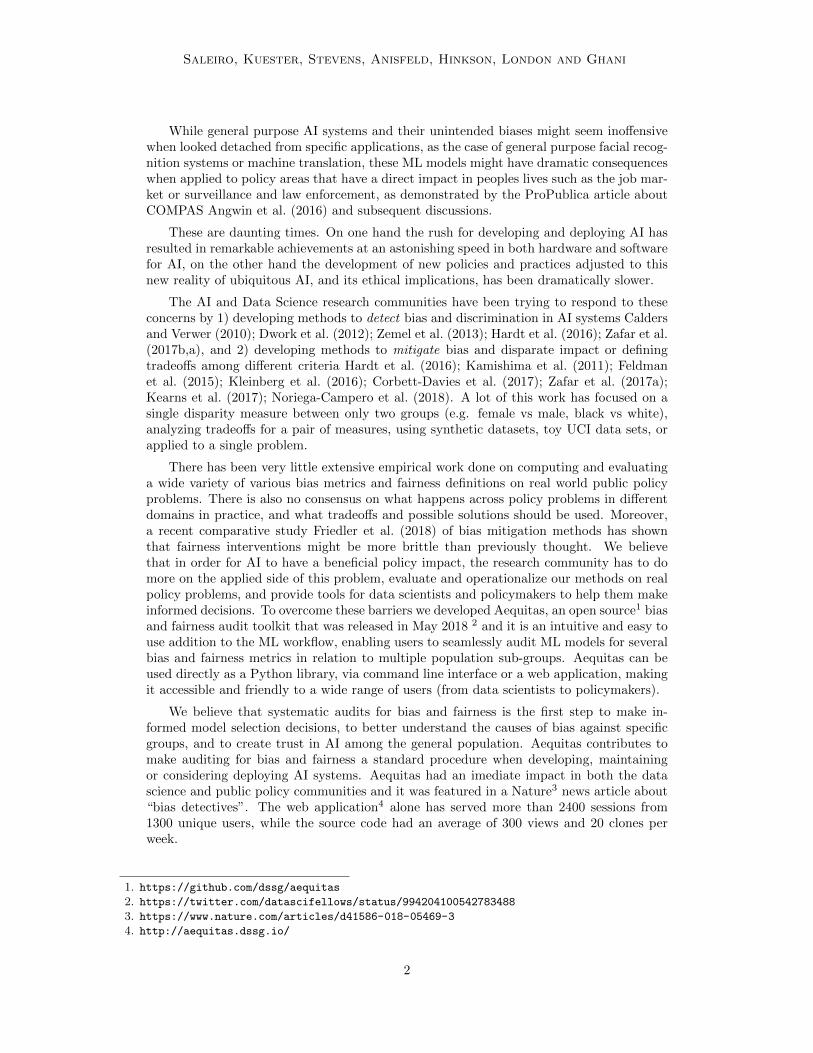
Figure 1: Aequitas in the larger context of the ML pipeline. Audits must be carried inter-nally by data scientists before evaluation and model selection. Policymakers (orclients) must audit externally before accepting a model in production as well asperform periodic audits to detect any fairness degradation over time.
points representing different sub-groups. Fairness Measures Meike Zehlike (2017) providesseveral fairness measures and it is focused on learning to rank problems. It is followedby a website containing the descriptions of the measures implemented in the repository.Recently, IBM released AIFairness360 Bellamy et al. (2018), a general purpose fairnesstoolbox that compiles and implements both detection and the state-of-the-art methods forbias mitigation.
Aequitas distinguishes from the existing open source repositories and toolboxes in twokey aspects. First, bias and fairness are not absolute concepts and are not independentfrom the application scenario, as well as its analysis and interpretation. Aequitas providescomprehensive information on how it should be used in a public policy context, takingthe resulting interventions and its implications into consideration. Second, Aequitas isintended to be used not just by data scientists but also policymakers, and consequentlyprovides seamless integration in the ML workflow but also provides a web app tailored fornon-technical people auditing ML models.
3. Aequitas
Aequitas can audit AI systems to look for biased actions or outcomes that are based onfalse or skewed assumptions about various demographic groups. Using a Python library acommand line interface, users simply upload data from the system being audited, configurebias metrics for protected attribute groups of interest as well as reference groups, and thenthe tool generates bias reports.
3.1 The Audit Paradigm
In Aequitas, bias assessments can be made prior to model selection, evaluating the dispar-ities of the various models trained based on whatever training data was used to tune itfor its task. The audits can be performed prior to a model being operationalized, based
4
Aequitas: A Bias and Fairness Audit Toolkit
on operational data of how biased the model proved to be in holdout data. Or they caninvolve a bit of both, auditing bias in an A/B testing environment in which limited trialsof revised algorithms are evaluated whatever biases were observed in those same systemsin prior production deployments.
Aequitas was designed to be used by two types of users:
1. Data Scientists and AI Researchers: who are building AI systems for use in risk assessmenttools. They will use Aequitas to compare bias measures and check for disparities in differentmodels they are building during the process of model building and selection.
2. Policymakers: who, before “accepting” an AI system to use in policy decision, will run Ae-quitas to understand what biases exist in the system and what (if anything) they need todo in order to mitigate those biases. This process must be carried periodically to assess thefairness degradation through time of a model in production.
Figure 1 puts Aequitas in the context of the ML workflow and shows which type ofuser and when the audits must be carried. The main goal of Aequitas is to make standardthe audit paradigm, i.e., by auditing both internally (data scientists) and externally (poli-cymakers) it forces the different actors to have bias and fairness always into considerationwhen making decisions around model selection, deployment or not, the need to retrain, theneed to collect more and better data, and so on.
3.2 Measuring Bias and Fairness
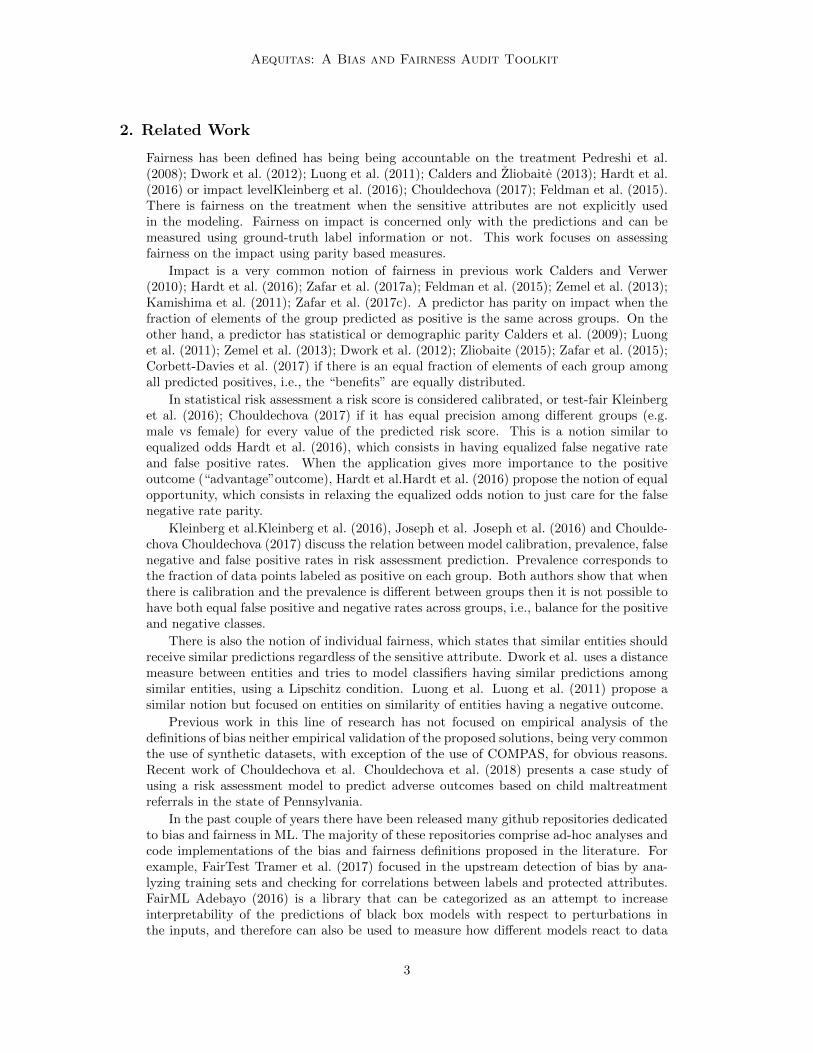
A large number of public policy and social good problems where AI systems are used to helphuman experts make decisions share some common characteristics, including skewed classdistribution, and the metric of interest being precision at top k, as opposed to accuracy orAUC-ROC in many other machine learning problems. This is the case because we oftenhave limited intervention resources, and can only take action on a small number (k) ofentities.
Figure 2: Algorithmic Decision Making timeline for Public Policy and Social Good prob-lems.
The goal of the ML model is to accurately prioritize the top k, which is equivalent tomaximizing the precision at top k. Figure 2 depicts a common timeline of AI systems forpolicy and social good. Based on the risk score (prediction) produced by the ML modelthe entities are ranked, and often with a human expert in the loop, the top k entities areselected to intervene on. These interventions can either be assistive (helping individualswith housing assistance to reduce their risk of future homelessness), or sometimes punitive(housing inspections that would result in fines and repair costs if violations are found).
5
Saleiro, Kuester, Stevens, Anisfeld, Hinkson, London and Ghani
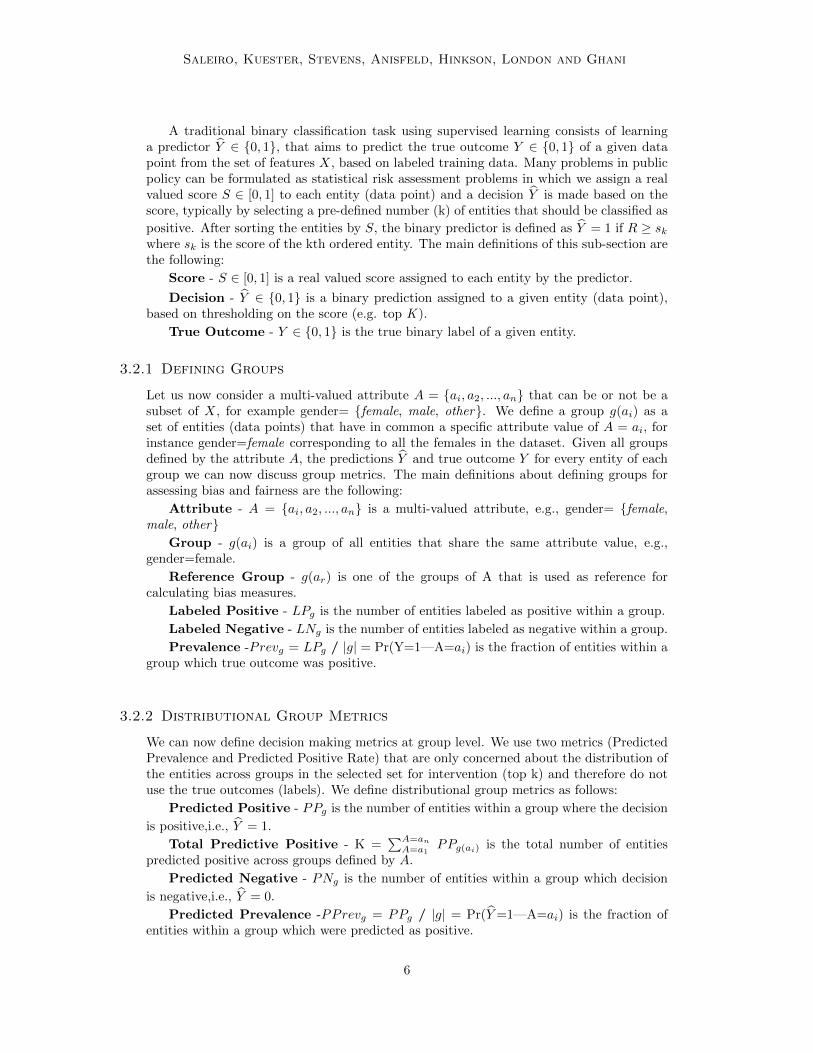
A traditional binary classification task using supervised learning consists of learninga predictor Y ∈ {0, 1}, that aims to predict the true outcome Y ∈ {0, 1} of a given datapoint from the set of features X, based on labeled training data. Many problems in publicpolicy can be formulated as statistical risk assessment problems in which we assign a realvalued score S ∈ [0, 1] to each entity (data point) and a decision Y is made based on thescore, typically by selecting a pre-defined number (k) of entities that should be classified as
positive. After sorting the entities by S, the binary predictor is defined as Y = 1 if R ≥ skwhere sk is the score of the kth ordered entity. The main definitions of this sub-section arethe following:
Score - S ∈ [0, 1] is a real valued score assigned to each entity by the predictor.
Decision - Y ∈ {0, 1} is a binary prediction assigned to a given entity (data point),based on thresholding on the score (e.g. top K ).
True Outcome - Y ∈ {0, 1} is the true binary label of a given entity.
3.2.1 Defining Groups
Let us now consider a multi-valued attribute A = {ai, a2, ..., an} that can be or not be asubset of X, for example gender= {female, male, other}. We define a group g(ai) as aset of entities (data points) that have in common a specific attribute value of A = ai, forinstance gender=female corresponding to all the females in the dataset. Given all groupsdefined by the attribute A, the predictions Y and true outcome Y for every entity of eachgroup we can now discuss group metrics. The main definitions about defining groups forassessing bias and fairness are the following:
Attribute - A = {ai, a2, ..., an} is a multi-valued attribute, e.g., gender= {female,male, other}
Group - g(ai) is a group of all entities that share the same attribute value, e.g.,gender=female.
Reference Group - g(ar) is one of the groups of A that is used as reference forcalculating bias measures.
Labeled Positive - LPg is the number of entities labeled as positive within a group.
Labeled Negative - LNg is the number of entities labeled as negative within a group.
Prevalence -Prevg = LPg / |g| = Pr(Y=1—A=ai) is the fraction of entities within agroup which true outcome was positive.
3.2.2 Distributional Group Metrics
We can now define decision making metrics at group level. We use two metrics (PredictedPrevalence and Predicted Positive Rate) that are only concerned about the distribution ofthe entities across groups in the selected set for intervention (top k) and therefore do notuse the true outcomes (labels). We define distributional group metrics as follows:
Predicted Positive - PPg is the number of entities within a group where the decision
is positive,i.e., Y = 1.
Total Predictive Positive - K =∑A=an
A=a1PPg(ai) is the total number of entities
predicted positive across groups defined by A.
Predicted Negative - PNg is the number of entities within a group which decision
is negative,i.e., Y = 0.
Predicted Prevalence -PPrevg = PPg / |g| = Pr(Y=1—A=ai) is the fraction ofentities within a group which were predicted as positive.
6
Aequitas: A Bias and Fairness Audit Toolkit
Predicted Positive Rate - PPRg = PPg / K = Pr(a=ai|Y=1) is the fraction of theentities predicted as positive that belong to a certain group.
3.2.3 Error-based Group Metrics
We now define group metrics that require the true outcome (label) to be calculated. Wefocus on type I (false positives) and type II (false negative) errors across different groups.In the context of public policy and social good the goal is to avoid disproportionate errorsin specific groups. We use four different error-based group metrics defined as follows:
False Positive - FPg is the number of entities of the group with Y = 1 ∧ Y = 0
False Negative - FNg is the number of entities of the group with Y = 0 ∧ Y = 1.
True Positive - TPg is the number of entities of the group with Y = 1 ∧ Y = 1.
True Negative - TNg is the number of entities of the group with Y = 0 ∧ Y = 0.
False Discovery Rate - FDRg = FPg / PPg = Pr(Y=0—Y=1,A=ai) is the fractionof false positives of a group within the predicted positive of the group
False Omission Rate - FORg = FNg / PNg = Pr(Y=1—Y=0,A=ai) is the fractionof false negatives of a group within the predicted negative of the group
False Positive Rate - FPRg = FPg / LNg = Pr(Y=1—Y=0,A=ai) is the fractionof false positives of a group within the labeled negative of the group
False Negative Rate - FNRg = FNg / LPg = Pr(Y=0—Y=1,A=ai) is the fractionof false negatives of a group within the labeled positives of the group
3.2.4 Assessing Group Bias and Fairness on Impact
In the context of public policy and social good we want to avoid providing less benefitsto specific groups of entities, if the intervention is assistive, as well as, avoid hurting morespecific groups, if the intervention is punitive. Therefore we define bias as a disparity mea-sure of group metric values of a given group when compared with a reference group. Thisreference can be selected using different criteria. For instance, one could use the major-ity group (with larger size) across the groups defined by A, or the group with minimumgroup metric value, or the traditional approach of fixing a historically favored group (e.grace:white). The bias measures are applied on a pairwise basis comparing groups definedby a given attribute A = ai. For instance we define Predicted Prevalence Disparity as
PPRevg disp =PPrevai
PPrevar
=Pr(Y=1—A=ai)
Pr(Y=1—A=ar)(1)
and False Positive Rate Disparity as:
FPRg disp =FPRai
FPRar
=Pr(Y=1 — Y=0,A=ai)
Pr(Y=1 — Y=0,A=ar)(2)
We use parity based measures of impact fairness. Our formulation and implementationof fairness is flexible as it relies on a real valued parameter τ ∈ (0, 1] to control the rangeof disparity values that can be considered fair. One example, of formulation of disparity isusing the “‘80% rule” represented by τ = 0.8. A predictor must be as fair as the maximumvalue of the bias across the groups defined by A allow. This notion of parity requires thatall biases to be within the range defined by τ:
τ ≤ DisparityMeasuregroupi≤ 1
τ(3)
7

Saleiro, Kuester, Stevens, Anisfeld, Hinkson, London and Ghani
The different fairness measures vary in importance to the end-user based on the costand impact of the intervention. If the interventions are very expensive or could hurt theindividuals, then we would want to minimize false positives (focusing on the False DiscoveryRate and/or the False Positive Rate). If the interventions are predominantly assistive, weshould be more concerned with false negatives (focusing on the False Omission Rate and/orthe False Negative Rate).
3.3 Gaps and Barriers
The main barrier we have witnessed in the adoption of audits for bias and fairness has beenin creating a systematic and sustained interaction and efforts between the policymakersand the data scientists/AI researchers who develop the AI systems. AI and data scienceare relatively new fields where there is no established tradition in studying the ethicalconsequences of the usage of biased models. At the same time, policymakers have littleexperience in dealing with AI and are not technically equipped to make specific designdecisions. Consequently, although the need for audit bias and fairness might sound obvious,it is not a standard practice nowadays. Aequitas is a step forward in that direction.
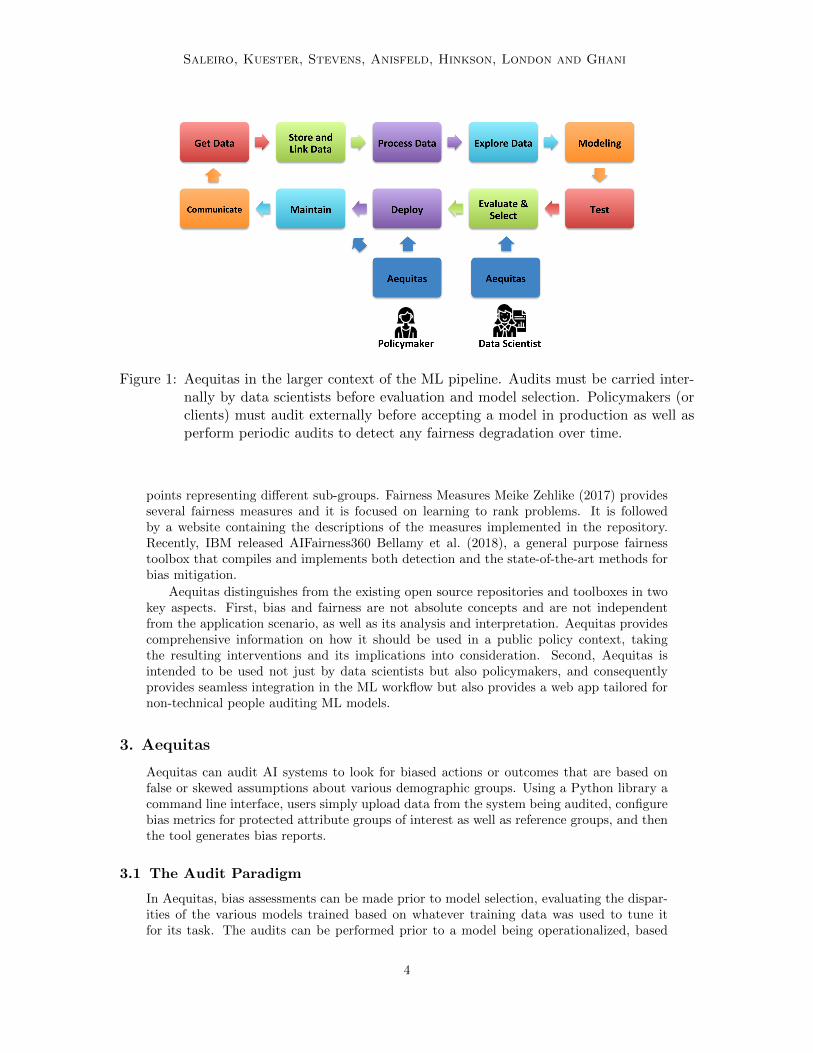
Before releasing Aequitas, we asked both data scientists and policymakers to use thetoolkit in real-world projects to collect feedback. Interestingly, both types of users com-plained that it was hard to navigate in so many different metrics and there was no guidancein how to link the different metrics and the real-world problem in hand. Therefore, we de-signed the “Fairness Tree” (Fig. 3) in collaboration with policymakers, which represent acomplete navigation of the most relevant bias metrics implemented in Aequitas. It is de-signed from the decision maker perspective and assume that there are fundamental policyoptions that the decision maker has decided in the beginning of a data science/AI project.For instance, the tree asks if the decision maker will carry on interventions based on themodel predicted labels, and if those interventions will help people or if they will hurt peo-ple. This is a friendly way of asking the user if he cares more about disparate distributionof false negatives or false positives.
4. Case Studies
To show the impact of using Aequitas, we build on the Center for Data Science and PublicPolicy experience on large scale data driven problems in public health, criminal justice andpublic safety. We present an extensive empirical comparison of several bias and fairnessmeasures across different real-world public policy projects where algorithmic decision mak-ing systems were trained and used to predict risk scores. To the best of our knowledge thisis the most extensive public disclosure of bias audits performed in real-world ML modelsbeing used in different policy areas.
4.1 Criminal Justice
With millions of people moving through courts and jails every year in the US, the crim-inal justice system is larger than ever. Communities across the country have recognizedthat a relatively small number of these highly vulnerable people cycle repeatedly not justthrough criminal justice system, but also emergency medical services (EMS), hospital emer-gency rooms, homeless shelters, and other public systems, receiving fragmented and un-coordinated care with poor outcomes at great cost. This project with a large US city(referenced redacted for blind review) was aimed at identifying individuals who repeatedlycycle through the criminal justice system and help the city determine tailored, preventativeinterventions for these individuals to reduce their risk of recidivism.
8

Aequitas: A Bias and Fairness Audit Toolkit
Figure 3: Fairness tree helps both data scientists and policymakers to select the fairnessmetric(s) that are relevant to each context.
• Goal: The specific goal was to use historical data about individuals, predict their likelihoodof recidivism in the next 6 months, and match the 150 highest risk individuals with tailored,preventative interventions.
• Data: The data used was criminal justice data for 1.5 Million individuals over the past 10years, primarily consisting of cases and bookings. The analysis focused on around 400,000individuals who had repeated interactions with the criminal justice system.
• Performance Metric: Since the pilot would involve intervening with 150 individuals, weused Precision at the top 150 as our performance metric to optimize.
• Analysis: The analysis involved integrating data from multiple sources using record linkagetechniques, generating over 3000 features (ranging from demographic to behavioral to spatio-temporal aggregations over different time and space resolutions) and building several hundredmodels. We validate our models using temporal cross-validation Hyndman and Athanasopou-los (2014). We split the data into several train-test splits by time, fitting models on allcriminal justice interactions occurring before year t and testing on data occurring in year t+ 6 months. (The 6 month gap between train and test data is due to the outcome window,which can extend 6 months after the last day of year t − 1.) We train and test repeatedlyby moving 6 months forward. Based on this model selection process, we select a model thatoptimizes our metric – with 73% precision at the top 150. We used two baselines to compareit against: 1) random baseline with 4.4% precision and 2) the existing heuristics used by thecity today using past frequency of criminal justice interactions to prioritize individuals, with43% precision.
We now audit the selected model that is ready for deployment for bias.
9
Saleiro, Kuester, Stevens, Anisfeld, Hinkson, London and Ghani
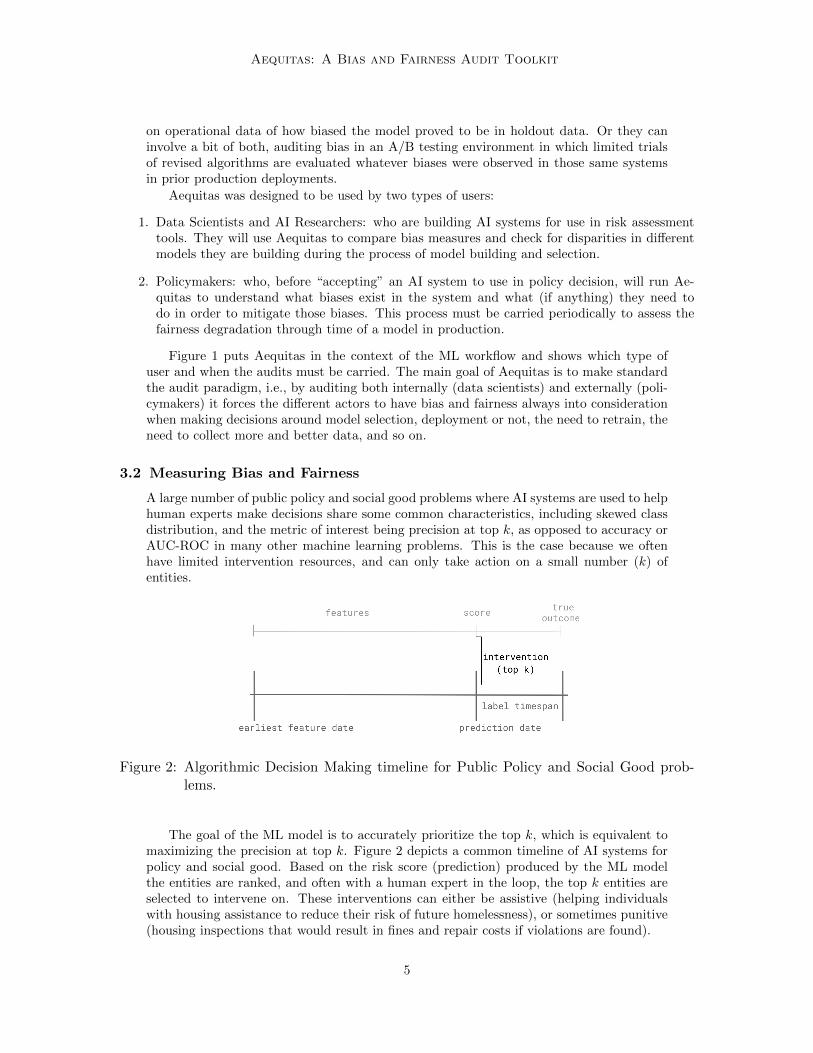
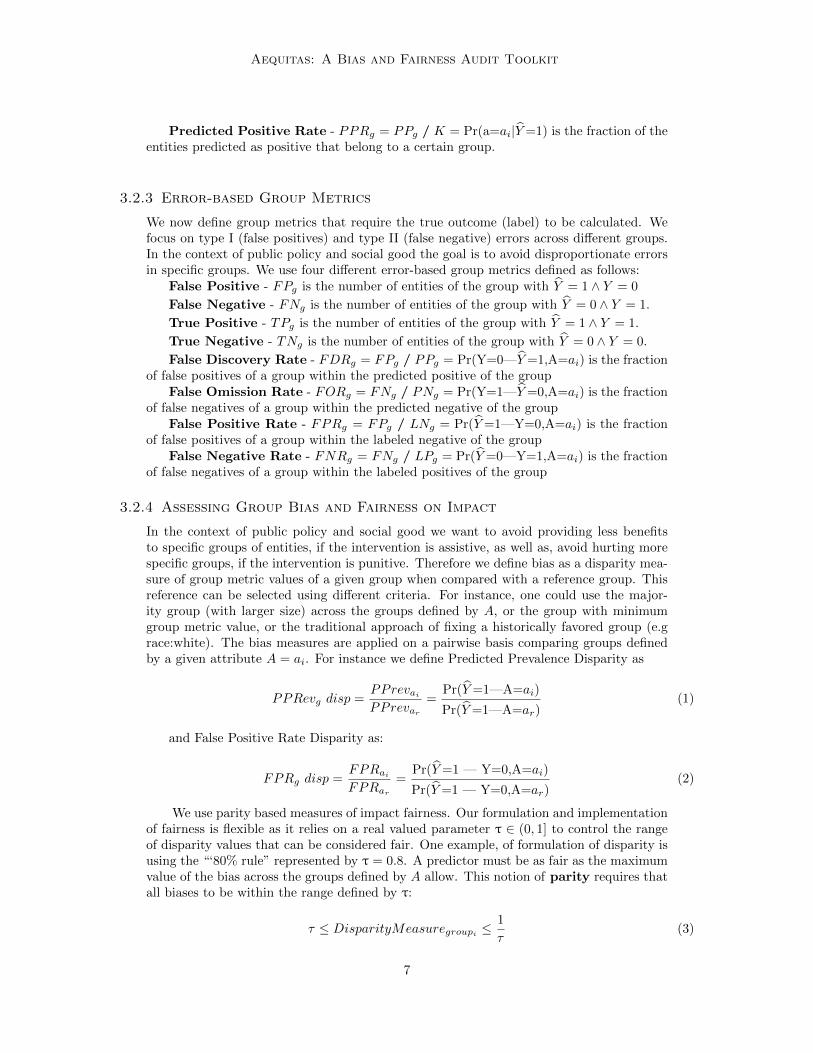
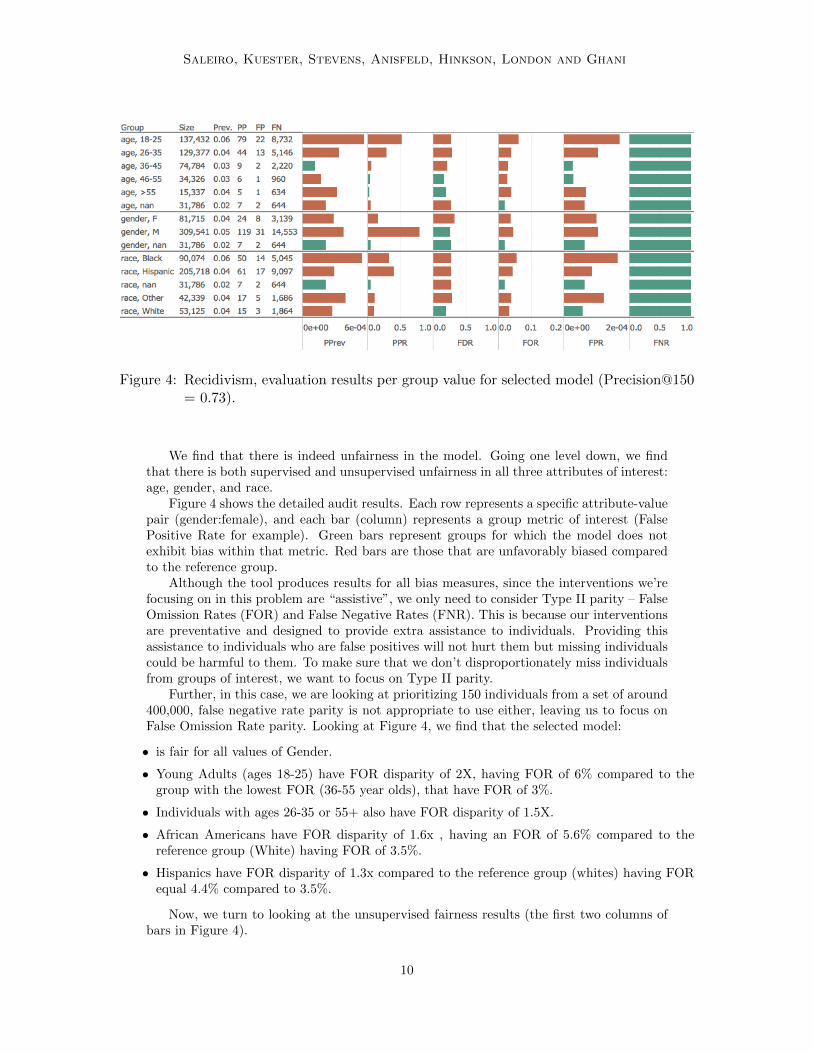
Figure 4: Recidivism, evaluation results per group value for selected model (Precision@150= 0.73).
We find that there is indeed unfairness in the model. Going one level down, we findthat there is both supervised and unsupervised unfairness in all three attributes of interest:age, gender, and race.
Figure 4 shows the detailed audit results. Each row represents a specific attribute-valuepair (gender:female), and each bar (column) represents a group metric of interest (FalsePositive Rate for example). Green bars represent groups for which the model does notexhibit bias within that metric. Red bars are those that are unfavorably biased comparedto the reference group.
Although the tool produces results for all bias measures, since the interventions we’refocusing on in this problem are “assistive”, we only need to consider Type II parity – FalseOmission Rates (FOR) and False Negative Rates (FNR). This is because our interventionsare preventative and designed to provide extra assistance to individuals. Providing thisassistance to individuals who are false positives will not hurt them but missing individualscould be harmful to them. To make sure that we don’t disproportionately miss individualsfrom groups of interest, we want to focus on Type II parity.
Further, in this case, we are looking at prioritizing 150 individuals from a set of around400,000, false negative rate parity is not appropriate to use either, leaving us to focus onFalse Omission Rate parity. Looking at Figure 4, we find that the selected model:
• is fair for all values of Gender.
• Young Adults (ages 18-25) have FOR disparity of 2X, having FOR of 6% compared to thegroup with the lowest FOR (36-55 year olds), that have FOR of 3%.
• Individuals with ages 26-35 or 55+ also have FOR disparity of 1.5X.
• African Americans have FOR disparity of 1.6x , having an FOR of 5.6% compared to thereference group (White) having FOR of 3.5%.
• Hispanics have FOR disparity of 1.3x compared to the reference group (whites) having FORequal 4.4% compared to 3.5%.
Now, we turn to looking at the unsupervised fairness results (the first two columns ofbars in Figure 4).
10
Aequitas: A Bias and Fairness Audit Toolkit
Looking at statistical parity (second column labeled PPR), we find that, in the top 150individuals scored, there are:
• more Males (79%) than Females (16%).
• more Young people (82% under 35) than Older people.
• more African American (33%) and Hispanics (41%) than White (10%).
Looking at Impact parity (first column labeled PPrev), we find that, in the top 150individuals scored, there is Disparate Impact of :
• 5X for Young People (ages 18-35). 0.06% of them are in the top 150 compared to 0.012% ofpeople aged 36-45.
• 2X for African Americans. 0.055% of them are in the top 150 compared to 0.028% for White.
Looking at these bias audit results, it seems that there are some biases present in ourmodel for metrics that we care about. To compare these biases with the current policy beingused by the city, we ran the same analysis again. We don’t show the detailed results becauseof space constraints. The existing approach uses the recent frequency of interactions withthe criminal justice system to prioritized 150 individuals. Analyzing the bias results, wefind that that approach is more biased, not only for the FOR parity, but also for FDRparity.
4.2 Public Health
Retaining individuals living with HIV in care has been shown to be critical in reducingonwards HIV transmission. Individuals retained in care are less likely to develop AIDSand transmit the infection to others and are more likely to have longer lifespans than theirunretained counterparts; yet maintaining quarterly appointments and daily medicationfor a lifetime is exceedingly difficult. This project focuses on the problem of prioritizingindividuals for retention interventions based on their likelihood of dropping out of care. Inpartnership with an HIV clinic and the Department of Public Health of a major US city(referenced redacted for blind review), we have developed a predictive model that providesa risk score for whether a patient will be retained in care at the time of the patient’s doctorvisit. This risk score and additional information extracted from the machine learning modelis then used by the clinic to assign personalized interventions to the patient to increase theirretention likelihood.
• Goal: The goal of this work was to build a point-of-service machine learning system that,at the time of a clinical visit, assesses the HIV patient’s risk of not returning for continuedtreatment, as well as the associated risk factors. The definition of retention used is the patienthaving at least two appointment 90 days apart within a 12 month time period.
• Data: The primary source of data used in the model are the electronic health records of allthe patients receiving care from the HIV Clinic. The patient records span 8 years from 2008 -2016 and include approximately 1,600 patients. This is a rich data source that includes data onall appointments in the health system, hospital encounters, infectious disease specialist visits,visits with other types of physicians, co-morbidities, list of prescribed drugs, opportunisticinfections, substance abuse data, demographic data, location data, lab tests, and doctor’snotes.
• Metric: The HIV Clinic has an estimated capacity to provide interventions for 10% of theirpatients. Thus, we selected models to maximize precision on the top 10% of at-risk patientvisits.
11
Saleiro, Kuester, Stevens, Anisfeld, Hinkson, London and Ghani
• Analysis: We augment the medical records from HIV Clinic with additional information suchas environmental data and crime records. We generate 1600 features from this augmented dataset and tested a number of algorithms, including Decision Trees, Random Forests, LogisticRegression, and Gradient Boosting, with various combinations of hyperparameters.
For each time period, and each model, we calculate the difference in performance (based onour metric – precision at the top 10%) of that model with that of the model that performedthe best in that time period. We then take all the previous time periods (from the date ofdeployment), and select the model whose performance was most consistently closest to that ofthe best model over all time periods. We found that shallow Random Forests with a maximumdepth of 1 and 10,000 estimators tended to work well on this problem.
We compare the performance of the machine learning models to two baselines:
1. Random Baseline: Based on the class priors (fraction of appointments with no follow-up– approximately 10%)
2. Clinician Generated Rules: This expert baseline is meant to mimic an expert (healthpractitioner) making the prediction of whether the patient will remain in care or not.
We find that our machine learning model improves over the expert heuristic model by20%-50%.
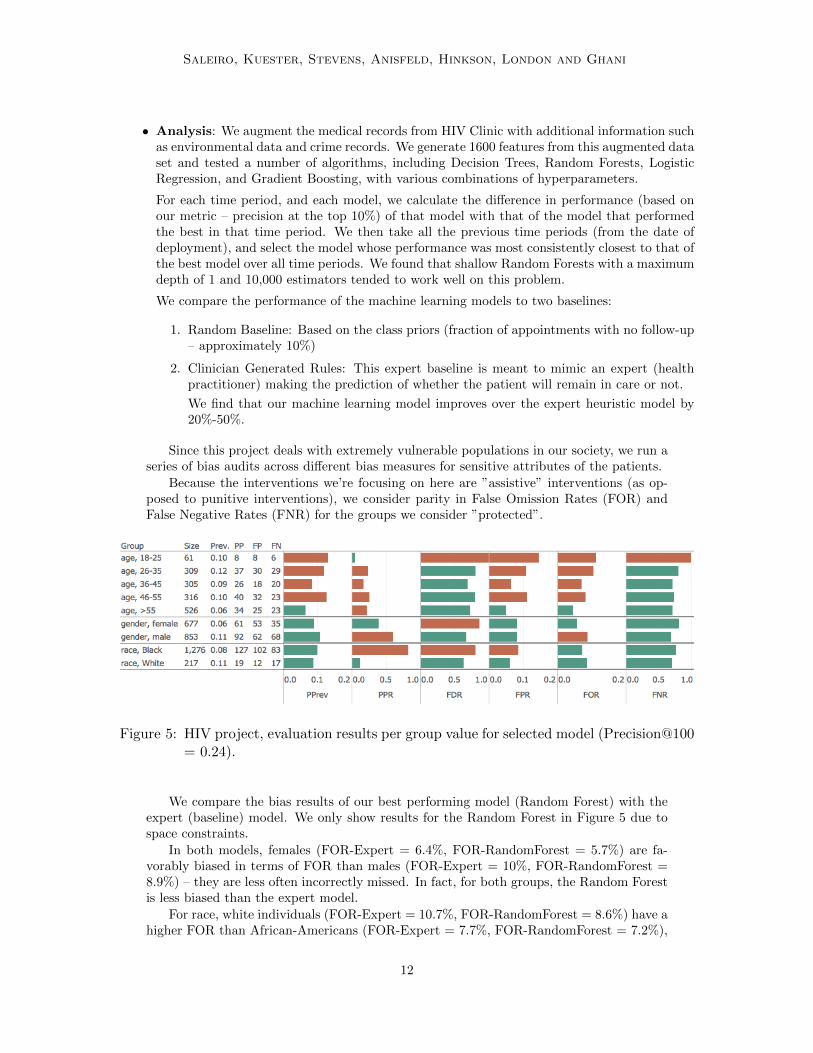
Since this project deals with extremely vulnerable populations in our society, we run aseries of bias audits across different bias measures for sensitive attributes of the patients.
Because the interventions we’re focusing on here are ”assistive” interventions (as op-posed to punitive interventions), we consider parity in False Omission Rates (FOR) andFalse Negative Rates (FNR) for the groups we consider ”protected”.
Figure 5: HIV project, evaluation results per group value for selected model (Precision@100= 0.24).
We compare the bias results of our best performing model (Random Forest) with theexpert (baseline) model. We only show results for the Random Forest in Figure 5 due tospace constraints.
In both models, females (FOR-Expert = 6.4%, FOR-RandomForest = 5.7%) are fa-vorably biased in terms of FOR than males (FOR-Expert = 10%, FOR-RandomForest =8.9%) – they are less often incorrectly missed. In fact, for both groups, the Random Forestis less biased than the expert model.
For race, white individuals (FOR-Expert = 10.7%, FOR-RandomForest = 8.6%) have ahigher FOR than African-Americans (FOR-Expert = 7.7%, FOR-RandomForest = 7.2%),
12

Aequitas: A Bias and Fairness Audit Toolkit
and are more often misclassified as false negatives. The expert model makes this mistaketo a greater degree compared to the Random Forest for both groups.
Another group with high relative FNR is young adults in the age range of 18-25. Thisis especially crucial to be aware of since in the target city, this is a high-risk group.
This in-depth bias audit analysis shows that while there are some possible biases inthe model we’ve developed, these biases are much more pronounced in the expert modelthat is the current approach. We plan to work with the public health policymakers tofurther understand these biases and make an informed policy decision moving forwardbefore deploying this model.
4.3 Public Safety and Policing
Recent high-profile cases of police officers using deadly force against members of the publichave caused a political and public uproar. Adverse events between the police and the publicthus come in many different forms, from deadly use of a weapon to a lack of courtesy paidto a victims family. This project was focused on building a data-driven Early InterventionSystem that would identify police officers at risk of an adverse event in the near future.The police department would use the risk scores to identify officers in need of interventions(additional training, counseling, or other programs). Here, we focus on the models thatwere built and deployed at one of the police departments we worked with, in a major UScity. More details on this project are available in (referenced redacted for blind review).
• Goal: Given the set of all active officers at a given date and all data collected by a policedepartment prior to that date, predict which officers will have an adverse interaction in thenext year.
• Data: The data for this work consists of almost all employee information and event recordscollected by PD to manage its day-to-day operations. This included data from Internal Affairs,Dispatch Events, Criminal Complaints, Citations, Traffic Stops, Arrests, Field Interviews, Em-ployee Records, Secondary Employment, and Training events over the past 15 years, totalingover 20M records.
• Performance Metric: The department had intervention resources to focus on 10% of thepolice force. Thus, we use precision at top 10% as our metric to optimize.
• Analysis: We generated over 400 features and tested various models including RandomForests, Support Vector Machines, Logistic Regression, Gradient Boosted Trees. We usedtemporal cross-validation to perform model selection (similar to what we described in CaseStudy 1) from 2009-2016. Our best performing model is able to flag 10− 15% more high-riskofficers (true positives), while reducing false positive rate by 40% compared to the currentEarly Intervention System being used by PD. The selected model was then put into a pilotin 2016 to validate predictions going forward, and based on the successful pilot, we deployedthis system at PD in November 2017.
We now audit the selected model that was deployed for biases using our Bias AuditTool. At a high level, we find that there is indeed bias in the model. Going one level down,we find that there is bias in all three attributes of interest: gender, race, and marital status.In this problem, we’re interested in both Type 1 and Type II parity, and in FDR parityand FOR parity specifically.
Looking at Figure 6, we find that the selected model:
• is unfavorably biased for Divorced officers, and to a lesser extend, for African American officersin terms of FDR parity.
13

Saleiro, Kuester, Stevens, Anisfeld, Hinkson, London and Ghani
Figure 6: Police Early Intervation System, evaluation results per group value for selectedmodel (Precision@100 = 0.28).
• is slightly unfavorably biased for Females, Divorced, and African American and UnknownRace officer in terms of FOR parity.
Now, we turn to looking at the unsupervised fairness results (the first two columns ofbars in Figure 6).
Looking at statistical parity (second column labeled PPR), we find that, in the top 150individuals scored, there are:
• more Males than Females.
• more Single officers than Divorced or Married.
• more White officers than African-American or unknown race.
Looking at Impact parity (first column labeled PPrev), we find that, in the top 150individuals scored, there is Disparate Impact for :
• 5X for Young People (ages 18-35). 0.06% of them are in the top 150 compared to 0.012% ofpeople aged 36-45.
• 2X for African Americans. 0.055% of them are in the top 150 compared to 0.028% for White.
5. Conclusions and Future Work
AI systems are being increasingly used in problems that can have drastic impact on people’slives in policy areas such as criminal justice, education, public health, workforce develop-ment and social services. In this paper, we presented Aequitas, a toolkit for auditing groupbias and fairness that is tailored to help AI developers and policymakers audit the output ofAI systems for decision making in Public Policy problems. Auditing bias and fairness beforeaccepting an AI system to production might seem a very obvious practice, however it is notyet a standard procedure. Aequitas makes a strong contribution in bringing together datascientists and policymakers to make more equitable decisions around developing, deployingand maintaining ML models in the real-world.
We used Aequitas to perform audit and fairness audit on real-world problems fromthree different policy areas: criminal justice, public health and public safety and policing.Aequitas allowed us to find that many of the ML models deployed for these problems doindeed have biases, but in most of those cases, the alternatives being used by policymakerstoday, are much more biased. The AI systems tend to be more accurate, and either equallyor less biased, in effect improving equity and fairness of the policy. These results suggest
14

Aequitas: A Bias and Fairness Audit Toolkit
that well-audited machine learning models are more effective at both solving the policyproblem as well as reducing inequities.
The work here is a start at building tools for machine learning developers and policy-makers that help them achieve fairness and equity in enacting policies. In addition to thisframework, we also need to develop materials and workshops for both of those audiencesto help them understand the impact of these biases and to make informed policy decisionsin the presence of AI-based decision making.
References
J. A Adebayo. Fairml : Toolbox for diagnosing bias in predictive modeling.https://github.com/adebayoj/fairml, 2016.
Julia Angwin, Jeff Larson, Surya Mattu, and Lauren Kirchner. Machine bias: There’s software usedacross the country to predict future criminals. and it’s biased against blacks. ProPublica, May,23, 2016.
Rachel KE Bellamy, Kuntal Dey, Michael Hind, Samuel C Hoffman, Stephanie Houde, KalapriyaKannan, Pranay Lohia, Jacquelyn Martino, Sameep Mehta, Aleksandra Mojsilovic, et al. Ai fair-ness 360: An extensible toolkit for detecting, understanding, and mitigating unwanted algorithmicbias. arXiv preprint arXiv:1810.01943, 2018.
Joy Buolamwini and Timnit Gebru. Gender shades: Intersectional accuracy disparities in commercialgender classification. In Conference on Fairness, Accountability and Transparency, pages 77–91,2018.
Toon Calders and Sicco Verwer. Three naive bayes approaches for discrimination-free classification.Data Mining and Knowledge Discovery, 21(2):277–292, 2010.
Toon Calders and Indre Zliobaite. Why unbiased computational processes can lead to discriminativedecision procedures. In Discrimination and privacy in the information society, pages 43–57.Springer, 2013.
Toon Calders, Faisal Kamiran, and Mykola Pechenizkiy. Building classifiers with independencyconstraints. In Data mining workshops, 2009. ICDMW’09. IEEE international conference on,pages 13–18. IEEE, 2009.
Alexandra Chouldechova. Fair prediction with disparate impact: A study of bias in recidivismprediction instruments. Big data, 5(2):153–163, 2017.
Alexandra Chouldechova, Diana Benavides-Prado, Oleksandr Fialko, and Rhema Vaithianathan. Acase study of algorithm-assisted decision making in child maltreatment hotline screening decisions.In Conference on Fairness, Accountability and Transparency, pages 134–148, 2018.
Sam Corbett-Davies, Emma Pierson, Avi Feller, Sharad Goel, and Aziz Huq. Algorithmic deci-sion making and the cost of fairness. In Proceedings of the 23rd ACM SIGKDD InternationalConference on Knowledge Discovery and Data Mining, pages 797–806. ACM, 2017.
Cynthia Dwork, Moritz Hardt, Toniann Pitassi, Omer Reingold, and Richard Zemel. Fairnessthrough awareness. In Proceedings of the 3rd innovations in theoretical computer science con-ference, pages 214–226. ACM, 2012.
Michael Feldman, Sorelle A Friedler, John Moeller, Carlos Scheidegger, and Suresh Venkatasubra-manian. Certifying and removing disparate impact. In Proceedings of the 21th ACM SIGKDDInternational Conference on Knowledge Discovery and Data Mining, pages 259–268. ACM, 2015.
15

Saleiro, Kuester, Stevens, Anisfeld, Hinkson, London and Ghani
Sorelle A Friedler, Carlos Scheidegger, Suresh Venkatasubramanian, Sonam Choudhary, Evan PHamilton, and Derek Roth. A comparative study of fairness-enhancing interventions in machinelearning. arXiv preprint arXiv:1802.04422, 2018.
Moritz Hardt, Eric Price, Nati Srebro, et al. Equality of opportunity in supervised learning. InAdvances in neural information processing systems, pages 3315–3323, 2016.
R J Hyndman and G Athanasopoulos. Forecasting: principles and practice:. OTexts, 2014.
Matthew Joseph, Michael Kearns, Jamie H Morgenstern, and Aaron Roth. Fairness in learning:Classic and contextual bandits. In Advances in Neural Information Processing Systems, pages325–333, 2016.
Toshihiro Kamishima, Shotaro Akaho, and Jun Sakuma. Fairness-aware learning through regulariza-tion approach. In Data Mining Workshops (ICDMW), 2011 IEEE 11th International Conferenceon, pages 643–650. IEEE, 2011.
Michael Kearns, Seth Neel, Aaron Roth, and Zhiwei Steven Wu. Preventing fairness gerrymandering:Auditing and learning for subgroup fairness. arXiv preprint arXiv:1711.05144, 2017.
Jon Kleinberg, Sendhil Mullainathan, and Manish Raghavan. Inherent trade-offs in the fair deter-mination of risk scores. arXiv preprint arXiv:1609.05807, 2016.
James Kuczmarski. Reducing gender bias in google translate.https://blog.google/products/translate/reducing-gender-bias-google-translate/, 2018.
Binh Thanh Luong, Salvatore Ruggieri, and Franco Turini. k-nn as an implementation of situationtesting for discrimination discovery and prevention. In Proceedings of the 17th ACM SIGKDDinternational conference on Knowledge discovery and data mining, pages 502–510. ACM, 2011.
Francesco Bonchi Sara Hajian Mohamed Megahed Meike Zehlike, Carlos Castillo. Fairness measures:Datasets and software for detecting algorithmic discrimination. http://fairness-measures.org/,2017.
Alejandro Noriega-Campero, Michiel Bakker, Bernardo Garcia-Bulle, and Alex Pentland. Activefairness in algorithmic decision making. arXiv preprint arXiv:1810.00031, 2018.
Dino Pedreshi, Salvatore Ruggieri, and Franco Turini. Discrimination-aware data mining. In Pro-ceedings of the 14th ACM SIGKDD international conference on Knowledge discovery and datamining, pages 560–568. ACM, 2008.
Florian Tramer, Vaggelis Atlidakis, Roxana Geambasu, Daniel Hsu, Jean-Pierre Hubaux, MathiasHumbert, Ari Juels, and Huang Lin. Fairtest: Discovering unwarranted associations in data-driven applications. In 2017 IEEE European Symposium on Security and Privacy (EuroS&P),pages 401–416. IEEE, 2017.
Muhammad Bilal Zafar, Isabel Valera, Manuel Gomez Rodriguez, and Krishna P Gummadi. Learn-ing fair classifiers. arXiv preprint arXiv:1507.05259, 2015.
Muhammad Bilal Zafar, Isabel Valera, Manuel Gomez Rodriguez, and Krishna P Gummadi. Fair-ness beyond disparate treatment & disparate impact: Learning classification without disparatemistreatment. In Proceedings of the 26th International Conference on World Wide Web, pages1171–1180. International World Wide Web Conferences Steering Committee, 2017a.
16
Aequitas: A Bias and Fairness Audit Toolkit
Muhammad Bilal Zafar, Isabel Valera, Manuel Rodriguez, Krishna Gummadi, and Adrian Weller.From parity to preference-based notions of fairness in classification. In Advances in Neural Infor-mation Processing Systems, pages 228–238, 2017b.
Muhammad Bilal Zafar, Isabel Valera, Manuel Gomez Rogriguez, and Krishna P Gummadi. Fairnessconstraints: Mechanisms for fair classification. In Artificial Intelligence and Statistics, pages 962–970, 2017c.
Rich Zemel, Yu Wu, Kevin Swersky, Toni Pitassi, and Cynthia Dwork. Learning fair representations.In International Conference on Machine Learning, pages 325–333, 2013.
Indre Zliobaite. On the relation between accuracy and fairness in binary classification. arXiv preprintarXiv:1505.05723, 2015.
17
Saleiro, Kuester, Stevens, Anisfeld, Hinkson, London and Ghani
Appendix A. Reproducible Audit
To show the utility of Aequitas, we used it to audit ML models developed at the Centerfor Data Science and Public Policy, University of Chicago, being used to solve problems indifferent domains. However, we are not allowed to share the input data used in the audits.Here we present a short case study of one of our audits using a publicly available dataset (COMPAS) from criminal justice. A Jupyter notebook containing the code to run thisaudit is available at the Aequitas Github repo 5.
The goal of COMPAS was to identify individuals who are at risk of recidivism to supportpretrial release decisions. In a recent widely popularized investigation conducted by a teamat ProPublica, Angwin et al. concluded that it was biased against black defendants.
A.1 Data
The data is based on the Broward County data made publicly available by ProPublica(Angwin et al., 2016). This data set contains COMPAS recidivism risk decile scores, 2-yearrecidivism outcomes, and a number of demographic and variables on 7214 individuals whowere scored in 2013 and 2014.
A.2 Bias Audit using Aequitas
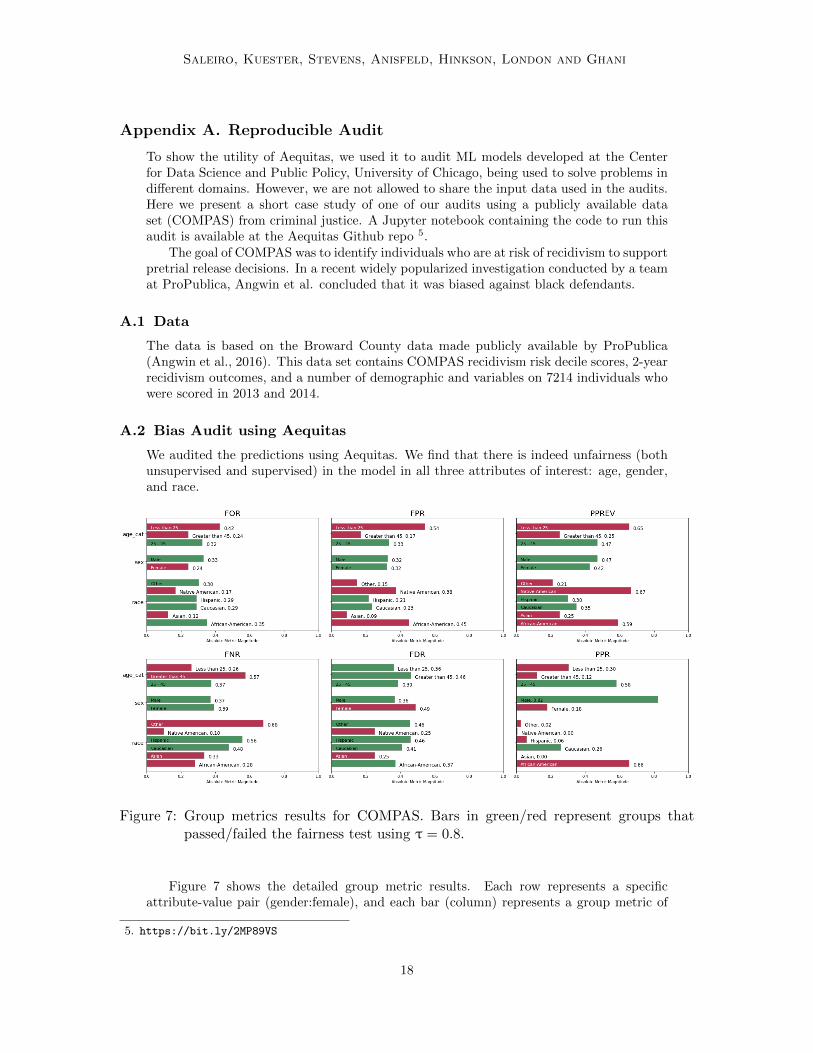
We audited the predictions using Aequitas. We find that there is indeed unfairness (bothunsupervised and supervised) in the model in all three attributes of interest: age, gender,and race.
Figure 7: Group metrics results for COMPAS. Bars in green/red represent groups thatpassed/failed the fairness test using τ = 0.8.
Figure 7 shows the detailed group metric results. Each row represents a specificattribute-value pair (gender:female), and each bar (column) represents a group metric of
5. https://bit.ly/2MP89VS
18
Aequitas: A Bias and Fairness Audit Toolkit
interest (False Positive Rate for example). Green bars represent groups for which themodel does not exhibit bias within that metric. Red bars are those that are unfavor-ably biased compared to the reference group. In this case we used a fairness thresholdτ = 0.8 and the results show that for every metric considered there is some kind of biastowards specific groups. For instance, PPR results show that COMPAS mostly consider ashigh risk people with age 18-25, Males and African-Americans and that compared to eachgroup size, younger people, Native Americans and African-Americans are being selecteddisproportionally.
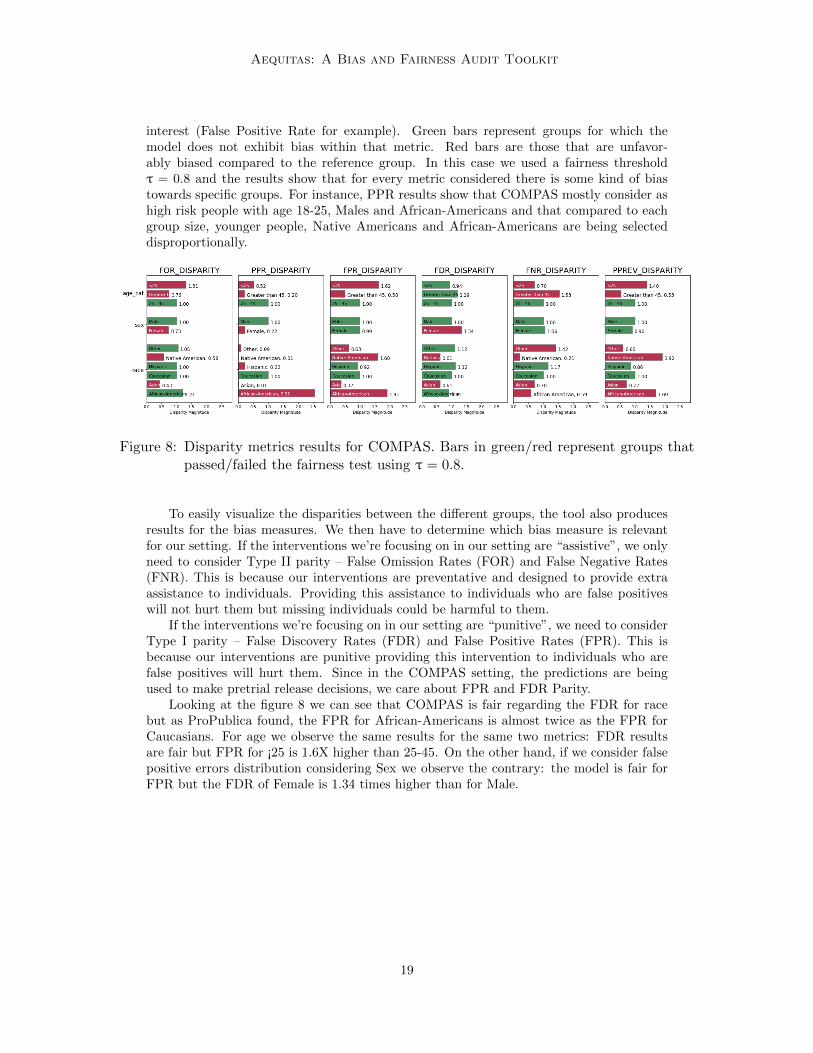
Figure 8: Disparity metrics results for COMPAS. Bars in green/red represent groups thatpassed/failed the fairness test using τ = 0.8.
To easily visualize the disparities between the different groups, the tool also producesresults for the bias measures. We then have to determine which bias measure is relevantfor our setting. If the interventions we’re focusing on in our setting are “assistive”, we onlyneed to consider Type II parity – False Omission Rates (FOR) and False Negative Rates(FNR). This is because our interventions are preventative and designed to provide extraassistance to individuals. Providing this assistance to individuals who are false positiveswill not hurt them but missing individuals could be harmful to them.
If the interventions we’re focusing on in our setting are “punitive”, we need to considerType I parity – False Discovery Rates (FDR) and False Positive Rates (FPR). This isbecause our interventions are punitive providing this intervention to individuals who arefalse positives will hurt them. Since in the COMPAS setting, the predictions are beingused to make pretrial release decisions, we care about FPR and FDR Parity.
Looking at the figure 8 we can see that COMPAS is fair regarding the FDR for racebut as ProPublica found, the FPR for African-Americans is almost twice as the FPR forCaucasians. For age we observe the same results for the same two metrics: FDR resultsare fair but FPR for ¡25 is 1.6X higher than 25-45. On the other hand, if we consider falsepositive errors distribution considering Sex we observe the contrary: the model is fair forFPR but the FDR of Female is 1.34 times higher than for Male.
19