aec vision post-2015: is an asean customs union … vision post-2015: is an asean customs union...
TRANSCRIPT

AEC Vision Post-2015: Is an ASEAN Customs Union Feasible?
Sanchita Basu Das
Institute of Southeast Asian Studies
E-mail: [email protected]
Rahul Sen
Department of Economics, Faculty of Business and Law, Auckland University of Technology
E-mail: [email protected]
Sadhana Srivastava
Department of Economics, Faculty of Business and Law, Auckland University of Technology
E-mail: [email protected]
ISEAS Economics Working Paper No.2015-1
February 2015
Abstract
This paper explores the feasibility of the ASEAN Economic Community (AEC) moving forward to the next step of economic integration, i.e. towards an ASEAN Customs Union (ACU) post-2015. Effectively, the way to progress towards an ASEAN custom Union is by forming it among ASEAN-9 members with Singapore maintaining its existing zero tariff against non-members, thereby creating a Partial ACU. Using applied general equilibrium modelling exercise based on GTAP, the findings suggest that there are potential net positive welfare gains to be collectively reaped by ASEAN if it moves from an AFTA to a partial ACU post-2015. However, not all ASEAN members will individually gain from such an ACU and members may need to potentially devise a mechanism wherein some member country welfare losses in an ACU can be compensated by the members who gain. The paper argues that in spite of political economy challenges due to ASEAN’s unique characteristics and diversity in the levels of economic development among members, such a Partial ACU could be considered by ASEAN leaders due to its strategic imperatives.
Keywords: ASEAN, Customs Union, Common External Tariffs, GTAP
JEL Classification: F12, F13, F15
Institute of Southeast Asian Studies 30 Heng Mui Keng Terrace Pasir Panjang, Singapore 119614 http://www.iseas.edu.sg

1
AEC Vision Post-2015: Is an ASEAN Customs Union Feasible?
Sanchita Basu Das, Rahul Sen and Sadhana Srivastava1
1. Introduction
The month of December 2015 is going to be a milestone in the history of ASEAN
economic cooperation as the leaders of the ten Southeast Asian economies are going to
announce the formation of an ASEAN Community. The idea of an ASEAN Community was
first conceptualised in 1997 as a part of ASEAN Vision 2020, which comprised of the three
pillars of the ASEAN Security Community (ASC)2, the ASEAN Economic Community (AEC)
and the ASEAN Socio-cultural Community (ASCC). Subsequently, at the 2003 ASEAN
Summit in Bali, ASEAN leaders declared the establishment of an AEC by 20203. The objective
of the AEC is “to create a stable, prosperous and highly competitive ASEAN economic region
in which there is a free flow of goods, services, investment and a freer flow of capital, equitable
economic development and reduced poverty and socio-economic disparities in year 2020”. In
January 2007, during the ASEAN Summit in Cebu, Philippines, the deadline to realise the AEC
was brought forward by five years to 2015 (ASEAN Secretariat, 1997; 2003a; 2007a).
Now as ASEAN is nearing its deadline, the discourse is once again on the post-2015
vision and direction for the region as a whole, including the AEC. That said, this paper intends
to undertake an analysis of feasibility of AEC moving forward to the next step of economic
integration, i.e. towards an ASEAN Customs Union (ACU) post-2015. By definition, a customs
union is the second step of economic integration wherein member countries eliminates trade
1 The authors thank Dr. Masahiro Kawai, Dr. Chia Siow Yue, Dr. Jayant Menon and Dr. Pradumna Rana for their detailed comments on an earlier version of the paper presented at a conference organized by the Rajaratnam School of International Studies (RSIS) and the Economic Growth Centre (EGC) of Nanyang Technological University (NTU) on ‘ASEAN’s Long-Term Economic Potential and Vision’ in November 2014.. The authors gratefully acknowledge the research assistance of Ms. Pham Thi Phuong Thao, Research Officer, of the Institute of Southeast Asian Studies, in the preparation of this paper. 2 This pillar is later known as ASEAN Political and Security Community (APSC). 3 This is known as Declaration of ASEAN Concord II or Bali Concord II
2
barriers on their imports of goods & services, and charge a Common External Tariff (CET)
towards non-members.
Interestingly, if ASEAN pursues its interest in moving forward from an ASEAN Free
Trade Area (AFTA) towards a Customs Union (CU) including Singapore, a CET of non-zero
seems impossible to achieve across all ten ASEAN members as that would require Singapore
to raise its tariffs to an agreed non-zero CET tariff rate. This is unlikely to happen with
associated negative welfare consequences involved for Singapore as raising tariffs will induce
production and consumption distortions creating deadweight losses (Chia, 1992).
Effectively, the way to progress towards an ACU will be by forming a CU among
ASEAN-9 members with Singapore maintaining its existing zero tariff against non-members.
In this sense, one could term this as a partial ACU where members conform to an agreed
positive CET levels against non-members (excluding Singapore).
The remainder of the paper is organized as follows: Section 2 undertakes a brief
literature review on theory of economic integration, and how ASEAN’s economic and political
motives aligned with it. Section 3 gives an overview of trade and investment linkages in
ASEAN. Thereafter, section 4 analyses the protection trends in the top ten traded goods within
the ASEAN region whereas section 5 analyses the divergence in non-tariff measures applied
beyond-the-border across ASEAN members. Section 6 undertakes an applied general
equilibrium analysis of an ACU starting from the base scenario of a zero-tariff on intra-ASEAN
trade or implementation of the ASEAN trade in Goods Agreement (ATIGA). Two scenarios
are compared from this base scenario: a) A positive CET of 2 per cent, 3 per cent 4 per cent
and 5 per cent involving an ACU on all goods (excluding Singapore) and b) a more futuristic
and extreme scenario of an ACU involving zero CET among all ASEAN members (thus
avoiding the ASEAN-X strategy of integration). Both scenarios assume that all non-ASEAN
3
members do not undertake any tariff changes. In order to understand the issues involved in
devising and implementing an ACU more holistically, Section 7 analyses the political economy
challenges in taking the AEC forward towards an ACU. Section 8 concludes the paper.
2. Literature Review
Balassa (1961) regards economic integration as a process encompassing measures
designed to abolition discrimination between economic units belonging to different national
states’. There are five forms of economic integration that varies in terms of their degrees. These
are: a FTA, where tariffs are removed between participating countries; a customs union (CU),
where, in addition, member countries establish a common external tariff; a common market,
where both restrictions on trade and on factor movements are eliminated; an economic union,
where, in addition to free movement of products and factors of production, member states
undertake ‘some degree of harmonisation of national economic policies’; and complete
economic integration, which entails ‘unification of monetary, fiscal, social and countercyclical
policies’ and ‘the setting up of a supra-national authority whose decisions are binding for the
member states’.
Balassa’s sequencing of integration seems to be somewhat rigid as it mentions that the
process must start with FTA and there must be complete elimination of discriminatory
measures as we pursue deeper form of integration. Alternatively, movement from FTAs to CUs
could be a very gradual process or many times member countries can leave its economic
integration as a FTA. This is especially because the shift from FTA to CU is not just an
economic but also a political step. It requires participating countries to agree on a positive CET
for all non-members (Krueger 1997). A fundamental difference between a FTA and CU is in
terms of pooling or loss of sovereignty on certain commercial policies. It is this difficulty that
explains only around six percent of preferential trade agreements (PTAs) that have been

4
notified to the GATT/ WTO are CUs, progressing from FTAs4. This implies that although
many sign up for an FTA, very few are prepared to pool their sovereignty.
This implies that economic integration includes two situations; one is completely driven
by commercial motives (or economic welfare effect) and the other is driven by both
commercial and political motives. While FTAs, to a large extent, falls in the former category,
CU falls into the latter.
As for the political motives, economic integration helps member countries to get better
bargains, if they get together for international negotiations. In addition, countries may enter
trade negotiations to gain support of certain interest groups. These could be export-oriented or
import competing sectors or others like labour unions or those responsible for fiscal
sustainability and fear import duty losses. Other than these rationales, many times countries
enter economic integration as a response of other countries forming FTAs, limit illegal border
migration issues and to encourage intra-regional security (Heimenz and Langhammer 1990, De
Melo, Panagariya and Rodrik 1993, Grossman and Helpman 1994, Schiff and Winters 1998,
Mansfield and Milner 1999).
Analyzing the static welfare effects of economic integration, Viner (1950) identified
the possible advantages and disadvantages of economic integration. His study divided the
possible implications in terms of trade creation and trade diversion effects. Trade creation
happens when two or more countries enter into a trade agreement, and trade shifts from a high-
cost supplier member country to a low-cost supplier, whereas trade diversion occurs when
imports are shifted from a low-cost supplier of a non-member country to a high-cost supplier
member countries. According to Viner, who treated FTAs and CUs as almost synonymous,
‘customs union are not important, and are unlikely to yield more benefits than harm, unless
4 According to the WTO, as of 15 June 2014, some 585 notifications of RTAs has been received by the GATT/ WTO. Of these, 379 were in force and 25 have progressed to CU.
5
they are between sizable countries which practice substantial protection of substantially similar
industries’. However, Lipsey (1957), criticising Viner for focusing on the production side only,
argued that as relative prices in the domestic markets of member countries change as a result
of reduction of tariff barriers between them, economic welfare of a CU must include both
production and consumption effects. Therefore, in addition to production effect, there is bound
to be some consumption changes due to the relative change in process and this must be
considered with regard to economic welfare of CUs.
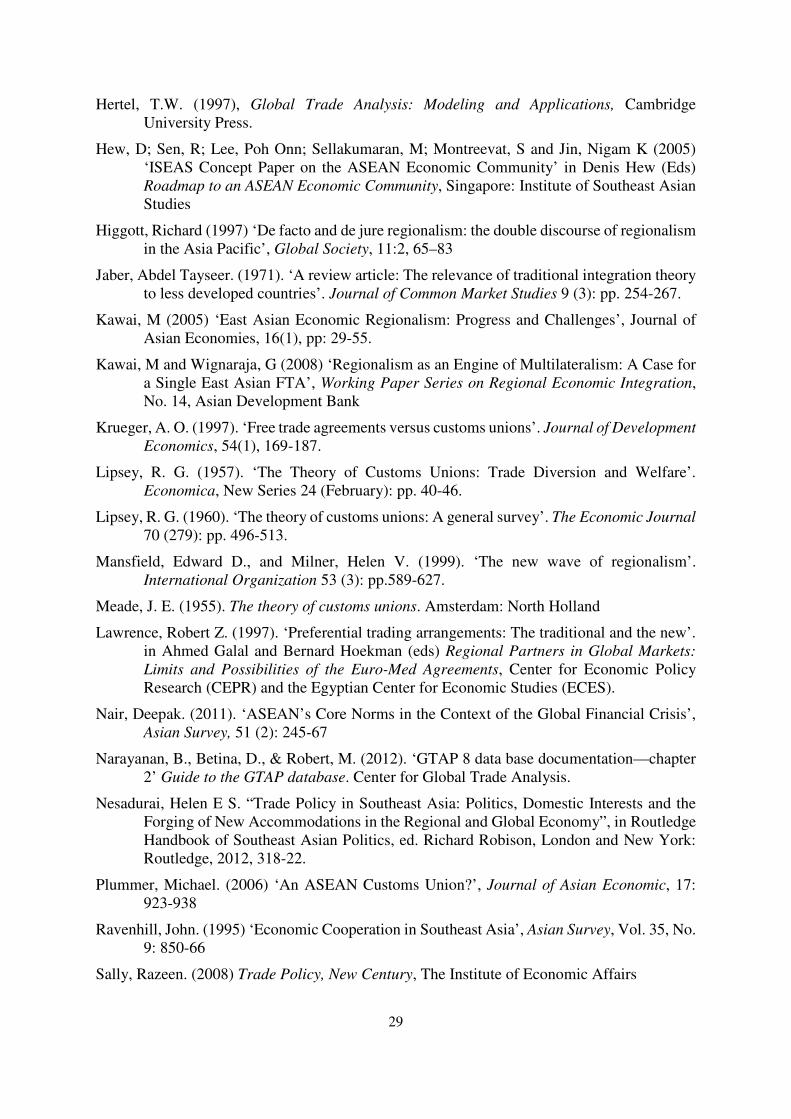
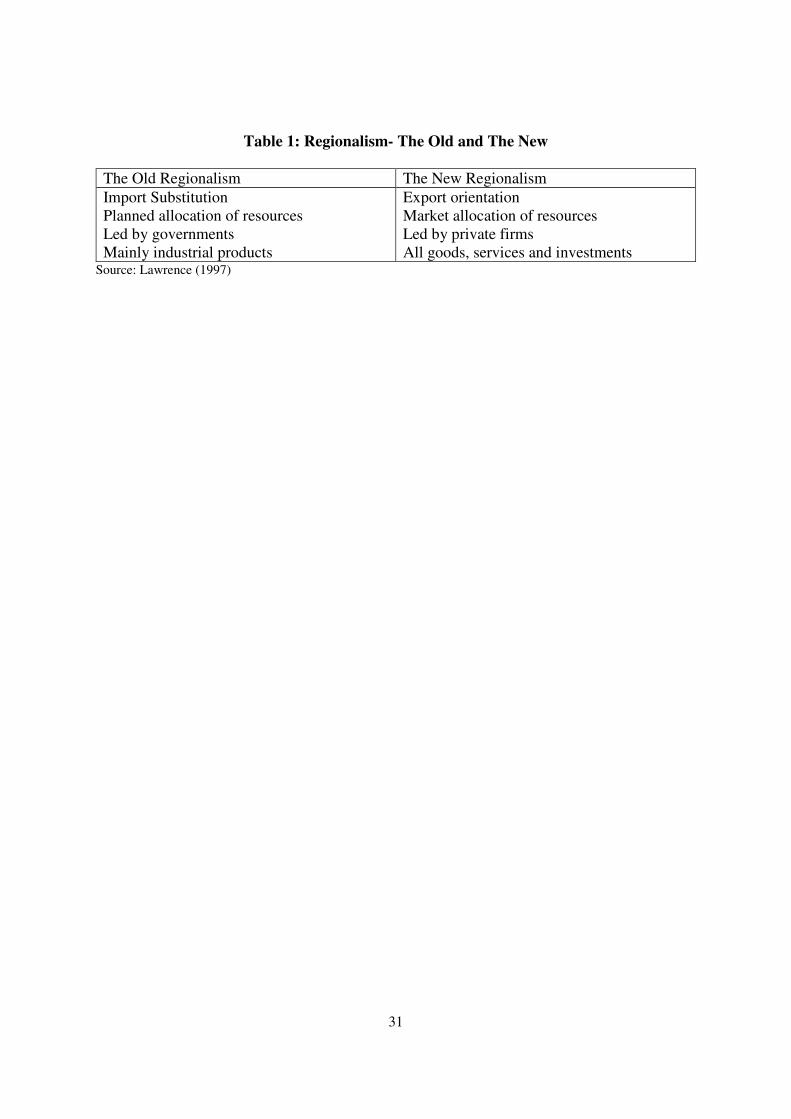
The welfare implications changes further as one distinguishes between ‘old’ and ‘new’
regionalism. While Viner’s description of economic integration relates to static effect of old
form of regionalism, new regionalism represents dynamic effects through increased
competition, investment flows, economies of scale, technology transfer and improved
productivity (De Melo and Panagariya 1993). Lawrence (1997) made a simple comparison
between old and new regionalism and noted that the latter has emerged with the changing
economic environments of increased private sector participation, competition, FDI, and the
increased importance of services sector (Table 1).
For developing countries, other than Lipsey’s production and consumption effects,
welfare impacts of economic integration changes further as one includes employment,
productivity and income effects, as these countries suffer from low productivity and
unemployment. It should be treated an approach to economic development, rather than only a
tariff issue (Jaber 1971). Other factors increasing the desirability of an economic integration
are – economies of scale, initial tariff level, degrees of complementarity, proportion of trade
with member countries, transport costs, coordination of macroeconomic policies (Meade 1955,
Lipsey 1960, Demas 1965, Jaber 1971, Heimenz and Langhammer 1990, De Melo, Panagariya,
Rodrik 1993). Empirically, these can be best captured through an applied general equilibrium

6
model using global macroeconomic, production and trade data such as the Global Trade
Analysis Project (GTAP) as described in Hertel (1997).
Observing ASEAN, as it has successfully achieved the first stage of economic
integration – by establishing a Free Trade Area (FTA) through AFTA – studies such as
Plummer (2006) have suggested that the future of the AFTA and its broader economic
cooperation measures under AEC should evolve to the next stage of economic integration i.e.
to creation of an ASEAN Customs Union (ACU). Thus, although under AFTA, member
countries’ tariff rates are either zero or close to it, each members are still pursuing their own
trade policy with external partners. In contrast, for an ACU, in addition to zero duties between
members, there has to be a CET on movement of goods with non-members. While there is
currently no general agreement on what should be the CET for a proposed ACU, Plummer
(2006) argued that ASEAN should adopt a liberal CET, as close to zero, so that the ACU can
generate trade creation and achieve closer integration with the rest of the world in the post-
customs union period. Given that Singapore already operates a zero tariff regime on trade in
goods, it remains to be seen whether other ASEAN members can move towards this goal and
inch closer to a zero CET in the near future. However, post-2015, a possible ACU with a
positive CET will have to exclude Singapore, thereby creating a partial ACU to begin with.
3. Trade and Investment Linkages in ASEAN
3.1 Economic diversity and intra-regional linkages
At the outset, it is notable, that even after two decades of economic integration
beginning with AFTA, ASEAN members continue to vary significantly in terms of income
levels with Singapore at the higher end of the spectrum, having GDP per capita at PPP of US$
75,913 as of 2012 and lower bounded by Cambodia among the CLMV members5 with GDP
5 CLMV members are Cambodia, Laos, Myanmar and Vietnam
7
per capita at PPP of US$ 2839. With an exception of Brunei, all the other ASEAN members
have been growing at annual growth rate of 5 per cent or above in 2012 (Table 2). Over the
years, ASEAN economies have been increasingly transforming into a service-oriented
economy, with larger fraction of GDP attributed to services sector. Yet, agricultural sector
predominates in CLMV countries with share of agriculture in GDP in Cambodia and Laos
accounting for about 35 per cent and 28 per cent respectively. The diversity of this region is
therefore best reflected in its unique economic, geographic and cultural characteristics that
provides significant complementarities in terms of its remarkable growth potential
demographic mix, and the ever growing manufacturing and assembly base that connects the
rest of the world through the global supply chain. The region’s strong dependence on trade
and investment flows has been a part of its export-oriented growth strategy since 1980s with
its adoption of unilateral liberalization policies, that has led large spin-offs from trade (share
of trade to GDP is highest for Singapore (367 per cent), followed by Malaysia and Vietnam)
(Table 2). This diversity however also creates significant economic and political challenges in
realising the future AEC goals towards an ACU.
Unlike the EU or NAFTA, the main trading partners of ASEAN members continue to
be extra-regional. As of 2004, intra-regional trade in ASEAN came to somewhat less than one-
fourth of total trade. It is observed that over 2005-2013, this trend has not changed very
significantly. It is observed from Chart 1 that at the individual country level, intra-regional
trade as a percentage of total trade was highest for Singapore (34 per cent) followed by
Malaysia (19.6 per cent), Thailand (17 per cent) and Indonesia (15.5 per cent). It should be
however noted that Singapore’s share is particularly high due to the fact that it engages
considerably in entrepot trade both within and outside the region.
8
Tables 3a and 3b provide the breakdown of export and import shares respectively of
ASEAN members total exports and imports by region as of 2012. It is observed that outside
the region, the CJK countries of the ASEAN plus 3 (China, Japan and Korea) were the most
important single export market for all ASEAN countries except Cambodia and the largest
import source as well. This reflects the strong extra-regional linkages of ASEAN with East
Asian countries that have strengthened over the period with the creation of international
production networks in the region through foreign direct investment (FDI). Table 4 presents
the intra and extra-ASEAN share of FDI flows from ASEAN member countries, and confirms
that FDI inflows into ASEAN are strongly extra-regional in terms of their source, with
Thailand, Brunei and Philippines attracting more than 90 per cent of their FDI outside ASEAN
members as of 2012.
Thus, regional economic integration initiatives in ASEAN such as AEC or a potential
ACU has to be considered in the context of a global economy. As Plummer (2006) warned,
“the cost of an inward-looking approach to regionalism, or ‘‘Fortress ASEAN,’’ would be far
too high”, which is a possibility if ASEAN countries were to adopt a CET that is not very low
(i.e. above 5 per cent) and creates a potential trade diversion.
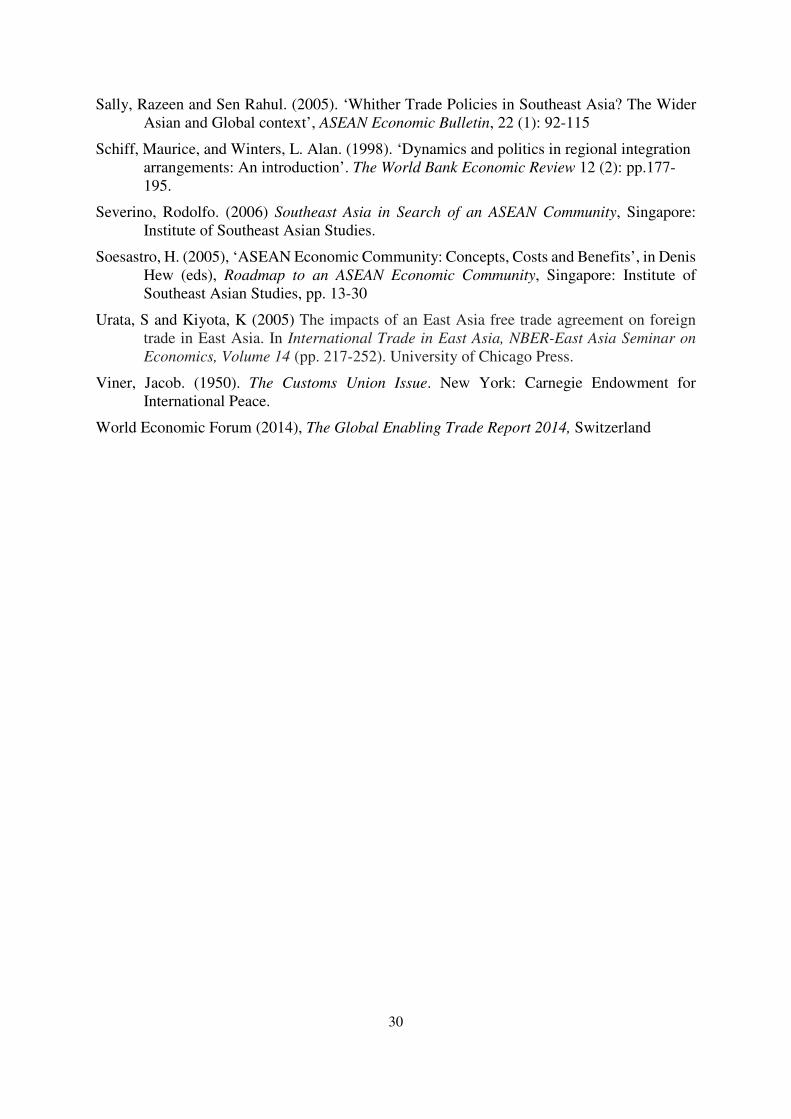
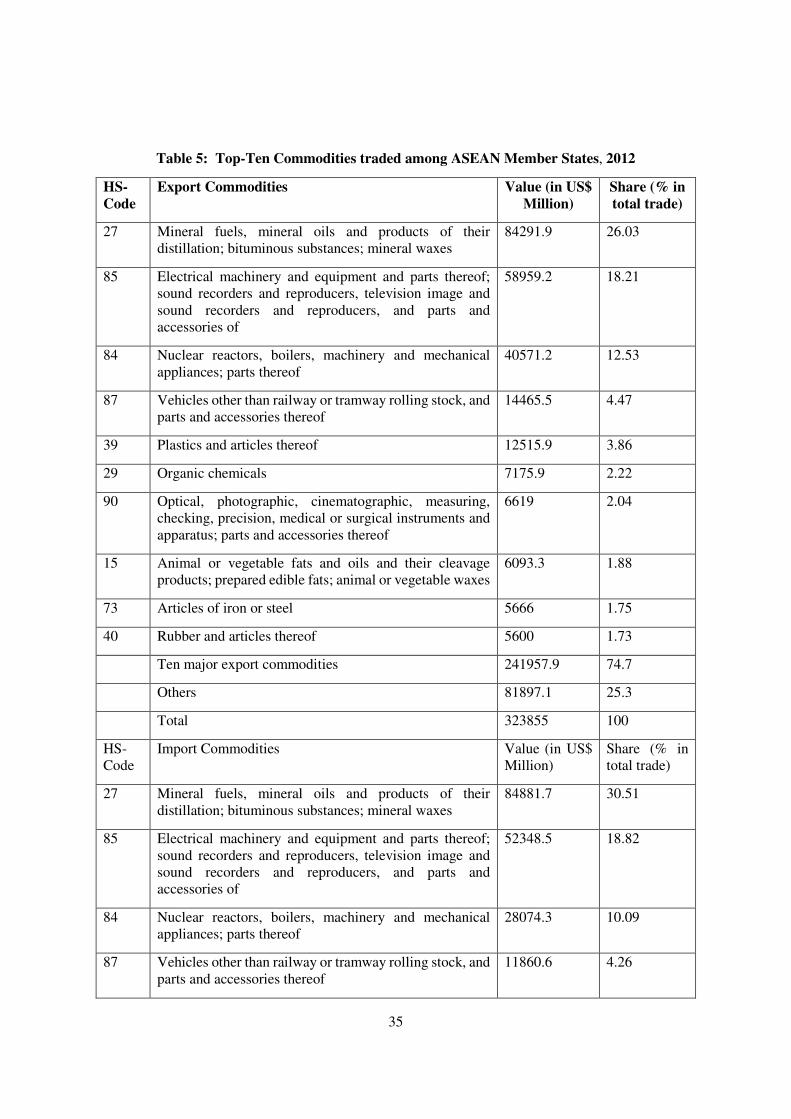
3.2 Product composition of Intra-ASEAN Trade
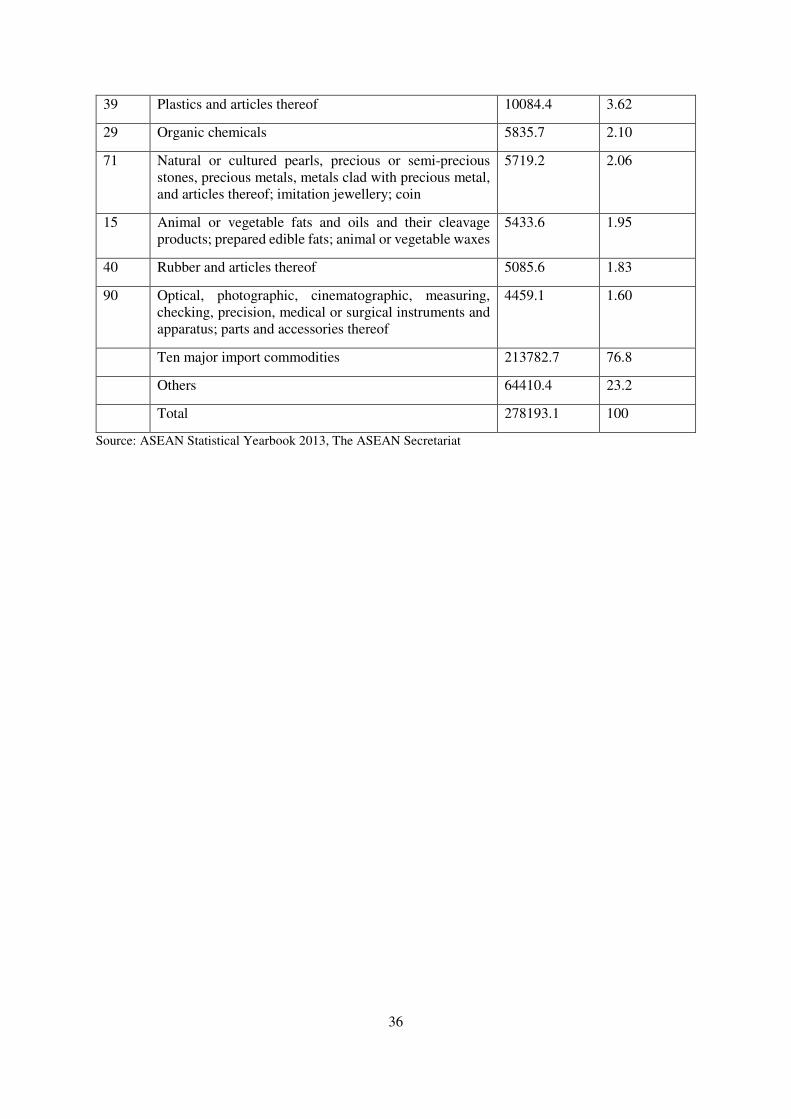
It is observed from Table 5 that two HS 2 digit industries HS-27 (consisting of Mineral
fuels, mineral oils and products of their distillation; bituminous substances; mineral waxes) and
HS-85 (consisting of Parts and accessories of Electrical machinery and equipment as well as
electronic goods, audio and video recorders) constituted nearly half of intra-ASEAN trade in
goods in 2011-12. Eight out of the ten industries involve exports and imports among them,
reflecting the high degree of intra-industry trade in the ASEAN region.

9
The top ten commodities constituted about three fourths of intra-ASEAN trade,
reflecting that a possible tariff elimination involving trade in these industries through ATIGA
and in the near future, through a possible ACU should have a significant impact on their
economic growth, enhancing economy wide welfare.
4. Protection Trends in Trade in Goods Across ASEAN members
In order to analyse the divergence in tariff structure of ASEAN-66 and ASEAN-107 in
terms of moving towards a CET in a possible ACU, it is important to make a comparison of
MFN and ATIGA tariffs. The analysis here is restricted to top ten goods imports only, covering
about three fourths of intra-ASEAN imports as of 2012.
4.1 MFN Applied Tariffs on imports
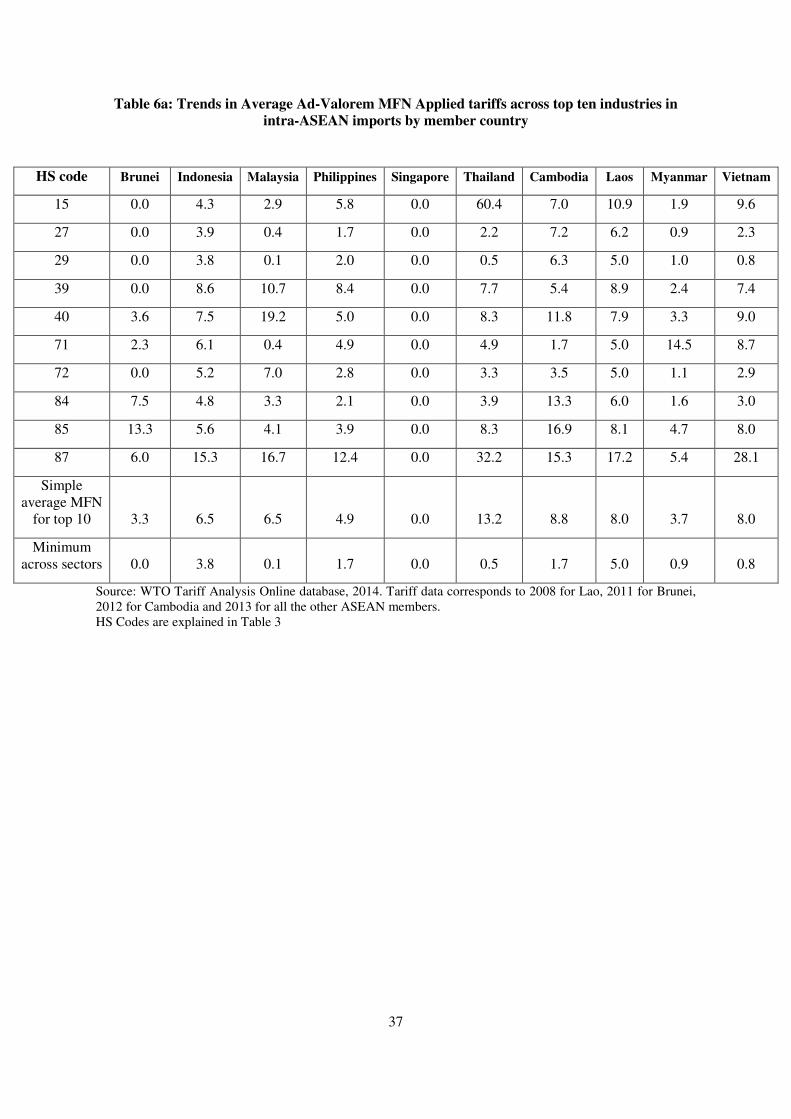
Table 6a and b presents the latest protection trends in terms of MFN Applied Tariffs
across these top ten imported goods industries intra-ASEAN. From Table 6a, it is observed that
except for Singapore, every ASEAN-6 country is charging a positive applied MFN tariff across
most of these industries, ranging from a simple average of 3.3 per cent across these industries
(for Brunei) to 13.2 per cent for Thailand. It is notable that Brunei, Indonesia, Thailand and
Malaysia are charging a maximum applied MFN Tariff rate across ASEAN-6 for at least two
of these top ten industries. Thailand applies the highest average MFN tariff of 60.4 per cent on
HS 15, followed by 32.2 per cent for HS 87.
Table 6b presents the average, peaks and dispersion measures of these tariff rates, which
suggests a highly divergent tariff structure across ASEAN-6 as well as ASEAN-10. It follows
that the simple average MFN applied tariffs across ASEAN-10 is still about 6.3 per cent, with
the peaks averaging about 13.2 per cent. HS 27, the top most imported good traded intra-
6 ASEAN-6 members are Brunei, Indonesia, Malaysia, Philippines, Singapore and Thailand 7 ASEAN-10 members include ASEAN-6 and Cambodia, Laos, Myanmar and Vietnam (CLMV countries).

10
ASEAN attracted the second lowest average MFN tariff rate of 1.4 per cent across ASEAN-6
and 2.5 per cent across ASEAN-10, involving the lowest tariff variability across ASEAN-6. In
contrast, the average, peak and dispersion across HS 85, the second highest traded good intra-
ASEAN was on a much higher side. HS 15 and HS 87 industries attracted one of the highest
average MFN tariffs across ASEAN-6 (23.7 per cent and 11.0 per cent) and ASEAN-10 (18.0
per cent and 9.9 per cent) respectively. Similar trends in tariff peaks are observed also for
CLMV countries. This of course implies that it is highly improbable to consider a low CET
that can be uniformly applied across these goods for achieving a possible ACU.
It is important to further note that the above peaks and dispersion trends are for nominal
tariff rates, and do not represent the effective rate of protection or presence of cascading tariff
structure across some of these industries in ASEAN member countries. While latest data on
Effective Rate of Protection (ERP) measures across these HS 2 digit industries are unavailable
across all ASEAN members, studies such as Urata and Kiyota (2005) and Plummer (2006)
indicated that ERPs remain virtually high across some of these sectors creating economic
distortions. Therefore an ACU involving even these ten HS 2 digit industries will require tariff
harmonization at both the country level across products as well as at the product level across
industries so that an appropriate CET can be reached.
4.2 ATIGA Preferential Tariffs on imports
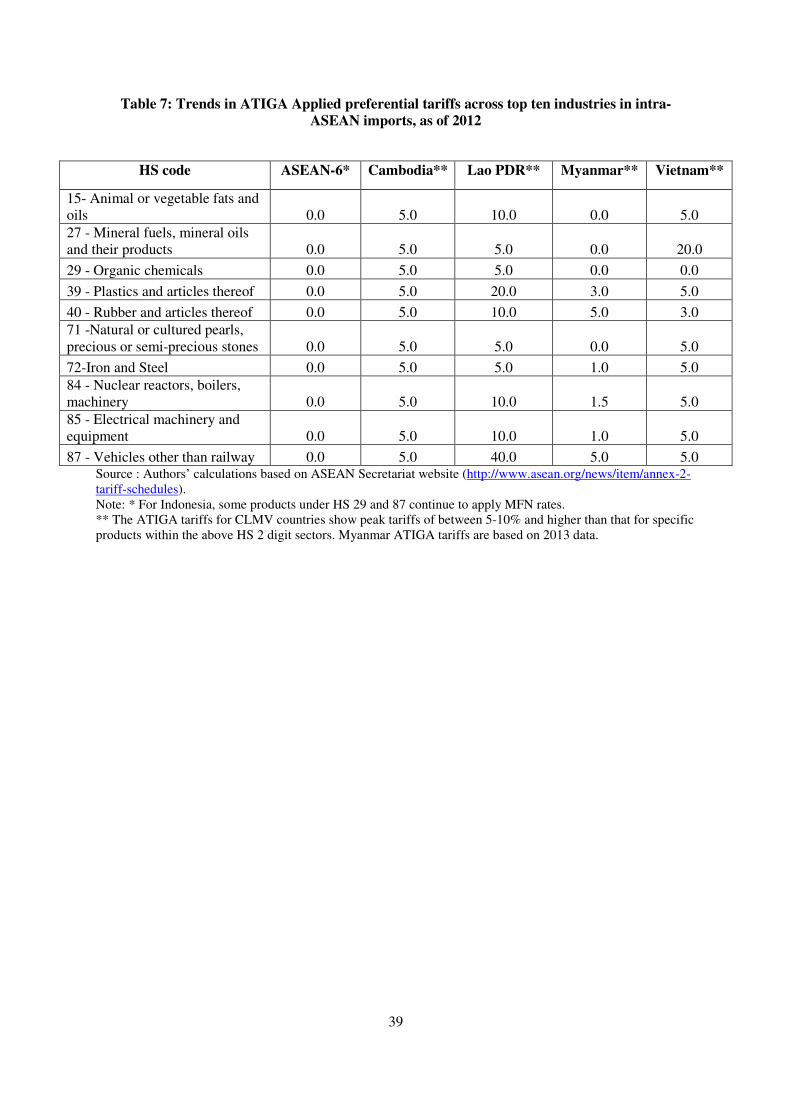
Analyzing the preferential 2012 Applied tariffs applicable to intra-ASEAN imports
under the ASEAN Trade in Goods Agreement (ATIGA) (Table 7), especially for the top ten
intra-ASEAN imports, it is noted that the preferential tariffs have been eliminated to zero for
ASEAN-6 members except for a few goods in HS 29 and 87 sectors for Indonesia wherein
MFN rates continue to be applied. This provides important evidence to the fact that ASEAN-6
is very close to achieving a zero tariff FTA in the top ten imported goods sectors. The CLMV
11
countries, on the other hand have been largely successful at reducing their ATIGA tariffs
compared their MFN counterparts, although in a few of these sectors, the average ATIGA
tariffs are surprisingly found to be higher than their applied MFN rates (Table 6a and 7).
The above trends in tariff protection suggests that while ASEAN-6 has partially
achieved the AEC goal of a free trade area by implementing a zero tariff regime across nearly
three-fourths of intra-ASEAN trade, its move towards a customs union would require them to
eventually implement a low positive CET for non-ASEAN members. This, as observed from
the analysis of Table 6b, would require significant harmonization efforts across sectors and
across countries.
5. Non-Tariff Barriers to Trade for a Possible ACU
Literature on the role of institutions on trade and development has well demonstrated that highly
developed and strong institutions significantly reduces trade costs, achieved through increase in the
transparency of the trading environment owing to greater predictability and simplification. (Helble
Shepherd, and Wilson, 2009). Therefore, in addition to harmonisation efforts in border tariffs, a
possible ACU will also need elimination or alignment of non-tariff barriers (NTBs) that
continues to prevail both at the border and beyond the border. These NTBs are discriminatory
in nature and include issues like diverse product standards, weak enforcement of government
regulations and the logistics gaps among the economies. While removal of NTBs is an action
plan mentioned in the AEC Blueprint, there is apparent lack of political will to implement the
commitments. Hence, NTBs are mentioned as the most formidable impediments to the
achievement of a ‘single market’ in several studies (ERIA 2012, Austria 2013, World Bank
and ASEAN Secretariat 2013, Chia 2013).
The latest data provided by World Economic Forum (2014) Enabling Trade Report
compares the quality of institutions, policies and services that facilitate the cross-border flow

12
across 138 countries. It can be observed that Singapore represents the most liberalized trading
environment, keeping transparency in border-crossing procedures and is well supported by
strong infrastructure and business operating environment. Among other ASEAN members,
Malaysia is also fairly perceived in terms of its institutional quality for facilitating trade with
an overall ranking of 25. Among the four sub-indices, it is found that Cambodia, Lao PDR and
Thailand perform poorly with respect to allowing domestic market access. In terms of
efficiency and transparency of border administration that represents the non- tariff barriers,
most of the ASEAN members, with an exception of Singapore, perform poorly. The same could
be said for infrastructure and business operating environment in the region (Table 8).
The above indicates that elimination or harmonization of NTBs remain central for a
possible ACU than tariff reduction. This can be further illustrated in Charts 2 and 3 that present
the most problematic factors for importing and exporting respectively in 2013 across ASEAN
members. A lower score represents a less problematic factor as identified by businesses. While
Chart 2 demonstrates that corruption at the border, burdensome import procedures as well as
regulatory requirements such as product standards testing etc. continue to be perceived as major
problematic areas for importing into most ASEAN countries, , similar problems are faced while
exporting the good to ASEAN members, with rules of origin requirement emerging as another
barrier for exporting, in the wake of the multiple bilateral and regional FTAs that ASEAN
members have been involved in (Chart 3).
The above data from the business perspective confirms that even ASEAN-6 has a long
way to go in harmonizing and reducing these institutional barriers or NTBs, which can impede
intra-regional and extra-regional trade even with complete tariff liberalization. Of course, this
is of concern in the context of its move towards an ACU as a potential ACU should also aim
to achieve common NTBs against the rest of the world. However, setting positive CETs and
maintaining some NTBs in an ACU involving Singapore is likely to be politically difficult to

13
achieve, but joint negotiations on trading rules with the rest of the world can be discussed at an
intra-ASEAN level.
6. Welfare Analysis of ACU
6.1 The GTAP model
In order to analyze the impacts on welfare and real GDP changes due to AFTA
implementation and a possible move towards an ACU, an applied general equilibrium (AGE)
analysis is more appropriate. The standard GTAP model, which is a multi-sectoral multi-
regional Computable General Equilibrium (CGE) model framework, described in Hertel
(1997) with the recently updated GTAP 8.1 database for 2007 (documented in Narayanan et.
al., 2012) is utilized for this purpose.
The standard GTAP model is based on the assumption of perfect competition and
constant returns to scale. The trade data in the GTAP database distinguishes between
commodities on the basis of their countries of origin and destination, and also on the basis of
the agents (intermediate demand, and final demand by household, government and investment)
that absorb the commodities in the importing economy, thus allowing for the varying import
intensities by different agents within regions and across countries disaggregated in the model.
This is the Armington assumption (Armington, 1969) that is incorporated across all variety of
CGE models and results of policy experiments are sensitive to both substitution elasticities and
trade shares (de Melo and Robinson, 1989). Region-specific trade tax data, import duties export
taxes, and transport costs are recorded for each and every trade transaction in this database and
the model. The remaining data in the GTAP database come from input-output tables of each
country/region modelled in the database. The ‘regional’ household in this model receives all

14
income from factor sales, and from five different tax instruments8. This income is then
distributed to the private household, savings and government9.
The policy simulations involve a 11x12 regional and sectoral aggregation from the
original GTAP 8.1 database based on 57 sectors and 129 regions10. The regional aggregation
consists of 7 individual ASEAN countries (Cambodia, Indonesia, Lao PDR, Malaysia,
Philippines, Thailand and Vietnam, as well as Rest of Southeast Asia (that includes both Brunei
and Myanmar11) as one region in the GTAP database. The three other regions are Singapore,
OECD members and the Rest of the World (ROW). Singapore is modelled separately from rest
of ASEAN to analyse the impact of a Partial ACU that will exclude Singapore.
The sectoral aggregation separates the top-ten import sectors of intra-ASEAN trade ,
(consisting of ten HS-2 digit sectors mapped onto their corresponding sectors in GTAP) 12, and
aggregates the others into Services, Other Manufacturing, Transport Communications and
Agri-Forestry and fishing. The standard GTAP closure is altered to reflect the assumptions of
unemployment for skilled and unskilled labour in all countries and fixing trade balances for all
regions except the OECD13.
8 These are import and export duties, sales/commodity taxes, production taxes and factor taxes. 9 For details on the structure of GTAP and a full graphical exposition of the multi-region GTAP model, see Hertel (1997) and Brockmeier (2001) 10 For a list of original sectors and regions documented in the GTAP Database, see https://www.gtap.agecon.purdue.edu/databases/regions.asp?Version=8.211 and https://www.gtap.agecon.purdue.edu/databases/v8/v8_sectors.asp 11 Note that in this model, Rest of Southeast Asia is aggregated as a region as GTAP 8.1 database does not have disaggregated data for Brunei and Myanmar. 12 See Appendix 1 for further details on the database aggregation. 13 This has been undertaken by earlier studies involving standard GTAP model simulations such as MacDonald and Walmsley (2008).

15
6.2 Policy scenarios
6.2.1 AFTA implementation with zero tariffs (Scenario 1 or base scenario)
An ACU is likely to be the next step of economic integration post AFTA, and is
expected to be implemented across all goods. The baseline scenario or Scenario 1 therefore
simulates the implementation of a zero tariff ASEAN Trade in Goods Agreement (ATIGA) so
that the ATIGA tariffs have been eliminated within ASEAN-10 imports. This scenario assumes
that non-ASEAN members are still charged the MFN tariffs while exporting to ASEAN
members.
6.2.2 ASEAN Customs Union minus Singapore with a positive CET of 2-5 per cent on all
goods (Scenario 2)
This scenario analyzes the potential economy wide impacts of ASEAN members as a
result of formation of a possible ACU on all goods, starting from the creation of AFTA.
Following Plummer (2006), who suggests that the proposed CET in an ACU should be as low
as possible, it is assumed in this scenario that a customs union is formed by ASEAN-9 with a
positive CET that ranges from a high of 5 per cent to a low of 2 per cent, which will be
applicable for imports of all goods of ASEAN-9 from the two non-member regions modelled
in this study viz. OECD, and RestofWorld.
Starting from 5 per cent, each sub-scenario of a progressive reduction of CET to 4 per
cent, 3 per cent and 2 per cent is modelled. The scenarios assume that this positive CET is not
applicable for imports from Singapore into ASEAN-9 (i.e. Singapore exports to ASEAN-9 are
charged ATIGA rates), and non-ASEAN members still charge the MFN tariffs while importing
from ASEAN members.

16
6.2.3 ASEAN Customs Union with a zero tariff on all goods (Scenario 3)
What would happen if ASEAN-9 were to eventually eliminate tariffs for imports from
non-members, starting from AFTA? Though not realistic, at this stage, this scenario is more
futuristic and analyses the possibility that ASEAN-9 eventually eliminates all tariffs so that an
ACU (possibly including Singapore as the CET is zero) is now a de-facto free trade zone vis-
à-vis non-members. This scenario continues to assume that non-ASEAN members still charge
MFN tariffs while importing from ASEAN members.
For each of the above scenarios, impacts on overall welfare (in Equivalent Variation
(EV) terms as measured by GTAP) and changes in real GDP (measured by the GTAP qgdp
variable) are analyzed. The results reported below are comparative static in nature given the
structure of the GTAP model and hence does not capture any potential dynamic effects of these
policy shocks. Further, the results are aggregative in nature and do not provide any insights
into industry-specific impacts as a result of these tariff shocks.
6.3 Impact on overall welfare and real GDP
Tables 9 and 10 report policy simulation results. Table 9 presents the changes in overall
welfare (in level terms) while Table 10 shows the aggregate changes in real GDP (in percentage
terms) in ASEAN members across all three scenarios. Table 11 estimates the aggregate changes
in real GDP aggregating ASEAN-9 as one single region, separating Singapore, to analyse the
impact on the region as a whole if it were to form a partial ACU.
It is observed that an AFTA with zero tariffs intra-ASEAN would unambiguously
improve the welfare of all ASEAN members and increase their real GDP growth (Tables 9 and
10). In terms of real GDP, larger gains are observed for newer ASEAN members (Cambodia,
Vietnam and Lao PDR) compared to others, given that these countries end up undertaking a
17
larger tariff reduction, particularly in the Agricultural goods sector as they progress towards
the implementation of AFTA.
Post-AFTA, creation of a partial ACU with a positive CET of between 2-5 per cent
demonstrates that all ASEAN members may not benefit individually, although there maybe net
benefits for ASEAN-9 as a whole. Notably, Singapore is estimated to be experiencing positive
welfare gains in a partial ACU at a CET of 5 per cent, the magnitude of which reduces
considerably as the CET is to be chosen to be 4 per cent. In contrast, the remaining ASEAN
members experience greater positive welfare gains if a lower positive CET of 4 per cent is
chosen instead of 5 per cent. Specifically, as observed in Tables 9 and 10, Indonesia, the largest
member economy in the ACU experiences welfare losses of US$ 735.3 million if it applies a
CET of 5 per cent in an ACU (equivalent to a loss of about 0.18 per cent in terms of real GDP).
These losses are far lesser (equivalent to a loss of about 0.07 per cent of real GDP) if the CET
were to be 4 per cent instead. Similar results are observed for the Philippines. Except for these
two ASEAN members, all others experience a positive welfare gain at a CET of 4 per cent.
As the margin of tariff preferences is further reduced between Singapore and other
ASEAN members with the positive CET chosen being 3 per cent and 2 per cent respectively,
it is observed that the magnitude of positive welfare gains for ACU members increases,
reflecting increasing extra-regional trade of ACU members with non-members (OECD, Rest
of the World) who are now able to expand their exports to ACU members with a lower positive
CET. This erosion of tariff preferences between Singapore and rest of ASEAN vis-à-vis non-
members increasingly generates negative terms of trade effects for the former, resulting in trade
diversion from OECD towards ACU members. This is reflected in Singapore experiencing a
welfare loss of US $ 218.97 million (equivalent to a loss of 0.03 per cent in terms of real GDP)
at a CET of 3 per cent, which further accentuates to US $ 482.1 million if the CET is 2 per
cent. Indonesia is the only ACU member that continues to experience a welfare loss (equivalent
18
to a loss of 0.03 per cent in terms of real GDP) at a CET of 3 per cent. The combined welfare
gains for ACU members is nearly US$ 3.8 billion in moving from AFTA to this scenario of a
Partial ACU with a CET of 3 per cent, far offsetting the individual negative welfare losses for
Indonesia and Singapore. If the CET is chosen to be even lower than this at 2 per cent, the gains
for ACU members are almost US$ 5.0 billion, but at the cost of greater welfare losses for
Singapore (Tables 9 and 10).
If ACU were to include Singapore, only a futuristic scenario of a zero tariff towards
non-members is possible. Scenario 3 results in Tables 9 and 10 demonstrate that this would
completely erode any margin of tariff preference between Singapore and other ASEAN
members, and thus benefit all non-ASEAN members and ASEAN members except for
Singapore, which will suffer a potential welfare loss of about US$ 981.53 million (equivalent
to 0.21 per cent of its real GDP). In this unlikely scenario, ASEAN-9 as a whole would still
experience a net gain of about US$ 7.0 billion, and ASEAN-10’s net gains (after accounting
for Singapore’s welfare losses) would be worth US$ 6.0 billion. Table 11 presents these results
in terms of changes in real GDP at the aggregate level, and confirms that at a positive CET of
3 per cent, the aggregate gain to ASEAN-9 in creating a partial ACU would be equivalent to
0.61 per cent of ASEAN-9’s real GDP, that would far offset the 0.03 per cent welfare loss for
Singapore if it were to be excluded from the ACU.
The above policy modelling exercises, though aggregative and static in nature, suggests
that even if ASEAN’s extra-regional members were to keep their tariff structures unchanged,
there are potential net positive welfare gains to be reaped by ASEAN if it moves from an AFTA
to a partial ACU (excluding Singapore) post-2015. However, not all ASEAN members will
individually gain from such an ACU. Notably, members may need to potentially devise a
mechanism wherein some member country’s welfare losses in an ACU can be compensated by
the gaining members.

19
However, the above results need to be qualified with several important caveats: First,
while isolating the welfare impact on Singapore, it should be noted that a significant proportion
of Singapore’s imports are re-exported and do not enter the domestic economy, which cannot
be analyzed in the GTAP trade database on which the simulation exercise have been conducted.
This is particularly significant for the case of the Petro sector wherein Singapore is heavily
involved in re-exports of refined petroleum to other ASEAN members as well as non-member
countries. The observed welfare impact and real GDP changes for Singapore may not
accurately capture the entrepot and manufacturing hub role that it would play in a potential
future partial ACU. Second, there are likely to be much larger gains for Singapore as well as
other ASEAN members and extra-regional members, if the ACU were to also harmonize
regulatory and institutional barriers towards trade in services as well as foreign investment
flows, and create a common NTB towards non-members. This scenario is not modelled in this
study as it requires extensions of a standard GTAP model.
Third, extra-regional trade of ASEAN has been expanding over the years, and ASEAN
(both as a region as well as individual members) is getting integrated with its major trading
partners through several bilateral and regional trading agreements (RTAs) over the past decade.
Singapore, in particular has been highly forthcoming in implementing a number of bilateral
RTAs with its extra-regional trading members, which has not been separately modelled in these
scenarios. It is highly likely that these extra-regional trading partners will also lower their tariffs
closer to these chosen CET levels. If that were to happen, opportunities for ASEAN’s extra-
regional export expansion should increase further, converting Singapore’s welfare losses into
welfare gains, as well as enhancing the welfare of other ASEAN members in presence of a
Partial ACU.
Fourth, as mentioned earlier, the simulations projects a scenario of a uniform CET
applied across all industries in ASEAN-9, but it would be worthwhile to analyse those
20
industries wherein the average MFN tariffs are already lower than the CET levels. In reality, a
potential partial ACU is more likely to operate with industry or goods specific CETs, at a
disaggregated level of tariff classification, similar to RTAs.
Finally, the GTAP modelling results analysed above are based on a static perfectly
competitive model, and it would be useful to extend it in a dynamic & imperfectly competitive
setting at a sectoral level. It is also important to note that there will be significant political
economy challenges in realizing and implementing such a partial ACU (minus Singapore),
which needs to be analysed in detail.
7. Political Economy Factors in Achieving the ACU
Although ACU may allow for greater gains from trade and FDI, the diversity of
ASEAN members and their varied interests can thwart any such intentions. The challenges for
ASEAN to develop an ACU from a political economy perspective are manifold, even though
there could be strategic imperatives that could provide ASEAN with an incentive to overcome
socio-economic division that currently characterise the region.
7.1 Challenges in achieving an ACU
For ACU to happen, can ASEAN continue to work with its three unique characteristics
that it had followed since its inception? These are: first, the ‘ASEAN Way’ in dealing with the
regional matters. This relates to ASEAN’s preference for loose arrangements rather than formal
agreements, its dependence on personal relations among ministers and leaders rather than
strong institutions and its reliance on consensus and common interests rather on high-level
binding commitments (Severino 2006). This can be observed in several ASEAN documents,
including AEC, as it discuss the vision and the required broad actions rather than mention the
mechanisms through which member economies can develop the capacity to implement the
21
regional measures. The documents are not couched in legal terms and allows for flexibility in
complying with regional commitments.
The second characteristics is ASEAN states preference for sovereignty, as they
uniformly reject the idea of ‘pooled’ sovereignty under any regional initiative. Instead, they
believe that regional institutions should enhance the sovereignty of their member states (Higgot
1997). This also holds true for its economic integration measures. Although initiatives like
AEC is regional in nature, compliance with and implementation of AEC commitments depends
on voluntary national action. While peer pressure is applied among the friendly ASEAN
members or mutual assistance and capacity-building exercises are used to help in
implementation efforts, the region does not have an European Commission (EC)14 alike
institution that can insist member countries to comply with ASEAN commitments. This is a
reason that despite committing to AEC actions in 2007, a proportion of its targets are not met
and even those that are met have uneven rate of implementation across member states.
Finally, this connects to ASEAN’s third characteristic i.e. principle of ‘non-
interference’ that is mentioned in several of ASEAN documents15. The 2007 ASEAN Charter
reaffirmed the adherence to fundamental principles, including ‘non-interference in the internal
affairs of ASEAN Member States’ (ASEAN Secretariat 2007b). Hence, while ASEAN cannot
14 The European Commission represents and upholds the interests of the EU as a whole. It drafts proposals for
new European laws. It manages the day-to-day business of implementing EU policies and spending EU funds (EU
Institutions and Other Bodies, Europa.Eu)
15 In 1967 Bangkok Declaration, ASEAN proclaimed its determination “to ensure their stability and security from
external interference in any form or manifestation”. In the 1971 “Zone of Peace, Freedom and Neutrality
Declaration”, ASEAN reiterated that every state, regardless of its size, has the right “to lead its national existence
free from outside interference in its internal affairs”. In the “Treaty of Amity and Cooperation in Southeast Asia”,
ASEAN committed itself to principles, including “mutual respect for the independence, sovereignty, equality,
territorial integrity and national identity of all nations; the right of every State to lead its national existence free
from external interference, subversion or coercion and; non-interference in the internal affairs of one another.”
(ASEAN Secretariat 1967, 1971, 1976b)

22
be made responsible for regional commitments, much will depend on its members’ interests
and their domestic dynamics.
Indeed, ACU takes ASEAN to next step of integration by ‘deepening’ the initiative
through adoption of CET, but it also entails many other related matters that may not go well
with ASEAN’s characteristics. First, countries have to pool sovereignty over some of their
commercial policy, which ASEAN states may not agree with. This is also reiterated by
Akrasanee and Stifel (1992) as they say that ‘the goal of ASEAN co-operation has never been
a form of integration in which supranational characteristic progressively transcend national
sovereignty. Cooperation in the region was pursued as a means of assuring national
independence and mutual benefits for all participants……… a customs union …..has
supranational characteristics which are unacceptable’. For most of the ASEAN economies, this
belief reflects their own institutional weaknesses, as discussed in section 4 of this paper.
Economically also, the ties between the member countries are relatively weak; as intra-ASEAN
trade remained a quarter of total trade in the region, despite the initiative of AFTA since 1992.
Moreover, ASEAN’s economic interaction with the North-eastern states of China, Japan and
Korea and the United States remained critical, reinforcing external linkages that have
undermined regional institutional development.
Apart from the question on the above mentioned three characteristics of ASEAN, it is
going to be difficult to agree on a CET, especially when ASEAN countries have divergent tariff
structures (as observed in section 4). Creating an ACU among ASEAN-10 would either require
Singapore and Brunei to abandon a tariff regime on which their entire economies have been
based or require other members to completely eliminate their tariffs. Either of these scenarios
are highly improbable at this juncture. This is so as at least one of the ASEAN members is
likely to experience a welfare loss as evinced from the simple modelling exercise in Section 6.
Further, there is no current mechanism in place in ASEAN wherein gainers in deeper economic

23
integration are prepared to compensate potential losers in the event of an ASEAN-wide net
welfare gain. Issues such as the distribution of tariff revenue in a partial ACU from a CET
remains unresolved as well. These factors considered together may make the implementation
possibility of an ACU much weaker, at least in the short-run. Earlier studies like Chia (1992),
Cuyvers and Pupphavesa (1996), Chirathivat and Srisangnam (2013) have all put the possibility
of ASEAN of moving towards an ACU as very low, mainly citing the negative consequences
of member countries as a key reason.
Furthermore, the domestic political economy support to create an ACU can be
complicated as in ASEAN, interest groups at domestic level play an important role in regional
economic cooperation matters. It has been repeatedly mentioned in literature that protection
persists despite free trade being an optimal policy choice. Domestic politics and domestic
interest groups seek to maintain trade barriers and economic restrictions, under the guise of
‘national interest’. This is often a result of organised rent-seeking interaction between interest
groups and politicians (Sally 2008, Nair 2011, Balboa et al 2012). According to Nesadurai
(2012), a crucial feature of the Southeast Asian political economy is a close relationship
between the ruling elites and the business sector, whether state-owned enterprises, government-
linked corporations (GLCs) or private businesses.
7.2 ACU – A Strategic Project
Despite these negative connotations from an ACU, pressing strategic imperatives could
provide incentives to ASEAN states to overcome its historical ways of doing things and to
manage its socio-economic and institutional diversity that presently characterise the region.
This has happened in the past and ASEAN, as an organisation, has evolved overtime.
Going back to ASEAN’s past, it is important to note the strategic imperatives that
pushed the ASEAN leaders to decide on an AEC. These were the financial crisis of 1997-98,

24
proliferation of FTAs elsewhere in the world; China’s membership in WTO; fear of investment
diversion to bigger and emerging markets of China and India; importance with linkages with
East Asian countries and the desire to play the role of a ‘hub’ in the broader Asian region
(ASEAN Secretariat 2003b, Kawai 2005, Sally and Sen 2005, Hew et al 2005, Soesastro 2005,
Kawai and Wignaraja 2008).
Other than these, while ASEAN is a regional organisation to avoid conflict, economic
cooperation is viewed as a means to achieve this objective. Moreover, the ASEAN
governments view the economic cooperation as beneficial for individual member states with
no extra costs, especially in delegating sovereignty to supranational institution and the risk of
interference in domestic affairs. Alternatively, being a part of ASEAN help the member states
to pursue their national interests16.
ASEAN finds itself standing on the cross-roads in 2015. All attention is on ASEAN on
how it can deliver on an economic cooperation arrangement that have profound implications
in both economic and non-economic realms. There are still many destabilising factors present
in and around ASEAN economies. Firstly, since the 2008 global crisis, the world has become
economically more vulnerable. Any economic or financial meltdown in the West can be felt
among the Asian economies, hampering its growth story. Secondly, Asia, in this twenty-first
century contain group of big powers, including China, India, Russia and Japan (with the US
playing role from across the Pacific) and several smaller ones, all capable of bringing in
instability. Lately, the region has seen competition of mega-regionals like the China-led East
Asia FTA, Japan-led Comprehensive Economic Partnership for East Asia and the US-led
Trans-Pacific Partnership, each of them trying to economically influence the Asia-Pacific
region. This was felt to be threatening the ASEAN ‘centrality’, which assumed that ASEAN,
16 See Hew, et.al (2005) and Kawai (2005).
25
instead of the bigger economies like those of China, Japan, the U.S. or India, should be the hub
of developing a wider Asia-Pacific regional architecture (Basu Das 2014). Thirdly, despite the
end of the Cold War, issues of non-traditional security remained pertinent and became a new
security agenda for ASEAN countries. Finally, the issue of China in the South China Sea was
left dormant without institutional arrangement for resolution.
In this light, a partial ACU among ASEAN-9 could be a possibly pathway to deepen
economic integration beyond AFTA and generate greater economic benefits for ASEAN as a
regional community. A rules-based framework for economic cooperation among the member
states of ASEAN seems to be already developing, which has further culminated in the ASEAN
Charter in 2007 (Davidson 2010). In addition, since the post-Cold war era, ASEAN has always
viewed its economic cooperation as a mode to give it a sense of regional identity (Ravenhill
1995). Moreover, post-2015, ACU could be an agenda that can help ASEAN to strengthen its
‘single market’ objective. With harmonization of commercial policies, this will make the
region attractive to MNCs, who may enjoy lower transaction costs in doing business in an
economically integrated market than they have in the current form of AEC.
8. Conclusion
With the 2015 deadline for an AEC, ASEAN is on discourse again to work on a vision
to foster deeper integration in the future. Taking the cue of a deeper integration, an ASEAN
Customs Union (ACU) could be considered as a possibility. For ASEAN to move to a CU, it
requires either all its members to inch closer to a zero Common External Tariff (CET), given
that Singapore already operates a zero tariff regime on trade in goods, or is to form an ACU
minus Singapore involving a positive CET. However, the latter would imply that such an ACU
would be a Partial CU as ATIGA would continue to be applicable for ASEAN-9’s imports
from Singapore.
26
The results from an applied general equilibrium policy modelling exercise, though
static in nature, suggests there are potential net positive welfare gains to be collectively reaped
by ASEAN if it moves from an AFTA to a partial ACU (excluding Singapore) post-2015,
which involves a positive CET of about 3 per cent. This is assuming that ASEAN’s extra-
regional members keep their tariff structures unchanged. However, not all ASEAN members
will individually gain from such an ACU. In a more extreme scenario, if ASEAN-9 were to
move towards a zero tariff regime similar to that of Singapore, it will continue to achieve higher
welfare gains, but at the cost of welfare losses for Singapore due to a potential intra-regional
trade diversion. Notably, members may need to potentially devise a mechanism wherein some
member country’s welfare losses in an ACU can be compensated by the members who gain.
There are important caveats to these results that are detailed in Section 5, and this
modelling exercise could be further extended in future studies by analysing i) sector-specific
CETs ii) harmonization of services and investment regulations ASEAN-wide and iii) impact
on Singapore’s regional entrepot role if a Partial ACU excluding it were to involve very low
positive CETs, ultimately eliminating all tariffs and thereby eroding current margin of tariff
preferences between the city-state and ASEAN-9.
Despite the challenges, there could be pressing strategic imperatives like the economic
vulnerability of the West, big power rivalry, issue of South China Sea and desire to entrench
ASEAN Centrality, and these could provide incentives to ASEAN states to overcome
challenges and its historical ways of doing things. This has happened in the past as ASEAN
moved from AFTA in the 1990s to a more rules-based approach of AEC recently. ASEAN, as
an organisation, has definitely evolved over the last four decades. Hence, post-2015, political
leaders in ASEAN may disregard the ACU as an impossible initiative, and may visualise the
deeper integration as a way to further ASEAN’s strategic agenda in the international
community.

27
References Akrasanee, Narongchai and Stifel, David (1992) ‘The Political Economy of the ASEAN Free
Trade Area’, in Pearl Imada, Seiji Naya (ed), AFTA: The Way Ahead, Singapore: Institute of Southeast Asian Studies.
Armington, Paul S. (1969). ‘A Theory of Demand for Products Distinguished by Place of Production’. IMF Staff Papers 16(1): 159-178.
ASEAN Secretariat (1967), The ASEAN Declaration (Bangkok Declaration), Bangkok, 8 August 1967 (http://www.asean.org/news/item/the-asean-declaration-bangkok-declaration; accessed on 2 November 2014).
ASEAN Secretariat (1971), 1971 Zone of Peace, Freedom and Neutrality Declaration, Kuala Lumpur, Malaysia, 27 November 1971
ASEAN Secretariat (1976), Treaty of Amity and Cooperation in Southeast Asia, Indonesia, 24 February 1976 (http://www.asean.org/news/item/treaty-of-amity-and-cooperation-in-southeast-asia-indonesia-24-february-1976-3; accessed on 29 July 2014)
ASEAN Secretariat (1997), ASEAN Vision 2020, ASEAN Secretariat, Jakarta, 15 December 1997. (http://www.asean.org/news/item/asean-vision-2020; accessed on 2 November 2014)
ASEAN Secretariat (2003a), Declaration of ASEAN Concord II (Bali Concord II), Bali, 7 October 2003. (http://www.asean.org/news/item/declaration-of-asean-concord-ii-bali-concord-ii; accessed on 2 November 2014)
ASEAN Secretariat (2003b), Towards a Single Economic Space, Jakarta (http://www.asean.org/archive/pdf/tse1.pdf; accessed on 2 November 2014)
ASEAN Secretariat (2007a), Cebu Declaration on the Acceleration of the Establishment of an ASEAN Community by 2015, Cebu, Philippines, 13 January 2007 (http://www.asean.org/news/item/cebu-declaration-on-the-acceleration-of-the-establishment-of-an-asean-community-by-2015; accessed on 2 November 2014)
ASEAN Secretariat (2007b), The ASEAN Charter, 2007 (http://www.asean.org/archive/publications/ASEAN-Charter.pdf; accessed on 2 November 2014)
ASEAN Secretariat Databases (various issues)
ASEAN Secretariat and World Bank (2013), ASEAN Integration Monitoring Report (http://documents.worldbank.org/curated/en/2013/01/18780456/association-southeast-asian-nations-asean-integration-monitoring-report-joint-report-asean-secretariat-world-bank; accessed on 2 November 2014)
Austria, Myrna (2013) ‘Non-Tariff Barriers: A Challenge to Achieving the ASEAN Economic Community’, in Sanchita Basu Das, Jayant Menon, Omkar L. Shrestha and Rodolfo Severino (Eds.), The ASEAN Economic Community: A Work in Progress, Singapore: ISEAS, pp. 31-94.
Balassa, Bela. (1961). The Theory of Economic Integration. Homewood, Illinois: Richard D. Irwin
Balboa, J.D., del Prado, F.L.E and Yap, J.T. (2012). ‘Achieving the AEC 2015: Challenges for the Philippines’ in Sanchita Basu Das (Eds.), Achieving ASEAN Economic

28
Community 2015: Challenges for Member Countries and Businesses, Singapore: ISEAS, pp. 99-124
Basu Das, Sanchita (2014). The Political Economy of the Regional Comprehensive Economic
Partnership (RCEP) and the Transpacific Partnership (TPP) Agreements: An ASEAN
Perspective, Singapore: Institute of Southeast Asian Studies
Chia, S.Y. (1992). "Commentary on Chapter 4", in Pearl Imada, Seiji Naya (ed), AFTA: The
Way Ahead, Singapore: Institute of Southeast Asian Studies: 95-97
Chia,S.Y. (2013) ‘The ASEAN Economic Community: Progress, Challenges, and Prospects’ ADBI Working Paper Series, No. 440. Asian Development Bank Institute.
China Economic and Industry (CEIC) Database (2013). http://www.ceicdata.com [Accessed on October 3,2014 ].
Chirathivat, Suthiphand and Srisangnam, Piti (2013). ‘The 2030 Architecture of Association of Southeast Asian Nations Free Trade Agreements’, ADBI Working Paper Series, No.
419. Asian Development Bank Institute
Cuyvers, Ludo and Pupphavesa, Wisarn (1996) ‘From ASEAN to AFTA’, CAS Discussion paper No 6, Centre for ASEAN Studies and Centre for International Management and Development Antwerp
Davidson, Paul J. (2010). ‘The Role of International Law in the Governance of International Economic Relations in ASEAN’ in 12 Singapore Year Book of International Law, pp.213-224
Demas, William G. (1965). The economics of development in small countries with special
reference to the Caribbean. Montreal: McGill University Press.
De Melo, Jaime, and Panagariya, Arvind. (1993). ‘Introduction’. in Jaime De Melo and Arvind Panagariya (eds), New Dimensions in Regional Integration, Cambridge University Press.
De Melo, Jaime; Panagariya, Arvind, and Rodrik, Dani. (1993). ‘The new regionalism: A country perspective’ in Jaime De Melo and Arvind Panagariya (eds), New Dimensions
in Regional Integration, Cambridge University Press.
De Melo, J., and Robinson, S. (1989). ‘Product differentiation and the treatment of foreign trade in computable general equilibrium models of small economies’. Journal of
International Economics, 27(1): 47-67.
Economic Research Institute for ASEAN and East Asia (ERIA) (2012), Mid-Term Review of the Implementation of AEC Blueprint: Executive Summary (http://www.eria.org/publications/key_reports/mid-term-review-of-the-implementation-of-aec-blueprint-executive-summary.html; accessed on 2 November 2014)
Grossman, Gene M., and Helpman, Elhanan. (1994). ‘Protection for sale’. The American
Economic Review 84 (4): pp.833-850.
Heimenz, Ulrich, and Rolf J. Langhammer. (1990). Regional integration among developing
countries: Opportunities, obstacles, and options. Tubingen, Germany: Westview Press.
Helble, M.; B. Shepherd; and Wilson, J.S. (2009). ‘Transparency and regional integration in the Asia-Pacific’. World Economy, 32(3): 479-508.
29
Hertel, T.W. (1997), Global Trade Analysis: Modeling and Applications, Cambridge University Press.
Hew, D; Sen, R; Lee, Poh Onn; Sellakumaran, M; Montreevat, S and Jin, Nigam K (2005) ‘ISEAS Concept Paper on the ASEAN Economic Community’ in Denis Hew (Eds) Roadmap to an ASEAN Economic Community, Singapore: Institute of Southeast Asian Studies
Higgott, Richard (1997) ‘De facto and de jure regionalism: the double discourse of regionalism in the Asia Pacific’, Global Society, 11:2, 65–83
Jaber, Abdel Tayseer. (1971). ‘A review article: The relevance of traditional integration theory to less developed countries’. Journal of Common Market Studies 9 (3): pp. 254-267.
Kawai, M (2005) ‘East Asian Economic Regionalism: Progress and Challenges’, Journal of Asian Economies, 16(1), pp: 29-55.
Kawai, M and Wignaraja, G (2008) ‘Regionalism as an Engine of Multilateralism: A Case for a Single East Asian FTA’, Working Paper Series on Regional Economic Integration, No. 14, Asian Development Bank
Krueger, A. O. (1997). ‘Free trade agreements versus customs unions’. Journal of Development
Economics, 54(1), 169-187.
Lipsey, R. G. (1957). ‘The Theory of Customs Unions: Trade Diversion and Welfare’. Economica, New Series 24 (February): pp. 40-46.
Lipsey, R. G. (1960). ‘The theory of customs unions: A general survey’. The Economic Journal 70 (279): pp. 496-513.
Mansfield, Edward D., and Milner, Helen V. (1999). ‘The new wave of regionalism’. International Organization 53 (3): pp.589-627.
Meade, J. E. (1955). The theory of customs unions. Amsterdam: North Holland
Lawrence, Robert Z. (1997). ‘Preferential trading arrangements: The traditional and the new’. in Ahmed Galal and Bernard Hoekman (eds) Regional Partners in Global Markets:
Limits and Possibilities of the Euro-Med Agreements, Center for Economic Policy Research (CEPR) and the Egyptian Center for Economic Studies (ECES).
Nair, Deepak. (2011). ‘ASEAN’s Core Norms in the Context of the Global Financial Crisis’, Asian Survey, 51 (2): 245-67
Narayanan, B., Betina, D., & Robert, M. (2012). ‘GTAP 8 data base documentation—chapter 2’ Guide to the GTAP database. Center for Global Trade Analysis.
Nesadurai, Helen E S. “Trade Policy in Southeast Asia: Politics, Domestic Interests and the Forging of New Accommodations in the Regional and Global Economy”, in Routledge Handbook of Southeast Asian Politics, ed. Richard Robison, London and New York: Routledge, 2012, 318-22.
Plummer, Michael. (2006) ‘An ASEAN Customs Union?’, Journal of Asian Economic, 17: 923-938
Ravenhill, John. (1995) ‘Economic Cooperation in Southeast Asia’, Asian Survey, Vol. 35, No. 9: 850-66
Sally, Razeen. (2008) Trade Policy, New Century, The Institute of Economic Affairs
30
Sally, Razeen and Sen Rahul. (2005). ‘Whither Trade Policies in Southeast Asia? The Wider Asian and Global context’, ASEAN Economic Bulletin, 22 (1): 92-115
Schiff, Maurice, and Winters, L. Alan. (1998). ‘Dynamics and politics in regional integration arrangements: An introduction’. The World Bank Economic Review 12 (2): pp.177-195.
Severino, Rodolfo. (2006) Southeast Asia in Search of an ASEAN Community, Singapore: Institute of Southeast Asian Studies.
Soesastro, H. (2005), ‘ASEAN Economic Community: Concepts, Costs and Benefits’, in Denis Hew (eds), Roadmap to an ASEAN Economic Community, Singapore: Institute of Southeast Asian Studies, pp. 13-30
Urata, S and Kiyota, K (2005) The impacts of an East Asia free trade agreement on foreign trade in East Asia. In International Trade in East Asia, NBER-East Asia Seminar on
Economics, Volume 14 (pp. 217-252). University of Chicago Press.
Viner, Jacob. (1950). The Customs Union Issue. New York: Carnegie Endowment for International Peace.
World Economic Forum (2014), The Global Enabling Trade Report 2014, Switzerland
31
Table 1: Regionalism- The Old and The New
The Old Regionalism The New Regionalism
Import Substitution Planned allocation of resources Led by governments Mainly industrial products
Export orientation Market allocation of resources Led by private firms All goods, services and investments
Source: Lawrence (1997)

32
Table 2: Selected Macroeconomic Indicators of ASEAN, 2012
GDP per capita, PPP
(current international
$)
GDP growth (annual
%)
Gross capital
formation (% of GDP)
Gross domestic
savings (% of GDP)
Agriculture, value
added (% of GDP)
Manufacturing, value added (% of GDP)
Services, etc., value added (% of GDP)
Trade (% of GDP)
Trade in services (% of GDP)
Foreign direct investment,
net inflows (% of GDP)
Singapore 75913.57 2.50 30.37 52.80 0.04 20.38 73.29 367.72 82.87 21.32
Malaysia 22280.15 5.64 25.77 37.63 10.05 24.24 49.10 162.41 26.33 3.19
Thailand 13976.37 7.67 29.74 30.87 12.27 33.98 44.17 148.83 28.07 2.92
Indonesia 9009.82 6.26 34.74 33.18 14.50 23.97 38.72 50.15 6.63 2.24
Philippines 6109.76 6.81 18.46 15.28 11.84 20.55 57.07 64.79 13.31 1.29
Vietnam 4998.20 5.25 27.24 30.75 19.67 17.39 41.70 156.55 14.20 5.37
Cambodia 2839.22 7.31 .. .. 35.56 16.03 40.19 .. 29.11 10.25
Lao PDR 4464.89 8.20 31.86 19.66 27.98 8.40 35.81 84.68 .. 3.14
Brunei 72917.27 0.95 13.60 63.78 0.72 11.79 28.21 112.54 .. 5.07
Source: World Bank (2014)

33
Table 3a: Trends in export shares of ASEAN members in total world exports, 2012
World ASEAN-
10 ASEAN-
6 EU US CJK CIJK+CER Others
Brunei 11,917 13.1 8.5 0.1 0.7 63.6 85.0 1.1
Indonesia 190,031 22.0 20.4 9.5 7.8 35.2 44.6 16.1
Malaysia 227,766 26.8 24.7 8.9 8.7 28.1 36.9 18.7
Philippines 51,992 18.9 17.6 11.4 14.2 36.4 37.8 17.7
Singapore 409,709 31.7 28.6 9.2 5.5 19.4 26.8 26.8
Thailand 227,883 24.6 17.2 9.4 10.0 24.0 31.1 24.8
Cambodia
7,837 12.8 11.3 24.1 13.4 5.9 6.5 43.1
Laos
3,326 46.5 34.3 8.6 0.7 25.1 30.4 13.8
Myanmar
8,267 45.8 44.6 2.3 0.0 25.6 40.6 11.3
Vietnam
110,795 15.6 12.6 18.3 17.8 28.0 32.7 15.6 Source: Calculated from the CEIC database, 2013. Note: CJK refers to China, Japan and Korea among ASEAN+3 members, while CIJK+CER represents the CJK, India and CER members (Australia and New Zealand).
Table 3b: Trends in import shares of ASEAN members in total world imports, 2012
World ASEAN-
10 ASEAN-
6 EU US CJK CIJK+CER Others
Brunei
6,456 43.2 42.9 24.0 2.7 26.4 27.7 2.4
Indonesia
191,691 28.0 26.6 7.4 6.1 33.5 38.8 19.7
Malaysia
196,592 27.9 25.1 10.8 8.1 29.5 34.2 19.0
Philippines
67,886 22.9 21.3 7.5 11.5 28.5 32.6 25.6
Singapore
379,960 21.0 20.2 12.6 10.2 23.3 28.2 28.0
Thailand
251,464 16.1 12.9 8.1 5.1 38.3 42.1 28.7
Cambodia 7,062
35.5
22.2
3.2
1.7 39.5 41.3 18.3
Laos 6,340
70.4
63.1
4.6
0.6 21.5 22.6 1.8
Myanmar 17,035
36.8
36.0
1.8
0.4 53.4 57.5 3.6
Vietnam 111,640
18.6
17.7
7.9
4.3 50.1 54.0 15.2 Source: Calculated from the CEIC database, 2013. Note: CJK refers to China, Japan and Korea among ASEAN+3 members, while CIJK+CER represents the CJK, India and CER members (Australia and New Zealand).

34
Table 4: Trends in Intra and Extra-ASEAN FDI flows (US $ million)
Country Intra-ASEAN
Extra-ASEAN Total FDI net inflows
Share of Intra-
ASEAN FDI in Total FDI inflows (%)
Share of Extra-
ASEAN FDI in Total FDI inflows (%)
Brunei 31.50
833.30
864.80
3.6 96.4
Cambodia 523.00
1,034.10
1,557.10
33.6 66.4
Indonesia 7,587.90
11,550.00
19,137.90
39.6 60.4
Lao PDR 73.60
220.70
294.30
25.0 75.0
Malaysia 2,813.90
6,586.10
9,400.00
29.9 70.1
Myanmar 151.20
1,203.00
1,354.20
11.2 88.8
Philippines 145.20
2,651.80
2,797.00
5.2 94.8
Singapore 8,410.80
51,400.70
59,811.50
14.1 85.9
Thailand (342.00)
11,041.20
10,699.20
3.2 103.2
Viet Nam 1,262.50
7,105.50
8,368.00
15.1 84.9
ASEAN 20,657.60
93,626.40
114,284.00
18.1 81.9
Source: ASEAN FDI Statistics Database, ASEAN Secretariat
35
Table 5: Top-Ten Commodities traded among ASEAN Member States, 2012
HS-Code
Export Commodities Value (in US$ Million)
Share (% in total trade)
27 Mineral fuels, mineral oils and products of their distillation; bituminous substances; mineral waxes
84291.9 26.03
85 Electrical machinery and equipment and parts thereof; sound recorders and reproducers, television image and sound recorders and reproducers, and parts and accessories of
58959.2 18.21
84 Nuclear reactors, boilers, machinery and mechanical appliances; parts thereof
40571.2 12.53
87 Vehicles other than railway or tramway rolling stock, and parts and accessories thereof
14465.5 4.47
39 Plastics and articles thereof 12515.9 3.86
29 Organic chemicals 7175.9 2.22
90 Optical, photographic, cinematographic, measuring, checking, precision, medical or surgical instruments and apparatus; parts and accessories thereof
6619 2.04
15 Animal or vegetable fats and oils and their cleavage products; prepared edible fats; animal or vegetable waxes
6093.3 1.88
73 Articles of iron or steel 5666 1.75
40 Rubber and articles thereof 5600 1.73
Ten major export commodities 241957.9 74.7
Others 81897.1 25.3
Total 323855 100
HS-Code
Import Commodities Value (in US$ Million)
Share (% in total trade)
27 Mineral fuels, mineral oils and products of their distillation; bituminous substances; mineral waxes
84881.7 30.51
85 Electrical machinery and equipment and parts thereof; sound recorders and reproducers, television image and sound recorders and reproducers, and parts and accessories of
52348.5 18.82
84 Nuclear reactors, boilers, machinery and mechanical appliances; parts thereof
28074.3 10.09
87 Vehicles other than railway or tramway rolling stock, and parts and accessories thereof
11860.6 4.26
36
39 Plastics and articles thereof 10084.4 3.62
29 Organic chemicals 5835.7 2.10
71 Natural or cultured pearls, precious or semi-precious stones, precious metals, metals clad with precious metal, and articles thereof; imitation jewellery; coin
5719.2 2.06
15 Animal or vegetable fats and oils and their cleavage products; prepared edible fats; animal or vegetable waxes
5433.6 1.95
40 Rubber and articles thereof 5085.6 1.83
90 Optical, photographic, cinematographic, measuring, checking, precision, medical or surgical instruments and apparatus; parts and accessories thereof
4459.1 1.60
Ten major import commodities 213782.7 76.8
Others 64410.4 23.2
Total 278193.1 100
Source: ASEAN Statistical Yearbook 2013, The ASEAN Secretariat
37
Table 6a: Trends in Average Ad-Valorem MFN Applied tariffs across top ten industries in intra-ASEAN imports by member country
HS code Brunei Indonesia Malaysia Philippines Singapore Thailand Cambodia Laos Myanmar Vietnam
15 0.0 4.3 2.9 5.8 0.0 60.4 7.0 10.9 1.9 9.6
27 0.0 3.9 0.4 1.7 0.0 2.2 7.2 6.2 0.9 2.3
29 0.0 3.8 0.1 2.0 0.0 0.5 6.3 5.0 1.0 0.8
39 0.0 8.6 10.7 8.4 0.0 7.7 5.4 8.9 2.4 7.4
40 3.6 7.5 19.2 5.0 0.0 8.3 11.8 7.9 3.3 9.0
71 2.3 6.1 0.4 4.9 0.0 4.9 1.7 5.0 14.5 8.7
72 0.0 5.2 7.0 2.8 0.0 3.3 3.5 5.0 1.1 2.9
84 7.5 4.8 3.3 2.1 0.0 3.9 13.3 6.0 1.6 3.0
85 13.3 5.6 4.1 3.9 0.0 8.3 16.9 8.1 4.7 8.0
87 6.0 15.3 16.7 12.4 0.0 32.2 15.3 17.2 5.4 28.1
Simple average MFN
for top 10 3.3 6.5 6.5 4.9 0.0 13.2 8.8 8.0 3.7 8.0
Minimum across sectors 0.0 3.8 0.1 1.7 0.0 0.5 1.7 5.0 0.9 0.8
Source: WTO Tariff Analysis Online database, 2014. Tariff data corresponds to 2008 for Lao, 2011 for Brunei, 2012 for Cambodia and 2013 for all the other ASEAN members. HS Codes are explained in Table 3

38
Table 6b: Trends in Average, Peaks and Dispersions in Ad-Valorem MFN Applied tariffs across ASEAN-6 and ASEAN-10 in intra-ASEAN imports
HS code
Average (ASEAN-
10) Average
(ASEAN-6) Max across ASEAN-6
Max across ASEAN-10
STDEV (ASEAN-
10)
STDEV (ASEAN-
6)
15 10.3 12.2 60.4 60.4 18.0 23.7
27 2.5 1.4 3.9 7.2 2.5 1.5
29 2.0 1.1 3.8 6.3 2.3 1.5
39 5.9 5.9 10.7 10.7 3.8 4.7
40 7.6 7.3 19.2 19.2 5.3 6.6
71 4.9 3.1 6.1 14.5 4.3 2.6
72 3.1 3.1 7.0 7.0 2.3 2.8
84 4.5 3.6 7.5 13.3 3.8 2.5
85 7.3 5.9 13.3 16.9 4.9 4.5
87 14.9 13.8 32.2 32.2 9.9 11.0
Simple average MFN
for top 10 goods 6.3 6.6 13.2 13.2 3.6 4.4
Minimum across goods 1.5 1.6 3.8 5.0 1.7 1.5
Source: Authors’ calculations using WTO (2014); STDEV refers to Standard Deviation measure. Tariff data corresponds to 2008 for Lao, 2011 for Brunei, 2012 for Cambodia and 2013 for all the other ASEAN members. HS Codes are explained in Table 3
39
Table 7: Trends in ATIGA Applied preferential tariffs across top ten industries in intra-ASEAN imports, as of 2012
HS code ASEAN-6* Cambodia** Lao PDR** Myanmar** Vietnam**
15- Animal or vegetable fats and oils 0.0 5.0 10.0 0.0 5.0
27 - Mineral fuels, mineral oils and their products 0.0 5.0 5.0 0.0 20.0
29 - Organic chemicals 0.0 5.0 5.0 0.0 0.0
39 - Plastics and articles thereof 0.0 5.0 20.0 3.0 5.0
40 - Rubber and articles thereof 0.0 5.0 10.0 5.0 3.0
71 -Natural or cultured pearls, precious or semi-precious stones 0.0 5.0 5.0 0.0 5.0
72-Iron and Steel 0.0 5.0 5.0 1.0 5.0
84 - Nuclear reactors, boilers, machinery 0.0 5.0 10.0 1.5 5.0
85 - Electrical machinery and equipment 0.0 5.0 10.0 1.0 5.0
87 - Vehicles other than railway 0.0 5.0 40.0 5.0 5.0 Source : Authors’ calculations based on ASEAN Secretariat website (http://www.asean.org/news/item/annex-2-tariff-schedules). Note: * For Indonesia, some products under HS 29 and 87 continue to apply MFN rates. ** The ATIGA tariffs for CLMV countries show peak tariffs of between 5-10% and higher than that for specific products within the above HS 2 digit sectors. Myanmar ATIGA tariffs are based on 2013 data.

40
Table 8: Enabling Trade Index Rankings for ASEAN members, 2014
Enabling Trade Index 2014
Rankings
Market Access Sub-index
Border Administration
Sub-index
Infrastructure Sub-index
Operating Environment
Sub-index
Domestic Market Access
Foreign Market Access
Efficiency and Transparency
of Border Administration
Singapore 1 3 13 1 1 2
Malaysia 25 75 42 33 23 27
Thailand 57 113 12 56 46 75
Indonesia 58 26 37 69 64 61
Philippines 64 19 26 71 89 82
Vietnam 72 76 28 86 60 81
Cambodia 93 133 1 108 101 74
Lao PDR 98 121 4 114 115 68
Myanmar 121 97 6 117 136 134 Source: World Economic Forum (2014)
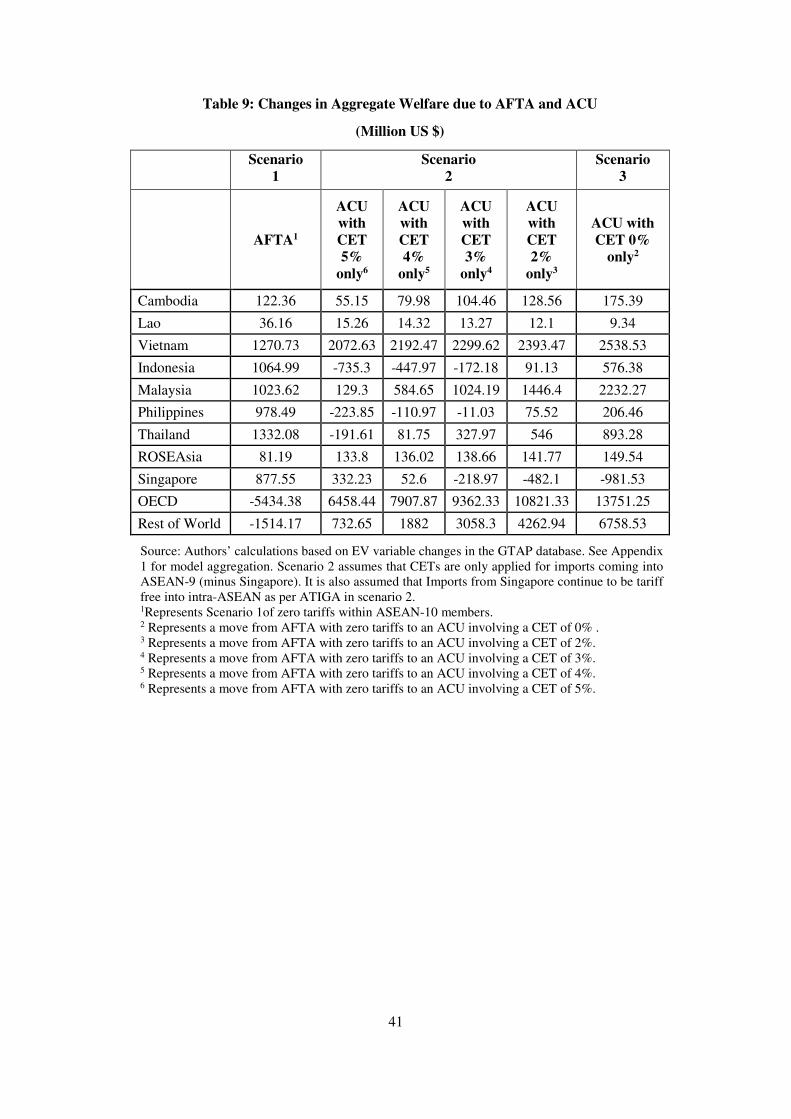
41
Table 9: Changes in Aggregate Welfare due to AFTA and ACU
(Million US $)
Scenario 1
Scenario 2
Scenario 3
AFTA1
ACU with CET 5%
only6
ACU with CET 4%
only5
ACU with CET 3%
only4
ACU with CET 2%
only3
ACU with CET 0%
only2
Cambodia 122.36 55.15 79.98 104.46 128.56 175.39
Lao 36.16 15.26 14.32 13.27 12.1 9.34
Vietnam 1270.73 2072.63 2192.47 2299.62 2393.47 2538.53
Indonesia 1064.99 -735.3 -447.97 -172.18 91.13 576.38
Malaysia 1023.62 129.3 584.65 1024.19 1446.4 2232.27
Philippines 978.49 -223.85 -110.97 -11.03 75.52 206.46
Thailand 1332.08 -191.61 81.75 327.97 546 893.28
ROSEAsia 81.19 133.8 136.02 138.66 141.77 149.54
Singapore 877.55 332.23 52.6 -218.97 -482.1 -981.53
OECD -5434.38 6458.44 7907.87 9362.33 10821.33 13751.25
Rest of World -1514.17 732.65 1882 3058.3 4262.94 6758.53
Source: Authors’ calculations based on EV variable changes in the GTAP database. See Appendix 1 for model aggregation. Scenario 2 assumes that CETs are only applied for imports coming into ASEAN-9 (minus Singapore). It is also assumed that Imports from Singapore continue to be tariff free into intra-ASEAN as per ATIGA in scenario 2. 1Represents Scenario 1of zero tariffs within ASEAN-10 members. 2 Represents a move from AFTA with zero tariffs to an ACU involving a CET of 0% . 3 Represents a move from AFTA with zero tariffs to an ACU involving a CET of 2%. 4 Represents a move from AFTA with zero tariffs to an ACU involving a CET of 3%. 5 Represents a move from AFTA with zero tariffs to an ACU involving a CET of 4%. 6 Represents a move from AFTA with zero tariffs to an ACU involving a CET of 5%.

42
Table 10: Changes in Real GDP due to AFTA and ACU (%)
Scenario 1
Scenario 2
Scenario 3
AFTA1
ACU with CET 5%
only6
ACU with CET 4%
only5
ACU with CET 3%
only4
ACU with CET 2%
only3
ACU with CET 0%
only2
Cambodia 2.70 1.58 1.88 2.19 2.49 3.09
Lao 0.91 0.54 0.57 0.60 0.63 0.68
Vietnam 1.60 5.38 5.90 6.43 6.95 7.97
Indonesia 0.22 -0.18 -0.07 0.03 0.13 0.33
Malaysia 0.38 0.02 0.34 0.65 0.96 1.56
Philippines 0.69 -0.24 -0.08 0.08 0.24 0.52
Thailand 0.51 0.04 0.25 0.46 0.66 1.03
RO SEAsia 0.27 0.09 0.14 0.20 0.25 0.34
Singapore 0.21 0.10 0.03 -0.03 -0.09 -0.21
OECD -0.01 0.01 0.01 0.02 0.02 0.02
Rest of World -0.01 0.01 0.01 0.01 0.02 0.03
Source: Authors’ calculations based on qgdp variable changes in the GTAP database. See Appendix 1 for model aggregation. Scenario 2 assumes that CETs are only applied for imports coming into ASEAN-9 (minus Singapore). It is also assumed that Imports from Singapore continue to be tariff free into intra-ASEAN as per ATIGA in scenario 2. 1Represents scenario of zero tariffs within ASEAN-10 members. 2 Represents a move from AFTA with zero tariffs to an ACU involving a CET of 0% . 3 Represents a move from AFTA with zero tariffs to an ACU involving a CET of 2%. 4 Represents a move from AFTA with zero tariffs to an ACU involving a CET of 3%. 5 Represents a move from AFTA with zero tariffs to an ACU involving a CET of 4%. 6 Represents a move from AFTA with zero tariffs to an ACU involving a CET of 5%.

43
Table 11: Aggregate Changes in Real GDP due to AFTA and ACU (%)
Scenario
1 Scenario
2 Scenario
3
AFTA1
ACU with CET 5%
only6
ACU with CET 4%
only5
ACU with CET 3%
only4
ACU with CET 2%
only3
ACU with CET 0%
only2
ASEAN-9 0.43 1.21 0.81 0.61 0.40 0.19
Singapore 0.20 -0.21 -0.09 -0.03 0.03 0.10
OECD -0.01 0.02 0.01 0.01 0.01 0.01
Rest of World -0.01 0.03 0.02 0.02 0.01 0.01
Source: Authors’ calculations based on qgdp variable changes in the GTAP database.
See Appendix 1 for model aggregation. Scenario 2 assumes that CETs are only applied
for imports coming into ASEAN-9 (minus Singapore). It is also assumed that Imports
from Singapore continue to be tariff free into intra-ASEAN as per ATIGA in scenario
2. 1Represents scenario of zero tariffs within ASEAN-10 members. 2 Represents a move from AFTA with zero tariffs to an ACU involving a CET of 0% . 3 Represents a move from AFTA with zero tariffs to an ACU involving a CET of 2%. 4 Represents a move from AFTA with zero tariffs to an ACU involving a CET of 3%. 5 Represents a move from AFTA with zero tariffs to an ACU involving a CET of 4%. 6 Represents a move from AFTA with zero tariffs to an ACU involving a CET of 5%.
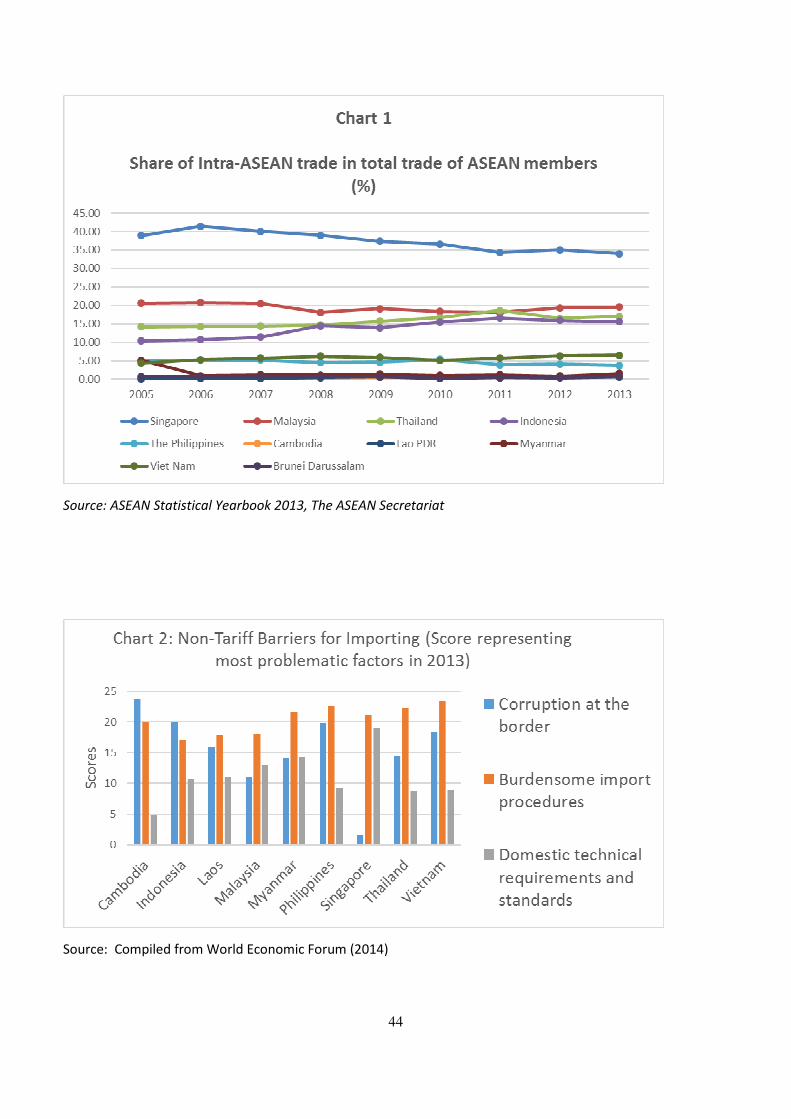
44
Source: ASEAN Statistical Yearbook 2013, The ASEAN Secretariat
Source: Compiled from World Economic Forum (2014)
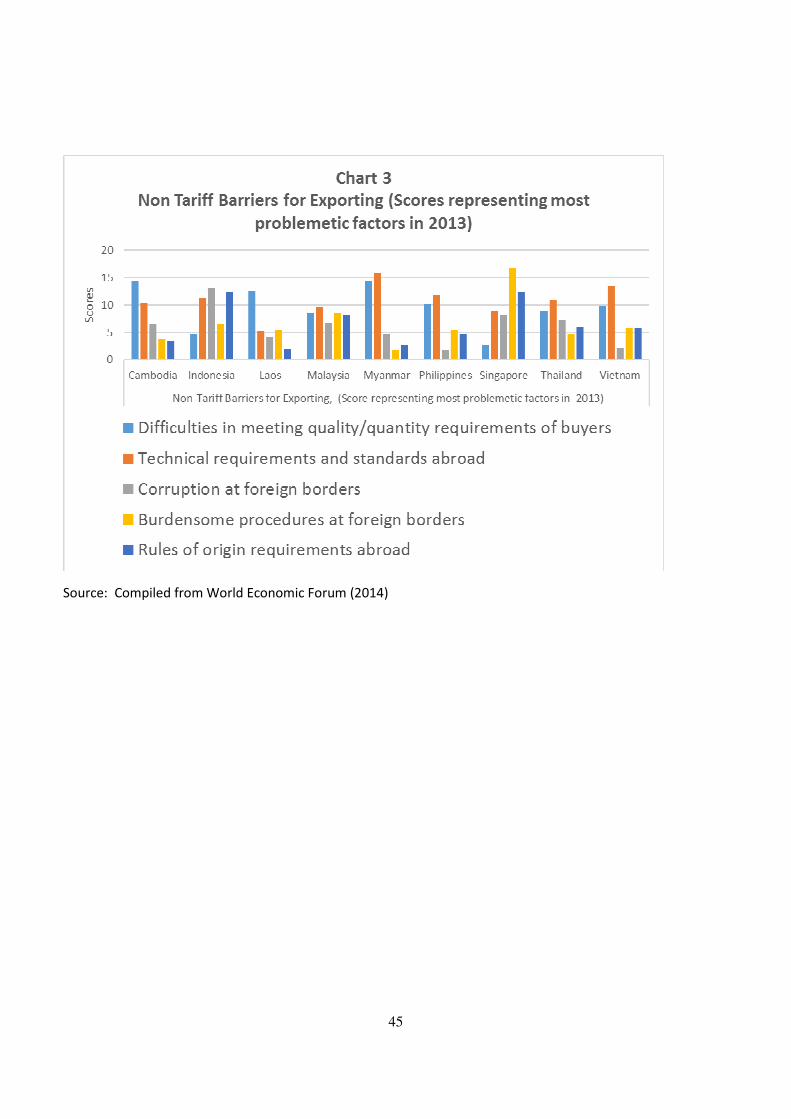
45
Source: Compiled from World Economic Forum (2014)

46
Appendix 1: Regional and Sectoral Aggregations used in the policy simulation
Regional Agreggation
No. Code Region Description Comprising old regions
1 Cambodia Cambodia Cambodia.
2 Indonesia Indonesia Indonesia.
3 OECD OECD OECD Member countries
4 Lao Lao PDR Lao People's Democratic Republic
5 Malaysia Malaysia Malaysia.
6 Philippines Philippines Philippines.
7 Singapore Singapore Singapore.
8 Thailand Thailand Thailand.
9 Vietnam Vietnam Viet Nam.
10 ROSEAsia Rest of Southeast Asia Rest of Southeast Asia aggregating Brunei and Myanmar
11 RestofWorld Rest of World All the remaining GTAP countries
12 ASEAN-9 ASEAN-9 members of the ACU (excluding Singapore)
Aggregation of GTAP regions Cambodia, Indonesia, Lao People's Democratic Republic, Malaysia, Philippines, Thailand, VietNam, and Rest of Southeast Asia

47
Sectoral Aggregation
No. GTAP Code (HS 2 digit) Sector Description Comprising old sectors
1 vol (15) Vegetable Oil and Fats Vegetable oils and fats.
2 omn (25, 27, 71) Minerals, N.E.C Minerals nec.
3 Agl Agri, Forestry, Fishing Agriculture, Forestry, Fishery, Beverages and Tobacco products
4 Extraction (27) Mining and Extraction Coal; Oil; Gas.
5 Petro (27) Petroleum Products Petroleum, coal products.
6 Crubplas (39 , 40) Chemicals, Rubber, Plastics Chemical,rubber,plastic products
7 othmfg Other manufacturing Textiles; Wearing apparel; Leather products; Wood products; Paper products, publishing.
8 LightMnfc (71, 72, 87) Light Manufacturing Metal products; Motor vehicles and parts; Transport equipment nec; Manufactures nec.
9 HeavyMnfc (84,85 and 87) Heavy Manufacturing
Mineral products nec; Ferrous metals; Metals nec; Electronic equipment; Machinery and equipment nec.
10 Util_Cons Utilities and Construction Electricity; Gas manufacture, distribution; Water; Construction.
11 TransComm Transport and Communication Trade; Transport nec; Sea transport; Air transport; Communication.
12 OthServices Other Services Financial Insurance Business Recreation and other services; PubAdmin/Defence/Health/Educat; Dwellings.
Source: Based on GTAP 8.1; HS 2 digit concordances with the GTAP sectors are based on HS-6 digit combined –GTAP concordance information available at http://wits.worldbank.org/product_concordance.html