a&e delays: why did patients wait longer last winter? · why did patients wait longer last...
TRANSCRIPT

www.gov.uk/monitor
A&E delays:
Why did
patients wait
longer last
winter?

2
About Monitor
As the sector regulator for health services in England, our job is to make the health sector work better for patients. As well as making sure that independent NHS foundation trusts are well led so that they can deliver quality care on a sustainable basis, we make sure: essential services are maintained if a provider gets into serious difficulties; the NHS payment system promotes quality and efficiency; and patients do not lose out through restrictions on their rights to make choices, through poor purchasing on their behalf, or through inappropriate anti-competitive behaviour by providers or commissioners.
Acknowledgements
This report would not have been possible without the help of many people with extensive knowledge and experience of A&E services. Monitor’s economics team is enormously grateful to everyone who contributed and would like to thank in particular the following individuals and organisations:
Nigel Edwards, Chief Executive at the Nuffield Trust for the quality assurance of the report
Dr Mauro Laudicella from City University and Imperial College for the quality assurance of the econometrics
NHS providers
All the acute trusts with a type 1 A&E department who completed our A&E information request
The staff of the trusts we visited for helping us to understand how A&E works in practice and their valuable insights into the challenges facing A&E departments:
o Royal Free London NHS Foundation Trust
o Homerton University Hospital NHS Foundation Trust
o Southend University Hospital NHS Foundation Trust
o George Eliot Hospital NHS Trust
o London Ambulance Service

3
National bodies/other organisations
Association of Ambulance Chief Executives
Association of Directors in Adult Social Services (including the Helping People Home team)
Cabinet Office (Prime Minister’s Implementation Unit)
Department of Health
Emergency Care Intensive Support Team
Health Foundation
The King’s Fund
National Audit Office (NAO)
National Institute for Health and Care Excellence (NICE)
NHS England
NHS Providers
NHS Trust Development Agency (TDA)
North West Utilisation Management Unit at Greater Manchester Academic Health Science’s Network (GMAHSN)
Nuffield Trust
Nuffield Trust Emergency Care Summit attendees who provided feedback on our preliminary findings
Public Health England
Royal College of Emergency Medicine
Royal College of Nursing
Royal College of Physicians

4
Foreword
As Monitor’s senior clinicians, we welcome this thorough report on what made it so hard for England’s hospital trusts to meet the four-hour emergency care standard last winter. The report’s main finding is that trusts’ performance against this important standard fell sharply in the third quarter of 2014/15 because hospitals were too full. Most clinicians knew this already. But what the rigorous number crunching in this report also demonstrates to NHS policy-makers is that accident and emergency (A&E) departments themselves rose to the challenge and coped well with the 6% average rise in A&E attendances last winter.
Departments generally secured the staff and capacity to deal with the greater numbers of attendances and staff worked harder. Levels of sickness among patients appeared to remain relatively stable, and the proportion of patients admitted from A&E to the hospital bedbase remained stable too. The real bottleneck occurred when it came to finding beds for patients being admitted from A&E. Inpatient wards lacked capacity and became blocked up. This had a significant impact on the exit flow from A&E departments themselves, which in turn had an adverse impact on the ability of staff in A&E to care for their patients.
The effect of the bottleneck between emergency departments and inpatient wards on performance against the four-hour standard shows how this standard is actually a quite sophisticated measure of complex interactions within the whole of a local health and care system. What the measure tells us about whole health care systems has never been more important. Staff in all areas on the frontline worked hard to maintain safe effective care last winter but many patients who needed to be admitted to hospital still had to wait for a bed, undoubtedly affecting their experience adversely at times.
The report’s findings suggest that among the best ways to make sure patients receive emergency treatment in a timely fashion this coming winter is to concentrate on smoothing the flow of patients through inpatient wards, to the point of discharge and beyond. That also makes capacity in social and community care important, as the report highlights, and this is beyond the control of hospital trusts. But there are many ways to free up acute capacity that hospital managers can consider, from schemes to provide care to patients closer to home and more standardised management of non-complex elective patients, to smaller-scale but continuous operational improvements across the board.
While this report has concentrated on the causes of poor four- hour system performance last winter, the next stage is to focus on solutions that can be maintained into the longer term. Monitor and the Nuffield Trust, among others, will shortly publish more on options for improving patient flows.

5
Any policies and solutions must not, of course, neglect A&E services themselves, which in some areas remain acutely challenged and fragile. Monitor is working closely with our partners to develop a support programme for the most challenged services. The report shows others too will need more help to continue to cope with any increases in attendance.
The key will be to make sure every link in the complex, dynamic matrix measured by the four-hour emergency care standard is as strong as possible. This will lead to safer, more efficient care and, equally important, improved patient experience. We have no doubt there is still much to do but this report and its findings are a valuable contribution that merit attention and action.
Hugo Mascie-Taylor
Medical Director Patient and Clinical Engagement
Taj Hassan
Associate Medical Director; Urgent and Emergency Care Patient and Clinical Engagement
Ruth May
Nurse Director Patient and Clinical Engagement

6
Contents
Acknowledgements ________________________________________________________ 2
Foreword ________________________________________________________________ 4
Summary ________________________________________________________________ 7
1. Background _________________________________________________________ 14
2. Hypotheses and approach to testing them __________________________________ 15 2.1 Our framework ...................................................................................................................... 15 2.2 How we tested the 10 hypotheses ........................................................................................ 18
3. Our findings _________________________________________________________ 19 3.1 Deterioration in A&E waiting times in Q3 2014/15 was not due to worse operational
performance by A&E departments ....................................................................................... 21 3.2 Patients waiting to be admitted to hospital from A&E were the main national reason for
A&E delays ........................................................................................................................... 27 3.3 Other hospital departments could not accommodate the increased admissions from
A&E ....................................................................................................................................... 27 3.4 Changes in social and community care capacity may explain part of recent A&E waiting
times performance, although their impact is hard to measure ............................................. 31 3.5 Increased activity within A&E departments is unlikely to be sustainable in the medium to
long term ............................................................................................................................... 33
7
Summary
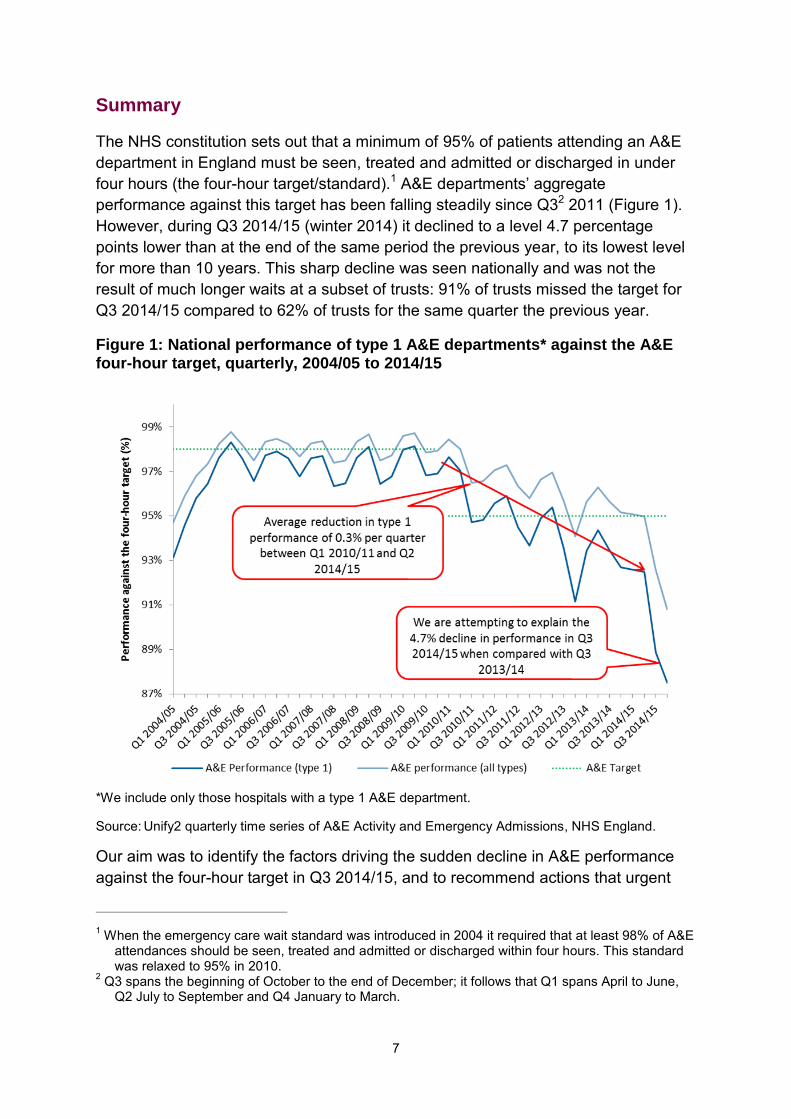
The NHS constitution sets out that a minimum of 95% of patients attending an A&E department in England must be seen, treated and admitted or discharged in under four hours (the four-hour target/standard).1 A&E departments’ aggregate performance against this target has been falling steadily since Q32 2011 (Figure 1). However, during Q3 2014/15 (winter 2014) it declined to a level 4.7 percentage points lower than at the end of the same period the previous year, to its lowest level for more than 10 years. This sharp decline was seen nationally and was not the result of much longer waits at a subset of trusts: 91% of trusts missed the target for Q3 2014/15 compared to 62% of trusts for the same quarter the previous year.
Figure 1: National performance of type 1 A&E departments* against the A&E four-hour target, quarterly, 2004/05 to 2014/15
*We include only those hospitals with a type 1 A&E department.
Source: Unify2 quarterly time series of A&E Activity and Emergency Admissions, NHS England.
Our aim was to identify the factors driving the sudden decline in A&E performance against the four-hour target in Q3 2014/15, and to recommend actions that urgent
1 When the emergency care wait standard was introduced in 2004 it required that at least 98% of A&E
attendances should be seen, treated and admitted or discharged within four hours. This standard was relaxed to 95% in 2010.
2 Q3 spans the beginning of October to the end of December; it follows that Q1 spans April to June, Q2 July to September and Q4 January to March.

8
care systems and national bodies could take to stop it from happening again this winter. We have done this by analysing relevant national data, the response to a trust information request, interviews with experts and observations from trust visits.
Our analysis indicates that half of the 4.7 percentage point decline in A&E performance against the four-hour target in winter 2014 could be explained by national systemic challenges. The most important national cause was hospitals’ inability to accommodate the increase in admissions from A&E departments generated by the increase in A&E attendances. This inability was a result of hospitals running at very high occupancy rates of 90% or above. Other factors such as blockages at other stages in the patient pathway had either a minor or an unquantifiable impact on A&E delays (Figure 2). Our findings advocate that measures taken by hospitals and urgent care systems to improve patient flow through hospital departments other than A&E and back into the community may be highly effective in avoiding another sharp decline in A&E performance against the four-hour target this winter.
Figure 2: Drivers of the decline in A&E performance against the four-hour target in Q3 2014/15
The other half of the 4.7 percentage point decline is likely to be explained by local drivers of A&E performance, which our analysis at the national level are unable to capture, and potentially other drivers for which data are not yet available, in particular expenditure on social care.
Our view is that the available evidence for the half of the decline that can be explained is strong enough to underpin policy, and that the findings of the analysis point to particular policy interventions that are likely to help prevent the decline from occurring again.

9
A&E departments kept pace with the increase in demand for their services
A&E type 1 attendances3 at and admissions to hospital from A&E were both 5.9% higher in Q3 2014/15 compared to Q3 2013/14. Although these increases were higher than those reported for the previous year, they were not out of line with the historical trend (Figure 3).
Figure 3: National trend in type 1 A&E attendances, admissions and performance against the four-hour target, quarterly, 2010/11 to 2014/15
Source: Unify2 Weekly A&E Activity and Emergency Admissions Sitreps, Department of Health (DH).
Our findings show that during winter 2014 A&E departments were as effective at managing patients as they had been the previous winter, despite there being an increased number of attendances. Though there were more attendances and admissions, the ‘sickness profile’ (ie the relative levels of sickness of patients)4 for each of these groups did not change considerably and the rate of attendances converting to admissions remained stable at 27.9%. This indicates that patients were
3 Type 1 attenders are those patients who attend type 1 A&E departments and are judged to be in
urgent need of care; type 2 attenders at type 1 departments are those patients who need single specialty treatment; type 3 attenders at type 1 departments refer to patients judged not to be in need of urgent care and who can be directed to a minor injuries unit.
4 We have used different proxies for the level of sickness as there is no perfect measure of degree of ‘sickness’. These included a points-based score severity index (Charlson index), data on triage categories of attenders, number of ambulance journeys and age of attenders. Section 3.1 gives further information on the proxies used.

10
not more likely to be admitted last winter, ie A&E staff had not become more risk averse.
Staffing problems do not seem to have been responsible for the decline in A&E performance against the four-hour target in Q3 2014/15. There were 4% more A&E staff per attendance in April to October 2014 than in April to October 2013, an increase which broadly kept pace with the demands on A&E.5 The skill mix and experience of staff did not change considerably. Also, although numbers of temporary staff increased, hospitals employed more regular temporary staff to fill vacancies, reducing the risk of problems from employing temporary staff who are unfamiliar with organisational processes, practices and culture.
Lastly, the physical capacity6 available to A&E departments did not make an important contribution to the decline in A&E waiting times performance. Capacity did not appear to have changed and A&E departments seem to have used the available capacity better as they were meeting increased emergency care demands.
Although A&E departments were managing the increased number of attendances, we found they were beginning to show signs of strain in 2014/15. For example, the number of ambulance handover delays increased by 55%, reaching 133,026 in 2014/15 compared with 86,003 the previous year. Furthermore, the average waiting times for initial assessment in A&E departments increased by 10 minutes (to 48 minutes) in Q3 2014/15 compared to Q3 2013/14. These are signs that A&E departments are at significant risk of not being able to sustain their performance in the medium to long term.
Other hospital departments became less able to accommodate admissions
from A&E because of their very high occupancy rates
Our analysis finds that rising bed occupancy rates were associated with worsening A&E performance against the waiting times target. Hospitals whose occupancy levels rise from less than 85% to greater than 90% typically face a 1 percentage point fall in the performance of their type 1 A&E department against the four-hour target; when occupancy exceeds 95%, A&E performance falls by a further 0.6 percentage points.
On average, NHS hospitals were operating at bed occupancy rates of 89.7% throughout Q3 2014/15, with 72 trusts registering rates above 90%, 14 more than in Q3 2013/14. Even marginal increases in occupancy are likely to have had a disproportionate negative impact on A&E performance. One indication of the effect of
5 This conclusion is based on an extrapolation of the data for previous quarters as the available data
were limited to October 2014. 6 We interpret the term ‘capacity’ in relation to A&E as a combination of staffing and physical capacity.
Physical capacity includes the space in A&E departments (number of beds, cubicles, etc) as well as all the services required to undertake A&E work (diagnostics, etc).

11
this rise in bed occupancy rate on A&E performance was that in Q3 2014/15 the average wait until departure from A&E for admitted patients was 17.1% higher (an increase of 39 minutes to 267 minutes) than it was in Q3 2013/14; the equivalent increase for non-admitted patients was 9.4% (an increase of 13 minutes to 151 minutes).
On average, hospitals did not have the flexibility to accommodate more admissions from A&E by reducing elective admissions, as they were also facing more difficulties managing their elective activities than in previous years. For instance , during winter 2014, hospitals dealt with the unexpectedly high A&E activity by cancelling urgent elective operations and did not ring-fence beds for elective care.
Hospitals could become more flexible in the number of admissions they can take from A&E by making operational changes to improve patient flows through inpatient departments. Lord Carter’s interim report into provider productivity identifies how improving patient flow could bring substantial savings to the NHS. The report suggests the NHS could save up to £2 billion through improving workflow and containing workforce costs.7
Impact of changes in social and community care on occupancy rates is hard to
measure
Hospitals did encounter more difficulties transferring patients awaiting discharge to other care providers. Delayed transfers of care (DTOC) increased by 27% in Q3 2014/15 compared to the same period the previous year.8 According to the response to our information request, this is likely to have been the result of reductions in social and/or community care capacity.9
While the reduction in social care capacity may be attributable to the widely reported reductions in the eligibility threshold for council funding for social care, we were unable to quantify the effect of changes in social care expenditure on the worsening A&E performance against the four-hour target mainly because social care
7 Lord Carter of Coles (2015) Review of operational productivity in NHS providers. Interim Report. An
independent report for the Department of Health. Available from: www.gov.uk/government/uploads/system/uploads/attachment_data/file/434202/carter-interim-report.pdf
8 Note there are concerns around the quality of data on DTOC, at least in absolute terms, as national data do not reflect the views expressed in Monitor and existing trust-level surveys. However, from the available data we observed a significant increase (albeit from a relatively small base number) in the number of delayed discharges from acute beds for which the delay could be attributed to social care organisations: a 42.4% increase in Q3 2014/15 compared to the same period the previous year. In contrast, delays attributed to failings of NHS organisations only increased by 7.7%.
9 60% of trusts that responded to our information request stated that DTOC had increased due to reductions in social care capacity; 45% to reductions in social care funding packages; 55% to reduction in domiciliary care provided by community providers (55%); and 46% to reductions in step-down/rehabilitation capacity in the community.
12
expenditure data are not available for 2014/15.10 However, we think the effect on A&E performance is not large because DTOC accounted for only 4% of occupied beds during Q3 2014/15, up from 3.1% in Q3 2013/14. Therefore, increasing the rate of transfers from hospital to community and/or social care appears unlikely to ease occupancy rates considerably.11 That said, if delays continue to increase and DTOC occupy a greater proportion of beds this winter, these could potentially have an impact on A&E delays.
Similarly, although trusts reported changes in community care expenditure to be a driver of the decline in A&E performance against the four-hour target, the limited available data indicate an increase in spending on community services in the last few years.12 That said, it is not possible to calculate how much of the community care budget is spent on patients coming from an urgent care pathway or the impact community care has on both A&E attendances and admissions.
Therefore, while in response to our information request trusts reported an impact of changes in social and/or community care capacity on both occupancy rates and A&E performance against the four-hour target, available data have not allowed us to quantify this impact.
Recommendations and next steps
Our analysis indicated that measures taken by local health systems to improve patient flow through hospital departments other than A&E are likely to be the most important systemic means of avoiding another sharp decline in A&E performance this winter. However, signs of strain on A&E departments indicate they will also need support to maintain their effectiveness if demand continues to rise. We are working with our national partners, the NHS Trust Development Authority (TDA), NHS England and Department of Health (DH), to identify what is being done and what more could be done to address some of the challenges faced by urgent care systems across England.
We recommend urgent care systems and national bodies prioritise the following actions to help local health systems improve their A&E waiting times performance:
1. improving patient flows through urgent care systems to increase processing capacity
10 We found no relation between changes in public adult social care spending and A&E delays.
However, given that data for 2014/15 are not yet available, we cannot quantify the effect of any reduction in spending.
11 We found that increases in bed days due to DTOC were considerably smaller than those due to increased occupancy rates.
12 Data on community care expenditure for 2014/15 per care commissioning group (CCG) are not yet available, but data on primary care trust (PCT) spending on community services show an increase between 2010/11 and 2012/13, from £8.4 billion to £9.7 billion.

13
2. gaining a better understanding of the impact of social and community care. This will require the collection of additional information to reveal the impact of DTOC on overall patient flows through hospitals, and the impact on the number of DTOC of:
changes to social care provision thresholds for public funding of individuals’ social care community services
3. addressing the medium- to long-term sustainability of A&E departments
4. supporting local efforts to tackle challenges, eg through system resilience groups (SRGs).
The steps being taken are listed in Figure 4.
Figure 4: Next steps
*Available from: http://www.england.nhs.uk/ourwork/futurenhs/5yfv-ch3/new-care-models/uec/

14
1. Background
A&E has been the focus of public interest and performance management in the NHS for at least the last decade. Since the introduction of the four-hour standard in 2004, the speed with which people move through A&E departments has become a key indicator of how the system is operating. The standard was set at 98% in 2004 but reduced to 95% in 2010.13
A&E performance against the ‘95% within four hours’ target declined considerably in 2014/15 compared to previous years. During the financial year 2014/15, the average performance of acute trust type 1 A&E services14 against the target fell to 90.5%, 3 percentage points lower than the previous year’s average.
The decline was particularly sharp between October and December 2014: average A&E performance dropped to 88.8%, 4.7 percentage points lower than in the same period in 2013/14 (Figure 5).
We have sought to explain the sharp decline in A&E performance against the four-hour target during the winter of 2014. Full analysis of the long-term trends in A&E performance was beyond our scope, as was consideration of any potential impact of the decline – or the impact of possible measures to avoid it happening again – on patient outcomes and quality of care. However, our findings do help to explain the decline in A&E performance against the four-hour target since 2010 as we analysed data going back to Q1 2010/11.
The deterioration in A&E waiting times performance over this period was a national trend rather than a localised one: 91% of all trusts in England failed to meet the A&E four-hour target during Q3 2014/15, up from 62% over the same period in the previous year.
Breaches of the four-hour target were concentrated among patients admitted to an inpatient hospital ward through A&E, as opposed to those attending an A&E department and then being discharged after treatment. Late admissions accounted for 63% of breaches in Q3 2014/15 compared to 61% for the same period the
13 Further information on the A&E waiting time indicator:
College of Emergency Medicine (2011) Emergency department clinical quality indicators: A CEM guide to implementation. Available from: www.rcem.ac.uk/code/document.asp?ID=5832 Blunt I (2014) Focus on: A&E attendances. Why are patients waiting longer? Quality Watch, The Health Foundation and Nuffield Trust. Available from: www.nuffieldtrust.org.uk/sites/files/nuffield/publication/140724_focus_on_ae_attendances.pdf
14 A type 1 A&E department is a consultant-led 24-hour service with full resuscitation facilities and designated accommodation for the reception of A&E patients. A type 2 A&E department is a consultant-led single-specialty A&E service (eg ophthalmology, dentistry) with designated accommodation for the reception of patients. A type 3 A&E department may be doctor led or nurse led. It may be co-located with a major A&E department or sited in the community. A defining characteristic of a service qualifying as a type 3 department is that it treats minor injuries and illnesses (eg sprains) and can be routinely accessed without appointment.

15
previous year. Patients who breached the target waited on average 300 minutes longer in the A&E department during Q3 2014/15 than those who did not breach the target.
Figure 5: National performance of type 1 A&E departments* against the A&E four-hour target, quarterly, 2004/05 to 2014/15
*We include only those hospitals with a type 1 A&E department.
Source: Unify2 Quarterly A&E attendances and emergency admission statistics, NHS England.
2. Hypotheses and approach to testing them
The meeting of the four-hour target seems to have been a national difficulty, suggesting that trusts across England shared common systemic challenges. Our objective was to answer the following questions:
1. What specific factors drove the national decline in A&E performance against the four-hour target in 2014/15?
2. What actions by urgent care systems and national bodies are likely to be most effective in helping to avoid these factors having the same impact in the future?
2.1 Our framework
The complex interactions between the A&E department and other areas of the health and social care system mean performance against the A&E four-hour target is likely

16
to be determined by factors along the emergency care patient pathway, both those occurring within and beyond the immediate control of the A&E department.
A&E is in constant interaction with other hospital departments (to request diagnostic tests or specialist opinions and/or to transfer patients to wards elsewhere in the hospital) but also with other players in the social and community care system (to transfer patients to other care settings, to request social and/or community care funding, etc).
A&E waiting times performance is therefore dependent on processes and capacity in other hospital departments and other parts of the system. Figure 6 summarises how patients ‘flow’ into, through and beyond A&E departments on the emergency care pathway and shows how the system performed in Q3 2014/15 compared to Q3 2013/14.15
From considering all the different stages of the emergency care pathway we developed a framework of 10 hypotheses for factors that could be driving A&E waiting times performance (Figure 7). Our aim was to test whether changes in those factors could have caused the sharp decline in A&E waiting times performance observed in Q3 2014/15. We drew on a wide range of qualitative evidence to develop the hypotheses, gathered from a high level review of the literature on drivers of A&E performance; interviews with senior operational and clinical experts in emergency care; and site visits to four A&E departments and one ambulance dispatch centre.
For each of the 10 hypotheses, our analysis aimed to answer the following questions:
1. Was there a change in the factor between Q3 2013/14 and Q3 2014/15? 2. Did this change have a negative impact on A&E waiting times performance
during Q3 2014/15, and how reliable is the evidence for this? 3. What caused the change to occur?
15 For further explanation of how A&E departments interact with the rest of the system, watch The
King’s Fund (2014) An alternative guide to the urgent and emergency care system in England. Available from: www.kingsfund.org.uk/projects/urgent-emergency-care/alternative-guide-urgent-and-emergency-care-system-england
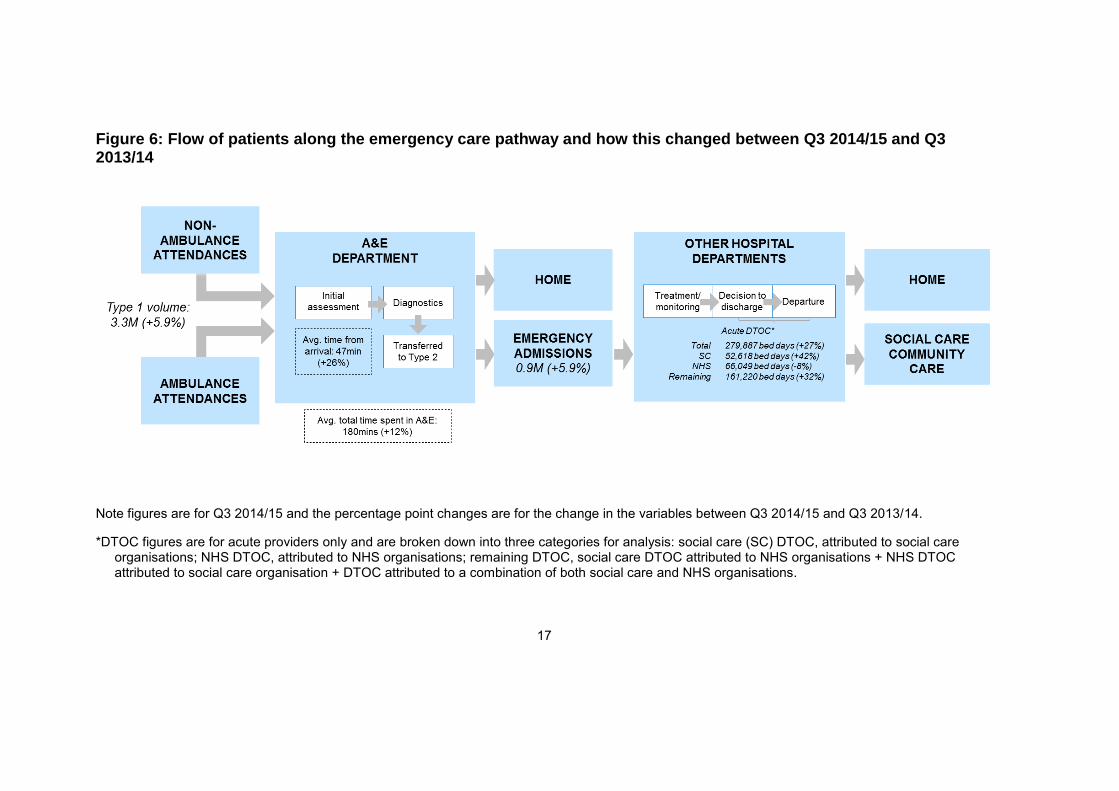
Figure 6: Flow of patients along the emergency care pathway and how this changed between Q3 2014/15 and Q3 2013/14
Note figures are for Q3 2014/15 and the percentage point changes are for the change in the variables between Q3 2014/15 and Q3 2013/14.
*DTOC figures are for acute providers only and are broken down into three categories for analysis: social care (SC) DTOC, attributed to social care organisations; NHS DTOC, attributed to NHS organisations; remaining DTOC, social care DTOC attributed to NHS organisations + NHS DTOC attributed to social care organisation + DTOC attributed to a combination of both social care and NHS organisations.
17

Figure 7: The 10 hypotheses
2.2 How we tested the 10 hypotheses
We used three methods of analysis:
Examination of the trends and patterns observed in the data for each
factor potentially driving performance against the waiting times target to identify any changes in these variables during 2014/15, and the relationship of those variables to A&E waiting times performance. We used different sources of data:
o Hospital Episode Statistics (HES)
o Weekly A&E Attendances and Emergency Admissions Sitreps
o Electronic Staff Record (ESR) data
o Quarterly Bed Availability and Occupancy returns
o Monthly Situation Report data.
For each of the variables, we analysed the long-term trends and the specific change between Q3 2013/14 and Q3 2014/15. We also calculated the correlation between the variables and A&E performance against the four-hour target. Our analysis of HES was based on a 5% sample of the data stratified at the trust and week levels.

18
A univariate, bivariate and multivariate econometric analysis of data on
A&E performance (a full description of the econometric analysis is given in a separate document), which identified statistically significant factors that were driving performance against the four-hour target when controlling for the effect of other factors,16 and determined the impact of changes in these statistically significant factors on A&E performance in Q3 2014/15.
Analysis of the response to an information request sent to all NHS trusts and foundation trusts with a type 1 A&E department. The information request covered important changes affecting patient pathways that occurred during 2014/15 but for which no national data are available, such as changes in local authority spending on social care. It asked respondents for their view on the impact of these changes on their A&E waiting times performance. Respondents also provided new data on staff vacancy rates and their use of non-permanent staff. We received 123 responses, representing 96% of providers with a type 1 A&E department.
For each of the hypotheses, we combined the findings from each of these analytical approaches to determine whether the factor tested in the hypothesis was a driver of the decline in A&E waiting times performance. Where possible, we gave greatest weight to evidence from the econometric model in reaching conclusions.
A full explanation of our approach to testing the hypotheses and rating the reliability of the findings is given in a separate document.
3. Our findings
Our econometric modelling explained half of the observed decline in hospitals’ A&E performance against the four-hour target in Q3 2014/15. It showed that the most important driver of the decline common to most hospitals nationally was a reduction in their ability to accommodate the increase in admissions from A&E departments. This resulted from hospitals running at very high occupancy rates – 90% or above. Therefore, measures taken by urgent care systems to improve patient flow through hospital departments other than A&E and into the community are likely to be an effective approach to avoiding another sharp decline in A&E performance this winter.
Figure 8 summarises our conclusions and the findings on which they are based.
16 Statistical significance means the observed relationship between the factor and A&E waiting times
performance would be very unlikely if it were driven by random chance alone.
19

20
Figure 8: Drivers of challenge in meeting the A&E four-hour target in Q3 2014/15
Note that the percentage point changes are for the change in the variables between Q3 2013/14 and Q3 2014/15.

21
A summary of the findings for each hypothesis is given in Figure 9. While we have sought to provide a definitive answer for each hypothesis, data quality concerns mean that for several of the hypotheses tested we cannot always be confident in the reliability of the conclusions. Therefore, we rated the strength of the evidence underpinning our conclusions for each hypothesis. We used a RAG rating to reflect the confidence in the data available. Green is used when the available data are strong, amber when data are available but not collected consistently and red when data are not available and we needed to use proxies.
Figure 9: Summary of and confidence in the findings from the 10 hypotheses tested
3.1 Deterioration in A&E waiting times in Q3 2014/15 was not due to worse
operational performance by A&E departments
The analysis indicates that the 2014 deterioration in A&E performance against the four-hour target was not a reflection of the overall operational performance of A&E departments, ie they did not perform worse than in previous years.17 In particular:
17 We cannot, however, say on the basis of the examined data whether quality of care improved or
worsened.
22
Although there were more attendances and admissions from A&E, the profile of A&E patients did not change considerably and A&E staff did not change the way they dealt with patients.18
We found no evidence that problems with staffing in A&E contributed to the deterioration in waiting times performance at a national level.
The capacity available to A&E departments did not appear to have declined. Rather, it seems that A&E departments utilised available capacity more effectively to meet the increased emergency care demand.
A&E staff maintained their effectiveness despite higher attendances
On average nationally, type 1 attendances in Q3 2014/15 were 5.9% higher than in the same period the previous year. However, A&E staff did not change the way they managed attendances, meaning they maintained their level of effectiveness despite treating more patients and apparently were not more risk averse in their treatment decisions than in previous years. We draw the latter conclusion from the facts that:
there was no change in the proportion of A&E attendances admitted to hospital (the conversion rate19); it was 27.9% in both Q3 2013/14 and Q3 2014/15
patient age and level of sickness, time of day and day of the week of arrival, and referral routes of admitted patients (the patient profile) were relatively stable.
It can be argued that if the admitted patients in Q3 2014/15 were less sick than those admitted in Q3 2013/14, the constant conversion rate could indicate that A&E staff had become more risk averse in their management of patients. However, the available evidence indicates this was not the case, as described below.
Level of sickness
Levels of sickness are challenging to measure directly so we used a variety of proxies and give our confidence in the evidence a red rating (see Figure 9).20 That said, the proxies point towards stable or slightly increased levels of sickness among patients attending A&E and admitted from A&E (this is consistent with the evidence
18 By ‘profile’, we mean patient age and level of sickness (acuity), time of day and day of the week of
arrival, and referral route – these were the factors examined in our analysis. 19 We acknowledge the long-term upward trend in conversion rates, but there was no change
between Q3 2013/14 and Q3 2014/15.20 DH is beginning some work to look in more detail at the level of sickness as it relates to emergency attendances.
20 DH is beginning some work to look in more detail at the level of sickness as it relates to emergency attendances.

23
collected by the North West Commissioning Support Unit (CSU) that has been shared with us):
The average Charlson index21 was 0.5 in the winters of both 2013 and 2014, indicating there was no change in the level of illness of admitted patients. However, this index does not cover all conditions and therefore all attenders.
The ratio of A&E attenders categorised as ‘urgent’ and ‘very urgent’ in relation to those classified as standard and non-urgent increased from 1 to as high as 1.2 between September and December 2013, and 1 to 1.3 between September and December 2014 (Public Health England data on the triage categories of attenders at a sample of A&E departments across the country), indicating a slight increase in the sickness of attenders.
The number of ambulance journeys to type 1 and 2 A&E departments was 7% higher in Q3 2014/15 compared to Q3 2013/14, which could indicate an increase in the level of sickness of patients.
The average age of attenders rose from 39.3 to 39.8 years. This again may indicate a very small increase in the level of sickness as older patients generally are sicker than younger ones.
We looked at the possibility that there was an unexpected infectious disease outbreak during Q3 2014/15. Such outbreaks can have a negative impact on A&E waiting times performance because hospitals cannot plan for them. However, we found no evidence for such an outbreak. In particular:
There were no considerable increases in the proportion of patients admitted under specialties likely to be affected by an infectious disease outbreak (gastroenterology, respiratory medicine, infectious diseases or genitourinary medicine) (HES data22).
The percentage of patients recorded as attending A&E for a respiratory condition peaked at 15% during Q3 2014/15, but this peak occurred after A&E waiting times performance had begun to decline sharply (Public Health England data). Respiratory problems only became more common than in 2013 around the end of November 2014, by which time A&E waiting times
21 A points-based score of the severity of admitted patients’ co-morbidities based on inpatient codes. 22 This analysis is based on a 5% sample of HES data stratified at the trust and week levels.
24
performance had already declined substantially and A&E attendances and admissions had already started rising.23
Staffing problems in A&E were not a factor in A&E waiting times performance
decline
We found no evidence that problems with staffing in A&E contributed to the deterioration in waiting times performance at a national level. The increase in number of A&E staff per attendance kept pace with the increases in A&E attendances and admissions.24 In particular:
The number of staff per attendance was 4% higher between April and October 2014 than between April and October 2015 (Figure 10; ESR data). This was driven in large part by a 9.2% increase in the number of full-time equivalent (FTE) nurses, although increases were also recorded in the numbers of senior and junior doctors, both locum and permanent.25
We found no statistical link between staffing and A&E waiting times performance.
In response to our information request, around 30% of trusts reported problems with some aspect of staffing in 2014. However, generally, trusts did not feel that changes in staffing were linked to their deterioration in A&E waiting times performance.26 That said, we observed some variation between hospitals, suggesting staffing problems may not have been a national problem but one affecting A&E waiting times performance at particular hospitals.
23 Public Health England data are derived from a non-representative sample of trusts, given that
Emergency Department Syndromic Surveillance System (EDSSS) data are based on voluntary submissions. Only 28% of trusts with type 1 A&E departments submitted information on A&E attendances with respiratory conditions.
24 This is based on an extrapolation of the data for the previous quarters as the available data were limited to October 2014.
25 The only available data on temporary staff were the number of locum doctors. We have no data on bank staff or any type of temporary nursing staff. The locum rate increased from 1.8% in October 2013 to 1.9% in October 2014. Available ESR data extended only to October 2014 when A&E waiting times performance was starting to decline.
26 The most widespread problem, mentioned by 31% of trusts, was the availability of non-clinical managers to help identify and manage patient flow problems. However, only 5% of trusts said this had a large or very large impact on A&E performance against the waiting times standard. Further, 28% of trusts considered they had less access to senior decision-makers at the triage stage, although only 7% stated this had a large or very large impact. Given that 60% of trusts experienced a decline in A&E waiting times performance between the winters of 2013 and 2014, it does not appear these anecdotal examples of rising problems with staffing can contribute much to explaining the national decline against the A&E waiting times target. However, staffing problems may have been the main challenge for some individual trusts.

25
We found that neither the skill mix of the medical workforce available to A&E departments nor their use of temporary staff was a significant factor in the waiting times performance decline. In particular:
The ratio of junior to senior staff (a proxy for the skill mix of medical staff) did not increase (Figure 10).27 This is relevant because less experienced staff have been found to be less efficient and more risk averse than senior colleagues, sometimes taking longer to treat patients or conducting more tests.28
Evidence from the information request suggested that the numbers of temporary staff had risen. However, hospitals are increasingly using the same temporary staff each time they need to cover vacancies, which increases familiarity with local A&E systems and possibly motivation.
Figure 10: National profile and numbers of A&E staff, monthly, October 2011/12 to October 2014/1529
Source: ESR data, DH. 27 We have divided the medical workforce into senior and junior categories. ‘Senior’ comprises
registrar and higher levels. 28 See for example: Wyatt JP, Henry J, Beard D (1999) The association between seniority of Accident
and Emergency doctor and outcome following trauma. Injury 30 (3),165-168. White AL, Armstrong PA, Thakore S (2010) Impact of senior clinical review on patient disposition from the emergency department. Emergency Medicine Journal 27, 262-265 Sen A, Hill D, Menon D, Rae F, Hughes H, Roop R (2010) The impact of consultant-delivered service in emergency medicine: the Wrexham Model. Emergency Medicine Journal 29 (5), 366-371.
29 ESR data for the months following October 2014 were not available when we conducted our analysis. We observe from Figure 10 that there is a modest upward trend for the number of A&E staff.

26
Physical capacity available to A&E departments did not decline
Physical bed capacity in A&E departments is critical to their ability to treat patients within the waiting times target. Both national data and the response to our information request suggested the bed capacity available to A&E departments has remained stable rather than fallen.
The number of escalation beds (beds allocated to A&E departments for use during times of high demand or extraordinary pressures) increased from 3% of the total general and acute (G&A) bed stock in 2013/14 to 3.8% in 2014/15, an increase of more than 50,000 escalation bed days in total. However, few of these beds were available at the start of November 2014 (Figure 11). Compared with 2013, the number of escalation beds increased particularly rapidly in the first weeks of December and January (weeks 5 and 10 in Figure 11), ie after our Q3 2014/15 analysis period, which may imply that they were opened in reaction to worsening performance.
Figure 11: Number of escalation beds available for A&E use during the winter months, weekly, 2012/13 to 2014/15
Source: Unify2 Daily Winter Sitreps.
The response to our information request confirmed that A&E departments were not closing physical capacity over the period of analysis. Only 11% of trusts reported having to close bays or cubicles in their A&E department. A bigger impediment to patient flow faced by 31% of A&E departments was the lack of access to short stay wards for patients admitted from A&E for observation and treatment in A&E during stays of up to 72 hours. Approximately 14% of trusts stated this had a large or very

27
large negative impact on their A&E waiting times performance.
3.2 Patients waiting to be admitted to hospital from A&E were the main
national reason for A&E delays
All three types of the data we analysed suggested that it was specifically patients waiting to be admitted to hospital, rather than those attending A&E without being admitted, who were associated with worse A&E waiting times performance. In other words, the point of admission from A&E to hospital was a bottleneck in the A&E patient pathway. In particular:
Between Q3 2013/14 and Q3 2014/15, the average wait until departure from an A&E department increased by 17.1% (an increase of 39 minutes, raising the average wait to 267 minutes) for admitted patients but only 9.4% (an increase of 13 minutes, raising the average wait to 151 minutes) for non-admitted patients.
In our econometric modelling, a 10 percentage point increase in the conversion rate of type 1 attendances to admissions was associated with a 0.3 percentage point decline in waiting times performance.
Increases in type 1 attendances were not associated with declines in waiting times performance; this is consistent with expert opinion.
3.3 Other hospital departments could not accommodate the increased
admissions from A&E
Hospitals’ difficulties in accommodating increases in emergency admissions via A&E was the main identifiable national factor in driving the half of the decline in waiting times performance that could be explained in our analysis. In particular:
Hospitals had high levels of bed occupancy, making it very difficult for them to accommodate the increased demand for admissions from A&E departments.
Hospitals were unable to manage occupancy levels by improving the flow of elective patients.
Recent improvements in the overall management of inpatient capacity and hospital processes were not enough to cope with the increased demand for services from A&E patients.

28
Impact of high levels of bed occupancy on A&E waiting times30
In 2014/15, most hospitals were operating at bed occupancy rates above 85% – the level at which DH and NHS England suggest hospitals will struggle to deal with fluctuations in demand.31 Bed occupancy rates were particularly high in winter 2014, with 72 trusts registering rates above 90%, 14 more than in winter 2013.
NHS bed occupancy rates have increased because demand for services has risen while supply has remained relatively stable. As illustrated in Figure 12, the number of overnight beds available has remained roughly constant since 2012.
Figure 12: Average hospital bed occupancy rates (G&A) and number of beds
available, type 1 acute, quarterly, Q1 2011/12 to Q3 2014/15
Source: Bed availability data, NHS England.
At such high levels of occupancy, even a small increase in demand can have a large detrimental effect on performance. In particular:
30 Consistent with the literature, the interview programme and the responses we received to the
information request, more than 40% of trusts reported that capacity constraints had had an impact on their A&E waiting times performance.
31 Note this 85% bed occupancy ‘threshold’ rate has been challenged as evidence indicates there is no unique optimal rate of hospital bed utilisation. Indeed, the ideal rate depends on (a) the size of the hospital, (b) the category of bed and (c) the out-of-hospital support in a particular health and social care system. See for example Jones R (2011) A paradigm shift for bed occupancy. British Journal of Healthcare Management 17 (8), 376-377.

29
Occupancy above 85% in our model was associated with a 0.4 percentage point reduction in A&E performance against the waiting times target; above 90% was associated with a further 0.6 percentage point reduction; and above 95% with a further 0.6 percentage points.
Anecdotal evidence from senior A&E clinicians and managers suggests that when hospitals are under pressure from high demand and constrained capacity, patients are more likely to be allocated to inappropriate wards. These patients are known as ‘medical outliers’. This leads not only to lower quality of care for the outliers but also more inefficient use of resources. However, we have not been able to quantify the number of medical outliers and their impact on A&E waiting times performance, as national data on medical outliers are not routinely collected.
Hospitals were unable to manage occupancy levels by improving the flow of
elective patients
Our analysis suggests that hospitals were unable to mitigate the detrimental effects of the high bed occupancy levels on A&E waiting times by improving the flow of elective patients. In fact these high levels contributed to a deterioration in the management of elective activity as well.
The performance of the admitting wards of the hospital is challenging to measure, given the number of different wards and departments interacting with each other. All of the proxies used to measure this, however, point towards hospitals having more difficulties in managing their elective activities in 2014/15 than in the previous year. In particular:
During winter 2014, hospitals dealt with the unexpectedly high A&E activity by cancelling urgent elective operations and did not ring-fence beds for elective care. More than 29,000 elective operations were cancelled during that period (25.4% more than in winter 2013).32 According to the response to our information request, only 18% of trusts ring-fenced beds to treat elective patients.33
The volume of elective activity fell by 2% between Q3 2013/14 and Q3 2014/15.
32 Monitor analysis using Winter Sitreps data. 33 Monitor A&E information request.

30
General improvements in the management of inpatient capacity and hospital
processes were insufficiently advanced to cope with the increased demand for
services
Our analysis suggests that hospitals may have slightly improved the efficiency of their inpatient departments (ie non-A&E inpatient wards) in recent years. However, this improvement did not go far enough to allow hospitals to accommodate the increase in emergency admissions in Q3 2014/15.
We used the length of stay (LoS) of inpatient admissions as a proxy for the efficiency of admitting wards (but note that LoS may be affected by factors other than efficiency, such as delayed discharges arising from, for example, lack of capacity in social or community care beyond the hospital’s control). We found:
Average LoS for patients admitted to hospital departments other than A&E (including day cases) decreased slightly from 1.3 days in Q1 2011/12 to 1.2 days in Q2 2014/15 (Figure 13), equivalent to a 2.9% reduction in average LoS per year. Excluding day cases, LoS for patients admitted to hospital departments other than A&E decreased from 3.19 in Q1 2011/12 to 3.12 in Q2 2014/15.34
Within the context of a constant or small increasing level of sickness of patients, this suggests that providers achieved some efficiencies in the admitting wards of hospitals. However, LoS has not been falling fast enough to match the rate of increase in emergency admissions. The resulting disparity between the demand for and supply of capacity drives the higher levels of bed occupancy and in turn the decline in A&E waiting times performance (see Summary).
Figure 13: Trends in national average length of stay (in bed days) including
and excluding day cases, quarterly, Q1 2011/12 to Q2 2014/15
Source: HES data, Health and Social Care Information Centre (HSCIC).
34 Data from Q3 2014/15 were not included in this analysis as they would include patients whose
inpatient stay had not yet concluded and so would likely underestimate LoS.

31
3.4 Changes in social and community care capacity may explain part of
recent A&E waiting times performance, although their impact is hard to
measure
We found quantitative evidence suggesting the number of DTOC was higher in Q3 2014/15 than in Q3 2013/14. Qualitative evidence indicated that reductions in the capacity of social and/or community care services could have contributed to the higher occupancy rates in Q3 2014/15.35 However, we could not quantify the effect of these changes on bed occupancy or A&E waiting times performance. Nevertheless, the available data show that DTOC resulting from changes in social and community care account for only a very small proportion of total bed occupancy. Better patient flow through improvements in hospitals’ internal processes is likely to be more important in improving A&E performance than reductions in DTOC, although these will also be critical.
DTOC are a growing challenge for trusts
National data show a trend for hospitals having more difficulties discharging patients to care providers outside hospital. DTOC were 27% higher for Q3 2014/15 than for Q3 2013/14.
This is likely to be partly the result of reductions in local authority-funded social care and (NHS-funded) community care capacity,36 as reported by trusts in response to our information request. In particular, more than 50% of respondents reported they had experienced more DTOC as a result of reductions in social and community care capacity37 and fewer available rehabilitation beds. Reduction in social and/or community care capacity was a reported top five factor contributing to declining A&E waiting times performance in Q3 2014/15 in our information request.
The absence of social care data from 2014/15 did not allow us to quantify the effect of social care expenditure on the decline in A&E performance. However, our econometric analysis found that changes in social care expenditure did not affect A&E performance.38
35 60% of trusts reported more DTOC due to reductions in social care capacity; 45% to reductions in
social care funding packages; 55% to reduction of domiciliary care provided by community providers; 46% to reductions in step-down/rehabilitation capacity in the community.
36 Reductions in social care capacity are most likely to be the result of the reduction in publically-funded care (ie due to lower income thresholds for self-funding service users) as opposed to a reduction in private provision.
37 Anecdotally, there have been reports of families of self-funders taking a long time to find places in care settings for elderly relatives, with those people staying in hospital while places are found.
38 Note that as we do not have data for 2014/15, we used lagged social care expenditure in our model. A full explanation of the findings relating to the effect of social care on A&E performance is given in a separate document.

32
Similarly, although trusts reported changes in community care expenditure to be a driver of the decline in A&E performance against the four-hour target, the limited available data indicate an increase in spending on community services in the last few years. That said, it is not possible to calculate how much of the community care budget is spent on patients coming from an urgent care pathway or the impact community care has on both A&E attendances and admissions.
Therefore, it seems that DTOC are an increasing challenge for trusts, although we cannot quantify the size of this challenge or identify the actual sources of delays (or the relative contributions of social care and community care).
DTOC cannot explain the entire increase in occupancy rates
Bed occupancy rates could be driven by a large number of factors along the patient pathway, including increasing difficulties in discharging patients or increasing numbers of patients admitted to hospital (via both emergency and non-emergency care). Understanding the drivers of the high occupancy rates during Q3 2014/15 was beyond the scope of our project. However, using the available evidence we have explored several possibilities in order to get a better understanding of what is behind the high bed occupancy levels.39
Publicly available DTOC data suggest that DTOC could never explain more than a relatively small increase in the overall bed occupancy levels experienced by hospitals because they represent only a very small proportion of occupied beds. In winter 2014 only 4% of occupied beds were unavailable due to DTOC, up from 3.1% in 2013/14 40 Furthermore, Winter Stireps data, unlike Monthly Situation Report data, do not differentiate the DTOC according to the reason a patient has not been discharged. This means patients recorded as DTOC are not necessarily waiting to be transferred to social and community care settings.
In addition, anecdotal evidence from stakeholders suggests that the definition of DTOC is inconsistently applied across the country, meaning that reported DTOC numbers for different trusts (or even different sites within the same trust) may not be comparable. Furthermore, the response to our information request and trust-level surveys undertaken by other organisations suggest that actual DTOC are higher than reported in national data.41
39 A more detailed explanation of what we looked at is given in a separate document. 40 Monitor analysis using Winter Sitreps data. 41 The NHS Confederation surveyed trust chief executives and King’s Fund financial directors and
both reported that DTOC have increased over recent years. See Thompson J (2013) Are delayed transfers a growing problem? London: The King’s Fund. Available here.

33
Hospitals need to address other factors as well as DTOC to ease occupancy
rates
Recent research into the appropriateness of bed usage within acute hospitals suggests that up to 20% of occupied bed days are ‘wasted’ because hospitals do not direct patients to the most appropriate care pathways or settings.42 Similarly, Lord Carter’s interim report into provider productivity finds that improving patient flow could bring substantial savings to the NHS. The report suggests that the NHS could save up to £2 billion through improving workflow and containing workforce costs.43
Research by the Centre for Heath Economics at the University of York looked at the relation between the capacity of nursing and care homes and DTOC. It found that although numbers of DTOC are related to availability of care home beds, the effect is modest. 44
The evidence indicates that hospitals can ease occupancy rates by addressing other factors in addition to DTOC. In particular, processes within hospitals are critical in determining how quickly patients move through them. The critical steps are: timeliness of first consultant review; the completeness of the case management plan, which should include an expected date of discharge and clinical criteria for discharge; then ensuring the tempo of the case management plan is delivered, highlighting potential bottlenecks or constraints and designing them out off the process. The ambition should be to remove all unnecessary waits along a patient journey.
3.5 Increased activity within A&E departments is unlikely to be sustainable
in the medium to long term
While we did not find that A&E capacity and staffing were the main causes of last winter’s decline in waiting times performance, the continuing increases in demand on A&E staff and capacity are unlikely to be sustainable. This may have important consequences for service quality and patient safety.
Our analysis suggests a number of factors may reduce A&E departments’ ability to handle additional activity in future in the way they appear to have been able to last year. In particular, A&E departments in 2014/15 carried out a wider range of In 42 Research by the North West Utilisation Management Unit at Greater Manchester Academic Health
Science’s Network (GMAHSN). 43 Lord Carter of Coles (2015) Review of operational productivity in NHS providers. Interim report. An
independent report for the Department of Health. Available from: www.gov.uk/government/uploads/system/uploads/attachment_data/file/434202/carter-interim-report.pdf
44 Gauhan J, Gravelle H, Sciliani L (2015) Testing the bed-blocking hypothesis: Does nursing and care home supply reduce delayed hospital discharges? Health Economics 24 (Suppl 1), 32-44. Available from: onlinelibrary.wiley.com/doi/10.1002/hec.3150/epdf

34
particular, A&E departments in 2014/15 carried out a wider range of services than in previous years, increasing the volume of activity in A&E departments.
As well as treating higher numbers of less acute attendances, A&E staff are also treating more A&E attenders who are admitted to the A&E department for further observation or treatment.45 Figure 14 shows this trend as an indexed 12-week rolling average. Since 2011, the increase in and pattern of A&E attenders admitted to A&E has followed the pattern of total A&E attenders. However, from early 2014 the numbers treated in A&E increased sharply to a level that was over 23% higher than at the end of 2011. This trend is echoed by trusts’ responses to our information request. Many reported reduced access to short stay wards, even though more escalation beds were available. This means that even though the number of A&E staff has been increasing, they have had to undertake a larger number of activities.
Figure 14: National capacity of A&E departments, 12-week rolling average, December 2011/12 to September 2014/15
Source: Unify2 data, DH; HES data, HSCIC; ESR data, DH.
These trends may make it harder for A&E staff to cope with any future rises in attendances, as more of their scarce resources will be committed. We have observed some signs that strain is already being felt, especially at the early stages of the A&E pathway:
45 This may be the case if, for instance, A&E departments admit patients to short stay wards (such as
clinical decision units) for diagnosis, observation or therapy.

35
ambulance handover delays of more than 30 minutes increased during Q3 2014/15 by 55% compared to the same period for the previous year46
patient time spent in triage increased for Q3 2014/15 compared to Q3 in the previous year: patients waited 48 minutes and 38 minutes respectively before they were first seen in A&E departments.
Most A&E departments are working at a very high level of activity. There is a limit to the workload staff can undertake in the absence of additional staff and/or new capital spending without it having negative consequences on morale, recruitment and retention, performance and/or patient safety.
46 Monitor analysis using Winter Sitreps data from NHS England.
Monitor, Wellington House, 133-155 Waterloo Road, London, SE1 8UG Telephone: 020 3747 0000 Email: [email protected] Website: www.gov.uk/monitor
© Monitor (September 2015) Publication code: IRRES 06/15
This publication can be made available in a number of other formats on request. Application for reproduction of any material in this publication should be made in writing to [email protected] or to the address above.
Contact us