advisory boards:liberty mutual insurance company
TRANSCRIPT

3
01
Lib
ert
y M
utu
al
Gro
up
:
20
01
An
nu
al
Re
po
rt
this is what we do:
Policyholder MessageEdmund F. Kelly, Chairman, President and Chief Executive Officer, tells why
2001 was one of the most significant years in the company's history.
This Is What We DoWhile the insurance marketplace is vastly different from when Liberty Mutual
was founded 90 years ago, our fundamental role as an insurance company
remains the same.
Assess and Assume Risk
Prevent and Manage Loss
Anticipate Your Needs
Deliver on Our Promises
2:
5:
6:
10:
14:
18:
23 Financial Statements
35 Report of Management
35 Report of Independent Auditors
36 Board of Directors
36 Officers
39 Advisory Boards
45 Annual Meetings
Financial Contents
table of contents:
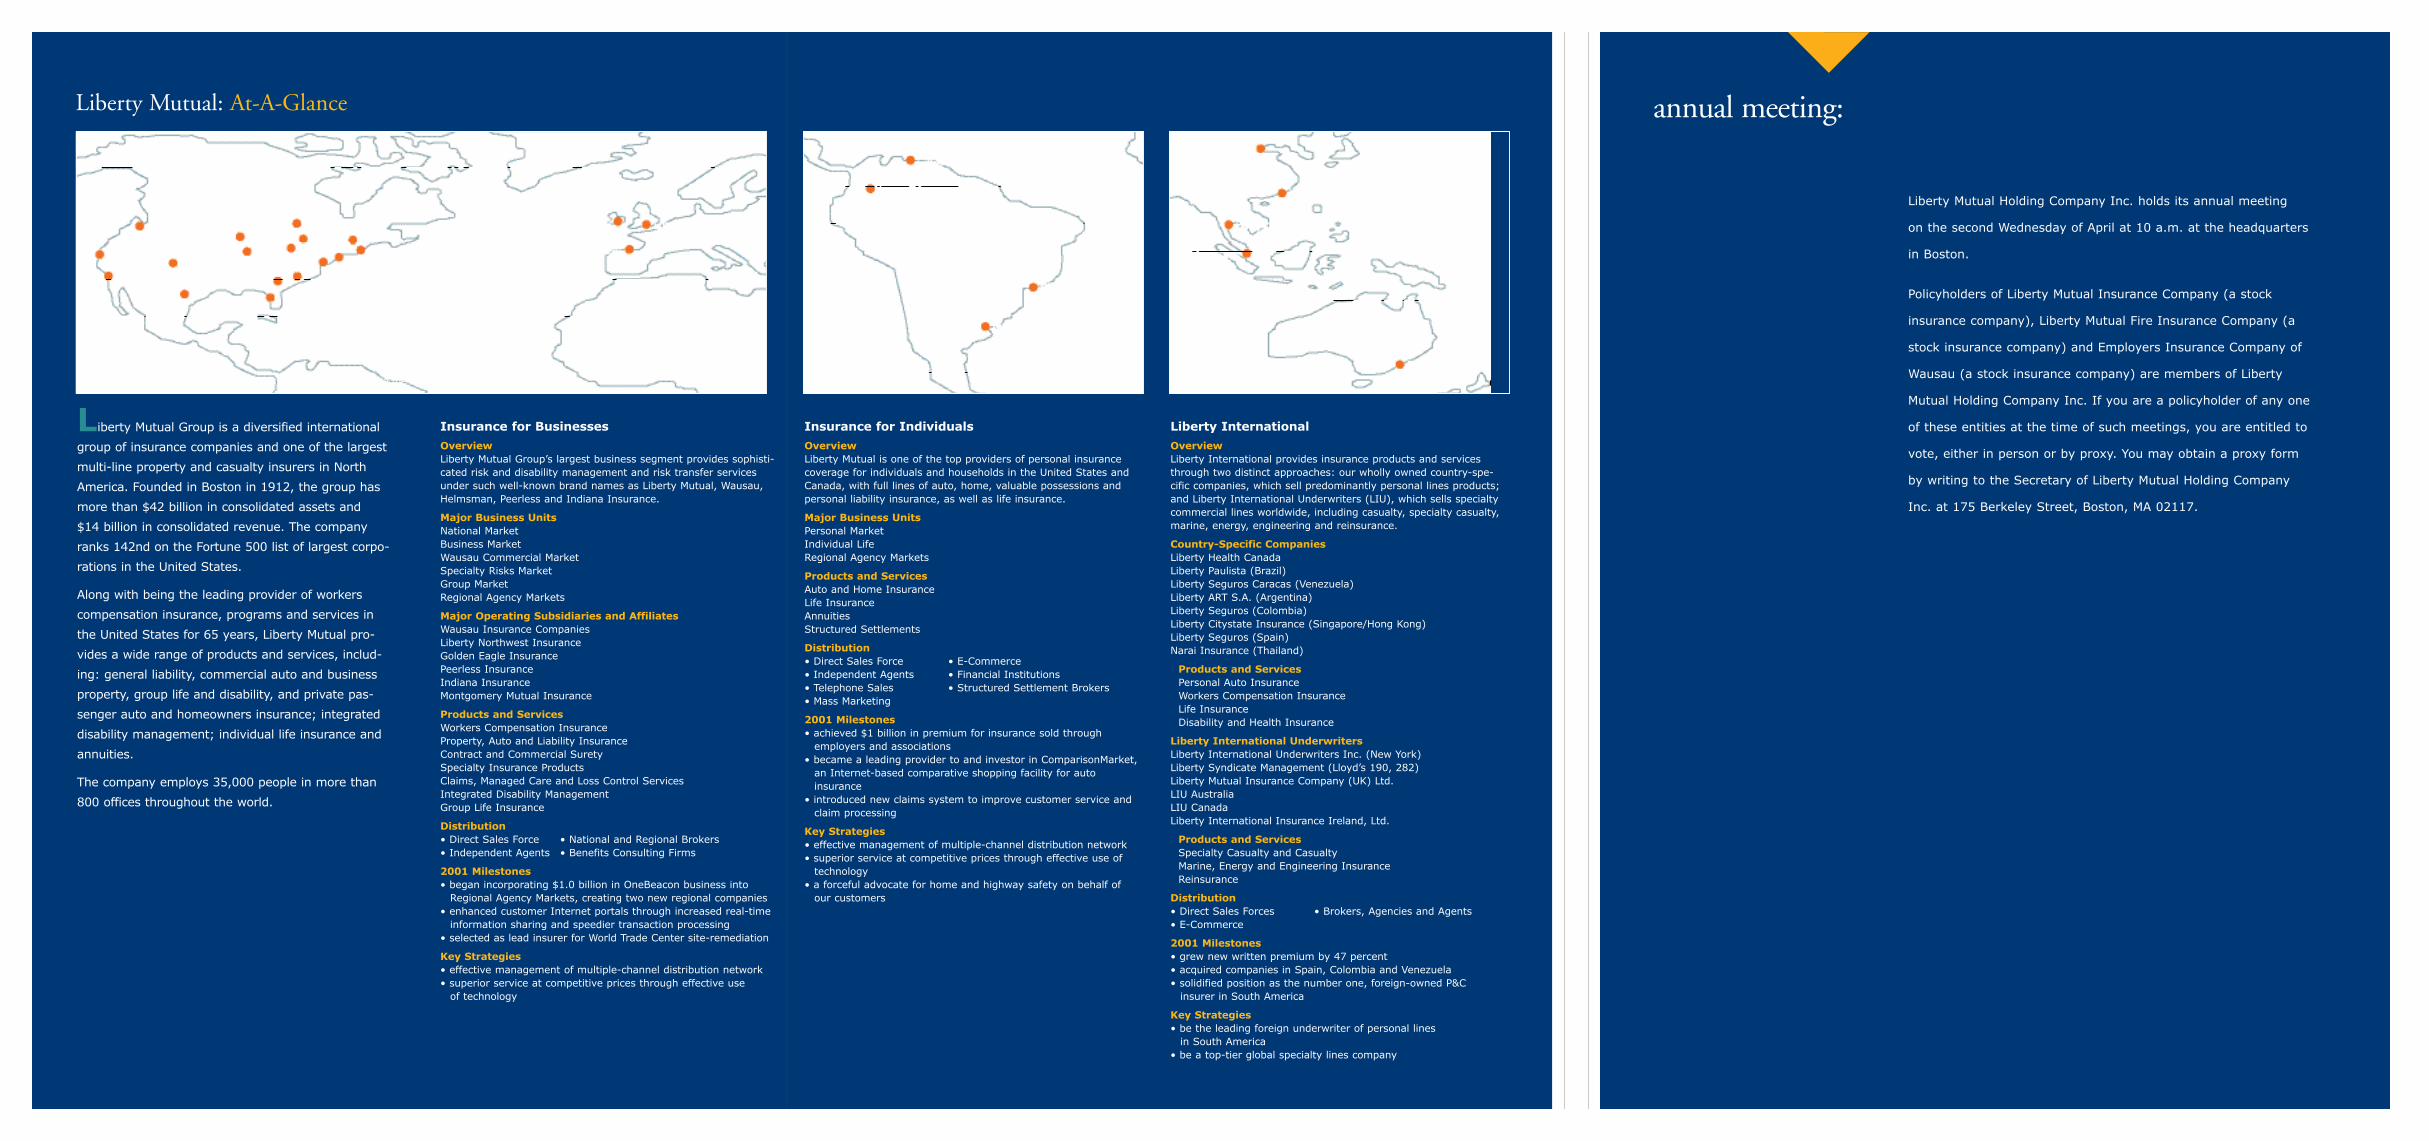
Liberty Mutual Group 2001 Annual Report

While it’s easy to overstate the importance of a given year, it’s clear that 2001, without a doubt, was one of the most
significant years in the 90-year history of your company.
Illustrating this statement are three major events, two of which positioned us for sustained growth and profitabili-
ty, while the other made clear the fundamental importance and critical nature of what we do.
First, I’m pleased to be writing you, for the first time, as members of Liberty Mutual Holding Company Inc.
(LMHC). Thanks to your overwhelmingly positive vote, we successfully created LMHC on November 28, 2001.
As a mutual holding company, we now have greater strategic and capital flexibility to pursue growth through
consolidations, mergers, acquisitions and alliances. This flexibility is extremely important given today’s rapidly
changing, and consolidating, global property and casualty insurance marketplace.
Just as important, we remain a mutual company. Liberty Mutual was founded in 1912 on the fundamental belief that having common
2001: One of the Most Significant Years in Your Company’s History
2
policyholder message:
Edmund F. Kelly, Chairman, President and Chief Executive Officer

goals with its policyholders was the best way to prevent workplace accidents and injuries, and minimize losses when
accidents occur. We still believe working together with our policyholders is the best way to do business.
The second event of strategic significance was the sale of Liberty Financial Companies and its asset management,
and annuity and bank marketing businesses. This sale allows us to focus our attention and resources on what we do
best – provide high-quality property and casualty products and services at competitive prices. Today we have an
enviable mix of property and casualty businesses, a good franchise in each business, and a solid platform for future
growth and profitability.
Third, the tragic events of September 11 underscored the important role of a financially strong insurance indus-
try in today’s global economy. If there was any good to come from this horrible tragedy, it was that it reaffirmed for
us, and we trust for you, the importance of what we do as an insurer and provider of risk management products and
services. While no one imagined a catastrophe of such magnitude would ever occur, these situations are what we’re
in business to handle. I’m extremely proud of our employees’ immediate and sustained response, as caring human
beings and as insurance professionals. Whether it be our claims professionals, who worked around the clock to set
up and staff catastrophe units, or our loss prevention experts, who are coordinating the safe clean-up of the World
Trade Center site, the tragic event brought out the best in us personally and professionally.
From a financial standpoint, September 11 clearly had a significant negative impact on Liberty Mutual, with
that event alone resulting in a pre-tax loss of approximately $500 million. While it is little consolation, we were not
alone, with the worldwide property and casualty industry incurring upwards of $40 billion in Sept. 11-related loss-
es.
However, long before September 11, we encountered events that would negatively affect Liberty Mutual’s per-
formance, from Tropical Storm Allison to severely underpriced homeowners insurance and prior years’ reserve
increases, to the collapse of an oil rig in the South Atlantic. As a result, our pre-tax operating income fell by $1.3
billion and our surplus by $1.4 billion.
At the business unit level, excluding the events of September 11, our core domestic commercial business was on
its way to solid improvement in operating results, and we look to the continuation of that trend in 2002.
In contrast to this improvement in our commercial lines, however, was poor performance in our personal P&C
lines, especially homeowners, where we and the industry failed to recognize changing loss trends and adjust rates
accordingly. I’m confident that we will turn around this performance in 2002, while continuing to enhance our high
customer satisfaction levels, as made evident by our 93 percent homeowners and 92 percent auto retention rates.
In our life insurance business unit, I’m pleased to report that we hit a milestone in 2001, breaking $100 million
in premium, and retaining our position as the largest distributor of life insurance through banks.
Within our five-year-old independent agency system, we saw continued operating improvement in our existing
>

companies, which include Peerless Insurance, Indiana Insurance, Colorado Casualty, Summit, Golden Eagle and
Montgomery Mutual. At the same time, we entered into an exciting arrangement with OneBeacon, which will
expand our book of business by up to $1.0 billion while positioning us as a true national organization of regional
companies with operations in 42 states.
In the international arena, we continued to make considerable strides. Despite the impact of September 11 and
the challenging economic conditions in Latin America, we experienced strong growth, driven primarily by acquisi-
tions in our local businesses, and strong organic growth for Liberty International Underwriters, our global specialty
lines business. Of particular note were: the establishment of a local company presence in Spain, where we bought
two companies; an acquisition in Colombia, which made us the second-largest P&C company in that nation; a sub-
stantial acquisition in Venezuela, making us the largest provider of insurance in that country; and, capitalizing on a
fast-changing situation, the formation of a personal auto insurance company in Argentina.
Clearly, while 2001 was a year in which we fared poorly from a financial perspective, it was a year of consider-
able achievement at both the corporate and business unit levels.
The events of 2001, both positive and negative, strengthened our company and our dedication to helping people
live safer, more secure lives. Our strength comes from both the hard work and professionalism of our employees, and
the long-term support of our policyholders and members.
Once again, I wish to express my appreciation for the continued support and guidance of our Board of Directors
and 30 Advisory Boards, and for the dedication and commitment of our management team and 35,000 employees
worldwide.
Finally, I want to thank you, our customers and policyholders, for the trust and confidence you continue to
place in Liberty Mutual as your insurer. At this crossroads, as with many before it, we must preserve the best of our
tradition and pursue the most of our potential. We do so on behalf of you – the customers and policyholders we
serve, the people we employ and the communities we so proudly support.
Edmund F. Kelly
Chairman, President and Chief Executive Officer
4

this is what we do:
Globalization. Industry consolidation. Financial services deregulation. Multi-channel distribution. Terrorism.
These are just some of the complex issues facing today’s global insurer.
Obviously, the insurance marketplace is much changed from when Liberty Mutual was
founded in 1912 as one of the first workers compensation providers. However, while the
environment in which we operate is constantly changing, and the pace of that change acceler-
ating, our role as an insurance company remains fundamentally the same. Today, as was the
case 90 years ago, Liberty Mutual helps people live safer, more secure lives. And we do so by
remaining financially strong, by being sensitive to the needs of our customers, by being cre-
ative, flexible and responsive in how we service those needs, and by consistently delivering
what we promise.
Yes, we are a much larger, more diversified company today than we were 90, or even five,
years ago. We constantly evolve to meet our customers’ changing needs and thus compete
successfully in today’s marketplace.
What differentiates Liberty Mutual, however, is not our size or breadth of product offer-
ings, but how well we serve our customers. Service excellence is our mantra, whether it’s how
well we manage global risk for a huge multinational, identify sources of loss at a mid-sized
manufacturer, partner with an agent or broker, or handle your claim for a dented front fend-
er.
In the following pages are examples of the many ways we work with you with the goal of
adding value and providing superior service. After all, this is what we do.
90Years ofService
Today, as was the
case 90 years ago,
Liberty Mutual helps
people live safer,
more secure lives.

Time betweenoccurrences of
disabling injuriesin U.S.:
8seconds
Likelihood a 16-year-old malewill be in an auto
accident:
1in5
Number of structure fires inU.S. during 1999:
523,000
6

Liberty Mutual, as do other property and casualty insurers, helps a diverse set
of policyholders manage their risks. We do so not only by using our capital to assume
financial risk, but by using our skills and experience to identify and evaluate potential
causes of loss.
Vital to the task of risk management is of course the underwriter. The better
our underwriters understand the risk characteristics of groups of individuals,
or the risks associated with different types of businesses, the better they can match our
risk management expertise and appetite for financial risk with the needs of prospective
customers. When the match is right, we can best determine loss prevention and loss
reduction programs, and tailor coverage to our policyholders’ needs.
On the next two pages we profile two long-term underwriting relationships: one
with a mid-sized manufacturer, the other with a multinational financial services firm.
While dramatically different in terms of their risk management issues, each appreciates
the benefits of working with the experts at Liberty.
this is what we do: Assess and Assume Risk
largest loss:
With an estimated cost of $40 billion, the World Trade Center terrorist
attacks represent the largest single insurance loss in history, surpassing by a
wide margin the devastating losses arising from Hurricane Andrew in 1992.
>
U.S. Insurance Industry’s
Top Five P&C
Insurance Lines in 2001…
A:Personal Auto: 38%
B:Homeowners: 11%
C: Workers Compensation: 10%
D:General & Product Liability: 9%
E: Commercial Auto: 7%
F: Other: 25%

Liberty Mutual’s relationship with Kennedy Die Castings, Inc. is a long-term partnership based on mutual respect and
profitability. Over the years, President Bob Kennedy (left in photo), and his father before him, have
worked hard to reduce losses, and premiums, through effective safety and claims management pro-
grams.
Serving his company, a leading manufacturer of custom-designed aluminum and zinc die cast com-
ponents and assemblies, are not only Liberty’s sales, claims and loss prevention professionals, but Senior
Underwriter Brian Johnson, CPCU. Experienced in claims and underwriting, Johnson goes beyond the
traditional role of analyzing and pricing coverages by routinely meeting with customers to familiarize
himself with their operations.
“Bob has worked hard to improve his company’s safety performance, and that commitment is reflect-
ed in reduced premiums,” said Johnson, shown above with Bob Kennedy. “By managing risks more effi-
ciently, Bob’s company profits, and for providing these services, Liberty Mutual earns a fair profit as
well.”
Kennedy Die Castings: A 54-Year Partnership
8
Worcester, Massachusetts

Directors & Officers Liability. Errors & Omissions. Crime Bond. These are just some of the specialty casualty coverages
required by Prudential plc, a 154-year-old, London-based provider of retail financial products and
services and fund management to millions of customers worldwide.
For help with its sophisticated risk management needs, Prudential and its broker, Marsh, turned to
Liberty International Underwriters (LIU). “We work in a triangular – not linear – fashion, with
Liberty and our broker on a wide range of technical and commercial insurance issues,” said Mark
Butterworth, group insurance risk manager for Prudential plc.
“Liberty is one of the more experienced players in the London market,” said Butterworth, shown
at left above with LIU’s Alan Telford. “They get to know our business, and they help us with emerg-
ing issues.”
Formed as a global specialty lines business, LIU maintains six offices in the U.S., as well as offices in
Toronto, Dublin, London and Sydney. “The market views us as a nimble and entrepreneurial opera-
tion,” Telford said, “and we work hard to make sure we deliver on that image.”
Prudential plc: Sophisticated Needs
9
London, England

10
Number of people saved by
seatbelts in 1999:
11,197
Average cost per work-relatedinjury in 1999:
$32,900
Total cost of U.S. workplace
deaths and injuries:
$120-$240billion

Each year, U.S. businesses spend $40 billion in direct costs – wage replacement and pay-
ments to medical care providers – related to workplace injuries. But that’s not all. Liberty’s
studies have shown that the indirect costs – lost productivity and overtime – are far larger,
three-to-five times larger, than the direct costs. This translates into a staggering $120 billion to
$240 billion total cost to U.S. businesses for work-related injury and illness.
Clearly, workplace accidents needlessly cause pain and suffering to valuable employees and
waste resources that impact business performance. By focusing on workplace safety improve-
ments, a company can protect itself from the human and operational impact of a workplace
accident, and better manage its financial performance.
Throughout its 90-year history, Liberty Mutual has been a leader in loss management serv-
ices. Our 600 loss prevention consultants identify loss sources and suggest changes that help
customers control or eliminate sources of loss, while our return-to-work programs ensure that
injured employees get back on the job as quickly as possible. In addition to dollar savings,
benefits include lower turnover, better morale and improved work quality.
Liberty Mutual, of course, cannot act alone to reduce a customer’s workplace injuries and
their related costs. Only through a partnership with our customers –
as portrayed in the following pages – can we effectively control loss.
this is what we do: Prevent and Manage Loss
workplace injury rates:
>
At work, a fatal injury occurs every 103 minutes and a
disabling injury every 8 seconds.
Five leading causes of
workplace injuries…
A:Excessive lifting, pushing
or pulling: 25.5%
B:Same level falls: 11.5%
C: Bending, standing or
reaching: 9.4%
D:Falls to lower levels, such
as from a ladder: 9.2%
E: Struck by object, such as a
tool falling on a worker: 8.5%
F: Other: 35.9%

The Milliken & Company approach to the health and safety of its associates can be described in one word – relentless.
They simply never stop improving their safety process.
A manufacturer of more than 38,000 textile and chemical products, and a 60-plus-year Liberty
Mutual customer, Milliken has consistently reduced its Total Incident Rate and today is ten times
better than the textile industry average, one of the safest industries in the U.S.
“Milliken’s vision,” according to Health and Safety Director Wayne Punch, “has two basic corner-
stones. One, we will develop an uncompromising safety and health environment. And two, we have
the basic belief that all incidents can and will be prevented.”
“As part of our Architecture of Safety Excellence model,” said Larry Trotter, Liberty Mutual serv-
ice director (on right in photo with Wayne Punch), “we’ve launched our Performance Leadership
process at Milliken, which seeks to change employee behaviors that lead to workplace incidents. This
process involves all Milliken associates and the commitment of management, which Milliken under-
stands and provides.”
Milliken & Company: Relentless Commitment to Safety
12
Spartanburg, South Carolina

Jody Riley was working in her company’s hot press department, when she began to feel sick. Diagnosed with heat stress,
plant management immediately transported her to the hospital.
“Most people don’t think of heat stress as a condition that could keep you away from work for a
prolonged period of time,” said Stephanie Meyenberg, human resources manager at Flex-N-Gate,
which uses plastic injection molding to produce automotive bumpers at its plant in Ada, Oklahoma.
“In fact, without an effective return-to-work program, Jody could have been out of work for up to
four months.”
Fortunately for Riley, Flex-N-Gate is a participant in Wausau People@WorkSM, a proven vehicle to
reduce time lost and work absences. “With a return-to-work program, the temptation is to get the
employee back to any job as quickly as possible. That’s not compassionate to the employee nor is it
productive to the employer,” said Technical Claims Specialist Laura Standifer, at left in photo with
Riley.
“Following People@WorkSM protocols,” added Meyenberg, “we got Jody back to work in produc-
tive – not to mention cooler – employment within days.”
Flex-N-Gate: Compassionate Productivity
13
Ada, Oklahoma

14
Number of independent
insurance agenciesin the U.S.:
44,000
Percent of U.S.householderswho own theirown homes:
70
Percent of U.S.homes with
Internet access:
42

Just as we do more than identify risks and help prevent losses from happening, our services
go beyond insurance sales and claims processing. We work with our customers to anticipate
their insurance and risk management needs, whether it be a first-time homebuyer, a fast-
growing agency, or an expanding business.
In our personal lines, for example, we train our direct sales force to look for life-changing
events in their customers’ lives, and to ensure that they are properly covered, whether it be
the addition of a teenage driver to an auto policy or life insurance for an expectant couple.
Through role playing and classroom training, we teach our personal lines sales representatives
how to listen attentively to their customers, and ask the right questions for a better under-
standing of their needs. Whether it is a meeting at one of our 400 offices, an individual’s
home or the workplace of one of our Group Savings Plus® customers, our sales representa-
tives make themselves available to serve customers, at the customer’s convenience.
Our Regional Agency Markets companies apply the same philosophy when serving their
5,000 carefully selected independent agents. Guided by a mutually agreed-upon annual busi-
ness plan and clearly defined underwriting criteria, we work with agencies to identify their
future needs, pinpoint opportunities, apply innovative thinking, and measure the results.
Underlying each agency relationship is a dedication to service excellence, from frequent per-
sonal contact to the convenience of our Internet-based quote, claims and billing inquiry
capabilities, which place real-time information at the fingertips of agents.
Ultimately benefiting from this partnership, of course, is the policyholder, whether it be
an individual, or a small- to mid-sized business.
this is what we do: Anticipate Your Needs
insurance spending:
>
Vehicle, life and homeowners insurance account for four
percent of total consumer expenditures.
Percent of Americans
who buy insurance through…
A:National Agencies: 30.0%
B:Regional Agencies: 22.5%
C: Direct Writers: 47.5%

As is often the case in the world of personal sales, Liberty Mutual’s Nanette Sario met Eileen and Ramon Reyes through
a mutual friend, and that was eight years ago.
A personal sales representative out of Pleasanton, Calif., Sario sold the Reyes renters’ insurance in
1994, and has since moved on to home, auto and life insurance. “Like Eileen, I’m married with two
children, so I can easily identify with the changes they experience as a family,” she said. “Personal
insurance is not a once-and-done product. Peoples’ lives constantly change, and their insurance cover-
age needs to be expanded and adjusted accordingly. For example, I just added their daughter Shenna
to their auto insurance policy.”
“In today’s world, where you never seem to have a moment to yourself, it’s nice to have someone
like Nanette,” said Eileen, an IT project manager for a major corporation. “Both Ramon and I – he’s
a residential realtor – are very busy, and it’s easy to forget the basic necessities, like insurance. That’s
why we’re so grateful that Nanette checks on us from time to time, just to make sure we’re covered
appropriately.”
The Reyes Family: Covering the Basics
San Leandro, California
16

One of Liberty Mutual’s most rapidly growing business segments is Regional Agency Markets (RAM), a $3 billion
organization of regional insurance companies, which distributes small commercial and personal
P&C insurance exclusively through independent agents.
“Most of our policyholders, when you ask them where they’re insured, will name their inde-
pendent agent, rather than the insurance company,” said Jan McWhirter, territory manager,
Indiana Insurance, a 150-year-old RAM company. “That’s why we work so hard to anticipate, and
fulfill, our independent agents’ needs.”
McWhirter is shown here with Dennis Feldhaus, senior account executive for Evansville,
Indiana-based ONB (Old National Bank) Insurance, one of the largest agencies in Indiana, at the
offices of policyholder Bernardin Lochmueller & Associates, Inc., a large, locally based engineering
firm.
“Just as Indiana Insurance is selective in terms of the agents it does business with, we’re careful
as to where we place our business,” added Feldhaus. “We want a high-touch insurer that knows
our region. It’s no coincidence that our relationship with Indiana Insurance – our largest – goes
back 80 years.”
ONB Insurance: A Mutually Beneficial Relationship
17
Evansville, Indiana

18
Property fire losses in
1999:
$11.5billion
Percent of U.S.property & casualty
premiums spenton claims:
73.5
Number ofinsured motorvehicles in U.S.
in 1998:
161million

A perfect world would have no accidents, no damage, no injuries. But, in the real world,
accidents happen, and when they do – whether it’s a major loss or a dented fender – you
expect your insurer to do something, and do it fast.
That’s why, whether it’s a commercial or personal insurance claim, we emphasize fast, effi-
cient claims reporting and handling.
For all our customers, the sooner a claim is reported, in general, the less it will cost, and,
in the case of workers compensation claims, the sooner the injured employee can return to
productive employment. Prompt response and investigation of claims help control medical
and indemnity costs, and avoids unnecessary
attorney’s fees.
To ensure prompt reporting, we offer our business customers a choice of phone, fax,
Internet or electronic data exchange – 24 hours a day. And, when we respond, our more than
3,000 experienced and professional claims employees, working out of 75 workers compensa-
tion, liability and property centers, handle your claims in the most efficient and effective way
possible.
For our personal insurance customers, the emphasis, above all else, is on convenient, cour-
teous and responsive service. To report a claim, individuals can call their local office, our 24-
hour Claims Service Center, or fill out a claims first report on-line. Whether they report a
claim by phone or Internet, our customers are on their way to rapid appraisals, claim pay-
ments and repairs.
this is what we do: Deliver on Our Promises
Costliest year ever:
>
U.S. property and casualty insurers paid $24 billion in claims for
insured property damage in 2001, making it the costliest year ever
for catastrophe losses.
Percent of U.S.
motor vehicle accidents
by age of driver…
A:Under 20: 16.2%
B:20-34: 34.7%
C: 35-55: 33.7%
D:56 plus: 15.4%

Typically, if someone experiences an auto accident in Bogota, Colombia, it can take three or four visits, and waits up to
four hours, to get the car appraised.
This is not the case for customers of Liberty Seguros, the leading auto insurer in Colombia, and a
Liberty Mutual subsidiary. Through its five new Claims Service Centers, Liberty Seguros provides its
customers with fast, efficient auto claims service.
“No appointment is necessary, and when people see our facility, they relax,” said Lucy Chaparro,
assistant manager of the Bogota center, shown above with Luis Guillermo Gil, a claims analyst. “Not
only do we make sure they’re comfortable, but we typically arrange a meeting with one of our claims
analysts within 12 minutes, with a claim finalized within
27 minutes.”
Today, Liberty Seguros’ five Claims Service Centers, located in Colombia’s five-largest cities, handle
1,400 claims per month. “More important,” Chaparro said, “our customers gave us a 100 percent satis-
faction rating in our most recent survey.”
Colombian Auto Policyholders: Wowed by Service
20
Bogota, Colombia

It’s any homeowner’s nightmare. You drive down the street and realize the smoke billowing into the air is coming
from your home.
Such was the case for Margaret Churchill of Townsend, Delaware, who encountered this situa-
tion just days before Christmas. “We were planning on decorating the tree that afternoon,” said
Margaret, a mother of four, “and the presents were on the couch, all wrapped and ready.”
Margaret called Liberty Mutual’s toll-free claims number, which connected her with Claims
Adjuster Lisa Mild (on left in photo), a 17-year veteran. “Lisa arrived in no time,
gave me a check to cover immediate expenses, and started talking me through everything.”
“Everything” included determining the cause of the fire (a faulty lamp), and hiring
contractors to clean up the debris and repair the heavily smoke-damaged home. “Liberty even hired
a company to clean the presents using an ozone chemical cleaning process,” Margaret said, “so we
were able to salvage a Merry Christmas after all.”
The Churchill Family: A Saved Christmas
21
Townsend, Delaware

22
23: Combined Statutory Balance Sheets
23: Combined Statutory Statements of Income
24: Combined Statements of Changes in Statutory Surplus
24: Combined Statutory Statements of Cash Flow
25: Notes to Combined Statutory Financial Statements
35: Report of Management
35: Report of Independent Auditors
36: Board of Directors
36: Officers
39: Advisory Boards
45: Annual Meetings
financial statements: Liberty Mutual Group

23
Combined Statutory Balance Sheets
December 31, 2001 2000
(dollars in thousands)
Admitted AssetsInvestments:
Fixed maturities $17,274,074 $18,255,773Common and preferred stocks 2,092,870 2,383,875Investments in affiliates 2,227,142 2,868,367Cash and short-term investments 1,570,847 1,264,935Company occupied properties 218,635 230,403Other investments 521,177 698,845
Cash and invested assets 23,904,745 25,702,198Premiums receivable, net 2,878,621 2,802,282Deferred tax asset, net 612,598 –Reinsurance recoverable 353,646 358,532Funds held by affiliates and other reinsurers 556,747 473,772Other admitted assets 1,069,053 926,786
Total admitted assets $29,375,410 $30,263,570
Liabilities and SurplusLiabilities:
Losses unpaid $14,079,478 $13,513,462Loss adjustment expenses unpaid 2,753,214 2,864,576Unearned premiums 3,487,623 3,129,686Deposits and other liabilities 1,200,379 2,643,553Funds held under reinsurance contracts 1,480,901 593,842State taxes and assessments 449,976 95,495Federal income taxes accrued 99,432 241,556Dividends declared to policyholders 44,187 34,397
Total liabilities 23,595,190 23,116,567
Surplus:Surplus notes 1,141,019 1,140,855Special and other surplus funds 1,127,384 321,500Contributed capital 15,000 149,662Unassigned surplus 3,496,817 5,534,986
Total surplus 5,780,220 7,147,003
Total liabilities and surplus $29,375,410 $30,263,570
Combined Statutory Statements of Income
Years ended December 31, 2001 2000
(dollars in thousands)
Premiums earned $ 8,760,262 $ 8,450,375
Losses 7,459,379 6,323,149Loss adjustment expenses 1,379,664 1,301,327Underwriting and other expenses 1,952,312 1,852,062Premium and other taxes and assessments 425,845 302,878
Total underwriting expenses 11,217,200 9,779,416
Underwriting loss before dividends (2,456,938) (1,329,041)Dividends declared to policyholders 88,568 101,004
Underwriting loss (2,545,506) (1,430,045)Net investment income 1,232,835 1,274,804Realized investment gains, net 295,997 336,549Other income, net 659,280 263,467
(Loss) income before income taxes (357,394) 444,775Federal and foreign income tax (benefit) expense (68,671) 41,681
Net (loss) income $ (288,723) $ 403,094
See accompanying notes to combined statutory financial statements.

24
Years ended December 31, 2001 2000
(dollars in thousands)
Statutory surplus, beginning of year $7,147,003 $7,045,853
Add (deduct):Net (loss) income (288,723) 403,094Unrealized capital gains (losses):
From unconsolidated subsidiaries (479,401) (16,186)From non-affiliated securities (541,757) (264,383)
Cumulative codification adjustment (181,000) –Other surplus changes, net 124,098 (21,375)
Statutory surplus, end of year $5,780,220 $7,147,003
Years ended December 31, 2001 2000
(dollars in thousands)
Cash provided:From operations:
Premiums collected $9,069,843 $8,493,039Investment income and other income, net 1,235,253 1,240,004Loss and loss adjustment expenses 8,500,641 8,193,785Underwriting and other expenses, net 2,303,657 2,089,389
Net cash used by operations (499,202) (550,131)
From investments sold or matured:Fixed maturities 8,282,624 3,526,665Common and preferred stocks 689,950 886,047Other investments 144,179 122,250
Cash provided by investments 9,116,753 4,534,962
Securities lending collateral received, net – 185,088Debt financing, net 183,314 126,016Other, net – 220,369
Total other cash provided 183,314 531,473
Total cash provided 8,800,865 4,516,304
Cash applied:Cost of investments purchased:
Fixed maturities 7,155,972 3,181,092Common and preferred stocks 606,533 452,587Investments in affiliates, net 59,278 227,273Other investments 174,778 237,057
Cash applied to investments 7,996,561 4,098,009
Deposit liability 82,198 195,088Securities lending collateral returned, net 375,848 –Other, net 40,346 –
Total other cash applied 498,392 195,088
Total cash applied 8,494,953 4,293,097
Increase in cash and short-term investments 305,912 223,207
Cash and short-term investments, beginning of year 1,264,935 1,041,728
Cash and short-term investments, end of year $1,570,847 $1,264,935
See accompanying notes to combined statutory financial statements.
Combined Statements of Changes in Statutory Surplus
Combined Statutory Statements of Cash Flow

25
(1) Summary of Significant Accounting Policies
(a) Basis of PresentationThe accompanying combined statutory financial statementsof Liberty Mutual Insurance Company (“Liberty Mutual”),Liberty Mutual Fire Insurance Company (“Liberty Fire”),Montgomery Mutual Insurance Company (“Montgomery”),Merchants and Business Men’s Mutual Insurance Company(“M&B”) and Employers Insurance Company of Wausau(“EICOW”), formerly Employers Insurance of Wausau AMutual Company (“EIOW”), collectively referred to as the“Companies”, include, on a combined basis, the accountsof their U.S. property and casualty insurance subsidiaries.
The Companies provide most types of property-casualtyinsurance, fidelity and surety bonds and insurance-relatedservices for individuals, businesses, government units and associations.
In 2001, Liberty Mutual reorganized into a stock insurance company as part of an overall conversion to amutual holding company structure. Liberty Mutual formedas its ultimate parent Liberty Mutual Holding Company Inc., a Massachusetts mutual holding company (“LMHC”).Additionally, as part of its reorganization, Liberty Mutualformed (i) LMHC Massachusetts Holdings, Inc., aMassachusetts stock holding company (“LMHC MA”) whichis a direct, wholly-owned subsidiary of LMHC and (ii) LibertyMutual Group, Inc., a Massachusetts stock holding company(“LMGI”), which is a direct, wholly-owned subsidiary ofLMHC MA and the direct parent of Liberty Mutual. In 2001,EIOW reorganized into a stock insurance company namedEmployers Insurance Company of Wausau as part of anoverall conversion to a mutual holding company structure.EICOW formed as its direct parent Employers Insurance of Wausau Mutual Holding Company, a Wisconsin mutualholding company (“EIOW MHC”). This was the first step in a series of transactions to be completed in 2002 designedto result in Liberty Mutual, Liberty Fire and EICOW, becoming indirect wholly-owned stock subsidiaries of LMHC, subject to satisfaction of all applicable approvals.
These financial statements exclude the accounts ofLMHC, LMHC MA, LMGI and EIOW MHC.
The accompanying combined statutory financial state-ments have been prepared in conformity with accountingpractices prescribed or permitted by the insurance depart-ments of the states in which the companies are domiciled,which vary in some respects from accounting principles generally accepted in the United States (“GAAP”). EffectiveJanuary 1, 2001 the National Association of InsuranceCommissioners (“NAIC”) revised the Accounting Practicesand Procedures Manual in a process referred to as “codification”. Accordingly, insurance companies are requiredto prepare their statutory basis financial statements inaccordance with codification, subject to any deviations prescribed or permitted by the domiciliary state insurancedepartments. Principal variations from GAAP include:
Investments: Investments in bonds and mandatoryredeemable preferred stocks are reported at amortizedcost or market value based on their NAIC rating; for GAAP,such fixed maturity investments would be designated atpurchase as held-to-maturity, trading or available-for-sale.Held-to-maturity fixed investments would be reported atamortized cost, and the remaining fixed maturity invest-ments would be reported at fair value with unrealized
gains and losses reported in operations for those designat-ed as trading and as a separate component of surplus forthose designated as available-for-sale.
Undistributed results of limited partnerships are reflect-ed in unrealized gains on a statutory basis while GAAP utilizes the equity method unless the investor’s interest isso minor that the limited partner may have virtually noinfluence over partnership operating and financial policies.Investments in excess of three to five percent are consid-ered more than minor.
Subsidiaries: Controlling interests in subsidiaries otherthan domestic property and casualty insurance subsidiariesare not consolidated or combined, and the equity in earn-ings of unconsolidated subsidiaries is recorded in surplusas net unrealized capital gains or losses, with insurancesubsidiaries’ equity adjusted to a U.S. statutory basis. For domestic property and casualty subsidiaries acquiredduring the year, the full year’s results of operations areincluded in the combined statements of income.
Purchase Accounting: The excess of purchase price overthe fair value of net assets acquired, or historical statutorysurplus in the case of domestic insurance companies(“statutory purchase accounting”), is considered goodwilland is capitalized and amortized on a straight-line basisover periods of up to ten years, subject to certain statu-tory limitations. Statutory accounting limits the amount of goodwill that can be carried as an admitted asset to ten percent of surplus for the most recently filed statutoryfinancial statements adjusted to exclude any net positivegoodwill, EDP equipment and operating system software,and net deferred tax assets (“limitation basis surplus”).Goodwill in excess of the limitation is non-admitted.Goodwill is amortized over a period not to exceed tenyears and is reflected as a component of unrealized capitalgains or losses for unconsolidated subsidiaries and other surplus changes for combined companies. Under GAAP,goodwill is determined as the excess of purchase priceover the fair value of net assets acquired and for acquisi-tions prior to July 1, 2001 is amortized through earningsover a period not to exceed 40 years. For acquisitions afterJuly 1, 2001 and for all goodwill as of January 1, 2002,GAAP no longer requires periodic amortization of goodwill.
Deferred Policy Acquisition Costs: The costs of acquiringand renewing business are expensed when incurred. UnderGAAP, such costs, to the extent recoverable, would bedeferred and amortized over the effective period of therelated insurance policies. Commissions allowed by reinsur-ers on business ceded are reported as income whenreceived rather than being deferred and amortized withdeferred policy acquisition costs, as required under GAAP.
Non-admitted Assets: Certain assets designated as “non-admitted,” principally premiums receivable greaterthan ninety days old (net of any valuation allowance estab-lished for amounts deemed uncollectible and charged toearnings), furniture and equipment, deferred tax assets andgoodwill in excess of statutory limitations, other intangibleassets, and as of January 1, 2001, any other assets notspecifically identified as an admitted asset within statutoryaccounting guidance, are excluded from the accompanyingbalance sheets. Changes in such non-admitted assets arecharged or credited directly to surplus. Additionally, codifi-cation requires valuation allowances to be recorded by a
Notes to Combined Statutory Financial Statements(dollars in thousands)

26
charge to operations if asset impairment is probable andcan be reasonably estimated. Such allowances are includedin the cumulative effect of the implementation of codifica-tion and result in an offsetting reduction in non-admittedassets. Under GAAP, such assets are included in the balancesheet, net of any valuation allowance required.
Policyholder Dividends: Policyholder dividends are recog-nized when declared rather than over the term of the relat-ed policies under GAAP.
Employee Benefits: For purposes of calculating theCompanies’ pension and postretirement benefit obligations,only vested participants and current retirees are included inthe valuation. Under GAAP, active participants not currentlyeligible are also included.
Reinsurance: Reserves for losses and loss adjustmentexpenses and unearned premiums ceded to reinsurershave been reported as reductions of the related reserves,rather than as assets as would be required under GAAP.
Gains from retroactive reinsurance contracts are reportedas a segregated surplus account (“special surplus funds”)and are not reported as unassigned surplus until theCompanies have recovered amounts in excess of the consid-eration paid. Reserves transferred are recorded as a contraliability in “other liabilities”. Under GAAP, such gains aredeferred and recognized in income using the interest methodover the period the underlying reinsured claims are paid.
A liability for reinsurance balances (net of any allowancefor amounts deemed uncollectible and charged directly toearnings) has been provided for unsecured reinsurance balances due from reinsurers not authorized to transactbusiness in the respective states of domicile (“unauthorizedreinsurance”). This liability is not required under GAAP.
Deferred Income Taxes: Effective January 1, 2001,deferred tax assets are limited to (1) the amount of federalincome taxes paid in prior years that can be recoveredthrough loss carrybacks for existing temporary differencesthat reverse by the end of the subsequent calendar year;plus (2) the lesser of the remaining gross deferred tax assetsexpected to be realized within one year of the balance sheetdate or 10% of limitation basis surplus; plus (3) the amountof remaining gross deferred tax assets that can be offsetagainst existing gross deferred tax liabilities. The remainingdeferred tax assets are non-admitted. Deferred taxes do notinclude amounts for state taxes. Prior to January 1, 2001,deferred federal income taxes were not provided for differ-ences between financial statement amounts and tax bases of assets and liabilities. Changes in deferred tax assets andliabilities are recognized as a separate component of changesin surplus. Under GAAP, state taxes are included in the com-putation of deferred taxes, a deferred tax asset is recordedfor the amount of gross deferred tax assets expected to berealized in future years, and a valuation allowance is estab-lished for deferred tax assets not realizable.
Surplus Notes: Surplus notes represent subordinateddebt instruments classified as a component of surplus forstatutory accounting purposes. Associated surplus noteissuance costs are deferred, non-admitted and amortizedusing the interest method over the period to maturity. Thedifference between proceeds received and the face value of the surplus notes is amortized using the interest method
over the period to maturity. Interest expense on surplusnotes is reported as a component of net investmentincome. Under GAAP, surplus notes are reported as debtand the associated interest is reported as interest expense.
Guaranty Funds and Other Assessments: EffectiveJanuary 1, 2001, a liability for guaranty funds and otherassessments is accrued after an insolvency has occurred,regardless of whether the assessment is based on premi-ums written before or after the insolvency, and offsettingpremium tax credits and policyholder surcharges are recog-nized. Loss based assessments are assumed probable whenthe subject losses are incurred. Prior to January 1, 2001,guaranty fund and other assessments were accrued whenthe Companies received notice that an assessment waspayable. Under GAAP, assessments are typically accrued tomatch the underlying basis of assessment.
Statements of Cash Flow: Cash and short-term invest-ments include investments with maturities of one year or less at the time of purchase. Under GAAP, the corre-sponding caption of cash and cash equivalents includescash balances and investments with initial maturities ofthree months or less.
On a GAAP basis, consolidated policyholders’ surpluswas $5,885,000 and $7,888,000 at December 31, 2001and 2000, respectively, and net loss for the year endedDecember 31, 2001 was $1,946,000 and net income forthe year ended December 31, 2000 was $161,000.
Upon adoption of codification, effective January 1, 2001,the cumulative effect of the change in accounting was adecrease in surplus of $181,000. The components of thecumulative codification adjustment were as follows:
Guaranty funds and other assessments $(294,075)
Net deferred tax asset 574,174Postemployment benefits and
compensated absences (98,561)Non-admitted goodwill (78,277)Allowance for doubtful
accounts (195,273)Other (298,744)
Subtotal (390,756)Offsetting changes in
non-admitted assets 209,756
Total $(181,000)
The preparation of financial statements requires man-agement to make estimates and assumptions that affectamounts reported in the financial statements and accompa-nying notes. Such estimates and assumptions could changein the future as more information becomes known thatcould impact the amounts reported and disclosed herein.
(b) Investment SecuritiesInvestment securities are carried according to valuationspromulgated by the NAIC. Fixed maturity securities aregenerally carried at cost and adjusted where appropriatefor amortization of premium or discount, including antici-pated prepayments; unaffiliated common stocks are carriedat market value; preferred stocks are carried at cost ormarket in accordance with the NAIC; investments in
Notes to Combined Statutory Financial Statements(dollars in thousands)

27
Notes to Combined Statutory Financial Statements(dollars in thousands)
affiliated common stock of insurers and noninsurers aregenerally carried on the statutory equity basis and GAAPequity basis, respectively; short-term investments are carried at cost; and company-occupied properties are carried at depreciated cost. Investments in venture capitallimited partnerships are carried on the equity method. In2000, the investment in Liberty Financial Companies, Inc.(LFC) was carried at its publicly traded market value, net of a 30% valuation discount determined by the NAIC.
Prepayment assumptions for single class mortgage-backed/asset-backed securities and multi-class securitiesare obtained from internal estimates. These assumptionsare consistent with the current interest rate and economicenvironment. The retrospective adjustment method is usedto value all single class mortgage-backed/asset-backedsecurities and multi-class securities.
Realized gains and losses on sales of investments arerecognized in net income using the specific identificationmethod. Changes in unrealized gains and losses on stocks,certain fixed maturities, and other investments are recordedin surplus. Investment securities are regularly reviewed forimpairment based upon criteria that include the extent to which cost exceeds market value, the duration of themarket decline and specific issuer financial condition.Unrealized losses that are other-than-temporary are recog-nized in earnings. Any derivatives not qualifying as hedgesare marked to market through income and are included inother assets or liabilities.
(c) Fair Values of Financial InstrumentsThe Companies have used the following methods andassumptions in estimating fair value disclosures of financialinstruments:
Investment securities: Fair values for fixed maturitysecurities are based on quoted market prices, when available. If quoted market prices are not available, fair values are based on quoted market prices of comparableinstruments or values obtained from independent pricingservices. The fair values for equity securities are based onquoted market prices.
Cash and short-term investments: The carrying amountsreported in the balance sheets for these instrumentsapproximate their fair values.
Derivatives: The carrying amounts reported in the balancesheets for these instruments approximate their fair values.
(d) Securities LendingSecurities lending activities consist of lending certain U.S.government and corporate bonds to approved counterpar-ties. All lending transactions are collateralized by securities,accrued interest and cash with a total market value equal to or in excess of at least 102% of the market value of theloaned securities. Short-term investments and cash collat-eral received are recorded as assets, with a correspondingliability recorded for the return obligation.
(e) Recognition of Premium RevenuesPremiums are recognized as income on a pro-rata basis overthe terms of the policies or as loss experience dictates in thecase of retrospectively rated policies. Unearned premiumsrepresent the unexpired portion of premiums written.Premium adjustments resulting from retrospective rating ofexperience-rated policies and unbilled audit premiums areestimated and accrued, along with the related taxes, assess-ments and expenses associated with acquiring, billing andcollecting the premiums. When the anticipated losses, lossadjustment expenses, commissions, other acquisition costsand maintenance costs exceed the recorded unearned pre-mium reserve and future installment premiums on existingpolicies, a premium deficiency reserve is established.
(f) ReinsuranceTransactions with reinsurers which do not transfer risk orwhich transfer risk but are retroactive are included in otheradmitted assets or deposits and other liabilities.
(g) Losses and Loss Adjustment Expenses UnpaidThe Companies provide reserves for unpaid insurance lossesand loss adjustment expenses covering events thatoccurred in 2001 and prior years. These reserves reflectestimates of the total cost of claims reported but not yetpaid and the cost of claims not yet reported, as well as theestimated expenses necessary to settle the claims. Reserveestimates are based on past loss experience modified forcurrent claim trends, as well as prevailing social, economicand legal conditions. Final claim payments, however, mayultimately differ from the established reserves, since thesepayments may not occur for several years. Reserve esti-mates are continually reviewed and updated, and anyresulting adjustments are reflected in current operatingresults.
The Companies do not discount reserves other than tab-ular discounting on the long-term indemnity portion of cer-tain workers compensation claims and the long-termdisability portion of group accident and health claims aspermitted by insurance regulations in certain states.Reserves are reduced for estimated amounts of salvage andsubrogation, deductibles recoverable from policyholders andamounts recoverable under reinsurance contracts.
(h) Foreign ExchangeThe Companies convert foreign currencies to U.S. dollars in accordance with Statement of Statutory AccountingPrinciples No. 23, “Foreign Currency Transactions andTranslations” whereby items of income and expense aretranslated at the average exchange rate for the period whilebalance sheet items are translated using the spot rate as ofthe balance sheet date.
(i) ReclassificationsCertain reclassifications to the 2000 combined statutoryfinancial statements have been made to conform to the2001 presentations.

28
(2) Investments
(a) Fixed MaturitiesThe statement and fair values of fixed maturity securities at December 31, 2001 and 2000, are as follows:
Gross GrossStatement Unrealized Unrealized
Value Gains Losses Fair Value
December 31, 2001U.S. Treasury securities $ 639,211 $ 26,707 $ (4,776) $ 661,142Mortgage and asset-backed securities of
government and corporate agencies 6,737,332 176,543 (42,908) 6,870,967State and municipal 1,579,366 91,921 (1,964) 1,669,323Corporate and other 8,318,165 271,234 (37,769) 8,551,630
Total fixed maturities $17,274,074 $566,405 $(87,417) $17,753,062
December 31, 2000U.S. Treasury securities $ 945,144 $ 31,160 $ (262) $ 976,042Mortgage and asset-backed securities of
government and corporate agencies 6,946,575 166,810 (59,505) 7,053,880State and municipal 2,125,140 123,205 (1,485) 2,246,860Corporate and other 8,238,914 146,418 (115,886) 8,269,446
Total fixed maturities $ 18,255,773 $ 467,593 $(177,138) $ 18,546,228
The statement and fair values of fixed maturity securities at December 31, 2001, by contractual maturity, are shownbelow. Expected maturities may differ from contractual maturities because some securities may be called or prepaid.
Statement FairValue Value
Due to mature:One year or less $ 490,902 $ 497,430Over one year
through five years 3,015,121 3,128,547Over five years
through ten years 4,999,376 5,136,039Over ten years 2,031,343 2,120,079Mortgage and
asset-backed securities 6,737,332 6,870,967
Total fixed maturities $17,274,074 $17,753,062
(b) Common and Preferred Stocks and Other InvestmentsThe cost of common and preferred stocks and other invest-ments at December 31, 2001 and 2000, was as follows:
2001 2000
Common stocks $ 784,409 $ 799,513Preferred stocks 225,383 136,550Other investments 510,101 485,756
$1,519,893 $1,421,819
(c) DerivativesAt December 31, 2001 and 2000, the Companies wereparty to derivative contracts in the form of equity swapcontracts. The purpose of the equity swap contracts is to exchange rates of return of a specified set of commonstocks for rates of return consistent with the broad equitymarkets as represented by Standard & Poor’s Index of 500common stocks. The Companies agree with counterpartiesto exchange, at quarterly intervals, the net performancedifferential of the Standard & Poor’s Index of 500 commonstocks and a portfolio of the Companies’ common stocks. A single net payment is made by one counterparty at eachdue date. The Companies are exposed to potential creditloss with respect to only the net differential payments inthe event of nonperformance by the counterparties.
At December 31, 2001 and 2000, the equity swaps hadcombined notional amounts of $361,879 and $383,285,respectively and fair values of $13,516 and ($51,980),respectively.
(d) Investments in AffiliatesInvestments in affiliates consist primarily of theCompanies’ investments in unconsolidated insurance, inter-national and financial services subsidiaries. The Companies’equity in the net assets of unconsolidated subsidiaries issummarized as follows at December 31, 2001 and 2000:
2001 2000
Equity in net assets of unconsolidated subsidiaries $ 2,220,320 $ 1,635,263
Market value of Liberty Financial Companies, Inc. – 1,053,104
Loans to unconsolidated subsidiaries 6,822 180,000
Companies’ investment in affiliates $ 2,227,142 $ 2,868,367
Total assets $ 14,095,002 $10,593,804Total liabilities (11,862,260) (8,947,801)Interests of other
shareholders (12,422) (10,740)
Companies’ equity in net assets $ 2,220,320 $ 1,635,263
Equity in net assets of unconsolidated subsidiaries is distributed as follows at December 31, 2001 and 2000:
2001 2000
International subsidiaries $831,302 $1,126,739Liberty Financial
Companies, Inc. 909,953 –Liberty Life Assurance
Company of Boston 131,031 140,589Other subsidiaries 348,034 367,935
Companies’ equity in net assets $2,220,320 $1,635,263
Notes to Combined Statutory Financial Statements(dollars in thousands)

29
In 2000, the Companies changed the valuation method-ology for LFC to the market value approach. The change in methodology increased the carrying value of LFC byapproximately $456,000 at December 31, 2000. OnOctober 31, 2001, LFC sold its annuity and bank marketingbusiness for $1.7 billion in cash and on November 1, 2001,LFC sold its asset management business for $900,000 incash and the buyer assumed approximately $110,000 inrevolving debt. LFC recorded a gain on the sale, net of taxof $140,000 and the Companies recognized an unrealizedgain of $98,000. Following the sales of LFC’s operatingsubsidiaries, the Companies’ acquired 100% ownership ofLFC. As of December 31, 2001, the Companies’ investmentin LFC is valued on the statutory equity basis.
The remaining unamortized goodwill and other intan-gible asset balances included as a component of theCompanies’ investments in affiliates at December 31, 2001and 2000, were $360,562 and $333,438, respectively. Theremaining unamortized goodwill and other intangible assetbalances associated with combined insurance subsidiariesreported in other assets at December 31, 2001 and 2000,were $40,220 and $42,338, respectively.
Liberty Mutual purchased a 99.99% interest in Royal &Sun Alliance, S.A. Compañía Española de Seguros yReaseguros (re-named Liberty Insurance Group, Companiade Seguros y Reaseguros, S.A.) in Spain on November 26,2001. Liberty Insurance Group, Compania de Seguros yReaseguros, S.A. is licensed in Spain and sells property,casualty and life insurance. The transaction was accountedfor as a statutory purchase and the cost was $191,937.Goodwill amortization relating to the purchase was $6,935for the year ended December 31, 2001. Unamortizedgoodwill as of December 31, 2001 was $131,772.
In addition, the Companies’ unconsolidated subsidiariesacquired various companies in 2001 and 2000 for aggre-gate consideration of $111,462 and $16,925, respectively.
(e) Realized Investment Gains (Losses)Realized investment gains (losses) were as follows in 2001and 2000:
2001 2000
Fixed maturities:Gross gains $248,432 $ 31,185Gross losses (85,633) (48,839)
Common and preferred stocks:Gross gains 266,571 168,947Gross losses (110,622) (63,871)
Other investments:Gross gains 21,992 259,933Gross losses (44,743) (10,806)
$295,997 $336,549
Proceeds from sales of fixed maturity investments during2001 and 2000, were $6,007,281 and $2,578,060, respectively.
Gross losses included other-than-temporary impairmentwrite-downs of $80,786 in 2001.
(f) Net Investment IncomeNet investment income for the years ended December 31,2001 and 2000, consisted of:
2001 2000
Fixed maturities $1,286,098 $1,331,269Common and
preferred stocks 38,090 40,794Short-term investments 26,749 39,006Other 82,409 68,872
Gross investment income 1,433,346 1,479,941Investment and
interest expense (200,511) (205,137)
Net investment income $1,232,835 $1,274,804
(g) Statutory DepositsAt December 31, 2001 and 2000, fixed maturity securitiescarried at $4,564,853 and $4,671,043, respectively, wereon deposit with regulatory authorities as required by law.
(h) Securities LoanedAt December 31, 2001 and 2000, the market values offixed maturity securities loaned were approximately$153,515 and $697,434, respectively. Cash and short-terminvestments received as collateral in connection therewithat December 31, 2001 and 2000, were approximately$121,893 and $498,666, respectively, while non-cash collateral received in connection therewith was approxi-mately $34,692 and $212,717, respectively.
(3) Losses and Loss Adjustment Expenses Unpaid
The Companies establish loss and loss adjustment expensereserves, which are estimates of future payments of reported and unreported claims for losses and the relatedfuture expenses. The process of establishing loss reserves is subject to uncertainties that are normal, recurring andinherent in the property and casualty insurance business. Theprocess requires reliance upon estimates based on availabledata that reflects past experience, current trends and otherinformation, and the exercise of informed judgment.
As information develops that varies from past experi-ence, provides additional data or, in some cases, augmentsdata that previously was not considered sufficient for usein determining reserves, changes in the Companies’ estimate of ultimate liabilities may be required. The effectsof these changes are reflected in current operating results.
Activity in the insurance loss and loss adjustmentexpense reserves of the Companies is summarized as follows:
2001 2000
Balance as of January 1 $16,378,038 $16,928,795Incurred attributable to:
Current year 7,657,053 7,256,863Prior years 1,181,990 367,613
Total incurred 8,839,043 7,624,476Paid attributable to:
Current year 3,517,835 3,302,112Prior years 4,849,162 4,863,901
Total paid 8,366,997 8,166,013Net adjustment due
to foreign exchange (17,392) (9,220)
Balance as of December 31 $16,832,692 $16,378,038
In 2001 and 2000, incurred attributable to prior years wasdue to reserve increases primarily in commercial lines,including asbestos and environmental.
Notes to Combined Statutory Financial Statements(dollars in thousands)

30
In 2000, incurred attributable to prior years was favor-ably impacted by reinsurance transactions with a whollyowned subsidiary as more fully disclosed in Note 5.
The Companies do not discount unpaid insurance lossesand loss adjustment expenses other than tabular discount-ing on the long-term indemnity portion of workers com-pensation claims and group accident and health claims aspermitted by insurance regulations in certain states.
The tabular discounting on these workers compensationclaims is based upon Unit Statistical Plan tables as approvedby the respective states and generally approximates 4.0%.Unpaid losses at December 31, 2001 and 2000 include liabilities of $3,619,664 and $2,782,925 at discounted values of $2,302,836 and $1,719,278, respectively.
The tabular discounting on group accident and healthclaims is based on the 1987 Commissioners GroupDisability Table (CGDT) at annual discount rates varyingfrom 5.00% to 5.75% (6.0% in 2000). Unpaid losses at December 31, 2001 and 2000 include liabilities of$674,854 and $611,108 carried at discounted values of $466,996 and $425,951, respectively.
Loss and loss adjustment expense reserves are record-ed net of anticipated salvage and subrogation of $428,393and $410,498 as of December 31, 2001 and 2000, respectively.
For certain commercial lines of insurance, the Companiesoffer experience-rated insurance contracts whereby the ultimate premium is dependent upon the level of ultimatelosses and loss adjustment expenses incurred. At December31, 2001 and 2000, the Companies held $4,228,743 and$4,067,094, respectively, of loss and loss adjustmentexpense reserves related to experience-rated contracts.Premiums receivable included accrued retrospective premi-ums and accrued unbilled audit premiums of $710,278 and$623,209 at December 31, 2001 and 2000, respectively,and $78,313 and $76,581, respectively, have been designated non-admitted and charged to surplus.
As of December 31, 2001, the amount of reserve credit recorded for high deductibles on unpaid losses was$1,451,967 and the amount billed and recoverable was$257,163.
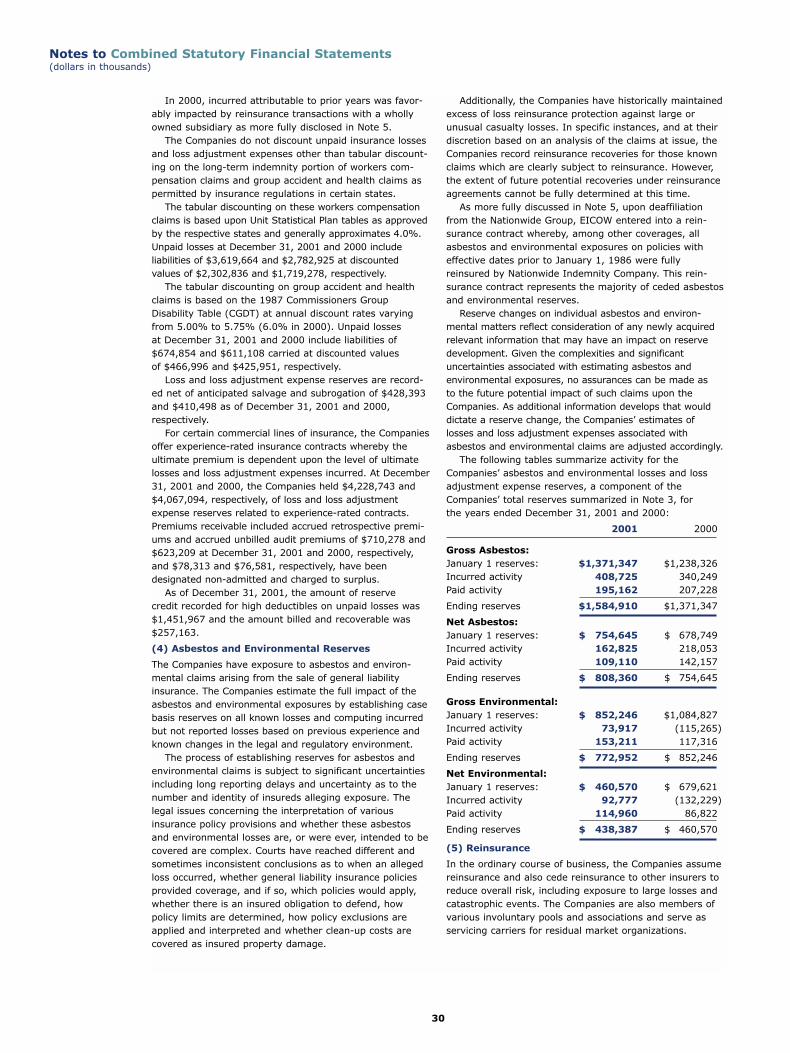
(4) Asbestos and Environmental Reserves
The Companies have exposure to asbestos and environ-mental claims arising from the sale of general liability insurance. The Companies estimate the full impact of theasbestos and environmental exposures by establishing casebasis reserves on all known losses and computing incurredbut not reported losses based on previous experience andknown changes in the legal and regulatory environment.
The process of establishing reserves for asbestos andenvironmental claims is subject to significant uncertaintiesincluding long reporting delays and uncertainty as to thenumber and identity of insureds alleging exposure. Thelegal issues concerning the interpretation of various insurance policy provisions and whether these asbestosand environmental losses are, or were ever, intended to becovered are complex. Courts have reached different andsometimes inconsistent conclusions as to when an allegedloss occurred, whether general liability insurance policiesprovided coverage, and if so, which policies would apply,whether there is an insured obligation to defend, how policy limits are determined, how policy exclusions areapplied and interpreted and whether clean-up costs arecovered as insured property damage.
Additionally, the Companies have historically maintainedexcess of loss reinsurance protection against large orunusual casualty losses. In specific instances, and at theirdiscretion based on an analysis of the claims at issue, theCompanies record reinsurance recoveries for those knownclaims which are clearly subject to reinsurance. However,the extent of future potential recoveries under reinsuranceagreements cannot be fully determined at this time.
As more fully discussed in Note 5, upon deaffiliationfrom the Nationwide Group, EICOW entered into a rein-surance contract whereby, among other coverages, allasbestos and environmental exposures on policies witheffective dates prior to January 1, 1986 were fully reinsured by Nationwide Indemnity Company. This rein-surance contract represents the majority of ceded asbestosand environmental reserves.
Reserve changes on individual asbestos and environ-mental matters reflect consideration of any newly acquiredrelevant information that may have an impact on reservedevelopment. Given the complexities and significant uncertainties associated with estimating asbestos and environmental exposures, no assurances can be made as to the future potential impact of such claims upon theCompanies. As additional information develops that woulddictate a reserve change, the Companies’ estimates of losses and loss adjustment expenses associated withasbestos and environmental claims are adjusted accordingly.
The following tables summarize activity for theCompanies’ asbestos and environmental losses and lossadjustment expense reserves, a component of theCompanies’ total reserves summarized in Note 3, for the years ended December 31, 2001 and 2000:
2001 2000
Gross Asbestos:January 1 reserves: $1,371,347 $1,238,326Incurred activity 408,725 340,249Paid activity 195,162 207,228
Ending reserves $1,584,910 $1,371,347
Net Asbestos:January 1 reserves: $ 754,645 $ 678,749Incurred activity 162,825 218,053Paid activity 109,110 142,157
Ending reserves $ 808,360 $ 754,645
Gross Environmental:January 1 reserves: $ 852,246 $1,084,827Incurred activity 73,917 (115,265)Paid activity 153,211 117,316
Ending reserves $ 772,952 $ 852,246
Net Environmental:January 1 reserves: $ 460,570 $ 679,621Incurred activity 92,777 (132,229)Paid activity 114,960 86,822
Ending reserves $ 438,387 $ 460,570
(5) Reinsurance
In the ordinary course of business, the Companies assumereinsurance and also cede reinsurance to other insurers toreduce overall risk, including exposure to large losses andcatastrophic events. The Companies are also members ofvarious involuntary pools and associations and serve asservicing carriers for residual market organizations.
Notes to Combined Statutory Financial Statements(dollars in thousands)
31
Notes to Combined Statutory Financial Statements(dollars in thousands)
Premiums earned and losses and loss adjustmentexpenses incurred from reinsurance assumed for the yearsended December 31, 2001 and 2000, were as follows:
2001 2000
Premiums earned (residual markets) $ 98,207 $ 79,211
Premiums earned (all other) 579,967 503,997
Incurred losses and loss adjustment expenses 905,724 703,015
Premiums earned and losses and loss adjustment expensesincurred have been reduced for reinsurance ceded for theyears ended December 31, 2001 and 2000, as follows:
2001 2000
Premiums earned (residual markets) $ 345,158 $ 248,868
Premiums earned (all other) 1,378,101 1,371,370
Incurred losses and loss adjustment expenses 2,661,789 1,748,945
Unearned premiums and unpaid losses and loss adjust-ment expenses have been reduced for reinsurance cededas follows:
2001 2000
Unpaid losses and loss adjustment expenses (residual markets) $1,816,260 $1,880,805
Unpaid losses and loss adjustment expenses (all other) 5,115,906 4,132,127
Unearned premiums (residual markets) 130,351 84,475
Unearned premiums (all other) 441,092 211,215
The Companies remain contingently liable in the event reinsurers are unable to meet the obligations for paid andunpaid loss recoverables and unearned premiums cededunder reinsurance agreements.
Effective November 1, 2001, Liberty Mutual acquired the renewal rights to the independent agency business of OneBeacon, excluding New York, New Jersey and NewEngland. The business includes small commercial and personal lines and total premiums are estimated to beapproximately $1,000,000. Under the terms of the agreement, Liberty Mutual will retain one third of theunderwriting results in the first year, two thirds in the second year and one hundred percent thereafter. Thetransaction excludes insurance liabilities incurred prior to the effective date. Under the terms of the transaction,Liberty Mutual assumed the related infrastructure, employees and underwriting responsibility for the business.
In 2001 and 2000, the Companies entered into retro-active reinsurance treaties with unaffiliated entities. TheCompanies transferred loss and loss adjustment expensereserves of $1,603,000 and $460,000, respectively and recognized a gain through other income of $800,000 and
$319,000, respectively. Included in the other income figures are accrued contingent profit sharing commissions of $162,500 and $0 for 2001 and 2000, respectively.
Liberty Mutual entered into a reinsurance agreementeffective January 1, 1998 with Liberty Life AssuranceCompany of Boston (“Liberty Life”), an indirect, unconsoli-dated subsidiary of the Companies, whereby Liberty Lifeceded 100% of long and short-term disability business on a funds withheld basis. Liberty Mutual assumed premiumsearned of $253,480 and $261,528 in 2001 and 2000,respectively; and loss and loss adjustment expense reservesof $625,604 and $545,148 as of December 31, 2001 and2000, respectively. The transaction resulted in a net loss of $2,062 and $18,091 in 2001 and 2000, respectively.
The Companies have reinsurance recoverables fromNationwide Indemnity Company in the amount of$1,099,175 as of December 31, 2001. The reinsurancerecoverables are guaranteed by Nationwide MutualInsurance Company. Additionally, the Companies have significant reinsurance recoverable concentration withNational Indemnity Company (a Berkshire Hathaway, Inc. subsidiary) and North American Specialty InsuranceCompany (a subsidiary of Swiss Reinsurance Company)totaling $489,334 and $509,508, respectively, as ofDecember 31, 2001, net of offsetting contractual liabilities.
The Companies entered into commutation agreementsin 2000 with unaffiliated reinsurers. Loss and loss expensereserves of $143,974, were returned along with cash of$97,100. The transaction resulted in a net statutory loss of $30,468.
Liberty Mutual entered into an intercompany rein-surance agreement with a wholly owned unconsolidatedsubsidiary in 2000 whereby Liberty Mutual ceded $195,983of loss and loss adjustment expense reserves in exchangefor premium of $147,591. The transaction resulted in net statutory income of $31,454, with no impact uponstatutory surplus. The Companies received regulatoryapproval to use prospective reinsurance accounting for2000. In 2001, the treaty was commuted in conjunctionwith the implementation of codification.
In 1997 San Diego Insurance Company (“San Diego”)entered into an assumed indemnity reinsurance agreementrecorded under the deposit method in accordance with statutory accounting. At inception, approximately$1,215,000 of securities and other assets were transferredto San Diego and recorded as a deposit liability. Interest iscredited on the contractual deposit balance at a rate of 7%annually. The outstanding deposit liability was $316,827and $399,000 at December 31, 2001 and 2000, respec-tively. The Companies have recorded the maximum liabilityunder the contract.
(6) Short-Term Borrowings
The Companies maintain a $600,000 revolving loan agree-ment maturing on December 31, 2003, with Liberty MutualCapital Corporation (Boston), a wholly owned unconsolidat-ed subsidiary. At December 31, 2001 and 2000, there werebalances outstanding of $283,113 and $111,239, respec-tively. Interest is based on the average daily outstandingborrowings at a variable interest rate (5.00% and 6.91%at December 31, 2001 and 2000, respectively). Interestexpense incurred related to this agreement was $10,205and $10,041 in 2001 and 2000, respectively.

32
Liberty Mutual has aggregate pound sterling denominateddemand notes payable to its subsidiary, Liberty Re Limited,totaling $333,188 and $341,984 (U.S. dollar equivalent atDecember 31, 2001 and December 31, 2000, respectively),and a demand note payable to its subsidiary Liberty Re(Bermuda) Limited, in the amount of $34,359 and $24,359as of December 31, 2001 and 2000, respectively. Intereston these notes is payable semi-annually on the first day ofApril and October, computed at LIBOR plus .15%.
(7) Surplus Notes
Surplus notes represent subordinated debt instrumentsclassified as a component of surplus for statutory account-ing purposes. At December 31, 2001 and 2000, LibertyMutual had the following surplus notes outstanding:
2001 2000
8.20%, $250,000 Notes due May 4, 2007 $ 249,706 $ 249,651
8.50%, $150,000 Notes due May 15, 2025 149,759 149,749
7.88%, $250,000 Notes due October 15, 2026 249,654 249,640
7.70%, $500,000 Notes due October 15, 2097 491,900 491,815
$1,141,019 $1,140,855
Payments for interest on and principal of the notes areexpressly subordinate to all policyholder claims and otherobligations of Liberty Mutual. Accordingly, interest andprincipal payments are contingent upon prior approval ofthe Commissioner of Insurance of the Commonwealth ofMassachusetts. Interest paid was $91,422 for the yearsended December 31, 2001 and 2000.
(8) Federal and Foreign Income Taxes
The Companies file consolidated federal income tax returnswith their respective eligible subsidiary companies. LibertyFire, Montgomery, M&B, and EICOW each file separate fed-eral income tax returns. Pursuant to intercompany federalincome tax allocation agreements, net operating losses andtax credits generated by certain subsidiaries and used toreduce the consolidated tax liability are reimbursed basedon separate-return calculations. Intercompany tax balancesare settled quarterly. Provision is made, where applicable,for taxes on foreign branch operations.
Total federal and foreign income taxes paid (recovered)were ($22,541) and $16,497 in 2001 and 2000, respec-tively. The amount of federal income taxes incurred andavailable for recoupment in the event of future net lossesis $8,255 for the current year and $13,105 for the firstpreceding year. EICOW has net operating losses availablefor carryforward of approximately $294 million, expiring in2002 through 2018. LMHC and Subsidiaries have net oper-ating losses available for carryforward of approximately$844 million, expiring in 2020 and 2021.
Federal income taxes incurred for financial statementpurposes are provided based upon the manner in whichincome and deductions are reported for tax purposes. The Companies’ income tax expense differs from theamount obtained by applying the federal statutory rate of 35% to income before income taxes in 2001, principallydue to revisions to estimates and the creation of net operating loss carryforwards; and in 2000, principally dueto the effects of tax-exempt interest, dividends-receiveddeductions and revisions to estimates.
The components of deferred tax assets (liabilities) are as follows:
December 31, 2001 January 1, 2001 Change
Gross deferred tax assets $1,886,335 $1,885,270 $ 1,065Gross deferred tax liabilities (597,465) (744,070) 146,605
Net deferred tax assets 1,288,870 1,141,200 147,670Deferred tax assets non-admitted (676,272) (567,026) (109,246)
Deferred tax assets admitted $ 612,598 $ 574,174 $ 38,424
The Companies’ net deferred tax asset is principally due to net operating loss carryforwards, loss and loss adjustmentexpense reserve discounting, and unearned premium discounting offset by unrealized gains on securities.
(9) Benefit Plans
(a) Pension Plans and Postretirement BenefitsThe Companies sponsor noncontributory defined benefitpension plans (“the Plans”) covering substantially all U.S.and Canadian employees. The benefits and eligibility arebased on age, years of service and the employee’s compensation, as more fully defined in the Plans.
Assets of the Plans consist primarily of investments in life insurance company separate accounts and a collectiveinvestment trust fund, which invests primarily in fixedincome and Standard & Poor’s Index of 500 equity
securities. At December 31, 2001 and 2000, assets of thePlans totaling $2,000,255 and $2,301,358, respectively,were held in separate accounts of Liberty Life AssuranceCompany of Boston (“Liberty Life”).
The Companies also provide certain health care and lifeinsurance benefits (“postretirement”) for retired employees.Substantially all employees may become eligible for thesebenefits if they reach retirement age and have ten years of service working for the Companies. Alternatively, retireesmay elect certain prepaid health care benefit plans. Lifeinsurance benefits are based upon a participant’s final compensation subject to the plan maximum.
Notes to Combined Statutory Financial Statements(dollars in thousands)

33
A summary of assets, obligations and assumptions of the Plans and postretirement benefits are as follows at December 31, 2001 and 2000:
Pension Postretirement
2001 2000 2001 2000
Change in benefit obligationBenefit obligation at beginning of year $1,700,837 $1,535,834 $ 288,548 $ 276,755Eligibility costs 74,860 64,466 10,836 7,351Interest cost 124,425 117,995 20,362 20,338Amendments 60,842 25,580 (6,500) (931)Actuarial loss 136,246 66,245 23,134 5,340Other 28,824 – 7,539 2,994Benefits paid (89,042) (109,283) (25,990) (23,299)
Benefit obligation at end of year $2,036,992 $1,700,837 $ 317,929 $ 288,548Change in plan assetsFair value of plan assets
at beginning of the year $2,434,278 $2,544,049 $ 24,800 $ 25,026Actual return on plan assets (194,958) 4,230 (791) 1,674Other 29,524 (1,919) – –Employer contribution – – 24,159 21,399Benefits paid (85,620) (106,266) (25,990) (23,299)Administrative expense (8,879) (5,816) – –
Fair value of plan assets at end of the year $2,174,345 $2,434,278 $ 22,178 $ 24,800Reconciliation of prepaid/(accrued)Funded status of the plan $ 137,353 $ 733,441 $(295,751) $(261,558)Unrecognized net (gain)/loss 411,557 (652,892) 30,782 5,144Unrecognized prior service cost 49,681 – (6,539) (504)Unrecognized net transition (asset)/obligation (666,284) (104,442) 112,925 124,124
Net amount recognized $ (67,693) $ (23,893) $(158,583) $(132,794)Components of net periodic
benefit cost for fiscal yearEligibility costs 74,860 64,466 10,836 $ 7,351Interest cost 124,425 117,995 20,362 20,338Special termination benefit charges – – – 803Expected return on plan assets (187,603) (142,047) (1,984) (2,065)Amortization of unrecognized:
Net (gain)/loss (325) (24,843) 21 1Prior service cost – 1,720 (465) (31)Net transition (asset)/obligation 1,370 (3,922) 11,279 11,304
Net periodic pension cost $ 12,727 $ 13,369 $ 40,049 $ 37,701Weighted-average assumptionsDiscount rate 7.00% 7.25% 7.00% 7.25%Expected return on plan assets 9.00% 9.00% 7.15% 7.15%Rate of compensation increase 5.20% 5.60% – –
The amount of the benefit obligation for non-vested employees was $39,904 and $28,444 at December 31, 2001and 2000, respectively. The accumulated postretirementbenefit obligation for non-vested employees was $107,984and $91,318 at December 31, 2001 and 2000, respectively.
The health care cost trend rates were 6.75% in 2001 and7.75% in 2000 respectively, graded to 5.00% in 2003.Health care cost trend rate assumptions have a materialimpact on the postretirement benefit obligation. An assumedchange in health care cost trend rates by a one percentagepoint increase or decrease in each year would impact thepostretirement benefit obligation as of December 31, 2001,by an increase of $29,642 or a decrease of $27,077 and theestimated eligibility cost and interest cost components ofthe net periodic postretirement benefit cost for 2001 by anincrease of $1,982 or a decrease of $1,857.
(b) Thrift-Incentive PlanThe Companies sponsor defined contribution savings plansfor employees who meet certain eligibility requirements.During 2001 and 2000, employees were permitted to contribute a percentage of their annual compensation on a combined before-tax and after-tax basis, subject to certain limitations imposed by the Tax Reform Act of 1986.The Companies made matching contributions of $57,000and $54,000 in 2001 and 2000, respectively.
(c) Other Compensation PlansThe Companies provide various performance based compen-sation plans to employees meeting the participation require-ments of the respective plans. Related compensation isdetermined in accordance with plan formulas.
Notes to Combined Statutory Financial Statements(dollars in thousands)

34
(10) Commitments and Contingent Liabilities
The Companies periodically purchase annuity contractsfrom various life insurance companies to settle claims.When a contract is purchased, the corresponding lossreserve is eliminated. The primary liability for future claimpayments resides with the life insurance company, but incertain instances, the Companies remain contingently liablein the event the life insurer is unable to meet its obliga-tion. These annuities were primarily purchased fromLiberty Life. At December 31, 2001 and 2000, the contin-gent liabilities amounted to $668,423 and $591,586,respectively, and represent the statutory reserves of theannuities as reported by the issuing companies.
On October 3, 2001, the Companies received notifi-cation of the insolvency of the Reliance Insurance Group. It is expected the insolvency will result in a gross guarantyfund assessment against the Companies of approximately$104,000 which was charged to operations in 2001 andwas offset by future premium tax credits and policy surcharges of $44,000.
At December 31, 2001, the Companies had commit-ments to purchase various mortgage backed securities settling in 2002, at a cost of $725,716 with a fair marketvalue of $720,867.
At December 31, 2001, the Companies had unfundedcapital commitments to private equity partnerships of$609,500.
The Companies lease certain office facilities and equip-ment from others under operating leases expiring in various years through 2009. Rental expense amounted to$149,700 and $131,968 for the years ended December 31,2001 and 2000, respectively. Future minimum rental pay-ments under non-cancelable leases with terms in excess of one year are estimated to be, $180,393 for 2002,$160,278 for 2003, $132,960 for 2004, $95,712 for 2005,and $100,134 for 2006 and thereafter. It is expected thatas leases expire they will be replaced.
In 2001, the Companies entered into a sale-leasebackagreement with an unrelated party for certain equipment,under a thirteen month lease period with monthly renewaloptions to a maximum of sixty months. The Companiessold non-admitted assets with a book value of $88,090 andreceived cash in the amount of $125,502. The transactionresulted in a deferred gain of $37,412 and an increase tounassigned surplus of $88,090.
During 2001, the Companies sold premiums receivableover 90 days past due totaling $74,831, net of valuationallowance, to LMGI for proceeds of $63,961, representingthe estimated fair market value of the related asset. Thetransaction was completed without recourse. TheCompanies realized an increase in surplus equal to theproceeds received and recorded a loss on the sale in theamount of $10,870. Concurrent with the transaction, LMGI entered into a premiums receivable swap financialarrangement with a third party, whereby LMGI received$75,000 in cash for the discounted non-admitted premi-ums receivable.
Liberty Mutual guarantees the obligations of Liberty Lifeon insurance policies and contracts issued.
The Companies guarantee the performance of certainaffiliates’ obligations under various credit facilities. Thetotal facilities had outstanding balances of $349,249 and$335,592 ($600,000 total revolving credit facility and$300,000 backup line of credit facility) as of December 31,2001 and 2000, respectively.
Various lawsuits against the Companies have arisen inthe normal course of business. Contingent liabilities arisingfrom litigation, income taxes and other matters are notconsidered material in relation to the financial position ofthe Companies.
(11) Unusual or Infrequent Items
The Companies have material exposure to losses arisingfrom the terrorist attacks of September 11, 2001. Theexposure arises from property, workers compensation,surety and reinsurance contracts written by member companies of the Liberty Mutual Group. Although uncer-tainty about the final loss amount still exists, the lossesare reasonably estimable and such estimate has beenrecorded. The Companies believe that their reinsurers are financially sound and that reinsurance collectibility is not a significant issue or concern. The Liberty MutualGroup, including international subsidiaries, recognized a pretax loss, net of reinsurance, of approximately$500,000, with $167,000 being recognized directly by the Companies.
Notes to Combined Statutory Financial Statements(dollars in thousands)

35
The Boards of DirectorsLiberty Mutual Insurance CompanyLiberty Mutual Fire Insurance CompanyEmployers Insurance Company of Wausau
The accompanying combined statutory financial statementsand related information contained in this annual report are the responsibility of management and have been pre-pared in conformity with accounting practices prescribed orpermitted by insurance regulatory authorities. These com-bined statutory financial statements include amounts thatare based on management’s estimates and judgments,particularly our reserves for losses and loss adjustmentexpenses. We believe that these combined statutory finan-cial statements present fairly the Companies’ financialposition and results of operations and that other informa-tion contained in the annual report is consistent with thecombined statutory financial statements.
We maintain and rely on a system of internal accountingcontrols designed to provide reasonable assurance thatassets are safeguarded and transactions are properlyauthorized and recorded. We continually monitor theseinternal accounting controls, modifying and improvingthem as business conditions and operations change. Ourinternal audit department also independently reviews and evaluates these controls. We believe our systems ofinternal accounting controls provide reasonable assurancethat errors or irregularities that would be material to thecombined statutory financial statements are prevented ordetected in the normal course of business.
Our independent auditors, Ernst & Young LLP, haveaudited the combined statutory financial statements and
expressed their opinion on the fairness of these combinedstatutory financial statements. Their audit provides anindependent, objective review of our combined statutoryfinancial statements. They review our internal controls andprocedures, perform tests of accounting records and con-duct other auditing procedures as they consider necessaryto comply with auditing standards generally accepted inthe United States.
The Audit Committee of the Board of Directors, com-prised solely of outside directors, oversees management’sdischarge of its financial reporting responsibilities. TheAudit Committee meets periodically with management, ourinternal auditors and representatives from Ernst & YoungLLP to discuss auditing, financial reporting and internalcontrol matters. Both our internal audit department andErnst & Young LLP have access to the Audit Committeewithout management’s presence.
Edmund F. KellyChairman, President and Chief Executive Officer
J. Paul Condrin, IIISenior Vice President and Chief Financial Officer
Report of Management
The Boards of DirectorsLiberty Mutual Insurance CompanyLiberty Mutual Fire Insurance CompanyEmployers Insurance Company of Wausau
We have audited the accompanying combined statutory balance sheets of Liberty Mutual Insurance Companies (theCompanies) as of December 31, 2001 and 2000, and therelated combined statutory statements of income, changesin statutory surplus, and cash flow for the years then ended.These financial statements are the responsibility of theCompanies’ management. Our responsibility is to express anopinion on these financial statements based on our audits.
We conducted our audits in accordance with auditingstandards generally accepted in the United States. Thosestandards require that we plan and perform the audit toobtain reasonable assurance about whether the financialstatements are free of material misstatement. An auditincludes examining, on a test basis, evidence supportingthe amounts and disclosures in the financial statements.An audit also includes assessing the accounting principlesused and significant estimates made by management, aswell as evaluating the overall financial statement presen-tation. We believe that our audits provide a reasonablebasis for our opinion.
As described in Note 1 to the financial statements, theCompanies present their financial statements in conformitywith accounting practices prescribed or permitted by the insurance departments of the states in which the individual companies are domiciled, which practices differfrom accounting principles generally accepted in the United States. The variances between such practices and
accounting principles generally accepted in the UnitedStates also are described in Note 1.
In our opinion, because of the effects of the matterdescribed in the preceding paragraph, the financial state-ments referred to above do not present fairly, in conformi-ty with accounting principles generally accepted in theUnited States, the combined financial position of LibertyMutual Insurance Companies at December 31, 2001 and2000, or the combined results of their operations or theircash flows for the years then ended.
However, in our opinion, the financial statementsreferred to above present fairly, in all material respects, the combined financial position of Liberty Mutual InsuranceCompanies at December 31, 2001 and 2000, and the com-bined results of their operations and their cash flows for theyears then ended in conformity with accounting practicesprescribed or permitted by the insurance departments ofthe states in which the individual companies are domiciled.
As discussed in Note 1 to the financial statements, in2001 the Companies changed various accounting policiesto be in accordance with the revised NAIC AccountingPractices and Procedures Manual, as adopted by the insurance departments of the states in which the indi-vidual companies are domiciled.
Boston, MassachusettsFebruary 15, 2002
Report of Independent Auditors

36
Board of Directors: Liberty Mutual Holding Company Inc.
Michael J. BabcockPrivate InvestorVero Beach, Florida
Gary C. ButlerPresident and Chief Operating OfficerAutomatic Data Processing, Inc.Roseland, New Jersey
Charles I. Clough, Jr.Chairman and Chief Executive OfficerClough Capital Partners, LPBoston, Massachusetts
Gary L. CountrymanChairman EmeritusLiberty Mutual Insurance CompanyLiberty Mutual Fire Insurance CompanyBoston, Massachusetts
Paul J. Darling, IIPresident and Chief Executive OfficerCorey Steel CompanyCicero, Illinois
John P. HamillChairman and Chief Executive OfficerSovereign Bank New EnglandBoston, Massachusetts
Marian L. HeardPresident and Chief Executive OfficerUnited Way of Massachusetts BayBoston, Massachusetts
Edmund F. KellyChairman, President and ChiefExecutive OfficerLiberty Mutual Holding Company Inc.Boston, Massachusetts
Thomas J. MayChairman, President and Chief Executive OfficerNSTARBoston, Massachusetts
Stephen F. PagePresident and Chief Executive OfficerOtis Elevator CompanyFarmington, Connecticut
Dr. Kenneth L. RoseVice Chairman and Chief Executive OfficerHenkels & McCoy, Inc.Blue Bell, Pennsylvania
Ellen A. RudnickExecutive Director and ClinicalProfessor, Entrepreneurship ProgramUniversity of Chicago Graduate School of BusinessChicago, Illinois
Glenn P. StrehleTreasurer EmeritusMassachusetts Institute of TechnologyCambridge, Massachusetts
William C. Van FaasenChairman, President and Chief Executive OfficerBlue Cross and Blue Shield ofMassachusetts, Inc.Boston, Massachusetts
Edmund F. KellyChairman, President and Chief Executive Officer
John B. ConnersExecutive Vice President
Gary R. GreggExecutive Vice President
Roger L. JeanExecutive Vice President
Thomas C. RameyExecutive Vice President
J. Paul Condrin IIISenior Vice President and Chief Financial Officer
Terry L. ConnerSenior Vice President and Chief Information Officer
A. Alexander FontanesSenior Vice President and Chief Investment Officer
Christopher C. MansfieldSenior Vice President and General Counsel
Helen E.R. SaylesSenior Vice President
Stephen G. SullivanSenior Vice President
Douglas M. HodesVice President and Corporate Actuary
Dennis J. LangwellVice President and Comptroller
Dexter R. LeggVice President and Secretary
Corporate Officers: Liberty Mutual Holding Company Inc.

37
Operating Management: Liberty Mutual Insurance Company
Commercial Markets
Gary R. GreggExecutive Vice President and Manager
Joseph A. GillesExecutive Vice PresidentAdministration
Business Market
John M. CollinsChief Operating Officer
Geoffrey E. HuntExecutive Vice President
Field Operations
Senior Vice Presidents and
Division General Managers
James D. Barrett
Robert J. Brautigam
Thomas P. Coyne
James A. Dupont
Bryan M. Grimm
David Radakovich
Thomas R. Rudder, Jr.
Timothy J. Rose
John M. Ruane, Jr.
E. Janney Wilson
National Market
David H. LongChief Operating Officer
Mark A. ButlerExecutive Vice President and Regional General Manager
Scott R. IsaacsonExecutive Vice President and Regional General Manager
Specialty Risks Market
Scott R. GoodbyChief Operating Officer
Douglas M. NelsonPresidentLMG Property
Dennis S. PerlerPresidentLiberty Bond Services
Group Market
Jean M. ScarrowChief Operating Officer
Wausau Commercial Market
James J. McIntyreChief Operating Officer
Personal Market
John B. ConnersExecutive Vice President and Manager
Regional Vice Presidents
Lewis R. Ayers
Donald O. Burns
Richard M. Evans
Thomas M. Jones
Maureen E. Lyden
James T. Masterson
Michael J. Mott
Vaughn R. Surprenant
Individual Life Market
John A. TymochkoChief Operating Officer

38
Operating Management: Liberty Mutual Insurance Company (continued)
International
Thomas C. RameyPresidentLiberty International
Joseph H. HamiltonChief Operating OfficerEurope
Peter LinChief Operating OfficerAsia
James T. McCartyChief Operating OfficerLatin America
Gordon J. McBurneyPresidentLiberty International Underwriters
Gery J. BarryPresidentLiberty HealthCanada
Luis BonellPresidentLiberty SegurosSpain
Mauricio GarciaPresidentLiberty Seguros SAColombia
S.F. LeowManaging DirectorLiberty Citystate Insurance PTE, Ltd.Hong Kong/Singapore
Robert L. MartinPresidentNarai International InsuranceThailand
Victor A. MeintjesPresidentSeguros Caracas de Liberty MutualVenezuela
Basilio PugatchenkoPresidentLiberty ART SA and Liberty SegurosArgentina
Luciano SuzukiPresidentLiberty Paulista SegurosBrazil
Regional Agency Markets
Roger L. JeanPresident
Mark FiebrinkExecutive Vice President
Richard T. BellPresident and Chief Executive OfficerIndiana Insurance Company
Michael R. ChristiansenPresident and Chief Executive OfficerPeerless Insurance Company
Donald E. FrettePresident and Chief Executive OfficerColorado Casualty Insurance Company
Steven A. FulwoodPresident and Chief Executive OfficerMontgomery Mutual InsuranceCompany
Ricky T. HodgesPresident and Chief Executive OfficerSummit Holding Southeast, Inc.
Frank J. KotarbaPresident and Chief Executive OfficerGolden Eagle Insurance Corporation
John C. RobinsonPresident and Chief Executive OfficerGoAmerica Auto Insurance

39
CALIFORNIA (Northern)
Michael J. BodellPresident and Chief Executive OfficerBodell Construction CompanySalt Lake City, Utah
James C. ChampionChairman of the BoardChampion Industrial ContractorsModesto, California
William H. ChildPresident and Chief Executive OfficerR. C. Willey Home Furnishings Inc.Salt Lake City, Utah
Robert C. CooksonPresident and Chief Executive OfficerThe Cookson Company Inc.Phoenix, Arizona
Ronald M. FedrickPresident, Owner and Chief Executive OfficerNOVA GroupNapa, California
Herman G. Rowland, Sr.Chairman of the BoardHerman Goelitz Candy Company, Inc.Fairfield, California
John J. ThulPresidentArizona Precision Sheet MetalPhoenix, Arizona
CALIFORNIA (Southern)
Rod BarhamChief Executive OfficerHDOS EnterprisesCarlsbad, California
Harold C. BennettPresidentUtility Trailer Manufacturing CompanyCity of Industry, California
Robert A. CurryPresidentCalifornia Cartage Co., Inc.Long Beach, California
Robert MyersonChairmanBen Myerson Candy CorporationLos Angeles, California
Anthony P. SouzaPresidentMPA, Inc.Torrance, California
Frank S. WyleFounder and ChairmanWyle ElectronicsEl Segundo, California
DELAWARE
Richard S. BarrPresidentBarr International, Inc.Salisbury, Maryland
John S. BonkPresidentM. Davis & Sons, Inc.Wilmington, Delaware
Eugene M. JulianPresidentEastern States Construction Service, Inc.Wilmington, Delaware
Alan B. LevinChairman, President and Chief Executive OfficerHappy Harry's, Inc.Newark, Delaware
William C. Robertson, Jr.PresidentPENCO CorporationSeaford, Delaware
P. Coleman Townsend, Jr.Chairman and Chief Executive OfficerTownsends, Inc.Wilmington, Delaware
FLORIDA
Richard W. EbsaryPresidentEbsary Foundation Company, Inc.Miami, Florida
Robert A. LopezPresidentGeneral Asphalt Company, Inc.Miami, Florida
Eugene McNicholsPresidentMcNichols CompanyTampa, Florida
Martin E. MurphyPresident and Chief Executive OfficerMurphy Construction Company, Inc.West Palm Beach, Florida
Kenneth N. SchulzPresidentPolk Nursery Company, Inc.Auburndale, Florida
Charles W. StiefelPresidentStiefel Laboratories, Inc.Coral Gables, Florida
Kenneth N. TraskPresident and Chief Executive OfficerConshor, Inc.Bonita Springs, Florida
GEORGIA
Edward M. AbramsChairman of the BoardAbrams Industries, Inc.Atlanta, Georgia
Fred KeithPresidentAtlanta Bonded WarehouseCorporationKennesaw, Georgia
Howell W. NewtonPresidentTrio Manufacturing CompanyForsyth, Georgia
William (Pete) W. Scogin, Jr.PresidentStasco Mechanical Contractors, Inc.Marietta, Georgia
Robert P. Shapard, IIIPresidentAmerican Knitting MillsGriffin, Georgia
INDIANA
Robert R. BaylorPresidentBaylor Trucking, Inc.Milan, Indiana
Mike MountPresidentMount Trucking, Inc.Columbus, Indiana
Daniel J. O'MaliaPresidentO'Malia Food Markets, Inc.Carmel, Indiana
Dean W. PfisterFormer SecretaryFranklin Electric CompanyFt. Wayne, Indiana
J. Douglas ReevesPresidentReeves Management Services, Inc.Knightstown, Indiana
Terry L. TuckerChairman, President and Chief Executive OfficerMaple Leaf Farms, Inc.Milford, Indiana
KENTUCKY
P. Jack ApplePresidentCummins Cumberland, Inc.Louisville, Kentucky
Advisory Boards: Liberty Mutual Insurance Company

40
Advisory Boards: Liberty Mutual Insurance Company (continued)
Robert W. ByrdChairman of the Board of DirectorsThe Keller Manufacturing Co., Inc.Corydon, Indiana
Don C. HaasPresidentHaas Cabinet Co., Inc. Sellersburg, Indiana
William H. Harrison, Jr.PresidentNumber Fourteen CorporationLouisville, Kentucky
Fred J. Merrick, Sr.Chief Executive Officer and PresidentMulti-Industries, IncorporatedLouisville, Kentucky
Thomas C. Nugent, IIIPresidentNugent Sand CompanyLouisville, Kentucky
Robert G. PfeifferChairman of the Board and Chief Executive OfficerNeill-LaVielle Supply Co.Louisville, Kentucky
MARYLAND
Wayne GaumerPresidentLightning TransportationHagerstown, Maryland
Michael E. HolupkaPartnerThe Anderson Company, LLCManassas, Virginia
Joseph A. HuntPresidentWestat, Inc.Rockville, Maryland
T. Kenneth JoyPresidentB. Frank Joy Company, Inc.Hyattsville, Maryland
Ernest D. LeveringPresidentRamsay, Scarlett & Co., Inc.Baltimore, Maryland
Carl A. RessaPresidentA. S. Johnson Company, Inc.Forestville, Maryland
Craig M. SmithPrincipalThe Creaney & Smith GroupBaltimore, Maryland
MASSACHUSETTS
Ara AykanianFormer Chairman and Chief Executive OfficerBoston Digital CorporationFramingham, Massachusetts
Salvatore A. BalsamoChairman and Chief Executive OfficerTechnical Aid Corporation d/b/a TACWorldwide CompanyDedham, Massachusetts
Michael F. FoleyPresidentM. F. Foley, Inc.New Bedford, Massachusetts
Wayne J. GriffinPresidentWayne J. Griffin Electric Inc.Holliston, Massachusetts
Benjamin D. HarringtonChief Executive Officer and TreasurerH. P. Cummings ConstructionCompany, Inc.Ware, Massachusetts
Charles B. HousenChairman, President and Chief Executive OfficerErving Industries, Inc.Erving, Massachusetts
Denis KeavenyPresident and Chief Executive OfficerCains Foods LPAyer, Massachusetts
Robert M. KennedyExecutive Vice President andTreasurerKennedy Die Castings, Inc.Worcester, Massachusetts
Daniel G. LarsonPresidentLarson Tool & Stamping CompanyAttleboro, Massachusetts
Michael J. McDougallSenior PartnerMcDougall Fine Arts GalleriesGloucester, Massachusetts
Edward O. OwensPresidentHenry F. Owens, Inc.Everett, Massachusetts
Alfred J. PandianiTreasurerNational Glass Works, Inc.Worcester, Massachusetts
James ZampellPresident and Chief Executive OfficerZampell Refractories, Inc.Newburyport, Massachusetts
MICHIGAN
Jeffrey A. CoolsaetPresidentR. L. Coolsaet Construction CompanyTaylor, Michigan
Fred H. MayPresident and Chief Executive OfficerSaginaw Control & Engineering, Inc.Saginaw, Michigan
Jeffrey S. PadnosPresidentLouis Padnos Iron & Metal CompanyHolland, Michigan
Joseph SchneiderPresidentMadison Electric Company/StandardElectric CompanyWarren, Michigan
Dr. Carl I. SchwartzChief Executive OfficerPlastics Research CorporationFlint, Michigan
Charles A. Van ZoerenChairman of the Board and ChiefExecutive OfficerAlvan Motor Freight, Inc.Kalamazoo, Michigan
MIDDLE WEST
Wayne E. BaumPresidentCombined Construction Group, Ltd.Morton, Illinois
William J. DarleyCEO and Chairman of the BoardWilliam S. Darley & CompanyMelrose Park, Illinois
Paul J. Darling, IIPresident and Chief Executive OfficerCorey Steel CompanyChicago, Illinois
Alfred F. Krumholz, Jr.PresidentChicago Boiler CompanyGurnee, Illinois
Joseph A. Pycz IIIPresidentKrupp Gerlach CompanyDanville, Illinois