adviser musical chairs report€¦ · (62.3%) are now licensed by privately owned licensees. 81% of...
TRANSCRIPT
Adviser Musical Chairs Report Industry research on financial adviser movement Quarter 1, 2020
This research report offers insights that will help key market players, such as fund manag-ers, life insurers, platform and software providers, to identify key focus areas to improve sales and marketing strategies. The financial planning and investment advice industry has undergone significant changes over the past five years with the implementation of the Fu-ture of Financial Advice (FOFA) reforms and the creation of the Financial Adviser Standards and Ethics Authority (FASEA). More recently, the introduction of the new FASEA require-ments on education and professional standards for financial advisers and the Royal Com-mission into misconduct in the banking, superannuation and financial services industry changed the industry dynamics substantially. Financial advisers continuously enter and exit the industry, as well as switch from one licensee to another. This report shows some of Adviser Ratings analysis and insight into these movements, for the benefit of those provid-ing products and services to the industry.
2 Adviser Musical Chairs Report | Quarter 1, 2020
pro.adviserratings.com.au
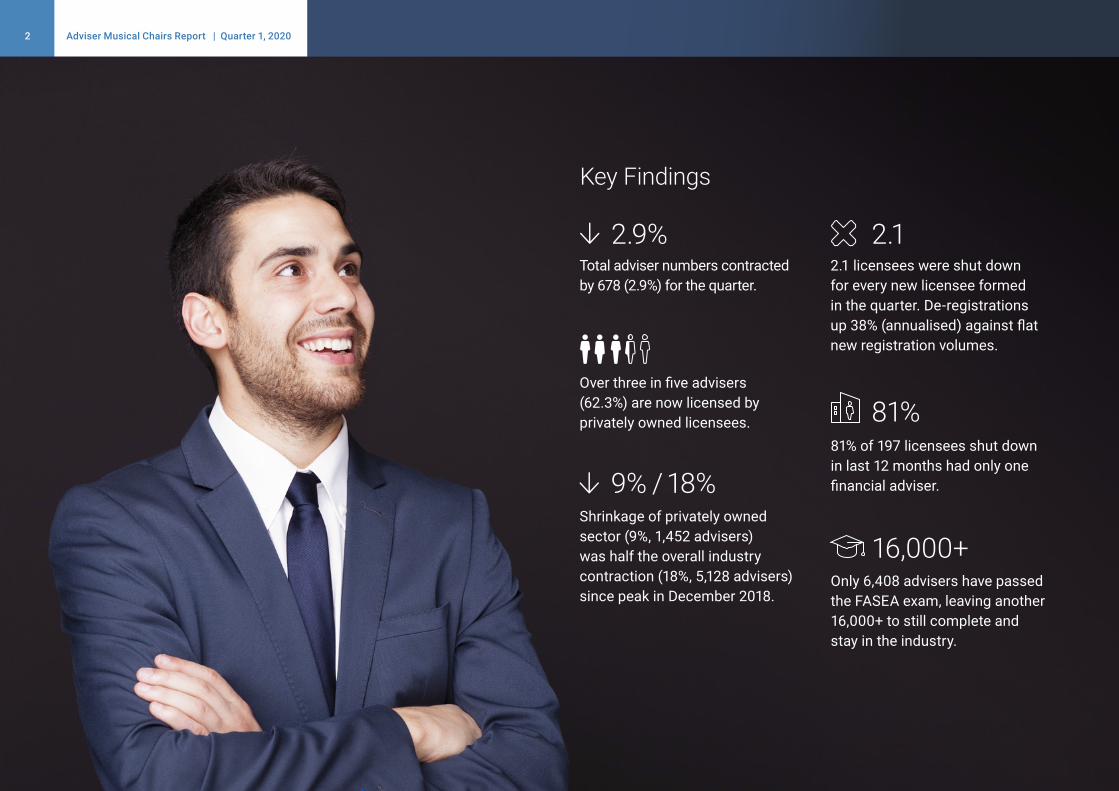
Key Findings
2.1 licensees were shut down for every new licensee formed in the quarter. De-registrations up 38% (annualised) against flat new registration volumes.
2.1
Shrinkage of privately owned sector (9%, 1,452 advisers) was half the overall industry contraction (18%, 5,128 advisers) since peak in December 2018.
9% / 18%
Only 6,408 advisers have passed the FASEA exam, leaving another 16,000+ to still complete and stay in the industry.
16,000+
Total adviser numbers contracted by 678 (2.9%) for the quarter.
2.9%
Over three in five advisers (62.3%) are now licensed by privately owned licensees.
81% of 197 licensees shut down in last 12 months had only one financial adviser.
81%
3 Adviser Musical Chairs Report | Quarter 1, 2020
pro.adviserratings.com.au
Industry Overview
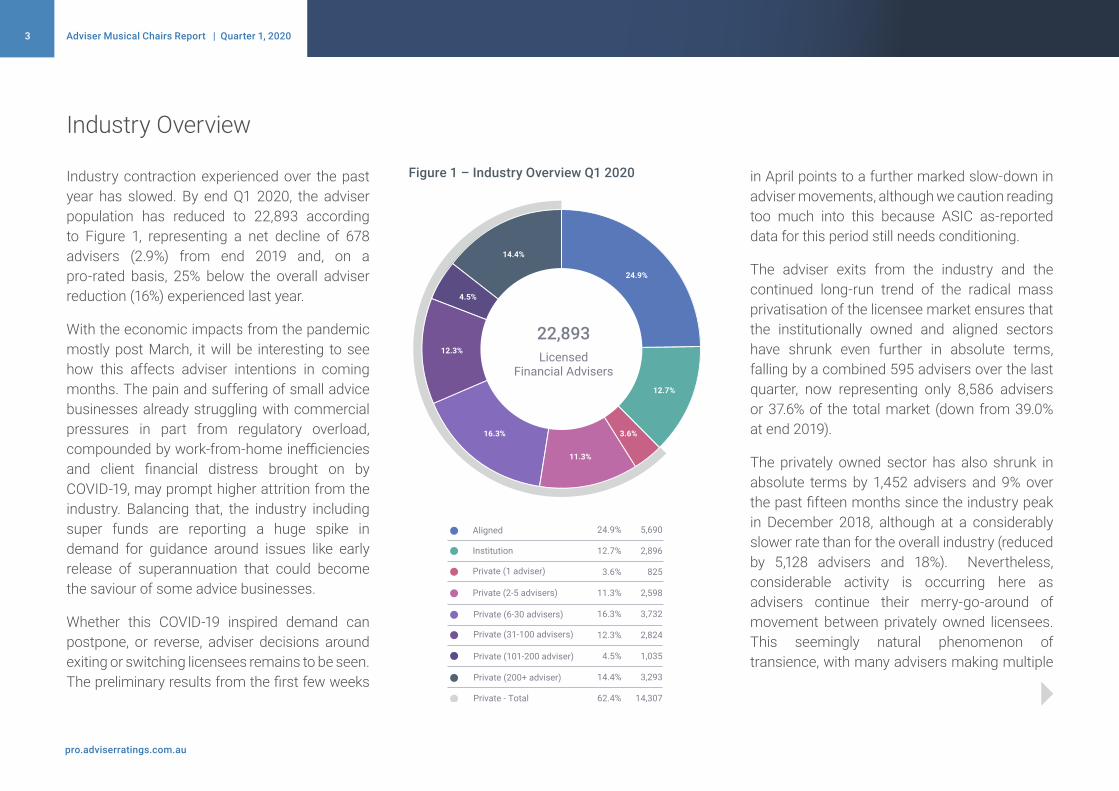
Industry contraction experienced over the past year has slowed. By end Q1 2020, the adviser population has reduced to 22,893 according to Figure 1, representing a net decline of 678 advisers (2.9%) from end 2019 and, on a pro-rated basis, 25% below the overall adviser reduction (16%) experienced last year.
With the economic impacts from the pandemic mostly post March, it will be interesting to see how this affects adviser intentions in coming months. The pain and suffering of small advice businesses already struggling with commercial pressures in part from regulatory overload, compounded by work-from-home inefficiencies and client financial distress brought on by COVID-19, may prompt higher attrition from the industry. Balancing that, the industry including super funds are reporting a huge spike in demand for guidance around issues like early release of superannuation that could become the saviour of some advice businesses.
Whether this COVID-19 inspired demand can postpone, or reverse, adviser decisions around exiting or switching licensees remains to be seen. The preliminary results from the first few weeks
Figure 1 – Industry Overview Q1 2020 in April points to a further marked slow-down in adviser movements, although we caution reading too much into this because ASIC as-reported data for this period still needs conditioning.
The adviser exits from the industry and the continued long-run trend of the radical mass privatisation of the licensee market ensures that the institutionally owned and aligned sectors have shrunk even further in absolute terms, falling by a combined 595 advisers over the last quarter, now representing only 8,586 advisers or 37.6% of the total market (down from 39.0% at end 2019).
The privately owned sector has also shrunk in absolute terms by 1,452 advisers and 9% over the past fifteen months since the industry peak in December 2018, although at a considerably slower rate than for the overall industry (reduced by 5,128 advisers and 18%). Nevertheless, considerable activity is occurring here as advisers continue their merry-go-around of movement between privately owned licensees. This seemingly natural phenomenon of transience, with many advisers making multiple
14.4%
4.5%
12.3%
16.3%
11.3%
3.6%
12.7%
24.9%
22,893 Licensed
Financial Advisers14.4%
4.5%
12.3%
16.3%
11.3%
3.6%
12.7%
24.9%
22,893 Licensed
Financial Advisers

4 Adviser Musical Chairs Report | Quarter 1, 2020
pro.adviserratings.com.au
Figure 2 — Change in adviser distribution by licensee type (all licensee types)
In these economically challenging times, we are likely to see a flight-to-safety as advisers favour licensees with greater scale and stronger balance sheets.
moves in a few short years, is driven by rapidly changing business conditions and shifting risk appetites from both advisers and licensees. The period post Royal Commission delivered major regulatory reforms that translated into licensees upgrading their value propositions, refining their notion of a preferred practice or adviser, increasing compliance obligations, and raising licensee fees. Unsurprisingly, in the midst of so much change, many advisers and licensees
continue to search for the perfect match, with advisers in particular looking for the right balance of support, independence, and profitability.
For this Musical Chairs report, we have further segmented the privately owned licensee sector in order to better track future market developments. In Figures 1 and 3, the 30+ adviser category, now easily the largest licensee
0
2000
4000
6000
8000
10000
12000
14000
16000
Mar-20Dec-19Dec-18Dec-17Dec-16Dec-15Dec-14
AlignedInstitution Private

5 Adviser Musical Chairs Report | Quarter 1, 2020
pro.adviserratings.com.au
Figure 3: Change in adviser distribution by licensee type (privately owned licensees only)category at 7,152 advisers (equating to 31% of the total market), has been split into 31-100, 101-200 and 200+ adviser segments. Of these, almost half are captured in the 200+ adviser category which represents 3,293 advisers and 14% of the total market. For now, approximately half of this category is represented by the large accounting origin licensees, namely Count and the suite of licensees under listed financial services company Easton Investments.
In these economically challenging times, we are likely to see a flight-to-safety as advisers favour licensees with greater scale and stronger balance sheets. For many, this “safe haven” may be quite appealing for those from institutional backgrounds who have since experienced the white-knuckle ride of their own self-licensed boutique. Having said that, these same licensees will be judged by how they leverage that scale to support advisers with services that help them grow their business and manage compliance.
Arguably, this flight-to-safety theme was already emerging through the worst of the regulatory driven disruption in 2019. While too early to tell from the Q1 2020 numbers, we anticipate
a growth over time in the volume of advisers gravitating to the largest privately owned licensees. Of course, the stronger licensees must be prepared to accept more advisers; there
are reports that some licensees have reached a self-determined capacity, or are being extremely selective in any incremental growth.
0
1000
2000
3000
4000
5000
200+ advisers101-200 adviser31-100 advisers
6-30 advisers2-5 advisers1 adviser
Mar-20Dec-19Dec-18Dec-17Dec-16Dec-15Dec-14
0
1000
2000
3000
4000
5000
200+ advisers101-200 adviser31-100 advisers
6-30 advisers2-5 advisers1 adviser
Mar-20Dec-19Dec-18Dec-17Dec-16Dec-15Dec-14

KEEP BUSINESS MOVING WITH ADOBE SIGN
Paper-based work�ows in �nancial services can move slowly and have a major impact on customer satisfaction and company success.
Adobe Sign is the e-signature solution built for business
continuity – prepare and send a document for e-signature,
anywhere and on any device, in a few clicks. Processes that
once took three weeks can be reduced to a few hours,
signatures are processed 28 times faster, and ROI is
420 percent a�er three years 1. Learn more
�ink about your organisation.
Where do you see ine�cient processes that can be streamlined through digitisation?
Interested to �nd out more?
Request a consultation
Copyright © 2020 Adobe. All rights reserved. 1 �e Total Economic Impact of Adobe Sign , a commissioned study conducted by Forrester Consulting on behalf of Adobe, August 2019.
Speed business transactions and processes, start to �nish, with e-signatures from Adobe Sign.
Opening a new checking account
Applying for a new credit card
Ge�ing a preapproval on a car loan
Applying for a business credit line
Sending a wire transfer
Applying for a mortgage
New hire paperwork
Time-o� requests
Expense reimbursements
Performance reviews
Vendor contracts
Employee security privilege change requests
Client-facing processes Internal processes
7 Adviser Musical Chairs Report | Quarter 1, 2020
pro.adviserratings.com.au
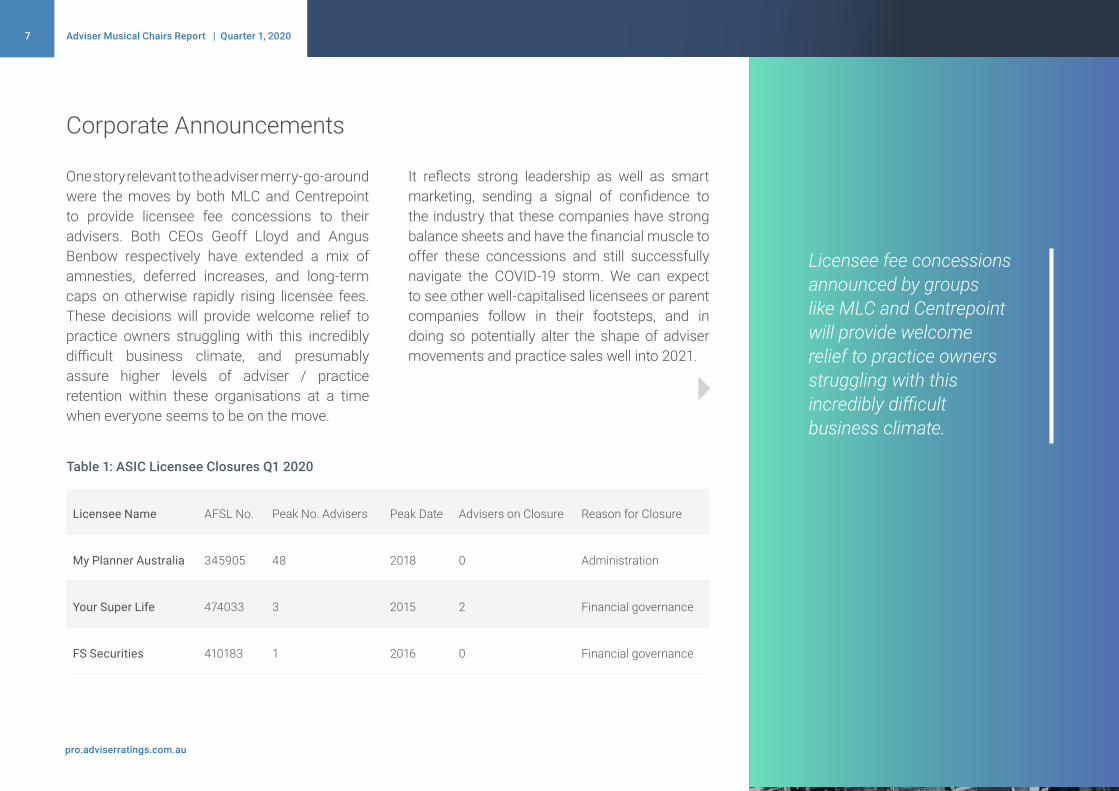
It reflects strong leadership as well as smart marketing, sending a signal of confidence to the industry that these companies have strong balance sheets and have the financial muscle to offer these concessions and still successfully navigate the COVID-19 storm. We can expect to see other well-capitalised licensees or parent companies follow in their footsteps, and in doing so potentially alter the shape of adviser movements and practice sales well into 2021.
One story relevant to the adviser merry-go-around were the moves by both MLC and Centrepoint to provide licensee fee concessions to their advisers. Both CEOs Geoff Lloyd and Angus Benbow respectively have extended a mix of amnesties, deferred increases, and long-term caps on otherwise rapidly rising licensee fees. These decisions will provide welcome relief to practice owners struggling with this incredibly difficult business climate, and presumably assure higher levels of adviser / practice retention within these organisations at a time when everyone seems to be on the move.
Corporate Announcements
Licensee fee concessions announced by groups like MLC and Centrepoint will provide welcome relief to practice owners struggling with this incredibly difficult business climate.
Table 1: ASIC Licensee Closures Q1 2020
Licensee Name AFSL No. Peak No. Advisers Peak Date Advisers on Closure Reason for Closure
My Planner Australia 345905 48 2018 0 Administration
Your Super Life 474033 3 2015 2 Financial governance
FS Securities 410183 1 2016 0 Financial governance

8 Adviser Musical Chairs Report | Quarter 1, 2020
pro.adviserratings.com.au
In Q1 2020 there was further action from ASIC in cancelling three licenses, two for not meeting the base level of financial requirements of AFS license holders and the third when it was placed into administration. All three had been effectively shells of licensees for several years. While only a very small sample, can we anticipate more house cleaning like this from ASIC?
Following a busy 2019 of companies announcing exits from the advice industry or major streamlining (think AMP, BT, CBA, and ANZ), the only notable corporate development in Q1 2020 was the transfer of 23 advisers from Yellow Brick Road (YBR) to licensee Interprac Financial Planning (with another 22 advisers in transition). This followed the sale announced on 27th December 2019 of the YBR wealth division to Sequoia Financial Group. The initial adviser transfer was the first leg of a two-step process, with the remaining 13 advisers due to move end April. This acquisition by Sequoia boosted Interprac to the top of the league table of fastest growing licensees in Q1 2020, as detailed in a later section of this report.

9 Adviser Musical Chairs Report | Quarter 1, 2020
pro.adviserratings.com.au
Last year, the overall adviser movement story was best characterised by minimal new entrants, an exit rate of 16% annualised, and a switching rate of 13% annualised. The 2020 story reflects the same dynamic. From Figure 4, while new entrants remain a rare species, exits remained around 16% annualised and switches 13% annualised.
However, COVID-19 ushers in a period where it is difficult to predict how and when it will end, and what will be the likely response from advisers
in terms of moving. Unfortunately, given the current environment, many businesses will go to the wall, as we would expect within any small business community, in any industry. This may accelerate the release of advisers onto the job market or into retirement in advance of any pre-meditated decision that they may have previously contemplated.
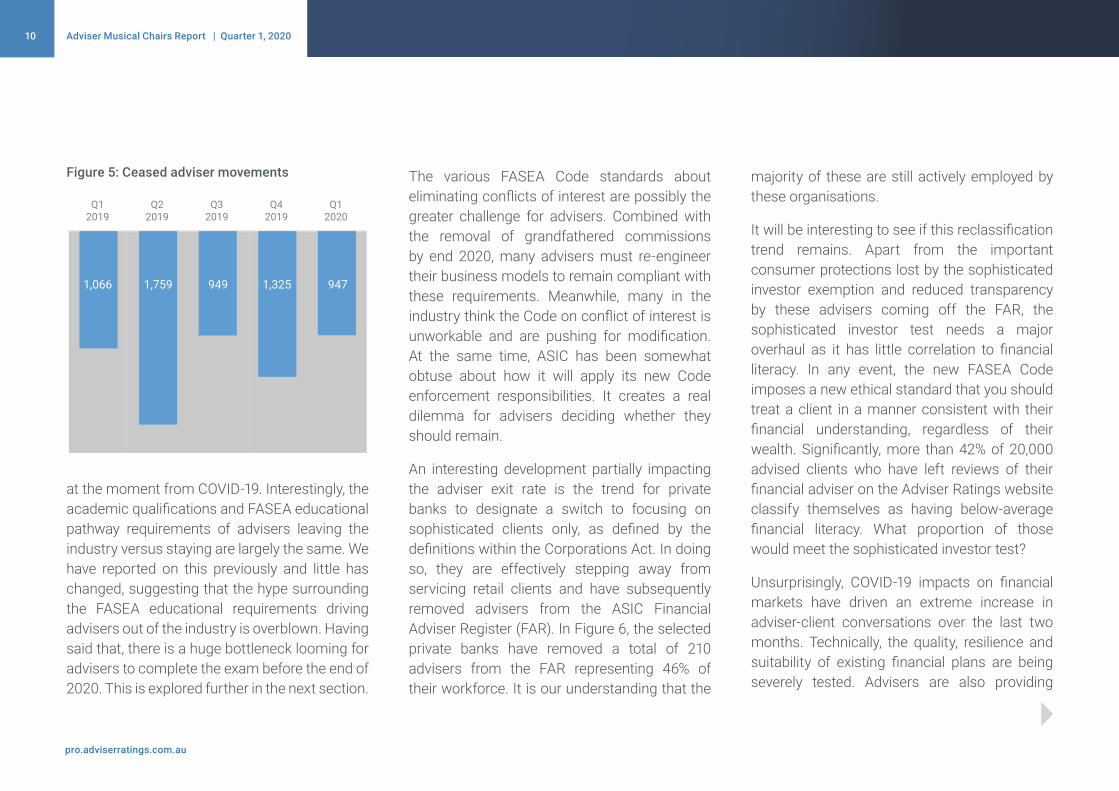
From Figure 5, 947 (4%) advisers left the industry in Q1 2020, in line with the average adviser exit rate for 2019. The overall reduction in adviser
numbers was 678, as 12 new advisers joined the industry and a further 257 transitioned back after being previously ceased.
The impending deadline to complete the FASEA exam is a factor for advisers thinking about whether to remain in the industry. The difficulties of studying for exams while running an advice business has been compounded by the intensity of inquiry and client hand-holding
Figure 4: Adviser movements by type
New Adviser
Ceased Adviser
Switching Adviser
Adviser Movements
0
200
400
600
800
1000
March2020
February2020
January2020
December2019
November2019
October2019
September2019
August2019
July2019
June2019
May2019
April2019
March2019
February2019
January2019
10 Adviser Musical Chairs Report | Quarter 1, 2020
pro.adviserratings.com.au
at the moment from COVID-19. Interestingly, the academic qualifications and FASEA educational pathway requirements of advisers leaving the industry versus staying are largely the same. We have reported on this previously and little has changed, suggesting that the hype surrounding the FASEA educational requirements driving advisers out of the industry is overblown. Having said that, there is a huge bottleneck looming for advisers to complete the exam before the end of 2020. This is explored further in the next section.
The various FASEA Code standards about eliminating conflicts of interest are possibly the greater challenge for advisers. Combined with the removal of grandfathered commissions by end 2020, many advisers must re-engineer their business models to remain compliant with these requirements. Meanwhile, many in the industry think the Code on conflict of interest is unworkable and are pushing for modification. At the same time, ASIC has been somewhat obtuse about how it will apply its new Code enforcement responsibilities. It creates a real dilemma for advisers deciding whether they should remain.
An interesting development partially impacting the adviser exit rate is the trend for private banks to designate a switch to focusing on sophisticated clients only, as defined by the definitions within the Corporations Act. In doing so, they are effectively stepping away from servicing retail clients and have subsequently removed advisers from the ASIC Financial Adviser Register (FAR). In Figure 6, the selected private banks have removed a total of 210 advisers from the FAR representing 46% of their workforce. It is our understanding that the
majority of these are still actively employed by these organisations.
It will be interesting to see if this reclassification trend remains. Apart from the important consumer protections lost by the sophisticated investor exemption and reduced transparency by these advisers coming off the FAR, the sophisticated investor test needs a major overhaul as it has little correlation to financial literacy. In any event, the new FASEA Code imposes a new ethical standard that you should treat a client in a manner consistent with their financial understanding, regardless of their wealth. Significantly, more than 42% of 20,000 advised clients who have left reviews of their financial adviser on the Adviser Ratings website classify themselves as having below-average financial literacy. What proportion of those would meet the sophisticated investor test?
Unsurprisingly, COVID-19 impacts on financial markets have driven an extreme increase in adviser-client conversations over the last two months. Technically, the quality, resilience and suitability of existing financial plans are being severely tested. Advisers are also providing
Figure 5: Ceased adviser movements
Q12020
Q42019
Q32019
Q22019
Q12019
1,066 1,759 949 1,325 947

11 Adviser Musical Chairs Report | Quarter 1, 2020
pro.adviserratings.com.au
significant emotional support to clients, whether that is to simply encourage them to stay the course or helping those suffering sudden financial hardship.
With economic fears now exceeding health concerns, the financial adviser is in the front-line of community triage. The value of advice is being affirmed every day. While the industry’s response is boosting reputations at a time when
it desperately needed some positive press, it is nevertheless placing a huge physical and emotional burden on advisers. Remote working due to COVID-19 self-isolation has also placed pressure on advice business work processes and levels of automation and straight-through processing. Put together, this environment should become a powerful catalyst for advisers to decide to stay or leave.
While the supply of new advisers remains very low, we can anticipate this growing gradually as more graduates and new recruits complete the exam and the requisite hours under the professional year program. The challenge remains, in these economically straightened times, that only the larger and more financially confident businesses can afford to support non-fee generating “apprentices” for the obligatory 12+ months gestation period.
Figure 6: Private bank adviser reductions
0
45
90
135
180
225
COMMONWEALTH PRIVATE LIMITEDCRESTONE WEALTH MANAGEMENT LIMITEDDIXON ADVISORY & SUPERANNUATIONSERVICES LIMITED
MACQUARIE EQUITIES LIMITED
December 2018
January 2019
February 2019
March 2019
April 2019
May 2019
June 2019
July 2019
August 2019
September 2019
October 2019
November 2019
December 2019
January 2020
February 2020
March 2020
December 2018
January 2019
February 2019
March 2019
April 2019
May 2019
June 2019
July 2019
August 2019
September 2019
October 2019
November 2019
December 2019
January 2020
February 2020
March 2020

12 Adviser Musical Chairs Report | Quarter 1, 2020
pro.adviserratings.com.au
Switching Advisers
In Q1 2020, 789 advisers (13% annualised) switched licensees, which was consistent with 2019 performance. Figure 7 reflects the persistent shift of advisers out of the institutionally owned and aligned licensees into the privately owned camp.
Figure 7: Adviser switching by licensee type
We anticipate a slow-down in adviser (and practice) switches in coming months, partly due to the “distraction” of COVID-19, and partly due to an increasing reluctance from both advisers, practice owners and licensees to take on the risk
and effort to change. For example, we understand from speaking to business brokers that there has been a marked slowdown in trade sales of practices as sentiment has shifted even further to buyers, forcing vendors to sit tight.
INSTITUTION ALIGNED PRIVATE
Q1-2019 Q2-2019 Q3-2019 Q1-2019 Q2-2019 Q3-2019 Q1-2019 Q2-2019 Q3-2019Q4-2019 Q1-2020 Q1-2020 Q1-2020Q4-2019 Q4-2019
20%
40%
60%
80%
PERC
ENT
IN
0%
-20%
-40%
-60%
PERC
ENT
OUT
9.0%
-19.8%
6.7%
-14.0%
5.6%
-24.6%
22.0%
-40.0%
15.5%
-35.0%
16.8%
-44.5%
69.0%
-49.2%
77.8%
-51.0%
77.6%
-30.9%
8.3%
-19.3%
5.2%
-22.7%
-38.4%
73.5%
-31.9%
77.9%
-42.3%
18.2%
-45.4%
16.9%

13 Adviser Musical Chairs Report | Quarter 1, 2020
pro.adviserratings.com.au
The industry awaits a decision on whether to extend FASEA deadlines for exam completion for all registered advisers (currently end 2020) and achievement of minimum educational standards (currently end 2024). Senator Jane Hume has confirmed that this legislation would be passed in this week’s sitting of Parliament. The draft legislation, already passed in the House of Representatives, has been listed as “non-controversial”, meaning both sides of politics agree it should pass.
Until now, the lack of certainty on the exam deadline has created substantial angst amongst advisers and licensees. In Figure 8, according to FASEA, 7,488 advisers have sat the exam and 86% or 6,408 passed over the last 11 months. The last exams were in February 2020 and those scheduled for April were cancelled. Pass rates have dropped consistently since the first exam, possibly because the most motivated and proactive engaged early on.
Another 16,000+ advisers still must sit the exam, and allowing for an average 15% failure rate on their first attempt, 2,400 advisers will require two attempts to pass. The four previous sittings have averaged 1,500 advisers each. Assuming the
extension legislation is passed, there are likely to be another 8-10 exam sittings by end 2021. Even then, that would represent 1,800-2,000 advisers for each exam, representing a 20-30% increase per sitting.
At least the next exam sitting in June will be held remotely. Conducting exams remotely eliminates the inconvenience of travel and, arguably, should allow for substantially higher participation rates. But right now, with the imminent passage of the legislation gifting advisers another 12 months of breathing space, compounded by the intensity of supporting clients through the pandemic, we are probably going to see a drop-off in participation rates for awhile.
Figure 8: FASEA exam results 2019-2020
Anecdotally, advisers are frustrated by the lack of feedback from FASEA on their performance where they have not passed. Guidance is reportedly generic and does not help advisers know where to focus their re-learning efforts. The apparent ease of completing the exam on-line may also not be as straightforward as it first seems. There are specific conditions that advisers must meet to ensure they are appropriately “supervised”, including downloading proctor software and installing mirrors to show the proctor what is around the adviser’s computer. And for some, the vagaries of internet connectivity mean that technical disruptions of more than 30 minutes require the session to be rescheduled.
Special Feature – FASEA Impacts
0
1000
2000
3000
4000
0%
25%
50%
75%
100%
Feb-20Dec-19Sep-19Jun-19
Sat Pass Pass Rate % (RHS)
0
1000
2000
3000
4000
0%
25%
50%
75%
100%
Feb-20Dec-19Sep-19Jun-19
Sat Pass Pass Rate % (RHS)

14 Adviser Musical Chairs Report | Quarter 1, 2020
pro.adviserratings.com.au
Figure 9: Licensees with most adviser additions and reductions in Q1 2020
The licensee constituents in Figure 9 are unsurprising and highly consistent with the trends previously discussed in terms of advisers favouring the larger privately owned licensees. Interprac benefited directly from the sale of Yellow Brick Road’s wealth division to parent Sequoia Financial Group, while many of the other licensees in growth mode have been consistently adding advisers through carefully orchestrated
Top 10 Licensees For Adviser Additions & Reductions
organic and inorganic approaches. These licensees are all at different stages of growing their capacity and re-engineering and stabilising their business models, in terms of their adviser value proposition and how they are structured to deliver it consistently and compliantly. It’s possible that we will see a different set of names emerge over coming quarters as some of the mid-sized (30-100) privately owned licensees
opportunistically step forward, potentially on the back of new funding from private equity.
The reverse is true for the firms in adviser net outflow. They all belong to the major institutions or have been intentionally run-down as part of a sale/ transfer (TFSA, YBR) or through ASIC enforcement (SMSF Advisers).
Licensees Licensee Type Total advisers entering and leaving per licensee
77
MO
ST A
DDIT
ION
SM
OST
RED
UCTI
ON
S
INTERPRAC FINANCIAL PLANNING PTY LTD
INSIGHT INVESTMENT SERVICES PTY LTD
FORTNUM PRIVATE WEALTH LTD
SENTRY ADVICE PTY LTD
LIFESPAN FINANCIAL PLANNING PTY LTD
MATRIX PLANNING SOLUTIONS LIMITED
COUNT FINANCIAL LIMITED
INFOCUS SECURITIES AUSTRALIA PTY LTD
PERPETUAL TRUSTEE COMPANY LIMITED
NEXTPLAN FINANCIAL PTY LTD
CHARTER FINANCIAL PLANNING LIMITED
CONSILIUM ADVICE PTY LTD
AUSURE PTY LTD
GWM ADVISER SERVICES LIMITED
SMSF ADVISERS NETWORK PTY LTD
YELLOW BRICK ROAD WEALTH MANAGEMENT PTY LIMITED
AMP FINANCIAL PLANNING PTY LIMITED
COMMONWEALTH FINANCIAL PLANNING LIMITED
TOTAL FINANCIAL SOLUTIONS AUSTRALIA LIMITED
FINANCIAL WISDOM LIMITED
Private (30+ adviser)
Private (30+ adviser)
Private (30+ adviser)
Private (30+ adviser)
Private (30+ adviser)
Aligned
Private (30+ adviser)
Private (30+ adviser)
Aligned
Private (30+ adviser)
Aligned
Private (30+ adviser)
Private (2-5 adviser)
Aligned
Private (30+ adviser)
Aligned
Institution
Institution
Aligned
Aligned
4438
2620
191616
151110
-26-31
-35-36
-44-45
-57-70
-79-137
-140 -120 -100 -80 -60 -40 -20 0 20 40

15 Adviser Musical Chairs Report | Quarter 1, 2020
pro.adviserratings.com.au
The explosion in licensee volumes has been a long term trend, with new licensee registrations generally outpacing de-registrations by 3-4 times over the last few years leading up to 2019.
In 2019, for the first time, de-registrations outnumbered new registrations. 177 licensees were ceased while 119 were formed. This trend has continued and accelerated in Q1 2020, with 61 licensees ceased and only 29 formed. The ratio of licensees ceased: formed has climbed from 1.48 to 2.10, with de-registrations up 38% on an annualised rate while licensee formation rates remain steady. In Figure 10, as of March 2020, there are a total of 2,185 licensees with 97% of these licensees privately owned.
The challenges of getting a license in today’s environment are well understood. ASIC has stricter requirements, waiting times are long, and the difficulties of securing affordable professional indemnity insurance are only increasing as more insurers walk away from this sector. These roadblocks mean that only the truly committed will tread this path.
The recently announced COVID-19 Advice Related Relief Instrument 2020/355 involved several changes to industry rules to support affordable advice on early access to super and other financial hardship situations. However, it also included relief to unlicensed tax agents and accounting firms to provide this advice if the consumer was an existing client of the firm. While at first glance a stunning reversal of the smothering creep of regulation on the advice
Licensee Changes
Figure 10: Number of licensees by type
0
10
20
30
40
50
60
70
80
AlignedInstitution
Dec-19Dec-18Dec-17Dec-16Dec-15Dec-140
300
600
900
1200
1500
1800
2100
2400
Private (RHS)
Dec-19Dec-18Dec-17Dec-16Dec-15Dec-140
10
20
30
40
50
60
70
80
AlignedInstitution
Dec-19Dec-18Dec-17Dec-16Dec-15Dec-140
300
600
900
1200
1500
1800
2100
2400
Private (RHS)
Dec-19Dec-18Dec-17Dec-16Dec-15Dec-14
industry, the government has explained it as a temporary emergency initiative to increase industry capacity.
Based on an Adviser Ratings straw poll in mid-April, only 30% of financial advisers support this Instrument, further restricting industry capacity to service consumers in need. At the same time, the level of take-up from tax agents and unlicensed accountants is an unknown quantity.
16 Adviser Musical Chairs Report | Quarter 1, 2020
pro.adviserratings.com.au
Figure 11: Newly registered licensees vs discontinued licensees
0
10
20
30
40
50
CeasedNew
Mar-20Feb-20
Jan-20Dec-19
Nov-19Oct-19
Sep-19Aug-19
Jul-19Jun-19
May-19Apr-19
Mar-19Feb-19
Jan-19
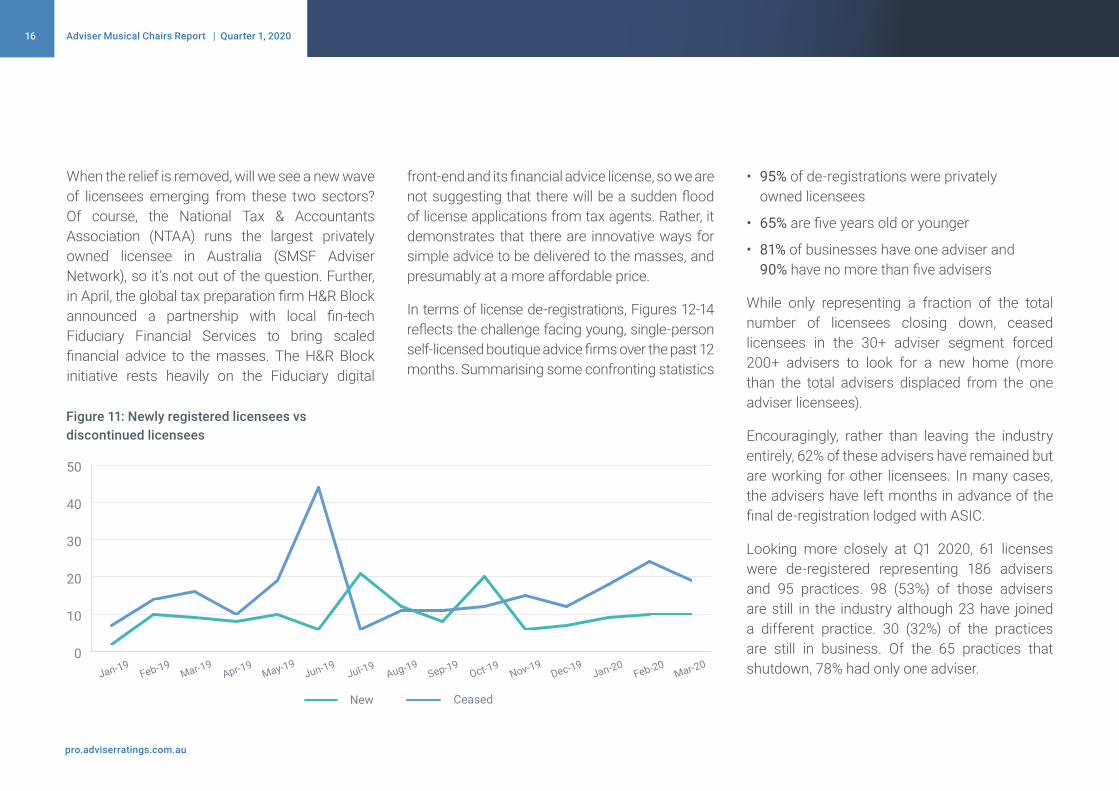
When the relief is removed, will we see a new wave of licensees emerging from these two sectors? Of course, the National Tax & Accountants Association (NTAA) runs the largest privately owned licensee in Australia (SMSF Adviser Network), so it’s not out of the question. Further, in April, the global tax preparation firm H&R Block announced a partnership with local fin-tech Fiduciary Financial Services to bring scaled financial advice to the masses. The H&R Block initiative rests heavily on the Fiduciary digital
front-end and its financial advice license, so we are not suggesting that there will be a sudden flood of license applications from tax agents. Rather, it demonstrates that there are innovative ways for simple advice to be delivered to the masses, and presumably at a more affordable price.
In terms of license de-registrations, Figures 12-14 reflects the challenge facing young, single-person self-licensed boutique advice firms over the past 12 months. Summarising some confronting statistics
• 95% of de-registrations were privately owned licensees
• 65% are five years old or younger
• 81% of businesses have one adviser and 90% have no more than five advisers
While only representing a fraction of the total number of licensees closing down, ceased licensees in the 30+ adviser segment forced 200+ advisers to look for a new home (more than the total advisers displaced from the one adviser licensees).
Encouragingly, rather than leaving the industry entirely, 62% of these advisers have remained but are working for other licensees. In many cases, the advisers have left months in advance of the final de-registration lodged with ASIC.
Looking more closely at Q1 2020, 61 licenses were de-registered representing 186 advisers and 95 practices. 98 (53%) of those advisers are still in the industry although 23 have joined a different practice. 30 (32%) of the practices are still in business. Of the 65 practices that shutdown, 78% had only one adviser.

17 Adviser Musical Chairs Report | Quarter 1, 2020
pro.adviserratings.com.au
4%
15%
46%
20%
15%
15%
20%
46%
15%
4%
207Distribution of Ceased
Licensees by Age
9
31
95
41
31
Less than a year
1 year
2 - 5 years
6 - 14 years
15+ years
4%
15%
46%
20%
15%
15%
20%
46%
15%
4%
207Distribution of Ceased
Licensees by Age
9
31
95
41
31
Less than a year
1 year
2 - 5 years
6 - 14 years
15+ years
Figure 12: Distribution of ceased licensee by age
Figure 13: Distribution of ceased licensees by type
Figure 14: Distribution of ceased privately owned licensees
1.5%
3.5%
95%
95%
3.5%
1.5%
207Distribution of Ceased
Licensees by Type
3
7
197
Institutionally Owned
Institutionally Aligned
Privately Owned
1.5%
3.5%
95%
95%
3.5%
1.5%
207Distribution of Ceased
Licensees by Type
3
7
197
Institutionally Owned
Institutionally Aligned
Privately Owned
81%
2%
9%
4%
4%
4%4%
9%
2%
81%
197Distribution of Private
Ceased Licensees
160
5
18
7
7
Private (1 adviser)
Private (11-30 advisers)
Private (2-5 advisers)
Private (30+ advisers)
Private (6-10 advisers)
81%
2%
9%
4%
4%
4%4%
9%
2%
81%
197Distribution of Private
Ceased Licensees
160
5
18
7
7
Private (1 adviser)
Private (11-30 advisers)
Private (2-5 advisers)
Private (30+ advisers)
Private (6-10 advisers)

18 Adviser Musical Chairs Report | Quarter 1, 2020
pro.adviserratings.com.au
Glossary of terms
New adviser A new entrant who is newly registered as a financial adviser on ASIC’s financial adviser register (FAR) in the sample period.
Ceased adviser A financial adviser whose AFSL Authorisation with a licensee has ceased during the sample period.
Switched adviser An existing or previously licensed financial adviser who has switched-in to a new practice/licensee in the sample period.
Returning adviser A financial adviser whose AFSL Authorisation was de-registered prior to the sample period and has switched-in to a new practice/licensee in the sample periods.
Switched-in Refers to the movement of an existing or previously licensed adviser moving to a new practice/licensee.
Switched-out Refers to the movement of an existing or previously licensed adviser moving from a practice/licensee.
Moving adviser A joint name of new, ceased and switched financial advisers.
Institutionally owned licensee Organisations that are wholly owned subsidiaries of major “parent” institutions with diversified business models beyond providing financial advice only, where the advisers are directly employed. These institutions may be banks, super funds or stockbroking firms.
Institutionally aligned licensee Organisations that are partly owned by or tied exclusively to a parent institution. Advisers are generally not directly employed but operate as authorised representatives.
Privately owned licensee Organisations that are independent of any major institution. Advisers may be directly employed or authorised representatives.

19 Adviser Musical Chairs Report | Quarter 1, 2020
pro.adviserratings.com.au
AR data provides insights to the financial services eco-system. We operate as a stand alone service to assist platforms, insurers, and other product manufactures reach advisers they want to work with.
Consolidating ASIC information with our global partners and proprietary methods, our data is the most valuable, up to date, and accurate in the market. The musical chairs service consists of this report, and the underlying data on all advisers switching, entering, and exiting. (For example in quarter one 2020, this service captures 2,000 adviser movements)
Email us today to access the quarter one underlying data.
Contributors
Nicolas Peña Mc Gough Econometrician [email protected]
Mark Hoven CEO [email protected]
Enquiries
Mark Hoven CEO
0413 614 640

Adviser Ratings is the only independent consumer review and rating system on financial advisers in Australia. Our unique value proposition in being an online marketplace for consumers to connect with and give feedback to advisers has created a robust data, technology and research organisation.