advantages of agilent advancebio sec columns for ... · pdf filesec columns for...
TRANSCRIPT
Advantages of Agilent AdvanceBio SEC Columns for Biopharmaceutical AnalysisComparing Columns from Different Vendors to Improve Data Quality
Technical Overview
IntroductionSize exclusion chromatography (SEC) is a standard technique for determining molar mass averages, and is often used to describe size-based separation of biomolecules. In SEC, separation efficiency comes only from the stationary phase, while the mobile phase should have no effect. Therefore, column selection for a given biomolecule is crucial for the successful application of SEC. There are different types of SEC columns commercially available that come in various dimensions, porosities, and particle sizes. Agilent AdvanceBio SEC columns incorporate breakthrough technology for SEC analysis. The columns have been designed and manufactured by Agilent to give maximum efficiency without risk of shear degradation of samples, or clogging between particles. The unique method of manufacture controlling pore size, structure, and volume, and then applying a hydrophilic polymeric coating ensures that protein peaks are sharp and well resolved.
This Technical Note compares SEC columns from different vendors using a mobile phase commonly used for a separation with protein standards, monoclonal antibodies, and an antibody drug conjugate (ADC). We wanted to identify differences in column performance that could impact the quality of the data being generated. We showcase the unique advantage of AdvanceBio SEC columns for high-resolution separation of biomolecules for biopharmaceutical applications.

2
Materials and MethodsColumns7.8 × 300 mm
• Agilent AdvanceBio SEC 300Å, 2.7 µm
• Other vendor A 200Å, 3.5 µm
• Other vendor B 450Å, 3.5 µm
• Other vendor C 250Å, 5 µm
• Other vendor D 250Å, 4 µm
• Other vendor E 300Å, 3 µm
4.6 × 300 mm
• Agilent AdvanceBio SEC 300Å, 2.7 µm
• Other vendor F 450Å, 2.5 µm
• Other vendor G 200Å, 1.7 µm
Results and DiscussionComparison of 7.8 × 300 mm SEC columns for robust SEC-DAD methodsSeparation of protein standardsFigure 1 compares the resolution of a six-protein reference standard on columns with different pore sizes, and clearly shows the effect of pore size on resolution. The largest proteins, thyroglobulin and its monomer, have good resolution with 450Å and 300Å pores. However, as the pore size decreases, the largest proteins are excluded and resolution is poor. While the largest proteins were better resolved on the 450Å column B and 300Å column E, both columns delivered broader peak widths, which makes quantitation of low levels of aggregation more difficult and less accurate. The AdvanceBio SEC column improved resolution of high, medium, and low weight biomolecules, which is critical for separation of many of them (Figure 1). AdvanceBio SEC also provided improved sensitivity, narrow peak width, and lower elution volume.
Table 1. Chromatographic conditions.
Parameter 7.8 × 300 mm SEC columns 4.6 × 300 mm SEC columnsFlow rate 0.8 mL/min 0.4 mL/minMobile phase 150 mM phosphate buffer, pH 7.0 150 mM phosphate buffer, pH 7.0Instrument Agilent 1260 Infinity Bio-inert
Quaternary LCAgilent 1290 Infinity Binary LC with G1315D DAD and Bio-inert flow cell (1200 bar)
Injection volume 5 µL 5 µLTCC Ambient AmbientDetection UV, 220 nm UV, 220 nmSamples • Protein molecular weight markers (thyroglobulin aggregate, thyroglobulin, IgG,
bovine serum albumin, myoglobin), and uracil total permeation marker • Therapeutic monoclonal antibodies (rituximab and trastuzumab)• Therapeutic antibody drug conjugate
Figure 1. Comparison of SEC profiles of protein standards on 7.8 × 300 mm SEC columns. The resolution between peaks 1 and 2, 3 and 4, and 5 and 6 were calculated.
min5 10 15
min5 10 15
min5 10 15
min5 10 15
min5 10 15
min5 10 15
mAU
0250500750
mAU
0250500750
mAU
0250500750
mAU
0250500750
mAU
0250500750
mAU
0250500750
2
34
5
61
2
3
4
5
61
2
34
5
61
23
4
5
61
23
4
5
61
23
4
5
61
Agilent AdvanceBio SEC, 2.7 µm, 300Å, 7.8 × 300 mm
Other vendor A, 3.5 µm, 200Å, 7.8 × 300 mm
Other vendor B, 3.5 µm, 450Å, 7.8 × 300 mm
Other vendor C, 5 µm, 250Å, 7.8 × 300 mm
Other vendor D, 4 µm, 250Å, 7.8 × 300 mm
Other vendor E, 3 µm, 300Å, 7.8 × 300 mm
Rs = 1.44
Rs = 0.52
Rs = 2.0
Rs = 0.81
Rs = 0.97
Rs = 1.7Rs = 2.27
Rs = 4.90
Rs = 2.81
Rs = 1.77
Rs = 2.12
Rs = 1.86
Rs = 1.88
Rs = 3.70
Rs = 2.86
Rs = 3.49
Rs = 3.4
Rs = 5.59
Peak ID1. Thyroglobulin aggregates2. Thyroglobulin (662 kDa)3. IgG (150 kDa)4. BSA (66 kDa)5. Myoglobin (17 kDa)6. Uracil (112 Da)

3
To evaluate the effect of pore size on the separation of a range of protein markers, calibration curves for each column were plotted (Figure 2). Molecules larger than the pore size are excluded, and smaller molecules penetrate the pores to define the exclusion limit and permeation range of a column. An ideal SEC column is one that separates biomolecules in the most linear part of the calibration curve. When we evaluated columns for the separation of the same protein range, AdvanceBio SEC provided a linear and shallow slope for most of the resolution curve. This performance resulted in improved separation of protein markers within the molecular weight range 662 kDa to 112 Da, the range of most protein-based biotherapeutics.
Comparing pore volumesPeak capacity and resolution in SEC are primarily determined by pore volume. Larger pore volume provides better resolution across a wider molecular weight range. Table 2 shows the pore volumes calculated from the total permeation point (uracil) and exclusion limit (thyroglobulin aggregate) for the columns. AdvanceBio SEC provided higher pore volume (7.11 mL) compared to the other columns, and thus provided better resolution and higher peak capacity.
1.5
2.0
2.5
3.0
3.5
4.0
4.5
5.0
5.5
6.0
6.5
4 5 6 7 8 9 10 11 12 13 14
Log
Mw
Elution volume (mL)
Elution volume (mL)
Calibration curves comparing Agilent AdvanceBio SEC with Columns A and B
Agilent AdvanceBio SEC Column, 300ÅOther Vendor A, 200ÅOther Vendor B, 450Å
R2 = 0.9868R2 = 0.9538R2 = 0.8175
1.5
2.0
2.5
3.0
3.5
4.0
4.5
5.0
5.5
6.0
6.5
4 6 8 10 12 14
Log
Mw
Calibration curves comparing Agilent AdvanceBio SEC with Columns C, D, and E
Agilent AdvanceBio SEC, 300Å Column
Other Vendor C, 250ÅOther Vendor D, 250Å
Other Vendor E, 300Å
R2 = 0.9868
R2 = 0.9201R2 = 0.8862
R2 = 0.9123
Figure 2. Calibration curves for protein standards on various 7.8 × 300 mm SEC columns.
Table 2. Total column pore volume comparison.
Column Pore volume (mL)7.8 × 300 mmAgilent AdvanceBio SEC 300Å, 2.7 µm 7.11Other vendor A 200Å, 3.5 µm 6.25Other vendor B 450Å, 3.5 µm 4.57Other vendor C 250Å, 5 µm 6.51Other vendor D 250Å, 4 µm 6.70Other vendor E 300Å, 3 µm 5.624.6 × 300 mmAgilent AdvanceBio SEC 300Å, 2.7 µm 2.36Other vendor F 450Å, 2.5 µm 2.06Other vendor G 200Å, 1.7 µm 2.20

4
column D showed the highest resolution factors of 2.37 and 2.41, respectively, for trastuzumab monomer and its aggregate. Column E, which claims to separate larger proteins or antibody dimers and higher aggregates, failed to resolve the aggregate, and it was not possible to integrate the monomer and aggregate to determine its resolution.
Separation of therapeutic monoclonal antibodiesFigure 3 shows the improvement in data quality for the separation of therapeutic trastuzumab on the AdvanceBio SEC 2.7 µm column. The chromatogram displays the resolution values of various columns for the separation of monomer and aggregates. AdvanceBio SEC and
min5 10 15
min5 10 15
min5 10 15
min5 10 15
min5 10 15
min5 10 15
mAU
024
mAU
024
mAU
024
mAU
024
mAU
024
mAU
024
min5 10 15
min5 10 15
min5 10 15
min5 10 15
min5 10 15
min5 10 15
mAU
0500
1,000
mAU
0500
1,000
mAU
0500
1,000
mAU
0500
1,000
mAU
0500
1,000
mAU
0500
1,000
Agilent AdvanceBio SEC, 2.7 µm, 300Å, 7.8 × 300 mm
Rs = 2.37
Rs = 1.89
Rs = 1.70
Rs = 2.1
Rs = 2.41
Other vendor A, 3.5 µm, 200Å, 7.8 × 300 mm
Other vendor B, 3.5 µm, 450Å, 7.8 × 300 mm
Other vendor C, 5 µm, 250Å, 7.8 × 300 mm
Other vendor D, 4 µm, 250Å, 7.8 × 300 mm
Other vendor E, 3 µm, 300Å, 7.8 × 300 mm
Figure 3. Analysis of trastuzumab monomer and aggregate using 7.8 × 300 mm SEC columns.
5
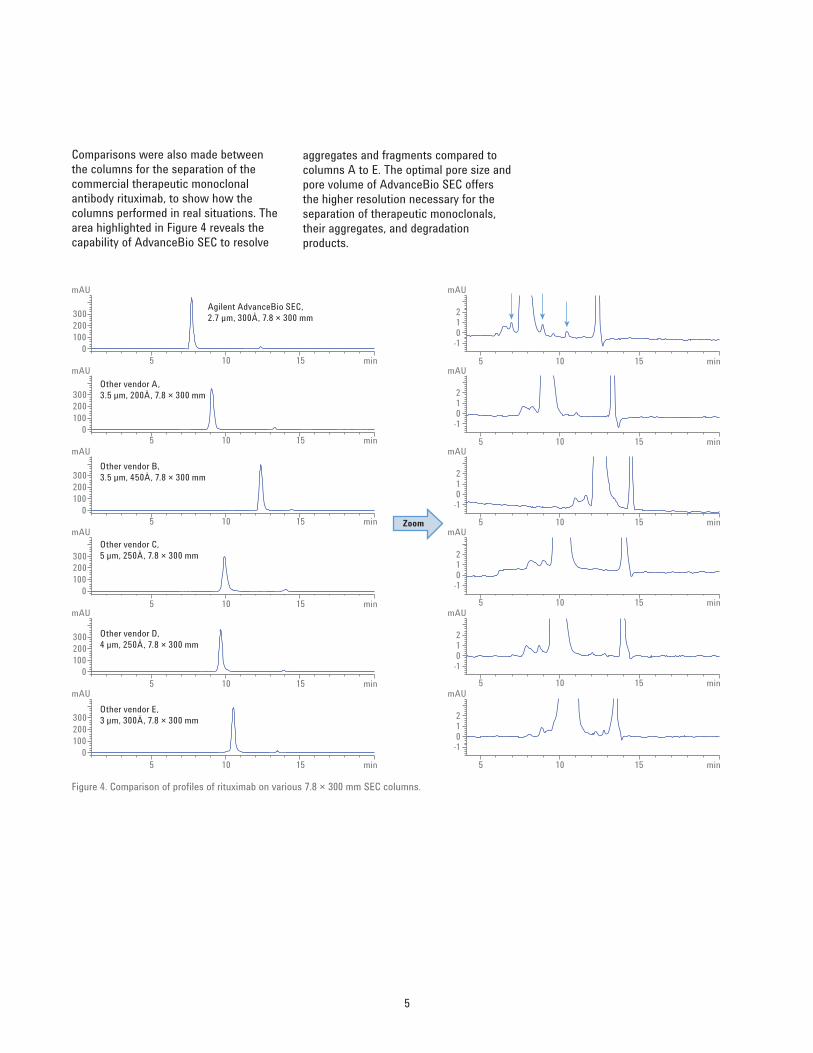
Comparisons were also made between the columns for the separation of the commercial therapeutic monoclonal antibody rituximab, to show how the columns performed in real situations. The area highlighted in Figure 4 reveals the capability of AdvanceBio SEC to resolve
Figure 4. Comparison of profiles of rituximab on various 7.8 × 300 mm SEC columns.
min5 10 15
min5 10 15
min5 10 15
min5 10 15
min5 10 15
min5 10 15
min5 10 15
min5 10 15
min5 10 15
min5 10 15
min5 10 15
min5 10 15
Agilent AdvanceBio SEC, 2.7 µm, 300Å, 7.8 × 300 mm
Other vendor A, 3.5 µm, 200Å, 7.8 × 300 mm
Other vendor B, 3.5 µm, 450Å, 7.8 × 300 mm
Other vendor C, 5 µm, 250Å, 7.8 × 300 mm
Other vendor D, 4 µm, 250Å, 7.8 × 300 mm
Other vendor E, 3 µm, 300Å, 7.8 × 300 mm
mAU
0100200300
mAU
0100200300
mAU
0100200300
mAU
0100200300
mAU
0100200300
mAU
0100200300
mAU
-1012
mAU
-1012
mAU
-1012
mAU
-1012
mAU
-1012
mAU
-1012
Zoom
aggregates and fragments compared to columns A to E. The optimal pore size and pore volume of AdvanceBio SEC offers the higher resolution necessary for the separation of therapeutic monoclonals, their aggregates, and degradation products.

6
mobile phase, 150 mM phosphate buffer. This method also gave the highest resolution of monomer and aggregate (Rs = 1.75), indicating no nonspecific interaction of the hydrophobic drug with the stationary phase (Figure 5). In addition, the AdvanceBio SEC was able to separate and resolve ADC aggregates better than the other columns, indicating its suitability for the analysis of ADC and aggregates. The broader peaks produced by columns from other vendors not only impacted sensitivity and limited the detection of low levels of aggregates, but also made peak integration difficult.
this effect, but the increased mobile phase viscosity, and hence pressure, can compromise flow rate or column life time. Sample integrity can also be compromised as the organic can affect sample aggregation.
Analysis of ADC using columns A to E with aqueous mobile phase led to poor peak shape due to nonspecific interaction of the hydrophobic payload with the stationary phase, as shown in Figure 5. However, peaks were symmetrical when the ADC was analyzed using an AdvanceBio SEC with an aqueous
Separation of antibody drug conjugatesSEC analysis of antibody drug conjugates (ADCs) requires columns with reduced secondary interaction of hydrophobic payloads with the column stationary phase. Most published methods for SEC analysis of ADCs performed using aqueous phases led to poor peak shape and incomplete resolution of aggregate from the monomeric conjugate. This effect was due to nonspecific interaction of hydrophobic payload with the stationary phase. Adding organic modifiers has been shown to overcome
min5 10 15
mAU
0
20
40
min5 10 15
mAU
0
20
40
min5 10 15
mAU
0
20
40
min5 10 15
mAU
0
20
40
min5 10 15
mAU
0
20
40
min5 10 15
mAU
0
20
40
Rs = 1.75
Rs = 1.11
Rs = 1.40
Rs = 1.28
Zoom
min5 10 15
mAU
0200400600 Agilent AdvanceBio
SEC, 2.7 µm, 300Å, 7.8 × 300 mm
min5 10 15
mAU
0200400600 Other vendor A,
3.5 µm, 200Å, 7.8 × 300 mm
min5 10 15
mAU
0200400600 Other vendor B,
3.5 µm, 450Å, 7.8 × 300 mm
min5 10 15
mAU
0200400600 Other vendor C,
5 µm, 250Å, 7.8 × 300 mm
min5 10 15
mAU
0200400600 Other vendor D,
4 µm, 250Å, 7.8 × 300 mm
min5 10 15
mAU
0200400600 Other vendor E,
3 µm, 300Å, 7.8 × 300 mm
Figure 5. Comparison of profiles of therapeutic ADC on various 7.8 × 300 mm SEC columns.
7
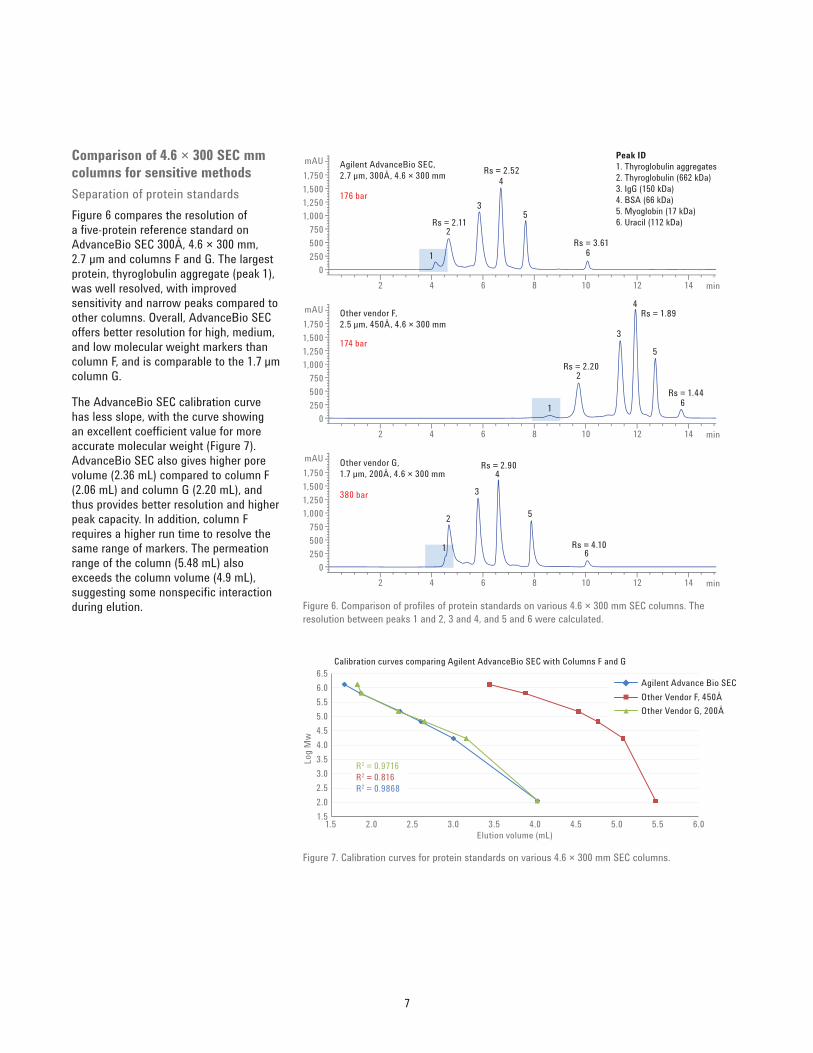
Comparison of 4.6 × 300 SEC mm columns for sensitive methods Separation of protein standardsFigure 6 compares the resolution of a five-protein reference standard on AdvanceBio SEC 300Å, 4.6 × 300 mm, 2.7 µm and columns F and G. The largest protein, thyroglobulin aggregate (peak 1), was well resolved, with improved sensitivity and narrow peaks compared to other columns. Overall, AdvanceBio SEC offers better resolution for high, medium, and low molecular weight markers than column F, and is comparable to the 1.7 µm column G.
The AdvanceBio SEC calibration curve has less slope, with the curve showing an excellent coefficient value for more accurate molecular weight (Figure 7). AdvanceBio SEC also gives higher pore volume (2.36 mL) compared to column F (2.06 mL) and column G (2.20 mL), and thus provides better resolution and higher peak capacity. In addition, column F requires a higher run time to resolve the same range of markers. The permeation range of the column (5.48 mL) also exceeds the column volume (4.9 mL), suggesting some nonspecific interaction during elution.
min2 4 6 8 10 12 14
mAU
0250500750
1,0001,2501,5001,750
min2 4 6 8 10 12 14
mAU
0250500750
1,0001,2501,5001,750
min2 4 6 8 10 12 14
mAU
0250500750
1,0001,2501,5001,750
380 bar
176 bar
174 bar
2
3
4
5
6
Agilent AdvanceBio SEC, 2.7 µm, 300Å, 4.6 × 300 mm
Other vendor F, 2.5 µm, 450Å, 4.6 × 300 mm
Other vendor G, 1.7 µm, 200Å, 4.6 × 300 mm
Rs = 2.11
Rs = 2.52
Rs = 3.61
Rs = 2.20
Rs = 1.89
Rs = 1.44
Rs = 2.90
Rs = 4.10
1
2
3
4
5
61
2
3
4
5
61
Peak ID1. Thyroglobulin aggregates2. Thyroglobulin (662 kDa)3. IgG (150 kDa)4. BSA (66 kDa)5. Myoglobin (17 kDa)6. Uracil (112 kDa)
Figure 6. Comparison of profiles of protein standards on various 4.6 × 300 mm SEC columns. The resolution between peaks 1 and 2, 3 and 4, and 5 and 6 were calculated.
Figure 7. Calibration curves for protein standards on various 4.6 × 300 mm SEC columns.
1.52.02.53.03.54.04.55.05.56.06.5
1.5 2.0 2.5 3.0 3.5 4.0 4.5 5.0 5.5 6.0
Log
Mw
Elution volume (mL)
Calibration curves comparing Agilent AdvanceBio SEC with Columns F and G
R2 = 0.9868R2 = 0.816R2 = 0.9716
Agilent Advance Bio SECOther Vendor F, 450ÅOther Vendor G, 200Å
8
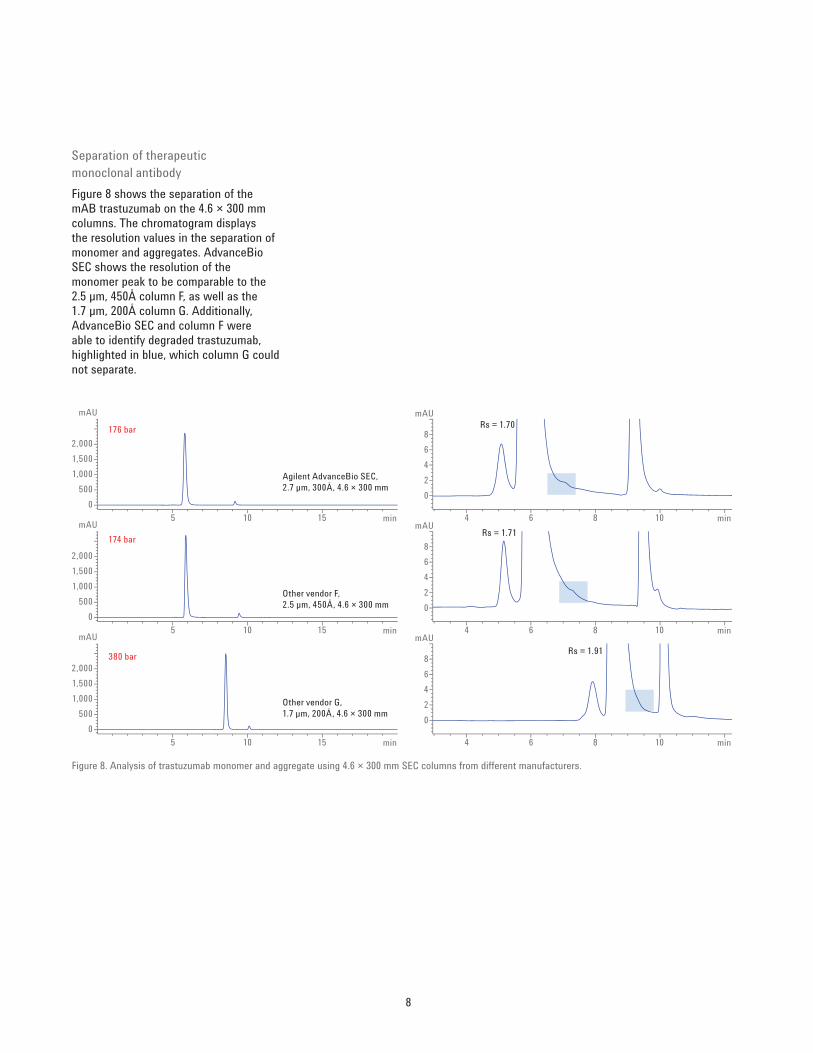
Separation of therapeutic monoclonal antibody Figure 8 shows the separation of the mAB trastuzumab on the 4.6 × 300 mm columns. The chromatogram displays the resolution values in the separation of monomer and aggregates. AdvanceBio SEC shows the resolution of the monomer peak to be comparable to the 2.5 µm, 450Å column F, as well as the 1.7 µm, 200Å column G. Additionally, AdvanceBio SEC and column F were able to identify degraded trastuzumab, highlighted in blue, which column G could not separate.
min5 10 15
mAU
0500
1,0001,5002,000
min5 10 15
mAU
0500
1,0001,5002,000
min5 10 15
mAU
0500
1,0001,5002,000
min4 6 8 10
mAU
02468
min4 6 8 10
mAU
02468
min4 6 8 10
mAU
02468380 bar
176 bar
174 bar
Agilent AdvanceBio SEC, 2.7 µm, 300Å, 4.6 × 300 mm
Other vendor F, 2.5 µm, 450Å, 4.6 × 300 mm
Other vendor G, 1.7 µm, 200Å, 4.6 × 300 mm
Rs = 1.70
Rs = 1.71
Rs = 1.91
Figure 8. Analysis of trastuzumab monomer and aggregate using 4.6 × 300 mm SEC columns from different manufacturers.

9
capacity for monomers, aggregates, and fragments for reliable and robust separations. To achieve better sensitivity, the method was transferred to a 4.6 × 300 mm column and compared with 2.5 µm, 450Å and 1.7 µm, 200Å columns, which also resulted in superior resolution. In addition, resolution and peak capacities can be improved significantly by coupling two columns in series. This is only possible with AdvanceBio SEC columns that can run at lower pressures. Finally, AdvanceBio SEC columns provide better peak shapes and certainty of resolving ADC monomers and their aggregates using aqueous mobile phase, without compromising column life and sample integrity.
column G column. The latter requires LC systems that are capable of tolerating high backpressures.
ConclusionsThe potential of size exclusion chromatography for biomolecule characterization is very high. This Technical Overview showcases several benefits of Agilent AdvanceBio SEC columns for biopharmaceutical analysis when compared to SEC columns from other vendors. We first used the 7.8 × 300 mm columns to separate a range of proteins, mAb monomer, aggregates, and fragments. The ideal pore size and pore volume of AdvanceBio SEC offer excellent separation and peak
Separation of antibody drug conjugate Figure 9 illustrates the SEC separation of ADC on various 4.6 × 300 mm columns. It is evident that the AdvanceBio SEC showed the highest resolution factor (Rs = 1.47) for ADC monomer and its aggregate, compared to columns F and G. Columns F and G gave poor peak shapes due to the interaction of hydrophobic payloads with the column stationary phase. The Advance BioSEC column also provided better peak shape for ADC monomer, and improved resolution of its aggregate. In addition to better separation of protein markers, mABs/ADCs, and their aggregates, AdvanceBio SEC operates at approximately 176 bar, as opposed to the 380 bar of the sub-2 µm
Figure 9. Comparison of ADC separation on various 4.6 × 300 mm SEC columns.
Agilent AdvanceBio SEC, 2.7 µm, 300Å, 4.6 × 300 mm
Other vendor F, 2.5 µm, 450Å, 4.6 × 300 mm
Other vendor G, 1.7 µm, 200Å, 4.6 × 300 mm
Rs = 1.47
Rs = 0.66
Rs = 1.07
min5 10 15
mAU
050
100150200250300
min5 10 15
mAU
050
100150200250300
min5 10 15
mAU
050
100150200250300
min2 4 6 8 10 12 14
mAU
-202468
10
min2 4 6 8 10 12 14
mAU
-202468
10
min2 4 6 8 10 12 14
mAU
-202468
10
380 bar
176 bar
174 bar

10

11

www.agilent.com/chem
For Research Use Only. Not for use in diagnostic procedures.
This information is subject to change without notice.
© Agilent Technologies, Inc., 2015, 2017 Published in the USA, November 2, 2017 5991-6474EN