advancing with “value networking ” design and …...advancing with “value networking” design...
TRANSCRIPT

Advancing with “Value Networking ” design and forge a robust corporate culture
Annual Report 2014For the year ended March 31, 2014

Profile
*1 “Autoworks” changed its segment name from “Truck Maintenance” starting from the fiscal year ended March 31, 2014.*2 TA-Q-BIN is the name in english for “Takkyubin,” the Yamato Group’s core small parcel delivery service.
The Yamato Group consists of Yamato Holdings Co., Ltd. (“the Company”), 44 subsidiaries, and
3 affiliated companies. It is primarily involved in six business segments: Delivery, BIZ-Logistics,
Home Convenience, e-Business, Financial, and Autoworks*1, as well as services incidental to
these activities.
The goal of the Yamato Group is to help bring about a better society by further refining the
TA-Q-BIN*2 network, which is a part of the social infrastructure, creating services that facilitate more
convenient, comfortable lifestyles, and developing innovative logistics systems. The Group has
managed its businesses in pursuit of this goal, toward which it will continue to strive. To this end, the
Group is working to maximize corporate value through improving quality by constantly putting ourselves
in our customers’ position, while also using the capabilities of the whole Group to develop unique
services that further improve convenience for our customers.
Forward-Looking StatementsThis annual report contains forward-looking statements concerning Yamato Holdings’ future plans, strategies, and performance. These statements represent assumptions and beliefs based on information currently available and are not historical facts. Furthermore, forward-looking statements are subject to a number of risks and uncertainties that include, but are not limited to, economic conditions, customer demand, foreign currency exchange rates, tax laws and other regulations.Yamato Holdings therefore cautions readers that actual results may differ materially from these predictions.
Contents
2 To Our Shareholders
4 Per formance Highlights
5 A Message from the President
14 Market Data
16 At a Glance
18 Overview of Operations
18 Deliver y
20 BIZ-Logistics
22 Home Convenience
24 e-Business
26 Financial
28 Autoworks
30 Other
31 Organization
32 Corporate Social Responsibility
35 Corporate Governance
38 Directors, Audit & Supervisory Board Members,
and Executive Officers
40 Analysis of Financial Position and
Management Results
44 Consolidated Balance Sheet
46 Consolidated Statement of Income
47 Consolidated Statement of
Comprehensive Income
48 Consolidated Statement of Changes in Equity
49 Consolidated Statement of Cash Flows
50 Notes to Consolidated Financial Statements
72 Independent Auditor’s Repor t
73 Corporate Data
1AnnuAl RepoRt 2014

To Our Shareholders
The Yamato Group has developed products and services for further improving customer convenience under a man-
agement philosophy that aims to “help enrich our society by enhancing the social infrastructure of TA-Q-BIN net-
works, creating more convenient services for comfortable lifestyles, and developing an innovative logistics system.”
Moreover, our long-term DAN-TOTSU Management Plan 2019 was formulated in January 2011, based on
this philosophy.
Since then, we have developed our businesses along the theme of striving for “more globalization” while remain-
ing “in close touch with the lives of local residents.” In doing so, we have endeavored to become Asia’s No. 1 solu-
tion provider in distribution and lifestyle support by fiscal 2020, when we will be celebrating our 100th anniversary.
In the year ended March 2014, the final year of the first DAN-TOTSU Three-Year Plan HOP phase of our long-
term plan, our operating climate was underpinned by continued expansion of e-commerce markets, and marked by
a recovery in personal consumption, corporate earnings, and the job market in Japan.
Under this operating climate, the Yamato Group responded to ever-evolving customer needs by further enhanc-
ing the TA-Q-BIN and other existing businesses, while developing new business lines by comprehensively leveraging
Group management resources.
In particular, we succeeded in growing our solutions business, which the Group pioneered as an organic out-
crop of rigorously combining consumer differentiation strategies with non-delivery businesses. As a result, the
Yamato Group enjoyed a year in which our presence in the growing e-commerce market increased dramatically.
Moreover, in July 2013, we announced a new “Value Networking” design as a pillar for underpinning our growth
in the future.
This design describes our attempt to raise logistics to a new evolutionary stage by upgrading our services as a
“means for generating new value.” This will be achieved by integrating our “last mile” delivery network, built up in
Japan and Asia as the Group’s core competence, with an array of non-delivery services we are developing.
Kaoru Seto
Representative Director and Chairman(left)
Makoto Kigawa
Representative Director, President and Executive Officer(right)
2

To kick start this revolution in logistics networking, our Haneda Chronogate, Atsugi Gateway, and Okinawa
International Logistics Hub began operation in the second half of 2013. The logistics quality, speed, and cost ben-
efit improvements brought about by these strategic bases will be leveraged to push strongly for the realization of
our “Value Networking” design.
Thanks to these endeavors, our consolidated operating revenues increased substantially by 7.2% year on year
to ¥1,374,610 million in the year ended March 2014.
On the other hand, our operating income fell short of target and declined 4.7% year on year to ¥63,096 million,
due to a weighty increase in temporary expenses. These short-lived impacts on income included delivery system
improvements to keep up with the increasing TA-Q-BIN handling volume, system buildups for improving the quality of
Cool TA-Q-BIN refrigerated courier services, and the Group responding to the record snowfall Japan experienced in
February 2014.
Net income decreased 1.0% year on year to ¥34,776 million.
Impacted by the decline in income, ROE stood at 6.4%. Even though this ratio of shareholder returns was
boosted in part by approximately ¥10,000 million in share buybacks we conducted in January 2014.
Millions of Yen
FY10/3 FY11/3 FY12/3 FY13/3 FY14/3
Change
Increase/Decrease YoY (%)
Operating revenues
Delivery ¥ 966,480 ¥ 995,651 ¥1,014,564 ¥1,028,219 ¥1,098,693 ¥70,474 6.9
Non-Delivery 234,354 240,869 246,269 254,155 275,917 21,762 8.6
Total 1,200,834 1,236,520 1,260,833 1,282,374 1,374,610 92,236 7.2
Operating income 61,389 64,314 66,651 66,203 63,096 (3,107) (4.7)
(Operating margin) 5.1% 5.2% 5.3% 5.2% 4.6% – –
Net income 32,282 33,208 19,787 35,144 34,776 (368) (1.0)
(Net margin) 2.7% 2.7% 1.6% 2.7% 2.5% – –
The DAN-TOTSU Three-Year Plan STEP, the second phase of our
long-term plan launched in April 2014, posits promoting the “Value
Networking” design and forging a robust corporate culture as our
two management pillars going forward.
Accordingly, we will develop business models with high added
value to revolutionize the logistics we provide customers as we
endeavor to promote our “Value Networking” design. At the same time,
we will deliver greater satisfaction to our shareholders and other inves-
tors, customers, the local communities, and societies we serve, and
our employees by forging a robust corporate culture. This will enable
us to take a balanced approach to management, enhance corporate
governance, and keep the promises we make to our customers.
We ask our shareholders and other investors for their ongoing
encouragement and support as the Yamato Group embarks on a
journey in pursuit of new growth.
September 2014
Return on Equity(%)8.0
6.0
4.0
2.0
2010 2011 2012 2013 20140
6.53 6.46
3.84
6.706.41
3AnnuAl RepoRt 2014

Performance Highlights
Millions of YenThousands of
U.S. Dollars (Note)
2014 2013 2012 2011 2010 2009 2014
Operating revenues ¥1,374,610 ¥1,282,374 ¥1,260,833 ¥1,236,520 ¥1,200,834 ¥1,251,922 $13,356,103
Delivery 1,098,693 1,028,219 1,014,564 995,651 966,480 997,898 10,675,214
Non-Delivery 275,917 254,155 246,269 240,869 234,354 254,024 2,680,889
Operating costs 1,274,471 1,181,834 1,163,777 1,143,006 1,110,971 1,167,764 12,383,117
Selling, general and administrative expenses 37,043 34,337 30,405 29,200 28,474 28,437 359,923
Operating income 63,096 66,203 66,651 64,314 61,389 55,721 613,063
Income before income taxes and minority interests 65,882 64,284 45,817 61,836 60,434 48,996 640,130
Income taxes 31,003 29,563 26,059 28,491 28,096 23,349 301,235
Net income 34,776 35,144 19,787 33,208 32,282 25,523 337,895
Yen U.S. Dollars (Note)
Per share of common stock:
Basic net income ¥ 82.22 ¥ 81.85 ¥ 46.00 ¥ 73.42 ¥ 71.84 ¥ 57.60 $ 0.80
Diluted net income 80.18 79.84 44.87 73.30 71.16 56.45 0.78
Cash dividends 24.00 23.00 22.00 22.00 22.00 22.00 0.23
Net assets per share 1,316.12 1,261.35 1,197.26 1,173.60 1,130.33 1,073.86 12.79
Millions of YenThousands of
U.S. Dollars (Note)
Working capital ¥ 179,999 ¥ 186,868 ¥ 182,111 ¥ 185,922 ¥ 165,890 ¥ 159,937 $ 1,748,926
Total shareholders’ equity 551,379 534,451 514,996 515,602 512,910 475,815 5,357,360
Total assets 1,032,134 950,153 919,295 899,363 878,641 869,606 10,028,509
Capital expenditures 79,531 48,052 48,615 52,472 39,700 45,856 772,745
Depreciation and amortization 42,266 37,936 38,682 39,583 39,883 42,697 410,668
Net cash provided by operating activities 80,075 73,950 71,843 87,899 77,064 84,463 778,035
Operating income margin (%) 4.59 5.16 5.29 5.20 5.11 4.45 –
Net margin (%) 2.53 2.74 1.57 2.69 2.69 2.04 –
Return on assets (ROA) (%) 3.51 3.76 2.18 3.74 3.69 2.93 –
Return on equity (ROE) (%) 6.41 6.70 3.84 6.46 6.53 5.42 –
Current ratio (%) 151.82 162.39 164.50 170.34 159.82 158.00 –
Shareholders’ equity ratio (%) 53.42 56.25 56.02 57.33 58.38 54.72 –
Assets turnover (Times) 1.39 1.37 1.39 1.39 1.37 1.44 –
Interest coverage ratio (Times) 153.41 108.36 90.52 73.71 88.35 58.57 –
Number of employees 193,146 177,108 177,301 171,642 167,555 170,662 –
Full-time 87,279 84,422 84,293 83,427 82,395 82,601 –
Part-time 105,867 92,686 93,008 88,215 85,160 88,061 –
TA-Q-BIN delivery volume (Millions of parcels) 1,665 1,487 1,423 1,348 1,262 1,232 –
Unit price (Yen) 574 591 600 609 624 646 –
Kuroneko Mail handling volume (Millions of units) 2,084 2,112 2,187 2,312 2,262 2,231 –
Unit price (Yen) 61 61 62 64 65 65 –
Note: U.S. dollar amounts have been translated, for convenience only, at the rate of ¥102.92 to U.S.$1.
For the year ended March 31, 2014
4 Yamato Holdings Co., ltd.

A Message from the President
1. The Yamato Group’s Vision
The Yamato Group is striving to become Asia’s No. 1 solution provider in distribution and lifestyle support by fiscal 2020, when we will be celebrating our 100th anniversary.
In relation to this, I think sustainable growth and co-existing with society are interconnected, and that it is vital for us as a Company that maximization of our profits and contribution to society are compatible.
The Yamato Group is striving to become Asia’s No. 1 provider in distribution and lifestyle support
solution services by fiscal 2020, when we will be celebrating our 100th anniversary.
To this end, the following three objectives were set forth in our long-term DAN-TOTSU Manage-
ment Plan 2019, scheduled for completion in the year ending March 2020:
(1) Enhance the logistics network in Asia
(2) Raise the product sophistication of TA-Q-BIN
(3) Establish lifetime lifestyle support platforms that are in close touch with local communities
These three objectives have served as guideposts in our pursuit of innovation for realizing growth
in TA-Q-BIN services, and cost structure reforms for giving rise to high profit margins.
Makoto KigawaRepresentative Director, President and Executive Officer
In April 2014, the Yamato Group began working on DAN-TOTSU Three-Year Plan STEP as the second phase to our long-term DAN-TOTSU Man-agement Plan 2019, which we aim to complete in the year ending March 2020.
In this 2014 annual report, I would like to explain our medium-term strategies along the lines of the following four themes.
The Four Themes
1. The Yamato Group’s Vision
2. Promoting the “Value Networking” Design and Forging a Robust Corporate Culture
3. Our Unique Competitive Advantages
4. Forecasts and Shareholder Returns for the Year Ending March 2015
5AnnuAl RepoRt 2014
IT LT FT“Last mile” network
Over the years, the Yamato Group has developed businesses in close touch with the lifestyles of
individuals in local communities. As a result, I have come to think that sustainable growth and co-
existing with society are interconnected, and that it is vital for us as a Company that maximization of
our profits and contribution to society are compatible.
This perspective has led us to refine our concept of CSR into a Creating Shared Value concept on
which we base the revitalization of communities and the lifestyle support we provide as part of the
structural innovations in our logistics business.
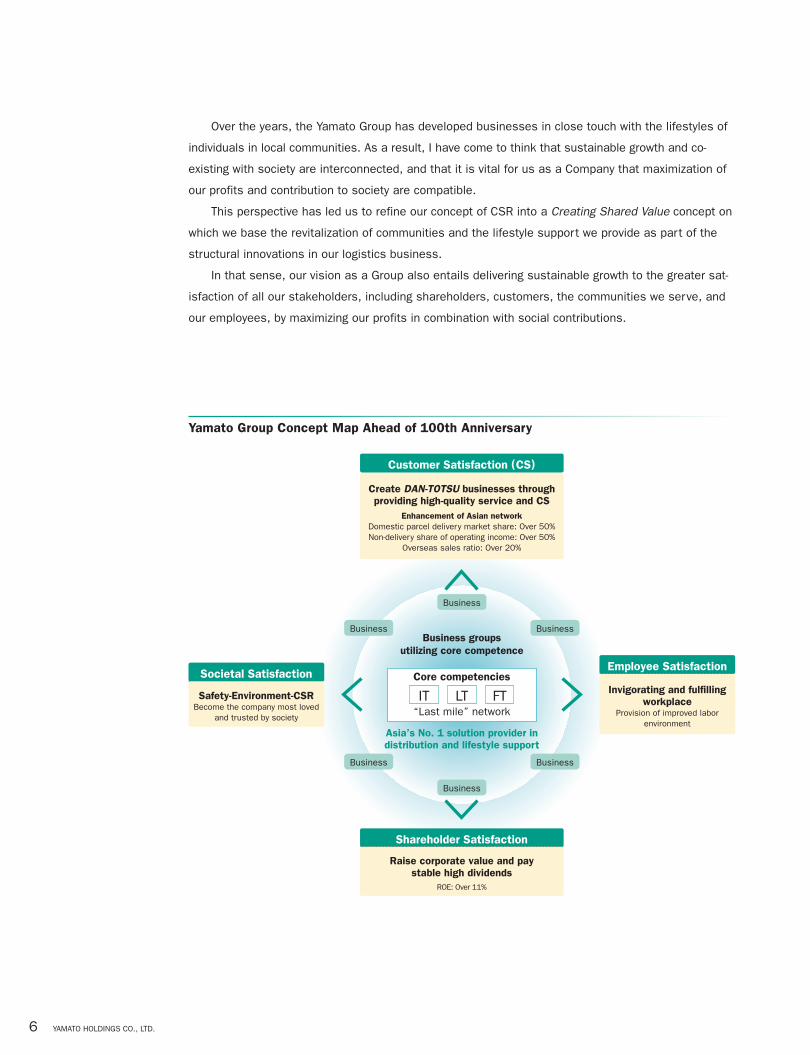
In that sense, our vision as a Group also entails delivering sustainable growth to the greater sat-
isfaction of all our stakeholders, including shareholders, customers, the communities we serve, and
our employees, by maximizing our profits in combination with social contributions.
Shareholder Satisfaction
Raise corporate value and pay stable high dividends
ROE: Over 11%
Employee Satisfaction
Invigorating and fulfilling workplace
Provision of improved labor environment
Societal Satisfaction
Safety-Environment-CSRBecome the company most loved
and trusted by society
Core competencies
Business groups utilizing core competence
Asia’s No. 1 solution provider in distribution and lifestyle support
Business
Business
Yamato Group Concept Map Ahead of 100th Anniversary
Create DAN-TOTSU businesses through providing high-quality service and CS
Enhancement of Asian networkDomestic parcel delivery market share: Over 50%Non-delivery share of operating income: Over 50%
Overseas sales ratio: Over 20%
Customer Satisfaction (CS)
Business
Business
Business
Business
6 Yamato Holdings Co., ltd.
2. Promoting the “Value Networking” Design and Forging a Robust Corporate Culture
Under DAN-TOTSU Three-Year Plan STEP, the Yamato Group will promote its “Value Networking” design and give rise to business models with high added value that not only benefit customers but also contribute to the growth of the Japanese economy.
At the same time, we will forge a robust corporate culture by rigorously educating our employees to instill in them the Yamato Group Corporate Philosophy and make the trust we earned from customers unshakable.
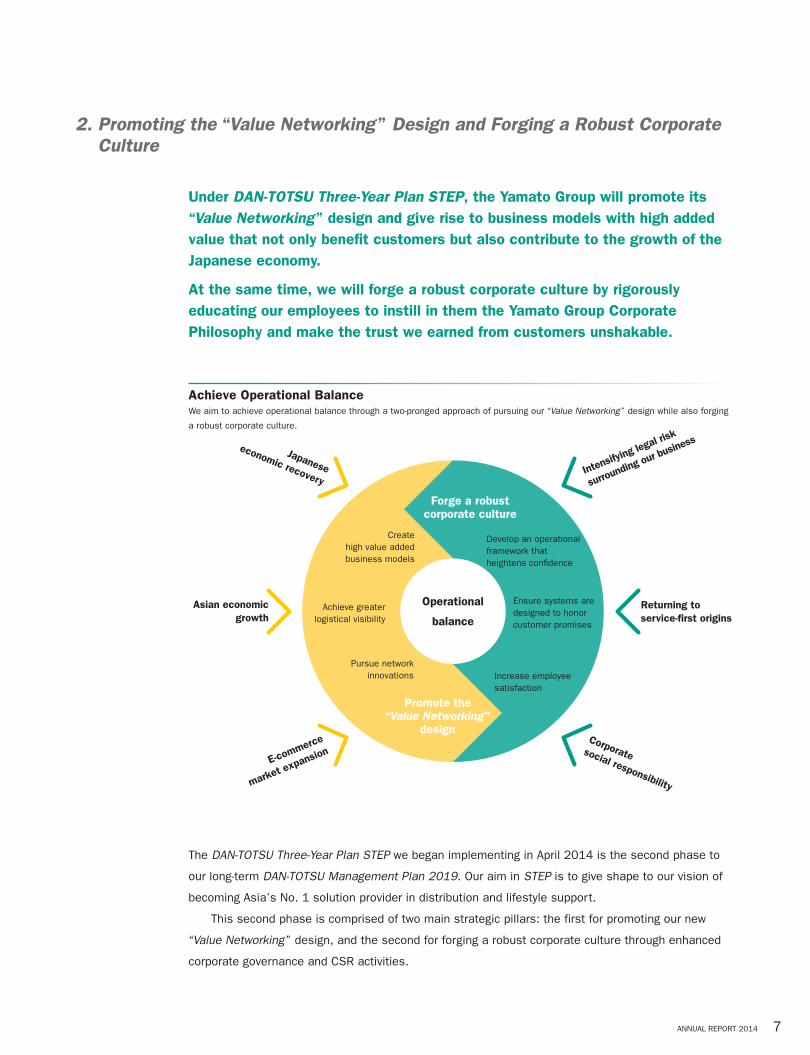
The DAN-TOTSU Three-Year Plan STEP we began implementing in April 2014 is the second phase to
our long-term DAN-TOTSU Management Plan 2019. Our aim in STEP is to give shape to our vision of
becoming Asia’s No. 1 solution provider in distribution and lifestyle support.
This second phase is comprised of two main strategic pillars: the first for promoting our new
“Value Networking” design, and the second for forging a robust corporate culture through enhanced
corporate governance and CSR activities.
Achieve Operational BalanceWe aim to achieve operational balance through a two-pronged approach of pursuing our “Value Networking” design while also forging
a robust corporate culture.
Forge a robustcorporate culture
Promote the“Value Networking”
design
Create high value addedbusiness models
Develop an operational framework thatheightens confidence
Ensure systems aredesigned to honorcustomer promises
Achieve greaterlogistical visibility
Pursue networkinnovations Increase employee
satisfaction
Operational
balance
Intensifying legal ris
k
surrounding our businessJapanese
economic recovery
Corporatesocial responsibility
E-commerce
market expansion
Returning toservice-first origins
Asian economicgrowth
7AnnuAl RepoRt 2014

Basic Group Strategy 1: Promoting the “Value Networking” Design
The “Value Networking” design describes our attempt to raise logistics to a new evolutionary stage by
upgrading our services as a “means for generating new value.” This will be achieved by integrating
our “last mile” delivery network, built up in Japan and Asia as the Group’s core competence, with an
array of non-delivery services we are developing. The concept will differentiate the Yamato Group from
conventional third-party logistics (3PL) providers who are dependent on warehousing and delivery of
inventory for revenue.
Our “Value Networking” design activates the following five engines in giving rise to business
models with high added value for improving the speed and quality of our logistics dramatically, and
holding down the total distribution cost of our customers.
The Five Engines of the “Value Networking” Design
(1) A non-stop logistic network, branching out from the full operation of Haneda Chronogate, Atsugi
Gateway, and Okinawa International Logistics Hub, providing swift value-added services 24 hours
a day, 365 days a year.
(2) A cloud-based network, interfaced with FRAPS*, which is unrestrained by shipping location,
shipping format, and shipping volume* FRAPS is an acronym for the Free Rack Auto Pick System, a cloud-based setup that can use “last mile” networks. This picking system uses
proprietary flow-through racks. As the racks move along, items are sorted and cross-merged on the network, reducing overall inventory by enhancing flow speeds and visualizing inventory volumes and flows.
(3) The world’s first integrated delivery network of international refrigerated packages, initiated by
International Cool TA-Q-BIN
(4) Seamless digital informatization enabling both senders and receivers to visualize logistics from
shipment to arrival
(5) Demand-chain-perspective innovation satisfying the needs of both purchasers and suppliers
Finding Insights to Changing Market Conditions
The “Value Networking” design was an insight that came to us as we observed the business condi-
tions of Japanese companies become increasingly borderless, and also intertwined with the rapidly
growing economies of Asia.
For example, our customers in the retail and distribution industry are facing intensifying competi-
tion with major e-commerce companies and are encountering growth of cross-border e-commerce
markets. Accepting smaller orders to stay in business and seeking prompt international delivery had
meant yearly increases in logistics costs for these customers.
Meanwhile, many Japanese manufacturers were having difficulty reining in their total distribution
cost, including inventory control, as they internationalized. This was because, while capable of keep-
ing manufacturing costs under control, they had to resort to outsourcing for shipments from the over-
seas factories they were opening.
We think that the solutions the Yamato Group is capable of providing can help these customers
reduce their total distribution cost, while improving the speed and quality of their logistics dramatically.
8 Yamato Holdings Co., ltd.

Meanwhile, the Yamato Group has
also had to cope with various changes
in its operating environment, including
an aging and shrinking population in
Japan, labor shortages, and the rapid
expansion of cross-border and domestic
e-commerce markets.
It was around seven years ago that
we began initiating cost structure
reforms in earnest. Since then we have
been working to raise our baseline
profit margins, while maintaining or enhancing our service quality, in anticipation of intensifying cost
pressure.
As part of cost structure reform, we have invested approximately ¥200.0 billion in new logistics
facilities such as Haneda Chronogate and Atsugi Gateway and in speeding up our conventional
TA-Q-BIN service to revolutionize our logistics network.
These capital investments for revolutionizing our logistics network will reach the final stage in the
year ending March 2015. From then on, the Yamato Group will enter a new phase of reaping benefits
from the reform.
In my analysis, the time-efficiency advantages of being ahead of others gained from the initiatives
we took will become a factor differentiating the Yamato Group substantially from our competitors.
As the objectives to our medium- to long-term strategy, we will continue to:
(1) Give rise to business models with high added value based on our “Value Networking” design,
(2) Push for cost structure reforms by re-examining our logistics network and package pickup and
delivery system,
(3) Apply pricing strategies for receiving fees for added value we provide,
(4) Stimulate new demand in Asia centered on TA-Q-BIN, and
(5) Build a global demand chain for our services.
Basic Group Strategy 2: Forging a Robust Corporate Culture
As the other strategic pillar to DAN-TOTSU Three-Year Plan STEP, the Yamato Group will concentrate
more than ever on building an open and transparent corporate culture. To this end, we will conduct
employee education programs for the entire group to instill in them the Yamato Group Corporate Phi-
losophy and make the trust we have earned from our customers unshakable.
At the same time, we will bolster corporate governance to make Group management more trans-
parent, realize a sound financial structure, and take a strategic approach to legal affairs to ensure
risk management is functioning as a check against the new business lines we create. The objectives
behind these measures we implement will be to 1) incentivize our employees to seek customer satis-
faction and 2) build a system that ensures that the promises we make customers will be kept.
9AnnuAl RepoRt 2014
In addition, we are aiming to develop a next-generation information system by the end of March
2017 to strengthen our IT platform. The new system will apply tools for making cargo flow handled by
the Group as a whole and each pickup and delivery area visible, so that an appropriate system for
maintaining and enhancing the quality of our services can be honed.
We will also try to fully commercialize the community lifestyle support services we developed with
local municipalities as part of our Creating Shared Value concept of embracing values important to
society in our main business activities.
3. Our Unique Competitive Advantages
The Yamato Group’s strength stems from the added value generated by fusing the “last mile” delivery network, built up in Japan and Asia as the Group’s core competence, with an array of high-margin, non-delivery services.
The Yamato Group has numerous unique competitive advantages unequaled by other companies.
But the following two strengths are the most salient as a foundation in realizing sustainable
growth for the Yamato Group and promoting the “Value Networking” design for driving growth in the
medium- to long-term.
1. The Yamato Group’s “last mile” delivery network in Japan and Asia
2. The added value generated by fusing this network with an array of non-delivery businesses
The Yamato Group’s “Last Mile” Delivery Network in Japan and Asia
The TA-Q-BIN business, which started as a home delivery service for consumers, has been operating
for 38 years since its launch in 1976.
We have run the service steadily from the outset to become as close as possible to our custom-
ers by operating from their perspective.
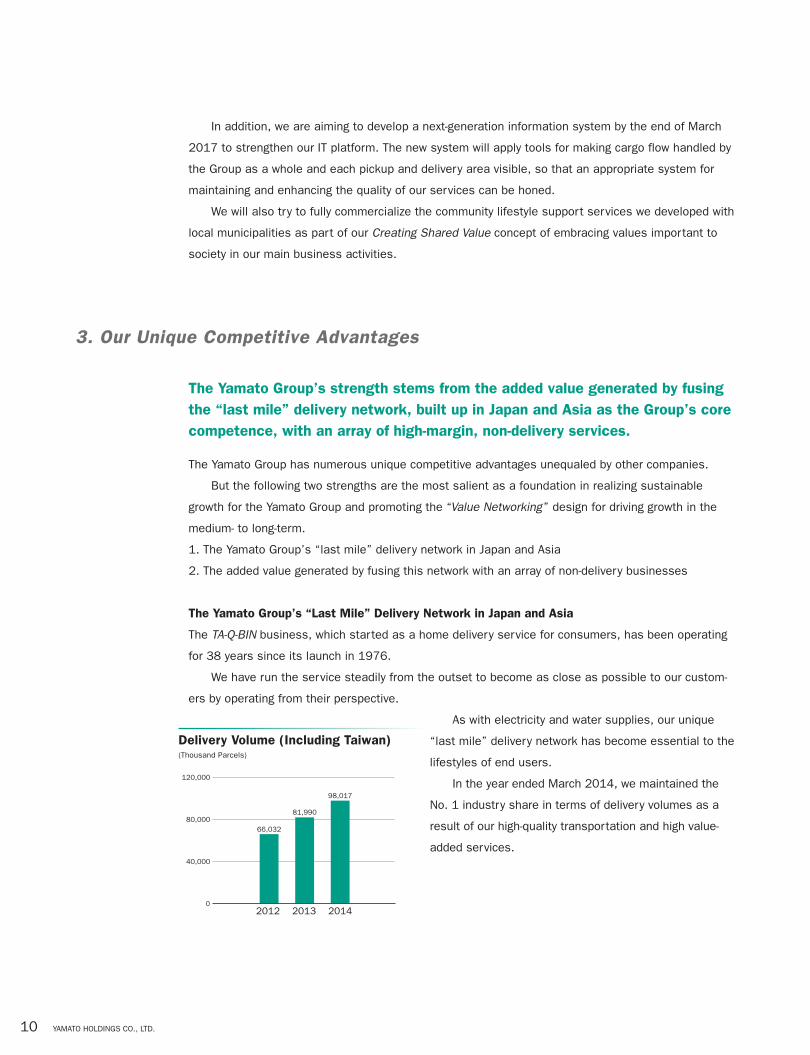
As with electricity and water supplies, our unique
“last mile” delivery network has become essential to the
lifestyles of end users.
In the year ended March 2014, we maintained the
No. 1 industry share in terms of delivery volumes as a
result of our high-quality transportation and high value-
added services.
Delivery Volume (Including Taiwan)(Thousand Parcels)
120,000
80,000
40,000
2012 2013 20140
66,032
81,990
98,017
10 Yamato Holdings Co., ltd.

The brand strength stemming from the Yamato Group’s TA-Q-BIN services and great customer
trust in its quality are tremendous assets of the Group.
We began expanding our TA-Q-BIN business in Asia when we provided our expertise in TA-Q-BIN
nurtured in Japan to Taiwan’s Uni-President Enterprises Corp. in 2000.
In January 2010, we took advantage of the economic growth potential of Asia by launching our
own businesses in the region, starting with Shanghai and Singapore.
As of March 31, 2014, we had developed the TA-Q-BIN delivery business in Hong Kong and
Malaysia, in addition to Shanghai and Singapore. Demand for delivery services is steadily rising in
these locations.
Courier companies with a “last mile” delivery network in Asia are few and far between globally.
We are convinced that this unique delivery network of ours is a strong advantage in capturing the
market for borderless logistics, extending the reach we have with customers in the countries in which
we already operate, and promoting a plan linking the regions and countries we serve with an inte-
grated international transportation service.
To build this integrated international transportation service in Asia, we used our Okinawa Interna-
tional Logistic Hub to launch an overnight delivery service of documents in November 2012 from
Japan to Shanghai, Singapore, Hong Kong, and Malaysia, where we have TA-Q-BIN services available.
In May 2013, we extended next-day deliveries to include small parcels.
In October 2013, we launched International Cool TA-Q-BIN, our service for delivering small refrigerated
packages internationally. The target area of this service between Japan and Hong Kong is scheduled to
expand to Taiwan and Singapore, as well.
Such TA-Q-BIN networks we have developed in Asia will play an important role in addressing our
medium-term objective of building up a global demand chain for the Yamato Group.
The Added Value Generated by Fusing our Network with an Array of Non-delivery Businesses
The Yamato Group adopted a pure holding company structure in November 2005.
We took advantage of that transition to reduce our reliance on TA-Q-BIN and other delivery ser-
vices by organically linking resources with non-delivery businesses. These non-delivery businesses
are the BIZ-Logistics, Home Convenience, e-Business, Financial, and Autoworks business segments.
In this way, we are developing and deploying new business models and accelerating strategies to
increase the earnings power of the entire Group.
Seamlessly integrating such non-delivery businesses as IT and financial settlement technology
(FT) with the “last mile” networks of our Delivery Business will empower us to provide new solutions
that dramatically improve logistics speed, costs, and quality.
11AnnuAl RepoRt 2014

4. Year Ending March 2015 Forecasts and Shareholder Returns
Our basic shareholder policy is to try to increase total returns through a combination of dividends and share buybacks.
In the year ending March 2015, the first year of the DAN-TOTSU Three-Year Plan STEP, we forecast
that consolidated operating revenues will increase 4.5% year on year to ¥1,437.0 billion. Operating
income is projected to rise 10.9% to ¥70.0 billion, while net income is forecast to increase 17.9% to
¥41.0 billion. We expect to reduce capital investment 9.6% to ¥80.0 billion, as we look to deliver a
record-setting performance.
Capital investment will peak out from the year ending March 2015. That said, the budget for
the year will include spending to maintain existing businesses and growth investments that
include new business oppor tunities such as e-commerce and procurement and delivery in the
corporate logistics category.
20
10
2005 2006 2007 2008 2009 2010 2011 2012 2013 20140
9.9 9.9 10.3
0.2 0.2 0.0
18.1
11.8
10.0 10.0
Operating Income(Millions of Yen)
80,000
60,000
40,000
20,000
2010 2011 2012 2013 2014 2015(forecast)
0
61,38964,314
66,651 66,20363,096
70,000
n Non-delivery n Delivery
Acquisition of own shares(Billions of Yen)
Cash Dividends per Share(Yen)
30
20
10
2010 2011 2012 2013 20140
22.0 22.0 22.0 23.024.0
12 Yamato Holdings Co., ltd.

Under the DAN-TOTSU Three-Year Plan STEP, ending March 2017, we are aiming for ROE exceed-
ing 9.0%. Meanwhile, we seek to generate an ROE of more than 11.0% under the DAN-TOTSU Man-
agement Plan 2019, which runs through the year ending March 2020.
For the year ended March 2014, we paid dividends of ¥24 per share, up ¥1 from a year earlier.
Our basic shareholder return policy is to continue trying to increase the total return through a
combination of dividends and share buybacks.
We will increase our earnings power by steadily executing our business plan, while raising capital
efficiency by implementing flexible capital policies, as and when needed, by taking advantage of our
solid financial base.
We ask our shareholders and other investors to look forward to the steps the Yamato Group
has begun taking on a journey in pursuit of new growth, and appreciate their ongoing encourage-
ment and suppor t.
September 2014
Makoto Kigawa
Representative Director,
President and Executive Officer
13AnnuAl RepoRt 2014

Market Data
4,000
3,500
3,000
2,500
2,000
1,500
1,000
500
0
1990198519801975
Source: Japan Post Holdings Co., Ltd. Japan Post Co., Ltd.
Yamato
(Millions of Parcels)
Japan Post
1996 Start of year-round
operations
Note: “Total Number of Deliveries” includes express home delivery services involving transport by truck, air, and other methods.Source: Statistical survey by the Ministry of Land, Infrastructure, Transport and Tourism
1988 Cool TA-Q-BIN service launched
1986 TA-Q-BIN Collect launched
Timeline of New Product Development
Growth in the Express Home Delivery MarketTrends in Parcel Delivery Volume
This survey uses company-reported parcel delivery
volume data compiled by Japan’s Ministry of Land, Infra-
structure, Transport and Tourism.
In the data, “parcels” denotes individual packages
weighing less than 30 kg, irrespective of the type of deliv-
ery (C2C, B2C, or B2B).
However, lots in which multiple packages are sent
together and parcels that do not require a signature on
delivery are not counted as “parcels” for the purposes of
the survey.
Growth of TA-Q-BIN
TA-Q-BIN is the Yamato Group’s flagship service offering.
Since its launch in 1976, we have pursued a strategy of
dif ferentiation based on development of additional stra-
tegic offerings, such as Cool TA-Q-BIN and TA-Q-BIN Col-
lect, and improvement of delivery quality, including
enhanced features such as Time Period Delivery and
Driver Direct services. As a result of these effor ts, the
Yamato Group has outper formed the growth in the
express home delivery market as a whole, and steadily
expanded our market share.
14 Yamato Holdings Co., ltd.

4,000
3,500
3,000
2,500
2,000
1,500
1,000
500
0
20142010200520001995
Enhancingservices by proposing solutions
Enhancingdelivery-side customer service
Trends in Delivery Volume By TruckTotal Number of Deliveries
(Millions of Parcels)
2010 TA-Q-BIN services started in Shanghai and Singapore
2011 TA-Q-BIN services started in Hong Kong and Malaysia
2009 Five Solution Models (Today Shopping
Service, Global Direct, etc.)
2002 Start of Driver Direct service
2007 Kuroneko Members service launched
2013 “Value Networking” design announced
1999
In fiscal 1999*1, certain firms switched their existing parcels to express home delivery, and the data for the year reflects this increase. Excluding this extraordinary factor, year-on-year growth was 5.9%.
*1 The period April 1999 through March 2000 in this graph only
2007
As a result of the privatization of the postal service in October 2007, Japan Post Co., Ltd. now falls under the jurisdiction of the Motor-Truck Transport Business Law, and is included in the survey starting from fiscal 2007*2.
*2 The period April 2007 through March 2008 in this graph only
Enhancingsender-side customer service
1998 Start of Time
Period Delivery
Moreover, the Yamato Group is developing its overseas
TA-Q-BIN business across Asia.
In addition to operations that have already begun in
Shanghai, Singapore, and Hong Kong, in September 2011,
the Group launched a TA-Q-BIN operation in Malaysia.
Moving forward, the Yamato Group will expand the
TA-Q-BIN business in markets across Asia where rapid
economic growth is expected to continue. By penetrating
these markets with high-quality door-to-door delivery ser-
vices and a business model honed in Japan, the Yamato
Group aims to contribute to the prosperity of societies
across Asia, and to evolve as the leading provider of
distribution and lifestyle support services in the region.
In July 2013, Yamato Holdings announced the Value
Networking concept as a pillar for growth going forward.
By integrating the overwhelming speed of our large-scale,
value-added distribution centers with our proprietary infor-
mation technology (IT), logistics technology (LT), financial
settlement technology (FT) and last-mile delivery network
throughout Japan and in other parts of Asia, the Yamato
Group will pursue growth by developing logistics as a
means for generating value.
15AnnuAl RepoRt 2014

n Delivery . . . . . . . . . . . . 79.9%
n BIZ-Logistics . . . . . . . . . . 6.6%
n Home Convenience . . . . . 3.5%
n e-Business . . . . . . . . . . . 3.0%
n Financial . . . . . . . . . . . . 4.6%
n Autoworks . . . . . . . . . . . 1.9%
n Other . . . . . . . . . . . . . . . 0.5%
Operating Revenues (Millions of Yen)
BIZ-Logistics
e-Business
Financial
Autoworks
Other
Share of Net Sales
1,200,000
900,000
600,000
300,000
02012 2013 2014
2012 2013 2014
100,000
80,000
60,000
40,000
20,000
0
2012 2013 2014
60,000
40,000
20,000
0
2012 2013 2014
40,000
20,000
30,000
10,000
0
2012 2013 2014
60,000
40,000
20,000
0
2012 2013 2014
20,000
25,000
10,000
15,000
5,000
0
2012 2013 2014
8,000
6,000
4,000
2,000
0
Delivery
Home Convenience
At a Glance
16 Yamato Holdings Co., ltd.

Operating Income (Loss) (Millions of Yen) Business Description
The Delivery Business provides small parcel delivery services for the general public
and corporations.
Guided by its basic corporate philosophy of “Total Reliability,” the business provides
mainly TA-Q-BIN and Kuroneko Mail services to improve convenience in customers’ lives.
The BIZ-Logistics Business is a corporate distribution operation involved in services such
as logistics and medical products distribution. The business provides customers with an
innovative logistics system by combining management resources such as the TA-Q-BIN
network with international transport and warehouse management functions.
The Home Convenience Business is a community-based lifestyle support operation that
provides services such as the pickup, delivery, and assembly and installation of home
furnishings and appliances. The business provides lifestyle-related services utilizing the
Yamato Group’s nationwide network, with the aim of supporting the convenient and
comfortable lifestyles of customers.
The e-Business comprises operations in contract data processing and information systems
development.
The e-Business is actively engaged in proposing solutions that integrate data, distribu-
tion, and settlement functions to raise business process efficiency and solve potential
business problems customers face.
The Financial Business provides settlement services and financial products for corpora-
tions and the general public.
From payment collection on mail-order product deliveries to B2B logistics settlement,
the Financial Business is striving to respond to every means of settlement to meet the
needs of customers.
The Autoworks Business performs the maintenance and upkeep of trucks and other vehi-
cles for transportation companies under contract.
Utilizing the Yamato Group’s technologies for reliably maintaining and repairing trucks,
the Autoworks Business provides customers in the trucking and bus transportation sector
with three forms of value: 1) convenient vehicle maintenance, 2) compliance with statutory
vehicle inspections, and 3) reduced maintenance and repair costs.
The Yamato Group’s Other businesses comprise the B2B logistics business involving the
JITBOX Charter service, personnel placement services, and shared services.
2012 2013 2014
25,000
20,000
15,000
10,000
5,000
0
2012 2013 2014
4,000
3,000
2,000
1,000
0
4,000
3,000
2,000
1,000
02012 2013 2014
(800)2012 2013 2014
400
0
(400)
2012 2013 2014
8,000
4,000
6,000
2,000
0
2012 2013 2014
12,000
9,000
6,000
3,000
0
40,000
30,000
20,000
10,000
02012 2013 2014
* Operating income in Other includes dividends from Group companies.
17AnnuAl RepoRt 2014

Overview of Operations
With the goal of being one of Japan’s most recognized and most endeared companies, the Delivery Business pursues development aimed at making the lives of customers more convenient. As a form of social infrastructure, we are com-mitted to living up to the trust society places in us while meeting its expectations.
The environment in which the Delivery Business operates is undergoing a major transition. In the Japanese market, volume has been increasing thanks to growth in e-commerce markets and with more frequent and smaller lots becoming the norm in B2B logistics. In addition, distribution distances have shortened due to the population becoming more con-centrated in urban areas and companies building distribu-tion facilities in the suburbs. Plus, home delivery services are beginning to be vertically integrated with outside indus-tries such as mail-order companies, and specialized local delivery companies are beginning to enter the scene. On the other side of things, consumers have started to demand flexible services in line with their own lifestyles, coinciding with an increase in single-person, dual-income, and senior citizen households. It is also becoming increasingly difficult to secure personnel due to Japan’s aging and shrinking population, so maintaining TA-Q-BIN networks and high-quality services is a major management issue.
Operating in this environment, in the Japanese market, we will bolster solution proposals for commercial distribu-tion, a growth area, further enhance products and services that respond to the diverse needs of consumers, and accommodate needs associated with the revitalization of local communities, another growing area. In conjunction with this, we will also reinforce systems for maintaining high-quality services. At the same time, we intend to further expand the TA-Q-BIN business overseas in anticipation of economic growth in Asia and the lowering of tariff barriers and continue to build an integrated overseas and domestic delivery platform. Through these initiatives we will work to realize the “Value Networking” design.
Review of the Year Ended March 2014The year under review was the final year of our medium-term management plan, DAN-TOTSU Three-Year Plan HOP, and in order to build a foundation for further growth, we opened Haneda Chronogate, which is based on a new concept in distribution and stands as one of Japan’s largest general distribution terminals, as well as Atsugi Gateway while also launching full-fledged operations at the Okinawa International Logistics Hub. By linking domestic and overseas distribution and effecting new logistics innovations through these new facilities we steadily carried out activities to realize the “Value Networking” design and give concrete form to the foundation that had been planned.
In the Japanese market, we expanded pickup services at convenience stores to boost convenience for customers and worked to support sales growth for mail-order compa-nies in the rapidly growing e-commerce market. For the B2B market, we proposed solutions drawing on TA-Q-BIN net-works and Group functions. And for individual customers, we steadily increased membership in the Kuroneko Members online service in order to further raise convenience for people receiving deliveries, adding new online functions that allow members to request changes in pickup dates and times using the Kuroneko Yamato Parcel Inquiry System and enhancing pickup services to promote greater use, which included expanding the scope of convenience store pickup when deliveries would otherwise be missed. In addition, there was increased use nationwide of services created in partnership with local governments, including lifestyle sup-port services, such as a shopping delivery service, and services provided on behalf of government agencies, such as a service for confirming the health and well-being of seniors. In this way we made further progress on establish-ing lifetime lifestyle support platforms.
In overseas markets, the ongoing integration of the Asian economic sphere is accelerating the transition to borderless goods, money, and information, and with demand for shorter lead times for international delivery and lower total distribu-tion costs, which includes inventory control, we launched the International Cool TA-Q-BIN service for delivery from Japan to Hong Kong utilizing the Okinawa International Logistics Hub in October 2013. The service allows small parcels requiring refrigeration to be delivered frequently and with a high level of quality. In addition, with the opening of Haneda Chronogate and Atsugi Gateway, we have established the foundation for a distribution network to Asia with higher quality, faster speeds, and greater cost performance.
In terms of earnings, in the rapidly expanding e- commerce market, our strength lies in differentiation and delivery quality via our “last mile” network, and this has led to a major increase in delivery volume centering on mail-order customers. In the TA-Q-BIN business, we achieved record-high transaction volume. On the other hand, Kuroneko Mail transaction volume declined due to more stringent accep-tance requirements, as more emphasis was put on compli-ance, and to a more intense competitive environment.
Masaki YamauchiRepresentative Director,
President and Executive Officer of Yamato Transport Co., Ltd.
Delivery
18 Yamato Holdings Co., ltd.

In terms of expenditures, we further developed transport and delivery systems in conjunction with the sharp increase in TA-Q-BIN volume, maintained and raised the quality of Cool TA-Q-BIN, and as a result of these and other initiatives, expenses related to system construction increased. There was also a record-setting snowfall in February, so temporary expenses were incurred as a result.
As a result, operating revenues increased 6.9% year on year to ¥1,098,693 million, in contrast to operating income which decreased 14.4% to ¥35,874 million.
Strategies for the Year Ending March 2015We began a new three-year plan this year, DAN-TOTSU Three-Year Plan STEP. Under the plan, we will promote new growth strategies that build on the foundation laid in our previous three-year plan. We have also crafted three man-agement policies, outlined below, for continuing to build a robust management base that will be ready for further changes in the market environment. Initiatives for realizing the three management policies will be implemented in the year ending March 2015.
1. Raise the value of the Yamato brand by resuming full participation of all employees in management, with an emphasis on the frontlines
In order to create a workplace environment in which each and every employee demonstrates their abilities and finds meaning in their work, we will enhance the employee train-ing system, reform the personnel evaluation system, and revise organizational formats. In addition, in order to main-tain the TA-Q-BIN network and high-quality delivery services, we will reinforce systems through utilization of diverse human resources, revise workflows centering on Cool TA-Q-BIN and Kuroneko Mail and further enhance available pickup options.
2. Reform the income structure and maintain sustained growth
for the company and good quality of life for employeesWe intend to more rigorously manage income by making costs of our goods and services transparent and by revis-ing our management accounting system in order to set rates and collect at appropriate levels. At the same time, in order to reform the cost structure, we will promote full digitalization utilizing our Kuroneko Members and Yamato Business Members services, which have seen membership increases, and more actively use IT to simplify internal clerical administration to both reduce the clerical overhead and lower costs.
3. Pursue “Value Networking” design and meet increasingly sophisticated customer needs
Under the “Value Networking” design concept, we will further reinforce our network infrastructure to realize same-day deliv-ery between major Japanese cities and next-day delivery to Asia. In addition, in order to accommodate increased volume within major metropolitan areas, we will also reorganize our urban area networks. For Asia, we plan to promote sales of International Cool TA-Q-BIN, which is experiencing growing demand. We will also actively develop B2B solutions in com-bination with advanced logistics at each distribution facility. These solutions will put emphasis not only on the sender (the supplier) but also on the needs of the recipient (the purchaser) from a “demand chain” standpoint.
In order to carry out the initiatives for the year ending March 2015, primarily those discussed above, and achieve the goals of the new three-year plan, we will institute a man-agement system using key performance indicators (KPI). Setting clear targets and making progress transparent, we will steadily execute the plan while flexibly responding to the changing environment.
TA-Q-BIN Services
Express Agencies: 240,000*Direct Retail Stores: 4,000*
Customers request delivery
(Corporate or Individual)
Customers receive packages
(Corporate or Individual)
Base(76 centers
nationwide)
Arterial Transportation
(Outsourced)
Base
(FY2014)
* Approximate figures
Acceleration of Multi-Stores (4,000 Stores)•High-Density Network with Our Catchphrase “No Matter What Time
Serve the Customer, No Matter How Many Times Serve the Customer”
•Time-DifferentiatedHigh-QualityService
•DeliverySystemwithIn-HouseEmployees
•DeliverynotDependentonTrucksActionsforEnvironmentandSafety
Greater Sophistication of ICT Infrastructure•Real-TimeParcelInquirySystemviaMobileTerminals
•DeliveryScheduleandMissedDeliveryE-mailSystem
•SettlementSystemIncludingPaymentonDelivery
Small GroupCenter
Small GroupCenter
Small GroupCenter
Small GroupCenter
Small GroupCenterSmall Group
Center
Mobile Terminal Mobile Terminal
IT and Settlement Data
19AnnuAl RepoRt 2014

Hitoshi KanamoriRepresentative Director,
President and Executive Officer of Yamato Logistics Co., Ltd.
Guided by our slogan of “LOGINNOVATION,” which encapsu-
lates our goal of achieving logistics innovation, the BIZ-
Logistics Business will work to pull together the Yamato
Group’s management resources in creating innovative logis-
tics solution models. Our efforts will be devoted to satisfy-
ing and inspiring the Yamato Group’s corporate customers,
as well as the consumers they serve.
Review of the Year Ended March 2014
In the year ended March 2014, operating revenues of the
BIZ-Logistics Business increased 4.0% from a year earlier to
¥90,255 million in contrast to operating income decreasing
16.9% to ¥3,404 million. Revenue growth was mainly attrib-
utable to an expansion in our logistics business in Japan as
a result of the economy recovering. Profits, on the other
hand, were weighed down by waning demand for our logistics
in international trade as the global economy stagnated, and
the expenses we incurred in developing new logistics bases.
The following are two initiatives we carried out in busi-
ness logistics during the year ended March 2014.
Firstly, we worked on launching a new logistics service,
combining the Yamato Group’s high-speed network and logis-
tics capabilities, to coincide with the completion of our
Haneda Chronogate and Atsugi Gateway distribution centers.
This contributed to shorter delivery lead times and enhanced
convenience for corporate customers receiving deliveries.
Particularly when the service was coordinated by our propri-
etary FRAPS (Free Rack Auto Pick System) loading docks for
sorting manufacturing materials and consumer goods into
lots, and then cross-merging them for synchronized just-in-
time delivery to stores and factories. In the meantime, we
also opened the Keihinjima Ryutsu Trinity Center as a new
logistics platform base. This new base will provide the infra-
structure that will enable industrial product makers to con-
centrate on manufacturing, because we will now have the
capacity for contracting their procurement logistics upstream
and sales distribution logistics downstream. Going forward,
BIZ-Logistics will contribute to revitalizing manufacturers in
Japan by increasing the added value in the sophisticated
business logistics we provide.
Secondly, we also worked on expanding the all-in-one sup-
port we provide with repair services in our Multi-Maintenance
business. Our goal was to establish a one-stop solution that
not only warehoused and supplied parts for home appliance
repairs, but also came with a network for overseeing all
functions involved in repairs from beginning to end. This
covered the call centers for accepting repair requests, pick-
ups, repairs, operational checks, and delivery of the
repaired appliances. The all-in-one support we provided
shortened repair turnaround, while enabling prompt cus-
tomer support, and contributed greatly to raising the satis-
faction of the Yamato Group’s corporate customers.
BIZ-Logistics
20 Yamato Holdings Co., ltd.

Strategies for the Year Ending March 2015
In the year ending March 2015, the first year of our DAN-
TOTSU Three-Year Plan STEP medium-term plan, BIZ-Logistics
will leverage the Group’s “Value Networking” design to radi-
cally reshape the value chain of our corporate customers in
the field of logistics.
Domestically, we will continue to work on business
expansion that stems from both the creation of logistics
models with high added value and growth in our baseline
operations. One concrete example of this is the Inventory-
free Model we have developed for small and medium-sized
mail-order business operators. Under this model, these
operators can make speedy home deliveries in as little as
four hours, because our logistics capabilities enable them
to disperse their inventory near major delivery markets in
minimal lots. This model shortens lead times, improves
work quality and reduces costs with no physical investment.
Internationally, we plan on providing services matching
the market needs of each region the Yamato Group covers by
globalizing our business logistics models in Japan. One area
we are working on is an all-in-one procurement and delivery
model for the supply of consumables in drugstore chains.
Our model will combine customs clearance, warehousing,
and transport functions with traceability. And we will apply a
flexible approach to globalizing this logistics model, including
active pursuit of local business alliances.
In these and other ways, the BIZ-Logistics Business will
help enrich society through borderless logistics and innova-
tions by organically connecting the management resources
of the Yamato Group.
Mail-Order CompanyOnly a quantity equivalent to
items sold is replenished
Atsugi Gateway Minimum
stock
Kansai Minimum
stock
FRAPS
Speedily replenishing stock through frequent trunk-route transportation
Purchaser
FRAPS
Sorting (single picking)
bundling of promotional
material, and wrapping
FRAPS
Purchaser
Purchaser FRAPS Purchaser
Mail-Order Company:
Improved speed, no picking, no logistics investment, visualization of inventory, reduced total inventory volume
Mail-Order User:
Quicker receipt of item, visualization of delivery
Chubu Minimum
stock
FRAPS
Inventory-free Model
21AnnuAl RepoRt 2014

In the Home Convenience Business, we provide lifestyle
support services that help solve inconveniences at home,
along with moving services and home furniture delivery,
assembly, and installation services. In addition, leveraging
our networks, we provide a range of solutions to corporate
customers in both the private and public sectors to support
sales growth and help reduce costs.
Review of the Year Ended March 2014In fiscal 2014, the final year of our DAN-TOTSU Three-Year
Plan HOP, we established the business model for lifestyle
support services by systematically building out the product
lineup, while implementing cost structure reforms and
bolstering backup support for operations to strengthen our
management base.
In services for individual customers, we used sales
promotion activities for the Group’s moving services as a
foot in the door to actively pitch our lifestyle support ser-
vices. This included our Raku Raku Okatazuke Pack for
customers seeking convenient house cleaning services and
Memorial Seiri Service, providing people in mourning the
reliable help they need in sorting out the estates of the
deceased. We also reminded customers of our capabilities
for contracting daily chores, the delivery and installation of
furniture and household appliances in rural areas far from
shopping districts, and for buying and recycling used furni-
ture and appliances. These services we pitched were
favored by individuals on tight schedules, and those in need
of a helping hand.
In addition, we bolstered our weak furniture delivery,
assembly, and installation service. This was done by estab-
lishing a centralized nationwide network for dispatching
two-person crews, rearranging rooms, hauling away used
furniture and appliances for recycling, and performing other
value-added chores upon arrival. The convenience the crews
provided was popular among both retailers and buyers of
mail-order furniture and household appliances, and resulted
in a recovery and increase in work volume in furniture deliv-
ery, assembly, and installation.
In services for corporate clients, we marketed our com-
prehensive logistics support service to businesses involved
with eco-home related equipment such as home power
generators and storage batteries. This service offers end-to-
end support covering import procedures, parts merging,
advance site checks, delivery, setup, installation, inspec-
tion, and repairs. Consequently, we were able to greatly
increase our handling volume. At the same time, we
achieved rapid growth by expanding the scope of this ser-
vice to include businesses in IT devices, office equipment,
kitchen appliances, and more.
We also launched a service drawing on our capabilities
cultivated for over 20 years in procuring local produce from
all over Japan. This service, used by many customers, was
launched mainly to help corporate clients improve customer
footfall, or to enhance their employee benefit programs.
As a result, operating revenues for Home Convenience
increased 9.2% year on year to ¥48,723 million. This
steady growth in operating results was underscored by the
solution platforms we provided corporate clients in the
home and commercial furnishing installation business, in
addition to the diverse array of value-added lifestyle support
services we built around the Yamato Group’s moving and
furniture delivery service.
Moreover, the operating income we recorded was ¥217
million, an improvement of ¥744 million over the previous
year. This was attributable to the strategic management of
subcontracting and personnel expenses in rigorous align-
ment with profit margins, as well as the integration and
consolidation of operational and clerical functions to curtail
fixed overhead.
Strategies for the Year Ending March 2015The year ending March 2015 is the first year of the DAN-
TOTSU Three-Year Plan STEP, in which we will be aiming to
stabilize our operating environment. Under the plan, we
will balance our effort to expand operations by creating
value-added business models against our initiatives to
forge a robust corporate culture by strengthening the
management base.
In services for individual customers, our focus in par-
ticular will be on lifestyle support services. In this modern
society, it is now easy to conduct various procedures and
make purchases from home owing to advancements in IT
and delivery networks. Consumption in the privacy of one’s
home will continue to increase going forward, and it will not
Atsushi IchinoRepresentative Director,
President and Executive Officer of Yamato Home Convenience Co., Ltd.
Home Convenience
22 Yamato Holdings Co., ltd.
only be to simply eliminate inconvenience but to establish
lifestyles tailored to individual preferences. There will also
likely be acceleration in demand for services performed by
third parties as customers seek to make more effective use
of their own time. The Yamato Group can reach customers
at their homes all over Japan. We also have the capability to
deliver packages whether large or heavy, as well as the
capable technicians to conduct electrical installation and
other work. Utilizing this network, we intend to provide ser-
vices that both solve inconveniences within the home and
help individuals realize their own fulfillment.
At the same time, we will begin to genuinely adapt our
network to the needs of corporate clients. This will entail
launching development of a Technical Network Business in
the year ending March 2015. This new facilities contracting,
maintenance, and after service network under the Kuroneko
Technical Network brand will combine our formidable two-
person delivery and installation crews with the capability of
130 collaborating utility work contractors whom satisfy the
bar we set for excellence. Together, our crew and the
contractors will provide a one-stop service for corporate
clients, such as home furnishing makers, who want to hire
operational support and enhance end user satisfaction at
the same time.
The above lifestyle support services and corporate
activity support services will have the effect of increasing
our average daily workload. And by smoothing out downtime,
they help raise productivity and contribute to structural
improvements in profitability.
Meanwhile, our management base will be strengthened in
accordance with the YHC Code of Conduct we formulated as a
guideline for enhancing the safety, compliance, and customer
relations of Yamato Home Convenience Co., Ltd. In combina-
tion with backup support for business operations and cost
structure reforms, this code will be applied to satisfy custom-
ers, society, and our employees, and build a sound manage-
ment base for recording stable profits in return.
Looking ahead, we will strive to raise our corporate
value by developing services favored by customers and
needed by society.
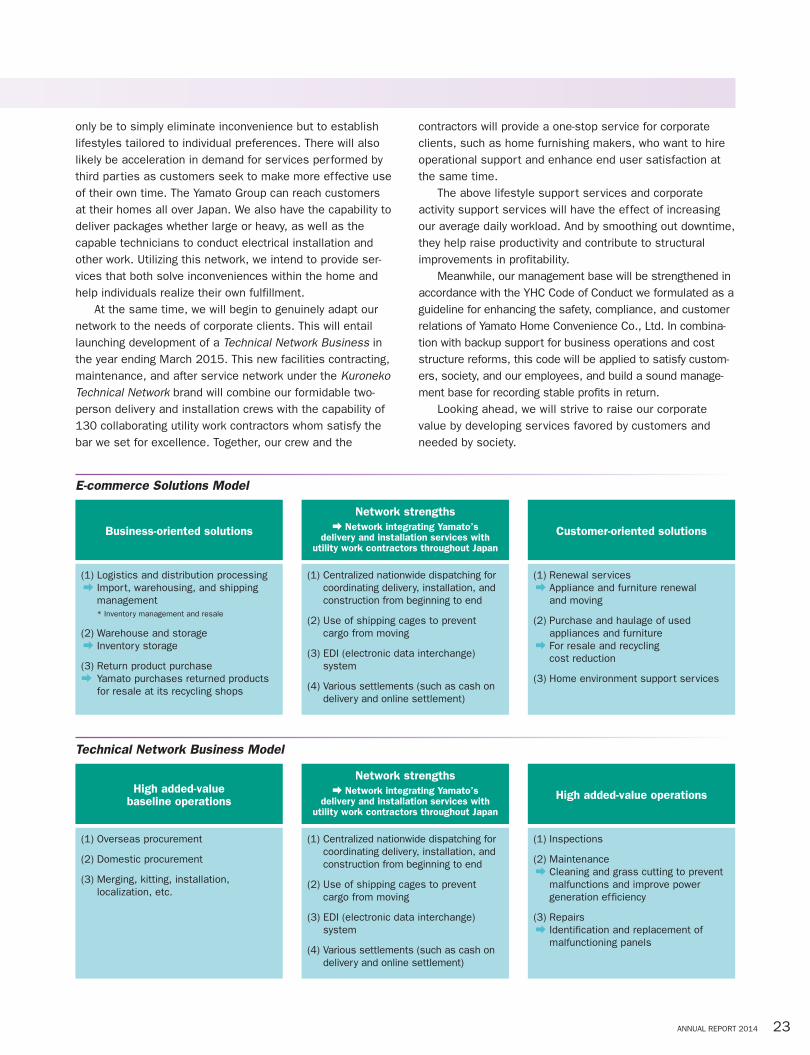
E-commerce Solutions Model
Technical Network Business Model
Business-oriented solutions
(1) Logistics and distribution processing a Import, warehousing, and shipping
management * Inventory management and resale
(2) Warehouse and storage a Inventory storage
(3) Return product purchasea Yamato purchases returned products
for resale at its recycling shops
Network strengthsa Network integrating Yamato’s
delivery and installation services with utility work contractors throughout Japan
(1) Centralized nationwide dispatching for coordinating delivery, installation, and construction from beginning to end
(2) Use of shipping cages to prevent cargo from moving
(3) EDI (electronic data interchange) system
(4) Various settlements (such as cash on delivery and online settlement)
Customer-oriented solutions
(1) Renewal services a Appliance and furniture renewal and moving
(2) Purchase and haulage of used appliances and furniture
a For resale and recycling cost reduction
(3) Home environment support services
High added-value baseline operations
(1) Overseas procurement
(2) Domestic procurement
(3) Merging, kitting, installation, localization, etc.
Network strengthsa Network integrating Yamato’s
delivery and installation services with utility work contractors throughout Japan
(1) Centralized nationwide dispatching for coordinating delivery, installation, and construction from beginning to end
(2) Use of shipping cages to prevent cargo from moving
(3) EDI (electronic data interchange) system
(4) Various settlements (such as cash on delivery and online settlement)
High added-value operations
(1) Inspections
(2) Maintenance a Cleaning and grass cutting to prevent
malfunctions and improve power generation efficiency
(3) Repairs a Identification and replacement of
malfunctioning panels
23AnnuAl RepoRt 2014

The e-Business is involved in a range of information
services for corporate customers, including cloud-based
(ASP/SaaS) services, and information system development
and operation.
Using ICT, the e-Business works in partnership with
customers to enhance business process efficiency. Based
on its services, the e-Business seeks to help resolve latent
business issues and proactively propose solutions that
result in sales growth and cost reductions for customers.
Review of the Year Ended March 2014
In the e-Business, we spent the year under review actively
proposing solutions that integrate data with distribution and
settlement functions to raise business process efficiency
and help resolve the hidden business issues of our custom-
ers. Furthermore, we also devoted ourselves to developing
and operating ICT systems that were an integral part of
business development for the Yamato Group as a whole.
In collaboration with the Financial Business in e-money
services, we have been promoting installation and operation
of the Multi e-money Settlement Terminals, which are capa-
ble of processing multiple brands of e-money for settlement
on a single platform. During the year under review, we saw
Yoshihiko HoshinoRepresentative Director,
President and Executive Officer of Yamato System Development Co., Ltd.
e-Logistics Solution
Production Base
Distribution Base
Sales Base
Customer
Flow of Goods
Flow of Information
Information and Tracking ManagementStorage, Transport, and Delivery
Individual Product Management Enables Faster, More Accurate ResponseBusiness Partner’s
Customers
Yamato Group Business Partner
Yamato Group Operations
Using Tracing to Achieve Uniform Information Management
e-Business
24 Yamato Holdings Co., ltd.

expanded installation and use of the terminals by a wide
range of corporate customers, including companies develop-
ing chain stores and those in the food and drink, retail, and
amusement facilities industries.
In our e-Logistics Solution business, we offer a service
that visualizes delivery flows and the whereabouts of pack-
ages by applying the tracking know-how of our TA-Q-BIN
business for customers, including telecommunications
equipment and cable television companies in need of man-
aging and keeping track of the individual terminals they
install. In the year under review, in addition to subscription
growth in our existing services, we accelerated business
development by mainly promoting services for managing the
reservations, acceptance and delivery, and inventory of
precision instrument and medical device manufacturers
when renting products to hospitals and other customers.
In e-On Demand Solutions, business expanded in the
fiscal year under review thanks to the development of ser-
vices, particularly for the pharmaceutical industry, that sup-
port improved sales efficiency and inventory reductions for
customers through the management, on-demand printing,
and just-in-time delivery of sales promotion materials.
Our Web-Based Mail Order Solutions business was
grown through the development of mail-order and
e-commerce ICT services designed for the expanding mail-
order and e-commerce market.
In Chain Store Solutions, we experienced business
growth by developing ICT services for supporting the deliv-
ery of summer and year-end gift packages by retailers, and
product returns and exchanges by mail-order businesses.
Overseas, we provide ICT backup support in the Yamato
Group’s steps to advance into the Asian market. We are
also actively involved in bringing the Group’s proprietary
services online in Taiwan and Singapore in coordination
with the Group’s business expansion in Asia.
As a result, operating revenues increased 12.1% year on
year to ¥41,538 million, supported mainly by growth in
services linking data and logistics functions. Operating
income rose 13.8% to ¥7,954 million due to productivity
enhancements and cost cutting measures, despite upfront
investments in e-money services and other factors.
Strategies for the Year Ending March 2015
Our first strategy is to strengthen the competitiveness of our
ICT products. Besides refining existing services as a matter
of course, we will create more services and businesses by
combining the management resources of e-Business and
other business operations within the Yamato Group.
Our second strategy is to reinforce our sales capabili-
ties. In order to cultivate customer needs as the market for
our ICT services spreads throughout Japan, we will open six
branches and build a sales network for proposing ICT solu-
tions in tune with local requirements. At the same time, we
will raise the sophistication of our ICT solutions capability by
working in closer coordination with the Yamato Group’s
other business operations.
Thirdly, we will emphasize quality. We must value our
ties with customers, build reliable and good relationships of
trust, and enhance the level of our ICT services from their
perspective, if we are to keep our customers satisfied.
Going forward, the e-Business will provide ICT and other
optimal solutions, combining the Yamato Group’s management
resources in distribution and settlement functions, in order to
contribute to the business development of our customers.
25AnnuAl RepoRt 2014

Toshizo KurisuRepresentative Director,
President and Executive Officer of Yamato Financial Co., Ltd.
The Financial Business aims to become a strong partner
that provides convenience for consumers and helps business
operators overhaul their distribution systems by providing
settlement and other financial solutions in Japan and
abroad. We are determined to offer diverse settlement
methods to fulfill customer requirements, such as collecting
payment on delivery for mail-order companies and handling
settlements between companies. Under our DAN-TOTSU
Management Plan 2019, we will strengthen strategies in the
e-commerce market in order to command the No. 1 market
share as a settlement provider for mail-order businesses in
particular while enhancing the product lineup of our other
financial services.
Review of the Year Ended March 2014
In addition to providing all sorts of settlement methods from
credit cards to payments at convenience stores and with
e-money, the Financial Business addressed continued
growth of online mail-order businesses in the business-to-
consumer (B2C) market by actively promoting sales of
Kuroneko Web Collect, a service package for mail-order
businesses that helps integrate their sales processing from
receiving payment to settlement. This was done with the aid
of new functions such as Repeat Customer Settlement and
Advance Sales that we added to enhance the service. We
also began leasing the Group’s Multi e-money Settlement
Terminal to vendors as we adapt to a market for settling
payments with e-money that has been burgeoning in terms
of penetration rate, settlement volume and application.
These terminals were used to enable vendors to accept
e-money for payment at not only permanent storefronts, but
also in other settings such as at events held for short peri-
ods of time throughout Japan. We offered these business
customers proposals for total solutions in which we pack-
aged the means for accepting e-money as payment with
assistance in sales promotion activities.
In the business-to-business (B2B) market in Japan, we
helped sellers expand sales channels and buyers perform
credit transactions through the Kuroneko Anshin Kessai
Service. This service also provided the added value of
improving business efficiency, enabling the management of
trade receivables, and reducing the risk of those receivables
going uncollected. Efforts were geared toward improving the
service by enabling buyers to submit applications online and
speeding up the screening for approving their credit.
In leasing, we bolstered sales by expanding the scope of
our truck leasing market from the existing customer base of
shipping companies to companies who have in-house logis-
tics operations. We also enhanced our product strength by
developing new products, such as lease backs and three-
year operating leases, matching customer needs in new
markets, to promote sales and increase profits.
Overseas, in Shanghai, Singapore, Hong Kong, and
Malaysia, where we provide settlement solutions, we worked
to differentiate ourselves from local competitors by propos-
ing solutions in line with local customs and the unmet needs
of customers. This included the introduction of a settlement
service accepting checks as payment in Singapore and Hong
Kong where writing checks is customary. These efforts
resulted in a year-on-year increase in overseas settlement
transaction volume and operating revenues.
As a result of the above, operating revenues in the
Financial Business rose 10.6% year on year to ¥62,728
million. This improvement was largely attributable to an
increase in the number of TA-Q-BIN Collect and e-money
settlement transactions due to more business with major
mail-order companies. Operating income was ¥9,406 million,
up 10.4% year on year.
Strategies for the Year Ending March 2015
In the B2C market, the e-commerce and online mail-order
market is expected to grow as a result of the establishment
of environments with easy Internet access from just about
anywhere. In response, we will be enhancing the functions
Financial
26 Yamato Holdings Co., ltd.

available on Kuroneko Web Collect, our strategic service
product in the online mail-order market, while maintaining
our core business of settling payment on delivery. In paral-
lel, we will take the initiative of enhancing the marketability
of our services by means that include marketing process
reforms and business alliances.
We will also strive to provide safe, reliable, and conve-
nient settlement services while flexibly adapting to the
diversifying needs of both buyers and mail-order business
operators. This will be done by expanding our Kuroneko Pay
On Delivery service, as well as our business leasing the
Group’s Multi e-money Settlement Terminal.
In the meantime, we will hone our product development
and marketing capabilities in striving to deliver added value
to mail-order business operators. These capabilities will be
upgraded to propose total solutions that make the most of
the Yamato Group’s collective power in addressing their
diversifying needs.
In the B2B market, we will accelerate growth by strength-
ening the marketing structure underpinning our Kuroneko
Anshin Kessai Service. To achieve this, we will sort our
target customers by segment, and draw on the Group’s
marketing acumen to propose optimal solutions for each.
In leasing, we will designate used car leasing, lease
backs, and three-year operating leases as our three strate-
gic products. At the same time, we will provide solutions to
business issues having to do with safety, environmental
accountability, quality assurance and customer development
through our value-added services. In these ways, we will
strive to differentiate ourselves from the competition and
grow our net balance of lease contracts.
In overseas markets, we will work to steadily increase
our settlement volume amid rapid growth of cross-border
settlements in the B2C market, mainly by helping retailers
from Japan expand their sales channels overseas. Mean-
while, in the overseas B2B market, we will make our Global
Procurement Support Service and other capabilities for
settling international trade even easier to use.
With these objectives, we will propose solutions based
on the Yamato Group’s “Value Networking” design and aim
to become the ideal partner for customers by upholding
consumer convenience and realizing distribution reform for
business operators.
The Growing Mail-Order Sales Market and TA-Q-BIN Collect(%)
14.0
12.0
10.0
8.0
4.0
6.0
2.0
02010 2011 2012 2013 2014
4.1
6.2
3.2
4.1
8.49.0 9.1
6.3
12.9
8.3
n YoY growth in mail-order sales n YoY growth in TA-Q-BIN Collect parcel volume
Source: The Japan Direct Marketing Association
TA-Q-BIN Collect: Flowchart of Cash-on-Delivery Service
Seller BuyerProduct delivery
Sales agreement
Yamato Transport Co., Ltd.
Yamato Financial Co., Ltd.
Payment
•Cash •Credit card
•Debit card •Electronic money
Product charge collection contract
Net deposit
Settlement
•Product charge •Collection fee
27AnnuAl RepoRt 2014

The Autoworks Business is not satisfied with being a one-of-
a-kind operation in Japan. Our vision is to transform our
vehicle maintenance services into the No. 1 autoworks for
logistics and distribution business operators. “Transform
inconvenience into convenience from the customer’s stand-
point” is the corporate DNA of the Yamato Group. Based on
this perspective, the Autoworks Business functions as a
vehicle maintenance plant chiefly for logistics and distribu-
tion companies. We have enhanced our operations in scope
with groundbreaking services in the industry that go beyond
vehicle maintenance to provide around the clock service
365 days a year, vehicle maintenance without downtime,
mandatory inspections around tight time schedules, and
road service for vehicles. We offer our customers the value
of compliance with statutory vehicle inspections, convenient
vehicle maintenance, and reduced maintenance costs.
Furthermore, to better provide one-stop service solu-
tions geared toward customer business operations, we have
added services for maintaining and safeguarding logistics
facilities and equipment, along with auto and property insur-
ance agency services where we offer plans tailored to cus-
tomer needs.
Review of the Year Ended March 2014We posted increases in both revenues and profit in the year
under review. Our operating revenues were ¥25,650 million,
up 10.4% year on year. Operating income increased 22.7%
to ¥3,272 million.
A new Superworks vehicle maintenance plant was estab-
lished near the Port of Nagoya, the largest port in Japan in
terms of total cargo throughput. Superworks plants repre-
sent a new paradigm in environmentally accountable main-
tenance facilities and feature high operating efficiency, as
well as solar power systems, LED lighting, and other energy-
saving equipment. Of our 71 vehicle maintenance plants,
22 are now Superworks facilities. We also enhanced cus-
tomer convenience by expanding our road service for basic
vehicle repairs and inspections performed on location at
customer business sites.
In addition, we launched the sale of a new proprietary
digital tachograph that was simplified to be affordable and
easy to use. This product, which encourages safe and proper
driving to reduce traffic accidents and conserve fuel con-
sumption while supporting enhancements in labor manage-
ment of drivers, was part of our effort to expand services
contributing to the security and safety of our customers.
As a result of leveraging our network strengths and solu-
tions capabilities in this way, mandatory inspections per-
formed on vehicles outside the Yamato Group, a key
performance indicator, increased by 1,900 over the previ-
ous year to 78,500 vehicles.
Strategies for the Year Ending March 2015In the year ending March 2015, we aim to grow operating
revenues by 9.2% year on year to ¥28.0 billion, and
operating income by 10.0% to ¥3.6 billion. To this end,
we will adhere to the following strategies and basic
Keishirou SasakiRepresentative Director,
President and Executive Officer of Yamato Autoworks Co., Ltd.
Superworks Nagoya
Completed in April 2013 Launched for sale in August 2013
Superworks vehicle maintenance plants pursue operating efficiency and environmental accountability
EarthDrive DTU-1 simplified digital tachograph
Autoworks
28 Yamato Holdings Co., ltd.

concept to reshape Autoworks as a solutions company
able to make new logistics suppor t proposals while pro-
viding management assistance to logistics and distribu-
tion business operators.
Basic Strategy 1: Build Closer, Far-reaching Trust to Create New Value Together1. Build service networks closer in touch with customers
We will establish Superworks facilities in major Japa-
nese cities and strengthen our road service equipped
with vehicle diagnostics capabilities. This will be done
to provide services closely in touch with our customers
in each local market, and to help maintain delivery
infrastructure from the standpoint of business continuity
planning (BCP).
2. Build far-reaching services providing management supportWe will utilize IT to enhance our far-reaching repair and
maintenance capabilities in support of procurement,
management of logistics vehicles, facilities, equipment
and machinery, and risk management. This will be done
to upgrade the customer orientation of our services and
create an enduring value cycle by eliminating customer
down time.
3. Create new value togetherWe will strengthen collaboration with business partner
companies and expand our scope of services in vehicle,
facility and equipment maintenance. This will be done to
help improve the quality of deliveries by logistics and
distribution business operators so that we can create
new value together.
Basic Strategy 2: Forge a Robust Corporate CultureWe will forge a robust corporate culture in line with the
Yamato Group’s corporate philosophy for the Autoworks
Business. This will be done by nurturing an environ-
ment of mutual trust that endorses a culture in which
employees encourage one another in realizing their full
potential. To this end, we will also enhance corporate
governance while strengthening our legal compliance
and financial structure.
Basic Concept—The “Three Cs” and “One C”The Autoworks Business provides one-stop services based
on observing the three “Cs” underpinning management
support for logistics and distribution business operators.
The first “C” is Compliance, which is the foundation of man-
agement. In this regard, our Repairworks road service has
contributed to improving the completion rate for statutory
vehicle inspections by our customers. Next, we have Conve-
nience, where we pursue ever higher levels of convenience
for our customers. Based on this concept, we aim to estab-
lish a framework that enables around the clock operations
365 days a year in order to carry out vehicle inspections
when the vehicles are not in operation. Our third “C” stands
for Cost Reduction based on helping to improve utilization
rates for commercial vehicles while leveraging procurement
capabilities. By promoting measures to limit the need for
spare vehicles and increasing the completion rate for statu-
tory vehicle inspections, we have made it possible to imple-
ment preventive maintenance, which helps limit occurrences
of unexpected costs. We will harness our nationwide network
to optimally procure parts and fuel so as to provide custom-
ers with high-quality products and services at low costs.
The last “C” stands for Clean. In keeping with the times,
we have addressed environmental accountability by deploy-
ing solar power systems, energy-efficient LED lighting, and
other facilities at Superworks. Also, we have started to
build a system for being able to handle new technologies in
our maintenance operations, with an eye on the increasing
use of electric vehicles. In addition, we are recommending
the use of rebuilt and reused parts, and are actively
involved in recycling discarded batteries, in our efforts to
support the environmental accountability of customers and
society at large.
3C+1CCompliance, Convenience,
Cost Reduction+
Clean
Vehicle Maintenance
Risk Consulting
Logistics Maintenance
Vehicle safety
Maintenance of logistics equipment
Non-life insurance agency
Fuel procurement
Tire management
Sale of logistics equipment
Life insurance agency
29AnnuAl RepoRt 2014

The JITBOX Charter service is a service that provides trans-
portation in shipment cages. The service takes advantage
of its Group network consisting of multiple companies and
provides value to customers through timely delivery and
frequent, adequate volume delivery. In the fiscal year ended
March 31, 2014, the Group saw an increase in usage of the
service by manufacturers and other customers and trans-
portation orders related to events, and the handling volume
exceeded that of the previous fiscal year.
Operating income in Other, excluding dividends which
Yamato Holdings Co., Ltd. received from the Group companies,
increased 6.3% from the previous fiscal year to ¥955 million.
JITBOX Charter
Track Record of JITBOX Charter(Units)
500,000
400,000
300,000
200,000
100,000
02012 20142013
403,018
471,018
380,270
Operating Income(Millions of Yen)
25,000
20,000
15,000
2,000
1,500
1,000
500
0
11,877
1,157898 955
18,763
24,957
2012 20142013
n Including Yamato Holdings n Excluding Yamato Holdings
Other
30 Yamato Holdings Co., ltd.

OrganizationAs of March 31, 2014
Yamato Transport Co., Ltd.
Yamato Global Express Co., Ltd.
Yamato (China) Transport Co., Ltd.
Okinawa Yamato Transport Co., Ltd.
Express Network Co., Ltd.
Yamato Dialog & Media Co., Ltd.
Yamato Transport (HK) Ltd.
Yamato Logistics Co., Ltd.
Yamato Global Logistics Japan Co., Ltd.
Yamato Multi-Maintenance Solutions Co., Ltd.
Yamato Packing Service Co., Ltd.
Yamato Packing Technology Institute Co., Ltd.
Konan Industry Co., Ltd.
Yamato Transport U.S.A., Inc.
Yamato Transport Europe B.V.
Yamato International Logistics (Hong Kong) Ltd.
Yamato International Logistics Co., Ltd.
Taiwan Yamato International Logistics Inc.
Yamato Transport (S) Pte. Ltd.
Yamato Transport (M) Sdn. Bhd.
Yamato Logistics India Pvt. Ltd.
ShanghaiWaiGaoQiaoBondedLogisticsZoneYamatoWarehouseCo.,Ltd.
Yamato Home Convenience Co., Ltd.
Yamato System Development Co., Ltd.
Yamato Web Solutions Co., Ltd.*2
Yamato Financial Co., Ltd.
Yamato Credit & Finance Co., Ltd.
Yamato Lease Co., Ltd.
Yamato Payment Service (HK) Ltd.
Yamato Autoworks Co., Ltd.
Yamato Autoworks Iwate Co., Ltd.
Yamato Autoworks Hokushinetsu Co., Ltd.
Yamato Autoworks Shikoku Co., Ltd.
Yamato Autoworks Okinawa Co., Ltd.
BoxCharter Co., Ltd.
Yamato Box Charter Co., Ltd.
Yamato•Staff•Supply Co., Ltd.
Yamato Management Service Co., Ltd.
Yamato Multi Charter Co., Ltd.
Kobe Yamato Transport Co., Ltd.
Swan Co., Ltd.
Delivery
BIZ-Logistics
Home Convenience
e-Business
Financial
Autoworks*1
Other
Consolidated subsidiaries
Unconsolidated subsidiaries
*1 “Autoworks” changed its segment name from “Truck Maintenance” starting from the fiscal year ended March 31, 2014.*2 Yamato Career Service Co., Ltd. in the e-Business was renamed Yamato Web Solutions Co., Ltd. on August 1, 2013.*3 From the fiscal year ending March 2015, Yamato Contact Service Co., Ltd. will be reclassified for inclusion under the Delivery Business from the e-Business unit.
Yamato Holdings Co., Ltd.
PT. Yamato Indonesia
Yamato Contact Service Co., Ltd.*3
Yamato Asia Pte Ltd.
31AnnuAl RepoRt 2014

Corporate Social Responsibility
The Yamato Group believes that its sustained growth is
largely contingent upon not only business profitability, but
also fair and proper management as a business group with
operations that require a high degree of social interaction.
With the interests of all stakeholders in mind, the
Group actively conducts Corporate Social Responsibility
(CSR) activities from the perspectives of safety, the envi-
ronment, and society, in line with the Yamato Group Cor-
porate Philosophy at the hear t of the Group’s business,
with the aim of fur ther becoming a company most loved
and trusted by society.
Safety
The Yamato Group, which uses public roads in carrying out
its business, believes ensuring the safety and security of
people from local communities is of paramount importance.
With a philosophy of “Safety First, Sales Second,” we
endeavor to drive safely and focus on measures to promote
safe transportation, and put respect for human lives as our
greatest priority at all times while undertaking duties.
Review of the Year Ended March 2014
Deploying See-T Navi in Delivery Vehicles
See-T Navi is a proprietary telematics navigation system
encouraging safe and environmentally friendly driving that
Yamato Transport developed and deployed in March 2010.
This system, which records an extensive array of driving
performance data, enables Yamato Transport sales drivers
to self-inspect their driving performance and make improve-
ments. The 246 Safety Instructors, safety specialists
posted nationwide, can use data from this system for indi-
vidual instruction, and the system has functioned as a
strong support for sales drivers and safe driving habits.
Constructing a Driver’s License Management System using
IC Card Licenses
Yamato Transport always conducts visual inspections of
documentation such as driver’s licenses before drivers
drive, but has also constructed a system using IT that
matches drivers with the details on their license and license
categories. Thorough compliance is supported by managing
driving duties from the IT aspect.
Customers
LocalResidentsShareholders
Partners Employees
ManagementPhilosophy
Corporate Stance
Employee Code of Conduct
Yamato Group Corporate Philosophy
PreceptsFounding Spirit
Diagram of Yamato Group Corporate Philosophy Changes in the Number of Low-Emission Vehicles
18,000
18,903
12,000
6,000
02009 2010 2011 2012 2013 2014
n Hybrid Carsn CNG Cars
n LPG Carsn Electric Vehicles
n Others
32 Yamato Holdings Co., ltd.

Holding Safe Driver Contests
Yamato Transport holds Driver Contests to further enhance
safety awareness and driving skills, not only in Japan, but
also overseas in Malaysia and Singapore with Yamato Trans-
port (M) Sdn. Bhd. and Yamato Transport (S) Pte. Ltd.
Maintaining Safety in Vehicles
Yamato Autoworks operates Superworks vehicle mainte-
nance factories open 24 hours a day, 365 days a year at 22
bases inside Japan, greatly improving work efficiency and
with more than 60% of maintenance operators possessing
vehicle inspection qualifications.
Environment
The Yamato Group has adopted the catchphrase of Necology
for the environmental preservation activities in which it
engages as a corporate social responsibility, and to ensure
individual employees are aware of the need to protect the
environment as they go about their daily duties. Packing,
carrying, and delivering during transport are a matter of
course, but Yamato takes a thoroughly ecological approach
to a variety of other initiatives to build an environmentally
friendly distribution system. Yamato provides these types of
products and services with the aim of working together with
communities to contribute to making a better society.
Review of the Year Ended March 2014
Reducing CO2 Emissions
The Yamato Group uses carts and trolleys to avoid using
vehicles for deliveries to the greatest possible extent and is
shifting toward low-emission vehicles when it does have to
use them. In the fiscal year ended March 2014, Yamato
Transport added approx. 21,000 low-emission vehicles,
making up 41.5% of the entire fleet.
Yamato Transport added 100 light commercial electric
vehicles to its fleet between 2011 and 2012 in coordina-
tion with local municipalities in districts associated with
the Future City Initiative and other progressive environ-
mental programs, and in districts requiring special envi-
ronmental measures, such as areas around World
Heritage sites.
The opening of more satellite centers reduces the deliv-
ery area assigned to each sales driver. This change not
only enables drivers to provide more detailed services to
each customer, but also helps to curb increases in the
number of vehicles required to keep pace with increased
parcel volume.
Yamato Transport is promoting the development of these
satellite centers, which enable the pickup and delivery of
parcels without the use of motor vehicles, apart from the
occasional mini-vehicle, mainly in urban districts and
densely populated residential areas.
Yamato Transport is also promoting a modal shift toward
railway and water-based transport, joint transport with other
companies, and other methods of efficient transport.
Kuroneko Yamato Environmental Classes
Environmental classes are held to teach children about the
importance of the environment. Yamato Transport held
241 classes in the year ended March 2014, attended by
20,700 children.
33AnnuAl RepoRt 2014

Society
The Yamato Group values the dialogue with each stake-
holder, is aware of the social responsibilities that it must
fulfill, and aims to be a company that achieves sustained
development together with society. It uses its business and
social contribution activities to solve issues local communi-
ties are facing.
Review of the year ended March 2014
Safety Classes for Children
We have held safety classes for children since 1998. Held
all over Japan, these classes seek to teach children ways to
protect themselves from traffic accidents. In the fiscal year
ended March 2014, classes were held on 2,013 occasions
and around 224,000 children participated. Classes were
held overseas as well.
Promoting CSV Entrenched in Communities
Based on the belief of Creating Shared Value (CSV), which
is the creation of values together with local communities
through business, joining with local governments across the
country in Project G (Government) the entire Yamato Group
promotes developments including support watching over the
elderly, shopping support, and emergency transport at
times of disaster. As of the end of June 2014, we had been
involved in a total number of 550 cases and concluded
agreements with 110 local governments.
The Music TA-Q-BIN Kuroneko Family Concert has been held
283 times and attended by over 410,000 people.
Recognized by the Ministry of Health, Labor and Welfare as
a Company Supporting Child-Raising
Certification was awarded to Yamato System Development
Co., Ltd. in fiscal 2012 and Yamato Transport and Yamato
Logistics Co., Ltd. in fiscal 2014.
Actively Employing People with Disabilities
The Yamato Group, primarily through the Yamato Welfare
Foundation, promotes various activities for the realization
of a society in which people with disabilities can enjoy the
world of work and the act of independently earning a living.
Such support for helping people with disabilities gain
their independence includes active employment at the
Swan Bakery, which produces and sells bread, and as
couriers for our Kuroneko Mail service. In addition, the
Yamato Welfare Foundation operates a support facility
where people with disabilities can receive training in voca-
tional skills and knowledge.
34 Yamato Holdings Co., ltd.
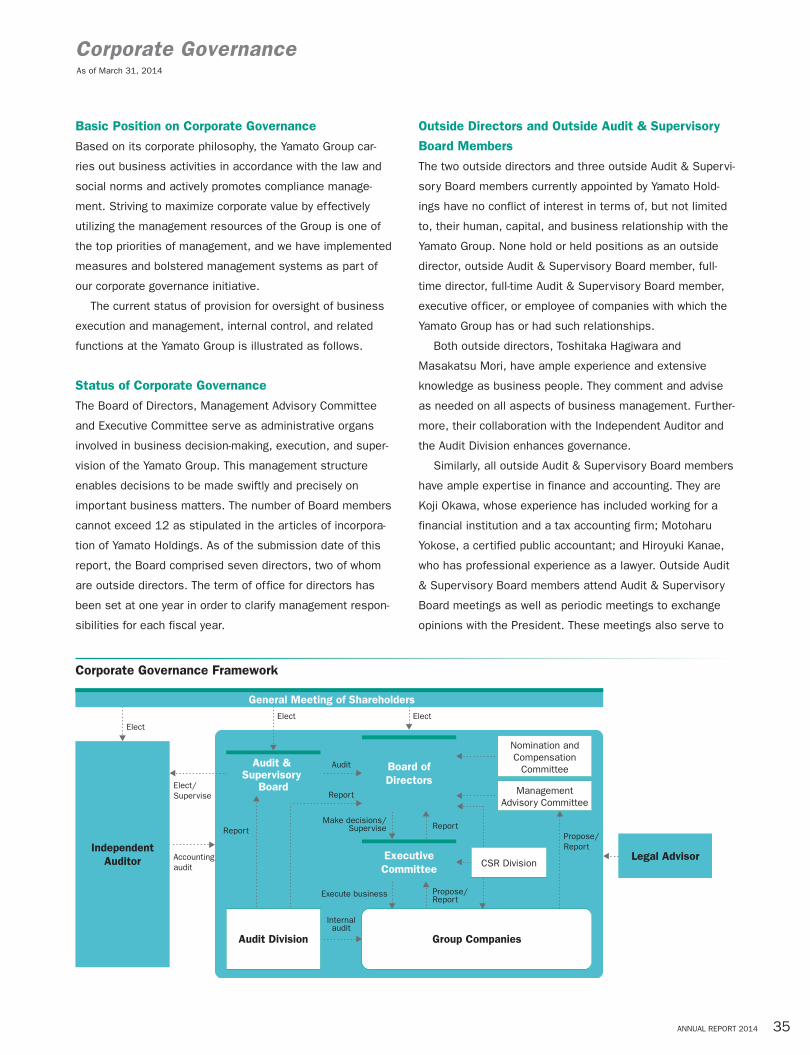
As of March 31, 2014
Corporate Governance
Basic Position on Corporate Governance
Based on its corporate philosophy, the Yamato Group car-
ries out business activities in accordance with the law and
social norms and actively promotes compliance manage-
ment. Striving to maximize corporate value by effectively
utilizing the management resources of the Group is one of
the top priorities of management, and we have implemented
measures and bolstered management systems as part of
our corporate governance initiative.
The current status of provision for oversight of business
execution and management, internal control, and related
functions at the Yamato Group is illustrated as follows.
Status of Corporate Governance
The Board of Directors, Management Advisory Committee
and Executive Committee serve as administrative organs
involved in business decision-making, execution, and super-
vision of the Yamato Group. This management structure
enables decisions to be made swiftly and precisely on
important business matters. The number of Board members
cannot exceed 12 as stipulated in the articles of incorpora-
tion of Yamato Holdings. As of the submission date of this
report, the Board comprised seven directors, two of whom
are outside directors. The term of office for directors has
been set at one year in order to clarify management respon-
sibilities for each fiscal year.
Outside Directors and Outside Audit & Supervisory
Board Members
The two outside directors and three outside Audit & Supervi-
sory Board members currently appointed by Yamato Hold-
ings have no conflict of interest in terms of, but not limited
to, their human, capital, and business relationship with the
Yamato Group. None hold or held positions as an outside
director, outside Audit & Supervisory Board member, full-
time director, full-time Audit & Supervisory Board member,
executive officer, or employee of companies with which the
Yamato Group has or had such relationships.
Both outside directors, Toshitaka Hagiwara and
Masakatsu Mori, have ample experience and extensive
knowledge as business people. They comment and advise
as needed on all aspects of business management. Further-
more, their collaboration with the Independent Auditor and
the Audit Division enhances governance.
Similarly, all outside Audit & Supervisory Board members
have ample expertise in finance and accounting. They are
Koji Okawa, whose experience has included working for a
financial institution and a tax accounting firm; Motoharu
Yokose, a certified public accountant; and Hiroyuki Kanae,
who has professional experience as a lawyer. Outside Audit
& Supervisory Board members attend Audit & Supervisory
Board meetings as well as periodic meetings to exchange
opinions with the President. These meetings also serve to
ElectElect Elect
Elect/Supervise
Accounting audit
Audit & Supervisory
Board
Report
Audit Division
Audit
Report
Report
Board ofDirectors
Nomination andCompensation
Committee
ManagementAdvisory Committee
Make decisions/Supervise
ExecutiveCommittee
Execute business
Propose/Report
Propose/Report
CSR Division
Internalaudit
Legal Advisor
Group Companies
General Meeting of Shareholders
IndependentAuditor
Corporate Governance Framework
35AnnuAl RepoRt 2014

confirm the status of directors’ execution of duties, by
means of including questions regarding management policy.
To ensure objective checks of management, two of the
seven directors are currently outside directors. This configu-
ration allows the outside directors to adequately fulfill their
appointed function. Similarly, three of the four Audit &
Supervisory Board members are outside Audit & Supervi-
sory Board members to reinforce supervision of business
execution. This configuration, too, enables the outside
members to adequately fulfill their appointed function.
The Group maintains a policy of satisfying the indepen-
dence criteria of Tokyo Stock Exchange, Inc. when choosing
outside directors and Audit & Supervisory Board members.
The Group has notified the Tokyo Stock Exchange that all
the above outside directors and Audit & Supervisory Board
members are independent, as required.
Full-time Audit & Supervisory Board member Hiroshi
Kawada and Audit & Supervisory Board member Koji Okawa
resigned, and Kazuko Takahara was newly appointed as a
full-time Audit & Supervisory Board member at the conclusion
of the Ordinary General Meeting of Shareholders on June
24, 2014. Consequently, the Company’s Audit & Supervisory
Board became comprised of three members, two of which
are outside Audit & Supervisory Board members.
Status of Internal Audits, Audits by Audit &
Supervisory Board Members, and Accounting Audits
The Audit & Supervisory Board is made up of one full-time
Audit & Supervisory Board member and three outside Audit &
Supervisory Board members. Audit & Supervisory Board
members attend meetings of the Board of Directors and
other important meetings to audit the execution of duties by
the directors, and otherwise endeavor to improve the
soundness of management and the trust of the public. A
full-time staff member has been appointed to assist the Audit
& Supervisory Board members to put in place a framework
that enables the Audit & Supervisory Board members to
smoothly carry out their functions. In addition, Group Audi-
tors’ Liaison Meetings are held periodically for the full-time
Audit & Supervisory Board members of the major operating
companies to confer on auditing policies and procedures,
exchange information, and otherwise enhance collaboration.
Meetings with internal auditors are also held periodically to
exchange information.
Internal audits are performed by an 11-member team that
operates independently from any other Group organ. Together
with the 102 employees who conduct internal audits for
Group companies, the Yamato Group has a total of 113 inter-
nal auditors who check whether the business and affairs of
the Group as a whole are being carried out appropriately and
efficiently based on the annual auditing plan. A structure is in
place under which results are reported to the Board of Direc-
tors and the Audit & Supervisory Board. Also, the Group
Internal Auditing Committee meets regularly with the internal
auditors of the operating companies to confer on problems
and propose improvements based on auditing policies and
audit results. At the same time, management collaborates
with Group companies’ internal control divisions to improve
and build systems to validate internal controls.
As the Group’s appointed Independent Auditor, Deloitte
Touche Tohmatsu LLC holds regular meetings with Audit &
Supervisory Board members and conducts effective account-
ing audits. Accounting audits are performed by two certified
public accountants, Yoshiaki Kitamura and Kazuhide Kobori,
assisted by another 9 certified public accountants and 20
other staff members.
Compensation of Directors and Audit & Supervisory Board Members
Details of Compensation for Directors and Audit & Supervisory Board Members
Director and Audit & Supervisory Board member category
Total compensation and other remuneration
(Millions of Yen)
Total by compensation and remuneration category
(Millions of Yen)
Headcount of eligible directors and Audit & Supervisory Board
membersBasic compensation
Directors (excluding outside directors) 218 218 5
Audit & Supervisory Board members (excluding outside Audit & Supervisory Board members) 20 20 1
Outside directors and Audit & Supervisory Board members 35 35 6
36 Yamato Holdings Co., ltd.
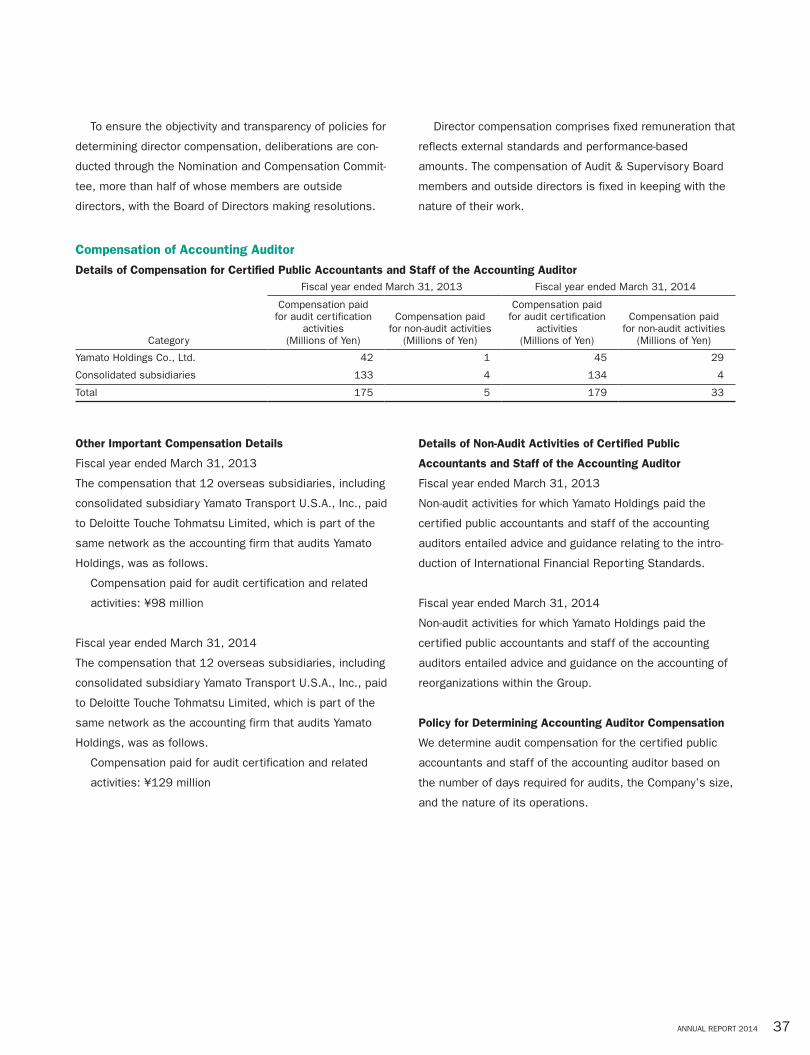
To ensure the objectivity and transparency of policies for
determining director compensation, deliberations are con-
ducted through the Nomination and Compensation Commit-
tee, more than half of whose members are outside
directors, with the Board of Directors making resolutions.
Director compensation comprises fixed remuneration that
reflects external standards and performance-based
amounts. The compensation of Audit & Supervisory Board
members and outside directors is fixed in keeping with the
nature of their work.
Compensation of Accounting Auditor
Details of Compensation for Certified Public Accountants and Staff of the Accounting Auditor
Category
Fiscal year ended March 31, 2013 Fiscal year ended March 31, 2014
Compensation paid for audit certification
activities (Millions of Yen)
Compensation paid for non-audit activities
(Millions of Yen)
Compensation paid for audit certification
activities (Millions of Yen)
Compensation paid for non-audit activities
(Millions of Yen)
Yamato Holdings Co., Ltd. 42 1 45 29
Consolidated subsidiaries 133 4 134 4
Total 175 5 179 33
Other Important Compensation Details
Fiscal year ended March 31, 2013
The compensation that 12 overseas subsidiaries, including
consolidated subsidiary Yamato Transport U.S.A., Inc., paid
to Deloitte Touche Tohmatsu Limited, which is part of the
same network as the accounting firm that audits Yamato
Holdings, was as follows.
Compensation paid for audit certification and related
activities: ¥98 million
Fiscal year ended March 31, 2014
The compensation that 12 overseas subsidiaries, including
consolidated subsidiary Yamato Transport U.S.A., Inc., paid
to Deloitte Touche Tohmatsu Limited, which is part of the
same network as the accounting firm that audits Yamato
Holdings, was as follows.
Compensation paid for audit certification and related
activities: ¥129 million
Details of Non-Audit Activities of Certified Public
Accountants and Staff of the Accounting Auditor
Fiscal year ended March 31, 2013
Non-audit activities for which Yamato Holdings paid the
certified public accountants and staff of the accounting
auditors entailed advice and guidance relating to the intro-
duction of International Financial Reporting Standards.
Fiscal year ended March 31, 2014
Non-audit activities for which Yamato Holdings paid the
certified public accountants and staff of the accounting
auditors entailed advice and guidance on the accounting of
reorganizations within the Group.
Policy for Determining Accounting Auditor Compensation
We determine audit compensation for the certified public
accountants and staff of the accounting auditor based on
the number of days required for audits, the Company’s size,
and the nature of its operations.
37AnnuAl RepoRt 2014

Directors
Outside Directors Full-time Audit & SupervisoryBoard Member
Executive Officers
Executive Officers
Directors, Audit & Supervisory Board Members, and Executive OfficersAs of June 24, 2014
Kaoru SetoRepresentative Director and Chairman
Toshitaka Hagiwara
Toshizo Kurisu
Hideo Tanzawa
Makoto KigawaRepresentative Director, President and Executive Officer
Masakatsu Mori
Hitoshi Kanamori
Richard Chua Khing Seng
Haruo KandaRepresentative Director, Senior Executive Officer
Kazuko Takahara
Atsushi Ichino
38 Yamato Holdings Co., ltd.

Audit & Supervisory Board Members Managing Executive Officer
Kenji MinakiDirector and Managing Executive Officer
Motoharu Yokose
Keishirou Sasaki
Masaki YamauchiDirector and Executive Officer
Hiroyuki Kanae
Yoshihiko Hoshino
Kenichi Shibasaki
Tadao Mikami
39AnnuAl RepoRt 2014
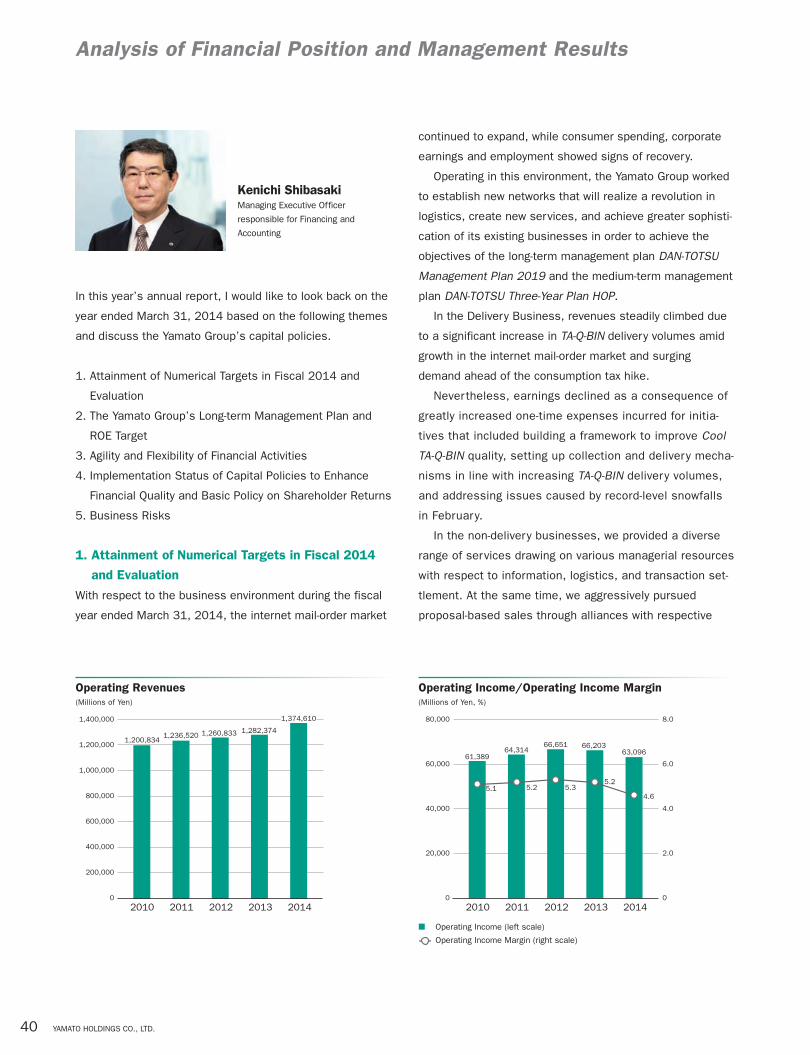
Analysis of Financial Position and Management Results
In this year’s annual report, I would like to look back on the
year ended March 31, 2014 based on the following themes
and discuss the Yamato Group’s capital policies.
1. Attainment of Numerical Targets in Fiscal 2014 and
Evaluation
2. The Yamato Group’s Long-term Management Plan and
ROE Target
3. Agility and Flexibility of Financial Activities
4. Implementation Status of Capital Policies to Enhance
FinancialQualityandBasicPolicyonShareholderReturns
5. Business Risks
1. Attainment of Numerical Targets in Fiscal 2014
and Evaluation
With respect to the business environment during the fiscal
year ended March 31, 2014, the internet mail-order market
Operating Revenues(Millions of Yen)
1,400,000
1,200,000
1,000,000
800,000
600,000
400,000
200,000
0
1,200,8341,236,520 1,260,833 1,282,374
1,374,610
20112010 2012 20142013
Operating Income/Operating Income Margin(Millions of Yen, %)
n Operating Income (left scale)
n Operating Income Margin (right scale)
80,000
60,000
40,000
20,000
0
8.0
6.0
4.0
2.0
0
61,389
5.1
64,31466,651 66,203
63,096
5.25.2
4.65.3
20112010 2012 20142013
continued to expand, while consumer spending, corporate
earnings and employment showed signs of recovery.
Operating in this environment, the Yamato Group worked
to establish new networks that will realize a revolution in
logistics, create new services, and achieve greater sophisti-
cation of its existing businesses in order to achieve the
objectives of the long-term management plan DAN-TOTSU
Management Plan 2019 and the medium-term management
plan DAN-TOTSU Three-Year Plan HOP.
In the Delivery Business, revenues steadily climbed due
to a significant increase in TA-Q-BIN delivery volumes amid
growth in the internet mail-order market and surging
demand ahead of the consumption tax hike.
Nevertheless, earnings declined as a consequence of
greatly increased one-time expenses incurred for initia-
tives that included building a framework to improve Cool
TA-Q-BIN quality, setting up collection and delivery mecha-
nisms in line with increasing TA-Q-BIN delivery volumes,
and addressing issues caused by record-level snowfalls
in February.
In the non-delivery businesses, we provided a diverse
range of services drawing on various managerial resources
with respect to information, logistics, and transaction set-
tlement. At the same time, we aggressively pursued
proposal-based sales through alliances with respective
Kenichi ShibasakiManaging Executive Officer
responsible for Financing and
Accounting
40 Yamato Holdings Co., ltd.

Group companies, with the aim of helping corporate clients
find solutions to management challenges.
As a result, operating revenues increased 7.2% year on
year to ¥1,374,610 million, while operating income
decreased 4.7% to ¥63,096 million.
Net income per share rose 0.5% as a result of the
shares we bought back in January 2014.
ROE was 6.4%, a decline from the previous fiscal year.
We fell short of achieving the targets in our medium-term
management plan DAN-TOTSU Three-Year Plan HOP. That
said, our cost structure reforms aimed primarily at revolu-
tionizing the Yamato Group’s logistics network and parcel
pickup and delivery system were successful at strategically
capturing changes in the market place. In my analysis, we
managed in the year under review to build a foundation for
keeping our long-term management plan, ending March
2020, on track and significantly differentiating the Yamato
Group from our competitors.
Going forward, we are aiming for a record ¥70.0 billion in
consolidated operating income in the year ending March
2015. To this end, we will implement pricing strategies, by
first effectively raising our unit price by strictly sorting the
TA-Q-BIN parcels we accept according to size, to ensure that
the Group is working together to provide customers high
added value. At the same time, cost structure reforms for
n Net Income (left scale)
n Net Margin (right scale)
Net Income/Net Margin(Millions of Yen, %)
40,000
30,000
20,000
10,000
0
4.0
3.0
2.0
1.0
0
32,282 33,208
19,787
2.7 2.7
1.6
35,144
2.7
34,776
2.5
20112010 2012 20142013
revolutionizing our logistics network and parcel pickup and
delivery system will be expanded to include other parts of
Asia, as we continue to apply strategies for differentiating
the Yamato Group from the competition.
2. The Yamato Group’s Long-term Management Plan
and ROE Target
The management philosophy of the Yamato Group is to help
“enrich our society by enhancing the social infrastructure of
TA-Q-BIN networks, creating more convenient services for
comfortable lifestyles and developing an innovative logistics
system.” The entire Yamato Group is making a concerted
effort to realize this philosophy.
To this end, in January 2011, we formulated a long-term
management plan, DAN-TOTSU Management Plan 2019,
that’s final year is fiscal 2020. Guided by this plan, we are
making every effort to become a leading provider of distri-
bution and lifestyle support solution services in Asia by the
year ending March 2020, when we will celebrate the 100th
anniversary of our founding.
This long-term management plan aims to increase satis-
faction of shareholders, customers, the public, employees
and all other stakeholders.
We recognize that the keys for success are to increase
the profitability by steadily executing our business plan,
n Cash Flows from Operating Activities
n Cash Flows from Investing Activities
n Free Cash Flows* Free Cash Flows = Cash Flows from Operating Activities
+ Cash Flows from Investing Activities
Operating and Investing Cash Flows/Free Cash Flows(Millions of Yen)
100,000
60,000
80,000
40,000
20,000
0
(40,000)
(20,000)
(80,000)
(60,000)
87,899
71,843 73,95077,064 80,075
36,22030,750
23,410
15,139
42,821
(41,093)(50,540)
(64,936)
(51,679)
(34,243)
20112010 2012 20142013
41AnnuAl RepoRt 2014

and also to raise capital efficiency by implementing capital
policies that take advantage of our solid financial base.
And we must tie these improvements to a further increase
in corporate value.
From this perspective, we consider ROE to be a key
benchmark to keep in mind as we seek to raise shareholder
value, which we plan to attain by combining our business
and financial strategies.
We aim to raise ROE to over 9.0% in the year ending
March 2017, the final year of the medium-term management
plan DAN-TOTSU Three-Year Plan STEP, and to over 11.0% in
the year ending March 2020, the final year of the long-term
management plan DAN-TOTSU Management Plan 2019.
3. Agility and Flexibility of Financial Activities
The Yamato Group consistently and continually generates
between ¥70.0 billion and ¥80.0 billion in cash annually to
maintain the agility and flexibility of financial activities while
sufficiently covering ordinary expenditures.
As of March 2014, Yamato Holdings has received the
following credit rating from Rating and Investment Informa-
tion, Inc. (R&I):
R&I AA–
n ROA
n ROE
ROA/ROE(%)
Interest-Bearing Liabilities/Equity(Millions of Yen)
8.00
6.00
4.00
2.00
0
3.7 3.7 3.83.8
3.5
6.46.5 6.5 6.7
2.2
20112010 2012 20142013
The Yamato Group will strive to remain aware of capital
costs, while at the same time maintain the existing credit
rating in order to facilitate smooth capital procurement.
4. Implementation Status of Capital Policies to
Enhance Financial Quality and Basic Policy on
Shareholder Returns
The Yamato Group seeks to provide returns to shareholders
based on the return to shareholders ratio, a combination of
both dividends and share buybacks.
We have a basic policy of paying dividends with a target
consolidated dividend payout ratio of 30% of consolidated
net income.
During the fiscal year ended March 31, 2014, we bought
back about ¥10.0 billion in shares, and retired 6.7 million
shares of treasury stock to allay concerns for the dilution
of equity.
For the fiscal year ended March 31, 2014, we paid divi-
dends of ¥24 per share, ¥1 higher than in the previous
fiscal year. The return to shareholders ratio, a combination
of both dividends and share buybacks, was over 50% for the
fiscal year ended March 31, 2014.
For the fiscal year ending March 31, 2015, we will take
our earnings performance into consideration as we aim for
a consolidated dividend payout ratio of 30%.
n Interest-Bearing Liabilities
n Equity
600,000
500,000
400,000
300,000
200,000
100,000
0
523,473 524,505 523,784
81,598101,373 92,780
542,915560,172
93,781 107,843
20112010 2012 20142013
42 Yamato Holdings Co., ltd.

While increasing our profitability by steadily executing our
business plan, we will work to raise capital efficiency by
implementing capital policies that take advantage of our
solid financial base. And we will strive to tie these improve-
ments to a further increase in corporate value.
5. Business Risks
The Yamato Group is fully aware of the potential impact of
the following risks on its business performance and finan-
cial position, and is accordingly managing these risks.
The following risks are solely within the scope of projec-
tions possible from information available at the end of
March 2014, and may not encompass all of the risks
related to the business of the Yamato Group.
(1) Legal Regulations
The risk of revenues decreasing as a result of restric-
tions on operations, and expenses increasing as a
result of compliance with laws and regulations
(2) High Reliance on the TA-Q-BIN Business for Operating
Revenues
The risk of delivery volumes and unit prices declining as
a result of a change in environment surrounding the
TA-Q-Bin Business
(3) Securing Human Resources
The risk of growth slowing as a result of difficulty recruit-
ing high-quality human resources
(4) Loss of Business Expertise Caused by Personnel Leav-
ing the Company
The risk of competitive advantage declining as a result
of an outflow of business expertise from the Company
(5) Decline in Trust in the Company
The risk of society’s trust declining as a result of a dete-
rioration in service quality, or accidents involving
damage or loss of entrusted packages
(6) Leak of Customer Information
The risk of society’s trust declining as a result of a leak-
age of customer information to the outside
(7) Loss of Social Trust Due to Major Traffic Accident and
Administrative Action
The risk of society’s trust declining as a result of a
major traffic accident, and business suspension as a
result of government sanction
(8) Official Regulation Due to Environmental Issues
The risk of incurring expenses as a result of complying
with environmental regulations more rigorous than
envisioned
(9) Natural Disasters or Power Outages
The risk of business being suspended as a result of an
unexpected major natural disaster or power outage
(10) Computer Viruses and Criminal Hacking Activity
The risk of computer systems or operations being
partly suspended as a result of infection by a com-
puter virus or hacking.
(11) International Developments or Terrorism
The risk of business being suspended in certain
regions as a result of terrorism, warfare or outbreak of
a new contagious disease.
(12) Credit Management Costs and Interest Rate Fluctua-
tions
The risk of credit management costs increasing as a
result of economic trends and other impacts, and fund
procurement costs increasing as a result of a rise in
long-term interest rates.
We ask our shareholders and other investors for their
ongoing encouragement and support.
43AnnuAl RepoRt 2014

44 Yamato Holdings Co., ltd.
Millions of Yen
Thousands of U.S. Dollars
(Note 1)
ASSETS 2014 2013 2014
CURRENT ASSETS:
Cash and cash equivalents (Notes 2.d and 13) ¥ 220,148 ¥ 213,619 $ 2,139,017
Notes and accounts receivable (Note 13):
Trade 188,145 163,790 1,828,070
Installment (Note 3) 39,480 37,456 383,605
Lease (Note 12) 35,329 22,377 343,265
Allowance for doubtful accounts (1,591) (1,654) (15,461)
Inventories (Note 4) 3,237 3,601 31,456
Deferred tax assets (Note 11) 16,548 16,647 160,782
Prepaid expenses and other current assets 26,063 30,572 253,241
Total current assets 527,359 486,408 5,123,975
PROPERTY, PLANT AND EQUIPMENT—At cost:
Land 188,344 187,108 1,830,001
Buildings and structures 329,289 281,096 3,199,464
Vehicles 187,882 182,679 1,825,512
Leased assets (Note 12) 23,944 23,549 232,649
Machinery and equipment 121,422 108,493 1,179,777
Construction in progress 7,895 35,892 76,708
Others 11,662 9,432 113,309
Total 870,438 828,249 8,457,420
Accumulated depreciation (453,310) (445,092) (4,404,487)
Net property, plant and equipment 417,128 383,157 4,052,933
INVESTMENTS AND OTHER ASSETS:
Investment securities (Notes 5 and 13) 25,577 21,787 248,518
Investments in and advances to unconsolidated subsidiaries and affiliates, net of valuation allowance of ¥222 million in 2013 644 838 6,260
Long-term loans 961 915 9,334
Software 12,343 12,389 119,925
Lease deposits 18,468 19,373 179,445
Deferred tax assets (Note 11) 21,687 18,515 210,713
Other assets (Note 8) 7,967 6,771 77,406
Total investments and other assets 87,647 80,588 851,601
TOTAL ¥1,032,134 ¥ 950,153 $10,028,509
See notes to consolidated financial statements.
March 31, 2014
Consolidated Balance Sheet

45AnnuAl RepoRt 2014
Millions of Yen
Thousands of U.S. Dollars
(Note 1)
LIABILITIES AND EQUITY 2014 2013 2014
CURRENT LIABILITIES:
Short-term bank loans (Notes 7 and 13) ¥ 19,256 ¥ 15,704 $ 187,092
Current portion of long-term debt (Notes 7, 13 and 14) 21,941 18,825 213,188
Notes and accounts payable (Note 13):
Trade 172,463 138,288 1,675,702
Other 21,942 15,283 213,193
Income taxes payable 20,908 22,442 203,148
Employees’ savings deposits 4,723 4,453 45,888
Accrued expenses 61,535 57,344 597,892
Deferred profit on installment sales (Notes 3 and 13) 5,349 5,006 51,974
Other current liabilities (Note 9) 19,243 22,195 186,972
Total current liabilities 347,360 299,540 3,375,049
LONG-TERM LIABILITIES:
Long-term debt (Notes 7, 13 and 14) 66,646 59,252 647,552
Long-term accounts payable 1,243 2,414 12,078
Liability for employees’ retirement benefits (Notes 2.j and 8) 47,224 38,178 458,843
Deferred tax liabilities (Note 11) 1,808 459 17,568
Other long-term liabilities (Note 9) 7,681 7,395 74,626
Total long-term liabilities 124,602 107,698 1,210,667
COMMITMENTS LIABILITIES (Note 12)
EQUITY (Notes 10 and 18):
Common stock—authorized, 1,787,541,000 shares in 2014 and 2013; issued, 454,684,992 shares in 2014 and 461,345,492 shares in 2013 127,235 127,235 1,236,249
Capital surplus 100,863 111,291 980,019
Retained earnings 371,965 347,358 3,614,120
Treasury stock—at cost, 35,742,057 shares in 2014 and 37,631,001 shares in 2013 (56,079) (56,496) (544,884)
Accumulated other comprehensive income:
Unrealized gain on available-for-sale securities 8,770 6,095 85,211
Foreign currency translation adjustments 342 (1,032) 3,328
Remeasurements of defined employees’ retirement benefit plans (Notes 2.j and 8) (1,717) (16,683)
Total 551,379 534,451 5,357,360
Minority interests 8,793 8,464 85,433
Total equity 560,172 542,915 5,442,793
TOTAL ¥1,032,134 ¥950,153 $10,028,509
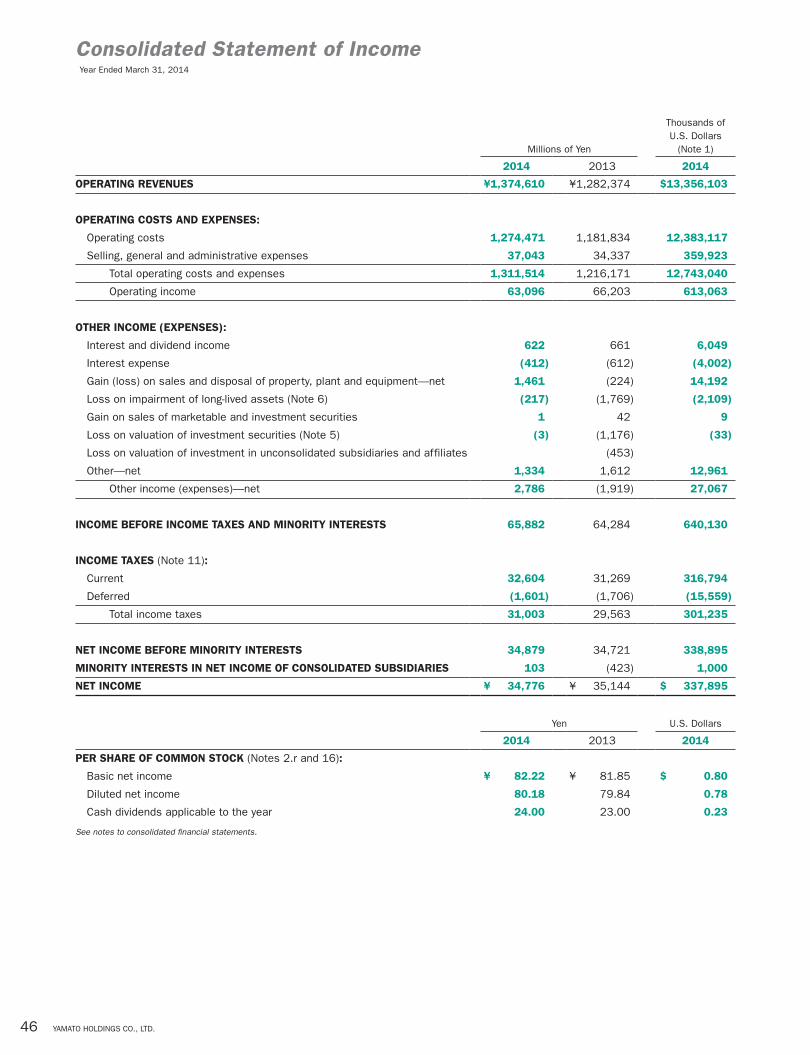
46 Yamato Holdings Co., ltd.
Millions of Yen
Thousands of U.S. Dollars
(Note 1)
2014 2013 2014
OPERATING REVENUES ¥1,374,610 ¥1,282,374 $13,356,103
OPERATING COSTS AND EXPENSES:
Operating costs 1,274,471 1,181,834 12,383,117
Selling, general and administrative expenses 37,043 34,337 359,923
Total operating costs and expenses 1,311,514 1,216,171 12,743,040
Operating income 63,096 66,203 613,063
OTHER INCOME (EXPENSES):
Interest and dividend income 622 661 6,049
Interest expense (412) (612) (4,002)
Gain (loss) on sales and disposal of property, plant and equipment—net 1,461 (224) 14,192
Loss on impairment of long-lived assets (Note 6) (217) (1,769) (2,109)
Gain on sales of marketable and investment securities 1 42 9
Loss on valuation of investment securities (Note 5) (3) (1,176) (33)
Loss on valuation of investment in unconsolidated subsidiaries and affiliates (453)
Other—net 1,334 1,612 12,961
Other income (expenses)—net 2,786 (1,919) 27,067
INCOME BEFORE INCOME TAXES AND MINORITY INTERESTS 65,882 64,284 640,130
INCOME TAXES (Note 11):
Current 32,604 31,269 316,794
Deferred (1,601) (1,706) (15,559)
Total income taxes 31,003 29,563 301,235
NET INCOME BEFORE MINORITY INTERESTS 34,879 34,721 338,895
MINORITY INTERESTS IN NET INCOME OF CONSOLIDATED SUBSIDIARIES 103 (423) 1,000
NET INCOME ¥ 34,776 ¥ 35,144 $ 337,895
Yen U.S. Dollars
2014 2013 2014
PER SHARE OF COMMON STOCK (Notes 2.r and 16):
Basic net income ¥ 82.22 ¥ 81.85 $ 0.80
Diluted net income 80.18 79.84 0.78
Cash dividends applicable to the year 24.00 23.00 0.23
See notes to consolidated financial statements.
Year Ended March 31, 2014
Consolidated Statement of Income

47AnnuAl RepoRt 2014
Millions of Yen
Thousands of U.S. Dollars
(Note 1)
2014 2013 2014
NET INCOME BEFORE MINORITY INTERESTS ¥34,879 ¥34,721 $338,895
OTHER COMPREHENSIVE INCOME (Note 15):
Unrealized gain on available-for-sale securities 2,938 3,199 28,548
Foreign currency translation adjustments 1,408 1,035 13,682
Total other comprehensive income 4,346 4,234 42,230
COMPREHENSIVE INCOME ¥39,225 ¥38,955 $381,125
TOTAL COMPREHENSIVE INCOME ATTRIBUTABLE TO:
Owners of the parent ¥38,825 ¥39,210 $377,237
Minority interests 400 (255) 3,888
See notes to consolidated financial statements.
Year Ended March 31, 2014
Consolidated Statement of Comprehensive Income

48 Yamato Holdings Co., ltd.
Thousands Millions of Yen
Accumulated Other Comprehensive Income
Outstanding Number of Shares of Common
StockCommon
StockCapital Surplus
Retained Earnings
Treasury Stock
Unrealized Gain on
Available-for-Sale
Securities
Foreign Currency
Translation Adjustments
Remeasure-ments of Defined
Employees’ Retirement
Benefit Plans Total
Minority Interests
Total Equity
BALANCE, APRIL 1, 2012 430,147 ¥127,235 ¥121,314 ¥321,862 ¥(56,514) ¥2,976 ¥(1,877) ¥ – ¥514,996 ¥8,788 ¥523,784
Net income 35,144 35,144 35,144
Cash dividends, ¥22 per share (9,463) (9,463) (9,463)
Adjustment of retained earnings for
changes in the scope of consolidation (185) (185) (185)
Purchase of treasury stock (6,433) (10,006) (10,006) (10,006)
Disposal of treasury stock 1 1 1
Retirement of treasury stock (10,023) 10,023
Net change in the year 3,119 845 3,964 (324) 3,640
BALANCE, MARCH 31, 2013 423,714 127,235 111,291 347,358 (56,496) 6,095 (1,032) – 534,451 8,464 542,915
Net income 34,776 34,776 34,776
Cash dividends, ¥24 per share (10,169) (10,169) (10,169)
Purchase of treasury stock (4,771) (10,012) (10,012) (10,012)
Disposal of treasury stock 1 1 1
Retirement of treasury stock (10,428) 10,428
Net change in the year 2,675 1,374 (1,717) 2,332 329 2,661
BALANCE, MARCH 31, 2014 418,943 ¥127,235 ¥100,863 ¥371,965 ¥(56,079) ¥8,770 ¥ 342 ¥(1,717) ¥551,379 ¥8,793 ¥560,172
Thousands of U.S. Dollars (Note 1)
Accumulated Other Comprehensive Income
Common Stock
Capital Surplus
Retained Earnings
Treasury Stock
Unrealized Gain on
Available-for-Sale
Securities
Foreign Currency
Translation Adjustments
Remeasure-ments of Defined
Employees’ Retirement
Benefit Plans Total
Minority Interests
Total Equity
BALANCE, MARCH 31, 2013 $1,236,249 $1,081,331 $3,375,031 $(548,928) $59,226 $(10,028) $ – $5,192,881 $82,233 $5,275,114
Net income 337,895 337,895 337,895
Cash dividends, $0.23 per share (98,806) (98,806) (98,806)
Purchase of treasury stock (97,275) (97,275) (97,275)
Disposal of treasury stock 2 5 7 7
Retirement of treasury stock (101,314) 101,314
Net change in the year 25,985 13,356 (16,683) 22,658 3,200 25,858
BALANCE, MARCH 31, 2014 $1,236,249 $ 980,019 $3,614,120 $(544,884) $85,211 $ 3,328 $(16,683) $5,357,360 $85,433 $5,442,793
See notes to consolidated financial statements.
Year Ended March 31, 2014
Consolidated Statement of Changes in Equity

49AnnuAl RepoRt 2014
Millions of Yen
Thousands of U.S. Dollars
(Note 1)
2014 2013 2014
OPERATING ACTIVITIES:
Income before income taxes and minority interests ¥ 65,882 ¥ 64,284 $ 640,130
Adjustments for:
Income taxes—paid (35,437) (28,078) (344,320)
Depreciation and amortization 42,284 37,944 410,842
(Gain) loss on sales and disposal of property, plant and equipment—net (1,461) 224 (14,192)
Loss on impairment of long-lived assets 217 1,769 2,109
Gain on sales of marketable and investment securities (1) (42) (9)
Loss on valuation of investment securities 3 1,176 33
Donations concerning restoration support paid (1,148)
Changes in assets and liabilities, net of effects from newly consolidated subsidiaries:
Increase in notes and accounts receivable (38,786) (10,526) (376,860)
Decrease in inventories 401 87 3,898
Increase in notes and accounts payable 33,411 8,406 324,630
Increase in liability for employees’ retirement benefits 6,278 6,442 61,003
Other—net 7,284 (6,588) 70,771
Total adjustments 14,193 9,666 137,905
Net cash provided by operating activities 80,075 73,950 778,035
INVESTING ACTIVITIES:
Proceeds from sale of property, plant and equipment 4,238 582 41,176
Purchases of property, plant and equipment (65,212) (47,099) (633,617)
Proceeds from sales of marketable and investment securities 2 52 21
Purchases of marketable and investment securities (11) (12) (106)
Decrease in investments in and advances to unconsolidated subsidiaries and affiliates 375 511 3,646
Collection of loans 1,120 881 10,878
Payment of loans (1,154) (847) (11,210)
Other (4,294) (4,608) (41,724)
Net cash used in investing activities (64,936) (50,540) (630,936)
FINANCING ACTIVITIES:
Proceeds from short-term bank loans 80,798 68,949 785,052
Repayments of short-term debt (82,478) (63,955) (801,383)
Proceeds from long-term debt 27,007 5,538 262,411
Repayments of long-term debt (14,145) (12,199) (137,442)
Dividends paid (10,235) (9,528) (99,449)
Purchase of treasury stock—net (10,013) (10,008) (97,285)
Other 33 181 325
Net cash used in financing activities (9,033) (21,022) (87,771)
FOREIGN CURRENCY TRANSLATION ADJUSTMENTS ON CASH AND CASH EQUIVALENTS 648 457 6,294
NET INCREASE IN CASH AND CASH EQUIVALENTS 6,754 2,845 65,622
CASH AND CASH EQUIVALENTS OF NEWLY CONSOLIDATED SUBSIDIARIES, BEGINNING OF YEAR 1,403
CASH AND CASH EQUIVALENTS, BEGINNING OF YEAR 212,641 208,393 2,066,084
CASH AND CASH EQUIVALENTS, END OF YEAR (Note 2.d) ¥219,395 ¥212,641 $2,131,706
See notes to consolidated financial statements.
Year Ended March 31, 2014
Consolidated Statement of Cash Flows
50 Yamato Holdings Co., ltd.
1. BASIS OF PRESENTATION OF CONSOLIDATED FINANCIAL STATEMENTS
The accompanying consolidated financial statements have been prepared in accordance with the provisions set forth in the
Japanese Financial Instruments and Exchange Act and its related accounting regulations, and in accordance with accounting prin-
ciples generally accepted in Japan (“Japanese GAAP”), which are different in certain respects as to the application and disclosure
requirements of International Financial Reporting Standards.
In preparing these consolidated financial statements, certain reclassifications and rearrangements have been made to the con-
solidated financial statements issued domestically in order to present them in a form which is more familiar to readers outside
Japan. In addition, certain reclassifications and rearrangements have been made in the 2013 consolidated financial statements to
conform them to the classifications and presentations used in 2014.
The consolidated financial statements are stated in Japanese yen, the currency of the country in which Yamato Holdings Co., Ltd.
(the “Company”) is incorporated and operates. The translations of Japanese yen amounts into U.S. dollar amounts are included
solely for the convenience of readers outside Japan and have been made at the rate of ¥102.92 to $1, the approximate rate of
exchange at March 31, 2014. Such translations should not be construed as representations that the Japanese yen amounts could
be converted into U.S. dollars at that or any other rate.
2. SUMMARY OF SIGNIFICANT ACCOUNTING POLICIES
a. Consolidation—The consolidated financial statements as of March 31, 2014, include the accounts of the Company and its 41
significant (40 in 2013) subsidiaries (together, the “Group”).
Under the control or influence concept, those companies in which the Company, directly or indirectly, is able to exercise control
over operations are fully consolidated, and those companies over which the Group has the ability to exercise significant influence are
accounted for by the equity method.
The unconsolidated subsidiaries, whose combined assets, net sales, net income and retained earnings in the aggregate are not
significant to the consolidated financial statements, have not been consolidated with the Company.
There were no affiliates accounted for by the equity method in 2014 or 2013.
Investments in the unconsolidated subsidiaries and affiliates are stated at cost, less a valuation allowance representing possible
losses on the investments that are deemed to be other than temporary. If the equity method of accounting had been applied to the
investments in such companies, the effect on the accompanying consolidated financial statements would not be material.
The excess of the costs over the underlying net equity of investments in consolidated subsidiaries is recognized as goodwill and
amortized on a straight-line basis over a five-year period, with the exception of minor amounts, which are charged or credited to
income in the period of acquisition.
All significant intercompany balances and transactions have been eliminated in consolidation. All material unrealized profit
included in assets resulting from transactions within the Group is also eliminated.
b. Unification of Accounting Policies Applied to Foreign Subsidiaries for the Consolidated Financial Statements—In May 2006, the
Accounting Standards Board of Japan (the “ASBJ”) issued ASBJ Practical Issues Task Force (PITF) No. 18, “Practical Solution on
Unification of Accounting Policies Applied to Foreign Subsidiaries for the Consolidated Financial Statements.” PITF No. 18 prescribes
that the accounting policies and procedures applied to a parent company and its subsidiaries for similar transactions and events
under similar circumstances should in principle be unified for the preparation of the consolidated financial statements. However,
financial statements prepared by foreign subsidiaries in accordance with either International Financial Reporting Standards or the
generally accepted accounting principles in the United States of America tentatively may be used for the consolidation process,
except for the following items which should be adjusted in the consolidation process so that net income is accounted for in accor-
dance with Japanese GAAP, unless they are not material: (a) amortization of goodwill; (b) scheduled amortization of actuarial gain or
loss of pensions that has been directly recorded in equity; (c) expensing capitalized development costs of R&D; (d) cancellation of
Year Ended March 31, 2014
Notes to Consolidated Financial Statements
51AnnuAl RepoRt 2014
the fair value model accounting for property, plant and equipment and investment properties and incorporation of the cost model
accounting; and (e) exclusion of minority interests from net income, if contained in net income.
c. Recognition of Operating Revenues—The Group recognizes freight charge income as operating revenue at the time when freight
has been received from the shipping customer for transportation.
Fees from customers based on installment sales contracts are recognized by the equal installment method.
d. Cash Equivalents—Cash equivalents in the consolidated statement of cash flows are short-term investments that are readily
convertible into cash and that are exposed to insignificant risk of changes in value. Cash equivalents in the consolidated statement
of cash flows include time deposits, certificates of deposits, and mutual funds investing in bonds that represent short-term invest-
ments, all of which mature or become due within three months of the date of acquisition.
The difference between cash and cash equivalents in the accompanying consolidated balance sheet and cash and cash equiva-
lents in the accompanying consolidated statement of cash flows is as follows:
Millions of YenThousands of U.S. Dollars
2014 2013 2014
Cash and cash equivalents presented in the consolidated balance sheet ¥220,148 ¥213,619 $2,139,017Time deposits due beyond three months (445) (695) (4,319)Bank overdraft (308) (283) (2,992)
Cash and cash equivalents presented in the consolidated statement of cash flows ¥219,395 ¥212,641 $2,131,706
e. Inventories— Inventories are stated at the lower of cost determined by the first-in, first-out method or net selling value.
f. Marketable and Investment Securities—Marketable and investment securities are classified and accounted for, depending on
management’s intent, as follows: (1) trading securities, which are held for the purpose of earning capital gains in near term are
reported at fair value, and the related unrealized gains and losses are included in earnings, (2) held-to-maturity debt securities, for
which there is the positive intent and ability to hold to maturity are reported at amortized cost, and (3) available-for-sale securities,
which are not classified as either of the aforementioned securities, are reported at fair value, with unrealized gains and losses, net
of applicable taxes, reported in a separate component of equity. The Group had no trading securities at March 31, 2014 and 2013.
Nonmarketable available-for-sale securities are stated at cost determined by the moving-average method.
For other-than-temporary declines in fair value, investment securities are reduced to net realizable value by a charge to income.
g. Property, Plant and Equipment—Property, plant and equipment are stated at cost. Depreciation of property, plant and equipment
excluding leased assets of the Company and its domestic consolidated subsidiaries is computed substantially by the declining-balance
method, while the straight-line method is applied to buildings acquired after April 1, 1998. Depreciation of leased assets is computed
by the straight-line method over the lease period with no residual value carried.
The depreciation of property, plant and equipment of foreign consolidated subsidiaries is computed by the straight-line method
over the estimated useful lives of the assets. The range of useful lives is principally as follows:
Buildings and structures 7–60 years
Vehicles 2– 7 years
Machinery and equipment 2–20 years
Maintenance and repairs, including minor renewals and improvements, are charged to income as incurred.

52 Yamato Holdings Co., ltd.
h. Long‑Lived Assets—The Group reviews its long-lived assets for impairment whenever events or changes in circumstances indicate
the carrying amount of an asset or asset group may not be recoverable. An impairment loss is recognized if the carrying amount of
an asset or asset group exceeds the sum of the undiscounted future cash flows expected to result from the continued use and even-
tual disposition of the asset or asset group. The impairment loss would be measured as the amount by which the carrying amount of
the asset exceeds its recoverable amount, which is the higher of the discounted cash flows from the continued use and eventual
disposition of the asset or the net selling price at disposition.
i. Other Assets—Amortization of intangible assets is computed by the straight-line method.
Depreciation of leased assets is computed by the straight-line method over the lease period with no residual value carried.
j. Retirement and Pension Plan—The Company and consolidated subsidiaries mainly have a contributory trusted pension plan and
an unfunded retirement benefit plan. In addition, a defined contribution retirement plan was introduced along with these defined
benefit pension plans.
In calculating the retirement benefit obligations, the straight-line basis is used in determining the amount of the expected retirement
benefit obligations attributed to service performed up to the end of the current fiscal year. Past service costs are recognized in profit or
loss in full in the fiscal year in which it arises. Actuarial gains and losses are amortized on a straight-line basis over five years within the
average remaining service period of the eligible employees on and after the fiscal year following the fiscal year in which it arises.
In May 2012, the ASBJ issued ASBJ Statement No. 26, “Accounting Standard for Retirement Benefits” and ASBJ Guidance No. 25,
“Guidance on Accounting Standard for Retirement Benefits,” which replaced the former standard and the other related practical guidance.
Under the revised accounting standard, actuarial gains and losses shall be recognized within equity on the consolidated balance
sheet after adjusting for tax effects, and funded status shall be recognized as a liability or asset.
The Company applied the revised accounting standard effective from the end of the fiscal year ended March 31, 2014. In apply-
ing the accounting standard, and in accordance with transitional accounting as stipulated in the accounting standard, the effect of
the changes in accounting policy described above has been recognized in the item remeasurements of defined employees’ retire-
ment benefit plans under accumulated other comprehensive income as of March 31, 2014.
As a result of this change, as of the fiscal year ended March 31, 2014, liability for employees’ retirement benefits of ¥47,224
million ($458,843 thousand) was recorded, accumulated other comprehensive income decreased by ¥1,717 million ($16,683 thou-
sand), and deferred tax assets increased by ¥1,087 million ($10,557 thousand). Net assets per share decreased by ¥4.10 ($0.04).
k. Asset Retirement Obligations— In March 2008, the ASBJ issued ASBJ Statement No. 18, “Accounting Standard for Asset Retire-
ment Obligations” and ASBJ Guidance No. 21, “Guidance on Accounting Standard for Asset Retirement Obligations.” Under this
accounting standard, an asset retirement obligation is defined as a legal obligation imposed either by law or contract that results
from the acquisition, construction, development, and normal operation of a tangible fixed asset and is associated with the retire-
ment of such tangible fixed asset.
The asset retirement obligation is recognized as the sum of the discounted cash flows required for the future asset retirement
and is recorded in the period in which the obligation is incurred if a reasonable estimate can be made. If a reasonable estimate of
the asset retirement obligation cannot be made in the period the asset retirement obligation is incurred, the liability should be recog-
nized when a reasonable estimate of the asset retirement obligation can be made. Upon initial recognition of a liability for an asset
retirement obligation, an asset retirement cost is capitalized by increasing the carrying amount of the related fixed asset by the
amount of the liability. The asset retirement cost is subsequently allocated to expense through depreciation over the remaining
useful life of the asset. Over time, the liability is accreted to its present value each period. Any subsequent revisions to the timing or
the amount of the original estimate of undiscounted cash flows are reflected as reconciliation to the carrying amount of the liability
and the capitalized amount of the related asset retirement cost.

53AnnuAl RepoRt 2014
l. Leases—For a lessee, all finance lease transactions are capitalized to recognize lease assets and lease obligations in the bal-
ance sheet.
For a lessor, all finance leases that deem to transfer ownership of the leased property to the lessee are recognized as lease
receivables, and all finance leases that deem not to transfer ownership of the leased property to the lessee are recognized as
investments in leases.
m. Income Taxes—The provision for income taxes is computed based on the pretax income included in the consolidated statement
of income. The asset and liability approach is used to recognize deferred tax assets and liabilities for the expected future tax conse-
quences of temporary differences between the carrying amounts and the tax bases of assets and liabilities. Deferred taxes are
measured by applying currently enacted tax laws to the temporary differences.
n. Appropriations of Retained Earnings—Appropriations of retained earnings at each year-end are reflected in the consolidated
financial statements for the following year upon shareholders’ approval.
o. Foreign Currency Transactions—All short and long-term monetary receivables and payables denominated in foreign currencies
are translated into Japanese yen at the exchange rates at the balance sheet date.
p. Derivative Financial Instruments—Certain consolidated subsidiaries use derivative financial instruments to manage their expo-
sures to fluctuations in interest rates. Interest rate swaps are utilized by the consolidated subsidiaries to reduce interest rate risks.
The consolidated subsidiaries do not enter into derivatives for trading or speculative purposes.
The interest rate swaps, which qualify for hedge accounting and meet specific matching criteria, are not remeasured at market
value but the differential paid or received under the swap agreements are recognized and included in interest expense or income.
q. Foreign Currency Financial Statements—The balance sheet accounts of the consolidated foreign subsidiaries are translated into
Japanese yen at the current exchange rate as of the balance sheet date except for equity, which is translated at the historical rate.
Differences arising from such translation are shown as “Foreign currency translation adjustments” under accumulated other compre-
hensive income in a separate component of equity.
Revenue and expense accounts of the consolidated foreign subsidiaries are translated into Japanese yen at the current exchange
rates as of the balance sheet date.
r. Per‑Share Information—Basic net income per share is computed by dividing net income available to common shareholders, by the
weighted-average number of common shares outstanding for the period, retroactively adjusted for stock splits.
Diluted net income per share reflects the potential dilution that could occur if securities were exercised or converted into common
stock. Diluted net income per share of common stock assumes full conversion of the outstanding convertible notes and bonds at the
beginning of the year (or at the time of issuance) with an applicable adjustment for related interest expense, net of tax, and full
exercise of outstanding warrants.
Cash dividends per share presented in the accompanying consolidated statement of income are dividends applicable to the
respective years, including dividends to be paid after the end of the year.
s. Accounting Changes and Error Corrections— In December 2009, the ASBJ issued ASBJ Statement No. 24, “Accounting Standard
for Accounting Changes and Error Corrections” and ASBJ Guidance No. 24, “Guidance on Accounting Standard for Accounting
Changes and Error Corrections.” Accounting treatments under this standard and guidance are as follows:
(1) Changes in Accounting Policies—When a new accounting policy is applied following revision of an accounting standard, the
new policy is applied retrospectively unless the revised accounting standard includes specific transitional provisions, in which case

54 Yamato Holdings Co., ltd.
the entity shall comply with the specific transitional provisions. (2) Changes in Presentation—When the presentation of financial
statements is changed, prior-period financial statements are reclassified in accordance with the new presentation. (3) Changes in
Accounting Estimates—A change in an accounting estimate is accounted for in the period of the change if the change affects that
period only, and is accounted for prospectively if the change affects both the period of the change and future periods. (4) Corrections
of Prior-Period Errors—When an error in prior-period financial statements is discovered, those statements are restated.
t. New Accounting Pronouncements
Accounting Standard for Retirement Benefits— In May 2012, the ASBJ revised ASBJ Statement No. 26, “Accounting Standard for
Retirement Benefits” and ASBJ Guidance No. 25, “Guidance on Accounting Standard for Retirement Benefits.”
The accounting standard has been revised mainly in terms of accounting methods for unrecognized actuarial gains or losses and
unrecognized past service costs, calculation methods for defined benefit obligation and service cost, and enhancement of disclosure
items.
The revision of the calculation methods for defined benefit obligation and service cost will be applied to the Company and its
domestic consolidated subsidiaries from the beginning of the fiscal year that begins on or after April 1, 2014. The accounting stan-
dard and the guidance will not be applied retrospectively to the financial statements in the prior years, following the transitional
provisions.
The Company is now in the process of measuring the effect of applying the accounting standard and the guidance.
Accounting Standards for Business Combinations— In September 2013, the ASBJ revised ASBJ Statement No. 21, “Accounting
Standard for Business Combinations,” ASBJ Statement No. 7, “Accounting Standard for Business Divestitures,” ASBJ Guidance No.
10, “Guidance on Accounting Standards for Business Combinations and Business Divestitures” and related standards and imple-
mentation guidance.
The accounting standards has been revised mainly as follows: (a) accounting treatment of changes in a parent’s ownership inter-
est in a subsidiary, due to purchase of ownership interests in its subsidiary or other transactions, while the parent retains its con-
trolling interest in its subsidiary; (b) accounting treatment of acquisition-related costs; (c) the presentation of net income and the
change in presentation from minority interests to non-controlling interests; and (d) transitional accounting treatment.
(a) and (b) will be applied from the beginning of the fiscal year that begins on or after April 1, 2014, (d) will be applied early for a
business combination which will occur on or after the beginning of the fiscal year that begins on or after April 1, 2014, and (c) will be
applied early from the beginning of the fiscal year that begins on or after April 1, 2015.
3. NOTES AND ACCOUNTS RECEIVABLE
Sales recorded on the installment basis were 0.3% of operating revenues in 2014 and 2013, respectively.
Annual maturities of notes and accounts receivable—installment at March 31, 2014, and related amortization of deferred profit
on installment sales are as follows:
Millions of Yen Thousands of U.S. Dollars
Receivables
Deferred Profit on Installment
Sales Receivables
Deferred Profit on Installment
Sales
2015 ¥19,688 ¥2,113 $191,292 $20,5262016 9,818 1,450 95,392 14,0942017 5,438 886 52,839 8,6102018 2,659 485 25,836 4,7082019 1,239 256 12,042 2,4872020 and thereafter 638 159 6,204 1,549
Total ¥39,480 ¥5,349 $383,605 $51,974

55AnnuAl RepoRt 2014
4. INVENTORIES
Inventories at March 31, 2014 and 2013, consisted of the following:
Millions of YenThousands of U.S. Dollars
2014 2013 2014
Merchandise ¥ 780 ¥ 852 $ 7,584Work in process 235 161 2,279Raw materials and supplies 2,222 2,588 21,593
Total ¥3,237 ¥3,601 $31,456
5. MARKETABLE AND INVESTMENT SECURITIES
Marketable and investment securities as of March 31, 2014 and 2013, consisted of the following:
Millions of YenThousands of U.S. Dollars
2014 2013 2014
Noncurrent:Marketable equity securities ¥24,796 ¥20,516 $240,922Nonmarketable equity securities 685 1,175 6,657Other 96 96 939
Total ¥25,577 ¥21,787 $248,518
Information regarding each category of the securities classified as available-for-sale at March 31, 2014 and 2013, was as follows:
Millions of Yen
2014
CostUnrealized
GainsUnrealized
Losses Fair Value
Securities classified as:Available-for-sale: Equity securities ¥12,777 ¥12,038 ¥19 ¥24,796
Millions of Yen
2013
CostUnrealized
GainsUnrealized
Losses Fair Value
Securities classified as:Available-for-sale: Equity securities ¥12,257 ¥8,277 ¥18 ¥20,516
Thousands of U.S. Dollars
2014
CostUnrealized
GainsUnrealized
Losses Fair Value
Securities classified as:Available-for-sale: Equity securities $124,145 $116,962 $185 $ 240,922

56 Yamato Holdings Co., ltd.
Information for available-for-sale securities, which were sold during the years ended March 31, 2014 and 2013, was as follows:
Millions of Yen
March 31, 2014 ProceedsRealized Gains
Realized Losses
Available-for-sale:Equity securities ¥2 ¥1 ¥–Other
Total ¥2 ¥1 ¥–
March 31, 2013
Available-for-sale:Equity securities ¥44 ¥42 ¥–Other 8
Total ¥52 ¥42 ¥–
Thousands of U.S. Dollars
March 31, 2014 ProceedsRealized Gains
Realized Losses
Available-for-sale:Equity securities $21 $9 $–Other
Total $21 $9 $–
Loss on valuation of available-for-sale equity securities for the years ended March 31, 2014 and 2013, were ¥3 million ($33
thousand) and ¥1,176 million, respectively.
6. LONG-LIVED ASSETS
The Group reviewed its long-lived assets for impairment as of the years ended March 31, 2014 and 2013. As a result, the Group
recognized an impairment loss of ¥217 million ($2,109 thousand) as other expense for the asset groups of the Tomakomai Mainte-
nance Factory of Yamato Autoworks Co., Ltd. and eleven other asset groups for the year ended March 31, 2014, and ¥1,769 million
as other expense for the asset groups of the Nishi-Kanto Regional Branch of Yamato Home Convenience Co., Ltd. and eight other
asset groups for the year ended March 31, 2013, respectively, due to continuous operating losses of those units or significant
declines in market prices. The carrying amounts of the relevant asset groups were written down to the recoverable amounts. The
recoverable amounts of the relevant asset groups were measured by net selling prices and evaluated mainly based on Real Estate
Appraisal Standards, assessed value of fixed assets, and posted land prices.
7. BANK LOANS AND LONG-TERM DEBT
Short-term bank loans at March 31, 2014 and 2013, consisted of notes to banks and bank overdrafts. The weighted-average inter-
est rates applicable to the bank loans as of March 31, 2014 and 2013, were approximately 0.450% and 0.663%, respectively.
Long-term debt at March 31, 2014 and 2013, consisted of the following:
Millions of YenThousands of U.S. Dollars
2014 2013 2014
0.150% to 6.900% loans from Japanese banks due 2014 to 2017 ¥ 59,422 $ 577,3660.200% to 6.900% loans from Japanese banks due 2013 to 2017 ¥ 46,321Lease obligations 9,165 11,756 89,048
Zero coupon convertible bonds due in March 2016 20,000 20,000 194,326
Total 88,587 78,077 860,740
Less current portion (21,941) (18,825) (213,188)
Total ¥ 66,646 ¥ 59,252 $ 647,552

57AnnuAl RepoRt 2014
Annual maturities of long-term debt at March 31, 2014, were as follows:
Year Ending March 31 Millions of YenThousands of U.S. Dollars
2015 ¥21,941 $213,1882016 32,143 312,3102017 26,882 261,194
2018 7,294 70,8742019 306 2,9742020 and thereafter 21 200
Total ¥88,587 $860,740
The conversion price of the convertible bonds due in March 2016 was ¥1,850 per share at March 31, 2014. If all the outstand-
ing convertible bonds had been exercised at March 31, 2014, 10,810,810 shares of common stock would have been issued.
The conversion price of the convertible bonds is subject to adjustments to reflect stock splits and certain other events. Each
stock acquisition right may be exercised at any time during the period from March 22, 2011 to February 22, 2016.
8. RETIREMENT AND PENSION PLANS
The Group has defined benefit pension plans and defined contribution retirement plans for employees.
The defined benefit pension plans provide, under most circumstances, that employees terminating their employment are entitled to
retirement benefits determined based on the rate of pay at the time of termination, years of service, and certain other factors. Such
retirement benefits are made in the form of a lump-sum severance payment from the Company or from the consolidated subsidiaries
and annuity payments from a trustee. Employees are entitled to larger payments if the termination is involuntary, by retirement at the
mandatory retirement age, by death, or by voluntary retirement at certain specific ages prior to the mandatory retirement age.
Year Ended March 31, 2014
(1) Defined Benefit Pension Plans
The changes in defined benefit obligation for the year ended March 31, 2014, were as follows:
Millions of YenThousands of U.S. Dollars
2014 2014
Balance at beginning of year ¥112,493 $1,093,014Service cost 8,910 86,577Interest cost 1,443 14,019Actuarial loss arising during the year 744 7,233Retirement benefits paid (4,458) (43,318)Past service cost arising during the year 4 36Others (4)
Balance at end of year ¥119,136 $1,157,557
The changes in plan assets for the year ended March 31, 2014, were as follows:
Millions of YenThousands of U.S. Dollars
2014 2014
Balance at beginning of year ¥64,927 $630,849Expected return on plan assets 649 6,308Actuarial gain arising during the year 4,516 43,880Contributions from the employer 3,881 37,702Retirement benefits paid (1,894) (18,401)
Balance at end of year ¥72,079 $700,338

58 Yamato Holdings Co., ltd.
Reconciliation between the liability recorded in the consolidated balance sheet and the balances of defined benefit obligation and
plan assets as of March 31, 2014, were as follows:
Millions of YenThousands of U.S. Dollars
2014 2014
Defined benefit obligation of funded plan ¥ 50,035 $ 486,157Plan assets (72,079) (700,338)
(22,044) (214,181)Defined benefit obligation of unfunded plan 69,101 671,400
Net liability arising from defined benefit obligation ¥ 47,057 $ 457,219
Millions of YenThousands of U.S. Dollars
2014 2014
Liability for employees’ retirement benefits ¥47,224 $458,843Asset for employees’ retirement benefits (167) (1,624)
Net liability arising from defined benefit obligation ¥47,057 $457,219
The amount of liability and asset for employees’ retirement benefits that are offset individually by the Company and subsidiaries
are combined.
The components of net periodic benefit costs for the year ended March 31, 2014, were as follows:
Millions of YenThousands of U.S. Dollars
2014 2014
Service cost ¥ 8,910 $ 86,577Interest cost 1,443 14,019Expected return on plan assets (649) (6,308)Recognized actuarial loss 3,047 29,607Past service cost 4 36Others (6) (58)
Net periodic benefit costs ¥12,749 $123,873
Accumulated other comprehensive income before tax effect adjustments on defined employees’ retirement benefit plans as of
March 31, 2014, was as follows:
Millions of YenThousands of U.S. Dollars
2014 2014
Unrecognized actuarial gain and (loss) ¥(2,683) $(26,072)
Total ¥(2,683) $(26,072)
Plan assets as of March 31, 2014, consisted of the following:
2014
General accounts 34%Debt investments 26Equity investments 21Others 19
Total 100%

59AnnuAl RepoRt 2014
Assumptions used for the year ended March 31, 2014, were set forth as follows:
2014
Discount rate 1.3%Expected rate of return on plan assets 1.0%
The expected rate of return on plan assets is determined on the basis of the distribution of plan assets, past performance of
respective assets that make up investments of plan assets, and market trends.
(2) Defined Contribution Retirement Plans
The amount contributed to the defined contribution retirement plans of the Group for the year ended March 31, 2014, was ¥2,089
million ($20,301 thousand).
Year Ended March 31, 2013
(1) Defined Benefit Pension Plans
The liability for employees’ retirement benefits at March 31, 2013, consisted of the following:
Millions of Yen
2013
Projected benefit obligation ¥112,493Fair value of plan assets (64,927)Unrecognized actuarial loss (9,502)Prepaid pension cost 114
Net liability ¥ 38,178
The components of net periodic benefit costs for the year ended March 31, 2013, is as follows:
Millions of Yen
2013
Service cost ¥ 7,106Interest cost 1,946Recognized actuarial loss 3,399
Net periodic benefit costs ¥12,451
Assumptions used for the year ended March 31, 2013, is set forth as follows:
2013
Discount rate 1.3%Expected rate of return on plan assets 0.0%Recognition period of actuarial gain/loss 5 years
(2) Defined Contribution Retirement Plans
The amount contributed to the defined contribution retirement plans of the Group for the year ended March 31, 2013, was ¥2,053
million.
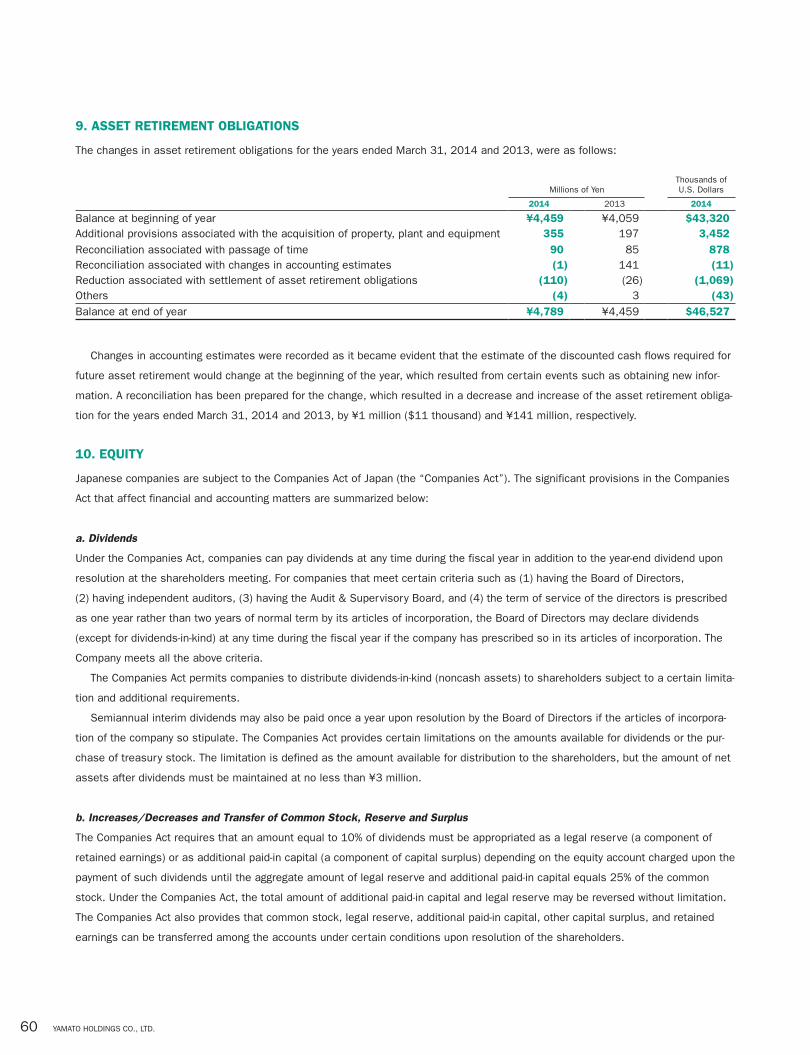
60 Yamato Holdings Co., ltd.
9. ASSET RETIREMENT OBLIGATIONS
The changes in asset retirement obligations for the years ended March 31, 2014 and 2013, were as follows:
Millions of YenThousands of U.S. Dollars
2014 2013 2014
Balance at beginning of year ¥4,459 ¥4,059 $43,320Additional provisions associated with the acquisition of property, plant and equipment 355 197 3,452
Reconciliation associated with passage of time 90 85 878Reconciliation associated with changes in accounting estimates (1) 141 (11)Reduction associated with settlement of asset retirement obligations (110) (26) (1,069)Others (4) 3 (43)
Balance at end of year ¥4,789 ¥4,459 $46,527
Changes in accounting estimates were recorded as it became evident that the estimate of the discounted cash flows required for
future asset retirement would change at the beginning of the year, which resulted from certain events such as obtaining new infor-
mation. A reconciliation has been prepared for the change, which resulted in a decrease and increase of the asset retirement obliga-
tion for the years ended March 31, 2014 and 2013, by ¥1 million ($11 thousand) and ¥141 million, respectively.
10. EQUITY
Japanese companies are subject to the Companies Act of Japan (the “Companies Act”). The significant provisions in the Companies
Act that affect financial and accounting matters are summarized below:
a. Dividends
Under the Companies Act, companies can pay dividends at any time during the fiscal year in addition to the year-end dividend upon
resolution at the shareholders meeting. For companies that meet certain criteria such as (1) having the Board of Directors,
(2) having independent auditors, (3) having the Audit & Supervisory Board, and (4) the term of service of the directors is prescribed
as one year rather than two years of normal term by its articles of incorporation, the Board of Directors may declare dividends
(except for dividends-in-kind) at any time during the fiscal year if the company has prescribed so in its articles of incorporation. The
Company meets all the above criteria.
The Companies Act permits companies to distribute dividends-in-kind (noncash assets) to shareholders subject to a certain limita-
tion and additional requirements.
Semiannual interim dividends may also be paid once a year upon resolution by the Board of Directors if the articles of incorpora-
tion of the company so stipulate. The Companies Act provides certain limitations on the amounts available for dividends or the pur-
chase of treasury stock. The limitation is defined as the amount available for distribution to the shareholders, but the amount of net
assets after dividends must be maintained at no less than ¥3 million.
b. Increases/Decreases and Transfer of Common Stock, Reserve and Surplus
The Companies Act requires that an amount equal to 10% of dividends must be appropriated as a legal reserve (a component of
retained earnings) or as additional paid-in capital (a component of capital surplus) depending on the equity account charged upon the
payment of such dividends until the aggregate amount of legal reserve and additional paid-in capital equals 25% of the common
stock. Under the Companies Act, the total amount of additional paid-in capital and legal reserve may be reversed without limitation.
The Companies Act also provides that common stock, legal reserve, additional paid-in capital, other capital surplus, and retained
earnings can be transferred among the accounts under certain conditions upon resolution of the shareholders.

61AnnuAl RepoRt 2014
c. Treasury Stock
The Companies Act also provides for companies to purchase treasury stock and dispose of such treasury stock by resolution of the
Board of Directors. The amount of treasury stock purchased cannot exceed the amount available for distribution to the shareholders,
which is determined by specific formula. The Companies Act also provides that companies can purchase both treasury stock acquisi-
tion rights and treasury stock. Such treasury stock acquisition rights are presented as a separate component of equity.
11. INCOME TAXES
The Company and its domestic subsidiaries are subject to Japanese national and local income taxes, which, in the aggregate,
resulted in a normal effective statutory tax rate of 38.0% for the years ended March 31, 2014 and 2013.
The tax effects of significant temporary differences, which resulted in deferred tax assets and liabilities at March 31, 2014 and
2013, were as follows:
Millions of YenThousands of U.S. Dollars
2014 2013 2014
Deferred tax assets:Current:
Accrued expenses ¥ 10,463 ¥ 10,994 $ 101,668Enterprise tax 1,747 2,015 16,975Allowance for doubtful accounts 196 211 1,903Legal welfare expense 1,660 1,728 16,131Other 3,067 2,456 29,798
Less valuation allowance (273) (392) (2,656)
Deferred tax assets—current ¥ 16,860 ¥ 17,012 $ 163,819
Noncurrent:Liability for employees’ retirement benefits ¥ 16,998 ¥ 13,720 $ 165,155Investment securities 2,199 2,202 21,369Loss on devaluation of land 24,163 24,218 234,772Loss on impairment of long-lived assets 4,225 4,150 41,053Loss on devaluation of telephone subscription rights 546 546 5,307Unrealized profit 1,840 1,660 17,873Other 10,764 10,087 104,581Less valuation allowance (35,505) (34,472) (344,973)
Deferred tax assets—noncurrent ¥ 25,230 ¥ 22,111 $ 245,137
Deferred tax liabilities:Current—other ¥ (312) ¥ (365) $ (3,037)
Deferred tax liabilities—current ¥ (312) ¥ (365) $ (3,037)
Noncurrent:Unrealized gain on available-for-sale securities ¥ (2,871) ¥ (2,020) $ (27,896)Other (2,480) (2,035) (24,096)
Deferred tax liabilities—noncurrent ¥ (5,351) ¥ (4,055) $ (51,992)
Deferred tax assets—net ¥ 36,427 ¥ 34,703 $ 353,927

62 Yamato Holdings Co., ltd.
Reconciliation between the normal effective statutory tax rates and the actual effective tax rates reflected in the accompanying
consolidated statement of income for the year ended March 31, 2014, with the corresponding figures for 2013 is as follows:
2014 2013
Normal effective statutory tax rate 38.0% 38.0%Per capita levy of local taxes 4.3 4.2Valuation allowance 1.2 2.2Downward revision to deferred tax assets as of end of the period due to the change in the corporate tax rate 1.8
Other—net 1.8 1.6
Actual effective tax rate 47.1% 46.0%
On March 31, 2014, a new tax reform law was enacted in Japan, which changed the normal effective statutory tax rate from
38.0% to 35.6%, effective for the fiscal year beginning on or after April 1, 2014.
The effects of the reform were to decrease deferred tax assets (after subtraction of deferred tax liabilities) in the consolidated
balance sheet as of March 31, 2014, by ¥1,172 million ($11,387 thousand), and to increase income taxes—deferred in the
consolidated statement of income for the year then ended by ¥1,163 million ($11,296 thousand).
12. LEASES
(1) Lessee
The Group leases certain machinery, computer equipment and other assets.
Future rental payments under noncancelable operating leases at March 31, 2014 and 2013, was as follows:
Millions of YenThousands of U.S. Dollars
2014 2013 2014
Due within one year ¥ 76 ¥507 $ 736Due after one year 123 44 1,201
Total ¥199 ¥551 $1,937
(2) Lessor
The net investments in lease as of March 31, 2014 and 2013, are summarized as follows:
Millions of YenThousands of U.S. Dollars
2014 2013 2014
Gross lease receivables ¥35,645 ¥22,859 $346,340Unguaranteed residual values 2,948 1,820 28,638Unearned interest income (3,264) (2,302) (31,713)
Investments in leases—current ¥35,329 ¥22,377 $343,265
Maturities of lease receivables for finance leases that are deemed not to transfer ownership of the leased property to the lessee
as of March 31, 2014, are as follows:
Year Ending March 31 Millions of YenThousands of U.S. Dollars
2015 ¥10,861 $105,5232016 9,442 91,7432017 7,592 73,7672018 5,246 50,9742019 2,242 21,7862020 and thereafter 262 2,547
Total ¥35,645 $346,340

63AnnuAl RepoRt 2014
The minimum rental commitments under noncancelable operating leases at March 31, 2014 and 2013, are as follows:
Millions of YenThousands of U.S. Dollars
2014 2013 2014
Due within one year ¥2,069 ¥1,509 $20,106Due after one year 4,385 3,431 42,607
Total ¥6,454 ¥4,940 $62,713
13. FINANCIAL INSTRUMENTS AND RELATED DISCLOSURES
(1) Group Policy for Financial Instruments
The Group uses financial instruments, mainly long-term debt including bank loans and bonds, in order to expand its business based
on its investment plan to expand its network. Cash surpluses, if any, are invested in low risk financial assets. Derivatives are used,
not for speculative purposes, but to manage exposure to interest fluctuation risk. Certain consolidated subsidiaries conduct leasing
or installment sales operations.
(2) Nature and Extent of Risks Arising from Financial Instruments and the Risk Management for Financial Instruments
Receivables such as notes and accounts receivable and installment sales receivable are exposed to customer credit risk.
Therefore, the Group maintains customers’ credit risk by monitoring collections and accrued receivables at due dates.
Marketable and investment securities are mainly equity securities of the companies that have business relationships or capital
alliances. Such securities are exposed to the risk of market price fluctuations.
Most payment terms of payables such as notes and accounts payable are less than one year.
Short-term bank loans are related to a financial business, and long-term bank loans are used for expanding its business and
network. Although a portion of such bank loans are exposed to market risks from changes in variable interest rates, those risks are
mitigated by using derivatives of interest rate swaps. In addition, such interest rate swaps are contracted in accordance with the
internal rule, which prescribes the authority over derivative transactions.
Accounts payable and bank loans exposed to liquidity risks are managed by each company of the Group, such as fund settlement,
bookkeeping, monitoring of the balances outstanding, and managing cash flows.
(3) Fair Values of Financial Instruments
Fair values of financial instruments are based on quoted prices in active markets. If a quoted price is not available, other rational
valuation techniques are used instead. According to the techniques used, the value could be different.
Fair values of financial instruments at March 31, 2014 and 2013, were as follows:
Millions of Yen
March 31, 2014 Carrying Amount Fair Value Difference
Cash and cash equivalents ¥220,148 ¥220,148Trade notes and accounts receivable 188,145
Allowance for doubtful accounts (131)
188,014 188,519 ¥ 505
Installment sales receivable 39,480Allowance for doubtful accounts (933)Deferred profit on installment sales (5,349)
33,198 38,320 5,122
Investment securities 24,796 24,796Trade notes and accounts payable 172,463 172,463Short-term loans 36,412 36,493 81Long-term loans 42,266 42,334 68Derivatives

64 Yamato Holdings Co., ltd.
Millions of Yen
March 31, 2013 Carrying Amount Fair Value Difference
Cash and cash equivalents ¥213,619 ¥213,619Trade notes and accounts receivable 163,790
Allowance for doubtful accounts (143)163,647 164,258 ¥ 611
Installment sales receivable 37,456Allowance for doubtful accounts (1,112)Deferred profit on installment sales (5,006)
31,338 36,110 4,772Investment securities 20,516 20,516Trade notes and accounts payable 138,288 138,288Short-term loans 29,814 29,892 78Long-term loans 32,210 32,275 65Derivatives
Thousands of U.S. Dollars
March 31, 2014 Carrying Amount Fair Value Difference
Cash and cash equivalents $2,139,017 $2,139,017Trade notes and accounts receivable 1,828,070
Allowance for doubtful accounts (1,276)
1,826,794 1,831,709 $4,915
Installment sales receivable 383,605Allowance for doubtful accounts (9,071)Deferred profit on installment sales (51,974)
322,560 372,324 49,764
Investment securities 240,922 240,922Trade notes and accounts payable 1,675,702 1,675,702Short-term loans 353,788 354,575 787Long-term loans 410,670 411,332 662Derivatives
Cash and cash equivalents
The carrying values of cash and cash equivalents approximate fair value because of their short maturities.
Trade notes and accounts receivable
The fair values of receivables are measured at the amount to be received at maturity discounted at the Group’s assumed corporate
discount rate. A portion of these receivables is determined by discounting the cash flows related to the receivables at the rate of
government bonds.
Installment sales receivable
Allowances for doubtful accounts and deferred profit on installment sales are deducted from the fair values of installment sales receiv-
able, which are determined by discounting the cash flows related to the installment sales receivable at the market interest rate.
Marketable and investment securities
The fair values of marketable and investment securities are measured at the quoted market price of the stock exchange for the
equity instruments, and at the quoted price obtained from the financial institution for certain debt instruments. Information of the
fair value for marketable and investment securities by classification is included in Note 5.

65AnnuAl RepoRt 2014
Trade notes and accounts payable
The fair values of payables, all of which are substantially paid within one year, are measured at the amount to be paid.
Short‑term and long‑term loans
The fair values of short-term bank loans and long-term loans are determined by discounting the cash flows related to the debt at the
Group’s assumed corporate borrowing rate.
The current portion of long-term bank loans is included in short-term loans in the above table in addition to short-term bank loans
on the consolidated balance sheet. Lease payments are not included in long-term loans in the above table.
Derivatives
Information of the fair value for derivatives is included in Note 14.
(4) Financial Instruments Whose Fair Value Cannot Be Reliably Determined
Millions of YenThousands of U.S. Dollars
2014 2013 2014
Investments in equity instruments that do not have a quoted market price in an active market ¥1,324 ¥2,082 $12,865
(5) Maturity Analysis for Financial Assets and Securities with Contractual Maturities
Millions of Yen
March 31, 2014Due in One Year
or Less
Due after One Year through
Five YearsDue after Five Years
Cash and cash equivalents ¥220,148Trade notes and accounts receivable 177,095 ¥10,975 ¥ 75Installment sales receivable 19,688 19,154 638
Total ¥416,931 ¥30,129 ¥713
March 31, 2013
Cash and cash equivalents ¥213,619Trade notes and accounts receivable 156,108 ¥ 7,637 ¥ 45Installment sales receivable 19,318 17,556 582Total ¥389,045 ¥25,193 ¥627
Thousands of U.S. Dollars
March 31, 2014Due in One Year
or Less
Due after One Year through
Five YearsDue after Five Years
Cash and cash equivalents $2,139,017Trade notes and accounts receivable 1,720,708 $106,637 $ 725Installment sales receivable 191,292 186,109 6,204
Total $4,051,017 $292,746 $6,929

66 Yamato Holdings Co., ltd.
(6) Maturity Analysis for Long‑term loans, Lease obligations and Convertible bonds
Millions of Yen
Year Ending March 31 Long-term loans Lease obligationsZero coupon
convertible bonds
2015 ¥17,156 ¥4,7852016 10,007 2,136 ¥20,0002017 25,656 1,226
2018 6,603 691
2019 306
2020 and thereafter 21
Total ¥59,422 ¥9,165 ¥20,000
Thousands of U.S. Dollars
Year Ending March 31 Long-term loans Lease obligationsZero coupon
convertible bonds
2015 $166,696 $46,4922016 97,225 20,759 $194,3262017 249,285 11,9092018 64,160 6,7142019 2,9742020 and thereafter 200
Total $577,366 $89,048 $194,326
Please see Note 7 for annual maturities of long-term debt.
14. DERIVATIVES
Certain consolidated subsidiaries use derivative financial instruments to manage their exposure to fluctuations in interest rates.
Interest rate swaps are utilized by the consolidated subsidiaries to reduce interest rate risk. The consolidated subsidiaries do not
enter into derivatives for trading or speculative purposes.
The interest rate swaps, which qualify for hedge accounting and meet specific matching criteria, are not remeasured at market
value but the differential paid or received under the swap agreements is recognized and included in interest expense or income.
Derivative Transactions to Which Hedge Accounting Is Applied
Millions of Yen
March 31, 2014 Hedged ItemContract Amount
Contract Amount Due
after One Year Fair Value
Interest rate swaps (fixed rate payment, floating rate receipt) Long-term bank loans ¥44,050 ¥29,050 *
March 31, 2013
Interest rate swaps (fixed rate payment, floating rate receipt) Long-term bank loans ¥42,050 ¥28,050 *
Thousands of U.S. Dollars
March 31, 2014 Hedged ItemContract Amount
Contract Amount Due
after One Year Fair Value
Interest rate swaps (fixed rate payment, floating rate receipt) Long-term bank loans $428,002 $282,258 *
*The information of the fair value of interest rate swaps is included in that of hedged items (see Note 13).

67AnnuAl RepoRt 2014
15. COMPREHENSIVE INCOME
Each component of other comprehensive income for the years ended March 31, 2014 and 2013, was as follows:
Millions of YenThousands of U.S. Dollars
2014 2013 2014
Unrealized gain on available-for-sale securities:Gains arising during the year ¥3,784 ¥ 3,036 $36,766
Reclassification adjustments to profit or loss (1) 1,176 (9)
Amount before income tax effect 3,783 4,212 36,757Income tax effect (845) (1,013) (8,209)
Total ¥2,938 ¥ 3,199 $28,548
Foreign currency translation adjustments:
Adjustments arising during the year ¥1,408 ¥ 1,035 $13,682Total other comprehensive income ¥4,346 ¥ 4,234 $42,230
16. NET INCOME PER SHARE
Reconciliation of the differences between basic and diluted net income per share (“EPS”) for the years ended March 31, 2014 and
2013, is as follows:
Millions of YenThousands of
Shares Yen U.S. Dollars
Year Ended March 31, 2014 Net IncomeWeighted-
average Shares EPS
Basic EPS—Net income available to common shareholders ¥34,776 422,941 ¥82.22 $0.80
Effect of dilutive securities—Convertible bonds 10,811
Diluted EPS—Net income for computation ¥34,776 433,752 ¥80.18 $0.78
Year Ended March 31, 2013
Basic EPS—Net income available to common shareholders ¥35,144 429,377 ¥81.85
Effect of dilutive securities—Convertible bonds 10,811
Diluted EPS—Net income for computation ¥35,144 440,188 ¥79.84
17. SEGMENT INFORMATION
(1) Description of Reportable Segments
The Group identifies operating segments as units of segment reporting for which discrete financial information is available and
whose operating results are regularly reviewed by the Board of Directors, in order to make decisions about resources to be allocated
to the segment and assess its performance.
The Company, as a pure holding company, forms six business formations classified according to each business contents and
manages based on these business formations. The Group categorizes as the six reporting segments, “Delivery,” “BIZ-Logistics,”
“Home Convenience,” “e-Business,” “Financial,” and “Autoworks” based on the above policy.
“Autoworks” changed its segment name from “Truck Maintenance” starting from the fiscal year ended March 31, 2014.
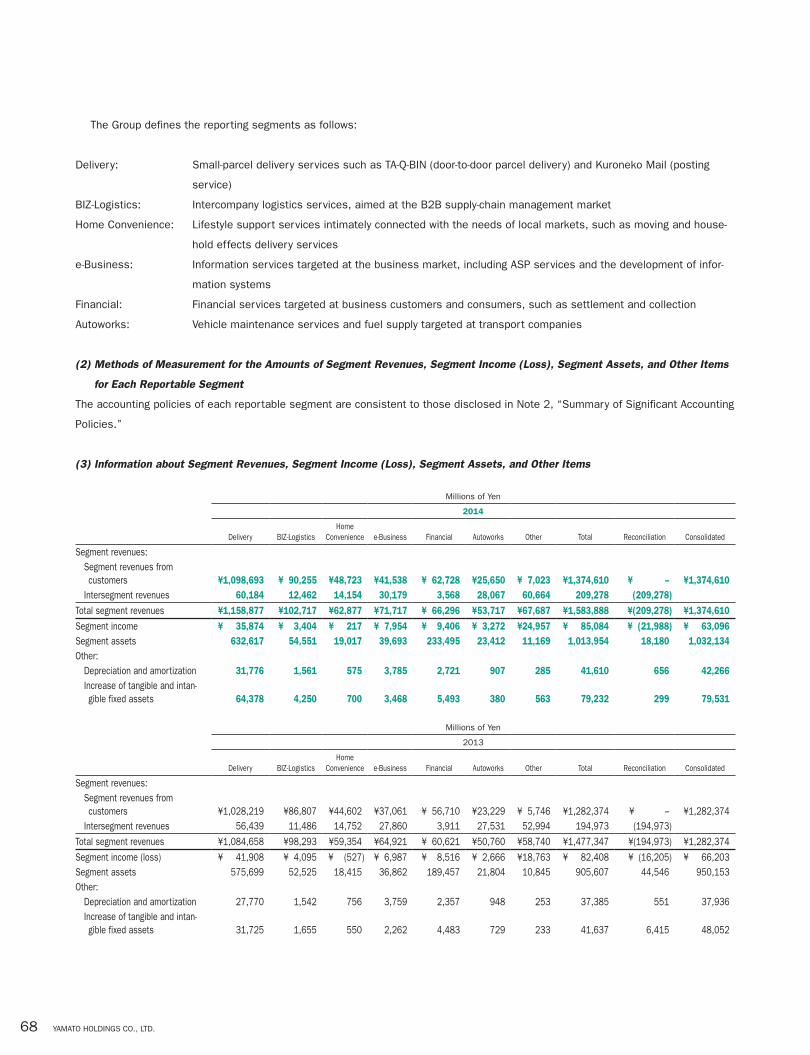
68 Yamato Holdings Co., ltd.
The Group defines the reporting segments as follows:
Delivery: Small-parcel delivery services such as TA-Q-BIN (door-to-door parcel delivery) and Kuroneko Mail (posting
service)
BIZ-Logistics: Intercompany logistics services, aimed at the B2B supply-chain management market
Home Convenience: Lifestyle support services intimately connected with the needs of local markets, such as moving and house-
hold effects delivery services
e-Business: Information services targeted at the business market, including ASP services and the development of infor-
mation systems
Financial: Financial services targeted at business customers and consumers, such as settlement and collection
Autoworks: Vehicle maintenance services and fuel supply targeted at transport companies
(2) Methods of Measurement for the Amounts of Segment Revenues, Segment Income (Loss), Segment Assets, and Other Items
for Each Reportable Segment
The accounting policies of each reportable segment are consistent to those disclosed in Note 2, “Summary of Significant Accounting
Policies.”
(3) Information about Segment Revenues, Segment Income (Loss), Segment Assets, and Other Items
Millions of Yen
2014
Delivery BIZ-LogisticsHome
Convenience e-Business Financial Autoworks Other Total Reconciliation Consolidated
Segment revenues:
Segment revenues from customers ¥1,098,693 ¥ 90,255 ¥48,723 ¥41,538 ¥ 62,728 ¥25,650 ¥ 7,023 ¥1,374,610 ¥ – ¥1,374,610
Intersegment revenues 60,184 12,462 14,154 30,179 3,568 28,067 60,664 209,278 (209,278)
Total segment revenues ¥1,158,877 ¥102,717 ¥62,877 ¥71,717 ¥ 66,296 ¥53,717 ¥67,687 ¥1,583,888 ¥(209,278) ¥1,374,610
Segment income ¥ 35,874 ¥ 3,404 ¥ 217 ¥ 7,954 ¥ 9,406 ¥ 3,272 ¥24,957 ¥ 85,084 ¥ (21,988) ¥ 63,096Segment assets 632,617 54,551 19,017 39,693 233,495 23,412 11,169 1,013,954 18,180 1,032,134Other:
Depreciation and amortization 31,776 1,561 575 3,785 2,721 907 285 41,610 656 42,266Increase of tangible and intan-gible fixed assets 64,378 4,250 700 3,468 5,493 380 563 79,232 299 79,531
Millions of Yen
2013
Delivery BIZ-LogisticsHome
Convenience e-Business Financial Autoworks Other Total Reconciliation Consolidated
Segment revenues:
Segment revenues from customers ¥1,028,219 ¥86,807 ¥44,602 ¥37,061 ¥ 56,710 ¥23,229 ¥ 5,746 ¥1,282,374 ¥ – ¥1,282,374
Intersegment revenues 56,439 11,486 14,752 27,860 3,911 27,531 52,994 194,973 (194,973)
Total segment revenues ¥1,084,658 ¥98,293 ¥59,354 ¥64,921 ¥ 60,621 ¥50,760 ¥58,740 ¥1,477,347 ¥(194,973) ¥1,282,374
Segment income (loss) ¥ 41,908 ¥ 4,095 ¥ (527) ¥ 6,987 ¥ 8,516 ¥ 2,666 ¥18,763 ¥ 82,408 ¥ (16,205) ¥ 66,203
Segment assets 575,699 52,525 18,415 36,862 189,457 21,804 10,845 905,607 44,546 950,153
Other:
Depreciation and amortization 27,770 1,542 756 3,759 2,357 948 253 37,385 551 37,936
Increase of tangible and intan-gible fixed assets 31,725 1,655 550 2,262 4,483 729 233 41,637 6,415 48,052

69AnnuAl RepoRt 2014
Thousands of U.S. Dollars
2014
Delivery BIZ-LogisticsHome
Convenience e-Business Financial Autoworks Other Total Reconciliation Consolidated
Segment revenues:
Segment revenues from customers $10,675,214 $876,941 $473,408 $403,594 $ 609,483 $249,227 $ 68,236 $13,356,103 $ – $13,356,103
Intersegment revenues 584,767 121,087 137,527 293,227 34,663 272,705 589,432 2,033,408 (2,033,408)
Total segment revenues $11,259,981 $998,028 $610,935 $696,821 $ 644,146 $521,932 $657,668 $15,389,511 $(2,033,408) $13,356,103
Segment income $ 348,559 $ 33,073 $ 2,113 $ 77,284 $ 91,386 $ 31,795 $242,489 $ 826,699 $ (213,636) $ 613,063Segment assets 6,146,692 530,029 184,776 385,670 2,268,706 227,474 108,521 9,851,868 176,641 10,028,509Other:
Depreciation and amortization 308,745 15,166 5,591 36,779 26,434 8,809 2,766 404,290 6,378 410,668Increase of tangible and intan-gible fixed assets 625,510 41,296 6,804 33,693 53,369 3,696 5,475 769,843 2,902 772,745
Notes: “Other” includes JITBOX charter services, staffing services, and shared services.
Segment revenues and segment income of “Other” include dividends for the years ended March 31, 2014 and 2013, of ¥24,105 million ($234,208 thou-
sand) and ¥17,553 million, respectively, which the Company received from its subsidiaries as a pure holding company.
Reconciliations are as follows:
(1) Reconciliations of segment income for the years ended March 31, 2014 and 2013, of ¥21,988 million ($213,636 thousand) and ¥16,205 million,
respectively, are intersegment eliminations.
(2) Reconciliations of segment assets at March 31, 2014 and 2013, of ¥18,180 million ($176,641 thousand) and ¥44,546 million, respectively, include
intersegment eliminations of ¥143,258 million ($1,391,937 thousand) and ¥118,389 million, and corporate assets which are not allocated to each
reporting segments of ¥161,438 million ($1,568,578 thousand) and ¥162,935 million, respectively.
(3) Reconciliations of increases of tangible and intangible fixed assets at March 31, 2014 and 2013, of ¥299 million ($2,902 thousand) and ¥6,415
million, respectively, are the Company’s capital investment.
Segment income is reconciled with the consolidated statement of income.
[Related Information about Reporting Segments]
(1) Information about products and services
Operating revenues from customers for the years ended March 31, 2014 and 2013, are as follows:
Millions of Yen
2014 2013
TA-Q-BIN Kuroneko Mail Other Total TA-Q-BIN Kuroneko Mail Other Total
¥906,057 ¥120,800 ¥347,753 ¥1,374,610 ¥831,083 ¥122,277 ¥329,014 ¥1,282,374
Thousands of U S. Dollars
2014
TA-Q-BIN Kuroneko Mail Other Total
$8,803,507 $1,173,726 $3,378,870 $13,356,103

70 Yamato Holdings Co., ltd.
(2) Information about geographical areas
Operating revenues for the years ended March 31, 2014 and 2013, are as follows:
Millions of Yen
2014 2013
Japan North America Other Total Japan North America Other Total
¥1,349,718 ¥10,461 ¥14,431 ¥1,374,610 ¥1,259,728 ¥9,545 ¥13,101 ¥1,282,374
Thousands of U.S. Dollars
2014
Japan North America Other Total
$13,114,248 $101,637 $140,218 $13,356,103
Property, plant and equipment at March 31, 2014 and 2013, are as follows:
Millions of Yen
2014 2013
Japan North America Other Total Japan North America Other Total
¥415,013 ¥386 ¥1,729 ¥417,128 ¥380,952 ¥300 ¥1,905 ¥383,157
Thousands of U.S. Dollars
2014
Japan North America Other Total
$4,032,386 $3,748 $16,799 $4,052,933
(3) Information about impairment losses of long‑lived assets by reporting segments
Impairment losses of long-lived assets by reporting segments for the years ended March 31, 2014 and 2013, are as follows:
Millions of Yen
2014
DeliveryBIZ-
LogisticsHome
Convenience e-Business Financial Autoworks Other TotalEliminations or
Corporate Consolidated
Impairment losses of long-lived assets ¥217 ¥217 ¥217
Millions of Yen
2013
DeliveryBIZ-
LogisticsHome
Convenience e-Business Financial Autoworks Other TotalEliminations or
Corporate Consolidated
Impairment losses of long-lived assets ¥357 ¥1,409 ¥3 ¥1,769 ¥1,769
Thousands of U.S. Dollars
2014
DeliveryBIZ-
LogisticsHome
Convenience e-Business Financial Autoworks Other TotalEliminations or
Corporate Consolidated
Impairment losses of long-lived assets $2,109 $2,109 $2,109

71AnnuAl RepoRt 2014
(4) Information about amortization and amounts of goodwill by reporting segments
Amortization and balance of goodwill by reporting segments for the year ended March 31, 2014, is not applicable, and for 2013, is
as follows:
Millions of Yen
2013
DeliveryBIZ-
LogisticsHome
Convenience e-Business Financial Autoworks Other TotalEliminations or
Corporate Consolidated
Amortization of goodwill ¥68 ¥104 ¥172 ¥172Amounts of goodwill
18. SUBSEQUENT EVENT
Appropriations of Retained Earnings
The following appropriation of retained earnings at March 31, 2014, was approved at the Company’s Board of Directors meeting
held on May 16, 2014:
Millions of YenThousands of U.S. Dollars
Year-end cash dividends, ¥12.00 ($0.12) per share ¥5,027 $48,847

72 Yamato Holdings Co., ltd.
To the Board of Directors ofYamato Holdings Co., Ltd.:
We have audited the accompanying consolidated balance sheet of Yamato Holdings Co., Ltd. and its consolidated subsidiaries as of March 31, 2014, and the related consolidated statements of income, comprehensive income, changes in equity, and cash flows for the year then ended, and a summary of significant accounting policies and other explanatory information, all expressed in Japanese yen.
Management’s Responsibility for the Consolidated Financial Statements
Management is responsible for the preparation and fair presentation of these consolidated financial statements in accordance with accounting principles generally accepted in Japan, and for such internal control as management determines is necessary to enable the preparation of consolidated financial statements that are free from material misstatement, whether due to fraud or error.
Auditor’s Responsibility
Our responsibility is to express an opinion on these consolidated financial statements based on our audit. We conducted our audit in accordance with auditing standards generally accepted in Japan. Those standards require that we plan and perform the audit to obtain reasonable assurance about whether the consolidated financial statements are free from material misstatement.
An audit involves performing procedures to obtain audit evidence about the amounts and disclosures in the consolidated financial statements. The procedures selected depend on the auditor’s judgment, including the assessment of the risks of material misstate-ment of the consolidated financial statements, whether due to fraud or error. In making those risk assessments, the auditor consid-ers internal control relevant to the entity’s preparation and fair presentation of the consolidated financial statements in order to design audit procedures that are appropriate in the circumstances, but not for the purpose of expressing an opinion on the effective-ness of the entity’s internal control. An audit also includes evaluating the appropriateness of accounting policies used and the rea-sonableness of accounting estimates made by management, as well as evaluating the overall presentation of the consolidated financial statements.
We believe that the audit evidence we have obtained is sufficient and appropriate to provide a basis for our audit opinion.
Opinion
In our opinion, the consolidated financial statements referred to above present fairly, in all material respects, the consolidated finan-cial position of Yamato Holdings Co., Ltd. and its consolidated subsidiaries as of March 31, 2014, and the consolidated results of their operations and their cash flows for the year then ended in accordance with accounting principles generally accepted in Japan.
Convenience Translation
Our audit also comprehended the translation of Japanese yen amounts into U.S. dollar amounts and, in our opinion, such translation has been made in accordance with the basis stated in Note 1 to the consolidated financial statements. Such U.S. dollar amounts are presented solely for the convenience of readers outside Japan.
June 6, 2014
Independent Auditor’s Report

73ANNuAL RePORT 2014
Head OfficeYamato Holdings Co., Ltd.16-10, Ginza 2-chome, Chuo-ku, Tokyo104-8125 JapanTelephone: 81-3-3541-4141Facsimile: 81-3-5565-3427
Common StockAuthorized: 1,787,541,000 sharesIssued: 454,684,992 shares
Stock Exchange ListingTokyo Stock exchange
Transfer Agent and RegistrarMizuho Trust & Banking Co., Ltd.
Annual MeetingThe annual meeting of shareholders is normally held in June in Tokyo, Japan.
AuditorDeloitte Touche Tohmatsu LLC
Principal ShareholdersPercentage of total shares outstanding
The Master Trust Bank of Japan, Ltd. (Trust Account) 6.33%
State Street Bank and Trust Company 505223 4.97%
Yamato employees’ Shareholding Association 4.02%
Japan Trustee Services Bank, Ltd. (Trust Account) 3.61%
Mizuho Bank, Ltd. 3.60%
Nippon Life Insurance Company 3.14%
Meiji Yasuda Life Insurance Company 2.70%
Yamato Trading-Partner Shareholding Association 2.11%
The Bank of New York Mellon SA/NV 10 1.55%
Sompo Japan Insurance Inc. 1.33%
Total 33.35%
Stock Price Range (Tokyo Stock Exchange)(Yen) (Yen)
11/40
500
1,000
1,500
2,500
2,000
16,000
14,000
12,000
10,000
8,000
6,000
20,000
7 10 12/1 4 7 10 13/1 4 7 10 14/1
18,000
n Stock Price Range (left scale) Average (left scale) Nikkei Stock Average (right scale)
As of March 31, 2014
Corporate Data
Advancing with “Value Networking ” design and forge a robust corporate culture
Printed in Japan
Annual Report 2014For the year ended March 31, 2014
YAM
ATO H
OLD
ING
S C
O., LTD
. Annual R
eport 2
01
4