advances nde techniques and reliability engineering
TRANSCRIPT
www.ndt.net - 3rd MENDT - Middle East Nondestructive Testing Conference & Exhibition - 27-30 Nov 2005 Bahrain, Manama
Advances NDE Techniques and Reliability Engineering Assessments for Piping and Storage Tanks in Refineries and Petrochemical Plants
Francesco Bresciani, Stefano Pinca, Chiara Servetto
Istituto Italiano della Saldatura Lungobisagno Istria, 15 – 16141 GENOA – ITALY (EU)
1 FOREWORD In the last years, the technological progress has given rise to a significant improvement of the consolidated
NDE techniques and to a noticeable development of new ones. The "Istituto Italiano della Saldatura" (IIS, Italian institute of welding) has defined an approach to detect and
to assess the reliability for components affected by service induced damages. Specifically IIS highlight his attention on piping and storage tanks, components neglected for many years by
the users, that nowadays, thanks also to the increased sensitivity towards the environment safeguard, have become strategic.
The paper is divided in three different parts: � in the first part, a survey on the modern diagnostic techniques used by IIS, showing their features and their
main applications, is presented; � in the second part, the procedure, developed by IIS for the evaluation of the reliability of corroded piping, is
reported. It takes into account all the inspection results, obtained applying several diagnostic techniques mentioned in the first part;
� in the third part, regarding to storage tanks, RBI methodology, according to API BRD 581 Appendix O (preliminary document), is explained; the methodology is used by IIS in order to define the inspection plans and consequentially put them in act using appropriate techniques of investigation.
2 ADVANCED NDE TECHNIQUES
2.1 Automatic Ultrasonic Testing Ultrasonic testing (UT) is the NDE method which has been mostly improved from the technological
progress in mechanic and electronic fields. Manual UT, even though it remains fundamental and often irreplaceable, has been put beside by automated
techniques, which provide an objective documentation of the test and allow a future reproducibility. Among the automated UT techniques existing today, the most applied are:
� T-SCAN technique (called also C-SCAN) � P-SCAN technique � TOFD technique
All the above techniques are usually applied with an automatic scanning which allows a systematic relative displacement of the ultrasonic beam, the material being tested by other than manual means.
T-SCAN technique
This technique shows a two-dimensional graphical presentation, in which the discontinuity echoes are displayed in a top view on the test surface. In the presentation, reflected pulses are shown as events.
T-Scan technique, with direct probes, is used to detect internal defects or to make corrosion mapping, produced by fabrication or service problems (for instance, wet H2S damage).
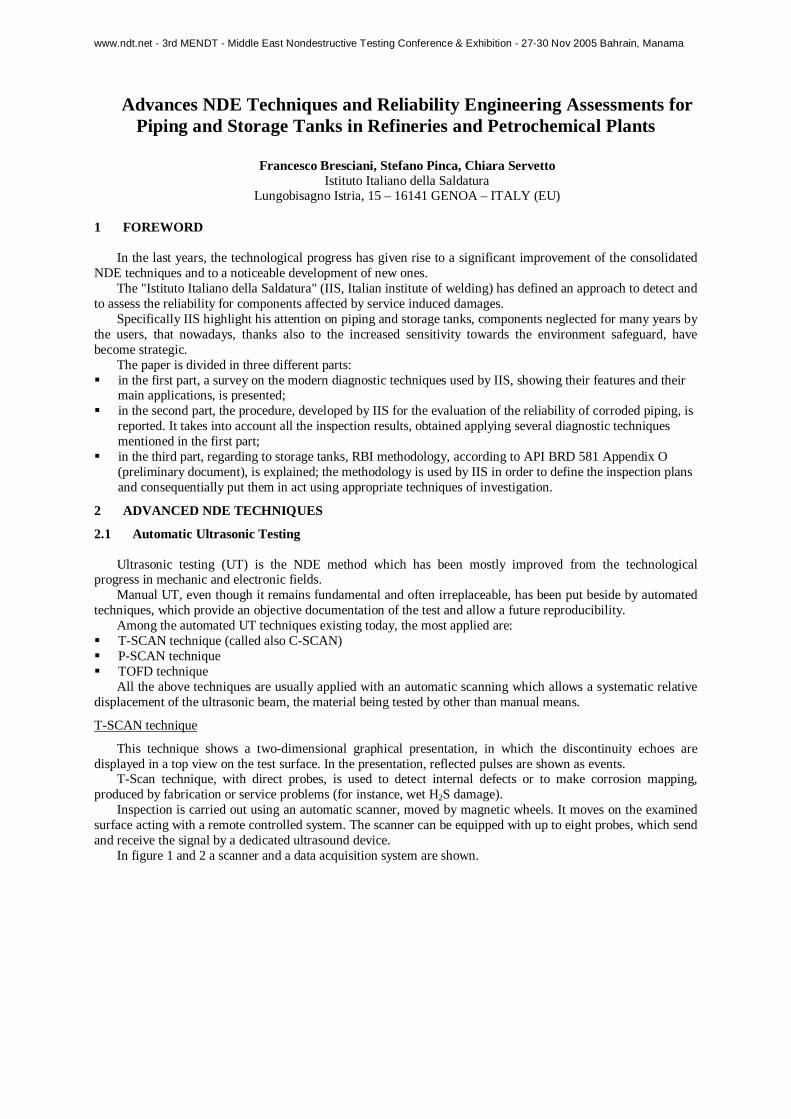
Inspection is carried out using an automatic scanner, moved by magnetic wheels. It moves on the examined surface acting with a remote controlled system. The scanner can be equipped with up to eight probes, which send and receive the signal by a dedicated ultrasound device.
In figure 1 and 2 a scanner and a data acquisition system are shown.
www.ndt.net - 3rd MENDT - Middle East Nondestructive Testing Conference & Exhibition - 27-30 Nov 2005 Bahrain, Manama
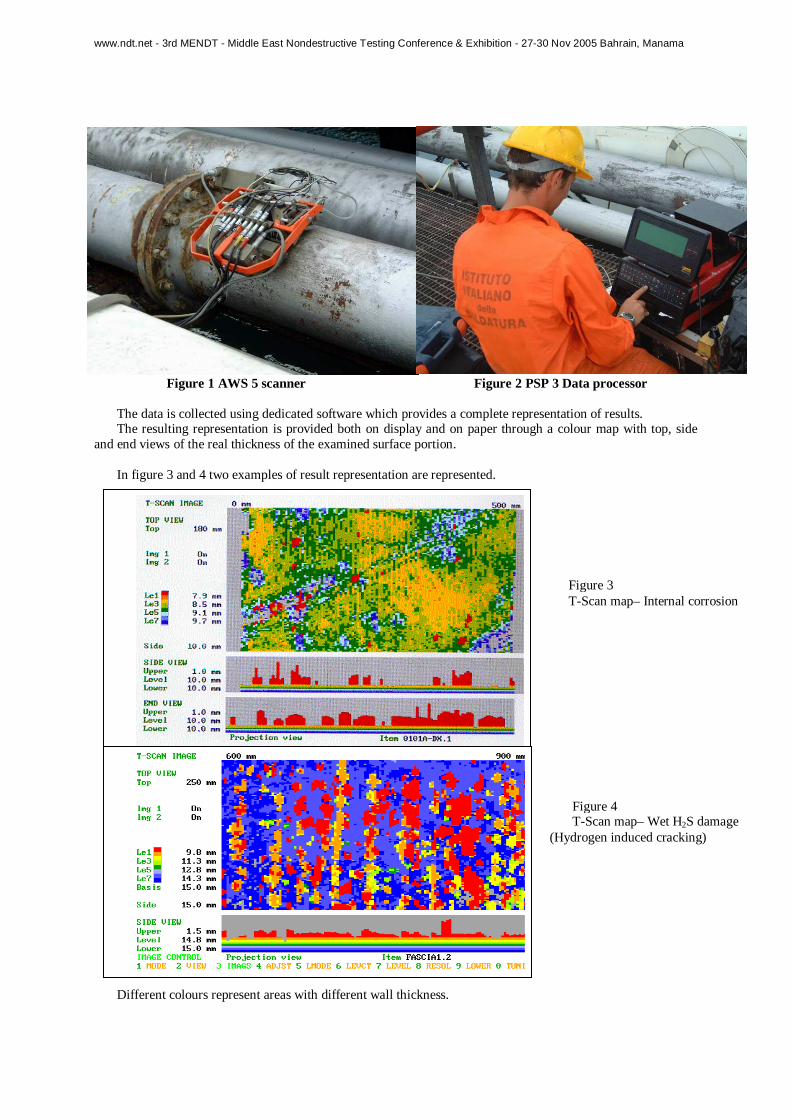
Figure 1 AWS 5 scanner Figure 2 PSP 3 Data processor The data is collected using dedicated software which provides a complete representation of results. The resulting representation is provided both on display and on paper through a colour map with top, side
and end views of the real thickness of the examined surface portion. In figure 3 and 4 two examples of result representation are represented. Different colours represent areas with different wall thickness.
Figure 3 T-Scan map– Internal corrosion
Figure 4 T-Scan map– Wet H2S damage
(Hydrogen induced cracking)

www.ndt.net - 3rd MENDT - Middle East Nondestructive Testing Conference & Exhibition - 27-30 Nov 2005 Bahrain, Manama
P-SCAN technique
The Projection Imaging Scanning is a projection of a B-scan result, which is performed in top view of the test piece, to any side view of the test piece. It is used for 3-D visualisation of defects. Ultrasonic weld inspection using P-scan imaging is mainly used for weld inspection with either a manual or a mechanised scanner.
P scan technique is normally applied using the same equipment previously described for T-scan, equipped with angular probes and with different software.
In figure 5 a welded joint inspection using P-scan is shown.
Figure 5 P-Scan map – Butt weld inspection (Detected defect: Lack of fusion) Also in this application, defects are shown in top and side views using different colours which represent half
path signal and full path signal coming from each probe. A lot of experience has been made in inspection of welds of vessels, LPG spheres, storage tanks, piping, etc. In figure 6 and 7 data collected from a LPG sphere and a defect found with P-scan inspection are
respectively reported.
Figure 6 P-scan application on LPG sphere welds
www.ndt.net - 3rd MENDT - Middle East Nondestructive Testing Conference & Exhibition - 27-30 Nov 2005 Bahrain, Manama
TOFD technique
Time-of-flight diffraction (TOFD) technique is an ultrasonic NDT technique, which was first described by Silk (1977).
This method relies on the diffraction of ultrasonic energies from “corners” and “ends” of internal structures
(primarily defects) in a component being tested. This technique is very useful for a proper measurement of height of internal indications but it is uncertain if TOFD is a reliable method for detection of defects.
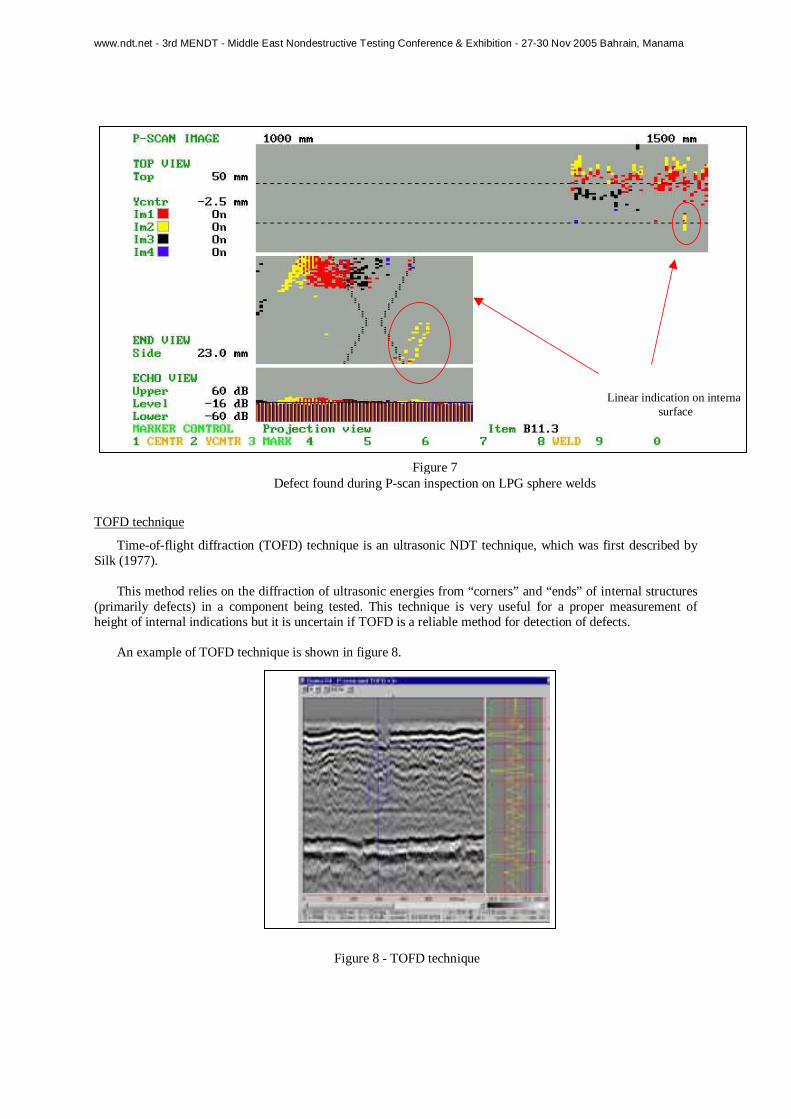
An example of TOFD technique is shown in figure 8.
Figure 8 - TOFD technique
Linear indication on internalsurface
Figure 7
Defect found during P-scan inspection on LPG sphere welds
www.ndt.net - 3rd MENDT - Middle East Nondestructive Testing Conference & Exhibition - 27-30 Nov 2005 Bahrain, Manama
2.2 Ultrasonic Guided Waves Systems A specific speech deserves the recent application of the ultrasonic guided waves for corrosion detection on
pipes. Guided ultrasonic technique involves transmitting ultrasonic Lamb waves along the pipe length. Using this
method several hundred feet of pipe can be inspected from a single location. The system has the ability to transmit waves from a remote single location of the pipe and inspect difficult areas, such as road crossings and insulated pipes. The technique is especially sensitive for detection of corrosion damage in pipes.
This equipment allows a rapid screening of the all pipe; screening tools for fast assessment of large parts of installations seem to have a growing inspection potential. Instead of spot checks, plant Users demand complete 100% inspection coverage of their installations; where conventional ultrasonic techniques, based on bulk wave propagation, have a limited range up to one meter, Lamb waves have the potential of propagating over much longer distances. In a confined geometry, such as a pipe, guided waves build up and can travel over tens of meters.
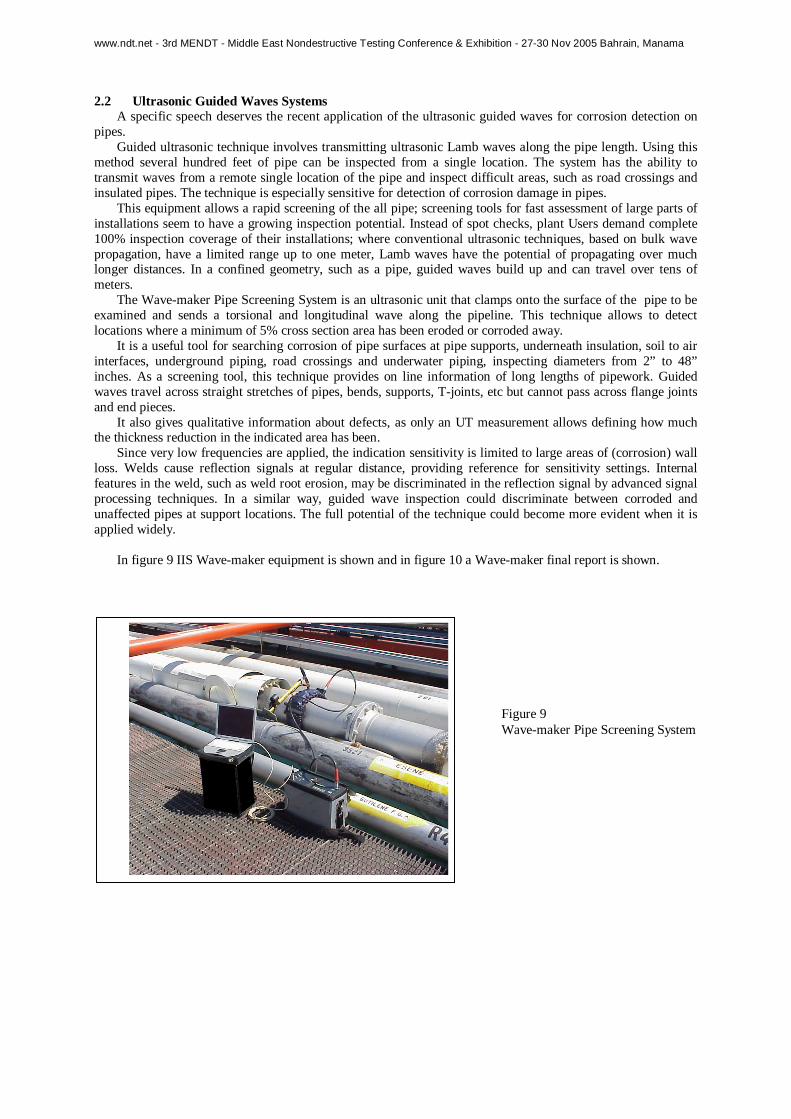
The Wave-maker Pipe Screening System is an ultrasonic unit that clamps onto the surface of the pipe to be examined and sends a torsional and longitudinal wave along the pipeline. This technique allows to detect locations where a minimum of 5% cross section area has been eroded or corroded away.
It is a useful tool for searching corrosion of pipe surfaces at pipe supports, underneath insulation, soil to air interfaces, underground piping, road crossings and underwater piping, inspecting diameters from 2” to 48” inches. As a screening tool, this technique provides on line information of long lengths of pipework. Guided waves travel across straight stretches of pipes, bends, supports, T-joints, etc but cannot pass across flange joints and end pieces.
It also gives qualitative information about defects, as only an UT measurement allows defining how much the thickness reduction in the indicated area has been.
Since very low frequencies are applied, the indication sensitivity is limited to large areas of (corrosion) wall loss. Welds cause reflection signals at regular distance, providing reference for sensitivity settings. Internal features in the weld, such as weld root erosion, may be discriminated in the reflection signal by advanced signal processing techniques. In a similar way, guided wave inspection could discriminate between corroded and unaffected pipes at support locations. The full potential of the technique could become more evident when it is applied widely.
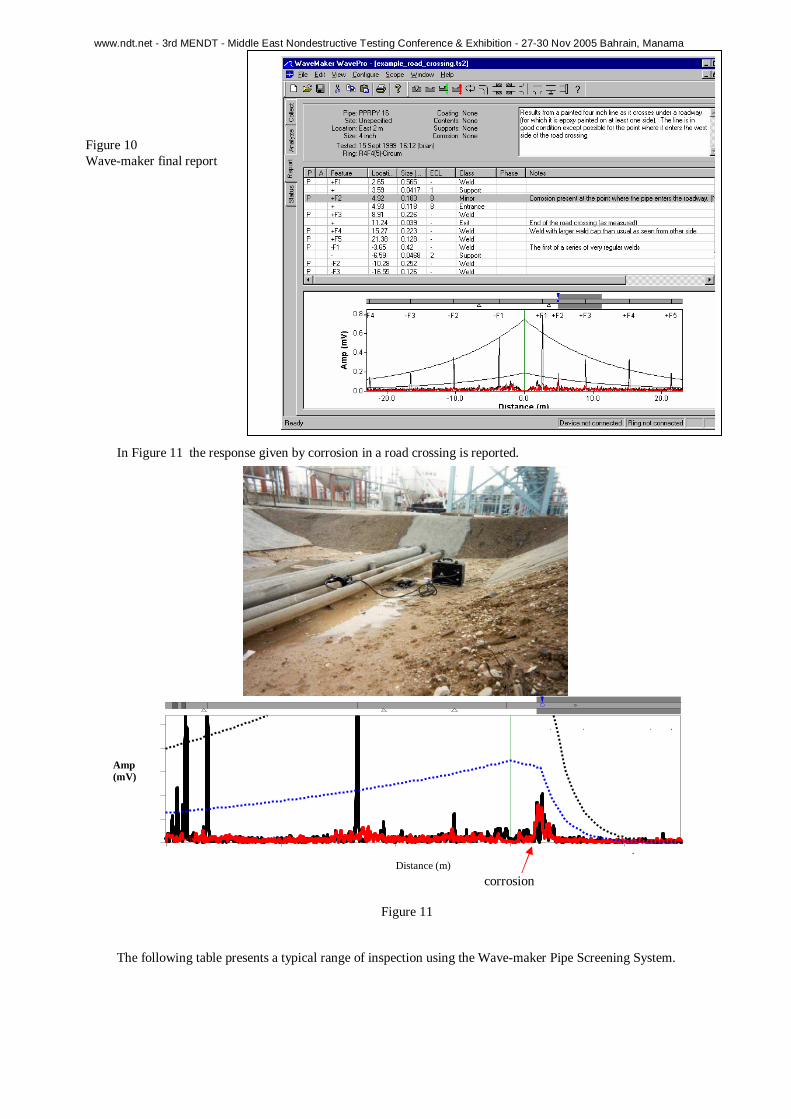
In figure 9 IIS Wave-maker equipment is shown and in figure 10 a Wave-maker final report is shown.
Figure 9 Wave-maker Pipe Screening System
www.ndt.net - 3rd MENDT - Middle East Nondestructive Testing Conference & Exhibition - 27-30 Nov 2005 Bahrain, Manama
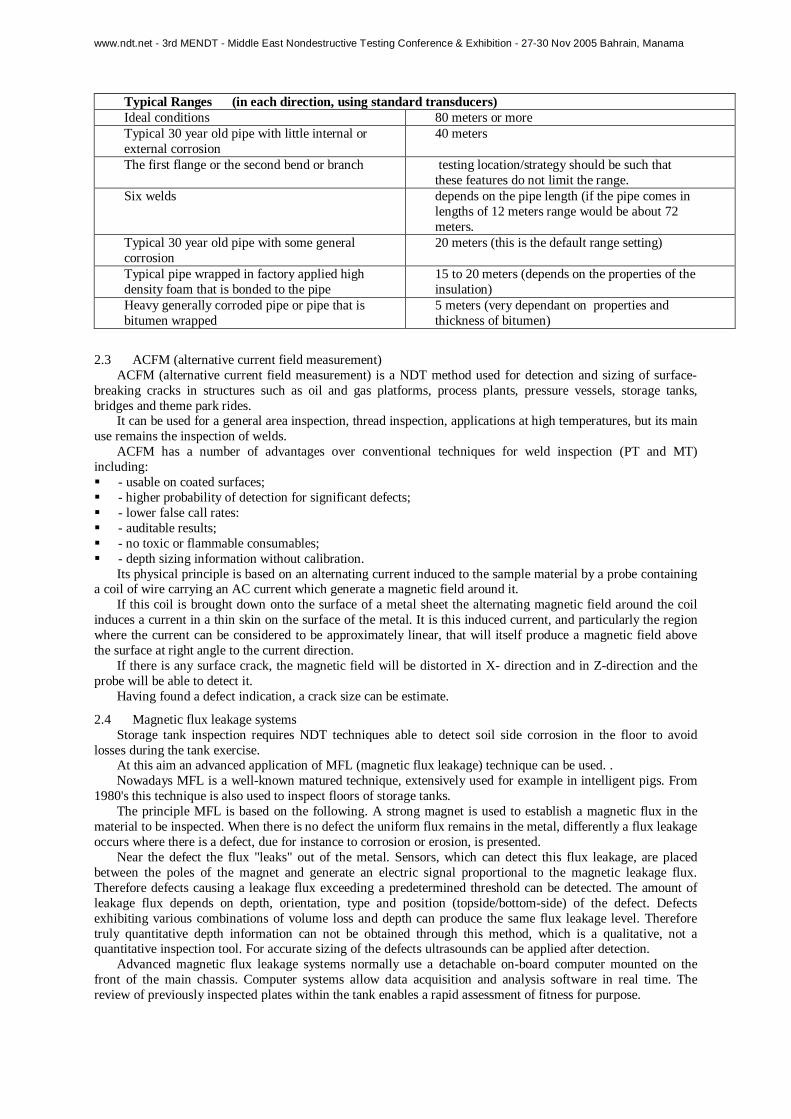
In Figure 11 the response given by corrosion in a road crossing is reported.
Figure 11
The following table presents a typical range of inspection using the Wave-maker Pipe Screening System.
Figure 10 Wave-maker final report
1 Distance (m)
Amp (mV)
+
+
+
+
corrosion
www.ndt.net - 3rd MENDT - Middle East Nondestructive Testing Conference & Exhibition - 27-30 Nov 2005 Bahrain, Manama
Typical Ranges (in each direction, using standard transducers) Ideal conditions 80 meters or more Typical 30 year old pipe with little internal or external corrosion
40 meters
The first flange or the second bend or branch testing location/strategy should be such that these features do not limit the range.
Six welds depends on the pipe length (if the pipe comes in lengths of 12 meters range would be about 72 meters.
Typical 30 year old pipe with some general corrosion
20 meters (this is the default range setting)
Typical pipe wrapped in factory applied high density foam that is bonded to the pipe
15 to 20 meters (depends on the properties of the insulation)
Heavy generally corroded pipe or pipe that is bitumen wrapped
5 meters (very dependant on properties and thickness of bitumen)
2.3 ACFM (alternative current field measurement) ACFM (alternative current field measurement) is a NDT method used for detection and sizing of surface-
breaking cracks in structures such as oil and gas platforms, process plants, pressure vessels, storage tanks, bridges and theme park rides.
It can be used for a general area inspection, thread inspection, applications at high temperatures, but its main use remains the inspection of welds.
ACFM has a number of advantages over conventional techniques for weld inspection (PT and MT) including: � - usable on coated surfaces; � - higher probability of detection for significant defects; � - lower false call rates: � - auditable results; � - no toxic or flammable consumables; � - depth sizing information without calibration.
Its physical principle is based on an alternating current induced to the sample material by a probe containing a coil of wire carrying an AC current which generate a magnetic field around it.
If this coil is brought down onto the surface of a metal sheet the alternating magnetic field around the coil induces a current in a thin skin on the surface of the metal. It is this induced current, and particularly the region where the current can be considered to be approximately linear, that will itself produce a magnetic field above the surface at right angle to the current direction.
If there is any surface crack, the magnetic field will be distorted in X- direction and in Z-direction and the probe will be able to detect it.
Having found a defect indication, a crack size can be estimate.
2.4 Magnetic flux leakage systems Storage tank inspection requires NDT techniques able to detect soil side corrosion in the floor to avoid
losses during the tank exercise. At this aim an advanced application of MFL (magnetic flux leakage) technique can be used. . Nowadays MFL is a well-known matured technique, extensively used for example in intelligent pigs. From
1980's this technique is also used to inspect floors of storage tanks. The principle MFL is based on the following. A strong magnet is used to establish a magnetic flux in the
material to be inspected. When there is no defect the uniform flux remains in the metal, differently a flux leakage occurs where there is a defect, due for instance to corrosion or erosion, is presented.
Near the defect the flux "leaks" out of the metal. Sensors, which can detect this flux leakage, are placed between the poles of the magnet and generate an electric signal proportional to the magnetic leakage flux. Therefore defects causing a leakage flux exceeding a predetermined threshold can be detected. The amount of leakage flux depends on depth, orientation, type and position (topside/bottom-side) of the defect. Defects exhibiting various combinations of volume loss and depth can produce the same flux leakage level. Therefore truly quantitative depth information can not be obtained through this method, which is a qualitative, not a quantitative inspection tool. For accurate sizing of the defects ultrasounds can be applied after detection.
Advanced magnetic flux leakage systems normally use a detachable on-board computer mounted on the front of the main chassis. Computer systems allow data acquisition and analysis software in real time. The review of previously inspected plates within the tank enables a rapid assessment of fitness for purpose.
www.ndt.net - 3rd MENDT - Middle East Nondestructive Testing Conference & Exhibition - 27-30 Nov 2005 Bahrain, Manama
3 IIS PROCEDURE FOR RELIABILITY EVALUATION OF CORRODE D PIPING Piping systems in petrochemical plants are usually inspected by means of a 100% visual examination and by
a spot ultrasonic thickness measurement inspection, in order to point out service anomalies and to control corrosion phenomena.
IIS has developed an approach for the evaluation of the reliability of corroded piping which takes into account all the inspection results. Criteria to determine the extension of the subsequent inspection interval are also given in function of the piping risk level.
3.1 Characteristics of piping The procedure has been finalised and is applicable to “unburied” piping system, typically interconnecting
pipe-works for petrochemical and refinery plants, with length over 50 meters. The piping systems are classified on the basis of the fluid hazard in the following three classes, with
reference to API 570: � class A: fluids having high potential hazard, whose leakage can lead to important damage to persons
and environment (explosive, highly flammable and toxic); � class B: fluids having medium hazard, whose leakage cause not serious damage to persons and things
(medium toxic, corrosive, obnoxious, fuel, medium flammable, steam and water at temperature greater than 110°C);
� class C: fluids having negligible hazard (irritant products).
3.2 Method of inspection The piping systems are inspected first of all by a 100% visual external examination and ultrasonic guided
waves which allow determining the critical points in of external and internal severe corrosion, large deformations, condition of supports, etc. Then a spot ultrasonic inspection is performed in order to measure the pipe remaining thickness. A detailed IIS procedure defining the frequency of the thickness measurement locations on straight pipes and bends is applied.
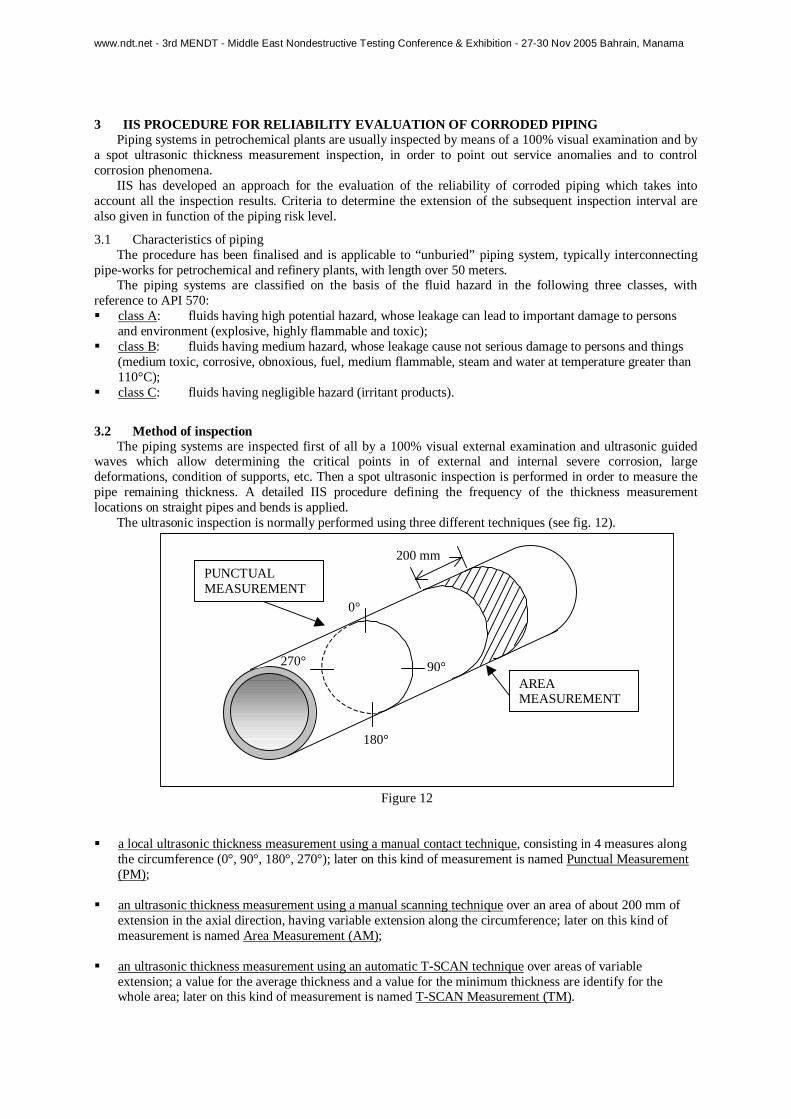
The ultrasonic inspection is normally performed using three different techniques (see fig. 12).
Figure 12
� a local ultrasonic thickness measurement using a manual contact technique, consisting in 4 measures along the circumference (0°, 90°, 180°, 270°); later on this kind of measurement is named Punctual Measurement (PM);
� an ultrasonic thickness measurement using a manual scanning technique over an area of about 200 mm of
extension in the axial direction, having variable extension along the circumference; later on this kind of measurement is named Area Measurement (AM);
� an ultrasonic thickness measurement using an automatic T-SCAN technique over areas of variable
extension; a value for the average thickness and a value for the minimum thickness are identify for the whole area; later on this kind of measurement is named T-SCAN Measurement (TM).
0°
90°
180°
270°
PUNCTUALMEASUREMENT
200 mm
AREAMEASUREMENT
www.ndt.net - 3rd MENDT - Middle East Nondestructive Testing Conference & Exhibition - 27-30 Nov 2005 Bahrain, Manama
In each case the value of thickness to be used for the calculation is the minimum value measured
on each section / area examined.
3.3 Procedure for the evaluation of the piping reliability The piping reliability is assessed by means of the following steps.
3.3.1 Geometrical and operational data In the case of lack of design geometrical information, actually not a rare situation, the first step of the work
is to associate a nominal value of thickness to each stretch of pipe on the grounds of the measurements performed (in particular referring to the maximum measured thickness, which is nearer to the original thickness) and of the scheduled values of thickness.
3.3.2 Minimum thickness evaluation The minimum resistant thickness is assessed through a proper procedure taking into account the main loads
which could occur on the piping (internal pressure, weight, impact loads, local load on supports). The objective of this procedure is to determine a value of thickness corresponding to an incipient collapse of the piping, to be used as an input value for the subsequent calculation of the piping failure probability. To this scope the usual safety factors foreseen by applicable standard are not used, and it is admitted that the most stressed fibre could reach the yield point.
3.3.3 Elaboration of the thickness measurement results The Punctual, Area and T-SCAN measurements have different effectiveness of detecting the minimum
remaining thickness of a stretch of piping. In order to obtain a larger but homogeneous set of values, to be used for the subsequent statistical evaluations, a series of comparing analyses is performed among the thickness measurements taken with the different techniques and a set of corrective coefficients was defined.
The statistical analysis led to the conclusion that the error performed by the Area measurement was negligible, while for Punctual measurements the error grew with the measured thickness value.
A series of corrective coefficients were calibrated for different corrosion condition of the piping and taking also into account the nominal pipe diameter. The following set of values was defined:
• for DN 100 and over and important corrosion phenomena:
− for measured thickness 63%NT and less: γ = 1 − for measured thickness between 63%NT and 86%NT: γ = 1.13 − for measured thickness 86%NT and over: γ = 1.27
• for DN 100 and over and normal corrosion phenomena: − for measured thickness 63%NT and less: γ = 1 − for measured thickness between 63%NT and 86%NT: γ = 1.07 − for measured thickness 86%NT and over: γ = 1.14
• for less than DN 100 pipelines the error is negligible, so no corrective coefficient must be applied.
Of course, when negligible internal corrosion was detected, no corrective coefficients have to be applied.
3.3.4 Statistical distribution of the thickness measurements Once the corrective coefficients are applied (if applicable), a list of comparable values is obtained. A further
step is to separate the different populations of measures, e.g. the ones relating to piping with different nominal thickness or different material, in order to have homogeneous values that could be analysed together. For each population containing a sufficient number of values a statistical distribution is determined; considering the kind of physical phenomenon, the Weibull function was chosen to represent the thickness measurement distribution. The Kolgomorov test is applied in order to test the goodness of fit, as it is efficient also in case of small samples.
www.ndt.net - 3rd MENDT - Middle East Nondestructive Testing Conference & Exhibition - 27-30 Nov 2005 Bahrain, Manama
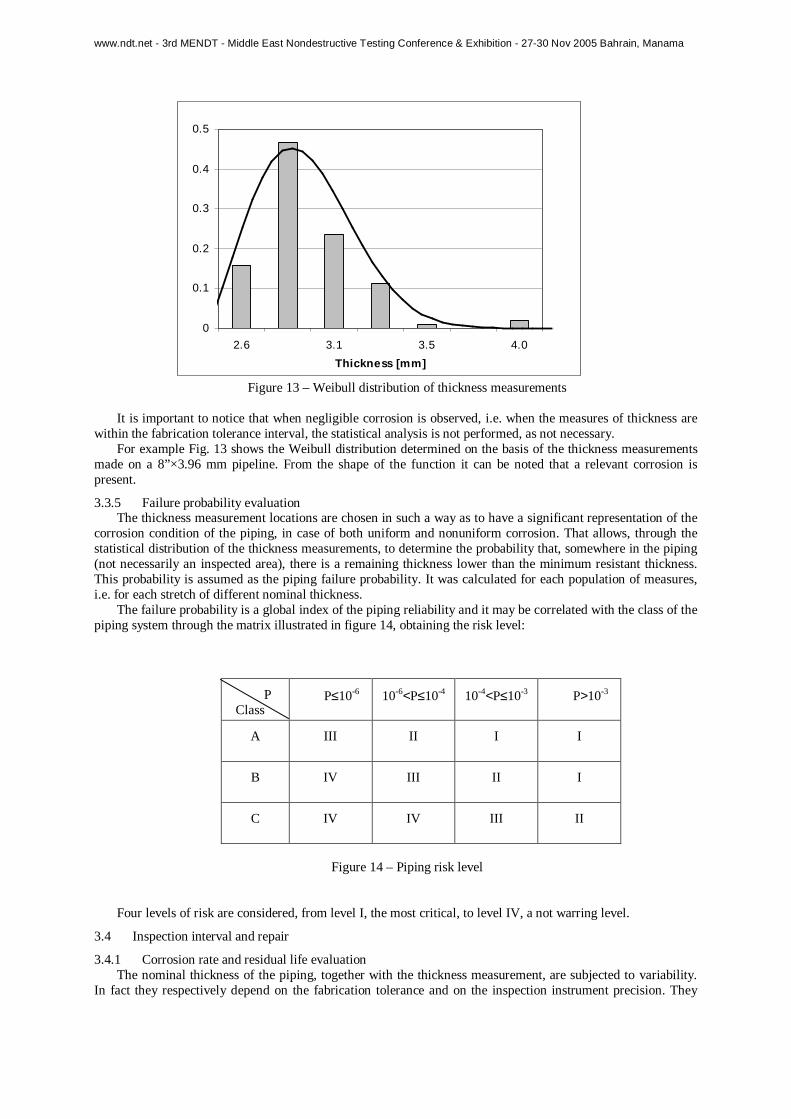
Figure 13 – Weibull distribution of thickness measurements It is important to notice that when negligible corrosion is observed, i.e. when the measures of thickness are
within the fabrication tolerance interval, the statistical analysis is not performed, as not necessary. For example Fig. 13 shows the Weibull distribution determined on the basis of the thickness measurements
made on a 8”×3.96 mm pipeline. From the shape of the function it can be noted that a relevant corrosion is present.
3.3.5 Failure probability evaluation The thickness measurement locations are chosen in such a way as to have a significant representation of the
corrosion condition of the piping, in case of both uniform and nonuniform corrosion. That allows, through the statistical distribution of the thickness measurements, to determine the probability that, somewhere in the piping (not necessarily an inspected area), there is a remaining thickness lower than the minimum resistant thickness. This probability is assumed as the piping failure probability. It was calculated for each population of measures, i.e. for each stretch of different nominal thickness.
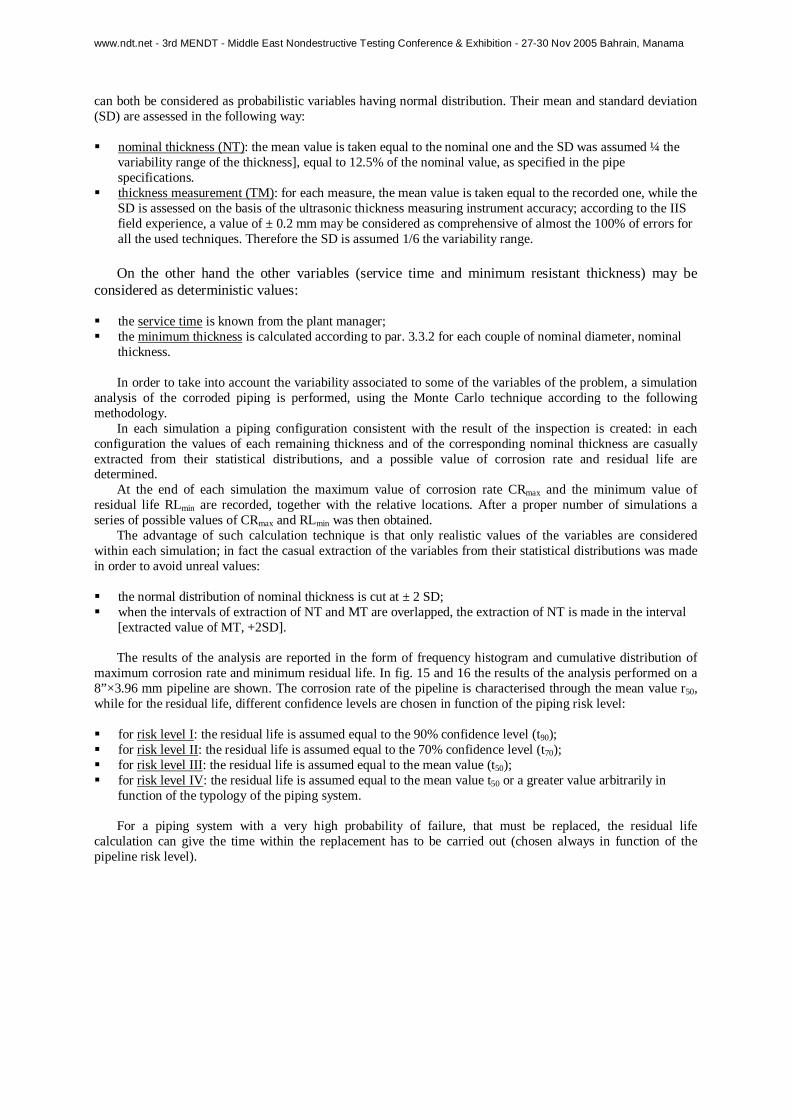
The failure probability is a global index of the piping reliability and it may be correlated with the class of the piping system through the matrix illustrated in figure 14, obtaining the risk level:
P Class
P≤10-6 10-6<P≤10-4 10-4<P≤10-3 P>10-3
A III II I I
B IV III II I
C IV IV III II
Figure 14 – Piping risk level
Four levels of risk are considered, from level I, the most critical, to level IV, a not warring level.
3.4 Inspection interval and repair
3.4.1 Corrosion rate and residual life evaluation The nominal thickness of the piping, together with the thickness measurement, are subjected to variability.
In fact they respectively depend on the fabrication tolerance and on the inspection instrument precision. They
0
0.1
0.2
0.3
0.4
0.5
2.6 3.1 3.5 4.0
Thickness [mm]
0
0.2
0.4
0.6
0.8
1
1.2
1.4
1.6
1.8
2.48 2.98 3.48 3.98
www.ndt.net - 3rd MENDT - Middle East Nondestructive Testing Conference & Exhibition - 27-30 Nov 2005 Bahrain, Manama
can both be considered as probabilistic variables having normal distribution. Their mean and standard deviation (SD) are assessed in the following way:
� nominal thickness (NT): the mean value is taken equal to the nominal one and the SD was assumed ¼ the
variability range of the thickness], equal to 12.5% of the nominal value, as specified in the pipe specifications.
� thickness measurement (TM): for each measure, the mean value is taken equal to the recorded one, while the SD is assessed on the basis of the ultrasonic thickness measuring instrument accuracy; according to the IIS field experience, a value of ± 0.2 mm may be considered as comprehensive of almost the 100% of errors for all the used techniques. Therefore the SD is assumed 1/6 the variability range.
On the other hand the other variables (service time and minimum resistant thickness) may be
considered as deterministic values:
� the service time is known from the plant manager; � the minimum thickness is calculated according to par. 3.3.2 for each couple of nominal diameter, nominal
thickness. In order to take into account the variability associated to some of the variables of the problem, a simulation
analysis of the corroded piping is performed, using the Monte Carlo technique according to the following methodology.
In each simulation a piping configuration consistent with the result of the inspection is created: in each configuration the values of each remaining thickness and of the corresponding nominal thickness are casually extracted from their statistical distributions, and a possible value of corrosion rate and residual life are determined.
At the end of each simulation the maximum value of corrosion rate CRmax and the minimum value of residual life RLmin are recorded, together with the relative locations. After a proper number of simulations a series of possible values of CRmax and RLmin was then obtained.
The advantage of such calculation technique is that only realistic values of the variables are considered within each simulation; in fact the casual extraction of the variables from their statistical distributions was made in order to avoid unreal values:
� the normal distribution of nominal thickness is cut at ± 2 SD; � when the intervals of extraction of NT and MT are overlapped, the extraction of NT is made in the interval
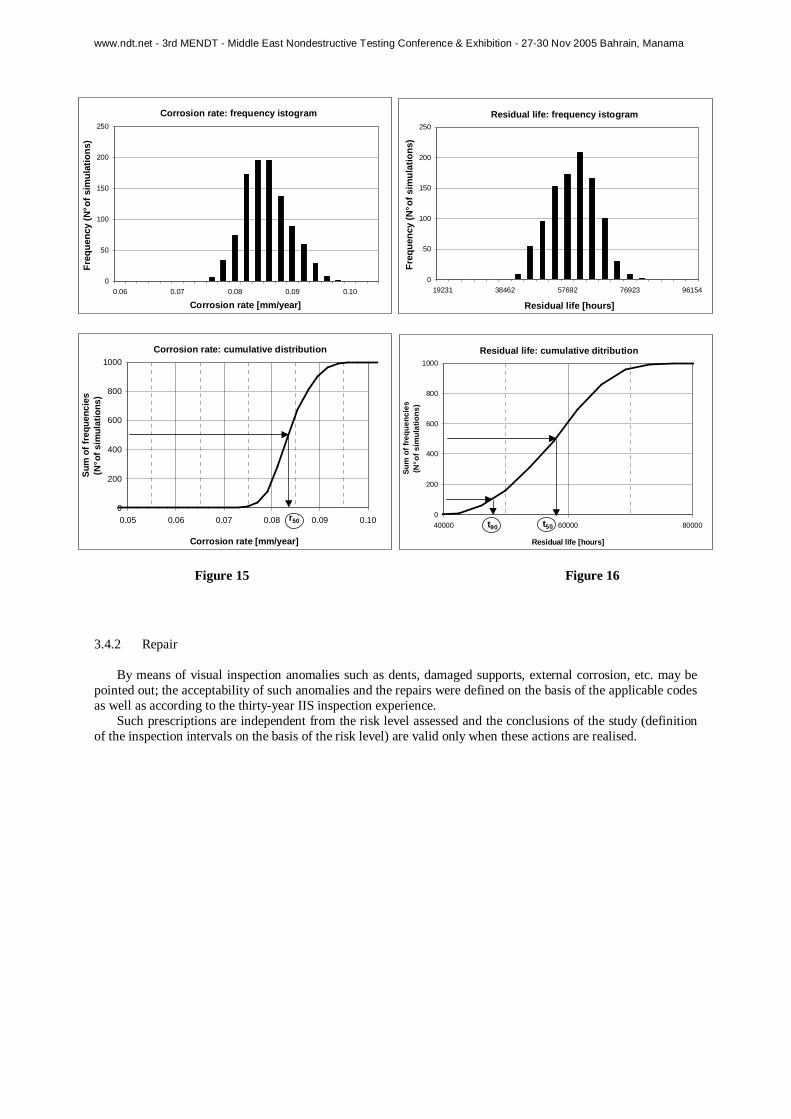
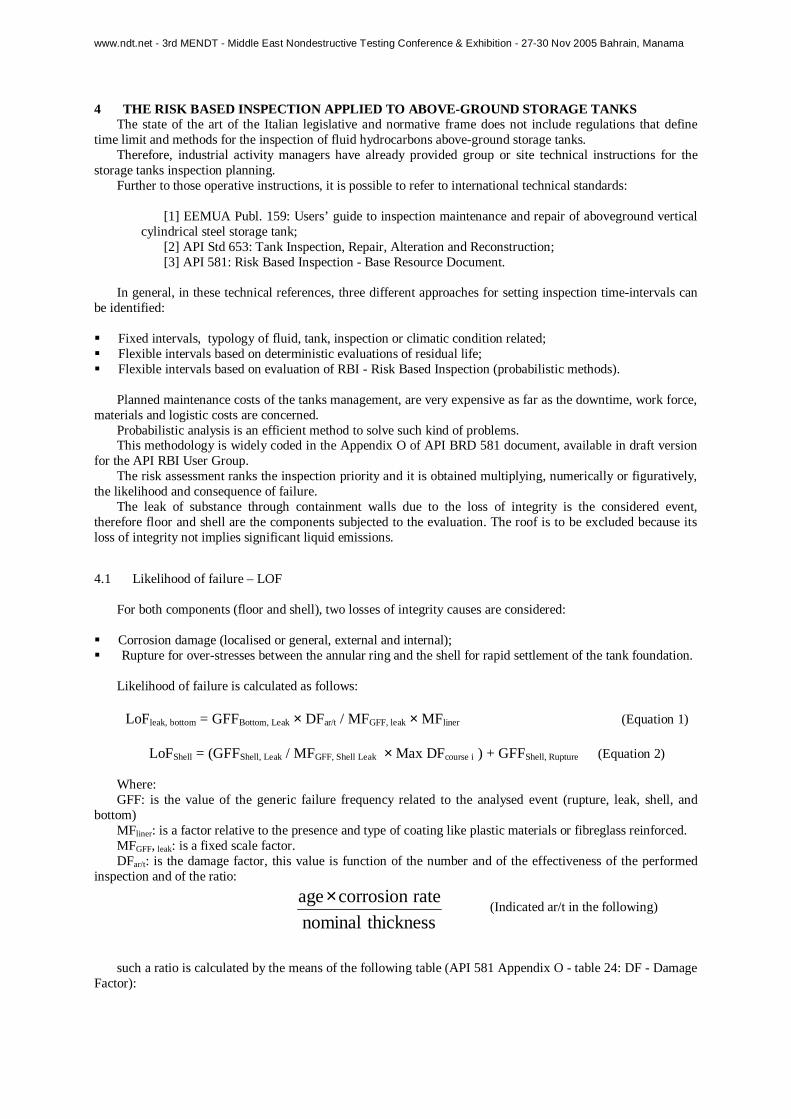
[extracted value of MT, +2SD]. The results of the analysis are reported in the form of frequency histogram and cumulative distribution of
maximum corrosion rate and minimum residual life. In fig. 15 and 16 the results of the analysis performed on a 8”×3.96 mm pipeline are shown. The corrosion rate of the pipeline is characterised through the mean value r50, while for the residual life, different confidence levels are chosen in function of the piping risk level:
� for risk level I: the residual life is assumed equal to the 90% confidence level (t90); � for risk level II: the residual life is assumed equal to the 70% confidence level (t70); � for risk level III: the residual life is assumed equal to the mean value (t50); � for risk level IV: the residual life is assumed equal to the mean value t50 or a greater value arbitrarily in
function of the typology of the piping system. For a piping system with a very high probability of failure, that must be replaced, the residual life
calculation can give the time within the replacement has to be carried out (chosen always in function of the pipeline risk level).
www.ndt.net - 3rd MENDT - Middle East Nondestructive Testing Conference & Exhibition - 27-30 Nov 2005 Bahrain, Manama
Figure 15 Figure 16
3.4.2 Repair By means of visual inspection anomalies such as dents, damaged supports, external corrosion, etc. may be
pointed out; the acceptability of such anomalies and the repairs were defined on the basis of the applicable codes as well as according to the thirty-year IIS inspection experience.
Such prescriptions are independent from the risk level assessed and the conclusions of the study (definition of the inspection intervals on the basis of the risk level) are valid only when these actions are realised.
Corrosion rate: frequency istogram
0
50
100
150
200
250
0.06 0.07 0.08 0.09 0.10
Corrosion rate [mm/year]
Fre
quen
cy (
N° o
f sim
ulat
ions
)
Corrosion rate: cumulative distribution
0
200
400
600
800
1000
0.05 0.06 0.07 0.08 0.09 0.10
Corrosion rate [mm/year]
Sum
of f
requ
enci
es
(N° o
f sim
ulat
ions
)
r50
Residual life: frequency istogram
0
50
100
150
200
250
19231 38462 57692 76923 96154
Residual life [hours]
Fre
quen
cy (
N° o
f sim
ulat
ions
)
Residual life: cumulative ditribution
0
200
400
600
800
1000
40000 60000 80000
Residual life [hours]
Sum
of f
requ
enci
es
(N° o
f sim
ulat
ions
)
t50t90
www.ndt.net - 3rd MENDT - Middle East Nondestructive Testing Conference & Exhibition - 27-30 Nov 2005 Bahrain, Manama
4 THE RISK BASED INSPECTION APPLIED TO ABOVE-GROUND S TORAGE TANKS The state of the art of the Italian legislative and normative frame does not include regulations that define
time limit and methods for the inspection of fluid hydrocarbons above-ground storage tanks. Therefore, industrial activity managers have already provided group or site technical instructions for the
storage tanks inspection planning. Further to those operative instructions, it is possible to refer to international technical standards:
[1] EEMUA Publ. 159: Users’ guide to inspection maintenance and repair of aboveground vertical cylindrical steel storage tank;
[2] API Std 653: Tank Inspection, Repair, Alteration and Reconstruction; [3] API 581: Risk Based Inspection - Base Resource Document.
In general, in these technical references, three different approaches for setting inspection time-intervals can be identified:
� Fixed intervals, typology of fluid, tank, inspection or climatic condition related; � Flexible intervals based on deterministic evaluations of residual life; � Flexible intervals based on evaluation of RBI - Risk Based Inspection (probabilistic methods).
Planned maintenance costs of the tanks management, are very expensive as far as the downtime, work force,
materials and logistic costs are concerned. Probabilistic analysis is an efficient method to solve such kind of problems. This methodology is widely coded in the Appendix O of API BRD 581 document, available in draft version
for the API RBI User Group. The risk assessment ranks the inspection priority and it is obtained multiplying, numerically or figuratively,
the likelihood and consequence of failure. The leak of substance through containment walls due to the loss of integrity is the considered event,
therefore floor and shell are the components subjected to the evaluation. The roof is to be excluded because its loss of integrity not implies significant liquid emissions.
4.1 Likelihood of failure – LOF For both components (floor and shell), two losses of integrity causes are considered:
� Corrosion damage (localised or general, external and internal); � Rupture for over-stresses between the annular ring and the shell for rapid settlement of the tank foundation.
Likelihood of failure is calculated as follows:
LoFleak, bottom = GFFBottom, Leak × DFar/t / MFGFF, leak × MFliner (Equation 1)
LoFShell = (GFFShell, Leak / MFGFF, Shell Leak × Max DFcourse i ) + GFFShell, Rupture (Equation 2)
Where: GFF: is the value of the generic failure frequency related to the analysed event (rupture, leak, shell, and
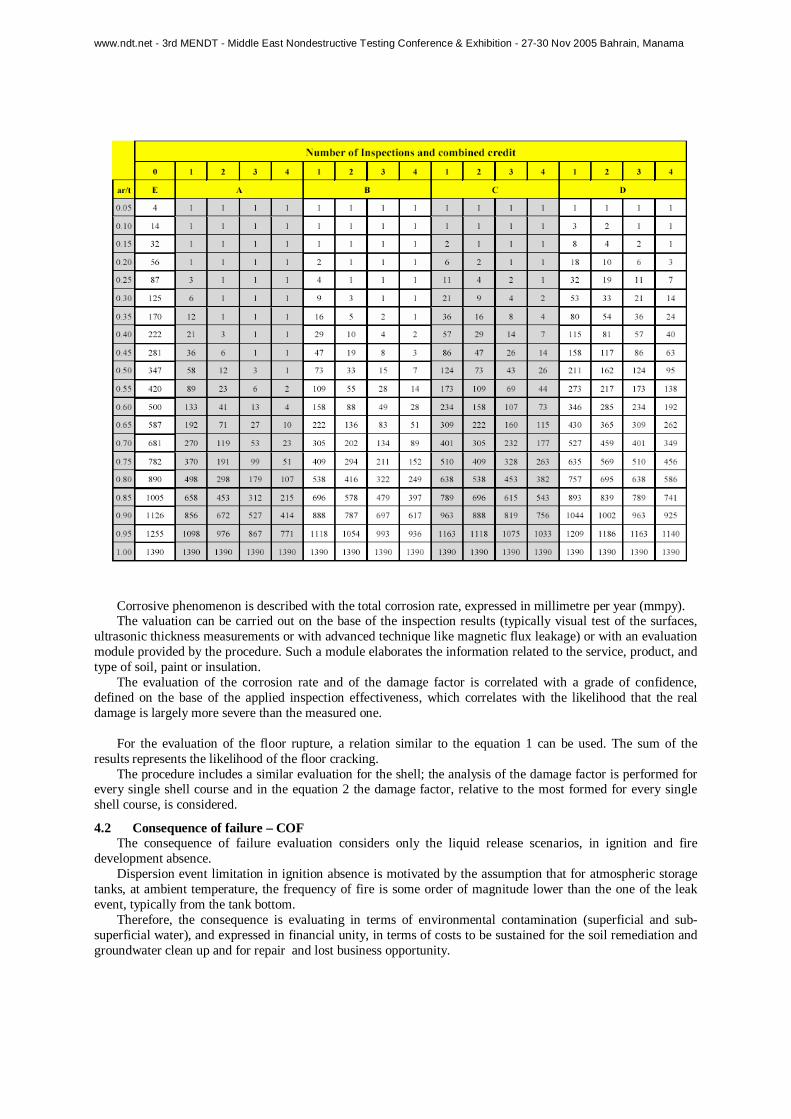
bottom) MFliner: is a factor relative to the presence and type of coating like plastic materials or fibreglass reinforced. MFGFF, leak: is a fixed scale factor. DFar/t: is the damage factor, this value is function of the number and of the effectiveness of the performed
inspection and of the ratio: (Indicated ar/t in the following) such a ratio is calculated by the means of the following table (API 581 Appendix O - table 24: DF - Damage
Factor):
thicknessnominal
ratecorrosion age×
www.ndt.net - 3rd MENDT - Middle East Nondestructive Testing Conference & Exhibition - 27-30 Nov 2005 Bahrain, Manama
Corrosive phenomenon is described with the total corrosion rate, expressed in millimetre per year (mmpy). The valuation can be carried out on the base of the inspection results (typically visual test of the surfaces,
ultrasonic thickness measurements or with advanced technique like magnetic flux leakage) or with an evaluation module provided by the procedure. Such a module elaborates the information related to the service, product, and type of soil, paint or insulation.
The evaluation of the corrosion rate and of the damage factor is correlated with a grade of confidence, defined on the base of the applied inspection effectiveness, which correlates with the likelihood that the real damage is largely more severe than the measured one.
For the evaluation of the floor rupture, a relation similar to the equation 1 can be used. The sum of the
results represents the likelihood of the floor cracking. The procedure includes a similar evaluation for the shell; the analysis of the damage factor is performed for
every single shell course and in the equation 2 the damage factor, relative to the most formed for every single shell course, is considered.
4.2 Consequence of failure – COF The consequence of failure evaluation considers only the liquid release scenarios, in ignition and fire
development absence. Dispersion event limitation in ignition absence is motivated by the assumption that for atmospheric storage
tanks, at ambient temperature, the frequency of fire is some order of magnitude lower than the one of the leak event, typically from the tank bottom.
Therefore, the consequence is evaluating in terms of environmental contamination (superficial and sub-superficial water), and expressed in financial unity, in terms of costs to be sustained for the soil remediation and groundwater clean up and for repair and lost business opportunity.
www.ndt.net - 3rd MENDT - Middle East Nondestructive Testing Conference & Exhibition - 27-30 Nov 2005 Bahrain, Manama
COF = Environmental clean-up cost + Environmental penalties cost + Lost business oppor-tunity cost + Repair costs
Environmental clean-up cost = ∑∑∑∑Area Volume of ProductArea X CUFArea
(CUF: Clean-up Factors; [$/bbl]) The downtime cost is referred to the cost of lost business for the lack of storage availability due to the down-
time of the tank. Repair cost is relative to replacement damaged parts, to the tank clean up and to derived materials
disposing. According to of the event typology (small leak or rupture) several scenarios are associated:
� Floor leak: contamination of the subsoil and of the ground water. � Rupture (floor or shell): surface contamination inside the dike and, due to the wave that overflows the dike,
contamination of the soil inside the refinery, outside and of the surrounding surface water. � Shell leak: surface contamination inside the dike.
For the first scenario, by means of a simplified hydraulic of liquid flow through 1/8" diameter hole, the quantity of the fluid adsorbed by soil and of the fluid that reaches the groundwater is evaluated, knowing the hydraulic conductivity of the soil sub-layer, the groundwater’s depth and reaction time.
The reaction time is the time between the start to release and the moment of leak detection and mitigation, estimated on the base of systems and procedures adopted.
In relation to the leak event from shell, the time to detection can be estimated on the base of the frequency of
the storage liquid control and product movements. The scenario of floor or shell rapid rupture is equivalent to an event of rapid release of all contained fluid.
The procedure evaluates the portion of the liquid that can overflow the dike, on the base of the ratio between tank volume and dike contained volume.
The quantity of released fluid is translated in costs of clean-up, with a unitary clean-up factor relative at every scenario of contamination.
4.3 Risk definition Risk is represented in two different forms.
� Quantitatively: by numerical product of the adjusted failure frequency, for the financial consequence. The value obtained includes every scenario of leakage and of rupture, both floor and shell.
Risk = LOF x COF [$/year]
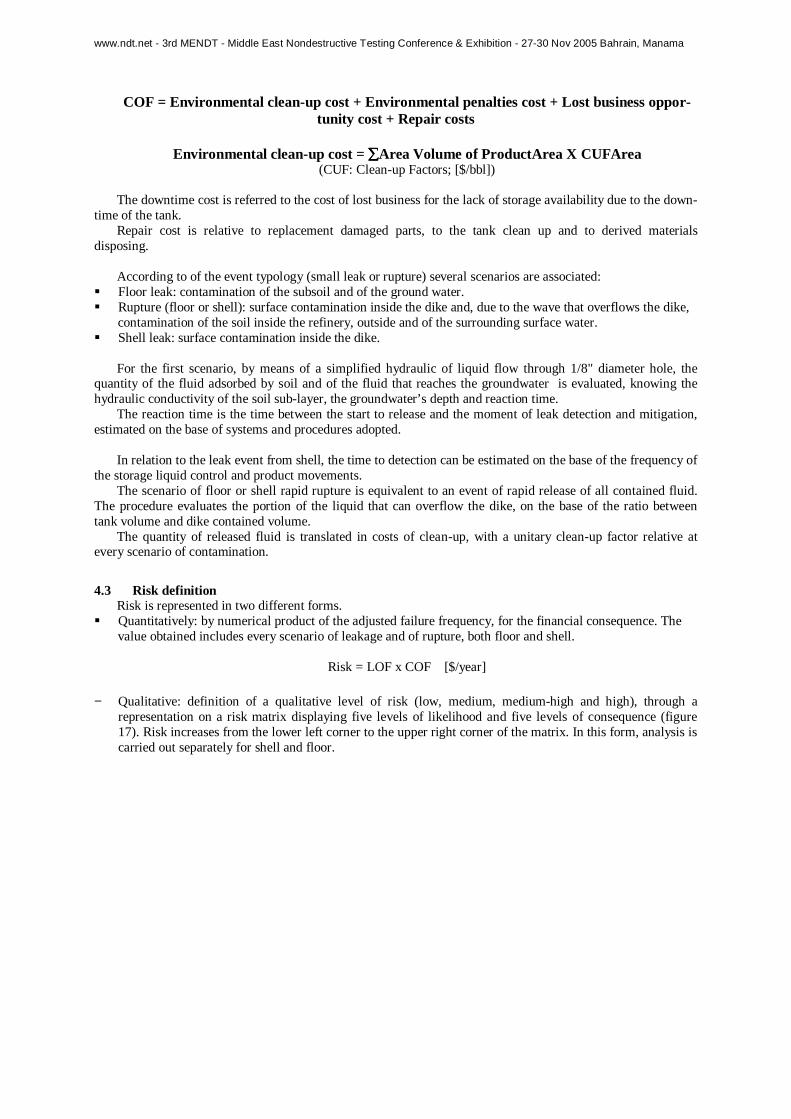
− Qualitative: definition of a qualitative level of risk (low, medium, medium-high and high), through a representation on a risk matrix displaying five levels of likelihood and five levels of consequence (figure 17). Risk increases from the lower left corner to the upper right corner of the matrix. In this form, analysis is carried out separately for shell and floor.
www.ndt.net - 3rd MENDT - Middle East Nondestructive Testing Conference & Exhibition - 27-30 Nov 2005 Bahrain, Manama
LOF
COF
3
1
2
4
BA DC
5
E
Likelihood of failure LOF
(Damage Factor)
LOF Cat.
<2 1 2 ÷ 20 2
20 ÷ 100 3 100 ÷1000 4
>1000 5
Consequence of failure COF (Costs)
COF Cat.
<104 $ A
104 $÷105 $ B
105 $÷106 $ C
106 $÷107 $ D
>107 $ E
Fig.17 – Risk Matrix and LOF / COF definition
Risk is affected by time dependant damage mechanism, so an increasing trend function of time can be
observed. Therefore the first evaluation is referred at current state.
4.3.1 Inspection planning The definition of the next inspection date is based on a time-projection of the risk; in particular, at the same
damage condition (corrosion rate), the year when the expected risk reaches a maximum acceptable value, is identified. The valuation is performed by qualitative representation in a risk matrix.
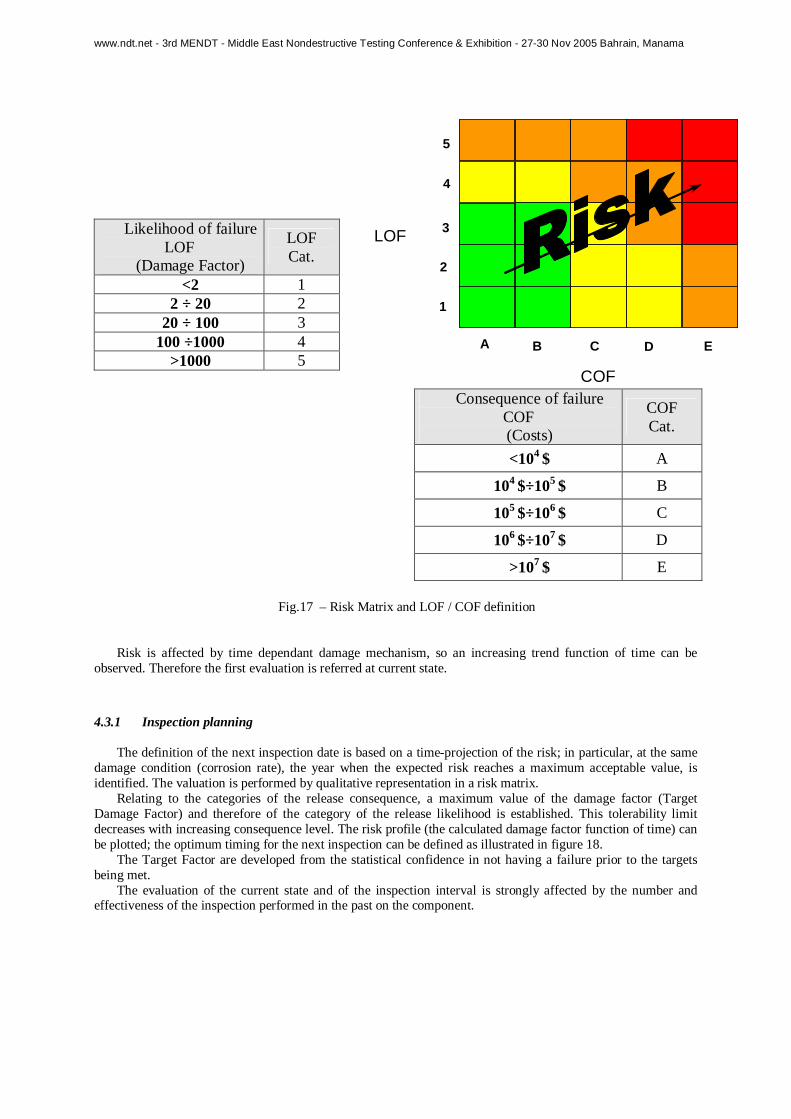
Relating to the categories of the release consequence, a maximum value of the damage factor (Target Damage Factor) and therefore of the category of the release likelihood is established. This tolerability limit decreases with increasing consequence level. The risk profile (the calculated damage factor function of time) can be plotted; the optimum timing for the next inspection can be defined as illustrated in figure 18.
The Target Factor are developed from the statistical confidence in not having a failure prior to the targets being met.
The evaluation of the current state and of the inspection interval is strongly affected by the number and effectiveness of the inspection performed in the past on the component.
www.ndt.net - 3rd MENDT - Middle East Nondestructive Testing Conference & Exhibition - 27-30 Nov 2005 Bahrain, Manama
COF Cat.
Target (Damage Factor)
A 415 B 335 C 250 D 165 E 85
Figure 18 –“Target” definition (limit values)
Therefore having defined the time/damage relation, the time to reach the risk target can be deduced and adopted for the inspection planning.
For the inspection strategy (technique and extension) the API document provides general indications aimed to apply techniques of higher effectiveness with the maximum extension.
This general statement is based on the ascertainment that the costs ascribed to the only complete inspection (internal and external) are significantly lower than the costs sustained for the predisposition of the tank inspection (outage and clean-up). As the latter is hardly affected by the inspection method and extension, the planning is aimed to maximise the service time of the tank; this result can be obtained if the inspection planning is supported by highly effective inspection methods which can assure a higher confidence level on the corrosion and lifetime estimation.
LOF
COF
3
1
2
4
BA DC
5
E
Target
Risk
timeCurrent Inspection
Target