advances in
TRANSCRIPT


Advances in Networks, Computing and Communications 6 Proceedings of the MSc/MRes Programmes from the School of Computing, Communications and Electronics
2007 - 2008
Editors Dr Paul S Dowland Prof Steven M Furnell School of Computing, Communications & Electronics University of Plymouth
ISBN: 978-1-84102-258-1

© 2009 University of Plymouth All rights reserved Printed in the United Kingdom
No part of this book may be reproduced, stored in a retrieval system, or transmitted in any form or by any means – electronic, mechanical, photocopy, recording or otherwise, without the prior written permission of the publisher or distributor.

i
Preface This book is the sixth in a series presenting research papers arising from MSc/MRes research projects undertaken by students of the School of Computing, Communications and Electronics at the University of Plymouth. These one year masters courses include a significant period of full-time project activity, and students are assessed on the basis of an MSc or MRes thesis, plus an accompanying research paper.
The publications in this volume are based upon research projects that were undertaken during the 2007/08 academic year. A total of 35 papers are presented, covering many aspects of modern networking and communication technology, including security, mobility, coding schemes and quality measurement. The expanded topic coverage compared to earlier volumes in this series reflects the broadening of our range of MSc programmes. Specifically contributing programmes are: Network Systems Engineering, Information Systems Security, Web Technologies and Security, Communications Engineering and Signal Processing, Computer Applications, Computing, Robotics, and Interactive Intelligent Systems
The authorship of the papers is credited to the MSc/MRes student in each case (appearing as the first named author), with other authors being the academic supervisors that had significant input into the projects. Indeed, the projects were conducted in collaboration with supervisors from the internationally recognised research groups within the School, and the underlying research projects are typically related to wider research initiatives with which these groups are involved. Readers interested in further details of the related research areas are therefore encouraged to make contact with the academic supervisors, using the contact details provided elsewhere in this publication.
Each of the papers presented here is also supported by a full MSc or MRes thesis, which contains more comprehensive details of the work undertaken and the results obtained. Copies of these documents are also in the public domain, and can generally be obtained upon request via inter-library loan.
We believe that these papers have value to the academic community, and we therefore hope that their publication in this volume will be of interest to you.
Steven Furnell and Paul Dowland School of Computing, Communications and Electronics University of Plymouth, May 2009

ii
About the School of Computing, Communications and Electronics
The School of Computing, Communication and Electronics has interests spanning the interface between computing and art, through software, networks, and communications to electronic engineering. The School contains 61 academic staff and has over 1000 students enrolled on its portfolio of taught courses, over 100 of which are at MSc level. In addition there is a similar number of postgraduate research students enrolled on a variety of research programmes, most of which enjoy sponsorship from external sources.
The bulk of the staff in the School are housed in the Portland Square building, a purpose built state of the art building costing over £25million and situated near the centre of the historic city of Plymouth on the University campus. The laboratories are located in the newly refurbished Smeaton Building, and the Clean room for nanotechnology also recently refurbished courtesy of a Wolfson Foundation grant is situated in the nearby Brunel Building. All buildings are a short walk from each other, enabling a close collaboration within our research community.
This School sits alongside two other Schools in the Faculty of Technology, the School of Engineering (the merged School of Civil and Structural Engineering and Department of Mechanical and Marine Engineering), and the School of Mathematics and Statistics. There are research and teaching links across all three schools as well as with the rest of the University. The closest links are with the Faculty of Science, principally the Centre for Computational and Theoretical Neuroscience which started in Computing, and Psychology through Artificial Intelligence and Human Computer Interaction research.
Prof. Steven Furnell Head of School

iii
Contributing Research Groups
Centre for Information Security and Network Research Head: Professor S M Furnell E-mail [email protected] Research interests:
1) Information systems security 2) Internet and Web technologies and applications 3) Mobile applications and services 4) Network management
http://www.cscan.org Centre for Interactive Intelligent Systems Head: Professor E Miranda & Professor A Cangelosi Email: [email protected] Research interests:
1) Natural language interaction and adaptive systems 2) Natural object categorisation 3) Adaptive behaviour and cognition 4) Visualisation 5) Semantic web
http://www.tech.plymouth.ac.uk/Research/computer_science_and_informatics/
Centre for Robotics and Intelligent Systems Head: Dr G Bugmann Email: [email protected] Research interests:
1) Cognitive systems 2) Social interaction and concept formation through human-robot
interaction 3) Artificial intelligence techniques and human-robot interfaces 4) Cooperative mobile robots 5) Visual perception of natural objects 6) Humanoid robots
http://www.tech.plymouth.ac.uk/socce/ris/ Fixed and Mobile Communications Head: Professor M Tomlinson BSc, PhD, CEng, MIEE E-mail: [email protected] Research interests:
1) Satellite communications 2) Wireless communications 3) Broadcasting 4) Watermarking 5) Source coding and data compression
http://www.tech.plymouth.ac.uk/see/research/satcen/sat.htm http://www.tech.plymouth.ac.uk/see/research/cdma/

iv
Interdisciplinary Centre for Computer Music Research Head: Professor E Miranda Email: [email protected] Research interests:
1) Computer-aided music composition 2) New digital musical instruments 3) Sound synthesis and processing 4) Music perception and the brain
http://cmr.soc.plymouth.ac.uk

Contents
v
Contents SECTION 1 Network Systems Engineering Improving the Usability of Security Features – a Survey of End Users M.O.Adjei and S.M.Furnell
3
Information Security Awareness and Culture Y.Al-Shehri and N.L.Clarke
12
Social Engineering Vulnerabilities T.Bakhshi and M.Papadaki
23
Vulnerability Awareness A.Edu and M.Papadaki
32
Network Security, Guidelines to Build a Security Perimeter for SMEs S.Godon and P.S.Dowland
40
Performance Analysis and Comparison of PESQ and 3SQM in Live 3G Mobile Networks M.Goudarzi and L.Sun
48
Investigation of Radio Access Bearer Dedicated Bandwidth and PDCP Compression on UMTS Networks and their Impact on SIP Session Delay A.Hadjicharalambous and X.Wang
56
Video Quality Analysis in 3G Mobile Networks M.Imran and L.Sun
64
Home Users Vulnerabilities in Audio/Video Players R.Jain and M.Papadaki
73
BER Performance of MPSK and MQAM in 2x2 Almouti MIMO System A.S.Mindaudu and M.A.Abu-Rgheff
83
CentOS Linux 5.2 and Apache 2.2 vs. Microsoft Windows Web Server 2008 and IIS 7.0 when Serving Static and PHP Content D.J.Moore and P.S.Dowland
92
Assessing the Usability of Security Features in Tools and Applications F.Moustafa and S.M.Furnell
98
Guidelines/Recommendations on Best Practices in Fine Tuning IDS Alarms C.A.Obi and M.Papadaki
107
Implementing Biometrics to Curb Examination Malpractices In Nigeria O.A.Odejobi and N.L.Clarke
115

Advances in Networks, Computing and Communications 6
vi
An Assessment of People’s Vulnerabilities in Relation to Personal and Sensitive Data B.G.Sanders and P.S.Dowland
124
Internet Security: A View from ISPs and Retailers R.Shams and S.M.Furnell
135
Improving Awareness on Social Engineering Attacks A.Smith and M.Papadaki
144
An Assessment of Security Advisory Website J.Thomas and S.M.Furnell
152
Response of Software Vendors to Vulnerabilities G.Erebor and M.Papadaki
160
SECTION 2 Information Systems Security & Web
Technologies and Security Information Security Leakage: A Forensic Analysis of USB Storage Disks A.Adam and N.L.Clarke
171
Digital Watermarking with Side Information I.Al-Houshi and M.A.Ambroze
179
Smartphone Deployment of Keystroke Analysis A.Buchoux and N.L.Clarke
190
Information Revelation and Computer-Mediated Communication in Online Social Networks R.J.Davey and A.D.Phippen
198
School Children! A Security Aware Generation? J.W.G.Littlejohns and N.L.Clarke
206
Comparative Study and Evaluation of Six Face Recognition Algorithms with a View of their Application on Mobile Phones N.Mahmoud and N.L.Clarke
212
Implementation of the Least Privilege Principle on Windows XP, Windows Vista and Linux L.Scalbert and P.S.Dowland
226
Design and Development of Hard Disk Images for use in Computer Forensics S.Siddiqui and N.L.Clarke
234

Contents
vii
SECTION 3 Communications Engineering and Signal Processing
Article Surveillance Magnetic Marker with Built-In Security M.Gaschet and L.Panina
245
Peak-to-Average Power Ratio Reduction in OFDM Using Cyclic Coding P.Henrys d’Aubigny d’Esmyards and M.A.Abu-Rgheff
253
Brain-Computer Music Interface Mixer V.Soucaret and E.R.Miranda
259
SECTION 4 Computer Applications, Computing, Robotics &
Interactive Intelligent Systems How can a Robot Learn the Meaning of Words? M.Eftimakis and T.Belpaeme
269
Evaluating the Effects of Security Usability Improvements in Word 2007 M.Helala and S.M.Furnell
277
Web-Based Plankton Data Visualisation T.T.Ho and P.S.Dowland
285
Comparing Anti-Spyware Products – A different approach M.Saqib and M.Papadaki
294
“The websites of Higher Education Institutions are more than merely promotional interfaces with potential students” - Web Accessibility and Usability in a HEI environment I.L.St John and A.D.Phippen
302
Author Index 311

Advances in Networks, Computing and Communications 6
viii

Section 1 – Network Systems Engineering
1
Section 1
Network Systems Engineering

Advances in Networks, Computing and Communications 6
2

Section 1 – Network Systems Engineering
3
Improving the Usability of Security Features – a Survey of End Users
M.O.Adjei and S.M.Furnell
Centre for Information Security and Network Research, University of Plymouth, Plymouth, United Kingdom
e‐mail: [email protected]
Abstract
Computer users today face a myriad of threats most of which are as a result of the Internet. The numbers of applications available to help combat these threats also exist in an equal measure. This means that end users are likely to encounter security events on a daily basis. This reiterates the need for usable and effective security applications to counter these threats. This paper presents the results from a survey conducted to sample the views and record the experiences of 46 end users over a 21 day period. Security related events were categorised into user initiated and system initiated events. Under these two categories, a total of 294 events were recorded. It was also found that out of the total of all user initiated events, 27% of them were not fully understood by the participants with 16% of the events were unable to be completed meaning that this number although willing to set protection on their systems, were unable to do so. Indeed this shows a serious problem in usability and has the possibility of presenting vulnerable systems that can be easily compromised.
Keywords
Usability, Security, User‐Initiated Events, System Initiated Events
1 Introduction
Since the ability to greatly reduce the size of computers while still maximising its power and storage, end user computing has seen a corresponding increase throughout this time. The Internet has become an important part of end user computing with most users having one form of computer identity or the other from e-mail accounts, social websites and online shopping accounts. This has also resulted in new and sophisticated approaches to Internet crime commonly referred to as cyber crime. Users face such threats as identity theft, deliberate service disruption and electronic theft of valuable information. Undoubtedly, both corporate and end user systems are being used to hold more sensitive and valuable information now than ever before partly because these systems now have the ability to do so. The theft and subsequent profits at stake for this information has also become very high. There is therefore the need for these systems that hold and transport the information to be adequately secured. (Polstra III, 2004).

Advances in Networks, Computing and Communications 6
4
2 Usability
The interaction of end users with security is an important aspect of Human Computer Interaction (HCI) with what is now known as Human Computer Interaction-Security, (Johnston et al, 2003) indicating that security should inevitably lead to trust of the system by the user. Indeed it can also be argued that users need to see security working but also more importantly need to understand what it is the security is actually doing in order to establish that required level of trust for the system (Furnell et al, 2006). Although a previous study has infamously acclaimed end users as the weakest link in security (Gross and Rosson, 2007), another on the contrary showed that some end users do indeed differentiate between security and general issues concerning their systems (Gross and Rosson, 2007). It is important to note that some users may be genuinely concerned about security but may be constrained by usability challenges. The problem of security should therefore not be blamed on end users alone. The tools and applications for the protection of their systems needs to also be put under equal scrutiny. They must be usable to ensure effective protection overall.
2.1 Usability and Security
System threats have evolved considerably and today’s varied malware run silently but deep in the background. They steal information or use such compromised systems as a storage or in other cases as transit for the stolen information. These malicious codes in most cases operate without affecting the resource use of the compromised systems or disrupting their normal workings in a noticeable way. As (Thompson, 2005) put it, “Theft through spyware could be the most important and least understood espionage tactic in use today.” This is can in fact be confirmed by the sheer number of security tools and applications available to combat current threats. For instance (Kaspersky Labs, 2008) indicate that their antivirus databases currently contain over 724,538 records with around 3,500 new records are added weekly. The threats themselves have also evolved in much the same way in terms of technology as is used to try to fight them. Since malware are in fact just computer programs, most are analysed by reverse engineering the original software code, analysing the behaviour then writing counter-code to annul its destructive effects. To effectively conceal their true behaviour from de-compilation and reverse engineering, some malware code now employ obfuscation by specifically using transform algorithms to alter code into a meaning in the programming language used which will be much harder to comprehend if actually de-compiled, and thereby making it extremely difficult to neutralise (Anckaert et al, 2007). This shows that even the efforts to curb end user threats do not come at a light expense. Among other things various encryption algorithms that activate at each infection (Zhang et al, 2007) used by other malware developers making the behaviour analysis even more difficult. All this shows the gravity of threats that computer users are faced with today. However the average end user cannot be expected to be on top of the finer details of these threats as described, but there is the need for them to at least be made aware of their existence and more importantly be presented with usable security to offer adequate protection for their systems and information contained therein.

Section 1 – Network Systems Engineering
5
3 Research Methodology
The research was primarily aimed at trying to establish how to improve the usability of the security features that are contained in end user applications. Similar work had been done prior to this research by other authors, some employing end user population survey using paper and online questionnaires and others reviewing the usability of specific applications (Chatziapostolou and Furnell, 2007; Gross and Rosson, 2007). For this research it was considered to gather information on end user experiences with security related events as much as possible when the events are actually occur. The target platform was to be Microsoft Windows primarily because it has the widest distribution. This it was believed would give an insight into how in reality end users deal with these events. To effectively accomplish this, it meant that the questionnaire that was to be used had to be available to collect and store user responses whenever an event of relevance occurred irrespective of the system’s network status.
3.1 The Electronic Questionnaire (e-Quest)
Given the current work done and the fore going, it was decided that a custom computerised self-administered questionnaire (CSAQ) would be the best option. This approach would ensure the availability of the questionnaire on-demand and to store responses locally even with the absence of a network connection. A custom utility called, e-Quest was therefore developed for the purpose using Visual C# 2005.
Figure 1: e-Quest Questionnaire Selection Window
The utility was distributed participants who took part in the survey which was for a period of 21 days. The respondent selection criteria were mainly on their ability to make regular use of a system that has at least an Internet connection to send questionnaire data. Participants were duly briefed prior to the survey and it was ensured that they fully understood the whole process. e-Quest also contained the relevant help files and examples for any further help should the participants need them. Responses were saved locally in the working folder of e-Quest in open Extensible Mark-up Language (XML) format to ensure storage compatibility which were later compressed into a single file to be attached and sent via email.
Advances in Networks, Computing and Communications 6
6
4 Survey Results
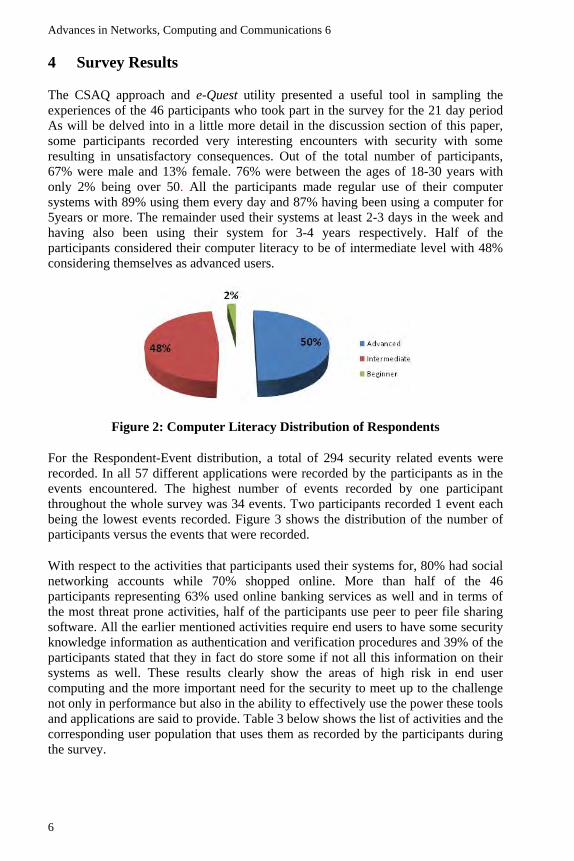
The CSAQ approach and e-Quest utility presented a useful tool in sampling the experiences of the 46 participants who took part in the survey for the 21 day period As will be delved into in a little more detail in the discussion section of this paper, some participants recorded very interesting encounters with security with some resulting in unsatisfactory consequences. Out of the total number of participants, 67% were male and 13% female. 76% were between the ages of 18-30 years with only 2% being over 50. All the participants made regular use of their computer systems with 89% using them every day and 87% having been using a computer for 5years or more. The remainder used their systems at least 2-3 days in the week and having also been using their system for 3-4 years respectively. Half of the participants considered their computer literacy to be of intermediate level with 48% considering themselves as advanced users.
Figure 2: Computer Literacy Distribution of Respondents
For the Respondent-Event distribution, a total of 294 security related events were recorded. In all 57 different applications were recorded by the participants as in the events encountered. The highest number of events recorded by one participant throughout the whole survey was 34 events. Two participants recorded 1 event each being the lowest events recorded. Figure 3 shows the distribution of the number of participants versus the events that were recorded.
With respect to the activities that participants used their systems for, 80% had social networking accounts while 70% shopped online. More than half of the 46 participants representing 63% used online banking services as well and in terms of the most threat prone activities, half of the participants use peer to peer file sharing software. All the earlier mentioned activities require end users to have some security knowledge information as authentication and verification procedures and 39% of the participants stated that they in fact do store some if not all this information on their systems as well. These results clearly show the areas of high risk in end user computing and the more important need for the security to meet up to the challenge not only in performance but also in the ability to effectively use the power these tools and applications are said to provide. Table 3 below shows the list of activities and the corresponding user population that uses them as recorded by the participants during the survey.

Section 1 – Network Systems Engineering
7
Figure 3: Number of Users versus Events Recorded
Do you use your computer for any of the following?
Computer Activity Number of Participants Percentage(%)
Online Gaming 4 9
Peer – to – Peer file sharing
23 50
Internet Banking 29 63
Online Shopping 32 70 Storing of personal
information 18 39
Social Networking 37 80
Table 1: List of computer activity versus participant numbers distribution
In terms of the security available on their systems, all the participants had some antivirus protection with 89% indicating they had a firewall installed. 58% of the participants also had some Internet solution application. However, only 48% of all participants had ever changed the settings of these applications from the default.
4.1 User-Initiated Events
A total of 70 events from 26 different applications were initiated by respondents in an attempt to deal with security. For these, 63 had respondents satisfactorily complete the user-initiated events questionnaire. Norton Internet Security was found attributed the most number of events initiated by a subset of 3 respondents. The research results showed that for the total number of events that users started themselves, 27% were not fully understood. Table 2 shows the number of events and the degree to which they were understood as presented on the user-initiated events questionnaire. Another 16% events prevented users from completing events that they initiated.

Advances in Networks, Computing and Communications 6
8
To what extent did you understand this whole event?
Total Number of Events
Percentage (%)
Fully 46 73 Partially 15 24 Not at all 2 3
Table 2: Participants understanding of user-initiated events
4.2 System-Initiated Events
A total of 222 system-initiated events from 31 named applications were recorded. Similar to the user-initiated events, Norton Internet Security recorded the highest number of events totalling thirty seven, 37 from 13 respondents. Respondents completed the system-initiated event questionnaire 217 times with 5 activations of the questionnaire for which it was not completed. From the respondent’s understanding of events, similar to the user-initiated events responses, 26% of events were not satisfactorily clear to participants out of which 10% prevent them from completing activities they were performing or about to perform prior to the occurrence of the event. Table 3 below displays these results in detail.
Were you clear on what was going to happen next with this event?
Total Number of Events
Percentage (%)
Very Clear 100 46 Quite Clear 60 28
Clear 28 13 Not Quite Clear 23 10
Not Clear 6 3
Table 3: Participants understanding of system-initiated events
5 Discussion
A lack of understanding of security technologies may lead to inadequate protection from the threats that exist, (Furnell, 2005) and this was evident in this research. If users are not very sure of what to do or what will happen next with a security related occurrence but are placed in a position, as in most cases where they need to respond, they might make a wrong decision. In a situation where this user’s system is among others in a closed network scenario, such as exists in company local area networks, this can lead to a serious breach affecting part or the whole firm (Gross and Rosson, 2007). Figure 4 below shows part on one user’s response to an event during a browsing session where a modal pop-up dialog requested them to install a free security application, Antivirus 2009 to help protect their system.

Section 1 – Network Systems Engineering
9
Figure 4: System-Initiated Prompt To Install Antivirus 2009
From this user’s response, they did not understand why the event occurred yet and the event stopped them from performing whatever that they were doing before its occurrence. The XML tags <Understand> and <StopFromPg> indicate this respectively. XML as stated in the methodology was the storage format for user responses.
A background check on the said security tool revealed that it was in fact rogue spyware product and a variant of earlier versions Antivirus 2008, Antivirus 2008 XP and Antivirus2009. This confirms the earlier analysis in this paper of the sophistication and repackaging of variants of malicious code to evade detection (Anckaert et al, 2007; Zhang et al). Figure 5 below shows a security assessment of the spyware by Computer Associates website.
Figure 5: Threat Assessment of Antivirus 2009 - CA Website (2008)
The particular user did in fact go ahead to install the tool in the utmost sincerity of adding to their security protection. Another problem is that although the user did not understand the particular event, they did not seek any help or guidance for it. It proves right the claim that most users do not like to read instructions unless it actually pertains to something they already want to do (Furnell, 2005). This scenario clearly shows that even though majority of events were in reality understood by users, the relative few which were not can still pose a major security risk. The user’s

Advances in Networks, Computing and Communications 6
10
systems and those of others might be put in danger of compromise with neither of them realising the full consequences.
6 Conclusion
As presented in this paper, the need for usable security cannot be treated lightly as the consequences may be too high. The use of the CSAQ enabled this research to realise firsthand how such scenarios in effect can occur. With all the advancement in usability study, there are still current problems facing end users. While conceding that the ideal of every user being protected to the required level may not be a realistic enough premise for evaluating usable security, the contrary cannot also be accepted either. Even the least percentage of users who might not use properly, use at all or understand security, the overhead cost can still be very high as shown in the results.
This research was limited to the Windows platform. Future work may be useful to combine multiple survey methods on various platforms. A survey of a larger user population over a longer period of time may also be desirable. These will be useful to unearth whether or not usable security is in effect getting better and any new challenges that users may face.
7 References
Anckaert, B., Matias Madou, B., DS., De Bus., B., De Bosschere, K. and Preneel, B., (2007), Program obfuscation: a quantitative approach, QoP '07: Proceedings of the 2007 ACM workshop on Quality of protection, ACM (Online Resource)
Antivirus Database Updates (2008). Kaspersky Labs http://www.kaspersky.com/ avupdates, [Date Accessed 23RD April,2008]
Chatziapostolou, D. and Furnell, S., M., (2007). Assessing the usability of system-initiated and user-initiated security events, Proceedings of ISOneWorld 2007, Las Vegas,
Computer Associates (2008) Antivirus 2009 Threat Assessment http://ca.com/ securityadvisor/pest/pest.aspx?id=453137270 [Date Accessed, 28TH August, 2008]
Furnell, S., (2005) Why users cannot use security. Computers & Security, 24, 274e279, Elsevier Ltd. (Online Resource)
Furnell, S. M., Jusoh, A. and Katsabas, D.,(2006) The challenges of understanding and using security: A survey of end-users. Science Direct, Computers & Security, vol. 25, no.1, pp27-35
Gross, J., B. and Rosson, M., B., (2007) End User Concern about Security and Privacy Threats.
SOUPS '07: Proceedings of the 3rd symposium on Usable privacy and security, ACM (Online Resource)
Gross, J., B. and Rosson, M., B., (2007) Looking for Trouble: Understanding End-User Security Management CHIMIT '07: Proceedings of the 2007 symposium on Computer human interaction for the management of information technology, ACM (Online Resource)
Johnston, J., Eloff, J. H. P. and Labuschagne, L. (2003) Security and human computer interfaces, Science Direct, Computer and Security, Volume 22, No.8

Section 1 – Network Systems Engineering
11
Polstra III and Robert M., (2005), A case study on how to manage the theft of information, InfoSecCD '05: Proceedings of the 2nd annual conference on Information security curriculum development, ACM (Online Resource)
Thompson, R., (2005), Why spyware poses multiple threats to security, Communications of the ACM, Volume 48 Issue 8, ACM (Online Resource)
Zhang, Q., Reeves, S.R., Ning, P.S. and Iyer, S.P., (2007). Analyzing Network Traffic To Detect Self-Decrypting Exploit Code, ASIACCS '07: Proceedings of the 2nd ACM symposium on Information, computer and communications security, ACM (Online Resource)

Advances in Networks, Computing and Communications 6
12
Information Security Awareness and Culture
Y.Al-Shehri and N.L.Clarke
Centre for Information Security and Network Research, University of Plymouth, Plymouth, United Kingdom
e-mail: [email protected]
Abstract
The Internet has dramatically increased during the last decade in terms of the number of users. Users from diverse backgrounds have joined the Internet. At the same time, Internet threats have increased and become more sophisticated. Measuring the awareness of end users from diverse backgrounds was one of the aims of this research. A questionnaire was designed and published online in order achieve this aim and reach end-users everywhere. After analysing the answers of all participants, the study found that cultural factors can influence security practices in terms of the use of the Internet and information confidentiality. In addition, competent users often have poor practices which do not help the maintenance of security. Moreover, incompetent users are often unconscious of their needs. In order to develop awareness levels and thereby develop security practices, educating security can significantly help to increase the awareness.
Key words
Information Security, Information Security Awareness, Information Security Awareness and Culture
1 Introduction
The number of users who joining the internet is increasing. The infrastructure of the global network will be consequently enlarged in order to fulfill user needs. Furthermore, several applications have been introduced to provide users with full connectivity text, voice, and video images. In addition, business operation and vital transactions are now undertaken through the internet. For instance, due to the convenience of online activities, users now maintain their bank accounts, buy and sell commodities, and bid in auctions all in the global network. It is estimated that 20% of people in the UK are doing most of their banking operations through online banking (Online Identity theft, 2006). In addition, AOL reports (2005) that 72% of internet users use the internet for sensitive transactions such as banking or stock trading. These features encourage people to join the global network to remain in touch with family, friends worldwide. All these facilities have attracted users to come toward this global community and to remain connected longer or permanently. Although end users have adapted the technology, they often have a lack of awareness towards the right practice or they possess knowledge but they often do not practice it in proper ways.
This research aims to demonstrate differences of practice and awareness between different cultures in the context of their dealing with information. Dealing with

Section 1 – Network Systems Engineering
13
information has been part of end users daily activities. This paper will start by giving a brief background of different research in the area. Then, it will explain the methodology that has taken place in this research. Afterwards, it will produce the main findings of the study with the analysis. At the end, the paper will be concluded.
2 Background
Human interactions have been noted as an important area of the information security architecture. It is an important area which should concern by everybody not only home users. Furnell et al (2007) states that when home systems are compromised, the internet as a whole will be affected. Surely, raising the awareness will simultaneously reduce users fault (Siponen, 2000). As a consequence, it is essential to keep the public aware of the security threats and educate them towards using good practices in order to get greater security. Furthermore, human factors need be addressed beside the technical and management factors in information security. In this sense, Von Solms (2000) adds the third dimension in the information security waves which is called the institutionalization wave. This wave is described as building a security culture among users which should be practiced as daily activities. In addition, Siponen (2001) proposes the five dimensions of information security awareness. The first one is the organizational dimension which has been covered by much research (e.g. Siponen, 2000). The second dimension, on the other hand, is the general public dimension which has been touched by some other research (e.g. Furnell, 2007; 2008).
In order to measure human awareness, other areas need be measured. Kruger and Kearney (2006) suggest that the measurement should address three major areas: peoples’ behavior, feeling and knowledge. Based on this argument, they have developed a prototype to investigate three major questions: what do they know? How do they feel? And how do they behave? Some users could behave in a way that is against their belief or feeling. For example, a system forces a user to change his password every 30 days. This user has changed his password because he was forced to by the system not because he knows this practice can secure his account. This approach will investigate users’ knowledge and match it with their practice.
It is argued (Thomson et al 2006) that the level of awareness of this knowledge must be addressed first. The study proposes that users in the knowledge are either competent or incompetent. In addition, incompetent users are either conscious or unconscious of their needs. The worst level of awareness is the one when users are incompetent and unconscious. Therefore, in order to improve the skills level, users must be alerted of their needs.
3 Methodology
3.1 The Chosen Method
The objectives of the research are to investigate the use of the internet among people of different cultural backgrounds. It will also investigate their practices and awareness towards information. Furthermore, the analysis expected differences

Advances in Networks, Computing and Communications 6
14
between different cultures. In order to achieve these aims, several methods can be undertaken. For example, interviewing users and monitoring their practices with information. However, the most appropriate one to achieve diverse people is a questionnaire. With the help of CISNR at the University of Plymouth, this survey was conducted and uploaded to the web server of CISNR. An online survey is very cost effective since no papers are required to be distributed to all respondents. This can also maximise the number of respondents because it will be published online.
3.2 The Survey Structure
This survey comprises 44 questions divided into four sections: Demographics, Computer General Practice, Security Practice, and Security Awareness. Firstly, the Demographics section will investigate the background that users are come from (Who are they?). Secondly, computer general practice will move on to investigate the practice of users with information. In other words, what do they really do? The general practice is the practice that does not affect the security if used properly. Thirdly, the security practice section will investigate one crucial area which concerns user behaviour towards information security. Fourthly, the security awareness section will check the level of awareness users have (What they know?).
4 Results and Analysis
The survey was conducted for one month, from the 4th of July2008 through 29th of July 2008. The total number of respondents was 245 users from thirty five countries all over the world. The survey was promoted through a published link. This link was sent to users through e-mails, and Internet forums.
Although users from thirty-five countries contributed to this survey, only the top five countries in terms of response were selected to be analysed. These five countries are: Saudi Arabia, Pakistan, UK, France and Nigeria. The study analyse the differences between the top five countries which the survey received sufficient number of responses from. Responses from the rest of the countries will be taken into account when the study makes some generalisations the evaluation section.
4.1 Gender and Age of Participants
Females from all countries contributed in this survey in a small proportion (20%). A majority of respondents (60%) are from the age group of 20-29 years of age. In terms of age, some differences were noticed in the use of the Internet applications and the use of technology. For example, social networks attract younger users. As they get older, they lose the Internet in these types of application. Fifty-three percent of users from the age group of 20-29 use social networks. The percentage drops down to 29% for the age group 30-39. The percentage also goes down to 9% for the age group 40-49. In addition, users in the middle ages have a low number of accounts in comparison to other users. For instance, all users from the age group 50-59 have few numbers of accounts (Maximum 5). Also, a majority of the users from the age group 40-49 have fewer than five accounts. In the security practice, users between the ages of 30 and 49 are more careful. For example, 60% of the age group of 50-59 have

Section 1 – Network Systems Engineering
15
never reused their passwords. In addition, 60% of the same age group consider all of their accounts to be important.
4.2 Education
Users in general possess either graduate (41%) or post-graduate (40%) degrees. There was no noticeable difference in terms of the security practice or awareness between different educational backgrounds. The only noted factor was studying a security course. All of the users who have attended modules in security show better understanding and awareness in many aspects of security.
4.3 Religion
The participants followed ten religions. Participates from some countries followed a single faith. For instance, Saudi and Pakistani users follow the Islamic faith. In the UK, users follow verities of faiths such as Anglicans, Catholicism, protestant, Islam and atheism. All the religions are illustrated in the following Table 1.
Saudi Arabia Islam (100%)
Pakistan Islam (100%)
UK Anglicanism(30%) Atheism (5%) Islam (15%)
None (25%)
Protestantism (10%)
Roman Catholicism (15%)
France None (40%) Roman Catholicism (60%)
Nigeria Anglicanism (17%)
Church of Africa (17%) Islam (30%) Roman Catholicism (17%)
Table 1: Religions of the participants
4.4 The Use of the Internet
The survey questioned users about their use to assess the popularity of the applications, in one hand. On the other hand, this assesses the familiarity of end users towards the technology. As it is expected, some applications were used by many users such as e-mailing and web browsing with out noticeable differences between countries and religions. Other applications were quite new in the use of the Internet. Therefore, few users from every country were using them. For instance, telephony was used by Saudi (24%), Pakistani (26%), British (20%), French (60%), and Nigerian (50%). French and Nigerian respondents were students of IT in postgraduate level. So, their familiarities with technology were noticeably differed from other users. Online banking application was used more by British (75%) and French (70%) users. the reason could be due the application in industrial countries could be more mature and secure. Part of this also depends upon the trust between end users and their local banks. Also, what effort was made by local banks to introduce the service to their customers if the service is existed. In terms of age, some differences were noticed in the use of the Internet applications and the use of technology. For example, social networks attract younger users. As they get older, they lose the Internet in these types of application. Fifty-three percent of users from

Advances in Networks, Computing and Communications 6
16
the age group of 20-29 use social networks. The percentage drops down to 29% for the age group 30-39. The percentage also goes down to 9% for the age group 40-49.
4.5 Authentication Practice and Awareness
Authentication is the process of ensuring that a system should be accessed by certain users. This study selected the password because it is one of the most common methods of authentication. First, the study evaluates the use of passwords and people’s awareness for good password practices. Second, the study will assess whether users reuse their passwords in other systems. If so, the study will evaluate the extent of this behaviour. Third, the study will discuss the awareness of users towards password selection.
4.5.1 Reused Password
Almost all of the 245 participants revealed that they have more accounts than passwords. However, users reused different proportions of their passwords: 25%, 50%, 75% or all of them. Generally, a majority of all users have reused at least a small proportion (25%) of their passwords. Figure 1 shows the percentage of users from the five main countries who have reused 50% of passwords they have. Similarly, figures 2 and 3 illustrate percentage of users who have reused 75% or 100% of their passwords.
Figure 1: 50% of their passwords have been reused
Figure 2: 75% of their passwords have been reused
Figure 3: All of their passwords have been reused
4.5.2 Account Security Awareness
The awareness toward the necessity of having different types of accounts secure seems to be inadequate among all users in general. Every single account should be considered as crucial in users’ thoughts. The reason for this is simply because every account could contain valuable information: financial, personal, and data belonging to work. Based on this, the participants were questioned about which accounts they

Section 1 – Network Systems Engineering
17
think should be protected by using a strong authentication method. Five major accounts were listed: online banking, a login to work, a login to school, social networks, and mail servers. The results in general show that users agreed mostly about online banking as sensitive accounts. After online banking, the majority of every country thinks that mail servers are vital accounts. However, other accounts show that few users think that they are crucial accounts. As a result, the study breaks down four groups according to these answers.
SOC1 group of users who did not agree that social networks should be protected by strong passwords
LOG1 users did not appreciate work accounts LOG2 did not appreciate accounts given by institutes or schools BANK1 group of users who did not agree with the importance of online banking
Table 2: The four sample groups
First, the results of SOC1 are the most shocking results. First of all, all users in some countries have social network accounts, such as Pakistan and France. Seventy-eight percent of Saudi users and 69% of British users have access to these networks. In addition, they are happy to share real information such as names, dates of birth, family information, addresses, and telephone numbers. Second, the results of the second group, LOG1, demonstrate the low awareness level among quite a few users from Saudi Arabia, Pakistan, and the UK. The worst figure is shown in the Saudi users; 60% of them think the work login is unimportant. Also, 35% of them are workers and have access to computers from their work. British and Pakistani users share nearly the same level of awareness (20%). Third, LOG2 group shows a level of awareness that is the same as LOG1. The results find that quite a few users from every country did not agree with the necessity of the account while they are students. Fourth, BANK1 group joins users from Saudi Arabia (15%), Pakistan (8%) and the UK (15%). However, All British users from this group have no access to online banking. Even though, it is not an enough excuse. Seven percent of Saudi and 3% of Pakistani users have online banking, but they do not agree with the necessity of the account.
4.5.3 Password Understanding
The survey asked participants if they believe that “David1984” is a strong password. There were four possible answers and only one reflected good awarness and understanding of this issue. All other options would show that users are not aware of how passwords should be selected.The results found that a majority are conscious of this issue. Competent users will be the participants who selected the right answer. They will be joind under one group called CompetentPass. Their practice will be investigated individualy in order to find whether they practice what they understood or not. The study find that 40% from every of saudi, pakstani, and French users do not use complex passwords. Nigerian and British users have better practice when 20% of every country do not have complex passwords. The figure here does not look that bad. However, it is worthless having a complex password since this password is used in other systems as it is pointed in the previous section.

Advances in Networks, Computing and Communications 6
18
4.6 Access control, Practice and Awareness
Authorization is one of the main goals of system security. It helps to first authorize the right user to get access to the computer. Secondly, it protects the user’s own files, which are saved on the same physical disk with other users. Hence, it is important to have multiple IDs for a single computer that are accessed by multiple users. Having different accounts will protect data from being seen, lost or modified by unauthorized persons. Users prefer the easier option of opening a computer for anyone at any time. Or, they prefer to assign one user name for everyone using the system. Table 3 below show that users who share access with others are more likely to use a single account set for everyone except the Nigerian users, who either do not share access or set up the right security configuration. In the UK, one in every two users use the right practice; Pakistan is somewhat similar to the UK. In Saudi Arabia, one in every four users uses the right security configuration.
France Nigeria Pakistan Saudi Arabia UK Single account 30% 0% 26% 38% 25% Several accounts 0% 17% 11% 10% 15%
Table 3: Access control practice
Child protection has been regarded as one of the main aspect of Internet content. Since the Internet is an open network, it is impossible to regulate what is inside the Internet. The respondents were questioned if they have applied a content protection for children who share the access. The following figure illustrates percentage of users who share the Internet with their children and weather they apply content protection or not. In this issue, British users show more care than other users as it seen in the figure below. The worst figure is shown with the Pakistani users. Almost one in every four users from Pakistan applies protection for children.
Figure 4: Have you applied any content protection for children who share the access to the Internet?
4.7 Social Network Awareness and Practice
First, the survey questioned users on what they think of having an account in a social networking web site. The answers are illustrated in the table below (4). The lowest level of understanding appeared in the first row which show that a majority of British users (70%), French users (70%) and Pakistani users (66%) did not understand the problem of social networks. Saudi users are not far better because 20% of them prefer to be anonymous. The best understanding is clearly represented in Nigerian users since 66% understood that the information in socail network could be misused.

Section 1 – Network Systems Engineering
19
The last row of the table will be taken as a sample called ComptenceSOCI. The study assessed the knowledge of this group in regard to the social network understanding. It will now evaluate their practice and demonstrate whether their practice match their knowledge or not.
France Nigeria Pakistan Saudi Arabia UK
I agree to expose my real information 70% 17% 66% 32% 70%
I want to be anonymous 10% 17% 8% 20% 10% I do not agree because my real information could be misused 20% 66% 26% 48% 20%
Table 4: Social Network Awareness
CompetenceSOCI was analysed in order to assess if the users of this group have social network accounts. If yes, what information they are happy to expose. Figure 5 illustrates the competent group and their use of social networks. Fifty percent of users from France have social network accoutns and all of them expose their real names, dates of birth and home adresses. All coompetent users from pakistan have social network accounts. However, only 10% of them exposed their real name only. Eighty percent of saudi users have social network accounts. It was found that 30% of them have exposed their real names, 26% disclosed their dats of birth and 6% revealed their home addreses. The figure also shows that 40% of the british users have share their real names in social networks.
Figure 5: CompetenceSOCI
4.8 Identity Theft Awareness
This survey questioned users if they have ever been victims of identity theft. A group of users (IDT1) answered “yes” and another group (IDT2) answered “no.” Both groups were evaluated in their practices towards physical documents (e.g. bank statements and bills) and digital information (e.g. social networks), which also can be used for ID fraud (National Identity Fraud, 2007). The results of the participants show that 35% of the British users, 30% of French users, 18% of Pakistani users, 17% of Nigerian users and 17% of Saudi users have been victims of identity theft.

Advances in Networks, Computing and Communications 6
20
Also, it is important to note that people might not realise that they have been victims. Therefore, users of group IDT2 might be victims without their knowledge.
Seventy percent of British users (from IDT1 and IDT2 groups) have never thrown any of the physical documents. This show the best practice among other nationalities. This good practice might be due to the awareness programmes which are promoted by the government in the Internet and the media. Other users from both groups have thrown their physical papers without destroying them. Phone and utility bills were the most common papers which usually users do not care about them. Bank statements come after bills with average 20% of every country. However, social networks seem to be a serious problem for both groups. Some identity theft victims claim that they have never thrown documents into trash bins without first destroying them. However, the same users who claim that have social network accounts and have exposed some of their real information. So, if this was not the first reason, it might be due to the second reason. On the other hand, IDT2 users showed very poor practices that make it very likely that they will become victims. Figure 4-6 illustrates the percentage of information has been exposed in social networks from every country. It is clear that Saudi and Pakistani users have a high percentage in social networks. However, the percentage of the real information exposed is low in comparison to the number of accounts they have. In other words, they are likely to prefer to be anonymous. Table 4 indicates that 20% of Saudi users prefer to be anonymous rather than share their real information. So, this result here is not due to the security awareness.
Figure 6: IDT2 disclose information on social networks
4.9 Competence and Consciousness
It is a good level of awareness when users are competent and conscious. In other words, users have the knowledge of particular skills. At the same time, they are aware of their needs and of their developing areas (Thomson et al 2006). However, they might be competent and conscious but not practicing what they know and what they believe in. Therefore, it is important for competent users to use the skills that they have. In other words, are they really practice what they believe in? (Kruger and Kearney 2006). From the two arguments, the study comes out with the level which all security awareness programmes much seek. This level can be called Conscious Competent Practised.

Section 1 – Network Systems Engineering
21
The results, in some places, clearly indicate the fact that users often practice differently than their understanding. There are two examples from this study that prove this argument. The first is the example of the password understanding, when a majority of the participants have a good understanding. However, their password practices are different than what they believe as it is pointed in the password understanding section. The second example is about social network understanding. Quite a few users understood that information in social networks could be misused. In spite of this, a large proportion of this group have posted their real information in social networks as it is pointed in the social network awareness and practice section. In addition, the results indicated there is a lack of consciousness among quite a large number of users. For example, their understanding is poor in some security aspects. In spite of this, they claim their professional level of computer security. In this sense, they were classified in the incompetence unconscious level.
5 Conclusion
It is important for this kind of research to continue. Also, it will be useful to reach more backgrounds in terms of the level of education, age and sex. The responses of this study were quite limited in these factors. For instance, only 20% of the responses were female. Moreover, 81% of the participants hold graduate or postgraduate certificates. Also, the highest proportion of the respondents was in the age group of 20-29 years of age. It will be very useful to find various answers which can lead to better analysis.
To sum up, this paper introduced the topic and gave a brief background of the topic. It explained methodology of this research. Then, the topic illustrated some of the key findings. It analysed and discussed the major findings of this study. At the end, the topic was concluded by explaining some limitation of this work which can be avoid in the future.
6 References
AOL/NCSA. (2005). AOL/NCSA Online Safety Study [Online] Available at: http://staysafeonline.org/pdf/safety_study_2005.pdf [accessed 15 Jan 2008]
Furnell, S., Bryant, P. and Phippen, A., (2007). “Assessing the security perceptions of personal Internet users”. Computer and Security. http://www.sciencedirect.com/science/journal/ 01674048Volume 26, Issue 5, August 2007, Pages 410-417
Furnell, S., (2008). “End user security culture: A lesson that will never be learnt?” Computer Fraud and Security. http://www.sciencedirect.com/science/journal/01674048 Volume 2008, Issue 4, April, pp6-9, 2008
Kruger, H. and Kearney, W., (2006). “A prototype for assessing information security awareness”. Sience Direct. Vol.25, Issue 4, Pages 289-296
National Identity Fraud, (2007).”How ID fraud Occurs”. [Online] available at: http://www.stop-idfraud.co.uk/How_IDF_Occurs.htm [accessed 5 August 2008]
Online Identity Theft, (2006). “Security Report: Online Identity Theft”. [Online] Available at: http://www.btplc.com/onlineidtheft/onlineidtheft.pdf [accessed 10 July 2008]

Advances in Networks, Computing and Communications 6
22
Siponen, M., (2000). ''A conceptual foundation for organizational information security awareness''. Information Management and Computer Security. Vol.8/1, Pages: 31-41
Siponen, M., (2001). ''Five Dimensions of Information Security Awareness''. Computer and Society. Pages: 24-29
Thomson, K. Von Solms, R. and Louw, L. (2006).” Cultivating an organizational information security culture”. Computer Fraud & Security. Vol. 2006, Issue 10,Pages 7-11
Von Solms, B. (2000). “Information Security- The Third Wave?” Computer & Security. Vol. 19, Issue 7, Pages 615-620

Section 1 – Network Systems Engineering
23
Social Engineering Vulnerabilities
T.Bakhshi and M.Papadaki
Centre for Information Security and Network Research, University of Plymouth, Plymouth, United Kingdom
e‐mail: [email protected]
Abstract
Social engineering refers to the phenomenon of circumventing technical security mechanisms inherent in a system by manipulating legitimate users of the system using a host of physical and psychological compromising methods. This may lead to a compromise of the underlying IT systems for possible exploitation. It remains a popular method of bypassing security because attacks focus on the weakest link in the security architecture, the staff of the organization, instead of directly targeting electronic and cryptographic security algorithms. Universities and academic institutions are no exception to this vulnerability and the present research aims to investigate the level of susceptibility of university staff to social engineering vulnerabilities. This research entailed an experiment involving email based auditing technique directed at staff in the Faculty of Technology, University of Plymouth. The results were analysed from a quantitative and qualitative perspective and compared with results generated from similar experiments to ascertain the level of staff’s susceptibility to this threat.
Keywords
Social engineering, IT systems security, Computer security threat
1 Introduction
Social Engineering remains a popular method of compromising the security of computing systems. According to Thornburgh (2004) social engineering has gained profound acceptance in the information technology community as an effective social and psychological tool for exploiting the IT security mechanism of a target organization. Renowned hacker turned security consultant Kevin Mitnick suggests that it is much easier to trick somebody into giving his or her password then to carry out an elaborate hacking attempt for this purpose (Mitnick and Simon 2002). A social engineer (SE) may bypass the identification process of an organization or a system either individually or by a combination of: counterfeiting IDs, posing to be someone else (e.g. employee, support staff, visitor, etc.) and by compromising a legitimate user/admin staff with necessary privileges who could allow the SE access to the system. Such a process even if ineffective in the first instance may lead to the generation of useful data for the SE such as insight into the security policy of an organization, the countermeasures in place and specifics relating to personnel and their level of security privilege for possible use in future attacks. Social engineering requires a considerable effort requiring planning and research to be successful. Mitnick and Simon(2002) while elaborating the art of social engineering compares a social engineering attack to a software development life cycle and summarizes the art into four steps of research, development of rapport and trust, exploitation of trust and

Advances in Networks, Computing and Communications 6
24
utilization of information. Research from an SE’s perspective is vital as it provides a plethora of information regarding the organization which could be used in carrying out an attack. Such information can be gathered from numerous sources. Erianger (2004) and Granger (2001) refer to dumpster diving in their discussions suggesting that a SE may go through the paper waste produced by an organization to gain any general and confidential information that may be useful. The same is also true for shoulder surfing. Nolan and Levesque (2005) while investigating a social engineer’s research toolkit suggest that global search engines such as Google can provide much useful information regarding an organization or an individual. The leads generated as part of this process may serve as further input into the same search engine to gather refined results and help a SE carry out a better planned attack. Whichever the method of research employed by a social engineer, the vital ingredient without which successful social engineering attack would not be possible are the people within the organization that is being targeted. The employees of an organization need to be persuaded by a SE to give vital information or access relating to the targeted system and as such proper awareness and training of employees regarding this vulnerability can lead to an increased level of security. Employees in universities and academic institutions are not an exception to this vulnerability and a range of social engineering techniques may be targeted at them for compromising the security of their computer systems. In the present research the aim is to analyse whether this is true and assess the faculty of technology staff’s susceptibility to such attacks in University of Plymouth. The University of Plymouth is a public institution with a student population of approximately 30,000. The present project was carried within the faculty of technology; the primary audience being staff of the faculty. The respective faculty has both academic as well as support and administrative staff from diverse educational backgrounds having different levels of IT experience and provides a relatively rich environment for carrying out such a vulnerability study. The primary aims of the research were to assess the susceptibility that social engineering vulnerabilities pose to IT systems within the faculty and to raise staff awareness regarding this peculiar security threat. The following section, section (2) discusses the existing work in this area, section (3) describes the research methodology employed, section (4) analyses the results and section (5) derives the conclusions of this study.
2 Existing research
Similar research has been carried out by Orgill et. al (2004) and Greening (1996) in corporate and educational environments respectively. Orgill et. al (2004) used a physical approach by posing to be an individual from computer support department and asking employees for a range of information (e.g. usernames, passwords, etc.) while Greening (1996) used an email based approach by sending emails to undergraduate computer science students improperly requesting usernames and passwords using the pretext of intrusion detection and subsequent system upgrade in Sydney University. Karakasiliotis et. al (2007) carried out a web-based survey to ascertain the level of susceptibility of unsuspecting internet users to ‘phishing’ attacks under the auspices of Information Security and Network Research Group, University of Plymouth.

Section 1 – Network Systems Engineering
25
Social engineering audits are an important tool for measuring the vulnerability of an organization against social engineering attacks. A well implemented audit can lead to useful results that could be used to further the awareness of staff and employees regarding social engineering vulnerabilities. However, as Jones (2003) suggested there is a considerable lack of procedures regarding social engineering vulnerability audits and has further provided a generic template for carrying out such audits. This fact has been endorsed by Orgill et. al (2004) who consequently used a customized form of the template provided by Jones (2003) for carrying out social engineering vulnerability audit in a corporate organization. Referring to Jones (2003) schema, the social engineering audit is primarily composed of two phases i.e. a pre-audit phase and an auditing phase. The pre-audit phase includes definition of mission objectives, obtaining permission from relevant authorities, etc. while the auditing phase may utilize techniques such as intelligence gathering, physical entry, shoulder surfing, telephone based auditing or email based auditing, etc. The template provided by Jones (2003) serves as a useful example of social engineering vulnerability audits and was customized in the present research according to the requirements at hand as described in the following sections.
3 Research methodology
In accordance with the present research aims the template provided by Jones (2003) served as a useful blueprint. Customization of this template in accordance with the present research formed the basis of the research methodology as described below.
3.1 Pre-audit phase
The pre-audit phase primarily addressed the social engineering auditing technique, background research and experiment approval from concerned bodies. E-mail based auditing technique was employed as the aim was to analyse the implications social engineering vulnerability would have on the security of IT systems and as such e-mail based communication with the staff provided a relevant auditing technique. Hence the associated research experiment used an email based message directed towards staff in faculty of technology soliciting an improper request by the computer support department in the university requiring the user to click on a link embedded in the email message. The webpage would in turn report the unique number of individuals visiting the webpage. The logic here refers to the fact that an analysis of staff’s susceptibility to social engineering vulnerabilities can be can be made judged by considering whether they are able to identify this as a social engineering attempt or not. Karakasiliotis et. al (2007) conducted similar survey based study using twenty questions each having an email message from companies, banks, etc. and requiring the participant to judge the legitimacy of the message.
Subsequently, email addresses of faculty staff had to be accounted and 152 email addresses of a total faculty staff of approximately 165 were retrieved from the university website. Finally approval from the relevant departments the Information and Learning Service (ILS) and faculty of technology Ethics Committee were sought for the research experiment. This was furnished on conditions that the security of the staff clicking on the embedded link would not be compromised in any way (i.e. no account of staff names, IP addresses would be stored) and that the staff would be

Advances in Networks, Computing and Communications 6
26
explained purpose of the research at the end of the experiment with the provision that staff may opt out from the results of the study on request. These conditions were adhered to and an explanatory email was sent to staff at the end of the experiment with further link to social engineering identification resources.
3.2 Auditing Phase
The auditing phase included the design of the actual email message containing tell-tale signs of social engineering informing the staff of an important software upgrade and requesting embedded URL to be clicked which would direct the user to an external website emulating to be the university website providing innocuous information about MS Office 2007 and related products. Tell-tale signs of social engineering had been included in order to give the staff a fair chance to spot this attempt. The associated website comprised two web pages and two separate tools were used to report the number of visitors to the website. These included a cgi-script reporting the number of visitors visiting both pages and an invisible counter (java-script) reporting both the unique number of visitors as well as total hits to the website. The content of the email sent to staff is given in Fig.1 with pointers highlighting social engineering signs.
Figure 1: E-mail message sent to staff with classic signs of social engineering
4 Results
The research experiment was conducted on November 7, 2007 and 152 email messages were sent to staff members. Instead of carbon copying the email message to all the 152 individuals, each email was sent individually. The reason for sending
Section 1 – Network Systems Engineering
27
each email individually was twofold. Firstly, it was important avoiding spamming university’s staff, so the gradual submission of traffic across the network would avoid this problem. Moreover, solitary employees can reportedly be more easily manipulated than those in groups (Orgill et. al 2004). It was perceived that on receiving an email message reporting ‘software updates’ by ILS and noting the ‘fishy’ signs, staff could have looked at other recipients of the same message and contacted them regarding the issue rather than ascertaining the legitimacy of the message themselves, or perhaps contacting the apparent sender of the message (in this case ILS) before following the message which would be a positive sign (i.e. employee’s resistance to comply with an improper request).
4.1 Quantitative Analysis
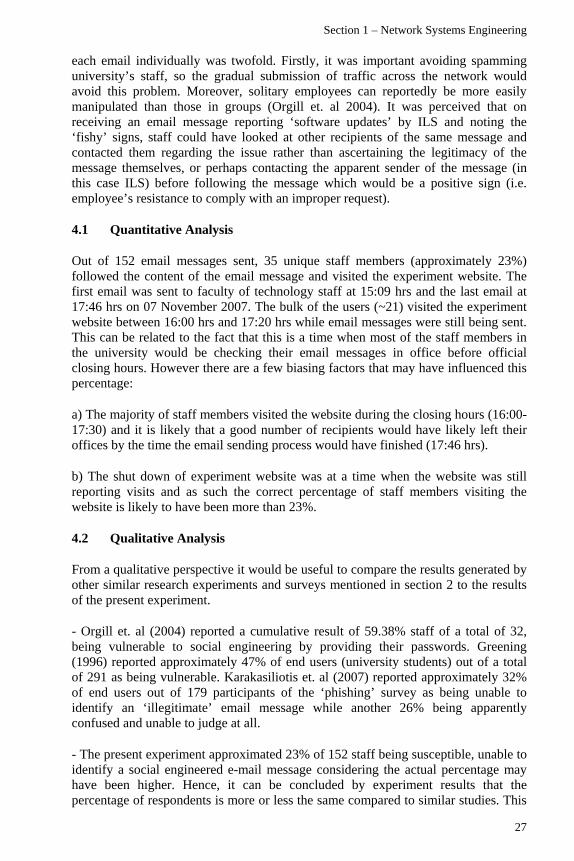
Out of 152 email messages sent, 35 unique staff members (approximately 23%) followed the content of the email message and visited the experiment website. The first email was sent to faculty of technology staff at 15:09 hrs and the last email at 17:46 hrs on 07 November 2007. The bulk of the users (~21) visited the experiment website between 16:00 hrs and 17:20 hrs while email messages were still being sent. This can be related to the fact that this is a time when most of the staff members in the university would be checking their email messages in office before official closing hours. However there are a few biasing factors that may have influenced this percentage:
a) The majority of staff members visited the website during the closing hours (16:00-17:30) and it is likely that a good number of recipients would have likely left their offices by the time the email sending process would have finished (17:46 hrs).
b) The shut down of experiment website was at a time when the website was still reporting visits and as such the correct percentage of staff members visiting the website is likely to have been more than 23%.
4.2 Qualitative Analysis
From a qualitative perspective it would be useful to compare the results generated by other similar research experiments and surveys mentioned in section 2 to the results of the present experiment.
- Orgill et. al (2004) reported a cumulative result of 59.38% staff of a total of 32, being vulnerable to social engineering by providing their passwords. Greening (1996) reported approximately 47% of end users (university students) out of a total of 291 as being vulnerable. Karakasiliotis et. al (2007) reported approximately 32% of end users out of 179 participants of the ‘phishing’ survey as being unable to identify an ‘illegitimate’ email message while another 26% being apparently confused and unable to judge at all.
- The present experiment approximated 23% of 152 staff being susceptible, unable to identify a social engineered e-mail message considering the actual percentage may have been higher. Hence, it can be concluded by experiment results that the percentage of respondents is more or less the same compared to similar studies. This

Advances in Networks, Computing and Communications 6
28
essentially means that social engineering susceptibilities are inherent in university staff as among other computer users such as corporate office workers, university students, general population, etc. and user education regarding this vulnerability is necessary.
- Employee reaction was reported to be a mix in the experiments by Orgill et. al (2004) and Karakasiliotis et. al (2007) and also observed in the present research experiment, some employees clicking the embedded link while the rest querying the relevant computer support department (ILS). The present experiment was slightly different as being a real scenario the reporting mechanism did not account for user comments other than any voluntary response by the staff on receiving sent the explanatory email. While factors such as notion of asserting authority by using the name of ILS, originating email address, URL/Link, forceful language, confidence building measures etc. were incorporated in the research experiment.
The more or less same number of respondents in this experiment compared to similar studies by Orgill et. al (2004), Greening (1996) and Karakasiliotis et. al (2007) could be attributed to the following factors.
4.2.1 Staff’s lack of awareness
The IT policies, rules and regulations available on the ILS website provide a modular approach to key factors that the university computer users (including staff and students) have to take into account while using university resources. The rules related to IT policy use which may assumedly be relevant to countering a social engineering attempt as undertaken in the experiment include documents such as Email/Outlook Etiquette (Email 2007) and Good Practice and Marketing and Communications Department guide (Marketing 2006). There is scanty information available in these guidelines that could support the user in effectively identifying a social engineering attempt via an email message and it can be deduced that staff require awareness regarding social engineering vulnerabilities at least from this information channel.
4.2.2 Context of the email message
A good environment for a social engineering audit as described by Greening (1996) and importance of context of the email Karakasiliotis et. al (2007) mentioned by is crucial for the success of a social engineering attempt. Factors that would have biased the result of the experiment and are nonetheless valid and applicable in real social engineering attempts are mentioned below.
a) A week before the experiment the university portal had been updated and was experiencing considerable problems with regards to user access and other technical issues. In such an environment an email from the ILS regarding important software upgrade would not be considered ‘un-common’. This was further fortified by the fact that the domain name of the sender’s email address had been spoofed to ‘plymouth.ac.uk’, hence a way of legitimising the sender as being authentic

Section 1 – Network Systems Engineering
29
b) The timing of the experiment could have influenced the results in the sense that by the time the email messages were received most of the staff would be preparing to leave their offices and this ‘rush’ factor could have added to their susceptibility.
4.2.3 Post experiment derivations
After successfully being run for approximately two hours (18:46 hrs)t the experiment has to be halted and a list of all staff email addresses to which the email had been sent be provided due to intervention by ILS. The experiment website was also consequently shut down at 18:50hrs.
The main reason for this action was a misunderstanding in relation to a requirement for the experiment approval by ILS, which wanted the experiment not to appear to originate from them. However, since the name and address of ILS in the email was spoofed and paraphrased, the project supervisor did not think that this particular requirement was invalidated. Also, ILS’s name is present in the university external website (ILS 2007) and so it could have been more easily used in a real social engineering attempt. This of course was not the view from ILS, which led to the termination of the experiment.
Subsequently the ILS wanted to make changes to the explanatory email message. A comparison between the previous email message and modified version revealed two interesting additions by ILS included below.
1. ILS was not the actual sender of the email, ‘[email protected]’ does not exist
It can be suggested that the staff members may have responded to the same address for contacting ILS regarding further queries. The email address [email protected] had actually been spoofed and possibly mail sending error would have led to more subsequent explanations by ILS. Hence, ILS wanted to make it clear that it was not the actual sender of the email message and the associated email address did not exist.
2. ILS would in any case never send out links for software upgrades in this manner.
It appears that staff members were unaware that software upgrades would not be sent out in this manner before this incident and may have considered the email to be about a genuine software upgrade. ILS took this opportunity in educating the staff that software patches would never be sent in this manner so that the staff could avoid such scenarios in future.
In conclusion it would be feasible to judge that the email message caused considerable confusion to staff members. It would be appropriate to assume that had an individual with a malicious intent composed such a message originating from an authority such as ILS and requested something improper (e.g., username, password, click on external link, etc.) from the staff members the consequences would have been far shoddier.

Advances in Networks, Computing and Communications 6
30
5 Conclusion
Having discussed the quantitative and qualitative aspect of the study in detail the following provide a summarisation of the analysis and discussion of the results generated as part of this research experiment.
- 23% of the staff members were in some way or another vulnerable to social engineering attacks this includes the individuals who deliberately visited the website knowing it was a compromising attempt and those who failed to recognize this attempt at all despite the ‘tell-tale’ signs included in the message.
- Approximately 23% of the 152 recipients (faculty of technology) staff being susceptible and unable to identify a social engineered e-mail message when compared to similar experiments by Orgill et. al (2004), Greening (1996) and Karakasiliotis et. al (2007) suggests that the percentage of respondents is more or less the same. This essentially means that social engineering susceptibilities are as inherent in university staff as among other end users including corporate office workers, university students, general population, etc. and user education regarding this vulnerability is necessary.
- In most instances the availability of internal organization structure and policies on dealing with various scenarios is readily available to external public. In the present case this would be the role of ILS, the email addresses and contact details of staff members as well as some general guidelines and escalation procedures related to IT services in University of Plymouth. Such information would be quite useful to a social engineer in executing a well planned compromising attempt.
- The overall context of the email message i.e. using ILS’s name, the timing of the email message, the spoofed originating email address, ‘tell-tale’ sings of social engineering and lack of information among staff regarding the method of software upgrades affected the overall result. Such features are imitated in genuine scenarios and therefore, the experiment provided a factual account of the susceptibility level of staff to social engineering attempts which is almost the same when compared to similar experiments meaning that social engineering poses a considerable threat to computer security.
6 References
Email/Outlook (2007), ‘Email/Outlook Etiquette and Good Practice’. Retrieved on December 21, 2007 from https://exchange.plymouth.ac.uk/intranet///computing/Public/ policies/Email%20Etiquette%20ver3.2.pdf
Erianger L. (2004), ‘The weakest link’, PC Magazine, issue 23, pp. 58-59
Granger S. (2001), ‘Social engineering fundamentals, part I: Hacker tactics’. Retrieved April 24, 2007 from http://www.securityfocus.com/infocus/1527
Greening T (1996), ‘Ask and Ye Shall Receive: A Study in ‘Social Engineering’’, ACM SIGSAC Review, vol. 14, no.2, pp. 8-14, ACM Press NY, USA.

Section 1 – Network Systems Engineering
31
ILS (2007), ‘ILS Self-help home accessed via opening hours’. Retrieved on December 21, 2007 from http://www.plymouth.ac.uk/pages/view.asp?page=719
Jones C (2003), ‘Social Engineering: Understanding and Auditing’. Retrieved on December 18, 2007 from http://www.giac.org/practical/GSEC/Chris_Jones_GSEC.pdf
Karakasiliotis A, Furnell S and Papadaki M (2007), ‘An assessment of end user vulnerability to phishing attacks’, Journal of Information Warfare, vol. 6, no. 1, pp 17-28. Retrieved on January 3, 2007 from http://www.infowar.com/index.php?act=attach&type=post&id=11
Marketing (2006), ‘Marketing and Communications Department – Policies and Procedures on News Alerts’. Retrieved on December 21, 2007 from https://exchange.plymouth.ac.uk/intranet///computing/Public/policies/News%20alert%20policy.pdf
Mitnick K and Simon W (2002), ‘The art of deception: Controlling the human element of security’. Indianapolis, Indiana: Wiley publishing, Inc.
Nolan and Levesque (2005), ‘Hacking human: data-archaeology and surveillance in social networks’, ACM SIGGROUP Bulletin, vol. 25, no.2, pp. 33-37, ACM Press NY, US.
Orgill GL, Romney GW, Bailey Mg and Orgill P (2004), ‘The urgency for effective user privacy-education to counter social engineering attacks on secure computer systems’, CITC – Proceedings of 5th conference on IT education, pp. 171-181, ACM Press NY, U.S.
Thornburgh T. (2004), ‘Social Engineering: The ‘’Dark Art’. InfosecCD Conference, October 8, 2004, Kennesaw GA, US.

Advances in Networks, Computing and Communications 6
32
Vulnerability Awareness
A.Edu and M.Papadaki
Centre for Information Security and Network Research, University of Plymouth, Plymouth, United Kingdom
e‐mail: [email protected]
Abstract
The many application humans carry out with the use of the computer are almost uncountable. The advent of the Internet made the whole world go agog with the wealth of activities that can be achieved on the Internet. The Internet became the information gateway. However, the development came with its sour part. The Internet became the nest for attackers who unleashed mayhem on unsuspecting users attacking their systems with all sorts of elements that compromised the systems. The common element with those entire computers is that they all are vulnerable. The idea of the consciousness of this menace is what the research, Vulnerability Awareness is about. The aim of this research is to investigate the problem of maintaining vulnerability awareness, focusing on the extent and range of sources used by network administrators and end users. The objectives of the research therefore includes to demonstrate awareness of vulnerabilities and vulnerability management issues, investigate existing attitudes of network administrators and end users towards vulnerability awareness, focusing particularly on the range of sources they use to keep informed about vulnerabilities and finally using the findings to recommend solutions to improve the problem of maintaining vulnerability awareness. The investigation lays emphasis on Network administrators and Home users. This thesis explains methods used for data collection, investigation and analysis of each set of users. The data for statistics was collected using an online survey questionnaire. The obtained was analyzed and the results are interpreted in the form of graphs and charts to obtain the characteristic attitude of each user towards Vulnerability and its management.
Keywords
Vulnerability, exploits, malware, spyware, Network administrators, Home users, Virus, Networks, Internet, patches
1 Introduction
Vulnerability has been described in different kinds of vocabulary, however a simple definition of vulnerability in networks describes it as any flaw or weakness in the network defence that could be exploited to gain unauthorized access to damage or otherwise affect the network. The lapse as described in the definition are mostly occasioned by some undetected shortcomings not considered at the design stage of various wares involved in the smooth operation of the computer network but only detected when such wares have been deployed for public use. The consciousness of the public to these weaknesses in such wares and managing these weaknesses effectively describes the concept of vulnerability awareness.
Section 1 – Network Systems Engineering
33
Well, having accepted the almost inevitable presence of vulnerability in computing. The concept of making users recognize the presence, characteristics and dangers posed by these menace and how to combat it describes the topic of these research work” Vulnerability Awareness”. On identifying the flaws in a product, the manufacturers tend to send corrections for these identified shortcomings, these are known as “patches”. Having done that, it is still up to users to effect these corrections on their individual systems. In view of this, the research tends to view the response of users to these corrections and also investigate other means by which users ignorantly expose their systems into infiltration by attackers. The main stakeholders that the research is targeted at are the end user: who either use the computers individually at home for varying applications and the network administrators in organization who sometimes are saddled with the responsibility of administering some of these patches by updating the organizational network. Many people do not regard security threat as genuine for different reasons varying from ignorance, monotonous nature of updates , reliance on manufacturers to take care of their security, reliance on administrators to mention a few. You will be surprised at how many people live with these risks without even a slight idea what great deal of danger they are exposed to. Results of these surveys will be analyzed and a possible reason for the lack of awareness amongst users will be identified and finally a possible solution will be proffered to improve awareness of users.
2 Overview of Vulnerability
Vulnerability awareness cannot be discussed without looking critically at past works related to this. Recently, surveys have been carried out to investigate Vulnerability, vulnerability consciousness and knowledge of important security issues amongst computer users, threats that are inherent with lack of good awareness practices and the financial and human implication of past bad vulnerability management practices. Prominent amongst these works are. Symantec in 2004, AOL and Get safe online in 2005, the British computer society, Symantec and Webroot Incorporation in 2007 and more recently, Symantec, computer security Institute, Sans Institute, McAfee and the Australian computer emergency response team, all in 2007 to mention a few. Some of these works will be revisited and reviewed to give justification to this research as the research tries to establish if improvements have been achieved in these areas and offer improvements recommendation in areas still lagging in all the topical vulnerability issues raised in these past literature.
2.1 Symantec survey (Dec.2004)
This survey carried out by Symantec over a five year period between 1999 and 2004 revealed series of discoveries over the five year period that deals with several areas of security which include Vulnerability trends and threats arising from unpatched vulnerabilities. Some of the highlights of this survey are as described in the number of vulnerabilities discovery, average time to exploits of these vulnerabilities and attack trends. The highlights of this survey are as described below. Figure1 shows the average new discovery in vulnerabilities weekly from1999 to 2004.

Advances in Networks, Computing and Communications 6
34
Figure 1: Number of weekly discovered Vulnerabilities. (Symantec, 2004)
From the outcome of the survey, an increase was seen in the vulnerability discoveries as the years moved on. Though the difference in discoveries were relatively reduced over the last two years of the survey, The outcome of that has been able to prove that with more application introduced to everyday computing as a result of advancement in Technology, more rooms for exploitation arise as a direct consequence of these developments. The advent of the Internet in the 90s saw little to worry about Vulnerabilities as seen from the survey, however, with the astronomical rise of the Internet around the globe in the new millennium, perpetrators of evil acts equally appeared on the Internet as well, and thus loopholes in computers and their applications are exploited through this exposed vulnerability. A need to provide correction for these Vulnerabilities known before colossal damage is done by would be attackers has informed manufacturers releasing vulnerabilities and patches for this vulnerability to save their users from horror. The data represented in figure 1 only shows that with advancement in computer communications occasioned by the Internet, the attackers as well are becoming more sophisticated discovering lapses in computer hardware and software as well. In 2004, the time between vulnerability discovery and exploitation was studied. Figure 2 shows the results for the Vulnerability against exploitation time survey carried out in the first six months of 2004.
Figure 2: Vulnerability discovery versus exploitation time (Symantec, 2004)

Section 1 – Network Systems Engineering
35
The results from the figure above shows that in the year in question, (2004) the time between a discovery of a vulnerability and the time likely to become an avenue for attacks range between 4 and 7.8 days, bringing it to an average 5.8 days. With that, the manufacturer or vendor has little or no time to develop patches to correct these flaws before an imminent attack is launched. Some facts behind the figures also provided by the survey showed the following:
Attack Code Red Slammer Blaster Sasser Witty Worm
Mydoom.ah
Time to attack after Vulnerability disclosure
Doubled infection rate every
37 minutes
Doubled infection rate every
8.5 seconds
27 days after
disclosure
16 days
48 hours
4 days
Table 1: Time taken for attack after vulnerability discovery.
Considering the fact that the survey was carried out four years ago, it will be imagined that development must have influenced these figures for or against computer users, as it is evident that the newer the technology measures introduced by manufacturers to curb the efforts of these malicious entities, the more sophisticated these attackers get also in their attack patterns as drastic actions often begets drastic reaction. In as much as the manufacturers want to remain in business the attackers as well want to remain also in business.
The work by Symantec in 2004, showed the extent to which Vulnerability and threats associated with it have moved from linear increase in the 90s to a multiplier effect of a very alarming proportion in the post 1999 era.
period Win 32 Malicious
codes threats
reported
Malicious codes recorded
Bot Infected computers per
day
Vulnerabilities documented
Jan –June 2004
- 4496 60,000 1378
July –Dec.2006
8258 1318 63,912 2,526
Jan. –June 2007
212,101 1509 52,771 2461
Table 2: Vulnerability and threat trends (Symantec, 2007)
With obvious development of new technology by a host of manufacturers trying to attract more customers, more security measures have been put in place to curtail varying threats that may arise from vulnerability; this has also motivated attackers to improve on their activities incorporating more sophisticated modes as well. To get a clearer picture of what the vulnerability issues of recent times are, a more recent survey to investigate similar concepts have to be reviewed to give an up to date analysis of the various menace occasioned by vulnerability. Symantec, the same organisation that carried out the 2004 survey have carried out more recent surveys along the line, these research reports are contained in the Symantec Internet threat

Advances in Networks, Computing and Communications 6
36
reports XI and XII.A direct comparison of the statistics gathered from the three surveys is as shown in figure 2.
The trends shows from the three surveys a drastic drop from the 2004 survey in terms of Malicious codes recorded from close to 5,000 to just above 1500 in the 2007 survey. However, the first half of 2007 has an appreciated number of these malicious codes as against the last half of 2006 underscoring the hard work attackers have put in as well over the last six months, an indication that attackers as well mean business. Zombie computers or Bot infected computers incidents rose from 60,000 a day in the first six months of 2004 to 63,912 per day in the last half of 2006 and further dipped to over 52,000 in 2007.Vulnerabilities documented has also been on the increased from the earliest of the three surveys almost doubling the number. The surveys actually show the extent Vulnerabilities are ready to be exploited by mischief makers giving everyone an indication that the threat is here and here to stay.
3 Analysis and Discussion
With the risk of vulnerability exploits increasing and users being the obvious targets, there is a need to find out how knowledgeable the users are towards their own safety and particularly the level of education or information they have to prevent them from falling victims of these exploitations occasioned by bad vulnerability practice.
To carry out this investigation, a questionnaire was prepared for home users and network administrators to ascertain their level of Vulnerability consciousness and management practices. The survey produced 203 respondents for all users with 52 of those being network administratrors.The survey questionnaire was hosted on the website freesurveyonline.com a survey website that helps in helping registered account holders conduct surveys online. The results were automatically updated unto the account created by the user as soon as they come in. The survey was carried out for a period of time and the results collated and analyzed. The questions contained in the questionnaire centers around issues which include vulnerability information sources, application of patches, responses to unsolicited mails to mention just a few of the 27 questions.
The response of users to some of the questions in the survey that were critical to the research carried out is as shown in the following graphical representation.
3.1 Home or end users
From the response to both questions, two points were clear, firstly, users were seen to be more inclined to the organizations that provided security suites like antivirus, anti spyware and others but were not readily knowledgeable about vulnerability databases which give unbiased information on vulnerabilities and how to deal with them.CVE and SOPHOS provide such information as such users are supposed to be at least conversant with them. More interesting is the response to the follow on question which asks the frequency of visits to these sites. Majority of the respondents hardly ever visit the sites, a clear digression from the overwhelming response to the McAfee and Symantec response of people’s knowledge. Also, of note is the response to question on non response to patch .91 people of the 203 representing almost 50%

Section 1 – Network Systems Engineering
37
don not respond to patches for one reason or the other a clear indication that users either by omission or commission expose themselves to vulnerability exploits.
Figure 3: Knowledge of Vulnerability information organisation A) CVE B) CERT C) SYMANTEC D)
SOPHOS E) MCAFEE F) SECUNIA G) NONE OF THE ABOVE
Figure 4: Frequency of visits to Vulnerability Site A) Daily B) Weekly C) Monthly D) Yearly E) Hardly ever
3.2 Network Administrators
Some specific questions directed at network administrators also show they act in ways which open their organization networks to vulnerability exploits .29 of the 52 respondents respond for one reason or the other do not apply patches unto the network, which exposes a large amount of end users and organizational infrastructure to risks of exploitations. Figure 5 below shows the distribution of the response of the network administrators to the patch application question.

Advances in Networks, Computing and Communications 6
38
Figure 5: Administrators holding back from applying patches
4 Conclusion
The survey brought about a lot of interesting conclusion and contradictions as well from the respondents .While some users thought of themselves as professionals they actually failed in basic vulnerability related questions. It is almost impossible to think a whole lot of users claim to be experienced from over 3 years and still find it difficult to identify with household names in the industry.
The survey has been able to establish that the basic installed protection software installed on individual computers is not enough to take care of their security needs, but the trend of the threats that exploit common human vulnerabilities today are more sophisticated and resistant to mere plug and play protection offered by anti viruses. The new scale of malicious codes as observed by Symantec identifies newer codes that are resistant to antivirus which can exploit the ignorance displayed by a host of computer users today. 100% of participants in the survey had one form of formal education or the other as far as the doctorate level. This shows clearly that formal education in the four walls of a classroom does not guarantee your information on information technology. The fact that a lot of people hold back from applying patches was particularly worrisome, there is no easier way by which the users can be more opened to risks. The reasons they give range from complexity in the nature of these patches to mere laziness. People seem to appreciate security and want it at all times, however, efforts to take responsibility for themselves and their fellows is very unimpressive.
The whole bulk of the blame cannot be given to the users though, as some stakeholders in these are also part of lack of education on vulnerability. The most governments of the day, encourage the teaching of Information technology in schools and colleges, they tend to focus on how to make computers and what to do with them, but not what the effect of using the computer in an unwise way may cause. It is worthy of note that emphasis has been laid on securing the computer generally as evident in the overwhelming knowledge of McAfee by the users, however not much emphasis is placed on education on good practice that will reduce the need to worry too much about security, this was evident in the large number of people that hardly ever visited a vulnerability information site despite claims they knew Vulnerability

Section 1 – Network Systems Engineering
39
sites. The concept of Vulnerability awareness is to show that good management practice reduces the need for worry over vulnerability. Another important discovery of the survey showed majority of network administrators felt the most common factor responsible for bad vulnerability management practices the lack of knowledge of end users within the organisation. In my view, the Vulnerability knowledge of good practice resides in whatever orientation they receive from their organisation in form of awareness training and Vulnerability coaching from time to time.
Finally, the manufacturers and vendors sometime discourage users from performing best practice as patches and other vulnerability tools are often filled with too many technical jargons for ordinary users to comprehend at times. Manufacturers should endeavor to produce wares with the customers at heart and not the financial gains, with that, more time will be spent producing only the best quality of materials that will not containing all sorts of technical lapses in nauseating proportions.
5 References
Arbaugh, Fithen and Mc Hugh “windows of vulnerability”. A case study analysis. IEEE computer, vol.333 no.12
www.bcs.org/server.php?show=conwebdoc.6307 (accessed 02/06/07)
www.cert.org (accessed 26/04/07)
www.fsecure.com/weblog/archives/archive-012006.html (assessed 27/04/07)
Migakizza, J. (2005), “Computer Network security” 4th edition
www.sans.org/top20 (accessed 27/04/07)
www.schneier.com/blog/archives/2006/05/dangers_of_repo.html (assessed 27/04/07)
www.staysafeonline.info/pdf/safety_study_2005.pdf (accessed 02/06/07)
Stewart, L.D.S.J.N. “The worldwide web security FAQ” [http://www.w3.org/security/faq/ ]
Symantec “Internet Security Threat Report”
http://eval.symantec.com/mktginfo/enterprise/white_papers/ent-whitepaper_symantec_internet_security_threat_report_iv.pdf (accessed 19/11/07)
http://eval.symantec.com/mktginfo/enterprise/white_papers/ent-whitepaper_internet_security_threat_report_xi_03_2007.en-us.pdf (accessed 19/11/07)
http://eval.symantec.com/mktginfo/enterprise/white_papers/ent-whitepaper_internet_security_threat_report_xii_09_2007.en-us.pdf(accessed 19/11/07)
Webroot software Inc. (2005) “state of spy ware Q3 2005” webfoot software Inc. 1-91pp
Webroot software Incorporated (2007) “The state of spyware: protect your network from emerging spy ware trends and the real threat and risk of spy ware”

Advances in Networks, Computing and Communications 6
40
Network Security, Guidelines to Build a Security Perimeter for SMEs
S.Godon and P.S.Dowland
Centre for Information Security and Network Research, University of Plymouth, Plymouth, United Kingdom
e‐mail: [email protected]
Abstract
Network Security is becoming a significant problem for SME administrators. Lack of time, small budget and limited expertise are some of the common issues faced today by most small and medium companies. This paper addresses this problem by proposing a simplified method for securing the network perimeter. Based on the observations made on SME constraints and on the state of the art of current vulnerabilities and threats, this paper presents a decision making approach on how to build a security perimeter for SMEs. Firewalls are obviously the central point of this study. Different guidelines will be provided to efficiently choose a firewall solution.
Keywords
Firewalls, Perimeter, SME
1 Introduction
The great majority of today’s small and medium sized companies are dependent on IT systems and most of them need internet access to drive their business. However, the landscape of cyber security threats is becoming more and more complex and now targets companies of any size. (McAfee 2008) Data theft, computer downtime, productivity decrease and loss of reputation are no longer a matter of large corporations. If Small and Medium Companies seems to face the same risks as large companies, they do not have the same expertise and budget to address them. But their principal difficulty is the lack of time to design appropriate security perimeter and manage security issues. This paper presents a method that should help SME administrators to design a security perimeter that fits the needs of the company.
2 Firewall, the key element of security perimeter
A security perimeter is an enforcement zone around the private network to protect the security assets of a company. It is generally composed of many different devices or security services such as anti-virus, content filtering, virtual private networks, intrusion detection systems, authentication servers, vulnerability scanners, etc. However, the foundation of any security perimeter is the firewall. Indeed, the firewall is the entry point of the private network and thus the first line of defence; it creates a barrier (or boundary) between the trusted network (the private network) and

Section 1 – Network Systems Engineering
41
the outside (internet) by controlling all the incoming and outgoing traffic. The firewall design is then a milestone to build a good security perimeter.
3 Firewall Selection: a daunting task
Given the key functions of the firewall, its choice is critical for the security of a company. But it is not without difficulties. Choosing the architecture and product that really fits its needs is generally an overwhelming and time-consuming task. The process includes two major phases: the definition of the needs and the evaluation of the different products available on the market.
Prior to the firewall selection, a risk assessment has to be performed to estimate the security needs. This step consists in identifying the critical assets of the company (everything of value to the organisation). It also permits to identify the security weaknesses of the business and thus facilitate the risk prioritisation. However, this step is often bypassed or under-estimated by SMBs: only half of them performed Risk Assessment in 2006 according to the DTI report. (DTI 2006) This generally results in firewall solutions that either under-estimate or over-estimate the needs of the company.
The security needs identified, the evaluation of the available products is the next logical step and not the easiest one. The reason why is because firewalls come up in many different flavours (hardware, software, commercial, open-source), each vendor adding its own buzzwords, proprietary trademarks, adds-on and support contracts.(Taylor 2002; Shinder 2008; Chapple 2005) All this makes the comparison of features not straightforward. If the primary step has not been concluding, it is then easy to get influenced by the firewall offers and purchase a firewall that seems to fit but does not really as long as the company implements it.
The increasing complexity of new threats generally closely related to the constant evolution of new technologies has considerably accelerated the development of firewalls more and more complex to design and maintain. Although SMEs think to save time by purchasing firewall as a one-fit-all product, the result is either at the expense of security or at the one of the business. The principal cause is the lack of time: The McAfee report shows that one third of UK SMEs only spend one hour per week on IT security. (McAfee 2008) In order to address this recurrent problem in SMEs, more support should be given to help them implement and maintain their security system more efficiently.
4 Firewall Design Decision Making (FDDM)
Firewall Design Decision Making is an approach which tends to provide support to SMB in their process of choosing a firewall design that firewall architecture, firewall technologies (or inspection level) and finally firewall products. The method is built in a way to reflect the needs of the company. It relies on key criteria known to be decisive enough to lead to a specific firewall design solution. This method is a questionnaire based approach in 4 easy steps:

Advances in Networks, Computing and Communications 6
42
Step 1 tries to determine the scope of the company and its security objectives.
Step 2 intends to determine which firewall architecture best fit the need of the company.
Step 3 determines what firewall technology (firewall filter) is the most appropriate.
Step 4 investigates which product and features may fit the technical requirements.
4.1 Step 1: The scope of the company
The firewall design is more or less dependent on the specificity of the company: its size, its sector of activity, its geography, the complexity of its network, its personnel, its business objectives...But the most important aspect that conditions the firewall design is the Risk Profile. This latest is what determines the level of protection required by the company. The Risk Profile is the synthesis of three parameters relative to most critical assets: their criticality to the business, their exposure and their probability to be corrupted. These information are the outcome of Risk Assessment, hence the importance to conduct such a process prior to security design.
4.2 Step 2: The firewall architecture
Three main types of firewall architecture exist: The Simple Screening Architecture which consists in one unique box with two interfaces separating the trusted network from the internet, the Multi-Screening Architecture which is one box with more than 2 interfaces which permits to connect networks of different security level, and the Dual Architecture which makes use of two firewalls to separate internal services and external services. The additional zones that are created in the Multi-Screening and Dual Architectures are commonly called DMZ (DeMilitarized Zone). A DMZ is generally a highly secured zone used to provide services to internet users and thus avoid a direct communication between the trusted and untrusted zone.
Although many criteria such as the expertise and time available may enter into consideration while choosing a firewall architecture, FDDM approach uses only the most preponderant criteria:
The type of services The Risk Profile
The firewall Architecture clearly depends on the type of services provided. With internal services only (internet access to internal users), the vector of attacks is somewhat limited, and the choice of the Simple Screening architecture nearly comes in as an evidence. However, if the company decides to open its network to external users such as teleworkers, suppliers, contractors or internet users, the Simple Screening Firewall does not suffice. DMZ(s) should be created to separate the private network from the external services. Multi-Screening or Dual Architecture are the two possible choice. The Risk Profile previously defined should permit to decide between both of them. If set to High, Dual Firewall may best fit the requirement, else a Multi-Screening should be enough.

Section 1 – Network Systems Engineering
43
4.3 Step 3: The firewall technology
There are basically four types of firewall inspection: Packet filtering Inspection, Stateful Inspection, Proxy-level Inspection and Deep Inspection. Firewall products generally use a combination of these technologies to permit more security, however most product fall into a predominant category. The easiest way to tackle the problem is firstly to determine the level of inspection that is at which layer of the OSI model the inspection occurs:
Packet filtering Inspection and Stateful Inspection occurs at the Network Layer; they basically inspect the header of each IP packet and can filter based on the protocol, source/destination addresses and source/destination ports. First one is static, while the second one keeps track of the state of the connection to deny packets that does not belong to an established session.
Proxy-level and Deep Inspection filter at the Application Layer; they are able to detect malicious code and viruses contained in the payload of packets. Proxies are the most secure firewall, but they are too specific and slow to fit in all case. Deep Inspection comes then as an alternative combining high security and flexibility.
Two criteria permit to determine which one from the Application inspection or the Network inspection is the most appropriate:
The Firewall Policy The Firewall Policy is the baseline to implement a firewall solution. It should specify more in details what services should be inspected, why and what measures may apply in case of non respect. Generally, the more precise and complex the policy is, the more probable Application inspection will be needed. And the more dangerous services are, the more appropriate Application inspection will be. The Risk Profile The Risk Profile previously determined, provides information about how well the company needs to be secure. High Security Level Business should consider Application Level Filters while Low Security Level may probably get enough from Network Inspection. Once the inspection level is determined, the choice for the sub-type inspection is a matter of technical requirements. It generally consists in giving priority to one of these parameters: the price, the rapidity or the security.
Hereafter a summary of all firewall inspection:

Advances in Networks, Computing and Communications 6
44
NETWORK INSPECTION APPLICATION INSPECTION Profile 1 Basic Network Filter - Stateless + Very Fast - Not Flexible - Low security + Cheap
Profile 2 Basic Network Filter + Stateful + Fast - Not Flexible Medium security + Relatively cheap
Profile 3 Advanced Filter + Stateful - Slow + Flexible + High Security - Expensive
Profile 4 Application specific Filter + Stateful - Very Slow - Not Flexible + Very High Security - Expensive
4.4 Step 4: The firewall product and features
When comes the moment to choose a firewall product, a lot of pending questions still remain. FDDM method focuses on the six preponderant questions. A decision tree generally helps in choosing the appropriate solution.
4.4.1 What type of product to choose?
Products are mainly divided into four categories: Embedded Firewalls, which are network devices such as router or switches
with firewall capabilities.
SOHO (Small Office Home Office) Firewalls, designed to protect relatively small network (up to 50 users).
Enterprise Firewalls, designed for larger companies with advanced monitoring and management needs.
Unified threat Management (UTM), designed for both SOHO and Enterprise profiles, they protect against the majority of internet threats.
FDDM Method determines which one of the product best is the most appropriate based on the level of inspection (either network or application based) and on the size of the company.
4.4.2 What firewall platform: Hardware or Software?
All firewalls are software running on some kind of hardware, however on the selling market you can either buy a software or an hardware solution. So what are the differences?

Section 1 – Network Systems Engineering
45
Software Firewalls are programs that run on top of an existing operating system (ie Windows, Unix). It can be installed on any existing server in the company but should preferably have its own dedicated machine. The advantage of this solution is that it is usually cheaper at the acquisition and scalable (or expandable) to meet the future requirements of the network. The downside however, is that they are more prone to hardware failure, are vulnerable to OS attacks and are difficult to maintain since this solution supposes to keep up to date the OS system as well as the firewall software. Hardware Firewalls are programs that run on dedicated devices specifically designed for the purpose of firewalls. Hardware Firewalls provide a great advantage over software based solutions. Also called turn-key solution, they are plug and play devices, easy to use and maintain with no need to secure the underlying operating system. Furthermore, they contain only what they need to run compared to computer-based solution composed of many more components subject to many more failures. The constructor warranties and the following up of products and bugs make Hardware Firewalls more reliable than computer often home-made. The downside of firewall box however is its cost and its lack of upgradability. If the future growth of the company is not taken into account during the choice of the appliance, this one will probably not fit the future needs.
4.4.3 Free or Commercial Software?
While Hardware solution will always be commercial solutions, Software solutions can be either commercial or free. When choosing between both of them, the best thing to do is probably to assess the overall cost, the features and the support available. The pitfall would consist to believe that because a solution is free, it is the most cost effective solution. However, the cost of implementation and maintenance could reverse the balance. No general decision tree is provided in this case, because of the variety of products. Indeed, free firewalls can outstrip some commercial products.
4.4.4 Open Source or Closed Source?
There is often a misconception that Open-Source means Free of charge, but it is not true. Open Source can be the basis for commercial products. Some of the examples are Untangle, Vyatta, Sourcefire, which are all commercial Firewalls built on Open-source architecture (Directorym.net 2008) Open-Source means the source code is available in clear to anyone who wants it. By contrast, Closed-Source or Proprietary Software keeps their code secret to the end-user. It may be tempting to ask the question “Which one of them is the most secure”. However, this is probably the wrong way to tackle the problem. The right way is probably to know how flexible the solution must be and how confident you are in both strategies. The decision tree implemented in FDDM is as follow:

Advances in Networks, Computing and Communications 6
46
4.4.5 In-house or Out-Source?
Firewalls are just as secure as you tell them to be. In other words, a good firewall will not provide good security if it is not well configured. Firewall configuration and maintenance is not an easy task and requires competencies and experiences. The choice to leave this task to an experimented third party could be an alternative for small and medium companies with no in-house expertise. It permits to get rid of the firewall configuration, administration and maintenance. However it does not exempt the company to define the firewall policy to apply and to check that the outsourcing company complies with the term of the policy. Although tempting, outsourcing generally offer limited services and may not be as flexible a solution as managing itself the firewall. Furthermore, this option implies to trust the out-sourcing company, not a viable option for anybody. While assessing the need for outsourcing or not the firewall, one should ask the following questions: Do you have firewall expertise in-house to ensure the maintenance and administration of the firewall? Is that part of the strategy of the company to develop firewall expertise?
4.4.6 Best-of-Breed or All-in-one?
Since the apparition of UTMs, numbers of debates oppose partisans of Best-of-Breed solutions and partisans of All-in-one solutions. The Best-of-Breed configuration consists in implementing the best of each security products with the idea to create several layers of protection: in other words, it means buying a firewall as a first line of defence, buying a separate anti-virus as a second one, buying a separate anti-spam, a separate intrusion prevention system and any other security device depending on the level of security needed. By opposition, All-in-one solution which best example is probably the UTM, is a concentrate of all the security devices in one unique box. The immediate advantage is the reduced price and the easy management of the security. The downside however is the lack of defence-in-depth with one unique point of failure.

Section 1 – Network Systems Engineering
47
5 Conclusion
The evolution of technologies went with a multiplication of threats more and more difficult to manage. Securing the perimeter stays one of the best practises to keep away attackers. However, as threats have become more sophisticated, perimeter solution also became more difficult to design and maintain. Firewalls are one of the best examples. The principal victims of all this are Small and Medium Companies for which the factor time and budget does not permit to efficiently respond these security issues. This paper has described some of the outcome of the Firewall Design Decision Making (FDDM). This methodology, although not already tested, intends to help SMEs in choosing more efficiently a firewall solution that fits their needs. FDDM should save time to administrator since it has solution oriented approach. However, one should also understand the limits of this approach. FDDM is an help to the firewall decision, but not for its implementation. No matter how good is the firewall if bad is the implementation. Furthermore, this study focused on securing the perimeter while most of the recent threats may come from the internal network. It is clear that the protection of the perimeter is not the only security challenge that face Small and Medium Companies, nevertheless any singe contribution can help to make security more affordable for SMEs.
6 References
Chapple, M. (2005). “How to choose a firewall”. SearchSecurity.com. http://searchsecurity.techtarget.com/tip/1,289483,sid14_gci1113533,00.html, (Accessed 12 January 2008)
Directorym.net (2008) “Open source security: 10 commercial vendors”. http://articles.directorym.net/Open_Source_Security_10_Commercial_Vendors-a899079.html, (Accessed 14 June 2008)
DTI (2006). Information security breaches survey. http://www.enisa.europa.eu/doc/ pdf/studies/dtiisbs2006.pdf, (Accessed 12 December 2007)
McAfee (2008). “Does size matter? The security challenge of the smb”. http://www.mcafee.com/us/local_content/reports/does_size_matter_en_v2.pdf, (Accessed 15 August 2008)
Shinder, D. (2008). “Choosing a firewall”. WindowsNetworking.com. http://www.windowsnetworking.com/articles_tutorials/Choosing_a_Firewall.html, (Accessed 15 February 2008)
Taylor, L. (2002). How to choose the right enterprise firewall. ITmanagement.earthweb.com. http://itmanagement.earthweb.com/secu/article.php/974501, (Accessed 15 February 2008)

Advances in Networks, Computing and Communications 6
48
Performance Analysis and Comparison of PESQ and 3SQM in Live 3G Mobile Networks
M.Goudarzi and L.Sun
School of Computing, Communications and Electronics, University of Plymouth, Plymouth, United Kingdom
e-mail: [email protected]
Abstract
The ITU-T’s Perceptual Evaluation of Speech Quality (PESQ) is an intrusive objective assessment tool that has been widely used in telecommunications and IP networks. 3SQM is an ITU-T standard for single-sided non-intrusive quality measurement. The purpose of this paper is to investigate the accuracy of PESQ and 3SQM in evaluating voice quality over live 3G networks. A testbed was setup based on Asterisk to measure voice quality over 3G mobile networks. 192 voice samples from the ITU-T database were recorded via mobile phones during different times of the weekdays and the results of the objective measurements (in terms of PESQ and 3SQM) were analyzed. A further 30 samples were selected (from 192 recorded ones) and carried out informal subjective tests (with 33 subjects). The correlation of the objective and subjective results was analyzed using a 3rd order polynomial regression method. The results showed that overall PESQ (including PESQ-LQO) measures have a high correlation with subjective assessments whereas 3SQM measurements had a fair correlation. This suggests that PESQ is preferred to use for objective speech quality testing in live 3G networks when compared with 3SQM. It was also found that two individual cases in which 3SQM provided better prediction results than PESQ. It can also be noticed that the quality degradation in these cases is mainly due to loss position. It indicates that PESQ still needs to improve its performance in cases such as different loss locations. 3SQM also showed useful in identifying quality problems in Individual tests. Therefore, it is recommended that a co-existence of both measures when investigating speech quality problems in 3G mobile networks.
Keywords
Speech quality measurement, Subjective, PESQ, 3SQM
1 Introduction
There are two approaches to measuring the speech quality in telecommunication networks: Subjective and Objective. In subjective listening tests a subject hears a recorded speech processed through different network conditions and rates the quality using an opinion scale, and the MOS is then calculated as an average of all participants’ scores. Subjective tests are the most reliable method for obtaining the true measurement of user’s perception of voice quality and have good results in terms of correlation to the true speech quality. Traditionally, user’s perception of speech quality has been measured by this method which is time-consuming and expensive, and it is impossible to use them to supervise all calls in the network. Hence, they are not suitable for monitoring live networks.

Section 1 – Network Systems Engineering
49
Objective models have been developed to provide machine-based automatic assessment of the speech quality score. These objective measures that can be easily automated and computerized have gained popularity and are becoming broadly used in the industry. Many field tests have shown that objective speech quality measurements can be highly useful in managing cellular networks and have necessary variety of applications in mobile networks such as daily network maintenance, benchmarking and resource management.
Intrusive measurements such as Perceptual Evaluation of Speech Quality (PESQ) are generally based on sending stimulus through the system under test and comparing the output signal to the original. Intrusive methods have a number of disadvantages such as consuming network capacity when used for testing live networks. More calls can be assessed if the voice quality is measured through non-intrusive methods based on single sided monitoring, by using the in-service speech signals. This is the basic principle for ITU-T’s Single Sided Speech Quality Measure (3SQM), developed for non-intrusive voice quality testing. It is based on recommendation (ITU-T P.563). 3SQM is less reliable in terms of the correlation with subjective tests, but as a non-intrusive technique is effective in live networks since single sided measurement will not occupy any network bandwidth and is expected to become more accurate in the near future.
Since PESQ is a more popular tool and has been widely deployed in the industry, many researches have been carried out to investigate the effects of different impairments on the results of PESQ. The effects of packet loss in VoIP networks have been investigated by (Hoene and Enhtuya, 2004). However it only focuses on the impact of packet loss in simulated VoIP environment, which may not properly model the signal characteristics during the normal operation of a mobile network. The performance of PESQ for various audio features and codecs has been studied in the reports by (QUALCOMM, 2008) and (Ditech, 2007). Also a detailed case study of the defects of PESQ time alignment features in the presence of silence gap and speech sample removal or insertion due to packet loss concealment and jitter buffer adjustment in mobile devices has been carried out by (Qiao et al., 2008).
Although PESQ is state-of-the-art in terms of the objective prediction of perceived quality and is claimed to have the highest correlation with the subjective measurements, by looking at a number of published case studies and reports, it can be seen that there is still work to be done in the area of objective quality measurement. PESQ does not always predict perceived quality in live network accurately, as a result of improper time-alignment as reported by (Qiao et al., 2008). (Ditech, 2007) also reports that there are significant known limitations to the PESQ algorithm with regards to its time alignment and psychoacoustics model. Furthermore PESQ has not been validated for many methods commonly used in live networks to enhance the quality such as noise suppression or echo cancelling (QUALCOMM, 2008); Packet loss concealment and adaptive Jitter buffer are also examples of such methods.
It should also be noted that neither PESQ nor 3SQM algorithms provides a comprehensive evaluation of transmission quality, and only the effects of one-way speech distortion and noise on speech quality are measured using these objective

Advances in Networks, Computing and Communications 6
50
methods. Factors such as loudness loss, delay, sidetone, echo, and other impairments related to two-way interaction are not reflected in the quality scores given by these models (ITU-T, 2001).
Further research can be done in the area to pinpoint the flaws and strengths of each objective model that can help to further improve the accuracy of the model or may lead to the development of new, more accurate objective measurement techniques.
Moreover, assessing how and under which conditions these methods may be more accurate, and comparing the accuracy of each algorithm under real live mobile environments is an essential issue, in order to improve the performance of speech quality measurement techniques.
The main objective of this paper is to investigate and evaluate the accuracy of PESQ and 3SQM objective measurement models in a live wireless 3G mobile network. Objective testing was carried out through our testbed platform and the correlation of the results with subjective votes was analyzed. The Individual cases in which PESQ did not predict accurate quality scores were also analyzed.
The remainder of the paper is structured as follows. In Section 2, the quality measurement platform and the methods of objective and subjective measurements are presented. In Section 3, the correlation of the objective and subjective results, plus two individual cases has been investigated. The conclusion is presented in Section 4.
2 Methodology
2.1 Objective measurement test platform
In order to objectively measure user perceived speech quality in a live telecommunication conversation, a speech quality test platform was set up to mediate between calls from 3G mobile network and the quality test equipment. As can be seen in Figure 1, the platform consists of a voice server based on Asterisk connected to the mobile network via an ISDN interface, 3G mobile handsets, monitor PC and a local pc, all networked together in an IP environment.
Using the quality test platform, calls placed or received via the voice server could be recorded on the server, or the sample speech files could be played back on the channel and recorded from the mobile on the monitor pc using the microphone and line-in of the soundcard connected to the mobile handset. Alternatively, calls could be forwarded to a SIP client for experiments with SIP, which is out of the scope of this paper.
(ITU-I P862.3) provides guidance and considerations for the source materials that will be used in speech quality tests. Reference speech should contain pairs of sentences separated by silence. It is also recommended that the reference speech should include a few continuous utterances rather than many short utterances of speech such as rapid counting. ITU-T P.862 also suggests that signals of 8-12s long should be used for the experiments.

Section 1 – Network Systems Engineering
51
Figure 1- Testbed platform for speech quality measurement
16 British English speech samples (8 male and 8 female), from (ITU-T P.50) database were used for all the subjective and objective measurements. Samples are each 6-8s in length. All the speech samples were converted to 8000 sampling rate. GSM and AMR codecs were employed as the main voice codecs used in mobile networks. 192 recording were made during week days and at three different times of the day. Figure 2 illustrates the block diagram of the experiments with PESQ algorithm.
Figure 2: PESQ speech quality evaluation setup
2.2 Informal subjective test for evaluating the accuracy of objective models
The purpose of conducting an informal subjective quality test was to validate the applicability of objective algorithms for assessing the quality of the speech samples. The main criteria in selecting the speech samples used in the subjective test, was the difference between the PESQ and 3SQM of the results. 30 samples with the highest difference in their PESQ and 3SQM results were selected from 192 previously recorded samples, some female and some male (12 male, 18 female), 17 of which were GSM encoded samples and 13 were AMR-encoded samples. The subjective test material involved 8 samples from ITU-T P.50 database with different recording time and conditions. Efforts have been made for the test to conform to the ITU-T
Encoder Mobile Network
Decoder Speech sample
Degraded Speech
PESQ MOS-LQO

Advances in Networks, Computing and Communications 6
52
standards for subjective evaluation of voice quality in telephone networks (ITU-T P.800) in terms of the test procedure and eligibility of the participants. Score sheets with instructions and voice files were sent out to colleagues and friends; and the results were collected by e-mail from the subjects. 33 subjects completed the subjective test.
In order to scale the objective scores onto the same scale as the subjective votes, relationship between PESQ and 3SQM scores and subjective MOS is modelled using a monotonic 3rd order polynomial mapping function. The closeness of fit between the objective and the subjective scores may be measured and analysed after the mapping function has been applied.
3 Experimental results
Upon receiving all the score sheets from the subjects, the average of subjective scores given by the participants was calculated for each file to achieve the MOS-LQS. The standard deviation for subjective results ranges between 0.7 to 1.01 and less than 1 for most of the cases. This indicates that the individual results differ quite significantly from subject to subject. Table compares the average results of PESQ, PESQ-LQO and 3SQM with the results of the informal subjective test. Preliminary comparisons between the subjective and objective results showed that in general, 3SQM results have a higher variation.
Codec PESQMOS PESQ-LQO 3SQM MOS-LQS GSM 3.007941 2.842765 2.406109 2.889483
AMR 3.162538 3.063692 4.164516 3.843823
ALL 3.074933 2.938500 3.168085 3.30303 Table 1: average quality scores of objective and subjective experiments
3.1 Differences between PESQ and 3SQM measurements
Although by looking at the overall results of the objective and subjective tests, the results of both objective methods are linked with the subjective results, some differences were found between the scoring of PESQ and 3SQM. Within both groups of samples (AMR and GSM) gender of the talker showed to have an effect on the perceived speech quality. For PESQ algorithm, MOS score for male talkers tends to be higher than that of female talkers. This result is more consistent with the literature. One reason could be higher average frequency of the female voice which causes a lower quality in the encoding process (Holub and Street, 2004). Also (Lingfen and Ifeacher, 2001) reported the effect of the gender on PESQ results. However, experiments with 3SQM algorithm showed opposite results, which mean relatively better MOS scores for female samples. Figure 3 shows the gender effect on the PESQ and 3SQM scores for GSM samples. The average PESQ score for male samples is more than 3, whereas in 3SQM results male samples have an average of around 2.6. This results shows that there is a difference in the perceptual model of these two algorithms.

Section 1 – Network Systems Engineering
53
Figure 3: PESQ and 3SQM scores for male and female GSM samples
Also individual cases that showed a major difference between PESQ and 3SQM results were studied. There were 2 cases in which PESQ generated a significantly less accurate results compared to their respective 3SQM results. Also in 5 cases 3SQM results were not adequately accurate and PESQ predicted the quality score more accurately.
Figure 4: Inaccurate PESQ result , loss positions in the degraded speech
By comparing the wave forms of the original and degraded speech files for these individual cases, some of the low PESQ MOS scores are clearly the result of packet loss or bad signal conditions. The waveform for one of the GSM samples with the highest difference between its 3SQM and PESQ quality scores is shown in Figure 4. As indicated in the figure, many parts of the signal, particularly at the beginning of the recording are lost. Also listening tests resulted in a low score (=1.455) for this sample which is reasonable because the beginning of the speech is not intelligible. Therefore regarding it as a “bad” sample with a score of 1-1.5 is reasonable. However PESQ gave a score of 3.302 to this sample (3SQM=1.432). These results show that the position of loss has an effect on the quality score give by PESQ and also the subjects.
On the other hand, for 5 other samples the reason for such low scores is not so obvious. The same sample recorded in another time, showed to have a fairly well waveform did not seem to have a very low MOS score. However, 3SQM score was 1.43 and PESQ score was 3.078 and subjective MOS was 3.455.
Original
Degraded

Advances in Networks, Computing and Communications 6
54
3.2 Correlation of objective and subjective measurements
As can be seen in Table 2, correlation of subjective results with the results from objective tests shows the accuracy of each objective measure in predicting the quality of the speech samples.
PESQ PESQ-LQO 3SQM Correlation 0.9433 0.8911 0.5193
Max. difference 0.412 0.591 1.319 Min difference -0.500 -0.697 -2.054
RMSE 0.237 0.343 1.108 Table 2: statistical summary of objective vs. subjective results
Figure 5 shows the scatter plots of the objective versus subjective results before and after mapping. The correlation coefficient for PESQ results after the mapping is 0.9433, which shows a high degree of correlation between objective and subjective results. PESQ-LQO scores also had a good correlation (correlation coefficient= 0.8911). 3SQM, however, had a lower correlation of 0.5193, which shows a lower level of correlation between 3SQM results and the informal subjective test results.
Figure 5: Mapped PESQ and 3SQM results vs. subjective MOS
4 Conclusions
The present study evaluated two objective measures commonly used for evaluating speech quality. The test conditions included real live mobile environments and GSM and AMR codecs as the main voice codecs used in mobile networks have been employed. Around 200 recording were made during weekdays and at different times of the day.
The comparison between subjective and objective results showed that PESQ and PESQ-LQO measures have a good correlation with the subjective results and according to our results PESQ can be used reliably for objective speech quality measurements in live 3G networks. Though in individual cases 3SQM showed to

Section 1 – Network Systems Engineering
55
have a more accurate prediction. In two cases PESQ algorithm seemed to be less accurate compared to 3SQM, one of which is mainly due to the loss position.
3SQM as non-intrusive test method could not supersede intrusive analysis as expected; since it lacks the information from the reference signal. However, it showed useful in identifying quality problems in individual tests and as a non-intrusive measurement has advantages in live telecommunication networks. Therefore, it is recommended that a co-existence of both measures when investigating speech quality in 3G mobile networks.
5 References
Ditech. (2007) Limitations of PESQ for Measuring Voice Quality in Mobile and VoIP Networks. http://www.ditechnetworks.com/learningcenter/whitepapers/WP_PESQ_ Limitations.pdf, (Accessed: 18/7/2008).
Hoene, C. and Enhtuya, D-L (2004) Predicting Performance of PESQ in Case of Single Frame Losses. Proceeding of MESAQIN 2004. Prague,CZ.
Holub, J. and Street, M. D. (2004) Impact of end to end encryption on GSM speech transmission quality - a case study. Secure Mobile Communications Forum: Exploring the Technical Challenges in Secure GSM and WLAN, 2004. The 2nd IEE (Ref. No. 2004/10660). pp 6/1-6/4.
ITU-T (1999) Artificial voices ITU-T Recommendation P.50,September 1999.
ITU-T (2001) Perceptual evaluation of speech quality (PESQ), an objective method for end-to-end speech quality assessment of narrowband telephone networks and speech codecs. ITU-T Recommendation P.862,February 2001.
ITU-T (2004) Single-ended method for objective speech quality assessment in narrow-band telephony applications ITU-T Recommendation P.563,May 2004.
ITU-T (2007) Application guide for objective quality measurement based on Recommendations P.862, P.862.1 and P.862.2 ITU-T Recommendation P.862.3,November 2007.
Qiao, Z., Sun, L. and Ifeachor, E. (2008) Case Study of PESQ Performance in Live Wireless Mobile VoIP Environment. IEEE PIMRC 2008. Cannes, France.
QUALCOMM. (2008) PESQ Limitations for EVRC Family of Narrowband and Wideband Speech Codecs: http://www.qualcomm.com/common/documents/white_papers/PESQ_ Limitations_Rev_C_Jan_08.pdf, (Accessed: 1/7/2008).
Sun, L. and Ifeacher, E.C. (2001) Perceived Speech Quality Prediction for Voice over IP-based Networks. Proceedings of the 2nd IP-Telephony Workshop (IPTEL '01). Columbia University, New York.

Advances in Networks, Computing and Communications 6
56
Investigation of Radio Access Bearer Dedicated Bandwidth and PDCP Compression on UMTS Networks
and their Impact on SIP Session Delay
A.Hadjicharalambous and X.Wang
Centre for Information Security and Network Research, University of Plymouth, Plymouth, United Kingdom
e‐mail: [email protected]
Abstract
SIP protocol has a significant part on the QoS of multimedia services over 3G UMTS networks. It is the protocol responsible of establishing, managing and terminating multimedia sessions over 3G wireless networks. SIP protocol as a text based protocol has its limitations and drawbacks regarding the delay experiencing in setting up those multimedia sessions. This paper studies the effect of RAB bandwidth and PDCP compression on SIP Session Setup Delay suggesting some optimization configurations.
Keywords
SIP, UMTS, 3G, RAB, PDCP, Delay
1 Introduction
The World Wide Web and the internet can only be characterized and judged by the protocols that they use. Similarly, IP communications through 3G networks and not only are mostly characterized by SIP which is basically the leader of this revolution of IP Multimedia. Driven by the continuous increasing demand for mobile data access and the evolution of the Internet, wireless data applications are now seen as the major characteristic of 3G wireless networks.
SIP is a member of the second wave of internet application protocols which focuses on interactive human to human communication and the integration of media rather than only voice especially under 3G networks. After dozens of research papers that turned to RFCs, Sip matured through time and the human to human communication standards have shifted. At the beginning, cellular phones provided voice communications at any time. Now with SIP cellular networks allow us to add any kind of media. It is widely said that SIP will merge together cellular and Internet worlds.
Despite the revolutionary behaviour of SIP, services using it suffer a major impact from delay known as session setup delay which is defined as the period between the time the originator of the session triggers the initiate command and the time the same originator receives the reply that the other party has been alerted (Kist & Harris, n.d.). This publication studies how the dedicated bandwidth assigned to the Radio

Section 1 – Network Systems Engineering
57
Access Bearer and PDCP compression affect the value of SIP setup delay over a UMTS network, pointing some optimization configurations regarding these issues.
2 SIP Protocol / UMTS Network Overview
SIP is an application layer protocol which uses plain text format messages in order to create, manipulate and terminate multimedia communication sessions that involve elements of multimedia world like audio, video, instant messaging etc (Lakay, 2006). Members belonging in a session governed by SIP are able to communicate via multicast or a mesh of unicast relations or even a combination of these. Furthermore SIP supports session description that has the ability to allow participants to agree on a set of compatible media types. Session Initiation Protocol prefers UDP and TCP but is also compatible with other protocols like IP, ATM and X.25. It is easy to cope with, requiring only a datagram to work and can be very friendly with other protocols when combined to create a complete multimedia architecture.
SIP is a layered protocol, and its function can be described as a set of independent steps with only a loose margin between each. Of course each layer has its own rules which have to be followed in order for a layer to be contained within an element. However not all layers are part of an element making that way each SIP element logical and not physical. SIP has a lead role on the Quality of Service offered by 3G networks as it is responsible of the establishment, management and termination of multimedia sessions carried out in these networks (Lakay, 2006).
A UMTS network is one of the many types of 3G cellular network available today and it consists of two parts: a Radio Access Network (RAN) and a Core Network. The RAN aims to provide the users with radio access and CN provides the users with services. This allows different RAN and CN elements to be combined.
Primary functions of the CN is providing routing and switching along with control traffic. CN is divided into circuit switched (CS) and packet switched (PS) domains. CS is an evolution of GSM and PS an evolution of GPRS. Both packet switched and circuit switched services are handled by the SGSN and GGSN nodes. The GGSN operates with knowledge on the SGSN handling the user and has the ability to act as a gateway router between the UMTS network and the Internet. ATM or PPP interface is used for UMTS transmission for the Core Network. RAN is required to provide wireless (WCDMA) connectivity between UE and CN and it is basically a set of Node Bs and RNCs. The UTRAN is specially built in order to support many kinds of traffic and services, from circuit switched (PSTN) to packet switched services and controlling the functionalities of Node Bs. Radio Access Network is the place where the most important functions and protocols that control the functionality of a UMTS network reside.
SIP is implemented in a UMTS or any kind of 3G networks through IMS (Internet Multimedia Sub-system). IMS enhances the IP connectivity of UMTS by adding network entities that handle multimedia sessions.

Advances in Networks, Computing and Communications 6
58
3 Experimental design
Radio Access Bearer (RAB) is a theoretical medium/service provided by the UTRAN in order to enable the exchange of radio frames of an application (traffic) between the UE and the access network for the service intended to use creating that way the illusion of a fixed bearer designed to provide the necessary QoS for the end user application (Costa et al, 2004). It is a way to ensure that the user’s or application’s demands in terms of bandwidth are reserved and provided in order to successfully establish a multimedia session. RAB tasks involve providing an optimized way of confidential transport and signaling of user data between UE and CN. Furthermore it is responsible for taking care of all aspects of the radio interface transport (Laukkanen, 2000). A RAB will be set up taking into account the demand of the user in terms of bandwidth and the available resources. It is the last step before the packets are sent through the air interface and operates like a quality control mechanism. Transmission of VoIP packets within a RAB works with an application at the UE creating data which is then stored in an internal buffer. When the frame is created, is sent through the air interface to the Node B where IP packet is generated and sent through the RAN to the RNC which extracts the IP packets and sends them to the core network (Costa et al, 2004).
The other aspect of the test is PDCP compression. PDCP compression is meant to provide functions that improve channel efficiency. The current mode that PDCP uses in order to provide that efficiency is header compression. After finishing the compression it sends the resulting PDCP-PDUs to the RLC protocol. Transmission efficiency that PDCP is trying to implement into UMTS packet exchange depends on the size of the header relative to the size of the whole packet. PDCP compression relies on the fact that many headers remain the same during transmission thus transmitting a packet at the beginning with the entire header in order to use it as a decompression reference and the rest of the packets without a header. If the header changes during the transmission, it must be retransmitted in order to be used again as a reference for the future packets (Karim & Sarraf, 2002).
4 Simulation and Results
4.1 Optimization of dedicated RAB bandwidth for SIP based VoIP services
The radio access bearer and its performance are of key value to a UMTS network as it is responsible for the allocation of resources. The test consists of 6 simulations each with a different total bandwidth value assigned to the bearer. The test specifics can be seen on the following table:
Characteristics Test 1 Test 2 Test 3 Test 4 Test 5 Test 6 RAB B/width 8 kbps 16 kbps 24 kbps 32 kbps 40 kbps 42 kbps
Uplink 4 kbps 8 kbps 12 kbps 16 kbps 20 kbps 21 kbps Downlink 4 kbps 8 kbps 12 kbps 16 kbps 20 kbps 21 kbps
Voice codec G.711 G.711 G.711 G.711 G.711 G.711 Protocol UDP UDP UDP UDP UDP UDP
Users 14 14 14 14 14 14

Section 1 – Network Systems Engineering
59
Graph 1: SIP session setup delay using different RAB bandwidth values
The best performing RAB in terms of delay according to Graph 1 is 40 and 42 kbps which are represented by yellow and lilac lines respectively, where 20 kbps are allocated to the uplink and downlink in the first occasion and 21 kbps for each in the second occasion. It can also be noted that the difference between the worst and best performing scenarios is very high as the average delay when RAB is set to 40 and 42 kbps peaks at approximately 7.8 seconds and approximately at 9.4 seconds when RAB is set to 8 kbps. This is a difference of about 1600 ms which is considered very high. The delay values obtained from the test are considered high as the distance between the networks is 3200 km. The network consists of 14 mobile nodes performing VoIP calls at a static VoIP network. These values were chosen to represent the dedicated bandwidth to the RAB because setting that value below 8 kbps would lead to simulation abort with errors which means that the bandwidth was not enough to carry out the signaling operations. On the other hand, setting the bandwidth above 42 kbps led to calls being rejected meaning that not all calls were established as they should have, indicating that bandwidth settings are too high and waste many cell resources. As it can be seen from the graph above low bearer settings have a negative effect on sip delay values as there is not enough bandwidth to cope with protocol message exchange, NAS exchange messages between the UE and the core network in order for resource reservation to take place and setup the transmission path. The bearer strangles to cope with the limitations in bandwidth which is required to perform the negotiation techniques and signaling functions, acquire the necessary resources and establish the connection. On the other hand as bandwidth assigned to the bearer increases, a reduction in delay takes place as the bearer is more comfortable to perform negotiation procedures, reserve the resources and establish the connection with the core network. Assigning higher values to the bearer leads to more comfortable completion of operation therefore sessions are established quicker. Values above 42 kbps for the bearer result in call rejection

Advances in Networks, Computing and Communications 6
60
leading to the fact that they are not suitable for the network. Specifically when the bearer was set above 42 kbps only 12-13 out of 14 calls were established indicating cell resource requirements that cannot be met. Furthermore, from graph 1 it can be seen that as more calls are established and the flow of data gets larger (higher link utilization), has a significant impact on session setup delay as it jumps from 2 seconds at the beginning to nearly 8 seconds (average peak time) towards the end.
Previous test used the same bandwidth for the uplink and downlink. This simulation will try to discover the best possible RAB bit rate value, this time by arranging different values for the uplink and the downlink. The test specifications used are summarized on the table below:
Characteristics Test 1 Test 2 Test 3 Test 4 Test 5 RAB total 42 kbps 42 kbps 42 kbps 42 kbps 42 kbps
Uplink 21 kbps 20 kbps 19 kbps 18 kbps 17 kbps Downlink 21 kbps 22 kbps 23 kbps 24 kbps 25 kbps
Voice codec G.711 G.711 G.711 G.711 G.711 Protocol UDP UDP UDP UDP UDP
Users 14 14 141 14 14
Graph 2: Session Setup Delay of variable bearer bandwidth
When increasing the uplink and reducing the downlink, the network was rejecting calls, sometimes many of them. Surprised at the beginning making sense afterwards, the only explanation for that behavior is that since the calls are initiated by the UEs there are much more going on in the uplink initially when the bearer establishment is taking place. After the packet exchange is finished and the cell resources are reserved and session established, uplink and downlink requirements are the same as there is the same amount of data flowing through both channels. So assigning a higher bandwidth to the uplink means that it will utilize the much more of cell resources.

Section 1 – Network Systems Engineering
61
As it can be seen from graph 2, differentiating the uplink from the downlink did not do any good except one occasion, when the downlink equals to 23 and the uplink to 19 kbps (red line). Comparing that occasion with the default 21 uplink/ 21 downlink which is represented by the yellow line is that it performs almost identically on both low and high cell resource utilizations. Furthermore the increment of session setup delay as more resources are getting allocated seems to be smoother as time passes (x axis), making it that way an equally effective choice.
4.2 Impact of PDCP compression on SIP session setup delay for VoIP services
The second simulation involved testing PDCP compression, assigning different compression ratios and observing how SIP session setup delay was affected. As mentioned earlier PDCP compression performs IP header compression at the UMTS layer by removing redundant information from the header that was placed by other protocols. The test involves simulating four scenarios, one with PDCP compression off and with the compression ratio at 50%, 60% and 90%. Test specifics are outlined on table 2. The best performing bearer bandwidth scenario was used in order to be as a reference to this test (21 kbps up/21 kbps down). The PDCP compression must be enabled at both the end user and RNC as PDCP compression at the UE is dealing with the uplink and on the RNC with the downlink. NAS (Non Access Stratum) packets initiated by the mobile user are compressed at the user equipment and decompressed at the RNC where are being forwarded to the core network and from there to the intended destination. On the other hand packet destined to arrive at the user equipment are compressed at the RNC and decompressed at the user equipment. That means that compression is not applied on the entire packet transmission path therefore improvements on SIP delay expected are minimal if any.
Characteristics Test 1 Test 2 Test 3 Test 4 PDCP on/off Off On On On Ratio - 50% 60% 90% RAB 42 kbps 42 kbps 42 kbps 42 kbps Downlink 21 kbps 21 kbps 21 kbps 21 kbps Uplink 21 kbps 21 kbps 21 kbps 21 kbps Voice codec G.711 G.711 G.711 G.711 Protocol UDP UDP UDP UDP Users 14 14 14 14

Advances in Networks, Computing and Communications 6
62
Graph 3: Impact of PDCP compression on SIP session setup delay
PDCP compression has a negative impact on delay values despite the fact being minimal. All the scenarios with PDCP compression on perform worse than the scenario with PDCP compression disabled despite the compressed data that is flowing in the UTRAN. Despite the compression applied is limited in terms where the compression takes place, some minor improvement was expected and it was surprising not to observe anything as compression usually sets free some of the resources. This is because despite the compression applied, there is some processing delay where the packets have to be compressed and decompressed and can reach up to 50-100 ms in a network therefore having PDCP compression configured, processing times greatly overcome the benefits. Moreover performing compression and decompression may increase the packet queues at the RNC and UE. These results put a tombstone on whatever expectations regarding benefits of PDCP compression.
5 Conclusions
The value of bandwidth for the radio bearer is far from optimized especially for data transfer, specifically for multimedia services. Where 3GPP sets the optimal radio bearer bandwidth to 46 kbps, our simulated network fails to establish all requested calls using the value, leading that way to unavailability for some users for that value. Assigning the radio bearer with too low or too high value leads to the increase of sip session setup delay therefore finding the optimal value is crucial and beneficiary for the network. The importance of dedicated RAB bandwidth in a UMTS network is major as it controls not only an aspect if SIP session setup delay but also the cell resources available and the quality received be each user. When bandwidth is too low, it leads to the failure of the simulation having no adequate bandwidth to deal with the increased message exchange and when to high leads to call rejection as major cell resources are wasted. Our tests showed that the best performing bearer

Section 1 – Network Systems Engineering
63
bandwidth is 42 kbps. Finally it was proved that the optimal bandwidth assignment in terms of uplink/downlink is having the same value as the amount of data passing through the two channels is identical.
On the other hand PDCP compression proved to have negative effects instead of optimization, failing that way to live its expectation. It was created in order to provide amongst other thinks link efficiency. PDCP has the potential to be a great compression tool in the war against SIP delays but in order to do that more efficient coding has to take place (whole packet).
SIP based networks and services have evolved tremendously from the day of their introduction. Despite that there still many “inconsistencies” occurring in key areas in these networks and need improvement in order to raise them to a user satisfying level.
6 References
Costa, X., Banchs, A., Noguera, J. and Ribes, S. (2004) [online] Optimal Radio Access Bearer Configuration for Voice over IP in 3G UMTS networks, Available at: http://www.it.uc3m.es/banchs/papers/ew04.pdf [date accessed 18/08/2008]
Freescale Semiconductor, (n.d.) 3G Radio Network Controller [internet], Available at www.freescale.com/files/graphic/other/RF_3G_OVERVW_UMTS_WIRELESS_NTWK.gif [date accessed 22/08/2008]
Karim, M.R. and Sarraf, M. (2002). W-CDMA and cma2000 for 3G Wireless Networks, USA, McGraw Hill Companies
Lakay, T.E. (2006). SIP based content development for wireless mobile devices with Delay constraints, MSc, University of Western Cape
Laukkanen, J. (2000).[online] UMTS Quality of Service Concept and Architecture, Helsinki Available at: http://www.medienengineering.de/lehre/NWQoS/umts/UMTSQoSConcept Architecture.pdf [date accessed 18/08/2008]
Xylomenos, G. and Vogkas, V., (2005). [online] Wireless Multimedia in 3G Networks, Available at www.ieee.org [date accessed 6/01/2008]

Advances in Networks, Computing and Communications 6
64
Video Quality Analysis in 3G Mobile Networks
M.Imran and L.Sun
Signal Processing and Multimedia Communications (SPMC) Group, School of Computing, Communications and Electronics, University of Plymouth
e-mail: [email protected]
Abstract
Most studies in the literature for video quality analysis have focussed on areas that involve improvement of metrics and standards with less occurrence of evaluation for factors that influence the quality of video delivered over real time network especially 3G mobile networks, that has evolved since its inception and is today widely accepted and delivered as a value added service. This research paper aims at evaluating and analysing the impact on video quality over live 3G mobile networks using objective prediction models. In particular it is an attempt to assess and understand the activities involved in video calls placed and the extent to which application parameters play a role in maintaining consistency in the overall quality at the end point. Extensive objective analysis was conducted with three base types of video with five distinctive dimensions: frame rate, bit rate, frame size, video encoder type and content. The sample sets were classified into two test cases one consisting of varied frame rates with variable bit rates selected automatically by the encoder and the second test case where sample sets were tested with fixed frame rates and low to high range of bit rates. Based on the results got using the objective metric analysis that was used to predict perceived viewing quality the it showed that the video sequences displayed good resilience in negotiating key parameters such as frame and bit rates and it was also found that the video sequences with slight and rapid movements demonstrated good viewing quality and the sequence with rapid movement displayed fair quality. It is believed that this study will help promote further initiatives to investigate real time networks with a transparent approach and help improve service provision.
Keywords
3G, MOS, PSNR, VQM, H263, QCIF, perceived quality, PBX.
1 Introduction
Multimedia communication has become an integral part of our daily lives and video quality assessment to evaluate quality of service has been an active research area for over two decades. It is important to develop and improve reliable mechanisms to enable delivery of real time information with acceptable quality of service. Basis for this development mainly comes from evaluation and understanding of existing mechanisms and their capabilities. Video quality analysis is mainly of two types subjective and objective. Many analysis methodologies have been proposed and the most common are Full Reference, Reduced reference, and no reference (Khan, 2007). The most commonly used is Full reference where the exact original image is compared to the degraded sample. Subjective analysis involved visual analysis for different test cases and is usually expensive and time consuming but tend to be accurate. Objective analysis involves using metrics that predict perceived quality that

Section 1 – Network Systems Engineering
65
corresponds to a Mean opinion score (MOS) reflecting appropriate video quality. PSNR is considered a stable video metric (Xiao, 2000) and a recent improvement as a preferred metric over PSNR is the DCT-based video quality metric (VQM) that considers the quantised block of values for examination compared to the traditional calculation of mean square between each frame that is used by PSNR (Sumohana, 2007).
The aim of the project being to evaluate video quality over live 3G networks a set of objective were defined to achieve it. A test platform based on the open source IP Private Branch Exchange (PBX) was setup as a gateway to make and receive calls over live 3G mobile network.
In this paper, the perceived video quality is determined using the Full reference method where the objective model uses PSNR metric values initially to correspond to a respective MOS score that is observed as the predicted quality of the video sample. As the tests are carried out on a live network the parameters chosen for the samples are network independent. Recent work in an application oriented scenario, video prediction model was designed that highlights the significance a sample holds in terms of its correlation to application and network parameters. The focus of the analysis was based on low bit rate videos using H.263 codec for 3G-H324M compatible phones, that forms the base for mobile video communication (Zhenghau, 2000). A further aim was to investigate the impacts on video quality at varied frame and bit rates based on different content types while making a video call. Samples were collected by making video calls, i.e. by dialling in to the server that played back video samples that were classified according to their characteristics as with slight, rapid and fast movements. The samples recorded on the mobile phone were classed as degraded samples and evaluated against the original sample to evaluate deterioration and predict perceived video quality. In majority of the samples, it demonstrated an average of good quality with video sequences containing slight and rapid movements but the sequence with fast movement showed an average of fair viewing quality that was experienced at the receiving end.
In the remainder of this paper, section 2 presents a brief description of the test bed that was setup with an overview on the functionalities it offers followed by section 3 that discusses the test cases and about the samples that were chosen for analysis. Section 4 presents the evaluation and analysis results that were observed and finally section 5 discusses concluding remarks with suggestions for possible future work.
2 Testbed Setup
As illustrated in Figure 1, based on the aim of this research paper, the platform for a live 3G network test is set up as above. The test bed is configured with Asterisk, an open source PBX which handles calls and is setup with an open source application that adds a layer of functionality to the IP PBX and is available as a package that is added as an add on and executed. The other two applications visible, Zaptel and Libpri are downloadable libraries that need to be installed in order to enable complete functionality in terms of placing a proper 3G-H324M call over the ISDN network. An ISDN with BRI configuration is setup at the asterisk server to enable it

Advances in Networks, Computing and Communications 6
66
to interface with the external network and sends signalling information required to establish and maintain a call.
ISDN BRI Line
LIBPRI
ZAPTEL
OPEN SOURCE H324
APPLICATION
ASTERISK
LOCAL EXCHANGE
MOBILE NETWORK GATEWAY
Test Bed
3G-H324M Compatible
Terminal
Service Provider Network
PSTN
Asterisk Based Test Bed for 3G Video Quality Analysis
Figure 1: Asterisk based testbed for video quality analysis
The open source application (University, 2005) contains installation procedure which is straight forward and is defined set of functions that form an integral part of this project and working of this test bed. Samples collected as per specification discussed in the next section are played back using the mp4play() function that handles video frames and information relying on Asterisk s capability to handle video frames which can be activated on a call in from the end terminal using the dial plan.
The end terminal, a H324M compatible phone is used to receive the desired video samples that is enabled with a live record function using which the received video call is stored and is taken as the degraded sample for analysis.
3 Experimental Analysis
3.1 Test Data
We selected video samples focussed on different video content classification. A base of three samples was chosen which include Akiyo which represented slight movement, Carphone that contained fast moving images and Claire that contained rapid changing images. It gave the opportunity to understand the behaviour and performance of video samples with varied characteristics over a 3G network. As illustrated in Fig, Akiyo is a video sequence of a news presenter with very slight movement and the original sample contains a total of 300 frames, Carphone video sequence contains a fast moving background, that constitutes fast movement and the original sequence contains 382 frames. Final video sequence is that of Claire that demonstrates rapid movement images. The sequence has a total of 494 frames.

Section 1 – Network Systems Engineering
67
Akiyo (300 frames) Carphone (382 frames Claire (494 frames)
Figure 2: Snapshots of test samples.
All the samples are selected in QCIF format and encoded using H.263 codec. The open source usability of this video codec makes it a preferred choice and is implemented in the open source PBX, Asterisk that is used to handle calls from and to the end terminal (3G mobile phone). The samples obtained originally are in their raw format i. e. YUV (sample as individual frames characterised in their chrominance (YU) and luminance (V) making it easier for analysis).
The samples were converted to .3gp format with the required parameters, the description of which follows in the next section, using the FFMPEG tool that supports encoding and decoding of multimedia and in this case is used to prepare the required sequences with the H263 video codec at desired frame and bit rates (Zhai, 2008).
3.2 Variable test Parameters
In order to analyse performance of these different sequence over the mobile network, two different test cases were prepared. The first test case involved preparing these samples with frame rates of 10, 25 and 30 frames per second manually encoded with variable bit rates selected automatically by the encoder. This was aimed at initially understanding the behaviour of the end terminal on how it handles received video calls and negotiated integral application parameters with the network. It was also aimed at understanding the 3G network adaptability as the test parameters were independent of them due to the inability to modify of set desired values and are based on service provider configuration.
The second test case configuration was aimed more at deeper analysis for each video sequence type after transmitting them over the 3G network for their video quality and the possible reason behind the deterioration. Under this test case, the sequences were prepared with fixed frame rates of 25 fps and varied bit rates of 50, 100 and 150 bps. The frame and varied bit rates were selected to simulate samples to represent low to high quality streaming data and to observe the overall impact on the quality after they are transmitted which would demonstrate the capability of the test 3G network. The samples were run in two sets at different times identified as peak and off peak hours. Peak hours were defined as time between 9 a. m and 6 p. m and off peak hours between 8 p. m and 5 a. m. The samples were collected on a weekday.

Advances in Networks, Computing and Communications 6
68
4 Results
4.1 Analysis and Observations
The metrics used to evaluate these sequences are mainly PSNR and VQM that help in predicting a Mean Opinion score that rates the perceived quality based on the Human visual system (Mplayer, 2005).
a) With varied frame rate and bit rates
For the initial test case, degraded samples were retrieved from the end terminal, a 3G compatible phone with live recording enabled. The frame rates and bit rates from the degraded video samples were recorded and were found to be characteristic to the encoder. Although the samples were encoded at a range of different bit rates the parameter value at the end terminal were very low compared to it. The main reason behind this could be limited channel bandwidth as the terminal tries to negotiate the parameters with the network whilst decoding and also because of the nature of the video codec. A frame by frame analysis for this test case was carried out and signal to noise ratio determined. This helped predict a corresponding MOS score as shown in table.
PSNR (dB) MOS Perceived Quality >37 5 Excellent
31 - 36.8 4 Good 25 – 30.9 3 Fair 20 – 24.9 2 Poor
<19.9 1 Bad Table1: PSNR to MOS Conversion
Amongst all the sequences, Akiyo video sequence demonstrated good perceived quality with a mean opinion score of 4, which was expected as it being a sample with slight movement. Claire, the video sequence with rapid movements also demonstrated good quality with MOS score of 4 on average during both peak and off peak hours and Carphone video sequence which contained rapid movements tends to perform fairly during both peak and off peak conditions with an average MOS score of 3. The analysis was carried out the Full Reference (FR) way, where the original sample was compared to the degraded one. Having carried out observation on the performance of some of the basic features impact on its quality were determined which forms the basis this research paper
b) With fixed frame rate and varied bit rates
The second test case is a bit more specific as a standard and involves configuration of specific parameters. The samples were configured with fixed frame rates of 25 fps and varied bit rates of 50, 100 and 150 bits per second using the FFMPEG encoder. The degraded samples retrieved from the other end were converted to their raw format to enable a frame by frame analysis. The values gathered from the metrics PSNR and its corresponding MOS the relationship is shown in Table 1. The

Section 1 – Network Systems Engineering
69
evaluation results also include values returned from the D-VQM metric that reflect the amount of distortion between the frames in each sample configuration.
Sample Frame Rate (FR)
Send Bit
Rate (SBR)
Average PSNR value
MOS Score D-VQM
Peak Off Peak
Peak Off Peak
Peak Off Peak
Akiyo (176x144)
25 50 36.94 36.4 4 4 1.99 2.19 100 36.8 36.75 4 4 2.38 2.35 150 36.8 36.69 4 4 2.85 2.87
Carphone (176x144)
25 50 31.92 31.88 4 4 7.00 6.89 100 31.49 30.46 4 3 7.52 8.89 150 28.87 27.8 3 3 9.12 8.92
Claire (176x144)
25 50 34.77 34.63 4 4 3.29 3.24 100 34.26 34.36 4 4 3.53 3.60 150 34.21 33.74 4 4 3.59 3.82
Table 2: Summarised finding of metric values for the different sample sets
Table 2, shows the set of three samples with the encoded information and the decoded information at the end terminal that reflects the frame and bit rates at which the samples were received. The original and degraded samples were converted to their raw formats and analysed using MSU evaluation software (Rijkse, 1995). The Mean opinion scores predicted reflect on the quality of the sample sets where, Akiyo video sequence with slight movement tends to perform well under both peak and off peak conditions with an average opinion score of 4. The sample with rapid movement, Claire also performs well under the test conditions with a fair score of 4. The video sequence Carphone, with fast movements tends to perform rather badly. Having a closer look at the values reflects that there are slight changes in values for the PSNR and this being a predictive model affects the overall perceived quality.
The D-VQM metric was determined to validate the findings of PSNR and upon examination it is apparent it shows a high value to samples demonstrating low signal to noise ratio and it represents total video distortion which is found to be higher in all the Carphone samples which has the lowest perceived quality and reasonable distortion is seen in the slight movement and rapid movement samples. The deteriorated samples for each sequence are shown in Figure 3.
The slight movement sequence shows losses in spatial correlation that was picked up by the metric as a distortion for the first couple of frames that reduced the overall quality of the sample. Losses on the channel may have contributed towards it. The fast movement sequence demonstrates delay as shown in error frame 101, closer examination reveals the time sensitivity of this type of video as it has fast moving images which does not compensate any losses cause of high number of I frames which is common in fast moving images and is apparent on visualising the degraded sample. Channel bandwidth as noticed at the end terminal from table, with an average of 55 bits per second is insufficient for a video with dynamic quality and high bit rate. Video sequence with rapid movement demonstrates fair visual quality with negligible delay and slight distortion of image.

Advances in Networks, Computing and Communications 6
70
(a)
Original Frame Degraded Frame
(b)
Original Frame Degraded Frame
(c)
Original Frame Degraded Frame
Figure 3: (a) Original and degraded sample for slight movement [Akiyo] (b) Original and degraded sample for fast movement [Carphone] (c) Original and
degraded sample for rapid movement [Claire]
4.2 Comparison between MOS vs. Frame rate vs. Bit rate
Follwing is a summary of the overall perceived quality based on objective analysis for the various video samples with frame rates 25 fps and bit rates of 50, 200, 300 bps in peak / off peak conditions.
As shown in Figure 4, Akiyo demonstrates stable quality for at 50 and 100 and 150 bps in peak condition with Carphone at 50 bps maintains fair quality at all bit rates in both conditions and sample but dropping at higher bit rates. Claire is predicted to maintain good quality for bit rates 50, 100 and 150 bps in peak conditions. In off peak conditions Akiyo and Claire maintain their video quality but with Carphone video sequence drop its quality to fair at bit rates above 100 bps. These results correspond to the network and terminal conditions at the time of sample collection.

Section 1 – Network Systems Engineering
71
(a) Slight Movement (b) Fast Movement
(c) Rapid Movement
Figure 4: MOS vs. Frame rate vs. Bit rates comparison for slight movement, fast movement and rapid movement video samples.
5 Conclusion
In this paper, the effects of application parameters on the over all perceived quality on an end-to-end basis that were based on different content types and varied parameters such as frame rates and bit rates are presented. Further standard metrics were used under the objective analysis model to predict approximate quality and results were validated using a more recent metric, D-VQM. A network limitation faced was that it was only possible to make incoming calls to Asterisk server as outgoing video was being blocked by the service provider. It was observed the behaviour of the end terminal on how the parameters are negotiated with the network in selecting appropriate frame and bit rate that also demonstrated the efficiency of the encoder which handled the information in an error resilient low bit rate fashion, for the samples that ranges from high to low quality in terms of their bit rates.
It was also observed that certain sequences mainly the ones containing slight and rapid movement demonstrated good overall quality under both peak and off peak condition with a drop in quality at higher bit rates that was observed to be mainly because of loss of certain packets and frame distortion that was picked up by the metrics. The fast movement sequence performed fairly with a fairly low score under both peak and off peak conditions. Analysis showed that delay was one of the main reasons behind the poor performance which shows that videos streamed at high

Advances in Networks, Computing and Communications 6
72
quality still face a challenge of being delivered with acceptable quality and needs further investigation if any possible network modifications could help improve this.
As future work , focus can be laid on further investigating with maybe a possible collaboration to try and initiate this study further under live network conditions with dependant characteristics that can be changed and observe possible changes or different finding compared to the ones from this research. Subjective analysis can also be carried out and objective models that are currently improved and developed further such as VQM developed by the Institute of Telecommunication sciences can also be adopted to further investigate these findings using more intrusive methods such as channel packet monitoring that was a setback in this project because of limited functionalities in the platform used. The study can also be furthered into considering video codec's such as MPEG-4 which can be implemented as the basis of this study is totally open source giving the flexibility to do so.
6 References
Channappayya, S., Alan, K.S. and Bovik, C. (2007). "Video quality assessment with motion and temporal artifacts considered." Video Imaging Design Line.
Group, M.V.R. (2001). "MSU Video qaulity evaluation tool." from http://www.compression.ru/video/.
Group, V.Q.E. (2005). Multimedia group test plan, Draft version 1.8.
Khan, A., Sun L. and Ifeachor, E., (2007). "An ANFIS-based Hybrid Video Quality Prediction Model for Video Streaming over Wireless networks."
Jabri, M.A. (2004). "The 3G-324M protocol for Conversational Video Telephony."
Mplayer. (2005). "FFMPEG - Documentation." from http://ffmpeg.mplayerhq.hu/.
Murillo, S.G. (2006). "Asterisk Video Resources." from http://sip.fontventa.com/.
Rijkse, K. (1995). "H263: Video cosing for Low bit rate communication."
University, A.S. (2005). "YUV Research standard samples." from http://trace.eas.asu.edu/yuv/ index.html.
Xiao, F. (2000). DCT-based Video Quality Evaluation.
Zhai, G.J.C., Lin, W., Yang, X., Zhang, W. and Etoh, M. (2008). Cross-dimensional Perceptual Quality Assessment fot low bit rate videos. IEEE Transactions on Multimedia.
Zhenghau, Y.H.R.W. (2000). Human Visual System based Objective Digital Video Quality Metrics. ICSP. Australia.

Section 1 – Network Systems Engineering
73
Home Users Vulnerabilities in Audio/Video Players
R.Jain and M.Papadaki
Centre for Information Security and Network Research, University of Plymouth, Plymouth, United Kingdom
e‐mail: [email protected]
Abstract
Computer security researchers and professionals have a long history of computer vulnerabilities information. Days are gone when information security could be based on one firewall protecting a network from the dangers of external attacks. Today laptops and home computer systems have made information security a daunting task. In the recent years, there is a rapid increase in discovered computer vulnerabilities and home users have become the major target for vulnerability exploitation. Lack of human factor identification, analysis methods and user’s unawareness in computer and information security has made the conditions worse. Previous researches have focused on usability aspects of security methods like passwords, smart cards and biometrics. The main purpose of this research is to develop a basic understanding of home user vulnerabilities, issues contributing to computer and information security vulnerabilities and suggest the possible ways of avoiding these vulnerabilities. This research examines how home user vulnerabilities have evolved over the past years, what are the main factors contributing these issues and how users can make their computer safe against those vulnerabilities. The information has been carried out in the form of surveying vulnerability databases and surveying existing research. After analysing the whole results conclusion and recommendations has been drawn.
Keywords
Media Players, Vulnerability, Trends of Vulnerability, Types of Home Users.
1 Introduction
When IBM introduced their first PC, in the beginning of eighties no one thought that 20 years later there would be a PC in every home and they all will be interconnected. During these 20 years several breakthroughs in computer technology has changed the opinion of ordinary people about computers. In the middle of nineties personal computers had become easy enough to use for ordinary people because of new Windows version. The huge amount of home computers and massive internet usage has improved the information flow in various ways. People now have access to the information they need and they can communicate with each other electronically. But there are some problems that need to be addressed. Home users have become administrators of their home computer without having basic knowledge of how to protect their system from increasing threats on the internet. Hackers and attackers launch various attacks on computer systems using internet. They use internet to steal important information, install programs that monitor pattern of surfing without user’s knowledge. This makes computer security vulnerable and put information on high risk. (Ulf Frisk 2004)

Advances in Networks, Computing and Communications 6
74
Traditional sciences and engineering have a long history in the analysis of computer vulnerabilities. There are a few instances of researchers who have attempted to find some regularity in computer vulnerabilities. Same vulnerabilities occur again and again which should be a powerful incentive for the development of vulnerability database that can be used to learn from others’ mistakes. The last years have seen a surge in interest for designing and maintaining vulnerability databases. These databases are not being widely published and analyzed because of the fear that it may trigger a great number of intrusions or intrusion attempts by hackers, students or employees. So it becomes essential to examines how home user vulnerabilities have evolved over the past years, what are the main factors contributing these issues and how users can make their computer safe against those vulnerabilities. (Krsul 1997), (Lieungh 2005)
2 Home User Vulnerabilities
As discussed in the previous section, home users have become the main target for the vulnerability exploitation in the recent years. The main reason behind this is users’ unawareness and carelessness towards the security and the threats to the security of the computer. Before discussing home user vulnerabilities, this paper discusses the types of users. A users’ knowledge is of two types: Syntactic and Semantic. Syntactic knowledge is device dependent and it can be easily forgotten by the users whereas semantic knowledge is well structured, device independent and stable. It is acquired by meaningful learning. Depending on the type of knowledge, users can be categorized as following:
Novice Users: Novice users do not have syntactic knowledge of the system. They only have some semantic knowledge about the system or task they want to perform. They do not have much technical knowledge about the system.
Knowledgeable Intermittent Users: These users have full semantic knowledge about the system and task they want to perform but it’s hard for them to maintain the syntactic knowledge of the system. They can use simple menu functions or commands on the system.
Frequent Users: Frequent users have thorough semantic and syntactic knowledge about the computer and its tasks. They can use shortcuts and abbreviations while performing any task on the system. (CERT)
Depending on the types of users following are the vulnerabilities caused by the users which results system or data compromise.
Not installing antivirus on the system Not updating antivirus regularly. Not updating patches regularly. Use of weak passwords. Sharing passwords with friends and relatives. Not installing firewalls.

Section 1 – Network Systems Engineering
75
Unawareness about certain vulnerabilities. Not configuring security policies on the system. Not taking backups.
Novice users who do not have much technical knowledge do not bother about the system security. It makes the system vulnerable and an open invitation for the attackers to attack. Usually novice users do not install antivirus on the system and do not know what type of password would be safe. They do not know much about the computer vulnerabilities putting the data security at high risk.
Intermittent users have some technical knowledge about the system but they also ignore some of the security rules while using the system. Some users’ do not update their system time to time thinking that it can be done later putting the system security on risk. Most of the users do not take backups of their work done. This is also vulnerability in case of system crash or hard disk failure. Some of the users do not patch their system regularly which also makes the system vulnerable.
Frequent users also sometimes make the system vulnerable, as some of the frequent users do not enable firewall on their system. If a user is using a DSL connection for internet then it is very important to enable firewall at both ends: at the router and the system as well. (CERT)
3 Vulnerability Databases
There are many databases for reporting vulnerabilities and the databases chosen for this research are based on:
Up to date information provided by the database. Relevancy and acceptability of the data provided by the database. Total number of vulnerabilities reported. Reference to the other sources used.
Based on the above facts, databases are chosen for the analysis of the vulnerabilities reported in specified audio/video players. In this chapter the research method used for this research and various vulnerabilities found in the audio/video players is discussed.
Source URL CERT www.cert.org
SecurityFocus www.securityfocus.com Secunia www.secunia.com
Table 1: Vulnerability Databases
Secunia is one of the most trusted vulnerability database and a computer security service provider also. So it is chosen as the major source for this research. Secunia collects vulnerability information from CERT, CVE (Common Vulnerabilities and Exposures), vendors, newsletters and bug reports. Secunia prioritised remediate techniques by considering the severity of the vulnerabilities, threat environment and

Advances in Networks, Computing and Communications 6
76
commercial use of the vulnerable assets. It gives the complete solution for fixing the vulnerabilities and finding the root cause of the vulnerabilities in order to eliminate its threat completely. Figure 4.1 shows the working procedure for vulnerability management by Secunia. (Secunia)
4 Research Method
The research method used for this research is comparative method of research. Data from the various databases is compared with each other and then the trends in vulnerabilities thus extracted are analysed. The following figure (Figure 1) shows the research method used. This approach is used to study trends of vulnerabilities in the given audio/video players. Data collected from databases like Secunia, SecurityFocus and CERT is compared with each other on the basis of total number of vulnerabilities, their impact on the end users, criticality and patch management. After analysing all the results, this information is used to define vulnerability management and suggestions for safeguards against those vulnerabilities.
Figure 1: Comparative Research Method
5 RealPlayer
RealPlayer 10.x has been chosen for vulnerability analysis in this research. This has been chosen as it is one of the most widely used media player among home users. Secunia started reporting vulnerabilities in RealPlayer since 2003. Since then Secunia has released 15 advisories till 2007.
Year 2004: In year 2004, number of vulnerabilities reported in this version of RealPlayer is 4 by Secunia. SecurityFocus reported 3 vulnerabilities during this period which shows that the data from Secunia is correct. All of the vulnerabilities reported in that period of time were highly critical. Impact of these vulnerabilities at

Section 1 – Network Systems Engineering
77
the home users includes manipulation of data, cross site scripting and system access.(Secunia; SecurityFocus)
Year 2005: In this year Secunia reported 6 vulnerabilities for this version of RealPlayer. SecurityFocus reported only 7 vulnerabilities during this period of time. 4 of the 6 vulnerabilities reported by Secunia were highly critical. Impact created by these vulnerabilities was system access and manipulation of data on home users’ computer by a remote attacker.(Secunia; SecurityFocus)
Year 2006-07: Secunia reported 4 vulnerabilities during this time period while 7 vulnerabilities were reported by SecurityFocus during these years. 1 out of 4 vulnerabilities reported by Secunia was extremely critical which RealPlayer Playlist Handling Buffer Overflow was and rest of the 3 were highly critical vulnerabilities. Impact of these vulnerabilities on home users included full system access from a remote location.(Secunia; SecurityFocus)
6 Winamp
Winamp is also used by a large group of users because of its features. Winamp 5.x has been chosen for vulnerability analysis in this research. Secunia has reported 12 advisories since it started reporting from the year 2003 till 2007 for this version of Winamp.
Year 2004: Secunia reported 3 vulnerabilities during 2003 year for this version of Winamp as there were no vulnerabilities reported in 2003. Two out of three vulnerabilities were extremely critical including Winamp Skin File Arbitrary Code Execution Vulnerability and Winamp “IN CDDA.dll” Buffer Overflow Vulnerability. Remaining vulnerability was highly critical based on its’ criticality which was Winamp “in mod.dll” Heap Overflow Vulnerability. Impact of these vulnerabilities was full system access by the remote attacker.(Secunia; SecurityFocus)
Year 2005-06: Secunia reported 6 vulnerabilities during the years 2005-06 for this version of Winamp. One out of six vulnerabilities was extremely critical which Winamp Three Playlist Parsing Buffer Overflow Vulnerability was. Rest of the five vulnerabilities were highly critical. Impact of these vulnerabilities included System Access and DoS (Denial of Service) after exploitation by remote attacker.(Secunia; SecurityFocus)
Year 2007: In 2007 Secunia reported 3 vulnerabilities so far for this version of Winamp. Two out of three vulnerabilities are highly critical and one is moderately critical.. Impact of these vulnerabilities on home users was system access by the remote attacker after the exploitation of these vulnerabilities.(Secunia; SecurityFocus)

Advances in Networks, Computing and Communications 6
78
7 Apple QuickTime
Apple Quicktime player is the top most used media player among home users. Apple QuickTime 7.x has been analysed in this research to find vulnerability trends. Secunia started reporting vulnerabilities in Apple QuickTime 7.x since 2003. 15 advisories have been reported by Secunia since 2003 till 2007 whereas 18 reported by SecurityFocus.
Year 2004-05: Secunia reported 4 vulnerabilities during the year 2004-05 in this version of Apple QuickTime where as SecurityFocus reported 5 vulnerabilities proving the data from Secunia to be correct. Two out of four vulnerabilities were highly critical including Apple QuickTime “QuickTime.qts” Heap Overflow Vulnerability and Apple QuickTime Multiple Vulnerability. Impact of these vulnerabilities on home users was system access by a remote attacker after exploiting these vulnerabilities.(Secunia; SecurityFocus)
Year 2006: In 2006, Secunia reported 3 vulnerabilities in Apple QuickTime 7.x and SecurityFocus also reported the same number of vulnerabilities. 2 out of 3 vulnerabilities were highly critical including Apple QuickTime Multiple Vulnerability and Apple QuickTime “qtnext” Input Validation Vulnerability. Other was less critical vulnerability. Impact of these vulnerabilities on users was System Access and DoS.(Secunia; SecurityFocus)
Year 2007: Secunia reported 8 vulnerabilities so far for this version of Apple QuickTime during the year 2007. SecurityFocus reported 10 vulnerabilities during the same period for this version of Apple QuickTime proving the data from Secunia to be true. 1 out of 8 vulnerabilities was extremely critical including Apple QuickTime RTSP “Content-Type” Header Buffer Overflow. Remaining 7 vulnerabilities were highly critical. Impact of these vulnerabilities on home users and all other end users could have been System Access and DoS if being exploited by the remote attackers.(Secunia; SecurityFocus)
8 MPlayer
MPlayer 1.x has been analysed for vulnerability trends in this research. Secunia reported 13 advisories for this version of MPlayer since 2003 to 2007.
Year 2003-04: Secunia reported 5 vulnerabilities during the time period between 2003 and 2004 whereas SecurityFocus reported 6 vulnerabilities during the same time period for MPlayer 1.x proving the data from Secunia to be correct. Two out of five vulnerabilities reported by Secunia were highly critical including MPlayer GUI Filename Handling Buffer Overflow Vulnerability and MPlayer Multiple Vulnerability. Impact of these vulnerabilities after its exploitation by a remote attacker includes System Access.(Secunia; SecurityFocus)
Year 2005-06: In these years Secunia reported 5 vulnerabilities for this version of MPlayer. 2 out of 5 vulnerabilities were highly critical and the rest 3 were moderately critical. Highly critical vulnerabilities include MPlayer RTSP and MMST

Section 1 – Network Systems Engineering
79
Streams Buffer Overflow Vulnerability and MPlayer FFmpeg Multiple Buffer Overflow Vulnerability. Impact of these vulnerabilities if being exploited could have been System Access and DoS by the remote attackers.(Secunia; SecurityFocus)
Year 2007: Secunia reported 3 vulnerabilities so far in year 2007 for MPlayer 1.x and SecurityFocus also reported the same number of vulnerabilities proving the data from Secunia to be correct. Two out of three vulnerabilities are highly critical and one is moderately critical. Impact of these vulnerabilities after being exploited by remote attackers could have been System Access and DoS putting the home users’ data on high risk.(Secunia; SecurityFocus)
9 Trend Analysis
Figure 2: Trends of Vulnerability in All players. (Secunia)
Figure 2 analyses the trends of vulnerability in all the media players discussed and it is clear that the number of vulnerabilities is increasing year per year. With increase of window of exposure and patch release time, the threat to home users is also increasing. As can be seen, vulnerabilities are rapidly increasing in case of Apple QuickTime as compared to other players. This issue should be considered more seriously as it is the most commonly used media player among the home users across the globe. Number of vulnerabilities is increasing at an inconsistent rate in case of RealPlayer. Winamp and MPlayer are under minimal threat of vulnerability exploitation as compared to other two media players. (Secunia)
Figure 3 illustrates the trends of vulnerability in all the players based on the criticality of the vulnerabilities. This graph is generated on the basis of data collected from Secunia for every audio/video player during the time period between 2003 and 2007. The graph indicates the inconsistent increase of extremely and highly critical vulnerabilities in all the media players per year. This shows the huge impact of these vulnerabilities after exploitation. Number of extreme and highly critical vulnerabilities in Apple QuickTime has been increased consistently per year. Apple QuickTime is the most common and popular product used across the globe and increase of seer vulnerabilities has put home users under the threat of malicious

Advances in Networks, Computing and Communications 6
80
attacks. It is clear that the rate of vulnerabilities has increased with the increase of its popularity. RealPlayer is at second place in case of severing vulnerabilities. RealPlayer is also most common product among home users and the graph shows that the rate of sever vulnerabilities is inconsistent per year. There are not much significant vulnerabilities in Winamp and MPlayer though these are also commonly used by the home users. So it is clear that Apple QuickTime is the most vulnerable media player under the threat of malicious attacks.
Figure 3: Trends of Vulnerability based on Criticality. (Secunia)
10 Conclusion and Recommendations
The main objective of this research was to obtain the understanding of home user vulnerabilities and its evolution. According to the results media players are becoming more popular among attackers for vulnerability exploitations. Though there is not much vulnerability founded in the recent years in media players as compared to other applications like web browsers yet it is clear that the trends in media players are increasing. With the increase of these trends, window of exposure is also increasing giving the malicious attackers more time for attacks and exploitations. It’s becoming difficult for the vendors to release the patch as soon as the vulnerability is publically exposed. It is of no doubt that home users have become the primary target for the attackers to exploit vulnerabilities. Due to lack of exact information from various vulnerability databases this research did not meet up to its standards and this area still needs to be carried on. Following are the recommendations for the home users to safeguard against the vulnerabilities analysed in this research:
Always apply current patches to the media players and be updated.
Always review default installation settings while installing the media players.
Do not install any add on from untrusted sites and other sources.

Section 1 – Network Systems Engineering
81
All the media players provide features for browsing music online, so configure the media player in order to prevent unintentional installations from internet.
Install the media player which you need, do not just install every media player.
Windows Media Player is analysed to be the most secure media player, so it is strongly recommended to use Windows media Player rather than any other if you are using Microsoft Windows operating system.
Always use Antivirus and Spywares to block unwanted malicious media files.
Always install and configure firewall in order to prevent remote attacks.
Do not use unsecure wireless connections as it makes things easier for an attacker to attack on your system remotely.
Always deploy security policies on your system in order to avoid unauthorized system access.
Despite of these vulnerabilities, it is also recommended to use large and complex passwords for the systems.
Always review security bulletins from various organizations and be updated about the vulnerability information.
If you are a non technical user then it is recommended to use your operating systems default help option as much as you can in order to gain knowledge about the security of your system.
Do not give your details to any untrusted site as it can be a spoof page.
Always check the padlock in the bottom of the web browser before shopping online.
11 References
CERT "Home Computer Security”. http://www.cert.org/homeusers/HomeComputerSecurity/. Accessed on May 16, 2007
CERT "Home Network Security”. http://www.cert.org/tech_tips/home_networks.html#III. Accessed on May 25, 2007.
Krsul, I. (1997). "Computer Vulnerability Analysis Thesis Proposal”. http://ftp.cerias.purdue.edu/pub/papers/ivan-krsul/krsul-thesis-proposal.pdf. Accessed on May 13, 2007.

Advances in Networks, Computing and Communications 6
82
Lieungh, S. (2005). "Rate Vulnerability Reducing Measures for Home Offices Based on a Cost Effectiveness Analysis”. http://hig100.hig.no/imt/file.php?id=623. Accessed on May 13, 2007.
Secunia. "MPlayer”. http://secunia.com/search/?search=Mplayer&w=0. Accessed on November 10, 2007.
Secunia. "QuickTime”. http://secunia.com/search/?search=quicktime&w=0. Accessed on November 13, 2007.
Secunia. "Real Player”. http://secunia.com/search/?search=Real+Player. Accessed on November 20, 2007.
Secunia. "Winamp”. http://secunia.com/search/?search=winamp. Accessed on November 18, 2007.
SecurityFocus. "SecurityFocus Introduction”. http://www.securityfocus.com/about. Accessed on May October 23, 2007.
SecurityFocus "Vulnerabilities”. http://www.securityfocus.com/bid. Accessed on November 21, 2007.
Ulf Frisk, S. D. (2004). "The State of Home Computer Security”. www.diva-portal.org/diva/getDocument?urn_nbn_se_liu_diva-2584-1_fulltext.pdf. Accessed May 11, 2007.

Section 1 – Network Systems Engineering
83
BER Performance of MPSK and MQAM in 2x2 Almouti MIMO System
A.S.Mindaudu and M.A.Abu-Rgheff
Mobile Communications Network Research, University of Plymouth, United Kingdom
email: [email protected]
Abstract
Almouti published the error performance of the 2x2 space-time transmit diversity scheme using BPSK. This paper explores the error performance of the 2x2 MIMO system using the Almouti space-time codes for higher order PSK and M-ary QAM. The system is simulated using MATLAB; assuming slow fading Rayleigh channel and additive white Gaussian noise. The simulated performance curves for the MIMO system are compared with the performance of a simulated single channel system (SISO).
Keywords
MIMO; M-ary QAM; M-ary PSK; EbNo; BER; STBC
1 Introduction
The increasing demand for modern communication systems to provide high speed multimedia wireless services places very stringent requirements on the systems. The communication systems process message symbols in digital manner with the sole objective of transmitting the symbols and recovering them correctly at the receiving end. This is not entirely an easy process especially in wireless systems where several factors come into play. For instance, limitations in bandwidth, propagation loss, time variance, noise, interference, and multipath fading, among other factors, make the wireless channel a narrow pipe through which data transmission is not very easy (Tarokh et. al., 1999)
Wireless systems based on the MIMO technique are employed in applications that require high data rates. In such systems due to the additional antennas and signal processing chains, power problems are attendant issues to be resolved. Consequently, choice of modulation schemes and low power consumption amplifiers are critical in the MIMO systems.
MIMO has become an interesting area of research simply as a result of its potential to give many orders of magnitude improvement in wireless communication performance at no cost of extra spectrum (only hardware and complexity are added). Gesbert et. al., (2003).

Advances in Networks, Computing and Communications 6
84
2 The MIMO Signal Model
In a MIMO system where there are M transmit and N receive antennas as shown in fig. 1, the transmitted data signals pass through multiple paths to get to the receiving antennas. Though not shown on the diagram, but there is also noise that interferes with the data signals along the paths.
Figure 1: Basic M-transmit by N-receive MIMO system
If the channel matrix is H, then the MIMO signal model is defined in matrix form by Gesbert et al (2003) as
(1) where r is the received signal vector s is the transmitted signal vector n is the additive white Gaussian noise vector with zero mean and a variance of σ2. Equation 1 can also be presented as a system of linear equations given by:-
(2)
For a 2x2 MIMO system, the expression reduces to

Section 1 – Network Systems Engineering
85
3 The Almouti 2x2 MIMO Scheme
The encoding and transmission sequence for the two transmit antennas in the
Almouti scheme is shown in Table 1 (Almouti, 1998).
Table 1: Encoding and transmission sequence for the Almouti two transmit antennas
At time t, S1 and S2 are transmitted simultaneously by antennas 1 and 2 respectively. In the next time instant, t+T where T is the symbol duration -S2
*and S1*are
transmitted simultaneously by antennas 1 and 2 respectively, where * denotes complex conjugation. A generalised frame design for the scheme requires a concatenation of 2x2 blocks of the space-time code is as follows:
Given that the channel coefficients remain constant over two consecutive symbol periods, the signals at the two receive antennas are given by a set of linear equations as follows:-
At time t1, (3)
(4)
And at time t1+T, (5)
(6)
Antenna 1 Antenna 2
Time t S1 S2
Time t + T -S2* S1
*
Space
Space
Tim
e
Time

Advances in Networks, Computing and Communications 6
86
where , , and are complex samples of independent Gaussian distributed noise and interference.
The performance of communication systems is, to a large extent, dependent on the type and efficiency of modulation techniques employed. The published performance of Almouti 2x2 MIMO scheme (fig. 2) employed coherent BPSK which uses only real components of the signal constellation in the simulation (Almouti, 1998). If the simulation is carried out using QPSK where both real and imaginary components of the constellation are used, what will the BER performance be?
Figure 2: BER performance comparison of coherent BPSK with MRRC and two-branch transmit diversity in Rayleigh fading. (Source: Almouti, 1998)
Quite a number of performance results have been reported for different antenna constellations, different environmental conditions, different modulation techniques and a lot more scenarios. For instance, (Abouda et. al., 2006) has reported that mutual coupling between antenna elements in a MIMO antenna constellation could be either positive or negative on the error performance of the Almouti scheme. (Yuyu and Yongzhi, 2007) simulated the Almouti STBC in MPSK with increasing number of receiving antennas, and concluded that in Rayleigh fading channels, if the number of receiving antennas is kept constant the performance of STBC improves with increasing number of transmit antennas.
4 Simulation of 2x2 Almouti MIMO Scheme
After setting some parameters such length of symbols, modulation order, simulating the Almouti 2x2 starts with the transmit side where random data is generated as an input information to the system. This data is in the form of 1s and 0s randomly generated with equal probability of occurrence. This data is then split into two, giving rise to data1 and data2 which are fed to a baseband modulator (MPSK or MQAM) from where the symbols S1 and S2 are produced. These symbols are then

Section 1 – Network Systems Engineering
87
encoded using the Almouti space-time coding scheme generating the codeword given by
So the encoded Almouti codeword is then passed through a simulated Rayleigh slow fading channel perturbed by complex Gaussian noise factors of zero mean and a variance of σ2
. It is pertinent to note that, as the channels are randomly generated and assumed known at the receiver, channel estimation is not implemented in the simulation. The received signals which are affected by noise are combined together using equations (7) and (8) to produce outputs C1 and C2 which are then demodulated in the detector.
(7)
(8)
5 Simulation Results/Analysis
The performance curves obtained with MPSK are shown in fig 3
0 2 4 6 8 10 12 14 16 18 2010
-7
10-6
10-5
10-4
10-3
10-2
10-1
100
101
Performance of Almouti 2X2 MIMO system using M-ary PSK
EbNo(dB)
BE
R
BPSKQPSK8-PSK16-PSK32-PSK64-PSK
Figure 3: Performance curves of Almouti 2x2 MIMO scheme using M-ary PSK
The results show that as the modulation order increases more energy is needed to achieve a given error probability. Increase in the modulation order means an increase in the number of bits per symbol to process. For instance, it can be seen that for a BER of 10-2 almost additional 4dB is required using QPSK over what will be needed

Advances in Networks, Computing and Communications 6
88
with BPSK. Generally it can be seen from the curves that for the same bit error rate of 10-2, going from M = 4 to M = 8 will require about 5.8dB, and from M = 8 to M = 16 about 6dB to achieve the same performance. The performance curves obtained with QAM are shown in fig 4.
0 2 4 6 8 10 12 14 16 18 2010
-7
10-6
10-5
10-4
10-3
10-2
10-1
100
101
Performance of Almouti 2X2 MIMO system using M-ary QAM
EbNo(dB)
BE
R
4-QAM8-QAM16-QAM32-QAM64-QAM
Figure 4: Performance of Almouti 2x2 MIMO system using M-ary QAM
The curves obtained for the M-ary QAM also show adherence to the expected behaviour for such modulation scheme. It can however be seen that in comparison to the M-ary PSK curves of fig. 3, while 4QAM is exactly the same as QPSK in performance, there is a distinct difference in the performance of the higher order schemes between both QAM and PSK generally. For instance, it can be seen from fig.3 that, a BER of 10-3 is obtained at EbNo of about 11dB for QPSK which is the same for 4QAM in fig. 4. However, considering 16PSK and 16QAM, it can be seen that to achieve a BER of 10-2 will require about 3.4dB less when using 16QAM than what will be required for 16PSK (which is approximately 18.6 dB).
Fig. 5 shows more closely the direct comparison between the performance of the simulated system using PSK and QAM with modulation order of 16. Here it can be seen that 16QAM is more power efficient than 16PSK and this is attributable to the nature of the signal space diagrams of the two modulation schemes. Even though QAM and PSK both have 2 – dimensional signal spaces, the signal points, in the case of PSK, lie on a circle of fixed radius, , where is the energy per symbol. So, as the modulation order increases, the signal points tend to be more and more crowded together thereby increasing the probability of error. However, for QAM the signal points are distributed in the signal space without being confined to lie on a circle.

Section 1 – Network Systems Engineering
89
0 2 4 6 8 10 12 14 16 18 2010
-4
10-3
10-2
10-1
100
101
Performance Comparison of Almouti 2X2 MIMO with P = 16
EbNo(dB)
BE
R
16-PSK
16-QAM
Figure 5: Performance comparison of Almouti 2x2 MIMO with between 16-PSK and 16-QAM
While BPSK is better than QPSK and 16QAM (fig 6) in terms of power usage (i.e. lower EbNo for a given BER), its data rate is lower. In fig. 6 it can be seen that 16QAM which is more susceptible to noise and interference due to its dependence on amplitude, requires relatively more power for a given BER, but it should be noted that it has a higher spectral efficiency when compared with BPSK or QPSK (Pearson, 1992).
0 2 4 6 8 10 12 14 16 18 2010
-7
10-6
10-5
10-4
10-3
10-2
10-1
100
Performance Comparison of Almouti 2X2 MIMO system
EbNo(dB)
BE
R
BPSK
QPSK16QAM
Figure 6: Performance comparison of Almouti 2x2 MIMO system between BPSK, QPSK and 16-QAM
We see from Fig. 7a that there is a big advantage of the 2x2 MIMO system over a SISO system in terms of error performance. With the MIMO system, for instance, about 3dB EbNo is required in the simulated result to achieve a bit error rate of 10-2 while for SISO to achieve the same performance; about 14 dB has to be expended. Similarly, with QPSK there a better performance is observed by the MIMO system over the SISO as shown in Figs. 7b. Here, for a given error probability of 10-2, for

Advances in Networks, Computing and Communications 6
90
instance, the energy required in the SISO system shows the need for approximately 12.5dB above the requirement in the case of the 2x2 MIMO system.
0 2 4 6 8 10 12 14 1610
-7
10-6
10-5
10-4
10-3
10-2
10-1
100
Performance of SISO and Almouti 2X2 MIMO system using BPSK
EbNo(dB)
BE
R
SISO
2X2 MIMO
Figure 7a: Performance results for SISO and MIMO BPSK
0 2 4 6 8 10 12 14 16 18 2010
-7
10-6
10-5
10-4
10-3
10-2
10-1
100
Performance of SISO and Almouti 2X2 MIMO system using QPSK
EbNo(dB)
BE
R
SISO
2X2 MIMO
Figure 7b: Performance results for SISO and MIMO QPSK
6 Conclusion
The Almouti 2x2 MIMO scheme was simulated using both M-ary PSK and M-ary QAM so as to be able to compare their error performances. Basic assumptions were made in line with the published work of Almouti 1998 in simulating the 2x2 system. Furthermore, the error performance of the system was compared with the performance in a simulated SISO system using BPSK and QPSK modulation schemes. Generally, the curves obtained in the simulations follow the expected behaviour for such modulation schemes.
While it can be concluded that QPSK outperforms 16QAM in error performance as could be seen in Fig.6, it is to be noted that QPSK gives only half the data rate possible with 16QAM. So there has to be a trade-off; get better error performance for less data rate or get more data rate at the expense of degraded error performance.

Section 1 – Network Systems Engineering
91
7 References
Abouda, A. A., El-Sallabi, H.M. and Häggman, S.G.,(2006) ‘Effect of Mutual Coupling on BER Performance of Alamouti Scheme,’ Proc. of IEEE International Symposium on Antennas and Propagation, AP-S 2006, pp. 4797-4800, Jul. 2006, New Mexico, USA.
Alamouti S. M. (1998) ‘A Simple Transmit Diversity Technique for Wireless Communications’ IEE Journal on Select Areas in Communications, vol. 16 no. 8: 1451-1458
Gesbert D, Shafi M, Shiu D, Smith P J, and Naguib A, (2003)’ From Theory to Practice: An Overview of MIMO Space–Time Coded Wireless Systems’ IEEE Journal on Selected Areas in Communications, vol. 21, no. 3: 281-302.
Pearson, J., (1992) ‘Basic Communication Theory’ Prentice Hall International (UK) Ltd.
Tarokh V, Naguib A, Seshadri N and Calderbank,A. R, (1999)’ Combined Array Processing and Space–Time Coding’ IEEE Transactions on Information Theory, vol. 45, no. 4
Yuyu, L. and Yongzhi, L (2007) ‘Research and Performance Analysis of Space-Time Block Codes in MIMO system’ IEEE International Conference on Wireless Communications, Networking and Mobile Computing, 2007. WiCom 2007, pp. 118-121

Advances in Networks, Computing and Communications 6
92
CentOS Linux 5.2 and Apache 2.2 vs. Microsoft Windows Web Server 2008 and IIS 7.0 when Serving
Static and PHP Content
D.J.Moore and P.S.Dowland
Centre for Information Security and Network Research, University of Plymouth, Plymouth, United Kingdom
e-mail: [email protected]
Abstract
This research paper intends to find out which operating system and web server is faster when hosting static and PHP generated content. The results could potentially sway end users who are not sure of which web server they would like to use with static and PHP content. The feud between Microsoft Windows and Linux is very long standing and this paper will throw some light to this specific area. Both servers were installed with the default settings and configured with three web applications and benchmarked using a load generation tool to see which provided a higher number of requests per second. Microsoft Windows served 1184 requests per second for static content and an average of 8.5 requests per second for the PHP applications. Linux performed far worse in the static test with only 789 requests per second, but served an average of 10.6 requests per second for the PHP applications. Linux is better able to process the PHP applications, but Microsoft Windows is better for serving static content when the default configuration of both operating systems is used.
Keywords
Windows, Linux, Server Performance, PHP, IIS, Apache
1 Hardware
The server hardware is an entry-level HP ProLiant ML110 Generation 5 server. It has a single Intel Xeon 3065 dual core processor running at 2.33 GHz, 4 GB of un-buffered ECC memory, a 250 GB hard drive and gigabit Ethernet.
The client has two Intel Xeon E5462 quad core processors running at 2.8 GHz with 2 GB of fully buffered ECC RAM. Traffic generation is a very CPU, network and memory demanding task. Therefore the load testing software will be running on the most powerful machine available for the test.
The NetGear GS716T, an entry-level enterprise grade switch, forms the test network between the client and the server. It has 16 gigabit Ethernet ports and has a switching capacity of 32 Gb per second.
To monitor the server and network while testing takes place a monitoring node has been added running the Wireshark network protocol analyser. This allows for detailed monitoring of the traffic going over the network. It also allows the

Section 1 – Network Systems Engineering
93
verification of results generated by the testing software and to monitor any potential network interference. Its primary function is to determine if the results gathered from the client are accurate. If the two sets of results do not match then the results are discarded and the tests rerun. This ensures that the results are accurate as possible.
All the nodes were connected in a star topology using CAT5e gigabit Ethernet.
Figure 1 - Network Configuration
The monitor node sits on a mirrored port which forwards all of the data sent to/from the server to the monitor node.
2 Software
Three different web applications were installed on each operating system. The first was a basic static web page with a simple HTML document created in Notepad. It had one image and a few paragraphs of text on the British scientist Charles Darwin.
The second was the WordPress 2.6 blogging software. WordPress is a dynamic application that relies on PHP and MySQL to work.
The third was the MediaWiki 1.12.0 package. It also depends on PHP and MySQL.
The web applications WordPress and MediaWiki were installed according to their installation manuals. After WordPress was installed two articles and two comments were added to the WordPress blog. One comment each was added to the NASA Phoenix Mars Lander and the Mars Reconnaissance Orbiter articles. MediaWiki was configured with an article on the CERN Large Hadron Collider experiment and a smaller article defining a hadron. Links to both pages were added to the home page.
When installing the applications there was constant effort to ensure that as many of the defaults were kept as possible. The only modifications made were to configure

Advances in Networks, Computing and Communications 6
94
the applications to make them work in the server environment provided and to add the content as previously described.
To generate the HTTP traffic to test how fast each server is Apache JMeter 2.3.2 was installed on the client. It was configured with a test plan to test each of the three applications in turn. Figure 2 shows the final test plan as created in Apache JMeter.
Figure 2 - Apache JMeter Test Plan
To achieve this, the “Total Test Plan” was configured to run the thread groups consecutively so they would run one at a time instead of all together which is the default operational mode. Each thread group defines the number of users who will access the application. Each thread group was configured to start two users because of the dual-core nature of the server. The scheduler in each thread group was configured to start 30 seconds after the previous group and to run the test loop for 2 minutes.
During the 2 minute test loop each thread will attempt to access each page in series as quickly as possible. This means that the total throughput of a thread is limited to the slowest article giving a farer representation of the speed an application can provide.
The static thread group accessed the static web site on the server. The WordPress and MediaWiki threads are slightly different in that they access the home page before continuing to one of the article pages. WordPress continues to the Mars

Section 1 – Network Systems Engineering
95
Reconnaissance Orbiter article with its single comment and MediaWiki continues to the Large Hadron Collider article. Each time a page is requested its embedded resources are also requested and downloaded. This is to mimic the behaviour of a standard web browser. So when requesting the static page there are actually two requests being made and responded to. One for the actual HTML document, and a second for the image it links to.
The response assertions in the test plan above are to check that the content returned by the server is what was expected. If any errors occur “View Results Tree” would record the response from the server and will show why the response assertion failed. At no point did an error occur during the test.
The “Aggregate Graph” records all the transactions that take place between the client and the server. It is this item that collects the number of requests per second for each application.
The final requests per second figure is obtained by adding the requests made per second for both articles of a particular application as Apache JMeter will generate a figure for both articles separately. Adding those together when there is more than one article in the test (such as is the case with WordPress and MediaWiki) gives a throughput in requests per second for the application as a whole.
It is important to note that one request represents all of the HTTP queries and responses required to download the HTML and embedded data. For example, the static web page and WordPress required two HTTP queries and responses to complete a single request. The MediaWiki application requires seven HTTP queries and responses to complete a single request.
When the tests were run on each operating system a data monitoring tool was running. This could have potentially affected the results, but the impact of monitoring was most likely equal between the two operating systems.
Both Microsoft Windows Web Server 2008 and CentOS 5.2 were installed using the default settings where possible. CentOS was installed with Apache, PHP and MySQL from the install disc. Microsoft Windows Web Server 2008 was setup using the management console to allow for PHP scripts to be executed using the Internet Server Application Programming Interface (ISAPI) module. The latest PHP and MySQL Microsoft Windows installations were downloaded from their respective web sites and were more recent than the versions installed on CentOS 5.2.
• PHP 5.1.2 on Linux – PHP 5.2.6 on Microsoft Windows • MySQL 5.0.45 on Linux – MySQL 5.0.67 on Microsoft Windows
It is unlikely that these differences provided either Microsoft Windows or CentOS with a significant advantage or disadvantage.
MySQL was installed on Microsoft Windows with the following settings:

Advances in Networks, Computing and Communications 6
96
• Configured as a server machine • Medium memory usage • Multifunctional database access • Support for Multilingualism • 200 concurrent connections • Installed as a Microsoft Windows service
When the test was run every effort was made to ensure that at no point would the database be unavailable for either operating system. The default settings on CentOS Linux 5.2 were sufficient and the settings above worked well for Microsoft Windows.
No updates or service packs were applied to either operating system to ensure the test was fair.
3 Results
Web Application
Requests per Second (CentOS
Linux)
Requests per Second (Microsoft
Windows)
Overall Result
Static 789 1184 50% faster than Linux
WordPress 15.5 12.3 20.6% slower than Linux
MediaWiki 5.6 4.6 17.9% slower than Linux
Table 1 - Linux vs. Microsoft Windows Requests per Second
There are some interesting differences in the results between the two operating systems. Microsoft Windows does have an impressive advantage on static content. This is probably due to the fact than a default Apache installation on CentOS Linux 5.2 has a lot of unnecessary modules loaded. When installing IIS 7 it only installs the modules required. As such, IIS 7 has fewer modules and extensions to worry about when dealing with HTTP requests.
Where Microsoft Windows is let down is with the performance of PHP. It is possible that the Microsoft Windows version of the PHP module is not as efficient as on Linux. To improve performance IIS 7 can also be configured to execute PHP code with something known as FastCGI. When reconfigured for FastCGI the results for the dynamic applications increase slightly to 13.5 for WordPress and 5.0 for MediaWiki. There is a clear improvement, but it still does not approach the Linux speeds
Things have changed a lot over the years and a report commissioned by Microsoft in 2003 claimed that Microsoft Windows Server 2003 RC2 was significantly faster than Red Hat Linux. (VeriTest, 2003) Unlike the report these test results indicate that Linux is faster than Microsoft Windows 2008 under these somewhat specific circumstances and that the VeriTest report should not be taken too seriously.

Section 1 – Network Systems Engineering
97
Ultimately, these results should not sway people from one operating system to another. There are far more concerns to operating system choice than raw speed which need to be considered carefully.
4 References
VeriTest (2003) Microsoft Windows Server 2003 with Internet Information Services (IIS) 6.0 vs. Linux Competitive Web Server Performance Comparison, Available: http://download.microsoft.com/download/0/7/1/0715a190-70f5-4b0d-8ced-f9d1e046aa6a/webbench.pdf (Accessed 20/01/2008)

Advances in Networks, Computing and Communications 6
98
Assessing the Usability of Security Features in Tools and Applications
F.Moustafa and S.M.Furnell
Centre for Information Security and Network Research, University of Plymouth, Plymouth, United Kingdom
e-mail: [email protected]
Abstract
Today’s Security Software Tools and Applications such as Firewall, Anti-spyware, and Anti-Virus are developed in such a fashion that they provide only partial guidance to the end-users. Because of which though end users have advanced security software tools in hand they were unable to utilize the security features inbuilt. This research focuses on improving the usability of security features in Tools and Applications. The research evaluates 6 security programs and 3 web browsers for usability issues. User’s perception/understanding on those usability issues were surveyed among 30 participants. The evaluation and survey results reveal that security awareness among end users and usability awareness among product vendors are in developing stage. The major usability issues addressed in today’s security products are inappropriate help documentation, overloading the window with rarely needed features/information, using high technical vocabulary terms, missing of most frequently used actions in home page, protection-less password protection settings and hectic default configuration settings. The suggested solutions and alternative interface styles are provided for these potentially confusing interfaces to improve the usability of the security features in selected tools and applications.
Keywords
Usability, Security, Guidelines, Web Browsers, Firewall, Anti-virus, Anti-spyware
1 Introduction
It is evident that today’s technology-based solutions are presented in such a way that user cannot understand and utilize them effectively though good safeguard features are available in hand. The security requirements of the product will be fulfilled only when the end users are influenced by its usability. The International Organization for Standardization (ISO) defines Usability as “effectiveness, efficiency and satisfaction with which a specified set of users can achieve a specified set of tasks in a particular environment”. These factors depend upon the user and their technical level (Furnell, 2007).
Human Computer Interaction (HCI) is the study of interaction between users and computers. The main goal of HCI is to improve the interactions between users and computers; to design the user-friendly interface which breaks the barrier between the user’s need and computer tasks. The study was initially conducted by Saltzer and Schroeder (1975) resulted that end users were unable to take security decisions which made them to compromise security than usability. After 3 decades of

Section 1 – Network Systems Engineering
99
experiment with HCI guidelines, Johnston, Eloff and Labuschagne (2004) refined HCI guidelines to HCI-S guidelines. These guidelines helped to improve the interface usability so that the system becomes more secure, robust and reliable.
Furnell et al (2006), pointed some desirable key points that will instigate the usability are understandable, locatable, visible and convenient. These factors should be investigated in current products for deficiencies. In 2005, the team conducted survey on 340 end users to investigate their understanding on some generally used tools and applications and how comfortable they feel in configuring security-related settings; responding to security-related events and messages; specifying policy and access rights.
The team focussed on the security related features within Windows XP firewall, Internet Explorer, MS word etc. The finding revealed that every security product should have training on how to use its security features and also recommended to improve the interface with clearer language and additional help facility. Finally the group recommended for further research on alternative interaction styles that might guide the user to secure their system in more intuitive ways.
In the another study Furnell (2007) compared the IE7 and Word 2007 interfaces with Nielsen’s Usability Heuristics and concluded that usability is not served according to user’s perceptive and added that some of the usability problems were rectified in the current version of security tools than their earlier versions.Not only end users, who suffer from usability problems, but also system administrators. This can be witnessed from the survey conducted by Furnell et al. (2004) on 160 system administrators revealed that above 50% of the administrators faced difficulty during installation of security analysis tool and 71% faced difficulty during configuration of the same.
Other than collecting information on general usage of security tools and applications, investigating each security product for usability under different circumstances also gains valuable results. Dapeng performed his survey on personal firewall usability with 18 users (technical users and 10 non-technical users). He considered 6 firewalls which were used widely and concluded that personal firewalls were designed for end users and should it be designed for all level of users. Also provided suggestions on how the interface should be for each level of user (Dapeng, 2007).
Few of his suggestions upon improving the interface were, expert users should be prompted with security warnings quite often so that they know about their potential risk on computer; normal users should be prompted with only appropriate security prompts with detailed information about modification of files during execution. Whereas, beginners should be informed about those security prompts which pose high security risk.
The aim of this research paper is to improve the usability of security features in Tools and applications. This paper includes the evaluation criteria of this research followed by survey outline. The next section of this paper, presents the survey results followed by the evaluation analysis and discussion of selected security tools and applications. The research findings are presented to summarize existing usability

Advances in Networks, Computing and Communications 6
100
issues followed by the suggestions to improve the usability on the security tools and applications.
2 Evaluation Methodology
The security products selected for evaluation in this research are
1. Apple Safari 3.1.2 (525.21) 2. Mozilla Firefox 3.0.1 3. Windows Internet Explorer 7 (7.0.6001.18000) 4. Comodo Firewall pro version 3.0 (Free) 5. Outpost Firewall Pro 6.5.2358.316.0607 (Trial Version) 6. Kaspersky Anti-Virus 7 (Trial Version) 7. Norton Anti-Virus 2008 8. McAfee Security Centre 2009 (Trial Version) 9. Webroot software Spy Sweeper 5.5 (Trial Version).
Home Page of a Security program should clearly inform the user about the entire system status and available security features. The home page should display all the frequently used options/ navigation links. Other than home page, there are few actions and requirements often used by end users. Things to be considered in the security product interfaces are
1. Recommended configuration settings should be set as default during installation.
2. Home Page should clearly present the system status. a) The System Status- Is the computer secured or Not b) Quick link to scan/update the program c) Date of last scan/update was performed d) Indication if any intrusion attempts/virus detected/actions blocked
Link to view the problem Link to action to be taken for the problem
e) The Essential Security Tools/options f) Help
3. Security options and warning information should be stated clearly and precisely in plain language to avoid risk
4. User control and freedom – undo and redo 5. Proper feedback for user’s action 6. Handle errors appropriately 7. Password protection to protect the unauthorized change of security settings 8. Appropriate help 9. Security should not reduce performance 10. Safe uninstall
Each security product was evaluated based on these 10 evaluation criteria. The research found many interesting usability issues within the security tools. The most common usability issues were picked for the survey questionnaire. The questionnaire consists of 19 questions and these questions focussed on 3 categories; Personal details, Security and Usability awareness & Understanding and suggestions.

Section 1 – Network Systems Engineering
101
We considered collecting survey from people who spend ample time with computer would be preferable. Data entry work place and university campus were selected. The project aims and objectives were printed and distributed to 33 participants for getting acceptance to participate in the survey. 30 interested participants gave their approval through signature, after which questionnaire was distributed as hard copy. The completed survey forms were then collected back from the participants after two days.
3 Survey Results and Discussion
Age range of the participants were collected which is shown in figure 1. This clearly states that majority of the participants were from 21-30 age range followed by 31-39 age range. Figure 2 clearly says that majority of participants were students followed by 26% of employees.
Figure 1: Age range of Respondents Figure 2: Identification of Respondents
The survey results reveal that 83% of the participants were intermediate user, followed by 10% of expert user and the rest were beginners.
The survey results on security awareness i.e. when end users were asked about storing personal information in their computer. The results revealed that 57% of the respondents do not store personal information in computer, followed by 23% of the respondents store only username and not password. And 17% of the respondents store both their username and password. Observing this result it is evident that security awareness among the end users is in progressing stage.
The survey results on usability awareness i.e. when end users were asked about compromising between usability, security and system performance. The results revealed that 63% of the end users would compromise advanced security features if usability and system performance are good. 20% of users would compromise usability if advanced security features are available and 17% of the user would compromise system performance if advanced security features are available.

Advances in Networks, Computing and Communications 6
102
Observing this result it is evident that usability awareness among end users is in satisfactory level, but still need to be considered for further improvement.
When respondents were asked about their prefered format for displaying the description of a security option, 40% suggested that they need help description at the tooltip followed by 23% of the end users suggested that clicking on the help icon should navigate them to specific security option. 13% of the respondents suggested that they need help description in the same window without clicking anything and another 13% suggested for main help document. The rest of the respondent preferred help description in the same window after clicking individual help icon provided for each security option. Observing this result, it is evident that majority of the users prefer their software to navigate them to appropriate help document rather than browsing through lengthy help document.
When the end users were presented with interface which had high technical vocabulary term scan archives, the results revealed that only 50% of the end users could understand the meaning of archives. 30% of the respondents could not understand the meaning of archives, followed by 20% understood partially. This result reveals that interfacing high technical vocabulary terms in setting window will impede the user from making any configuration settings.
Similarly, when end users were presented with interface which had system oriented term Turn ON bloodhound Heuristics, the results revealed that only 3% of the end users could understand the term and the majority of the respondents could not understand the meaning of bloodhound Heuristics.
When the end users were asked about the automated scanning of the failed scheduled scan, their responses were shown in Table 1. Observing this result, it is evident that 43% of the end users expect that failed scheduled scan will restart automatically when their system restarts, which is not actually the case in today’s security products.
Consider you scheduled your anti-virus program to scan your computer on every Monday at 2 pm as. By mistake you turned OFF your computer at 1.45pm and then turned ON at 2.10pm. So, now when you log on to your computer, Will the anti-virus program start scanning your computer for virus?
Amount in %
Yes 43 No 33
Do Not Know 23 Table 1: Result on scheduled scanning
From the survey results, it is clear that the usability in today’s security product is still a dream goal for the end users. However, adding security features in today’s security products is always a goal for security product vendors. Security awareness among end users and usability awareness among product vendors should go in parallel, failure of which will lead to decrease in usability of the product and increase in vulnerabilities.

Section 1 – Network Systems Engineering
103
4 Research Findings
The overall study of this research found many interesting usability issues:
The survey results of this research clearly proves that the security awareness among the end users is in developing progress, and still need to be developed for further improvement. However, usability awareness among the security product vendors is in under-developing stage. The survey results itself revealed that most of the security software interfaces were not designed based on the usability guidelines; instead they were built to enhance the security features within.
From the evaluation of web browser products, it is observed that security options of browsers are unsecured by exposing the personal information like username and password. Though it benefits the user in some case, it also exposes their personal information to strangers. This research provided suggested solution for this issue by providing additional options and master password feature. Also browser information window fails in its function to inform the user about its progress in the logical way that end user could understand.
From the evaluation of 6 security software, it is observed that many security tools do not qualify the evaluation criteria of this research and usability guidelines of Nielsen, Shneiderman and Furnell et al. The home page of the security product which is suppose to inform the user about system status and suppose to possess the frequently used options, is not fulfilled in many of the today’s security products.
A surprising factor is that most of the security products do not have a ‘Help’ option in the home page. Even if they provide the one, it does not have appropriate document in appropriate way the user needs. Either they provide very less information or overload the settings window with full of help information. This research provides the suggested solution for help format by surveying the end user’s perception on help format.
The most frequently used options like Scan, Updates, etc., should be accessible to end users in home page itself. But the research found that not most of the security products do it. Instead of providing the necessary tools in the home page, they accumulate the page with rarely used services/functions like Highlights, Tip of the day, etc.
The next usability issue encountered in majority of the security products is ‘Default settings’ (For resetting the product to factory setting) option, which is not even visible in one of the security product. Even if they provided the one in the software, it is presented with high technical vocabulary terms and not in plain language. Other than default settings option, the settings window for scanning the computer, adding applications to firewall list, etc., also designed with system oriented terms and had not enough options for ease use of those settings. If this persists, then modification of settings might leave the user to risk, which in turn reduces the usability of the product.

Advances in Networks, Computing and Communications 6
104
Next issue is password protection of the security settings, which is interfaced in the way that it actually does not protect the security settings. Today’s security products are interfaced in such a way; if password protection is enabled, the software will prompt for the password only to enter the settings window and it no more prompt for the password for further modifications of the settings. This interface would attract the strangers to modify the settings of the software in the absence of the administrator.
Also the alert windows which are suppose to inform the user about the intrusion attempts, existence of virus/worms, etc., should inform the user about the threat details. The research found that most of the security products alert window appears only at the moment the attack encounters, and it no more appears to user even in the home page. If the attack was encountered in the short absence of the user, then the user might not know about the threats fought by his/her security software. Today’s security products inform the user about the system status only partially.
When user feels that no more he/she needs the product, the software should assist in clean un-install of the product. But few of the security products do fail in this clean un-installation by still running the product supported toolbars/features in the system without informing the user during un-installation. This action might frustrate the user, who actually needs everything of everything to be cleaned/un-installed. These usability issues found in evaluated security tools and applications were analyzed.
5 Research suggestions
The suggested solutions to improve these usability issues are
Focussing on the interface of the home page, this should clearly visualize the entire security status and should possess the frequently used options.
Focussing on the help format and its contents, this should clearly present what explanations do actually the user needs in the right place.
Focussing on relative visibility of the page, the interface window should possess only relevant information and should not contain irrelevant/rarely needed information.
Focussing on appropriate words for security options, by thinking of the word that actually user uses to represent an action.
Focussing on not using high technical vocabulary terms in settings window. Focussing on including all the basic function that the user needs like
resetting the product, providing help document, etc., Focussing on security of the settings that the user made; the product should
allow only the authorized modifications. Focussing on informing the user about system status at the right time;
especially most important alert windows should be displayed until user closes it.
Focussing on clean un-installation of the product to get positive feedback about the product as well to let the user’s to use the product later.

Section 1 – Network Systems Engineering
105
If the above mentioned lists were checked in the security products, then the usability of the product could increase.
6 Conclusion and the Future
Current versions of selected security products were investigated for improving the usability features of tools and applications. The most common usability issues were picked for the questionnaire and distributed among 30 participants. The survey was conducted on different level of end users from novice to expert users. The survey results and evaluation results were compared and analyzed. The hectic interfaces under different security products were discussed for usability issues.
The major usability issues addressed in today’s security products are not appropriate help document, overloading the window with rarely needed features/information, using high technical vocabulary terms, missing of most frequently used actions in home page, protection-less password protection settings and hectic default configuration settings. The suggested solutions and alternative interface styles are provided for these hectic interfaces to improve the usability of the security features in selected tools and applications.
The research found security awareness among end users is in progressing stage. As security awareness increases among the end users, it would directly increase proportion of security products. So the security product vendors were trying to increase the usability of the product by revising the usability issues of their previous product.
The future work of this research could be performed on the upcoming versions of the same security products evaluated in this research. Usability issues pointed in this research could be re-evaluated in the upcoming versions. If the occurrence of the same usability issue was detected, alternative interfaces could be designed. The functional prototype of alternative interfaces could be created using a simple development environment such a Visual Basic.
7 References
Dapeng. J, Personal Firewall Usability- A survey, [Online] Available: http://www.tml.tkk.fi/Publications/C/25/papers/Jiao_final.pdf [Date accessed: 24 Jan 2008]
Furnell, SM (2007) ‘Making security usable: Are things improving?’, Computers & Security 26(2007), 434-443.
Furnell, SM. and Bolakis, S. (2004). “Helping us to help ourselves: assessing administrators’ use of security analysis tools”, Network Security, February 2004, pp7-12.
Furnell, SM., Jusoh, A., and Katsabas, D. (2006) ‘The challenges of understanding and using security: A survey of end-users’, Science Direct, Computers & Security 25(2006), 27-35.
Johnston, J., Eloff, J.H.P and Labuschagne, L. (2004), ‘Security and Human Computer Interfaces’, Computers and Security 22(8), 675-684.

Advances in Networks, Computing and Communications 6
106
Saltzer, J and Schroeder, M. (1975), ‘The Protection of Information in Computer Systems’, in Proc. IEEE 63(9), 1278-1308.

Section 1 – Network Systems Engineering
107
Guidelines/Recommendations on Best Practices in Fine Tuning IDS Alarms
C.A.Obi and M.Papadaki
Centre for Information Security and Network Research, University of Plymouth, Plymouth, United Kingdom
e‐mail: [email protected]
Abstract
This paper presents guidelines/recommendations on best practices in fine tuning IDS alarms based on experiment conducted using the network based intrusion detection system Snort and MIT 1999 DARPA dataset. Snort generated about seventy seven percent false alerts. Experiment used fine tuning techniques namely: thresholding, rule customisation, rule disablement and combination of mentioned techniques, in order to achieve reduction in false alerts with minimal chances of missing true attacks. Evaluation of the tuning techniques led to the following guidelines put forward by this study: customised rule should be designed with context keyword which remains constant, threshold time periods should be set based on approximate time interval between successive alert instances, the limit threshold type is better suited to detect probe attack involving clear and stealth versions, technique combination improves attack detection rate with highly reduced false alarm instances.
Keywords
Intrusion Detection System (IDS), Snort, Fine Tuning.
1 Introduction
Reliance on the internet and other forms of network has led to increase in intrusions. Symantec in its Internet Security Threat Report Trends for January-June 2007 observed an alarming growth of Trojan attacks over the worldwide web (Symantec website, 2008). The Intrusion Detection System (IDS) was developed to complement the firewall in its fight against intrusions, and to enforce a defence in depth security approach. False alarms are usually the bane of the IDS (Cox and Gerg, 2004). They are alerts triggered by the IDS as a result of benign activities. It can be reduced using fine tuning. If the IDS is not properly tuned, could increase the risk of missing true attacks. This paper presents guidelines/recommendation on best practices in carrying out the technique of IDS fine tuning.
Section 2 presents existing research on IDS false alarm reduction while Section 3 is on the research procedures. In section 4, results from experiment are evaluated and analysed. Section 5 presents guidelines put forward by research on best practices in fine tuning IDS alarms while section 6 covers further work and conclusion.

Advances in Networks, Computing and Communications 6
108
2 Related Work
Law (2007) applied the use of data mining to IDS false alarms reduction. A false alarm engine built from false alarms produced from training the engine with attack free data was created. These false alarms generated were modelled as points in space within a time window, referred to as normal points. An alarm filtering engine referenced the false alarm modelling engine, using the K-nearest-neighbour (KNN) classifier to make its decision of whether data traffic was normal or abnormal traffic. KNN classifier measured the distance between the normal points and the new point (representing data traffic under observation). If the distance was below a certain set threshold, data traffic was flagged as false and filtered and if otherwise it was a true alert.
Abimbola et al, (2006) proposed a technique for false positive reduction in an HTTP data network using procedure analysis. Procedure analysis technique involved creating a data model from an HTTP ‘GET’ request. This HTTP data model divides the Uniform resource locator (URL) into its path component (path) and optional query string component (q). Harmful strings consistent to the HTTP request isolated from the HTTP data model, is used to design intrusive signature patterns.
The research conducted by law (2007) and Abimbola et al, (2006) used Data mining KNN classifier and procedure analysis techniques respectively to investigate false alarms reduction in contrast to fine tuning method used in this research to draw up appropriate guidelines/recommendations. Abimbola et al, (2006) were of opinion that Snort’s increase in false positives was as a result of its detection rule options based on context keyword detection. As a result of the assertion made by Abimbola et al, this research made sure custom rules were designed based on keywords that were peculiar to the attack under observation. Keywords synonymous with attacks were selected based on careful observations of the attack patterns in the MIT 1999 DARPA dataset.
3 Research Procedure
Phase 1of this reasearch involved running Snort with all its rules enabled against the inside and outside tcpdump data of each day contained in the MIT 1999 DARPA dataset. This was modelled to represent an initial off the shelf IDS installation prone to generate numerous alert logs. This study assumed that the snort.conf settings: var HOME_NET and var EXTERNAL_NET have been correctly set since these variables are known to generate numerous false alarms if not properly defined (Greenwood, 2007). The generated logs were analysed to determine Snort’s signatures which have raised false and true alert instances. To identify true and false alerts from each day of the experiment, the following approaches were utilised:
A. Alerts were correlated with the attack identification list released by MIT/DARPA/AFRL research team. An attack is considered true if it’s time stamp, source and destination IP address and probably port numbers matched the attacks listed for that particular day on the list; otherwise it is a false alert

Section 1 – Network Systems Engineering
109
B. Information provided by Snort website on the rule responsible for the alert was compared with a database containing details (attack database, provided by MIT/DARPA/AFRL research team) on almost all the attacks in the 1999 DARPA dataset for a match. If there is a match, the alert is considered a true alert and if otherwise, a false alert.
C. Wireshark was used to analyse alerts generated for noticeable exploits peculiar to attack under investigation. If alert traffic pattern/payload indicates attack exploit, it was considered a true alert and if otherwise, a false alert.
Second phase (Phase 2) of this research depended on phase 1 results. Second phase involved comparison of different scenarios using various fine tuning techniques put forward by this study. Comparisons were based on two criteria namely: Tuning technique’s ability to reduce false alerts and chances of increasing the risk of missing true attacks. Tuning techniques which offer great reduction in false alerts and minimizes the risk of missing attacks were adopted. From the outcome of this phase, guidelines/recommendations on fine tuning IDS alarms were proposed.
4 Experimentation Results and Analysis
4.1 Phase 1 Results and Analysis
Figure 1. Total number of alerts and false alerts generated for each day in weeks 4 and 5 test data (inside tcpdump data).
Snort generated a total of nineteen thousand four hundred and thirty seven alerts. Fourteen thousand eight hundred and eighty four of the total alerts generated (over two weeks) were false alerts (figure 1).
4.2 Phase 2 Results and Analysis
From the outcome of phase 1 above, this section assesses the results achieved by implementing the various fine tuning techniques and strategy. Only signatures whose outcomes have contributed to this research work have been analysed herein.

Advances in Networks, Computing and Communications 6
110
4.2.1 ICMP PING signature
ICMP PING signature generated true alert instances for the ipsweep and POD attacks respectively. A custom tailored rule below was designed to detect the POD attack. Rule accurately alerted on all instances of the POD attack with no false alert observed.
alert icmp $EXTERNAL_NET any -> $HOME_NET any (msg:"POD"; dsize:>64000;
reference:url,www.ll.mit.edu/mission/communications/ist/corpora/ideval/docs/attac
kDB.html; classtype:attempted-dos; sid:2000005; rev:1;)
Thresholding was applied to the ICMP PING signature with regards to the ipsweep attack (made up of clear and stealth versions). Scenarios 1, 2 and 3 were used to investigate the ideal threshold type for this probe attack using three hundred and forty three alerts (two hundred and sixty nine alert instances indicated the ipsweep attack) generated by signature from the outside tcpdump data of Friday week 4 .
Scenario 1: A threshold was designed instructing the ICMP PING signature to log one alert upon detection of six ICMP echo requests in sixty seconds (below).
threshold gen_id 1, sig_id 384, \
type both, track by_src, \
count 6, seconds 60
Thirty seven true alerts and six false alerts were generated by this rule. Threshold rule entirely missed out the stealth versions of the attack.
Scenario 2: Threshold count (scenario 1) was reduced to one, and its effect on signature detection for the stealth version of the attack observed. Rule generated six true alert instances indicating the stealth version of the ipsweep attack and seven false alert instances. It was observed that this scenario greatly reduced the value of true alert instances and missed all two hundred and fifty four instances of the clear version of this attack.
Scenario 3: A limit threshold was designed to alert on the first ICMP echo request in sixty seconds (below).
threshold gen_id 1, sig_id 384, \
type limit, track by_src, \
count 1, seconds 60
Threshold rule detected all stealth versions of the ipsweep attack, thirty seven true instances of the clear version of this attack and fifteen alerts were considered false alerts. This scenario showed that the limit threshold was the most ideal for probe attacks containing the stealth and clear versions together; none of the attack versions were missed by this threshold type.

Section 1 – Network Systems Engineering
111
4.2.2 INFO TELNET login incorrect signature
This research evaluated a total of thirty five alerts generated by this signature from the inside tcpdump data of Wednesday week 4. It was resolved to threshold the signature to generate an alert after three login failures. The alert instances for the two different but similar attacks (guesstelnet and the guest attacks) detected by signature were observed to have occurred under different time windows. A threshold set (below) instructing Snort to log an alert if four incorrect log in attempts in thirty seconds was detected entirely missed the guesstelnet attack, generating only a single alert indicating the guest attack. Increasing the time period to forty seconds, threshold rule detected six true alert instances indicating the guesstelnet and guest attacks respectively. This rule was adopted for this signature. Experiment observed that threshold time period influenced rule detection rate.
threshold gen_id 1, sig_id 718, \ type both, track by_dst, \
count 4, seconds 30
4.2.3 ATTACK-RESPONSES directory listing signature
The ATTACK-RESPONSES directory listing signature detected the most number of true attacks amidst false alerts from ‘vol’, ‘dir’, ‘tree’ commands issued during telnet sections. To fine tune signature, the research built custom rules for the respective attacks detected. Custom rule (below) for the yaga attack was designed to raise alert on initial attempt to hack the registry in order to add attacker to the Domain admins group. This custom rule generated an alert on the initial attack attempt (inside tcpdump of Tuesday and Thursday week 5). Ran against the inside tcpdump of Friday week 5 generated two alerts indicating the same attack.
alert tcp $EXTERNAL_NET any -> $HOME_NET 23(msg:”YAGA”;
flow:to_server,established;content:”REGEDIT4”;nocase;content:”domain
admins”;nocase;reference:url,http://www.ll.mit.edu/mission/communications/ist/cor
pora/ideval/docs/attackDB.html;
reference:url,http://support.microsoft.com/kb/310516;classtype:attempted-
admin;sid:2000002;rev:1;)
To improve the alert quality, content modifier ‘within’ was introduced (below).
alert tcp $EXTERNAL_NET any -> $HOME_NET 23(msg:”YAGA”;
flow:to_server,established;content:”REGEDIT4”;nocase;content:”domain
admins”;nocase;within:170;reference:url,http://www.ll.mit.edu/mission/communicati
ons/ist/corpora/ideval/docs/attackDB.html;
reference:url,http://support.microsoft.com/kb/310516;classtype:attempted-
admin;sid:2000002;rev:1;)
The use of content modifier greatly improved the alert quality. Custom tailored rules were designed for the other attacks (casesen, sechole and netcat) detected by the ATTACK-RESPONSE directory signature. Custom rules successfully detected the

Advances in Networks, Computing and Communications 6
112
various attacks it was meant for without any observable false alert instances respectively. The research turned off the ATTACK-RESPONSE directory signature.
4.2.4 SHELLCODE x86 NOOP signature
Signature generated numerous false alerts from NETBIOS name query, HTTP ‘GET’ request for JPEG image and from base64 content encoding of legitimate emails; signature also alerted on true alert instances indicating the ppmacro, netcat and netbus attacks through the course of this research. Exploit codes of these attacks were sent as email attachments. Research used the netcat attack detected by signature to illustrate effect of designing keyword detection custom rules based on variable attack parameter.ie. parameter not peculiar to the attack. The custom tailored rule (below) was designed to alert on the context keyword y2ktest.exe (executing this email attachment launched the netcat exploit).
alert tcp $HOME_NET any -> $EXTERNAL_NET any (msg:"NETCAT"; flow:established;content:"y2ktest.exe";classtype:shellcode-detect; sid:2000007; rev:1;)
Rule was meant to alert on the netcat initial attack attempt whenever it detects the ‘y2ktest.exe’ file. Rule ran against inside tcpdump data of Wednesday week 4 raised true alerts indicating the netcat attack but was observed to generate false alerts when ran against the inside tcpdump data of Friday and Monday week 4.
In order to fine tune the SHELLCODE x86 NOOP signature, focus was on the ppmacro and netbus attacks respectively since custom signature to detect the netcat exploit was designed on tuning the ATTACK-RESPONSE directory signature. Research considered three scenarios: the first involved setting a limit threshold type to raise an alert upon detection of an event in a second. This rule generated five hundred and fifteen false alerts and a true alert each indicating the ppmacro and netbus attack respectively (inside tcpdump data of Thursday week 4), the outcome was still very noisy. The second scenario involved the design of suppression rule to pass false alerts generated by this signature, but research observed that rule completely missed all true alert instances indicating the netbus and ppmacro attacks because machine IP addresses which were used to launch attacks shared same IP addresses amongst the IP addresses the rule was meant to pass. The third scenario was adopted, it involved the design of a custom (below) tailored rule to alert only on the detection of NOP strings ‘AAAAAAA’ found in email attachments.
alert tcp $EXTERNAL_NET any -> $HOME_NET 25 (msg:"SHELLCODE x86 NOOP"; flow:to_server,established;content:"AAAAAAAAAAAAAAAAAAAAAAAAA";classtype:shellcode-detect; sid:2000010; rev:1;)
Rule comfortably detected all three alert instances each for the netbus and ppmacro attacks respectively. Custom rule ran against Tuesday week 4 outside tcpdump data was observed to raise four false alerts from a benign email attachment. Tuesday week 4 results showed rule was prone to false alerts; to put a check, research designed a limit threshold type to raise an alert upon detection of an event in a second in combination with custom rule. A combination of custom rule and threshold rule ran against the inside tcpdump data of Wednesday week 5 generated just two alerts. (SHELLCODE x86 signature originally generated four hundred and seventy

Section 1 – Network Systems Engineering
113
four alerts) indicating the netbus attack and the other was a false alert. Inside tcpdump data of Wednesday week 5 was used because it contained instances of the netbus attack and benign email attachments. Research adopted this tuning techniquecombination for the SHELLCODE x86 NOOP signature (original rule with SID 1394 was turned off).
4.2.5 CHAT IRC and the PORN BDSM signatures
The policy based CHAT IRC signatures and the PORN BDSM signature respectively have been disabled. This tuning technique decision was carried out by the research based on the loose policy of the MIT test evaluation (MIT website, 2008).
5 Guidelines/Recommendations
The following guidelines / recommendations on fine tuning have been put forward based on the findings of this research:
i. Custom tailored rules based on keyword detection should be designed with context keywords that remain constant and peculiar to the attack.
ii. When setting thresholds for probe attacks consisting of stealth and clear versions, the limit threshold type is better suited to detect instances of all attack versions.
iii. Combination of two tuning techniques improves attack detection with great
reduction in number of false alerts.
iv. Threshold time period is of utmost importance. Improperly set time periods increase chances of missing attacks. Time periods should be set based on the approximate time interval between successive alert instances.
v. Rules are turned off only if they do not conform to the set policy of the
network under guard or appropriate tuning measures have been put in place.
vi. Content modifiers should be used in design of custom tailored rules in order to improve alert quality.
6 Further work and Conclusion
6.1 Further work
Snort’s pre-processors just like has been observed by Caswell et al (2007) have evolved so much since the inception of Snort; their functions are not restricted to anomaly detection and protocol normalization alone but also generate their own alerts. Through the course of this research, Snort pre-processors generated several alerts which could not be analysed due to time constraints. Investigation into alerts produced by this pre-processors are worth carrying further to determine if these alerts are false or actually true alerts and also a study could be carried out in order to

Advances in Networks, Computing and Communications 6
114
determine optimum tuning techniques for false alerts generated by Snort’s pre-processors. Snort’s respective pre-processors can be manually configured; if Snort can be designed to alert and drop protocols/data traffic which do not meet pre-processors set configurations before they traverse the detection engine, great reductions in false alerts and system processor overhead could be achieved.
6.2 Conclusion
Research effort was focused on proposing guidelines/recommendations on best practices in fine tuning IDS alarms. This study made use of fine tuning techniques namely: thresholding, custom rule design, rule disabling and combination of techniques aimed at false alert reduction with minimal risk of missing true attacks. This research work will be of benefit to the corporate (information technology personnel-network managers, administrators and support staff) as well as the academic world. It will alleviate the problems faced by Information technology personnel because it will save time spent on Intrusion detection system logs, improve device performance and justify cost on device investment. As regards the benefits to the academic world, future research in this area can hinge on the guidelines proposed by this study.
7 References
Abimbola, A., Munoz, J. and Buchanan, W., (2006). “Investigating False Positive Reduction in HTTP via Procedure Analysis. International conference on Networking and Services”, [online], p 87-87. Available at: http://ieeexplore.ieee.org/iel5/11125/35640/ 01690558.pdf?temp=x&htry=1[accessed 2 August 2008].
Caswell, B., Beale, J. and Baker, A. (2007) “Snort IDS and IPS Toolkit”. Burlington, MA: Syngress Publishing, Inc.
Cox, k.J. and Gerg, C.,(2004). Managing Security with Snort and IDS Tools. Sebastopol, CA: O’Reilly Media, Inc
Greenwood, B., (2007). Tuning an IDS/IPS From The Ground Up. Available at: http://www.sans.org/reading_room/whitepapers/detection/1896.php [accessed 15 June 2008]
Law, K., (2007). Reduction Of IDS False Alarms Using KNN Classifier. Available at: http://lbms03.cityu.edu.hk/theses/ftt/mphil-cs-b22180461f.pdf [accessed 3 August 2008].
Massachusetts Institute of Technology Website (2008). Available at: http://www.ll.mit.edu/ IST/ideval/index.html [accessed 8 January 2008]
Symantec, (2007) “Internet Security Threat Report: Trends for January-June 2007”. Available at: http://eval.symantec.com/mktginfo/enterprise/white_papers/ent-whitepaper_internet_ security_threat_report_xii_emea_09_2007.en-us.pdf [accessed 25 August 2008]

Section 1 – Network Systems Engineering
115
Implementing Biometrics to Curb Examination Malpractices in Nigeria
O.A.Odejobi and N.L.Clarke
Centre for Information Security and Network Research, University of Plymouth, Plymouth, United Kingdom
e-mail: [email protected]
Abstract
The problem of examinations malpractices that has been plaguing Nigeria for decades in spite of visible efforts by the stakeholders is examined in this paper. The main fundamental problems are identified as the absence of a credible identity verification system. This has an over bearing effect on knowing who should be where and at what time. Biometrics is considered as an adequate solution, with its proven achievement level in identification and verification of identities effectively answering the question- who you are. But given the peculiarity of Nigeria, there are general and solution specific requirement to be met for a successful implementation of biometrics in Nigeria. The proposed biometric solution; a smartcard based fingerprint verification technology incorporating the security strength of smartcards and the accuracy and speed of fingerprint biometrics is presented. A case for it is made, discussing the choice of technologies, cost and the views of the stakeholders. The paper concludes by looking at limitations of the presented solution and necessary future work if examination malpractices will be absolutely defeated.
Keywords
Examination malpractice, biometrics, identity verification, smartcard, fingerprint
1 Introduction
The recent ruthless and constant upward increase in examination malpractice cases in public examinations in Nigeria, the forms of its perpetration and the increase in its sophistication at an alarming rate called for at least equal measure of sophistication in the effort to curb this menace. The fact that examinations has to do with testing individual abilities means that in the minimum, the examiner needs to be able to identify the examinee in some way to be sure that the appropriate person is examined.
In Nigeria today, the examination institutions are using several manual methods of identity verification. These methods entirely relied on the ability of human beings to perform verification or authentication tasks and have failed so far in this concept to impact on the growing problem, hence the need for a reliable and accurate way of carrying out these checks.
Biometrics, described by (Blackburn, 2004) as “automated methods of recognising an individual based on their physical and behavioural characteristics” has been in

Advances in Networks, Computing and Communications 6
116
existence for centuries although in a non-sophisticated form (Zang, 2000). Biometric technologies have been used in various capacities to enhance security of processes, procedures and systems usually serving a complementary purpose. Different types of biometrics exist with peculiar merits and demerits in varying level of complexity and sophistication.
Its implementation to provide a viable solution towards curbing the rampant examination fraud in Nigeria is discussed. This paper presents Identity Smartcard with fingerprint match on Card as a viable solution which is proposed after a careful understudy and analysis of the problems as capable of keeping the vice under control.
2 Problem of Examination Malpractice
The fundamental success of any examination administration is the ability to keep the examinations materials confidential, making sure that the candidates sitting for the examinations are authentic and abide by the rules and ensuring that the process of scoring candidates is transparent and fair. A departure from any of these is regarded as examination malpractice.
There has been a persistence increase in the number of reported examination malpractice cases since year 2000. There are 40,805 malpractice cases in the senior school certificate examinations conducted by the National Examinations council-NECO in year 2000 and this figure has grown to 469,582 cases in 2007 (NECO, 2007). These figures show an annual increase of about 167%. The number of candidates caught in the act is up by about 5% within the same time frame (NECO, 2007). Taking into account the fact that an average of 1million candidates register for this examination yearly, this implied about 50,000 candidates are caught every year.
2.1 Impersonation
West African Examinations Council, a sister examination body to NECO reported increase in impersonation figure from 0.2% of the total malpractice cases in 2000 to 1.2% in 2005 (Uzoigwe, 2007). This figures does not justify in anyway the effort that goes into planning and administering these examinations as discovered while understudying operations of these examination bodies. The impersonations are now planned from the registration stage, making it difficult more than ever to spot ordinarily.
2.2 Leakages
Examinations materials leakage is the most serious problem capable of disrupting the whole examinations especially when it leaks well ahead of the examination day. It was made manifest during the studies that these leakages might be through the distribution drivers, subject officers, centre supervisors and custodian points. The fact that this problem in particular is hardly admitted by the examination institutions makes availability of statistical data very hard to come by. However, it is well known that the leakages are becoming more serious threat as the year goes by.

Section 1 – Network Systems Engineering
117
3 Solution Requirements
The biometric verification of the identity of the candidates as well as that of the officials administering these examinations could go a long way in reducing the problem of malpractice. Identity verification is capable of at least eradicating impersonation and by extension contributes towards behaviour improvement within the examination hall. Its variant could be implemented for access control to enforce who can access what resources.
To successfully implement biometric identity verification in examination in Nigeria, the following requirements need to be met.
3.1 General requirements
The uniqueness of Nigeria where the system or the solution will be deployed necessitates meeting some basic requirements that may otherwise not be necessary if the same solution is to be deployed in another part of the world. These are bulleted below:
The system must be independently powered. Use of matured technology is mandatory Biometric template storage method must be carefully selected The system must be quick and secure
These are made necessary by peculiar conditions in the country such as incessant power failures, poor communication infrastructures, Nigerians impatience and curiosity.
3.2 Solution Specific Requirements
These requirements stems from the problems that needs to be solved and the need for the solution to be able to effective in solving those problems while been able to seamlessly work with the existing systems and processes. They include:
The solution must be one that could be Integrated with the existing registration procedure
The system must be able to conclusively carry out identity verification Integration of candidate attendance record keeping not negotiable The solution must incorporate blacklisting function
Working closely with these requirements is essential. Only then will it be possible to achieve a solution that will be effectively able to curb the problem of impersonation first hand and other forms of examination malpractice by extension.
4 The Biometric Solution
Biometric solutions are generally implemented using one or more of the human physiological or behavioural attributes. Biometric technologies that could be used to implement the solution includes but not limited to; iris scanning, hand geometry,

Advances in Networks, Computing and Communications 6
118
voice recognition, fingerprint scanning and keystroke analysis. All biometric systems are basically made up of the same fundamental blocks and they all work the same way (Xiao, 2007).
4.1 Identity Smartcard with fingerprint match on card
The solution combines the smartcard technology with the speed and performance of the fingerprint biometrics to solve the perennial problem of examination malpractice. A multiple card operating system- MACOS capable microprocessor smartcard is used as an identity card with the photograph of the holder printed on the card secured with ultraviolet and hologram printing. The card equally will hold the biometric fingerprint template that will be used for verification. The verification unit will be custom built to house the fingerprint scanner, the smartcard reader and a visual display unit capable to operate in enrolment or verification mode. Figure 1 shows the block diagram of the enrolment process.
4.1.1 Enrolment
The enrolment process is divided into two stages the online registration and the biometric enrolment. During the online registration stage individual candidates will be required to register using a web form to submit their personal information as well as the subjects for which they wish to sit for during examinations. This data is centrally stored.
Figure 1: Enrolment block diagram
However during the biometric enrolment, the candidates will first be required to provide the registration number issued to them during the online registration phase and another source of information that could be used to verify their identity, such as driving licence, national identity card or international passport. The candidates’

Section 1 – Network Systems Engineering
119
photographs will be taken at this stage as well as the fingerprint sample using the fingerprint scanner. The minutiae based system is used. Figure 1 shows the general block diagram of the enrolment process.
Figure 2: Typical minutiae extraction and matching source (Pallav, et al. 2005)
The fingerprint image obtained is normalised, its orientation and frequency estimated and region mask applied then Gabon filtered to obtain an enhanced image (Pallav, et al. 2005). The minutiae will be detected, extracted and stored as template. Figure 2 shows typical minutiae extraction and matching process. But in this case, the template obtained for individual candidate is then stored on the smartcard.
4.1.2 Verification
Figure 3: Verification and attendance record system

Advances in Networks, Computing and Communications 6
120
During verification stage, the candidate is required to produce ‘what he/she has’- the smartcard issued during enrolment. Then, the verification unit will prompt for finger scanning. The process of template creation is then repeated and the minutiae extracted but this time the created minutiae template is communicated to the card holding the enrolment minutiae template. The matching algorithm resident in the card is used to match the minutiae and a matching score is calculated. The candidate is considered a match if the calculated score exceeds threshold. The smartcard then allows the attendance record application access to the candidate information stored on the card. Figure 3 shows the general verification block diagram of the identity smartcard with match on card fingerprint biometrics.
This 1:1 matching is typically enough to conclusively verify candidate or staff claimed identity. This verification is carried out offline and removes the envisaged communication problem that may hunt match on server approach.
5 Discussion
There is more than one possible solution that can be used to solve this problem of examinations malpractice. The choice of the identity smartcard with match on card fingerprint biometrics is a synergy of effective problem analysis; clear understanding of the available options and insightful cost management. The solution’s successful implementation to curb examinations malpractice in a country like Nigeria requires a little bit more to be considered especially in making the choice of the technology that will effectively do the job.
5.1 Choice of Technology
The choice of fingerprint biometrics is selected after a careful study of every option available. Such technology includes iris technology, hand geometry, voice and face recognition. Availability of the biometric attribute is considered; about 99.98% of the candidates have fingers with they would write the examinations (NECO, 2007). There are sizable numbers of deaf and dumb candidates enrolling for examinations annually. Therefore, the implementation of fingerprint will translate to use of less pragmatic alternative verification approach for the remaining less than 0.02%. Usually alternative biometric attribute is implemented for those users who either do not have fingerprints or a fingerprint good enough for enrolment.
Considering the performance measure statistics, fingerprint technology has a false acceptance rate FAR of 0.0008% and false reject rate FRR of 2.5% (Deutsche Bank Research, 2002). Although iris scans technology that has a better FAR figure, however, taking into consideration the acceptability factor, fingerprint technology has a better standing. The same is applicable when considering speed and accuracy. Although, at present the technology is implemented in verification mode, if necessary it is identification mode capable, this is good for scalability.
The solution combines biometrics with smartcard technology. Smartcards are made to securely resist any attack or in the minimum to show evidence of attack. The decision to use smartcard is not only informed by the security needs but also by the need to carry out the verification offline. The selection of the solution fits the

Section 1 – Network Systems Engineering
121
ambition of all the educational and examination institutions in Nigeria to make the solution work across board.
5.2 Cost
This is a very important factor to be given consideration since there is always a limit on the amount of resources available for every project. The government through the examination bodies will finance part of the project while the candidates themselves will bear the cost of the identity smartcard issued them. Since the cost of implementing a solution does not always indicate it is the best solution for a specific problem, it is necessary to include cost as a factor to be considered when making decision on the kind of technology to be implemented.
The equipments and software cost is about $4.2 million when roughly estimated. The overall cost of implementation is expected to be a little different since the retail costs of most of the equipments are used. It must although be stated that this is the initial cost subsequent cost for each examination will be limited to the cost of producing the card for the enrolled candidates.
5.3 Stakeholders Opinion
This solution when presented to some officials of examinations institutions in Nigeria, in spite of their little understanding of the technology, saw its possibility of helping to put a stop to the identity based examination malpractice problems especially impersonations. Some believed that its being new will make it enjoy success for a while. Others said it would in the minimum serve as deterrent while some are rather uncomfortable with spending $4.2 million only to get a solution that will only serve as a deterrent.
When they were asked about their fear with regards to the implementation of the solution, the response was clear and suggestive of the general and solution specific requirements initially enumerated. Other than this, there are concerns about what will happen should a candidate’s card get lost. Some student can loose the card intentionally so as to escape the biometric verification. In as much as this type of problem is not unexpected, therefore well-defined procedures such as using other official identity documents for verification and treating such candidates as special and possibly keeping special eyes on them if they are at all allowed write the examination.
The majority of the stakeholders have cost as their top priority, also many of them place more emphasis on the effective identity verification at the expense of security and maintenance. This is not unexpected, but when they were asked which of the two solution presented, majority clearly agree that identity smartcard match on card fingerprint biometrics is better.
5.4 Future Work
Copying from other candidates or textbooks and substitution of answer booklets etc. all still constitute examination malpractice (Adamu,1998 and Fagbemi, 2001). This,

Advances in Networks, Computing and Communications 6
122
sloppy or unpatriotic attitude of the verification supervisors for example can not be curbed by the proposed solution.
Having stated that this solution cannot summon all the problems independently, then there are other areas that must be looked into for solution in the future. Handwriting recognition for the purpose of verifying who actually write the examination will be a huge step forward if it could be effectively implemented. It might just be the required solution to eradicate vices like swapping of examination answer booklets. Not this alone, work needs to be done towards implementation of fingerprint screening of answer booklets or sheets as the case may be, especially the optical mark reader sheet currently used for collecting multiple choice type questions responses.
6 Conclusion
The result of the research carried out on the examination institutions in Nigeria show that there are concerted efforts towards perfect delivery of the examinations with little to show for the work done. This is largely due to the fact that there is a large number of identity related loopholes. With problems such as impersonation forming foundation for other kinds of malpractices, the effective way of verifying individual identity has to be implemented. Biometrics of course is the right direction to follow but the availability of just few independent evaluation of the existing biometric technology does not make the selection of which technology to implement an easy one.
Biometrics on its own cannot be regarded as a perfect authentication solution, but it is at its best when combined with other forms such as token and PIN or passwords. The choice of technology requires tradeoffs to be made, if not properly set, arriving at a solution that is neither cheap nor fit for purpose is not impossible. While the stakeholder agrees that this solution meets their requirements, it still suffers the same weakness peculiar to every human supervised security. The supervising being is always the weakest link.
7 References
Adamu, H. (1998). Indiscipline in Nigerian institutions: Causes, effects and solution. cited in Ehiozuwa, A. 0. (Ed). Etiology Effect and control of Malignancies in Nigerian Education (EEC OFMINE). CPSE Publishers.
Blackburn, D. M. (2004). Biometrics 101 version 3.1. Retrieved January 16, 2008 from www.biometricscatalog.org/biometrics/biometrics_101.pdf
Deutsche Bank Research. (2002). Biometrics – hype and reality. Economics (22).
Fagbemi, J. (2001). Assessement and Examination Malpractice. Proceedings of the 16th Annual Congress of the Nigerian Academy Of Education, (pp. 82-100). Jos.
NECO. (2007). The stastistical facts of the conducted examinations so far. Minna, Nigeria: National Examinations Council.

Section 1 – Network Systems Engineering
123
Pallav, G., Srivaths, R., Raghunathan, A., & Jha, N. K. (2005). Efficient Fingerprint-based User Authentication for Embedded Systems. Anaheim, California, USA: ACM.
Uzoigwe, M. G. (2007). WAEC Press Release. Lagos.
Xiao, Q. (2007). Biometrics—Technology, Application, Challenge,. IEEE Computational Intelligence Magazine , pp. 5-9 and 25.
Zang, D. (2000). Automated Biometrics: Technoloies and Systems. Massachusetts: Kluwer Academic Publishers.

Advances in Networks, Computing and Communications 6
124
An Assessment of People’s Vulnerabilities in Relation to Personal and Sensitive Data
B.G.Sanders and P.S.Dowland
Centre for Information Security and Network Research, University of Plymouth, Plymouth, United Kingdom
e‐mail: [email protected]
Abstract
Standards bodies and industry organisations spend a considerable amount of time, effort and money on the development and deployment of next generation solutions that address network security issues. However it is becoming increasingly apparent that people are in fact the main weakness with regards to the protection of personal and sensitive data. This paper explores in detail the areas in which personal and sensitive data was socially engineered. The study investigated people’s attitudes to security, their risk taking ability and their awareness regarding online and offline security. The analysis supports the theory that the security of data is entirely dependent on the security awareness and knowledge of individuals. In addition the study revealed that students who had undertaken one or more security modules at University had a greater awareness of security vulnerabilities, yet had limited knowledge regarding social engineering exploits. The paper concludes that a number of individuals had little awareness and understanding regarding basic computer security and the need for such security. The results showed a distinct lack of respect and awareness amongst demographics in relation to online security and the security of others. These respondents were unaware of the potential consequences of disrespecting implemented security measures and as such were considered more vulnerable. The study also revealed that none of the respondents could correctly differentiate between a legitimate and illegitimate (Phishing) email which consequently increased the possibility of exploitation. In addition it was revealed that many individuals were making themselves increasingly vulnerable to social engineering attacks by posting personal and sensitive information on social networking websites.
Keywords
Social engineering, people’s vulnerabilities, Phishing, passwords, cyber crime
1 Introduction
Regardless of how well a given network infrastructure is technically secured, the protection of sensitive data is still entirely dependant on the awareness and trustworthiness of its users. Security awareness of users is based on their education, background, experience and beliefs.

Section 1 – Network Systems Engineering
125
Due to the dramatic improvement in technical security, cyber criminals have resorted to socially engineering trusted users of a network in order to gain critical information such as login credentials.
Limited protection can be implemented to protect a user from feeling gullible to divulging information. Unlike physical network infrastructures, no patches or security policies can be applied to improve and protect human misjudgements.
With the present global state of information technology where the internet is generating a great deal of revenue and growing at an exponential rate it is crucial that awareness is raised throughout organisations in order to protect personal and sensitive.
An online survey conducted by a postgraduate student at the University of Plymouth assessed the extent of human vulnerabilities in relation to personal and sensitive data. The study revealed that respondents from various countries around the world were making themselves vulnerable to social engineering attacks which are largely due to a lack of awareness and understanding. It was found that individuals are willing to sacrifice the security of themselves and others for time and convenience.
2 Social Engineering
Social engineering is defined as the technique for obtaining confidential or sensitive information by interacting and deceiving people that can access that information (Burgoon, Qin, 2007). With the implementation of modern security technologies, attackers find exploiting human vulnerabilities much easier and quicker than conventional hacking (Twitchell, 2006).
Figure 1: Social Engineering Cycle (Allen, 2006)

Advances in Networks, Computing and Communications 6
126
Figure 1 illustrates the social engineering cycle. This cycle consists of four phases: Information Gathering, Relationship Development, Exploitation and Execution. Each social engineering attack is unique in approach and execution and is likely to involve multiple phases/cycles (Allen, 2006).
Social engineers, unlike traditional hackers, exploit human vulnerabilities as opposed to technical weaknesses. Humans have been characterised as the ‘weakest link’ in the security chain as there are no rules or patches that can be applied to protect their vulnerabilities (Mitnick, 2002).
The ability to detect social engineering and deception differs between individuals. Factors such as truth-bias, stereotypical thinking and processing ability form the basis of human judgement (Burgoon, Qin, 2007). As humans have different personalities and varying levels of perception, this brings with it different vulnerabilities and weaknesses which a talented social engineer can detect and exploit (Mitnick, 2002).
Social engineering is considered to be a high risk threat to the protection of personal and sensitive data. However, at this stage there is a distinct lack of factual evidence to support such a statement (Karakasiliotis, 2006). The existence of social engineering to date is merely supported by anecdotal evidence and as such makes it unquantifiable. An assumption is made that the reason for the lack of tangible evidence is to prevent embarrassment to both individuals and organisations. In addition, public knowledge of a successful social engineering attack could be damaging to a company’s reputation and call it’s integrity into question.
Social engineering has become more prevalent over the last five years (Grant, 2007) and surveys have been conducted to identify different aspects of socially exploited vulnerabilities. The following social engineering techniques have been defined:
2.1 Pretexting
Pretexting is a technique which involves creating and using an invented scenario in order to dupe the intended target into divulging personal and or sensitive information. This technique is usually executed over the telephone and normally requires an amount of prerequisite knowledge about the victim. This prerequisite knowledge can usually be acquired by researching public information resources, such as those listed on the previous page (Federal Trade Commission, 2006).
2.2 Phishing
Phishing, also known as ‘brand spoofing’ or ‘carding’ is the attempt to falsify or forge a legitimate company’s e-mail address or website in order to scam an e-mail recipient into providing personal and sensitive information. Phishing criminals aim to obtain information such as login credentials, credit card information and identity details. The technique of phishing has been around since 1995 but became more prominent in July 2003 when criminals began to actively target large financial institutions; namely E-Loan, Wells Fargo, E-Gold and CitiBank (Lance, 2005).
Section 1 – Network Systems Engineering
127
The most prominent methods of phishing to date are email forgery, false websites, caller identification spoofing, cross-site scripting attacks and malware/Trojans (Lance, 2005).
2.3 Pharming
Pharming is a more insidious variation of Phishing. Its fundamental technique is the same as phishing in that it uses forged websites to capture personal and sensitive information. Pharming, however, redirects a user to a false website as they attempt to access a legitimate website. This redirection, otherwise known as ‘domain spoofing’ can be initiated by an emailed virus that lies dormant on the victim’s computer until the specific web address (URL) is entered. An automatic redirection can also be facilitated by poisoning the Domain Name System (DNS). Once a computer is infected and the user is redirected to a false website then any information entered will be captured by hackers (Cisco Systems, 2007).
2.4 Evil Twins
The ‘Evil Twins’ technique is again a variation of phishing. Evil twins offer users a wireless connection service and look identical to one a user would find in any Wi-Fi hotspot or internet cafe. As the broadcasted Wi-Fi connection looks identical to legitimate connections, it is almost impossible for the victim to differentiate between the two. Once the user is connected to the rouge access point, fraudsters are able to capture credentials and credit card details by using a man-in-the-middle (MITM) attack (Delaney, 2005).
2.5 Interactive Voice Response
Interactive Voice Response (IVR) is a phone technology that enables a computer to detect voice and touch tones using a normal telephone call. Fraudsters use rouge IVR’s to replicate a legitimate copy of an organisation’s IVR system. Typical target organisations include banks and other financial institutions. This scam normally relies on generating a need for the customer to phone into the rogue system and this can be achieved by the sending of a Phishing email. The rogue IVR system will request that the user inputs their relevant personal and sensitive, which in turn gives the social engineers full access to the victim’s exploited accounts (Microsoft, 2006).
3 Demographics
Respondent demographics varied in age, gender, levels of education and countries of origin. Such information was collected throughout the survey to establish whether or not the aforementioned variables affected demographics responses. Indeed it was revealed that none of these variables significantly influenced demographics responses and in fact individuals of all ages, levels of education and countries of origin lacked awareness regarding social engineering exploits.
A total of 86 responses were collated. 83% of respondents were male and 17% female. 14% of respondents were aged between 18-20, 58% aged between 21 – 25, 20% aged between 26 – 40, 3% aged between 41 – 49 and 5% were 50 years old or

Advances in Networks, Computing and Communications 6
128
more. 84% of respondents originated from developed countries leaving 16% from undeveloped countries. 30% of respondents were students of the University of Plymouth out of which 74% had previously undertaken one or more security modules.
4 Computer Security
The study investigated and measured user’s awareness of basic computer security as well as the security based resources available to them. Respondents were asked where they use a computer and if they installed the latest updates to their computer when released. They were also asked how long they spend on the internet daily and whether or not they had a firewall installed. In addition demographics were asked if they had antivirus and anti spyware installed and the frequency to which they updated it.
The survey revealed that the majority of respondents spent more than four hours online a day and applied the latest security updates to their computer upon release. The survey revealed that males spent more time online than females and as such had a better understanding of computer security. Additionally, younger respondents, the majority of whom were heavy users (spending more than four hours online daily) had a better awareness of security issues and as such protected themselves more effectively against potential security threats. It was likely that this was due to the fact that younger demographics had far greater exposure to computers from an early age unlike older respondents who would not.
A comparison was drawn between respondents from developed and undeveloped countries. It was assumed that respondents from developed countries would have a better understanding of computer security than respondents from undeveloped countries. This assumption was based on the fact that developed countries are more likely to have a greater number of computational resources than undeveloped countries. Indeed it was revealed that there was little difference between responses between developed and undeveloped countries. In fact it was found that respondents from undeveloped countries had a better understanding than those from developed countries. This outcome was due to the fact that respondents from undeveloped countries were postgraduate students of the University of Plymouth.
Comparisons were drawn between respondents with varying qualifications. It was assumed that higher qualified respondents would respond more favourably than those with fewer qualifications. It was found that the results did not support this hypothesis and in fact there was little difference between responses. Respondents in the ‘No Qualifications’ group and ‘GCSE’ group all had a firewall installed whereas higher qualified respondents did not or were unsure. Additionally 17% of respondents with Bachelors Degrees and 11% of respondents with Masters Degrees did not have an antivirus package installed. These results indicate that higher qualified respondents may well have a better understanding of computer security but are complacent about the need for it.
Additionally results were compared between respondents who had previously undertaken one or more security modules and those who had not. It was found that

Section 1 – Network Systems Engineering
129
respondents who had not previously undertaken security modules performed worse than those who did. 10% of respondents who had undertaken security modules did not have an antivirus package installed where as 100% of the respondents who had not undertaken security modules did have antivirus protection. Moreover 35% of respondents who had undertaken security modules did not have an anti spyware package installed whereas 100% of the respondents who had not undertaken security modules did have anti spyware protection.
5 Security Awareness
The survey further measured respondent’s attitudes towards security. It additionally aimed to understand individual’s willingness to take risks which could potentially place themselves or others at risk. Demographics were asked what they would do if their firewall alerted them that their computer was attempting to make a connection to the internet whilst attempting to view a webpage. 23% of respondents claimed that they would continue to view the webpage regardless. 19% stated that they would open the webpage if they knew the source but would close it if they did not. 15% said that they would close the webpage immediately and block the URL and 26% claimed they would investigate the webpage using security facilities such as firewalls and anti virus packages. Surprisingly 2% of respondents stated that they would open the webpage on another individual’s computer thereby putting that computer at risk. 15% of the total demographics did not respond.
The above results show a distinct lack of respect and awareness regarding online security and the security of others. It is also apparent that people are unaware of the potential consequences of disrespecting security measures.
Respondents were also placed in a number of hypothetical situations which measured their honesty as well as their understanding of the importance of security. Demographics were asked what they would do if they received an email from their bank asking them to login with their credentials. 72% of both male and female respondents stated that they would phone the bank and ask for more details. 28% of males and 9% of females stated that they would click the link and sign in as requested, leaving 18% of females who would visit the site later.
The second question asked respondents what they would do if they believed that a friends computer had been infected with a virus whist they were surfing the internet. 64% of male respondents and 74% of female respondents stated that they would immediately inform the individual. 3% of males and 27% of females would leave the owner to find out later leaving 33% of males who would try and fix the problem themselves. The results show that a percentage of respondents are willing to leave another individual vulnerable to exploitation instead of owning up to their own mistakes. Leaving a computer which has been infected could at least lead to data corruption and theft.
Respondents were then asked what action they would take if they noticed that a work colleague had left their computer logged on with Microsoft Outlook running in the taskbar. 31% of males and 27% of females stated that they would lock the colleague’s computer. 53% of males and 55% of females would inform the

Advances in Networks, Computing and Communications 6
130
individual. 10% of males and 9% of females would shut the computer down and 2% of males and 5% of females would look through personal files and emails. Overall the responses to this question were mostly positive; however a small number of demographics admitted that they would invade the privacy of others.
The survey proceeded to ask demographics what they would do if they got to work one morning and realised that they left their access card at home. 34% of males and 55% of females would follow someone else into the building and continue their day. 60% of males and 36% of females would go to the card office and obtain a temporary card for that day leaving 5% of males and 9% of females who would go home and collect their own access card. This question measured demographics understanding of the importance of security policies. In this instance access cards are used to identify employees. If such policies are disregarded then an organisation is more vulnerable to social engineering attacks due to the fact it will be more difficult to differentiate between legitimate employees.
Finally respondents were asked what they would do if a friend, who had owed them money for sometime had left their online banking account logged on. 97% of males and 82% of females stated that they would not transfer the funds owed to them leaving 3% of males and 18% of females that would. This question measured a respondent’s level of trust. Transferring funds without the owner’s authorisation could have constituted theft.
6 Social Engineering
Demographics were presented with five different emails and asked to identify them as legitimate or illegitimate. Four out of the five emails were illegitimate and were in fact Phishing emails (section 2.2). The aforementioned emails are detailed in table 1.
Question Correct Answer
1. Amazon.co.uk Email Illegitimate
2. Halifax Bank Email Illegitimate
3. Ebay Security Email Illegitimate
4. Ebay Powerseller Email Legitimate
5. PayPal Tsunami Appeal Email Illegitimate
Table 1: Correct answers for social engineering emails
Male – 77% of male respondents correctly identified the Amazon.co.uk email as being illegitimate and 23% did not. 83% correctly identified the Halifax email as being illegitimate and 17% were incorrect. 62% correctly identified the Ebay Security email as being illegitimate and 38% did not. 65% incorrectly identified the Ebay Powerseller email as being illegitimate and only 35% identified it as being legitimate. 72% correctly identified the PayPal Tsunami Appeal email as illegitimate and 28% did not.

Section 1 – Network Systems Engineering
131
Female – 80% of female respondents correctly identified the Amazon.co.uk email as being illegitimate and 20% did not. 67% correctly identified the Halifax email as being illegitimate and 33% were incorrect. 47% correctly identified the Ebay Security email as being illegitimate and 53% did not. 53% incorrectly identified the Ebay Powerseller email as being illegitimate and only 47% identified it as being legitimate. 73% correctly identified the PayPal Tsunami Appeal email as illegitimate and 27% did not.
The results revealed that regardless of age, gender, country of origin or level of education, none of the surveyed demographics were able to correctly identify all of the emails presented to them. This in turn showed a distinct lack of awareness and understanding of social engineering techniques.
7 Social Networking Websites
Demographics were further asked if they were members of a social networking website. If the answer to that question was ‘Yes’ then the demographics were presented with a list of possible details which are most commonly found on social networking websites. By analysing what details respondents were prepared to post online, their level of vulnerability could be measured.
Out of the total 86 respondents 67 (78%) were members of one or more social networking websites leaving 19 (22%) who were not. The results are displayed in table 2.
Figure 2: Social Networking Respondent Answers
Figure 2 shows a statistical view of the responses generated in section 5. From studying the results shown in table 2 and figure 2 it is clear that a number of users of social networking websites are highly vulnerable to social engineering attacks.

Advances in Networks, Computing and Communications 6
132
Name 97% of respondents posted their name on a social networking website leaving 3% who would not.
Age 79% of respondents posted their age on a social networking website leaving 21% who would not.
Gender 95% of respondents posted their gender on a social networking website leaving 5% who would not.
Date of Birth
73% of respondents posted their date of birth on a social networking website leaving 27% who would not. Dates of birth are personal to an individual and are often used for identification purposes.
Place of Birth
30% of respondents posted their place of birth on a social networking website leaving 70% who would not. Such information is used for identification purposes and password reset facilities.
Address and Postcode
15% of respondents posted their address and postcode on a social networking website leaving 85% who would not. Various parts of addresses and postcodes are nearly always used when verifying a person’s identity.
Relationship Status
70% of respondents posted their relationship status on a social networking website leaving 30% who would not.
Pictures 82% of respondents posted pictures of themselves on a social networking website leaving 18% who would not. Pictures enable social engineering to visually identify their targets and as such this facilitate easier exploitation.
Pet Names 18% of respondents posted the names of their pets on a social networking website leaving 82% who would not. Pet names are often used as security questions to enable access to more personal and sensitive information namely passwords.
Education 78% of respondents posted their educational background on a social networking website leaving 22% who would not. Educational details are often used in security questions; for example ‘What was the name of your first school?’
Favorite Food
33% of respondents posted their favourite food on a social networking website leaving 67% who would not. Details of favourite food are often used in security questions.
Mother’s Maiden Name
6% of respondents posted their mother’s maiden name on a social networking website leaving 94% who would not. Mother’s maiden name is a very common question used in verifying a person’s identity.
Home Telephone Number
6% of respondents posted their home telephone number on a social networking website leaving 94% who would not. Social engineers often use a telephone to execute a technique known as ‘pretexting’ (Section 2.1)
Mobile Number
18% of respondents posted their mobile telephone number on a social networking website leaving 82% who would not. Pretexting is also facilitated using mobile telephone numbers
Email Addresses
67% of respondents posted their email addresses on a social networking website leaving 33% who would not. Social engineers use email address to target individuals with phishing mail (Section 2.2)
Place of Work
33% of respondents posted their place of work on a social networking website leaving 67% who would not. Social engineers learn the structure of a company’s hierarchy in order to pretext desired information.
Instant Messaging Name
30% of respondents posted their instant messaging name on a social networking website leaving 70% who would not. Instant messaging addresses are used by social engineers and cyber criminals to make direct contact to individuals.
Credit/Debit Card Details
3% of respondents posted their credit and debit card details on a social networking website leaving 97% who would not. Respondents who posted such information online are very susceptible to fraudulent attacks from social engineers and cyber criminals.
Interests 69% of respondents posted their interests on a social networking website leaving 31% who did not.
Table 2: Social Networking Website Results

Section 1 – Network Systems Engineering
133
8 Conclusions and the Future
The range of respondent demographics varied considerably in age, gender, country of origin, and educational background. It was found that individual responses did not vary according to the aforementioned variables.
Section 2 found that the majority of respondents held a reasonable amount of knowledge with regards to basic computer security. The results of this section were not influenced by the variables contained within section 1. In order to facilitate a more accurate and meaningful analysis equal participation would be required from demographics of different ages, genders, countries of origins and educational backgrounds.
Section 3 found that a number of respondents had little regard for the need of security and the consequences of not respecting implemented security measures. If individuals do not understand and consequently do not adhere to security practices then they and any organisation to which they work for are likely to be highly vulnerable to social engineering attacks.
Section 4 found that none of the respondents were able to correctly identify all of the emails as legitimate or illegitimate. This clearly indicates that there is a distinct lack of awareness regarding Phishing based attacks. This lack of awareness combined with a lack of understanding and respect for implemented security measures (section 3) heightens the risk of attack on a given individual or organisation.
Section 5 found that many respondents were willing to post a personal profile online containing sensitive information which could be used to gain access to facilities such as password reset tools and telephone banking services.
Each section measured the extent to which different vulnerabilities could be exploited in order to gain access to personal and sensitive data. Section 2 measured people’s awareness of technical security whilst section 3 measured people’s attitudes and respect for the need of security by placing them in hypothetical situations which gave them the opportunity to breach or ignore privacy and security issues. Section 4 measured people’s abilities in detecting the most common social engineering technique known as Phishing. The ability to detect such attacks is crucial given that divulging such sensitive information could lead to exploitation. Section 5 aimed to measure how vulnerable individuals were making themselves by posting a repository of personal information about them online.
This research shows that no matter how well a given system is implemented it is impossible to completely circumvent risk. Hence due to the fact that technology is continuously and rapidly evolving, so are new technical and social vulnerabilities.
In light of the foregoing it is important that organisations and its employees are as dynamic and adaptable as possible. Individuals need to be adaptable to change in order to minimise the threat of exploitation. Many individuals do not like change, particularly within the workplace and as such somewhat prohibits effective security management. In addition it is vital that individuals are aware of the risks and

Advances in Networks, Computing and Communications 6
134
potential consequences of neglecting security procedures. Organisations need to ensure that its employees are fully aware of what security features surround them and their purposes for their implementation and then the employees must ensure that these procedures are completely adhered to.
With regards to future research further monitoring and analysis on the topic of social engineering is critical due to the fact that individuals and organisations underestimate the power that personal and sensitive information gives to cyber criminals. It is recommended that attempts to raise user awareness are implemented and the outline vulnerabilities are surveyed on a regular basis.
9 References
Allen, M., (2006) ‘Social Engineering – A Means to Violate a Computer System’ SANS Institute USA [Online] Available: http://www.sans.org/reading_room/whitepapers/ engineering/529.php?portal=a41a35b5183a4de5bc80070697433f71 [Date accessed: 29th August 2008]
Burgoon, J.K. and Qin, T., (2007) ‘An Investigation of Heuristics of Human Judgment in Detecting Deception and Potential Implications in Countering Social Engineering’ IEEE Explore: 152-169
Cisco Systems Inc. (2007) ‘Protect Against Social Engineering’ [Online] Available:http://www.cisco.com/web/about/security/intelligence/mysdn-social-engineering.html [Date accessed: 15th January 2008]
Delaney, K., (2005) ‘Hackers Use Two New Tricks to Steal Online Identities’ The Wall Street Journal May 17th 2005:B1 [Online] Available: http://www.lookstoogoodtobetrue.com/ fraudtypes/hacking.pdf [Date accessed: 15th January 2008]
Grant, I., (2007) ‘Social engineering on the rise’, [Online] Available: http://www.computerweekly.com/Articles/2007/11/27/228312/social-engineering-attacks-on-the-rise.htm [Date accessed: 19th August 2008]
Karakasiliotis, A., (2006) ‘Assess User’s Security Awareness of Social Engineering and Phishing’ MRes Thesis , University of Plymouth: 1
Lance, J. and Steward, J., (2005) ‘Phishing Exposed’ Sygress Publishing, ISBN: 159749030X
Microsoft USA (2006) ‘Phone Phishing Scams Direct You to Call a Phone Number’ [Online] Available: http://www.microsoft.com/protect/yourself/phishing/phone.mspx [Date accessed: 15th January 2008]
Mitnick, K.D. and Simon, W.L., (2002) ‘The Art of Deception – Controlling the Human Element of Security’ Wiley Publishing, Inc. ISBN: 0-7645-4280-X

Section 1 – Network Systems Engineering
135
Internet Security: A View from ISPs and Retailers
R.Shams and S.M.Furnell
Centre for Information Security and Network Research, University of Plymouth, Plymouth, United Kingdom
e‐mail: [email protected]
Abstract
This paper describes various the perceptions of internet security for home users from ISPs and Computer Retail stores in the UK. A research survey has been carried out focusing on selected largely subscribed ISPs in the UK and Computer Retailers in Plymouth and Exeter cities. The websites of the ISPs has been analyzed to measure the quality of information they offer with respect to various threats and vulnerabilities the home users are often posed to and also the information of security defense mechanisms the ISPs offer to home users to achieve optimum security. Computer Retailers were approached to measure the quality of IT Security information they offer to their everyday customers who are interested in buying personal computers and internet connections. It has been noticed from the past surveys that the users lack computer security application like Anti-virus, Firewall or Anti-spyware application which weakens the level of security on their home computers and personal information. This research work makes a sincere attempt to analyze the reasons for increase in cybercrime and decrease in the lack of user knowledge on information security. A set of brief media awareness suggestions for ISPs and Retailers has been offered which could perhaps help the home users to easily reach for information related to information security and cybercrime. The main goal of the research however, is to analyze the importance of the ISPs and Computer Retailers’ role in making the home users aware of online security.
Keywords
Online Security, Home Users, ISP Surveys, In-Store Survey
1 Introduction
The Internet has become a powerful medium for effective communication, information transfer, online banking and shopping. The fact is that the Internet has made human life easier and simpler but another opposing fact is that it has become a nightmare for people who are not completely aware of its threats. Information exchanged between users over the Internet could get compromised without their knowledge. Securing personal information and computers is often not an easy task to achieve. Possible reasons could be that the users may not be able to understand the security concepts, unaware or cannot reach the security guidelines offered by various sources and may not be interested in investing money for defense mechanisms
2 Common Threats for Home Users
Home users are facing increasing threats in the form of hacking, phishing, viruses, worms, spam etc, which directly compromises confidentially, integrity and

Advances in Networks, Computing and Communications 6
136
availability. According to a survey conducted by British Computer Society, British citizens are becoming aware of the security threats and they are deploying security measures to protect their information and personal computers. 52% online shoppers are concerned about secure payments and 51% of the users prefer to shop from popular retailer websites which offers them confidence of being secure. Home users are also aware of antivirus and firewall applications to help protect their personal computers from internet threats. 63% per cent of British adults have access to the Internet and 58% of them use it as a medium for shopping and 43% for online banking facilities. 92% of home users consider security applications as safety measures which include antivirus and firewall software applications. These figures, however does not convey that all home users are completely aware of the internet threats.
3 Aims and Objectives
The main aims of this paper are (1) benchmark the existing home user’s security measures (2) conduct a survey to investigate the user knowledge on internet security (3) investigate the sources for reliable security guidelines.
Specific objectives of the research are to:
Analyze the way users reach for security guidelines. Analyze and evaluate the guidelines offered in consumer electronic stores. Develop a new approach so that the home users could easily reach the
information security guidelines.
4 Approach Methods
The study involved two distinct data collection approaches, targeting different potential sources of advice to users. These are discussed in the sub-sections that follow.
4.1 In-Store Survey
Consumer electronic stores like Comet, PC World, Currys and Staples will be approached to respond to the survey questions. Since they are the first point of direct contact for people who buy personal computers, there is a good chance of learning about the way they make the buyers aware of security aspects and defense mechanisms.
4.2 ISP Survey
ISPs, quite similarly to consumer electronic stores, play an important role and form a first point of contact for users who are willing to sign-up for Internet connections. Some of the leading ISPs in the UK were called to check the level of their knowledge with respect to Internet Security and the security mechanism they offer for home users. The list of ISPs that are questioned will be kept disguised throughout the analysis of this research.

Section 1 – Network Systems Engineering
137
5 Internet Security: The ISP Perspective
Internet Service Providers will be the first point of contact for home users who sign-up for internet connections and they play an important role in making the users aware of the internet threats and also about the defending mechanisms against the threats. Most ISPs in Britain have dedicated an area on their websites where users will be able to find information about threats and the ways to defend. How the users are made aware of these defending mechanism plays an important role.
ISPs have two strong sources of making home users aware of various Internet threats that the users are often targeted with. The first source is their website and the second one being the technical support they offer over telephone.
6 The role of ISPs
ISP websites offer ample amount of information on security guidelines and the Internet threats they should be aware of. Apart from educating users with security mechanisms like Antivirus, Anti-Spyware, Spam and Firewall, most ISP websites offer hyperlinks to other reliable resources for online security guidelines like GetSafe, Symantec and Microsoft where users will be understand detailed security mechanism that they could deploy to secure their personal information and computers. Apart from educating users, ISPs also offer security mechanisms from their end in both basic and advanced level. In most cases, users will have to spend extra money in order to attach additional security to their subscription. Having said that, this paper would like to present home users security related web pages from some of the leading ISPs in the UK. This research considers a few top rated ISPs with respect to the number of subscribers but not necessarily all the leading top ISPs.
ISP Free Security Application
Online Help
Virus/Worms
Phishing Spyware
Virgin Mobile PC Guard Tiscali Broadband Norton AOL, UK McAfee & SpyZapper × BT Broadband Norton Sky Broadband McAfee × Talk Talk F-Secure Trial × × Orange McAfee Privacy Service × Vodafone Norton Security Suite × × O2 Broadband McAfee Suite × × ×
Table 1: Broad comparison between security features on ISPs’ websites.
A good comparison between different ISPs can be done taking into consideration the security information and protection they offer. Other popular ISPs include British Telecom, AOL (UK), SKY Broadband, TalkTalk etc. A summary of such details is presented in Table 1.
This paper, earlier had mentioned about the two methods the ISPs deploy in order to promote security measures. The first method was through their website and the second was through the Technical Support they offer over phone for their customers.

Advances in Networks, Computing and Communications 6
138
This research work approached 6 of the leading ISPs call centers in the UK to analyze the nature of security mechanisms information they offer over the phone. Each ISP was called three to four times during different times of the day to gather few answers for the survey questions. The whole idea behind this was to gauge the level of security awareness that the ISP call centers have and also the security mechanism they offer. The research voids disclosing the names of the 6 ISPs that are surveyed.
6.1 Survey Results
Eighteen responses from ISP Advisors (conducted in 6 ISPs, 3 times each) is the reply to the common threats that the home users should be worried about and taken care of.
Figure 1: Security Threats the home users should be concerned about.
According to ISPs, the major threat the home users should be worried about is viruses. Spyware and Spam are a concern to some extent where as ID Theft, Phishing and Adware threats are least considered. This could be because the advisors in ISPs were not aware of these threats by themselves which potentially brings down the percentage of home users who are being led into the proper direction of gaining optimum security.
Figure 1 shows the number if ISP advisors in percentage and the knowledge they were aware of about each of the security threat. All advisors were aware viruses and the defense mechanism against them. 33% of the 18 advisors from 6 ISPs knew about Spam. Spyware information was clearly given only by 22% of advisors and the rest had confused with Antivirus application as a security mechanism against spyware. 18% of the advisors suggested to call the ISPs and report ID Theft activity to them. No clear information was offered about what they are going to do once the user reports it. However, a general information that they will utilize the information to analyze the website where ID theft is supposedly to be happening. Shockingly, none of the advisors knew what phishing was let alone an effective defense mechanism for it. But somehow, users are guided to use Antivirus application in order to prevent phishing attacks. Adware was widely considered as pop-up’s from

Section 1 – Network Systems Engineering
139
the web sites and the advisors were aware of the fact that pop-up blocker application would reduce adware being thrown up to the users.
Another important fact that was noticed from the survey is that most advisors in the ISP are confused with anti-spyware and antivirus applications. Below are the summarized details from the outcome of the ISP survey results.
Table 2: Out come of ISP Survey Results
All the ISPs are very glad to inform about the technical support they offer for various security related questions the home users may have.
The center of gravity is no longer associated with viruses but other major threats like Phishing and ID theft have to be considered as an important issue to be taken care of. Security awareness about these threats including botware and PDF spam should be addressed by ISP and so should the users be made aware of
7 Internet Security: Retail Stores’ Perspectives
The paper earlier had mentioned about the two main first point of contact for home user’s broadband internet connections as ISPs and computer retailers. ISPs however, have failed to be responsible to educate or make users aware of various threats that the users confront with the broadband connections. This is apparent from the survey that was conducted as a part of this research and also from the past surveys that were conducted by other sources.
Computer Retailers will play an important role in this as every customer could spend a good time in the store learning about the defense mechanisms they could be deploying in order to achieve the best possible level of security. Home users who
Threat Description Virus Generally advisors are aware of the virus and the threats caused by viruses. This
helps home users to implement a basic security mechanism like Antivirus and Firewall applications.
Spyware Mostly advisors confuse spyware with antivirus. Instead of offering complete Anti-spyware software they offer antivirus and firewall as a solution. This perhaps is not the optimum security a home user should be expecting as the aftermath due to each threat varies a lot.
Adware Generally advisors have good understanding of adware that it pop-ups unwanted windows and steal personal information for marketing purpose. Advisors often recommend installing a popup blocker application in order to prevent unwanted pop-up’s from annoying the users.
Phishing Home users are advised antivirus as the solution for phishing. Phishing, a relatively new method of stealing personal information is completely misunderstood by the ISP advisors and they are unaware of the fact that an Antivirus application could solve the security vulnerability.
ID Theft Mostly antivirus and firewalls are proposed as a solution for ID Theft. ID theft relates to phishing attacks for which Antivirus and Firewall applications are not the end solution.
Spam Most advisors are fairly clear about spam whether it’s in the form of email or spam websites.

Advances in Networks, Computing and Communications 6
140
make personal computer/laptop purchase will also get a chance to look in to security related applications that are presented in the store.
Five of the following popular retailers in and around the town were approached to participate in this survey as they are the most easily accessible stores for users who plan to buy personal computers and hence were selected.
8 Knowledge on security aspects
Figure 2: Knowledge on Security Aspects of Store Advisors.
Figure 2 depicts the knowledge level the retail store advisors have on various security aspects like Phishing, spam, virus/malware/spyware, OS security patches, Firewall and Antivirus applications. It is apparent from this chart that 68% of 28 advisors had a good knowledge about Virus/Malware/Spyware, Firewall and Spam and only 53% of them had good knowledge on Antivirus application. However, 54% of them had an excellent knowledge about Antivirus application. Phishing, not surprisingly, 57% of the advisors had fair knowledge and only 10% of them just knew about it. These figures are scarily low as these advisors are meant to educate their customers who whether or not willing to buy a personal computer and/or internet connection from the store.
8.1 Security mechanisms discussed with users
In response to the type of security threat the advisors make the users aware of, 90% of the advisors educate the home users on the advantages they get if they you Antivirus application. 54% and 40% of the advisors offer information about Anti-spam and Firewall applications respectively. Only 7% and 10% of them contribute in making the users aware of ID theft and Phishing activities.

Section 1 – Network Systems Engineering
141
Figure 3: Security Applications discussed with home users.
The Internet, as mentioned earlier throughout this paper, is not safe anymore for home broadband users if there are no proper security defense systems. The usage of security applications like Antivirus, Firewall and Anti-Spyware proves to be very important which is apparent from the various surveys conducted earlier. Home users are aware of security applications to some extent but they have to master the area of total security in order to reduce the crime that originates from the Internet.
9 Recommendations
The fact that the users did not receive any security related information could not be completely pointed out at ISPs. There is plenty of information from reliable sources that the users are not aware of. Media presentation and awareness methods could be the main reason that the home users are not able to cope up with the security demands. If ISPs are not aware of themselves which is apparent from the research work done for this project work, would retail stores from where users purchase personal computers from contribute their help? This is discussed in the following chapter in detail. Possible recommendations for ISPs to enhance the existing security awareness mechanism would include but not limited to:
Offering an expert dedicated Internet Security Support team. Design their website to prioritize Internet Security and offer ample amount
of information on threats and protection mechanisms. Offering a prompt to learn the latest trends on cybercrime like phishing and
ID theft on their IVR Systems. Offering security newsletters and flash news related to cybercrime on their
websites. Offering online tools to check the home user computer’s vulnerabilities
towards various threats. Offering interactive tutorials on security mechanisms targeting novice to
expert users.
The above survey summarizes into the fact that both retail advisors and home users are completely unaware of the modern day threats specifically with phishing.

Advances in Networks, Computing and Communications 6
142
Representatives in retail stores must have a good understanding on various threats and possible ways to fight against them. Home users also have an impression that the security applications which are the most important defense mechanism are expensive. There are plenty of reliable sources for home users to learn and educate themselves with the various internet threats and also the guidelines to safeguard their home computers and personal information. But, most the users are not able to reach those resources. Retailers should not only be a computer selling medium but also act as a medium to make home users aware of the threats and defense techniques against cybercrime. They must implement effective media awareness methods and a few recommendations are to:
Offer brochures/booklets like the Virgin Media’s “Play Safe: Internet safety made easy” which has all the necessary information the users need to learn about cybercrime and the ways they could protect themselves against it.
An Information Security expert in each store who could explain the technical terms/jargons to every user, make them understand the importance of security and most importantly convince them to use security applications.
Instead of displaying “Ice Age” or “National Treasure” on the HD TV in the stores, projecting useful information on information security could be an effective way to enhance media awareness.
10 Conclusion
The Internet, as mentioned earlier throughout this paper, is not safe anymore for home broadband users if there are no proper security defense systems. The usage of security applications like Antivirus, Firewall and Anti-Spyware proves to be very important which is apparent from the various surveys conducted earlier. Home users are aware of security applications to some extent but they have to master the area of total security in order to reduce the crime that originates from the Internet.
ISPs and retail stores were presumed to play an important role in spreading the awareness which eventually is a wrong assumption according to the survey results. In a search conducted in the year 2005, home users think that ISPs should take of the entire security for the internet connections they are subscribing and about 60% of the survey respondents were willing to spend a few extra pounds to having their information and computers secured. ISPs with some extra money from the customers can only offer affordable or free security applications to the users but how about the guidelines about threats and vulnerabilities? As analyzed in this research, some ISPs consider spreading the awareness through their websites but not all them consider media awareness techniques which are aimed at educating the home users. There is a similar situation with the retail stores too. They are selling security applications in their stores but offering a free booklet or brochure that contains the information about internet threats, prevention and protection techniques could help the users educate themselves. Just giving away for free or selling a few security applications does not necessarily mean that the users are completely aware of all the threats. Usability in security applications have a considerable affect on encouraging the user in deploying them. Human computer interaction with these security applications proves to be a vital concept. Human computer interaction is defined as “the past of a user interface which is responsible for establishing the common ground between a

Section 1 – Network Systems Engineering
143
user and the security features of a system”. Security application designers must consider easy to understand interfaces in their applications so that even a novice user should be able to install and manage them. According to Whitten, a security application incorporates a good usability if:
It educates the user with the security task that they have to perform. It includes easy guide to achieve the mentioned tasks. It has a easy to understand and comfortable interface and It does not show error messages that are strange to the users.
Usable security applications that are affordable to home users would have great impact to achieving optimum security there by achieving the goal “Every users is safe user”.
11 References
British Crime Survey, (2003). “Fraud and technology Crimes”, http://uk.sitestat.com/homeoffice/homeoffice/s?rds.rdsolr3405pdf&ns_type=pdf&ns_url=%5Bhttp://www.homeoffice.gov.uk/rds/pdfs05/rdsolr3405.pdf%5D
Browse the Web Safely, Symantec Corporation. http://www.symantec.com/norton/ security_response/browsewebsafely.jsp
Getsafeonline, (2007). “10-minute guide for beginners”, http://www.getsafeonline.org/ nqcontent.cfm?a_id=1179
Johnston J, Eloff J H P and Labuschagne L. (2003), “Security and Human Computer Interfaces”, Computers and Security Journal, Vol 22, No 8.
Microsoft Corporation. Security at home,. http://www.microsoft.com/protect/default.mspx
Virgin Broadband Handy Booklet on Online Safety, http://allyours.virginmedia.com/ websales/service.do?id=2
Whitten A. and Tygar J.D. (1998), “Usability of Security: A Case Study”, Carnegie Mellon University, USA. http://reports-archive.adm.cs.cmu.edu/anon/1998/CMU-CS-98-155.pdf

Advances in Networks, Computing and Communications 6
144
Improving Awareness on Social Engineering Attacks
A.Smith and M.Papadaki
Centre for Information Security and Network Research, University of Plymouth, Plymouth, United Kingdom
e‐mail: [email protected]
Abstract
Social engineering as a method of attack is by no means a new concept, and can be easily defined as the exploitation of human weakness, gullibility and ignorance. If one was a believer in religion it could be argued that the first case of social engineering was achieved by the devil (the serpent), tricking Eve into eating forbidden fruit, thus releasing knowledge of good and evil into the world, essentially getting someone in a position of trust to perform an action they themselves could not. Social Engineering can be seen throughout history, possibly changing its alias from time to time, but still realising the same results from what is a relatively simple technique. Examples of this can be seen throughout conflicts such as World War I and II, the term ‘propaganda’ was adopted to describe what was essentially social engineering in a new form, with an attempt to control the attitudes and behaviour on a large scale (Jastrow & Podhoretz, 2000). However at current within the general IT community and especially amongst home users, the awareness of social engineering and its many implementable techniques is relatively low. The purpose of this research is to build an understanding of all the currently known about trends associated with the social engineering methodology of hacking and discover what attempts are being performed to raise users awareness to these issues. This research will cumulate in the development of an experiment, designed to evaluate the success of a newly designed educational tool based on the research discovered.
Keywords
Social Engineering, Awareness Schemes, Website Design, Learning Sciences
1 Introduction & Background
The technique of social engineering has evolved somewhat over time into a tool now used by the modern hacking community, a method which relies on influence and persuasion to deceive victims into divulging their most sensitive information. A successful social engineer is extremely adept at convincing people that he/she is someone he/she is not. Through this method of manipulation, unauthorised entities can gain access to personal information or secured systems which, by design they should never have access to. This result makes the social engineer an extremely dangerous individual, who is often able to take advantage of people to obtain information, without the use of technology (Mitnick, 2002).
The SANS institute, over the last several years has publicised a worrying statistic within the trends of social engineering, the results from several surveys reveal that

Section 1 – Network Systems Engineering
145
these techniques at bypassing security measures are on the increase. In most high profile organisations around the world, more and more elaborate security systems are being implemented to protect the perimeter of their networks, making it increasingly more difficult for hackers to gain entry with the traditional technological attacks. These systems, although proving very successful at halting the success rate of traditional attacks, are forcing the hacking community to develop new ways to gain access, thus Paller (2007) stated on behalf of the SANS institute, that social engineering seems to be a growing technique of choice for the modern hacker.
The influx of success by social engineering is in no small part attributed to the lack of education amongst users of IT systems. Surveys conducted over the last five years have proved that office workers (people who should be trained to understand the importance of security) are more than happy to give away personal information and security credentials when presented with the right reward or incentive (Wood, 2007). With this being the case for working professionals, it begs the question regarding home and general users, who lack any form of technical training, and their ability to identify and defend themselves against these growing internet based threats.
Due to the flexibility of social engineering, it has been branded by many security consultants as not unlike a disease, which has the ability to morph and disguise itself in new forms every time it is discovered. From this perspective, it shows exactly how social engineering can be a difficult threat to defend against, even if you, as a user are aware of the potential to this threat.
Examples of this can be seen in recent times through the introduction of more complex SPAM email messages, designed specifically with wording and structure to meet the statistical pass requirements of many SPAM filters acceptance policies. Even after methods such as this have been discovered, social engineers have shown the ability to mutate their attempt to include compressed archives, or embedded pictures as new techniques to combat the growing success of SPAM filters. This inability to effectively stay ahead of the growing number of methods has lead to an increasing success rate of these malicious techniques to commit identity theft, fraud and the successful building of botnet farms.
Even with all the current documentation and research which has been performed, social engineering is still not being treated with the respect it deserves. This factor can be attributed at least in part to the sheer number of traditional hacking techniques which have plagued the IT community for decades. Unfortunately this leaves attacks such as phishing, which are growing in number every day, still only being treated as an annoyance by many within the community.
Prevention of social engineering techniques is not only limited by the awareness of users to the threat, but also the effort placed by the social engineer, more than not users are falling for social engineering attacks due to the shear level of professionalism the effort entails, websites and emails which are so convincing that even the most security conscious expert requires time to uncover the underlying malicious intent of the scheme.

Advances in Networks, Computing and Communications 6
146
A great deal of the research encountered, leads to the conclusion that the most effective way to prevent successful social engineering attacks, is through the education of potentially targeted users. This defence technique, which falls into the category of semantic learning, teaches the users not only to be aware of the end results or the known attacks, but develop a deeper understanding of the principals behind them. This leads to users being able to recognise social engineering attacks which they may not have been originally educated about by recognising the characteristics which are sometimes common to all many techniques.
2 Prior Research into Social Engineering
The current research found indicates that a great deal of work has been done by previous authors into defining the term social engineering and tracking new techniques employed by its users. This includes, but not limited to several well known security organisations that are actively tracking the progress of this technique and attempting to define the damages caused by it. Paller (2007) and King (2002) have both published reports detailing the current level of threat which social engineering poses. Unfortunately this seems to be the extent of the endeavour, lacking any details regarding progressive defence’s measures which are being developed by the security community.
Symantec (2006), as a public organisation dedicated to the eradication of malicious cyber crime, have taken to more direct technical methods, and although somewhat biased due to their self promotion, do actively advertise the need for anti-phishing, anti-spyware & adware software, which they themselves provide. The development of these automated tools often fall short of obeying the published "Eight Golden Rules of Interface Design" (Shneiderman, 1997), which are a proposed collection of principals which were derived heuristically from experience and applicable in more interactive systems, the 8 rules are as follows;
Strive for consistency Enable frequent user to use shortcuts Offer informative feedback Design dialogs to yield closure Offer simple error handling Permit easy reversal of actions 7 Support internal locus of control. Reduce short term memory load
Due to lack of obedience to some of these rules, users have often been found not to understand or necessarily act upon the advice provided (Wu, Miller & Garfinkel, 2006).
Paller (2007) has also stated that the current levels of awareness amongst home user’s and businesses is insufficient to combat this growing threat, an opinion which seems to be backed up by works of Plymouth University students Karakasiliotis, Furnell & Papadaki (2007) & Bakhshi (2008) who’s efforts lead to similar conclusions, where there is still a distinct lack of awareness amongst users.

Section 1 – Network Systems Engineering
147
Adding to this, a previously undertaken research project by Tony Greening (1996 pp. 8-14) shows the results of an experiment conducted at the University of Sydney aimed at revealing the awareness of students to the vulnerabilities of social engineering, again these results were not positive in favour of the student, showing most had little or no concept of the security threats, though 1996 was some time before the current level of threat that social engineering is now regarded as. This experiment, results published alongside a report entitled ‘Ask and Ye Shall Receive’ was in line with a perception which reformed social engineer Kevin Mitnick has expressed on several occasions, whereby simply asking for the required information is often enough. Example experiments such as this one, where fraudulent emails are sent to users in an effort to retrieve targeted information are not uncommon and have been used in various studies to test user’s abilities to identify social engineering attacks. The Sydney University experiment, as shown in the figure below shows how a simplistic email with address spoofing and well formatted content can provide effective results, in this case out of 338 targeted students, 138 of them responded with their correct credentials to the phishing attempt.
However, some of the most definitive recent work on phishing is displayed in the results from the APWG (2007) survey and shows that the overall awareness of the problem is still not uniform amongst all survey participants, adding to the issues surrounding awareness is the steady number of new phishing attempts, as can be seen from figure 2 taken from the APWG (2007) survey, the numbers of these attempts per month remains consistent throughout the year.
Figure 1 - Sydney University, Greening
(2006)
Figure 2 - New Phishing Sites by Month Oct. '06 - 07' (based on figures from the APWG)
3 Existing awareness, deaf ears or definite response
Security awareness is a concept which has not fallen on deaf ears over the years, organisations and home users are constantly harassed by security concerns from their own personal computers or policies in place within their organisations, claims from within the IT community have speculated that user education is a pointless endeavour (Evers, 2006) claiming that security is always a secondary concern to end users and that the true response to enhanced security lies with the developers of applications and systems. Despite these claims, there is significant evidence to say

Advances in Networks, Computing and Communications 6
148
that well designed security education can be effective (Kumaraguru et al., 2007), where web based training, contextual training and embedded training have all shown to increase users ability to accurately identify an attack.
A study performed by Robila, James & Ragucci (2006 pp. 237-241) which utilised a more direct form of education to the users, with the introduction of a classroom discussion style environment. Subjects were included in an interactive group study session which focused on the threats of phishing and the attributes to be aware of when dealing with such threat, then allowed to take independent quizzes to test this knowledge, results from this experiment provided favourable results that users were better suited to deal with the illegitimate correspondence after their discussion orientation to the subject material.
Many of the technical social engineering methods revolve around the same techniques of fooling the user into submitting their information, primarily it is only the delivery method which changes, via Instant chat (allowing a more persuasive method to be attempted by the attacker) or through pop-up browser windows on legitimate sites (often caused by malware infected servers). Through review of these several other established methods of user awareness, it would seem conclusive that training of user is the most effective way to reduce (but not necessarily eradicate) a users susceptibility to social engineering attacks.
4 Design of a new educational tool
The background research performed in pursuit of this paper have led to the discovery of numerous already in existence social engineering awareness schemes, some details of which can be found in the previous chapter. After careful review of these other attempts and analysis of their relative success the following lists of design features were draw up as a guide of requirements for the creation of a new social engineering awareness tool.
Comprehensive literature about a wide range of social engineering techniques
Categorised material Links to additional material which is current and either presented in a
satisfactory way or complete to the point of no further additions being made.
Links to recent, past and ‘in the public eye’ news regarding social engineering trends or techniques
A user quizzes section which allows users to test themselves on their ability to recognise and defend against social engineering attacks. o Quizzes should;
Be simplistic Be Short Be Multiple Choice Have the ability to copy and paste URL’s (as much as
possible)

Section 1 – Network Systems Engineering
149
Have the ability to assist the user, in the event they lack the appropriate knowledge to complete the question
Contain real world scenarios or examples of real world attack materials
Be detailed enough for users to arrive at informed decisions Have questions based on worldwide organisations, not region
specific Promote users repeat efforts, implementation of some form of
management console to allow quiz management and overview of progress by the user
Provide feedback on progress and places for improvement Modular design to allow additional New techniques and trends to be added
easily Quick and Simple (average user, not IT specialist) method of adding new
content or editing old content when needed Contain a spokesperson, a representative entity to which users can turn to
for help, or relate the material to (a teacher, mentor or character to associate education with)
Online assistance to users who have difficulty in using the material provided (user guides to explain the general operation of the site).
4.1 Educational Concept
As has been discovered throughout the research phases, the power of interactive learning systems have been somewhat in doubt until recent years. However, with the publication of results from experiments such as the Anti-Phishing Phil game (Kumaraguru et al., 2007) and endeavors now being attempted by large organizations to create interactive education games, the true power of these efforts is now becoming evident (Havenstein, 2008).
As thus, some of these concepts were incorporated into this attempt at an educational tool and focused on supplying users with an educational experience based around learning science principals. Within the context of this design, the Social Ed website focused on providing a conceptual educational experience, whereby users are presented with material in a form which they can relate to, adding to this is the availability of interaction through the quizzes which has proven to improve the effectiveness of learning skills (Carnegie Mellon, 2007).
5 Experiment & Results
Once the implementation of the social education website was complete, and populated with general educational content regarding social engineering and techniques for defending against it an experiment was designed which requested volunteer users to participate in a trial period of the site, undertaking quizzes and utilising the literature material provided.
All of the results collected throughout this experiment of the project were stored in a MySQL database and left to build throughout this period, approximately 46 subjects

Advances in Networks, Computing and Communications 6
150
participated in the experiment throughout the trial period, falling into the groups shown in table 1.
Subject Group Quantity of Subjects
UoP Technical Students 5
UoP Technical Staff 3
Non Technical UoP & Public Organisation Staff 28
UoP Non-Technical Students 5
Non-Technical Individuals 5
TOTAL 46
Table 3 - Social Ed Respondents
Each of these subjects participated in several of the available quizzes, resulting in approximately 327 quiz results being collected within the database. The graph below shows that there was a direct correlation discovered between the pass rates of users in relation to their reading of the provided educational material. Although the results also confirm that users who did not engage in any prior reading before taking the quiz were also successful at attaining pass marks, there is statistically noticeable increase between these two sets of results.
Figure 3 - Social Ed Quiz Pass Results (With and Without Reading)
Figure 4 - Completed all Phases on Social Ed Site
In an effort to determine how successful the goal oriented design of the quizzes section was, an analysis was performed on these results to determine how many of the users who performed the available quizzes continued through all phases of testing. As can be seen from the results in figure 4 the overall number of test subjects to complete all the available phases is virtually identical to the number of people who started the quizzes (people who took a phase 1 quiz), this shows that the learning sciences principal of goal oriented design does actively encourages users to pursue a satisfactory result once started.
6 Conclusion
This attempt was designed and approached as a task to actively discover the underlying landscape behind the current trends and techniques of social engineering and the security communities approach to combat these techniques. From the research performed it quickly became evident that the most agreed upon method for

Section 1 – Network Systems Engineering
151
preventing the success of social engineering was through the education of potential victims to the techniques and their inherent characteristics.
In regards to the incorporation of learning science principals to create a goal orientated system with assistive agents, the experiment results also seem to indicate that the created tool actively engages the users and promotes their own inherent want for success. This result is reflected through the analysis of users who not only took part in the quizzes, but without any prompting from the system or invitation to continue with testing completed all available phases of the quiz.
7 References
Apwg (2007) Report for the Month of October 2007, Phishing Activity Trends. Available at: http://www.antiphishing.org/reports/apwg_report_oct_2007.pdf (Accessed: 24 January 2008).
Carnegie Mellon (2007) Anti-Phishing Phil. Available at: http://cups.cs.cmu.edu/antiphishing_phil/new/index.html (Accessed: 13 December 2007).
Evers, J (2006) Security expert: User education is pointless. Available at: http://news.cnet.com/2100-7350_3-6125213.html (Accessed: 5 June 2008).
Greening, T (1996) 'Ask and Ye Shall Receive : A Study in 'Social Engineering'', ACM Press NY, Vol 14, ACM Press NY, pp. 8-14. [Online]. Available at: http://portal.acm.org/citation.cfm?id=228292.228295&coll=GUIDE&dl=GUIDE&CFID=437183&CFTOKEN=10292806 (Accessed: 25 January 2008).
Havenstein, H (2008) Video games poised to boost corporate training. Available at: http://www.computerworld.com/action/article.do?command=viewArticleBasic&articleId=9113861&intsrc=hm_list (Accessed: 29 August 2008).
Jastrow, R and Podhoretz, N (2000) Two faces of reality, the Georrge Marshall Institute. Available at: http://www,marshall.org/pdf/materials/60.pdf (Accessed: 21 December 2007).
Karakasiliotis, A, Furnell, S.M and Papadaki, M (2007) Advances in Network & Communication Engineering. 4th edn: University of Plymouth.
King, B (2002) 'Security?, We've Heard of It', Silicon.com [Online]. Available at: http://software.silicon.com/security/0,39024888,11032629,00.htm?r=57 (Accessed: 18 January 2008).
Kumaraguru, P, Rhee, Y, Acquisti, A and Cranor, L, F, Hong, J & Hong, E (2007) Protecting People from Phishing: The Design and Evaluation of an Embedded Training Email System. Institute for Software Research: Carnegie Mellon University.
Mitnick, K and Simon, W (2002) The Art of Deception: Controlling the human element of security: Wiley Publishing Inc.
Paller, A (2007) 'For Questions : Allan Paller', SANS Institute [Online]. Available at: http://www.tippingpoint.com/pdf/press/2007/SANSTop20-2007_112707.pdf (Accessed: 22 November 2007).
Shneiderman, B (1997) Designing the User Interface. 3rd edn.: Addison Wesley.
Wood, P (2007) 'Social Engineering', Social Engineering [Online]. Available at: http://www.fbtechies.co.uk/Content/News/PeteSpeak.shtml (Accessed: 20 November 2007).

Advances in Networks, Computing and Communications 6
152
An Assessment of Security Advisory Websites
J.Thomas and S.M.Furnell
Centre for Information Security and Network Research, University of Plymouth, Plymouth, United Kingdom
e-mail: [email protected]
Abstract
Home users have been an interesting target for the hackers as home computers are always more vulnerable and less protected with the security software’s. Home users feel that security is not necessary to be maintained and is not their duty to maintain it. But at the same time home users do online banking and shopping and store valuable information in their systems which are very precious for the hackers, as they can earn money by selling it to third party. The research was carried out to assess the online security websites that the end-users normally access in getting help and also the online banking websites which the home users normally use for their daily purposes. The research found out that many websites did not prove to be useful as they ought to be. The websites were being developed in a way which the end-users normally, most of them who falls in the novice users would find it difficult. At the same time websites like Microsoft provided with a good structure of the contents thereby dividing into subsections for the better use of the end-users such that they could select what they want. But there was also some problems with the websites because there was much content in the websites, which may sometimes trouble users who are visiting the websites for the first time. Most of the websites just provided links to some other websites for assessing the security, but did not mention anything much about the software and it’s functioning. The websites were just pointing to some common threats, thereby not giving any examples of how to deal with the problems apart from just mentioning the names. Many of the websites did not show any information about the last updates they made on the website there by leaving the users in a confused state of mind. Most websites did not mention the latest threats apart from Microsoft which releases patches and updates for all its products. The research also provided some safety tips for the end-users when connected to the internet.
Keywords
Antivirus, Spywares, malwares, online Security websites, online banking, phishing
1 Introduction
The low cost of communication over the internet has made people to use it for maximum purpose, whether it may be sending mail, shopping or banking. The reliability has changed everybody to make use of it. The websites has been one of the main targets for the hackers; the main noticeable thing is that the common websites are being targeted where users spent much of their time when connected to the internet. The websites are being targeted to get the personal information’s very easily by sending Phishing mails or some links which might contain some adware or Spyware which might work without the knowledge of the user if the link is clicked.

Section 1 – Network Systems Engineering
153
Most of the websites are interlinked to each other such that it makes easy for the hackers to get the information quickly. According to report published by the
Symantec it states that threats are sky rocketing and in 2007 there was around 711,912 threats as compared to the 125,243 in 2006. So it clearly states that the threats are not going to come down. The reason for this threats increasing is because most of the people are not concerned about the Security. People just open all the e-mails and post everything on the computer with using correct security software’s like anti-virus, anti Spyware and e-mail filters being enabled.
2 A Report on Different Attacking Trends
Symantec reports that Microsoft Internet Explorer is the most widely affected web browser because of its dominance all over the world. During the first half of 2006 it states that Microsoft was attacked with 47% against 20% Mozila Firefox, 31% having multiple browsers and just 2% with Netscape navigator. It also found out that home users were the most targeted sector when compared to other sectors with 86% as that of 96% before, though there was reduction it does not mean that there is no threat to the home users. The ISP providers were also attacked with 38% affecting them with the denial of service attack. In the windows exposure which means that there are some loop holes in the operating systems. It was Mozila which had the largest number of vulnerabilities when compared to other web browsers even though it was not that popular as that of Microsoft Internet Explorer.
3 Assessment of online Security Website
3.1 Introduction
When talking about the online security websites some names that come into our mind is the Viruses, Trojan horses, Spyware, Adware and Phishing that make the users always vulnerable. While each one of them had there own functions but in general it could be categorized as some software that is used to track the user’s habits of browsing and gain unauthorized information from the user. When people use online websites, they use for many purposes, like banking, shopping, downloading music or movies by paying them online by having some membership in some websites. When using the Internet it is necessary that it should keep it updated with all security software and firewalls being enabled.
3.2 Methodology and Analysis
In the methodology the researcher is going to find out what are the resources available for the End users from the security websites which claim to provide help for the end-users from protecting them from all sorts of attacks. The researcher before choosing the methodology went through the Google search engine in determine the evaluating the websites that provide online security for the End-users. So while going through the search engines different varieties of online security websites came in the search and from there the researcher chose some websites for assessment depending on the founders and sponsors of the website. Since most of the

Advances in Networks, Computing and Communications 6
154
websites chosen were supported by Governments, Microsoft, Internet Industry Corporation and National cyber security Alliance. The other reason for choosing these websites were because of its popularity like Microsoft which is famous for it’s regular updates and patches. Also while going through different web pages the researcher found some of websites being mentioned and recommended for security, so based on all the above factors the researcher found that the selected websites would be having many new updates and it would be more useful than the other websites since they can be trusted about the contents in the websites, since all of them are widely accepted and standard.
In the second case the researcher used most of the popular bank websites which people uses more for their daily banking needs and based upon their outreach in the country. So the researcher chose almost majority of the banks that provide online banking to the customers. So once the websites have been chosen the researcher tried to analyse how to assess the selected websites and after evaluating the websites the researcher came to some points that could be used.
In the analysis the researcher is going to assess some websites based on some factors that provide the some valuable information to the user. They are as follows:
Based on latest online threats Based on methods to troubleshoot the online threats Based on providing users with the information to keep updated Based on the software’s for protecting the system and the information Based upon examples given in the website Based upon checking the websites that provide online self assessment in
their websites than rather other websites.
A. Staysafeonline
So based on the above mentioned factors it was noticed that many of the websites did not provide the users with the required details when they encountered problems. They just mentioned some names of the software but did not explained how to configure it or where to find the resources that was needed to update the system. The website was not arranged in a simple manner, finding the resources was very difficult, everything was complex for the user. The website provided with many online scans but did not mention about the version they are using.
B. Getsafeonline The website when compared to Staysafeonline was much better because it was arranged in an appropriate manner; everything was arranged in a perfect manner which allows the users to get what they want. So there was no difficulty in accessing the resources. The website had a clear description about all that is being provided and it would be helpful for the novice users for they can understand about everything that is being posted on the website.

Section 1 – Network Systems Engineering
155
C. Microsoft Microsoft is one of the best websites which provide the users with what they need, the website is always updated with latest threats and the vulnerabilities being displayed on the website whereby making the user to know exactly what is happening in the internet world. The website has been divided into different sections whereby enabling user to select what they want, it has security and update section together such that no user will miss anything, on clicking the respectful link it will take the user on that particular website. It also has a page where it is possible to have the problems solved if they are mailed to them, they also provide online help.
But at the same time there is also one disadvantage that is the webpage consists of much information and it would not be easy for everyone to get the desired information even though everything is there. It would be difficult for the novice users. So it is very necessary to think it in a way that would make every body self sufficient. The websites can do is, they can create a feedback form such that the designers could get a clear understanding of the problems that users face.
4 Assessment of online banking website
Online banking websites are now one of the major websites the hacker’s attacks, due to the amount of the information they possess with them. The banks claim to have many security options being developed but the fact is that still there are some loopholes which the hackers find out in claiming the information’s they want. One form of success for the hackers is the Phishing where by many users pass their vital information to third parties not knowing that they are giving away which might cause much problem afterwards. The HSBC bank offers an individual webpage for security, the website offers many of the most common problems being faced by the users, but the information is in sufficient for the end users because they are not given a complete description of the problems and how to rectify it. It is not necessary that all the users of the online banking system be an expert user of computer, because even expert users are being fooled by the cyber criminals. The bank claims to use some extra protection like EV-CERTS which means extended validation SSL certificate, whereas at the webpage they claim that even though they provide with security, it does not mean that it is secure, when users sees it they are confused. On the other hand Lloyds bank claims that they have some in built features which enable the security of the users like automatic log off if the webpage is idle for sometime or if more numbers of incorrect entries are being made. This is something good when compared to other banks even though some other banks also provide the same features, each bank has own there own way of security. Banks like Barclays they provide a new mechanism called PIN SENTRY which gives the users a card reader and they have to insert their card onto the reader and it displays and eight digit number which has to be entered while using online, the fact is good but if the user’s system is not updated then some software can find out their key strokes, but what the bank claims is that every time the user enters the card it

Advances in Networks, Computing and Communications 6
156
creates random numbers thereby making hackers unable to track the number, but also there is another problem what if they get hold of the card reader such that they can make duplicate cards. So security is never going to be an complete factor.
5 User awareness and usability of security
People now a days use computer in all their daily activities, it is quite noticing that people use internet more for browsing and sending e-mail, shopping and banking which all stands above the 60%. So it shows people’s interests in the internet. But the case is that most people do not use much of the security that is being provided to them and also this is causing much trouble to the end-users. A research survey (Furnell et al, 2007) had been conducted for the home users and around 415, responded to the survey and it was very interesting to find out many facts about the security awareness that home users possess. From the survey it found that people had problems in all the above mentioned five points, on the security related terms the respondents mentioned that they knew almost about every terms, the only term that they did not know was the term Phishing. But the factor is that how much of the mentioned terms has been clearly understood by the home users, is it that they had just heard the name or whether they have faced some problems is not known. So it depends upon the user’s knowledge in the field of security and if working in the IT field, then it would be good to know that what they say is correct. Home users always depend on their assumptions rather than finding out the fact. When based on security software awareness, majority of them claim to say that they know about the security softwares but it is also noticing that many do not understand about the security software’s in real which could also be an problem why the users get problems. Majority of the users claim that they know well about the web browsers because they normally quite often use that. When taken into consideration about the software’s it was those softwares which the people normally use like the office programs, e-mail programs like the outlook and above all the operating systems. One of the great reasons for mentioning this is because users they do not feel that it is the responsibility of them to understand them. Even though people are being given with the available resources that are for the better management of security many people do not offer to make use of that. Around four websites had been selected and this websites are developed to provide security help for the users, the websites are Getsafeonline, itsafe, internetsecurityzone and the BBC website. From the survey it was found that people heard of the BBC website much more than the other three and also visited the website and found it useful in their quest for solutions to the problem. What was noticed is that people visit websites that are much popular and because of that only they visited the BBC website. So the researcher found that the other websites which was also designed for security reasons being avoided by the home users. Based on the factors of reporting problems it was not sure which way to go for the end-users, so it was more vulnerable than the previous conditions leaving the system at a higher state of risks , this shows that people do not know how to maintain security and they are not worried about safeguarding it. What the users did was that they tried to solve by themselves and the remaining people went to government

Section 1 – Network Systems Engineering
157
agencies, some to IT professionals and some to their ISP providers. This shows that they are neither interested in security or they find it as their responsibility to report it. The problems that prevented from using the security could be the following reasons:
1. The user thinks that it is not their responsibility 2. The user feels that the security issues are of not great concern for them. 3. It might be because of lack of time that they do not keep an eye on the security
of the system. 4. Security softwares would be much expensive 5. The users not knowing how to use the security products. 6. They might not know how to keep secure the computers which is because they
do not know about the threats or they do not understand about the threats that they come through.
Given the above points it is much sure that users feel trouble in understanding the problem and getting the correct help they need. So where is the fault that happened because of which the users were not able to keep their systems safe. The problem lies with the designers of the websites whereby confusing them in selecting the desired link and get to the help. In general the websites should have the following four foundations such that to make the users use the resources available to them. 1. Understandable
The security descriptions should be given with much responsibility and they should be intended for all types of user, the helps should be written in simple language which makes it easy for the novices who are not familiar with the technical words.
2. Locatable
The contents on the webpage must be divided into subsections that might make the users easy to find out what they want, because if it is designed in a complex way then it would bring much trouble to the users and they would leave the website without accessing it making it not useful for any body. People nowqdays do not spent much time on spending with security matters searching long time.
3. Visible
Most of security configurations are hidden, one has to go to the security page and configure each setting which many users may find it very difficult. Security options should be known to the user and there should be some alerts if the security has not been configured, then only the users will know which security has been applied and would know the level of protection they have.
4. Convenient
On the other hand the most important thing is to make sure that everything is convenient, in the sense the security options should not be displayed openly such that others could know and make use of the loopholes if the program is being displayed openly. Security packages are costly for some of the users at the same time some

Advances in Networks, Computing and Communications 6
158
users do not know how to configure because there is not much information given about the configuration of the softwares which will also lead in people discarding the software.
All the websites should be developed in such a way thereby making the users knowing sure where they have to go. The websites should be designed in a simple manner with simple language and perfect arrangement for the users, when developing the websites they should also provide some feedback form for the users to take part, such that the developers would know the user attitudes. According to an Symantec global internet security threat report, it reveals many of the factors that are happening in the computing world. Some of the findings are as follows- it states that United States accounted for 31% of the malicious activity, which is an increase from 30 percent which was in the first half of 2007. The United States was also the top country in terms of origin of attacks. The education sector was accounted at 24% of data breaches which could lead to identity theft. Government sector accounted for the top sector in revealing the identities outside without the user’s knowledge. Bank accounts were the most commonly advertised item for sale without the customer’s knowledge. The other thing noticed was that there was also theft of computer and information’s on other data storage devices, this all shows that the security is at a very bad stage whereas even though the security is not considered as a top priority by the many organisations that should have kept the data safe
6 Conclusions
What the researcher would recommend will be that the safeguarding of the data should be the responsibility of both employer and the employee whatever be the organization. The interesting thing is that even though after providing with much information about the threats the users face problem, and are still ignorant about the security. The people should be made to sign some agreements before using the online services in the bank.
There must be rules for the home users as well and also for the ISP providers, they should make sure that the network is safe and also should create awareness from the children to the old people about the latest threats, educational institutions should must teach the students by showing of the threats and ways in which they can be targeted. Home users should be encouraged to use legitimate softwares such that they get good softwares and updates. There is tremendous work to be done on the basis of security, because the developments in the technology are very fast but safeguarding principles lack. The users of computer should be made to read the rules and regulations before working with the computer.
7 References
Barclays Online banking website (2008) , http://www.barclays.com/. (Accessed 28 August 2008)
Furnell, S. M., Bryant, P. and Phippen, A. D. (2007) “Assessing the security perceptions of internet users”, computers & Security vol 26(5): Pages 410-417

Section 1 – Network Systems Engineering
159
Furnell, S.M., Jusoh, A. and Katsabas, D. (2006) “The challenges of understanding and using security: A survey of End-Users”, computers & Security vol. 25(1): Pages 27-35.
Getsafeonline website (2008), http://www.getsafeonline.org/ . (Accessed 29 August 2008) HSBC Online banking website (2008) , http://www.hsbc.co.uk/1/2/ .(Accessed 28 August 2008)
LloydsOnline Banking website (2008), http://www.lloydstsb.com/. (Accessed 28 August 2008
Microsoft website (2008),http://www.microsoft.com/en/us/default.aspx. (Accessed 29 August 2008)
Staysafeonline website (2008), http://www.staysafeonline.org/. (Accessed 28 August 2008)
Symantec (2006), Symantec Internet Security Threat report: Trends for January 2006- June 2006.vol .10 http://www.symantec.com/specprog/threatreport/ent-whitepaper_symantec_ internet_security_threat_report_x_09_2006.en-us.pdf (Accessed 27 August 2008)
Symantec (2008), Symantec Global Internet Security Report: Trends for july 2007- December 2007. Vol.13. http://eval.symantec.com/mktginfo/enterprise/white_papers/b-whitepaper_ internet_security_threat_report_xiii_04-2008.en-us.pdf (Accessed 28August 2008)
Symantec (2008), Symantec Report: Attacks increasingly target trusted web sites. http://www.symantec.com/business/resources/articles/article.jsp?aid=20080513_sym_report_attacks_increasingly (Accessed 29 August 2008)

Advances in Networks, Computing and Communications 6
160
Response of Software Vendors to Vulnerabilities
G.Erebor and M.Papadaki
Centre for Information Security and Network Research, University of Plymouth, Plymouth, United Kingdom
e‐mail: [email protected]
Abstract
Software Security has remained a predominant issue with the most experienced defeat in the area of common exploits on holes and flaws left unknowingly on software called “Vulnerability”. This term as it refers- acts on vulnerable software of which one of the intended solution is a “Patch” released by Vendors for correcting any discovered vulnerability. Due to the consistent increase in vulnerability statistics by security organisations, it is assumed that vendors do not release patch on time and if at all, the patch ends up causing more harm than good. In view of this, Statistical analysis has been carried out on nine different vendors with the most used products, which shows that apart from the fact that vulnerabilities doubles up each year, some vendors have very high vulnerability rate compared to others, because they have larger number of product with more general usage than others, thereby exposing them to more attack. Also, it is discovered that not all vendors have in place a security approach to vulnerability process. However, some vendors with these standards in place uses it to slow down the process of patching due to the long phases involved. Furthermore, despite the number of vulnerability patched, exploit is still on the rise because most patched get faulty, complex or sometimes not even available, thereby exposing the exploitable holes to more attack. As such, this work will give end-users, administrators and organisations some recommendation to safeguard them from immediate exploit, although these will only be temporal precautionary measures. In conclusion, vendors are trying their best, but it does not seem good enough, as some are still more profit motivated than security alertness, neglecting the fact that the world greatest asset lies in their hands.
Keywords
Vulnerability, patch, un-patched, flaw, attack, exploit, vendor, security and software
1 Introduction
The rate of software security breaches has been increasing significantly. The main reason for this increase is security vulnerabilities in software. Hackers exploit software flaws to cause serious damage to firms, including blocking system resources to authorized users, modifying and corrupting sensitive information, and launching attacks on other organizations from victim systems. The sophistication of attack tools and the interconnected nature of the Internet enable hackers to exploit vulnerabilities on a large scale within a short time. And the availability of these tools on the Internet eliminates the need for specialized knowledge and expertise to exploit vulnerabilities, making even novice users capable of launching attacks on vulnerable systems. In view of this, analysis recorded by the Symantec Internet Security Threat

Section 1 – Network Systems Engineering
161
Report (2006) documented 2,249 new vulnerabilities in the first half of the year, which is an upshot of 18% over the 1,912 vulnerabilities that were documented by the second half of 2005. It is also a 20% increase over the 1,874 vulnerabilities reported in the last half of 2005.
Furthermore, the National vulnerability database statistics (CVE 2006) documents a total of 6,600 general software flaws, which is a super rise compared to their statistics of 4,912 vulnerabilities for the year 2005.
An interesting overview of the much damage caused by these attack can be extensively viewed through the 8 years incident report recorded by the CERT/CC (Computer Emergence Response Team/Coordination centre) from 2000 – 2007 below:
Year 2000 2001 2002 2003 2004 2005 2006 1Q-3Q, 2007
Vulnerabilities 1,090 2,437 4,129 3,784 3,780 5,990 8,064 5,568
Table 1: CERT/CC Vulnerability Report (CERT/CC, 2007)
Comparing the three statistics above shows that on the average vulnerability doubles up each year. This is quite an alarming issue as the increase in vulnerability attack is causing a very devastating problem to the national security, which is gradually affecting the world economy.
Does this mean that the words of (Paulk et al 1994: Arora, Caulkins, Telang 2004)....’many believe that software vendors typically follow the policy of ‘sell today and fix tomorrow’: or ‘I’d rather have it wrong than have it late”…) is true or should itr be concluded that vendors are trying their best but vulnerabilities are just inevitable?
A key aspect of fighting this inevitable attack is to secure a timely and reliable patching of vulnerabilities by vendors. Patching can be viewed as an after product support and a very important part of every software life cycle. However, while vendors commit so much to release timely, high quality products (Arora et al 2006), patching becomes an under-appreciated and under-investigated aspect of the overall software security and quality (Arora, Caulkins, Telang 2005). Since the emergence of various disclosure organizations such as Symantec, CERT/CC, National Vulnerability Database, and Secunia amongst many, patching vulnerability has gained more prominence as a result of the public disclosure of these vulnerabilities.
Once vulnerability is found by a third party and made known to the vendors, they are expected to release a patch and disclose the vulnerability information along side as timely as possible. But with the controversy in various disclosure policies, some advocate immediate full disclosure of information about vulnerabilities once discovered, i.e. post vulnerability to public and mailing lists such as Bugtraq, secunia and (http://archives.neohapsis.com/), while others decline and argue for limiting disclosure only to users at greatest risk, and release full disclosure details to everyone after a delay, giving the vendors time to come up with a patch (Doyle, 2005). Further more, a 30 days recommendation was made by the (OIS) Organisation for Internet

Advances in Networks, Computing and Communications 6
162
Safety (http://www.oisafety.org/guidelines/secresp.htm), as the number of days between vulnerability discovery and patch release, Telang and Wattal (2005).
Come to think of it, the delay intends to allow a quick fix to the problem by developing, releasing and applying patches but unfortunately this same delay increases the risk of those with no access to the disclosure full details (Takanen et al, 2002).
Some recent academic work is examining the issue more formally. (Arora, Telang and Xu, 2004) developed a model on timing of vulnerability disclosure and how full and immediate disclosure can force vendors to release patches more quickly. Has this controversial issue solved the problem? If not, then our aim should be on how fast a patch could be released to everyone as soon as vulnerability is discovered regardless of any standing disclosure policy.
With this aim in mind, some recent form of commercial vulnerability disclosure came up with an idea of the zero day patching. A typical example is the Zero day emergency response team (ZERT). They work with several internet security operations with liaison to antivirus and network operations communities to release a non-vendor patch when a “zero-day “ exploit appears in the open, which poses a serious risk to the public infrastructures and the internet (ZERT 2007).
Impressively, the ZERT works on averting security vulnerabilities in products before they become widely exploited. But unfortunately, waiting for a vendors-supplied patch can sometimes take ages but an off-the shelf patch from the ZERT released as a working patch before vendors’ can be of great form of defense against attackers. Yet the worrying issue lingers on, although a third party patch can serve as an interim safeguard but what happens to its suitability and compatibility test? ZERT as a small group cannot perform an in-depth testing on patches as a vendor will do. So the risk of patches working against a system comes in display here. ZERT acknowledges this fact stating “…we do not claim to be able to perform the exhaustive testing that a vendor would”….
“…please keep in mind that while ZERT tests these patches, they are NOT official patches with vendor-support and are provided as-is with no guarantee as to fitness for your particular environment, use them at your own risk or wait for a vendor-supported patch.” Zeroday Emergency Response Team (2007) http://zert.isotf.org/
In view of the ongoing rise in security exploits, our research sheds light into the various responses of vendors to software vulnerabilities. The rest of the paper is organized as follows. In the next section, the project aims are revuewed. In section 2, the vulnerability trend and analysis is presented. Section 3 focusses on the methodology involved in this analysis, with some collated sample data for a single vendor case summarized. Analyzed data and findings are presented in Section 5. Finally, the paper ends with recommendations and conclusions.

Section 1 – Network Systems Engineering
163
1.1 Project Aim
The aim of this paper is to investigate the response of vendors to software vulnerabilities. (Hunter, 2004) in his study on vulnerability referred security defeat to a blaze of fire that is inevitable and inconceivable, but when it happens acts quite reactive. He further suggested that despite its reactive way of occurrence, there are more and less intelligent ways both to tackle blazes when they occur and to minimize their impact, whether they were started deliberately or by accident. To tackle the blaze in this context – this work requires an extract of vulnerability trends from previous work, vendors site, research institutions and various security organisations to ascertain what extent is the damage done. Also, a clearer view of the main problems arising from the response of vendors to vulnerabilities with emphasis on the circumstances surrounding the release of patch – when and how a patch is released will be discovered. Further to this, a statistical analysis is required to establish the reliability and availability of patches to reported vulnerabilities. Accomplishing the statistical analysis will enable us look into the various reasons why patches provided as a solution in most cases creates more harm to the system than good.
The above aims cannot be achieved without reliable and updated vulnerability information, which were collatied from some vendors over a period of five years till date from a recognised vulnerability database.
In conclusion, it can be suggested that some possible recommendations for end-users, administrators and organisations on how to enhance their level of protection against vulnerabilities. And as for the vendors, this work will hopefully serve as a conscience test and further point out some uncovered truth about vendor’s response to patching.
2 Vulnerability Trend and Analysis
With the widespread of broadband and wireless Internet connectivity (Sullivan, 2003), software security will remain a key problem maybe for a while. A new awareness to security has been created as most households now have access to 24 hours Internet connectivity daily. Obviously, research has shown that there is a rapid growth in vulnerabilities and exposures as a result of advances in software, telecommuting and the system as a whole (David, 2007). The major new trend is a shift from the server to client applications. The research work on “laws of vulnerabilities” by Eschelbeck, 2005 shows that most vulnerabilities were in the server applications such as mail server, web server and operating system services but data now show that over 60 percent of new critical vulnerabilities are client application based such as antivirus, backup software, web browser, media player, flash and so many other tools.
Research conducted by (Symantec, 2006) also suggests that Web application vulnerabilities made up 69% of all vulnerabilities reported in 2006 and Seventy-eight percent of easily exploitable vulnerabilities affected Web applications. Whatever and however the attack, the frequency does not seem to be diminishing. Most worrying

Advances in Networks, Computing and Communications 6
164
is the shifts in the method attackers are using (Jessop, 2003). The most common attack is the ‘remote’ and ‘local’ exploit. The remote exploit works over a network and exploit security vulnerability without the need for a prior access to the vulnerable system while the ‘local’ exploit requires prior access to the vulnerable system with a sign of increase of privileges against that granted to users by the system administrator. Another form of exploit is against client applications, which is affected as a result of exploits sent to it for access by vulnerable modified servers. Also, actions such as denial of service, unauthorized data access and code execution against vulnerable systems are another set of common attacks (David, 2007).
The figures presented in table 1 from the Common Vulnerability Exposure statistics confirm the high rate of attack involving remote and local exploit. The figures increased consistently each year till date. This shows that intruders are not relenting in anyway.
Year 2007 2006 2005 2004 2003 2002 2001 2000
No of Vulns 6702 6602 4928 2456 1511 2162 1677 1020
% of Total Vulns 103% 100% 100% 100% 101% 100% 100% 100%
Table 2: Remote and local Exploits (CVE Statistics, 2007)
CVE records a vulnerability publication rate of 19 vulnerabilities a day (CVE, 2007). However, the number of vulnerabilities reported by different vulnerability databases is not consistent as they have various source of disclosure based on individual disclosure policies. And that is why a reliable and right source is needed for this work, before leading into the next phase.
3 Methodology
We took a list of vulnerability advisories on Microsoft, Apple, Sun, Novel, Oracle, Cisco, Intel, Redhat and Symantec from the Secunia vulnerability database issued within the last five years. The choice of the above vendors was based on products frequency of usage and vendors popularity. Due to the large dataset required, some form of automated script was required for a fast and accurate data collation. So it was decided to use a VBScript to upload a list of fields from the Secunia vulnerability database as shown Table 1- (Result generated on one of the vendors- Microsoft).
We have chosen the SPSS version 16.0 statistical software in analyzing the fields because of the wide variation of its analysis tools, ranging from non-parametric test such as the chi-square test, descriptive statistics, graphs and charts.
Considering the reliability and availability of patches, with respect to vendor’s response to software vulnerabilities. Table 2 shows the total advisories collated on vendors for this analysis.

Section 1 – Network Systems Engineering
165
VE
ND
OR
ID
PR
OD
UC
T I
D
PRODUCT NAME
UN
PA
TC
HE
D
AD
VIS
OR
IES
TO
TA
L
AD
VIS
OR
IES
TO
TA
L
PA
TC
HE
D
1 3593 Microsoft MN-500 1 1 0
1 21 Microsoft Windows 2000 Advanced Server 24 170 146
1 1177 Microsoft Windows 2000 Datacenter Server 18 147 129
1 1 Microsoft Windows 2000 Professional 22 161 139
1 20 Microsoft Windows 2000 Server 24 173 149
1 393 Microsoft Windows 95 3 7 4
1 12 Microsoft Windows 98 3 31 28
1 13 Microsoft Windows 98 Second Edition 3 32 29 Table 3: Sample Dataset on Microsoft Vulnerability Report
An overview of the figure in table 2 shows that Microsoft tops with a total of 3176, followed by SUN -1158, CISCO- 649, Symantec -450, Oracle-243, Novel-197, Apple-91, Redhat-75 and Intel-21. This shows that Microsoft has consistently remained the most vulnerable vendor with the highest vulnerability attack. The reason is that they have the most used product and also stands out to be one of the largest software vendors, which exposes them to more attack and exploits than other vendors. On the contrary, Intel has the lowest vulnerability from this analysis. The reason has been that they have fewer products, with less usage.
VENDORS
MIC
RO
SO
FT
AP
PL
E
SUN
NO
VE
L
OR
AC
LE
CIS
CO
INT
EL
RE
DH
AT
SYM
AN
TE
C
TOTAL ADVISORIES 3176 91 1158 197 243 649 21 75 450
Table 4: Total Advisories by Vendor
The IBM Internet security systems X-Force team released its 2007 report on cyber attacks revealing that Microsoft, Apple, Oracle, Cisco and Sun Microsystems are the top five vulnerable vendors. The report also says that 21% of the vulnerabilities disclosed by the top 5 vendors remain un-patched –up from a year ago, when only 14% of the top vendors’ vulnerabilities stayed open in the same timeframe. It is quite alarming to know but they further said that a whole 60% of vulnerabilities from all other vendors found in the first half of the year remained unaddressed (IBM, 2007). Could this be true? Further analysis is needed as to why some vulnerability are left un-patched and the reason why some vendors are more vulnerable than the others. This will enable us make an impressive contributions and clarifications were deem fit.

Advances in Networks, Computing and Communications 6
166
4 Research Analysis
4.1 Most Vulnerable Products
With the continuous increase of vulnerability, our analysis have shown that some certain products are more vulnerable and constitute enormously to the high number of reported vulnerabilities. One of such is Microsoft Office, with the most widely used email and productivity suites worldwide. Also Outlook, Word, PowerPoint, Excel, Visio, FrontPage and Access. A large number of critical flaws have been reported in MS Office applications with a few (CVE-2006-6456, CVE-2006-6561, CVE-2006-5994) zero-day issues. Interestingly, it was also discovered that Microsoft Internet Explorer, which happens to be the world's most popular web browser installed by default on every Microsoft Windows system, is the most vulnerable web browser. (Symantec, 2006) also confirmed Microsoft Internet Explorer as the most frequently targeted Web browser, accounting for 47% of all Web browser attacks. Its vulnerability is as a result of un-patched or older versions of multiple vulnerabilities that can lead to memory corruption, spoofing and execution of arbitrary scripts or code. With the most critical issues causing a remote code execution, which takes place without any user interaction once a malicious web page or email, is read. Also recently, a lot hundreds of vulnerabilities in ActiveX controls installed by Microsoft and other software vendors have contributed to the high number of reported vulnerabilities (Kristenson, 2003). These are also being exploited via Internet Explorer advisories all year round CVE-2006-4697, CVE-2007-0024, CVE-2007-0217 and CVE-2007-0218.
Considering the Open-source systems, web applications such as Linux, Sun Microsystems and Novell accounts for almost half the total number of vulnerabilities discovered. The most common instances are the common widely exploit that converts trusted web sites into malicious servers serving client-side exploits and phishing scams. Media Players for major platforms such as Linux and Apple have these vulnerabilities that can often be used to install malware such as viruses, bot-net applications, root kits, spy-ware, and ad-ware. This understanding as shown that vulnerability exists in both open-source and proprietary software.
4.2 Patch and Un-patched Vulnerabilities
The statistics of patched and un-patched vulnerability shown in figure 1 shows that despite vendor’s effort to mitigate vulnerability, there still exist some un-patched vulnerabilities. The question is why are these vulnerabilities still left un-patched? It was observed that most vulnerability remained un-patched because the vulnerability severity level is low and a test by vendor has shown that there cannot be an exploit. In most cases such as the OS X vulnerability in 2004, the fix sometime fails because no easy solution can be found. In some occasions, an overlap between useful applications and malicious ones does not allow vendors release a fix without removing useful features from its operating system or the existing application, which they usually avoid doing.

Section 1 – Network Systems Engineering
167
Figure 1: Graphical representation of Unpatched Vulnerabilities by Vendor (Secunia, 2007)
We further observed that Patches sometimes break the service they are supposed to repair, introduce changes that break compatibility and interoperability, add new and unwanted features, introduce new vulnerabilities, re-introduce old vulnerabilities or, in some cases, fail to repair the original vulnerability, thereby causing more harm than good. It was also realised that some patches are multiple, duplicated, complicated or even sometimes are not available. All of these are the key factors that constitute to why most vulnerability remains un-patched.
5 Conclusions
Vulnerability is a problem that has been and will remain possible for a while. However, this work evolves around vulnerability mitigation, which is patching. Patching should be taken serious by both vendors and end-users. Although implementing viable security measures in developing software should be the first safeguard to vulnerabilities.
After a careful study, it is realised that the number of un-patched vulnerabilities can be further reduced if more vendors would implement a standard security approach to vulnerability mitigation process and in doing this take into consideration the time this process takes. In view of this, it can also recommend that administrators, end-users and organisations enhance their level of protection against exploit by frequently using the following tools: Vulnerability Scanner, Firewall, Anti-virus, configuration management systems, package management systems and most importantly, frequent patching of all software is required. Although, most of the recommendations does not serve as a total way of eliminating vulnerabilities but they could at least safeguard end-users from a common exploit that could have been prevented by just imploring any of the discussed tools.
Finally, more work is required in researching into the response of vendors to vulnerabilities by considering the first day vulnerability was discovered to the exact time a patch was made available. This will enable a proper analysis on exactly how long it takes vendors to release a patch. Also more technical improvement in

Advances in Networks, Computing and Communications 6
168
automated patching tools, particularly in improving patch availability and patching process is required. It is hoped that this paper has placed things in its context, creating an insight to a further study.
6 References
Arora, A.; Telang, R. and Xu, H. (2004). “Optimal Policy for Software Vulnerability Disclosure”. In Workshop on Economics and Information Security. Available: http://www.dtc.umn.edu/weis2004/xu.pdf [Accessed, Jan 2007]
Arora, A; Krishnan, R; Nandkumar, A; Telang, R and Yang, Y. (2004). ”Impact of Vulnerability Disclosure and Patch Availability - An Empirical Analysis” In Third Annual Workshop on Economics and Information Security WEIS04. Available: http://www.dtc.umn.edu/weis2004/weis-arora.pdf [Accessed, Jan 2007]
Doyle, E. (2005). “Disclosure — time to ask the users” Computer Fraud & Security, Volume 2005, Issue 4, April 2005, Page 4. [Accessed, June 2007]
David, J. (2007). “New Threats Bring New Treatments”, Network Security, Volume 2004, Issue 9, September 2004, Pages 12-15 [Accessed, May 2007]
Eschelbeck, G. (2005). “The Laws of Vulnerabilities: Six Axioms for Understanding Risk”, Available: http://www.qualys.com/docs/laws_of_vulnerabilities.pdf [Accessed, July 2007]
Hunter, P. (2004). “Integrated Security and Network Management Remain Elusive” Network Security, Volume 2004, Issue 6, June 2004, Pages 15-16, [Accessed, February 2007]
Jessop, J. (2003). “Is your Current Security SECURE? Cryptic Software” Network Security, Volume 2003, Issue 4, April 2003, Page 3. [Accessed, February 2007]
Symantec, (2005). “Statistic of reported vulnerability comparing 2005 and 2006” Available: http://eval.symantec.com/mktginfo/enterprise/white_papers/ent-whitepaper_symantec_ internet_security_threat_report_x_09_2006.en-us.pdf [Accessed, Jan 2007]
Sullivan, P. (2003). “Vulnerability analysis — what is important and what is not” Network Security, Volume 2003, Issue 10, October 2003, Pages 17-19. [Accessed, May 2007]
Takanen, A. Raasakka, P. Laakso, M. and Roning, J. (2002). “Agents of Responsibility In Software Vulnerability Processes” vol. 6, no. 2, pp. 93-110, June 2004. [Accessed, March 2007].
White, D. (2006). “Limiting Vulnerability Exposure Through Effective Patch Management”, Available: http://www.netsecurity.org/dl/articles/Dominic_White-Patch_Management.pdf [Accessed, February 2007]

Section 2 – Information Systems Security & Web Technologies and Security
169
Section 2
Information Systems Security
&
Web Technologies and Security

Advances in Networks, Computing and Communications 6
170

Section 2 – Information Systems Security & Web Technologies and Security
171
Information Security Leakage: A Forensic Analysis of USB Storage Disks
A.Adam and N.L.Clarke
Centre for Information Security and Network Research, University of Plymouth, Plymouth, United Kingdom
e‐mail: [email protected]
Abstract
Mobile devices have become immensely popular and people are now frequently storing sensitive data on them. The cheap, handy and small USB Storage Disks are endorsed by people to carry, transfer and backup data. Unfortunately, the users of such devices are not fully aware of the importance to protect their data and how to securely wipe them prior to selling them second-hand. For this project, ten USB keys have been bought on an auction website. Then they have been forensically imaged, analysed and the amount of data has been classified according to its sensitivity. Six out of ten of the keys contained sensitive data such as names, addresses, invoices and health records. The sensitivity of the information retrieved and the potential threats they could have lead to seem to indicate that it is of importance to educate users about how to best protect their data.
Keywords
Information Leakage, Data Breach, Computer Forensic, Evidence Recovery, USB Storage Disks
1 Introduction
The reality and importance of the data leakage problem has been highlighted by several surveys. According to a study made by the company PGP (2007) on the cost of data breaches, the primary cause of a data breach is at 49% lost laptops and other mobile devices including USB storage disks. Due to their small size and their price regularly decreasing, USB keys are a device likely to be easily lost or stolen. Thus, the UK Ministry of Defence recently admitted that a hundred of their USB storage disks have been lost or stolen since 2004; devices that sometimes contained secret information (BBC, 2008). If those devices can be stolen or acquired following a loss, they can as well be freely bought second-hand for a small amount of money, generally between £1 and £10. Some academic studies (Jones et al., 2005) have highlighted the fact that people did not erase properly their data prior to disposing of their hard disk drives. If people have not taken the habit to erase securely their HDD, it can be wondered if the other computer devices they sell second-hand can become a source of data leakage due to a lack of secure erasing.
This project’s objectives were three in number: to investigate whether it is possible to retrieve data from USB storage disks bought second-hand, to try to evaluate the

Advances in Networks, Computing and Communications 6
172
sensitivity of the retrieved data and finally to understand the consequences of a possible disclosure of the restored data.
The second section of this paper will give some background literature. Academic research projects and studies done by companies specialised in security will be detailed in this section. The third section will focus on the methodology that has been built for the project. In the fourth section, the results obtained during the examination of the keys following the steps described in the methodology will be detailed. A discussion on these results will be given in the fifth section of the paper. Among other topic, the discussion will focus on the threats the data retrieved during the keys’ examination could have lead to. The sixth and final section will conclude this paper and give some thoughts about possible future work.
2 Background literature
In this section on the background literature, four studies will be described. Two of them were conducted by academic researchers while the two others were leaded by companies specialised in security. Most of these studies have been focusing on analysing data leakage coming from hard disk drives sold second-hand. However two of them pushed their study a little further towards mobile devices by analysing laptops and flash memory devices.
The University of Glamorgan in association with the Australian University Edith Cowan conducted a study (Jones et al., 2005) whose purpose was to determine whether hard disk drives sold second hand were efficiently wiped prior to their selling. After having bought a hundred HDD from Australia, Germany, North America and the UK, those were imaged using either EnCase Forensic or Linux based Knoppix software prior to be examined. The examination of the disks was done in two steps. They firstly determined the presence of data, and then, they tried to find data likely to tie the disk either to an individual or to a company. Following their investigation, 57% of the disks revealed to which company they belonged and 53% contained one or more identifiable usernames.
The Canadian University of Ottawa conducted a similar study (El Emam et al., 2007) buying 60 hard disk drives coming from several Canadian vendors. However their interest was in a particular kind of data: private health information. To recover the files on the drives bought second-hand, the researchers used the commercial software program “Recover my files”. Results showed that data could be retrieved from 67% of the disks among which 26 disks contained the address of their owner. Concerning their domain of interest, they found out that 18% of the disks contained private health information.
For the first part of their study on data leakage, Pointsec Mobile Technologies (Ahlberg, 2004) bought a hundred hard drives and laptops from auction websites and public auctions. They conducted a study similar to the two previously detailed, leading to the finding of data on seven disks out of ten. The second part of their study was a slightly different approach of the data leakage problem and concerned the lifecycle of a lost laptop. They followed the steps through which a lost laptop is going when forgotten in public places such as London airports. Unclaimed laptops

Section 2 – Information Systems Security & Web Technologies and Security
173
are sold in auctions where potential buyers have the possibility to have a look at it prior to buying it. Their study highlights that this way it is easy for ill-intentioned people to evaluate how they could use the remnant data of those devices.
The German security company O&O Software conducted several times a study (Kehrer, 2007) on second-hand hard disk drives leakages. However, the new part of the last edition of this study was that they also considered memory cards, cameras and USB sticks. 115 storage media were bought via online auctions coming both from Germany and from the USA. If 32 devices were securely deleted, 72.2% of the other disks presented recoverable data. Among the data found, a lot of pictures were available and other sensitive data that used to be backed up on the storage devices that were examined.
3 Methodology
At the beginning of this project it has been decided that a clear methodology was mandatory prior to taking any attempt at analysing the keys. Effectively, the data handled during the investigation are electronic evidence which require an appropriate care in order not to compromise them. Therefore, the ACPO Guidelines (Association of Chief Police Officers, 2003) describing data collection and evidence recovery have been used to build the following methodology. The process starts with the collection procedure. During this step, it has been decided to buy the second hand devices via the auction website eBay and to examine the keys with the help of the forensic software EnCase. Once the keys have been ordered and received, a number has been assigned to each of them and they were gathered with the packages they came with. The second phase is the examination procedure during which forensic images of each of the keys were produced. Electronic evidences can be easily corrupted; as a result there is a need not to work on the initial data but on an exact copy of it (Feldman, 2005). The images are named after the number assigned to the key it comes from and MD5 hashes are produced to ensure the integrity of the data (Scientific Working Group on Digital Evidence, 2006). The third step is the analysis procedure. During this step, several techniques have been used. Firstly, the information given by the key and its package were collected. Then a time analysis was performed to determine when the key was used. Given the relatively small size of a USB storage disk, a file-by-file analysis could be performed, opening and reading all the files that were not too damaged. Finally, keyword searches were used. This powerful technique allowed by EnCase generally lead quickly to an owner name. The last step of the evidence recovery is the reporting procedure during which reports on the keys were produced (Ashcroft et al., 2004).
4 Results
A set of ten USB storage disks has been bought for this experiment via the auction website eBay whose storage capacity distribution can be seen on Table 1. Given the storage capacity of the key bought for this project, it can be seen that the investigation has been conducted on a total capacity of 8,192 Mb of data.

Advances in Networks, Computing and Communications 6
174
Storage Capacity 128 Mb 256 Mb 512 Mb 1 Gb 2 Gb Number of keys 1 2 1 5 1
Table 1 - Storage Capacity Distribution
However, all the keys did not contain data. As a result, the useful devices for the study were quickly narrowed to eight because two of them did not present any data. Likewise, two other keys have been considered useless for the purpose of the project which is to evaluate the amount of sensitive data presented by the bought devices. The reason why those two other keys could not be exploited is that they were filled with impersonal data such as movie and music files preventing the investigator to retrieve sensitive data on them. The remaining six USB storage disks all presented either personal or private data. The presence or absence of data on the keys and its sensitivity degree is given in Table 2.
Private Data Personal Data Not sensitive No Data
KEY-01
KEY-02
KEY-03
KEY-04
KEY-05
KEY-06
KEY-07
KEY-08
KEY-09
KEY-10
Table 2 - Data presence on the USB storage disks
It has been decided that sensitive data would be split in two different categories. The first one is “personal” data; in this category, the data allowing identifying the owner of a key will be considered. However, this type of data is often given away by the user and do not constitute the most sensitive data. Along the investigation several examples of personal data were found such as:
Names Addresses Email addresses
Phone numbers Links to personal websites Education and work experiences
The second category of data is more likely to cause harm in case of a disclosure: it is “private” data. During the investigation, this type of data has been including:

Section 2 – Information Systems Security & Web Technologies and Security
175
Photos Date of birth Invoices Nationality Credentials
Network configurations Software serial numbers Health records Bank and credit card details Client and account numbers
Considering the eight keys returning data after the investigation, more than four thousand files could be retrieved by the forensic software. However, due to the damaged nature of many of those files, only a few of them could be entirely restored. Nevertheless, the possibility of retrieving the files allowed the investigator to consider what sort of files the owners of the USB storage disks were used to store. Thus, it has been found that pictures were the most commonly stored files on those disks, followed by multimedia files (music and video files for instance). The following categories, nearly equivalent in number, are software and document files. The rest of the results on the nature of the files retrieved on the keys can be seen on Figure 1.
Figure 1 - Nature of the files retrieved on the keys
During the examination of the keys, three of them happened to contain a very large amount of sensitive data. Details on those three keys can be found in this section of this paper.
Data retrieved on Key-02 included the owner’s contact details: full name, an email and two postal addresses, his phone number. In addition, what the owner looks like could be determined thanks to photos stored on the keys and entitled with “me” or with his name. Private documents have been restored from the key such as a couple of invoices and a request to obtain a domain name on the Internet. Apart from finding his contact details, those documents allowed the investigator to obtain the owner’s signature and serial numbers of software bought on the Internet. Credentials to access a YouTube account were also stored on the key, unencrypted. The most worrying finding was to discover that the owner of this key kept a lot of files giving details on his network. Not only was the kind of network hardware used by the

Advances in Networks, Computing and Communications 6
176
owner described on the key but also the configurations of this network were available. Thus, unencrypted IP and MAC addresses, credentials to access the router and a WEP key were found. To finish, the key conducted to two personal website owned by the owner, one of them describing his work activity and the other, a weblog giving a lot of details about his life.
The majority of the personal details found on the owner of Key-06 came from remnant parts of his Curriculum Vitae stored on the device. Effectively, his full name, a permanent postal address, four other postal addresses with the corresponding phone numbers, an email address and education and work information were found. In addition more private information was also revealed such as his date of birth, his marital status and his nationality. Unprotected documents also contained credit card numbers and details on a bank account belonging to the owner of this key. If this owner did keep information on him, the analysis revealed that he possessed a large amount of sensitive information on other people. As a result, databases of students applying for the College where the owner worked were found on the key. Among the information contained in this database, names, addresses, phone numbers and sometimes even passport numbers belonging to the students were available.
Used as a backup device by its user, key-08 revealed the owner’s most important files. As a result personal information found included a full name, a current postal address and ten previous ones, mobile and phone numbers, an email address and information on work and education. The owner’s medical history could be found on the storage disk including his doctor’s contact details, his daily medication and his latest hospital admissions. The owner of the key also stored letters he wrote to a number of creditors on which account numbers and client references are specified. Backup files from the web browser Firefox allowed the investigator to access stored credentials of about forty online accounts such as Paypal, eBay and The Carphone Warehouse. To finish, the key conducted to two personal websites created by the owner, the credentials to access the ftp hosting one of the website were found on the device.
5 Discussion
Compared to other research about data leakage, this study has been focusing on the involvement of USB storage drives alone. Studying USB keys often means that no operating system will be available. As a matter of fact, there is less chances to find traces of information automatically recorded by the operating system without the knowledge of the user. For instance, temporary internet files could lead to information a user would not want to disclose but which is automatically kept by the OS. On the contrary, on a USB stick, usually only files and directories are available and in addition the user of the key is likely to have chosen to write the files on his/her device. As a result, if the key is used to transfer music files it will not contain sensitive data. However, when it is used to carry work files or as a backup tape, it is possible that sensitive data can be retrieved.
Threats the data could have lead to have been investigated. Depending on the nature and amount of the data retrieved on each device, the previous owners of the second-

Section 2 – Information Systems Security & Web Technologies and Security
177
hand USB keys could have faced three different threats: identity theft, fraud and hacking attacks.
Four of the ten keys, presenting an important amount of sensitive data, could have lead to an identity theft scenario. Among them, the three of the keys detailed in the previous section could have been a target for ID theft. In addition to their owner’s contact details; Key-02 revealed the signature of its owner, information that could have been useful to falsify documents more easily while impersonating the identity of the owner of this key; Key-06 provided its owner’s full profile from his identity to his hobbies passing by his educational and work experience due to stored CVs; Key-08 contained its owner’s National Insurance Number and his date of birth information that criminals look for to perform an Identity theft. The large amount of data on four of the keys among the ten bought could also have lead to fraud scenario. Effectively, Key-06 and Key-08 contained banking details that could have allowed a criminal to perform a banking fraud. The owner of Key-06 stored credit cards numbers and a bank account details. The owner of Key-08 made a back up of a software program he used to access his online banking account that would have provided a criminal the necessary credentials to access the accounts. Finally, the owners of two of the keys could have faced a hacking attack. The details on both the hardware and the configurations the owner of key-02 used would have facilitated a hacking attack of his home network; moreover, the details given on his modem router could have incited somebody to misuse his Internet access. The owner of key-08 would have allowed a criminal to access forty of his online accounts by storing files containing his credentials that could be easily decrypted.
To finish, it is of importance to highlight that, according to the results of this investigation, too few people seems aware that formatting their device or erasing the files will not result in a secure wiping of all their data. If the data found during the investigation had been bought by ill-intentioned people they could have been misused and the repercussions could have been serious for the previous owners of those devices. If the Operating System often gives to understand that formatting a USB storage disk will erase ALL data contained by the device, it should be stressed that a lot of the data the owner thought he had wiped are still available when using forensic tools to recover it as it has been proven in this investigation.
6 Conclusion and future work
Evidences of the problem of data leakage have been found in the news, surveys and research. Given some recent data breach incidents, even the UK government decided to take countermeasures about this phenomenon (House of Commons, 2007). In this problem, some sources seem to indicate that mobile devices are a major vector of information leakage. Among those mobile devices, this project has been focusing on handy, cheap and immensely popular USB storage disks. From the ten USB keys bought second-hand on an auction website for this study, six of them revealed who their previous owners were, providing at least their first and last names. As a result, the risk of leakage appeared to be real and its importance needed to be investigated. Therefore the risks, the owners of the USB disks could have faced, have been considered, depending on the amount and nature of both personal and private data provided by the keys. Alarmingly, the data could have been misused in a number of

Advances in Networks, Computing and Communications 6
178
fraud, hacking or ID theft scenarios. Such results seem to point out that it is of importance to carry on educating the users of computer hardware, raise their awareness on how important their sensitive data can be and how to protect them.
Among the possibilities of future work concerning this research, it has been thought that the set of keys could be extended. Effectively, the study has been considering ten keys which can be considered as a limited number. Conducting this study again or buying additional devices could allow the investigators to confirm the results or to extend the findings. For instance, instead of having USB keys belonging to individuals, it can be expected that USB storage disks belonging to companies could be found. USB storage disks being not the only flash devices, it could be envisaged to extend the study to other mobile devices such as flash cards and mp3 players.
7 References
Ahlberg, M. (2004) ‘The lifecycle of a lost laptop’ info4security [Online] Available: http://www.info4security.com/story.asp?storyCode=3047857§ioncode=10 [Accessed 25 January 2008]
Ashcroft, J., Daniels, D. J. and Hart, S. V. (2004) 'Forensic Examination of Digital Evidence: A Guide for Law Enforcement' National Institute Justice
Association of Chief Police Officers (ACPO) and National Hi-Tech Crime Unit (NHTCU) (2003) ‘Good Practice Guide for Computer based Electronic Evidence’ Version 3.0 [Online] Available: www.acpo.police.uk/asp/policies/Data/gpg_computer_based_evidence_v3.pdf [Accessed 25 March 2008]
BBC (2008) ‘MoD admits loss of secret files’ [Online] Available: http://news.bbc.co.uk/1/hi/uk/7514281.stm [Accessed 30 July 2008]
El Emam, K., Neri, E. and Jonker, E. (2007) ‘An Evaluation of Personal Health Information Remnants in Second-Hand Personal Computer Disk Drives’ Journal of Medical Internet Research 9(3):e24 [Online] Available: http://www.jmir.org/2007/3/e24 [Accessed 25 January 2008]
Feldman, J.E. (2005) 'Ten Steps to Successful Computer-Based Discovery' Computer Forensics Inc.
House of Commons (2007) ‘Justice – First Report’ Justice Committee Publications [Online] Available: www.publications.parliament.uk/pa/cm200708/cmselect/cmjust/154/15402.htm [Accessed 3 May 2008]
Jones, A., Mee, V., Meyler, C. and Gooch, J. (2005) ‘Analysis of Data Recovered from Computer Disks released for Resale by Organisations’ Journal of Information Warfare 4(2):45-53
Kehrer, O. (2007) ‘Data Data Everywhere’ O&O Software GmbH, Berlin
PGP (2007) ‘Annual Study: Cost of a Data Breach’ [Online] Available: http://download.pgp.com/pdfs/Ponemon_COB-2007_US_071127_F.pdf [Accessed 25 January 2008]
Scientific Working Group on Digital Evidence (2006) 'Data Integrity within Computer Forensics'

Section 2 – Information Systems Security & Web Technologies and Security
179
Digital Watermarking with Side Information
I.Al-Houshi and M.A.Ambroze
School of Computing, Communications and Electronics, University of Plymouth
Abstract
The intent of this research is to improve the efficiency of digital watermarking techniques through applying side information principles in them, and to build an application for digital watermarking trying to prove that side information techniques are sufficient (theoretically) to defeat the noise caused by cover objects, then to prove that result practically through experiments by applying image samples to the developed application, to increase the ability to detect the hidden messages.
Keywords
Digital Watermarking, Side Information, Cover Object, Encoding, Embedding, Detection, Informed, Blind, Orthogonal Keys, Effectiveness, Robustness, Fidelity.
1 Introduction and motivations
The increasing of interest in digital watermarking is most likely due to the increasing of concern and interest in copyright protection and content authentication, verification, and tracking. The growing of Internet and the increasing of its usability make it excellent system for distributing digital media; Internet system is inexpensive and instant method to support digital media access, on the other hand, the risk of piracy is increasing with the growing of internet services and systems. Cryptographic techniques and principles are very efficient method to maintain secure transmission in addition to provide security for distributed messages and media before the decryption step, thus it will be easy to illegally distribute digital media soon after decrypting it. This limitation of cryptography explains the strong need for an alternative solutions and techniques which can protect the contents even after decrypting them. Digital watermarking has the ability to maintain the security during normal usage, decryption, encryption, or even compression and file format changes due to the fact that digital watermarking techniques place information within the content of digital media, this information is dependent to the content and sometimes, its existence is hidden as well (Lu, 2005).
Watermarking is using general standards and principles of communication systems such as noise averaging, spread spectrum communications, in addition to message encoding and embedding. Most of these principles and techniques ignore the fact that the noise caused by the cover work is known to the sender/encoder (Petrovic et al., 2004), so it is more efficient to exploit this information to defeat the noise caused by the cover work. Techniques and algorithms which neglect the information about the noise caused by the cover work decrease the effectiveness of watermarking (effectiveness is one of the main properties should be considered when designing

Advances in Networks, Computing and Communications 6
180
watermarking algorithms, and it is related to the probability of immediate detection after embedding step (Muharemagic et al., 2001)). This project is to investigate the background of spread spectrum communication techniques to improve these techniques by designing a system able to use the knowledge and information obtained from the original cover work, this process called side information techniques (Ambroze, 2007).
This research starts from building theoretical background about the main digital watermarking techniques in addition to the properties of these techniques which should be considered in the assessment of digital watermarking applications, covering the weaknesses of assumptions leaded to the algorithms and techniques of simple digital watermarking, then presenting side information theoretical approaches and principles as a better solution to address and solve the problems related to the assumptions done in these techniques and algorithms; Most of these principles and techniques were gathered from latest resources and articles published in the field of digital watermarking in general and side information techniques in particular. The second step is to design and draw the road map of building the tools and resources for running the experiments; this includes choosing the framework of programming, explaining the flow charts of our algorithms and application. The follower part of this research is reviewing the findings and results obtained from applying the developed techniques, in addition to comparing the results obtained from simple watermarking techniques with the results obtained from side information techniques before and after applying some attacks to these techniques to check similarities and differences between theory and application. Finally, this research is going to result in many conclusions about the achieved points of this project, in addition to presenting some recommendations and assumptions for the proposed future work.
2 Theoretical analysis
This section is to start by discussing the spatial domain approaches which are the core and most important case in watermarking systems (since they are used in both spatial and frequency domain techniques), then it is to move to cover the frequency domain issues taking in consideration the benefits and results obtained from spatial domain discussion.
The first technique to present is Least Significant Bit (LSB) Technique, where the message bits are included directly to the cover object without serious modification, for example, it is easy to add one bit message to one byte cover object without significant modification, so, human eye will not be able to distinguish and notice the differences between the watermarked object and cover object itself (this preserves the fidelity property of watermarking, in addition to 100% of effectiveness), this technique is using side information principles as it applies the changes only to the least significant parts of the cover object. The problem in this technique is the fact that this technique is not capable to resist any type of attacks or noise (Petrovic et al., 2004).
The second approach in spatial domain is based on correlation function and embedding weight principles (considering c0 as the cover object, wr as watermarking

Section 2 – Information Systems Security & Web Technologies and Security
181
key, wm as the encoded message pattern, α as the weight of embedded pattern, wa as the weighted embedded pattern). Using the latest considerations:
(1)
(2)
(3)
cw is the watermarked object, in this approach, the weight of embedded pattern should be static, moreover, cover object is considered to have Gaussian distribution in the frequency domain so the correlation between watermarking key and cover object could be neglected (correlation function properties) so:
(4)
The previous formula shows that a decision of having hidden might be taken when having correlation value (between watermarked object and watermarking key) greater (in absolute value) than the size of watermarking key multiplied by the embedding weight. This is the core principles of first approach which neglects any information about cover object, this assumption led to lower effectiveness and fidelity values.
The third approach benefits from cover object information so no approximations were considered in formula (4), in this case, side information about the cover object is used to determine the value of adaptive embedding weight (Cox et al., 2002):
(5)
Where τ is the threshold or detection value (the decision of having hidden bits within the watermarked object is taken according this value). Adaptive embedding weight technique does not increase the ability of watermark to resist attacks and noise; on the other hand it increases the fidelity (SNR) of watermarked object in addition to having 100% effectiveness (Eggers et al., 2002).
The other proposed solution in this research to increase the fidelity of watermarked object is to use orthogonal keys set, then to apply one key from this set according to its correlation value with the cover object (choosing the key which maintain the highest value to result in the minimum embedding weight). In this research, Hadamard orthogonal keys algorithm was applied to generate the needed orthogonal keys (Bella et al., 2005).
All of previous techniques do not take in consideration the robustness/security property of watermarking, so moving to frequency domain is a better approach to solve noise/attacks problem due to the fact that most of attacks and noise types have special characteristics in frequency domain rather than spatial domain (DCT is one of frequency domain techniques). Applying spatial domain techniques to mid-

Advances in Networks, Computing and Communications 6
182
frequencies band samples limits the effect of high frequencies attack (such as edge removal attacks), and maintain the quality of watermarked object since this technique is not using low frequencies samples (human eye is sensitive to low frequencies changes) (Cummins et al., 2004).
Finally, this research is to apply integrated solution benefits from all previous techniques and principles to prove that many improvements could be achieved in digital watermarking techniques by integrating one or more of digital watermarking techniques which are using side information.
3 Implementing the algorithms
Previously mentioned algorithms and techniques were implemented using MATLAB framework, gray scale images were considered as cover objects, where black/white images were considered as messages. The flowcharts of implemented algorithms are presented in this section as an explanation of the performed work. This research developed the code produced by (Shoemaker, 2002) to comply with the improvements of proposed approaches.
3.1 LSB
Figure 1: LSB technique flowchart (Sender/Receiver)

Section 2 – Information Systems Security & Web Technologies and Security
183
3.2 Static embedding weight
Figure 2: Static embedding weight technique (Sender/Receiver)
3.3 Hadamard orthogonal keys generator
Figure 3: Hadamard orthogonal keys generator algorithm
3.4 Adaptive embedding weight
The flowchart of this technique is the same as static embedding weight technique, taking in consideration that embedding weight should be calculated according to the proposed threshold before embedding the message in the cover object.

Advances in Networks, Computing and Communications 6
184
3.5 DCT
Figure 4: DCT technique (Sender/Receiver)
4 Experimental results and discussion
Cover Object Watermarked object After applying Gaussian
Noise
After applying Salt
Pepper Noise After applying
smoothing filter
Figure 5: Example of applied LSB technique (Attacks/Noise)
The same samples were applied to all techniques in order to maintain the same conditions for all experiments. In these experiments cover object file was gray scale image (the size of cover object samples is 1600x1200 pixels), while the message file considered to be black and white image file (the size of message was 93x33 pixels where every pixel in these message is only 1 bit). As expected from the theoretical

Section 2 – Information Systems Security & Web Technologies and Security
185
part, applying LSB as digital watermarking technique was efficient according to the high values of fidelity (SNR~47.9 dB), effectiveness properties, while the probability of retrieving message bits after applying different types of attacks and noise was very low (53.5% when applying Gaussian noise, 49.5% when applying smoothing filter).
Static embedding weight is not better than LSB, since higher embedding weight maintains the effectiveness of watermarking while it decreases the fidelity of watermarked image, and lower embedding weight maintains the fidelity of watermarked image but it decreases the effectiveness of watermarking (when applying embedding weight=1, the results were SNR~44.9 dB, security~65.3% when applying Gaussian noise, and security~52.7% when applying smoothing filter)
Cover Object Watermarked object After applying Gaussian
Noise
After applying Salt Pepper Noise
After applying smoothing filter
Figure 6: Example of applied static EWT (weight=1)
Adaptive embedding weight is a special case of static embedding weight technique, when the weight is adaptive to comply with the properties of cover object; adaptive EWT moves the samples of cover objects from the un-watermarked space to detectable watermarking space, to make sure that all watermarked samples can be detected (there are few errors related to the round-off and truncating errors). Adaptive EWT increases the value of effectiveness and security properties for the same signal to noise ratio or fidelity property value, this technique is making sure of applying static EWT in more efficient approach benefiting from the side information about the cover object (when applying threshold=0.1, the results were SNR~45 dB, security~79% when applying Gaussian noise, and security~61.8% when applying smoothing filter)

Advances in Networks, Computing and Communications 6
186
Cover Object Watermarked object After applying Gaussian
Noise
After applying Salt
Pepper Noise After applying
smoothing filter
Figure 7: Example of applied Adaptive EWT (threshold=0.1)
DCT technique is using side information of cover object in frequency domains; by applying DCT in mid-frequencies band, high-frequencies band attacks will be defeated, in addition to increasing the fidelity of watermarked objects due to the fact that human eye is more sensitive to low frequency modifications. The results obtained from applying DCT using static EWT (embedding weight=1) were (SNR~56.3 dB, security~50.3% when applying Gaussian noise, and security~87.7% when applying smoothing filter).
Cover Object Watermarked object After applying Gaussian
Noise
After applying Salt
Pepper Noise After applying
smoothing filter
Figure 8: Example of applied DCT using SEWT (weight=1)

Section 2 – Information Systems Security & Web Technologies and Security
187
In the last experiment, DCT were applied using adaptive embedding weight technique (to increase effectiveness and fidelity) in addition to Hadamard orthogonal keys (to increase fidelity as well). The results obtained from this integrated technique was not surprising comparing them to theoretical principles which were applied in this integrated solution. This technique increases the fidelity and effectiveness (AEWT and Hadamard) and increases the security property value (DCT). For example, when applying this technique using 16 orthogonal keys and threshold=0.1 the results were (SNR~64 dB, security~80.1% when applying Gaussian noise, security~88.1% when applying smoothing filter, in addition to effectiveness~99.8%).
Cover Object Watermarked object After applying Gaussian
Noise
After applying Salt Pepper Noise
After applying smoothing filter
Figure 9: Example of applied DCT using AEWT and Hadamard (threshold=0.1)
5 Conclusion
Watermarking Technique Pros Cons
LSB Simple, 100% effectiveness,
reasonable fidelity (SNR) Unable to resist noise and
other types of attacks
Static EWT Simple, more secure than
LSB
Less than 100% effectiveness, fidelity is
related to EW Adaptive EWT (Side
Information) ~100% effectiveness,
reasonable fidelity, secure More complicated than
SEWT
Hadamard (Side Information) Better fidelity, ~100%
effectiveness More complicated than
SEWT
DCT (Side Information) Better fidelity, high
effectiveness, more secure complicated
Integrated Technique (Side Information)
~100% effectiveness, higher fidelity value, as secure as
DCT
The most complicated technique
Table 1: Pros and Cons of applied digital watermarking techniques

Advances in Networks, Computing and Communications 6
188
Using Side Information techniques is very efficient solution to benefit from the gathered information about the cover object. This is the best way to converse from the optimum principle proposed by (Costa, 1983) who made an assumption that blind detectors could perform as efficient as informed detectors. This project developed an integrated technique through maximizing digital watermarking properties to converse from the optimum solution, so, further improvements could be performed by applying further techniques and principles, and researches.
Table 1 shows the techniques implemented and tested in this research in addition to the pros and cons of each technique.
6 Future work
There are many points to be considered in future work, the first point is related to taking more properties in consideration when testing the performance of digital watermarking techniques (such as data payload property which is the size of message could be hidden in the cover object), the second point is applying other types of attacks to check the ability of watermarking techniques to resist them (such as synchronization attacks). The last point is to errors in retrieved message, further error analysis should be considered in addition to apply some types of error correction code to improve the security of digital watermarking.
7 References
Ambroze, M. A. (2007). Project Proposal for MSc Information Systems Security. University of Plymouth.
Bella, T.; Olshevsky, V.; Sakhnovich, L. (2005). Equivalence of Hadamard matrices and Pseudo-Noise Matrices. New York: IEEE Publications.
Costa, M. (1983). Writing on Dirty Paper. IEEE Transactions on Information Theory (pp. 439-441). New York, USA: IEEE.
Edin Muharemagic, B. F. (2001). Multimedia Security: Watermarking Techniques. Florida, USA: Florida Atlantic University.
Ingemar J. Cox, M. L. (2002). Digital Watermarking. London, UK: Morgan Kaufmann.
Joachim J. and Eggers, R. B. (2002). DigitalWatermarking facing Attacks by Amplitude Scaling and Additive White Noise. ITG Conference on Source and Channel Coding. Berlin, Germany: ITG Conference on Source and Channel Coding.
Jonathan Cummins, P. D. (2004). STeganography and Digital Watermarking. Arizona, USA: Arizona State University.
Lu, C.-S. (2005). Multimedia Security: Steganography and Digital Watermarking Techniques for Protection of Intellectual Property. London, UK: IDEA Group Inc.
Rade Petrovic, B. T. (2004). Digital Watermarking Security Considerations. San Diego, USA: The University of San Diego.

Section 2 – Information Systems Security & Web Technologies and Security
189
Shoemaker, C. (2002). Hidden Bits: A Survey of Techniques for Digital Watermarking. Independent Study.

Advances in Networks, Computing and Communications 6
190
Smartphone Deployment of Keystroke Analysis
A.Buchoux and N.L.Clarke
Centre for Information Security and Network Research, University of Plymouth, Plymouth, United Kingdom
e-mail: [email protected]
Abstract
The current security on mobile phones is often limited to the Personal Identification Number (PIN) which is a secret-knowledge technique. Studies highlighted the drawbacks of such a method. The technologies on such devices are likely to evolve fast. As an example, a lot of handsets enable online banking or shopping nowadays, which can involve the storage or processing of sensitive data. The security on such devices should be effective to prevent impostors to use them. This study proposes an enhanced technique for authentication on Smartphone using keystroke analysis. Results of a practical evaluation are presented based upon the entry of a password which can be either number or character-based. The findings reveal the technique employed is not yet ready to be deployed on the market as the performance rates are relatively poor. However, it suggests that this biometric technique could be utilised on a mobile device as the processing requirements of the algorithms used are low. Furthermore, this study collected the participants’ thoughts and reactions about the system which were interesting to discuss.
Keywords
Keystroke analysis, authentication, biometrics, Smartphone, mobile devices
1 Introduction
Mobile devices and more specifically Smartphone are allowing access to a large variety of services. Users can now pay products directly on their devices, visit web pages or consult their bank account. Along with this services enhancement, handsets have built-in technologies that allow faster access to the network, larger storage space and multimedia functions. Such services generate sensitive information with for instance bank account details, passwords or other private information. Moreover, the storage space growth enables users to store more and more data on their handsets; this information could be in danger if no good security measures were applied. The current sales of Smartphone are rising according to Gartner (Pettey, 2008) with a sales growth of 29.3 percent in the first quarter of 2008 compared to the same period last year. If no adequate authentication security is enabled on them, it could reveal a high number of potential unsecured devices on the market. Therefore, a lot of personal data – and maybe professional data, as this type of handset is popular among companies’ employees – could be in danger.
The current and most common mobile phone security system is the Personal Identification Number (PIN). Such a system is based upon a secret-knowledge approach and relies on the user to ensure the device’s security. Effectively, the PIN

Section 2 – Information Systems Security & Web Technologies and Security
191
needs to be kept secret in order to be efficient; if an impostor discovers it, she/he can be authenticated successfully and for instance read potentially sensitive information. A mobile handset with the PIN security enabled can be considered more secured than a handset with no security at all. However, a survey conducted by Pointsec Mobile Technologies (2005) revealed that a third of surveyed people did not use a PIN. Moreover, Clarke and Furnell (2005) also found out that approximately a third of people did not use the PIN security. It means that a lot of users’ devices are not protected. If it was stolen or lost, the handset services would be usable by anyone and the data could be misused.
As knowledge-based methods might not be appropriate to protect mobile devices, other types of authentication should be worth looking at. Among the different techniques, three means are to be detailed (Wood, 1977). The first one is to use something the user knows to authenticate. The PIN is embedded into this category, as well as the password. The second category uses something the user has such as a token. Finally, the third category utilises something the user is. The latest is the one that interests the authors. This category is commonly known as biometrics and it exploits the user’s characteristics. Moreover, two types of biometrics can be distinguished based upon the features it uses: physiological biometrics that identify a user based on the parts of her/his body; behavioural biometrics that use the way a user is (Jain et al., 2004). Keystroke analysis is a type of behavioural biometrics as it authenticates a user based upon her/his typing pattern. A major difference between those two techniques is that a physiological trait is likely to remain quite stable, whilst a behavioural characteristic is likely to vary if the environment or the user changes. Furthermore, all current keystroke analysis studies on mobile platforms relied upon a network-based method; this project seeks to deploy a standalone authentication technique on a Smartphone. Therefore, the pattern classification algorithms will be executed on the device and not on a remote server.
This paper begins with section 2, describing background literature which helps to provide general information about biometrics, the pattern classification process and keystroke analysis. Then, the methodology is detailing the steps of the study from the software implementation to its evaluation. The results are presented in the fourth section. These include the processing requirements, the classifiers performance and the questionnaire results. The following section discusses these results and to finish a conclusion sums up the main findings and the potential future research.
2 Background literature
Biometrics can be used as a mean to identify people. Each technique has its own characteristics, and its own performance rate. Several rates can be utilised to choose a biometric technique. There are three common terms that are the False Acceptance Rate (FAR), the False Rejection Rate (FRR) and the Equal Error Rate (EER). The FAR measures the rate at which an impostor is able to authenticate. The FRR describes the rate to which a genuine user is not able to be authenticated. The EER is the rate when the previous two values cross and is often used as a way to compare biometric techniques.

Advances in Networks, Computing and Communications 6
192
Keystroke analysis is one of the numerous biometrics. It aims at identifying a user based upon her/his typing pattern. It is a fairly promising technique on Smartphone, because the cost of the implementation is reduced by the fact that the only hardware required – the keypad or keyboard – is already available on the device. Among the different inputs the user provides, the system usually collects two different features: key press and key release times. These values are then assembled into digraphs, trigraphs or more. The difference between those is the number of keys considered; a digraph is the features of two keys while a trigraph is the features for three keys. Based upon these values, the system will then calculate some other features. They are commonly known as the hold-time which is the difference between a key release and a key press, and the inter-keystroke latency which is the time between two consecutive keystrokes. The latter is considered as the most discriminative of the user’s behaviour. Moreover, there are two types of keystroke analysis. The first one is static analysis and is based upon static text. It is relatively suited to authentication and the password will be considered as the static text. The second type is dynamic analysis and is related to the entry of free text (Bergadano, 2003). With the latter, the user’s samples can be captured in the background which enhances the convenience. However, it makes the process more difficult to achieve in practice especially because more user samples are required (Dowland and Furnell, 2004). The enrolment takes more time therefore the device security is not ensured during this long process.
Study FAR (%) FRR (%) EER (%) Anagun (2002) 4.6 1.2 N.A. Bergadano et al. (2003) 5.36 0 N.A.
Cho et al. (2000) 0 19.5 N.A.
Clarke and Furnell (2007a) N.A. N.A. 13
Clarke and Furnell (2007b) N.A. N.A. 4.9
Clarke et al. (2003) 11.7 10.9 11.3
Guven and Sogukpinar (2003) 1 10.7 N.A.
Monrose and Rubin (1997) N.A. 9.3 N.A.
Table 1 - Neural network studies performance rates
There are a lot of studies that evaluated keystroke analysis. However, only a few of them considered its application to mobile devices (Clarke et al., 2003; Clarke and Furnell, 2007a; Clarke and Furnell, 2007b). Therefore, other studies assessing keystroke analysis on PC-based environments are to be considered. It seems that a lot of studies assessing both static and dynamic keystroke analysis found out that dynamic analysis was less likely to achieve good error rates compared to static analysis (Monrose and Rubin, 1997; Clarke and Furnell, 2007a; Clarke and Furnell, 2007b). Moreover, a lot of differences can be shown considering the pattern recognition algorithms. Effectively, their choice is very important as it will decide the performance rates of the solution. The majors classifiers are either statistical, Bayesian or neural networks. Generally, the results for statistical algorithms are not suitable for use on a real device: Monrose and Rubin (1997) achieved 9.3 percent FRR, Bergadano et al. (2003) achieved 5.36 percent FAR at zero FRR and Guven and Sogukpinar (2003) revealed 1 percent FAR at 10.7 percent FRR. However, neural networks seem to be interesting as it can be seen in Table . The feed forward

Section 2 – Information Systems Security & Web Technologies and Security
193
multi-layered perceptron (FF MLP) with backpropagation neural network is especially chosen by studies (Cho et al., 2000; Anagun, 2002; Clarke et al., 2003; Clarke and Furnell, 2007a; Clarke and Furnell, 2007b). The results might suggest that this classifier is usable in real conditions on mobile devices. However, neural networks are known to require a lot of processing power which might be a problem on mobile devices.
3 Methodology
This study seeks to implement keystroke analysis on a Smartphone. Therefore, a software program has to be implemented. The programming language is Visual Basic .NET and uses the Microsoft .NET Compact Framework 2.0. This framework is quite handy as it supports several programming languages and mobile operating systems. Therefore, a unique program will be able to run on Microsoft Windows Mobile 5 or 6. The software program is divided into two different forms: one for enrolment and one for authentication. Two types of password were proposed which were a simple PIN or a strong alphanumeric password. The password textboxes in these forms capture key events and the inter-keystroke latencies are saved on the handset. Moreover, three classifiers are evaluated based upon prior results; the Euclidean distance, the Mahalanobis distance and the FF MLP neural network. The first two algorithms are statistical-based methods which are likely to have low processing requirements, which is important on a mobile platform such as a Smartphone. The neural network technique is more likely to have high processing requirements, but its performance rates are usually better.
Figure 1 - Evaluation handset: SPV C600
A group of twenty people evaluated the software. In one session, they were asked to enrol by entering twenty times their password and authenticate ten times (see forms on Figure 2). A SPV C600 Smartphone running Microsoft Windows Mobile 5 was used (see Figure ). It has a 195 MHz TI OMAP850 processor and 64 Mb of RAM. The enrolment and authentication samples were saved for further calculation of performance rates. Then, they filled a questionnaire assessing their general use of mobile devices, their biometrics knowledge and the software usability. Some of the key questions were concerning the enrolment process, the authentication process, the ease of use or some critics they wanted to formulate.

Advances in Networks, Computing and Communications 6
194
Figure 2 - Software program forms
4 Results
The study and the evaluation revealed the feasibility of keystroke analysis on a Smartphone environment. Effectively, such devices are limited in processing capacity. Therefore, the processing requirements of classifiers should be as low as possible. The two statistical techniques were not a problem as the enrolment was done in less than two seconds, with no reliance upon the number of samples or password-length. The enrolment process length for such classifiers should be reduced to the time taken to enter the password samples. However the neural network showed, as expected, high processing requirements. Its characteristics were minimal due to the processing time: ten neurons in the hidden layer and a hundred training iterations. The enrolment took three minutes and a half for twenty samples and a ten keystrokes length password. The authentication took approximately five seconds.
The different classifiers performances were assessed for random threshold values. Figure 3 shows the performance rates for the Mahalanobis algorithm. The Euclidean classifier performance rates are described in Figure 4.
Figure 3 - Mahalanobis performance graph

Section 2 – Information Systems Security & Web Technologies and Security
195
Figure 4 - Euclidean performance graph
The second section of the evaluation, the questionnaire, exposed the participants’ thoughts about their knowledge and software usability. First of all, they answered to general questions about their mobile device use. Seven out of 20 participants do not use any security measure on their handset and fifteen users think that their device information is sensitive. Two participants used both PIN and password techniques which explains the total number of answers which is greater than 20. Moreover, five out of the seven participants who did not use any security feature think their information is sensitive. Then, they assessed the study software program usability. 19 users think that the software is easy to use and half of them found the enrolment time consuming. One user thought that the enrolment was both time consuming and easy to go through. The participants justified the length of the process by the number of samples that needed to be entered. Effectively, they estimated that 20 samples were too much to enter and were quickly bothered by the repetitive task. The other half of the users found out that the enrolment was easy to go through. Overall, 18 participants would use the solution if available and all of them thought it would provide more security.
5 Discussion
The system seems to be time consuming, especially for enrolment as pointed out by half of the participants. The fact that enrolment only occurs one time should be taken into account. This might suggest that the method is not as time consuming when it is used a long time. However, measures could be taken to shorten its duration. Effectively, the enrolment samples number could be reduced on a user basis: the shorter the password is, the fewer samples are needed because the latency times will be more regular than with a long password. It might help to decrease the time required for enrolment. Moreover, the FF MLP neural network classifier was not convincing. It should be noted that the algorithm was perfectible and that errors might reside in it. On the other hand, the processing requirements highlights that such a technique is hardly implementable on a Smartphone. For instance, three minutes and a half for enrolment is quite long, but not extremely. It should be worth noticing that the real neural network characteristics were not applied: the network should be between 100 and 500 neurons in the hidden layer and between 1 000 and 10 000 iterations. Even if only the number of iterations was changed to a thousand, it should extend the enrolment time by ten times; therefore the enrolment would approximately take thirty-five minutes. It seems impossible to lock out the user for

Advances in Networks, Computing and Communications 6
196
such a time. Even if run in background mode, the process/thread priority should be reduced in order to keep the Smartphone running smoothly, which would increase this theoretical enrolment time. That is why neural network seems hardly achievable on a mobile device, while the statistical classifiers run very well on such a handset. However, their performance rates are not good enough to be run on a real device. The processing requirements might be not as restrictive on more recent devices as on the SPV C600 device which is quite old today. Some strong programming techniques should be used when implementing a neural network classifier on a mobile platform to reduce its processing requirements as much as possible.
The participants’ comments gave a clearer view on their mobile use. Therefore, the fact that seven of them do not use any security measure is quite alarming. That is to say approximately two thirds of them do not protect their data. However, five of those seven participants think their information is sensitive. It might suggest that the current security measures are not suited to their need, or that they do not want to bother with security even if they know it is dangerous for their data. The reasons they did not protect their device was either because it was time consuming or too difficult to use. Therefore, the fact that half of them thought enrolment was time consuming should restrain them from using this security technique. That was not the case as 18 of them would use it and all of them thought it provided more security. Overall, it seems encouraging that they are willing to use new security solutions. Moreover, the fact that they think their information is sensitive – even for those not using security solutions – is interesting: they know that they should pay more attention to their data. Therefore, it could be said that their security awareness is good but that the current security techniques put in place are not suited to their needs or abilities.
6 Conclusion and future work
This study showed that keystroke analysis should be implementable on a mobile handset. The statistical classifiers demonstrated low processing requirements and can be used on a real device. On the other hand, the performance rates were not usable in practice. A far more promising technique, neural networks, was requiring too much processing power for such a platform. However the technique is promising and the participants’ comments were rather encouraging. Therefore, they are seeking for other security settings on their mobile phones and would like new authentication techniques. Even if they suggested that this method was time consuming at enrolment, they wish they could use it on their handset. Overall, it could suggest that new approaches should be worth investigating in the authentication field.
This study highlighted several restrictions. For instance, the biometrics samples were not encrypted, which might increase the risk for identity theft. Privacy should be ensured by using cryptography when storing those samples. Then, it could be worth trying to integrate the solution to the Microsoft Windows Mobile security architecture. Effectively, the software program of this study was a standalone application. The security architecture of Windows Mobile provides what is called the Local Authentication SubSystem (LASS) which helps programmers to integrate their authentication systems to the environment. Moreover, this study focused on Microsoft mobile environments and it should be interesting to investigate other

Section 2 – Information Systems Security & Web Technologies and Security
197
systems such as BlackBerry or Symbian. Finally, a neural network might be implemented with care to the processing requirements.
7 References
Anagun, A.S. (2002) ‘Designing A Neural Network Based Computer Access Security System: Keystroke Dynamics and/or Voice Patterns’ International Journal of Smart Engineering System Design, 4 (2): 125-132.
Bergadano, F., Gunetti, D., and Picardi, C. (2003) ‘Identity verification through dynamic keystroke analysis’, Intelligent Data Analysis, 7(5): 469-496.
Check Point Software Technologies LTD. (2005) ‘IT Professionals Turn Blind Eye to Mobile Security as Survey Reveals Sloppy Handheld Habits’, Check Point Software Technologies, [online] Available HTTP: http://www.checkpoint.com/press/pointsec/2005/11-18.html [accessed 20 July 2008].
Cho, S., Han, C., Han, D.H. and Kim, H.I. (2000) ‘Web-Based Keystroke Dynamics Identity Verification Using Neural Network’ Journal of Organizational Computing and Electronic Commerce, 10 (4): 295-307.
Clarke, N.L, Furnell, S.M., Lines, B.M., and Reynolds, P.L. (2003) ‘Keystroke dynamics on a mobile handset: a feasibility study’, Information Management & Computer Security, 11 (4): 161-166.
Clarke, N.L., and Furnell, S.M. (2005) ‘Authentication of users on mobile telephones – A survey of attitudes and practices’, Computers & Security, 24 (7): 519-527.
Clarke, N. L. and Furnell, S.M. (2007a) ‘Advanced user authentication for mobile devices’ Computers & Security, 26 (2): 109-119.
Clarke, N. L. and Furnell, S.M. (2007b) ‘Authenticating mobile phone users using keystroke analysis’ International Journal of Information Security, 6 (1): 1-14.
Dowland, P. S. and Furnell, S.M. (2004) ‘A Long-Term Trial of Keystroke Profiling Using Digraph, Trigraph and Keyword Latencies’, in: Security and Protection in Information Processing Systems, Springer, Boston: 275-289.
Guven, A. and Sogukpinar, I. (2003) ‘Understanding users’ keystroke patterns for computer access security’ Computers & Security, 22 (8): 695-706.
Jain, A.K., Ross, A., and Prabhakar, S. (2004) ‘An Introduction to Biometric Recognition’, IEEE Transactions on Circuits and Systems for Video Technology, 14 (1): 4-20.
Monrose, F. and Rubin, A. (1997) ‘Authentication via Keystroke Dynamics’ Proceedings of the ACM Conference on Computer and Communications Security, ACM, New York: 48-56.
Pettey, C. (2008) ‘Gartner Says Worldwide Smartphone Sales Grew 29 Percent in First Quarter of 2008’, Gartner, [online] Available HTTP:
http://www.gartner.com/it/page.jsp?id=688116 [accessed 20 July 2008].
Wood, H.M. (1977) ‘The use of passwords for controlled access to computer resources’, National Bureau of Standards, Special Publication 500-9.

Advances in Networks, Computing and Communications 6
198
Information Revelation and Computer-Mediated Communication in Online Social Networks
R.J.Davey and A.D.Phippen
Centre for Information Security and Network Research, University of Plymouth, Plymouth, United Kingdom
e‐mail: [email protected]
Abstract
There is much information being disseminated through user profiles and communication channels on social networking websites. This publication examines user demographics, the types, and volume of information exposed through social networking profiles found in the conceptual region of Plymouth.
Keywords
Information Revelation, Social Networking, Personal Privacy
1 Introduction
Social networking websites complement established real life social patterns and as a result, have rapidly grown in popularity throughout recent years. The volume and persistent nature of user visits to such websites demonstrate the level of integration and the grasp that social networking has on the lives of its users. However, there is growing concern over the numerous potential threats afforded through the revelation of information on social networking websites. These threats pose a genuine risk and are highly publicised through high profile media channels. It is unclear as to what information is being exposed on social networking websites and the communication channels that exist within them.
In this paper, patterns of detailed information revelation and the exposure of personal information through computer-mediated communication on social networking websites within the region of Plymouth are presented. The region of Plymouth was selected since it holds local interest, and taking a narrowed geographical picture of the SN state helped differentiate this study from other similar online studies. This paper also highlights the potential for harm, explains the superficial attitudes of social network users towards personal privacy, describes the ethical issues regarding online research, and presents an analysis of the findings.
2 The Evolution of Online Social Networking
Rheingold (1993) declares that the convergence of technologies with everyday life was foreseen in the late 1970’s and was predicted to affect everyone, whether they knew or cared about the future direction of technology. This claim was made in the

Section 2 – Information Systems Security & Web Technologies and Security
199
time of simple textual based social networks, and these were still in early stages of development and had not yet finished expanding into the integrated communities, as they are known today. The first truly collaborative and user-driven websites were established around 2003 as a result of new ‘Web 2.0’ technologies. These websites gave users the opportunity to create their own content and were generally divided into one of two types; a site gathering information as part of a collaboration, and a site that hosts and allows interaction between a collection of personal profiles. This user generated content and interaction between profiles provided the foundation for the development of social networking websites.
The launch of MySpace in 2003 allowed bands to promote their music. The website provided a place where young people could post pictures of themselves, find friends, and let people listen to their music. The demographics of MySpace became evident around 2004 with the launch of Facebook. Facebook was the creation of a former Harvard student and membership was restricted to Harvard students. The website was later opened through invitation only to other educational institutions, and quickly became a cultural status among teenagers (Boyd, 2007). Social networking websites are rapidly changing and the latest addition is the developer-orientated architecture of Facebook, which allows the creation of ‘applications’ or embeddable chunks of code that allows for the incorporation of external content with interactive user participation. This has led to concerns in the ethical view held by the developers who have control over the personal data being passed between these applications.
3 Personal Privacy
The labels ‘public’ and ‘private’ are prevalent online as metaphors for Internet interaction, as they can be easily interpreted. Nevertheless, while a social network profile page may be publicly viewable and accessible, it does not ensure that the user recognises the extent of the exposure of the information and interaction given on that page, which may be deemed private by the individual. It has been noted that connecting to public forums from private homes and workplaces can give the impression of privacy (Rheingold, 1993). Social network users often consider online identities separate from those offline, and this also applies to the information they disclose online. This gives a possible explanation to why potentially sensitive information can sometimes be disclosed (Stern, 2004). However, the Bakhtinian theory contradicts the expected perceptions of social network users. When translated into a virtual context, this theory shows that people can participate in online conversations and other online social activities, only while understanding and respecting its privacy space (Bakhtin, 1984). There is no particular attitude shown towards privacy from teenagers and younger Facebook users. However, it was confirmed in a recent study that some of the younger Facebook users are aware of active threats involved with the exposure of personal information, but did not understand the potential impact of the risks and were still happy to disregard protective advice. This was generally due to hidden motives in the hegemonic demographic. On the other hand, the subaltern teenagers had a better understanding of the consequences of disregarding personal privacy (Boyd, 2007). Users attitude towards breached privacy differs but is generally found to be fairly weak. This could be down to the lack of awareness regarding support, or not feeling empowered

Advances in Networks, Computing and Communications 6
200
enough to take legal action on infringement of personal privacy due to social or financial status (Atkinson, 2007).
3.1 Privacy Implications and the Potential for Harm
Before the creation of social networking websites, the only accessible form of personal information on the Internet was through a personal homepage or group bulletin board. This data was selective with a strong sense of self-presentation, and was hard to process in large quantities since the information was not standardised (Bober, 2004). Facebook is growing rapidly and this has a direct effect on the amount of standardised information available. Prior to the development of social networking websites, there was much emphasis on keeping data private. However, many successful Internet start-ups such as Flickr, initially disregarded personal privacy. This led to the sharing of personal information and opened the doors to social networking, but is nevertheless now leading to issues in personal privacy (Torkington, 2005). The Internet allows data to be moved, transformed or manipulated, which raises the core issues of authorship and authenticity of material. This can be expanded to cover the topics of confidentiality, integrity, availability and accountability (Furnell, 2005). As a result, it is not the technology that should cause concern, but the possession of the information and how it could be used to cause harm. Many studies have been conducted to evaluate the extent of the potential for harm through probing social network accounts for exposed information. A survey of 800 parents and children has recently shown that 25 percent of the children when questioned had given out personal information. In contrast, only 13 percent of the children’s parents were aware of the data being publicly posted (Vine, 2008). The target group in this survey was aimed particularly towards children, as younger age groups are presumed to be at the highest risk. The Sophos Facebook survey (2007) showed that this is not the case since 41 percent of randomly selected social network users are willing to share their personal information with potential identity thieves.
4 Information Revelation in Online Social Networks
It has been established that websites can be used as objects of analysis, due to their potential source for both qualitative and quantitative content. The type of information available in this environment is the same as traditionally available to the researcher, such as interview, observational, document, and audio-video materials (Creswell, 2007). In the case of this study, the natural setting spans several popular social network domains, linked through the conceptual physical location of the users’ online identity. This can in few situations include other sites through an online ‘mashup’ of web applications, ties to a personal homepage, personal Blog, or re-identification across other social networks. However, to define clear boundaries for the study, the research was limited to the data provided directly on users’ social network profile pages.
4.1 Selection of Population
Social networking websites have the potential to reach users internationally due to the size of the audience and the scope of the Internet. Facebook is becoming popular among teenagers, but more so for those from a wealthy demographic and those with

Section 2 – Information Systems Security & Web Technologies and Security
201
a higher emphasis on education. The main factor in the educational divide among the social networking websites could be a product of Facebook’s origin, when in its infancy it was initially limited to university students and individuals with an email address from an academic institution. A strong demographic divide is apparent between social networking websites, and one community cannot be given as an accurate representation of the ethnicity, educational background or income of the population at large (Boyd, 2007). Nevertheless, some studies have shown no real difference in demographics, but this is most likely due to the fact that these studies were conducted on a limited self-selected group or community (Ellison et al., 2007).
In June 2008, a preliminary study was undertaken with a small sample of 50 profiles. Later in July 2008, the profiles of 384 users across Facebook, MySpace and Bebo were gathered in accordance with our initial findings. In cases such as this where a population is spread over multiple defined target groups, stratified or weighted sampling is usually employed. By reflecting the distribution of the population based on a criterion, this ensured an accurate representative sample of the population was held and an extra increment of precision was injected into the probability sampling process. The sample population was stratified using the national population statistics for active online social network use (Burmaster, 2007). The sampling fraction was calculated and indicated that the probability of inclusion in the sample was 1 in 190. Using the sampling fraction, it was expected to include 144 Facebook, 141 MySpace and 99 Bebo profiles in our final sample.
4.2 Demographics
It is important to note at this point the similarities between the preliminary findings and the main findings to establish reliability within our results. A line graph of the user age distribution across the pilot and final sample groups is given in Figure .
Figure 1: Line graph showing the user age distribution across the pilot and final sample groups
This figure shows a very similar pattern in the distribution of users appearing in the range between 16 and 28 years of age. The most frequent age is 18 years, with

Advances in Networks, Computing and Communications 6
202
slightly more outliers present in the tailing age groups, although this is expected in a larger sample group. The grouping of these age demographics backs the idea of a ‘Generation Y’ (Gribben, 2007). This is defined as an ambitious generation born between 1978 and 1998, who have grown up with the Internet and have become accustomed to the freedom and instant global connectivity found online.
Users up to the age of 14 are restricted from registering with any social networking website, due to the terms and conditions of these services. Some users from the age of 14 are allowed use of social networking services, but these profiles carry heavy restrictions preventing them to be searched or browsed, without first directly gaining their consent and confirming them as friends. This explanation justifies the drop off and lack of users bellow the age of 18 in the findings, thus preserving the line of reasoning behind the ‘Generation Y’ theory.
4.3 Types and Frequency of Information Exposure
These results have shown that information revelation is a genuine issue across the sample group. The frequency of every identifiable piece of information has been measured for each information category, and the percentage of the likelihood of revelation has been calculated. The resulting bar chart can be seen in Figure 2.
Figure 2: Bar chart showing the likelihood of personal information revelation in the sample group
It was noticed that the social networking website had an effect on the likelihood of the type of information that may be available on any given profile. For example, Facebook users were more likely to either have a political opinion or be willing to reveal it, whereas MySpace users were ready to present their email address. Across

Section 2 – Information Systems Security & Web Technologies and Security
203
all the target websites in the region, there is much information being disseminated, which could be used to build an accurate personal profile upon each user, and open them to evident risks.
4.4 The Perceived Level of Privacy
It was accepted in Section 3 that the social network users’ attitude towards privacy is seen to be fairly weak. This proposition is confirmed by these findings; where users show signs of awareness of privacy, but are still willing to reveal sensitive information or not facilitate the full use of their privacy settings. It is suggested that this could be due to the act of signalling (Gross and Acquisti, 2005). This theory of signalling splits the target group by gender and assumes that males have a significantly higher chance of revealing information. This suggestion is explored in Figure 3 with an abstract view of the users’ perceived privacy settings, grouped by gender.
Figure 3: Pie charts showing the presence of user privacy settings grouped by gender in the sample group
As expected, the male group generally featured a lower level of privacy protection. In comparison the female group showed a surprisingly higher perceived level of control over their profiles, with nearly double the amount of profiles having a stronger level of privacy protection.
4.5 Data Validity
In several profiles analysed, it was made apparent through computer-mediated communication channels, that specific items in a profile were noticeably false. Users appeared to possess the attitude that this was intended and valued as a joke, such as a false sexual preference. This could have a negative effect in the reliability and validity of the information in a single instance, but should not negatively affect the study in regards to the risks posed though exposing this or other such information. When the study was in the process of being conducted and false information was identified, it was dismissed at the discretion of the researcher, based on other available information in context. Some of the information recorded in the profiles observed, were noted as containing a false positive. One Facebook profile seemed to possess extremely lax privacy settings, and had much personal information on

Advances in Networks, Computing and Communications 6
204
display. On deeper analysis of its content it appeared intentionally presented, with the apparent aim of advertising an advance powerboat tuition service that the user offered. This user lacked any form of privacy settings, nevertheless seemed to understand the risks as the information was purposely selected to advertise his business. This demonstrates a particular understanding of privacy and it’s application to both personal and professional information.
5 Conclusion
Privacy is a real concept and a growing concern due to the wide scope of the Internet. Social networking websites give the users the right and freedom of control over the flow of their information, but inevitable hidden risks always pose a concern. It can be hard to identify risks to personal privacy online, and measure the resulting impact should a risk materialise, as many risks do not clearly expose themselves or give any details of origin. This study has identified several important characteristics of the risks posed through Plymouth’s presence on social networking websites. Users in the region of Plymouth show a willingness to expose information, and this is exposing them to a high risk of online grooming, harassment, and identity theft. Although it is not possible to clearly define the users who may pose many of these threats, they are rarely caused by broken strong ties, but are more likely to be held by ‘friends’ who can be classed as weak ties. It is inevitable that these weak ties will exist, since it is part of the nature of social network users and is built into the culture surrounding such websites. Most users show awareness of privacy through some form of privacy setting, but they show willingness to share information through unprotected communication channels due to social necessity and trust. Evidence exists in the findings that suggests signalling may share a blame in the revelation of information, but only as an amplification factor in particular information types among the male group. The convergent validity of the data with existing theories supports the validity of the findings and the direction of causality of research is also self-evident. The recommendation is to minimise the escalation of the threats by removing any direct contact information from the view of these low intensity relationships. This is made increasingly possible due to the advancement in the customisation of privacy settings available to the individual. However, further research is needed into the state of the default privacy settings and the users attitude towards myopic discounting.
6 References
Atkinson, S. (2007), “Risk Reduction through Technological Control of Personal Information”, Ph.D. Thesis, University of Plymouth.
Bakhtin, M. (1984), Problems of Dostoevsky's Poetics, Minneapolis: University of Minnesota Press, ISBN: 978-0816612284.
Bober, M. (2004), “Virtual Youth Research: An Exploration of Methodologies and Ethical Dilemmas from a British Perspective”, in Buchanan, E. (Ed.) Readings in Virtual Research Ethics: Issues and Controversies, Hershey: Information Science Publishing, ISBN: 978-1591401520.

Section 2 – Information Systems Security & Web Technologies and Security
205
Boyd, D. (2007), “Viewing American class divisions through Facebook and MySpace”, http://www.danah.org/papers/essays/ClassDivisions.html, (Accessed 18 January 2008).
Burmaster, A. (2007), “Facebook is Now UK’s Most Popular Social Network”, http://www.nielsen-netratings.com/pr/pr_070925_UK.pdf, (Accessed 2 February 2008).
Creswell, J. (2007), Qualitative Inquiry and Research Design: Choosing Among Five Approaches (2nd Edition Ed.), California: Sage Publications, ISBN: 978-1412916073.
Ellison, N., Steinfield, C. and Lampe, C. (2007), “The Benefits of Facebook Friends: Social Capital and College Students’ Use of Online Social Network Sites”, Journal of Computer-Mediated Communication, Vol. 12, No. 4, pp1143-1168.
Furnell, S. (2005), Computer Insecurity: Risking the System, London: Springer, ISBN: 978-1852339432.
Gribben, R. (2007), “Generation Y talking about a revolution”, http://www.telegraph.co.uk/money/main.jhtml?xml=/money/2007/11/29/cmgen29.xml, (Accessed 20 May 2008).
Gross, R. and Acquisti, A. (2005), “Information Revelation and Privacy in Online Social Networks”, http:// www.heinz.cmu.edu/~acquisti/papers/privacy-facebook-acquisti-slides.ppt, (Accessed 23 May 2008).
Rheingold, H. (1993), The Virtual Community: Homesteading on the Electronic Frontier, New York: Addison-Wesley, ISBN: 978-0262681216.
Sophos (2007), “Sophos Facebook ID probe shows 41% of users happy to reveal all to potential identity thieves”, http://www.sophos.com/pressoffice/news/articles/ 2007/08/facebook.html, (Accessed 1 December 2007).
Stern, S. (2004), “Studying Adolescents Online: A Consideration of Ethical Issues”, in Buchanan, E. (Ed.) Readings in Virtual Research Ethics: Issues and Controversies, Hershey: Information Science Publishing, ISBN: 978-1591401520.
Torkington, N. (2005), “A Web 2.0 Investment Thesis”, http://www.oreillynet.com/pub/a/oreilly/tim/news/2005/09/30/what-is-web-20.html?page=4, (Accessed 17 January 2008).
Vine, J. (2008), “One Click from Danger”, http://news.bbc.co.uk/1/hi/programmes/panorama/ 7180769.stm, (Accessed 14 January 2008).

Advances in Networks, Computing and Communications 6
206
School Children! A Security Aware Generation?
J.W.G.Littlejohns and N.L.Clarke
Centre for Information Security and Network Research, University of Plymouth, Plymouth, United Kingdom
e‐mail: [email protected]
Abstract
Everyone has personal data that they wish to keep private from other individuals. Young people are the same; they also have bank accounts, telephone numbers and identities that can be stolen. This publication looks at the current levels of information security awareness amongst pre-university students – how they store and share their information, how they are trained in information security and how aware they feel of their own security. Using quantitive (online survey) and qualitative (focus groups) methods, this investigation indicates that young people are not always clued up on the issues surrounding the safety of their personal data even when they believe that they are. The results also imply that young people could be made to think more about what they actually know rather than what they think they know.
Keywords
Information Security Awareness, Students.
1 Introduction
Recently, it has been seen that a number of high profile errors made by companies and the government that have resulted in the release of personal data into the public arena whether it be a laptop left on a train, CD’s lost in the post or account details sent to the wrong addresses. In each of these cases, the public have been quick to complain, and rightly so, but just how aware are they when it comes to looking after their personal data for themselves?
Young people are particularly vulnerable when it comes to the subject of information security especially with the popular use of mobile devices and social networking websites. These devices make it much easier for people to store and/or share data about themselves and their friends and acquaintances.
This paper looks at the current situation of young people and their personal data focusing on social networking and the internet, mobile devices, USB memory keys and their levels of information security awareness. Information security training is also considered
2 Current Situation
Social networking websites are very popular with young people. One of the most popular, ‘Facebook’, had over 50 million users in October 2007 (Facebook, Inc.,

Section 2 – Information Systems Security & Web Technologies and Security
207
2007). It was further estimated that the number of active users would double every 6 months (Facebook, Inc., 2008). It has been found that those aged between 16 and 17 years of age have a high tendency with 73% of adding strangers as “friends” (Davies, 2007) and hence allowing them full access to any information contained on their profile. It is possible to restrict the amount of information that is displayed on social networking profiles however young people do not always do this. Experts have said that users are exposing themselves to identity theft, credit fraud and future embarrassment (Beucke & Thacher, 2005). In 2006, a study showed that whilst young people had an idea in their own mind about the safety of their personal data, the actual level of awareness was quite low given the high skill level when using the internet (Lacohée et al, 2006).
It was estimated that 28% of 10-19 year olds owned a mobile phone in 1999 (Aoki & Downes, 2003). This figure had increased dramatically by 2001 when it was said that 90% of UK secondary school students owned a mobile phone (Davie et al, 2004). In addition to this it was found in 2001 that almost half of mobile theft victims were under the age of 18 (Davie et al, 2004).
Original research took place via an online survey as part of this project to investigate the levels or perceived levels of information security awareness. The survey requested respondents to be of pre-university age, this being between 14 and 18 years inclusive. 105 surveys were completed fully from a total of 123 that were attempted. A focus group was also conducted to investigate issues in a greater depth.
2.1 Social Networking and the Internet
Social networking websites are one of the key tools that young people use to stay in contact with their friends. This is reflected in the high awareness of such sites in particular Facebook where 99.05% were aware of or at some point used the site. Similarly 98.09% were aware of Bebo and 97.14% aware of MySpace. They are, in contrast to other communication mediums such as mobile telephones, free to use reflected in the fact that all respondents in the survey were aware of or had used a social networking website. These statistics show that young people have an extremely high engagement with technology and that it forms a part of their everyday lives.
Social networking websites were an area where young people were aware of some of the issues posed but, in many cases they chose to ignore the problems. 40% of respondents said that they would accept a friend request from someone that they did not already know. On the other hand 73.3% said that they were aware of protection features offered by social networking websites such as hiding a profile from search engines or preventing a profile from being accessed by non friends.
Access to the internet has become more widespread for young people. Research in 2005 of a similar age group of 9 – 19 years old showed that 75% had internet access at home and that 19% of these had access within their own bedroom (Livingstone & Bober, 2005). Today, three years on, 79% have access at home. Staggeringly, the number of young people who have access to a computer and the internet within their own private space has risen to 67.6%. When a young person has access within their

Advances in Networks, Computing and Communications 6
208
own space, they are less likely to have as much supervision from parents meaning that there is less control over the sites that they visit or the information that is given out.
2.2 Mobile Devices
It may not be a surprise to find that 93.3% of young people own a standard mobile phone. This in itself may seem innocuous but a mobile phone can hold a surprising amount of information. This most often takes the form of names and telephone numbers but also can include addresses of contacts. Smart phones are particularly used for storing large amounts of contact information and are increasingly owned as age increases with 5.7% of 16 year olds owning such a device compared to 20% of 18 year olds. As could be expected the most common item of data stored on a mobile phone was phone numbers stored as part of contact information. Most modern phones now include a camera as standard and this is reflected in the survey results as 89.9% of respondents store photos. More important information such as PIN numbers and credit card numbers are rarely stored on a mobile phone with 7.9% and 0.95% storing these respectively. It is however worrying that this practise is carried out in any form in the first place as presumably they also keep their wallet in a similar location to their phone.
69.5% of respondents said that they had not had a mobile phone lost or stolen. This is an unfortunate statistic as 15.2% were a victim of a theft and 20.9% claimed that they had lost their mobile device. Ideally these figures would be much lower.
2.3 USB Keys
USB keys are very popular amongst young people with 81.9% of respondents owning one. USB keys are becoming increasingly cheaper and also increasingly larger allowing the owners to store many more things. Due to their nature, USB keys are also very small in size and are easily lost or stolen. USB keys are mostly used by young people to store their school work (89.53%) and to transfer it from place to place. 73.25% also said that they stored photographs. These two in themselves are fairly harmless things but more concerning was the fact that over a third said that they carried their Curriculum Vitae with them on a memory stick. This is even more concerning when it was found that 70.93% did not use any form of encryption or password to protect their USB data leaving it wide open for any thieves to use the contents how they wish.
2.4 Training and Awareness
To create a security aware society particularly amongst young people, training will need to take place, especially as there is no apparent security culture. Part of the lack of knowledge is most likely down to only 25.7% of respondents saying that they had had any form of information security or internet safety training. This is not to say that there are not sufficient resources available either as ready to teach material or as complete awareness websites. Despite them being available, the number of people that are aware of their existence is relatively low. The number of people who have actually used one or more is even lower. Figure 1 shows the number of young people

Section 2 – Information Systems Security & Web Technologies and Security
209
who have used, are aware of or are not aware of a select number of awareness websites. These websites are run by both governments and by independent organisations.
Figure 1: Awareness websites and their usage
One of the most interesting things concerning levels of awareness was the before and after questions in the survey. Respondents were asked if they felt they had an appropriate level of awareness at the beginning of the survey and then again at the end of the survey. To begin with, 80% of respondents were sure that they had an appropriate level of awareness. This compares to 61% when they were asked for a second time. This indicates that even something as simple as asking a few questions can stimulate a young person into thinking more about what they actually know rather than what they think they know.
3 Discussion
On closer inspection it was found that 24.76% changed their mind throughout the course of the survey by initially saying that they felt they had an appropriate level of awareness and then changing their mind to say that they did not.5.7% on the other hand changed their mind in the opposite way by initially saying no and then changing their mind to say yes. 55.23% did not change their mind and maintained that they had an appropriate level of awareness throughout the survey. The answers from these respondents were analysed further to produce the following statistics, 23.09% of respondents who changed their mind from yes to no correctly identified the right definition for the term phishing. Only 7.69% of those who changed their mind had received any form of awareness training and 57.69% used or were aware of protection features that are available when using social networking websites. These statistics are a contrast to those found when analysing the results of those who

Advances in Networks, Computing and Communications 6
210
maintained throughout that they did have an appropriate level of awareness. 50% of these respondents were able to correctly identify phishing from the responses given in the survey. 37.93% said that they had received some form of awareness training at some point and 86.20% were aware of protection features that can be used on social networking websites.
From the above it is clear to see that those who personally thought that their level of awareness was adequate did in fact have a greater degree of knowledge. Those who did change their mind from yes to no did in fact have a poorer level of awareness shown though their answers given in the survey. This could indicate that the multiple choice answers given in the survey were clear enough to indicate a correct or ideal answer to the question. This therefore indicated to the respondent that the answers they were giving were not ideal and that in fact their level of awareness was poorer than they had initially assumed. This again reinforces the idea that asking a few simple questions could make a young person think more about what they know rather than what they think they know.
4 Conclusions and Future Work
The research carried out for this project has raised some interesting points relating to the awareness that young people have for their information security. Overall, young people appear to have a good grounding in the rights and wrongs when it comes to what they should and what they should not do with their personal data but having said this, the young people surveyed do not always practise what they preach especially when it comes to social networking. Here, the young people are usually fairly aware that they should not display many details about themselves however they still show them on their profiles with an ‘it will not happen to me’ attitude. Also on the subject of social networking privacy features offered by the various social networking sites, although well known, it is not known how many people take advantage of the facilities. Mobile phone ownership is very high but so is their loss/theft. Thankfully young people were most likely to store less important items on their profile such as names and telephone numbers rather than PIN numbers and credit card details. USB memory keys are now also very popular and can store important documents. Unfortunately due to their size they can easily be lost or stolen and many do not use any form of protection for the data held within in case of such an eventuality. A young person’s knowledge of awareness training websites is very poor. Work needs to be conducted in this area to make such websites more accessible. It is not clear whether these sites are not interesting or whether they are simply not marketed correctly. Websites and posters whilst popular may not be the best way to deliver security awareness training. This issue was raised in the focus group by a young person. By using formal lessons it can be ensured that young people are made aware of the issues concerning the security of their personal information. Even better would be the inclusion of the topic in the national curriculum programmes of study.
Further research should be carried out to develop the ideas investigated further. More detailed analysis of the use of social networking websites is one possible avenue. Of particular interest, the creation of an awareness programme specifically for younger people could be devised using both the research carried out here and further research
Section 2 – Information Systems Security & Web Technologies and Security
211
into the topics and methods that would both benefit and be liked by the young people themselves. A comparison between those who have undertaken an awareness training programme and those who have not, can be made possibly by conducting a before and after survey.
5 References
Aoki, K., and Downes, E. J., (2003). “An analysis of young people's use of and attitudes towards cell phones”, Telematics and Informatics, 20 (4), 349-364.
Beucke, D., and Thacher, J., (2005). “The young are wide open for cyber thieves”, Business Week (3935).
Davie, R., Panting, C., and Charlton, T., (2004). “Mobile phone ownership and usage among pre-adolescents”, Telematics and Informatics , 21 (4), 359-373.
Davies, G., (2007). “Data Protection Topline Report”, Dubit Research.
Facebook, Inc., (2008). “Facebook | Statistics”, Retrieved January 5, 2008, from Facebook: http://www.facebook.com/press/info.php?statistics
Facebook, Inc., (2007). “Facebook | Timeline”, Retrieved January 8, 2008, from Facebook: http://www.facebook.com/press/info.php?timeline
Lacohée, H., Crane, S., and Phippen, A. (2006). “Trustguide: Final Report”, BT Group/HP Labs.
Livingstone, S., and Bober, M., (2005). “UK Children Go Online”, The London School of Economics and Political Science.

Advances in Networks, Computing and Communications 6
212
Comparative Study and Evaluation of Six Face Recognition Algorithms with a
View of their Application on Mobile Phones
N.Mahmoud and N.L.Clarke
Centre for Information Security and Network Research, University of Plymouth, Plymouth, United Kingdom
e‐mail: [email protected]
Abstract
Mobile phones are rapidly becoming one of the most popular and powerful tools in our lives everywhere in the world (Clarke et al, 2003). They have provided a powerful ability whilst on move and increasingly sophisticated functions. Nowadays mobile phones are allowing people to access an increased amount of data and much more such as paying for products using micro-payments, surfing the Internet, buying and selling stocks, transferring money and managing bank accounts (Dagon et al, 2004). . However, security levels provided on the mobile phones these days such as PIN numbers and passwords do not provide substantial protection. This has highlighted the need for another strong way to protect the information being held on these devices as well as the services being served. It was proposed to implement methods of controlling access to these devices namely, biometrics. Face recognition is one of biometrics techniques can be implemented on mobile phones these days as most have integrated digital cameras which can be used to capture an image and used for authenticating legitimate users. It is based on the use of underlying algorithms to implement a solution. Six such algorithms cover provide a good coverage of the techniques available today were evaluated based on two experiments, a control experiment to evaluate the normal operating performance of the algorithms and a test experiment to test the ability of the algorithms to deal with facial images with varying facial orientation. The best performed algorithm in the control experiment was Gabor filters for face recognition with 4.5% misclassification rate and the best performed algorithm in the test experiment was Fisherfaces for face recognition with 35.1% misclassification rate.
Keywords
Face recognition, face recognition algorithms, mobile phones.
1 Introduction
Personal digital assistants (PDAs) and of mobile phones are portable devices and both are meeting at many points which could be easily noticed in these days; the latter including ever more features than of the former. The evolution obviously tends in the direction of multi-functional communications including a wide range of smart capabilities, such as wireless internet, image or/and video camera, GPS, task manager (i.e. organizer), etc. in addition, to wireless telephone. As a result therefore, is that an increasing number of personal (private) and potentially sensitive information being hold on such a device and/or are transferred to remote locations, which evidently asks for improving security levels. User data security and privacy have been achieved in third generation mobile phones by encrypting all

Section 2 – Information Systems Security & Web Technologies and Security
213
communications during their transmission. In the same way, the subscriber account is protected by codes that are exchanged between the mobile phone and the network. However, none of these methods tends to protect the access to the mobile phone as a device holding sensitive information itself (Nagel et al, 2003).
Authentication of users of any security system can be achieved by using one of the three fundamental methods something the user knows (password, PINs), something the user has (tokens), and something the user is (biometric) (Furnell et al, 2000). The first two methods known as have their own weakness in contrast to other methods, the third approach of authentication does not need to be carried or to be remembered by the users; it just required them to be themselves. Such techniques are known as biometrics (Clarke et al, 2007).
Not surprisingly, the first biometric techniques that those users would be agreeable to implement is fingerprint recognition (74% of positive responses). This can be understood by the fact that fingerprint recognition is the most common biometric techniques that the majority of users already had some experience with this technique, while it is generally not the same situation with biometric face recognition. However, the availability of digital cameras in common mobile phones makes the implementation of face recognition cost-effective, since no additional sensor is required (Nagel et al, 2003).
This research aims to suggest a new approach which can be used to authenticate legitimate users to access their mobile phones. Since the image capturing is with the user holding the mobile phone including the camera, both the viewpoint and the lighting conditions are unrestricted. The algorithm which would be implemented must therefore take into account for differences in scale, different angles, and associated geometries (Nagel et al, 2003).
Face recognition is one of biometric techniques that can be used to provide the required level of security in order to protect the information being held in mobile phone these days. Hence, the opportunity is taken to evaluate six face recognition algorithms proposed by number of researches interested in face recognition technology. The aim is to find the best algorithm that can cope with varying facial orientations. Consequently, a suggestion may be made to implement one of the evaluated algorithms. The web site www.advancedsourcecode.com provided a good coverage of the available techniques available today (see the web site for more information). There algorithms evaluated were the following algorithms:
Eigenfaces for recognition. Fourier-Bessel Transform for Face Recognition. Fourier spectra for Face Recognition. FisherFaces for Face Recognition. Gabor filters for Face Recognition. High Speed Face Recognition based on Discrete Cosine Transforms and
Neural Networks.

Advances in Networks, Computing and Communications 6
214
2 Background
According to a survey performed by Clarke in 2002 on user attitudes towards mobile phone security, around 80% of the mobile phones users believe that enhancing the security level would be good to very good. Even five years later, inconvenience and low confidence in use of PIN numbers are the most commonly mentioned explanation of why subscribers are not using them (Nagel et al, 2003). With the growing of the mobile phones market, and their functionality as mentioned earlier, the need for implementing a high level of security would become very necessary in order to protect users and increase their trust in the new applications which would be introduce in the near future.
In summer 2004 Halifax General Insurance being one of UK’s leading providers of home insurance announced that Mobile phone theft doubled compared to previous year. This was an increase of mobile phone theft and consequential insurance payments by 123% in 2003 compared to 2002. In May 2006 Halifax General Insurance approximated mobile phone theft costs in the UK at around £390 million a year (HBOSplc, 2007).
However, these estimates gives figures based on the number of mobile phones stolen, but the question that should be asked is the cost is only based on the price of the mobile phone itself, what about the information being held on the mobile whether it has been used for other purposes. In other words these reports give some figures just about the number of stolen mobile phones and its price, but do not give ideas whether the information in these mobile phones have been used to fraud purposes, or even some employees of some companies keep sensitive information and recordings about their work, and so no body knows how this information would be used and what would be the consequent cost. This highlights the emergency steps needed to provide mobile phones a real protection in order to cut down the theft costs and /or minimizing the danger of using the kept sensitive information in them.
There are some solutions introduced by some companies to implement biometrics techniques such as fingerprint recognition or face recognition in order to increase the security levels of mobile phones. However, it might not be practical to authenticate the authorised user each time he/she would use the mobile phone. Moreover, the fact that the suggested technique in this research being face recognition technique, is non-intrusive and this is done by authenticating the user for example while he/she using the phone. Consequently the mobile phone would accept or reject the commands based on the face recognition system (match/ non-match).
3 The database used in this research
FERET database was selected to be the dataset for this research experiments. FERET database is a huge database that contains 14126 images for 1199. This database was created and collected by FERET program which started in 1993 to support algorithm development and evaluation. The final set of images consists a greyscale images 256×384 pixel size of individuals. The best point that makes FERET database one of the most important databases within the related researches to face recognition is that

Section 2 – Information Systems Security & Web Technologies and Security
215
it consists a large number of images for each individual, most importantly some images taken within different periods of time extended to more than two year elapsed between first and most recent sittings for some individuals, so that some face features have changed. This element is important for evaluating the performance of face algorithms and its robustness of face recognition algorithms over time (Zana & Cesar-Jr, 2006; Black et al, 2002; Phillips et al, 2000).
4 Experimental methodology
Two experiments were designed in order to evaluate these algorithms – a control experiment and test experiment. The database which has been selected to evaluate these algorithms was FERET database. The experiments were conducted in a controlled fashion to evaluate the normal operating performance of the algorithms and a test experiment to test the ability of the algorithms to deal with facial images with varying facial orientation. Specifics relating to each experiment are as follows:
The control experiment was designed to evaluate the accuracy of these algorithms to recognise 200 users, the images used were normal frontal facial images, taken under normal lighting conditions, including different faces with different gender, different age, and different ethnic origin, which to an accepted level increased the difficulty of the recognition task.
The test experiment was designed to evaluate the accuracy of the six algorithms in order to recognise the same subjects based on variation in face orientations, however the images selected to achieve this experiment were different in the way that the images were taken in different pose angles in order to evaluate the accuracy of these algorithms to recognise those subjects’ within different pose angles.
4.1 Test methodology for the control experiment
UserID 00700 UserID 00268 UserID 00029
ba bj ba bj ba bj
UserID 00761 UserID 00019 UserID 01096
ba bj ba bj ba bj
Figure 1 . Examples of some frontal facial images (ba & bj images) from FERET database.

Advances in Networks, Computing and Communications 6
216
The control experiment was designed to evaluate the performance of the algorithms to recognize (classify) frontal facial images. The images which would be used to achieve this goal are ba and bj subsets (normal frontal face images) of data (200 subjects), 2 images per subject, totalling 400 images. Some examples of images which would be used in the test are shown in Figure 1.
Description of data set
The collection of images which would be used to evaluate those algorithms was taken from FERET database. Table 1 shows ba and bj images subsets, their pose angel, description, number in database, and number of subjects for each group.
Two letter code
Pose Angle (degrees)
Description Number in Database
Number of Subjects
ba 0 Frontal "b" series 200 200 bj 0 Alternative expression to ba 200 200
Table 1 shows ba and bj images subsets (Source: (NIST, 2007).
Description of the actual process
The test would evaluate the performance of facial recognition algorithms in order to recognize (classify) users’ normal frontal facial images.
The evaluation process will based-on identification scenario; all users’ images (authorised users) would be stored in the system’s database. . After storing all users’ images, the system then compares each sample image against the database, the system then either would correctly or incorrectly recognize (classify). In this phase the comparison would be 1:200 (200 here refers to the number of the images in the system’s database). The actual process would take the following steps:
In the first stage system would acquire an image for the first user (this image would be used as a template), and then the system would acquire the image of the second user. The system would continue to acquire all users’ images which are here 200 images for 200 users. This process is called enrolment phase.
After finishing the whole enrolment process for the 200 subjects, the second step would be an identification process which is based-on making the comparison for each sample image against the system’s database in order to find out whether the system would correctly or incorrectly recognize (classify) an authorized user. This process would be repeated for each of the six algorithms described earlier in this section.
Calculation of misclassified rate for the first experiment
As the total number of subjects is 200 (200 images, 1 image per subject), so the misclassification rate for the first experiment can be calculated from the following equation:

Section 2 – Information Systems Security & Web Technologies and Security
217
Misclassification rate = 200
___ imagesiedmisclassifofnumber100
4.2 Test methodology for the test experiment
The purpose of the test experiment is to evaluate the performances of the six face recognition algorithms to recognize (classify) users’ images taken at different angles. These images were taken at different angles. The images which will be used to achieve this goal are divided into two groups. The first group of images was taken where the subject was facing to his/her left (photographer’s right). These includes (bb, bc, bd, be) image groups. The second group was taken where subject was facing to his/her right (photographer’s left). This includes bf, bg, bh and bi image groups. Each subject has eight images (each image was taken at different angle). Some examples of images used in the second experiment are shown in figure 2.
UserID 00019
bb bc bd be bf bg bh bi
UserID 00029
bb bc bd be bf bg bh bi
UserID 00268
bb bc bd be bf bg bh bi
UserID 00700
bb bc bd be bf bg bh bi
Figure 2. Some examples of images which would be used in the second experiment taken from FERET database.

Advances in Networks, Computing and Communications 6
218
Description of data set
The collection of images which will be used to evaluate those algorithms was taken from FERET database. Table 2 shows the subsets of the images, their pose angle, description, number in database and number of subjects.
Two letter code
Pose Angle (degrees)
Description Number in Database
Number of Subjects
bb +60 Subject faces to his left
which is the photographer's right
200 200 bc +40 200 200 bd +25 200 200 be +15 200 200 bf -15
Subject faces to his right which is the
photographer's left
200 200 bg -25 200 200 bh -40 200 200 bi -60 200 200
Table 2 shows the subsets of the images (Source: (NIST, 2007).
Description of the actual process
The evaluation process will base on identification scenario; all users’ images (authorised users) will be stored in the system’s database. After storing all users’ images, the system compares each sample image against the database, the system would either correctly or incorrectly recognize (classify) the user. In this phase the comparison will be 1:1600 (1600 refers to the number of the images in the system’s database). The actual process would take the following steps:
In the first stage system would acquire eight images for the first user (bb, bc, bd, be, bf, bg, bh, bi) these images will be used as a templates and then the system would acquire the images of the second user. The system will continue to acquire all users’ images (1600 images for 200 users).
After finishing the whole enrolment process for the 200 subjects, the second step will be an identification process which is based on making the comparison for each sample image against the system’s database in order to find out whether the system will correctly or incorrectly recognize (classify) an authorized user. This process would be repeated for each of the six algorithms.
Calculation of misclassified rate for the second experiment
As the total number of the users is 200 and each user has eight images within the system database so the total number of images is 1600. The misclassification rate in this case can be calculated from the following equation:
Misclassification rate = 1600
___ imagesiedmisclassifofnumber 100

Section 2 – Information Systems Security & Web Technologies and Security
219
5 Results
We performed two experiments and presented the results within this section. The control experiment was performed with 400 frontal facial images grouped into ba and bj groups, for 200 subjects (each subject has two frontal images). 200 images were used as templates (i.e. a database was created of the system by using one of the two frontal image for each subject), then the other image was used as a sample which basically would be used to authenticate the subject. The test experiment was performed with the same 200 subjects; however, 8 images were used for each subject which grouped into two groups. The first group of images was taken where the subject was facing to his/her left (photographer’s right). These include (bb, bc, bd, be) image groups. The second group was taken where subject was facing to his/her right (photographer’s left). This includes bf, bg, bh and bi image groups. There was no special standard for selecting these groups of images. So, the face images used in our experiments are much diversified, for example there are faces with different gender, different age, different ethnic origin, which to an accepted level increases the difficulty of the recognition task.
Table 3 and table 4 illustrate the final results of the control experiment and the test experiment. The output of the first experiment was the misclassification rate for each algorithm.
Algorithm Misclassification rate Eigenfaces for recognition 38.5% Fourier-Bessel Transform for Face Recognition 31.5% Fourier spectra for Face Recognition 24.5% FisherFaces for Face Recognition 21% Gabor filters for Face Recognition 4.5% High Speed Face Recognition based on Discrete Cosine Transforms and Neural Networks
96.5%
Table 3 illustrates the results of the control experiment
Algorithm Misclassification rate Eigenfaces for recognition 52% Fourier-Bessel Transform for Face Recognition 55.4375% Fourier spectra for Face Recognition 41.75% FisherFaces for Face Recognition 35.0625% Gabor filters for Face Recognition 51.125% High Speed Face Recognition based on Discrete Cosine Transforms and Neural Networks
97.125%
Table 4 illustrates the results of the second experiment
6 Comparison of the experimental results
Turk and Pentland presented results of evaluating eigenfaces algorithm based on a database of 16 subjects with different head orientation, scaling and lighting as well. For different illumination their system achieved 96% correct classification, for different head orientation their system achieved 85%, and for different scale their

Advances in Networks, Computing and Communications 6
220
system achieved 64% correct classification. Lawrence et al (1997) reported in his research paper that Pentland et al (1993; 1994) had methodologically found good results being attributable to a large database, 95% correct recognition of 200 subjects from a database of 3000. Also, it is hard to draw clear conclusion as many of the images of the same subjects may look very similar, and the database has accurate registration and position (Lawrence et al, 1997). However, in the control experiment eigenfaces algorithm resulted in 38.5% misclassification rate (i.e. 61.5 % correct classification rate) based on 400 images where 200 images used as templates and 200 images used for samples, there is enough differences between the 200 subjects and this might make it hard for the algorithm to achieve the same results as Turk and Pentland reported. Moreover, these images where taken in the same lighting conditions with only difference that the subject in the second image had a little facial smile. In the test experiment eigenfaces algorithm resulted in 52% misclassification rate (i.e. 48% correct classification). This is expected as in the second experiment the number of images used was 1600 images for the 200 subjects (eight images for each subject) taken at different angles, so this fact would increase the difficulty for the algorithm to recognise subject (i.e. classify the images correctly). In brief eigenfaces algorithm appears as fast simple and practical algorithm. “However, it may be limited because optimal performance requires a high degree of correlation between the pixel intensities of training and set images. “This limitation has been addressed by using extensive pre-processing to normalise the images” (Lawrence et al, 1997).
Fourier-Bessel Transform for Face Recognition algorithm in the control experiment resulted in 31.5% misclassification rate (i.e. 68.5 % correct classification rate). This algorithm was proposed by Zana and Cesar-jr 2006. They tested this algorithm on two types of databases namely FERET and ORL databases, whereas they used the largest probe set within FERET database which called “fb” in FERET terminology, this probe set consisting of a single image for 1195 subjects, a modification has been applied to this probe set (for more details see Zan and Cesar-jr 2006). Zana and Ceasr-jr reported that FBT algorithm resulted in 3.8% misclassification error rate with five images per subject taken from ORL database (they did not mention to the description of the images they used in their experiment from the ORL database).
However in the test experiment the FBT resulted in 55.4375% misclassification error rate. As 1600 images were used for 200 within different pose angles taken from FERET database. It is hard to compare our results that Zana ans Cesar-jr reported because they only used normal frontal facial images. The results from our control experiment and from Zana and Cesar-jr 2006 experiment (which was based on using 1195 normal frontal facial images from FERET database) indicates that the FTB perhaps can perform much better when it is evaluated in recognising normal frontal facial images. However in the test experiment indicates that the FTB would not perform a good recognition when evaluated within images taken in different pose angles.
The third algorithm evaluated within this research was Fourier spectra for Face Recognition algorithm introduced by Spies and Ricketts 2000. The control experiment resulted in 24.5% (i.e. correct classification rate is 75.5%) performance for this algorithm. Within the test experiment the algorithm performed 41.75% (i.e. 58.25% correct classification rate) as misclassification error rate. However, Spies

Section 2 – Information Systems Security & Web Technologies and Security
221
and Ricketts 2000 reported highly different results; they reported a 98% correct recognition (classification). Spies and Ricketts have used the ORL database to evaluate this algorithm (the 400 images of the ORL database were used). Spies and Ricketts have modified the resolution of the images in order to speed up the algorithm (for details see Spies and Ricketts 2000). Whereas, in our both experiments no modification have been applied to the used images. Within this case no comparison can be made according to the differences of the images and the size of the database used and the modifications applied to the database.
The forth evaluated algorithm was FisherFaces for Face Recognition. Belhumeur et al 1997 introduced this algorithm which was evaluated in this research. Belhumeur et al evaluated this algorithm by three experiments (the three experiments were carried out to evaluate other different algorithms (see Belhumeur et al 1997 for more details); each experiment was based on different scenario due to the type of the database and the number of images as well as the number of subjects. The first experiment was designed to test the hypothesis under variable illumination. The images used in this experiment were constructed by Hallinan at the Harvard Robotics Laboratory. The number of images was 330 images of five subjects (each subject has 66 images). Belhumeur et al extracted five subsets to quantify the effects of varying lighting (see Belhumeur et al 1997 for more details about the five subsets). For this experiment, classification was performed by using a nearest neighbour classifier. According to Belhumeur et al the results of this experiment was that this algorithm performs perfectly when lighting is nearly frontal (within subset 1 there was no error as well as within subset 2, the error rate within the subset 3 was 4.6% with a reduced space by 4). This algorithm had error rate lower than the Eignfaces algorithm based on the same database and the same scenario.
The second experiment related to this algorithm was based on different scenario where the database differs along with the number of subjects. The scenario of this experiment was to evaluate the performance of this algorithm within variation in facial expression, eye wear and lighting. The database used in this experiment contains 16 subjects (subjects include females and males (with some facial hair) and some wore glasses. In this test the error rate was determined by the “leaving one-out” strategy. Recognition was performed by nearest neighbour classifier. The fisherfaces algorithm gave excellent result (within the close crop the algorithm performed 7.3% error rate and within the images of full face performed 0.6% error rate).
The third experiment was carried out to evaluate the performance of the algorithm in recognising subject wearing glasses. The database contains 36 images forming the primary set of the Yale database, half with glasses. The result of this experiment was that this algorithm performed at 5.3% error rate with reduced space by 1. According to Belhumeur et al 1997, fisherfaces methods can be viewed as obtaining a template which is appropriate for finding glasses and ignoring other traits of the face.
This research evaluated this algorithm in entirely different scenario where the database is bigger than the databases used in Belhumeur et al 1997, the number of subjects as well as the number of images per subject. The most important difference that both experiment carried out in this research was that there were no subjects with glasses and there were no images with different lighting. In brief, in the control

Advances in Networks, Computing and Communications 6
222
experiment this algorithm performed 21% misclassification error rate (i.e. 79% correct classification rate), and with the test experiment performed 35.0625% misclassification error rate (i.e. 64.9375 correct classification rate). Clearly, this algorithm can work better in scenario of recognising frontal facial images, but it does not work better in the scenario of recognising frontal facial images in different pose angles.
The fifth algorithm evaluated was Gabor filters algorithm for Face Recognition. This algorithm was introduced by Hjelmås 2000. The evaluation of the algorithm was on the ORL database. Moreover, Hjelmås 2000 used two strategies within this experiment. Within the first strategy the algorithm was evaluated considering a single best matching feature vector being used (in pervious works by same author examination was focused in respect of face recognition provided the only available information were for example the eyes), the result (according to Hjelmås 2000) of this strategy was not satisfactory (only 76.5% for rank 1), the result here being reported in terms of cumulative match score. This result was expected as only very small amount of information from image was used. In this situation the classification is based only on the match of a single automatically extracted feature vector in the image to a stored one in the gallery. In the second strategy, the all sited feature locations were used to recognise the face. Within the second strategy the result was 83.4% which is better than the first strategy but not as good as expected (Hjelmås, 2000). However, within the control experiment the algorithm performed the highest with respect to the other five algorithms, i.e. only 4.5% misclassification error rate resulted (i.e. the correct classification rate is 95.5%). Within the test experiment it performed at 51.125% misclassification rate (i.e. 48.875% correct classification rate). Although this algorithm gave an excellent result within the control experiment, it is not possible to make logical comparison for several reasons. Firstly the database was different as the database used was the ORL database and secondly the methodology was also entirely different, within this experiment, 10 images per subject were used (divided into two groups five images each group, one for training and the second for testing) and the images within each group were selected randomly. Whereas, in the control experiment the images used were normal frontal facial images. In brief, this algorithm gave the best result (4.5% misclassification rate) within the control experiment.
The last evaluated algorithm within this research was High Speed Face Recognition based on Discrete Cosine Transforms and Neural Networks algorithm which was introduced by Pan and Bolouri 1999. Pan and Bolouri used the ORL database in order to evaluate this algorithm. The scenario was that the ORL database divided into two groups one for training purpose (the first five images for each subject were chosen for this group) and the rest for testing purpose (the last five images for each subject). As a result 200 images were used for training, 200 images for testing, and no overlap exists between the training and the test images. The experiment that carried out in their research paper based on reducing the unwanted information within the face recognition system, since (according to them) the high unwanted information within the face image the less efficiency of recognition when such image is used directly for recognition. Pan and Bolouri 1999 reported a best average recognition rate at 92.87% (see Pan and Bolouri 1999 for more details).

Section 2 – Information Systems Security & Web Technologies and Security
223
However, within both of the experiments carried out in this research, unsatisfactory results were obtained. In the control experiment the misclassification rate was 96.5% (i.e. correct classification rate was only 3.5%). This is a surprising result comparing it to the result that Pan and Bolouri 1999 obtained (92.87%). Although the database is different as well as the number of subjects, however, there should be a reasonable difference between the two results. The same result was obtained within the test experiment where the misclassification was at 97.125% (i.e. 2.875% correct classification rate).
At last, it is possible to learn several facts the evidently can have impact on the evaluation process of face recognition algorithms. The two experiments carried out within this research have evidenced several facts as following:
- Evaluating the same algorithms based on different type of database would give different results pointing out the best available option.
- Different number of images used to evaluate the same algorithm in different scenarios would lead to different results.
- Evaluating the same algorithm based on different image conditions (variations in illumination, orientation, ethnic origin, age, and gender) would result in different performance level for the same algorithm.
- Finally, the scenario of the evaluation process would have an impact on the performance of the algorithm as well.
7 Conclusions
Mobile phones are one of the ubiquitous tools used nowadays, and have become quite powerful. Now mobile phones are not just providing the traditional meaning of communication (making call or using text messages), but are also being used to surf the most unsecured world “the internet”. Since the implementations of two cameras (back and front cameras) in some common types of mobile phones, the chance of implementing face recognition biometric system in order to control the access to the mobile phone is highly possible. Classical security technique that is being used based on some thing the user knows (i.e. a password or PIN) and does not provide the recommended (needed) security level needed to protect the information being held on mobile phones these days.
This research found out (based on the control experiment and the test experiment) that, Gabor filters for face recognition algorithm is the best algorithm amongst the evaluated algorithms in recognising the frontal facial images with 4.5% misclassification rate and Fisherfaces for face recognition algorithm is the best algorithm amongst the evaluated algorithms in recognising users with different facial orientations. It could be said that the result was not satisfactory and improvements should be applied to this algorithm in order to meet the accepted level of error.
8 References
Belhumeur, P.N., Hespanha, J.P. and Kriegman, D.J., (1997). “Eigenfaces vs. Fisherfaces: recognition using class specific linear projection”. IEEE Transactions on Pattern Analysis and Machine Intelligence. Volume 19, Issue 7, July 1997. pp711 – 720

Advances in Networks, Computing and Communications 6
224
Black, J. A., Gargesha, M., Kahol, K., Kuchi, P., and Panchanathan, S. (2002). “Framework for performance evaluation of face recognition algorithms”. Proceedings of SPIE, Volume 4862, Internet Multimedia Management Systems III, 2002, pp. 163-174. Retrieved on 12th of August 2007 from http://cubic.asu.edu/people/students/publications/ITCOM_2002.pdf
Clarke, N.L, Furnell, S.M., Lines, B. M. and Reynolds, P.L. (2003).“Keystroke dynamics on a mobile handset: a feasibility study”. Information Management & Computer Security. Volume, 11 Issue, 4, pp161-166
Clarke, N. L. and Furnell. (2007). “Advanced user authentication for mobile devices”. Computer & Security. Volume 26, Issue 2, 2007, pp109-119
Dagon, D., Martin, T., and Starner, T. (2004). “Mobile phones as computing devices: the viruses are coming!”. IEEE Pervasive Computing, Volume 3, Issue 4. pp11- 15.
Furnell, S. M., Dowland, P. S., Illingworth, H. M., and Reynolds, P.L. (2000). “Authentication and Supervision: A Survey of User Attitudes”. Computer & Security.Vol. 19, No. 6. pp529-539
HBOSplc. (2007). “Halifax press release: Mobile phone theft doubles as Halifax General Insurance warns of summer crime wave”. Retrieved on 15th of December 2007 from http://www.hbosplc.com/media/pressreleases/articles/halifax/2004-04-17-00.asp?fs=/media/press_releases.asp
HBOSplc. (2007). “Halifax press release: Mobile phone theft costs UK £390 million a year”. Retrieved on 15th of December 2007 from http://www.hbosplc.com/media/pressreleases/ articles/halifax/2006-05-16-01.asp?section=Halifax
Hjelmås, E. (2000). “Biometric Systems: A Face Recognition Approach”. Retrieved on 30th July 2007 from http://www.nik.no/2000/Erik.Hjelmaas.pdf
Lawrence, S., Giles, C.L., Tsoi, Ah. C. and Back, A.D. (1997). “Face recognition: a convolutional neural-network approach”. IEEE Transactions on Neural Networks. Volume 8, Issue 1. Jan. 1997. pp98 – 113
Nagel, J.-L., Stadelmann, P., Ansorge, M. and Pellandini, F. (2003). “Comparison of feature extraction techniques for face verification using elastic graph matching on low-power mobile devices”. Computer as a Tool. The IEEE Region 8, EUROCON 2003. Volume 2, Issue , 22-24 Sept. 2003.pp365-369
Pan, Z. and Bolouri, H. (1999). "High Speed Face Recognition Based on Discrete Cosine Transforms and Neural Networks". Retrieved on 12th August 2007 from http://citeseer.ist.psu.edu/cache/papers/cs/13206/http:zSzzSzstrc.herts.ac.ukzSzNSGwebzSzPanzSzpaperszSzdct.pdf/pan99high.pdf
Pentland, A., Starner, T., Etcoff, N., Masoiu, A., Oliyide, O., and Turk, M. (1993). “Experiments with eigenfaces. In Looking at People Workshop, International Joint Conference on Artificial Intelligence 1993, Chamberry, France, 1993.
Pentland, A., Moghaddam, B., and Starner, T. (1994). “View-based and modular eigenspaces for face recognition”. IEEE Computer Society Conference on Computer Vision and Pattern Recognition. Volume , Issue , 21-23 Jun 1994.pp84-91
Phillips, P.J., Moon, H., Rizvi, S.A., and Rauss, P.J. (2000). “The FERET evaluation methodology for face-recognition algorithms”. IEEE Transactions on Pattern Analysis and Machine Intelligence. Volume 22, Issue 10, Oct. 2000 .pp 1090- 1104

Section 2 – Information Systems Security & Web Technologies and Security
225
National Institute of Standards and Technology (NIST). (2007). “FRVT 2006 and ICE 2006: Large-Scale Results”. NISTIR 7408. Retrieved on 12th August 2007 from http://www.frvt.org/FRVT2006/docs/FRVT2006andICE2006LargeScaleReport.pdf
Spies, H., and Ricketts, I. (2000). “Face Recognition in Fourier Space”. Retrieved on 2nd of August 2007 from http://citeseer.ist.psu.edu/cache/papers/cs/22946/http:zSzzSzklimt.iwr. uniheidelberg.dezSz~hspieszSz.zSzpdfzSzSpies_VI2000.pdf/face-recognition-in-fourier.pdf
Rosa, L. (2007). “Face Recognition System”. Retrieved on 25th September 2007 from http://www.advancedsourcecode.com/
Zana, Y. and Cesar-JR, R.M., (2006). “Face Recognition Based on Polar Frequency Features”. ACM Transactions on applied perception (TAP). Volume 3, No.1, January 2006, pp62-82. retrieved on 12th of August 2007 from http://arxiv.org/ftp/cs/papers/0509/0509082.pdf

Advances in Networks, Computing and Communications 6
226
Implementation of the Least Privilege Principle on Windows XP, Windows Vista and Linux
L.Scalbert and P.S.Dowland
Centre for Information Security and Network Research, University of Plymouth, Plymouth, United Kingdom
e-mail: [email protected]
Abstract
The least privilege principle can solve some of the problems in Operating System security. It consists of running programs with only the needed rights for the operations expected from them. Thus, the unexpected actions on a program such as an attack are blocked. This paper compares its current implementation on Windows XP (service pack 3), Windows Vista (service pack 1) and Linux (kernel 2.6).
Keywords
Least privilege principle, security by isolation, separation of privileges, Operating System Security, Linux Security, Windows Security
1 Introduction
1.1 Approaches in computer security
Modern Operating Systems are designed for being more and more secured. Besides adding new security mechanisms, four main approaches have been adopted for improving the security of Operating Systems (Rutkowska 2008). The first one consists of thinking the security from their design stage. This is called security by correctness. Methodologies such as the Microsoft’s Secure Development Life-cycle are intended to reduce the number of bugs in code that might result in security holes. Development tools include now some heuristic algorithms for detecting security bugs. Think for example of the argument –wall on the gcc compiler.
Since bugs are (and will still be) unavoidable, a second approach called security by obscurity completes the first one. Even if a flaw is found on the code, it should not be exploitable (or at least difficultly exploitable). Some attacks target some components that are constants or located at the same place. Randomizing some elements in the code and their location in memory could make such an attack defeat. Microsoft Windows Vista includes for example Address Space Layout Randomization that places the elements of the kernel randomly on memory.
The security by reduction of the surface of attack consists of disabling the unnecessary programs and services on the computer. The purpose of this approach is to avoid a potential attacker from using them for attacking the system. Some

Section 2 – Information Systems Security & Web Technologies and Security
227
potentially dangerous programs are not installed by default out-the-box on the newest versions of the Operating Systems. The tool tftp is now more and more uninstalled out-of-the-box as it can be used by an attacker that got an access to the command-line interpreter and want then to download tools to go further (Johansson 2006).
The fourth approach, which the paper focuses more on, is the security by isolation. It consists of breaking down the elements of the system into smaller and independent parts. The set of actions that could be carried out on a computer system is commonly called the privileges. The principle of least privilege is a kind of security by isolation. Indeed, it breaks down the privileges into small individual parts. Then it makes sure that programs run only with the needed privileges for the action expected from them. The purpose of the least privilege principle is to prevent attacker (may be either a hacker or malware) from breaking the security of the system. The difficulty resides in defining properly the privileges so that programs have sufficient privileges for their actions but attackers not.
1.2 Privileges and users
Privileges are based on the Access Control mechanism that denies or grants the access of the users (the subjects) to the objects of system. Privileges are not actually always determined by Access Control, for example, under Windows, the right of shutting down the computer is for example determined by a policy instead of an Access Control List. Access Control Lists (ACL), which are attached to each object, determine which users can access an object or, in other words what the privileges of the users are on a given object.
Windows and Linux define basically two classes of user accounts. The super-users (called Administrator or System on Windows, root on Linux) have the full privileges on the system whereas the normal users have only a limited set of privileges. A user is actually represented by programs that run under its identity and inherit normally its privileges. In fact, it should inherit only the needed privileges of the users if the least privilege principle is applied. This is discussed later.
It is possible of performing a lot of malicious thing as a normal user such as deleting user files and installing a Trojan malware but as super-user it is possible to go a step further. Despites the Super-user has full access rights on the objects of system, it can also loads some programs (called modules on Linux, drivers on Windows) on the kernel-mode. Such a program, called rootkit, has the ability of taking over the mechanisms that are located on kernel-mode. Therefore, a rootkit can modify the Reference Monitor that is responsible for the Access Control. It can also hide processes and files related to a malware and even disable an antivirus.
Since everything is possible from a super-user account, the system is often targeted by attacks, called escalation of privilege attacks, which consists of getting an access to the privileges of the super-user from a normal user session. These attacks target generally the super-user programs that run from the computer start-up. Number of techniques such as the buffer overflow and shatter attacks involve redirecting the super-user program to a malicious piece of code, called shellcode. Since the

Advances in Networks, Computing and Communications 6
228
shellcode inherits the privileges of the super-user, it can open an access to the super-user account. However, bear in mind that some malware does not involve any complex attack. A malicious program may simply prompt the person behind the screen for elevating the privileges, which succeeds in most of the cases.
What would be desirable is to be preventing any attack and malware from compromising the system. Without changing the current model, it is possible to limit the privileges of the normal user and super-user to only to these that are necessary. The permissions of a program would therefore not be determined by the rights of a user but the privileges that are allowed to it. For example, if the privileges of a program are got by any manner, the attacker will not get the privileges of a user but only the one of the program.
Dispatching the privileges throughout only two users has also another disadvantage. Indeed, the term user is ambiguous as it can be either a person, the system itself or a program. The system does not make actually the difference between a real person and a program. root is used on Linux for running daemons but also by the person whom the duty is to administrate the system. A user may trust a real person but not a program as it might be a malware.
2 Windows XP
The privileges on Windows XP are not adroitly dispatched throughout the two kinds of user. Indeed, the privileges of the normal user do not allow using properly the system. A normal user cannot for example connect to a wireless network, view the calendar when it clicks to the clocks of taskbar… Furthermore, some programs have not been designed to work with a normal user account. The command run as can normally be used for getting the super-user privileges for executing administrating tasks. However, although the super-user privileges are needed for the elements of the control panel, this command is not available there. Since the normal user account is not quite usable, the super-user account administrator is by default used instead out-of-the-box. Thus, all actions that are performed on the computer are carried out as a super-user, which equals not handling the least privileges at all. Note that the privileges of administrator are actually a bit lower than the one of the super-user system but sufficiently high to install a driver into kernel-mode (and so a rootkit). As a consequence, administrator has full privileges on the system directly or indirectly.
On Windows XP (and also Vista), the privileges of the processes and threads are determined by their Access Token. Access Tokens contain the identifiers (called Security Identifier or SID) of users and groups that are used as subjects in the Access Control mechanism. Groups are basically a set of users that shares the same rights on objects. Thus, associating (respectively dissociating) a process with a group permits adding (respectively removing) it a set of object permissions. A method, called impersonation, can make some modification on the Access Token. Some SIDs can be added or removed for adjusting the privileges of a process or thread. However, the privileges cannot be set finely. The impersonation is actually used in most of cases for switching from the normal user privileges to the super-user privileges.

Section 2 – Information Systems Security & Web Technologies and Security
229
Some privileges are not based on Access Control. For example, the privilege of shutting down the computer is not but it still associated to some users. These privileges are set in the security policy. They are associated to the user and editable through the management console secpol.msc in local policies and then local rights assignment. If the administrator account needs to be used for maintaining the compatibility with applications, it should recommend then removing the privileges load and unload device drivers to the current administrator account and using another administrator account when installing device driver is necessary. This setting can prevent efficiently rootkit infections. Note this setting does not fortunately avoid a driver delivered with the Windows Operating System from being installed with the Plug and Play feature. Therefore, it is still to use for example USB storage key if this setting is applied.
3 Windows Vista
On Windows Vista, the privileges of the normal users have been reviewed. Normal user accounts are fully operational. The privileges can always be elevated to super-user privileges in a specific tasks need them.
Windows Vista implements the least privilege principle with the User Account Control feature. By default, programs run with privileges of the normal user. The system decides whether a program needs super-user privileges prior to its execution. If the program does not contain a header with the required level of privileges, a heuristic algorithm determines it instead. The case elevating the privileges is needed generally arises when a new software or device is going to be installed. A dialog box prompts then the computer user for elevating the privileges.
User Account Control avoids using the super-user privileges when it is not necessary. However to our opinion, it is not sufficient for fully implementing the least privileges principle. Indeed, the privileges are set to either one of two levels of privileges instead of the privileges the process really needs. It would have been better at least to design an intermediate level of privileges. Installing software should not require the same level of privilege as installing device drivers. Indeed, the driver might be in fact a rootkit. An installer program should instead run at an intermediate level of privileges that would prevent it from installing drivers. If a driver needed to be installed, another dialog box could be displayed for asking the user if it really wants to do so. The dialog box would need to be designed in a manner the user would understand that it going to install a driver for a new hardware (or may be for security software).
Our recommendation for preventing a driver from being installed without the user’s consent is to disable the privileges load and unload device drivers to the administrator as recommended for Windows XP as well.
The user interface of User Account Control could have been designed in a better manner. The dialog boxes for elevating the privileges propose only two choices: “continue” or “cancel”. The user does not even have the choice of running the application with restricted privileges in case it does not trust the application. If it

Advances in Networks, Computing and Communications 6
230
really needs to run the application, it will click “continue”, which will execute the application at its own risk.
A common complain about User Account Control is that too many dialog boxes request actions from users (Johansson 2007). Firstly, it was experienced that some installation programs triggered two or more dialog boxes although only one would have been necessary. Secondly, when navigating through the elements of the control panel, too many dialog boxes are displayed. If the authorization were kept temporarily, at least for the Microsoft’s elements of the Control Panel. The high number of UAC dialog boxes has certainly a perverse effect on the computer user. Indeed, the user can become so accustomed to them that it might reply automatically “continue” anytime it see one of them without thinking to the consequences (Johansson 2007). The dialog boxes can also become so annoying for the user that it might decide to disable completely UAC. That would be bad for the security as that would result in coming back to the privilege model of Windows XP.
Another bad point with UAC is that there is an algorithm decides that a program requires administrator privileges. If the system decides the elevation of privilege is needed, there is no way by default to run the application at a low level of privileges. Indeed, the User Account Control dialog box suggests only two choices continue or cancel. It is recommend that disabling the policy Detect application installations and prompt for elevation (in secpol.msc, local policies and then security options) in order to disable the algorithm. Thus, all the applications run at a low level of privileges unless specifically requesting them to be loaded at the high level of privileges.
Mandatory Integrity Control is the feature of Windows Vista whom the duty is to put boundaries between the different levels privileges. It is used as a part of the User Account Control mechanism but provides also two more security features. The first one consists of preventing the shatter attacks, which target the graphical windows of super-user process for escalating privileges, by introducing a kind of Access Control on graphical windows. The second one is more related to our discussion as it provides a way of executing program at low level of privileges. This feature is similar to a sandboxing mechanism. The processes that run at the low level of privileges can only access files in read-only mode (excepting the setting files that are related to the specific program) in order to keep their integrity. Internet Explorer is as far the only one application that takes benefit of the feature. Thus, a malware that come from Internet cannot alter system files and personal documents. Note that the application needs to be designed for running in this sandboxing mode.
4 Linux
By default on Linux, all actions are performed as normal user. Like on Windows, the privileges of the super-user can be obtained on demand. Linux shared also the same problem as Windows. As soon the privileges are elevated, everything could be done on the system, including installing a rootkit.
Some programming methods exist for limiting the privileges of the super-user program. If they are used, they can considerably limit the consequence of an

Section 2 – Information Systems Security & Web Technologies and Security
231
escalation of privilege attack. Indeed, in case the attack succeeds, the attacker just gets the privileges that were allowed to the targeted program.
The capabilities were introduced with the kernel 2.2. They “divide the privileges traditionally associated with super-user into distinct units that can be independently enabled and disabled” in a program. For example, the capability CAP_SYS_MODULE and CAP_SYS_TIME control respectively the permissions of loading kernel modules and changing the system clock. The best practice regarding the least privilege principle consists of allowing only the necessary capabilities to a super-user program. Note this is only efficient if the capability CAP_SETPCAP that controls the ability of changing privileges is disabled.
Note also the utility lcap, provided with Linux, is able to disable the capability for whole system. It can be used on a start-up script in /etc/init.d (or an equivalent directory depending of the Linux distribution) for removing some capabilities to root from the machine start-up. Thus, a simple script can disable CAP_SYS_MODULE, which results of preventing rootkit from being loaded. However, the script (or the lcap program itself) can be easily deleted in order to remove the protection at the next reboot. It can be recommend instead building a static Linux kernel, which does not support modules. This can be done by disabling the Enable loadable module support option during the configuration stage of the kernel compilation and then selecting all the need the needed kernel components. Note that selecting the right components that will be built with the kernel is not an easy task but the method is very efficient as the protection cannot be disabled (NB a rootkit can still be installed by patching the kernel).
Root Set UID programs have the particularity of being executed by a normal user but with the privileges of the super-user root. They could be therefore targeted by an escalation of privilege attacks. It is strongly recommended to use the capabilities for limiting the privileges of root Set UID programs. Another technique should be used as well. It consists of not using the identity of root when it is not necessary during the execution of the Set UID program. The identity can be dropped temporarily to the one of the normal user if it needs to be restored afterwards or permanently otherwise. However, the developer should not assume that the identity always drops as requested. Indeed, the capability CAP_SETUID controls the ability of changing the ability. If it is disabled, the identity does not change as expected.
Another way of implementing the least privilege principle is to implement Mandatory Access Control. This consists of denying by default any access from a subject to an object unless it has been explicitly authorized on a policy. SE Linux is one of its popular implementations on Linux. It does not replace the traditional Discretionary Access Control mechanism but completes it. Indeed, if the access is granted by the Discretionary Access Control, then the Mandatory Access Control checks whether the access is permitted by the policy. Since it would be impossible to include on a policy all the authorized combinations of accesses from subjects to objects, SE Linux implements type enforcement. A type is tagged to every subject and object. The policy defines actually which types of subject can access to which types of objects. If no rule concerns the access from a type of subject to a type of object, the access is denied. SE Linux makes also the difference between a real

Advances in Networks, Computing and Communications 6
232
person and a program and so adjusts the privileges to the situation. Thus, some actions like changing a password can be only performed by a real person and so not by a malware. However, the difficulty with Mandatory Access Control is the policy is difficult to set properly. Indeed our experience with SE Linux showed that, if the rules contained on the policy are too permissive, they are not efficient enough. And on the other side, if they are too strict, some accesses can unwillingly be denied. Note that SE Linux is only efficient if it is set in a way it cannot be disabled. However, this means once the SE Linux is applied it cannot be changed. This is only conceivable in a corporate environment where system images are deployed on every computer. Thus changing the policy can be done by changing a previous system image that does not contain SE Linux applied.
Linux has also a powerful command chroot that provides a way of executing program in a safe context. chroot does not actually protect the system by dropping the level of privileges the application run at. It acts as a sandbox mechanism, which means the application is executed in a virtual context separated from the real one. The program works on a virtual directory that is totally separated from the rest of the file system. Thus, the confidentiality and the integrity of the data present on the file system are assured. This sandbox mechanism can be used for running critical root applications on a separate context. Since the programs on the sandbox do not use the real file structure, it can be difficult to make some programs run on the sandbox. This is the limit the possibility of applications of chroot.
5 Conclusion
The privilege model of security of Windows XP is clearly obsolete in comparison to the Windows Vista and Linux security model. It is difficult to determine which architecture is better secured between Linux and Windows Vista. The fact is there is a lot of Linux distribution that does not all offer the same level of security.
We suggested some security settings for reducing the privileges of the user. Some of them can avoid the systems from being infected by a rootkit. All these settings can significantly improve the security of these systems. To our opinion, the Linux system has a security advantage. Indeed, Linux has the ability of controlling everything. Thus it is possible applying more finely settings that can significantly improve the privilege model of the system. The Windows system is more closed and some components look actually like black boxes.
We pointed also out two main weaknesses that are shared on the three systems. First of all, the privileges on the system are determined by only two levels of users. Some enhancements to this privileges model are available on the three systems (we suggested some of them). It would be necessary redefining entirely the privileges model. A solution would consist of breaking down the privileges into small entities and another of differentiating the super-user account that is used by the administrator from the one that is used by the system.
If some boundaries exist to isolate processes on the user-mode, no boundary exists on the kernel-mode. Therefore, the security model can be bypassed by rootkit by

Section 2 – Information Systems Security & Web Technologies and Security
233
inserting drivers into the kernel mode. This paper has suggested some tips for preventing rootkit infection. The best thing would be that Operating System designers place the device drivers on a separate layer on top of the kernel and make the kernel static. Midori, which is the Microsoft research project for developing the Windows’s successor, uses such architecture (Worthington 2008). Since the Operating Systems that are designed in this way are totally different from the traditional Operating Systems, the old application cannot be re-used normally. The problem can nevertheless be sorted out by using virtualization technologies.
6 Reference
Johansson 2006. Anatomy of a network hack: How to get your network hacked in 10 easy steps - webcast. Microsoft (Ed) Journées Microsoft de la sécurité. Paris. http://www.microsoft.com/france/vision/WebcastTechnet.aspx?EID=941a1463-43aa-49b0-b52c-789cae0b2569 Johansson. 2007. Security watch the long-term impact of user account control. http://technet.microsoft.com/en-us/magazine/cc137811.aspx. [Accessed 25-08-2008] Rutkowska. 2008. The three approaches to computer security. http://theinvisiblethings.blogspot.com/2008/09/three-approaches-to-computer-security.html. [Accessed 4-09-2008] Worthington 2008. Microsoft's plans for post-windows os revealed. http://www.sdtimes.com/microsoft_s_plans_for_post_windows_os_revealed/about_cloudcomputing_and_mobiledevelopment_and_net_and_soasaas_and_softwaredevelopment_and_windows_and_microsoft/32627. [Accessed 18-09-2008]
Advances in Networks, Computing and Communications 6
234
Design and Development of Hard Disk Images for use in Computer Forensics
S.Siddiqui and N.L.Clarke
Centre for Information Security and Network Research, University of Plymouth, Plymouth, United Kingdom
e‐mail: [email protected]
Abstract
Educating people in new domains on new technologies requires good practise. But educating people has its own limitation as forensic is a very sophisticated job and it will not be sufficient to make an untrained person part of an investigation in order to get him trained because his less technical skills might cost loss of important evidences. Here the questions arrives then how to train and educate people about collecting digital evidences without involving them in real scenario and even if they get trained but it remains doubtful that either they would be enough capable of handling real crime situations or not. This research paper has been made on behalf of the research & experiment conducted on designing a forensic bit level image which would be useful for educating people about forensic examination. People can benefit from the designed image by evaluating their skills through trying to recover all possible artefacts. One of the main priorities of the research was to design an image which should look much closer to the images captured from the actual drives found on real crime scenes in order to provide users a much practical and professional experience. Presence of anti forensics artefacts in crime case assures investigators that their job will not be easy this time or might be end up with failure as anti forensic utilities are used to thwart the crime investigations, That’s why one of the most common crime has picked and also included essence of anti forensic to produce a list of artefacts which later practised on the experiment drive. A chronology of approx 80 artefacts has made which truly reflects a crime of employee conspiracy which is supposed to be one of the crucial issues in every next organization.
Keywords
Digital forensic, Security education, Hard disk imaging
1 Introduction
Rapid advancement in technology made the abusers more sophisticated which results involvement of computers in almost every next crime. Any level of involvement of computers in a crime makes it necessary to get examine by responsible officials who can identify what exactly went through the suspect machine. To convict the suspect requires evidence which brings the need of digital forensic which have the capability to dig further into all technology mediums in order to identify and preserve the digital evidence. Computer crimes are increasing rapidly day by day and for dealing them it requires a good number of experienced forensic experts which unfortunately departments does not have. Getting the inexperienced staff on crimes scenes and involving them on forensic examination creates a high risk of losing digital

Section 2 – Information Systems Security & Web Technologies and Security
235
evidences by making them tampered or overwritten which results prosecution to weaken the impact of the collected evidence against them.
Here is the question arrives that how to train and educate people about collecting digital evidences without involving them in real scenarios and even if they get trained but it remains doubtful that either they would be enough capable of handling real crime situations or not. On actual crime spots the very first thing an investigator does is to capture a bit level copy of found storage mediums and then begins analysing them. If a copy of those images provided to the beginners then it will hurt the privacy of the suspect as it is against the privacy legislation because passing drive images to people who are not directly connected to the investigation will become illegal as the suspect has the right of maintaining his privacy does not matter he is criminal or not (RFC 3227, 2002). Other than that passing actual crime images neither will it give a good platform in educating people as it will make them difficult to explore random huge GB drives because they really does not know the much background of the crime and the image, so that they will keep wasting time in searching different bits of the image. Therefore the best practise would be to design a smaller drive images which contains variety of suspicious stuff that makes the user familiar with all kind of common techniques used by abusers and they can learn the skill of differentiating casual activities among suspicious activities as well. In real world most of the times investigators come across those cases which based on sophisticated criminals who tries their best to thwart investigation process against them through using stegnography, encryption, overwriting recycle bin, and forensically wiping data. Along with simple illegal activities if the drive image contains above all anti forensics techniques as well that makes the image useful for all level of people who can utilize image according to their technical background. After playing with some special designed images people can get enough educated and they would be able to meet the level of real crime scenario investigation.
2 Research & Experiment Methodology
The initial phase of the methodology was to gain sufficient knowledge about digital forensic (mentioned above in the flow diagram), There are many technology products that can hold digital evidences such as hard drives, IPODS, network cards, floppy disks, memory sticks, magnetic tapes, firewalls, and routers. Exposure to all these hardware’s and different kinds of computing environments is essential to develop expertise in dealing with digital evidences as different type of hardware might be encountered since different equipment and expertise is required for terabytes of storage versus miniature systems. Different crimes result in different types of digital evidences like cyber stalkers mostly use email to harass their victims, child pornographers sometimes have digitized images stored on their systems (Casey 2004, p.216). Increased work load on digital forensics has forced to form sub domains which includes specialised categories of System, Network, and Mobile forensics. It is apparent that single individual can not successfully handle crimes which based on different platforms as it is quite rare an investigator carries deep knowledge of each domain. But knowledge of operating system, artefacts and anti-forensic artefacts remain common in all domain of digital forensic.

Advances in Networks, Computing and Communications 6
236
Figure 1: Research Methodology
An artefact is something created or shaped by human craft, Digital forensic artefacts are found on multiple locations of a storage medium which produced according to the behavioural activities of users. Several bits of a storage medium used to explore when investigators needs to identify the purpose behind the crime and if a nature of a crime is known than investigators remains focused on exploring only specific domain of artefacts.
Presence of anti forensics artefacts in crime case assures investigators that their job will not be easy this time or might be end up with failure as anti forensic utilities are used to thwart the crime investigations by overwriting, encrypting, and hiding their all possible foot marks (Hackaholic, n.d.).
After understanding the fundamentals of forensic, 3rd phase of the methodology (mentioned above in the flow diagram) includes a crime story in order to produce artefacts according to the scope of the crime. And In the last phase those artefacts will get perform on the 8 GB hard drive and makes the drive ready to get forensically imaged.
2.1 Crime Scenario for Designing Image
A practical crime scenario is the need for producing effective chronology, more effective chronology results broad range of artefacts which will make the image more interesting in analysing and useful for educating people. Crime of conspiracy

Section 2 – Information Systems Security & Web Technologies and Security
237
makes several things to look suspicious which bounds investigators to search for all emails, chats, history, documents, and hardware in order to find the digital evidences. In contrast to conspiracy with other destructive crimes like hacking, and spreading malwares that only makes the installed software and programming editors suspicious in the development of crime, which does not gives broad area to look for. Picking the crime scene below gives a broad range of artefacts which brings out variety of activities to add in crime chronology.
The Crime scenario is based on two employees who belongs to their competitor companies, Sid who is one of the trusty employees of Marine shipping meet John (Senior official of Titans) 1st time on a joint conference arranged by all shipping groups together. After having a general chit chat they exchanged their contacts details before leaving, later Sid received an informal email from John in order to plan a get together. John offered Sid a lucrative package which was way better to his current job at Marine Service but in condition he asked him to pass some confidential records of his company and offered him bribes for that conspiracy. Sid accepted his offer but to remain safe from all formal inquiries he opened a new back account to hide his additional income and studied about anti forensic techniques in order to thwart future investigations. Sid and John have made many conversations through Email and Instant Messengers and shared loads off confidential documents, to hide data exchanges and removing digital evidence Sid practised his anti-forensic skills by installing stegnography, virtual memory safe, and overwriting recycle bin software’s. In addition to divert the attention of expected future investigation he added few random data including documents, images and tried deliberately to hide them suspiciously by encrypting or renaming file extensions. As his intentions were that even if someone examines his machine they will get busy in sorting and understanding the objective behind those suspicious files and that will lead the investigation towards wrong way and he will get safe from his actual crime.
2.2 Selected Artefacts
Internet Explore Cookie, Cache, History
Instant Messaging Chat logs, File transfer, webcam images
Peer 2 Peer IP activity, connected hosts, host cache, file cache
Email Text, Attachments, contacts lists
Storage media Hard drive, USB, DVD, CD
Router/Firewall Logs, ACLs
Software’s Hacking, Encryption, Stegnography
Print Printing documents (RAW & EMF files)

Advances in Networks, Computing and Communications 6
238
2.2.1 Used Anti-Forensic Artefacts
Anti forensic artefacts have been used to made the drive look closer to the actual crimes happening around, which will prove more beneficial for users to get educated about forensic limitations.
Safebit software has been used in order to store documents in a virtual safe which are supposed to be in visible and un detectable in front of others and the most important thing that files stored in virtual safe never appears in any sort of search and it never occupies any level of memory which becomes more deceptive because of its ability of not increasing the memory consumption after storing documents in the safe (Download, 2007).
Stenography uses for hiding data onto files without making in notice to others. Hider software has been used for performing stenography on documents, through stenography text, jpeg, and other extension files can be embedded onto another file and later can be retrieved after entering the secret key (Lillard, 2003). The files first encrypted then embedded onto a carrier file after entering the secret key, even if the middle man sniffed the carrier file but he will not be able to identify that this file contains another file or in any case if someone has discovered that particular embedded file but still he needs the key to decrypt the original encrypted file to read. Such complex technology is supposed to be the most deadly utility of anti-forensic domain which hardly becomes detectable for investigators (Softaward, 2004).
Clean Disk Security software used for completely removing the traces of deleted files existence in recycle bin. Deleting files normally just removes the file directory index but the data itself remains stored on the memory mediums and by the use of data recovery software’s the deleted file index can be restored which results in providing the access of the deleted file again. Use of this anti forensic software means assurance of vanishing all possible traces of the files (Clean Disk Security, n.d.).
2.3 Chronology of Conspiracy
Regrouping all activities according to their periods and forming a chronology helps investigators to understand the seriousness of a crime and it indeed plays a vital role in searching the smoke gun. Chronology is basically the sequential order in which past events occur, its basically a science of arranging time in periods and a reference work organized according to the dates of events.
A detailed chronology has made and practised on the experimental drive which leads the investigation towards crime of conspiracy. The developed chronology starts from 18th/Oct/2007 up till 30th/Oct/2007 which included variety of incidents relevant and irrelevant to selected crime. Below is the brief example of the incidents have made which were rich of criminal, suspicious, anti-forensic, and casual activities in order to design a drive image which is much closer to the actual suspect’s drives.

Section 2 – Information Systems Security & Web Technologies and Security
239
Date/ Time
Description Of Artefact Artefact Tech. Conspiracy
18/Oct/07 Image transfer from digital camera to my pictures in the folder ‘conference 2007 ’, These images were taken on the joint conference of all shipping groups held in Plymouth
Storage media
None NO
24/Oct/07 Sid received an email from John, In which he offered him a lucrative package at Titans shipping which is a way better than his current job but in condition he has to pass some confidential information of his current company, They made this conversation through MS Outlook
Email attachment
None YES
25/Oct/07 Sid sent a positive rely to john’s offer of bribery
Email text None YES
26/Oct/07 Sid browsed Yahoo webpage Web Cookies,
Cache
None NO
26/Oct/07 Instant Conversation b/w Sid and Sarah, Their conversation shows Sarah was Sid’s girlfriend but she was not part of the conspiracy as no activities shows any involvement of her in the crime scene
Instant Messenger chat logs
None NO
27/Oct/07 Sid browsed web page of HSBC to open a new account in order to hide his under the table benefits
Web Cookies,
Cache
None YES
27/Oct/07 Sid browsed some Anti-forensics pages which shows he was afraid of forensic investigation and he was looking for some way outs to avoid evidence collection. A “Anti Digital Forensic.pdf” was downloaded and copied to USB. Sid deleted that pdf on the same day when it was downloaded.
Web Cookies,
Cache
Storage media
Deleted
files
None
None
Deletion
YES
28/Oct/07 Online shopping of mobile phone through carphone warehouse web site
Web Cookies,
Cache
None NO
28/Oct/07 Three MS Excel files (confidential1.xls, confidential2.xls, confidential3.xls) which contains crucial information about the company has transferred to John through MS Outlook
Email attachment
None YES
29/Oct/07 Sid created a word document “New word document.docx” which contains confidential information about the company, He encrypted the document before transferring through Instant Messenger as
Instant Messenger
File transfer
Encryption YES

Advances in Networks, Computing and Communications 6
240
except john if any one else tries to access it would not become successful
29/Oct/07 Sid browsed Google web page and it seems he was searching for a particular singer or song, As all pages belongs to a similar artist
Web Cookies,
Cache
None NO
29/Oct/07 Conversion of “sdsd.jpg” extension file into “sdsd.ppt”, Although the files did not contain conspiracy stuff but this has been done to divert the attention of investigators
File Signatures
Changed extensions
YES
29/Oct/07 Browsed news paper websites Web Cookies,
Cache
None NO
30/Oct/07 (a) Documents was scanned and then saved into a different file extension, Which makes the file open able but after opening it will show nothing except garbage values.
(b) Sid installed stenography
software and later those files were stegoed and sent through email attachment, Stego process will embed secret data in the file which remain invisible for others and that data can be recovered by entering a secret key.
Registry files
File
Signatures
Installed Software’s
attachment
Changed extensions
None
Stego
YES
30/Oct/07 Couple of important documents (print1.doc, print2.doc) had been printed
Printing jobs
(EMF, RAW files)
None YES
30/Oct/07 Transferring Images from Digital cam to PC, These were just causal pics taken in the office cafeteria
Interconnecting
Hardware
None NO
30/Oct/07
Sid installed Safebit anti forensic software, Files hidden by software are highly unlikely to become traceable, Multiple files (asasasa.jpg, dasd.file, hellopak33) had stored in virtual memory by creating a virtual safe containing name “Mysafe”
File Signatures
Hiding data
YES
Table 1: Brief Sample of actual experiment chronology

Section 2 – Information Systems Security & Web Technologies and Security
241
3 Discussion on Designed Image
After analysing the image one can get a perfect start for becoming a System Forensic investigator which is the foundation of all forensic domains, as this image explores all the possible artefacts of an system including documents, web browser, email, printing, scanning, storage medium, and installed software’s which leads individual to a solid foundation of systems forensic
Detecting stego files are a bit rear due to its nature of deception, The file that contains steganographically hidden information is somewhat proportional to the popularity of the software package. The software used in the experiment hard drive was not renowned and commonly available to masses, and if a new method formulated privately and used carefully then chances are that its existence would never become alerting (Caloyannides, p-246).
EMF & RAW print jobs will not be found in the print spool as they get deleted once the printing job has been done. Mostly these files are expected to be found in slack spaces and unallocated clusters but chances of tracing them become low with the passage of time as the data keep overwriting on slack spaces (Encase, p-381). So that could be the valid reason if one will not recover printing jobs as there were already just couple of printing activities made according to the chronology therefore couple of jobs will not take much time to get overwrite under slack space.
The designed image could also be very useful in performing a comprehensive evolution of tools, people if want to identify which forensic tool is more powerful than they can play with the same image by using different tools and can verify how many artefacts they managed to recover through each tool.
4 Conclusion
This designed hard drive image contains verity of colours of forensics & anti forensics and one could get extensive knowledge and practise while playing with this image. Various artefacts have been created in order to give broader scope to explore different areas of a hard drive and other than that anti forensic techniques has been used to improve the skill level by making them difficult in finding evidences and forcing them to think the way outs against them. The image created email traces by using both web based and software based email communication which indeed gives a useful exposure of discovering both the technologies, banking and many other web sites have browsed to give good exposure in sorting Cache & History between relevant and irrelevant sites to crime. Other than that the image contains the traces of existence of weird software’s and un compatible file extensions which provides a better platform to learn more about difficulties in forensics investigations
5 Reference
Casey (2004), Digital Evidence and Computer Crime, Academic Press, Britain
Caloyannides (2004), Privacy Protection and Computer Forensic, Artech House, London

Advances in Networks, Computing and Communications 6
242
Disk cleaners n.d., http://www.diskcleaners.com/clndisk.html (accessed on 10/Nov/2007)
Download (2007), http://www.download.com/SafeBit-Disk-Encryption/3000-2092_4-10711654.html?tag=lst-1 (accessed on 10/Oct/2007)
Bunting, Wei (2006), Encase Computer Forensic, Wiley, USA
Hackaholic n.d., “Anti forensic”, http://ws.hackaholic.org/slides/AntiForensics-CodeBreakers2006-Translation-To-English.pdf (accessed on 10/Oct/2007)
Lillard (2003), “Steganography-based techniques using Encase”, http://www.cit.uws.edu.au/compsci/computerforensics/Online%20Materials/SteganographyEFE4.pdf (accessed on 29/05/2007)
RFC 3227 (2002), “Guidelines for Evidence Collection and Archiving”, http://www.faqs.org/rfcs/rfc3227.html (accessed on 3/Dec/2007)
Softaward (2004), http://www.softaward.com/3519.html (accessed on 15/Dec/2007)

Section 3 – Communications Engineering and Signal Processing
243
Section 3
Communications Engineering and Signal Processing

Advances in Networks, Computing and Communications 6
244

Section 3 – Communications Engineering and Signal Processing
245
Article Surveillance Magnetic Marker with Built-In Security
M.Gaschet and L.Panina
School of Computing, Communications and Electronics, University of Plymouth
Abstract
The present Article Surveillance System using Magnetic Markers with Built-In Security is a portable classification system, based upon bistable microwires. The production of these microwires is incredibly cheap, making the system very interesting for a large number of applications from high risk applications such as banknotes, to low risk applications such as deposit/refund system of empty beverages. This publication describes the study carried out on the microwires and their implementation into a new detection system.
Keywords
Magnetic Markers, Microwires, Fast Remagnetisation, Classification System.
1 Introduction
Numerous systems exist to classify products and each one has its advantages and its drawbacks. Two of the most known and spread systems are the bar code identification system, for low risk applications, and the radio frequency identification system (RFID), for higher risk applications. Whereas the first provides a very cheap authentication but a slow reading at close distance, the second provides a fast and reliable reading at higher cost.
At terms, the new article surveillance system described in this publication may well have the qualities of RFID, for a cost similar to bar codes. In addition, the electronics involved in the actual detection device is enough polyvalent to make the system easily adaptable to numerous cases of application.
This paper describes the properties of the microwires, the experimental design used to carry out their study and the results of this study. The use of Matlab software to design and simulate the detection algorithms and finally, present the portable device. The paper concludes on an evaluation of the work done.
2 Magnetic Properties of the Microwires
The magnetic markers used in the system are composed of a microwire on a substrate. This last can be either a simple piece of paper without effect, or a material having magnetic properties that alter the magnetic behaviour of the microwire. The microwires are in fact fine fibres of CoFe-base amorphous alloys, i.e. ferromagnetic materials with positive magnetostriction. Such microwire is formed of an insulating

Advances in Networks, Computing and Communications 6
246
coating and a metallic core with the desired magnetic properties. In our case the coating is glass and the core is the CoFe-based amorphous alloy, as shown in Figure 1. The composition of the metallic core, the length of the sample and the ratio of the diameter of the core on the diameter of the glass coating ( ) have an impact on the
general magnetic behaviour of the microwire. Therefore, these parameters can be used to increase the diversity of its response to an interrogative system.
Figure 1: Schematic of the glass-coated microwire.
The principle of the detection is simple: in an external, strong and varying magnetic field (H-field), the bistable microwire will be subject to its magnetisation process. Since the microwire has been chosen to perform very fast transitions between its 2 saturation states and the structure is amorphous (hence contains a lot of obstructions), the Barkhausen effect is very strong. Each time the magnetisation turns down to the opposite direction (i.e. each time the H-field exceeds the threshold value around +/- Hc, the coercitive field of the microwire), the large Barkhausen jumps can be detected by pick-up coils wound around the microwire, by series of sharp peaks of voltage. The bistable wire chosen has a relatively rectangular magnetisation loop and thus, short transition duration. This last added with the smallest possible fluctuations in the switching field (i.e. two similar microwires will switch almost at the same time), make short duration and large amplitude voltage pulses. Therefore, the microwires provide signals easily detectable and differentiable. The Figure 2 is a plot on a period of the driving field, which is the sine. It can easily be seen that the pulse resulting of the fast remagnetisations of the microwire. The Figure 3 is a zoom of the pulse. Before the field reaches 2.0 Oe, the polarisation of the microwire is mostly oriented left. Whereas the field increases, the magnetic domains change at the extremities, until the polarisation is mostly right. The surrounding magnetic field is altered and a tight and strong pulse appears.
Figure 2: Pulses of transition. Figure 3: Zoom of the transition.
Amorphous alloy core
Glass coating
Driving magnetic field
Pulses of the switching field
Oe
s s
Oe

Section 3 – Communications Engineering and Signal Processing
247
In order to add complexity to the signature of the magnetic marker, the microwire is attached to a semi-hard magnetic layer which has a specific magnetic pattern, recorded during the marker fabrication. The resulting magnetic behaviour is due to the large magnetic domains (1 to 4mm long) with opposite magnetisation all along the substrate (see Figure 4) that creates local stray fields. These local H-fields will modify the excitation conditions and therefore, the voltage response waveform. The voltage response is no more just a single peak, but several predictable peaks that will be used to add security. Of course, the coercitive field of the magnetic layer is a lot higher (> 250 Oe) than the one of the microwire. Consequently, the detection process will not modify the magnetic pattern of the substrate.
Figure 4: Schematic of the magnetic domains of the substrate.
The deactivation feature is reached by applying a very strong alternative H-field which gradually decreases to zero (Degaussing process), creating smaller magnetic domains. The local H-fields are so small that they do not modify anymore the voltage response waveform. Therefore, only one peak is detected: the one of the microwire alone (see Figures 5 and 6). This kind of process can be described as irreversible since the coercitive field of the substrate is very high and its state will not change unless applying a very strong H-field.
Figure 5: Marker activated. Figure 6: Marker deactivated.
The main parameter of a microwire is the coercitive field. The coercitive field influents on the switching characteristic of the microwire, i.e. the given moment related to the applied magnetic field at which the polarisation of the microwire changes of direction. If this applied magnetic field is a sine, it can be used to determine the periodic time at which the fast remagnetisation occurs, called switching time. Of course this time depends on the frequency and the magnitude of the sine; however it can be used to differentiate the several microwires present at the same time in the system. Choosing a right set of microwires to obtain a regular range of switching times is essential. As the microwires behave independently when there are placed together in the pickup coils, it is possible to distinguish which ones are detected, which ones are not present: consequently a detection system is obtained with codes of several bits (equal to the number of microwires involved). For
Microwire

Advances in Networks, Computing and Communications 6
248
example, if 10 distinguishable microwires are used, the system uses codes of 10 bits or 1024 different combinations.
3 Study of the Microwires
The technique used to detect the alteration of the magnetic field done by the microwires, requires a homogeneous driving magnetic field and two identical pickup coils. These lasts, put inside the homogeneous field, generate two identical electrical signals depending on the magnetic field they are experiencing. However if a microwire is placed inside one of these two coils, the output of this coil is the electrical image of the driving magnetic field plus the pulse of the microwire whereas the output of the second coil is still the image of the driving magnetic field alone. The difference of the two outputs cancels the component resulting from the driving field and only the alteration of the field done by the fast remagnetisation of the microwire stays (see Figure 7). This is a differential measurement: the common signal is cancelled and only the signal specific to one of the two devices is kept. The homogenous driving magnetic field is generated by Helmholtz coils. This experimental design is used to measure the characteristics of the microwires:
The magnitude of the voltage pulse at the remagnetisation. The voltage pulse duration, or the width. The switching time, or the triggering voltage threshold. The fluctuation of the switching time.
Figure 7: The experimental measure.
The length at which the samples are chopped is also a decisive factor that influents both the magnitude and the width the pulse. Consequently, the study had to determine the effects of the length of samples on their magnetic behaviour. It was also aimed to get a classification of the different microwires, the final goal being to get a set of useable and compatible microwires at a fixed length.
The study showed that the switching time of a microwire is not dependant of the length. In most cases, increasing the length of the samples increases the magnitude of the pulse but also enlarges the pulse. This last is inconvenient because the risk of
Driving Magnetic
Field
Driving Magnetic Field
Measured
Altered Magnetic Field
Measured
Switching Magnetic Field
Alone

Section 3 – Communications Engineering and Signal Processing
249
overlapping of the pulses is greater. Therefore, for a working system, the number of bits has to be smaller. Considering these various factors, the length was fixed to 2 cm, best trade-off between miniaturisation, width and peak amplitude of the pulse. The threshold voltage does vary depending on the samples but stays around an average value with fluctuations not greater than 15-20%.
Now that the length was fixed, a set of microwires of different types was needed. Only a few bits were required for the prototype. Therefore 3 or more types of microwires had to be “temporally compatible”, i.e. the pulses from the microwires should be distinguishable. It requires a time gap between the intervals of switching field fluctuation. From the materials at disposal, 8 microwires with the most different coercitive fields were chosen. Several measures were done to determine their temporal compatibilities: the diagram of the Figure 8 was obtained. The possible groups are either 3 fully compatible microwires (N9, N3 and M1) or 5 microwires (N9, M5, N3, M4 and M1). Nevertheless, this last is more disposed to errors.
Figure 8: Time compatibility between the types of microwires.
The widths of the pulses are almost the same for every microwire, i.e. 30 to 50 us. The usual frequency of the driving source is 100 Hz, hence the period is 10ms. The switching fields occur during the first quarter of the period (positive half of the sine = 5 ms) and during the third quarter of the period (negative half of the sine = 5 ms). If the dispersions in the switching fields were not so big and if the range of microwires were larger, a time slot could be allocated every 100 us for example. By obtaining 25 time slots therefore codes of 25 bits, which is a strong security system. However, in practice this is very difficult to realise. If the reasoning is pushed further, using a semi-saw tooth signal (linearly increasing from 0 V to +Vmax in the first half and then linearly decreasing from 0 to –Vmax in the second half) as the driving source still at 100 Hz, the full period useable is obtained, therefore 50 bits. This is the theoretical limit for a driving source at 100 Hz, making the assumption that the microwires produce pulses of width of 50 us exists at the needed switching times.
4 A System Detection using Matlab
The goal of using Matlab to program a detection algorithm was mainly to gather some relevant measures and to construct an algorithm in order to process the data. This is not a real time processing software; however it greatly helped to design the real-time detection algorithms of the embedded solution.

Advances in Networks, Computing and Communications 6
250
The current algorithm works in two steps, as shown in the Figure 9. The first step is the learning process. After being filtered, synchronised and cut in blocks, a set of specific data is used to dynamically calibrate the algorithm. The calibration is mainly used to detect the target zones (the most probable ranges of time where the remagnetisation of the microwires occurs). Once the calibration has been done, the algorithm is ready to process the data. This is the second step, called the utilization process. The data file is also filtered, synchronised and cut in blocks. Two detection algorithms process the valid blocks and output the results to the decision algorithm. This last concludes the process by outputting several system results: the absence of a marker inside the device, the jamming of the system and the n-bit code of the marker. The anti-jamming feature is aimed to avoid falsification by applying a strong continuous field that triggers samples during all the period of the driving field. In that case, the system is put in stand-by and waits that the end of the jamming.
Figure 9: Structure of the program.
The detection algorithms use the parameters obtain in the learning process to detect pulses inside the blocks. The overall detection algorithm outputs the number of samples inside and outside all the target zones using the overall activation threshold. The threshold is used to compare every sample: if the magnitude is higher than the threshold, the sample is said activated, and its switching time is located. If the switching time is inside any of the target zones, it is a hit. In the opposite case, it is a miss. The hits and the misses are used to work out the accuracy and the density of the data file. From these, the decision algorithm decides wheather the system is jammed (with the accuracy) or there is a marker present (with the density).
The local detecion algorithm ouputs the numbers of activated samples inside local target zones separately. In addition, as the peak magnitude of the pulse depends on the type of microwire, a local threshold used only inside a specific target zone is used. Every activated sample inside a specific target zone is counted. For example, if
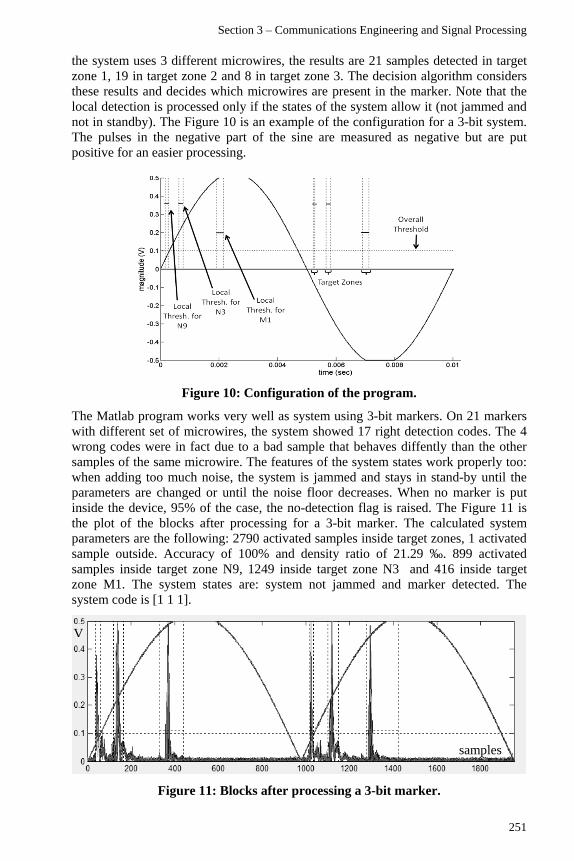
Section 3 – Communications Engineering and Signal Processing
251
the system uses 3 different microwires, the results are 21 samples detected in target zone 1, 19 in target zone 2 and 8 in target zone 3. The decision algorithm considers these results and decides which microwires are present in the marker. Note that the local detection is processed only if the states of the system allow it (not jammed and not in standby). The Figure 10 is an example of the configuration for a 3-bit system. The pulses in the negative part of the sine are measured as negative but are put positive for an easier processing.
Figure 10: Configuration of the program.
The Matlab program works very well as system using 3-bit markers. On 21 markers with different set of microwires, the system showed 17 right detection codes. The 4 wrong codes were in fact due to a bad sample that behaves diffently than the other samples of the same microwire. The features of the system states work properly too: when adding too much noise, the system is jammed and stays in stand-by until the parameters are changed or until the noise floor decreases. When no marker is put inside the device, 95% of the case, the no-detection flag is raised. The Figure 11 is the plot of the blocks after processing for a 3-bit marker. The calculated system parameters are the following: 2790 activated samples inside target zones, 1 activated sample outside. Accuracy of 100% and density ratio of 21.29 ‰. 899 activated samples inside target zone N9, 1249 inside target zone N3 and 416 inside target zone M1. The system states are: system not jammed and marker detected. The system code is [1 1 1].
Figure 11: Blocks after processing a 3-bit marker.
V
samples

Advances in Networks, Computing and Communications 6
252
The system using 5-bit markers show less efficiency. Using 3 different markers, it is possible to obtain an efficiency of the output code of about 82%. This is because the material at disposal has too many fluctuations of the switching times. The system should be much more efficient if the microwires were especially designed to cover a wide range of switching times. The Figure 12 is a plot of the measures done on a 5-bit marker. The calculated system parameters are the following: 1026 activated samples inside target zones, 64 activated sample outside. Accuracy of 94.1% and density ratio of 7.83 ‰. 207 activated samples inside target zone N9, 215 inside target zone M5, 219 inside target zone N3, 189 inside target zone M4 and 189 inside target zone M1. The system states are: system not jammed and marker detected. The system code is [1 1 1 1 1].
Figure 12: Blocks after processing a 5-bit marker.
5 A Portable Real-Time System Detection using a FPGA
The decision was made to transpose the analogue signals, collected by the pick-up coils, into digital signals and to use a Field Programmable Gate Arrays (FPGA) device to manage the processing part. It makes the system transportable (the FPGA is implemented on a small board), flexible (the code can be easily changed and no hardware modification is required) and low-cost. Once the signals are filtered and digitalized, the real-time signal processing stage (including the FPGA) uses them as inputs to work out the results (i.e. the bit-code detected and the system state). These results are then used in the post processing stage to perform the resulting actions (opening a container, display information, etc.), to trigger alarms (from the state of the system for example) or to execute any sequential procedures required for the application. The real-time system has been successfully simulated but the hardware tests are still in progress.
6 Conclusion and Improvements
The studies carried out revealed that the microwires have excellent magnetic properties to use them in a detection system. Their production being very cheap, the system should be very interesting for a large range of applications. The Matlab program designed showed that using simple markers of 3 or 5 bits is viable and making markers with bigger data densities (20 bits or more) is completely possible. A portable real-time system is still in development but gave good simulation results. It should be easily upgraded to markers of higher data densities. Some improvements could be made by studying in more depth the patterns of magnetic substrates.
samples
V

Section 3 – Communications Engineering and Signal Processing
253
Peak-to-Average Power Ratio Reduction in OFDM Using Cyclic Coding
P.Henrys d’Aubigny d’Esmyards and M.A.Abu-Rgheff
School of Computing, Communications and Electronics, University of Plymouth
Abstract
This paper presents an optimization of the method firstly developed by Wulich in (Wulich, 1996). It is demonstrated that this method can work for any PSK OFDM signal with a PAPR reduction of at least 3 dB. This straightforward method uses a ¾ cyclic coding scheme, thus there is a slight loss in data rate but the BER is not increased and there is no in-band and out-band distortion. Furthermore, this method has a low computational complexity since it does not need iterations for calculating the optimum solution.
Keywords
OFDM, PAPR, cyclic coding, PSK modulation
1 Introduction
Orthogonal Frequency Division Multiplexing (OFDM) transmission is not new but recently, this technique has received interest, especially in wireless applications (Alard et al., 1987, Reimers, 1998, Saltzberg, 1998). Indeed, improvements in signal processing have made it possible to generate OFDM signals with low implementation complexity. But OFDM transmission is also very efficient in fading environments since the equalization at receiver of such a signal is straightforward due to how OFDM signals are generated. Moreover, because every sub-carrier is orthogonal, OFDM signals have a high spectral efficiency. That is why this technique has been adopted in several standards such as the IEEE 802.11a for Wireless Local Area Networks (WLAN), ETSI HYPERLAN/2, Digital Audio Broadcasting (DAB) and the current DVB-T.
But of course, every new technique is never perfect and the OFDM technique has also some drawbacks. The main one is high power variations in the OFDM signal because of the summation of the orthogonal sub-carriers. These power variations are defined with the Peak-to-Average Power Ratio (PAPR) parameter (Bahai et al., 2004). High PAPR implies sophisticated radio transmitters with High Power Amplifier (HPA) operating on a very large linear range, which leads to very expensive electronic devices. Therefore, it is critical to use methods that reduce this PAPR. Several methods have been developed by researchers to mitigate the OFDM PAPR problem. The simplest one uses clipping and filtering (Armstrong, 2002) but that leads to increase the BER since this method definitively distorts the original OFDM signal. Other methods are based on multiple signal representation techniques such as Partial Transmit Sequences (PTS) (Jiang et al., 2007). Nonetheless these methods require a side information at receiver to recover the original OFDM signal

Advances in Networks, Computing and Communications 6
254
as well as many iterations for calculating the optimum sequences, which will decrease most the PAPR. Alternative methods are based on coding, there exist different coding schemes. The one presented in (Wilkinson et al., 1995) consists to transmit only symbols with a low PAPR value, the main problem of this last method is that it is very complicated and maybe impossible to calculate the PAPR value of all possible symbols when considering an OFDM system with many sub-carriers.
The aim of this paper is thus to present another coding scheme based on cyclic coding. This coding scheme has been previously developed in (Wulich, 1996) but only in the case of BPSK modulation. Therefore, it is demonstrated here that this solution can in fact be applied for any PSK modulation with the same results.
The paper is organised as follows. Section 2 defines the PAPR of PSK OFDM signals and gives understanding about how the PAPR is calculated during simulations since signals are discrete. Then, section 3 details how the cyclic coding scheme is implemented and demonstrates its suitability for any PSK modulation. Section 4 presents the simulation results. Finally, section 5 draws conclusions and perspectives.
2 PAPR definition
When no reduction scheme is implemented in a PSK OFDM transmission, the PAPR value, when considering an average power of 1 W for each sub-carrier, can be defined such as (Bahai et al., 2004):
In equation (1), N is the number of sub-carriers and x(t) is the PSK modulated OFDM signal with a symbol duration of Ts. In the remaining of the paper, the average power of each sub-carrier will be normalized to 1 W in order to compare the results. Whereas the PAPR value of equation 1 is calculated in continuous time, next simulations will work in discrete time. Therefore it is critical to oversample the data to get accurate PAPR results. Indeed, the OFDM signal in continuous time is expressed as:
And in practice, the frequency complex symbol (X) is transformed into a discrete-time signal via an Inverse Discrete Fourier Transform (IDFT) i.e.

Section 3 – Communications Engineering and Signal Processing
255
Nonetheless, the last sequences need to be oversampled and NL equidistant samples of x(t) are considered for the simulations, where L is the oversampling factor. The oversampled sequence of x(t) is then given by:
An oversampling factor of is sufficient for approximating the analogue PAPR (Sharif et al., 2003). Hence, the PAPR of the oversampled discrete-time signal xL is defined as:
3 Cyclic coding scheme
The OFDM signal for PSK modulation with an average total power of N W, can be expressed as:
can be (M: number of PSK symbol with probability
). And
Wulich in (Wulich, 1996) developed a new coding scheme for limiting the PAPR. He demonstrated that it is possible to reduce the PAPR by at least 3 dB using a ¾ cyclic code. This cyclic code was developed for a BPSK modulation since he realised his demonstration for two values of (0 and π) with probability 0.5. It consists to add one sub-carrier every 3 data sub-carrier for reducing the PAPR as depicted in figure 1. Thus, this PAPR reduction scheme needs a number of sub-carriers, which is a multiple of 4.
Figure 1: Representation of the position of added sub-carriers in the cyclic coding scheme
Data sub-carriers
Added sub-carriers to reduce the PAPR
3 sub-carriers
1 sub-carrier

Advances in Networks, Computing and Communications 6
256
The phase of added sub-carriers is calculated according to the three previous sub-carriers such as:
where
This cyclic coding scheme is in fact available for any PSK modulation, in other word for any integer M. This assumption can be demonstrated, considering equation (6), x(t) can be written as:
Thus,
In order to minimize the last term of expression (9), and must be in quadrature, which can be expressed as:
Therefore, the result of equation (7) is got back for any PSK modulation but now the PAPR reduction must be calculated. Using equation (9), |x(t)| can be defined such as:
And since a maximum is reached during this interval:

Section 3 – Communications Engineering and Signal Processing
257
0 1 2 3 4 5 6 7
x 104
0
5
10
15
20
25
30
35Envelope power of 8-carrier signal for all possible data words
data (decimal)
enve
lope
pow
er (
W)
Thus,
According to equations (1) and (10), the PAPR of the OFDM signal with any PSK modulation is defined as:
Hence, using cyclic coding with any PSK OFDM signals, a PAPR reduction of at least 3 dB is achievable. The former theoretical results of Wulich’s demonstration (Wulich, 1996) for BPSK OFDM signals work for any PSK OFDM signals.
4 Simulation results
The simulation results are represented in figure 2, which depicts the PAPR of all possible symbols considering a QPSK OFDM signal with 8 sub-carriers. Therefore the average total power of such a signal is 8 W since there is an average power of 1 W per sub-carrier.
0 1 2 3 4 5 6 7
x 104
0
10
20
30
40
50
60
70Envelope power of a 8-carrier signal for all possible data words
data (decimal)
enve
lope
pow
er (
W)
Figure 2: Envelope power of a QPSK OFDM signal without coding scheme for 8 sub-carriers for all possible data words (left). Envelope power of a QPSK
OFDM signal with cyclic code for 8 sub-carriers for all possible data words (right).
Without any coding scheme, the maximum power that can reach the OFDM signal is 64 W and using the cyclic coding, the maximum power of the same signal is divided by 2 (32 W). Therefore, the previous results are checked: firstly the cyclic coding scheme can be used not only for BPSK modulation and the PAPR reduction of at least 3 dB is still true.
Hence this technique can be used for any PSK OFDM signal and improve the efficiency of the HPA. It is very straightforward to implement and does not require

Advances in Networks, Computing and Communications 6
258
complex computation contrary to techniques such as PTS. Furthermore, there is no increase of power since just the phase of sub-carriers is modified (the average power leaves unchanged) and there is no change of the BER because receivers recover the original signal. But the data rate is slightly reduced as this solution used a ¾ code rate and receivers need to take into account the position of sub-carriers used for reducing the PAPR.
5 Conclusions
It has been demonstrated in this paper that cyclic coding can be used for any PSK modulation in OFDM and gives good results for reducing the PAPR. The main advantages of this technique are its straightforward implementation and computational complexity, moreover it does not increase the BER. Finally this coding scheme gives a PAPR reduction of at least 3 dB.
6 References
Alard, M. and Lasalle, R. (1987),“Principles of Modulation and Channel Coding for Digital Broadcasting for Mobile Receivers”, EUB Rev., vol. 224, pp. 47-69.
Armstrong, J. (2002), “Peak-to-Average Power Reduction for OFDM by Repeated Clipping and Frequency Domain Filtering”, Elect. Lett., vol. 38, no. 8, pp. 246-247.
Bahai, A.R.S., Saltzberg, B.R., and Ergen, M. (2004), “Multi-Carrier Digital Communications Theory and Applications of OFDM”, 2nd ed., Springer.
Jiang, T., et al. (2007), “PAPR Reduction of OFDM Signals Using Partial Transmit Sequences With Low Computational Complexity”, IEEE, vol. 53, pp. 719-724.
Reimers, U. (1998), “Digital Video Broadcasting,” IEEE Commun. Mag., vol. 36, no. 10, pp. 104-110.
Saltzberg,, B. R. (1998), “Comparison of Single-Carrier and Multitone Digital Modulation for ADSL Applications,” IEEE Commun. Mag., vol. 36, n. 11, pp. 114-121.
Sharif, M., Gharavi-Alkhansari, M., and Khalai, B. H. (2003), “On the peak to average power of OFDM signals based on oversampling”, IEEE Transactions on Communications, vol. 51, no. 1, pp. 72-78.
Wilkinson, T.A. and Jones, A.E. (1995), “Minimisation of the Peak to Mean Envelope Power Ratio of Multicarrier Transmission Schemes by Block Coding”, IEEE, vol. 2, pp. 825-829.
Wulich, D. (1996), “Reduction of peak to mean ratio of multicarrier modulation using cyclic coding”, IEEE Electronics Letters, vol. 32, pp. 432-433.

Section 3 – Communications Engineering and Signal Processing
259
Brain-Computer Music Interface Mixer
V.Soucaret1 and E.R.Miranda2
Interdisciplinary Centre for Computer Music Research, University of Plymouth, Plymouth, UK
e-mail: [email protected], [email protected]
Abstract
In this paper, the authors introduce a new Brain-Computer Music Interface mixer. They report on the continuing efforts to make this BCMI system cheaper to produce, more portable, more stable and easier for users to operate. This system allows creativity for people with severe disabilities and could also be a good tool to treat children suffering from hyperactivity or attention disorder. A new technique to produce music from the topological behaviour of the human brain signals is explained. This sophisticated method to generate melodies from the brain gives very interesting results, although the EEG trajectories seem to be different from a subject to another. Even if the technology is not following the ideas yet, the author hopes that this project will open other perspectives to a research area which has been growing for a few years only.
Keywords
Brain-Computer Interface, BCI, Electroencephalogram, EEG, brainwaves, music and brain.
1 Introduction
Although ‘music’ and ‘brain’ are two different areas of research, they can sometimes be dependent. Music has received a lot of attention from researchers seeking to understand the human brain (Margulis, 2008). It is understood that people perceive and react to music in different ways. For example, music can change a person’s mood. But if the problem is considered the other way around: Could a person’s mood change the music? The authors orientated their research with this perception and therefore, focused the research on Brain-Computer-Interface.
Controlling systems with the human brain could seem to be an idea for a Science-Fiction movie. Yet, since the last years, Human-computer interface (HCI) has been a growing field of research and development. Those systems use the recent progresses in technology, which allow the researchers to know physiological processes inside a patient’s body (blood pressure, heart rate variability, muscular activity, brain electrical activity, etc.). Those activities can be used in new communication systems, such as Human-Computer Interface. Brain-Computer Interface (BCI) adds a new dimension to HCI but it is still in its infancy, even if in the past decade there was an explosion in this research area. A brain-computer interface uses information extracted from the EEG to control devices. For example, it could control a wheelchair or a computer cursor (Dornhege et al. 2007). Nowadays, the BCI could

Advances in Networks, Computing and Communications 6
260
be used for people with differentiated physical and mental abilities, or every day tasks. With the actual accessible technology it could be difficult for people with severe complex disability, to interact with the environment created for them. Consequently, such systems may provide opportunities to express their creativity.
This paper introduces a new musical application: an EEG-controlled music mixer. The efforts to make this BCMI system cheap to produce, portable, stable and easy to operate are reported. A new technique, which is able to produce melodies from the topological behaviour of the EEG signal, is also introduced.
2 The Electroencephalogram (EEG)
Different techniques for measuring the brain activity have been attempted, such as near-infrared spectroscopy or Magnetoencephalography (MEG). However, most of the current efforts into BCI research focus on the Electroencephalogram. The EEG, literally “brain electricity writing”, was first measured in 1924 by Hans Berger, who published his results in 1929 (Berger, 1929). From his English translation (Berger, 1969), many attempts followed with various degrees of success.
To detect EEG signal, it takes many thousands of underlying neurons activated together. Because the human brainwaves have to go through the meninges (membranes covering the central nervous system to protect it), the skull and the scalp, they are difficult signals to deal with. Even if the Electroencephalogram is an imperfect and distorted indicator of brain activity, it seemed to be easy to record and was well studied.
The EEG is measured as the voltage difference between two or more electrodes on the surface of the scalp, one of which is taken as a reference. The International Federation in Electroencephalography and Clinical Neurophysiology made a standard electrode placement system (Figure 1), which is called the 10-20 placement system (10% and 20% of the head circumference). The electrodes are associated with key letters which correspond to a region of the scalp. As can be seen on Figure 1, odd numbers are for electrodes on the left side of the head and even numbers are for those on the right side. The set of electrodes being recorded at one time is called a montage.
Figure 1: (left) Electrodes placed on the scalp at positions measured at 10% and 20% of the head circumference. (right)The terminology for referring to the
position of the electrodes uses a key letter that indicates a region on the scalp and a number (Miranda and Boskamp, 2005)
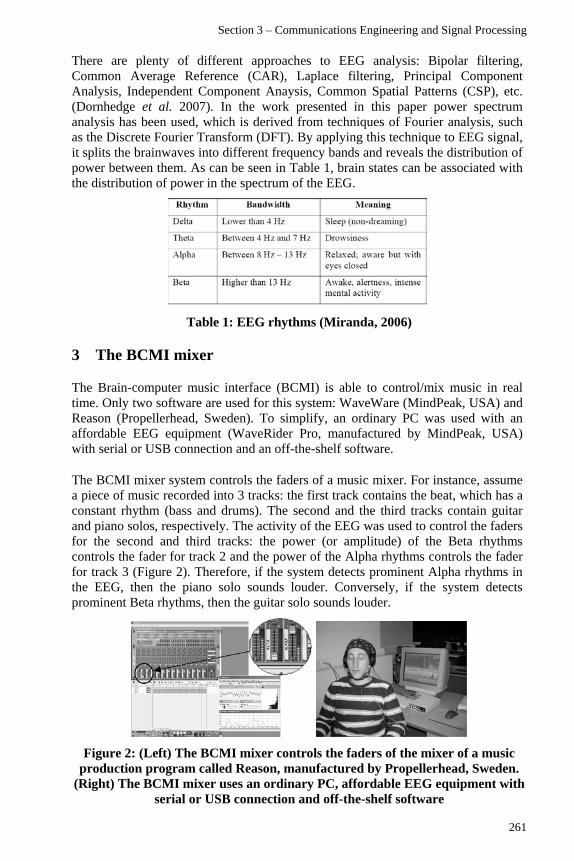
Section 3 – Communications Engineering and Signal Processing
261
There are plenty of different approaches to EEG analysis: Bipolar filtering, Common Average Reference (CAR), Laplace filtering, Principal Component Analysis, Independent Component Anaysis, Common Spatial Patterns (CSP), etc. (Dornhedge et al. 2007). In the work presented in this paper power spectrum analysis has been used, which is derived from techniques of Fourier analysis, such as the Discrete Fourier Transform (DFT). By applying this technique to EEG signal, it splits the brainwaves into different frequency bands and reveals the distribution of power between them. As can be seen in Table 1, brain states can be associated with the distribution of power in the spectrum of the EEG.
Table 1: EEG rhythms (Miranda, 2006)
3 The BCMI mixer
The Brain-computer music interface (BCMI) is able to control/mix music in real time. Only two software are used for this system: WaveWare (MindPeak, USA) and Reason (Propellerhead, Sweden). To simplify, an ordinary PC was used with an affordable EEG equipment (WaveRider Pro, manufactured by MindPeak, USA) with serial or USB connection and an off-the-shelf software.
The BCMI mixer system controls the faders of a music mixer. For instance, assume a piece of music recorded into 3 tracks: the first track contains the beat, which has a constant rhythm (bass and drums). The second and the third tracks contain guitar and piano solos, respectively. The activity of the EEG was used to control the faders for the second and third tracks: the power (or amplitude) of the Beta rhythms controls the fader for track 2 and the power of the Alpha rhythms controls the fader for track 3 (Figure 2). Therefore, if the system detects prominent Alpha rhythms in the EEG, then the piano solo sounds louder. Conversely, if the system detects prominent Beta rhythms, then the guitar solo sounds louder.
Figure 2: (Left) The BCMI mixer controls the faders of the mixer of a music production program called Reason, manufactured by Propellerhead, Sweden.
(Right) The BCMI mixer uses an ordinary PC, affordable EEG equipment with serial or USB connection and off-the-shelf software

Advances in Networks, Computing and Communications 6
262
Although the accuracy could be improved (but it would come at a price) it is believed that it is satisfactory enough for recreational, and even therapeutic, purposes. Moreover, the BCMI controls an off-the-shelf relatively easy to use music production software (Reason, manufacturer by Propellerhead, Sweden), which makes the whole system much more user-friendly to operate and customise.
4 A sophisticated BCMI
Unlike the described BCMI mixer, a signal processing approach was chosen. Therefore, the next part of this paper will be about a non real-time system.
A simple, but nevertheless, effective method to generate melodies from the trajectories has been developed. Instead of analysing the overall EEG activity, information was extracted from the signals of each electrode in order to infer possible brainwaves trajectories. For instance, Figure 3 demonstrates how the power of the signals has varied on the scalp in 5 steps. In this case, the area with the highest EEG power (average) moved from electrode 2 (Fp2) to 1 (Fp1), then 5(F4) and then 6 (F8), where it remained for two steps.
Figure 3: (Left) An extract of the individual raw EEG signals of 14 electrodes. (Right) EEG trajectory
Depending on the associations between musical notes and the electrodes, melodies can be easily generated from the trajectory. Because good results were obtained with the previous system, it was decided to go towards more sophistication. Indeed, instead of taking the overall EEG activity, it was decided to generate music with the trajectories of the 4 different rhythms (Delta, Theta, Alpha and Beta rhythms). That is possible because of the different frequencies of the travelling brainwaves. For instance, if a subject tries to be relaxed, although the Alpha waves (relaxed state) will be prominent, there will still be other rhythms (e.g. Beta rhythms).
To generate melodies, each electrode is associated with a musical note (Table 2), which is played when the respectively electrode is the most active with respect to the EEG information in question (Figure 4).

Section 3 – Communications Engineering and Signal Processing
263
Table 2: Associations between musical notes for each EEG rhythm and the electrodes of a given montage
Such a system can give an interesting musical result. Moreover, with a well-trained subject, it would be possible to map each rhythm to an instrument (e.g. delta rhythms with piano, Theta rhythms with bass, etc.) and have a complete orchestra generated with one only human brain.
Figure 4: The trajectories of EEG power information on the scalp for each
rhythm
As can be seen in Figure 5, the melodies are not regularly played, which actually gives an interesting result. It could be explained by the fact that the melodies are converted from *.wav format to *.mid format. Indeed, because this sophisticated system is not working in real-time, it was decided to convert from an audio format (wave) to another (midi) in order to have a better result (musically speaking). During the conversion, some notes are played harder, softer or not played at all.
DeltaBeta
Theta
Alpha

Advances in Networks, Computing and Communications 6
264
Figure 5: Melodies generated by the previous trajectories
Although satisfactory results were obtained, it would be more interesting to realise such a system in real-time. Therefore, by having feedback, the subject could control and generate melodies at their own will.
5 Conclusion
The BCMI mixer was tested on the same person (a member of the ICCMR laboratory) who was trained to control a previous BCMI developed by the laboratory. After a few minutes, the colleague was able to control the mixer at his own will. As the system is more portable and more user-friendly to operate than its predecessor was, it would be interesting to take it out of the lab to test it in real-world scenarios. One problem that may be encountered is that the EEG of a person with differentiated physical and mental abilities might behave differently. There will be a need to provide straight forward means for calibrating of the system to cope with differentiated EEG signals.
Although this sophisticated method to generate melodies is not in real time, the obtained results are promising. Further studies could be done to make this system in real-time which could open new possibilities for disabled people. It could also be a very useful tool to treat children suffering from hyperactivity or attention disorder. In the author’s opinion, more researches about real meaning of the topological behaviour of the EEG should be investigated in order to have sophisticated BCMI.
6 References
Berger, H. (1929), Über Das Elektrenkephalogramm Des Menschen, Archiv für Psychiatrie und Nervenkrankheiten, 87, pp. 527-70.
Berger, H. (1969), “On the Electroencephalogram of Man, The Fourteen Original Reports on the Human Electroencephalogram, Electroencephalography and Clinical Neurophysiology”, Supplement No. 28. Elsevier, Amsterdam.
Dornhege, G., Krauledat, M., Müller, K. R. and Blankertz, B. (2007), “General Signal Processing and Machine Learning Tools for BCI Analysis” in Dornhege, G., Millán, J. R., Hinterberger, T. McFarland, D. J., Müller, K. R. (Ed.), Toward Brain-Computer Interfacing, Massachussetts Institute of Technology (MIT), USA, pp207-233.

Section 3 – Communications Engineering and Signal Processing
265
Margulis, E. H. (2008), Neuroscience, the food of musical culture?, Review of general psychology, Vol. 12, No. 2, pp159-169.
Miranda, E. R. and Boskamp, B. (2005). Steering Generative Rules with the EEG: An Approach to Brain-Computer Music Interfacing, Proceedings of Sound and Music Computing 05, Salerno (Italy).
Miranda, E. R., (2006), Brain-Computer Interface for Generative Music, Proceedings of International Conference Series on Disability, Virtual Reality and Associated Technologies (ICDVRAT 2006), Esbjerg (Denmark).
Miranda, E. R. and Soucaret, V. (2008), Mix-It-Yourself with a Brain-Computer Interface, Proceedings of International Conference Series on Disability, Virtual Reality and Associated Technologies (ICDVRAT 2008), Porto (Portugal).

Advances in Networks, Computing and Communications 6
266

Section 4 – Computer Applications, Computing, Robotics & Interactive Intelligent Systems
267
Section 4
Computer Applications, Computing, Robotics & Interactive Intelligent
Systems

Advances in Networks, Computing and Communications 6
268

Section 4 – Computer Applications, Computing, Robotics & Interactive Intelligent Systems
269
How can a Robot Learn the Meaning of Words?
M.Eftimakis and T.Belpaeme
Robotics and Intelligent Systems Group, University of Plymouth, Plymouth, UK
Abstract
The first step in the children language acquisition is nouns learning. For robots to learn a language (and not to reproduce pre-programmed sentences), they should first be able to learn nouns. This is what this project is about. The aim is to create a piece of software able to learn names of objects shown to a webcam, using new recognition algorithms called SIFT and SURF. Then a guessing game can be played with the machine, showing known object for it to guess what it is. The program can then be used to collect data about objects it is able to recognize, to find the relevant part of the information taken on the pictures. In merging these information from objects of the same kind (green apple, golden apple and red apple for example), the machine should be able to categorize object and learn them fully. The code has been written in Matlab, using a simple interface for anyone to able to play with. The final recognition rate is about 80%, which is very good indeed. Data collected during the object adding and the guessing game can now be studied. The improvements to be done are the data merging, motorisation and automation of the webcam, for the machine to become interactive and attractive, and the colour histogram algorithm optimisation.
Keywords
Object recognition, SIFT, SURF, language acquisition, learning process.
1 Introduction
Robotics is one of the most existing research fields nowadays, because a lot of important (and interesting) subjects still need to be studied. For robots to become helpful in the future daily life, one of the keys is its ability to communicate effectively with humans (and with other robots). A more effective and more natural means of communication than a keyboard and a mouse is the language. Some robots already “speak” but in using registered sentences that do not support any fantasy.
For robots to speak fluently a language, they need to learn it, as children do after their birth. Except the brain work, every parts involved in the process are technically mastered: the vision, the image processing… even other senses if needed. What needs to be understood now is how children learn a language and how it can be translate into robot embedded software language.
Many studies have been done on children to understand how they do learn a language, through different point of view: philosophy (Demopoulos, Marras, 1986), psychology (Bloom, 2000), developmental psychology (Beck, 1979), linguistics (Arbib, et al. 1987) or process modelling (Huxley, Ingram, 1974; Bloom, Tinker, 2001; Roy, 2005).

Advances in Networks, Computing and Communications 6
270
Some biases have been found but nothing complete enough to reproduce the process fully. One of the known points is the first part of the language the children learn is nouns: that is what this project will work on, robot nouns learning.
Learning nouns means associate objects you saw with a given name (by a teacher, often the parents for the children). That means in more details, processing images you saw to extract information meaningful enough to categorize the group of objects it is linked to. For example, you see a fixed red chair with armrests, an office black chair with casters, an orange plastic chair and a brown highchair and you have to figure out that all these objects are standing for the same thing which is a “chair”.
This project will go as far as possible in this process, trying to copy what children are able to do.
2 SIFT and SURF algorithms
2.1 SIFT description
The SIFT (Scale Invariant Feature Transform) algorithm has been introduced in 1999 by David Lowe (Lowe, 1999; Lowe, 2001; Lowe, 2004). The purpose is to find robust features on pictures, using the less computation time possible. Robust means invariant to image scale, translation and rotation, changes in 3D viewpoint, illumination changes, noise, etc… SIFT is already used in professional applications (like AutoPano) to join two or more pictures of the same panorama. To use SIFT as an object recognition algorithm, the keypoints it returns for a picture on which an object is with those of objects images previously stored is compared. Some keypoints must match, and ensure us to detect the object (and his location).
2.2 SURF description
The SURF (Speeded Up Robust Features) algorithm has been introduced in 2006 by Herbert Bay, Tinne Tuytelaars, and Luc Van Gool (Bay, et al. 2006). The purpose for this algorithm is, as the SIFT algorithm, to find invariant keypoints in an image. The given objective is to “outperform previously proposed schemes with respect to repeatability, distinctiveness, and robustness. [The system could] be computed and compared much faster” (Bay, et al. 2006).
2.3 SIFT and SURF comparison
A suited comparative test has been conducted to determine which algorithm gave the best results in our case. A set of images has been collected on different kind of objects (Figure ). For each, a picture has been taken in different positions: normal (for the reference), rotated, twisted, scaled down, and a hand-held. The results gave the SIFT algorithm a slightly better recognition rate (4.2, Figure 4) but a much bigger processing time. As the program aims to be embedded and to interact with humans, faster it works better it is. So, the SURF algorithm has been chosen as the main recognition process.

Section 4 – Computer Applications, Computing, Robotics & Interactive Intelligent Systems
271
Figure 1: Objects pictures set.
Rotation and scale (and noise, which has not tested in our experiments but in Bauer, et al. 2007; and in Mikolajczyk, Schmid, 2005) hardly influence the matching quality, as well as flash, shadow and as covering the object when enough material remain visible. Twisting the object, on the other hand, gives the algorithms troubles: the view point is too different from the reference.
3 The program
To be effective in the image processing, the entire program has been coded in Matlab, except for the given algorithms: SIFT and SURF algorithms have been coded in C. The pre-compiled files are available on the SURF website: http://www.vision.ee.ethz.ch/~surf/ (accessed on the 28/08/08) and on David Lowe webpage http://www.cs.ubc.ca/~lowe/keypoints/ (accessed on the 28/08/08). The source code in not given. A command line will execute SIFT and SURF from our Matlab code, what create file filled in with the results (image keypoints), which is then read by our code.
The program is divided into 5 subprograms, coded as 5 different GUIs (plus the welcoming page one). The subprograms correspond to the different tasks. The user can:
- Show an object to the webcam and type its name, for the system to learn the object.
- Show an object to the webcam (or select an image from a specific folder), for the machine to give its name back (Guessing Game).
- Type a name for the machine to show the corresponding known object. - Show a few objects in the same time to the webcam (or select an image from a
specific folder), for the machine to give the objects’ names back. - Play with the system freely.
The Guessing Game process is detailed in the Figure 2. The reward increments a displayed score but also saved the data on the recognised object, and linked them to the corresponding known object. The “known objects memory” and “other view of known objects” are stored in ‘.mat’ files, what makes the saving time longer for each object added (See 4.1).

Advances in Networks, Computing and Communications 6
272
Start ? Start ?
SURF comparison
Let’s guess ! Not yet
Object recognised. Right ?
Reliable guess Unsure guess
SURF comparison
Let’s guess ! Not yet
Object recognised. Right ?
Reliable guessUnsure guess
No guess
Yes
No
Is the object recognised right ?
Yes
Background removing
No
Remove the background ?
YesStop
No guess
Yes
Color Histogram Comparison
Reliable guess
Is the object recognised right ?
Unsure guess
Yes
Use SIFT ?
No guess
No No
SIFT comparison
Yes No
Object recognised. Right ?
Is the object recognised right ?
No recognition.
YesNo
YesNo
Unsure guessReliable guess No guess: question to the user
Object Snapshot takenBackground removed
or Image selected
: action done by the machine
Reward
Reward
Reward
: reward
Caption: start or end point
Figure 2: Guessing game process.
The library of known objects grows with the experience of the machine. As the comparison between keypoints takes some time, finding a way to pre-sort quickly the library items is needed. Only the object images which can correspond to the scene should feed the recognition process.
To do that, a color histogram is calculated for each picture, in converting the RGB values of the images into the CIE Lab space (Westland, Ripamonti, 2004; López, et al. 2005), and then in taking the histogram of the ‘h’ value:
180
).arctan(a
bh (a and b from the ‘Lab’ values).
The group of possible objects is determined in comparing color histograms of the references and of the scene. For the comparison to be effective, the pictures’ background has first to be removed.

Section 4 – Computer Applications, Computing, Robotics & Interactive Intelligent Systems
273
4 Results
4.1 Processing time to add objects
In studying the software processing times, it has been found that the more objects are learnt, the more the object learning takes time. A precise study gives the following results, Figure 3. These curves display the time taken by the software to add an object in the references according to the number of known objects. The top one shows the complete process, what includes SIFT/SURF keypoints and colour histogram calculations, and the data saving. As was noticed, the time needed to add an object is growing almost linearly with the number of known objects.
The keypoints and the histogram calculations must consume almost always the same time, so the hypothesis is the saving time depends on the number of known objects.
0 5 10 15 20 25 30 35 40 45 500
0.5
1
1.5
2
2.5
3
3.5
4
4.5
5
Number of known objects
Proc
essi
ngti
me
(in
seco
nds)
Processing time to add an object in the References
Processing time including the data savingProcessing time without saving the dataDifferenceBest fitting (linear y = 0.085*x - 0.038)
Figure 3: Processing time to add objects in the References.
The bottom curve shows the time needed to calculate keypoints and color histogram only (without the saving time), and the middle curve (difference between top and bottom ones) is the time consumed to save the data. The keypoints and histogram calculation time is almost constant. The time consumed by the saving process is linear, so this part strongly depends on the number of known objects. Each object takes 85ms more to be saved than the previous one, no matter in which order they are taken (the same test has been done with different objects adding orders).
The explanation is the data is not accessed and changed directly, but the memory (‘.mat’ file) is opened, variables (cells) are changed, and then all of them are saved! So each time, all the previous data plus the new one are saved, what takes the previous time plus 85ms. A technique needs to be found to change and save only the next cell for each data instead of opening and saving all of them. That requires a direct access to the memory, as you can do in C language.

Advances in Networks, Computing and Communications 6
274
4.2 Recognition rate and influencing parameters
A set of 100 pictures has been taken on 20 objects, in the same way than in the paragraph 2.3. For each of the 80 pictures (100 - 20 references), the SIFT and SURF has been processed and the result has been evaluated as following:
- If the result was “Good Match”, 1 point has been given. - If the result was “Unsure”, 0.5 point has been given. - If the result was “No result”, 0 point has been given.
Then the sum is divided by the number of pictures to get a percentage.
This approximation is good enough, as the ‘Unsure’ results happened around 2/3rd of the time good results, and as about 1/6th of the ‘Good Match’ are wrong. In this way, nobody needs to validate the 80 results for the rate to be calculated.
Here are the results for pictures with the background removed:
20 25 30 35 40 45 50
50
60
70
80
90
100
Number of known objects
Rec
ogn
itio
nra
te(i
n%
)
Surf recognition rate details
Scaled down objectsHand held objectsRotated objectsTwisted objects
20 25 30 35 40 45 5060
65
70
75
80
85
90
95
100
Number of known objects
Rec
ogn
itio
nra
te(i
n%
)
Sift recognition rate details
Scaled down objectsHand held objectsRotated objectsTwisted objects
Figure 4: Sift and Surf recognition rate for images without background.
The recognition rates averages for images with the background not removed yet are close to 80% for SIFT and to 75% for SURF. The recognition rate for images without the background is a bit more than 7% better. The system recognizes perfectly the rotated objects (Figure 4), very well hand-held ones (>90% for SIFT, 80%<SURF<90%) and well scaled down objects (87% for SIFT, 80%<SURF<85%). On the other hand, it really struggles with twisted objects (60%<SIFT<70%, 50%<SURF<55%).
This experiment points out a slight reduction of the recognition rate with the number of known objects for both SIFT and SURF, and for all of the four kinds of pictures. The hypothesis is some “Good Match” must become “Unsure” because recently added objects have got enough matching keypoints to make the system uncertain.
In running the recognition program for these cases only and studying them carefully, you can show that the second best match which makes the program ‘unsure’ is one of the new added objects. For the cases observed, the matching keypoints were all on the surface of the objects, which were smooth. The light on these objects create likeness between them (in there shape) and it is detected by SIFT and SURF.

Section 4 – Computer Applications, Computing, Robotics & Interactive Intelligent Systems
275
5 Conclusion and improvements
Try to make a robot learn words in finding its own objects representations it can compare to the scene it is looking at, as a first step to make robots learn languages, was a great challenge. Everything has not been done yet, but already good results can be pointed out: our system is able to learn objects’ names, and to recognise them up to 80% (90% in some situations), and even more in coupling the different algorithms. Obviously, some problems remain, like the difficulty to recognize smooth objects, troubles with very bright dazzling spots or with posture far different from the reference, but this was an important first step.
Now the door is open. It is possible to collect more data with our system, and further studies on them can make the following steps reachable, like the possibility to generalise objects representation (see 5.2), actions and verbs learning, and then adjectives, adverbs, etc.
5.1. Fully automated pan and tilt webcam
We bought a pan and tilt camera at the beginning of the project with the wish to make it move and take the presented object picture automatically. As focussed first on the main part on the project (the recognition), and as time is limited, it has finally not been coded.
With the camera bought, a reverse engineering process may be needed to be able to get the streams and to control the pan and tilt from Matlab. Network systems knowledge might be useful to do that.
5.2. Data/Keypoints merging
This is the most important piece of study remaining. In merging the data collected on different kinds of the same object, the system should be able to generalise the objects it learnt. Recognise a particular chair is nice, but be able to categorise chairs, and recognize a kind of chair never seen before is really powerful. There is the point where the machine learns like a child, who sometimes even over-generalize, calling for example a cat a dog as he never saw a cat before.
Merging the data is possible in theory for Sift and Surf sets of keypoints but colour histogram will have to be considered twice: objects of a same group are often not of the same colour, but some objects can be characterised by their colour (like bananas and oranges for example).
6 References
Arbib, M. A., Conklin, E. J. and Hill, J. (1987), From schema theory to language, Oxford University Press, New York, USA. ISBN: 0195040651.
Bauer, J., Sünderhauf, N. and Protzel, P. (2007), “Comparing several implementations of two recently published feature detectors”, Proceedings of the International Conference on Intelligent and Autonomous Systems, IAV, vol. 22, n°7-8, pp. 635-650, Toulouse, France.

Advances in Networks, Computing and Communications 6
276
Bay, H., Tuytelaars, T. and Van Gool, L. (2006), “SURF: Speeded Up Robust Features”, Proceedings of the ninth European Conference on Computer Vision (ECCV), vol. 3951, pp. 404-417, Graz, Austria. Accessible on the SURF website: http://www.vision.ee.ethz.ch/~surf/, accessed 28/08/08.
Bloom, L. and Tinker, E. (2001), The Intentionality Model and Language Acquisition, Blackwell publishers, Oxford, United Kingdom. ISBN: 9781405100892.
Bloom, P. (2000), How Children Learn the Meanings of Words, The Mitt Press, London, United Kingdom. ISBN: 0262024691.
Demopoulos, W. and Marras, A. (1986), Language learning and concept acquisition, Abley publishing corporation, Norwood, United Kingdom. ISBN: 0893913162.
Huxley, R. and Ingram, E. (1971), Language Acquisition: Models and Methods, Academic Press Inc., London, United Kingdom. ISBN: 0123634504.
López, F., Valiente, J. M., Baldrich, R. and Vanrell, M. (2005), “Fast Surface Grading Using Color Statistics in the CIE Lab Space”, Iberian conference on pattern recognition and image analysis (IbPRIA) N°2, vol. 3523, pp. 666-673, Estoril, Portugal.
Lowe, D.G. (2004), “Distinctive Image Features from Scale-Invariant Keypoints”, International Journal of Computer Vision, vol. 60, n°2, pp. 91-110.
Lowe, D.G. (2001), “Local Feature View Clustering for 3D Object Recognition”, Proceedings of the IEEE Conference on Computer Vision and Pattern Recognition, vol. 1, pp. 682-688, Kauai, Hawaii.
Lowe, D.G. (1999), “Object Recognition from Local Scale-Invariant Features”, Proc. of the International Conference on Computer Vision, vol. 2, pp. 1150-1157, Corfu, Greece.
Mikolajczyk, K. and Schmid, C. (2005), “A Performance Evaluation of Local Descriptors”, IEEE Transaction on pattern analysis and machine intelligence, vol. 27, n°10, pp. 1615-1630.
Roy, D., (2005). “Grounding Words in Perception and Action: Insights from Computational Models”, Trends in Cognitive Science, vol. 9, n°8, pp. 389-396.
Steels, L. and Kaplan, F. (2000) “AIBO's first words: The social learning of language and meaning”, Evolution of Communication, vol. 4, n°1, pp. 3-32.
Westland, S. and Ripamonti, C. (2004), Computational colour science using Matlab, p. 50-52, John Wiley & Sons, Hoboken, New Jersey, USA. ISBN: 978-0-470-84562-2.

Section 4 – Computer Applications, Computing, Robotics & Interactive Intelligent Systems
277
Evaluating the Effects of Security Usability Improvements in Word 2007
M.Helala and S.M.Furnell
Centre for Information Security and Network Research, University of Plymouth, Plymouth, United Kingdom
e‐mail: [email protected]
Abstract
It has been argued in the literature that integrating security features with user goals and increasing their visibility would improve the usability of these functionalities. This paper investigates how these approaches affect the efficiency of use and subjective user satisfaction. The impacts of the combination of these two methods are evaluated as well. In order to do this the user interface of Word 2007 is modified according to these principles and usability tests are carried out with both the original and the modified user interfaces. The results suggest that integrating security features with user goals would improve the efficiency of using them but the impacts on user satisfaction cannot be clearly identified based on the collected data. No indications of any major improvements in the efficiency of use or user satisfaction are found when the visibility of security features is increased. The combination of these two methods seems to improve both the efficiency of use and the subjective user satisfaction.
Keywords
Security, Usability, Visibility, User Goals
1 Introduction
Several usability studies have been conducted in order to evaluate different security tools and security features in other applications. In some cases these have even suggested improvements to the studied applications and tools. However, solutions that could be applied to a wide range of applications would be more beneficial for user interface (UI) designers and software developers. Therefore this paper concentrates on presenting common usability issues and solutions that could be used in several everyday applications. The impacts these solutions have on efficiency of use and user satisfaction are also considered.
2 Common usability issues in security features
2.1 Security tasks are not integrated with user goals
Dourish et al. (2004) and Smetters and Grinter (2002) have criticised the way security features are presented in many applications. They have argued that the features are not integrated well enough with the tasks users need to do. This can lead to situations in which users cannot use applications or tools in a way that would be natural to them or to the tasks they are trying to complete.

Advances in Networks, Computing and Communications 6
278
Smetters and Grinter (2002) mentioned an example of this kind of situations. They found in their study that from time to time users had to manually change relevant security settings before carrying out certain tasks and then restore the previous settings afterwards. Clearly, having to turn off or bypass security features in this way increases the risk of user errors which can potentially compromise security. It can be argued that if security aspects of a task that users wish to do were integrated with other aspects of the task, it would be easier for them to complete the task successfully.
In addition, according to Balfanz et al. (2004) users tend to think about security in the context of the tasks they need to do rather than as security terms, such as certificates or encryption keys. Hence it could be beneficial to integrate security with these tasks so that users do not need to take separate steps in order to achieve the security aspects of their tasks.
2.2 Lack of visibility
It has been claimed that in many cases the visibility of security related functionalities is not good enough for users to notice them easily (Furnell, 2005). Therefore users might not utilise some important security features simply because they have not come across them (Furnell, 2005). In addition, Tognazzini (2003) stated that users of any applications should not be expected to search for features and functionalities. This clearly implies that if average users are expected to utilise different security features in everyday applications these features should be presented in a way that users will become aware of them while using other aspects of these applications.
Also, Dourish et al. (2004) have argued that security is not the main concern for most users when they are using IT in their everyday life. Furthermore, according to a research conducted by De Witt and Kuljis (2006), users often try to get their work done quickly even at the cost of security. The results of their research indicated that this common attitude was not dependent on users’ security awareness. Even users who were aware of the security consequences of this kind of behaviour often had the same approach. These findings provide further support for the idea that security should be given enough emphasis when designing UIs. If these features are hidden in different menus user can easily give up searching for them or might not even look for them in the first place.
3 Usability test methodology
Based on the findings presented above it was decided to test how integrating security features with user goal, increasing the visibility of security features and the combination of these improvements would affect their usability in everyday applications. The effects of these improvements were tested using some of the security features available in Microsoft Word 2007. In order to do this the UI regarding these features was modified with a Word 2007 add-in.

Section 4 – Computer Applications, Computing, Robotics & Interactive Intelligent Systems
279
3.1 User interface modifications
The visibility of protecting documents against unauthorised access and modifications was increased. This was achieved by adding a Security Options button to the Save As dialog and removing the General Options… menu item from the Tools menu. The General Options dialog that presented the protection settings was also replaced with a new Document Level Security Options as shown in Figure 1. The original and modified dialogs are shown in Figures 1 and 2 respectively.
Figure 1: The origianl Save As and General Options dialogs.
Figure 2: The modified Save As dialog and the new Document Level Security
Options dialog.
An effort was made to integrate security features and user goals in three cases. Users were given an option to create documents with access and editing restrictions as well as documents with increased privacy level. This was done by adding relevant buttons to the Office Menu as shown in Figure 3.
Both of the improvements were tested in two cases: controlling metadata, such as author name and revision number, that is saved with an existing document and controlling the metadata that is saved with all new documents by default. In this

Advances in Networks, Computing and Communications 6
280
paper these are referred to as document level privacy settings and application wide privacy settings respectively.
Figure 3: The new Office Menu (left) and the original version (right)
In the case of document level privacy settings users were able to select the metadata they wanted to be saved with a document instead of having to inspect the document and then remove the unwanted details with the Document Inspector. This was made possible through a privacy tab in the Document Level Security Options dialog as illustrated on the left side of Figure 4. This was done in order to integrate the user goals and the security functionality. In addition the Security Options button that was mentioned earlier was used for increasing the visibility of this feature.
Figure 4: The privacy tabs of the new Document Level Security Options and
Application Wide Security Options dialogs.
The visibility of application level privacy settings was increased by adding a Word Security Options button into the Office Menu as shown in Figure 4. Clicking this button opened a dialog shown on the right side the Figure. The same approach of integrating this functionality with user goals was used as in the case of document level privacy settings. In the original solution there was no straightforward way of controlling all the metadata described above. It was only possible to remove the

Section 4 – Computer Applications, Computing, Robotics & Interactive Intelligent Systems
281
default author name through the User name field in the Word Options. In order to do anything beyond this users were required to modify the Normal.dotx template, which is by default used as a template for all new documents. The new approach saved users from inspecting this template with the Document Inspector and removing any unwanted metadata this way.
3.2 Usability tests
Ten users participated in the practical tests. Most of the users were students at the University of Plymouth and the rest had at least a higher education qualification. Six of the participants rated themselves as advanced IT users and the rest regarded themselves as intermediate users. All participants used computers daily. In addition all but two of them had prior experience with the Word 2007. Even the two users who had not used this version were users of Word 2003.
The usability tests consisted of seven different security related tasks, as shown in Table 1, that users might encounter in their day-to-day use of any word processor. In each of these tasks users were required to utilise the features described earlier in this chapter. In addition the users were asked to do all tasks with both the original Word 2007 UI and the modified UI. If users had been divided into two groups each testing only one UI, the variation in the skills and performance of individual users could have caused significant difference between the groups (Nielsen, 1993, pp.178-9). In order to avoid bias caused by this, within-subjects testing was used. In addition, the problems caused by skills transferred between the two UIs was controlled by asking half of the participants to test the modified UI first and the other half to test the original one first as suggested by Nielsen (1993, p.179). In practice every other user tested the modified UI first and the rest tested the original one first.
Task number Task description 1 Create a new document with restricted access. 2 Restrict access to an existing document. 3 Create a new document that does not contain any personal details in the
metadata. 4 Remove personal details from the metadata of an existing document. 5 Create a new read only document. 6 Convert an existing document to a read only document. 7 Change the privacy settings so that by default no personal details will be
included in the metadata of new documents. Table 1: Description of the test tasks used in the usability tests.
The efficiency of use was estimated by measuring the completion times and success rates for all tasks. In addition subjective user satisfaction was estimated by recording user opinions regarding the ease of use and preference on certain areas of the UIs. The ease of use was measured with the following 5-point scale: very difficult, difficult, neither easy nor difficult, easy, and very easy. To make comparison between the two UIs easier geometric means were calculated for the completion times and the ease of use. In order to do this for the ease of use, the 5-point scale was represented with a linear numeric scale so that very difficult was given the value 1 and very easy the value 5.

Advances in Networks, Computing and Communications 6
282
4 Results
Overall consideration of the results needs to examine the effects upon the efficiency of the users’ operations when using the new interfaces, as well as how they felt about them in the process. These aspects are discussed in the sub-sections that follow.
4.1 Efficiency
In terms of completion times the only major difference between the two UIs was noticed in task 3 in which the modified UI was faster to use as it can be seen on the right side in Figure 5. When success rates presented on the left side in Figure 5 were considered, differences were notices in tasks 1, 3 and 7. In all of these users performed better with the modified UI.
Figure 5: Task success rates on the left and geometric means of task completion
times on the right.
Figure 6: User preference regarding specific areas of the user interfaces on the left and geometric means of user opinion regardig the ease of use on the right.
4.2 User satisfaction
The results considering user opinions regarding ease of use are presented on the right side in Figure 6. This shows that users felt that the modified UI was easier to use in most cases. Only in the case of document level protection settings there was no major difference between the two interfaces. Furthermore, the number of user who preferred the modified UI was higher in all considered cases as it can be seen from the graph on the left side in Figure 6. However, again the difference was quite small in case of document level protection settings.

Section 4 – Computer Applications, Computing, Robotics & Interactive Intelligent Systems
283
5 Discussion
5.1 Integrating security features with user goals
Integrating security features and user goals was tested in tasks 1, 3 and 5. The completion times for task 3 suggested that this approach would improve the efficiency of using the functionality in question. In addition, the success rates were higher for the modified UI which supports this finding. However, only one participant managed to complete the task 3 successfully with the original UI while only three participants out of ten failed the task with the modified one. Hence the task completion times might not be comparable. On the other had the poor success rate shows that the original UI was not very efficient in this respect. The success rates for task 1 support the effectiveness of the improvements used in the modified UI regarding this task. Thus it can be argued that integrating security features and user goals increases the efficiency of using them.
User satisfaction concerning document level privacy settings was higher for the modified UI as it scored higher in terms of users’ opinions regarding ease of use and user preference. Tasks 3 and 4 involved document level privacy settings. Task 3 tested the impacts of unifying security features with user goals while task 4 tested the effects of combining this modification with increasing the visibility of the relevant functionality. However, due to the phrasing of the questions presented to the participants, it was not possible to say which one they referred to when rating the ease of using or preference regarding document level privacy settings.
5.2 Increasing visibility of security features
The results did not show any major differences between the two UI in the tasks 2 or 6 which tested the effects of increasing visibility of security features. Similar task completion times and success rates were recorded for both UIs in these tasks. Similarly no indications were found that this approach would increase subjective user satisfaction. Nevertheless, there were no indications of decreased level of usability when this method was used.
5.3 Combining the two improvements
Tasks 4 and 7 tested the combination of integrating security features with user goals and increasing their visibility. In task 7 more users completed the task successfully with the modified UI. In fact none of the participants managed to complete this task successfully with the original user interface. Thus the completion times could not be compared. In task 4 no major differences were found between the two UIs in terms of efficiency of use.
Tasks 3 and 4 involved controlling document level privacy settings. As mentioned earlier in this chapter, it could not be determined from the collected data which task users referred to when giving their opinion regarding ease of use and preference. Therefore, based on task 4 conclusions could not be made regarding the effectiveness of the combination of these modifications. In case of task 7, however, users rated the modified UI higher in terms of ease of use. In addition most users preferred the

Advances in Networks, Computing and Communications 6
284
modified UI in this case. Hence it can be argued that the combination of integrating security features with user goals and increasing their visibility improves both the efficiency of use and subjective user satisfaction.
6 Conclusion
The results presented in this paper have indicated that at least in some cases integrating security features with user goals would improve the efficiency of using these features. Two out of three test cases showed improvements in efficiency of use when this approach was used. It could not be clearly identified from the collected data if this approach improved subjective user satisfaction. No indications of improvements in efficiency of use or subjective user satisfaction were found when the visibility of security features was increased. On the other hand this approach does not seem to decrease the usability either. The combination of the two improvements mentioned above seemed to increase the efficiency of use and user satisfaction in one of the two test cases.
In order to verify the results presented in this paper, further studies should be carried out with larger and more diverse groups of test users. In addition, the reliability of the results could be increased by testing the effects that different improvements have on the same functionalities and by carrying out similar tests with other applications as well.
7 References
Balfanz, D., Durfee, G., Smetters, D.K. and Grinter, R.E., (2004), “In search of usable security: five lessons from the field”, IEEE Security & Privacy, Vol. 2, No. 5, pp19―24.
DeWitt, A.J. and Kuljis, J., (2006), “Aligning usability and security: a usability study of Polaris”, Proceedings of the second symposium on Usable privacy and security. Pittsburgh, Pennsylvania, USA: ACM, pp. 1-7.
Dourish, P. Grinter, E., Delgado de la Flor, J. and Joseph, M., (2004), “Security in the wild: user strategies for managing security as an everyday, practical problem” Personal Ubiquitous Comput., Vol. 8, No. 6, pp.391― 401.
Furnell, S., (2005), “Why users cannot use security”, Computers & Security, Vol. 24, No. 4, pp.274―279.
Nielsen, J., (1993), Usability Engineering, Academic Press, San Diego, ISBN: 0-12-518405-0
Smetters, D.K. and Grinter, R.E., (2002), “Moving from the design of usable security technologies to the design of useful secure applications” NSPW '02: Proceedings of the 2002 workshop on new security paradigms, New York, NY, USA: ACM, pp.82―89.
Tognazzini, B., (2003), “First Principles of Interaction Design”, http://www.asktog.com/basics/firstPrinciples.html, (Accessed 14 January 2008)

Section 4 – Computer Applications, Computing, Robotics & Interactive Intelligent Systems
285
Web-Based Plankton Data Visualisation
T.T.Ho and P.S.Dowland
Centre for Information Security and Network Research, University of Plymouth, Plymouth, United Kingdom
e‐mail: [email protected]
Abstract
This paper briefly presents the findings from a project to build a web-based system to draw abundance maps, visualising plankton data from the Continuous Plankton Recorder (CPR) survey undertaken by the Sir Alister Hardy Foundation for Ocean Science (SAHFOS). The system implements a rich client application which draws maps from specific structured data transmitted from server side web service. An AJAX based model has been built for the whole system to provide better user interaction and features. A client cache is also implemented as a component in that model.
Keywords
Web CPR, SAHFOS, plankton, data visualisation, client cache, script cache, client drawing, browser drawing, AJAX, XML, JavaScript, web service, ASP .NET
1 Introduction
Since 1931, millions of plankton samples of biogeography and ecology of plankton from the North Atlantic and the North Sea has been collected by the Sir Alister Hardy Foundation for Ocean Science (SAHFOS) under Continuous Plankton Recorder (CPR) survey on a monthly basis (SAHFOS, 2006). Several windows and web applications, named WinCPR and WebCPR respectively, have been developed for a few years to assist scientists around the world in analyzing this growing data. The programs make seeing and analyzing the data easily by many kinds of visual charts.
The project Web-Based Plankton Data Visualisation contributes to the development of WebCPR site. Performance and interaction are the main targets of the project. The current underdeveloped WebCPR site bases totally on server-side processes, heavy-work load is put into a single centre system and both requests and responses between client and server consume a lot of network traffic. Moreover, because of limits of text-format-based HTML standards, user interactions are inconvenient. Current version of WinCPR also has limited interactions features.
The project concerns about North Sea databases and involves various experiments on client drawing, data structure and transfer, application architecture to provide better services for analyzing abundance maps.

Advances in Networks, Computing and Communications 6
286
2 Web technologies overview
World Wide Web uses HyperText Transfer Protocol (HTTP), a stateless protocol, and presents information in HyperText Markup Language (HTML), which uses text based standards. Therefore, human interaction and presentation is significantly limited, especially in comparison with standalone programmes. For example, every time user wants to get detailed information in a small piece of a page, he has to wait until the entire page is reloaded from web server. Since HTML file is simply a static text language and all interacts are based on hyper links and forms, the way to interact lacks of flexibility. In addition, the simplicity of HTTP protocol and HTML also leads to the difficulty of implementing complicated data presentation. Current WebCPR application is using this approach. HTML contents and images are generated from server side and transferred to client side to replace previous page, as a result of a user request.
Web contents are usually created by the use of traditional three tier application architecture, which is also applied to current development of WebCPR. In this architecture, a system is divided into three tiers with different functions. The first tier is client which presents information for user and also receives input. The second tier is web application tier which generates the content of the requested page and interacts directly with client. Finally, the last tier is data tier which stores data and responds to any data request (for retrieving or modifying) from application server. The architecture has several crucial advantages (Ramirez, 2000) so that it has been being applied for web development for a long time.
Because of the limited ability and low resource requirement of web browser, it is sometimes called a “thin client”. It maintains strong flexibility for end-user devices and provides compatibility and portability for web, which is a crucial factor of the Internet. It also puts all application (or business) process on one central point so implementing a system is easier. On the other hand, it limits the use of growing processing power in today clients. To compensate, it places heavy workload on web server, which sometimes challenges developers.
In order to compensate to these drawbacks, several refinements have been built, although the basic concept of three-tier model is still kept. One of them is Plug-in Object Approach, in which one or several objects are added to traditional HTML content in order to give content sent back to client processing abilities. The embedded objects are independent entities so they do have no relation or interaction with HTML content and theoretically they have limitless abilities of processing, presenting and interaction. However, browser is intended to HTML standards so it natively supports no embedded objects. Hence, a “plug-in” component needs installed to extend browser’s functions. The most popular embedded object solutions seem to be Adobe Flash (Millward Brown, 2007) and Java Applet.
Another refinement, which recently develops rapidly, is Scripting Approach. In this approach, when user interacts with HTML page, underlying script is activated and changes HTML content to present new suitable page. The browser immediately updates the outlook of the page. Two main missions on client side can be obtained by script are underlying process behind user interface and modifiable HTML content.

Section 4 – Computer Applications, Computing, Robotics & Interactive Intelligent Systems
287
Unlike embedded object, script is natively supported by browser and furthermore, it is similar from one browser to another. Therefore, it is more flexible to use and easier to be accepted by client. Moreover, basing on HTML, script keeps web page conception, including the way a page is designed and the way user interacts with the page. In development aspect, scripting approach requires source code of script to be sent back to client so it reveals all underlying mechanisms. More importantly, script is difficult to implement and maintain. Furthermore, because it bases on HTML elements in a page, it has a tight coupling association with those elements. Coupling association makes maintenance of code more difficult.
A lot of technologies have been being developed to overcome weaknesses of this approach. The most well-known one tends to be Asynchronous JavaScript and XML (AJAX). According to his famous article, Garrett (2005) defined AJAX as a combination of a number of technologies such as HTML, CSS, DOM, XML, XMLHttpRequest and JavaScript. In this model, AJAX page roles a client application interacting continuously with user, removing all interrupted times between requests and responds. All exchanges with server are hidden behind AJAX engine, written in JavaScript, by asynchronous XMLHttpRequests. Furthermore, as mentioned above, script can generate HTML and CSS content; only necessary raw data is needed to be transferred from server so both web traffic (then latency) and server workload is reduced. Some AJAX frameworks have both server and client parts coupling tightly together, some have only client part containing all client controls (Mesbah and van Deursen, 2007a). AJAX user interface is usually developed in a familiar way to graphics use interface (GUI) systems so it becomes much more convenient for GUI application developers (Mesbah and van Deursen, 2007b).
However, there are several clear disadvantages when scripting approach is used for client side image creation. Because it is implemented to manipulate HTML content but no other file types or other special elements, it has no ability to generate true image or drawing objects. Besides, reliance on web standard formats limits scripting codes and web services to efficiently structure data transferred in the network. HTML and XML are used to describe data and unfortunately these text-based languages are for easiness, comprehensibility and compatibility instead of efficiency.
On server side, web framework and platform are usually used to develop applications. They provide essential components for complicated services and simplify web development (Shan and Hua, 2006). One of the most popular are ASP .NET and Java technologies. ASP.NET is considered easier to implement Model View Controller pattern than Java technologies (Masoud et al., 2006). Model View Controller is an architectural pattern used for separating user interface from business logics.
3 A new model
ASP .NET and ASP .NET AJAX are chosen to develop the project and therefore AJAX technologies and development concepts are taken into the main points of development. Assisted by technologies, a model for the whole system, which is

Advances in Networks, Computing and Communications 6
288
shown in the figure below, is built and several web architectures as well as popular application architectures are reflected into it.
The model looks slightly different from three-tier model since databases are put into server side services part. It is because transactions between server side web services and database system are not currently covered by the research so database is kept into the web project to simplify the model. However, the model in fact follows three-tier model as there is no direct connection between client and databases. Hence, databases can be easily moved out to a dedicated tier.
The system is a composition of two joining applications: one is a server side web application, containing several services as is seen in traditional web applications, and the other is a client side application. Unlike traditional applications, except for initiating user interface, the server side application plays passive roles in the whole system and put active actions into the client side application. This design is significantly similar to desktop based or plug-in object design for network applications, not only in the outlook but also in deep details and functions. It is because the existence of a client side application. The main difference is the platform where the client side application runs. For a desktop based application and plug-in object, the platform is the operating system and a plug-in library (pre-installed into web browser) respectively, whereas in this design, it is the browser itself and its sandbox. The two key technical points to maintain this similarity are abilities of client technologies, with the help of AJAX framework, and one unified client page.
Further discussions of several important components are given in the below section.
Figure 1 - Overview of System model
4 Important components
Because transferring image requires the image exists on server side, it consumes server resources to generate the image. In addition, in order to keep network

Section 4 – Computer Applications, Computing, Robotics & Interactive Intelligent Systems
289
bandwidth low and also as a requirement of web standards, an image compression algorithm should be used to reduce the size of the image. Compression algorithm is always complicated and consumes a lot of processing power. Besides, because of compression techniques, image quality usually decreases. Image transfer also reduces flexibility of client-side application. In plankton map application, client application can give two types of flexibility, relating to data structure. The first is the interaction of user with the map, such as showing pixel values when user points mouse on. Secondly, user may want to change the way map is presented. Changing colour mapping method is a useful example. Therefore, the new system moves image drawing to client side and as a result, raw data is transferred from server to client, instead of image presenting it.
Theoretically, sending necessary data to client instead of its presentation would be more efficient in network traffic manner. Because data can be organized in a condensed form, it saves network traffic. However, XML is specifications web service should follow to exchange data between client and server. The language is text based but not binary based. Text based data is apparently not as condensed as binary data since it is the language for human readable, which is in a long form. Besides, XML is a mark-up and self-descriptive language, which uses tags and other sophisticated conventions to describe data fields and also their meaning.
The second problem of data organization for scripting approach is that it depends completely on web standards and web support from third parties, such as web browser to run client script. Therefore, one solution is to organize data structure in the way that code interpreting data can be written to be compatible with any browser.
Because of those reasons, text based transmission is chosen for the project. Additionally, if an array of pixel values is transferred directly to client side with XML format, the size of the response packet will be considerably large because of XML descriptions overhead, as explained above. To sort out this problem, all pixel values are put into a string (of characters) and then the whole string is formatted into an XML document. Furthermore, bandwidth can be saved more by using proper format of each value, instead of human readable number as in XML standards. XML uses decimal base (radix) to export numbers but larger base is more efficient. On the other hand, in order to make sure that the chosen base is supported by JavaScript interpreter of all browsers, it should be a technical standard base. Therefore, hexadecimal is used to describe each pixel.
On client side, although receiving and interpreting pixel values is pretty simple, drawing them into a map faces a vital issue. Client side script is designed to manipulate web page elements so it is given no general power like server side framework. Therefore, creating new type of data, file is impossible from client side code, especially in high security user devices. Applied to drawing maps, client side code can create no true image. Additionally, there are no HTML elements designed for graphics purposes. To work around, HTML elements with such formats as colours, borders, position, and size are used to mimic pixels. Fortunately, plankton abundance maps mainly consist of a few block pixels, arranged in rows and columns. Therefore, use of a table with well aligned cells is suitable. Each cell is then formatted so that only its background (which is the pixel colour) is shown. The

Advances in Networks, Computing and Communications 6
290
whole table is generated on the fly as an inner HTML content of a DIV panel. Upon the blocks presenting pixels, a North Sea geographical map with additional information is placed. This map gives user a geographical view of abundance pixels. Because it is fixed across maps, it can be prepared by web server as a pre-drawn picture and downloaded only once.
Figure 2 - A map with all relevant areas
Another problem of the client system is that because the new system supports various flexible ways to interact and swap maps, changing among maps should be as responsive as user interface. Therefore, a cache on client-side not only provides more conveniences for users but also supports additional abilities for other components or for the system as a whole. One of the conveniences can be shown in a manner that user waits no time for a repetitive map. Besides, an example for the supporting role of a client cache is that user can send multiple requests to save network latencies, which accumulate if single request is sent one by one. The user switches from map to map to request them asynchronously and requests are made without interruptions behind the scene. Data is cached whenever a respond comes to the user device and he then switches back to each map to work with client stored data. Because there are no interaction delays to wait for responses (a feature not from cache), requests are sent consecutively and there is no latency accumulation.
In technical aspect, due to AJAX technologies and program-generated server contents, browser cache does not work well with map data. Therefore, a client cache is implemented as a component of the client side application. As a consequence, it is a JavaScript component. The cache is in fact a proxy standing between user interface and communication back end. The proxy is responsible for data and hence uses cache records to serve the user interface.
5 Achievements and limits
In comparison to current WebCPR as well as WinCPR versions, the new system has reached several improvements as expected.

Section 4 – Computer Applications, Computing, Robotics & Interactive Intelligent Systems
291
Firstly, a completely new model for the system has been designed and proved to work properly. The new model still follows three-tier web architecture but creates an application on client side. The research has proposed a way to maintain a true client application, similar to standalone desktop programme, running inside a web browser.
Secondly, web server application becomes thinner, which needs far less power than a normal web site. The web page is mainly run on client-side, except for updates of the species list so the server-side page does noticeably fewer works than usual, when it processed all input changes. In addition and more importantly, map generation mechanisms, which consumed the majority of server-side power, have been moved down to client side. Map related works on server side now shrink to just formatting relative data. Fewer requests for the same resource, supported by client cache, also helps reduce server demands. Several test cases were conducted to measure server side resource consumption. Synchronous sequences of map data requests were generated in a desktop computer to mimic volumes of simultaneous or consecutive remote user requests. Test cases, with a lower system configuration and not optimized settings, were in a far weaker server condition than in real life situations. However, the results proved the efficiency of the approach. 60 pairs of requests/responses took around 3.8 seconds and 14% CPU use to be processed in cases requiring least database manipulations. (It is important to note that web server operations are separated from database system ones but test cases included both of them).
A rich client application is the third achievement. User can interact with a responsive, friendly, informative user interface as well as transformable map. Artefact-free image quality is also an improvement, with the disappearance of image compression.
Moreover, network bandwidth is used more efficiently (or much less). It is because of new type of data transmitted as well as its structure. Another reason is the effort of client application to avoid repetitive transmissions. To measure this improvement, a number of typical XML responses were captured to compare with correlative images made from WinCPR and compressed by Adobe ® Photoshop CS3. Several images in current WebCPR version were also captured, though they were produced from other databases. Transmission by using images requires at least 4 to around a hundred times as much network bandwidth as using XML contents.
However, several issues have been pointed out in the application, but not yet solved. Firstly, because images are composed by HTML elements, but not real digital pictures, image manipulations from web browsers do not work on them. To short it out, user can use screen capture function coming with almost all modern graphical operating systems, though it is an inconvenient way. The second problem is that all errors in asynchronous communication are bypassed. In the future, time-out and request errors can be processed inside the proxy to completely hide network communication from user interface module. Besides, as is an internal component of the client side application, cache lasts only in one session and this issue seems to be a coherent problem of the application.

Advances in Networks, Computing and Communications 6
292
6 Conclusion and future works
The research aims at proposing ideas to improve current WebCPR system, as well as WinCPR application, which are used to visualise plankton data from the CPR survey of SAHFOS. At the same time, a complete and usable system has been built to show the ideas and can be used as the starting point to develop further abilities.
The research has implemented a new model, in which the client-side application plays an active role instead of server-side application as in traditional approach. By that way, the web application comes closer to a desktop GUI program. Drawing mechanisms are also move from server side to client side, along with new data structure to transmit far fewer bytes on network but to carry information in details. Less required server resource is another result of the move. Additionally, fully comprehensive data received by the client, working with several components such as client caching system, also supports better user interface and interactions, including a transformable and interactive map. Some of new features are improvements over current Win CPR application.
In the future, along with solving some issues in the implementation, a number of directions are open to develop the research as well as the system further. Firstly, other types of charts needs more deep research due to the differences among chart types, which require specific data structures and drawing methods. In addition, visualisation methods can be enriched by several ways such as overlapping multiple maps. Another direction is to modify the system so that it can support other databases from both North Sea and North Atlantic observations. Improving database performance is also a promising area.
7 References
Garrett, J. J. (2005), “Ajax: A New Approach to Web Applications”, Adaptive Path, http://www.adaptivepath.com/ideas/essays/archives/000385.php, (Accessed 26 August 2008)
Masoud, F.A. and Halabi, D.H.. (2006), “ASP.NET and JSP Frameworks in Model View Controller Implemetation”, Proceedings of International Conference on Information and Communication Technologies 2006 (ICTTA’06) 2nd, Vol. 2, pp3593 - 3598
Mesbah, A. and van Deursen, A. (2007a), “An Architectural Style for Ajax”, Proceedings of the Working IEEE/IFIP Conference on Software Architecture, 2007 (WICSA’07), pp9 - 18
Mesbah, A. and van Deursen, A. (2007b), “Migrating Multi-page Web Applications to Single-page AJAX Interfaces”, Proceedings of 11th European Conference on Software Maintenance and Reengineering (CSMR'07), pp181-190.
Brown, M. (2007), “Adobe plugin-in technology study”, Adobe System Incorporated, http://www.adobe.com/products/player_census/, (Accessed 20 January 2008)
Ramirez, A. O. (2000), “Three-Tier Architecture”, Linux Journal, Vol. 2000, No. 75es, Article No. 7, ISSN: 1075-3583, Online: http://www.linuxjournal.com/article/3508 (Accessed: 27 August 2008)

Section 4 – Computer Applications, Computing, Robotics & Interactive Intelligent Systems
293
Shan, T. C. and Hua, W. W. (2006), “Taxonomy of Java Web Application Frameworks”, Proceedings of IEEE International Conference on e-Business Engineering July 2006 – ICEBE’06, pp378 - 385

Advances in Networks, Computing and Communications 6
294
Comparing Anti-Spyware Products – a Different Approach
M.Saqib and M.Papadaki
Centre for Information Security and Network Research, University of Plymouth, Plymouth, United Kingdom
e‐mail: [email protected]
Abstract
Spyware is one of the biggest emerging threats that can target both home users and organisations simultaneously. Lots of Anti-Spyware products are available in the market which can protect from Spyware threat. Existing research shows that Spyware causes financial loss and efforts are being made to test Spyware to propose the best Anti-Spyware products to the end users. This research focuses on different aspects of Anti-Spyware testing that the test should be conducted in real life environment in which the users operate. Anti-Spyware programs are selected by carefully researching through existing test results conducted by different internet security companies. The products are evaluated and tested to propose the suitable products to the end users. Some recommendations are also proposed on the basis of this research to help end user to increase their Spyware security.
Keywords
Spyware, Security, Anti-Spyware, Internet
1 Introduction
Spyware is a type of potentially unwanted programs (PUP) (Antispyware Coalition, 2007) becoming the significant problem for most computer users. Spyware tracks and monitors the user activities (Erbschloe, 2005), particularly browsing habits, typing of credit cards and passwords (McFedries, 2005), whether online or offline (Good et al., 2005) and share the user information with the third party companies for advertising and other targeted marketing purpose. Mostly it affects the system performance (Wu et al., 2006, Schmidt and Arnett, 2005) and stability and slows down the internet connectivity. There are many people involved in developing, distributing and benefiting from the Spyware itself. These include hackers, developers, distributers, online advertising companies, investing people and sponsors (Payton, 2006).
2 Spyware Threats
The word “Spyware” was first used on 16 October 1996, in a humorous post about Microsoft’s business model (Wienbar, 2004) which appeared on Usenet (News, 2007, Lavasoft AB, 2007) but in 2000 the term was used in press release for Zone Alarm Personal Firewall (Wienbar, 2004). According to a report that first Spyware was spread through a game called “Elf Bowling” in 1999 (News, 2007).

Section 4 – Computer Applications, Computing, Robotics & Interactive Intelligent Systems
295
In 2007, Spyware caused damaged to the 850,000 computers alone in USA, which made people to replace their computers (Consumer Reports, 2007). Due to lack of knowledge and expertise in this field, most of the people did not know how to resolve this problem. Gartner IT Summit 2006 estimates that over the next two years, Spyware will affect 20% to 50% of enterprises. And by the end of 2008 less than half of the organizations will affected by Spyware (Gartner, 2006).
One in seven of the worst security breaches involved Spyware (DTI, 2006) which gives a clear indication that Spyware is one of the biggest threats to the users. Different Anti-Spyware vendors show top ten threats on their websites which are periodically collected from the users.
Web root Computer Associates Threat Expert Trojan-Downloader-Zlob Trojan.Gen Trojan-Ace-X Trojan-Agent.Gen Trojan Downloader Matcash Trojan Agent Winlogonhook 2nd-thought Trojan-Relayer-Areses Trojan-Poolsv Trojan-Phisher-Bzub
Trymedia Nuvens Estalive HotBar New.Net.Domain.Plugin
SpyAxe/Zlob Virtumonde/ErrorSafe/WinFixer FakeAlert Lop.com PurityScan Maxifile SpySheriff/SpywareNo Zango/180Solutions/Hotbar Seekmo ISTBar
Table 1: Top ten Spyware threats (Webroot Software, 2008, CA, 2008, PC Tools, 2008)
3 Creation of Spyware – Latest trends
Spyware has gone through many changes throughout its history. But still the main aim of creating the Spyware is to steal private and secret information (Erbschloe, 2005). In the past attackers have been trying to create false applications, browser toolbars and tracking cookies to collect personal information and behaviours (Wu et al., 2006). There are quite a few techniques used in developing of Spyware like manipulating the system calls, using DLL files and configuration settings. Randomising the file names and storing it in different locations is also a technique used in Spyware development (Wu et al., 2006).
Attackers are creating deceiving applications like multimedia players and rogue applications to trick the user to install the Spyware. One of the examples of this type of Spyware is Viewpoint media player (SpywareInfo, 2005). With the increase use of web 2.0 and social networking websites like myspace.com and orku.com and blog website, attackers are now targeting these areas. Two examples of website being compromised in 2007 are Salesforce.com and Monster.com. In one of the report at “Webmaster World” that 75% of the Google’s BlogSpot are spam (McAfee, 2008). Another way is Steganography (Westphal, 2003), which hides messages or steeled personal information in images or multimedia contents like (audio, video), when an attacker steals the information then using this technique he hides the information into image and send to the server as an attachment (Kessler, 2004, Dunbar, 2002).

Advances in Networks, Computing and Communications 6
296
Steganographic technologies are a very important part of the future of Internet security and privacy on open systems such as the Internet (Dunbar, 2002).
4 Anti-Spyware Products Comparison
There are numbers of anti Spyware products available in the market. Various methodologies are available for Anti-Spyware testing. Few of them have been highlighted in this research.
4.1 Existing Research
Installing the threats on a computer and testing it with different Anti-Spyware scanners is one of the approaches used by newspapers and magazines to rate and review the Anti-Spyware products (AV-Test, 2008, PC Magazine, 2008). Sometimes the system is tested only with a newly operating system installed with security patches such as Windows (CNET Networks, 2006b) and then the system is bombarded with Spyware. These types of tests are also used to track the performance of the system before and after the Spyware are installed on the computer (Arnett and Schmidt, 2005).
0%10%20%30%40%50%60%70%80%90%
90% 90% 85%
52%
74% 79%
Figure 1: AV-Test - Spyware Detection Rate (CNET Networks, 2006a, PC
Magazine, 2008, AV-Test, 2008)
Similarly at 2Spyware.com, they take the image of a computer which was being used by a novice user and tests that image every time (JSC "Elektroniniai sprendimai", 2008). The computer is used by the novice user for approximately two weeks before it is being put into the action. The approach is quite good for comparison purpose but in our research only one PC was available and it was not possible to take the image of the whole computer and reload it every time the test was being performed.
Top IT magazines like PC Magazine, PC World, CNET Reviews, Consumer Research website and AV-Test Testing performs Anti-Spyware testing. The tests were conducted by PC magazine and PC World and CNET, the test cases and Spyware threats data provided by German Research Company (AV-Test.org) which conducts virus and Spyware research and testing. The tests were then conducted at

Section 4 – Computer Applications, Computing, Robotics & Interactive Intelligent Systems
297
CNET labs (CNET Networks, 2006b) and PC Word testing labs specially created for software testing.
The graphs below shows the detection rate for specific Spyware threats like registry keys and browser helper objects. Results show that Anti-Spyware mostly detects and removes BOHs (Browser Helper Objects) as compared to the removal of registry keys. Registry keys removed by all the programs are at the lower rate for all the security programs. Webroot Spy Sweeper and McAfee Anti-Spyware removes 100% of the browser helper objects and could remove 88% and 79% of the registry keys respectively.
0% 20% 40% 60% 80% 100%
Webroot Spy Sweeper
PC Tools Spyware Doctor
Lavasoft Ad-Aware
Windows Defender
ZoneAlarm Anti-Spyware
McAfee Anti-Spyware
100%
71%
64%
79%
86%
100%
88%
58%
58%
75%
79%
79%
Registry Key Removed BHOs Removed
Figure 2: Specific Spyware Detection Rate (CNET Networks, 2006a, PC
Magazine, 2008)
4.2 Products Selection
There are numbers of Anti-Spyware products available in the market, but to compare all of the products is a long process and is out of scope of the research. The products selected for the comparison are based on the top ten Anti-Spyware products selected by the renowned magazines and newspapers including PC World, CNET and ConsumerSearch. All the selected products are listed amongst the top ten charts of these magazines and they are highly rated by the consumers too.
In total there are seven products selected, and the selected products is a mix of Anti-Spyware scanners and Anti-Spyware as a part of whole internet security system. Here is the complete list of Anti-Spyware programmes which were selected in the research.
1. Webroot Spy Sweeper 2. PC Tools Spyware Doctor 3. Lavasoft Ad-Ware 4. Windows Defender 5. ZoneAlarm Anti-Spyware combined with the firewall suite 6. Norton Anti-Spyware combined with internet security suite 7. McAfee Anti-Spyware while combined with complete suite

Advances in Networks, Computing and Communications 6
298
4.3 Research Methodology
The approach taken in this research was quite simple and straight forward. The tests were conducted on the system one by one, and there was no priority for any application. The computer was being used regularly as a normal computer is being used. But the usage was kept limited just to make sure that new applications and Spyware are not installed during the testing process. Anti-Spyware was installed one by one so that they may not interfere with each other. Each of the Anti-Spyware was fully updated with the latest program updates and Spyware signatures.
During the testing phase most of the efforts were put to scan the whole computer system and do not go for real-time protection. This is because in real-time protection the Anti-Spyware scanner removes the threats without asking the user what to do. Sometimes the Spyware hides itself if there is a new installation or there is a new Anti-Spyware programmed installed on the system. So this leaves less Spyware for the next Anti-Spyware program to detect properly
The tests were performed on a computer with Processor type: Intel(R) Core(TM) 2 CPU T5500 @ 1.66GHz, Total Physical Memory: 1.0 GB and Total Disk Space: 120 GB. Operating system was Windows XP with service pack 3 installed and all the updated patches installed.
4.4 Anti-Spyware Testing
All the programs were tested and evaluated according to the research methodology explained above. Every Anti-Spyware program was first updated to get the most up-to-date information about the program like how many Spyware it can detect, what is the update date and version etc. And then the product was tested by scanning the whole computer system by using the default features turned on in the product.
02000400060008000
10000120001400016000
5666
2684
11718
15690
4075
10403
2629
Figure 3: Spyware Scanning Rate
Windows Defender scans 15,690 files per minutes which is very high rate as the average scan rate for all the Anti-Spyware program is 7,552 files per minute. The slowest scanner was ZoneAlarm Anti-Spyware with 2,629 files per minute. LavaSoft’s Ad-Aware was also amongst the fastest scanners with 11,717 files per

Section 4 – Computer Applications, Computing, Robotics & Interactive Intelligent Systems
299
minute. One may argue that the faster scanner may not be scanning the whole file, instead it scans the starting bytes and ending bytes of each file and then forwards to the next file. Whereas the slower scanner may scans the whole file including its contents and header. But for the end user it does not matter whether a program scans the whole file or part of a file, the point is the protections against Spyware threats.
The most important effectiveness and efficiency measure is the numbers of threats a scanner can find. But again it can be argued that what is a threat and what is not a threat. For example tracking cookies are sometimes considered low level threats and sometimes not considered a threat because they can be removed easily by the internet browser. Some people argue that a tracking cookie cannot be a threat, as it can be removed manually without any expertise needed (Microsoft, 2008).
05
10152025303540
2529
92
40 0 01 0
4 40 0 0
Total threats
Actual threats
Figure 4: Total vs. Actual Threats Detected
Numbers of Spyware threats detected during the test are being summarised in the above chart. Maximum numbers of threats were 92 detected by Ad-Aware, and surprisingly McAfee, Norton and ZoneAlarm Anti-Spyware programs did not detect even a single Spyware program or a tracking cookie. So program with lots of extra features like antivirus, firewall or any blocking features might cause the scanner to slow down and reduce its effectiveness.
5 Conclusion
Options are available to the end user about the selection of the desired Anti-Spyware product. User can select to install a free program and compromise on certain features like real-time protection and customised scans. Anti-Spyware comes as a part of the complete security suit which fulfils all the needs in one single program. Again some compromise on customisations options and effectiveness. More features mean more chances that the Spyware could not be detected as the program is designed to detect and remove various types of threats, and there is not enough expertise available in the program to do all the tasks accurately. Standalone Anti-Spyware programs are available for complete Spyware protection, which can detect and remove any type of Spyware either cookies or key logger. Again there is a compromise on system

Advances in Networks, Computing and Communications 6
300
resources and memory usage. So user has lots of options available and can choose the best possible option which suits the needs and performs the tasks as desired.
6 References
Antispyware Coalition, (2007). Definitions and Supporting Documents, Anti-spyware Coalition. Retrieved January 02, 2008 from http://www.antispywarecoalition.org/ documents/2007definitions.htm
Arnett, K. P. and Schmidt, M. B., (2005). Busting the ghost in the machine. Commun. ACM, Vol. 48, Iss. 8, p. 92-95.
AV-Test, (2008). Anti-virus comparison test of current anti-malware products, Ziff Davis Publishing Holdings Inc. Retrieved May 28, 2008 from http://blogs.pcmag.com/securitywatch/Results-2008q1.htm
CA, (2008). Internet Security Outlook, Computer Associates. Retrieved January 10, 2008 from http://ca.com/files/SecurityAdvisorNews/ca_security_2008_white_paper_final.pdf
CNET Networks, Inc, (2006a). CNET top 10 antispyware apps, CNET Networks, Inc. Retrieved January 12, 2008 from http://review.zdnet.com/4520-3688_16-6456087-1.html
CNET Networks, Inc, (2006b). How we test: Antispyware software, CNET Networks, Inc. Retrieved July 12, 2008 from http://reviews.cnet.com/Labs/4520-6603_7-6719061-1.html
Consumer Reports, (2007). Net Threats - State of the Net 2007, Consumers Union of U.S., Inc. Retrieved June 12, 2008 from http://www.consumerreports.org/cro/electronics-computers/computers/internet-and-other-services/net-threats-9-07/overview/0709_net_ov.htm
DTI, (2006). Information Security Breaches Survey 2006, Department of Trade and Industry. Retrieved January 04, 2008 from http://www.berr.gov.uk/files/file28343.pdf
Dunbar, B., (2002). A Detailed look at Steganographic Techniques and their use in an Open-Systems Environment, SANS Institute. Retrieved June 05, 2008 from http://www.sans.org/reading_room/whitepapers/covert/677.php
Erbschloe, M., (2005). Trojans, Worms, and Spyware: A Computer Security Professional's Guide to Malicious Code. Burlington: Elsevier Butterworth-Heinemann. 232.
Gartner, Inc, (2006). Information Technology Summit. London United Kingdom: Gartner Inc
Good, N., Dhamija, R., Grossklags, J., Thaw, D., Aronowitz, S., Mulligan, D. and Konstan, J., (2005). Stopping spyware at the gate: a user study of privacy, notice and spyware. Proceedings of the 2005 symposium on Usable privacy and security. Pittsburgh, Pennsylvania, ACM
JSC "Elektroniniai sprendimai", (2008). Anti-spyware comparison, July 10, 2008 from http://www.2-spyware.com/compare.php
Kessler, G. C., (2004). An Overview of Steganography for the Computer Forensics Examiner Forensic Science Communications, Vol. 6, Iss. 3, p. 23.
Lavasoft AB, (2007). The History of Spyware, Lavasoft. Retrieved January 02, 2008 from http://www.lavasoftusa.com/support/spywareeducationcenter/spyware_history.php

Section 4 – Computer Applications, Computing, Robotics & Interactive Intelligent Systems
301
McAfee, Inc, (2008). Top 10 Threat Predictions for 2008, McAfee Advert Labs. Retrieved January 20, 2008 from http://www.mcafee.com/us/local_content/white_papers/threat_center/ wp_avert_predictions_2008.pdf
McFedries, P., (2005). Technically Speaking: The Spyware Nightmare. IEEE Spectrum, Vol. 42, Iss. 8, p. 72-72.
Microsoft, Inc, (2008). Windows Defender, Microsoft Corporation. Retrieved May 15, 2008 from http://www.microsoft.com/windows/products/winfamily/defender/default.mspx
News, P. S., (2007). Chapter 2: History of Spyware, PC Security News. Retrieved January 02, 2008 from http://www.pcsecuritynews.com/spyware_history.html
Payton, A. M., (2006). A review of spyware campaigns and strategies to combat them. Proceedings of the 3rd annual conference on Information security curriculum development. Kennesaw, Georgia, ACM
PC Magazine, (2008). Antispyware - Reviews and Price comparisons from PC Magazine, Ziff Davis Publishing Holdings Inc. Retrieved June 16, 2008 from http://www.pcmag.com/category2/0,2806,1639157,00.asp
PC Tools, (2008). Spyware Doctor - Best Spyware Removal, May 15, 2008 from http://www.pctools.com/spyware-doctor/
Schmidt, M. B. and Arnett, K. P., (2005). Spyware: a little knowledge is a wonderful thing. Commun. ACM, Vol. 48, Iss. 8, p. 67-70.
SpywareInfo, (2005). Spyware Weekly Newsletter, SpywareInfo.com. Retrieved January 15, 2008 from http://www.spywareinfo.com/newsletter/archives/2005/nov4.php#viewpoint
Webroot Software, Inc, (2008). Webroot spy sweeper, Webroot Software, Inc. Retrieved May 08, 2008 from http://www.webroot.com/En_US/consumer-products-spysweeper.html
Westphal, K., (2003). Steganography Revealed, SecurityFocus. Retrieved January 10, 2008 from http://www.securityfocus.com/infocus/1684
Wienbar, S., (2004). The spyware inferno, News.com. Retrieved January 06, 2008 from http://news.cnet.com/2010-1032-5307831.html
Wu, M.-W., Huang, Y., Wang, Y.-M. and Kuo, S.-Y., (2006). A Stateful Approach to Spyware Detection and Removal. Proceedings of the 12th Pacific Rim International Symposium on Dependable Computing. IEEE Computer Society

Advances in Networks, Computing and Communications 6
302
“The websites of Higher Education Institutions are more than merely promotional interfaces with potential
students” - Web Accessibility and Usability in a HEI environment
I.L.St John and A.D.Phippen
Centre for Information Security and Network Research, University of Plymouth, Plymouth, United Kingdom
e‐mail: [email protected]
Abstract
Accessibility and usability are key fundaments a system designer should use in order to produce an effective and efficient website. The task of meeting the needs of user diversity in the modern world should be a high priority to any developer when looking at software development and the graphical user interface (GUI). This paper discusses research carried out with web focus groups comprising of 23 users at the University College Plymouth St Mark & St John (UCPMarjon) in Plymouth, England. The study adopted a Human Computer Interaction (HCI) approach and discovered a number of flaws in the conceptual model of the UCPMarjon website. Recommendations were made to improve the website and form a new conceptual model that Higher Education Institutions (HEI) should adopt as a baseline for website accessibility.
Keywords
Web Accessibility; Usability; Human Computer Interaction, UK Higher Education
1 Introduction
There is mounting evidence that website designers are neglecting disabled people when creating accessible content for their websites (Disability Rights Commission, 2004). The implementation of the Special Educational Needs and Disability Act (SENDA) has failed to increase HEI website accessibility and many educational websites are still lacking appropriate measures to include disabled people.
The term ‘disabled person’ covers a wide range of disabilities and health conditions - from a visual impairment to arthritis, cancer, multiple sclerosis, heart disease, depression, Downs Syndrome and diabetes. The Disability Rights Commission (DRC) estimates that there are over 10 million disabled people in Britain alone, with a spending power of around £80 billion (Family Resources Survey 2003-2004).
Mental models are defined as models that people have of themselves, others, the environment and the things that they interact. The mental model of a disabled user differs greatly from that of a normal user and thus must be accommodated for when

Section 4 – Computer Applications, Computing, Robotics & Interactive Intelligent Systems
303
designing an interface. They are unable to form a good understand of the perceived actions and visible structure that the interface provides. Increasingly, there is evidence that many HEI websites have failed to adopt a user centric perspective and neglected to identify the different mental models of potential users (Kelly 2002; Kelly, 2004).
This paper critically examines the existing UCPMarjon website and provides a conceptual design of a solution that bridges the gap between what currently exists and meeting the diverse needs of potential users.
2 Previous Studies of Accessibility of HEI websites
The majority of the previous studies undertaken on HEI website accessibility have been carried out by using automated evaluation tools to compare websites against the Web Accessibility Initiative (WAI) Web Content Accessibility Guidelines 1.0 (WCAG 1.0) standards. These have consistently shown HEI websites fail to meet the needs of their users. Table 1 summarises the results of three UK HEI website accessibility studies.
Study Websites WAI AA Compliant
WAI A Compliant
Not Compliant
Unknown
Kelly (2002) 163 1.85% 42.94% 54.60% 0.61% Kelly (2004) 161 5.59% 57.76% 30.43% 6.21%
Witt and McDermott
(2003) 180 1.5% 39.00% 58.33% 0
Table 1: Comparison of studies into the accessibility and usability of HEI websites
A variety of reasons have been suggested as to why HEI websites have failed to implement accessibility effectively. There are a three core themes that are identified through current literature:
Use of unreliable automated evaluation tools Lack of understanding of key concepts of HCI The WCAG Guidelines are too complex
2.1 Use of Unreliable Automated Evaluation Tools
Research has proven that evaluation tools are unreliable. It has been shown that they can give differing results for the same web pages and are not consistent in reporting accessibility status (Diaper and Worman, 2003).
2.2 Lack of Understanding of Key Concepts of HCI
The automated evaluation tools are only of use when they are used by a web designer who can interpret their results and relate them to the WCAG guidelines (Ivory and Chevalier, 2002).

Advances in Networks, Computing and Communications 6
304
2.3 The WCAG Guidelines Are Too Complex
The WCAG guidelines are cited as being too theoretical in nature, too dependent on other WAI guidelines, ambiguous, complex, contain logical flaws and hard to interpret (Sloan et al. 2006).
3 Accessibility and Usability in HEI and the need for future research
The theories of web accessibility and usability are built upon the interoperability of a large number of web pages which provide a unique GUI and the adoption of a universal usability principle. Schneiderman (2001) states that universal usability ‘implies that diverse users with varying language skills, knowledge levels, motivation and computer hardware/software can successfully apply technology to get what they need in life.’ It is therefore evident that the use of automated evaluation tools is not enough to determine the accessibility or usability of a website and that further examination is required to support the increasing number of disabled students in Higher Education.
4 Experimental Design and Research Method
The ‘Star Model’ (Hartson and Hix, 1993) was adopted as the HCI design approach that the study would follow in order to suggest a new conceptual design for the UCPMarjon website. The constant evaluation that the Star Model provides is flexible in its approach and enabled the continuous review of the prototype. It is better suited to the requirements of interactive web systems which have usability as a core focus.
A task analysis was designed to facilitate testing various user cognitive and physical abilities when they came into contact with the UCPMarjon website. This was distributed in the form of a paper booklet to staff and students at UCPMarjon who formed participants of the web focus groups. The task analysis was created to facilitate the development of user scenarios and use cases which would aid to interpret specific flaws in the conceptual model of the UCPMarjon website. It would also allow the creation of a rich picture (Checkland, 1999) which would assist in the understanding of the current UCPMarjon web system. The Use cases would help to build specific functional requirements that will be included in the HEI website GUI to make it accessible and usable.
5 Results
23 participants undertook the task analysis between May and July 2008 including eight users with varying disabilities. 86.96% of all tasks were completed successfully by participants although only 82.50% of the tasks that were executed by disabled tasks were completed effectively. Particular problems were found with the tasks that involved finding or viewing videos that were available on the website. 65.22% of all users failed to locate and observe a video of how to access the College email. Only 12.5% of disabled users who executed the task did so successfully. Users were also unable to find fee information on the UCPMarjon website. One of the tasks required

Section 4 – Computer Applications, Computing, Robotics & Interactive Intelligent Systems
305
the recording of fee information for a UK or EU for BA Undergraduate Geography. 26.09% of the focus group did not complete the task.
All Users (n=23) Disabled Users (n=8) Non-Disabled Users (n=15)
Task Frequency Percentage Frequency Percentage Frequency Percentage 1 15 65.22 7 87.5 8 53.33 2 0 0 0 0 0 0 3 0 0 0 0 0 0 4 0 0 0 0 0 0 5 2 8.70 1 12.50 1 6.67 6 1 4.35 0 0 1 6.67 7 6 26.09 2 25 4 26.67 8 2 8.70 2 25 0 0 9 2 8.70 1 12.50 1 6.67 10 2 8.70 1 12.50 1 6.67
TOTAL 30 - 14 - 16 -
Table 2: Summary of failure to complete task analysis tasks
The results depicted in Table 2 showed that the failure of the tasks by both disabled and non-disabled users was too significant to ignore and that action needs be taken.
Disabled users experienced more problems than non-disabled users. By comparing the ratio of number of failures against sample number from each user type it was able to deduce that a disabled user experienced 1.75 failures per user and non-disabled users 1.06 failures per user. This stressed that there was a great necessity to improve the accessibility of the UCPMarjon website.
Evidence suggested that the website had obstacles to accessibility and usability. There appeared to be problems with structure, navigation and accessibility of both the website and the videos that are contained within it.
Figure 1 – A Rich Picture of the current UCP Marjon website

Advances in Networks, Computing and Communications 6
306
It is possible to gain a better understanding of the problem situation that users presently have when using UCPMarjon by conveying their plight in the form of a rich picture (Figure 1). It can be deduced from the rich picture that at present, disabled users seem to have particular problems with the UCPMarjon website. This is not only evident at the UI level, but also when viewing videos.
6 Discussion
The UCPMarjon website needs to be developed to cater for the diversity of users that will use the system. Usability and accessibility principles should be fundamental to the conceptual model of any web design and should be built in where possible to provide an interface which affords direct manipulation (Schneidermann, 1983).
To accommodate this, user stories were sourced from the user experience sheets of participants who took part in the web focus groups. These resulted in the creation of two top level use case requirements lists as shown in Table 3.
Requirement Use CaseFor all users to be able to access and use the GUI of UCPMarjon website’s website
Create accessible and usable web pages
For all users to be able to access and view uploaded videos on the UCPMarjon website
Make the videos of UCPMarjon website accessible to all users
Table 3: Top level use case requirements lists for making the web pages and videos more accessible and usable
The Use cases requirements lists have therefore highlighted a need for changing the GUI of the UCPMarjon website and improving access to the videos by adding functionally to incorporate special needs users.
Recommendations were made to improve the UCPMarjon website in the light of the use case requirements list which can be viewed in Table 4.
Recommendation UCPMarjon GUI UCPMarjon Videos
1 Provide multiple cascading style sheets
Add closed caption subtitles/captions
2 Allow for the increase of relative font size
Offer a downloadable transcript of videos
3 Optimise website structure Offer a descriptive audio only option
4 Develop web pages using relative sizes
Add a sign language video to run in parallel with videos
5 Use metaphor only for cognitive assistance
6 Use Verdana Font 7 Offer the use of access keys
8 Use descriptive alternative text for images
9 Use headings for structure 10 Use table headings 11 Use a breadcrumb

Section 4 – Computer Applications, Computing, Robotics & Interactive Intelligent Systems
307
12 Use simple URLs 13 Use scannable text 14 Design for multiple browsers
15 Create menu bar with semantic organisation in mind
16 Use Google gisting services 17 Provide online help pages 18 Use form fills that are grouped 19 Provide Instant user feedback
Table 4: Recommendations to improve accessibility and usability of the UCPMarjon website GUI and videos
These were suggested as a baseline that HEI should adopt for their website accessibility and usability.
7 Conclusion and the Future
The research sought to investigate the subject of the accessibility and usability of HEI websites, using the UCPMarjon website as a basis for investigation. It was found by means of a task analysis that there were problems with structure, navigation and accessibility of both the website and the videos that were contained within it. As a result a number of recommendations have been made to improve accessibility and usability: 19 for the UCPMarjon GUI and 4 for the UCPMarjon videos. These are the basis for a conceptual model for HEI to adopt for website accessibility and usability.
Figure 2 – The Updated Rich Picture of the UCP Marjon website
As with most GUIs, the process of improving the conceptual model is a never ending one. It is suggested that the conceptual model for UCPMarjon be constructed as a

Advances in Networks, Computing and Communications 6
308
website and undergo further evaluation as stated by the Star Model that was adopted as the basis for this study.
As a basis for further evaluation it is suggested that the updated rich picture of UCPMarjon website (Figure 2) be adopted as a starting point.
8 References
Checkland P., (1999), Systems Thinking, Systems Practice, John Wiley & Sons, ISBN: 0471986062
Diaper, D., and Worman, L. (2003), “Two falls out of three in the automated accessibility assessment of world wide websites: A-Prompt v. Bobby” P. Johnson and P. Palanque, (Eds.), People and Computers XVII. Springer-Verlag, Berlin, pp349-363.
Hartson, H. R., and Hix, D. (1989), “Human-computer interface development: concepts and systems for its management”, In ACM Computing Surveys (CSUR), Vol 21, No 1, pp 5-9292
HMSO (2001), “The Special Educational Needs and Disability Act”, www.hmso.gov.uk/acts/acts2001/010010.htm (Accessed 24 October 2007)
Ivory, M and Chevalier, A., (2002). “A Study of Automated Web Site Evaluation Tools”, Technical Report UW-CSE-02-10-01, University of Washington, Department of Computer Science and Engineering.
Kelly, B. (2002), “An accessibility analysis of UK university entry points” http://www.ariadne.ac.uk/issue33/web-watch, (Accessed 24 October 2007)
Kelly, B. (2004), “Accessibility Survey of UK University Entry Points”, http://www.ukoln.ac.uk/web-focus/events/workshops/webmaster-2004/talks/phipps-kelly/survey/, (Accessed 16 September 2007)
Schneiderman, B. (1983), “Direct manipulation: A step beyond programming languages”, IEEE Computer, Vol 16, No 8, pp. 57-6969
Shneiderman B and Hochheiser H. (2001), “Universal usability as a stimulus to advanced interface design”, Behaviour & Information Technology, Vol 20, No 5, pp367-376
Sloan D., Kelly B., Heath A., Petrie H., Hamilton F. and Phipps L. (2006), “Contextual Accessibility: Maximizing the Benefit of Accessibility Guidelines”, Proceedings of the 2006 International Cross-Disciplinary Workshop on Web Accessibility (W4A) (Edinburgh, Scotland, 23 May 2006). New York: ACM Press, pp121-131.
The Department for Work and Pension Web Site (2004), “Family Resources Survey 2003-04”, http://www.dwp.gov.uk/asd/frs/2003_04/index.asp (Accessed 25 November 2007)
The Equality and Human Rights Commission Web Site (2008), “The Web access and inclusion for disabled people: A formal investigation conducted by the Disability Rights Commission”, http://www.equalityhumanrights.com/Documents/Disability/Accessibility_ guidance/web_access_and_inclusion.pdf (Accessed 2 January 2008)
Witt, N.A.J. and McDermott, A.P. (2004) “Web site accessibility- what logo will we use today?”, British Journal of Educational Technology. Vol 35, No1, pp 45-56.

Section 4 – Computer Applications, Computing, Robotics & Interactive Intelligent Systems
309
W3C Web Site (1999), “Web Content Accessibility Guidelines 1.0”, http://www.w3.org/TR/WAI-WEBCONTENT/, (Accessed 10 March 2008)
W3C Web Site (2007), “Web Accessibility Initiative (WAI)”, http://www.w3.org/WAI/, (Accessed 1 December 2007)

Advances in Networks, Computing and Communications 6
310

Author Index
311
Author Index
Abu-Rgheff MA Adam A Adjei MO Al-Houshi I Al-Shehri Y Ambroze MA Bakhshi T Belpaeme T Buchoux A Clarke NL Davey RJ Dowland PS Edu A Eftimakis M Erebor G Furnell SM Gaschet M Godon S Goudarzi M Hadjicharalambous A Helala M Henrys d'Aubigny
d'Esmyards P Ho TT
83, 253 171 3 179 12 179 23 269 190 12, 115, 171, 190, 206, 212, 234 198 40, 92, 124, 226, 285 32 269 160 3, 98, 135, 152, 277 245 40 48 56 277 253 285
Imran M Jain R Littlejohns JWG Mahmoud N Mindaudu AS Miranda ER Moore DJ Moustafa F Obi CA Odejobi OA Panina L Papadaki M Phippen AD Sanders BG Saqib M Scalbert L Shams R Siddiqui S Smith A Soucaret V St John IL Sun L Thomas J Wang X
64 73 206 212 83 259 92 98 107 115 245 23, 32, 73, 107, 144, 160, 294 198, 302 124 294 226 135 234 144 259 302 48, 64 152 56
