advances in structural and functional connectivity€¦ · advances in structural and functional...
TRANSCRIPT

Advances in structural and functional connectivity visualization using the Fibernavigator
Maxime ChamberlandComputational Brain Connectivity Mapping
Winter School Workshop 2017 - November 20-24, Juan-les-Pins, France

Disclaimer
“Non-rocket science”

3D rendering - Medical imaging
1996 20131985
Source: Google images

Real-time vs offline
• How fast these images or frames are generated in a given second, determines the method's real timeliness.
• Difference between real-time and non-real-time graphics is the interactivity desired in real-time graphics.
Not real-time

Scientific visualization - dMRI
Margulies, D. S., et al. (2013) Visualizing the human connectome. NeuroImage 80 (2013): 445-461.

Providing interactivity

Outline
I. Real-time ConnectivityI. Functional Connectivity on-the-flyII. FC-driven TractographyIII. Real-time Tractography (RTT)IV. Tractography-driven FC
II. Visualization goodiesI. Glass brainII. TDI / SlicingIII. Opacity renderingIV. Connectomics
FiberNavigator

I.I Functional Connectivity on-the-fly
Böttger, J. et al. (2011). A software tool for interactive exploration of intrinsic functional connectivity opens new perspectives for brain surgery." Acta neurochirurgica 153.8 (2011): 1561-1572.Taylor, Paul A., and Ziad S. Saad. "FATCAT:(an efficient) functional and tractographic connectivity analysis toolbox." Brain connectivity 3.5 (2013): 523-535.

I.I Functional Connectivity on-the-fly
Chamberland, M. et al. (2015). 3D interactive tractography-informed resting-state fMRI connectivity. Frontiers in neuroscience, 9, 275.

Chamberland, M. et al. (2015). 3D interactive tractography-informed resting-state fMRI connectivity. Frontiers in neuroscience, 9, 275.
I.II fMRI-driven Tractography

I.II Standard tractography
• Step size (0.1 - 1mm)
• Angular threshold (30 - 45°)
• Min/Max length (20 – 200mm)
• # of seeds (1k – 2M)
• …

I.II Real-time Tractography
Chamberland, M. et al. (2014). Real-time multi-peak tractography for interactive connectivity display. Frontiers in neuroinformatics, 8.
(Step size, Angular Threshold, Mask Threshold, # of seeds, etc.)

I.II Microstructural mapping per peak
?

I.II Microstructural mapping per peak

Chamberland, M. et al. (2017). Active delineation of Meyer's loop using oriented priors through MAGNEtic tractography (MAGNET).Human Brain Mapping, 38(1), 509-527.
I.II Real-time Tractography: Meyer’s loop
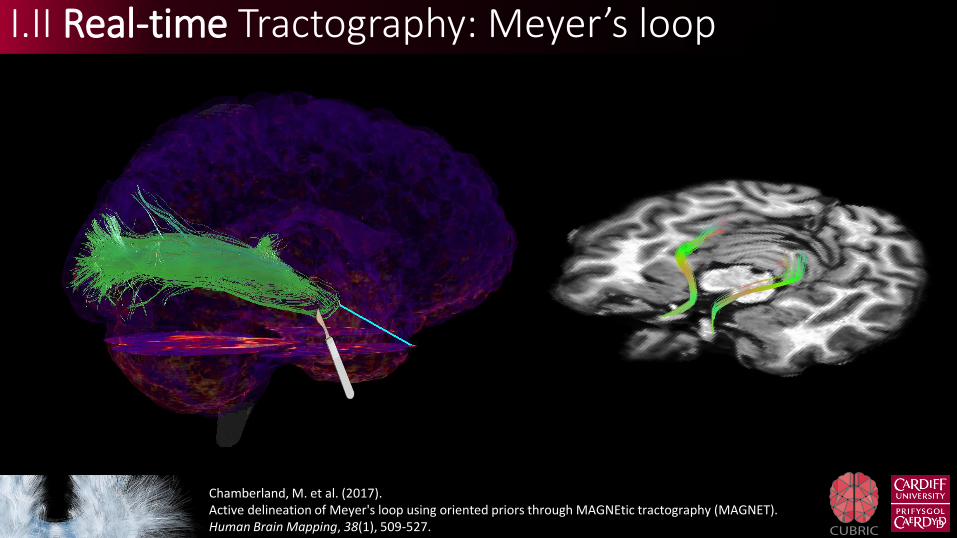
3. Chamberland, M. et al. (2017). Active delineation of Meyer's loop using oriented priors through MAGNEtic tractography (MAGNET).Human Brain Mapping, 38(1), 509-527.
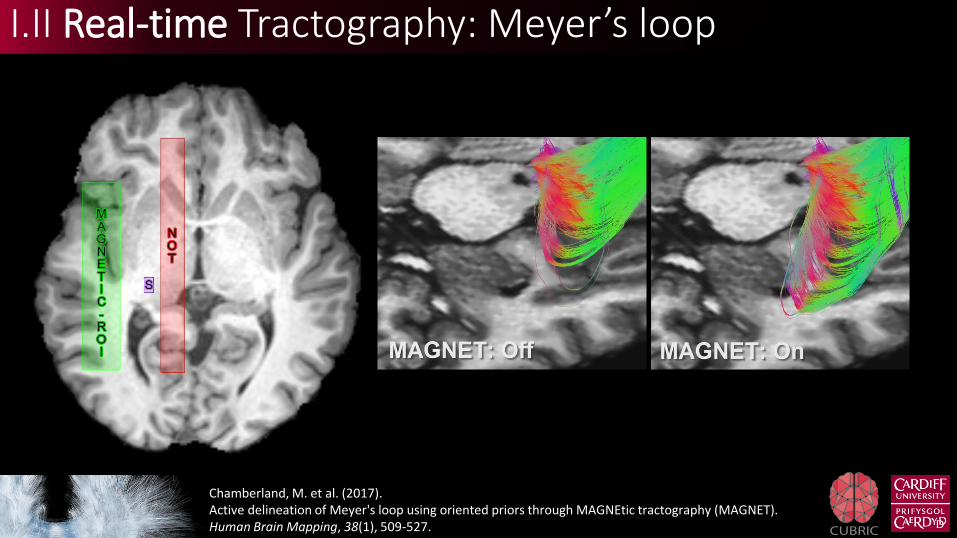
I.II Real-time Tractography: Meyer’s loop

3. Chamberland, M. et al. (2017). Active delineation of Meyer's loop using oriented priors through MAGNEtic tractography (MAGNET).Human Brain Mapping, 38(1), 509-527.
I.II Real-time Tractography: Meyer’s loop
3. Chamberland, M. et al. (2017). Active delineation of Meyer's loop using oriented priors through MAGNEtic tractography (MAGNET).Human Brain Mapping, 38(1), 509-527.
I.II Real-time Tractography: Meyer’s loop

Functional Connectivity (FC) on the fly
Structural Connectivity (SC) on the fly
FC-derived SC (Tracts from blobs)
SC-derived FC (Blobs from tracts)?
I.IV Tractography-driven fMRI

Chamberland, M. et al. (2015). 3D interactive tractography-informed resting-state fMRI connectivity. Frontiers in neuroscience, 9, 275.
I.IV Tractography-driven fMRI

II. Visualization goodies

II.I Glass brain

II.II Slicing Options
Calamante, F. et al. (2010). Track-density imaging (TDI): super-resolution white matter imaging using whole-brain track-density.Neuroimage 53.4: 1233-1243.

II.III Orientation-Dependent Opacity Rendering
Tax, Chantal MW, et al. "Seeing more by showing less: Orientation-dependent transparency rendering for fiber tractographyvisualization.“ PloS one 10.10 (2015): e0139434.

II.IV Connectomics
Chamberland, M. et al. (2017). Interactive Computation and Visualization of Structural Connectomes in Real-Time.MICCAI CNI Workshop, Québec, Canada.

Overview
Sherbrooke Connectivity Imaging Lab, Québec, CanadaNational Geographic, Feb. 2014

Twitter: @MaxChamb
Website: chamberm.github.io
Email: [email protected]
Acknowledgements
Derek JonesMaxime DescoteauxKevin WhittingstallDavid FortinMichaël BernierGabriel GirardWilliam GrayAlexander LeemansChantal TaxSimon WarfieldBenoit Scherrer